

联想 ThinkPad P14s G5 笔记本电脑评测--配备 RTX 500 Ada 和 3K IPS 面板的移动工作站
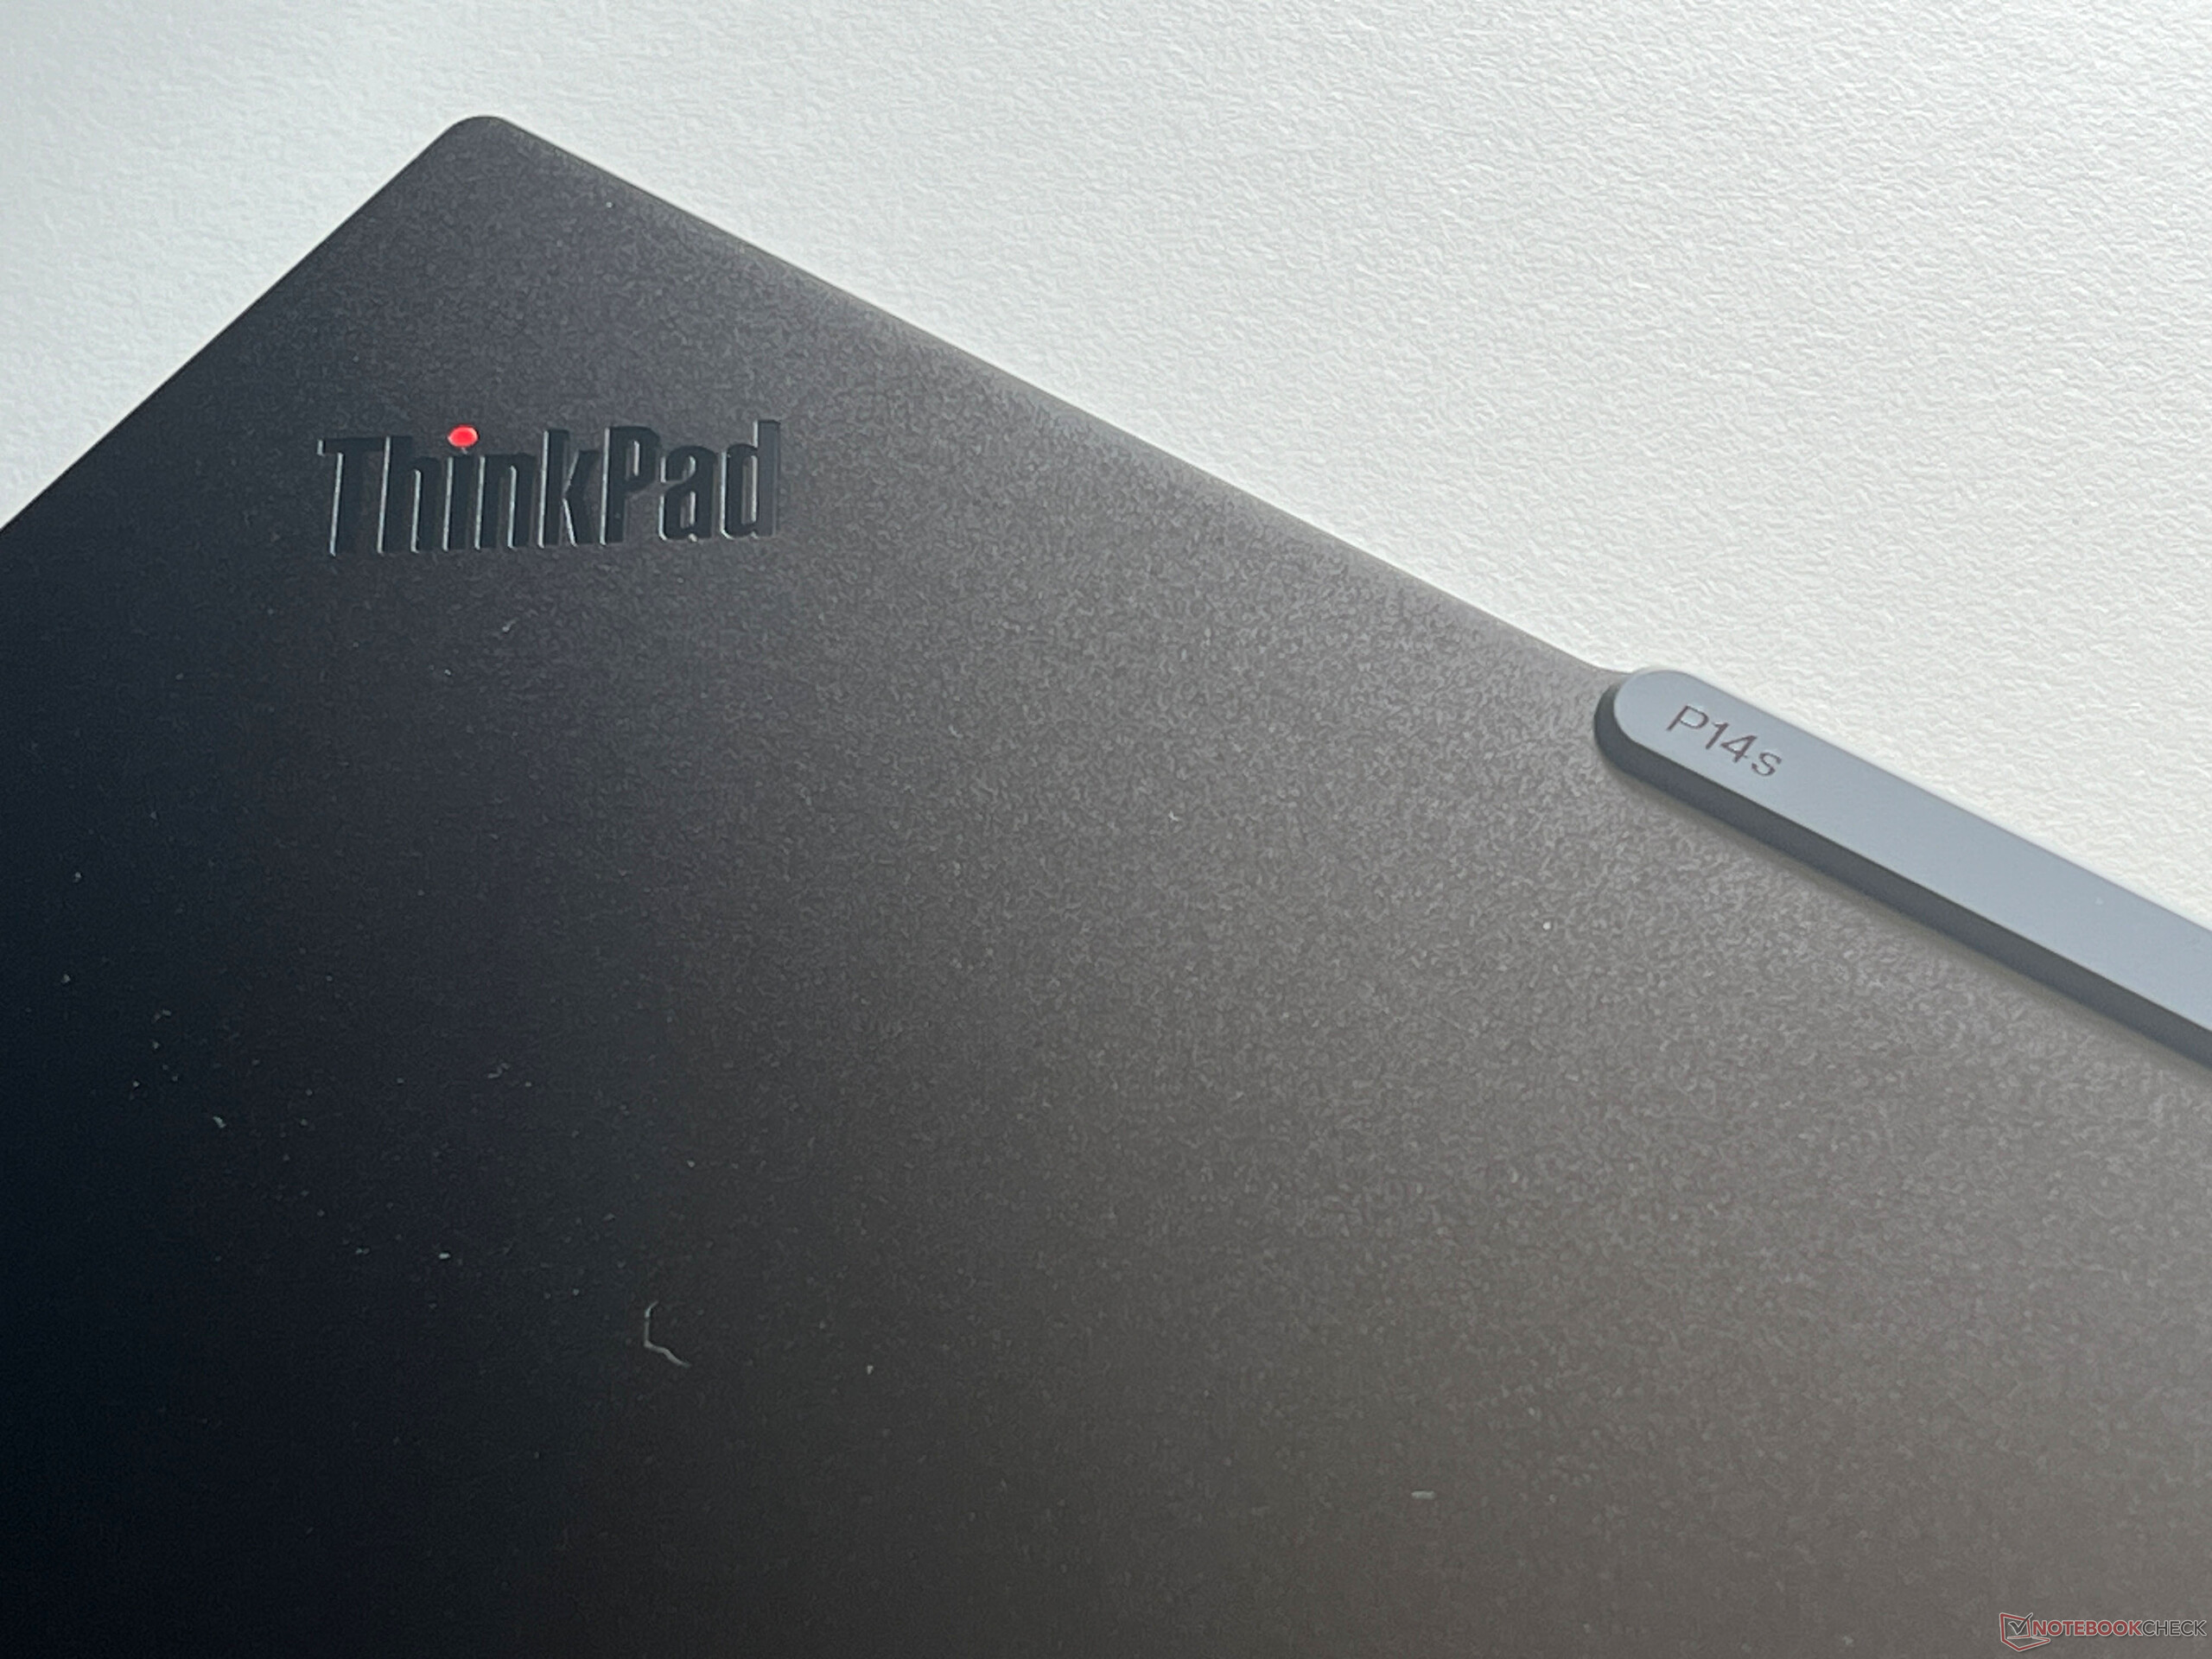
联想在其 ThinkPad P14s G5 移动工作站上采取了新的路线,虽然前几代机型总是基于各自的 T 系列机型,但配备英特尔处理器的新款 P14s G5 采用了自己的设计,包括新的 14.5 英寸显示屏(以前为 14 英寸)。另一方面,采用 AMD 处理器的 P14s G5 仍沿用旧机壳和 14 英寸面板。
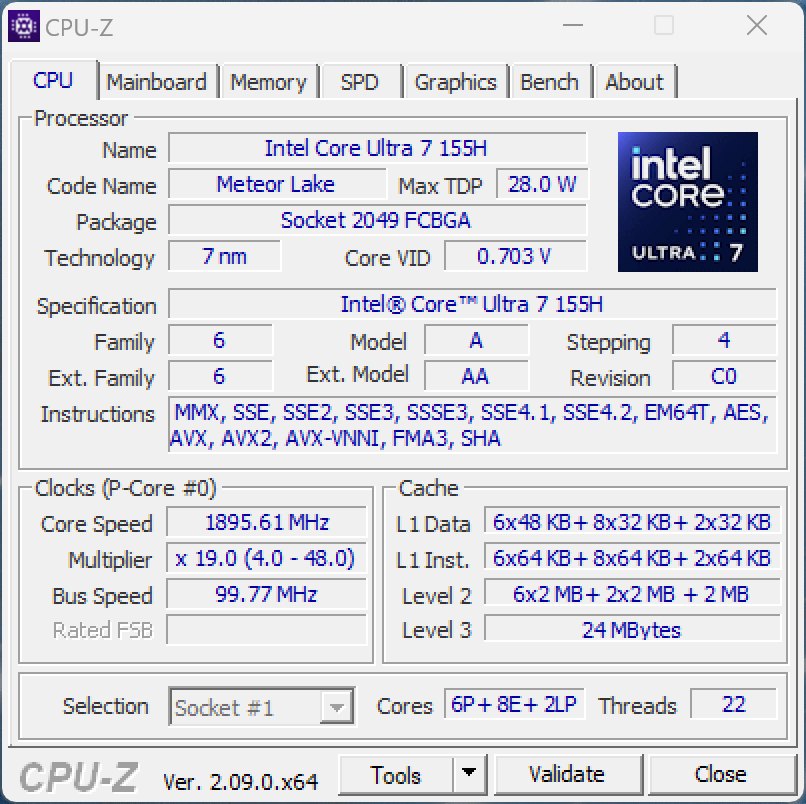
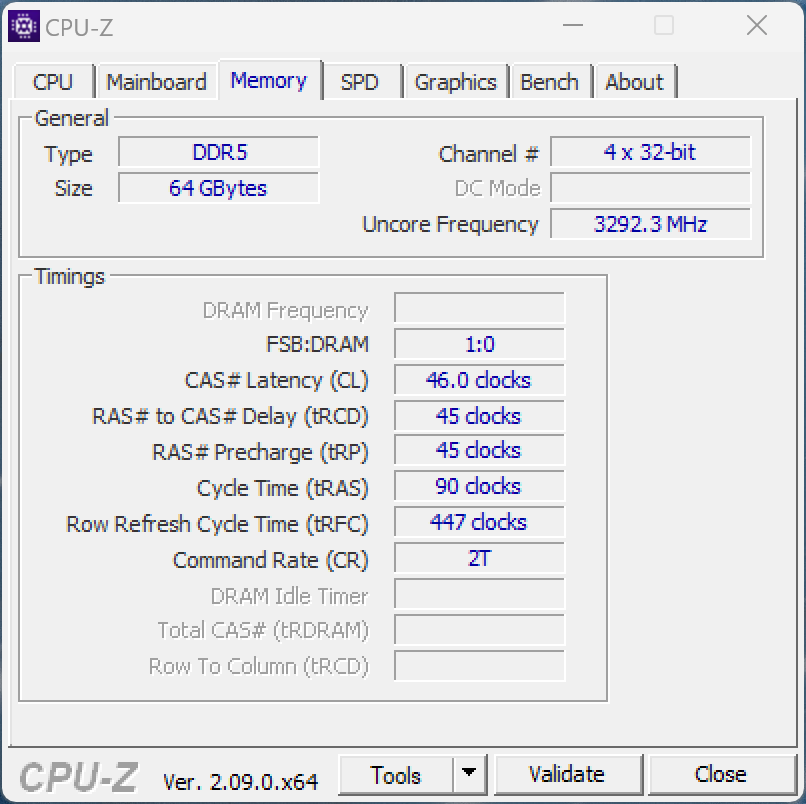
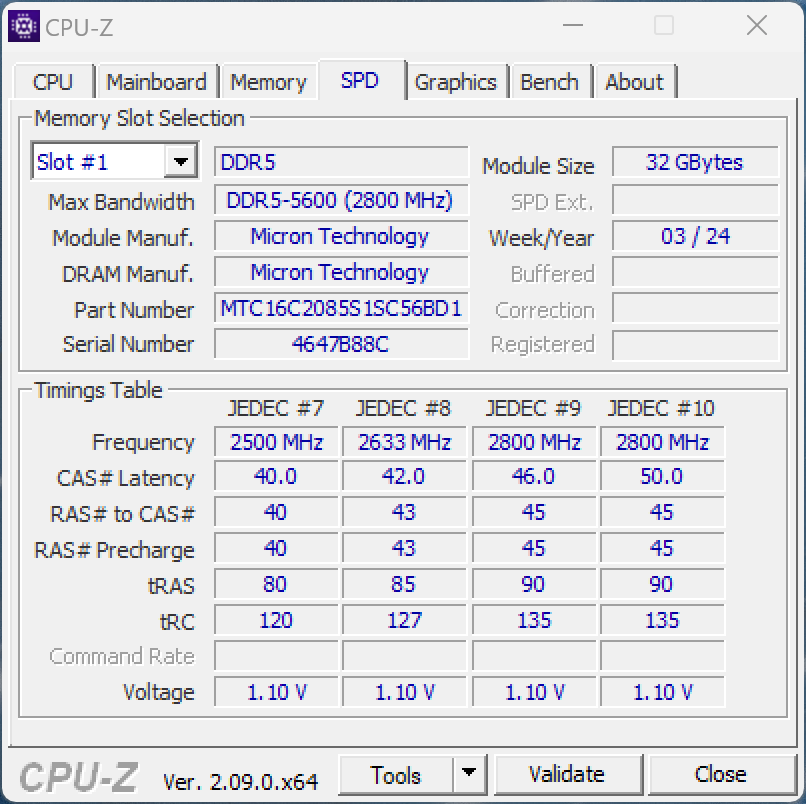
我们的测试机是校园版 21G3S00A00,售价约 2,100 美元,不含操作系统,但配置非常不错。除了新的 3K 显示屏外,它还配备了 酷睿至尊 7 155H64 GB 内存、1 TB SSD 以及专用的 Nvidia RTX 500 Ada.目前还没有相应的面向个人用户的畅销机型;如果通过联想网站配置该设备,包括 Windows 11 Home 在内的价格目前为 2700 美元多一点。
潜在的竞争对手比较
Rating | Version | Date | Model | Weight | Height | Size | Resolution | Price |
|---|---|---|---|---|---|---|---|---|
| 82.5 % | v8 | 07 / 2024 | Lenovo ThinkPad P14s G5 21G3S00A00 Ultra 7 155H, Nvidia RTX 500 Ada Generation Laptop GPU | 1.7 kg | 22 mm | 14.50" | 3072x1920 | |
| 80.3 % | v8 | 07 / 2024 | HP ZBook Firefly 14 G11 Ultra 7 165H, RTX A500 Laptop GPU | 1.5 kg | 19.2 mm | 14.00" | 2560x1600 | |
| 81 % | v8 | 07 / 2024 | Lenovo ThinkPad P14s G4 21HF0017GE i7-1370P, RTX A500 Laptop GPU | 1.5 kg | 22.7 mm | 14.00" | 2880x1800 | |
| 89.3 % v7 (old) | v7 (old) | 04 / 2024 | Dell Precision 5000 5490 Ultra 9 185H, NVIDIA RTX 3000 Ada Generation Laptop GPU | 1.6 kg | 18.95 mm | 14.00" | 2560x1600 | |
| 85.5 % v7 (old) | v7 (old) | 10 / 2023 | Microsoft Surface Laptop Studio 2 RTX 4060 i7-13700H, NVIDIA GeForce RTX 4060 Laptop GPU | 2 kg | 22 mm | 14.40" | 2400x1600 | |
| 89.8 % v7 (old) | v7 (old) | 07 / 2023 | Lenovo Yoga Pro 9-14IRP G8 i7-13705H, NVIDIA GeForce RTX 4050 Laptop GPU | 1.7 kg | 17.6 mm | 14.50" | 3072x1920 |
请注意:我们最近更新了评级系统,第 8 版的结果无法与第 7 版的结果进行比较。更多信息 请点击此处.
外壳 - 联想在尺寸上作弊
ThinkPad P14s 是一款移动工作站,当你第一次拿起它时,你会立即发现它绝对不是一款特别轻薄的设备。然而,当我们查看其数据表时,却大吃一惊,因为联想标注的高度为 18.5 毫米,这根本不正确。在没有脚垫的情况下,我们测得的高度约为 22 毫米,这又是一个明显的差别。
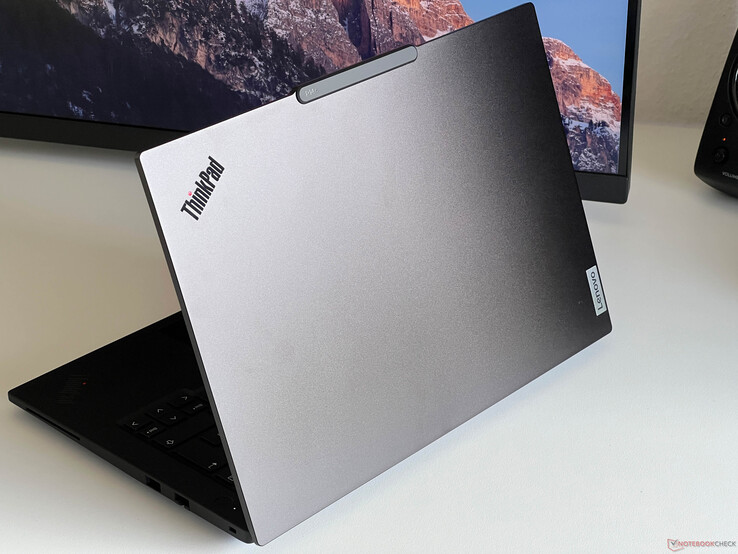
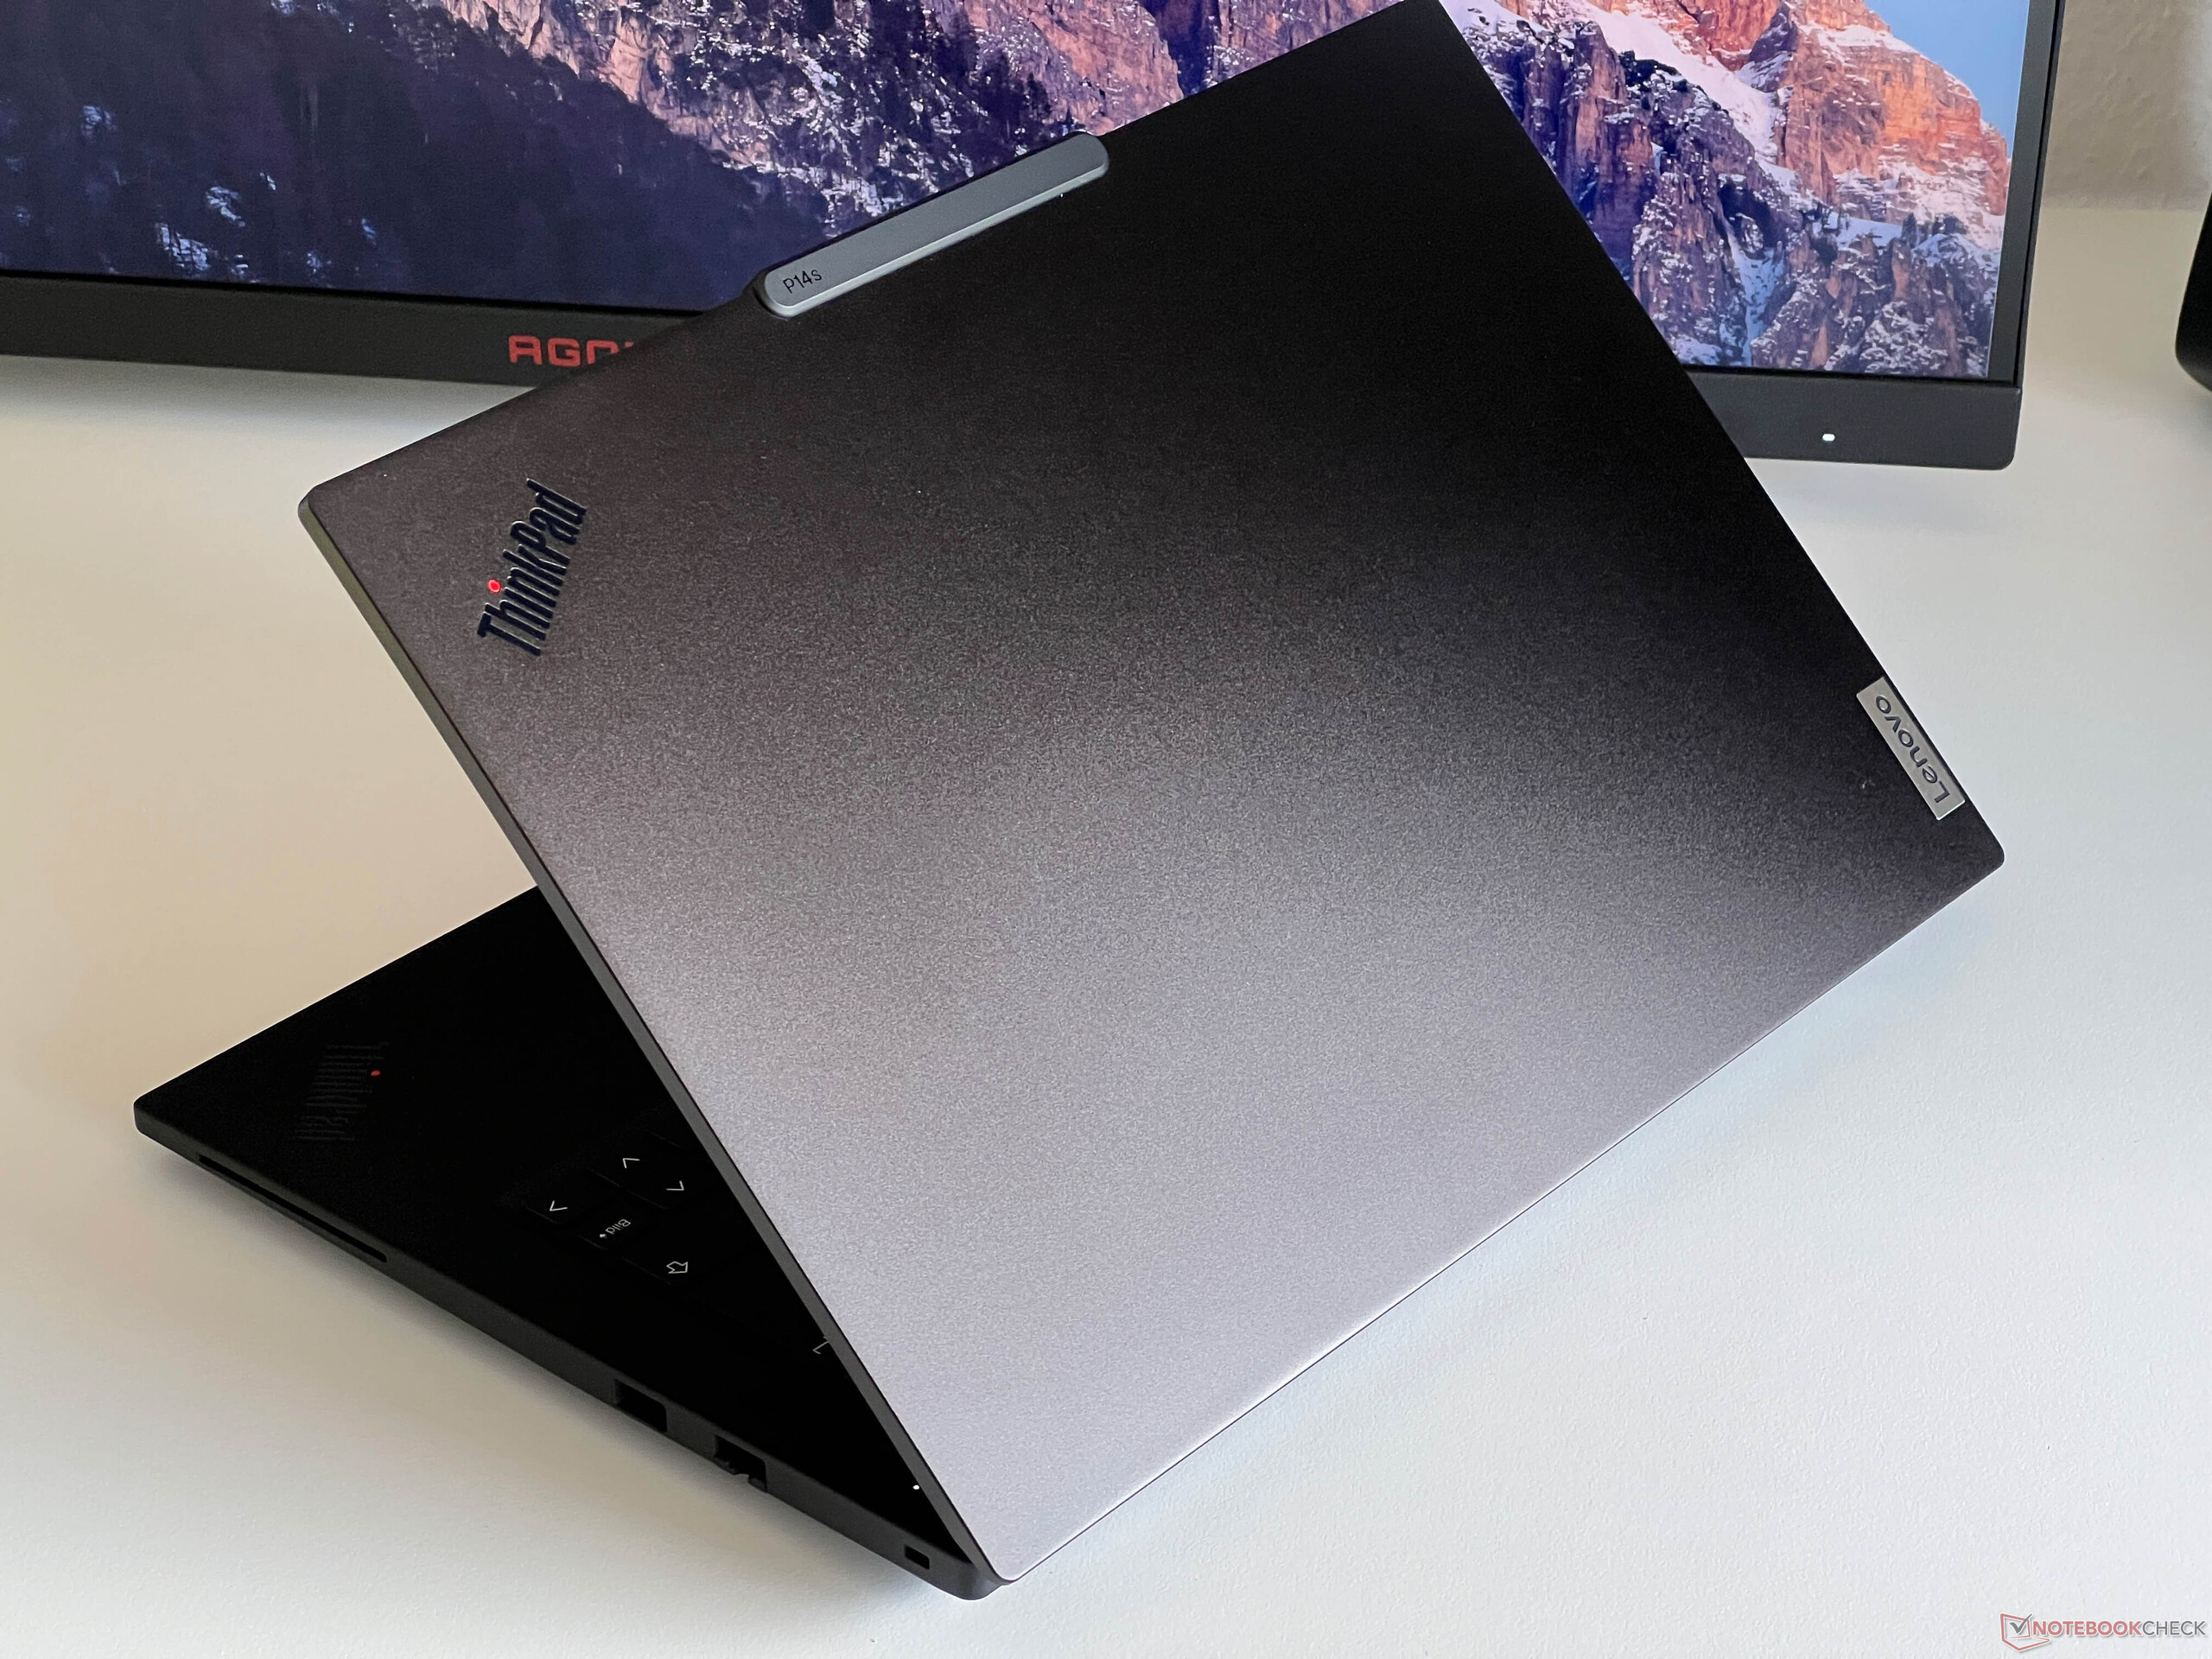
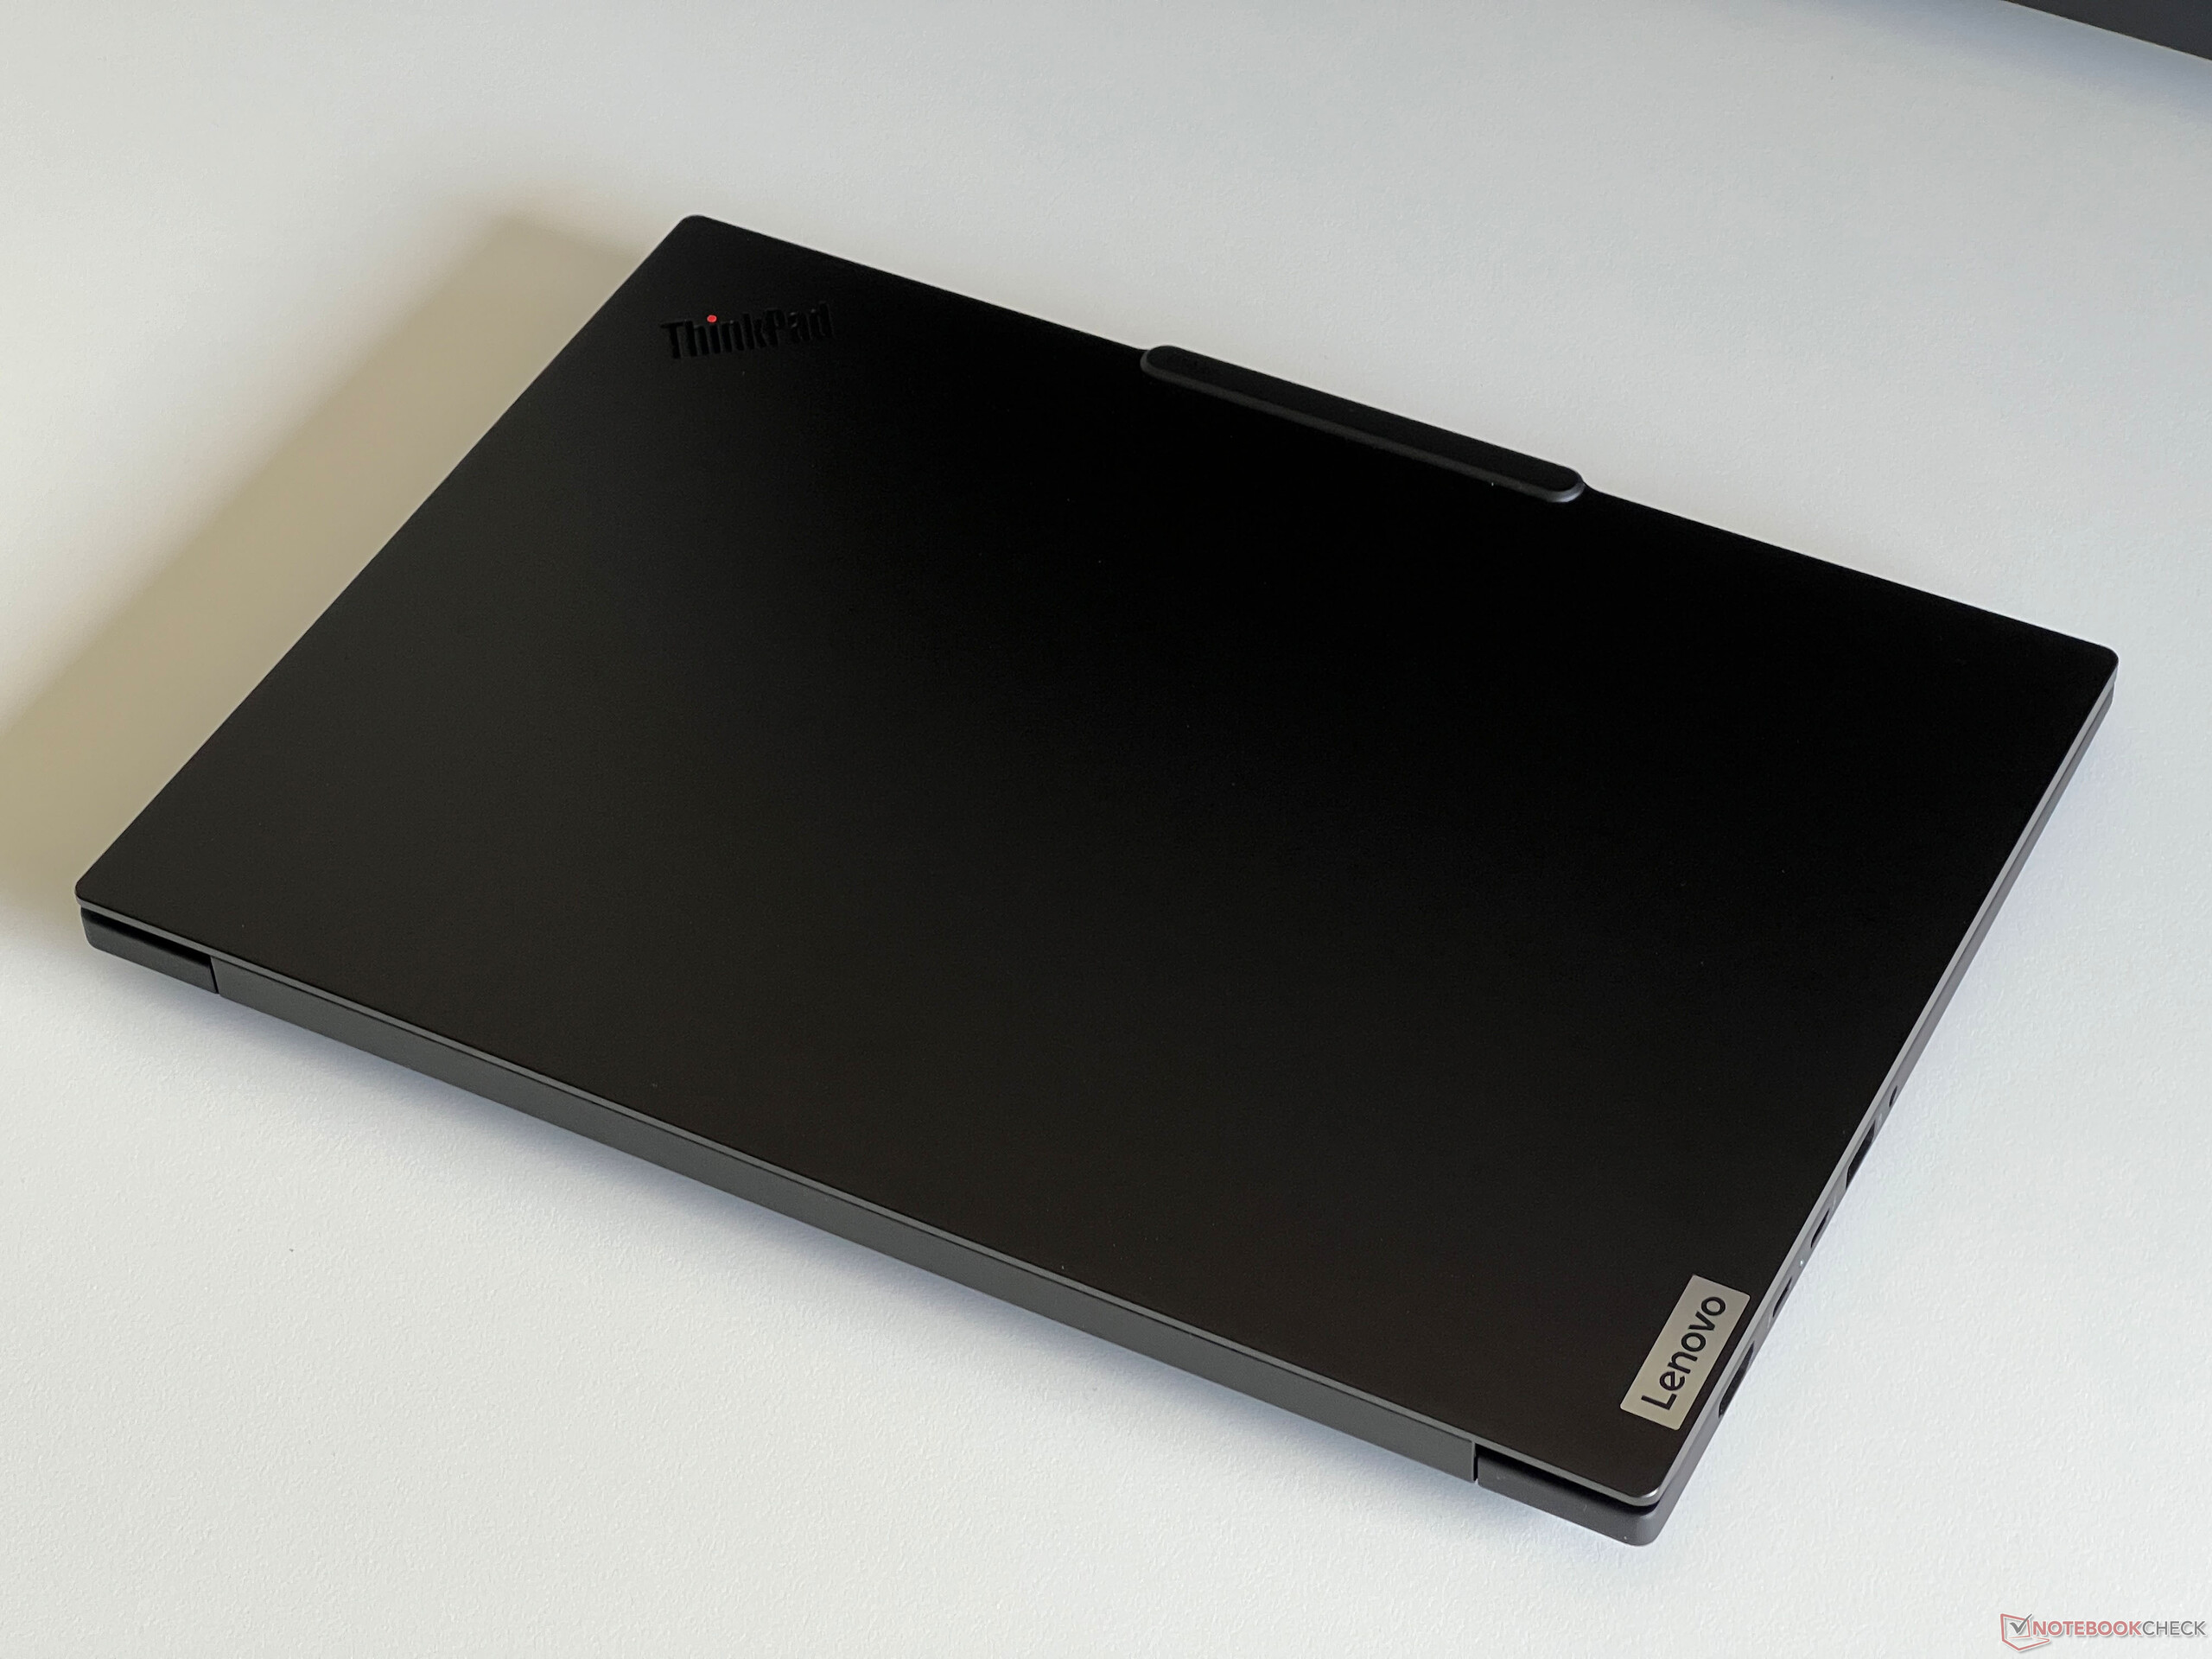
从外观上看,ThinkPad P14s G5 采用了与制造商当前机型相同的设计,遗憾的是,它的摄像头凸起并不美观。除此以外,它的设计一直保持简洁,对某些人来说,也许有些乏味。盖子和底部(均为铝合金)的光滑表面非常容易留下指纹印,而底座顶部(镁铝合金)则略带橡胶感,在这方面问题不大。屏幕的边框比前代机型略窄,这也是有空间安装更大的 14.5 英寸面板的原因。
底座的稳定性非常出色,没有任何东西可以压入或扭曲,但在我们的测试设备上,对键盘右侧区域施压会产生轻微的吱吱声。屏幕盖也非常稳定,我们在测试过程中没有发现任何图像错误。铰链整体非常紧,但单手仍可打开设备。不过,在改变打开角度(最大 180 度)时,无法完全避免摇晃。
我们已经讨论过它的高度,但就其占地面积而言,新款 P14s G5 也是我们对比组中最大的机型之一。它的重量为 1.72 千克,135 瓦电源的重量为 527 克。
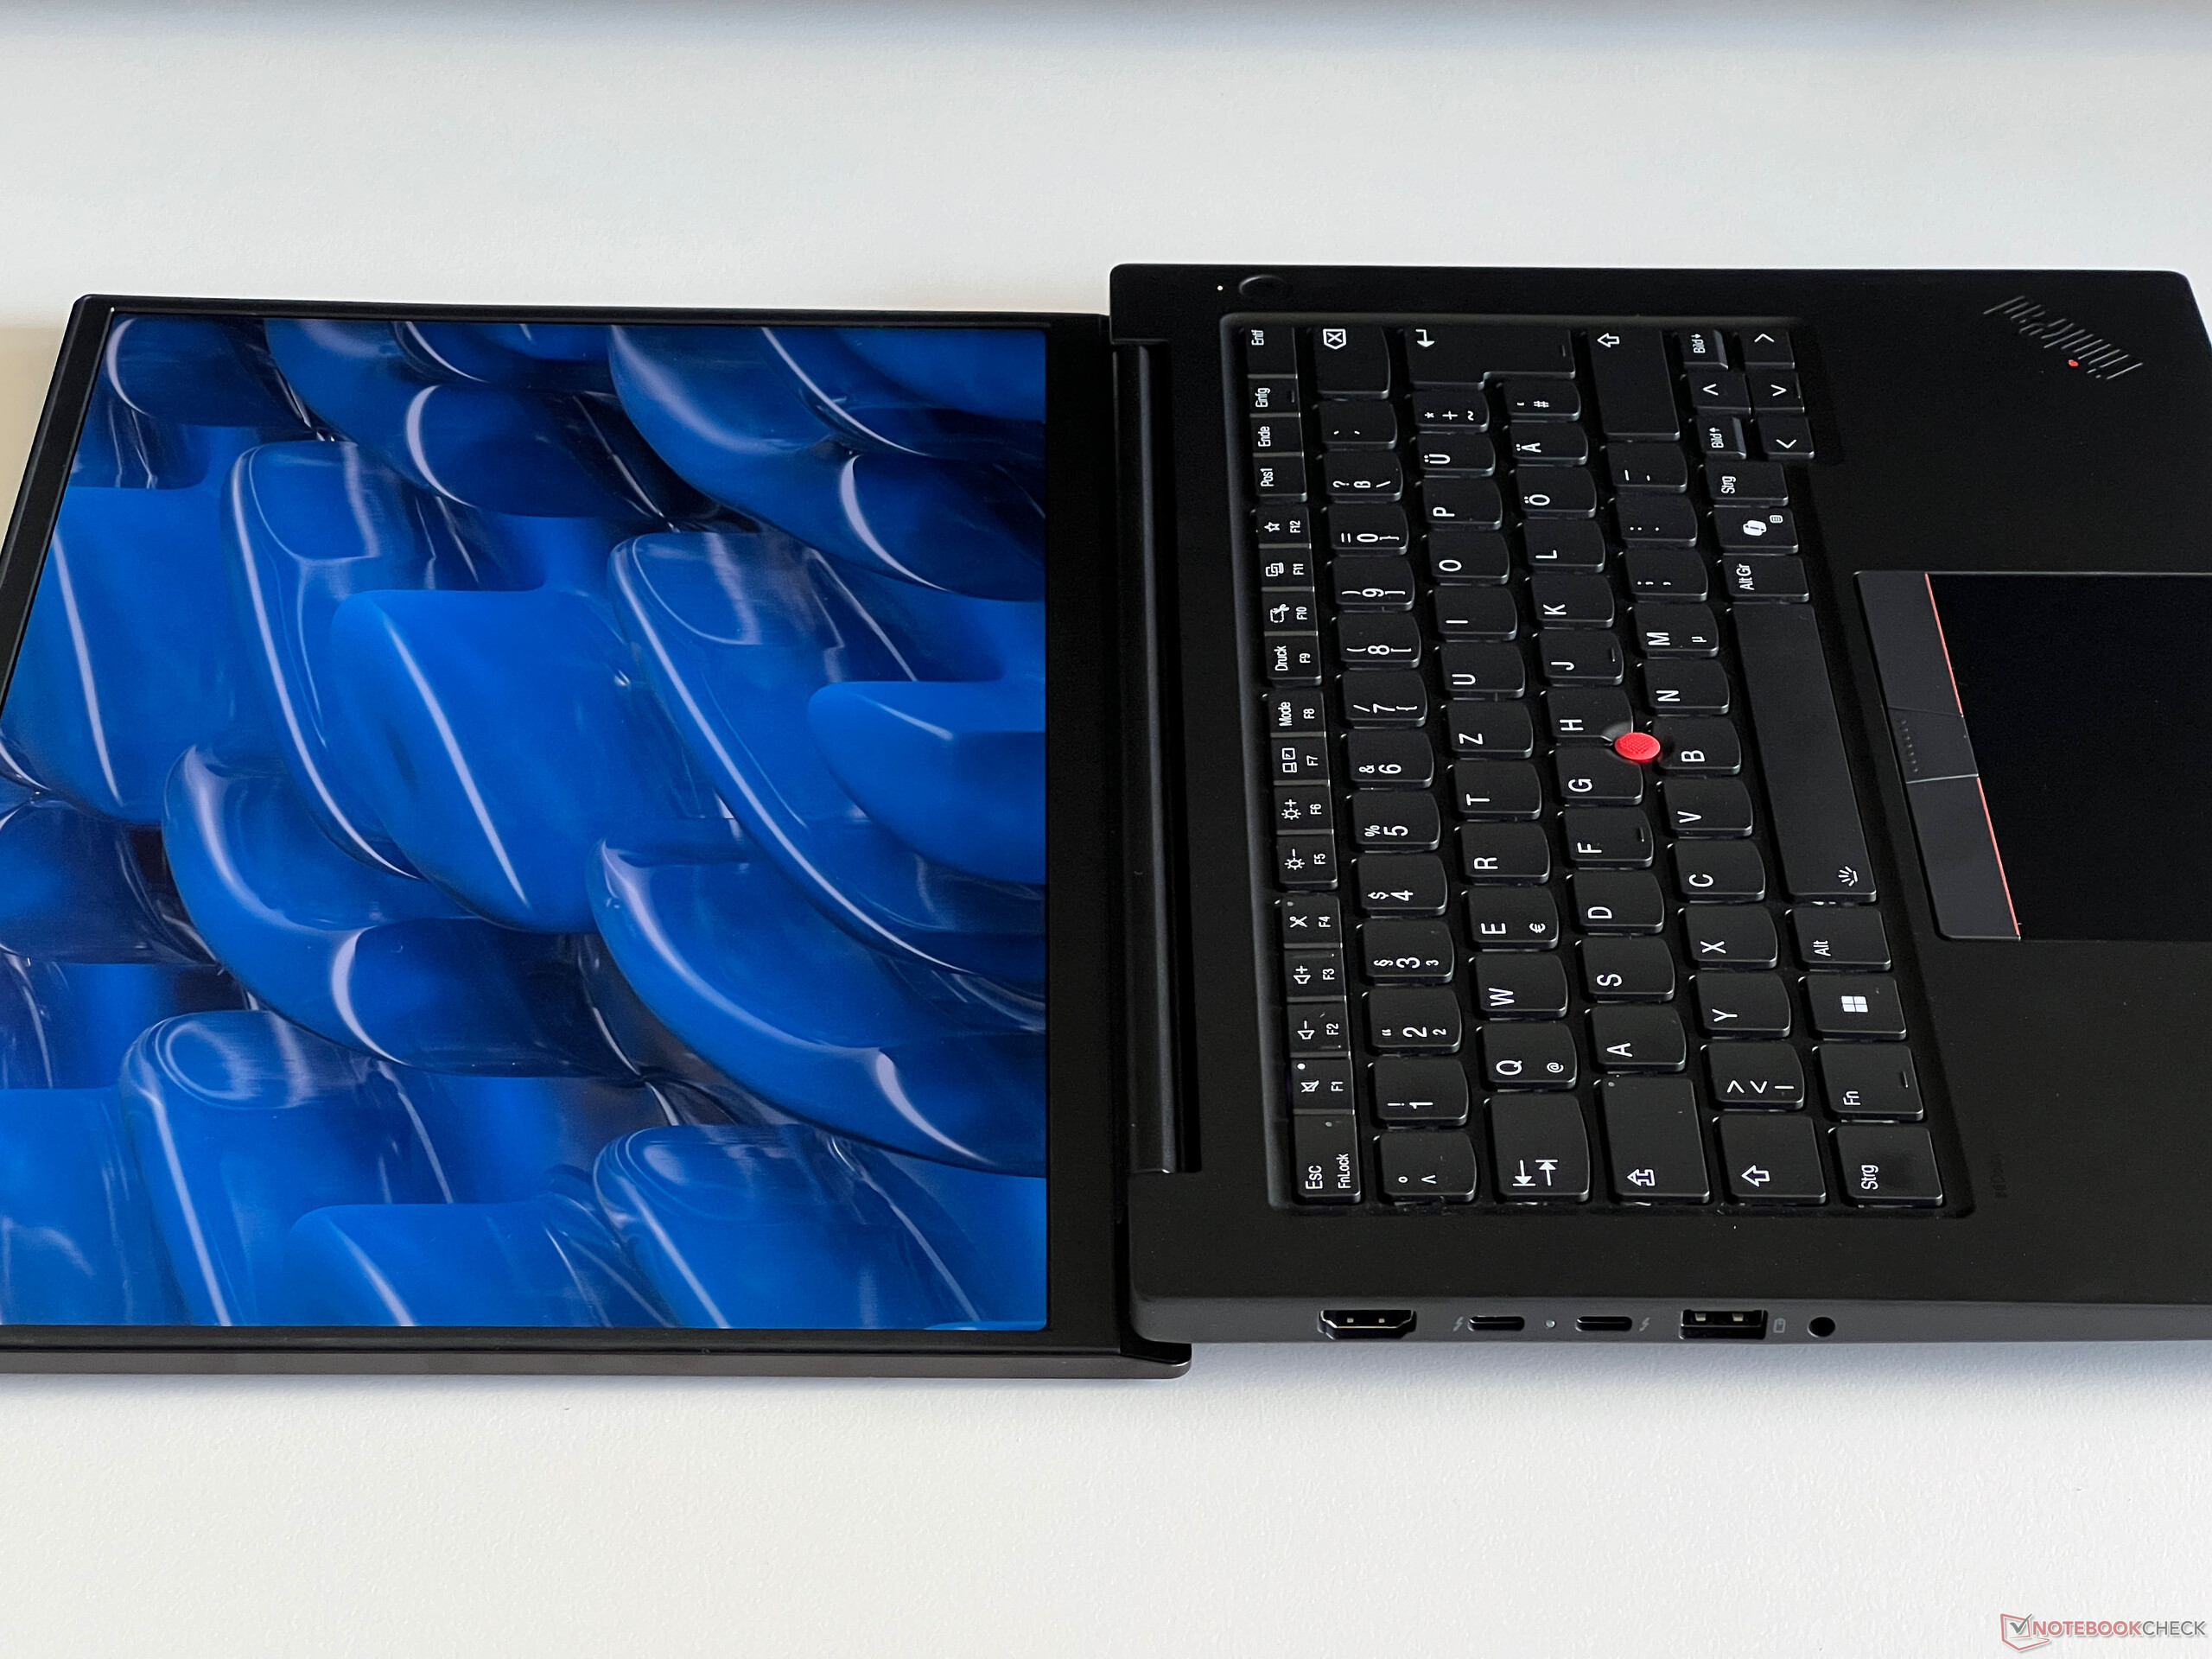
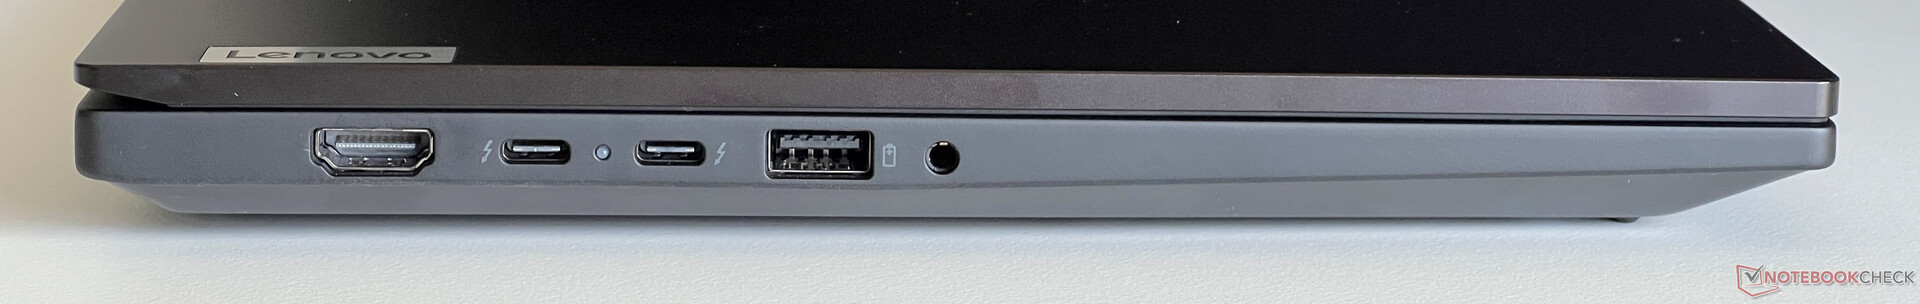
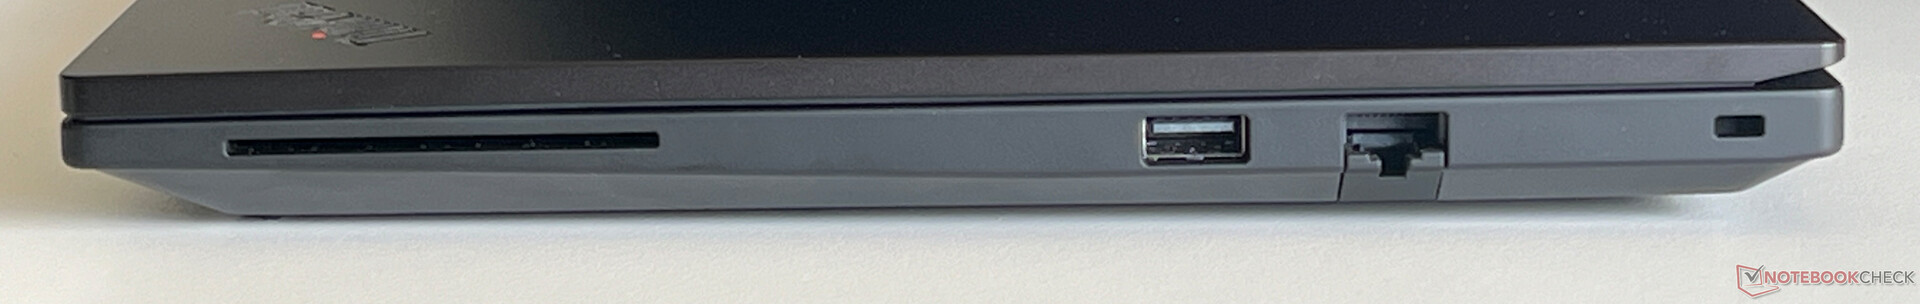
连接性 - Thunderbolt 4 和智能卡读卡器
除了现代的 Thunderbolt 4 端口外,还安装了两个普通的 USB-A 端口。这意味着在日常使用中,你不必再去找适配器。我们的测试设备还配备了一个可选的智能卡读卡器,但没有 SD 卡读卡器。
交流
联想安装了英特尔 AX211 WLAN 模块,它还支持现代 6 GHz 网络和蓝牙 5.3。但 Wi-Fi 7 模块并未安装。在我们使用华硕参考路由器进行的测试中,其传输速率非常出色,也非常稳定,因此在使用过程中不会出现任何问题。千兆以太网端口(英特尔 i219-V)也可用于有线网络。
P14s G5 还配备了一个用于 WWAN 模块的 M.2-2242 插槽,但由于法律纠纷,目前在德国(本次测试所在地)还没有相应的配置。此外,还缺少必要的天线(不支持 WWAN),因此用户在不采取额外措施的情况下无法加装模块。
| Networking | |
| Lenovo ThinkPad P14s G5 21G3S00A00 | |
| iperf3 transmit AXE11000 | |
| iperf3 receive AXE11000 | |
| HP ZBook Firefly 14 G11 | |
| iperf3 transmit AXE11000 | |
| iperf3 receive AXE11000 | |
| iperf3 transmit AXE11000 6GHz | |
| iperf3 receive AXE11000 6GHz | |
| Dell Precision 5000 5490 | |
| iperf3 transmit AXE11000 | |
| iperf3 receive AXE11000 | |
| iperf3 transmit AXE11000 6GHz | |
| iperf3 receive AXE11000 6GHz | |
| Lenovo ThinkPad P14s G4 21HF0017GE | |
| iperf3 transmit AXE11000 | |
| iperf3 receive AXE11000 | |
| iperf3 transmit AXE11000 6GHz | |
| iperf3 receive AXE11000 6GHz | |
| Microsoft Surface Laptop Studio 2 RTX 4060 | |
| iperf3 transmit AXE11000 | |
| iperf3 receive AXE11000 | |
| Lenovo Yoga Pro 9-14IRP G8 | |
| iperf3 transmit AXE11000 | |
| iperf3 receive AXE11000 | |
网络摄像头
网络摄像头可捕捉高达 500 万像素的 4:3 图像(2,592 x 1,944 像素)或 370 万像素的 16:9 图像(2,560 x 1,440 像素)。其图像清晰度优于一般的 200 万像素传感器,而且还支持附加的 Windows Studio 效果。


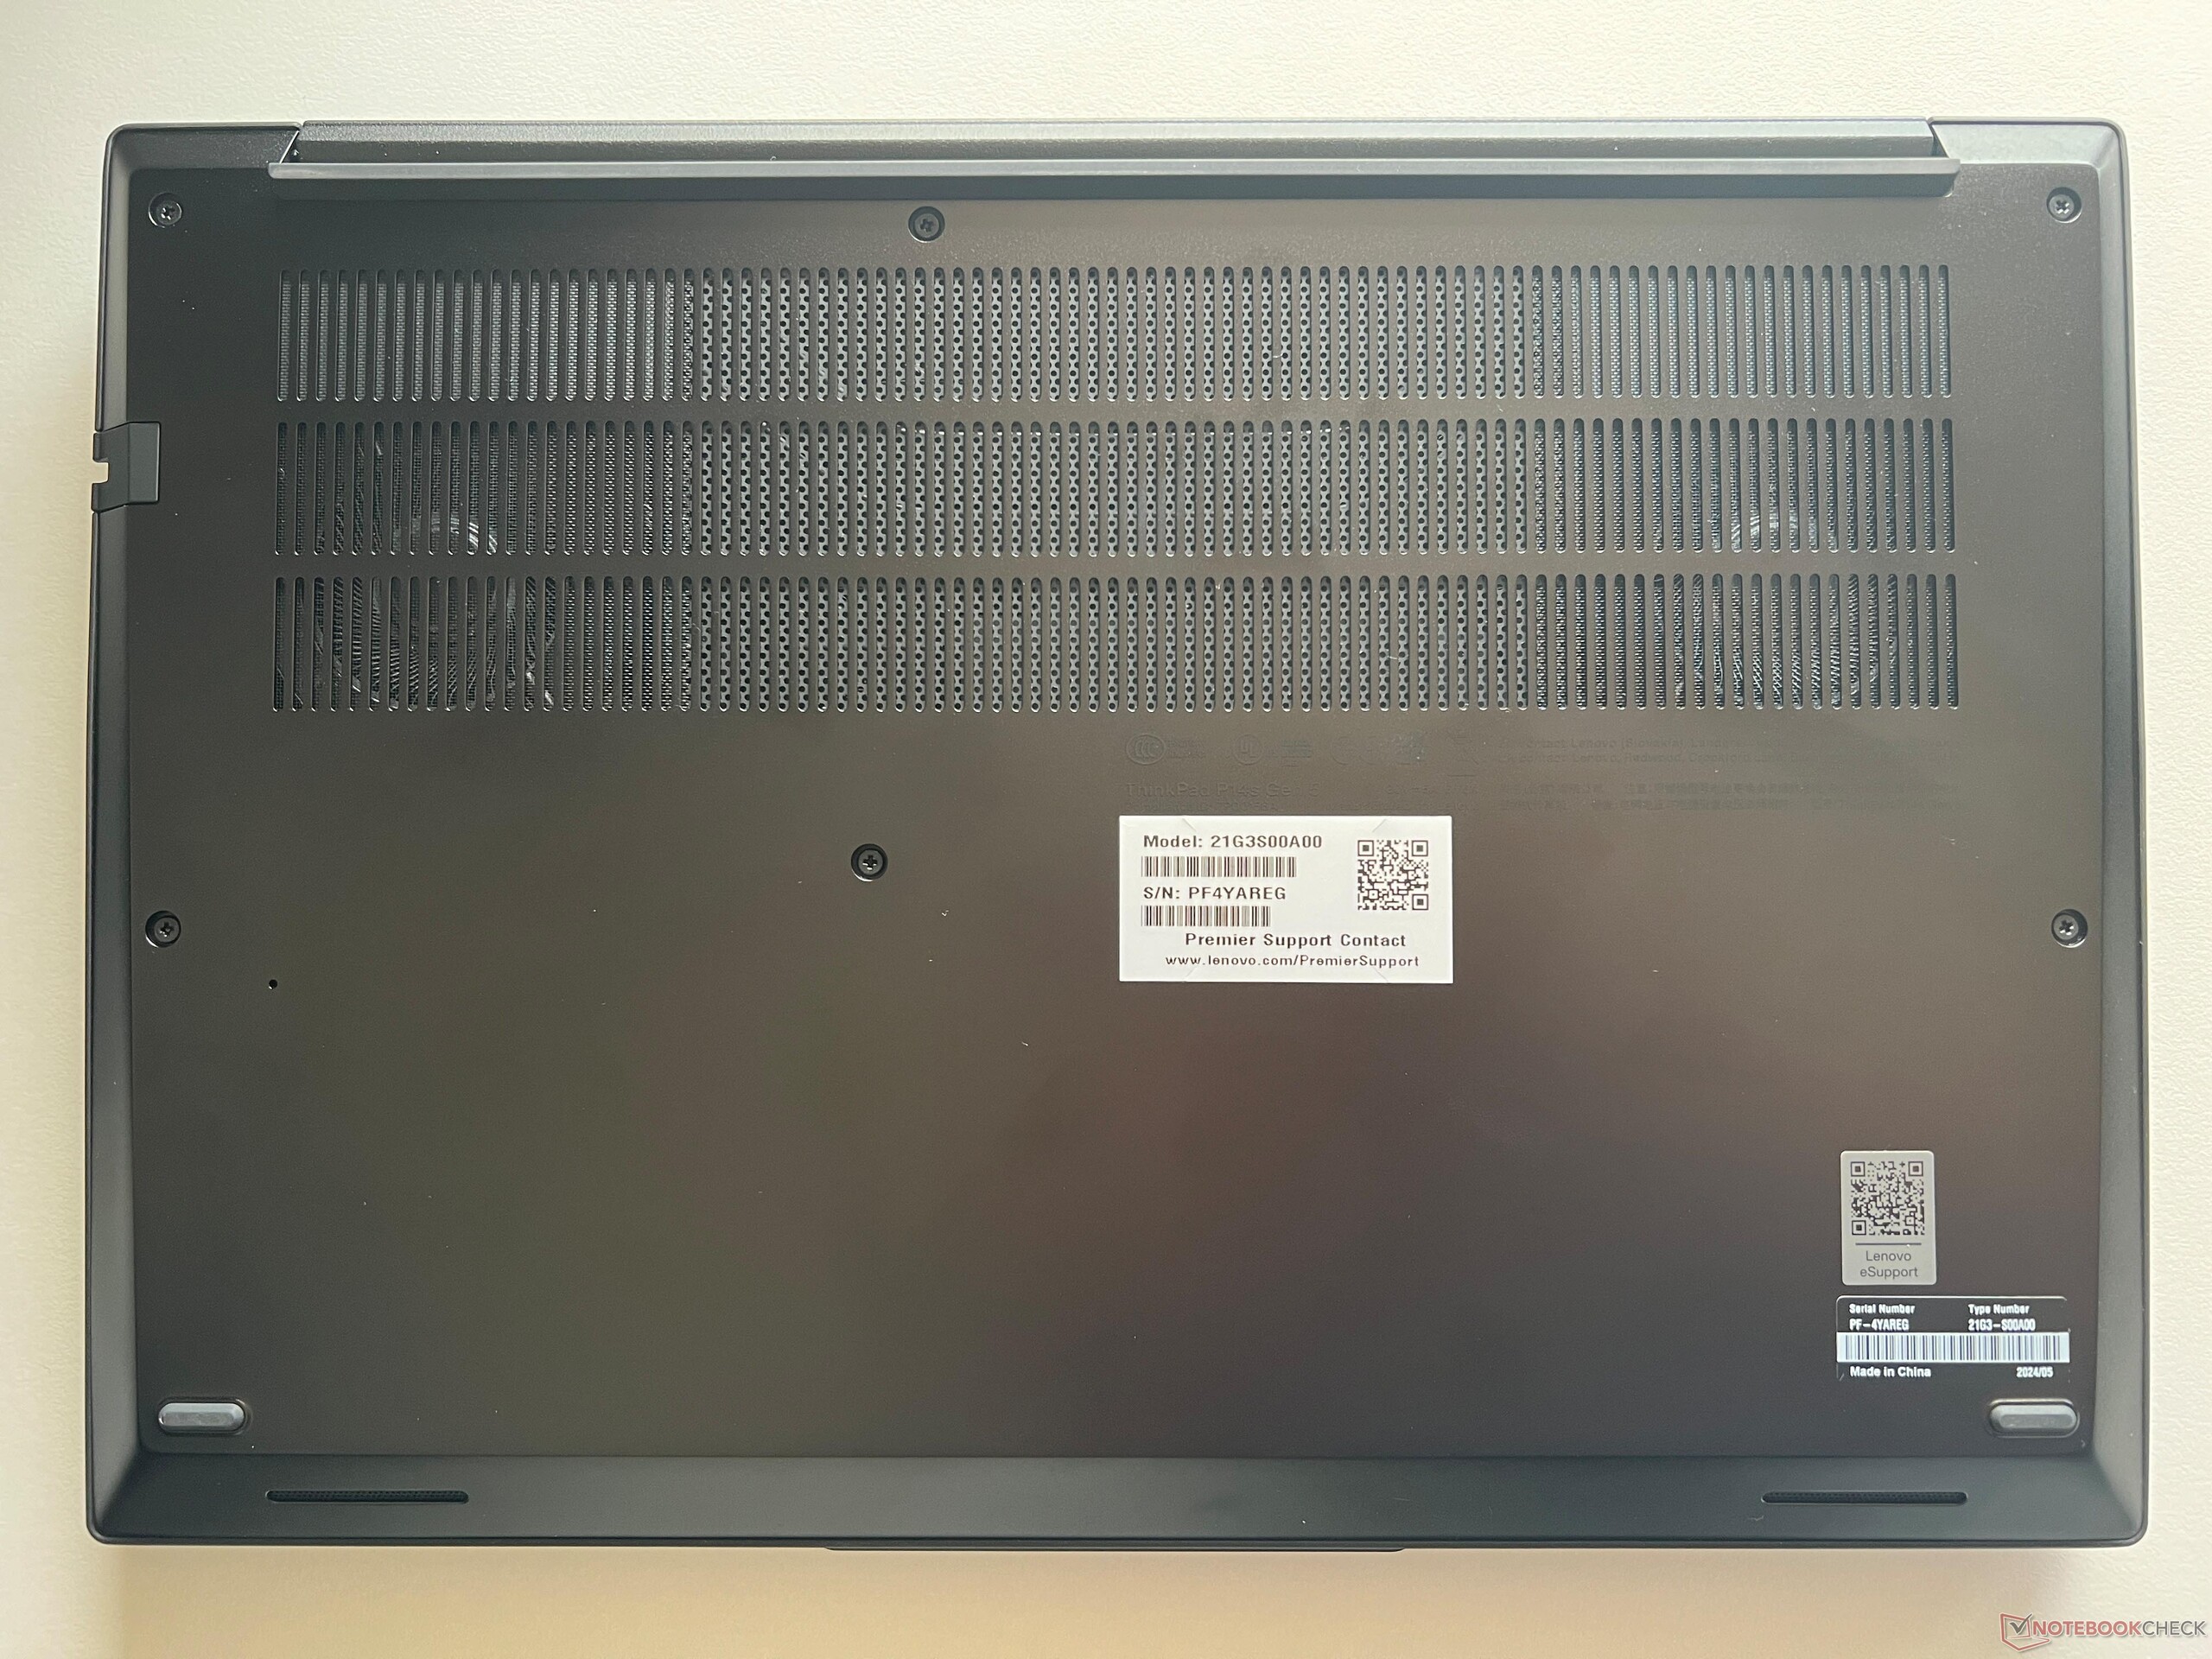
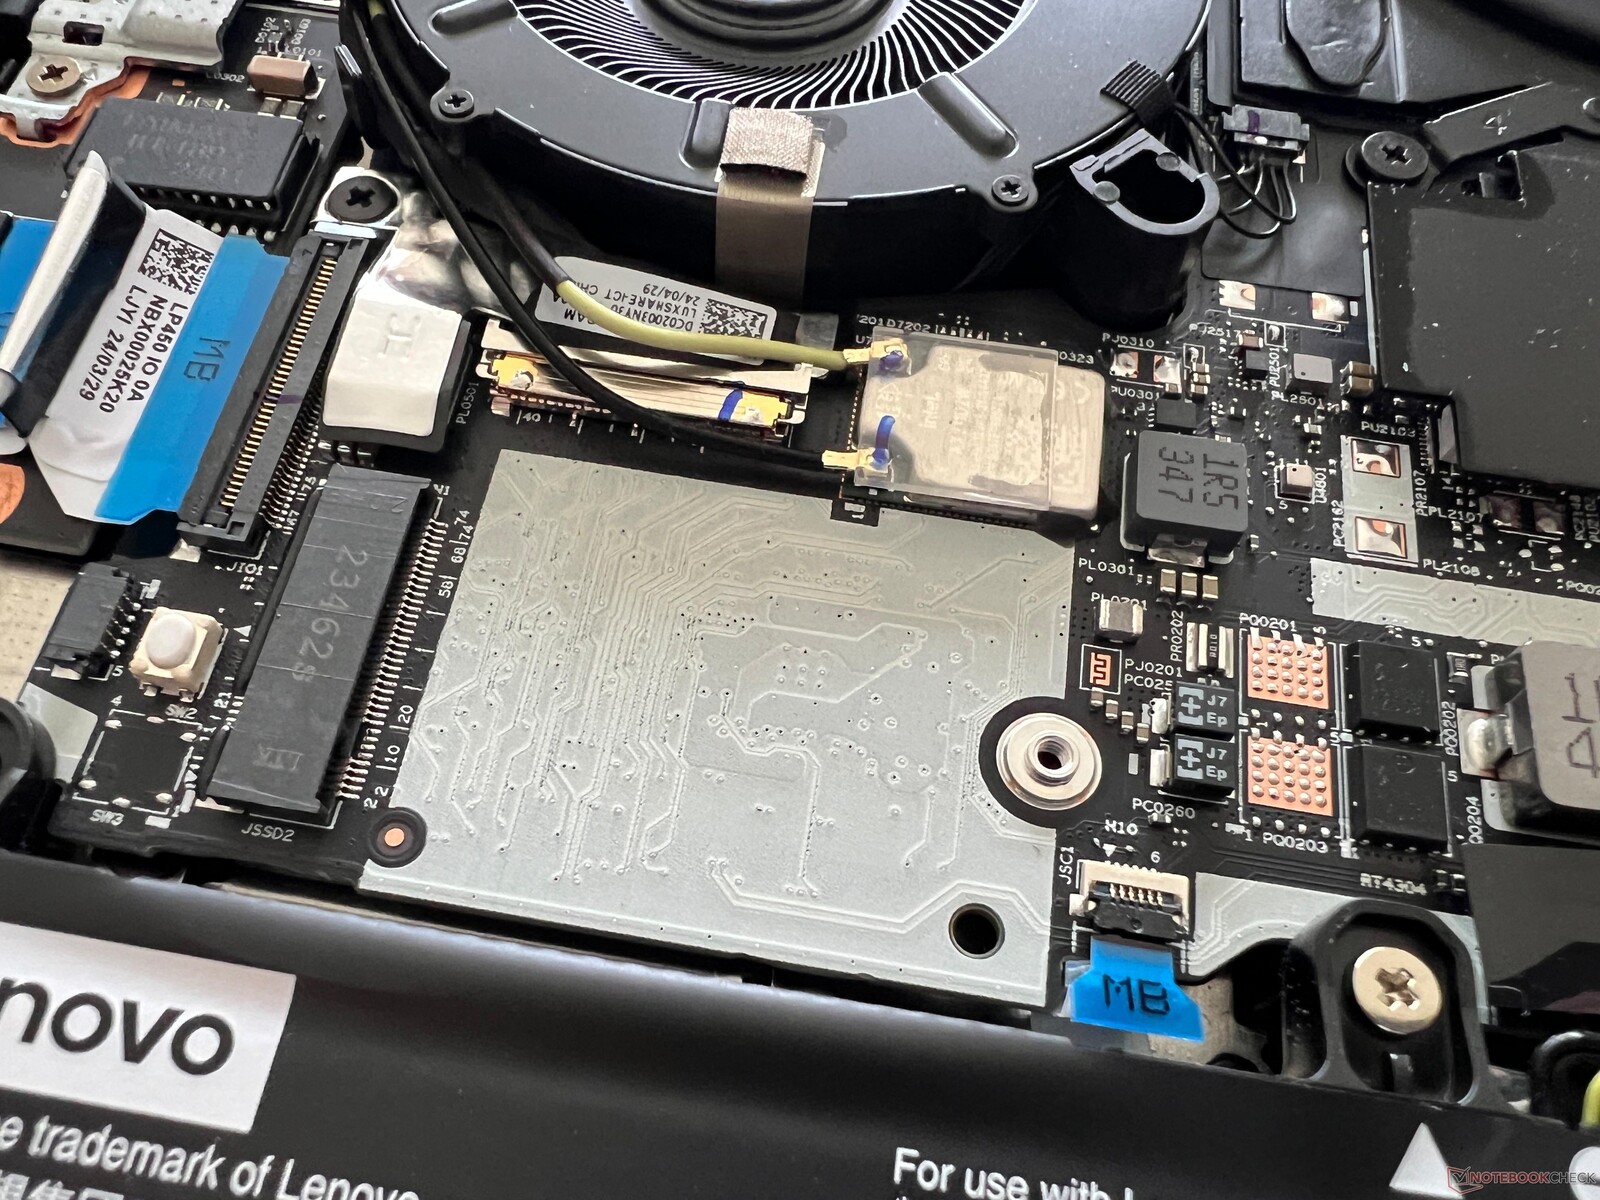
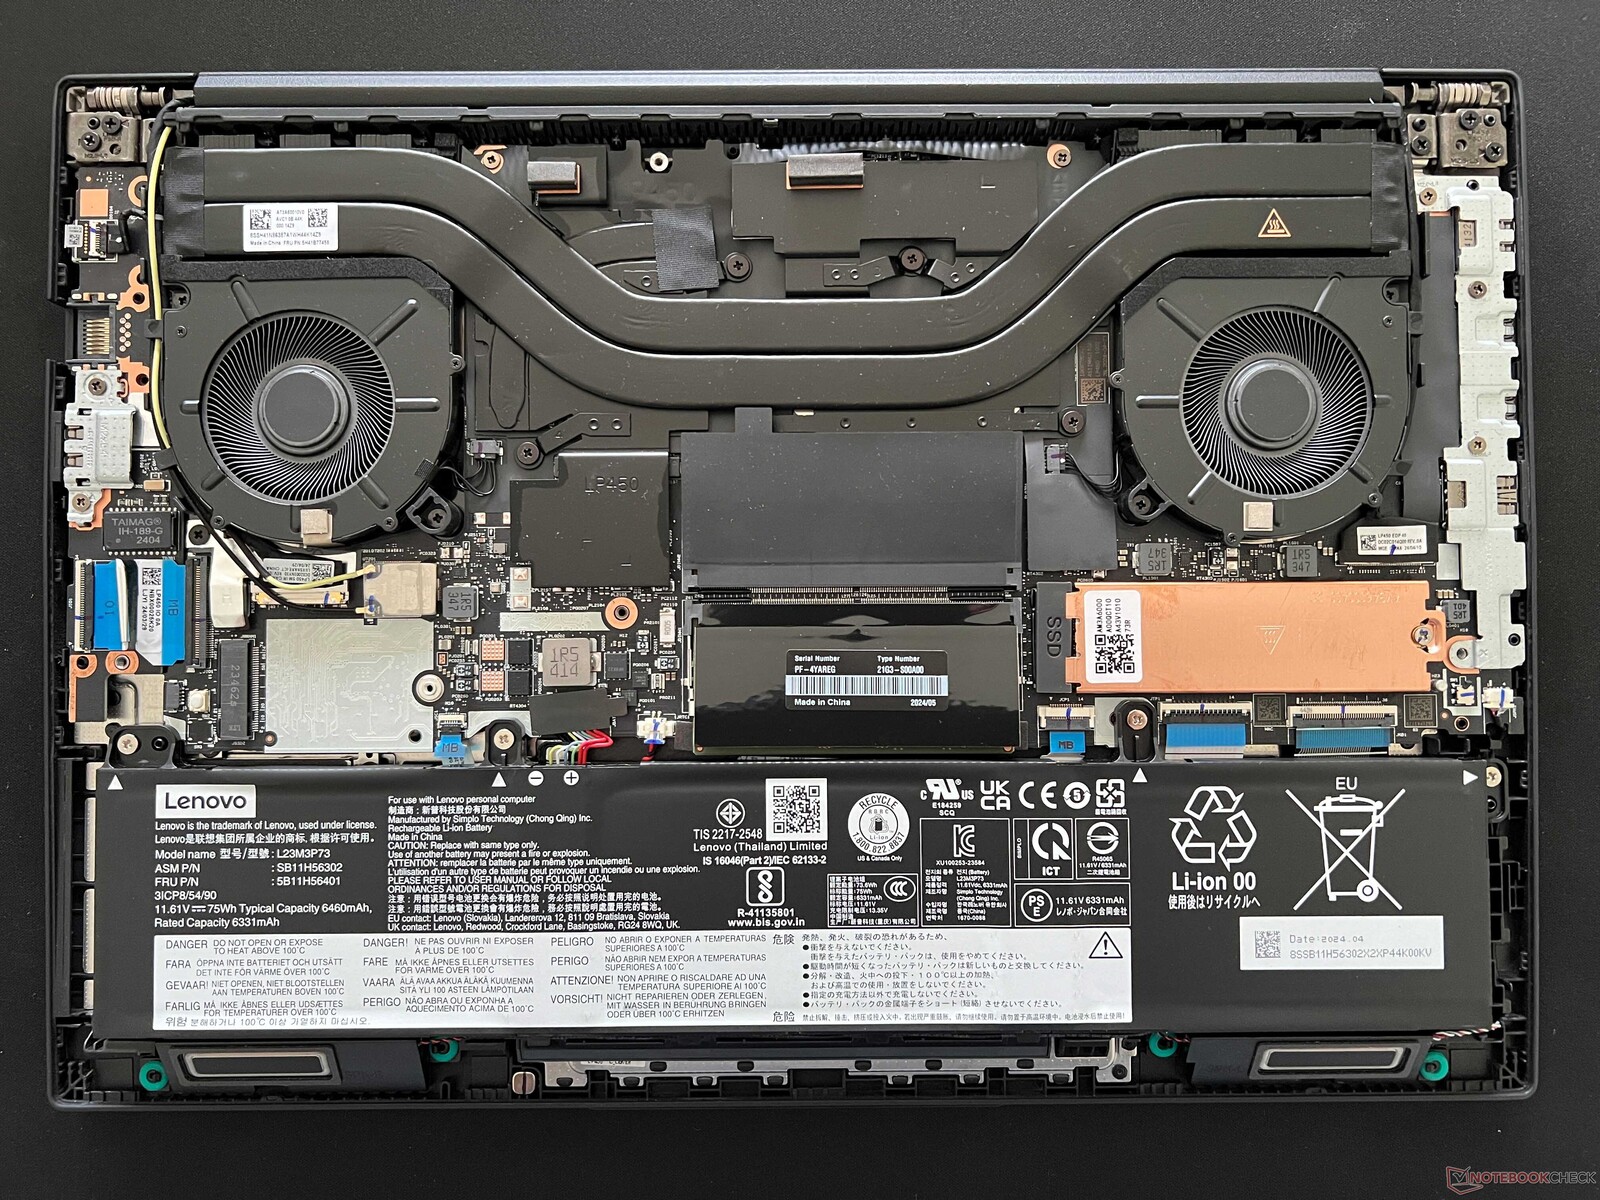
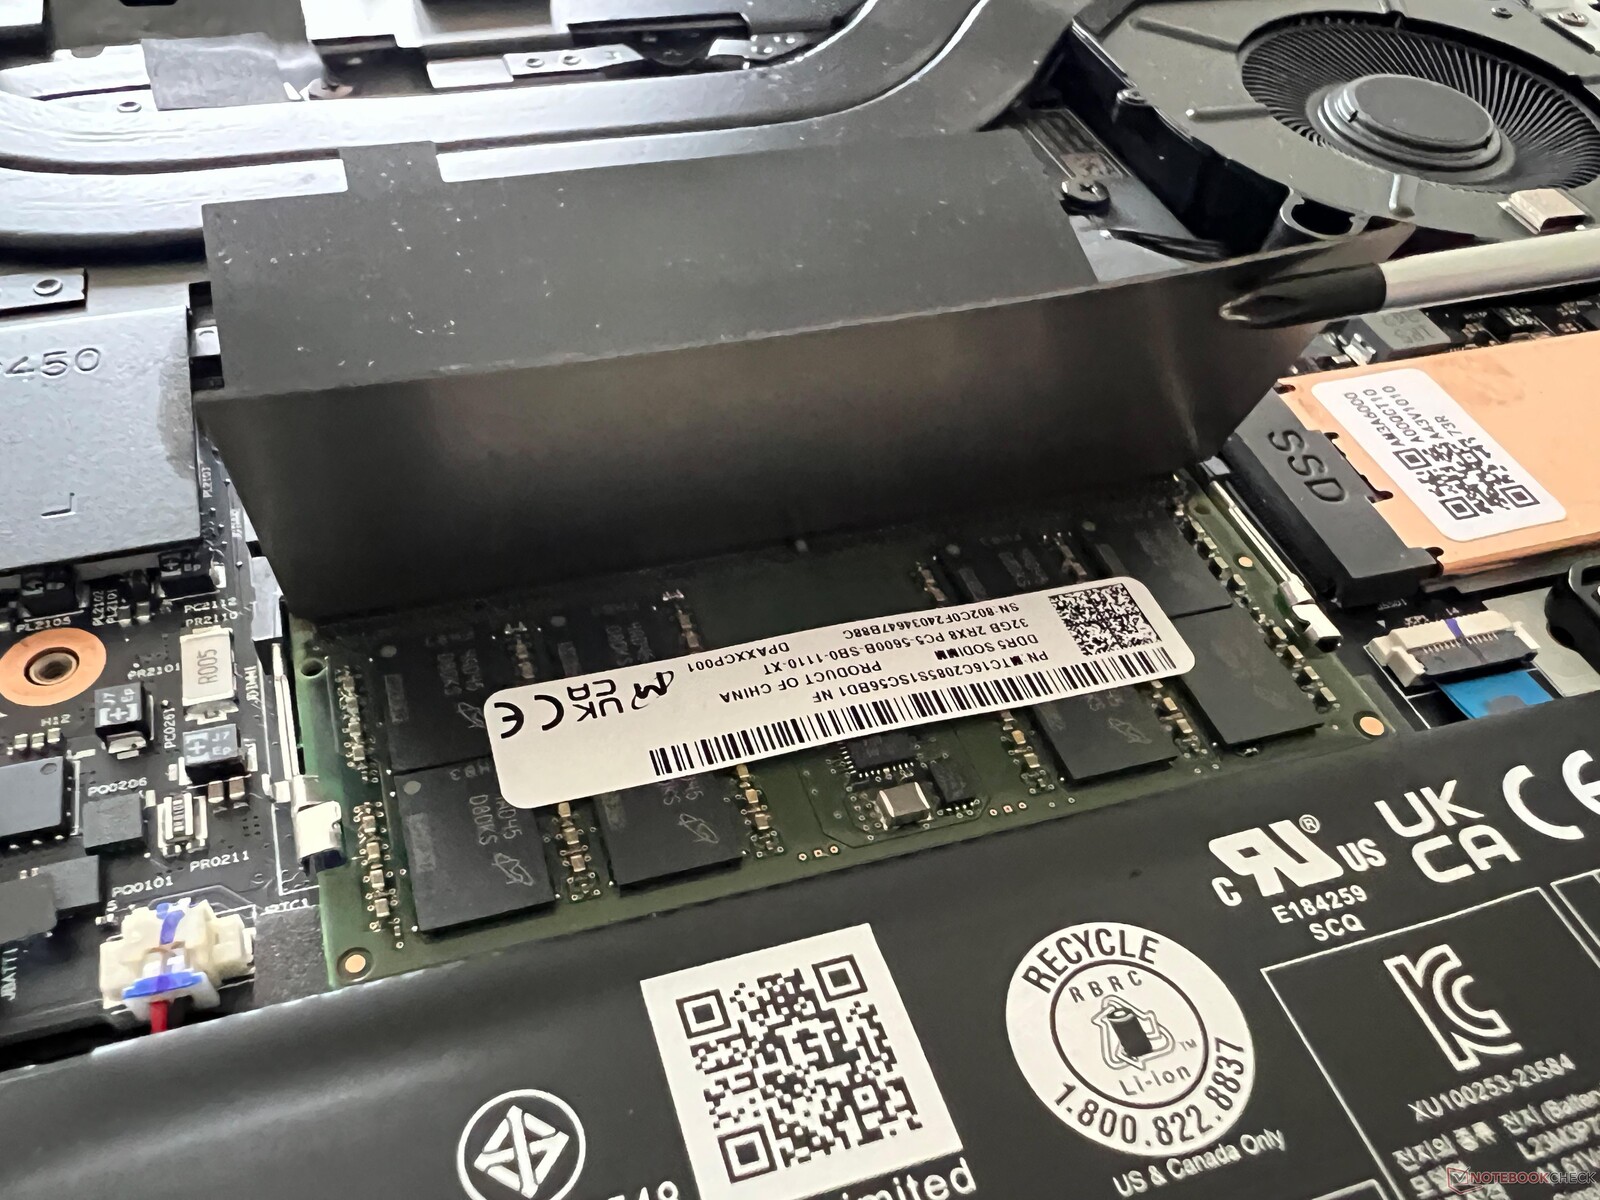
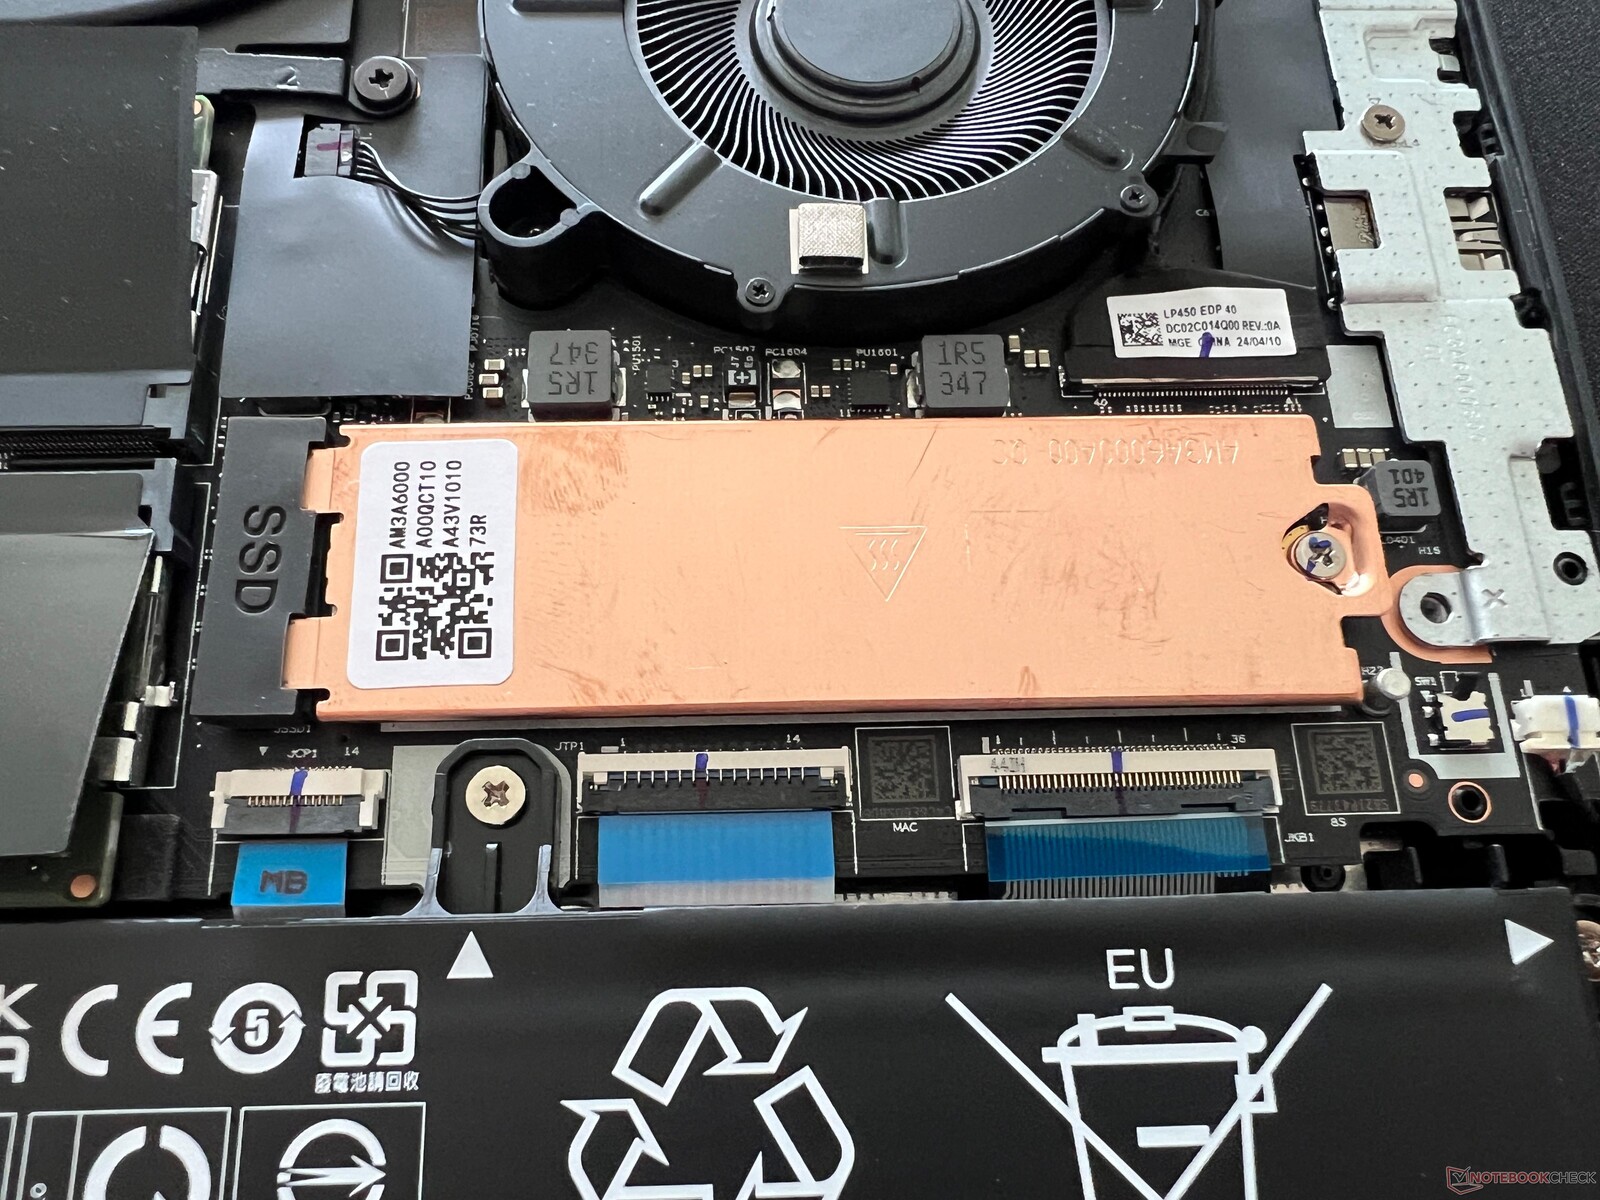
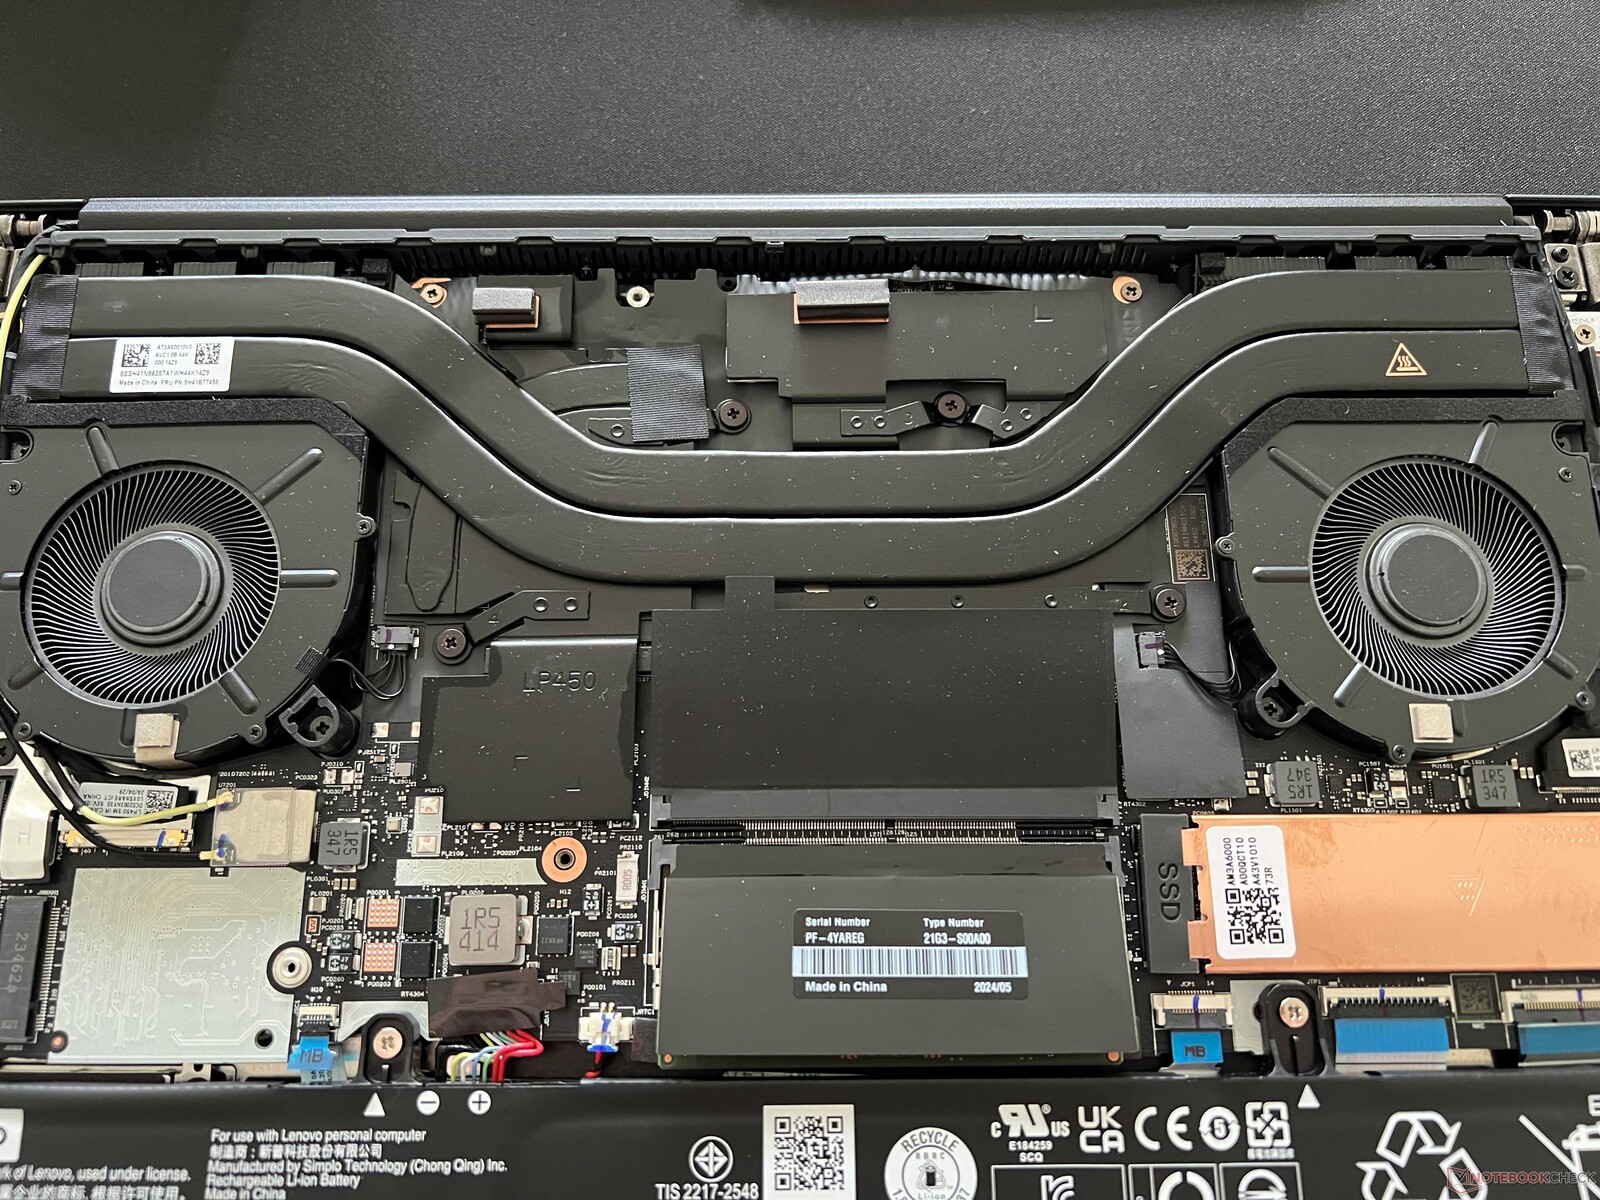
维护
机箱底盖由六颗十字螺丝固定,可以轻松取下。处理器、显卡和 WLAN 模块都是焊接上去的,但 M.2 2280 固态硬盘和内存都可以升级。两个 DIMM 插槽可容纳最大 48 GB 的模块,这意味着笔记本电脑总共可安装 96 GB 内存。
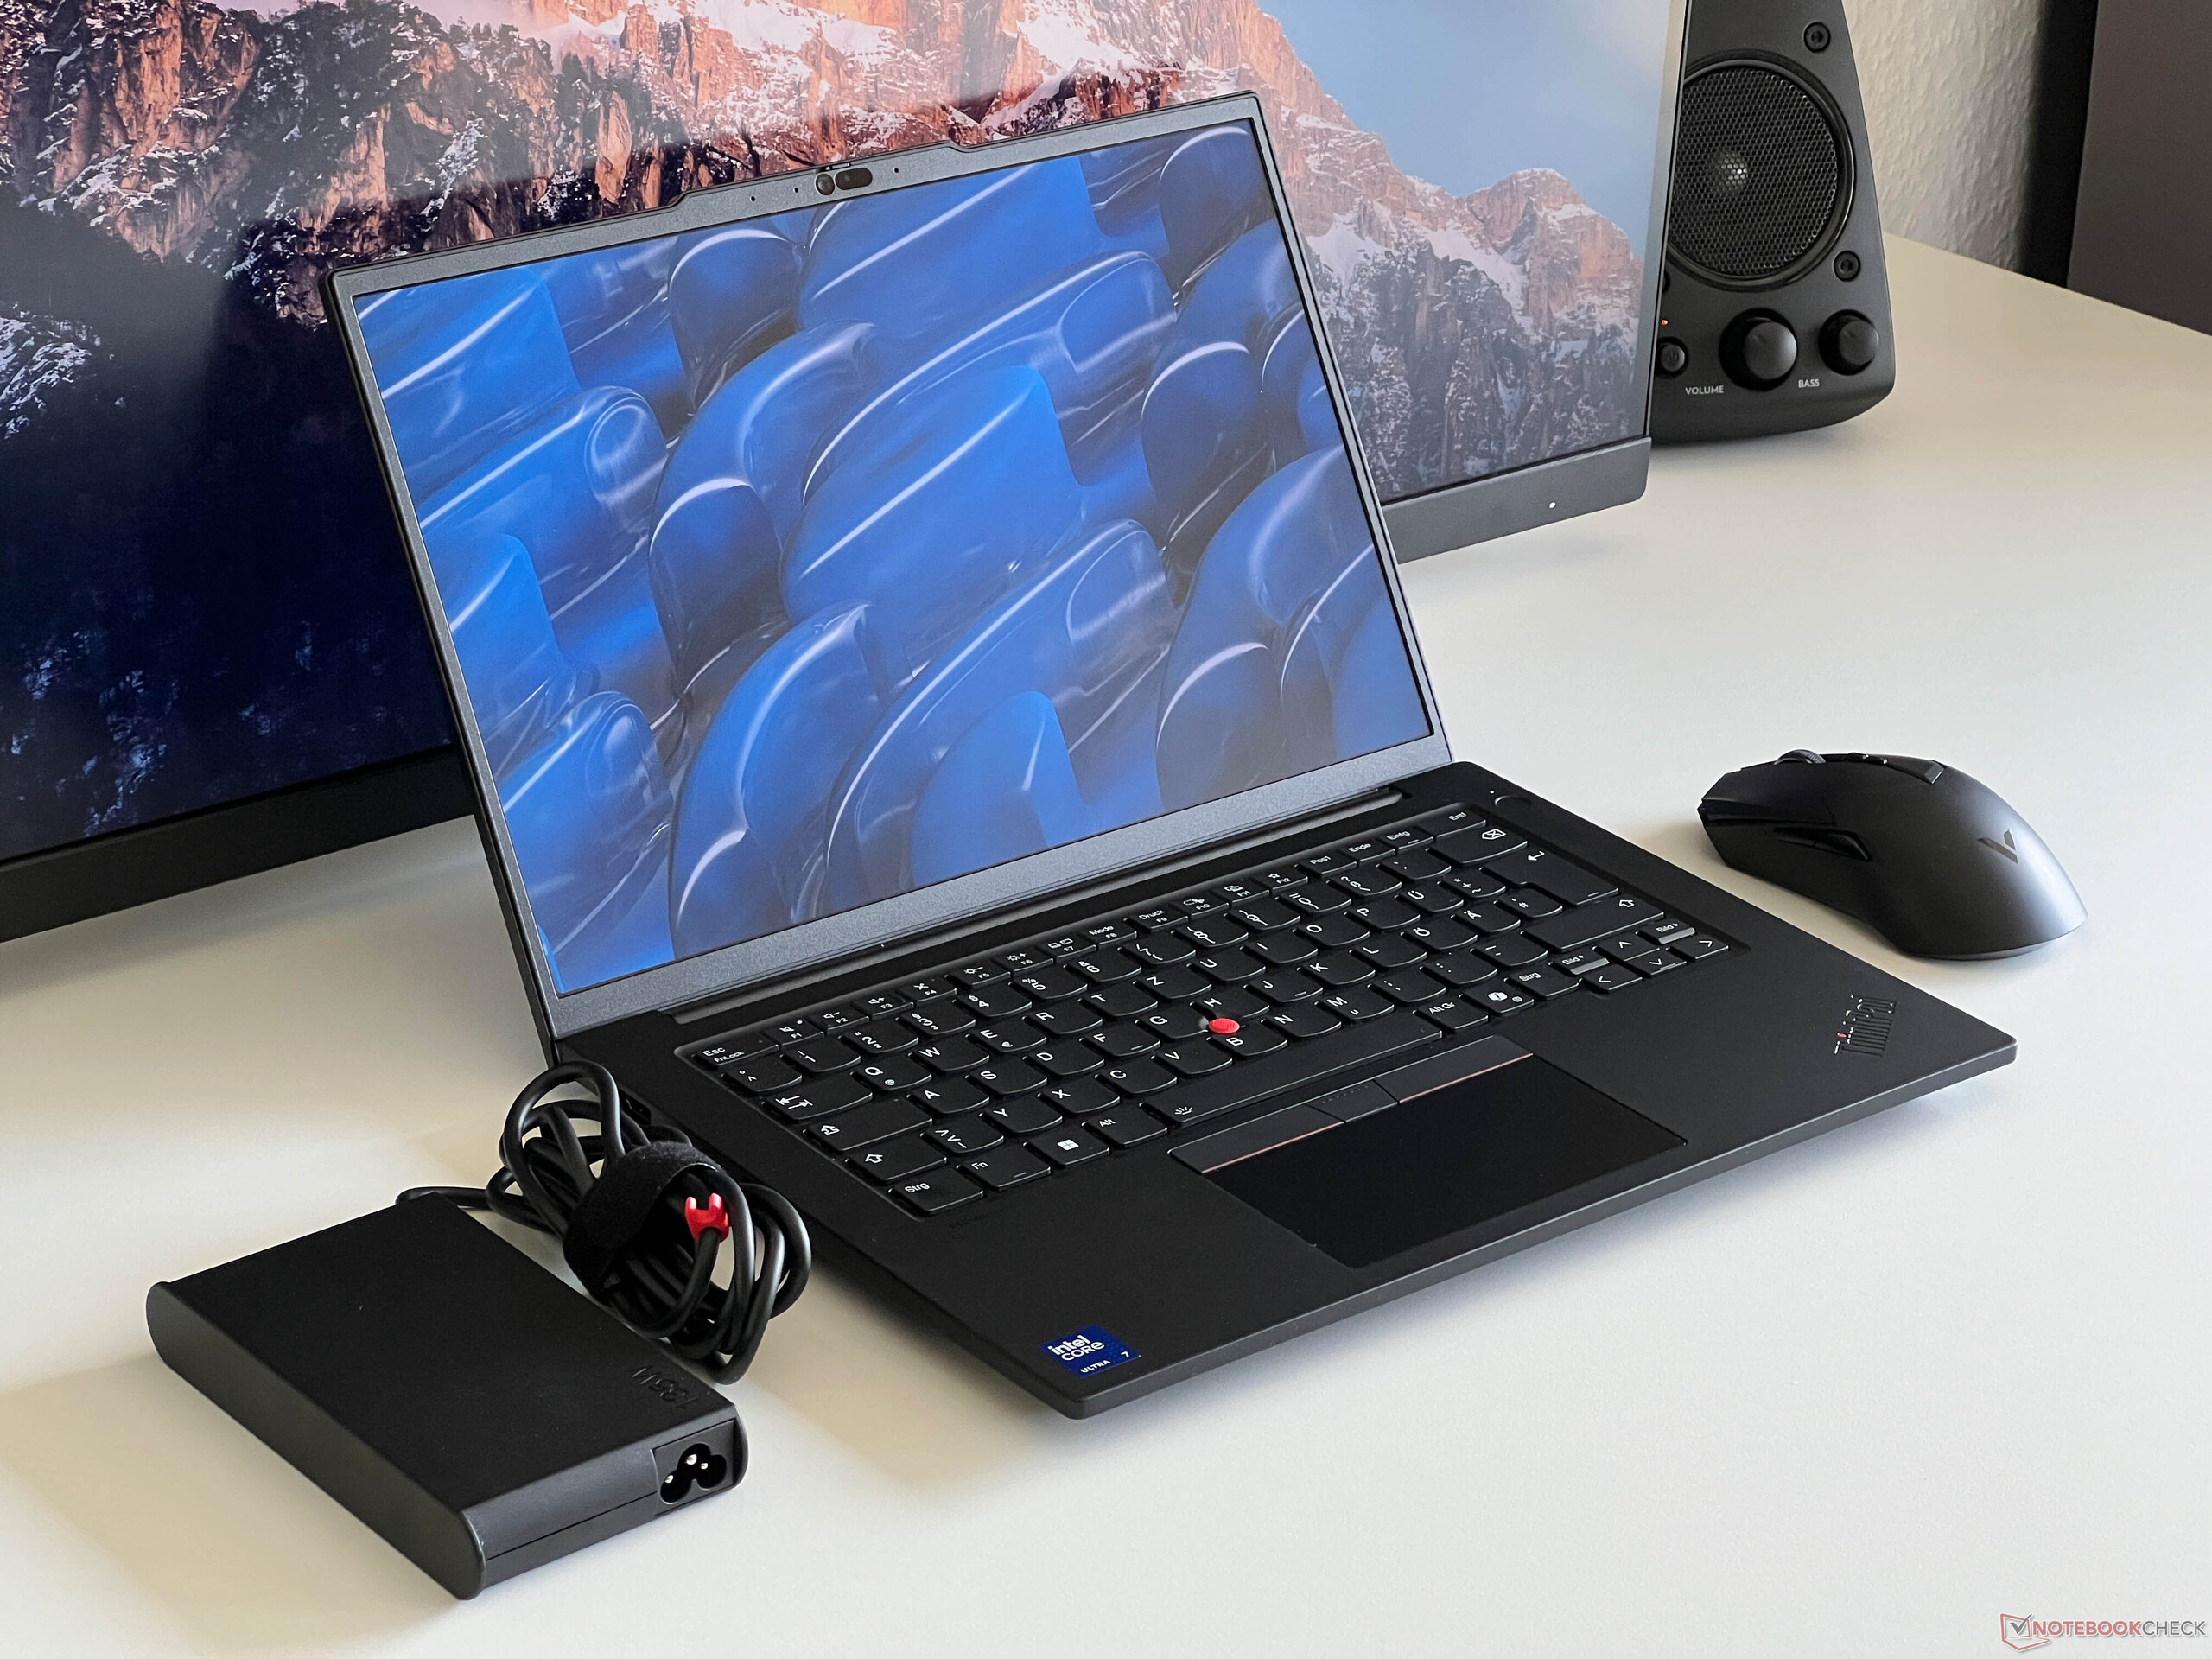
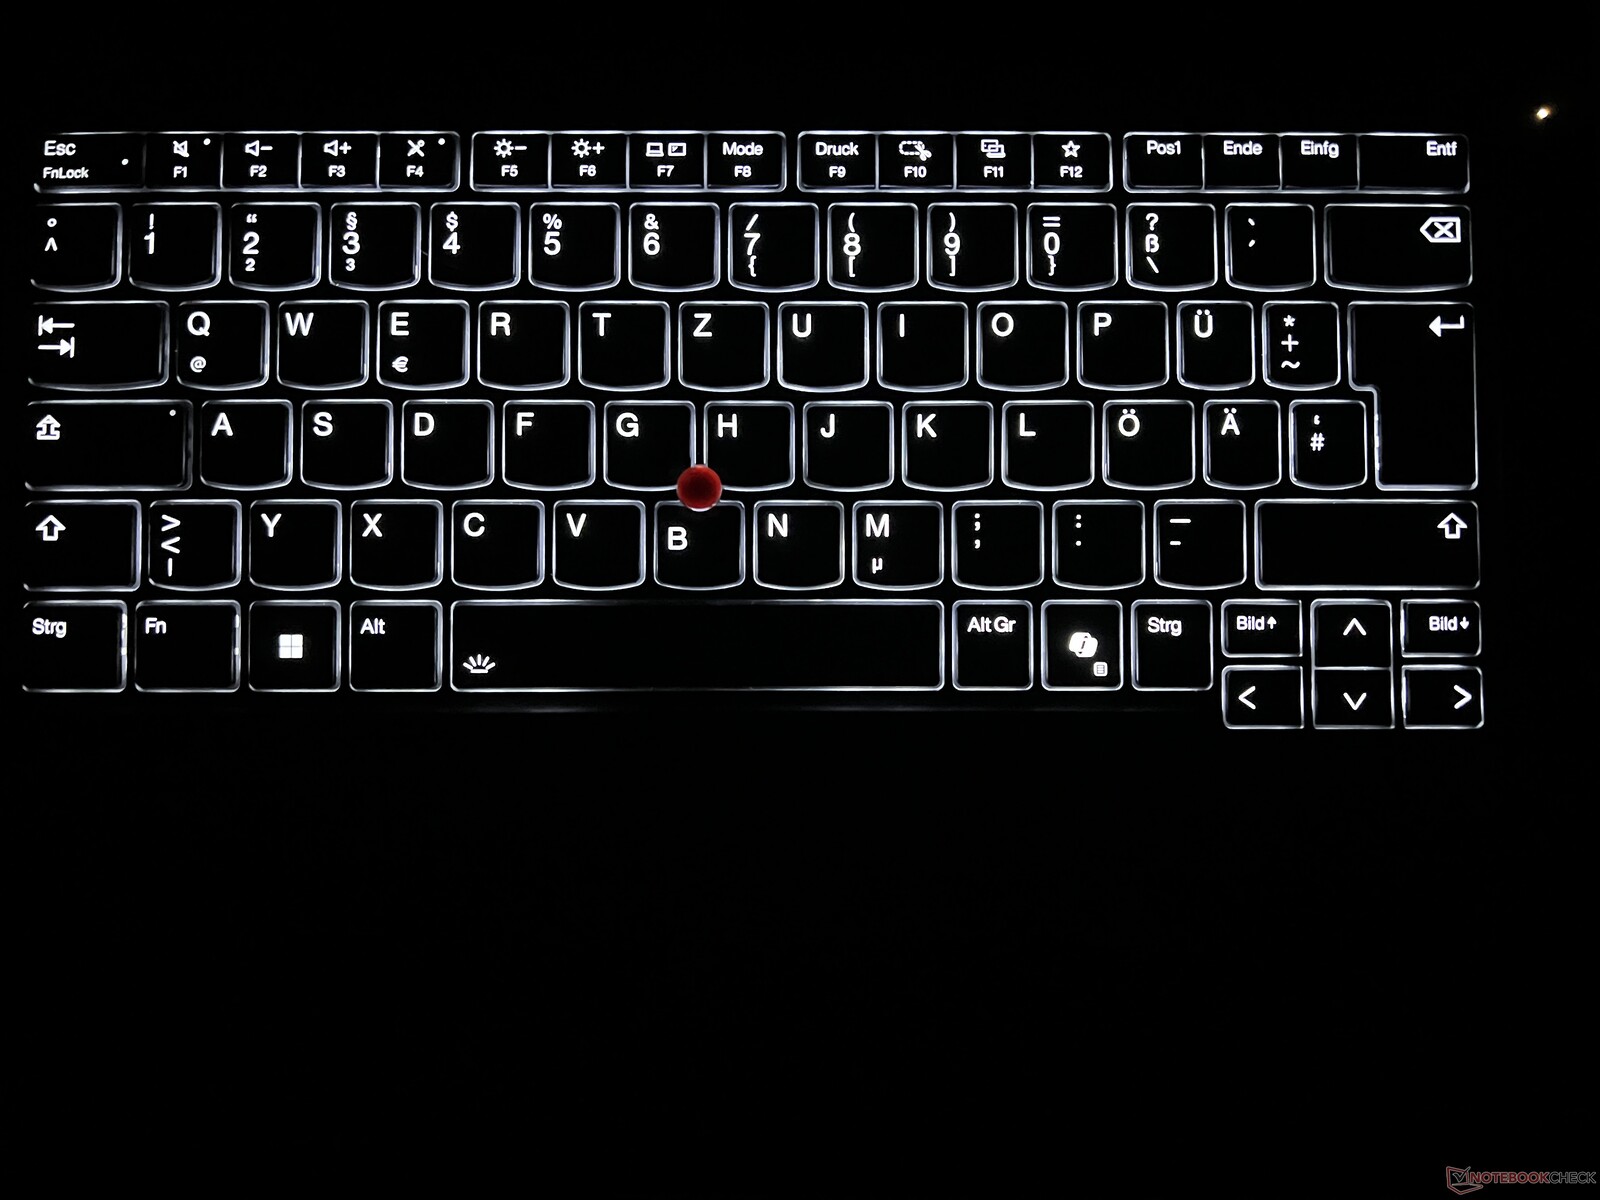
输入设备 - 提升 1.5 毫米,Fn 键重新定位
键盘是我们熟悉的型号,扬程为 1.5 毫米。打字时感觉不错,但这款 ThinkPad 在这方面已无法与其他竞争对手相提并论。我们还在使用一款键程为 1.8 毫米的 ThinkPad X1 Carbon,你肯定能感觉到它的不同之处。2024 年以来的新变化是它取代了 Fn 和 Ctrl 键,这肯定会给 ThinkPad 老用户带来一些困扰。现在还安装了一个副驾驶键。键盘的两级白色背光无法通过传感器激活。电源键位于键盘右上方,同时也是指纹扫描仪。
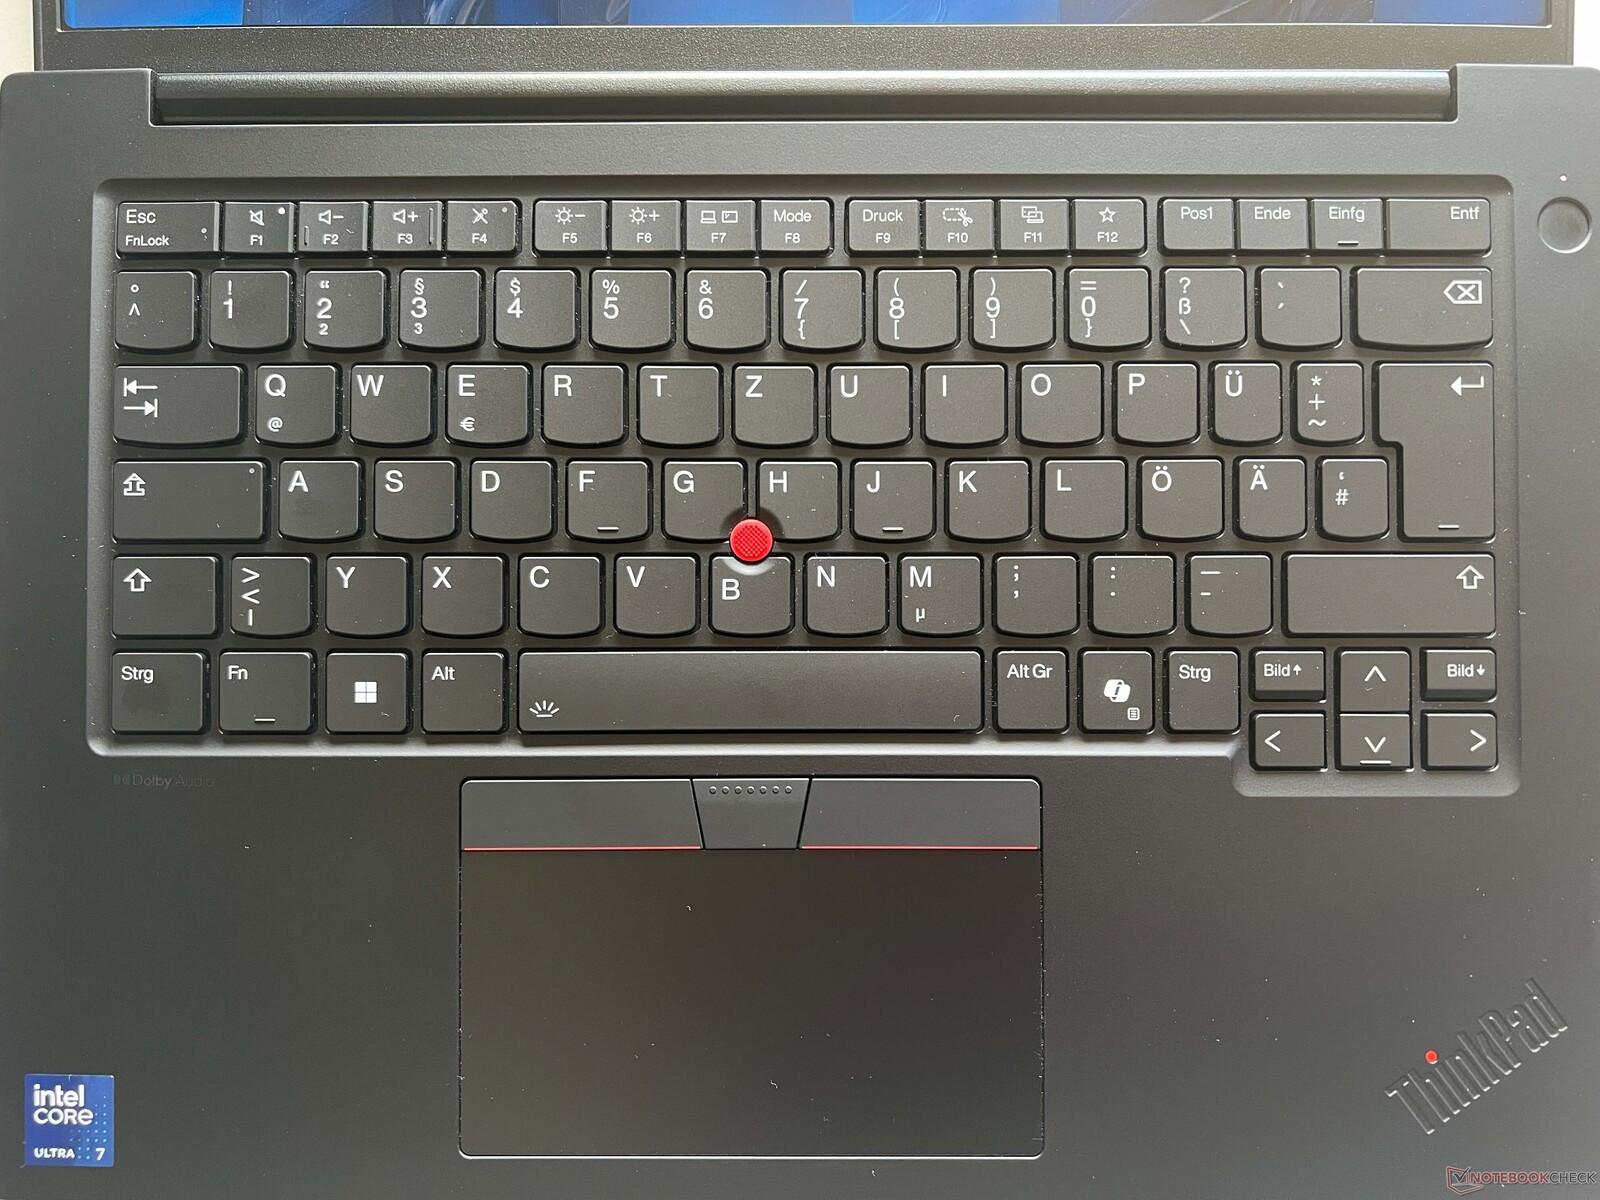
按照现在的标准,这款笔记本 11.5 x 6 厘米的点击板并不算特别大,因为它还要为 TrackPoint 的额外按钮腾出空间。不过,它的手感很好,也很顺滑,只是点击的声音本身有点大。当然,也可以使用 TrackPoint 作为替代,效果也很好(一旦你习惯了它)。专用按键给我们的测试设备留下了非常好的印象,因为它们发出高质量的低沉咔哒声,而且我们没有发现任何松动。
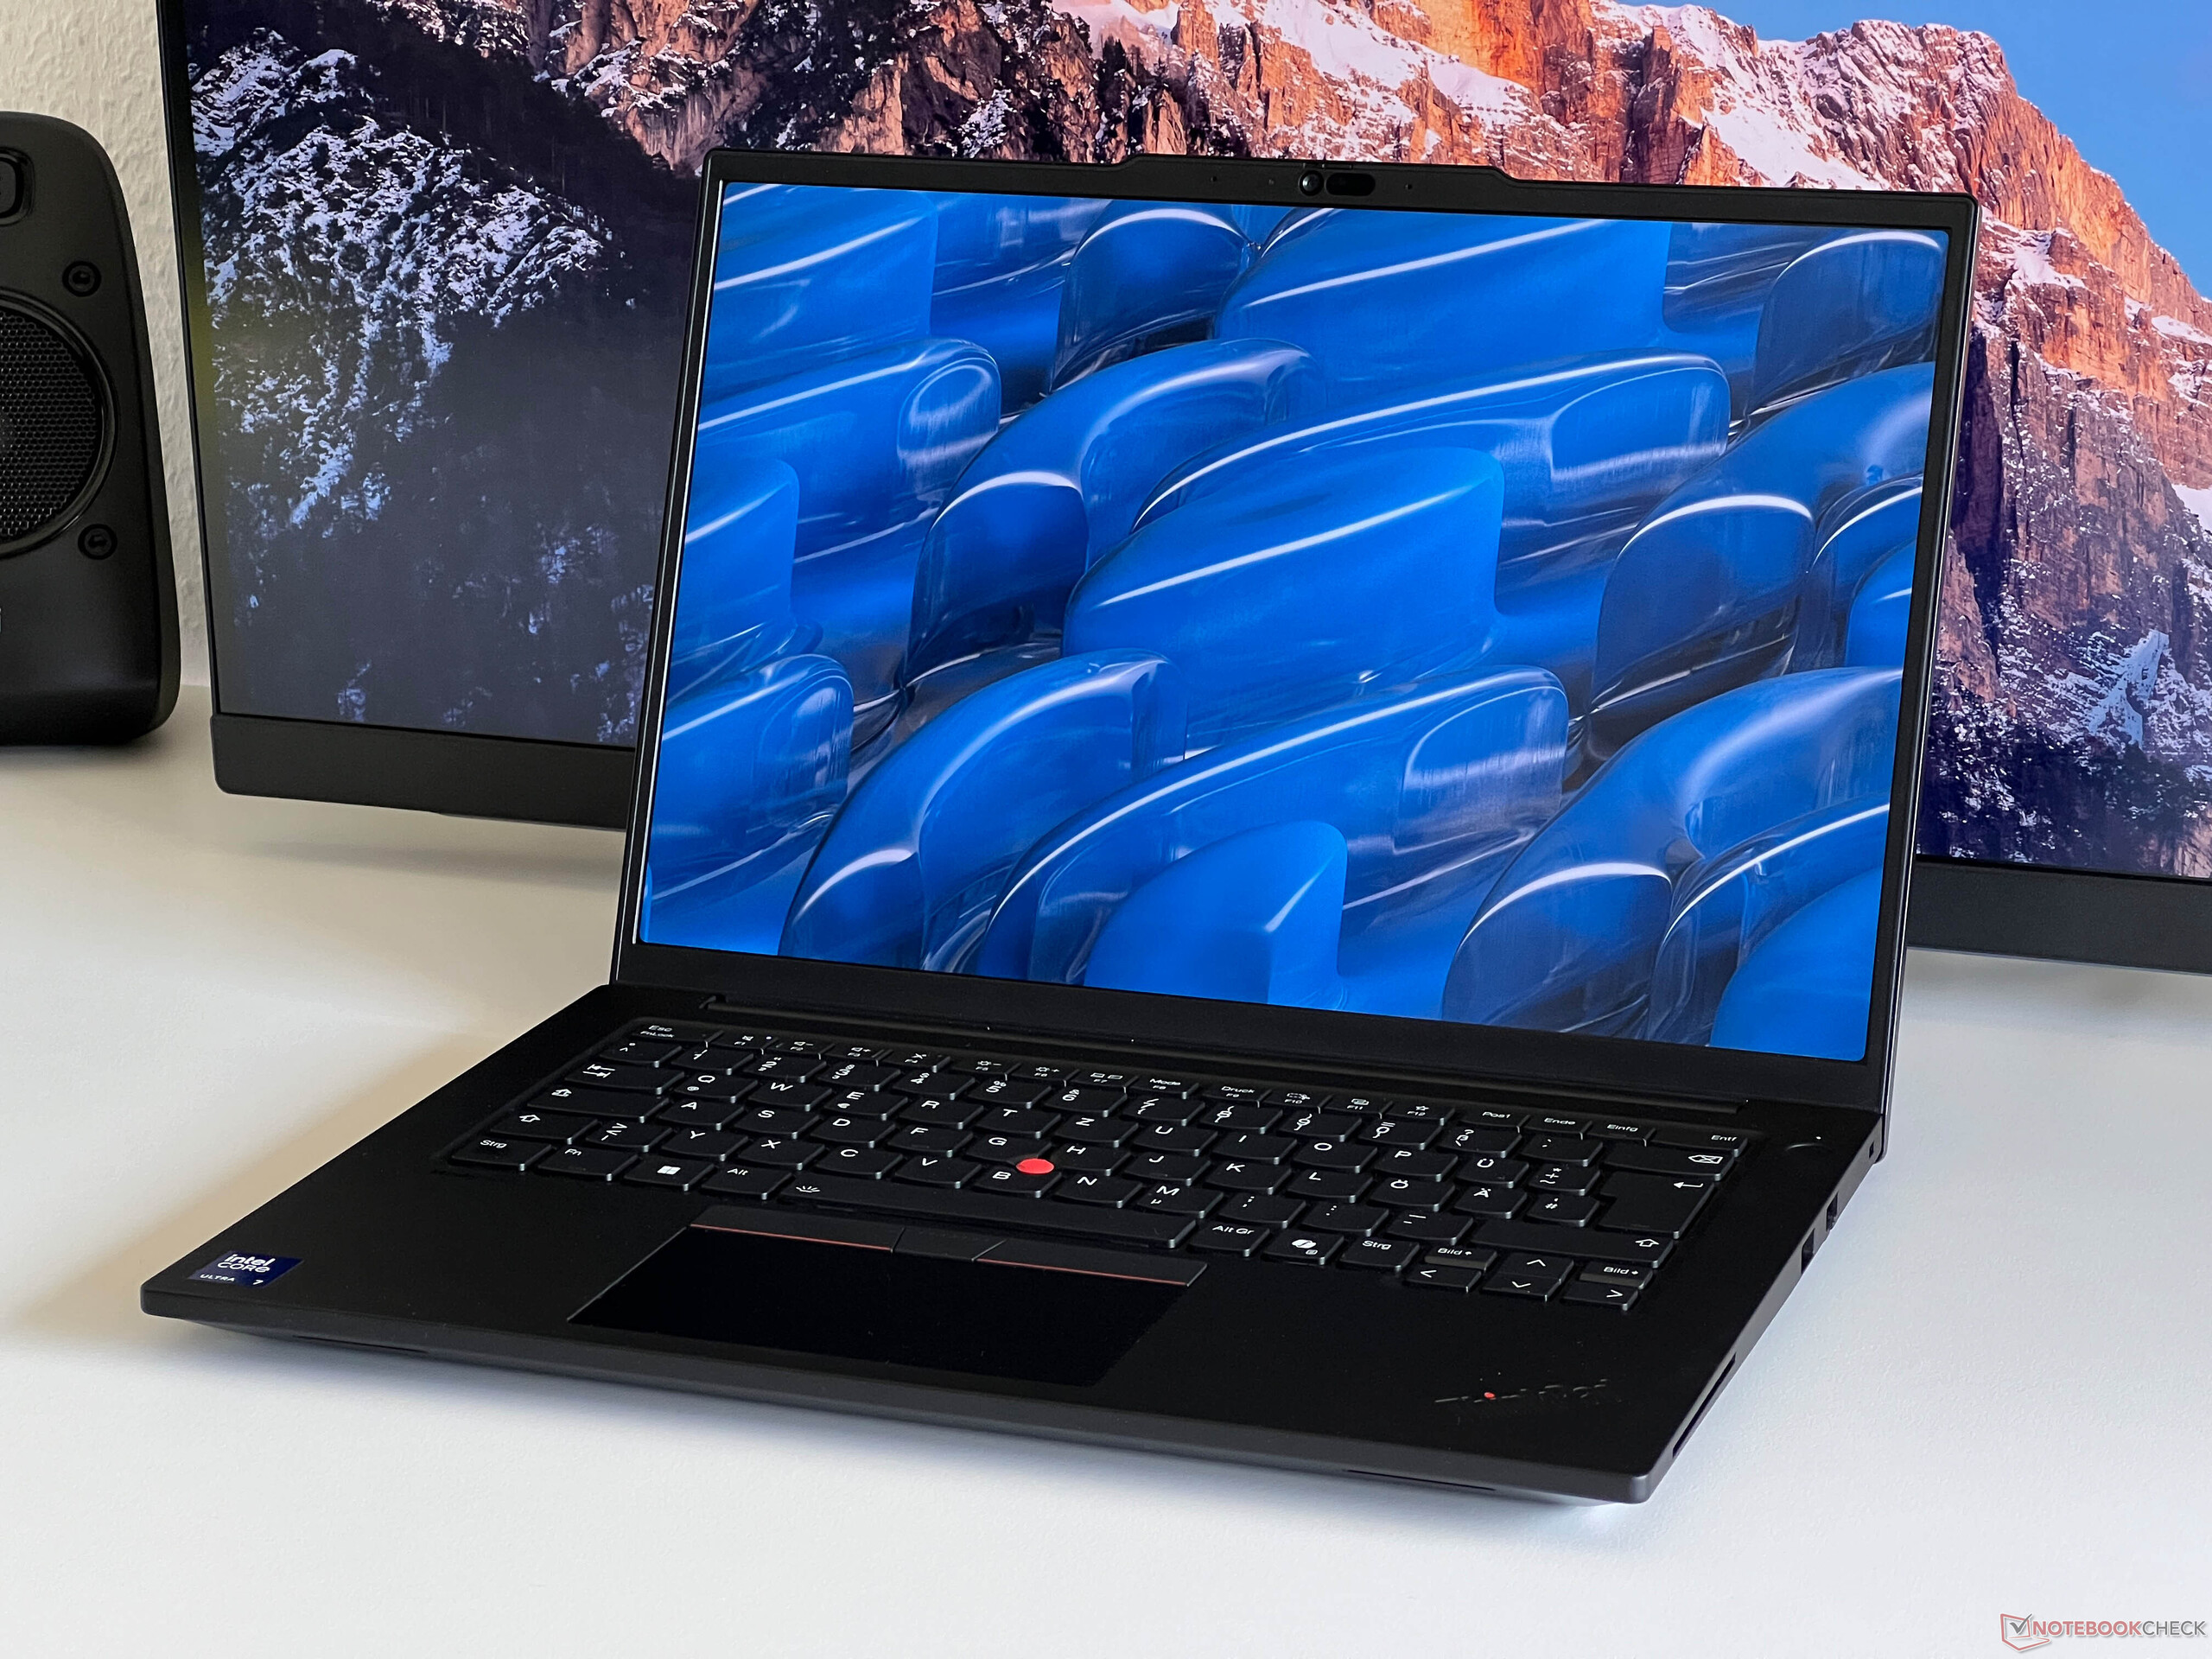
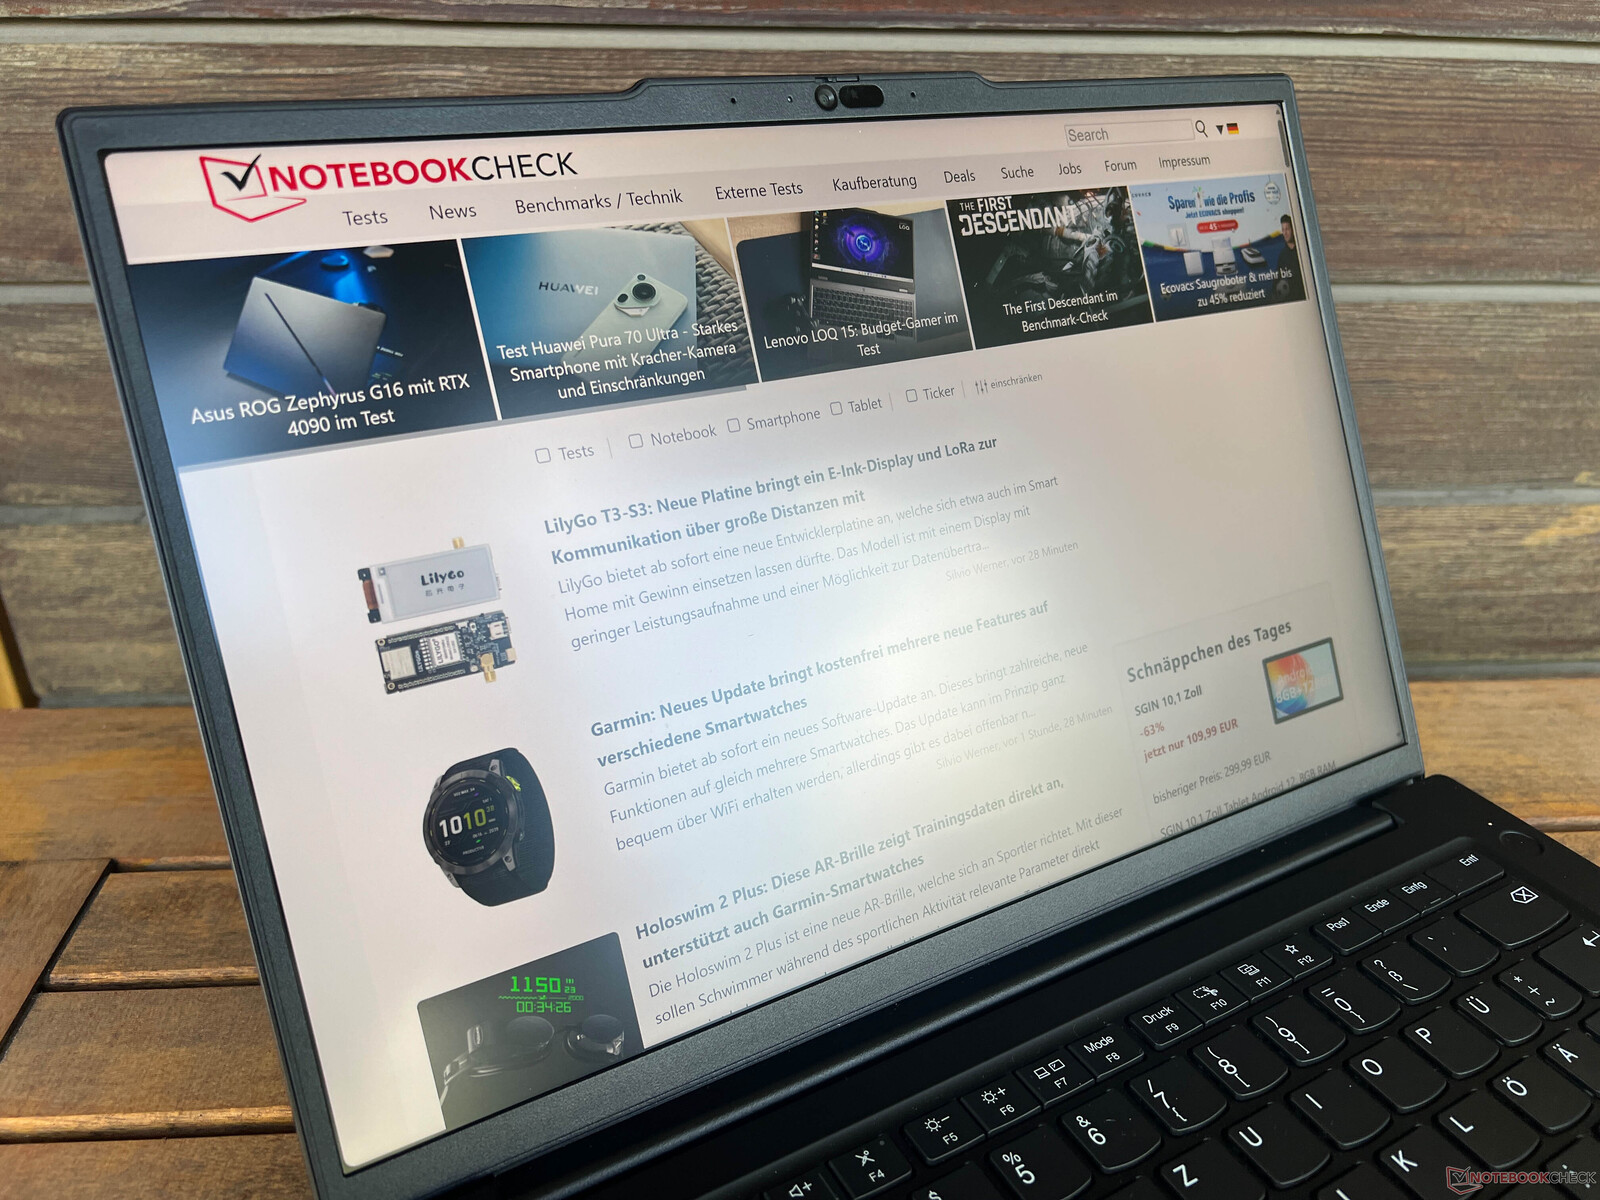
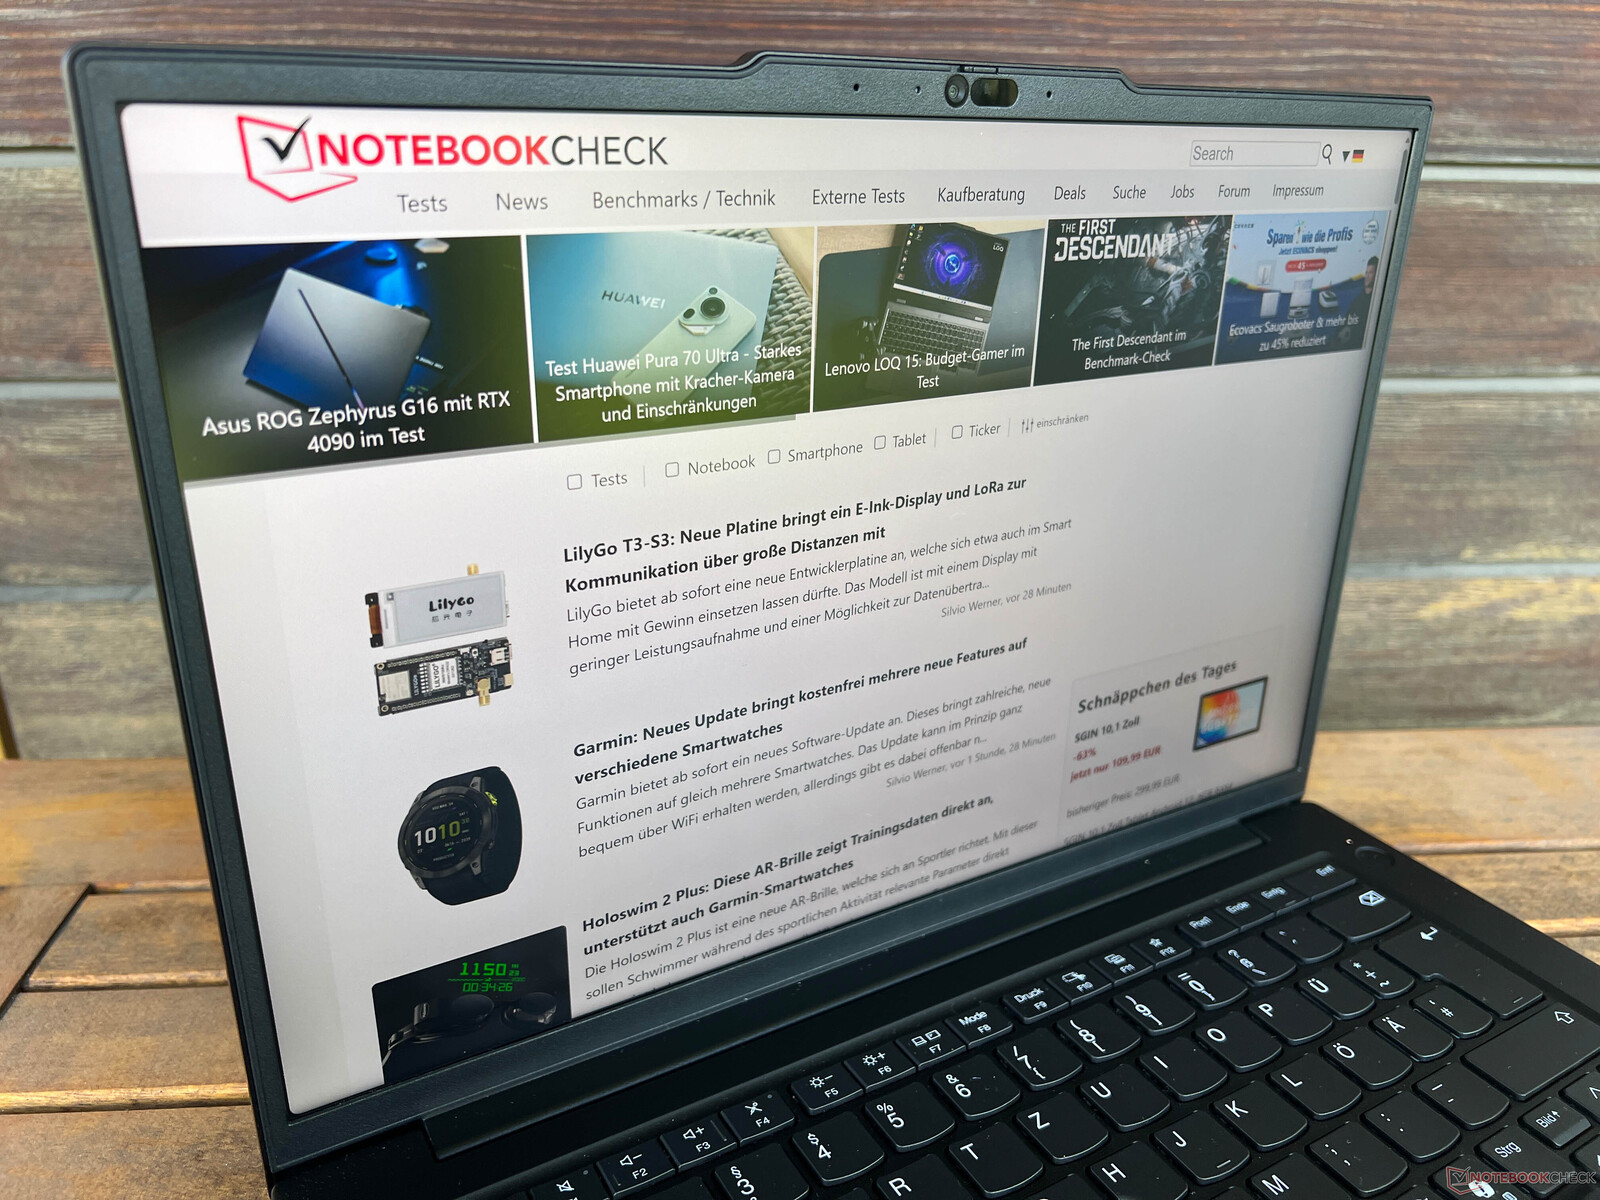
显示屏 - 3K IPS,120 赫兹
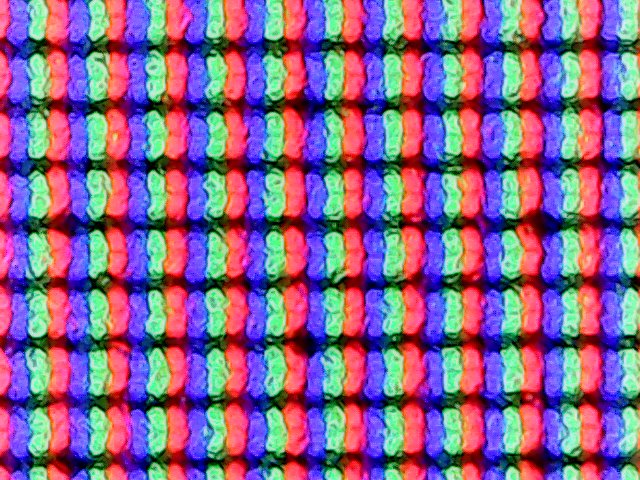
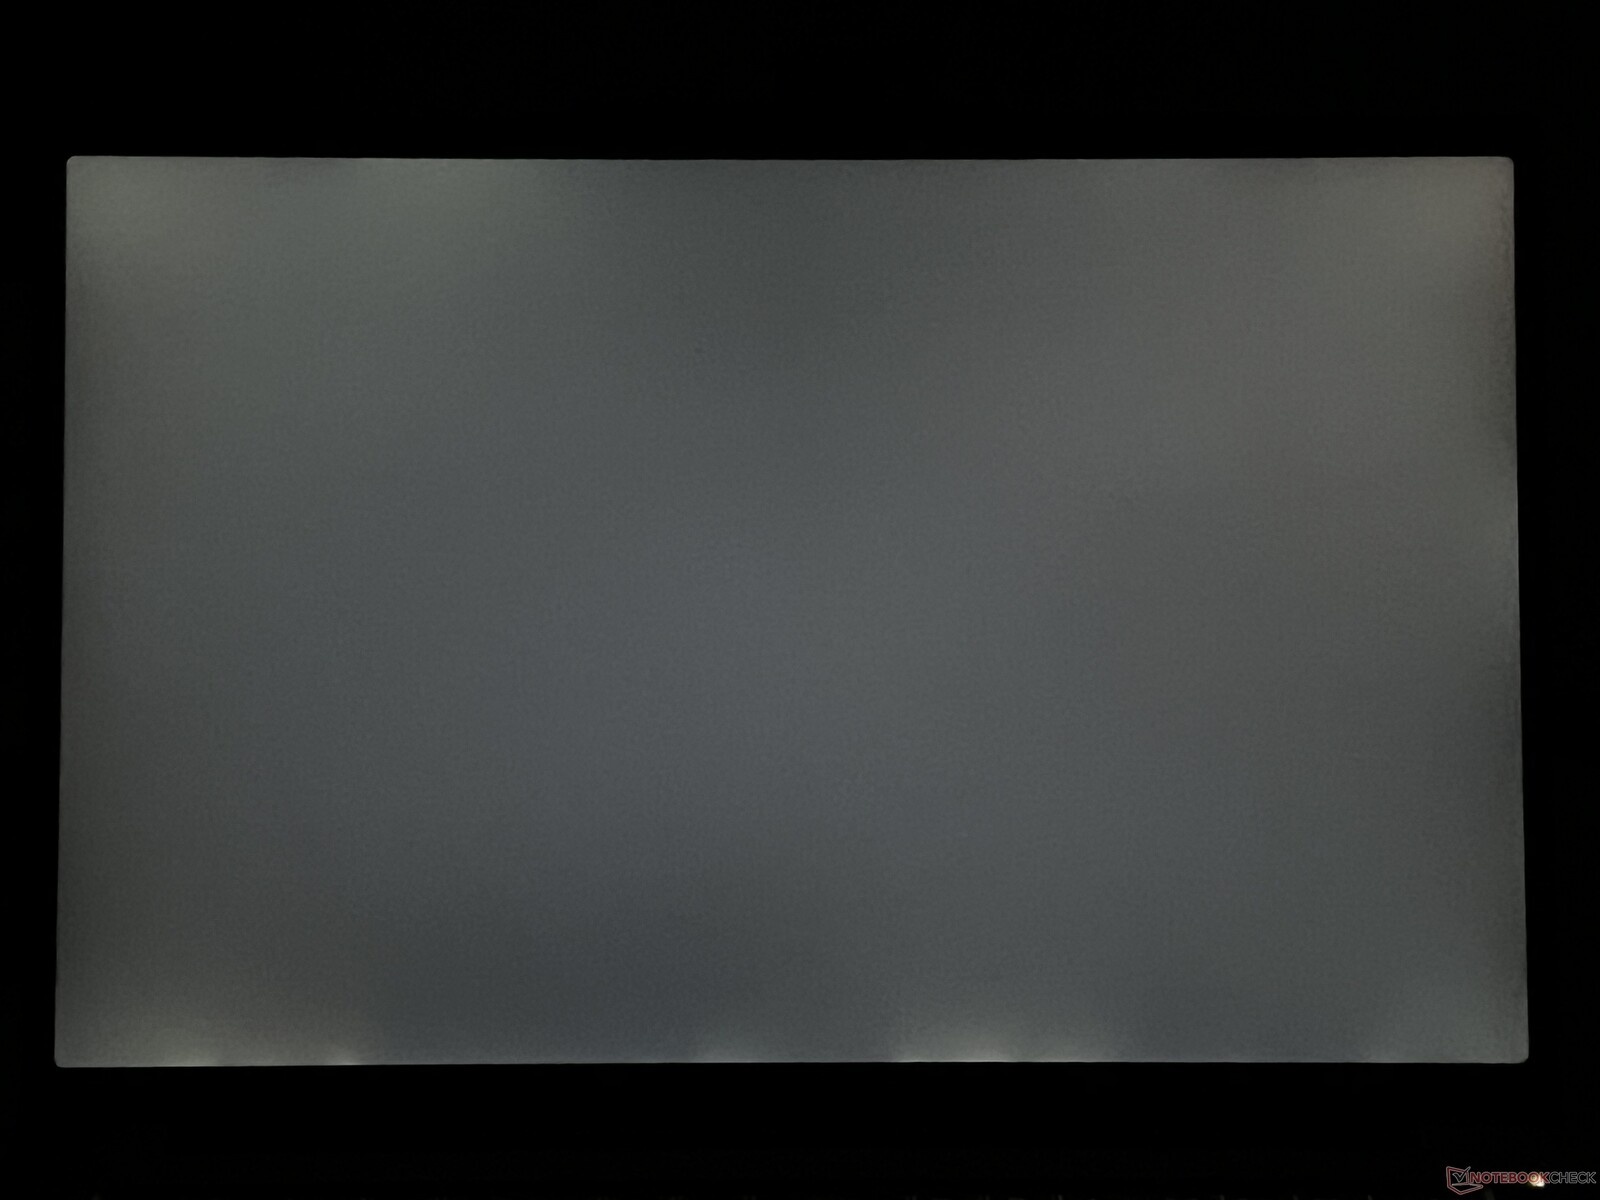
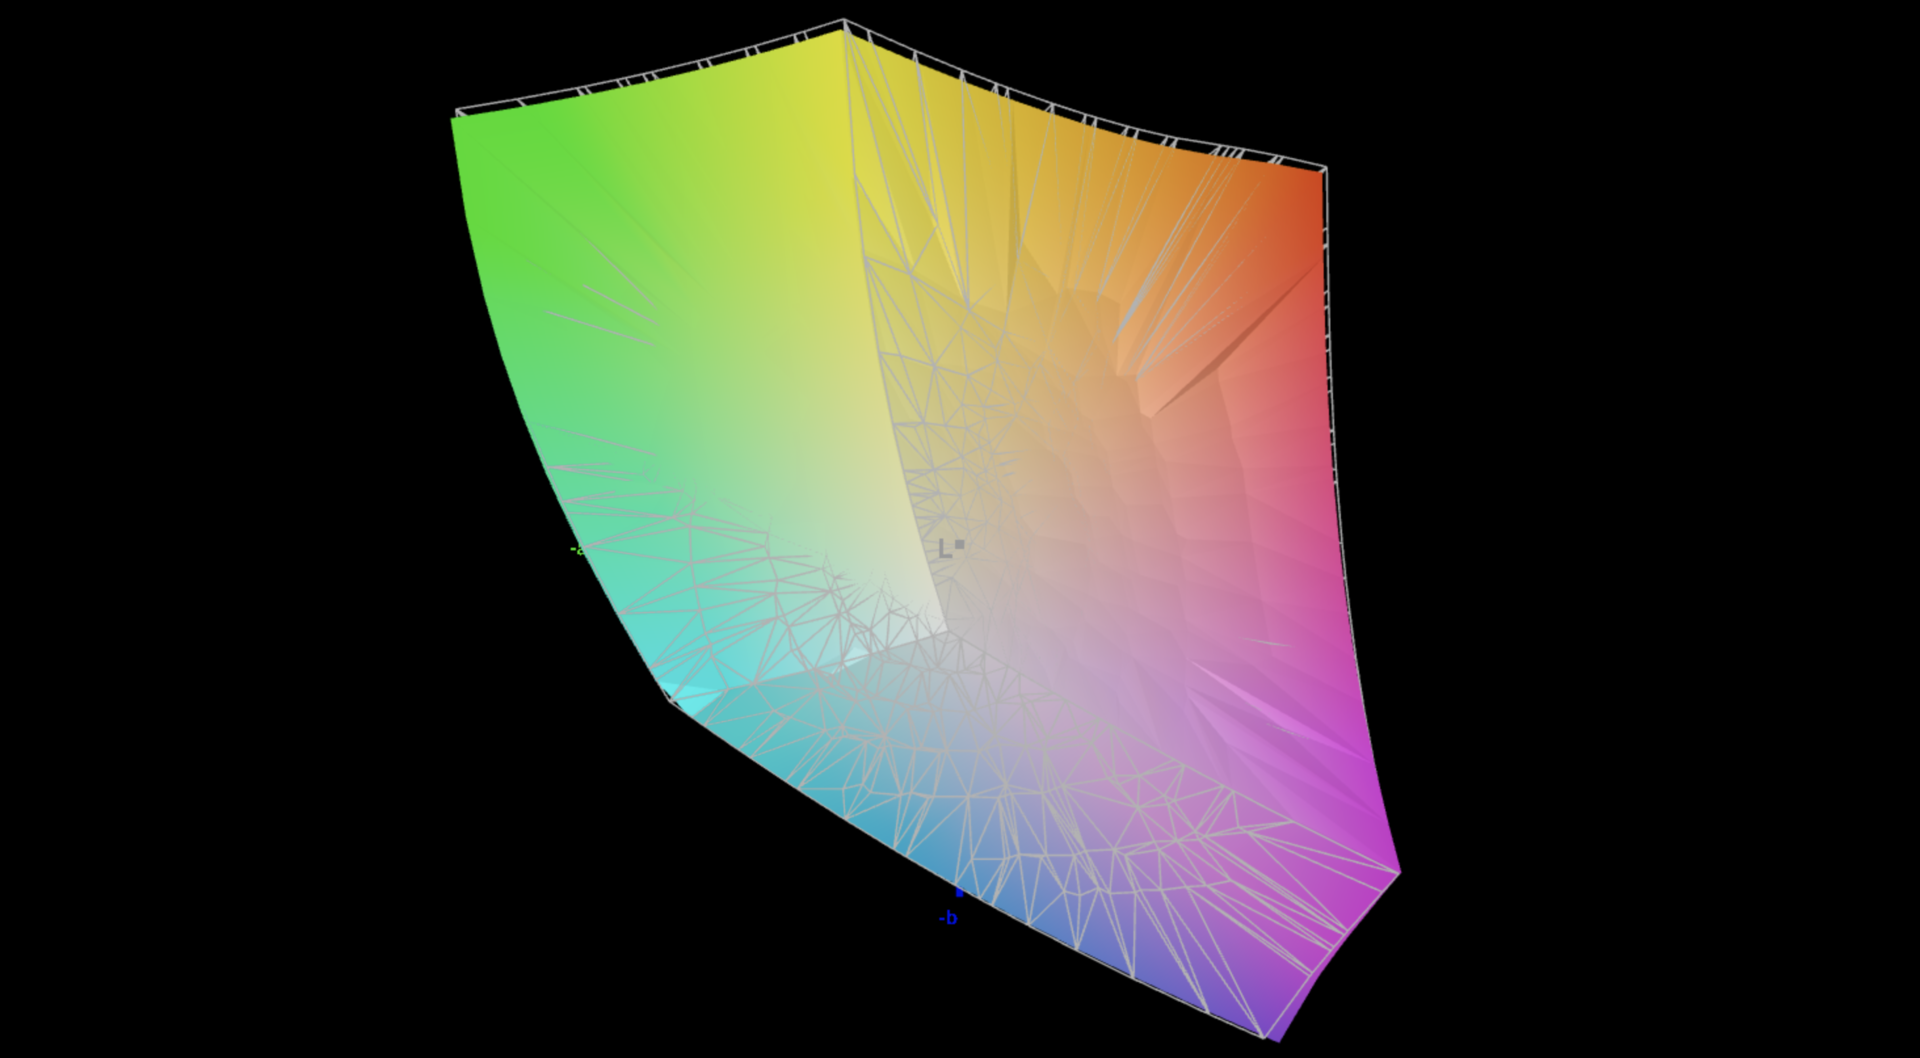
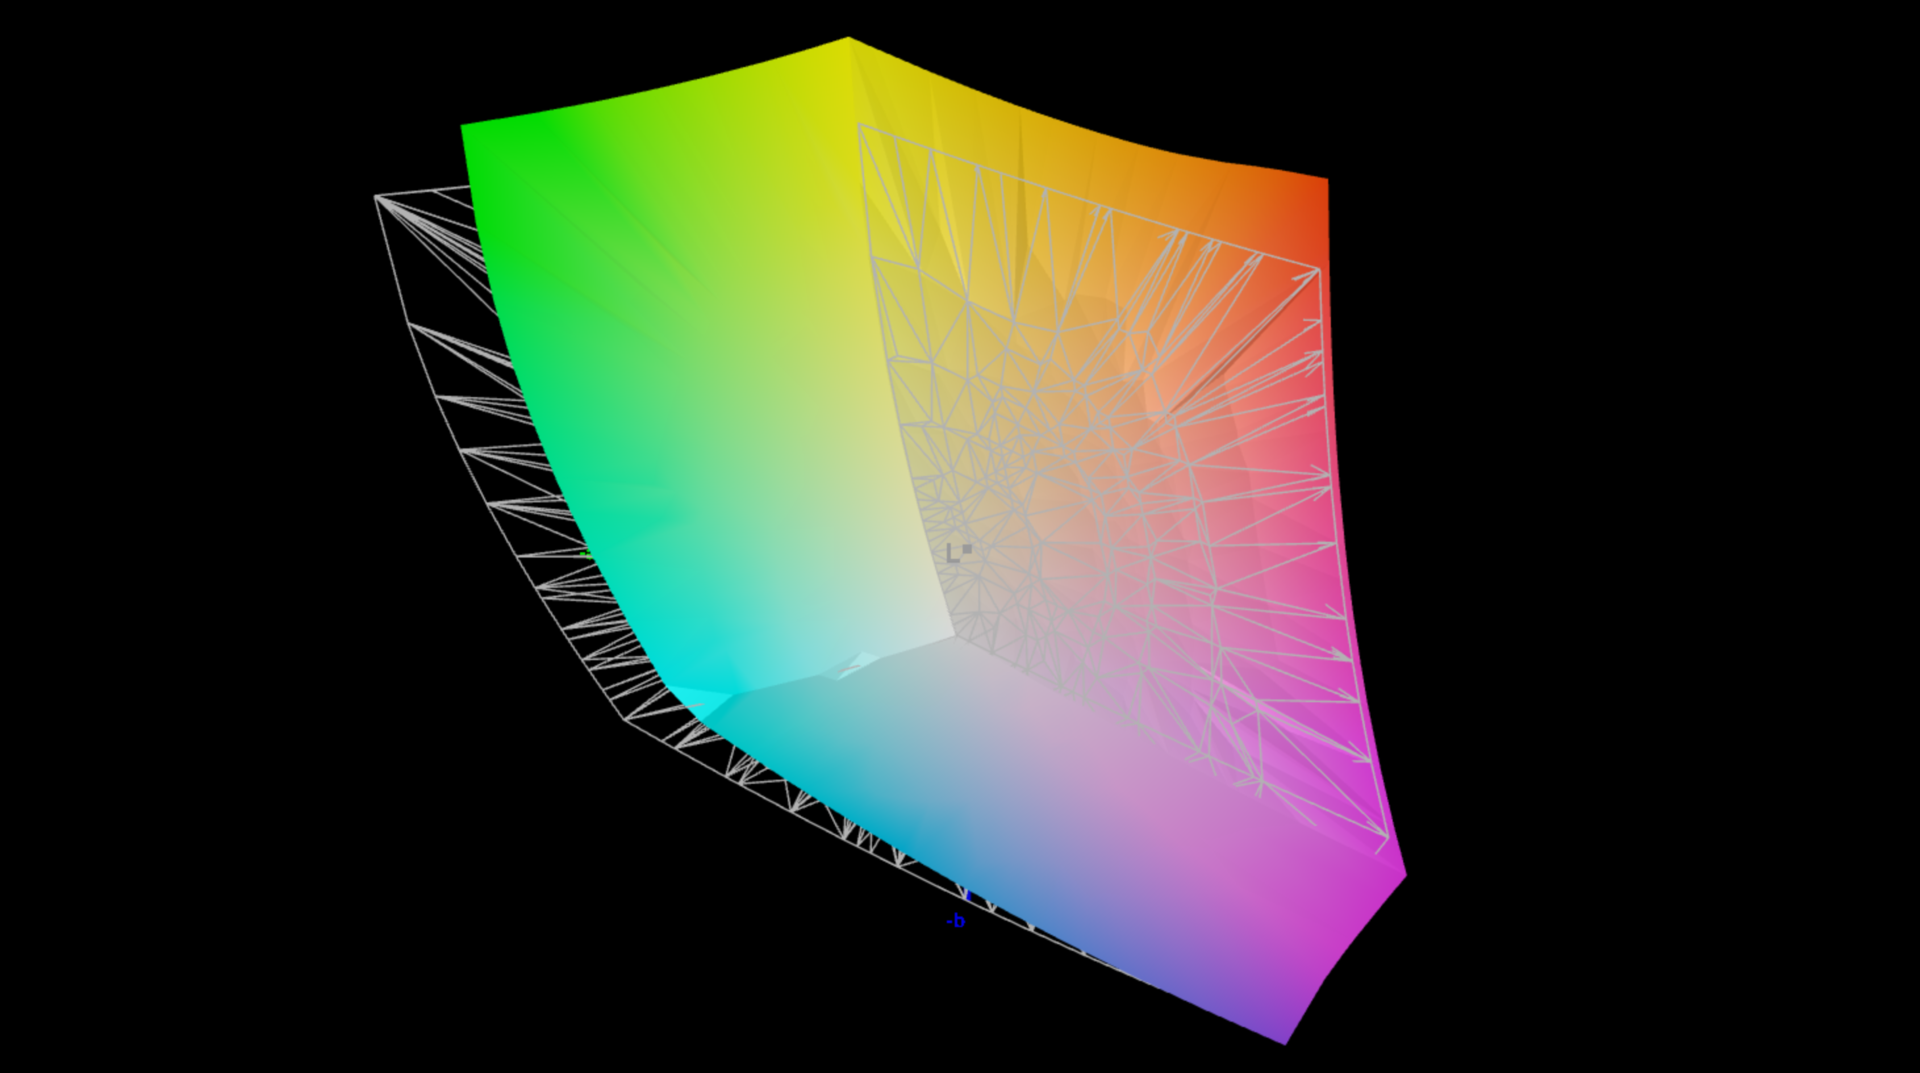
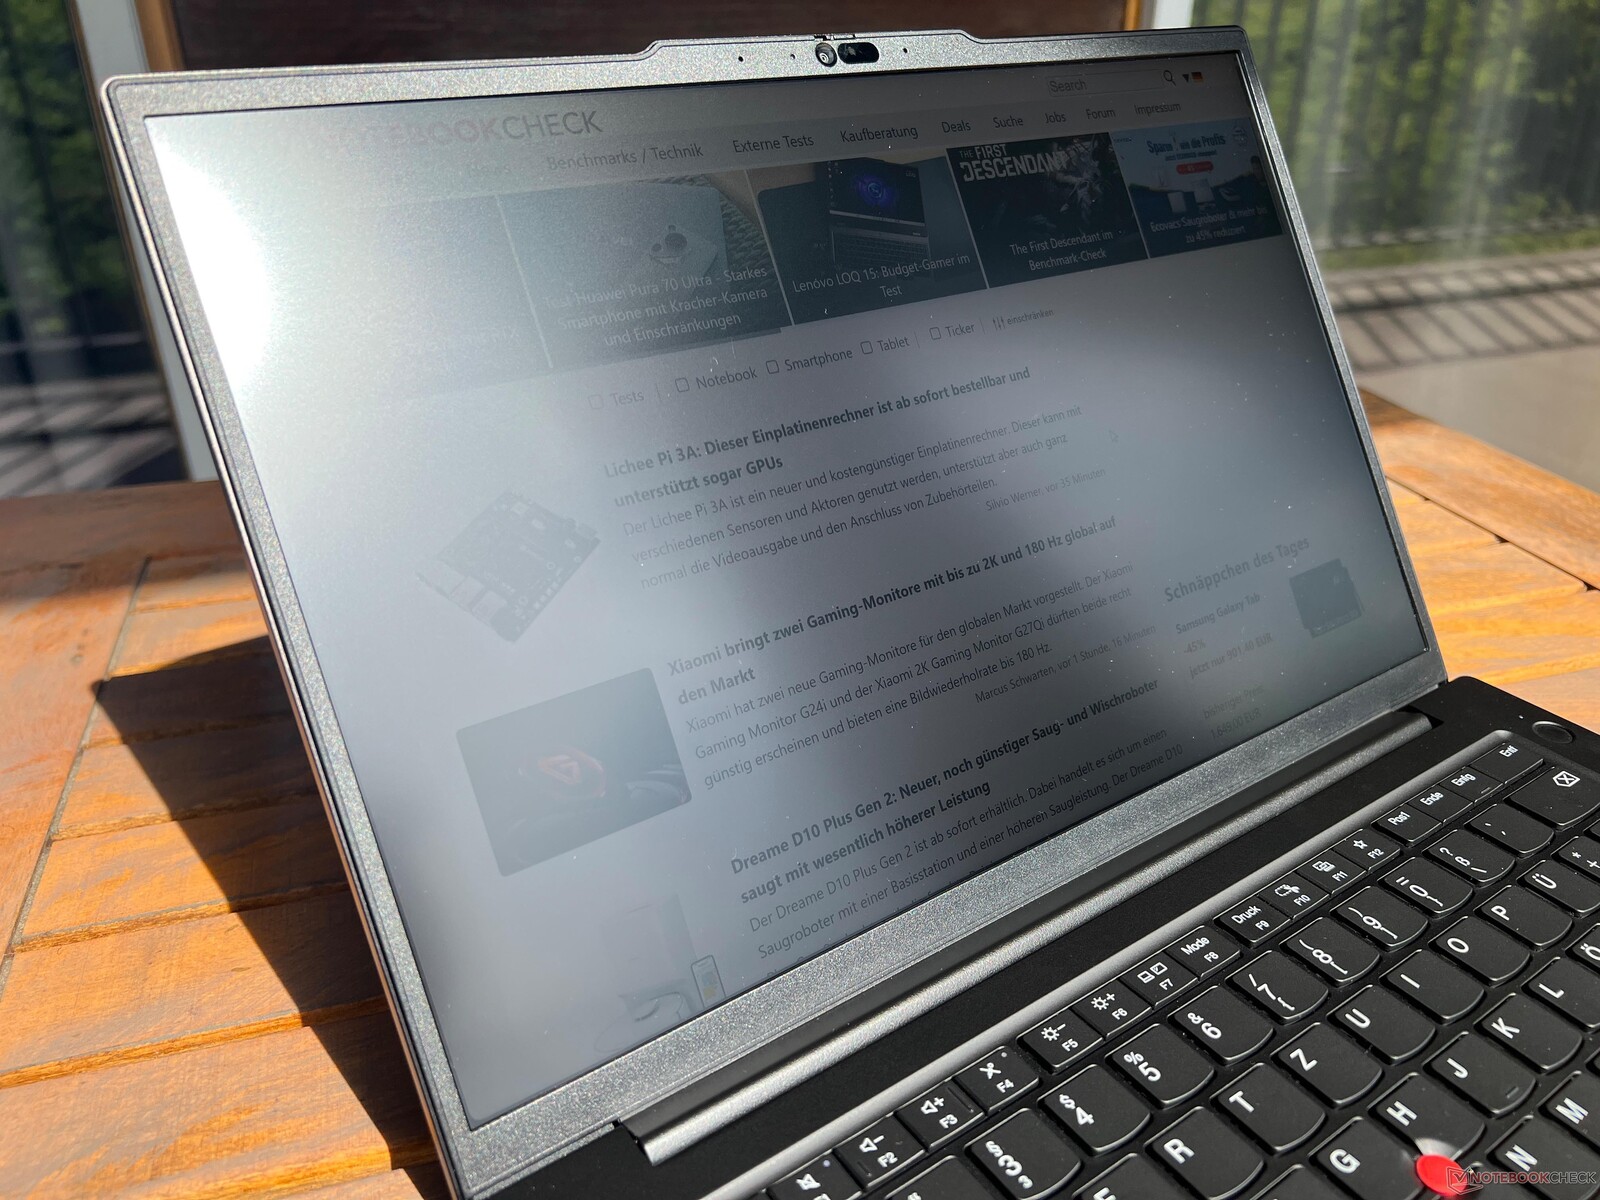
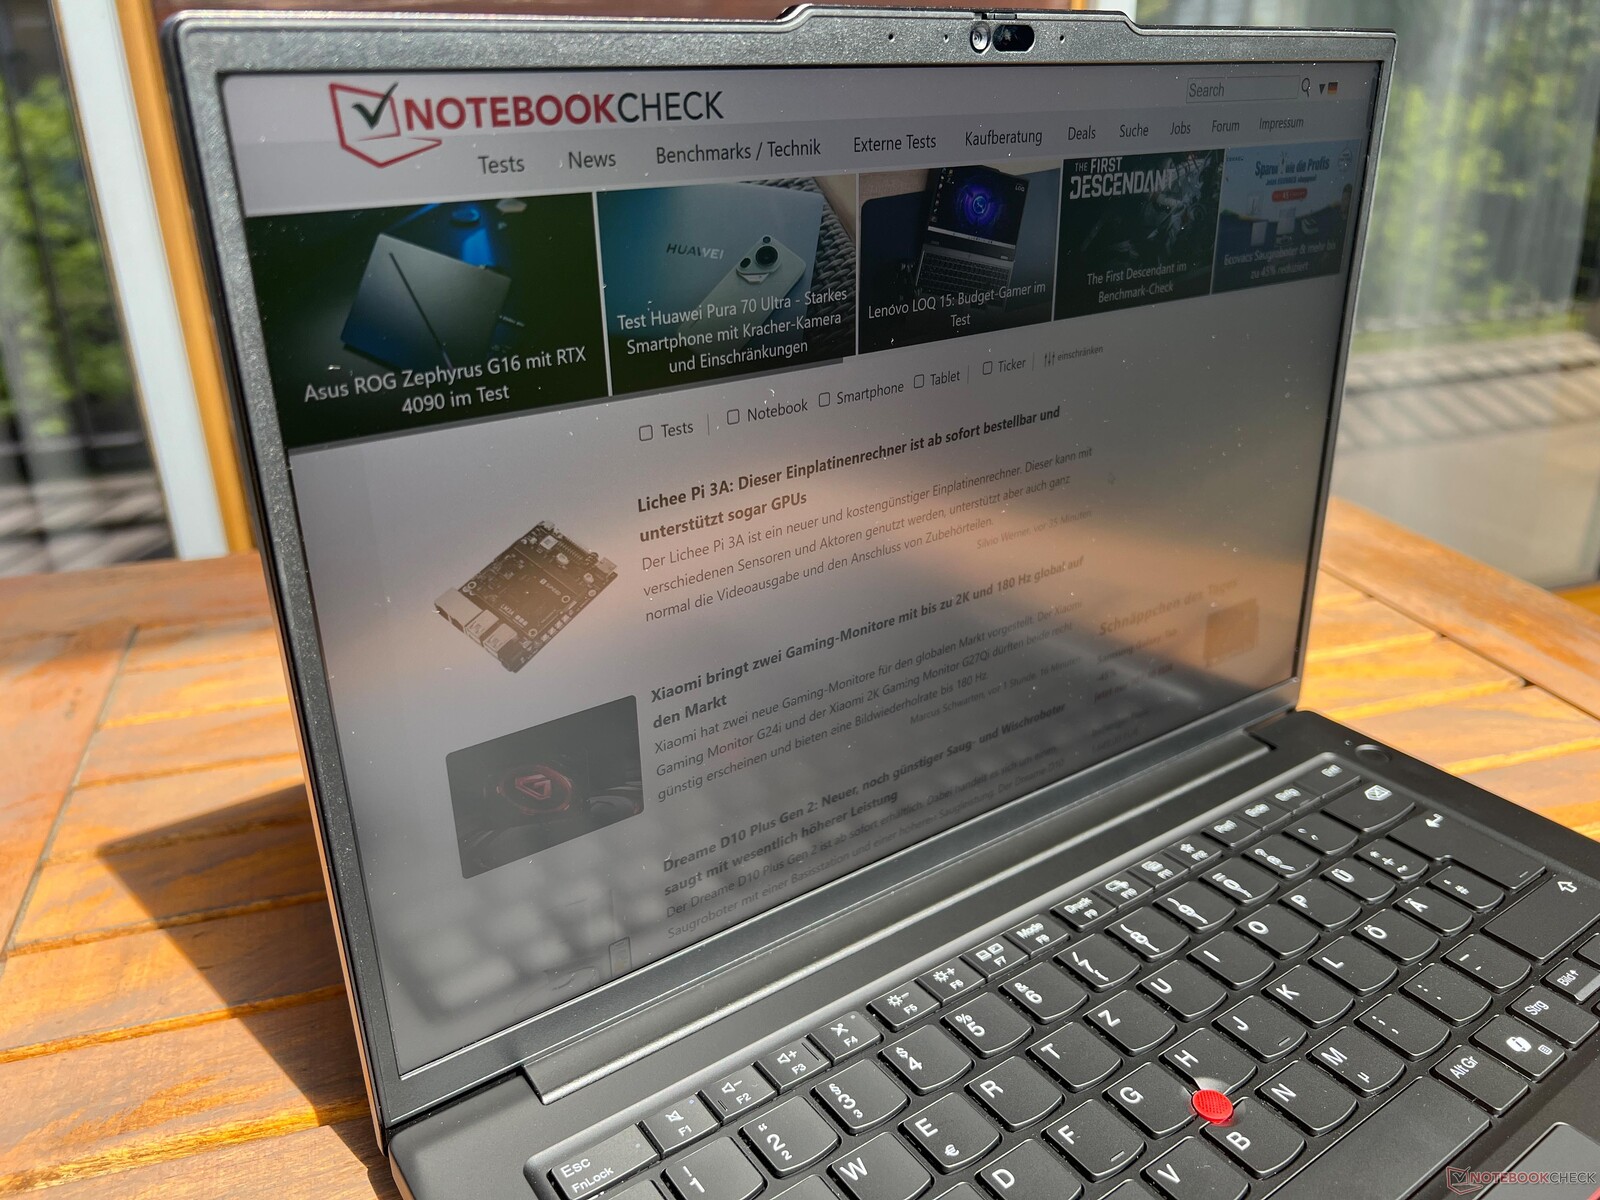
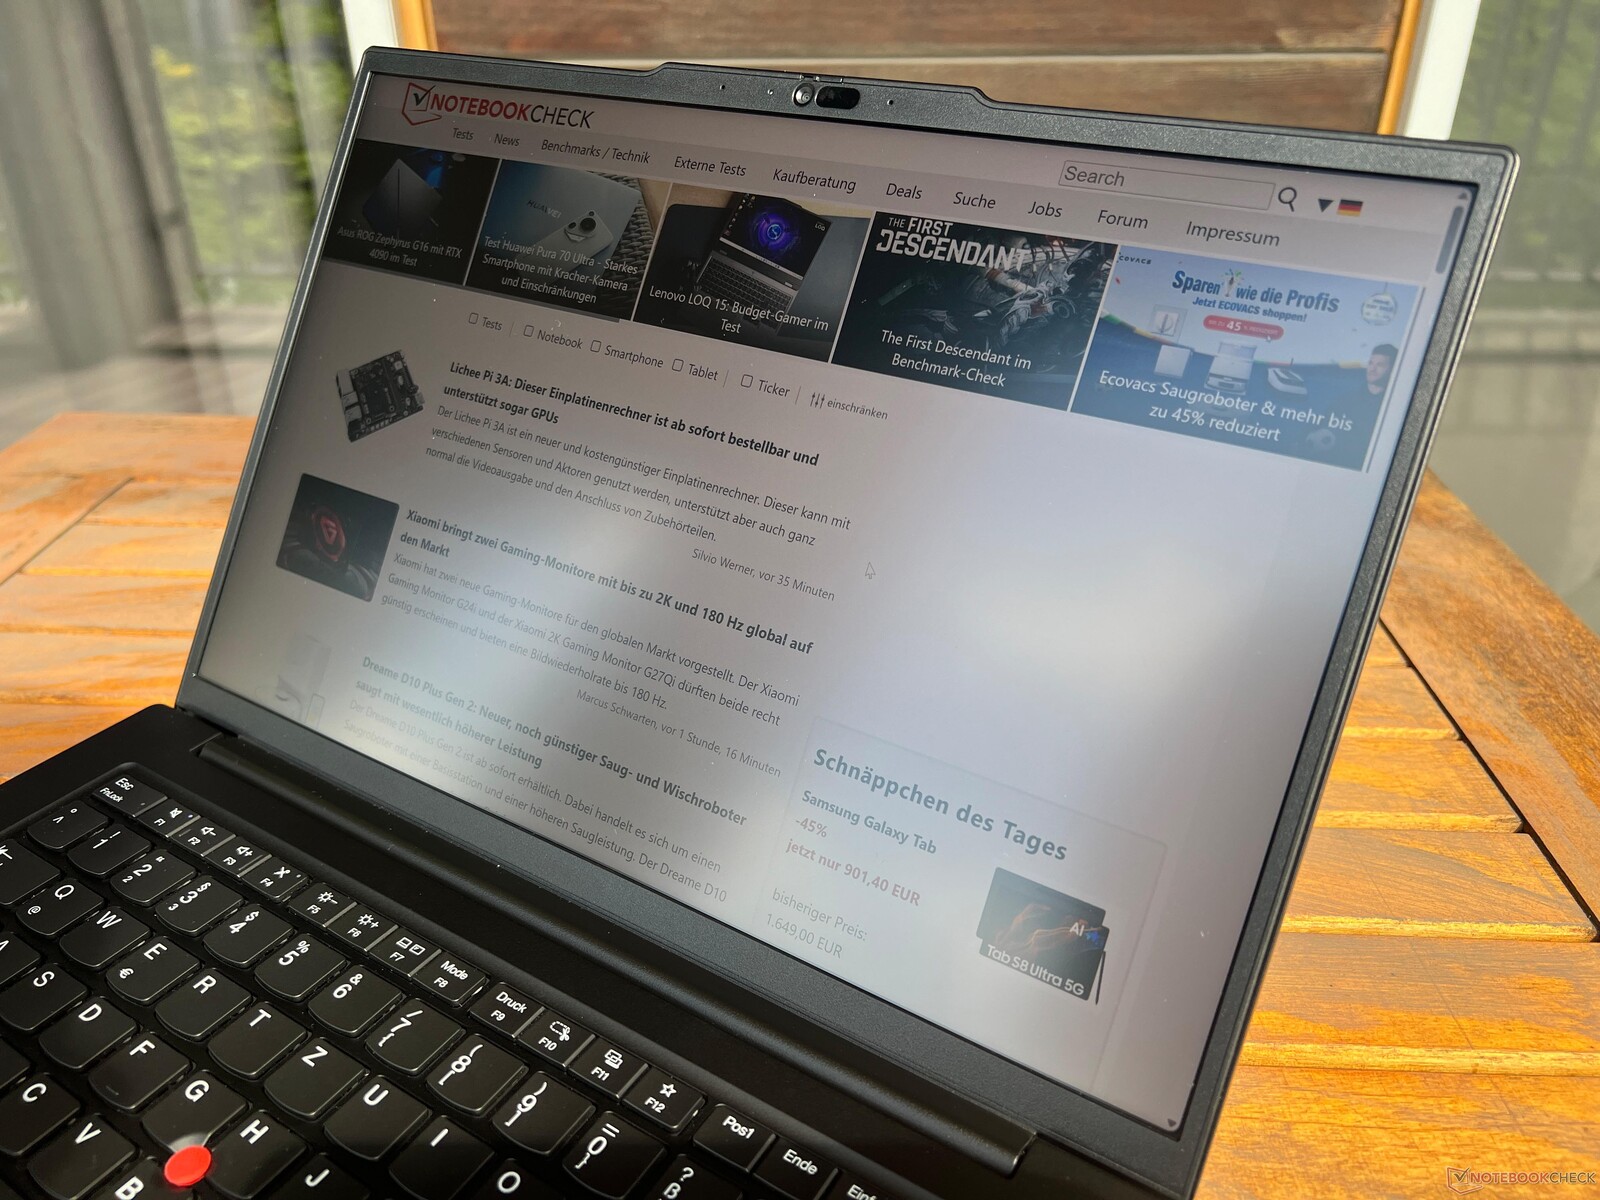
在这款更新的英特尔机型中,联想不再提供 P14s G4 中的可选 OLED 屏幕;取而代之的是哑光 14.5 英寸 IPS 面板。我们的测试设备安装了新的 3K 机型,分辨率为 3,072 x 1,920 像素,刷新率为 120 Hz,覆盖 P3 色彩空间。从主观上看,它的画质非常出色,即使仔细观察,也只能在描绘浅色内容时看到极少的颗粒感。值得庆幸的是,在正常距离观看屏幕时,这一点并不明显。所有内容都显示得非常清晰,色彩也超级鲜艳。当然,这款显示屏的色彩不如 OLED 面板鲜艳,但屏幕至少是哑光的,而且没有使用 PWM。由于刷新率提高,移动看起来很流畅,响应时间也很好(没有重影)。在亮度设置较高和观看暗色画面时,屏幕边缘会出现轻微的背光渗漏。它的亮度和色温都不能自动调节,也不支持 HDR 内容。
联想宣传的亮度为 430 cd/m²,但我们只能在屏幕中央确认这一点。平均亮度仅略高于 400 cd/m²。显示屏的黑色值为 0.32 cd/m²,最大对比度略低于 1,400.1。总体而言,这些数值还算合理,但也称不上好。这也可以从与竞争对手的对比中看出,因为新的 惠普 ZBook 萤火虫 G11为例,其 120 Hz 显示屏的亮度约为 550 cd/m²(尽管分辨率略低)。联想还有其他面板可供选择,如 Yoga Pro 9i 14 14 英寸笔记本电脑内的 165 Hz 超高亮度迷你 LED 面板。 Yoga Pro 9i 14(同样是 14.5 英寸,3,072 x 1,920 像素)。
| |||||||||||||||||||||||||
Brightness Distribution: 87 %
Center on Battery: 439 cd/m²
Contrast: 1372:1 (Black: 0.32 cd/m²)
ΔE Color 2.1 | 0.5-29.43 Ø4.87, calibrated: 0.8
ΔE Greyscale 3.9 | 0.5-98 Ø5.1
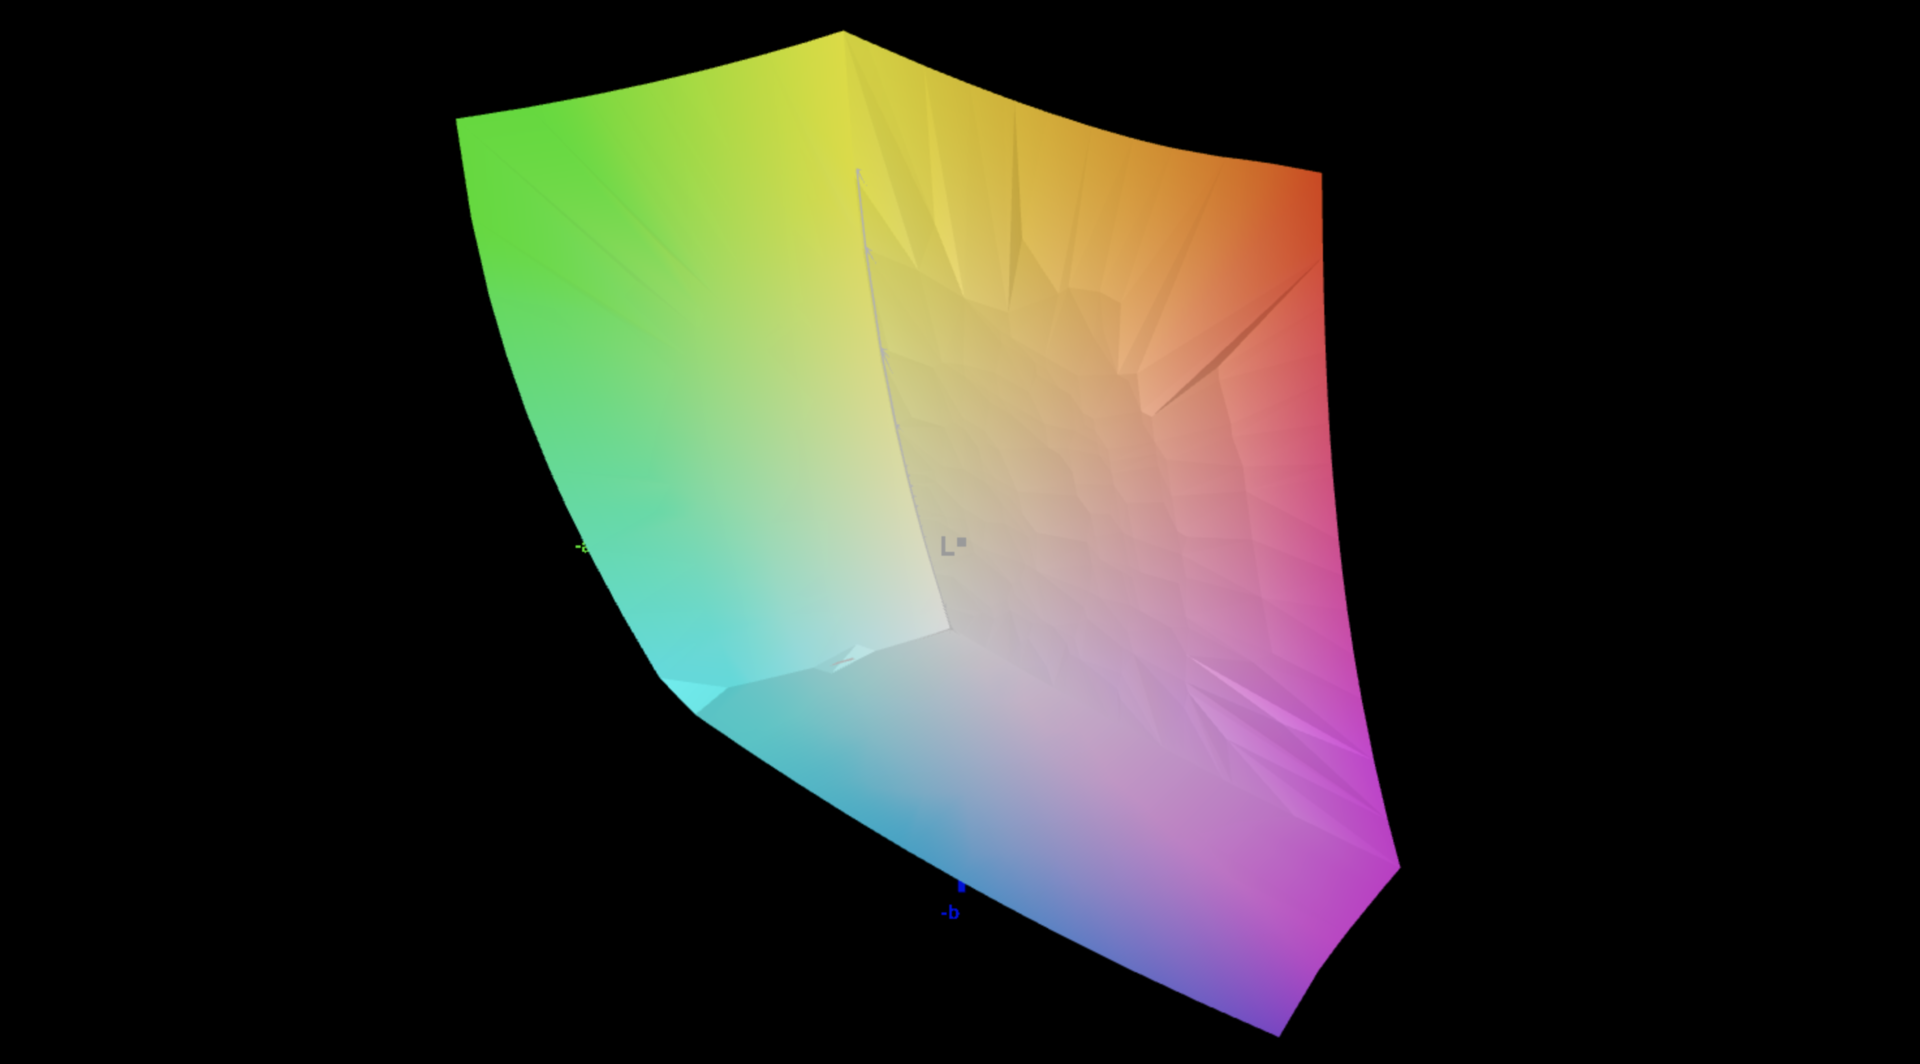
87.4% AdobeRGB 1998 (Argyll 2.2.0 3D)
100% sRGB (Argyll 2.2.0 3D)
98.4% Display P3 (Argyll 2.2.0 3D)
Gamma: 2.2
| Lenovo ThinkPad P14s G5 21G3S00A00 LEN145-3K, IPS, 3072x1920, 14.5", 120 Hz | HP ZBook Firefly 14 G11 AUO6DA8, IPS, 2560x1600, 14", 120 Hz | Dell Precision 5000 5490 AU Optronics B140QAN, IPS, 2560x1600, 14", 60 Hz | Lenovo ThinkPad P14s G4 21HF0017GE ATNA40YK15-0, OLED, 2880x1800, 14", 60 Hz | Microsoft Surface Laptop Studio 2 RTX 4060 LQ144P1JX01, IPS, 2400x1600, 14.4", 120 Hz | Lenovo Yoga Pro 9-14IRP G8 CSOT T3 MNE507HZ2-1, Mini-LED, 3072x1920, 14.5", 165 Hz | |
|---|---|---|---|---|---|---|
| Display | 0% | -9% | 4% | -18% | 1% | |
| Display P3 Coverage | 98.4 | 98.9 1% | 79.7 -19% | 99.9 2% | 66.7 -32% | 92 -7% |
| sRGB Coverage | 100 | 99.9 0% | 100 0% | 100 0% | 99 -1% | 99.7 0% |
| AdobeRGB 1998 Coverage | 87.4 | 86.6 -1% | 79.5 -9% | 97 11% | 68.9 -21% | 96.9 11% |
| Response Times | 52% | -98% | 88% | -143% | 41% | |
| Response Time Grey 50% / Grey 80% * | 30.2 ? | 12.3 ? 59% | 52.3 ? -73% | 3 ? 90% | 77.6 ? -157% | 12.7 ? 58% |
| Response Time Black / White * | 15 ? | 8.3 ? 45% | 33.3 ? -122% | 2.2 ? 85% | 34.3 ? -129% | 11.4 ? 24% |
| PWM Frequency | 360 ? | 17600 ? | 6000 ? | |||
| Screen | 6% | 9% | -90% | 43% | 19% | |
| Brightness middle | 439 | 554.1 26% | 485.1 11% | 432 -2% | 511 16% | 670 53% |
| Brightness | 406 | 540 33% | 471 16% | 432 6% | 503 24% | 680 67% |
| Brightness Distribution | 87 | 93 7% | 90 3% | 98 13% | 89 2% | 89 2% |
| Black Level * | 0.32 | 0.58 -81% | 0.38 -19% | 0.26 19% | 0.19 41% | |
| Contrast | 1372 | 955 -30% | 1277 -7% | 1965 43% | 3526 157% | |
| Colorchecker dE 2000 * | 2.1 | 2.54 -21% | 2.15 -2% | 4.8 -129% | 0.5 76% | 4 -90% |
| Colorchecker dE 2000 max. * | 6.2 | 4.99 20% | 5.39 13% | 9.2 -48% | 1.1 82% | 4.5 27% |
| Colorchecker dE 2000 calibrated * | 0.8 | 0.56 30% | 0.67 16% | 4.9 -513% | 1.3 -63% | |
| Greyscale dE 2000 * | 3.9 | 1 74% | 2 49% | 2.3 41% | 0.8 79% | 4.9 -26% |
| Gamma | 2.2 100% | 2.3 96% | 2.3 96% | 2.23 99% | 2.19 100% | 2.22 99% |
| CCT | 7013 93% | 6556 99% | 6826 95% | 6391 102% | 6650 98% | 5735 113% |
| Total Average (Program / Settings) | 19% /
12% | -33% /
-10% | 1% /
-37% | -39% /
0% | 20% /
18% |
* ... smaller is better
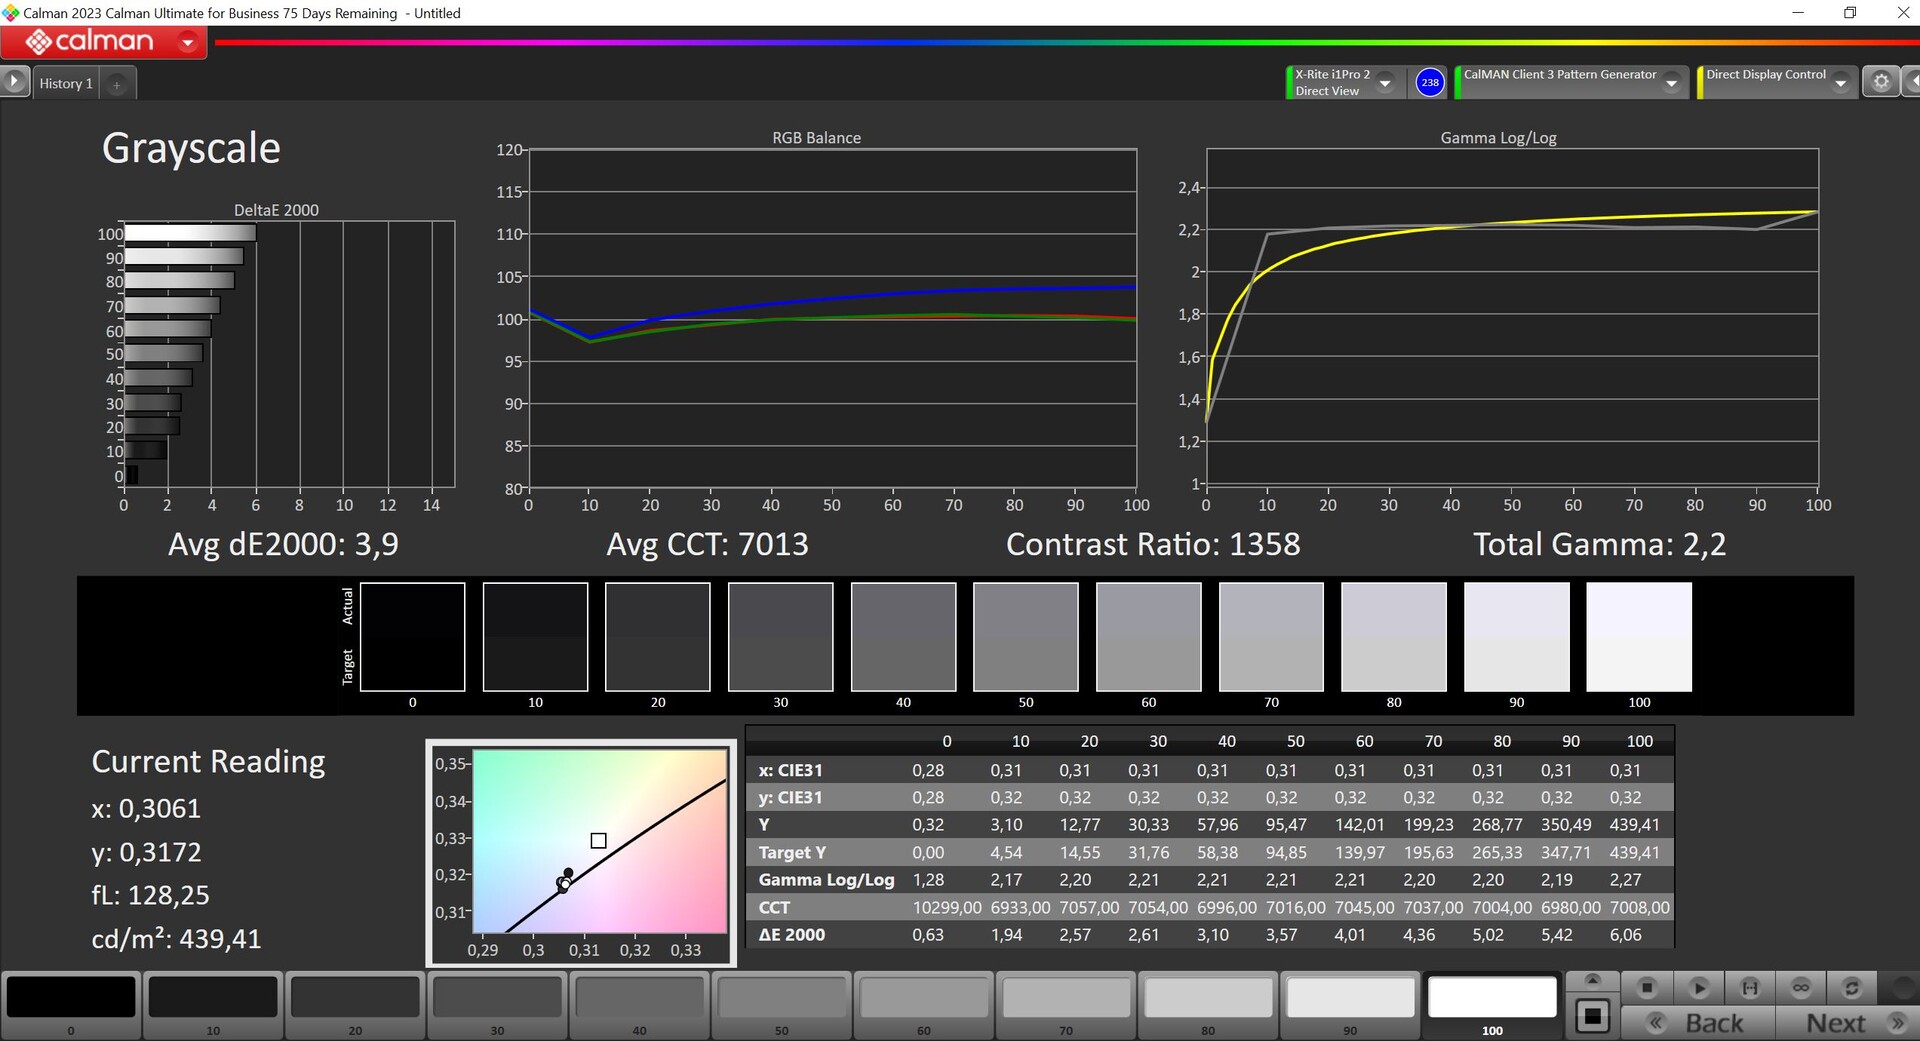
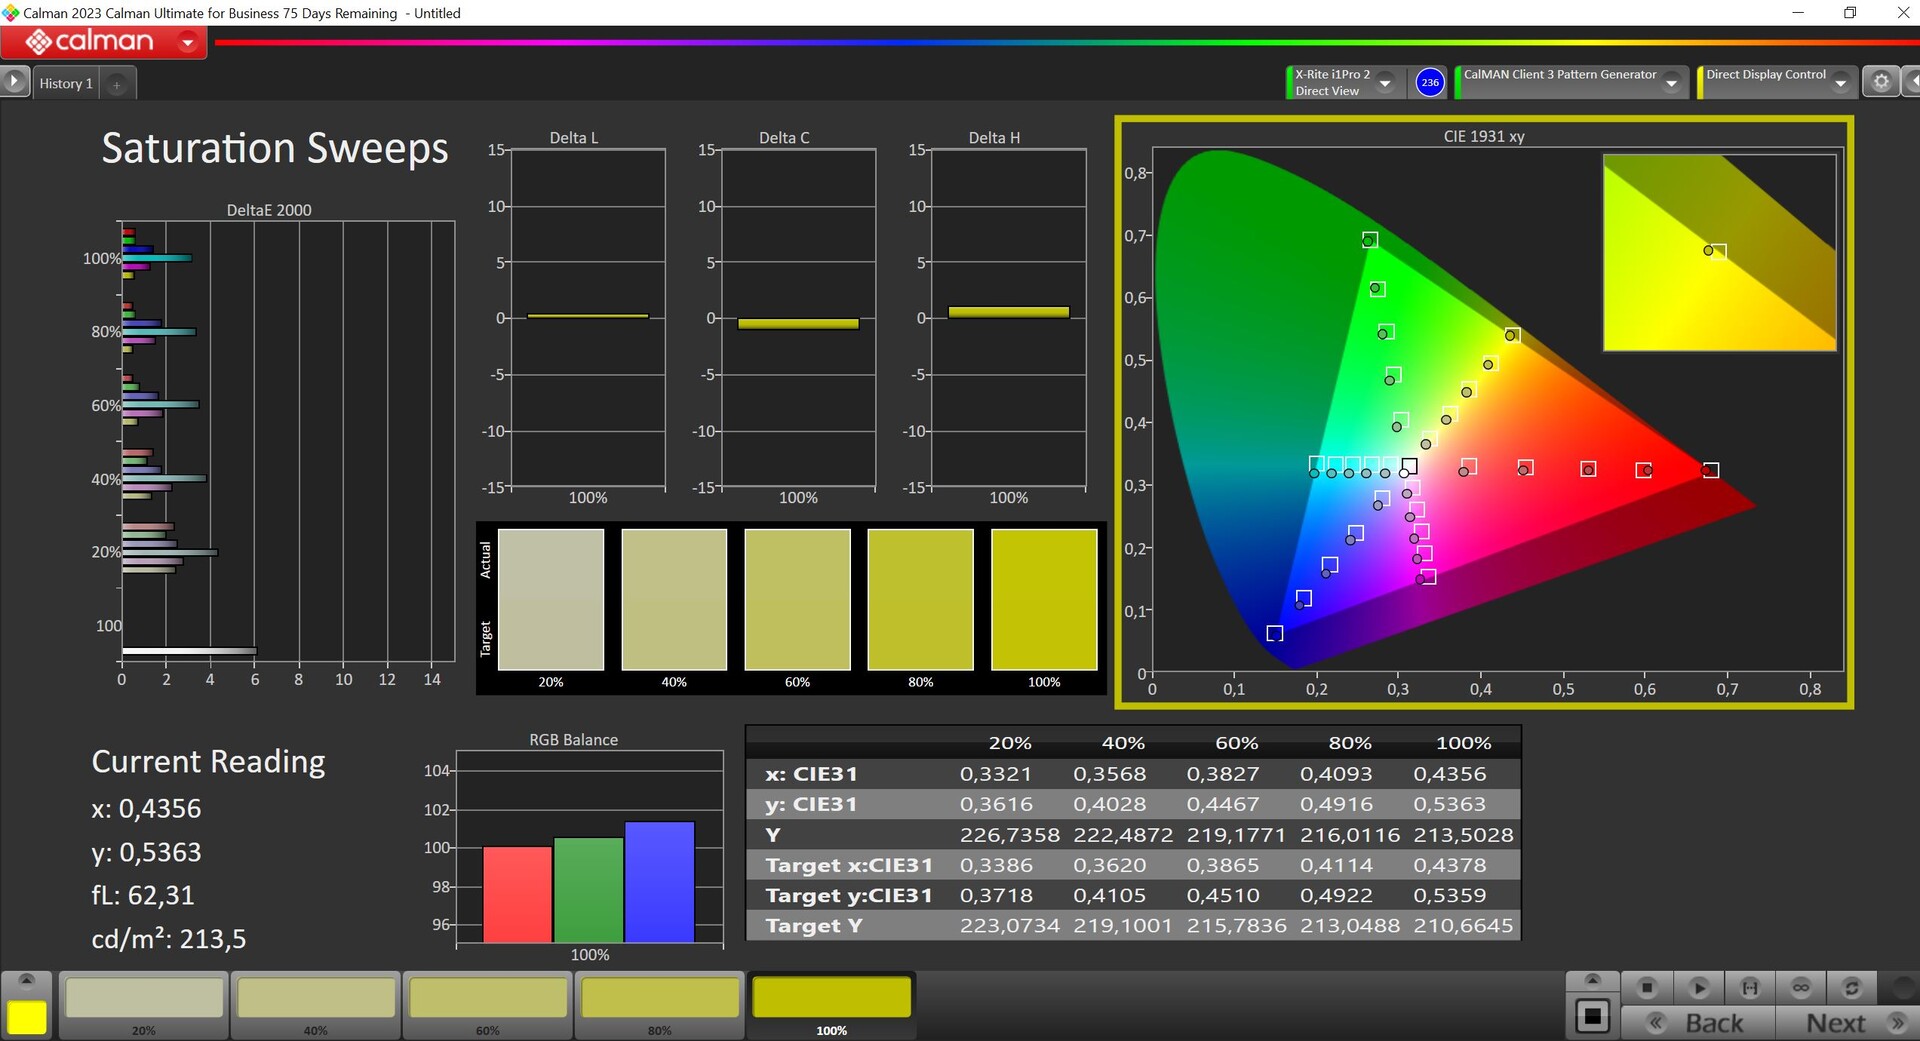
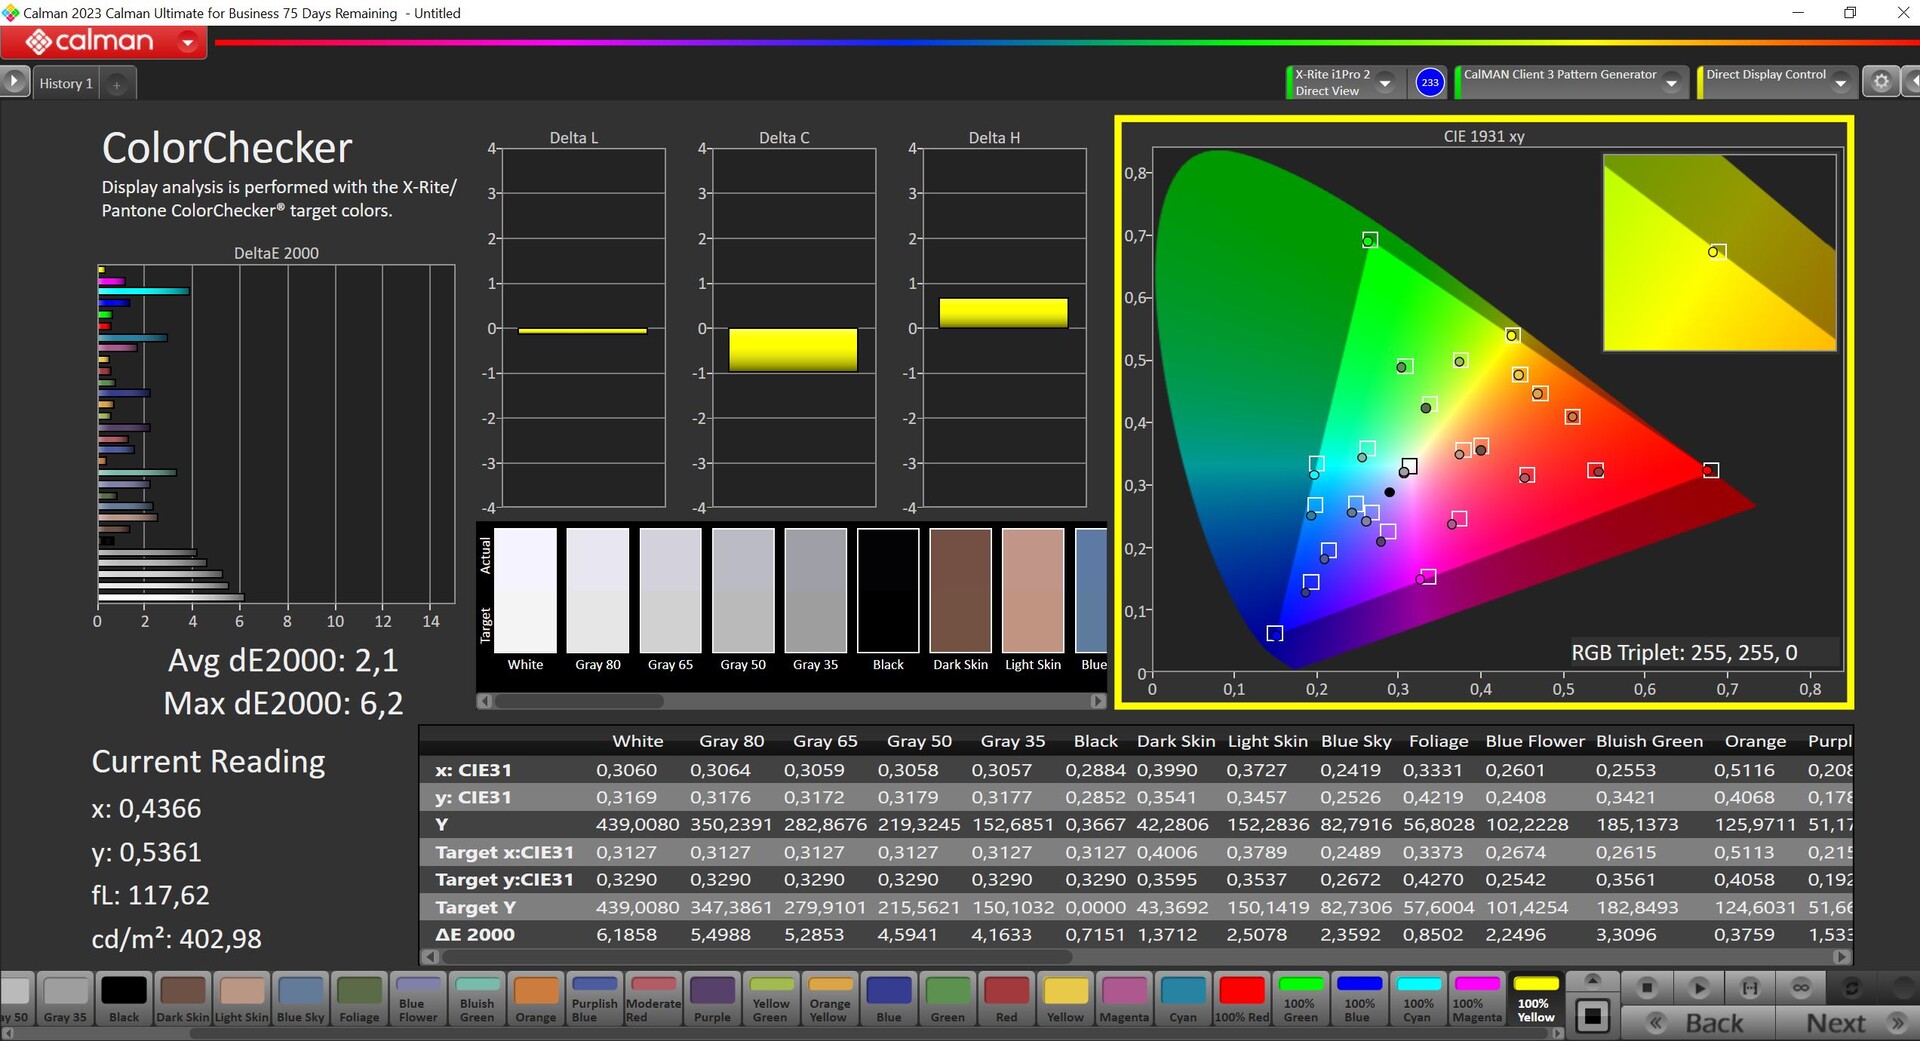
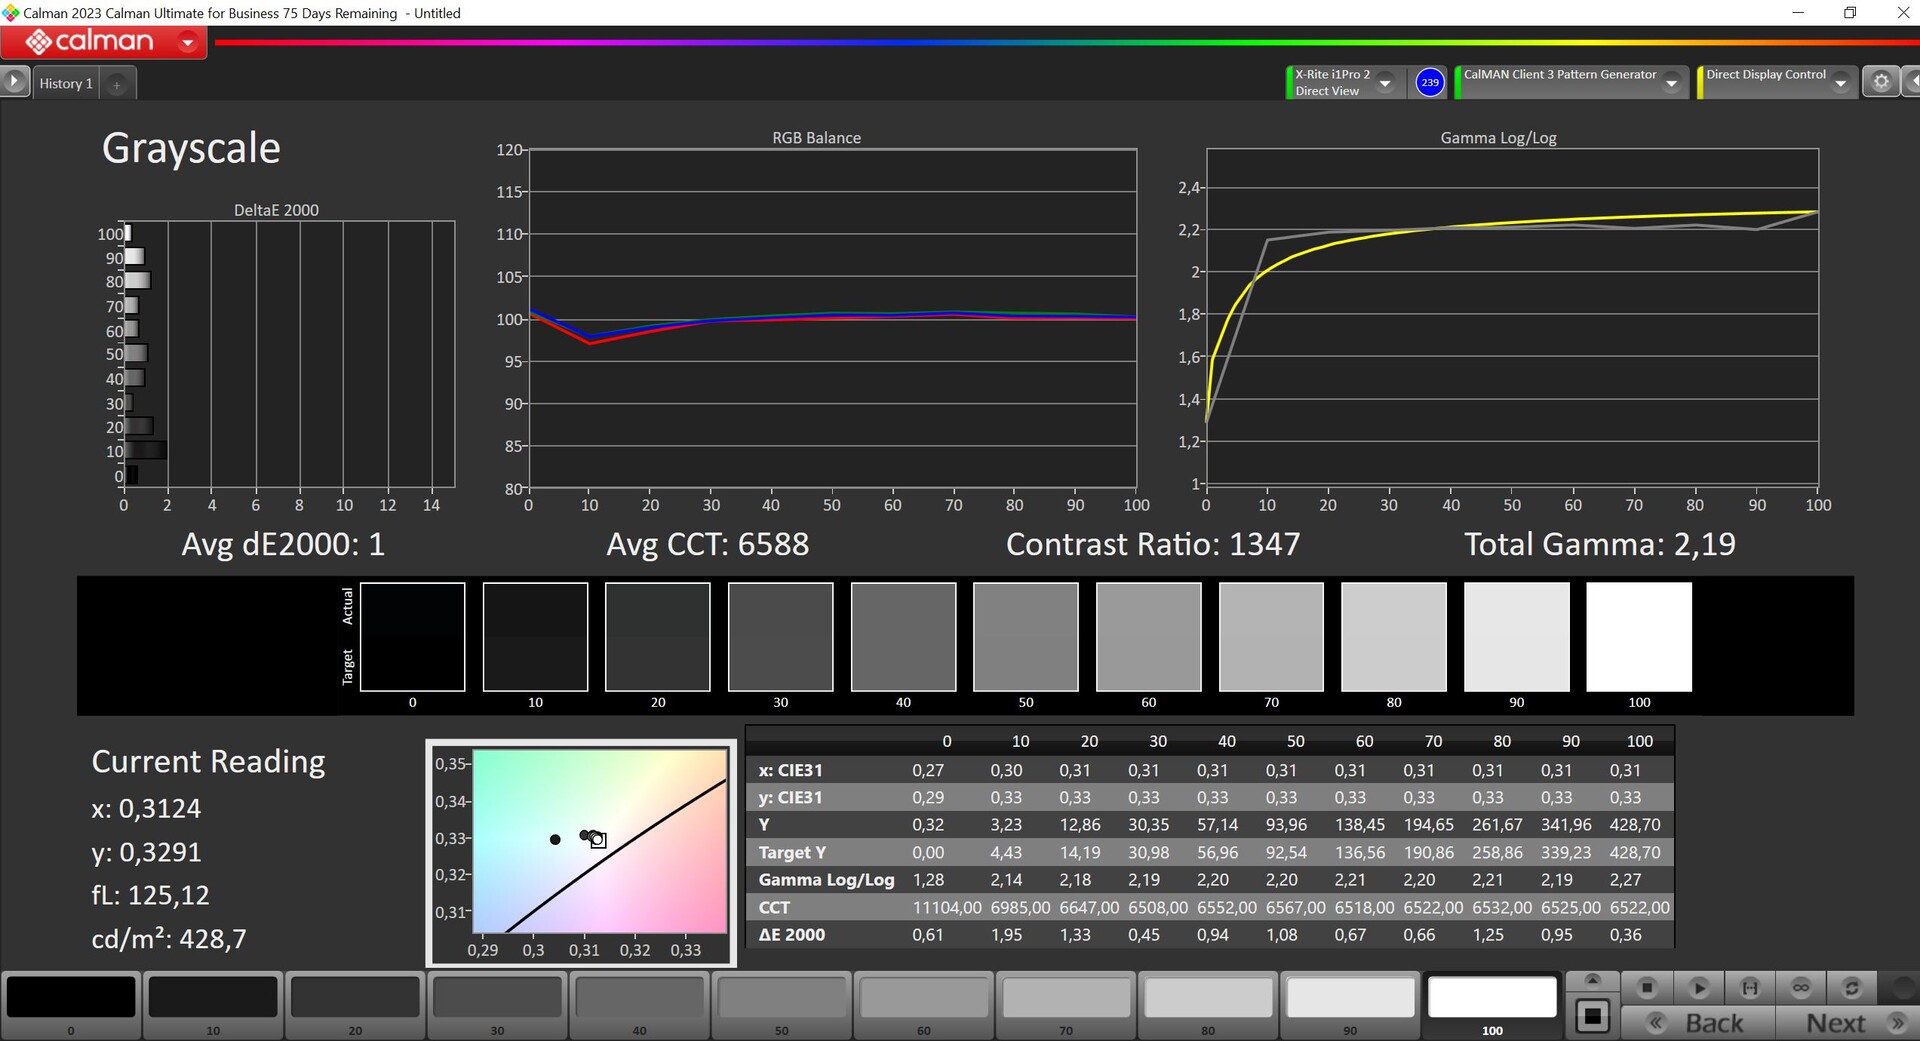
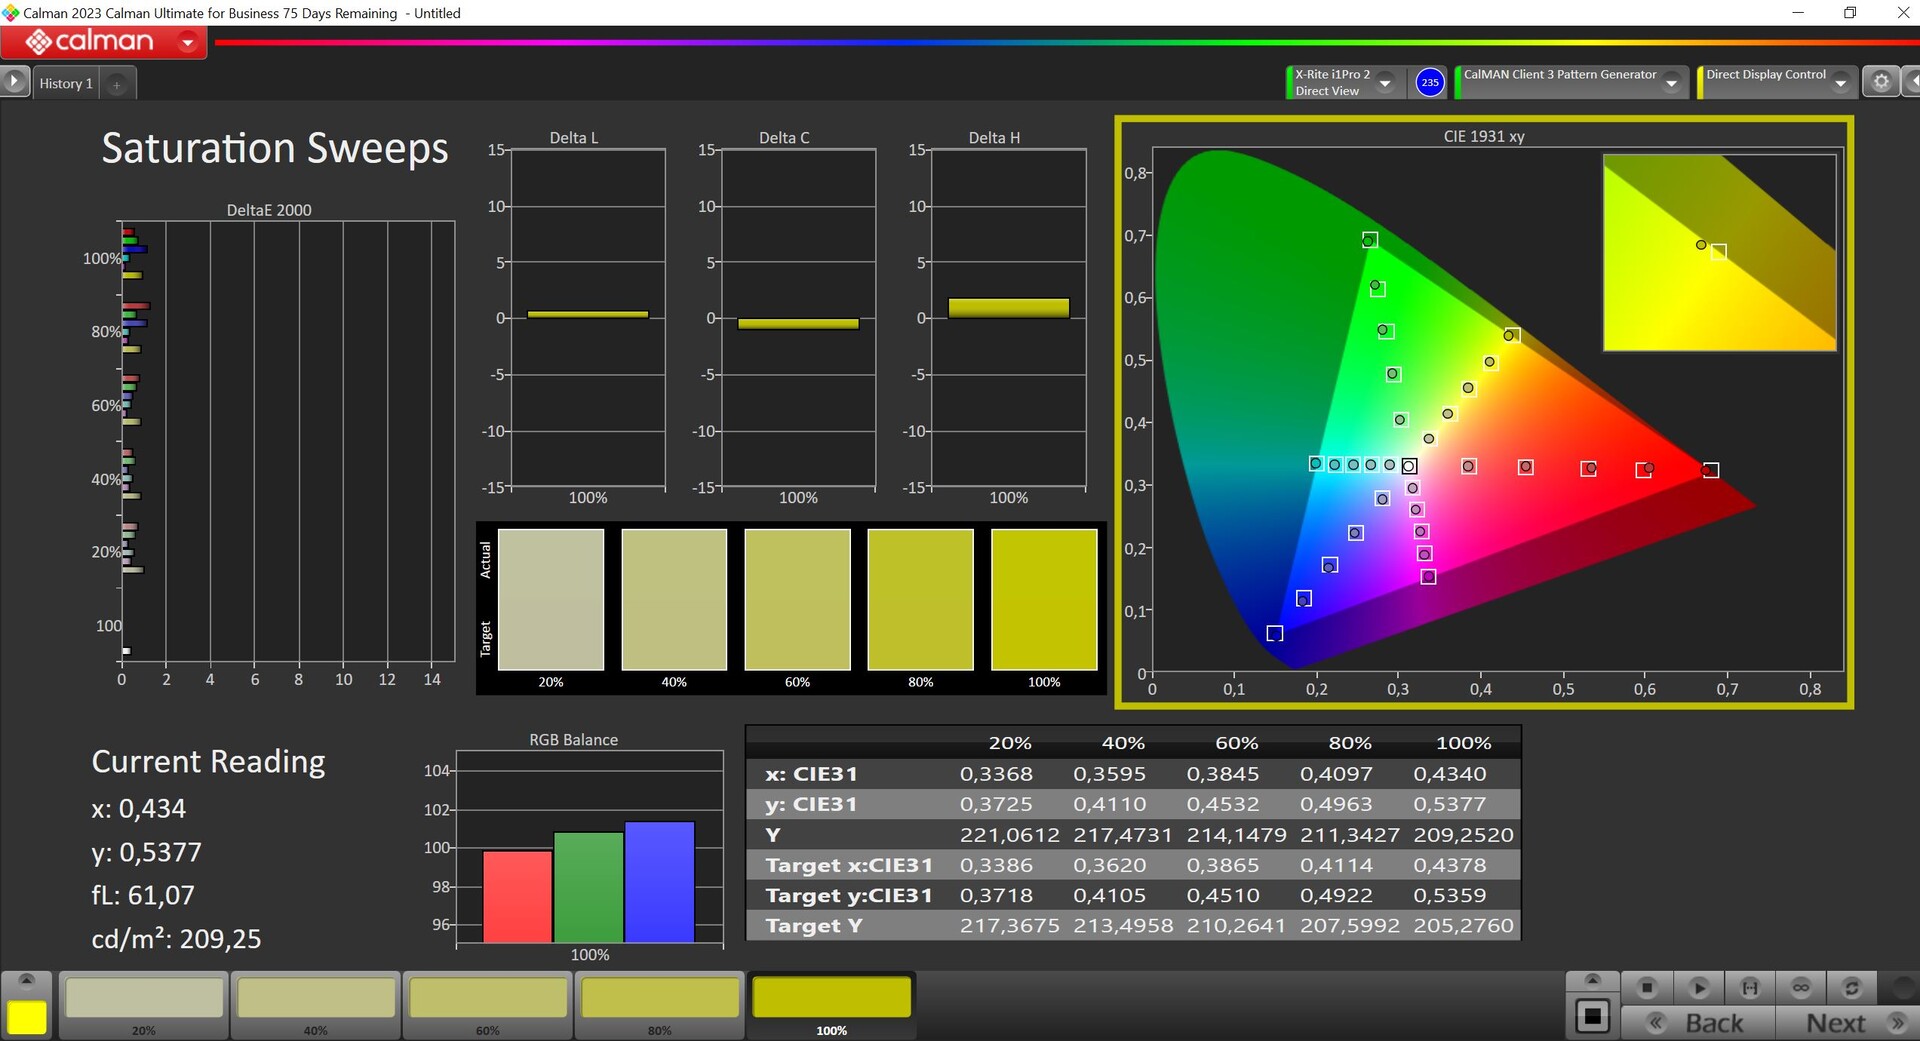
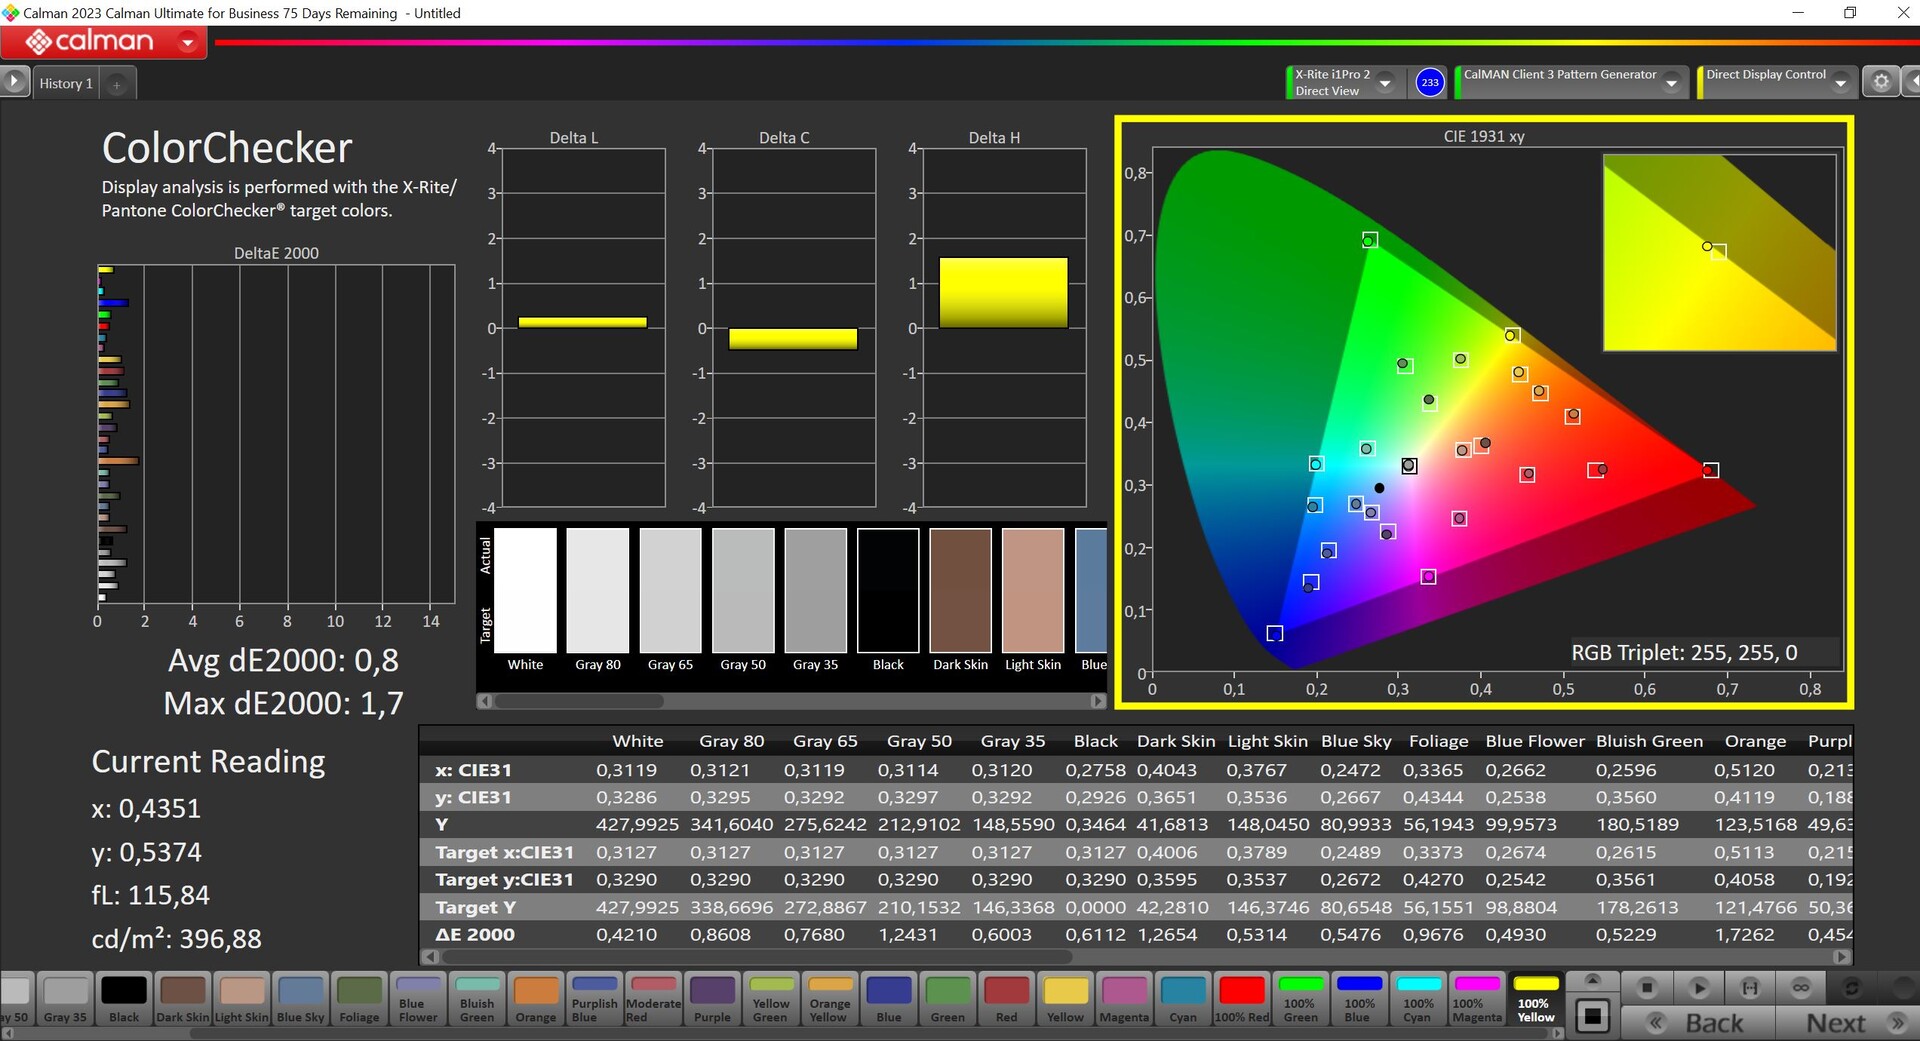
我们使用专业的 CalMAN 软件(X-Rite i1 Pro 2)对面板进行了分析,但联想没有提供 sRGB 配置文件。通过自行校准,我们明显改善了显示效果,纠正了灰度和色彩偏差。相应的配置文件可在上面免费下载。面板完全覆盖 P3 和 sRGB 色彩空间。
Display Response Times
| ↔ Response Time Black to White | ||
|---|---|---|
| 15 ms ... rise ↗ and fall ↘ combined | ↗ 5.8 ms rise | 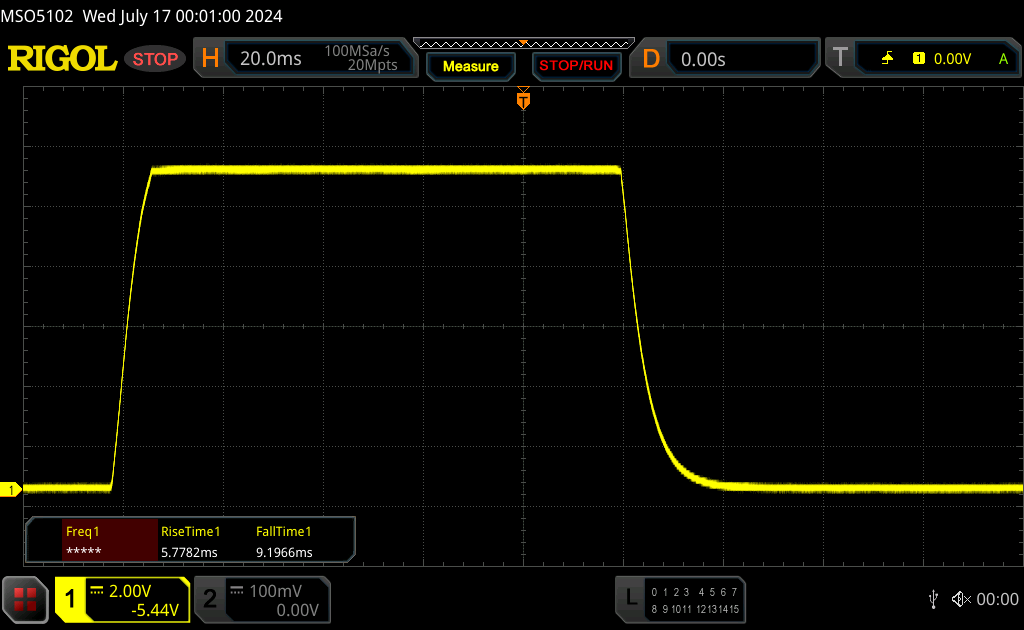 |
| ↘ 9.2 ms fall | ||
| The screen shows good response rates in our tests, but may be too slow for competitive gamers. In comparison, all tested devices range from 0.1 (minimum) to 240 (maximum) ms. » 33 % of all devices are better. This means that the measured response time is better than the average of all tested devices (20.8 ms). | ||
| ↔ Response Time 50% Grey to 80% Grey | ||
| 30.2 ms ... rise ↗ and fall ↘ combined | ↗ 14 ms rise | 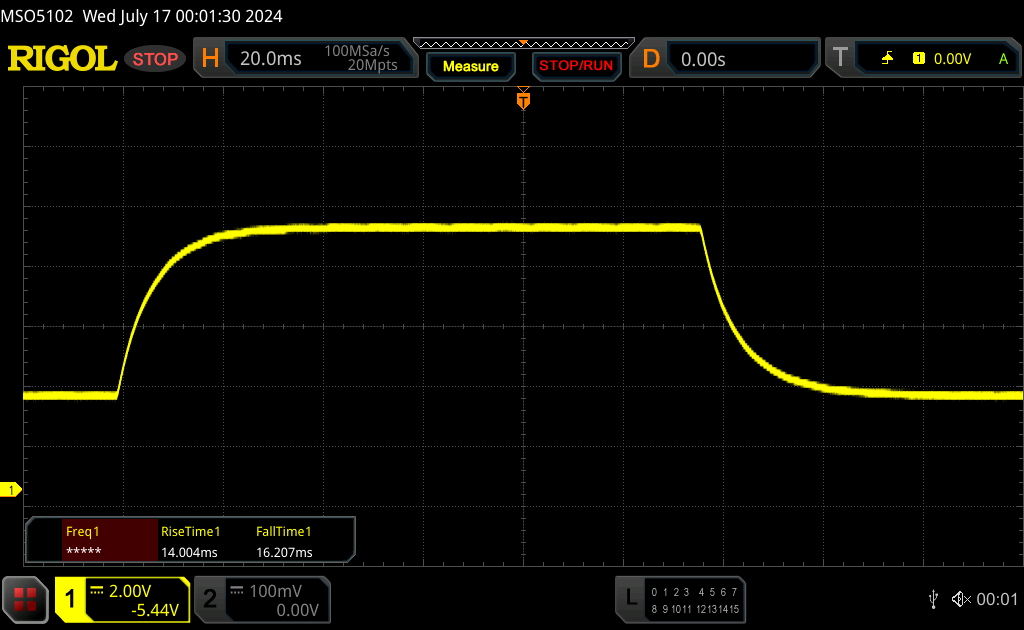 |
| ↘ 16.2 ms fall | ||
| The screen shows slow response rates in our tests and will be unsatisfactory for gamers. In comparison, all tested devices range from 0.165 (minimum) to 636 (maximum) ms. » 37 % of all devices are better. This means that the measured response time is similar to the average of all tested devices (32.5 ms). | ||
Screen Flickering / PWM (Pulse-Width Modulation)
| Screen flickering / PWM not detected |  | ||
In comparison: 53 % of all tested devices do not use PWM to dim the display. If PWM was detected, an average of 8519 (minimum: 5 - maximum: 343500) Hz was measured. | |||
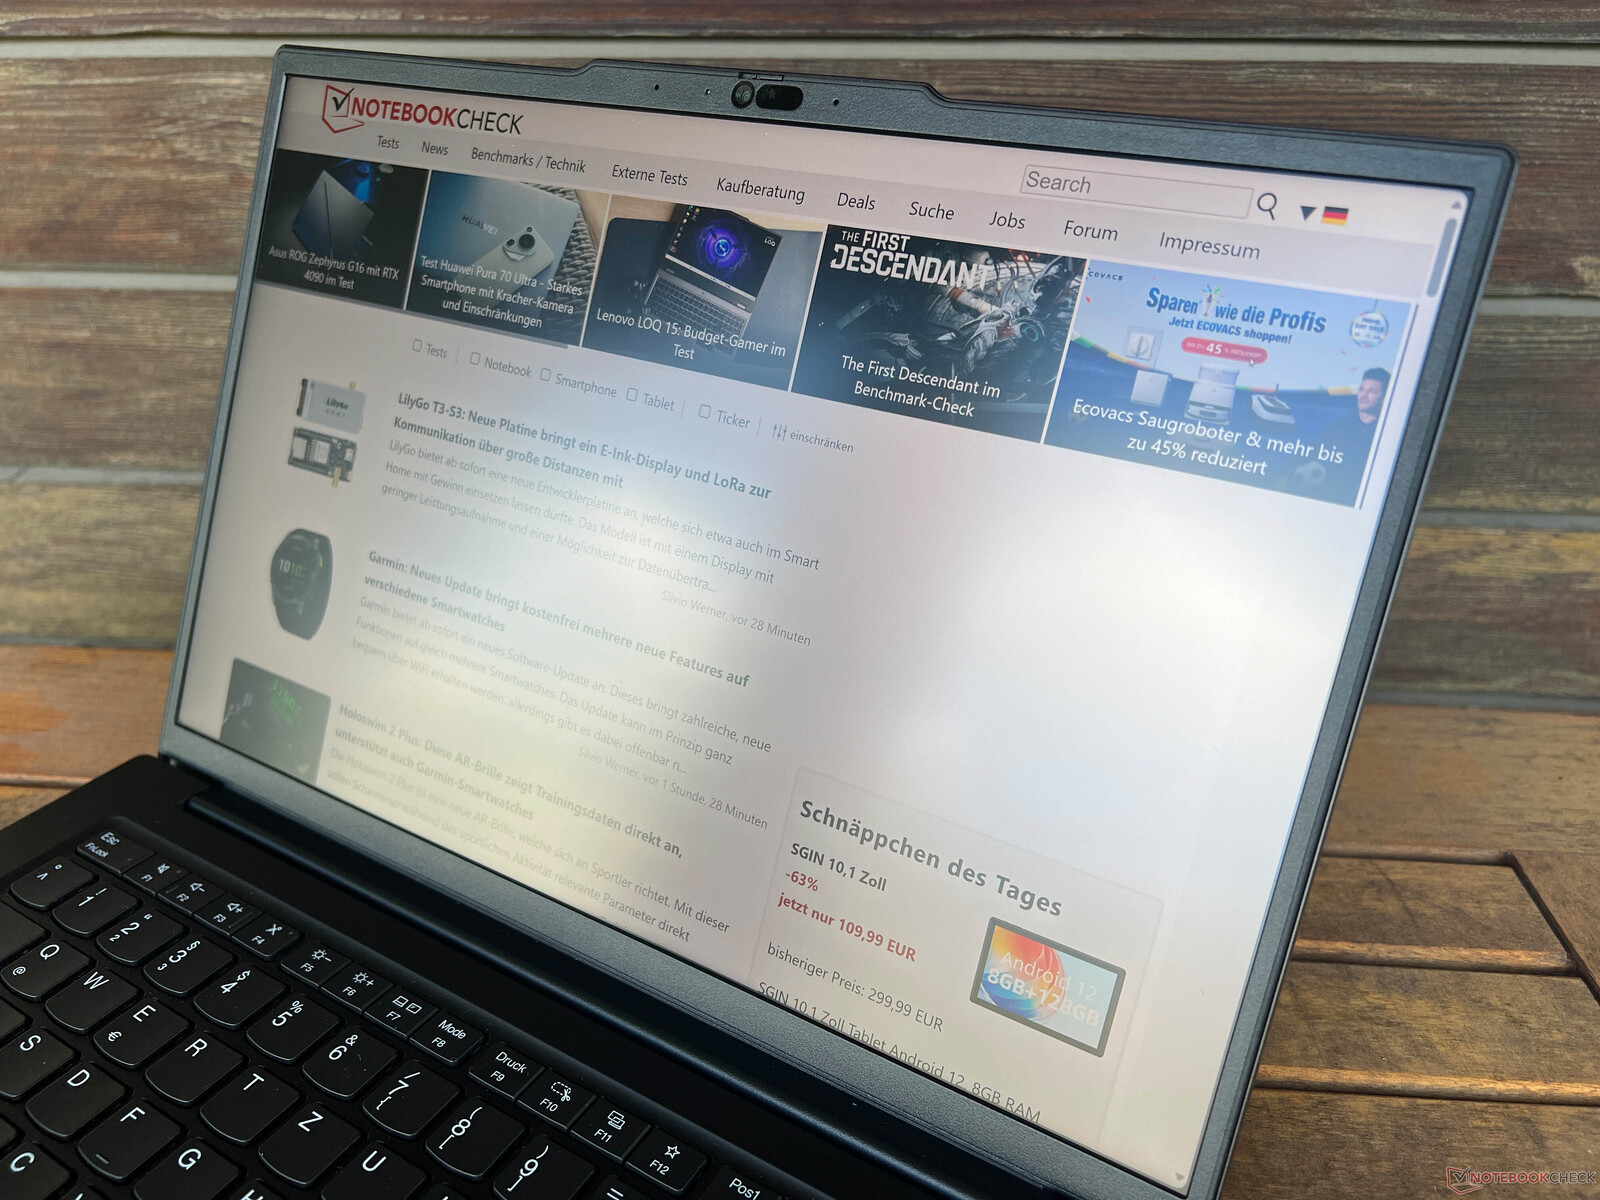
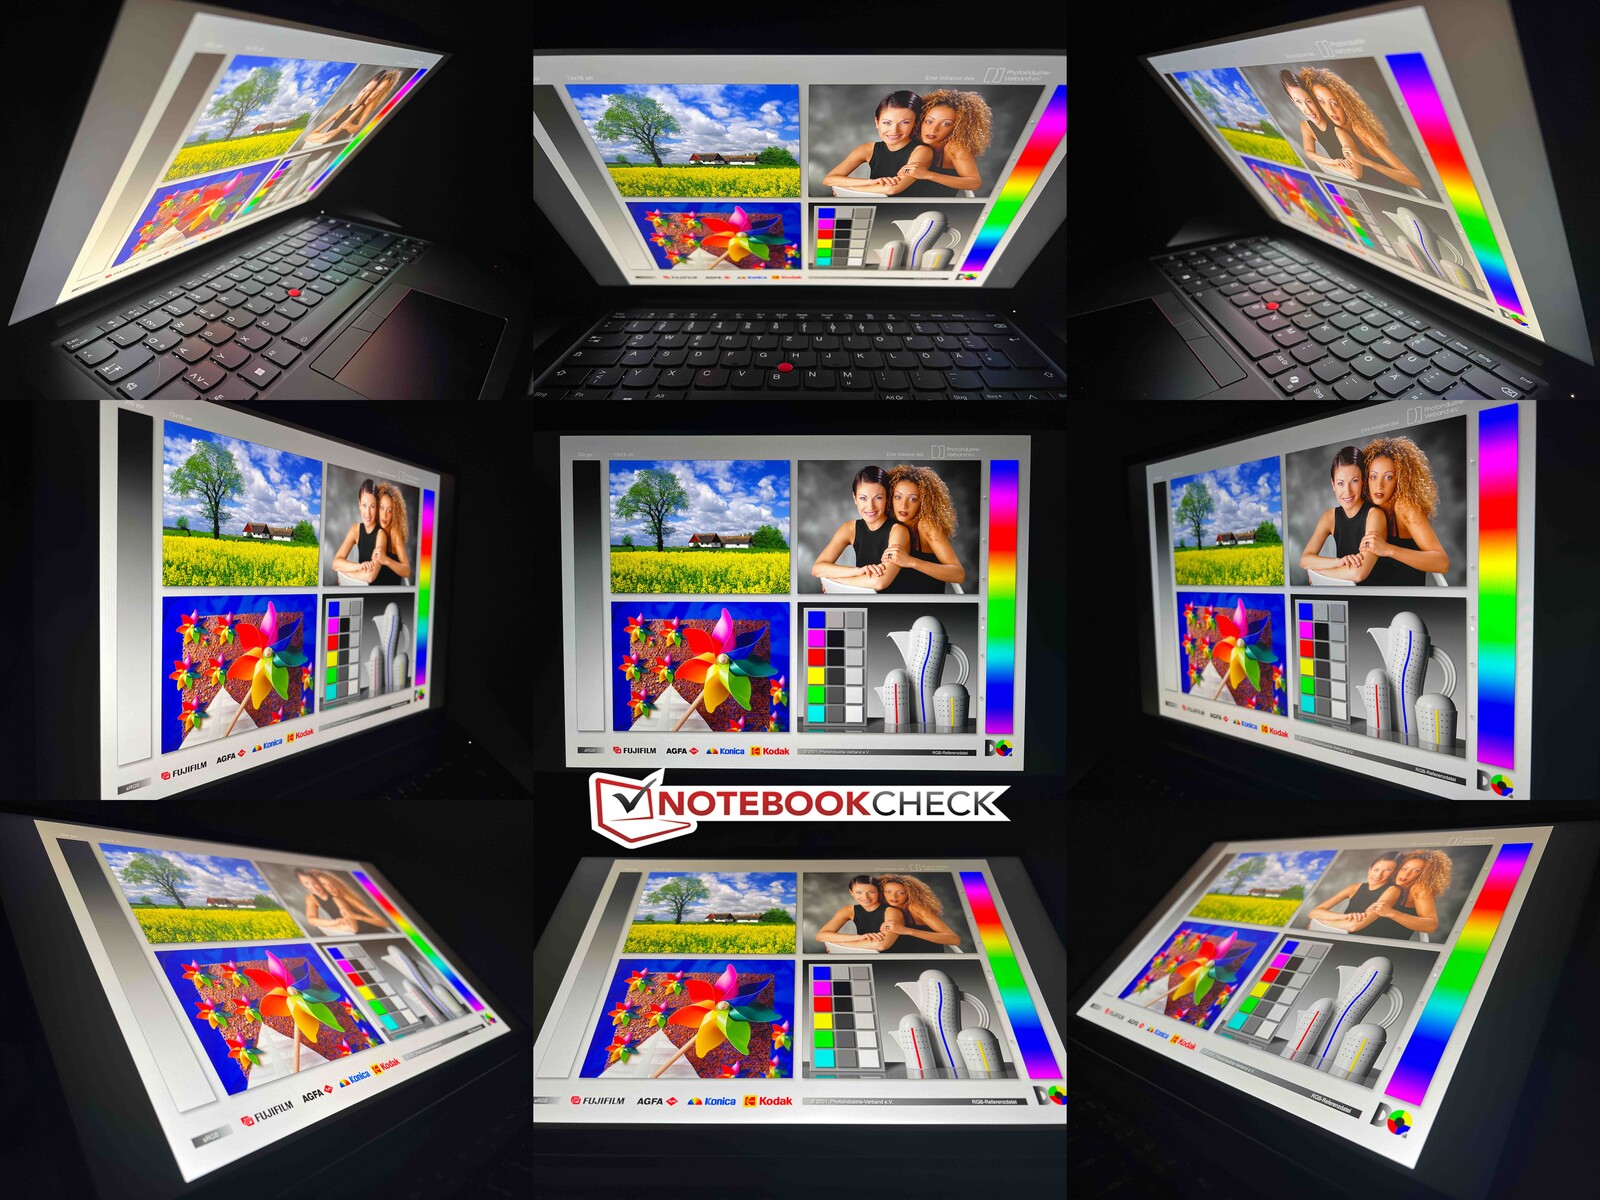
磨砂面板在室外的表现不错,但在非常明亮的天气里,其亮度尤其需要提高一些。IPS 面板的视角稳定性不错。
性能 - Meteor Lake 和 RTX 500 Ada
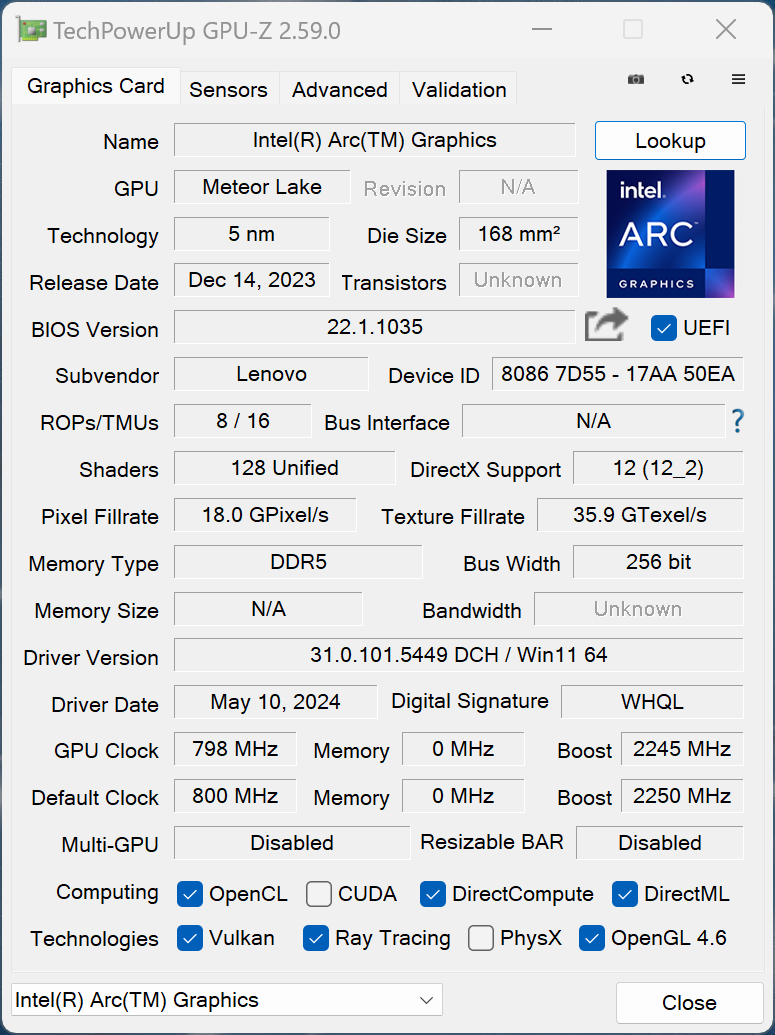
英特尔版本的 ThinkPad P14s G5 只配备流星湖处理器。在图形处理器方面,您可以选择集成的 英特尔弧形图形和专用的 英伟达 RTX 500 Ada.而采用老式设计的 AMD 版 P14s G5 则只能配备 iGPU。
测试条件
长期以来,联想一直将自己的 ThinkPad 能源配置文件与 Windows 的电源设置直接关联。下表总结了相应的 TDP/TGP 设置。我们使用默认设置的最佳性能进行了基准测试和测量。
| 性能模式 | CPU TDP | CB R23 Multi | GPU TGP | Time Spy 图形 | 压力测试 | 最大风扇噪音排放 |
|---|---|---|---|---|---|---|
| 最佳节能 | 80/30 瓦 | 12,089 分 | 35 瓦 | 4,848 分 | CPU:15 瓦 GPU:35 瓦 |
38.3 分贝(A) |
| 平衡 | 80/40 瓦 | 17,620 分 | 40 瓦 | 4,981 分 | CPU:17 瓦 GPU:35 瓦 |
44.8 分贝(A) |
| 最佳性能 | 80/50 瓦 | 17,612 分 | 50 瓦 | 5,278 分 | CPU: 25 瓦 GPU:35 瓦 |
46.8 分贝(A) |
处理器 - Intel Core Ultra 7 155H
酷睿至尊 7 155H 酷睿至尊 7 155H是英特尔当前新一代流星湖处理器的一部分,被许多笔记本电脑所采用。得益于其高功耗限制,该处理器的基准测试结果非常出色,其性能超过了酷睿 i7-1370P 和 AMD Ryzen 7 PRO 7840U和 AMD Ryzen 7 PRO 7840U。即使是名义上速度更快的 酷睿至尊 7 165H内的 ZBook Firefly 14 G11也明显要慢得多。不过,值得一提的是,英特尔旧款 Raptor Lake 芯片(如 酷睿 i7-13700H)的单核性能更高。在电池模式下,该处理器的最大功耗为 55 瓦,因此其多核性能降低了 8%。更多 CPU 基准测试请参见 我们的技术部分.
Cinebench R15 Multi continuous test
Cinebench R23: Multi Core | Single Core
Cinebench R20: CPU (Multi Core) | CPU (Single Core)
Cinebench R15: CPU Multi 64Bit | CPU Single 64Bit
Blender: v2.79 BMW27 CPU
7-Zip 18.03: 7z b 4 | 7z b 4 -mmt1
Geekbench 6.4: Multi-Core | Single-Core
Geekbench 5.5: Multi-Core | Single-Core
HWBOT x265 Benchmark v2.2: 4k Preset
LibreOffice : 20 Documents To PDF
R Benchmark 2.5: Overall mean
| CPU Performance Rating | |
| Average of class Workstation | |
| Lenovo Yoga Pro 9-14IRP G8 | |
| Microsoft Surface Laptop Studio 2 RTX 4060 | |
| Lenovo ThinkPad P14s G5 21G3S00A00 | |
| Dell Precision 5000 5490 | |
| Lenovo ThinkPad P14s G4 21HF0017GE | |
| Average Intel Core Ultra 7 155H | |
| HP ZBook Firefly 14 G11 | |
| Lenovo ThinkPad P14s G4 21K5000LGE | |
| Cinebench R23 / Multi Core | |
| Average of class Workstation (11507 - 30706, n=25, last 2 years) | |
| Lenovo Yoga Pro 9-14IRP G8 | |
| Lenovo ThinkPad P14s G5 21G3S00A00 | |
| Dell Precision 5000 5490 | |
| Microsoft Surface Laptop Studio 2 RTX 4060 | |
| Average Intel Core Ultra 7 155H (9769 - 19007, n=52) | |
| Lenovo ThinkPad P14s G4 21HF0017GE | |
| HP ZBook Firefly 14 G11 | |
| Lenovo ThinkPad P14s G4 21K5000LGE | |
| Cinebench R23 / Single Core | |
| Lenovo ThinkPad P14s G4 21HF0017GE | |
| Microsoft Surface Laptop Studio 2 RTX 4060 | |
| Average of class Workstation (1581 - 2178, n=25, last 2 years) | |
| Lenovo Yoga Pro 9-14IRP G8 | |
| Lenovo ThinkPad P14s G5 21G3S00A00 | |
| Dell Precision 5000 5490 | |
| HP ZBook Firefly 14 G11 | |
| Average Intel Core Ultra 7 155H (1496 - 1815, n=52) | |
| Lenovo ThinkPad P14s G4 21K5000LGE | |
| Cinebench R20 / CPU (Multi Core) | |
| Average of class Workstation (4530 - 11816, n=25, last 2 years) | |
| Lenovo Yoga Pro 9-14IRP G8 | |
| Lenovo ThinkPad P14s G5 21G3S00A00 | |
| Dell Precision 5000 5490 | |
| Microsoft Surface Laptop Studio 2 RTX 4060 | |
| Average Intel Core Ultra 7 155H (3798 - 7409, n=50) | |
| Lenovo ThinkPad P14s G4 21HF0017GE | |
| Lenovo ThinkPad P14s G4 21K5000LGE | |
| HP ZBook Firefly 14 G11 | |
| Cinebench R20 / CPU (Single Core) | |
| Microsoft Surface Laptop Studio 2 RTX 4060 | |
| Lenovo ThinkPad P14s G4 21HF0017GE | |
| Lenovo Yoga Pro 9-14IRP G8 | |
| Average of class Workstation (612 - 827, n=25, last 2 years) | |
| Lenovo ThinkPad P14s G5 21G3S00A00 | |
| Dell Precision 5000 5490 | |
| HP ZBook Firefly 14 G11 | |
| Average Intel Core Ultra 7 155H (601 - 696, n=50) | |
| Lenovo ThinkPad P14s G4 21K5000LGE | |
| Cinebench R15 / CPU Multi 64Bit | |
| Average of class Workstation (1863 - 4784, n=25, last 2 years) | |
| Dell Precision 5000 5490 | |
| Lenovo Yoga Pro 9-14IRP G8 | |
| Lenovo ThinkPad P14s G5 21G3S00A00 | |
| Microsoft Surface Laptop Studio 2 RTX 4060 | |
| HP ZBook Firefly 14 G11 | |
| Average Intel Core Ultra 7 155H (1932 - 2880, n=56) | |
| Lenovo ThinkPad P14s G4 21HF0017GE | |
| Lenovo ThinkPad P14s G4 21K5000LGE | |
| Cinebench R15 / CPU Single 64Bit | |
| Microsoft Surface Laptop Studio 2 RTX 4060 | |
| Lenovo Yoga Pro 9-14IRP G8 | |
| Average of class Workstation (167 - 307, n=25, last 2 years) | |
| Lenovo ThinkPad P14s G4 21K5000LGE | |
| Lenovo ThinkPad P14s G5 21G3S00A00 | |
| Lenovo ThinkPad P14s G4 21HF0017GE | |
| HP ZBook Firefly 14 G11 | |
| Dell Precision 5000 5490 | |
| Average Intel Core Ultra 7 155H (99.6 - 268, n=52) | |
| Blender / v2.79 BMW27 CPU | |
| HP ZBook Firefly 14 G11 | |
| Lenovo ThinkPad P14s G4 21HF0017GE | |
| Microsoft Surface Laptop Studio 2 RTX 4060 | |
| Lenovo ThinkPad P14s G4 21K5000LGE | |
| Average Intel Core Ultra 7 155H (175 - 381, n=47) | |
| Dell Precision 5000 5490 | |
| Lenovo ThinkPad P14s G5 21G3S00A00 | |
| Average of class Workstation (102 - 270, n=25, last 2 years) | |
| Lenovo Yoga Pro 9-14IRP G8 | |
| 7-Zip 18.03 / 7z b 4 | |
| Average of class Workstation (51096 - 109760, n=25, last 2 years) | |
| Lenovo Yoga Pro 9-14IRP G8 | |
| Lenovo ThinkPad P14s G5 21G3S00A00 | |
| Dell Precision 5000 5490 | |
| Microsoft Surface Laptop Studio 2 RTX 4060 | |
| Average Intel Core Ultra 7 155H (41739 - 70254, n=50) | |
| Lenovo ThinkPad P14s G4 21K5000LGE | |
| HP ZBook Firefly 14 G11 | |
| Lenovo ThinkPad P14s G4 21HF0017GE | |
| 7-Zip 18.03 / 7z b 4 -mmt1 | |
| Microsoft Surface Laptop Studio 2 RTX 4060 | |
| Lenovo ThinkPad P14s G4 21HF0017GE | |
| Average of class Workstation (4981 - 6960, n=25, last 2 years) | |
| Lenovo Yoga Pro 9-14IRP G8 | |
| Lenovo ThinkPad P14s G4 21K5000LGE | |
| Lenovo ThinkPad P14s G5 21G3S00A00 | |
| Dell Precision 5000 5490 | |
| HP ZBook Firefly 14 G11 | |
| Average Intel Core Ultra 7 155H (4594 - 5621, n=50) | |
| Geekbench 6.4 / Multi-Core | |
| Lenovo Yoga Pro 9-14IRP G8 | |
| Lenovo Yoga Pro 9-14IRP G8 | |
| Dell Precision 5000 5490 | |
| Microsoft Surface Laptop Studio 2 RTX 4060 | |
| Average of class Workstation (10200 - 16855, n=23, last 2 years) | |
| Lenovo ThinkPad P14s G5 21G3S00A00 | |
| Lenovo ThinkPad P14s G4 21HF0017GE | |
| Average Intel Core Ultra 7 155H (7732 - 13656, n=55) | |
| HP ZBook Firefly 14 G11 | |
| Lenovo ThinkPad P14s G4 21K5000LGE | |
| Geekbench 6.4 / Single-Core | |
| Lenovo ThinkPad P14s G4 21HF0017GE | |
| Microsoft Surface Laptop Studio 2 RTX 4060 | |
| Lenovo Yoga Pro 9-14IRP G8 | |
| Lenovo Yoga Pro 9-14IRP G8 | |
| Average of class Workstation (2352 - 2949, n=23, last 2 years) | |
| Lenovo ThinkPad P14s G4 21K5000LGE | |
| Lenovo ThinkPad P14s G5 21G3S00A00 | |
| HP ZBook Firefly 14 G11 | |
| Dell Precision 5000 5490 | |
| Average Intel Core Ultra 7 155H (1901 - 2473, n=52) | |
| Geekbench 5.5 / Multi-Core | |
| Lenovo Yoga Pro 9-14IRP G8 | |
| Average of class Workstation (8863 - 19316, n=25, last 2 years) | |
| Lenovo ThinkPad P14s G5 21G3S00A00 | |
| Microsoft Surface Laptop Studio 2 RTX 4060 | |
| Dell Precision 5000 5490 | |
| HP ZBook Firefly 14 G11 | |
| Average Intel Core Ultra 7 155H (10017 - 13556, n=52) | |
| Lenovo ThinkPad P14s G4 21HF0017GE | |
| Lenovo ThinkPad P14s G4 21K5000LGE | |
| Geekbench 5.5 / Single-Core | |
| Average of class Workstation (1740 - 2095, n=25, last 2 years) | |
| Lenovo Yoga Pro 9-14IRP G8 | |
| Microsoft Surface Laptop Studio 2 RTX 4060 | |
| Lenovo ThinkPad P14s G4 21HF0017GE | |
| Lenovo ThinkPad P14s G5 21G3S00A00 | |
| HP ZBook Firefly 14 G11 | |
| Dell Precision 5000 5490 | |
| Average Intel Core Ultra 7 155H (1462 - 1824, n=52) | |
| Lenovo ThinkPad P14s G4 21K5000LGE | |
| HWBOT x265 Benchmark v2.2 / 4k Preset | |
| Average of class Workstation (14.4 - 33, n=25, last 2 years) | |
| Lenovo ThinkPad P14s G5 21G3S00A00 | |
| Lenovo Yoga Pro 9-14IRP G8 | |
| Microsoft Surface Laptop Studio 2 RTX 4060 | |
| Dell Precision 5000 5490 | |
| Lenovo ThinkPad P14s G4 21K5000LGE | |
| Average Intel Core Ultra 7 155H (9.93 - 21.2, n=50) | |
| Lenovo ThinkPad P14s G4 21HF0017GE | |
| HP ZBook Firefly 14 G11 | |
| LibreOffice / 20 Documents To PDF | |
| Lenovo ThinkPad P14s G4 21K5000LGE | |
| HP ZBook Firefly 14 G11 | |
| Lenovo ThinkPad P14s G5 21G3S00A00 | |
| Average Intel Core Ultra 7 155H (37.5 - 79.2, n=49) | |
| Lenovo Yoga Pro 9-14IRP G8 | |
| Average of class Workstation (36.5 - 56.9, n=25, last 2 years) | |
| Microsoft Surface Laptop Studio 2 RTX 4060 | |
| Lenovo ThinkPad P14s G4 21HF0017GE | |
| Dell Precision 5000 5490 | |
| R Benchmark 2.5 / Overall mean | |
| Average Intel Core Ultra 7 155H (0.4457 - 0.53, n=49) | |
| Lenovo ThinkPad P14s G4 21K5000LGE | |
| Dell Precision 5000 5490 | |
| Lenovo ThinkPad P14s G5 21G3S00A00 | |
| HP ZBook Firefly 14 G11 | |
| Average of class Workstation (0.3825 - 0.4888, n=25, last 2 years) | |
| Microsoft Surface Laptop Studio 2 RTX 4060 | |
| Lenovo ThinkPad P14s G4 21HF0017GE | |
| Lenovo Yoga Pro 9-14IRP G8 | |
* ... smaller is better
AIDA64: FP32 Ray-Trace | FPU Julia | CPU SHA3 | CPU Queen | FPU SinJulia | FPU Mandel | CPU AES | CPU ZLib | FP64 Ray-Trace | CPU PhotoWorxx
| Performance Rating | |
| Average of class Workstation | |
| Lenovo Yoga Pro 9-14IRP G8 | |
| Lenovo ThinkPad P14s G5 21G3S00A00 | |
| Dell Precision 5000 5490 | |
| Average Intel Core Ultra 7 155H | |
| Microsoft Surface Laptop Studio 2 RTX 4060 | |
| Lenovo ThinkPad P14s G4 21HF0017GE | |
| HP ZBook Firefly 14 G11 | |
| AIDA64 / FP32 Ray-Trace | |
| Average of class Workstation (10658 - 61611, n=25, last 2 years) | |
| Lenovo Yoga Pro 9-14IRP G8 | |
| Lenovo ThinkPad P14s G5 21G3S00A00 | |
| Dell Precision 5000 5490 | |
| Average Intel Core Ultra 7 155H (6670 - 18470, n=50) | |
| Microsoft Surface Laptop Studio 2 RTX 4060 | |
| Lenovo ThinkPad P14s G4 21HF0017GE | |
| HP ZBook Firefly 14 G11 | |
| AIDA64 / FPU Julia | |
| Average of class Workstation (56664 - 183843, n=25, last 2 years) | |
| Lenovo ThinkPad P14s G5 21G3S00A00 | |
| Lenovo Yoga Pro 9-14IRP G8 | |
| Dell Precision 5000 5490 | |
| Microsoft Surface Laptop Studio 2 RTX 4060 | |
| Average Intel Core Ultra 7 155H (40905 - 93181, n=50) | |
| Lenovo ThinkPad P14s G4 21HF0017GE | |
| HP ZBook Firefly 14 G11 | |
| AIDA64 / CPU SHA3 | |
| Average of class Workstation (2608 - 8341, n=25, last 2 years) | |
| Dell Precision 5000 5490 | |
| Lenovo ThinkPad P14s G5 21G3S00A00 | |
| Lenovo Yoga Pro 9-14IRP G8 | |
| Average Intel Core Ultra 7 155H (1940 - 4436, n=50) | |
| Microsoft Surface Laptop Studio 2 RTX 4060 | |
| Lenovo ThinkPad P14s G4 21HF0017GE | |
| HP ZBook Firefly 14 G11 | |
| AIDA64 / CPU Queen | |
| Average of class Workstation (84022 - 144411, n=25, last 2 years) | |
| Lenovo Yoga Pro 9-14IRP G8 | |
| Microsoft Surface Laptop Studio 2 RTX 4060 | |
| Lenovo ThinkPad P14s G4 21HF0017GE | |
| Dell Precision 5000 5490 | |
| HP ZBook Firefly 14 G11 | |
| Lenovo ThinkPad P14s G5 21G3S00A00 | |
| Average Intel Core Ultra 7 155H (64698 - 94181, n=50) | |
| AIDA64 / FPU SinJulia | |
| Average of class Workstation (7906 - 29343, n=25, last 2 years) | |
| Lenovo Yoga Pro 9-14IRP G8 | |
| Lenovo ThinkPad P14s G5 21G3S00A00 | |
| Dell Precision 5000 5490 | |
| Average Intel Core Ultra 7 155H (5639 - 10647, n=50) | |
| Microsoft Surface Laptop Studio 2 RTX 4060 | |
| HP ZBook Firefly 14 G11 | |
| Lenovo ThinkPad P14s G4 21HF0017GE | |
| AIDA64 / FPU Mandel | |
| Average of class Workstation (27301 - 97385, n=25, last 2 years) | |
| Lenovo Yoga Pro 9-14IRP G8 | |
| Lenovo ThinkPad P14s G5 21G3S00A00 | |
| Dell Precision 5000 5490 | |
| Average Intel Core Ultra 7 155H (18236 - 47685, n=50) | |
| Microsoft Surface Laptop Studio 2 RTX 4060 | |
| Lenovo ThinkPad P14s G4 21HF0017GE | |
| HP ZBook Firefly 14 G11 | |
| AIDA64 / CPU AES | |
| Average of class Workstation (56077 - 187841, n=25, last 2 years) | |
| Lenovo ThinkPad P14s G5 21G3S00A00 | |
| Average Intel Core Ultra 7 155H (45713 - 152179, n=50) | |
| Dell Precision 5000 5490 | |
| Lenovo Yoga Pro 9-14IRP G8 | |
| Microsoft Surface Laptop Studio 2 RTX 4060 | |
| Lenovo ThinkPad P14s G4 21HF0017GE | |
| HP ZBook Firefly 14 G11 | |
| AIDA64 / CPU ZLib | |
| Average of class Workstation (742 - 2057, n=25, last 2 years) | |
| Lenovo ThinkPad P14s G5 21G3S00A00 | |
| Lenovo Yoga Pro 9-14IRP G8 | |
| Dell Precision 5000 5490 | |
| Average Intel Core Ultra 7 155H (557 - 1250, n=50) | |
| Microsoft Surface Laptop Studio 2 RTX 4060 | |
| Lenovo ThinkPad P14s G4 21HF0017GE | |
| HP ZBook Firefly 14 G11 | |
| AIDA64 / FP64 Ray-Trace | |
| Average of class Workstation (5580 - 32891, n=25, last 2 years) | |
| Lenovo Yoga Pro 9-14IRP G8 | |
| Lenovo ThinkPad P14s G5 21G3S00A00 | |
| Dell Precision 5000 5490 | |
| Microsoft Surface Laptop Studio 2 RTX 4060 | |
| Average Intel Core Ultra 7 155H (3569 - 9802, n=50) | |
| Lenovo ThinkPad P14s G4 21HF0017GE | |
| HP ZBook Firefly 14 G11 | |
| AIDA64 / CPU PhotoWorxx | |
| Lenovo Yoga Pro 9-14IRP G8 | |
| Dell Precision 5000 5490 | |
| Lenovo ThinkPad P14s G5 21G3S00A00 | |
| Average Intel Core Ultra 7 155H (32719 - 54223, n=50) | |
| HP ZBook Firefly 14 G11 | |
| Average of class Workstation (24325 - 93684, n=25, last 2 years) | |
| Microsoft Surface Laptop Studio 2 RTX 4060 | |
| Lenovo ThinkPad P14s G4 21HF0017GE | |
系统性能
ThinkPad P14s G5 是一款超快的笔记本电脑,这一点在合成基准测试中也得到了证实。虽然在测试过程中,其他设备的速度有时甚至更快,但总体差异很小,系统能快速处理所有输入。此外,我们在测试过程中也没有遇到系统稳定性方面的问题。
CrossMark: Overall | Productivity | Creativity | Responsiveness
WebXPRT 3: Overall
WebXPRT 4: Overall
Mozilla Kraken 1.1: Total
| PCMark 10 / Score | |
| Average of class Workstation (6336 - 8587, n=25, last 2 years) | |
| Lenovo Yoga Pro 9-14IRP G8 | |
| Dell Precision 5000 5490 | |
| Microsoft Surface Laptop Studio 2 RTX 4060 | |
| Lenovo ThinkPad P14s G4 21HF0017GE | |
| Lenovo ThinkPad P14s G5 21G3S00A00 | |
| Average Intel Core Ultra 7 155H, Nvidia RTX 500 Ada Generation Laptop GPU (n=1) | |
| HP ZBook Firefly 14 G11 | |
| PCMark 10 / Essentials | |
| Lenovo Yoga Pro 9-14IRP G8 | |
| Dell Precision 5000 5490 | |
| Lenovo ThinkPad P14s G5 21G3S00A00 | |
| Average Intel Core Ultra 7 155H, Nvidia RTX 500 Ada Generation Laptop GPU (n=1) | |
| Average of class Workstation (9647 - 12197, n=25, last 2 years) | |
| Microsoft Surface Laptop Studio 2 RTX 4060 | |
| Lenovo ThinkPad P14s G4 21HF0017GE | |
| HP ZBook Firefly 14 G11 | |
| PCMark 10 / Productivity | |
| Lenovo ThinkPad P14s G4 21HF0017GE | |
| Average of class Workstation (8829 - 10820, n=25, last 2 years) | |
| HP ZBook Firefly 14 G11 | |
| Lenovo ThinkPad P14s G5 21G3S00A00 | |
| Average Intel Core Ultra 7 155H, Nvidia RTX 500 Ada Generation Laptop GPU (n=1) | |
| Microsoft Surface Laptop Studio 2 RTX 4060 | |
| Dell Precision 5000 5490 | |
| Lenovo Yoga Pro 9-14IRP G8 | |
| PCMark 10 / Digital Content Creation | |
| Average of class Workstation (7589 - 15093, n=25, last 2 years) | |
| Lenovo Yoga Pro 9-14IRP G8 | |
| Microsoft Surface Laptop Studio 2 RTX 4060 | |
| Dell Precision 5000 5490 | |
| Lenovo ThinkPad P14s G5 21G3S00A00 | |
| Average Intel Core Ultra 7 155H, Nvidia RTX 500 Ada Generation Laptop GPU (n=1) | |
| Lenovo ThinkPad P14s G4 21HF0017GE | |
| HP ZBook Firefly 14 G11 | |
| CrossMark / Overall | |
| Lenovo Yoga Pro 9-14IRP G8 | |
| Lenovo ThinkPad P14s G4 21HF0017GE | |
| Average of class Workstation (1574 - 2037, n=23, last 2 years) | |
| Dell Precision 5000 5490 | |
| Microsoft Surface Laptop Studio 2 RTX 4060 | |
| Lenovo ThinkPad P14s G5 21G3S00A00 | |
| Average Intel Core Ultra 7 155H, Nvidia RTX 500 Ada Generation Laptop GPU (n=1) | |
| HP ZBook Firefly 14 G11 | |
| CrossMark / Productivity | |
| Lenovo Yoga Pro 9-14IRP G8 | |
| Lenovo ThinkPad P14s G4 21HF0017GE | |
| Average of class Workstation (1546 - 1902, n=23, last 2 years) | |
| Dell Precision 5000 5490 | |
| Microsoft Surface Laptop Studio 2 RTX 4060 | |
| HP ZBook Firefly 14 G11 | |
| Lenovo ThinkPad P14s G5 21G3S00A00 | |
| Average Intel Core Ultra 7 155H, Nvidia RTX 500 Ada Generation Laptop GPU (n=1) | |
| CrossMark / Creativity | |
| Lenovo Yoga Pro 9-14IRP G8 | |
| Lenovo ThinkPad P14s G4 21HF0017GE | |
| Average of class Workstation (1655 - 2412, n=23, last 2 years) | |
| Microsoft Surface Laptop Studio 2 RTX 4060 | |
| Dell Precision 5000 5490 | |
| HP ZBook Firefly 14 G11 | |
| Lenovo ThinkPad P14s G5 21G3S00A00 | |
| Average Intel Core Ultra 7 155H, Nvidia RTX 500 Ada Generation Laptop GPU (n=1) | |
| CrossMark / Responsiveness | |
| Lenovo ThinkPad P14s G4 21HF0017GE | |
| Lenovo Yoga Pro 9-14IRP G8 | |
| Average of class Workstation (1304 - 1730, n=23, last 2 years) | |
| Lenovo ThinkPad P14s G5 21G3S00A00 | |
| Average Intel Core Ultra 7 155H, Nvidia RTX 500 Ada Generation Laptop GPU (n=1) | |
| Dell Precision 5000 5490 | |
| Microsoft Surface Laptop Studio 2 RTX 4060 | |
| HP ZBook Firefly 14 G11 | |
| WebXPRT 3 / Overall | |
| Lenovo Yoga Pro 9-14IRP G8 | |
| Average of class Workstation (259 - 415, n=26, last 2 years) | |
| Microsoft Surface Laptop Studio 2 RTX 4060 | |
| Lenovo ThinkPad P14s G4 21HF0017GE | |
| HP ZBook Firefly 14 G11 | |
| Dell Precision 5000 5490 | |
| Lenovo ThinkPad P14s G5 21G3S00A00 | |
| Average Intel Core Ultra 7 155H, Nvidia RTX 500 Ada Generation Laptop GPU (n=1) | |
| WebXPRT 4 / Overall | |
| Microsoft Surface Laptop Studio 2 RTX 4060 | |
| Lenovo Yoga Pro 9-14IRP G8 | |
| Lenovo ThinkPad P14s G4 21HF0017GE | |
| Lenovo ThinkPad P14s G4 21HF0017GE | |
| Dell Precision 5000 5490 | |
| Average of class Workstation (199.4 - 338, n=22, last 2 years) | |
| HP ZBook Firefly 14 G11 | |
| Lenovo ThinkPad P14s G5 21G3S00A00 | |
| Average Intel Core Ultra 7 155H, Nvidia RTX 500 Ada Generation Laptop GPU (n=1) | |
| Mozilla Kraken 1.1 / Total | |
| Lenovo ThinkPad P14s G5 21G3S00A00 | |
| Average Intel Core Ultra 7 155H, Nvidia RTX 500 Ada Generation Laptop GPU (n=1) | |
| Dell Precision 5000 5490 | |
| HP ZBook Firefly 14 G11 | |
| Average of class Workstation (433 - 591, n=26, last 2 years) | |
| Lenovo Yoga Pro 9-14IRP G8 | |
| Microsoft Surface Laptop Studio 2 RTX 4060 | |
| Lenovo ThinkPad P14s G4 21HF0017GE | |
* ... smaller is better
| PCMark 10 Score | 6974 points | |
Help | ||
| AIDA64 / Memory Copy | |
| Dell Precision 5000 5490 | |
| Average Intel Core Ultra 7 155H (62397 - 96791, n=50) | |
| Lenovo Yoga Pro 9-14IRP G8 | |
| Lenovo ThinkPad P14s G5 21G3S00A00 | |
| HP ZBook Firefly 14 G11 | |
| Average of class Workstation (34323 - 158632, n=25, last 2 years) | |
| Microsoft Surface Laptop Studio 2 RTX 4060 | |
| Lenovo ThinkPad P14s G4 21HF0017GE | |
| AIDA64 / Memory Read | |
| Dell Precision 5000 5490 | |
| Average Intel Core Ultra 7 155H (60544 - 90647, n=50) | |
| Lenovo ThinkPad P14s G5 21G3S00A00 | |
| HP ZBook Firefly 14 G11 | |
| Lenovo Yoga Pro 9-14IRP G8 | |
| Average of class Workstation (30787 - 121177, n=25, last 2 years) | |
| Microsoft Surface Laptop Studio 2 RTX 4060 | |
| Lenovo ThinkPad P14s G4 21HF0017GE | |
| AIDA64 / Memory Write | |
| Dell Precision 5000 5490 | |
| Lenovo Yoga Pro 9-14IRP G8 | |
| Average of class Workstation (39166 - 212172, n=25, last 2 years) | |
| Microsoft Surface Laptop Studio 2 RTX 4060 | |
| Lenovo ThinkPad P14s G5 21G3S00A00 | |
| Average Intel Core Ultra 7 155H (58692 - 93451, n=50) | |
| HP ZBook Firefly 14 G11 | |
| Lenovo ThinkPad P14s G4 21HF0017GE | |
| AIDA64 / Memory Latency | |
| Average Intel Core Ultra 7 155H (116.2 - 233, n=50) | |
| Dell Precision 5000 5490 | |
| HP ZBook Firefly 14 G11 | |
| Lenovo ThinkPad P14s G5 21G3S00A00 | |
| Average of class Workstation (83.4 - 165.2, n=25, last 2 years) | |
| Lenovo ThinkPad P14s G4 21HF0017GE | |
| Lenovo Yoga Pro 9-14IRP G8 | |
| Microsoft Surface Laptop Studio 2 RTX 4060 | |
* ... smaller is better
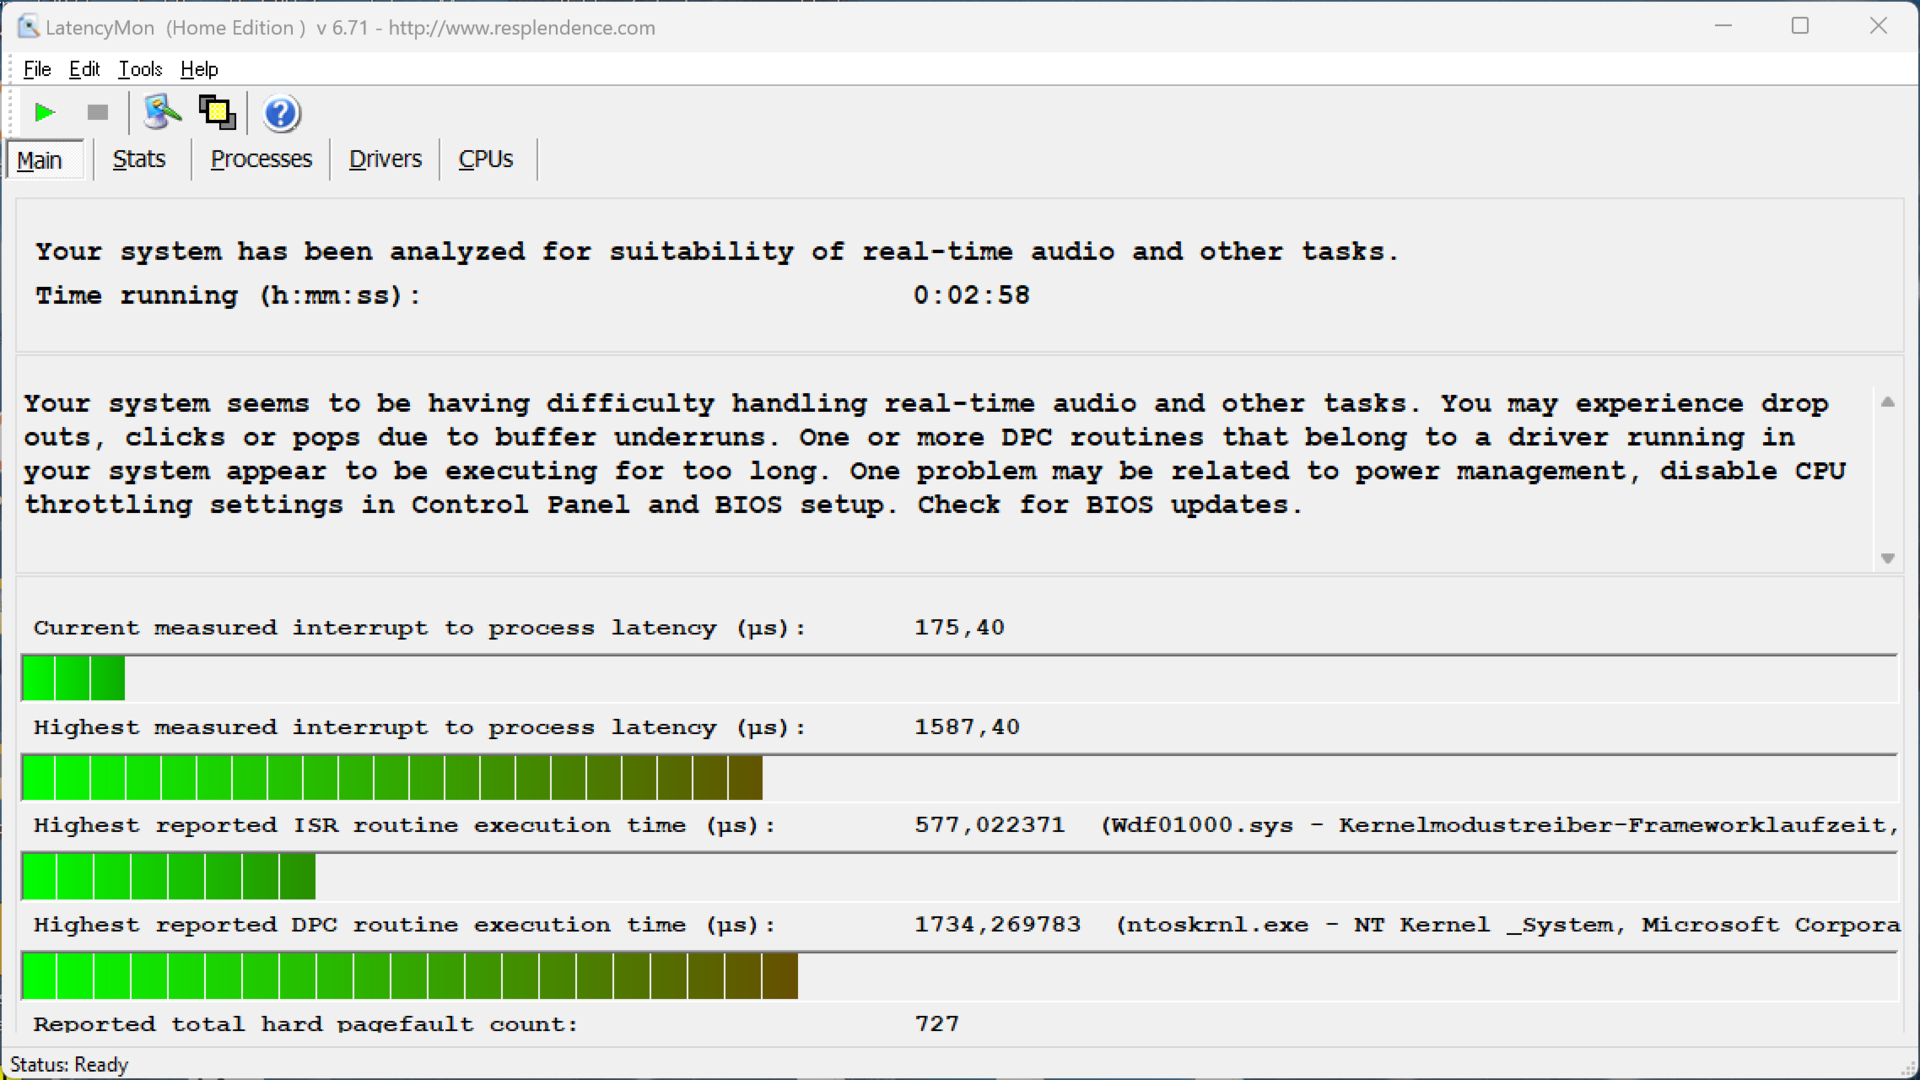
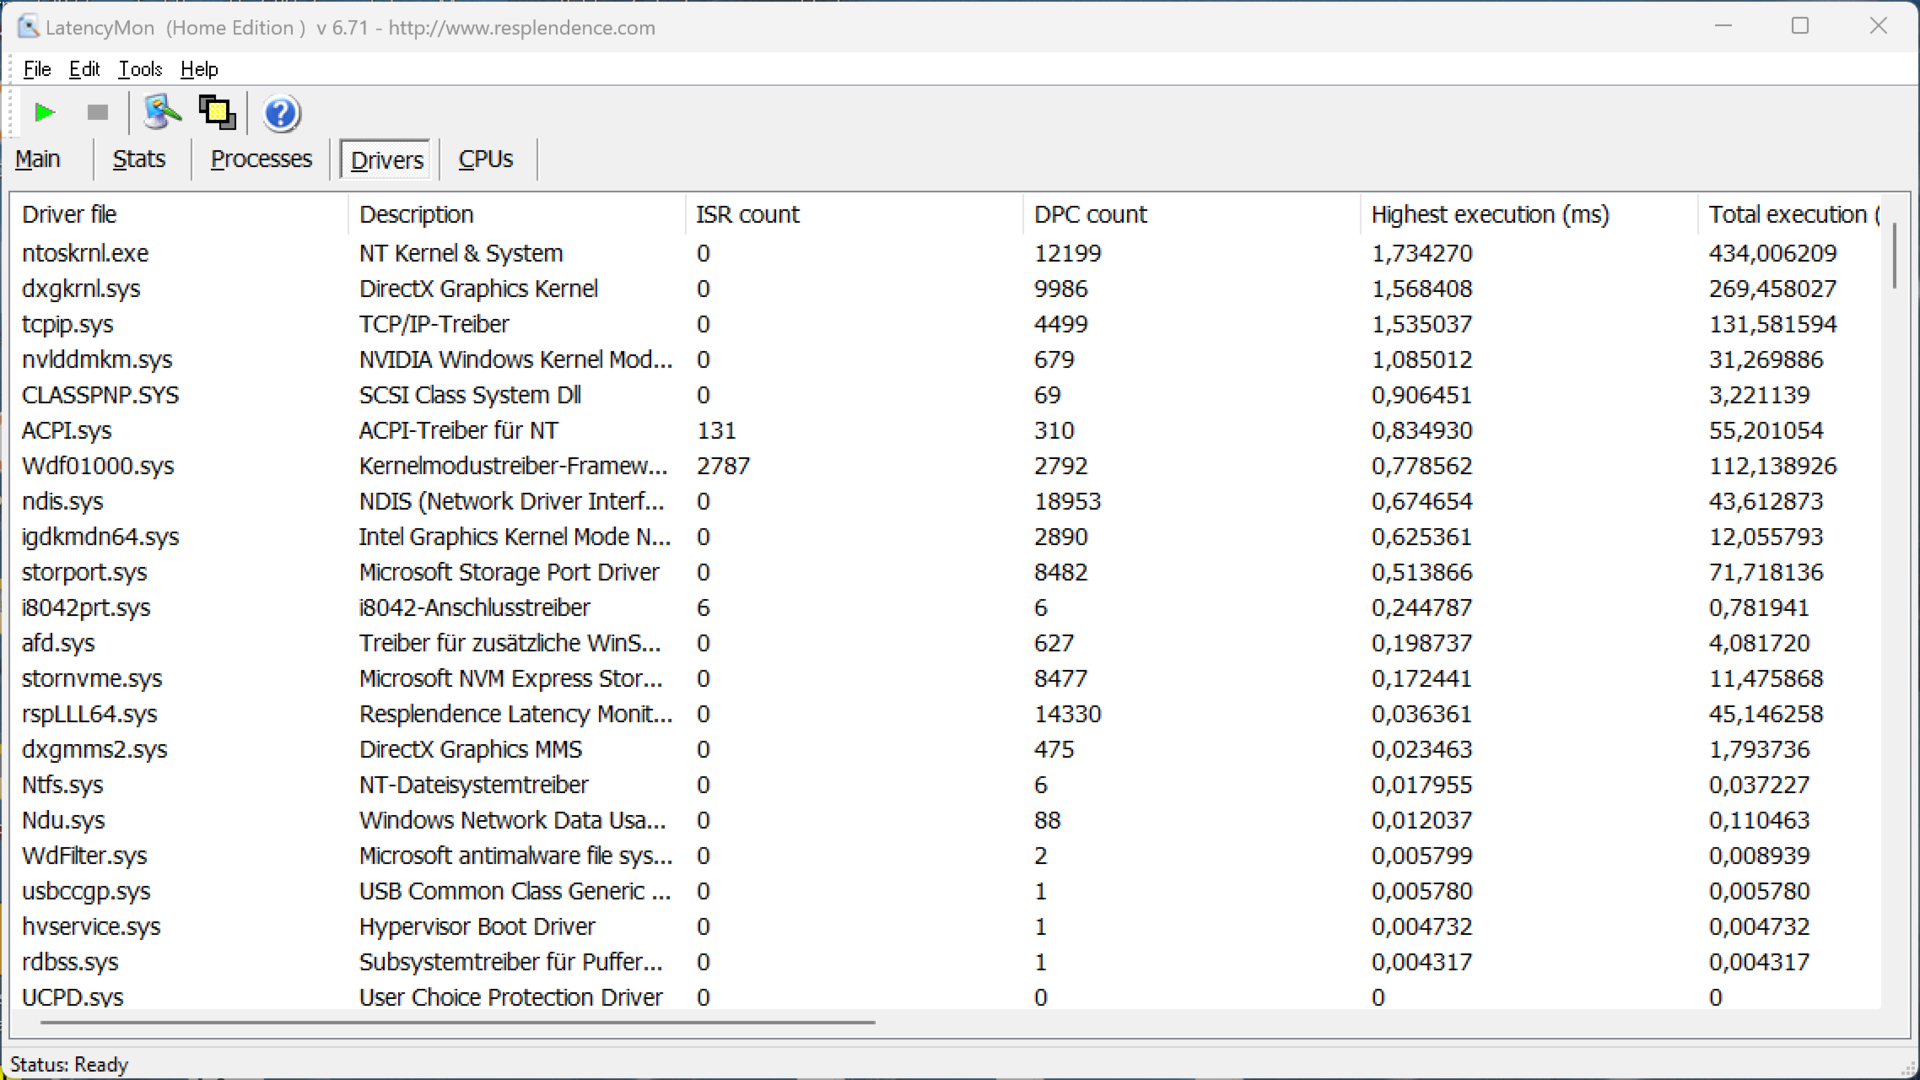
DPC 延迟
在我们的标准化延迟测试(网上冲浪、4K YouTube 视频、CPU 负载)中,使用当前 BIOS 版本的测试设备在使用实时音频应用程序时显示出轻微的限制。
| DPC Latencies / LatencyMon - interrupt to process latency (max), Web, Youtube, Prime95 | |
| Microsoft Surface Laptop Studio 2 RTX 4060 | |
| HP ZBook Firefly 14 G11 | |
| Dell Precision 5000 5490 | |
| Lenovo ThinkPad P14s G4 21HF0017GE | |
| Lenovo ThinkPad P14s G5 21G3S00A00 | |
| Lenovo Yoga Pro 9-14IRP G8 | |
* ... smaller is better
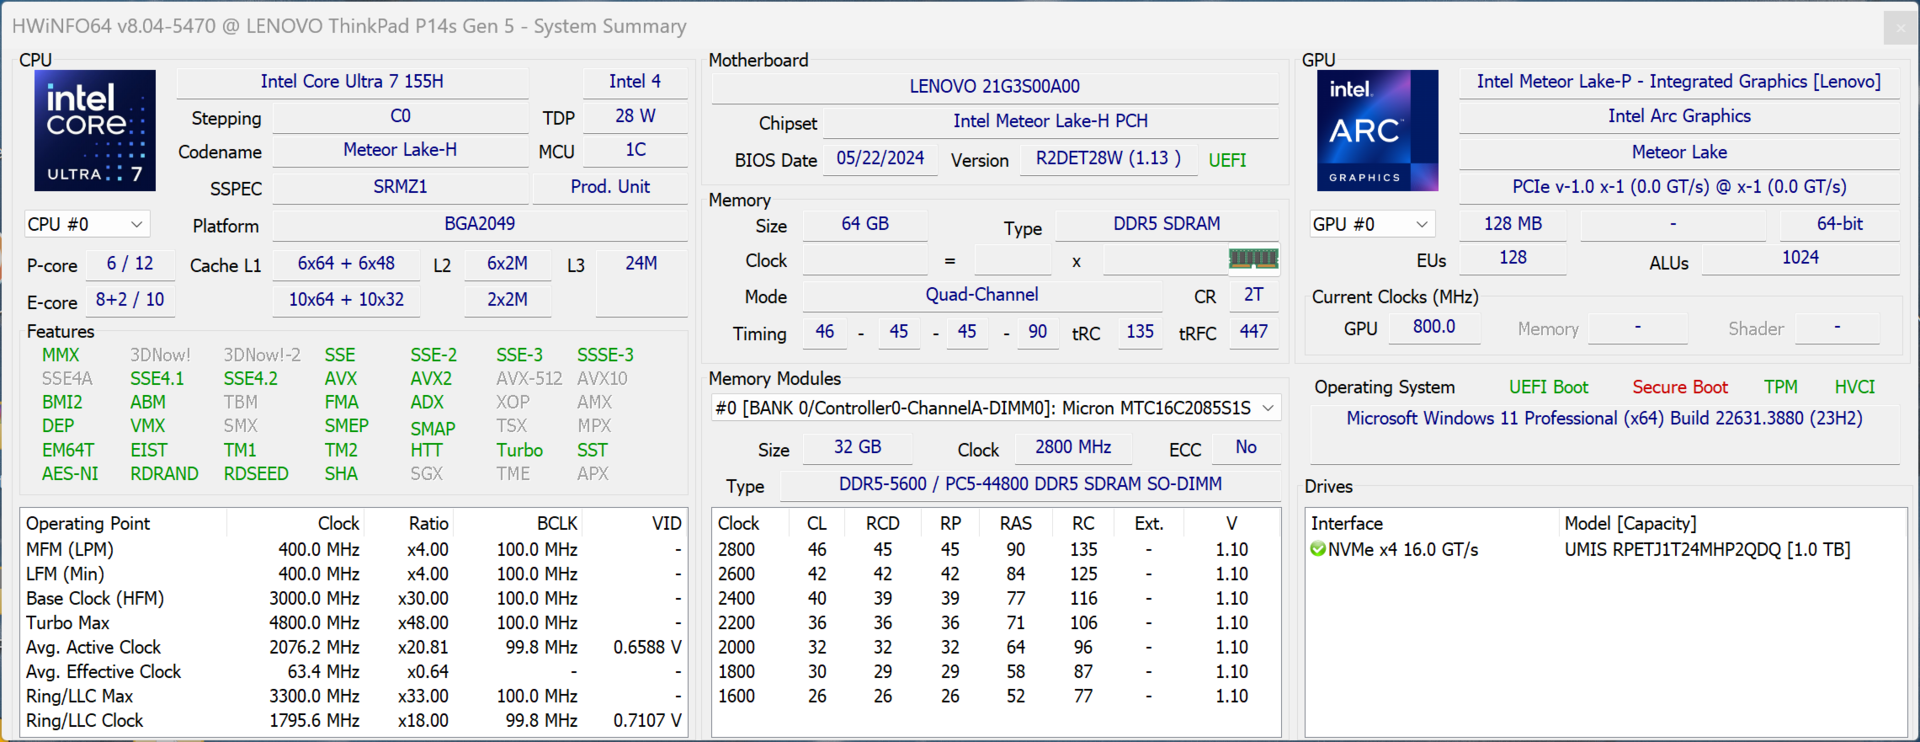
存储设备
P14s G5 有一个 M.2 2280 插槽,通过 PCIe 4.0 连接。我们的测试设备安装了 1 TB 版本的 UMIS AM630。首次启动设备后,用户可使用 871 GB。它的传输速率高达 7 GB/s,性能非常出色--尽管在连续负载的情况下无法保持这些值完全恒定。不过,由于传输速率仍超过每秒 4 GB,用户应该不会受到任何限制。更多固态硬盘基准测试 这里.

* ... smaller is better
Reading continuous performance: DiskSpd Read Loop, Queue Depth 8
显卡 - Nvidia RTX 500 Ada
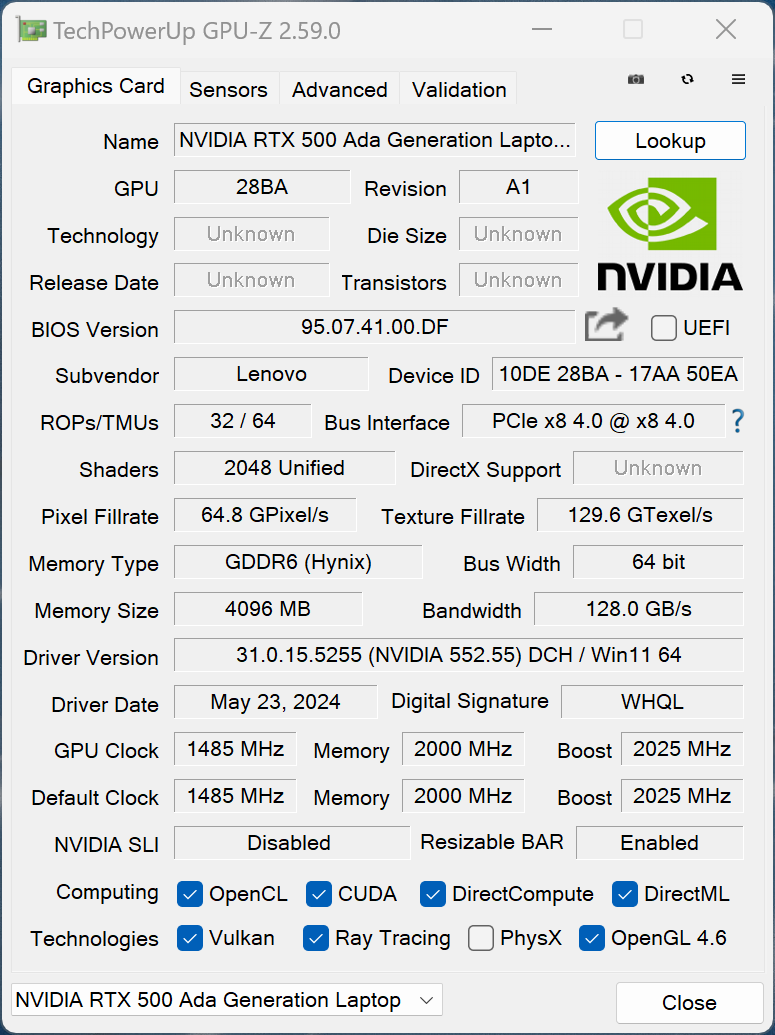
您可以选择在 P14s G5 上安装 英伟达 RTX 500 Ada这是 Nvidia 目前最小的专业移动 GPU。RTX 500 Ada 基于 AD107GLM 芯片,拥有 2,048 个 CUDA 内核和 4GB GDDR6 VRAM。因此,它是 RTX 1000 Ada的瘦身版,因此也是 GeForce RTX 4050 笔记本电脑-都配备了 2560 个 CUDA 内核和 6GB VRAM。在 ThinkPad P14s G5 中,RTX 500 Ada 的最大功耗为 50 瓦,系统支持通过 Nvidia 的 Optimus 技术进行图形切换。与GeForce 型号相比,专业 GPU 通过了 ISV 认证,最大程度地保证了与专业应用的兼容性。
与旧版 RTX A500 笔记本电脑(基于GeForce RTX 3050,用于当前的 ZBook Firefly 14 G11例如)相比,它在 3DMark 和专业 SPECviewperf 测试中的性能明显要好(50-80%),但消费级GeForce RTX 4050 笔记本电脑的 3D 性能甚至更高。遗憾的是,联想没有在 P14s G5 内提供 RTX 1000 Ada。
在持续负载和电池模式下,GPU 的性能保持稳定。更多 GPU 基准测试 这里.
| 3DMark 06 Standard Score | 50935 points | |
| 3DMark Vantage P Result | 66297 points | |
| 3DMark 11 Performance | 20426 points | |
| 3DMark Fire Strike Score | 12761 points | |
| 3DMark Time Spy Score | 5745 points | |
| 3DMark Steel Nomad Score | 981 points | |
| 3DMark Steel Nomad Light Score | 5441 points | |
Help | ||
| Performance Rating - Percent | |
| Dell Precision 5000 5490 -1! | |
| Lenovo ThinkPad P14s G5 21G3S00A00 | |
| Lenovo ThinkPad P14s G4 21HF0017GE -1! | |
| HP ZBook Firefly 14 G11 -1! | |
| Blender / v3.3 Classroom OPTIX/RTX | |
| HP ZBook Firefly 14 G11 | |
| Lenovo ThinkPad P14s G4 21HF0017GE | |
| Lenovo ThinkPad P14s G5 21G3S00A00 | |
| Average Nvidia RTX 500 Ada Generation Laptop GPU (n=1) | |
| Average of class Workstation (13 - 95, n=21, last 2 years) | |
| Lenovo Yoga Pro 9-14IRP G8 | |
| Dell Precision 5000 5490 | |
| Microsoft Surface Laptop Studio 2 RTX 4060 | |
| Blender / v3.3 Classroom CUDA | |
| Lenovo ThinkPad P14s G4 21HF0017GE | |
| HP ZBook Firefly 14 G11 | |
| Lenovo ThinkPad P14s G5 21G3S00A00 | |
| Average Nvidia RTX 500 Ada Generation Laptop GPU (n=1) | |
| Average of class Workstation (18 - 155, n=21, last 2 years) | |
| Lenovo Yoga Pro 9-14IRP G8 | |
| Dell Precision 5000 5490 | |
| Microsoft Surface Laptop Studio 2 RTX 4060 | |
| Blender / v3.3 Classroom CPU | |
| Lenovo ThinkPad P14s G4 21HF0017GE | |
| HP ZBook Firefly 14 G11 | |
| Microsoft Surface Laptop Studio 2 RTX 4060 | |
| Dell Precision 5000 5490 | |
| Lenovo ThinkPad P14s G5 21G3S00A00 | |
| Average Nvidia RTX 500 Ada Generation Laptop GPU (n=1) | |
| Lenovo Yoga Pro 9-14IRP G8 | |
| Average of class Workstation (159 - 472, n=26, last 2 years) | |
* ... smaller is better
游戏性能
如果你想在工作之余放松一下,也可以在 ThinkPad P14s G5 上玩游戏,尽管其性能再次明显低于消费级笔记本电脑 GeForce RTX 4050 笔记本电脑.这意味着您通常只能使用 1080p 分辨率,只有在玩较老或要求不高的游戏时才能获得较高或最高的细节。反过来,当前的游戏,如 F1 24或Cyberpunk 2077 等当前游戏需要进一步降低细节。DLSS 升采样也可用于支持的游戏;例如,在运行《赛博朋克 2077》(1080p,Ultra)时,我们可以将笔记本电脑的性能从 25fps 提高到 45fps(DLSS 平衡)。即使在长时间的游戏过程中,它的游戏性能也能保持完全稳定。
| Cyberpunk 2077 2.2 Phantom Liberty - 1920x1080 Ultra Preset (FSR off) | |
| Average of class Workstation (19.6 - 113.5, n=16, last 2 years) | |
| Microsoft Surface Laptop Studio 2 RTX 4060 | |
| Dell Precision 5000 5490 | |
| Lenovo ThinkPad P14s G5 21G3S00A00 | |
| Lenovo ThinkPad P14s G4 21HF0017GE | |
| HP ZBook Firefly 14 G11 | |
| GTA V - 1920x1080 Highest Settings possible AA:4xMSAA + FX AF:16x | |
| Microsoft Surface Laptop Studio 2 RTX 4060 | |
| Lenovo Yoga Pro 9-14IRP G8 | |
| Average of class Workstation (18.3 - 126.7, n=22, last 2 years) | |
| Lenovo ThinkPad P14s G5 21G3S00A00 | |
| Lenovo ThinkPad P14s G4 21HF0017GE | |
| F1 24 - 1920x1080 Ultra High Preset AA:T AF:16x | |
| Average of class Workstation (11.7 - 47.5, n=4, last 2 years) | |
| Lenovo ThinkPad P14s G5 21G3S00A00 | |
| Average Nvidia RTX 500 Ada Generation Laptop GPU (n=1) | |
| Lenovo ThinkPad P14s G4 21HF0017GE | |
Cyberpunk 2077 ultra FPS diagram
| low | med. | high | ultra | QHD | |
|---|---|---|---|---|---|
| GTA V (2015) | 182.7 | 177.4 | 138.2 | 64.6 | 45.1 |
| The Witcher 3 (2015) | 278 | 175 | 91 | 51 | 36 |
| Dota 2 Reborn (2015) | 176.2 | 156.1 | 148.1 | 137.4 | |
| Final Fantasy XV Benchmark (2018) | 130.5 | 71 | 50 | 36.1 | |
| X-Plane 11.11 (2018) | 128.3 | 103.5 | 81.5 | ||
| Far Cry 5 (2018) | 135 | 86 | 78 | 74 | 50 |
| Strange Brigade (2018) | 316 | 126 | 104 | 91 | 63 |
| Far Cry 6 (2021) | 126 | 80 | 68 | ||
| F1 22 (2022) | 150.4 | 134.4 | 99.6 | 32.9 | |
| F1 23 (2023) | 136.5 | 119.8 | 84.1 | 25 | 16 |
| Baldur's Gate 3 (2023) | 69.4 | 53.6 | 39 | 38.9 | 26.8 |
| Cyberpunk 2077 2.2 Phantom Liberty (2023) | 52.9 | 37.7 | 25.4 | 25 | 19.8 |
| Assassin's Creed Mirage (2023) | 78 | 69 | 55 | 40 | 32 |
| Total War Pharaoh (2023) | 199 | 129 | 73 | 56 | 39 |
| Call of Duty Modern Warfare 3 2023 (2023) | 88 | 78 | 58 | 49 | 33 |
| Avatar Frontiers of Pandora (2023) | 42 | 38 | 32 | 20 | |
| Ghost of Tsushima (2024) | 56.4 | 47.1 | 40.2 | 30.9 | 22 |
| F1 24 (2024) | 112.9 | 80.8 | 26.5 | 16 | 22 |
排放 - 风扇噪音
噪音排放
笔记本电脑的散热系统由两个风扇组成,即使在短时间的负载高峰期也能迅速启动。在我们的测试过程中,即使在播放 YouTube 视频等非常简单的操作时,风扇也始终以低速运转,只有使用较弱的能耗配置文件才能在一定程度上降低风扇转速。在负载情况下,设备的噪音也很快变大,我们在游戏和压力测试中测得的噪音为 46.8 分贝(A)。平衡模式下的噪音为 44.8 dB(A),即使在使用最佳节能模式时,风扇的噪音仍高达 38.3 dB(A)。在测试阶段,我们的测试设备没有发出其他电子噪音。
Noise Level
| Idle |
| 24.6 / 24.6 / 27.5 dB(A) |
| Load |
| 41.2 / 46.8 dB(A) |
 | ||
30 dB silent 40 dB(A) audible 50 dB(A) loud |
||
min: | ||
| Lenovo ThinkPad P14s G5 21G3S00A00 Nvidia RTX 500 Ada Generation Laptop GPU, Ultra 7 155H, Lenovo UMIS AM630 RPETJ1T24MGE2QDQ | HP ZBook Firefly 14 G11 RTX A500 Laptop GPU, Ultra 7 165H, Kioxia XG8 KXG80ZNV512G | Dell Precision 5000 5490 NVIDIA RTX 3000 Ada Generation Laptop GPU, Ultra 9 185H, Kioxia XG8 KXG80ZNV1T02 | Lenovo ThinkPad P14s G4 21HF0017GE RTX A500 Laptop GPU, i7-1370P, SK Hynix HFS002TEJ9X162N | Microsoft Surface Laptop Studio 2 RTX 4060 NVIDIA GeForce RTX 4060 Laptop GPU, i7-13700H, Kioxia XG8 KXG80ZNV1T02 | Lenovo Yoga Pro 9-14IRP G8 NVIDIA GeForce RTX 4050 Laptop GPU, i7-13705H, Samsung PM9A1 MZVL21T0HCLR | |
|---|---|---|---|---|---|---|
| Noise | 3% | 3% | 2% | -3% | -4% | |
| off / environment * | 24.6 | 24.3 1% | 22.8 7% | 24.6 -0% | 23.9 3% | 24.8 -1% |
| Idle Minimum * | 24.6 | 24.6 -0% | 23.8 3% | 24.6 -0% | 23.9 3% | 24.8 -1% |
| Idle Average * | 24.6 | 25.2 -2% | 23.8 3% | 24.6 -0% | 24.4 1% | 24.8 -1% |
| Idle Maximum * | 27.5 | 26.8 3% | 24.7 10% | 25.9 6% | 26.9 2% | 24.8 10% |
| Load Average * | 41.2 | 38.9 6% | 38.9 6% | 41.3 -0% | 48.5 -18% | 47.4 -15% |
| Cyberpunk 2077 ultra * | 46.8 | 41.8 11% | 44.2 6% | |||
| Load Maximum * | 46.8 | 45.8 2% | 51.4 -10% | 46.2 1% | 51.8 -11% | 52.9 -13% |
| Witcher 3 ultra * | 49.9 | 46 | 51.8 | 52.9 |
* ... smaller is better
温度
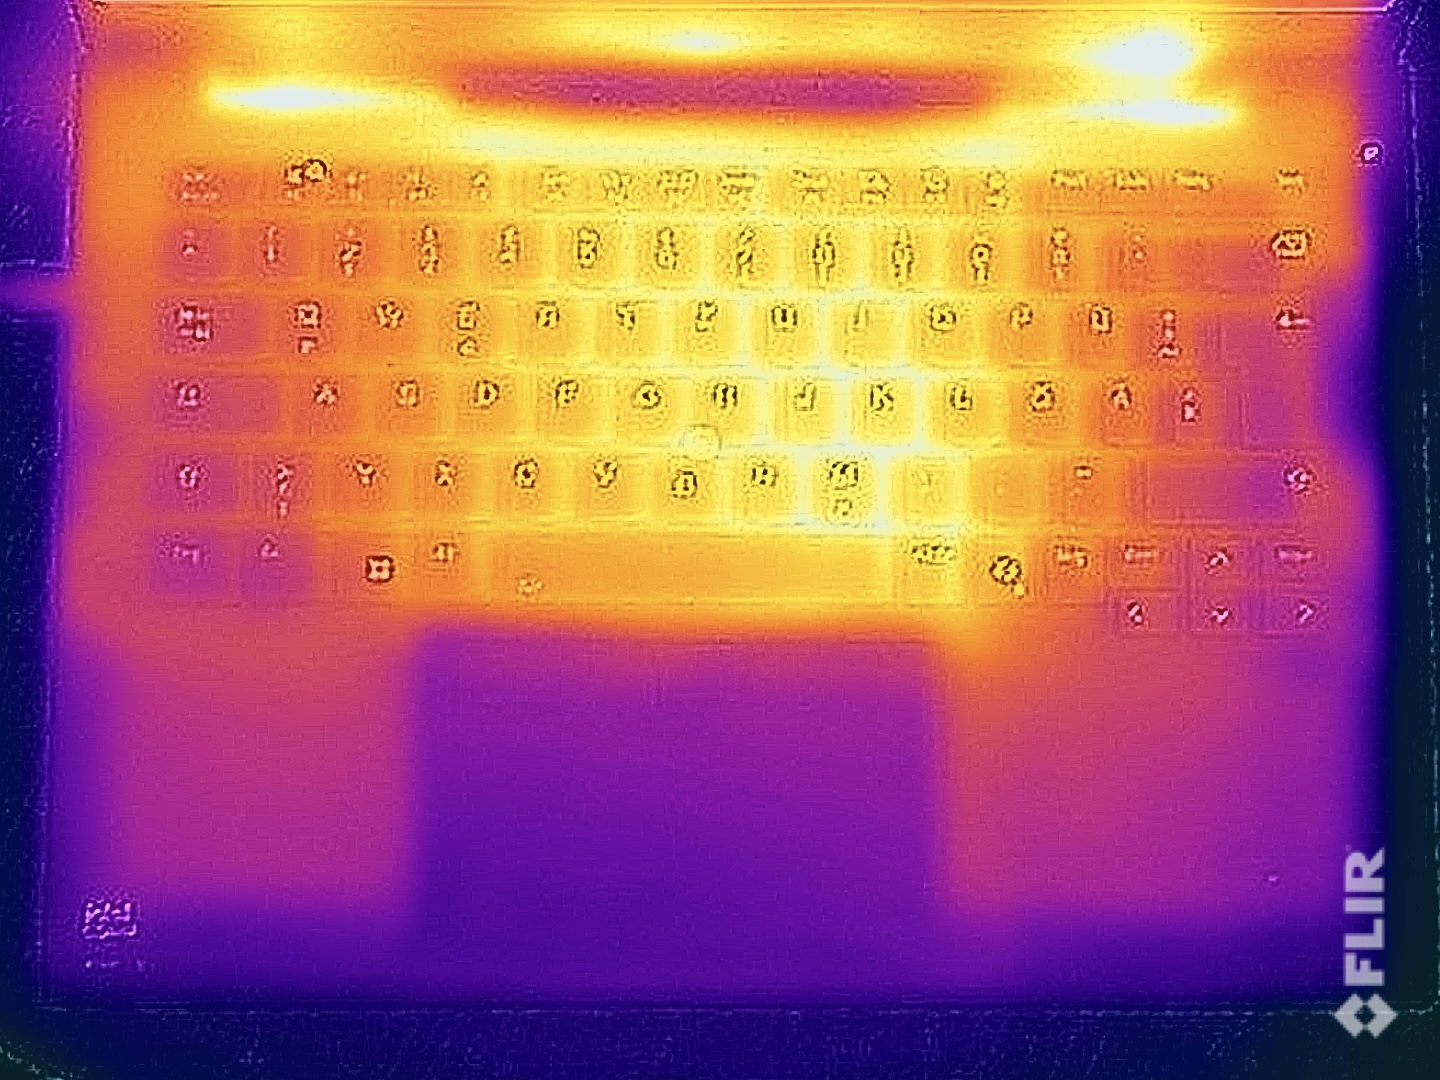
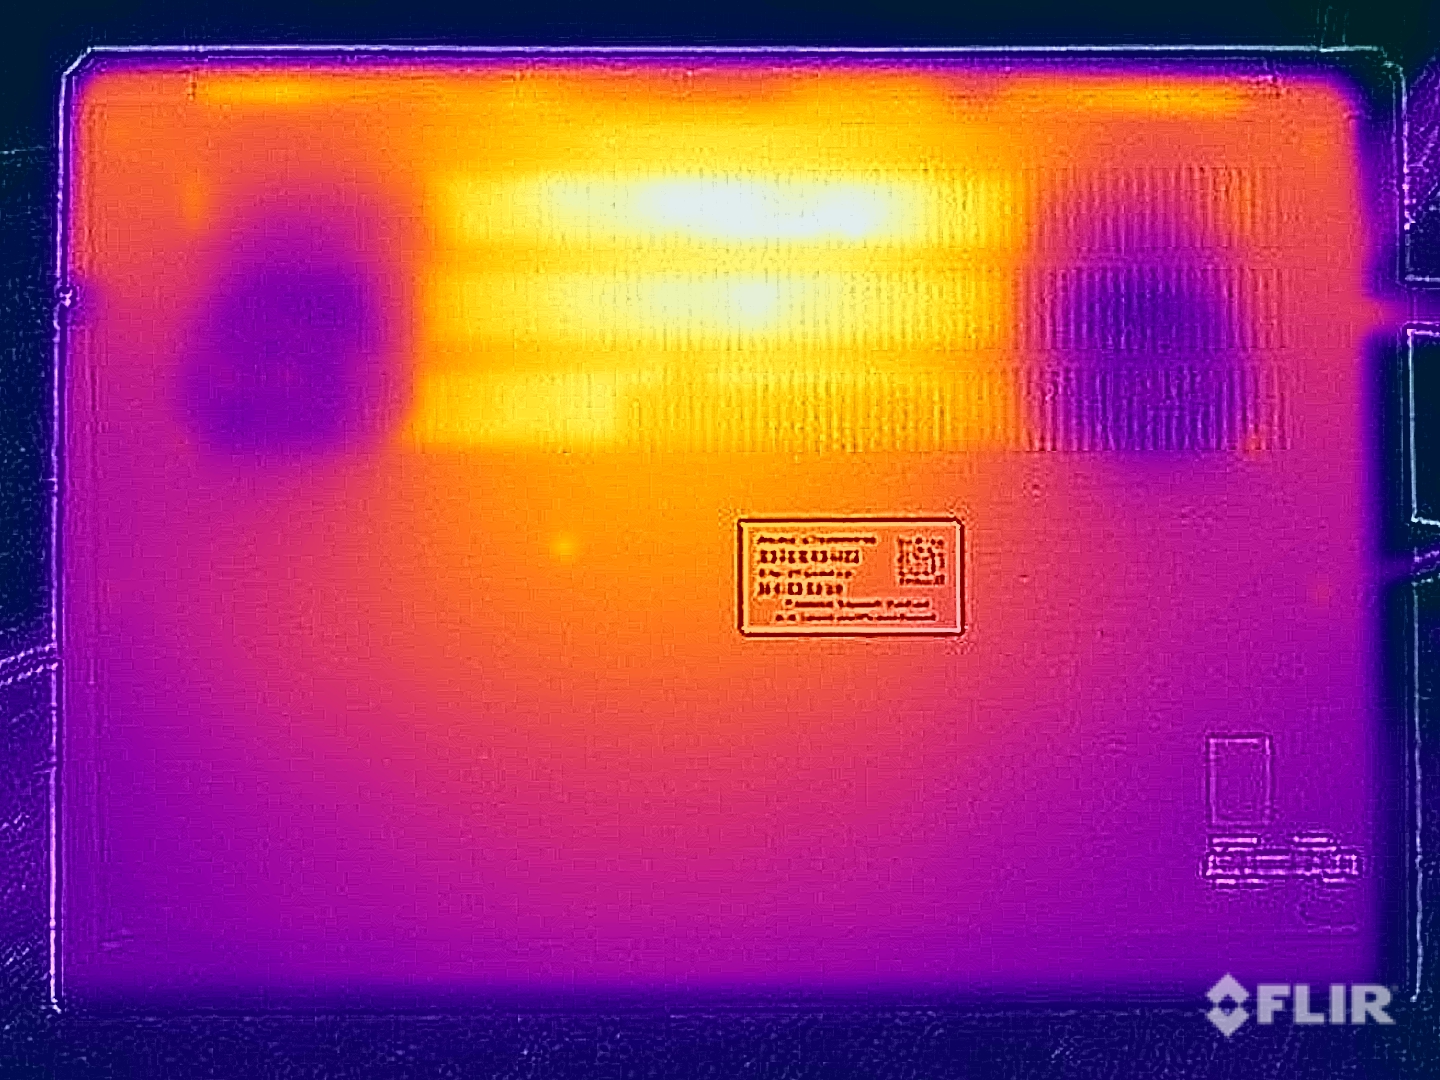
空闲时,ThinkPad P14s G5 表面的某些部分温度已达到 30 °C,因此该设备的被动散热能力似乎并不理想。在负载情况下,我们注意到底部中后部区域有一个约 47 ℃ 的热点,但这一数值并不重要。即便如此,你还是不应该把笔记本放在大腿上。键盘区域也会明显发热--我们测得的峰值为 41 °C,但在使用过程中不会造成任何限制。
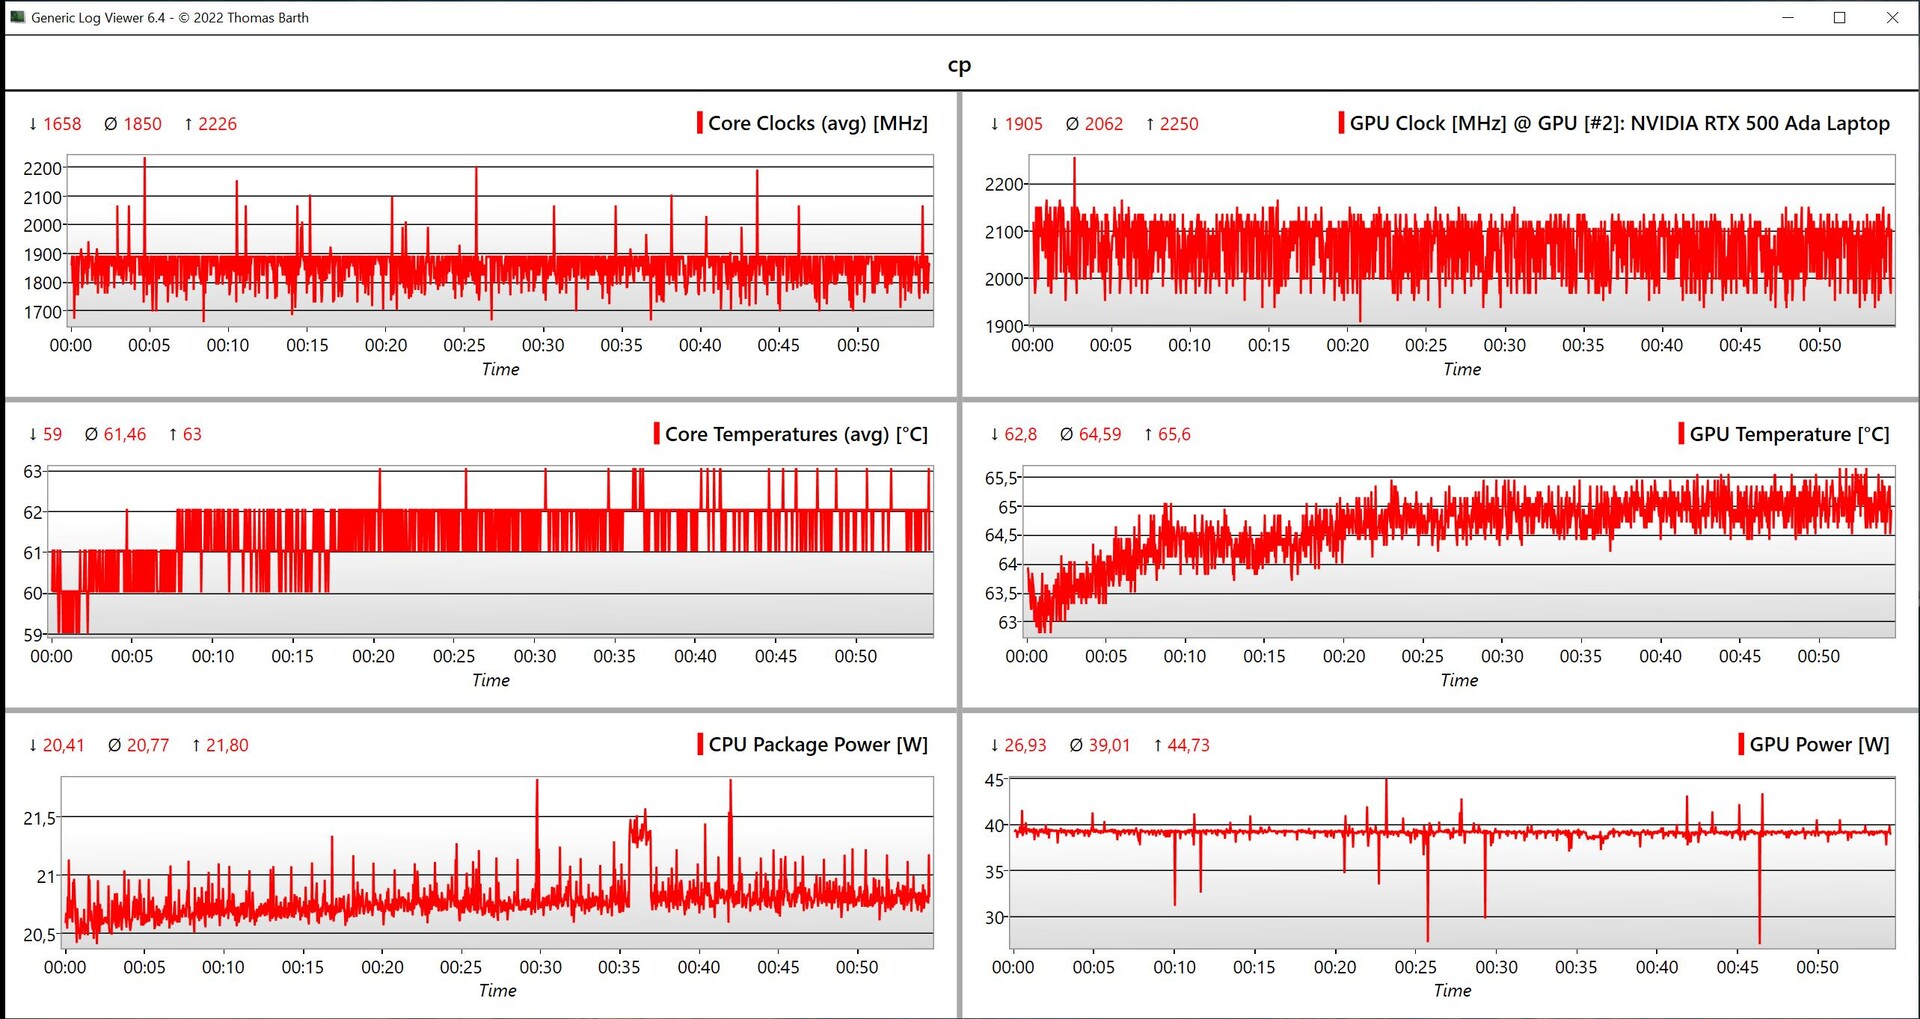
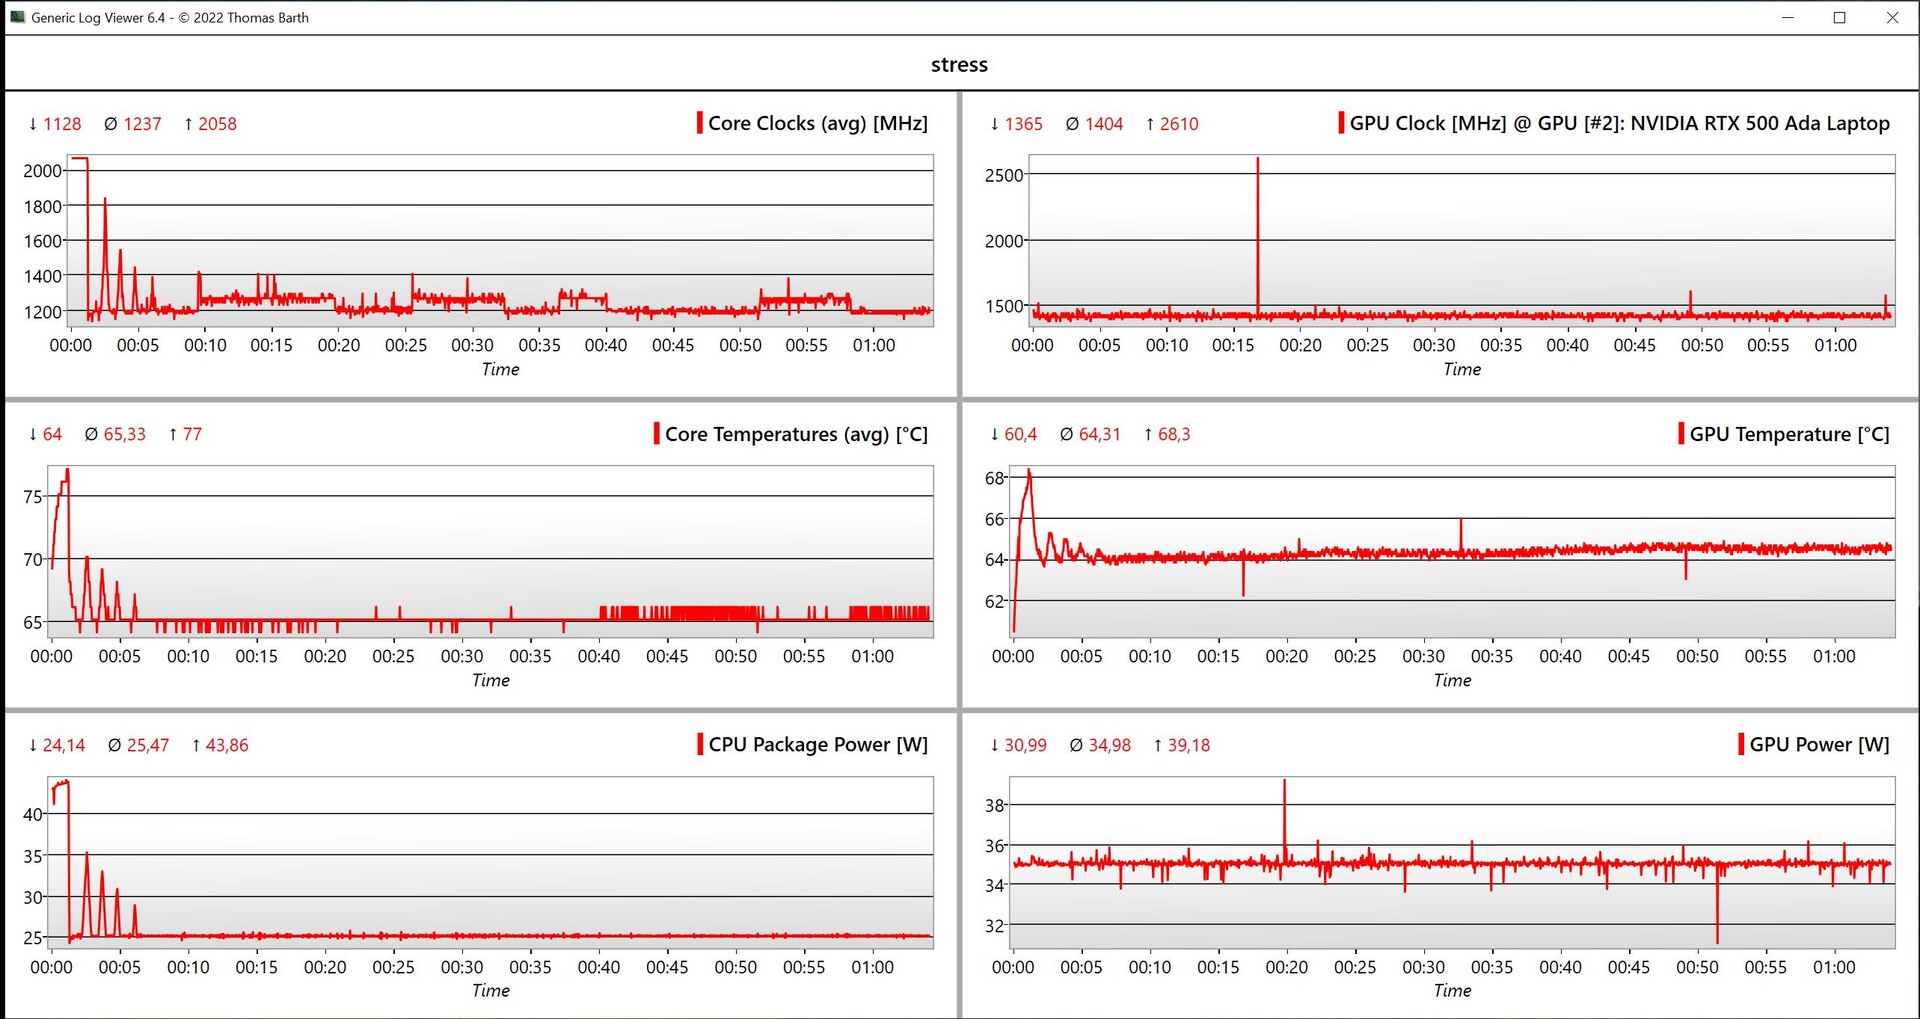
在综合 CPU/GPU 负载的压力测试中,显卡成为系统的首选,持续以 35 瓦的功率运行,而处理器则很快稳定在 25 瓦的功率。总的来说,系统可以永久冷却 60 瓦。
(±) The maximum temperature on the upper side is 41.3 °C / 106 F, compared to the average of 38.2 °C / 101 F, ranging from 22.2 to 69.8 °C for the class Workstation.
(-) The bottom heats up to a maximum of 47 °C / 117 F, compared to the average of 41.2 °C / 106 F
(+) In idle usage, the average temperature for the upper side is 29.1 °C / 84 F, compared to the device average of 32 °C / 90 F.
(±) 3: The average temperature for the upper side is 36.3 °C / 97 F, compared to the average of 32 °C / 90 F for the class Workstation.
(+) The palmrests and touchpad are cooler than skin temperature with a maximum of 30.2 °C / 86.4 F and are therefore cool to the touch.
(-) The average temperature of the palmrest area of similar devices was 27.8 °C / 82 F (-2.4 °C / -4.4 F).
| Lenovo ThinkPad P14s G5 21G3S00A00 Intel Core Ultra 7 155H, Nvidia RTX 500 Ada Generation Laptop GPU | HP ZBook Firefly 14 G11 Intel Core Ultra 7 165H, NVIDIA RTX A500 Laptop GPU | Dell Precision 5000 5490 Intel Core Ultra 9 185H, NVIDIA RTX 3000 Ada Generation Laptop GPU | Lenovo ThinkPad P14s G4 21HF0017GE Intel Core i7-1370P, NVIDIA RTX A500 Laptop GPU | Microsoft Surface Laptop Studio 2 RTX 4060 Intel Core i7-13700H, NVIDIA GeForce RTX 4060 Laptop GPU | Lenovo Yoga Pro 9-14IRP G8 Intel Core i7-13705H, NVIDIA GeForce RTX 4050 Laptop GPU | |
|---|---|---|---|---|---|---|
| Heat | 2% | 4% | -8% | 11% | 0% | |
| Maximum Upper Side * | 41.3 | 42.8 -4% | 43.2 -5% | 55.3 -34% | 40.4 2% | 41 1% |
| Maximum Bottom * | 47 | 44 6% | 38.4 18% | 48.7 -4% | 42.2 10% | 56.7 -21% |
| Idle Upper Side * | 30.2 | 30.6 -1% | 31.6 -5% | 31 -3% | 26.6 12% | 27.4 9% |
| Idle Bottom * | 33.2 | 31.4 5% | 30.6 8% | 29.9 10% | 27 19% | 29.1 12% |
* ... smaller is better
发言人
两个立体声扬声器位于底座的前缘下方,向下发射声音,声音最好能从坚硬的表面反射给用户。在我们的分析过程中,这些模块表现出色,不仅因为它们的音量大,还因为高音和中音听起来非常平衡。这也有利于人声。只有低音听起来有点弱,这就是为什么音乐或电影听起来没有那么震撼的原因。
Lenovo ThinkPad P14s G5 21G3S00A00 audio analysis
(+) | speakers can play relatively loud (87 dB)
Bass 100 - 315 Hz
(-) | nearly no bass - on average 18.8% lower than median
(±) | linearity of bass is average (8.3% delta to prev. frequency)
Mids 400 - 2000 Hz
(+) | balanced mids - only 2.7% away from median
(+) | mids are linear (2.8% delta to prev. frequency)
Highs 2 - 16 kHz
(+) | balanced highs - only 2.4% away from median
(+) | highs are linear (3.5% delta to prev. frequency)
Overall 100 - 16.000 Hz
(+) | overall sound is linear (12.2% difference to median)
Compared to same class
» 14% of all tested devices in this class were better, 3% similar, 83% worse
» The best had a delta of 7%, average was 18%, worst was 35%
Compared to all devices tested
» 8% of all tested devices were better, 2% similar, 89% worse
» The best had a delta of 4%, average was 24%, worst was 134%
HP ZBook Firefly 14 G11 audio analysis
(+) | speakers can play relatively loud (83.7 dB)
Bass 100 - 315 Hz
(-) | nearly no bass - on average 21.6% lower than median
(±) | linearity of bass is average (10% delta to prev. frequency)
Mids 400 - 2000 Hz
(+) | balanced mids - only 4.5% away from median
(+) | mids are linear (4.3% delta to prev. frequency)
Highs 2 - 16 kHz
(+) | balanced highs - only 3.4% away from median
(+) | highs are linear (3.2% delta to prev. frequency)
Overall 100 - 16.000 Hz
(±) | linearity of overall sound is average (16.2% difference to median)
Compared to same class
» 38% of all tested devices in this class were better, 7% similar, 55% worse
» The best had a delta of 7%, average was 18%, worst was 35%
Compared to all devices tested
» 24% of all tested devices were better, 5% similar, 71% worse
» The best had a delta of 4%, average was 24%, worst was 134%
Lenovo Yoga Pro 9-14IRP G8 audio analysis
(±) | speaker loudness is average but good (81.8 dB)
Bass 100 - 315 Hz
(±) | reduced bass - on average 5.9% lower than median
(±) | linearity of bass is average (7.8% delta to prev. frequency)
Mids 400 - 2000 Hz
(+) | balanced mids - only 2.3% away from median
(+) | mids are linear (3.2% delta to prev. frequency)
Highs 2 - 16 kHz
(+) | balanced highs - only 2.5% away from median
(+) | highs are linear (3.4% delta to prev. frequency)
Overall 100 - 16.000 Hz
(+) | overall sound is linear (7.3% difference to median)
Compared to same class
» 4% of all tested devices in this class were better, 1% similar, 95% worse
» The best had a delta of 5%, average was 18%, worst was 45%
Compared to all devices tested
» 1% of all tested devices were better, 0% similar, 99% worse
» The best had a delta of 4%, average was 24%, worst was 134%
电源管理 - 3K 面板需要大量电源
耗电量
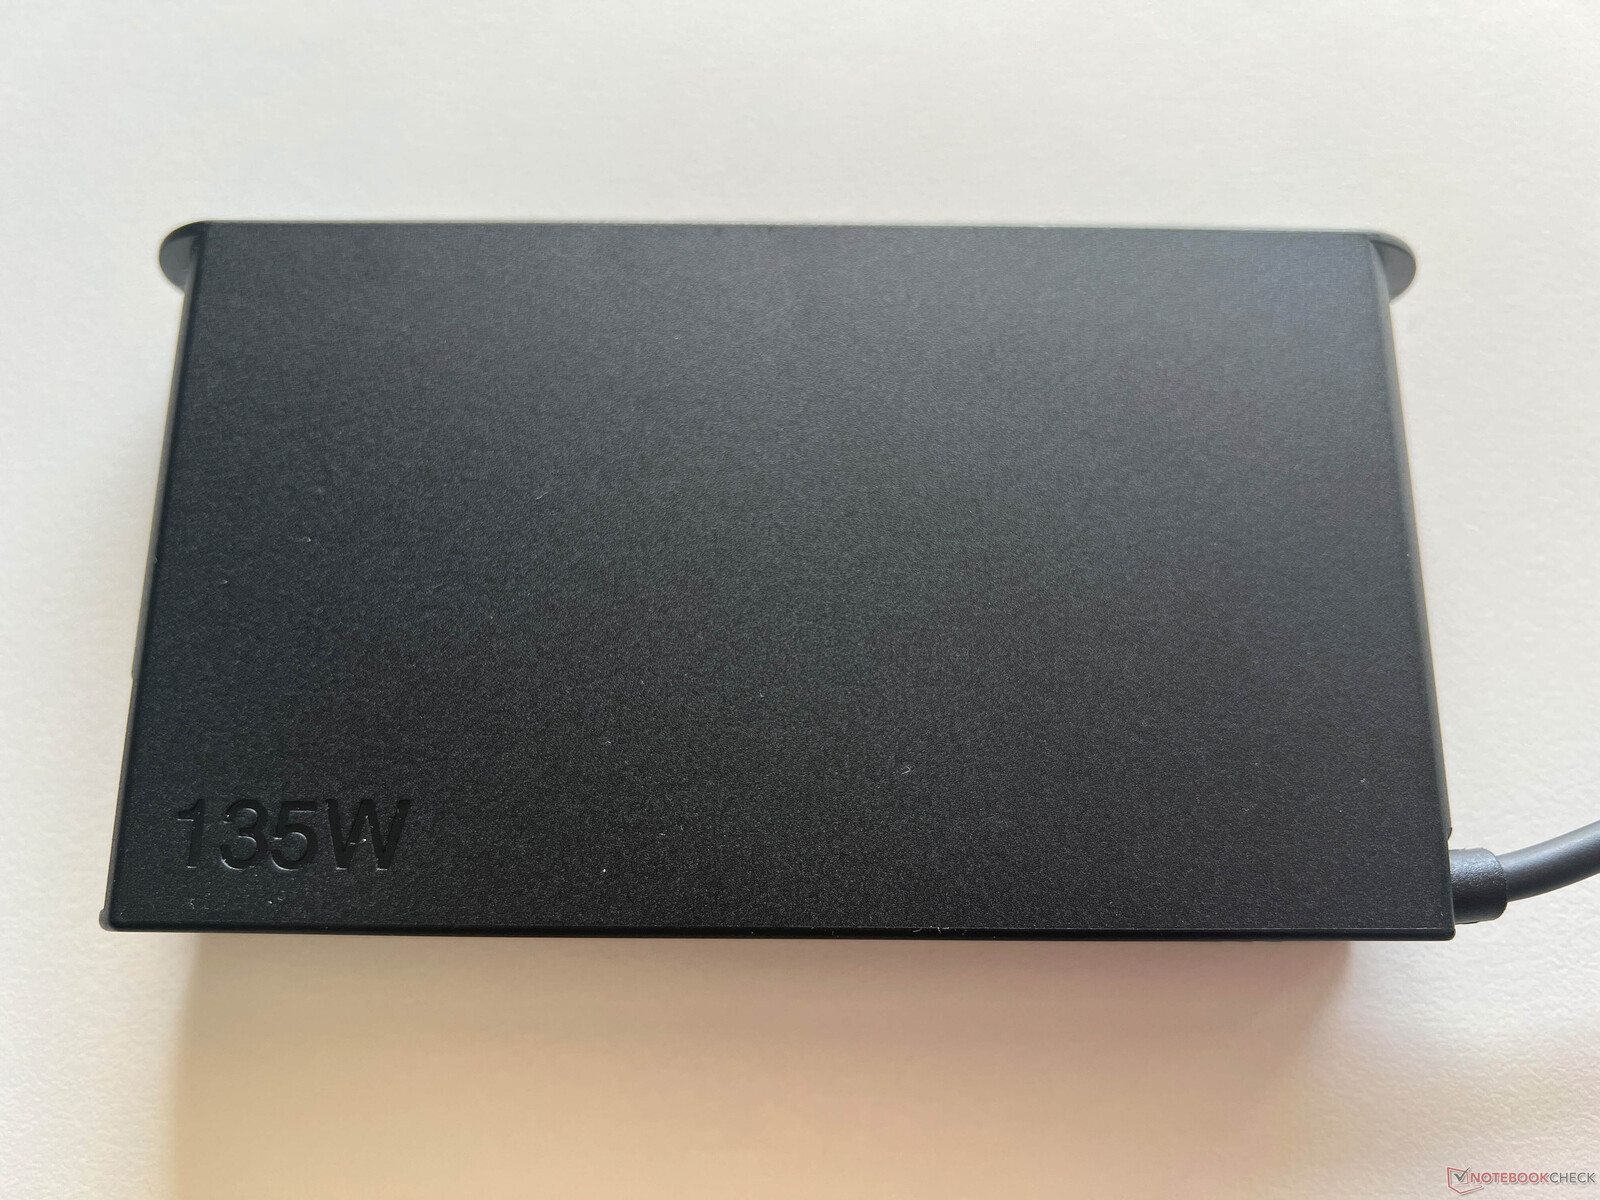
我们的耗电量测量结果清楚地表明,新的 3K 面板需要大量电能。尽管最大亮度较低,但该笔记本电脑的最大闲置功耗却高于 ZBook Firefly 14 G11为例。在玩游戏时,设备需要 80-90 瓦的功率,而在压力测试中,我们看到几秒钟内的功率为 137 瓦。不过,这一数值很快稳定在 90 瓦,并保持在这一水平。因此,135 瓦的电源规模已经足够。没有 RTX 500 Ada 的配置配备了较弱的 100 瓦电源装置。
| Off / Standby | |
| Idle | |
| Load |
|
Key:
min: | |
| Lenovo ThinkPad P14s G5 21G3S00A00 Ultra 7 155H, Nvidia RTX 500 Ada Generation Laptop GPU, Lenovo UMIS AM630 RPETJ1T24MGE2QDQ, IPS, 3072x1920, 14.5" | HP ZBook Firefly 14 G11 Ultra 7 165H, RTX A500 Laptop GPU, Kioxia XG8 KXG80ZNV512G, IPS, 2560x1600, 14" | Dell Precision 5000 5490 Ultra 9 185H, NVIDIA RTX 3000 Ada Generation Laptop GPU, Kioxia XG8 KXG80ZNV1T02, IPS, 2560x1600, 14" | Lenovo ThinkPad P14s G4 21HF0017GE i7-1370P, RTX A500 Laptop GPU, SK Hynix HFS002TEJ9X162N, OLED, 2880x1800, 14" | Microsoft Surface Laptop Studio 2 RTX 4060 i7-13700H, NVIDIA GeForce RTX 4060 Laptop GPU, Kioxia XG8 KXG80ZNV1T02, IPS, 2400x1600, 14.4" | Lenovo Yoga Pro 9-14IRP G8 i7-13705H, NVIDIA GeForce RTX 4050 Laptop GPU, Samsung PM9A1 MZVL21T0HCLR, Mini-LED, 3072x1920, 14.5" | Average Nvidia RTX 500 Ada Generation Laptop GPU | Average of class Workstation | |
|---|---|---|---|---|---|---|---|---|
| Power Consumption | 21% | -9% | 30% | 37% | -23% | 0% | -6% | |
| Idle Minimum * | 7.5 | 6.6 12% | 11.1 -48% | 6.3 16% | 3 60% | 10.9 -45% | 7.5 ? -0% | 8.43 ? -12% |
| Idle Average * | 13.5 | 12.7 6% | 14.8 -10% | 7 48% | 7.1 47% | 17.7 -31% | 13.5 ? -0% | 12.4 ? 8% |
| Idle Maximum * | 14.2 | 13.3 6% | 16.5 -16% | 8.1 43% | 7.6 46% | 19.3 -36% | 14.2 ? -0% | 17.8 ? -25% |
| Load Average * | 100.2 | 67 33% | 70.1 30% | 84.6 16% | 73.1 27% | 93.3 7% | 100.2 ? -0% | 88.4 ? 12% |
| Cyberpunk 2077 ultra * | 86.7 | 63.4 27% | ||||||
| Cyberpunk 2077 ultra external monitor * | 84.6 | 58.1 31% | ||||||
| Load Maximum * | 137.4 | 94.9 31% | 137.5 -0% | 98.3 28% | 128.5 6% | 150.2 -9% | 137.4 ? -0% | 154.1 ? -12% |
| Witcher 3 ultra * | 93.1 | 56.5 | 113.9 | 129.5 |
* ... smaller is better
Power consumption Cyberpunk / stress test
Power consumption with external monitor
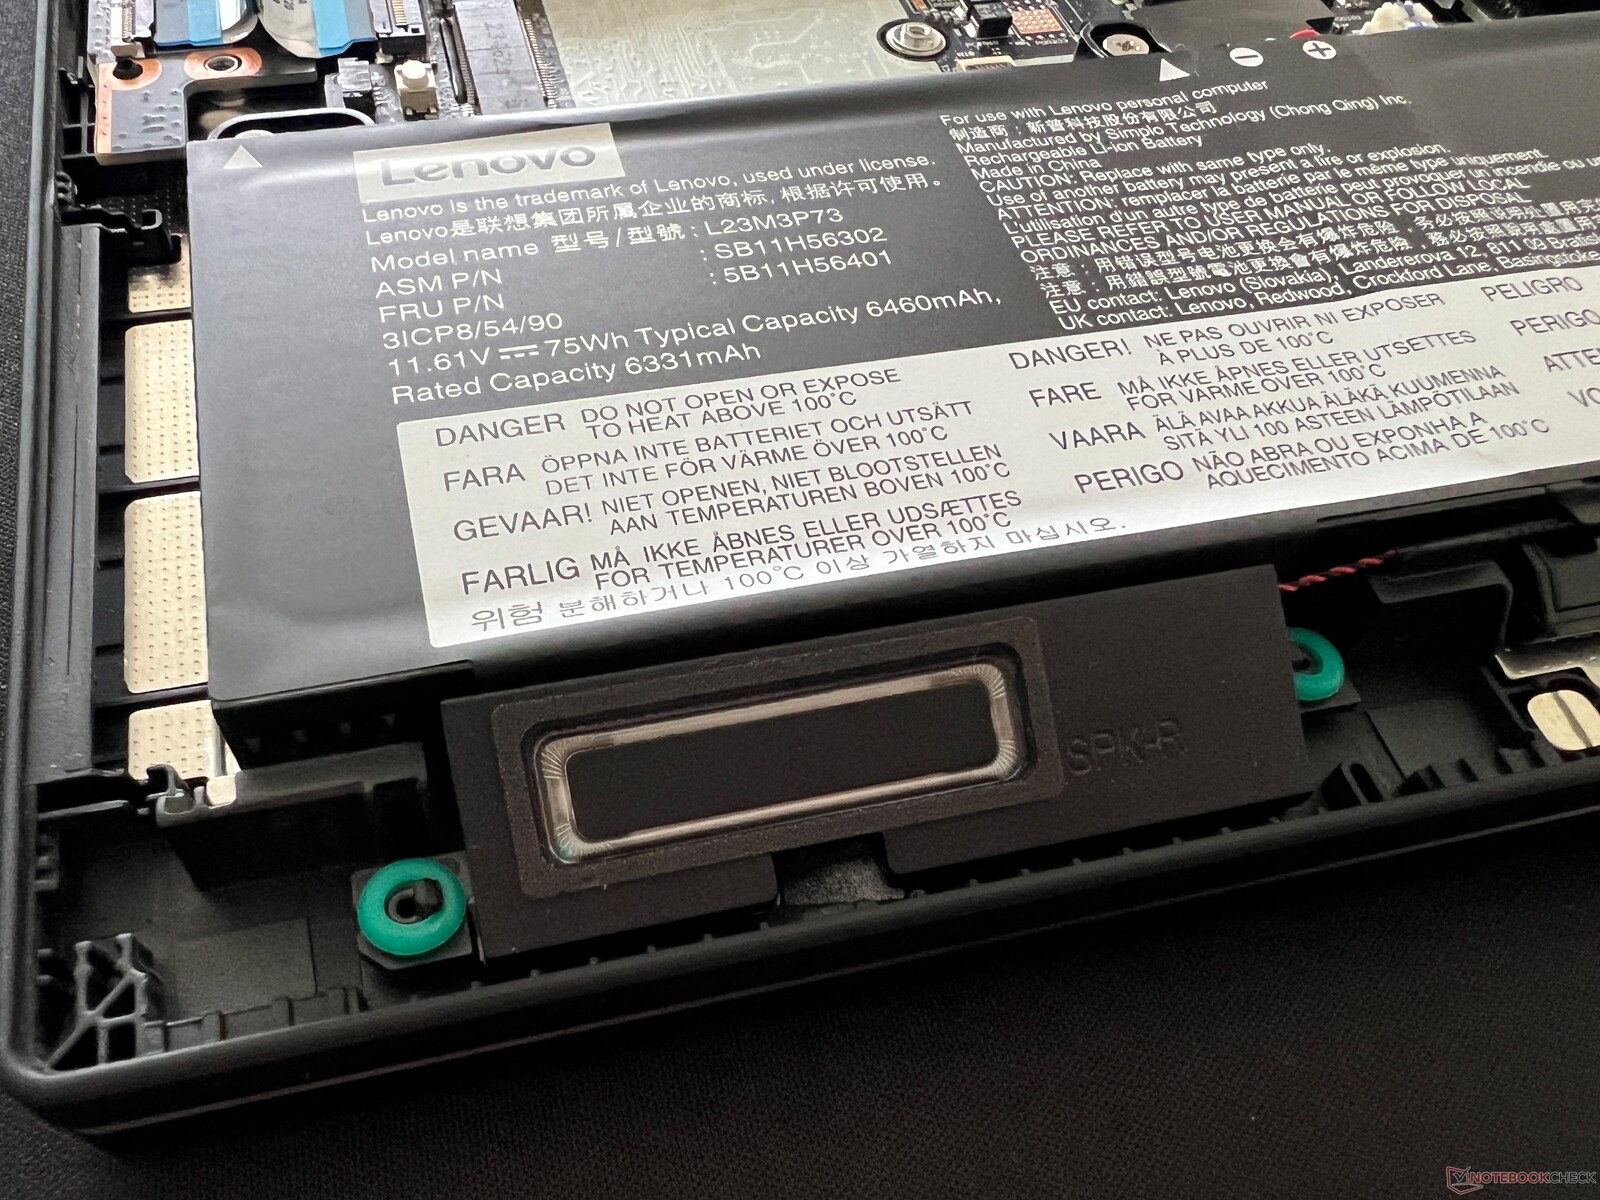
运行时间
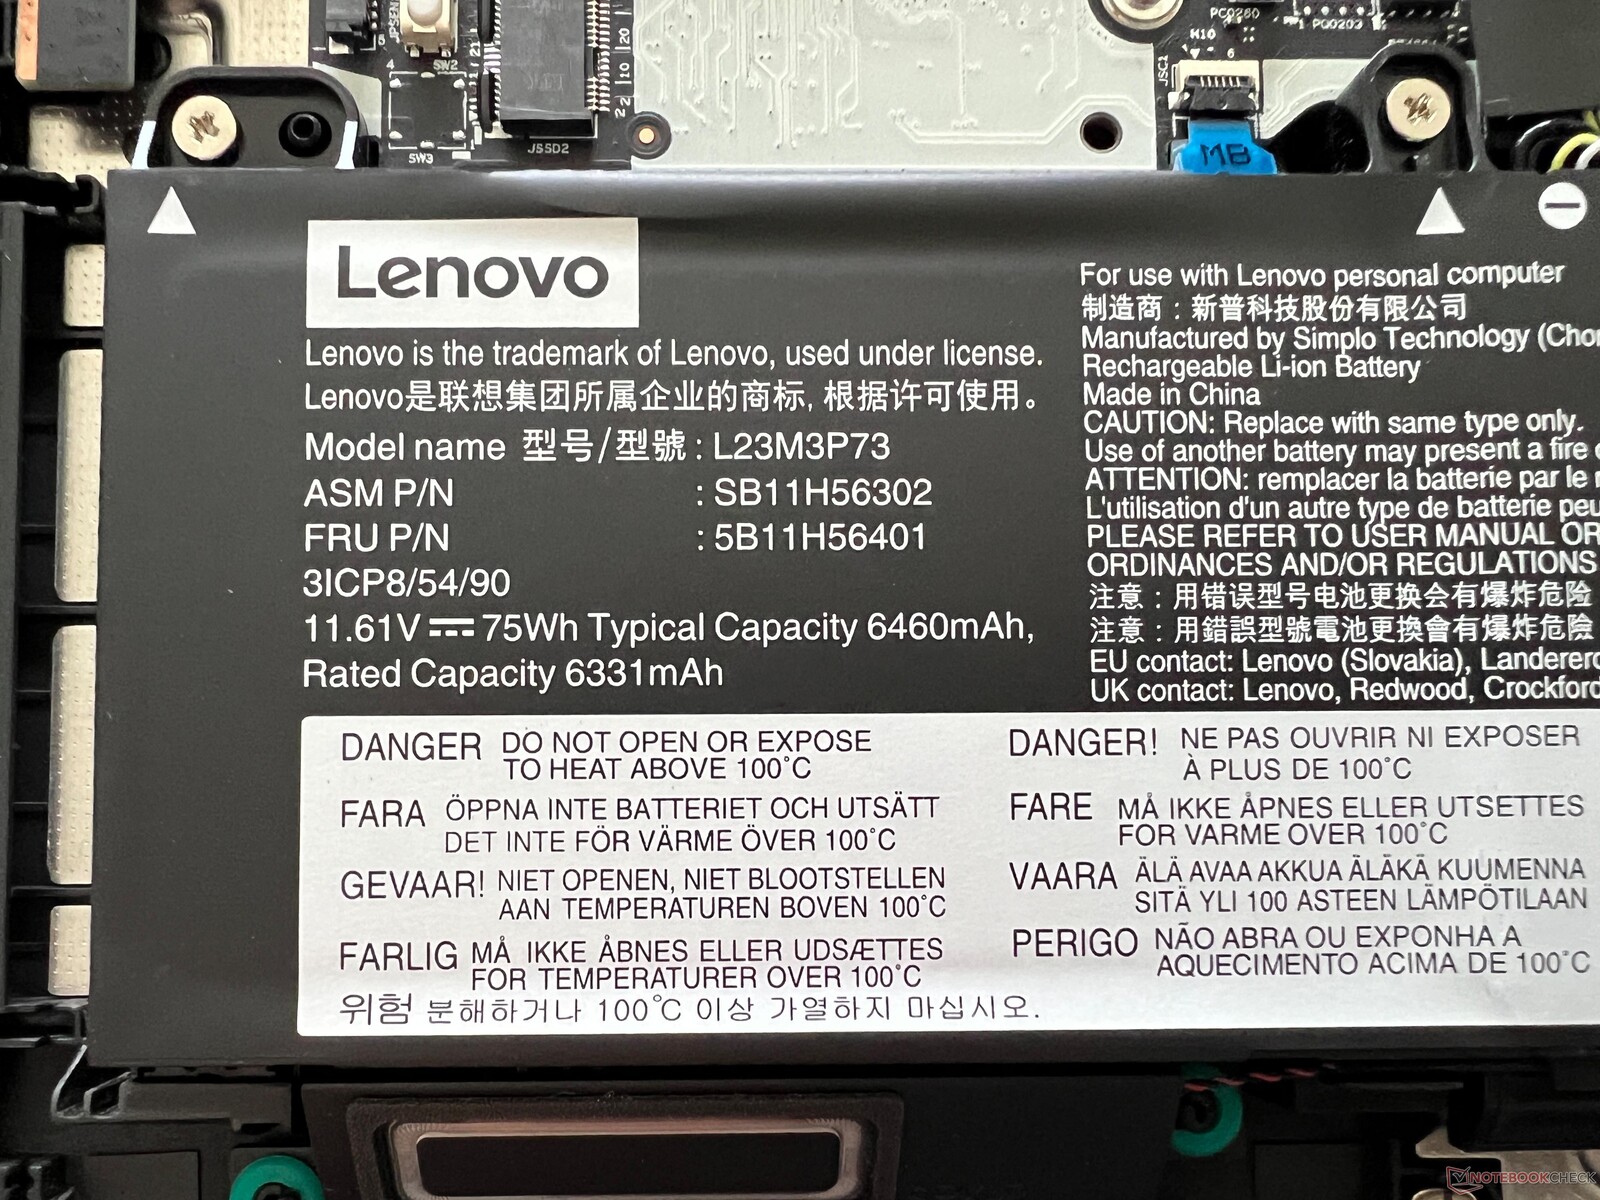
新款英特尔 ThinkPad P14s G5 有两种不同规格的电池(57 或 75 Wh)。我们的测试设备配备的是较大的 75 Wh 电池,因为它采用了 3K 面板,所以需要 75 Wh 电池来获得不错的运行时间。顺便提一下,它的刷新率目前无法更改,因为活动信号模式始终保持在 120 Hz;联想可以通过更新来改进这一点。在 120 Hz 下,它的效果只能算一般。在 150 cd/m²(相当于我们测试设备最大亮度的 66%)的 WLAN 测试中,我们注意到它的续航时间不到 8 小时,仅次于旧的 P14s G4的 52.5 Wh 电池所不及。在全亮度状态下,无线局域网测试仅持续了 5:43 小时。在视频测试中,它只持续了不到 9 个小时,而在负载情况下,电池在 80 分钟左右就耗尽了。
使用 135 瓦的电源为设备充满电需要 128 分钟,75 分钟后可恢复 80% 的电量。
| Lenovo ThinkPad P14s G5 21G3S00A00 Ultra 7 155H, Nvidia RTX 500 Ada Generation Laptop GPU, 75 Wh | HP ZBook Firefly 14 G11 Ultra 7 165H, RTX A500 Laptop GPU, 56 Wh | Dell Precision 5000 5490 Ultra 9 185H, NVIDIA RTX 3000 Ada Generation Laptop GPU, 72 Wh | Lenovo ThinkPad P14s G4 21HF0017GE i7-1370P, RTX A500 Laptop GPU, 52.5 Wh | Microsoft Surface Laptop Studio 2 RTX 4060 i7-13700H, NVIDIA GeForce RTX 4060 Laptop GPU, 58 Wh | Lenovo Yoga Pro 9-14IRP G8 i7-13705H, NVIDIA GeForce RTX 4050 Laptop GPU, 75 Wh | Average of class Workstation | |
|---|---|---|---|---|---|---|---|
| Battery Runtime | 9% | 39% | -23% | 33% | -2% | 14% | |
| H.264 | 534 | 675 26% | 547 2% | 733 ? 37% | |||
| WiFi v1.3 | 473 | 517 9% | 658 39% | 367 -22% | 498 5% | 477 1% | 502 ? 6% |
| Load | 78 | 59 -24% | 132 69% | 72 -8% | 77.4 ? -1% |
Pros
Cons
结论:ThinkPad P14s G5 现在配备了更快的图形处理器


在测试开始时,我们曾提出过这样一个问题:这款笔记本电脑的发展方向是否又正确了?新款 ThinkPad P14s G5(英特尔)显示出了巨大的潜力--不使用最薄机箱的决定、从可选的 OLED 面板转为无 PWM 的哑光 IPS 屏幕以及可升级的内存,这些都让移动工作站受益匪浅。然而,在我们看来,这些措施还远远不够。尽管组件的性能总体上还不错,但你不得不质疑为什么制造商不提供速度更快的 RTX 1000 Ada,例如,考虑到笔记本电脑厚重的外壳,或者为什么即使是可选的 3K 分辨率 IPS 面板在亮度方面仍然落后于竞争对手。最后,联想在 Yoga Pro 9 14 中使用了更强大的组件和更明亮的微型 LED 面板。 Yoga Pro 9 14-所有这一切都体现在更薄的机身内。
新的 IPS 显示屏本身具有 3K 分辨率和 P3 覆盖范围,是一款相当不错的面板,但联想应该为用户提供 sRGB 配置文件。显示器 RTX 500 Ada的图形性能比旧款 RTX A500 笔记本电脑好很多,其流星湖处理器也没有让人失望,不过在压力测试中,笔记本电脑的散热达到了极限。鉴于其厚重的底座,60 瓦(CPU/GPU 组合)的最大散热能力并不十分出色,尤其是与功能强大的 14 英寸多媒体笔记本电脑相比。至于键盘,Fn 键的新位置对于 ThinkPad 的老用户来说肯定需要适应一下,但键盘本身的质量并没有改变。因此,键盘是不错,但没有什么特别之处。我们不得不再次问自己,为什么不能在如此厚重的底座上安装 1.8 毫米的键盘呢?
英特尔版的 ThinkPad P14s G5 提供了很好的维护选项以及新的 14.5 英寸显示屏。它的性能也比上一代产品更好一些,但尽管底座很厚,这款移动工作站最多只能购买 Nvidia 的入门级 GPU,即 RTX 500 Ada。
ThinkPad P14s 还具有其他优势,如良好的维护选项,包括两个内存插槽,最多可容纳 96 GB 内存。它有足够多的端口,500 万像素的网络摄像头也表现不俗。在性能方面,它也明显优于其直接竞争对手--惠普 ZBook Firefly 14 G。 惠普 ZBook 萤火虫 14 G11.不过,如果你不依赖于 ISV 认证,现在的多媒体设备,尤其是显卡,可以提供更高的性能。英特尔和 AMD 机型之间的巨大差异也不利于客户。
价格和供应情况
ThinkPad P14s G5 可通过联想在线商店进行配置,价格从2,439 美元起。
请注意:我们最近更新了评级系统,第 8 版的结果无法与第 7 版的结果进行比较。更多信息 请点击此处.
Lenovo ThinkPad P14s G5 21G3S00A00
- 07/18/2024 v8
Andreas Osthoff
 Total Sustainability Score:
 Transparency
The selection of devices to be reviewed is made by our editorial team. The test sample was provided to the author as a loan by the manufacturer or retailer for the purpose of this review. The lender had no influence on this review, nor did the manufacturer receive a copy of this review before publication. There was no obligation to publish this review. We never accept compensation or payment in return for our reviews. As an independent media company, Notebookcheck is not subjected to the authority of manufacturers, retailers or publishers.
This is how Notebookcheck is testing
Every year, Notebookcheck independently reviews hundreds of laptops and smartphones using standardized procedures to ensure that all results are comparable. We have continuously developed our test methods for around 20 years and set industry standards in the process. In our test labs, high-quality measuring equipment is utilized by experienced technicians and editors. These tests involve a multi-stage validation process. Our complex rating system is based on hundreds of well-founded measurements and benchmarks, which maintains objectivity. Further information on our test methods can be found here.
Price comparison

