


结论 - 涵盖所有基本内容
作为一款经济实惠的中端次笔记本电脑,戴尔 14 Plus 并没有提供太多花哨的功能或闪亮夺目的设计。取而代之的是,它专注于具有预算意识的用户所关心的核心功能,包括现代化的 CPU、具有全 sRGB 色彩的高分辨率 IPS 显示屏,以及便于携带的相对轻薄的机身。与上一代机型相比,该机电池续航时间更长、效率更高,这都是处理器本身的功劳。
不足之处包括集成 GPU 性能不佳、黑白响应时间一般以及磨砂面板有些颗粒感。因此,该系统在游戏方面的表现并不理想,但即便如此,它仍然比使用 Iris Xe 图形处理器的前代产品要好得多。缺少触摸屏选项也可能会让一些用户失望。
Pros
Cons
戴尔 14 Plus 是继去年的 Inspiron 14 Plus 7440系列的一款经济实惠的中端产品,专为家庭多媒体或学生设计。正如我们下面的评测所示,它与 Inspiron 分享了主要的设计特性。
我们的测试机是低端配置,配备酷睿至尊 7 256V CPU 和 16GB 内存,售价约为 1100 美元。高端配置则采用酷睿至尊 7 258V 或酷睿至尊 9 288V,内存为原来的两倍,但目前所有配置的 2.5K 90 Hz 显示屏保持不变。
戴尔 14 Plus 的替代产品包括其他 14 英寸消费类便携式电脑,如 联想 IdeaPad Pro 5 14或 惠普Pavilion Plus 14.
更多戴尔评论:
规格
案例
该机箱与 Inspiron 14 Plus 7440 在材料、配色甚至尺寸方面都有很多共同之处。也许最显著的区别在于铰链,因为新款机型的盖子可以完全打开 180 度,而去年的机型最多只能打开约 150 度。此外,后通风栅和外盖上的徽标也略有不同。除此之外,尽管去掉了 Inspiron 的名称,但这款产品给人的感觉仍然是 Inspiron。

连接性
端口选项还不错,有两个 USB-C 端口和一个 USB-A 端口。旧款 Inspiron 机型上的桶状交流适配器端口已被取消,完全支持 USB-C 充电。
需要注意的是,两个 USB-C 端口中只有一个支持 Thunderbolt 4 和 DisplayPort 2.1。


交流
| Networking | |
| iperf3 transmit AX12 | |
| Dell Inspiron 14 5425 6VPKR | |
| iperf3 receive AX12 | |
| Dell Inspiron 14 5425 6VPKR | |
| iperf3 transmit AXE11000 | |
| Lenovo IdeaPad Pro 5 14AKP G10 | |
| HP Pavilion Plus 14-ew0153TU | |
| Dell 14 Plus | |
| Dell Latitude 3440 | |
| Lenovo ThinkPad E14 G6 | |
| iperf3 receive AXE11000 | |
| Lenovo IdeaPad Pro 5 14AKP G10 | |
| HP Pavilion Plus 14-ew0153TU | |
| Dell 14 Plus | |
| Dell Latitude 3440 | |
| Lenovo ThinkPad E14 G6 | |
| iperf3 transmit AXE11000 6GHz | |
| HP Pavilion Plus 14-ew0153TU | |
| Dell 14 Plus | |
| Dell Latitude 3440 | |
| iperf3 receive AXE11000 6GHz | |
| HP Pavilion Plus 14-ew0153TU | |
| Dell 14 Plus | |
| Dell Latitude 3440 | |
网络摄像头
标配 200 万像素网络摄像头以及红外和物理快门。


维护
主板与 Inspiron 14 Plus 7440 几乎完全相同,只是在散热解决方案上略有改动。

可持续性
顶盖由 50% 的回收铝制成,风扇外壳由 25% 的回收海洋塑料制成。掌托支架由 15% 的回收钢材制成。
包装不使用塑料,便于回收。
配件和保修
零售包装盒包括一个小巧的(约 11.1 x 5 x 2.8 厘米)65 W USB-C 交流适配器和常见的文件。如果在美国购买,制造商提供一年有限保修。
输入设备
键盘
键盘的反馈、字体甚至辅助功能都与去年的 Inspiron 14 Plus 7440 基本相同。唯一的视觉差异是专用的副驾驶键取代了右侧的 Ctrl 键。
触摸板
点击板的尺寸与去年的 Inspiron 14 Plus 7440 完全相同,为 12.5 x 8 厘米。光标控制宽敞可靠,但按下表面时的反馈太弱太浅。

显示屏
1600p 显示屏提供完整的 sRGB 色彩、IPS 面板的高对比度以及 90 Hz 的刷新率,优于大多数经济型笔记本电脑的显示屏。需要注意的主要问题是黑白响应时间相对较慢,磨砂覆盖层略显粗糙。不过,对于浏览和视频播放而言,这些缺点对观看体验的影响应该很小。


| |||||||||||||||||||||||||
Brightness Distribution: 92 %
Center on Battery: 354 cd/m²
Contrast: 1686:1 (Black: 0.21 cd/m²)
ΔE Color 1.94 | 0.5-29.43 Ø4.85, calibrated: 0.7
ΔE Greyscale 1.4 | 0.09-98 Ø5.1
71.9% AdobeRGB 1998 (Argyll 2.2.0 3D)
99.9% sRGB (Argyll 2.2.0 3D)
71.7% Display P3 (Argyll 2.2.0 3D)
Gamma: 2.25
| Dell 14 Plus BOE NE14N42, IPS, 2560x1600, 14", 90 Hz | Dell Inspiron 14 5425 6VPKR BOE NV14N42, IPS, 1920x1200, 14", 60 Hz | Dell Latitude 3440 BOE NE140FH, IPS, 1920x1080, 14", 60 Hz | Lenovo IdeaPad Pro 5 14AKP G10 LEN140WQ+, OLED, 2880x1800, 14", 120 Hz | Lenovo ThinkPad E14 G6 AU Optronics B140UAN03.2, IPS, 1920x1200, 14", 60 Hz | HP Pavilion Plus 14-ew0153TU Samsung SDC4197, OLED, 2880x1800, 14", 120 Hz | |
|---|---|---|---|---|---|---|
| Display | -44% | -42% | 23% | -40% | 22% | |
| Display P3 Coverage | 71.7 | 39.2 -45% | 40.4 -44% | 99.9 39% | 41.3 -42% | 97.9 37% |
| sRGB Coverage | 99.9 | 57.4 -43% | 60.7 -39% | 100 0% | 61.8 -38% | 99.6 0% |
| AdobeRGB 1998 Coverage | 71.9 | 40.5 -44% | 41.8 -42% | 94.5 31% | 42.7 -41% | 92.1 28% |
| Response Times | 43% | -1% | 99% | 29% | 69% | |
| Response Time Grey 50% / Grey 80% * | 42.7 ? | 23 ? 46% | 35.3 ? 17% | 0.39 ? 99% | 28.8 ? 33% | 10.8 ? 75% |
| Response Time Black / White * | 25.2 ? | 15 ? 40% | 29.8 ? -18% | 0.49 ? 98% | 19.1 ? 24% | 9.29 ? 63% |
| PWM Frequency | 1200 ? | 120 ? | ||||
| PWM Amplitude * | 22 | |||||
| Screen | -133% | -104% | 17% | -109% | 234% | |
| Brightness middle | 354 | 292 -18% | 292.6 -17% | 473 34% | 369.9 4% | 387 9% |
| Brightness | 333 | 279 -16% | 270 -19% | 474 42% | 361 8% | 387 16% |
| Brightness Distribution | 92 | 90 -2% | 88 -4% | 99 8% | 93 1% | 97 5% |
| Black Level * | 0.21 | 0.34 -62% | 0.19 10% | 0.24 -14% | 0.01 95% | |
| Contrast | 1686 | 859 -49% | 1540 -9% | 1541 -9% | 38700 2195% | |
| Colorchecker dE 2000 * | 1.94 | 6.26 -223% | 4.63 -139% | 1.2 38% | 5.2 -168% | 2.03 -5% |
| Colorchecker dE 2000 max. * | 3.28 | 19.14 -484% | 17.1 -421% | 3.8 -16% | 18.41 -461% | 3.86 -18% |
| Colorchecker dE 2000 calibrated * | 0.7 | 2.13 -204% | 2.04 -191% | 1.6 -129% | ||
| Greyscale dE 2000 * | 1.4 | 4.31 -208% | 3.2 -129% | 1.5 -7% | 3.5 -150% | 2.3 -64% |
| Gamma | 2.25 98% | 2.27 97% | 2.34 94% | 2.27 97% | 2.06 107% | 2.23 99% |
| CCT | 6453 101% | 6102 107% | 7184 90% | 6214 105% | 6204 105% | 6523 100% |
| Total Average (Program / Settings) | -45% /
-85% | -49% /
-76% | 46% /
33% | -40% /
-75% | 108% /
165% |
* ... smaller is better


戴尔 14 Plus 是为数不多的在获得 TUV 认证的同时还经过良好校准的廉价笔记本电脑之一。即使在最终用户尝试校准之前,平均灰度和色彩 DeltaE 值也分别只有 1.4 和 1.89。


Display Response Times
| ↔ Response Time Black to White | ||
|---|---|---|
| 25.2 ms ... rise ↗ and fall ↘ combined | ↗ 12.7 ms rise |  |
| ↘ 12.5 ms fall | ||
| The screen shows relatively slow response rates in our tests and may be too slow for gamers. In comparison, all tested devices range from 0.1 (minimum) to 240 (maximum) ms. » 58 % of all devices are better. This means that the measured response time is worse than the average of all tested devices (20.6 ms). | ||
| ↔ Response Time 50% Grey to 80% Grey | ||
| 42.7 ms ... rise ↗ and fall ↘ combined | ↗ 20.2 ms rise |  |
| ↘ 22.5 ms fall | ||
| The screen shows slow response rates in our tests and will be unsatisfactory for gamers. In comparison, all tested devices range from 0.165 (minimum) to 636 (maximum) ms. » 68 % of all devices are better. This means that the measured response time is worse than the average of all tested devices (32.3 ms). | ||
Screen Flickering / PWM (Pulse-Width Modulation)
| Screen flickering / PWM not detected |  | ||
In comparison: 53 % of all tested devices do not use PWM to dim the display. If PWM was detected, an average of 8429 (minimum: 5 - maximum: 343500) Hz was measured. | |||


性能


测试条件
在运行以下基准测试之前,我们将 Windows 设置为性能模式。
处理器
原始 CPU 性能与较早的 酷睿至尊 7 155U.较新的 Core Ultra 7 256V 的主要优势在于每瓦性能、集成 NPU、更快的内存和改进的集成 GPU。
Turbo Boost 的可持续性可能会更好;如下图所示,在循环运行 CineBench R15 xT 时,性能会随时间下降约 17%。
Cinebench R15 Multi Loop
Cinebench R23: Multi Core | Single Core
Cinebench R20: CPU (Multi Core) | CPU (Single Core)
Cinebench R15: CPU Multi 64Bit | CPU Single 64Bit
Blender: v2.79 BMW27 CPU
7-Zip 18.03: 7z b 4 | 7z b 4 -mmt1
Geekbench 6.4: Multi-Core | Single-Core
Geekbench 5.5: Multi-Core | Single-Core
HWBOT x265 Benchmark v2.2: 4k Preset
LibreOffice : 20 Documents To PDF
R Benchmark 2.5: Overall mean
* ... smaller is better
AIDA64: FP32 Ray-Trace | FPU Julia | CPU SHA3 | CPU Queen | FPU SinJulia | FPU Mandel | CPU AES | CPU ZLib | FP64 Ray-Trace | CPU PhotoWorxx
| Performance Rating | |
| Lenovo IdeaPad Pro 5 14AKP G10 | |
| Average Intel Core Ultra 7 256V | |
| Dell 14 Plus | |
| Lenovo ThinkPad E14 G6 | |
| Dell Inspiron 14 5425 6VPKR | |
| Dell Latitude 3440 | |
| HP Pavilion Plus 14-ew0153TU | |
| AIDA64 / FP32 Ray-Trace | |
| Lenovo IdeaPad Pro 5 14AKP G10 | |
| Dell 14 Plus | |
| Average Intel Core Ultra 7 256V (10524 - 12812, n=6) | |
| Dell Inspiron 14 5425 6VPKR | |
| Lenovo ThinkPad E14 G6 | |
| Dell Latitude 3440 | |
| HP Pavilion Plus 14-ew0153TU | |
| AIDA64 / FPU Julia | |
| Lenovo IdeaPad Pro 5 14AKP G10 | |
| Dell Inspiron 14 5425 6VPKR | |
| Average Intel Core Ultra 7 256V (52443 - 61614, n=6) | |
| Dell 14 Plus | |
| Lenovo ThinkPad E14 G6 | |
| Dell Latitude 3440 | |
| HP Pavilion Plus 14-ew0153TU | |
| AIDA64 / CPU SHA3 | |
| Lenovo IdeaPad Pro 5 14AKP G10 | |
| Average Intel Core Ultra 7 256V (2364 - 2814, n=6) | |
| Lenovo ThinkPad E14 G6 | |
| Dell 14 Plus | |
| Dell Inspiron 14 5425 6VPKR | |
| Dell Latitude 3440 | |
| HP Pavilion Plus 14-ew0153TU | |
| AIDA64 / CPU Queen | |
| Lenovo IdeaPad Pro 5 14AKP G10 | |
| Dell Inspiron 14 5425 6VPKR | |
| Dell Latitude 3440 | |
| HP Pavilion Plus 14-ew0153TU | |
| Dell 14 Plus | |
| Average Intel Core Ultra 7 256V (49622 - 49794, n=6) | |
| Lenovo ThinkPad E14 G6 | |
| AIDA64 / FPU SinJulia | |
| Lenovo IdeaPad Pro 5 14AKP G10 | |
| Dell Inspiron 14 5425 6VPKR | |
| Lenovo ThinkPad E14 G6 | |
| Dell Latitude 3440 | |
| Dell 14 Plus | |
| Average Intel Core Ultra 7 256V (4401 - 4431, n=6) | |
| HP Pavilion Plus 14-ew0153TU | |
| AIDA64 / FPU Mandel | |
| Lenovo IdeaPad Pro 5 14AKP G10 | |
| Dell Inspiron 14 5425 6VPKR | |
| Average Intel Core Ultra 7 256V (27382 - 32644, n=6) | |
| Dell 14 Plus | |
| Lenovo ThinkPad E14 G6 | |
| Dell Latitude 3440 | |
| HP Pavilion Plus 14-ew0153TU | |
| AIDA64 / CPU AES | |
| Lenovo IdeaPad Pro 5 14AKP G10 | |
| Lenovo ThinkPad E14 G6 | |
| Dell 14 Plus | |
| Average Intel Core Ultra 7 256V (38495 - 40828, n=6) | |
| Dell Latitude 3440 | |
| Dell Inspiron 14 5425 6VPKR | |
| HP Pavilion Plus 14-ew0153TU | |
| AIDA64 / CPU ZLib | |
| Lenovo IdeaPad Pro 5 14AKP G10 | |
| Lenovo ThinkPad E14 G6 | |
| Dell 14 Plus | |
| Average Intel Core Ultra 7 256V (536 - 632, n=6) | |
| Dell Latitude 3440 | |
| Dell Inspiron 14 5425 6VPKR | |
| HP Pavilion Plus 14-ew0153TU | |
| AIDA64 / FP64 Ray-Trace | |
| Lenovo IdeaPad Pro 5 14AKP G10 | |
| Average Intel Core Ultra 7 256V (5655 - 6878, n=6) | |
| Dell 14 Plus | |
| Dell Inspiron 14 5425 6VPKR | |
| Lenovo ThinkPad E14 G6 | |
| Dell Latitude 3440 | |
| HP Pavilion Plus 14-ew0153TU | |
| AIDA64 / CPU PhotoWorxx | |
| Dell 14 Plus | |
| Average Intel Core Ultra 7 256V (49906 - 52282, n=6) | |
| Lenovo IdeaPad Pro 5 14AKP G10 | |
| Lenovo ThinkPad E14 G6 | |
| HP Pavilion Plus 14-ew0153TU | |
| Dell Latitude 3440 | |
| Dell Inspiron 14 5425 6VPKR | |
压力测试
在运行 Prime95 压力测试时,CPU 的主频升至 3.4 GHz,功耗为 39 W,大约 30 秒后核心温度达到 80 C。此后,CPU 将稳定在 2.6 GHz、20 W 和 67 C。


| CPU 平均时钟 (GHz) | GPU 时钟 (MHz) | CPU 平均温度 (°C) | |
| 系统闲置 | -- | -- | 38 |
| Prime95 压力 | 2.6 | -- | 67 |
| Prime95 + FurMark Stress | 1.6 | 1250 | 63 |
| 赛博朋克 2077》压力 | 0.8 | 1650 | 62 |
系统性能

PCMark 10: Score | Essentials | Productivity | Digital Content Creation
CrossMark: Overall | Productivity | Creativity | Responsiveness
WebXPRT 3: Overall
WebXPRT 4: Overall
Mozilla Kraken 1.1: Total
| Performance Rating | |
| Lenovo IdeaPad Pro 5 14AKP G10 | |
| Average Intel Core Ultra 7 256V, Intel Arc Graphics 140V | |
| Dell 14 Plus | |
| Lenovo ThinkPad E14 G6 | |
| HP Pavilion Plus 14-ew0153TU | |
| Dell Latitude 3440 | |
| Dell Inspiron 14 5425 6VPKR | |
| PCMark 10 / Score | |
| Lenovo IdeaPad Pro 5 14AKP G10 | |
| Average Intel Core Ultra 7 256V, Intel Arc Graphics 140V (6677 - 7367, n=6) | |
| Dell 14 Plus | |
| Lenovo ThinkPad E14 G6 | |
| Dell Inspiron 14 5425 6VPKR | |
| HP Pavilion Plus 14-ew0153TU | |
| Dell Latitude 3440 | |
| PCMark 10 / Essentials | |
| Lenovo IdeaPad Pro 5 14AKP G10 | |
| Dell Latitude 3440 | |
| Lenovo ThinkPad E14 G6 | |
| Average Intel Core Ultra 7 256V, Intel Arc Graphics 140V (9627 - 11365, n=6) | |
| HP Pavilion Plus 14-ew0153TU | |
| Dell 14 Plus | |
| Dell Inspiron 14 5425 6VPKR | |
| PCMark 10 / Productivity | |
| Lenovo IdeaPad Pro 5 14AKP G10 | |
| Average Intel Core Ultra 7 256V, Intel Arc Graphics 140V (8161 - 9544, n=6) | |
| Dell Inspiron 14 5425 6VPKR | |
| Lenovo ThinkPad E14 G6 | |
| Dell 14 Plus | |
| Dell Latitude 3440 | |
| HP Pavilion Plus 14-ew0153TU | |
| PCMark 10 / Digital Content Creation | |
| Average Intel Core Ultra 7 256V, Intel Arc Graphics 140V (9481 - 10126, n=6) | |
| Dell 14 Plus | |
| Lenovo IdeaPad Pro 5 14AKP G10 | |
| Lenovo ThinkPad E14 G6 | |
| HP Pavilion Plus 14-ew0153TU | |
| Dell Inspiron 14 5425 6VPKR | |
| Dell Latitude 3440 | |
| CrossMark / Overall | |
| Lenovo IdeaPad Pro 5 14AKP G10 | |
| Dell 14 Plus | |
| Average Intel Core Ultra 7 256V, Intel Arc Graphics 140V (1636 - 1736, n=6) | |
| Lenovo ThinkPad E14 G6 | |
| HP Pavilion Plus 14-ew0153TU | |
| Dell Latitude 3440 | |
| Dell Inspiron 14 5425 6VPKR | |
| CrossMark / Productivity | |
| Lenovo IdeaPad Pro 5 14AKP G10 | |
| Dell 14 Plus | |
| Average Intel Core Ultra 7 256V, Intel Arc Graphics 140V (1563 - 1682, n=6) | |
| HP Pavilion Plus 14-ew0153TU | |
| Lenovo ThinkPad E14 G6 | |
| Dell Latitude 3440 | |
| Dell Inspiron 14 5425 6VPKR | |
| CrossMark / Creativity | |
| Lenovo IdeaPad Pro 5 14AKP G10 | |
| Dell 14 Plus | |
| Average Intel Core Ultra 7 256V, Intel Arc Graphics 140V (1862 - 1962, n=6) | |
| Lenovo ThinkPad E14 G6 | |
| HP Pavilion Plus 14-ew0153TU | |
| Dell Latitude 3440 | |
| Dell Inspiron 14 5425 6VPKR | |
| CrossMark / Responsiveness | |
| Lenovo IdeaPad Pro 5 14AKP G10 | |
| Lenovo ThinkPad E14 G6 | |
| HP Pavilion Plus 14-ew0153TU | |
| Average Intel Core Ultra 7 256V, Intel Arc Graphics 140V (1215 - 1343, n=6) | |
| Dell 14 Plus | |
| Dell Latitude 3440 | |
| Dell Inspiron 14 5425 6VPKR | |
| WebXPRT 3 / Overall | |
| Lenovo IdeaPad Pro 5 14AKP G10 | |
| Dell 14 Plus | |
| Average Intel Core Ultra 7 256V, Intel Arc Graphics 140V (243 - 310, n=6) | |
| Lenovo ThinkPad E14 G6 | |
| Dell Latitude 3440 | |
| HP Pavilion Plus 14-ew0153TU | |
| Dell Inspiron 14 5425 6VPKR | |
| WebXPRT 4 / Overall | |
| Dell 14 Plus | |
| Average Intel Core Ultra 7 256V, Intel Arc Graphics 140V (282 - 286, n=6) | |
| Lenovo IdeaPad Pro 5 14AKP G10 | |
| HP Pavilion Plus 14-ew0153TU | |
| Lenovo ThinkPad E14 G6 | |
| Dell Latitude 3440 | |
| Dell Inspiron 14 5425 6VPKR | |
| Mozilla Kraken 1.1 / Total | |
| Dell Inspiron 14 5425 6VPKR | |
| Dell Latitude 3440 | |
| Lenovo ThinkPad E14 G6 | |
| HP Pavilion Plus 14-ew0153TU | |
| Dell 14 Plus | |
| Average Intel Core Ultra 7 256V, Intel Arc Graphics 140V (470 - 480, n=6) | |
| Lenovo IdeaPad Pro 5 14AKP G10 | |
* ... smaller is better
| PCMark 10 Score | 6677 points | |
Help | ||
| AIDA64 / Memory Copy | |
| Average Intel Core Ultra 7 256V (99227 - 104459, n=6) | |
| Dell 14 Plus | |
| Lenovo IdeaPad Pro 5 14AKP G10 | |
| Lenovo ThinkPad E14 G6 | |
| HP Pavilion Plus 14-ew0153TU | |
| Dell Latitude 3440 | |
| Dell Inspiron 14 5425 6VPKR | |
| AIDA64 / Memory Read | |
| Average Intel Core Ultra 7 256V (86352 - 89144, n=6) | |
| Dell 14 Plus | |
| Lenovo ThinkPad E14 G6 | |
| Lenovo IdeaPad Pro 5 14AKP G10 | |
| HP Pavilion Plus 14-ew0153TU | |
| Dell Latitude 3440 | |
| Dell Inspiron 14 5425 6VPKR | |
| AIDA64 / Memory Write | |
| Dell 14 Plus | |
| Average Intel Core Ultra 7 256V (108692 - 117933, n=6) | |
| Lenovo IdeaPad Pro 5 14AKP G10 | |
| HP Pavilion Plus 14-ew0153TU | |
| Lenovo ThinkPad E14 G6 | |
| Dell Latitude 3440 | |
| Dell Inspiron 14 5425 6VPKR | |
| AIDA64 / Memory Latency | |
| Lenovo ThinkPad E14 G6 | |
| HP Pavilion Plus 14-ew0153TU | |
| Lenovo IdeaPad Pro 5 14AKP G10 | |
| Dell Inspiron 14 5425 6VPKR | |
| Dell 14 Plus | |
| Average Intel Core Ultra 7 256V (96.1 - 99.6, n=6) | |
| Dell Latitude 3440 | |
* ... smaller is better
DPC 延迟


| DPC Latencies / LatencyMon - interrupt to process latency (max), Web, Youtube, Prime95 | |
| Lenovo ThinkPad E14 G6 | |
| Dell Latitude 3440 | |
| HP Pavilion Plus 14-ew0153TU | |
| Dell 14 Plus | |
| Dell Inspiron 14 5425 6VPKR | |
| Lenovo IdeaPad Pro 5 14AKP G10 | |
* ... smaller is better
存储设备
我们的设备配备了中端 三星 BM9C1PCIe4 NVMe 固态硬盘,读取速度高达 4900 MB/s。不过,写入速度可能要慢得多,不到一半。


| Drive Performance Rating - Percent | |
| Lenovo IdeaPad Pro 5 14AKP G10 | |
| HP Pavilion Plus 14-ew0153TU | |
| Lenovo ThinkPad E14 G6 | |
| Dell Latitude 3440 | |
| Dell Inspiron 14 5425 6VPKR | |
| Dell 14 Plus | |
* ... smaller is better
Disk Throttling: DiskSpd Read Loop, Queue Depth 8
图形处理器性能
弧形 Arc 140V的性能比我们数据库中采用相同 iGPU 的普通笔记本电脑要慢 20%。即便如此,与老旧的 Iris Xe 96 EUs相比还是有很大提升。
| 电源配置文件 | 图形得分 | 物理得分 | 综合得分 |
| 性能模式 | 7706 | 17387 | 2671 |
| 均衡模式 | 7182 (-7%) | 16601 (-5%) | 2426 (-9%) |
| 电池供电 | 7374(-4%) | 16277 (-6%) | 2373 (-11%) |
如Fire Strike 上表所示,在平衡模式或电池供电模式下运行,性能仅降低几个百分点。


| 3DMark 11 Performance | 11261 points | |
| 3DMark Fire Strike Score | 6973 points | |
| 3DMark Time Spy Score | 3517 points | |
Help | ||
* ... smaller is better
| F1 24 | |
| 1920x1080 High Preset AA:T AF:16x | |
| Lenovo ThinkPad X1 2-in-1 Gen 10 | |
| Average Intel Arc Graphics 140V (34.4 - 66.4, n=18) | |
| Lenovo IdeaPad Pro 5 14AKP G10 | |
| Dell 14 Plus | |
| Lenovo Yoga 7 2-in-1 14AKP10 | |
| 1920x1080 Ultra High Preset AA:T AF:16x | |
| Average Intel Arc Graphics 140V (15.8 - 21.2, n=16) | |
| Lenovo ThinkPad X1 2-in-1 Gen 10 | |
| Dell 14 Plus | |
| Lenovo IdeaPad Pro 5 14AKP G10 | |
Cyberpunk 2077 ultra FPS Chart
| low | med. | high | ultra | |
|---|---|---|---|---|
| Dota 2 Reborn (2015) | 98.6 | 59.7 | 74.5 | 69.1 |
| Final Fantasy XV Benchmark (2018) | 76.9 | 42.8 | 32.3 | |
| X-Plane 11.11 (2018) | 43.8 | 35.3 | 36 | |
| Strange Brigade (2018) | 193.4 | 56.2 | 52.6 | 48.8 |
| Baldur's Gate 3 (2023) | 38.1 | 32.1 | 27.9 | 27.4 |
| Cyberpunk 2077 2.2 Phantom Liberty (2023) | 43.5 | 35.1 | 26 | 24.2 |
| F1 24 (2024) | 64.3 | 62.2 | 45.9 | 16.5 |
排放量
系统噪音
与大多数搭载 Lunar Lake 处理器的超极本一样,内部风扇在大多数中低负载情况下都很慵懒,而且噪音很小。当负载较高时,风扇需要一段时间才能真正运转起来,但在其他情况下,它能达到与大多数其他 14 英寸竞争产品类似的最高水平。

Noise Level
| Idle |
| 23.8 / 23.8 / 23.8 dB(A) |
| Load |
| 31.4 / 45.2 dB(A) |
 | ||
30 dB silent 40 dB(A) audible 50 dB(A) loud |
||
min: | ||
| Dell 14 Plus Arc 140V, Core Ultra 7 256V | Dell Inspiron 14 5425 6VPKR Vega 7, R5 5625U, SK Hynix BC711 512GB HFM512GD3GX013N | Dell Latitude 3440 Iris Xe G7 80EUs, i5-1345U, Samsung PM9A1 MZVL2512HCJQ | Lenovo IdeaPad Pro 5 14AKP G10 Radeon 860M, Ryzen AI 7 350, SK hynix PVC10 HFS001TEM4X182N | Lenovo ThinkPad E14 G6 Graphics 4-Core, Ultra 7 155U, Samsung PM9C1a MZAL8512HDLU | HP Pavilion Plus 14-ew0153TU Iris Xe G7 96EUs, i7-1355U, SK hynix PC801 HFS001TEJ9X101N | |
|---|---|---|---|---|---|---|
| Noise | -7% | -3% | -10% | 2% | 15% | |
| off / environment * | 23.8 | 25.5 -7% | 23.9 -0% | 23.6 1% | 24.6 -3% | 19.35 19% |
| Idle Minimum * | 23.8 | 25.5 -7% | 24.4 -3% | 23.6 1% | 24.6 -3% | 20.57 14% |
| Idle Average * | 23.8 | 25.5 -7% | 24.4 -3% | 23.6 1% | 24.6 -3% | 20.57 14% |
| Idle Maximum * | 23.8 | 25.5 -7% | 24.4 -3% | 23.6 1% | 24.6 -3% | 20.57 14% |
| Load Average * | 31.4 | 37.7 -20% | 37.1 -18% | 46.5 -48% | 27.5 12% | 32.18 -2% |
| Cyberpunk 2077 ultra * | 42 | 48.9 -16% | 39.4 6% | |||
| Load Maximum * | 45.2 | 43.3 4% | 40.2 11% | 48.9 -8% | 42.5 6% | 32.26 29% |
| Witcher 3 ultra * | 38.2 | 29.44 |
* ... smaller is better
温度
在负载情况下,键盘面板和底部的表面温度热点可高达 43 摄氏度,明显高于我们在键盘上记录的温度。 HPPavilion Plus 14高出几度。


(±) The maximum temperature on the upper side is 43 °C / 109 F, compared to the average of 35.9 °C / 97 F, ranging from 21.4 to 59 °C for the class Subnotebook.
(±) The bottom heats up to a maximum of 42.6 °C / 109 F, compared to the average of 39.3 °C / 103 F
(+) In idle usage, the average temperature for the upper side is 28.8 °C / 84 F, compared to the device average of 30.8 °C / 87 F.
(+) The palmrests and touchpad are cooler than skin temperature with a maximum of 28.4 °C / 83.1 F and are therefore cool to the touch.
(±) The average temperature of the palmrest area of similar devices was 28.2 °C / 82.8 F (-0.2 °C / -0.3 F).


| Dell 14 Plus Intel Core Ultra 7 256V, Intel Arc Graphics 140V | Dell Inspiron 14 5425 6VPKR AMD Ryzen 5 5625U, AMD Radeon RX Vega 7 | Dell Latitude 3440 Intel Core i5-1345U, Intel Iris Xe Graphics G7 80EUs | Lenovo IdeaPad Pro 5 14AKP G10 AMD Ryzen AI 7 350, AMD Radeon 860M | Lenovo ThinkPad E14 G6 Intel Core Ultra 7 155U, Intel Graphics 4-Core iGPU (Arc) | HP Pavilion Plus 14-ew0153TU Intel Core i7-1355U, Intel Iris Xe Graphics G7 96EUs | |
|---|---|---|---|---|---|---|
| Heat | 3% | 6% | 10% | 20% | 8% | |
| Maximum Upper Side * | 43 | 39.1 9% | 35.2 18% | 42.2 2% | 35 19% | 36.6 15% |
| Maximum Bottom * | 42.6 | 41.9 2% | 41 4% | 42.4 -0% | 35.6 16% | 37.2 13% |
| Idle Upper Side * | 31.6 | 31.2 1% | 29.8 6% | 25.4 20% | 23.8 25% | 31.6 -0% |
| Idle Bottom * | 30.6 | 30.9 -1% | 32 -5% | 25.7 16% | 24.8 19% | 30 2% |
* ... smaller is better
发言人

Dell 14 Plus audio analysis
(+) | speakers can play relatively loud (82 dB)
Bass 100 - 315 Hz
(±) | reduced bass - on average 7.8% lower than median
(±) | linearity of bass is average (9.2% delta to prev. frequency)
Mids 400 - 2000 Hz
(±) | higher mids - on average 6.5% higher than median
(+) | mids are linear (3.6% delta to prev. frequency)
Highs 2 - 16 kHz
(+) | balanced highs - only 1.9% away from median
(+) | highs are linear (3.7% delta to prev. frequency)
Overall 100 - 16.000 Hz
(+) | overall sound is linear (12.4% difference to median)
Compared to same class
» 15% of all tested devices in this class were better, 4% similar, 80% worse
» The best had a delta of 5%, average was 19%, worst was 53%
Compared to all devices tested
» 9% of all tested devices were better, 2% similar, 88% worse
» The best had a delta of 4%, average was 24%, worst was 134%
Apple MacBook Pro 16 2021 M1 Pro audio analysis
(+) | speakers can play relatively loud (84.7 dB)
Bass 100 - 315 Hz
(+) | good bass - only 3.8% away from median
(+) | bass is linear (5.2% delta to prev. frequency)
Mids 400 - 2000 Hz
(+) | balanced mids - only 1.3% away from median
(+) | mids are linear (2.1% delta to prev. frequency)
Highs 2 - 16 kHz
(+) | balanced highs - only 1.9% away from median
(+) | highs are linear (2.7% delta to prev. frequency)
Overall 100 - 16.000 Hz
(+) | overall sound is linear (4.6% difference to median)
Compared to same class
» 0% of all tested devices in this class were better, 0% similar, 100% worse
» The best had a delta of 5%, average was 18%, worst was 45%
Compared to all devices tested
» 0% of all tested devices were better, 0% similar, 100% worse
» The best had a delta of 4%, average was 24%, worst was 134%
能源管理
耗电量
总体耗电量与 戴尔Latitude 7450 2-in-1尽管我们的戴尔 14 Plus 在人工智能加速、内存性能和 iGPU 性能方面都有显著提升,从而提高了每瓦性能,但它与采用酷睿至尊 7 165U 的戴尔 7450 2 合 1 仍有相当大的差距。


| Off / Standby | |
| Idle | |
| Load |
|
Key:
min: | |
| Dell 14 Plus Core Ultra 7 256V, Arc 140V, , IPS, 2560x1600, 14" | Dell Inspiron 14 5425 6VPKR R5 5625U, Vega 7, SK Hynix BC711 512GB HFM512GD3GX013N, IPS, 1920x1200, 14" | Dell Latitude 3440 i5-1345U, Iris Xe G7 80EUs, Samsung PM9A1 MZVL2512HCJQ, IPS, 1920x1080, 14" | Lenovo IdeaPad Pro 5 14AKP G10 Ryzen AI 7 350, Radeon 860M, SK hynix PVC10 HFS001TEM4X182N, OLED, 2880x1800, 14" | Lenovo ThinkPad E14 G6 Ultra 7 155U, Graphics 4-Core, Samsung PM9C1a MZAL8512HDLU, IPS, 1920x1200, 14" | HP Pavilion Plus 14-ew0153TU i7-1355U, Iris Xe G7 96EUs, SK hynix PC801 HFS001TEJ9X101N, OLED, 2880x1800, 14" | |
|---|---|---|---|---|---|---|
| Power Consumption | -4% | -12% | -66% | -36% | -34% | |
| Idle Minimum * | 3.6 | 4 -11% | 3.7 -3% | 5.1 -42% | 5.4 -50% | 6.7 -86% |
| Idle Average * | 6.7 | 6.6 1% | 6.5 3% | 6.8 -1% | 9.7 -45% | 7.16 -7% |
| Idle Maximum * | 6.9 | 9.4 -36% | 9.5 -38% | 6.9 -0% | 10.4 -51% | 11.17 -62% |
| Load Average * | 41.2 | 37 10% | 46.9 -14% | 71.7 -74% | 49.2 -19% | 46.5 -13% |
| Cyberpunk 2077 ultra external monitor * | 34.2 | 83.5 -144% | 47.1 -38% | |||
| Cyberpunk 2077 ultra * | 36.6 | 84.8 -132% | 50.1 -37% | |||
| Load Maximum * | 62.6 | 53.7 14% | 67 -7% | 104.8 -67% | 68.9 -10% | 64.36 -3% |
| Witcher 3 ultra * | 37.1 | 42.1 | 37.2 |
* ... smaller is better
Power Consumption Cyberpunk / Stress Test
Power Consumption external Monitor
电池寿命
WLAN 运行时间非常长,64 Wh 的大容量电池可提供超过 14 小时的运行时间。
| Dell 14 Plus Core Ultra 7 256V, Arc 140V, 64 Wh | Dell Inspiron 14 5425 6VPKR R5 5625U, Vega 7, 54 Wh | Dell Latitude 3440 i5-1345U, Iris Xe G7 80EUs, 54 Wh | Lenovo IdeaPad Pro 5 14AKP G10 Ryzen AI 7 350, Radeon 860M, 84 Wh | Lenovo ThinkPad E14 G6 Ultra 7 155U, Graphics 4-Core, 47 Wh | HP Pavilion Plus 14-ew0153TU i7-1355U, Iris Xe G7 96EUs, 68 Wh | |
|---|---|---|---|---|---|---|
| Battery Runtime | -10% | -38% | -3% | -34% | -33% | |
| WiFi v1.3 | 857 | 770 -10% | 528 -38% | 833 -3% | 566 -34% | 578 -33% |
| H.264 | 1177 | 720 | ||||
| Load | 52 | 87 | ||||
| Reader / Idle | 1370 |
笔记本检查评级
Dell 14 Plus
- 06/01/2025 v8
Allen Ngo
 Total Sustainability Score:
 Potential Competitors in Comparison
Image | Model / Review | Price | Weight | Height | Display |
|---|---|---|---|---|---|
1. 83.4%  | Dell 14 Plus Intel Core Ultra 7 256V ⎘ Intel Arc Graphics 140V ⎘ 16 GB Memory | Amazon: $1,125.12 List Price: 1100 USD | 1.5 kg | 16.95 mm | 14.00" 2560x1600 216 PPI IPS |
2. 84.6% v7 (old)  | Dell Inspiron 14 5425 6VPKR AMD Ryzen 5 5625U ⎘ AMD Radeon RX Vega 7 ⎘ 16 GB Memory, 512 GB SSD | Amazon: 1. $43.74 54Wh V6W33 Battery for Dell ... 2. $643.98 Dell Inspiron 14 5425 14" La... 3. $799.00 Dell Inspiron 14 5000 5425 B... List Price: 849 Euro | 1.6 kg | 18.37 mm | 14.00" 1920x1200 162 PPI IPS |
3. 85.3% v7 (old) 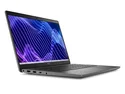 | Dell Latitude 3440 Intel Core i5-1345U ⎘ Intel Iris Xe Graphics G7 80EUs ⎘ 16 GB Memory, 512 GB SSD | Amazon: 1. $659.00 Dell Latitude 3000 3440 14" ... 2. $21.77 Dell Laptop Charger 65W Watt... 3. $859.99 Dell Latitude 3420 Business ... List Price: 1100 USD | 1.5 kg | 19.4 mm | 14.00" 1920x1080 157 PPI IPS |
4. 87.4% 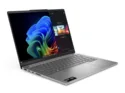 | Lenovo IdeaPad Pro 5 14AKP G10 AMD Ryzen AI 7 350 ⎘ AMD Radeon 860M ⎘ 32 GB Memory, 1024 GB SSD | Amazon: 1. $1,199.00 Lenovo ThinkPad P14s Gen 5 A... 2. $1,479.00 Lenovo IdeaPad Pro 5i Multi-... 3. $644.00 Lenovo IdeaPad 5 2-in-1 Lapt... List Price: 989€ | 1.4 kg | 15.5 mm | 14.00" 2880x1800 243 PPI OLED |
5. 84.8% 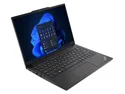 | Lenovo ThinkPad E14 G6 Intel Core Ultra 7 155U ⎘ Intel Graphics 4-Core iGPU (Arc) ⎘ 16 GB Memory, 512 GB SSD | Amazon: $899.00 List Price: 990 USD | 1.5 kg | 17.99 mm | 14.00" 1920x1200 162 PPI IPS |
6. 87.5% v7 (old)  | HP Pavilion Plus 14-ew0153TU Intel Core i7-1355U ⎘ Intel Iris Xe Graphics G7 96EUs ⎘ 16 GB Memory, 1024 GB SSD | Amazon: 1. $1,223.58 HP Pavilion Plus 14 inch Lap... 2. $684.00 HP Pavilion Plus 14 inch Lap... 3. $9.59 CPU Cooling Fan for HP Pavil... List Price: 1020 USD | 1.4 kg | 17.5 mm | 14.00" 2880x1800 243 PPI OLED |
Transparency
The selection of devices to be reviewed is made by our editorial team. The test sample was provided to the author as a loan by the manufacturer or retailer for the purpose of this review. The lender had no influence on this review, nor did the manufacturer receive a copy of this review before publication. There was no obligation to publish this review. We never accept compensation or payment in return for our reviews. As an independent media company, Notebookcheck is not subjected to the authority of manufacturers, retailers or publishers.
This is how Notebookcheck is testing
Every year, Notebookcheck independently reviews hundreds of laptops and smartphones using standardized procedures to ensure that all results are comparable. We have continuously developed our test methods for around 20 years and set industry standards in the process. In our test labs, high-quality measuring equipment is utilized by experienced technicians and editors. These tests involve a multi-stage validation process. Our complex rating system is based on hundreds of well-founded measurements and benchmarks, which maintains objectivity. Further information on our test methods can be found here.

