

Beelink EQ14 迷你电脑评测:不到 200 美元的即用型 HTPC
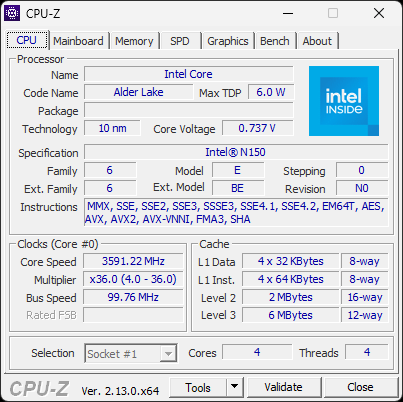
英特尔 N150 处理器首次亮相
最便宜的迷你 PC 之一,配备了最新的英特尔 Twin Lake 处理器。预算紧张的 HTPC 用户会喜欢它的安静和低价,但多任务处理者可能会对其缓慢的性能感到失望。Allen Ngo, 👁 Allen Ngo (translated by DeepL / Ninh Duy) Published 🇺🇸 🇫🇷 ...
结论 - 低调却牺牲性能
Beelink EQ14 的性价比很高。该系统售价 200 美元,包括 16 GB 内存、512 GB 固态硬盘和预装的 Windows 11 Home 操作系统,这三者加在一起占了系统价格的一半以上。入门门槛低、集成 PSU 和安静的运行对于大多数 HTPC 或流媒体用途来说都是可取的。
遗憾的是,新的 N150 处理器与现有的 N100 相比几乎没有什么优势,令人有些失望。单通道内存的限制令人沮丧,不支持 DisplayPort-over-USB 也是如此。想要更快的用户可能会考虑声音更大、价格稍贵的 GMK NucBox M6.
Pros
Cons
可能的替代品比较
Image | Model / Review | Price | Weight | Height | Display |
|---|---|---|---|---|---|
1. 61.3% 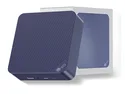 | Beelink EQ14 Intel Processor N150 ⎘ Intel UHD Graphics 24EUs (Alder Lake-N) ⎘ 16 GB Memory | Amazon: $189.00 List Price: 200 USD | 432 g | 39 mm | x |
2. 77.1% 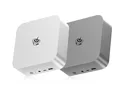 | Beelink SER9 AMD Ryzen AI 9 HX 370 ⎘ AMD Radeon 890M ⎘ 32 GB Memory, 1024 GB SSD | Amazon: $999.00 List Price: 1000 USD | 814 g | 44.7 mm | x |
3. 67.3% 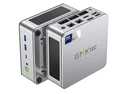 | GMK NucBox K9 Intel Core Ultra 5 125H ⎘ Intel Arc 7-Core iGPU ⎘ 32 GB Memory, 1024 GB SSD | Amazon: $639.99 List Price: 560 USD | 528 g | 47 mm | x |
4. 61.3% 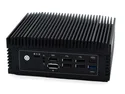 | Newsmay AC8F-POE Intel Processor N100 ⎘ Intel UHD Graphics 24EUs (Alder Lake-N) ⎘ 8 GB Memory, 128 GB SSD | Amazon: 1. $21.99 PowerHOOD AC/DC Adapter Comp... List Price: 295 EUR | 1.2 kg | 62 mm | x |
5. 73% v7 (old) 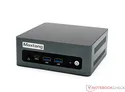 | Maxtang MTN-ALN50 Intel Core i3-N305 ⎘ Intel UHD Graphics 32EUs (Alder Lake) ⎘ 16 GB Memory, 512 GB SSD | List Price: 348 USD | 685 g | 52.5 mm | x |
6. 73.2% v7 (old)  | Asus ExpertCenter PN42-BBN200MV Intel Processor N200 ⎘ Intel UHD Graphics Xe 750 32EUs (Rocket Lake) ⎘ 16 GB Memory, 2048 GB SSD | List Price: 299 EUR | 828 g | 57.6 mm | x |
7. 73.1% v7 (old) 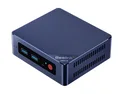 | Beelink Mini S12 Pro Intel Processor N100 ⎘ Intel UHD Graphics 24EUs (Alder Lake-N) ⎘ 16 GB Memory | Amazon: 1. $159.00 Beelink Mini S12 Pro Mini PC... 2. $159.00 Beelink Mini PC, Mini S12 Pr... 3. $156.99 Beelink Mini S12 Pro Mini PC... List Price: 200 USD | 335 g | 39.1 mm | x |
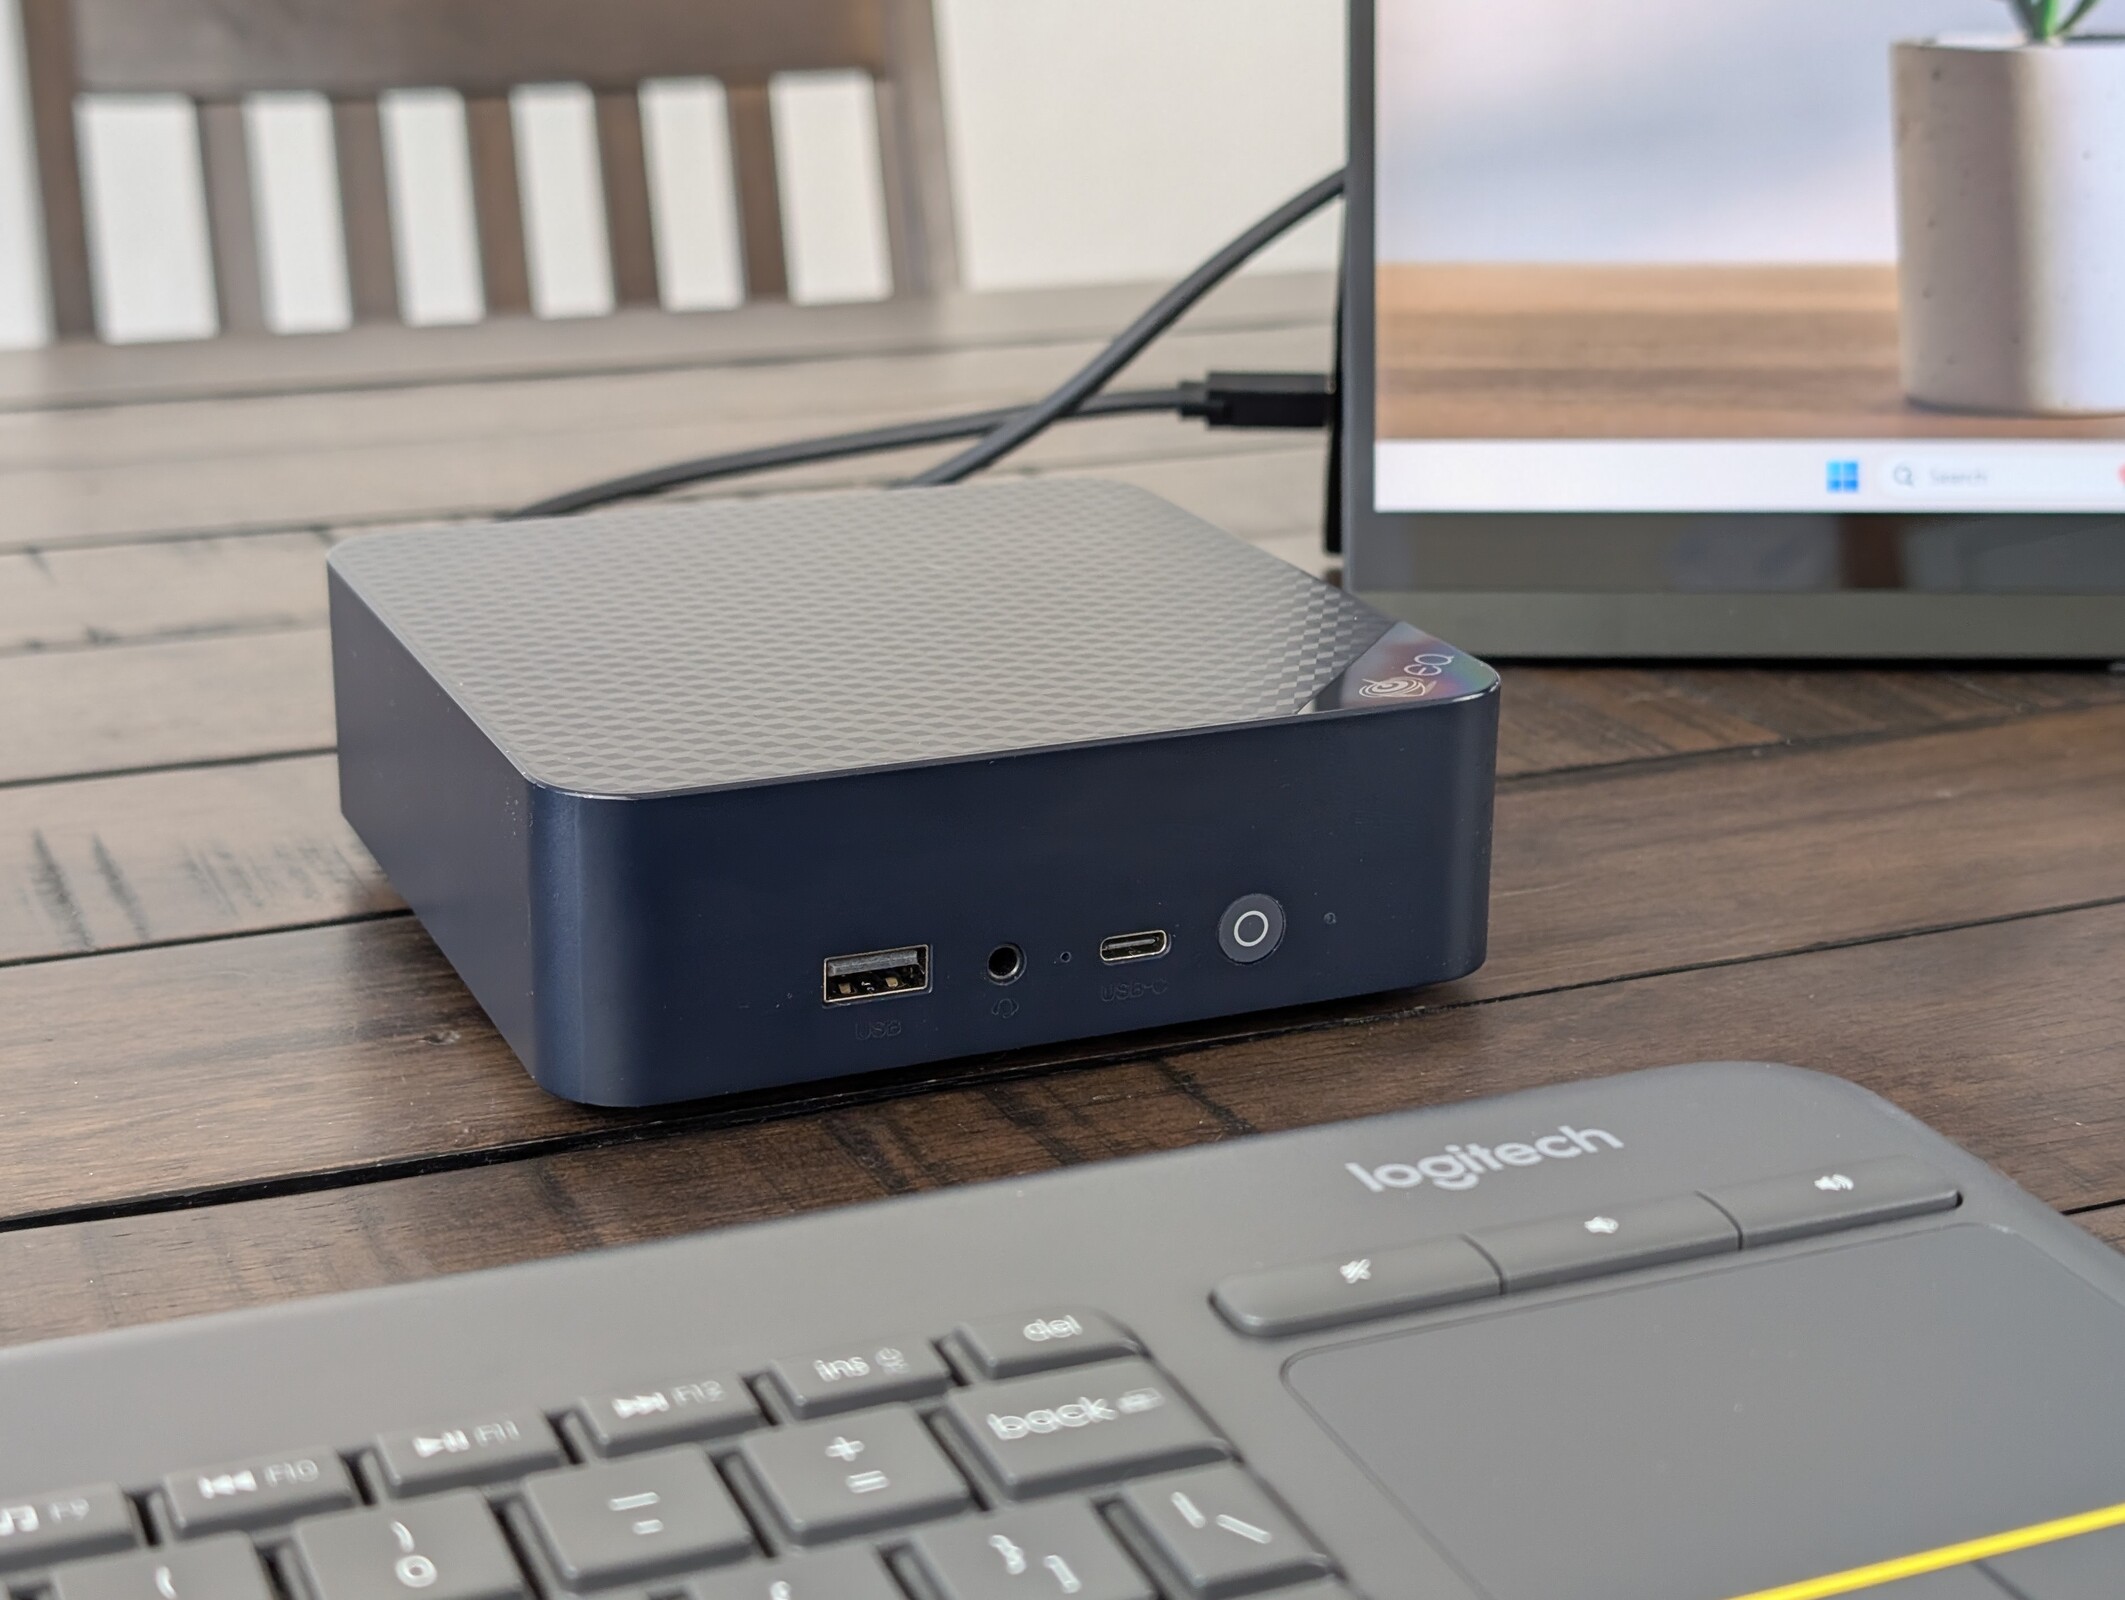
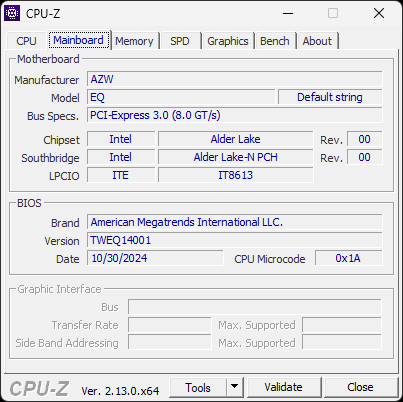
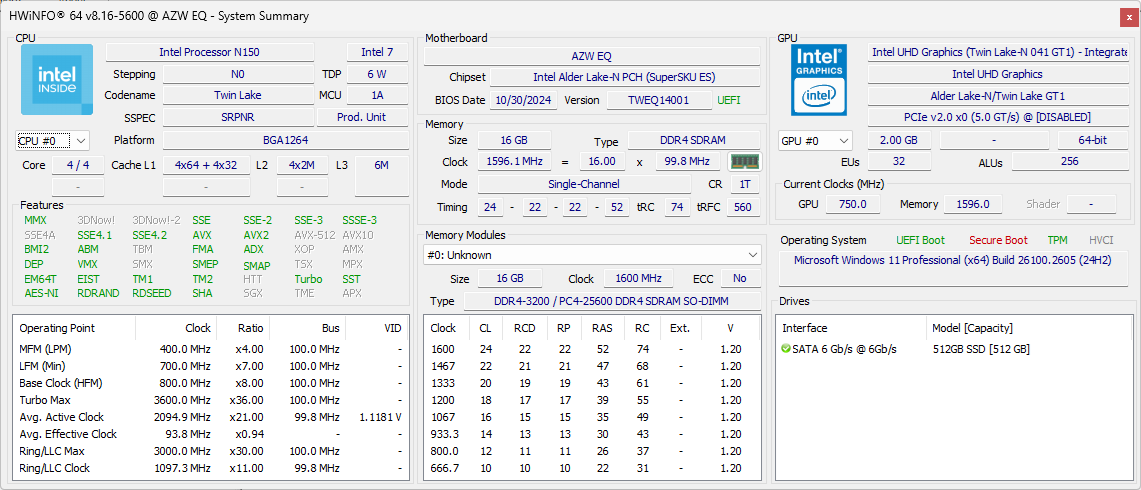
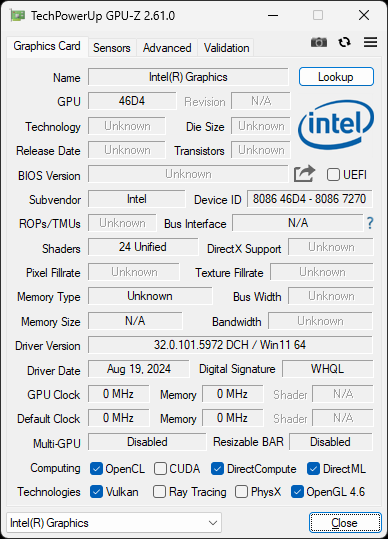
Beelink EQ14 是该公司产品系列中价格最低的迷你 PC 之一,售价不到 200 美元。它也是为数不多的采用英特尔 N150 Twin Lake CPU 的设备之一。
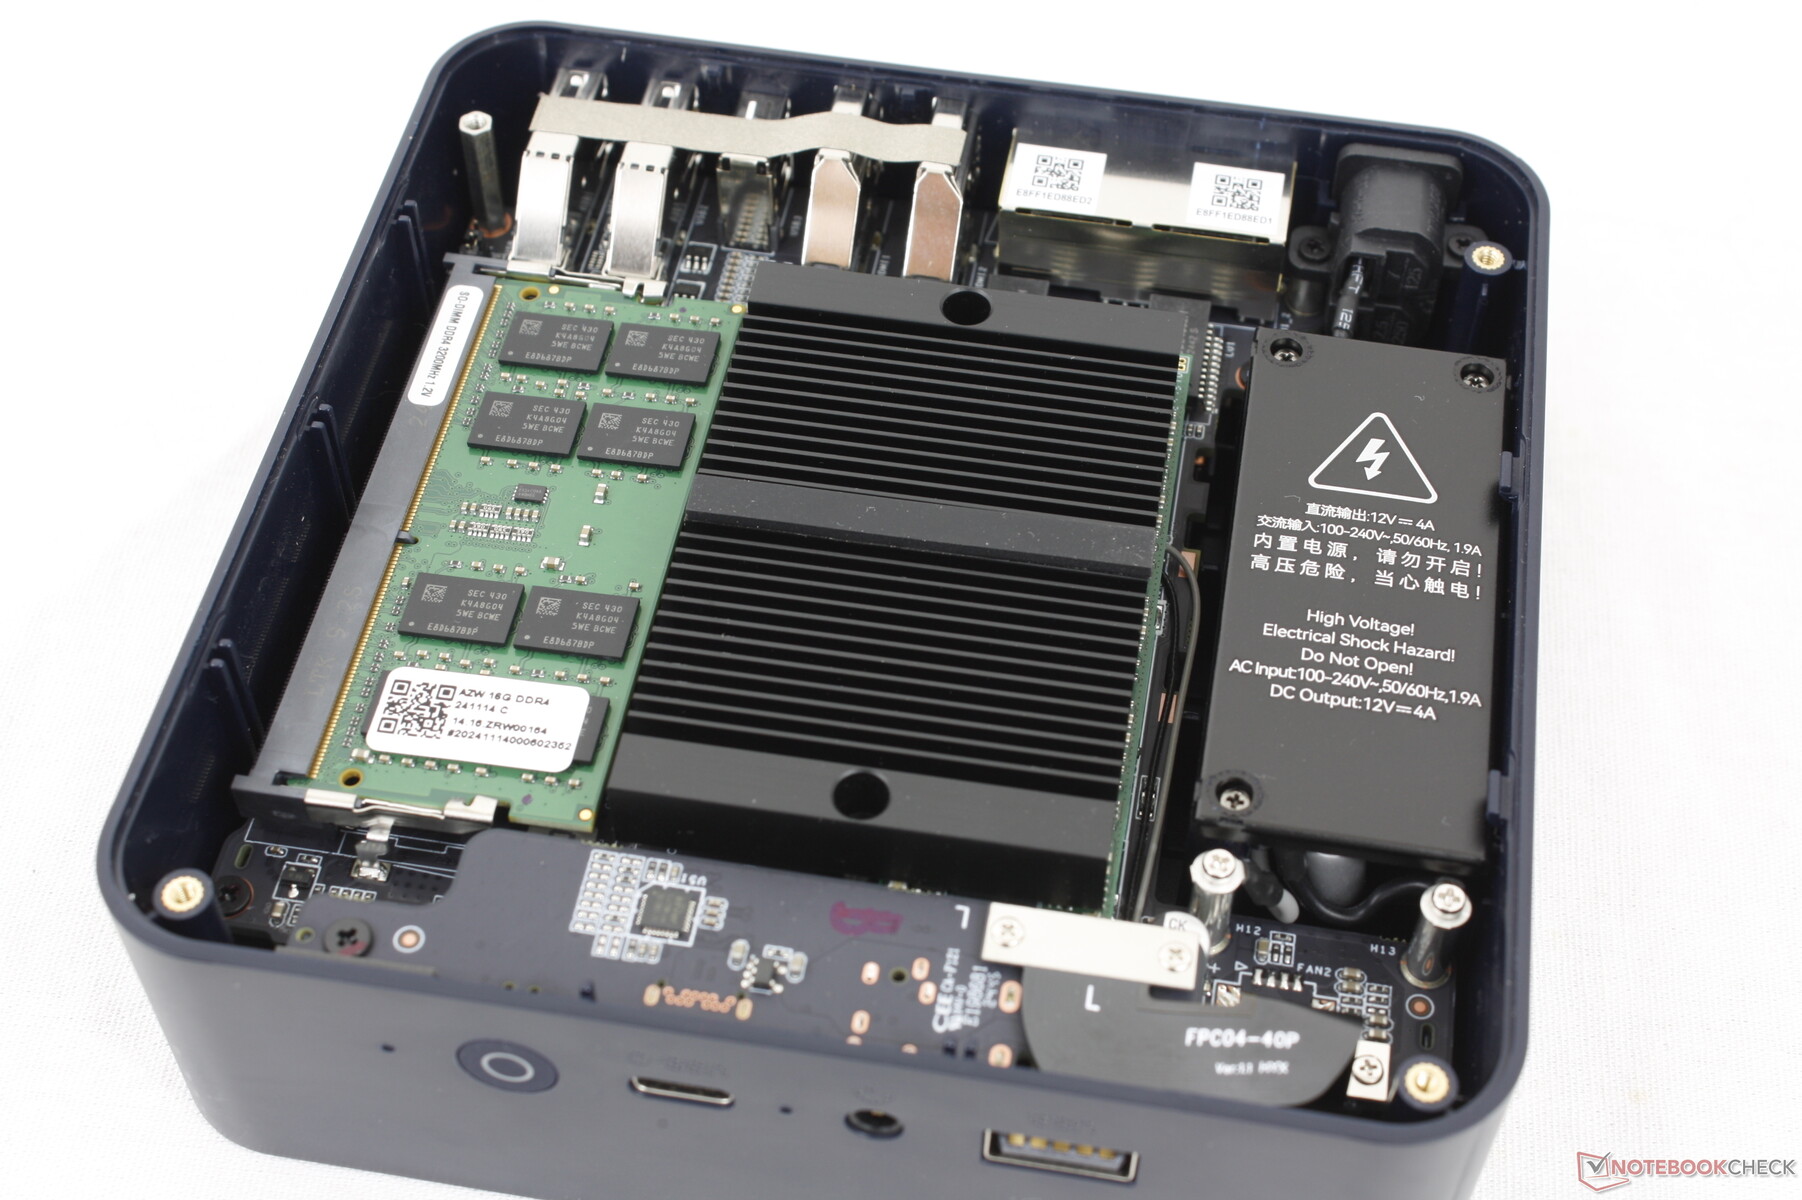
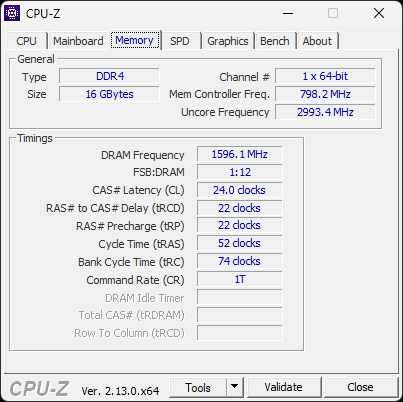
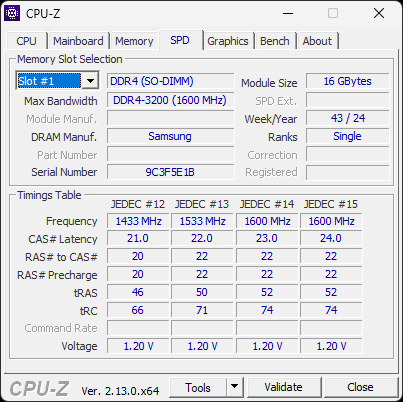
我们的测试机配置了 16 GB 单通道内存和 512 GB M.2 SATA III 固态硬盘。遗憾的是,在撰写本文时还没有裸机可供选择。
更多 Beelink 评论:
规格
案例
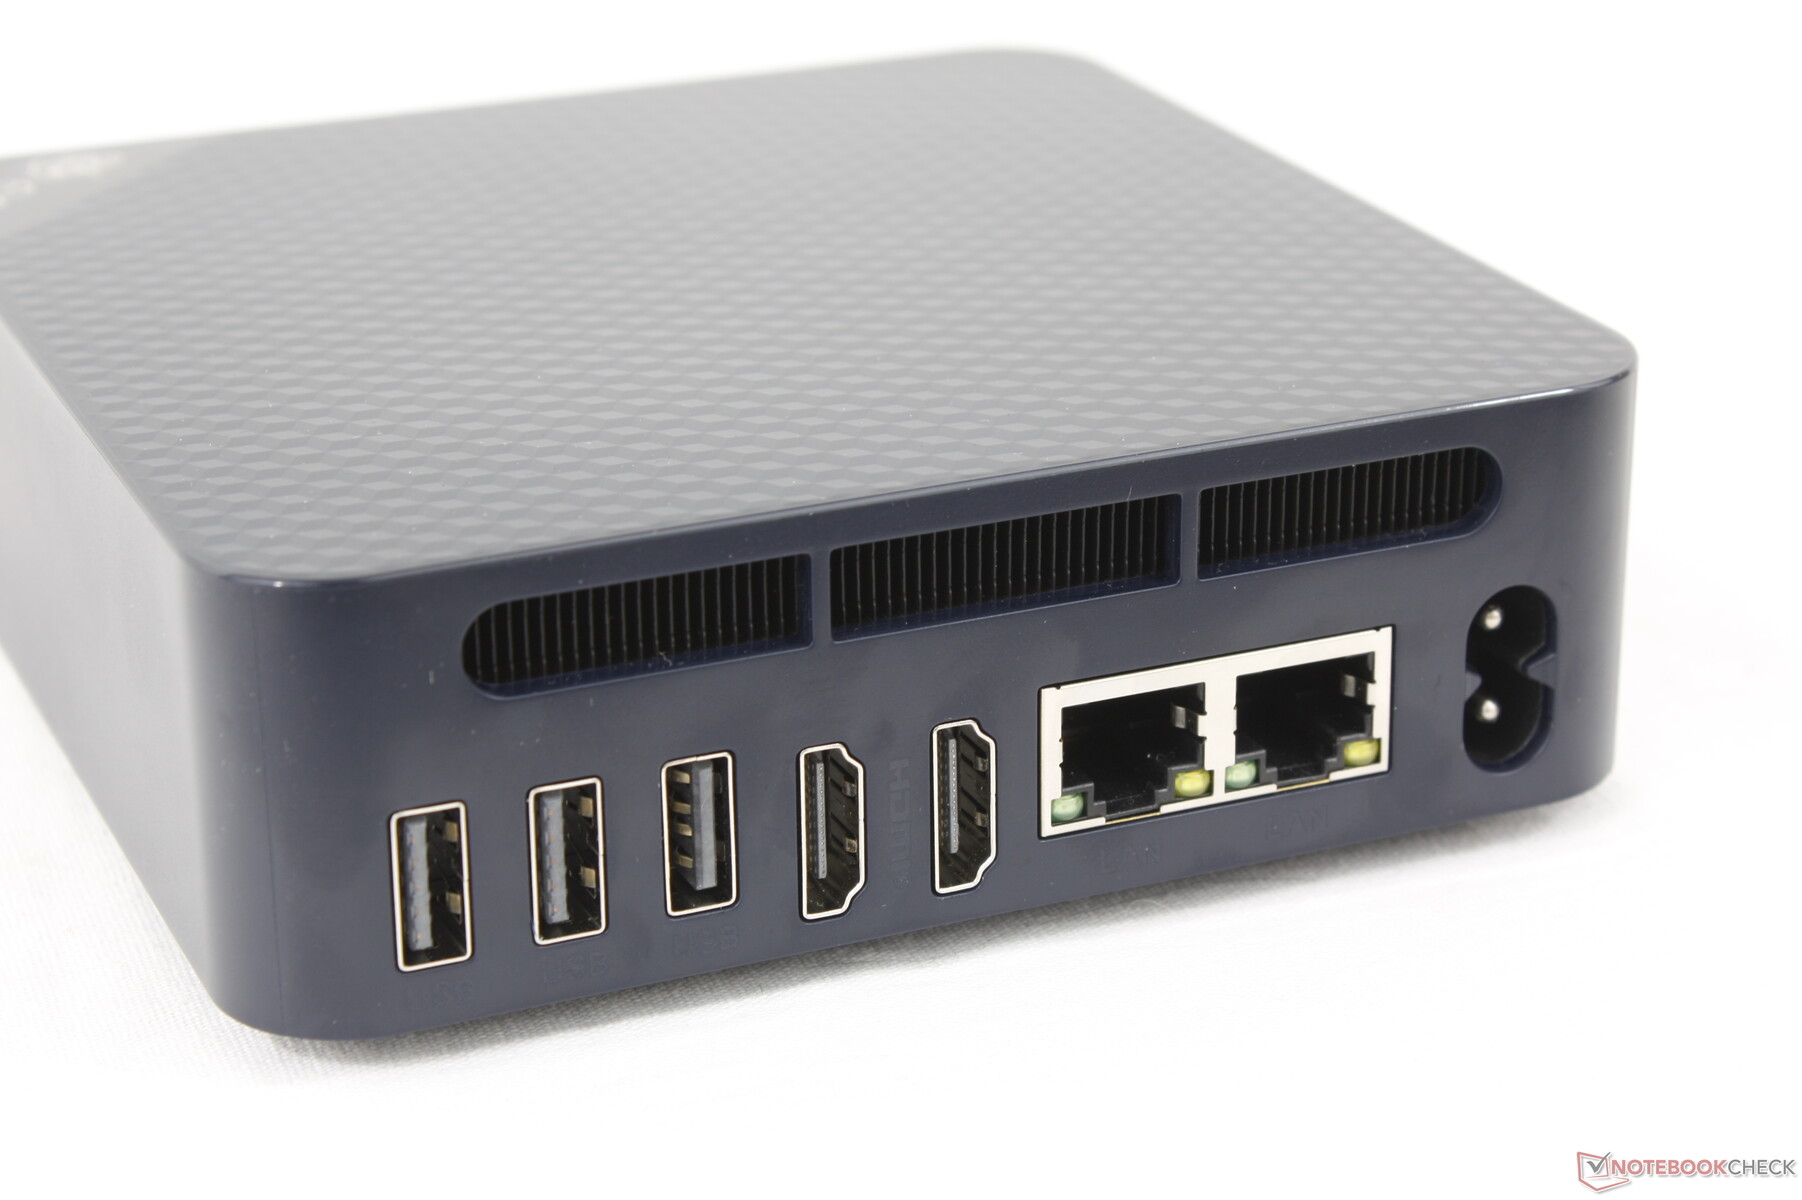
机箱大部分采用塑料材质,这在同价位产品中是意料之中的。不过,如果考虑到该系统与市场上绝大多数微型电脑不同,无需外接电源砖,其轻巧、低调的外观就更令人印象深刻了。只需一根通用交流电源线即可。
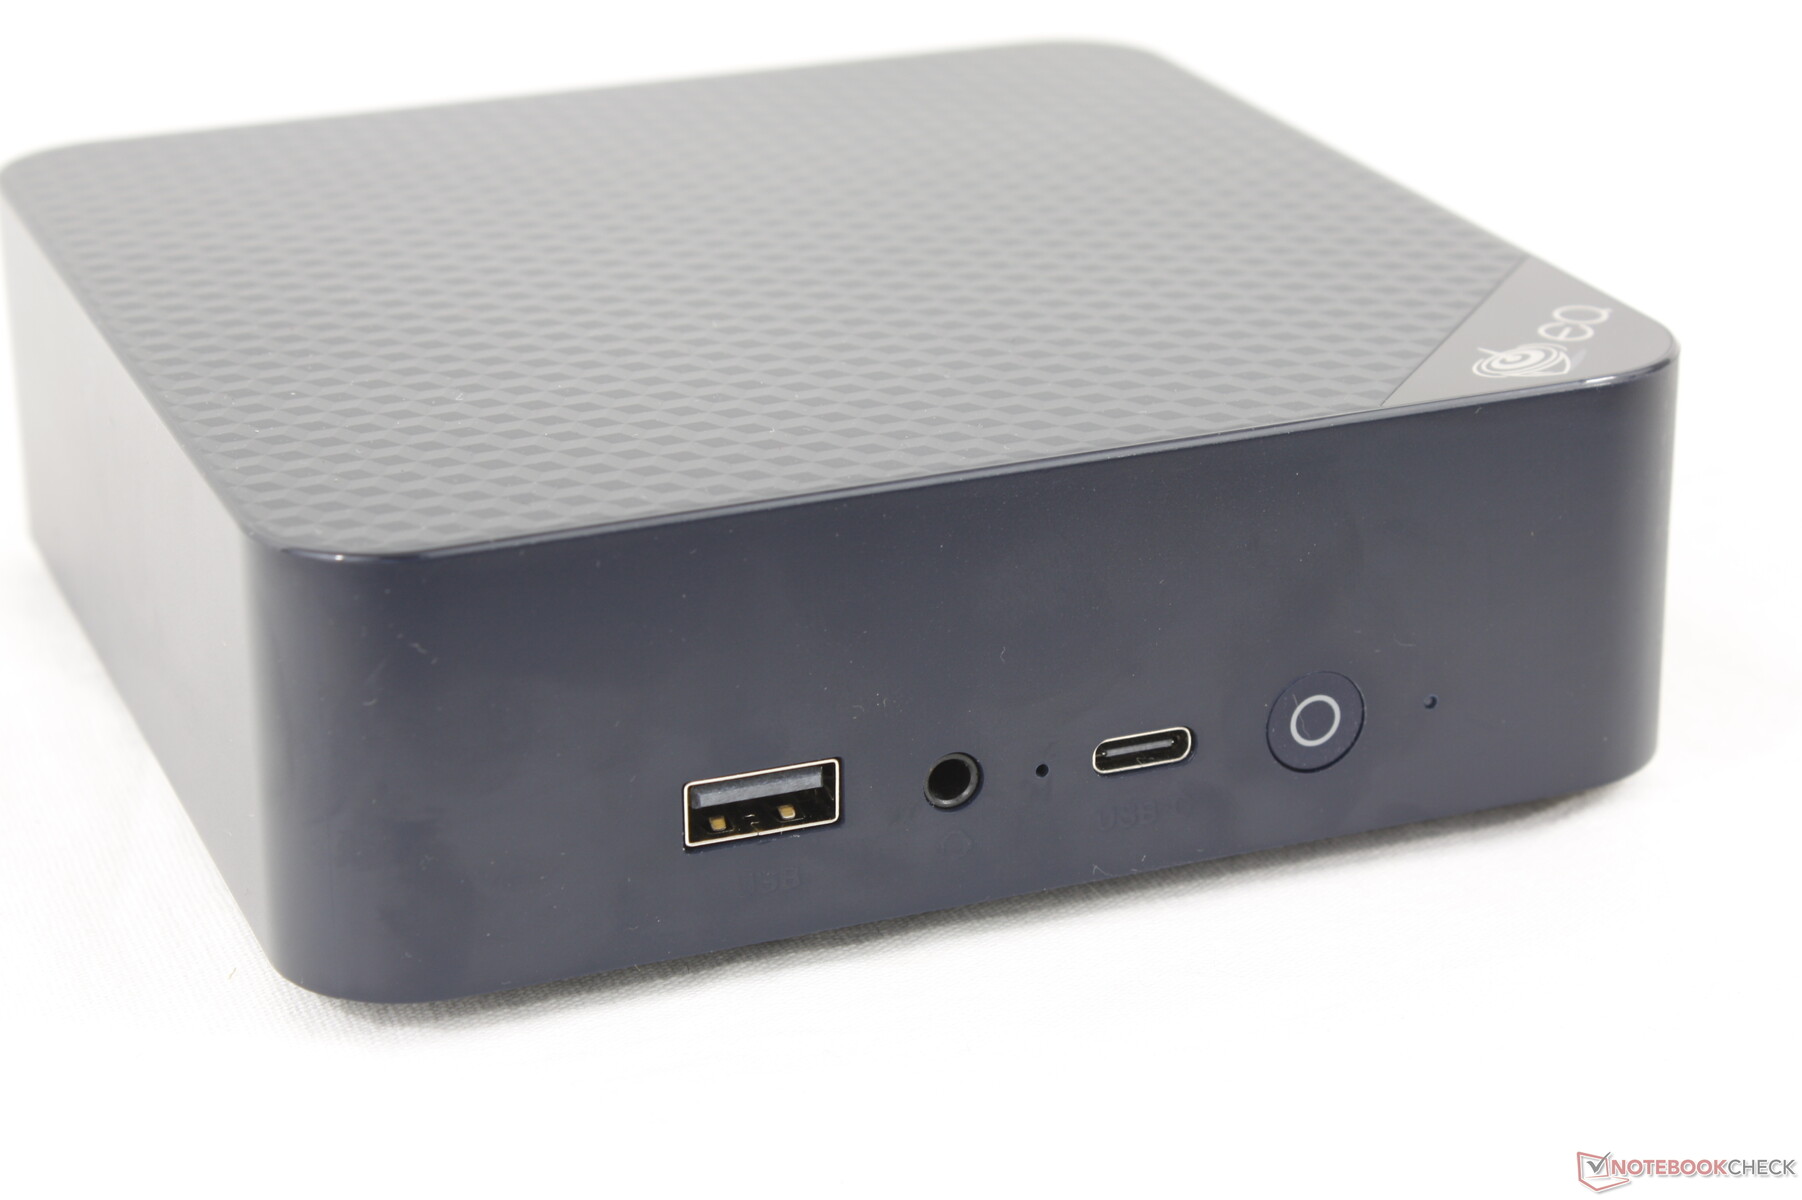
连接性
尽管起价很低,但却提供了多种端口。单个 USB-C 端口不支持 DisplayPort 或 Power Delivery。
交流
无线传输速率较慢,因为系统配备的是 1x1 WLAN 模块,而不是常见的 2x2。
| Networking | |
| iperf3 transmit AXE11000 | |
| Asus ExpertCenter PN42-BBN200MV | |
| GMK NucBox K9 | |
| Beelink SER9 | |
| Beelink Mini S12 Pro | |
| Beelink EQ14 | |
| iperf3 receive AXE11000 | |
| Asus ExpertCenter PN42-BBN200MV | |
| Beelink SER9 | |
| GMK NucBox K9 | |
| Beelink Mini S12 Pro | |
| Beelink EQ14 | |
维护
底部面板需要用十字螺丝刀才能取下。用户可以直接访问两个 M.2 2280 固态硬盘插槽和一个 DDR5 SODIMM 插槽。只能安装一个内存模块,这意味着不支持双通道内存。
可持续性
制造商宣称在生产过程中没有采取任何可持续发展措施。同时,包装主要是纸和纸板,外加一些保护性塑料包装。
配件和保修
零售包装盒中除了电源线和用户手册外,还有一条 HDMI 线。没有上面提到的专用电源砖。
如果在美国购买,制造商通常提供一年有限保修。
性能
测试条件
在运行以下基准测试之前,我们将 Windows 设置为性能模式。
处理器
N150 的多线程性能与 N100 的多线程性能相差不到一位数百分点。 N100 在 Beelink Mini S12 Pro 中,多线程性能与 N100 相比仅有个位数百分点的差距,同比没有显著提升。然而,使用 N100 或 N200 的迷你 PC(如 新美 AC8F-POE或 华硕 ExpertCenter PN42的多线程性能可能会提高 40% 或 100%。即便如此,整体性能仍然非常缓慢,这意味着在日常工作负载中几乎无法察觉到大比例的性能提升。
Cinebench R15 Multi Loop
Cinebench R23: Multi Core | Single Core
Cinebench R20: CPU (Multi Core) | CPU (Single Core)
Cinebench R15: CPU Multi 64Bit | CPU Single 64Bit
Blender: v2.79 BMW27 CPU
7-Zip 18.03: 7z b 4 | 7z b 4 -mmt1
Geekbench 6.4: Multi-Core | Single-Core
Geekbench 5.5: Multi-Core | Single-Core
HWBOT x265 Benchmark v2.2: 4k Preset
LibreOffice : 20 Documents To PDF
R Benchmark 2.5: Overall mean
| CPU Performance Rating | |
| HP Elite Mini 800 G9-5M9T9EA | |
| GMK NucBox K3 Pro | |
| GMK NucBox K2 | |
| Asus NUC 14 Pro | |
| MSI Cubi NUC 1M | |
| GMK NucBox M5 | |
| Acemagic S1 | |
| Beelink Mini S12 Pro | |
| Beelink EQ14 | |
| Acemagic S1 | |
| Average Intel Processor N150 | |
| Newsmay AC8F-POE | |
| Beelink U59 N5105 -2! | |
| Asus ExpertCenter PN42-BBN200MV | |
| GMK NucBox 3 -2! | |
Cinebench R23: Multi Core | Single Core
Cinebench R20: CPU (Multi Core) | CPU (Single Core)
Cinebench R15: CPU Multi 64Bit | CPU Single 64Bit
Blender: v2.79 BMW27 CPU
7-Zip 18.03: 7z b 4 | 7z b 4 -mmt1
Geekbench 6.4: Multi-Core | Single-Core
Geekbench 5.5: Multi-Core | Single-Core
HWBOT x265 Benchmark v2.2: 4k Preset
LibreOffice : 20 Documents To PDF
R Benchmark 2.5: Overall mean
* ... smaller is better
AIDA64: FP32 Ray-Trace | FPU Julia | CPU SHA3 | CPU Queen | FPU SinJulia | FPU Mandel | CPU AES | CPU ZLib | FP64 Ray-Trace | CPU PhotoWorxx
| Performance Rating | |
| Beelink SER9 | |
| GMK NucBox K9 | |
| Maxtang MTN-ALN50 | |
| Beelink EQ14 | |
| Average Intel Processor N150 | |
| Newsmay AC8F-POE | |
| Asus ExpertCenter PN42-BBN200MV | |
| Beelink Mini S12 Pro | |
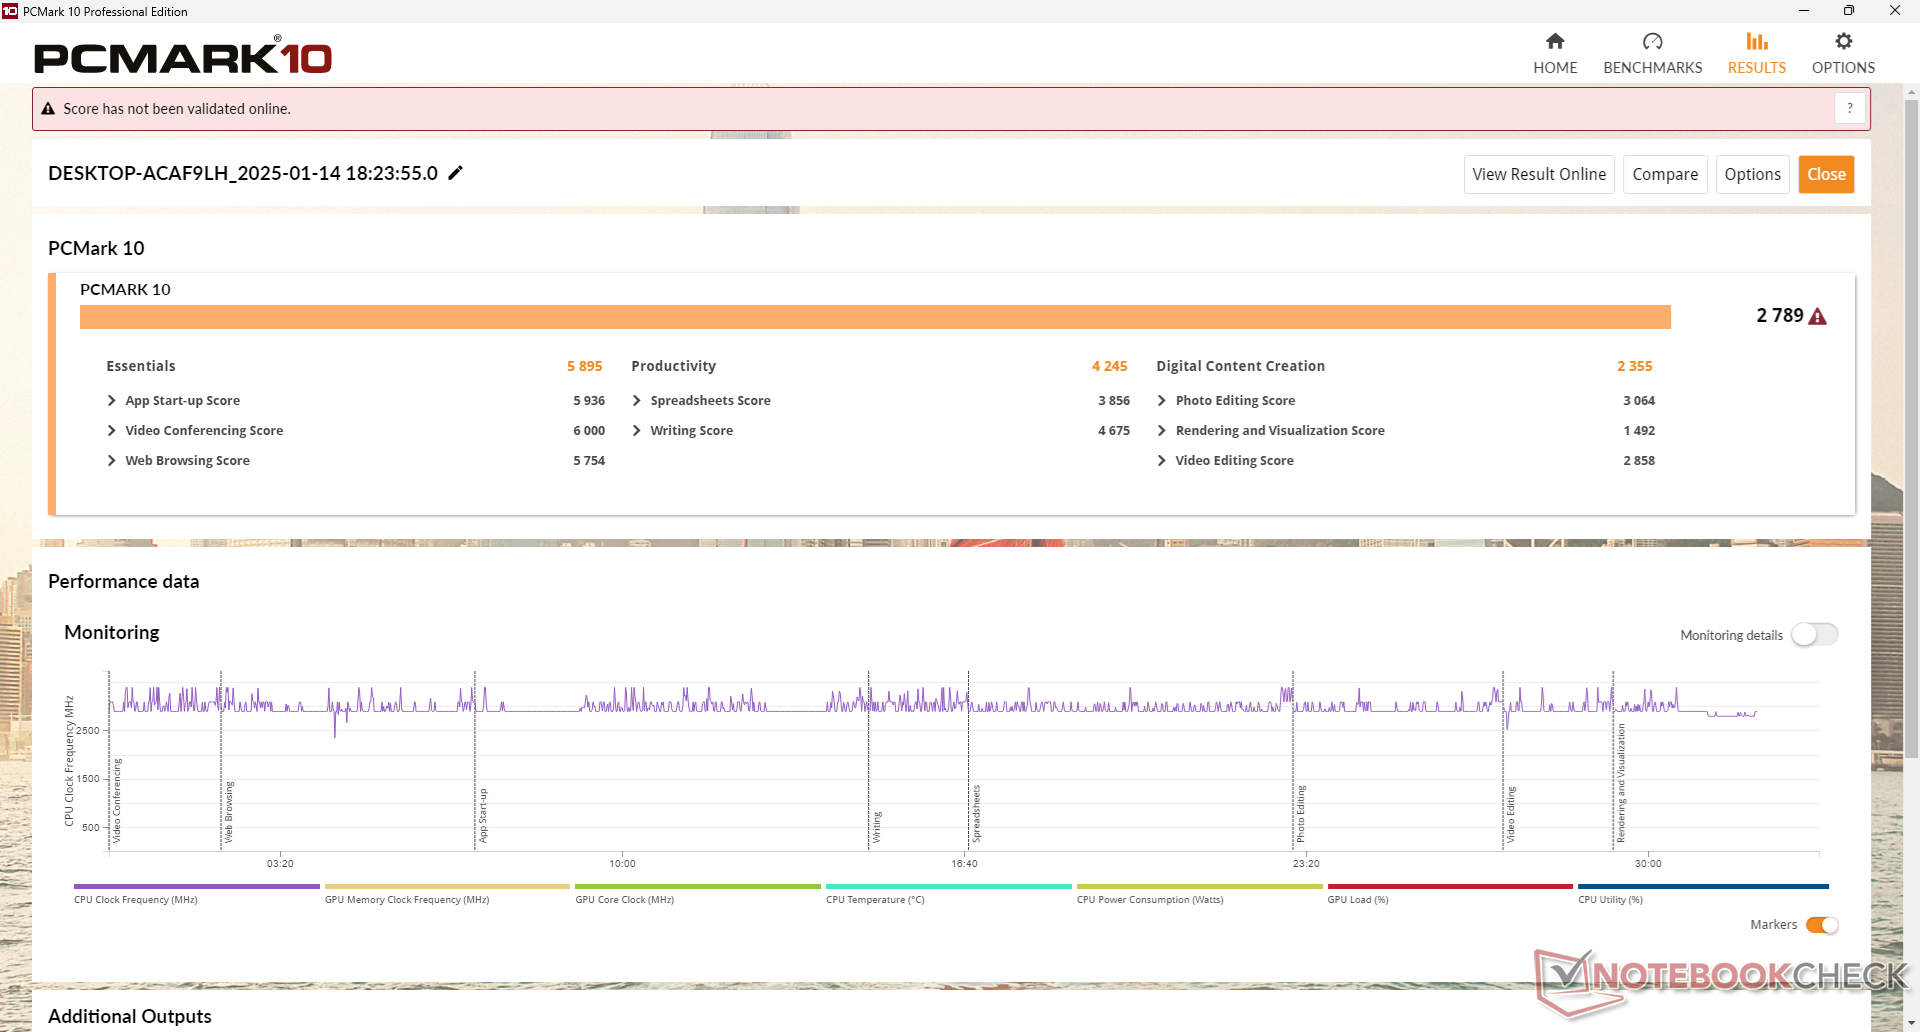
系统性能
PCMark 结果与旧版 N100 相当,表明在浏览或电子表格等常见日常工作负载中,较新的 N150 的整体性能并没有明显提高。
CrossMark: Overall | Productivity | Creativity | Responsiveness
WebXPRT 3: Overall
WebXPRT 4: Overall
Mozilla Kraken 1.1: Total
| PCMark 10 / Score | |
| Beelink SER9 | |
| GMK NucBox K9 | |
| Maxtang MTN-ALN50 | |
| Beelink Mini S12 Pro | |
| Average Intel Processor N150, Intel UHD Graphics 24EUs (Alder Lake-N) (2706 - 3050, n=3) | |
| Beelink EQ14 | |
| Newsmay AC8F-POE | |
* ... smaller is better
| PCMark 10 Score | 2789 points | |
Help | ||
| AIDA64 / Memory Copy | |
| Beelink SER9 | |
| GMK NucBox K9 | |
| Maxtang MTN-ALN50 | |
| Beelink EQ14 | |
| Average Intel Processor N150 (18528 - 22582, n=3) | |
| Asus ExpertCenter PN42-BBN200MV | |
| Newsmay AC8F-POE | |
| Beelink Mini S12 Pro | |
* ... smaller is better
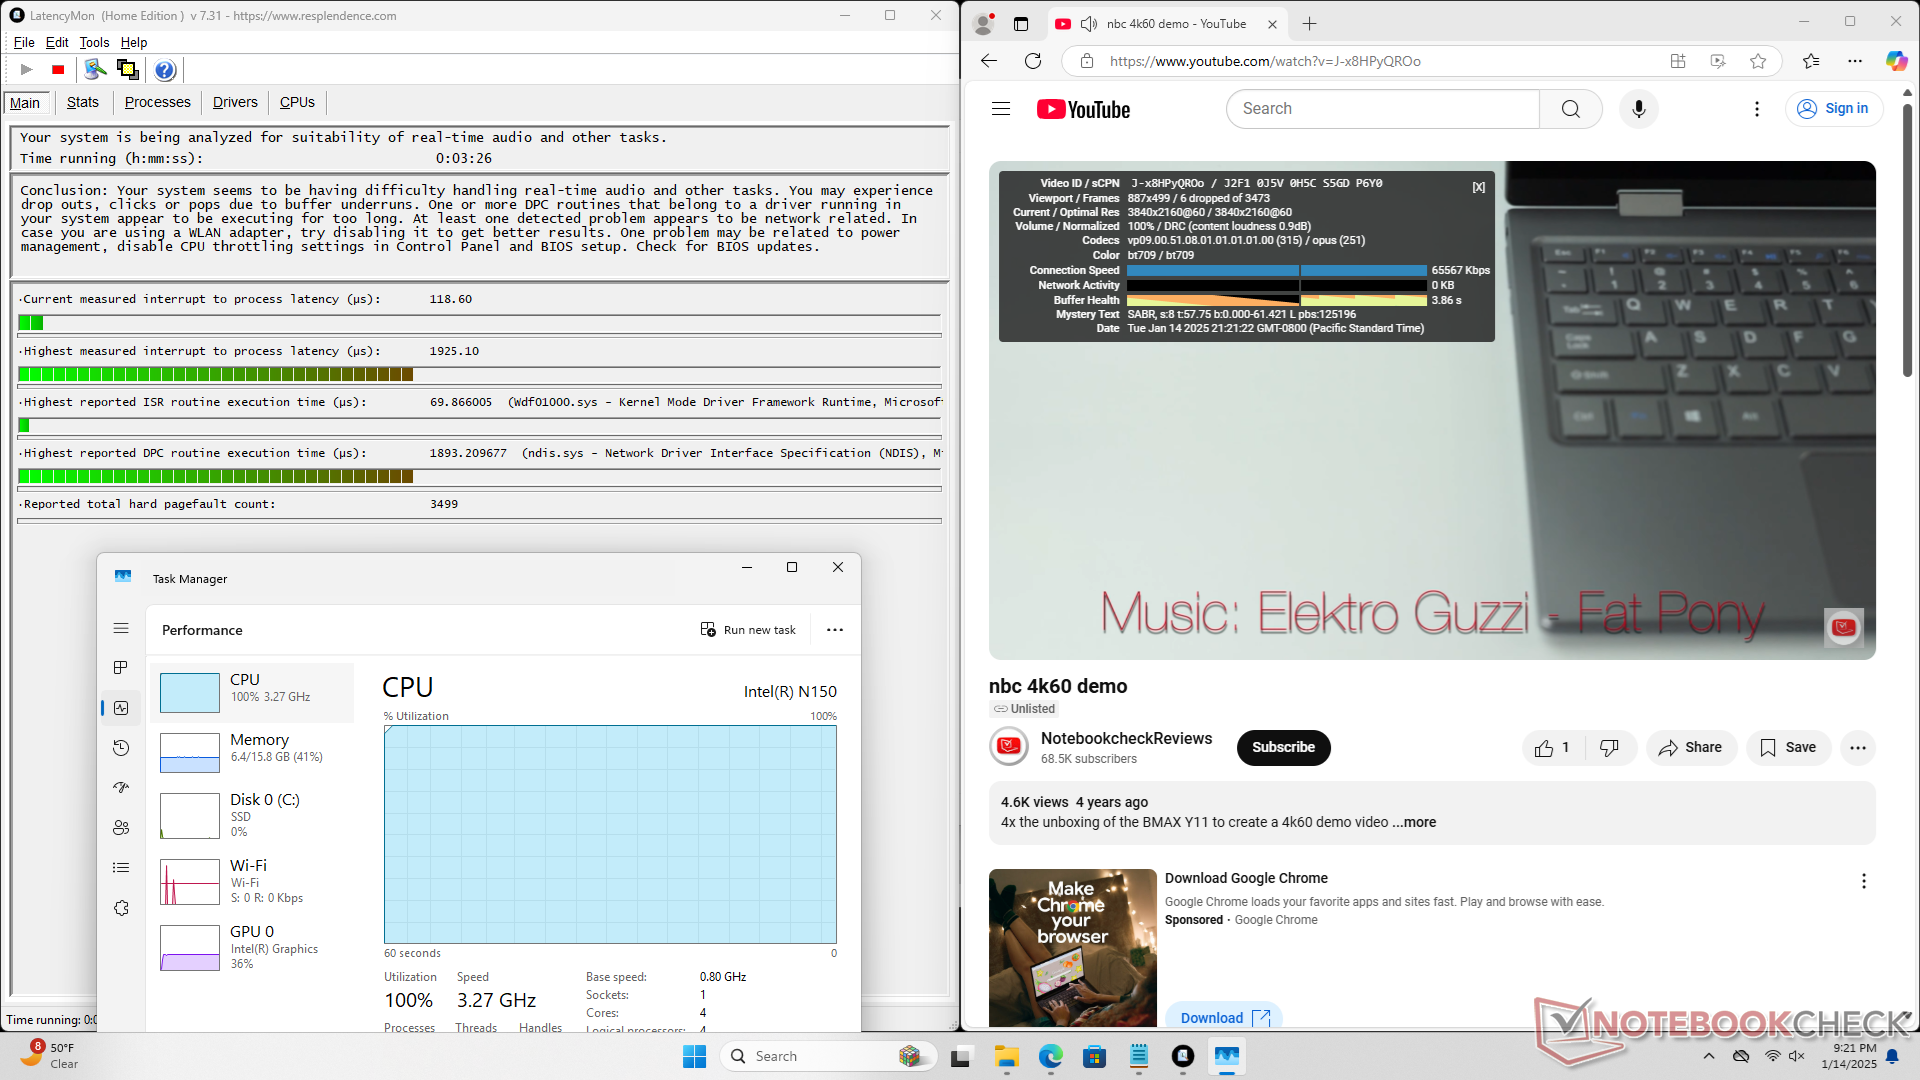
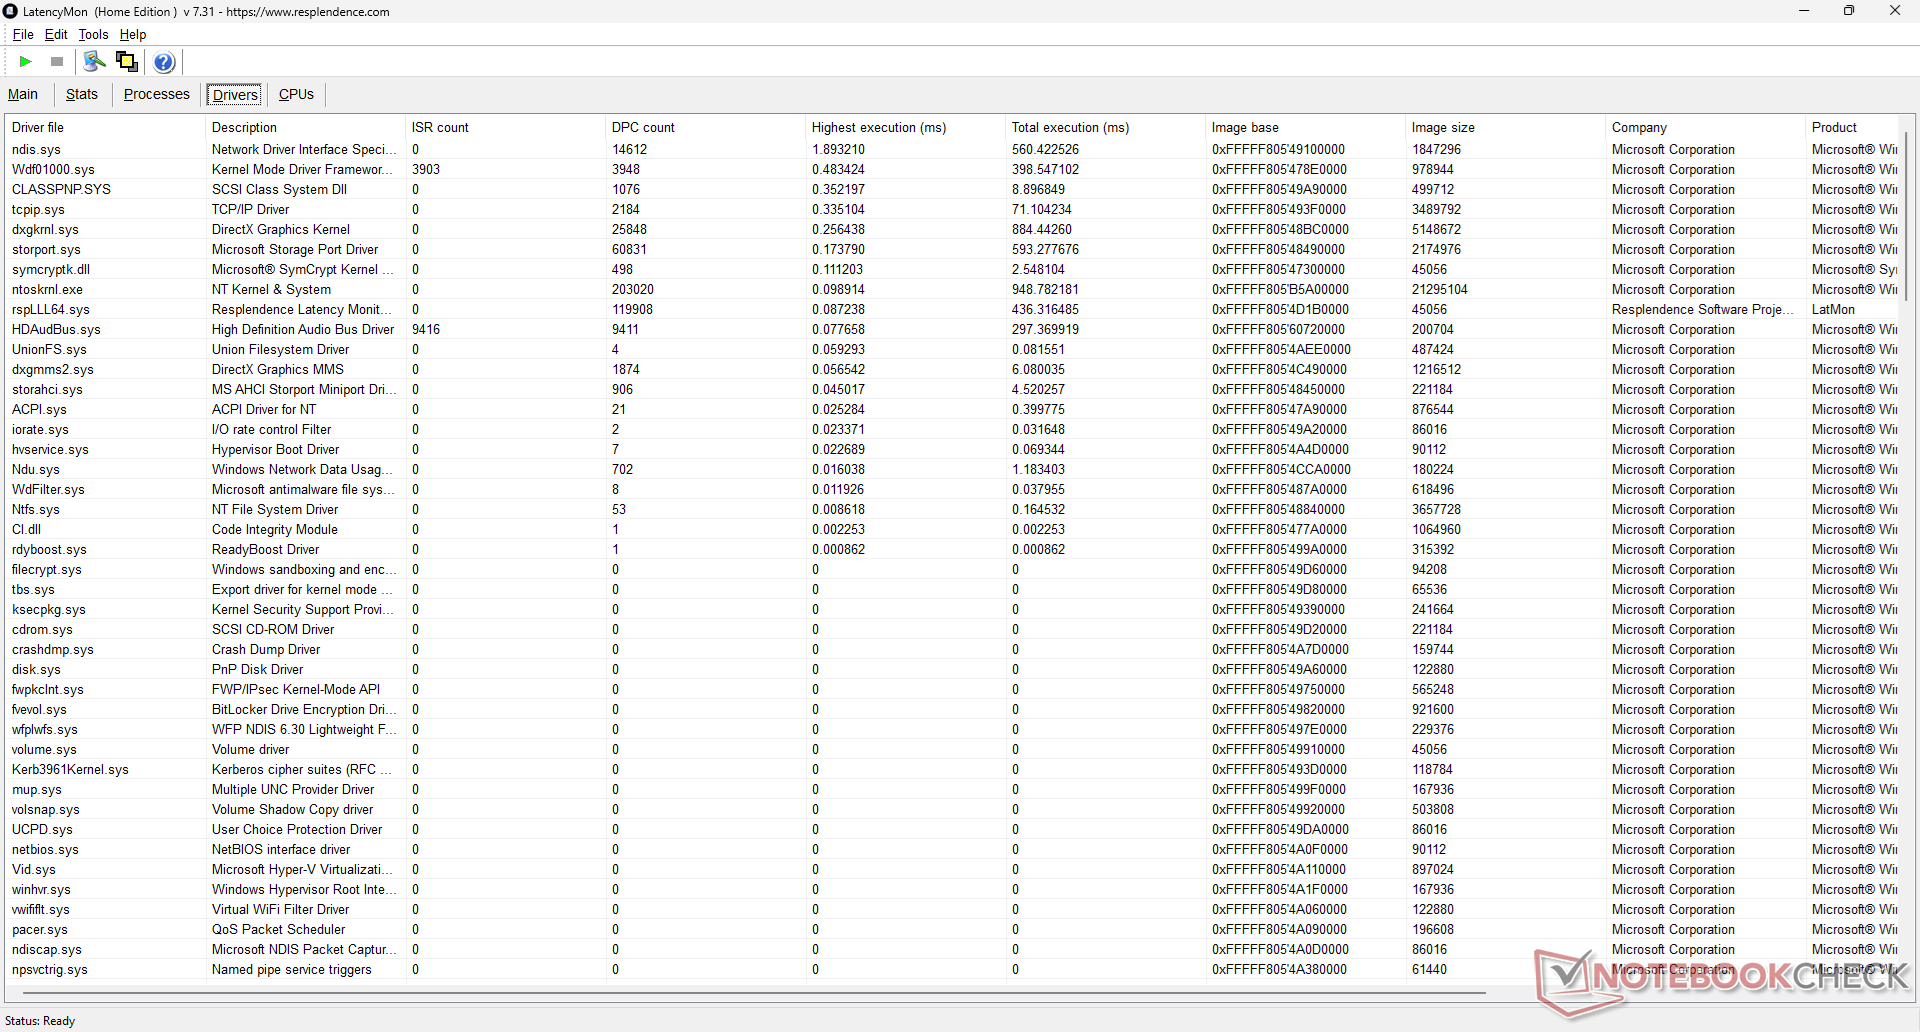
DPC 延迟
在打开我们主页的多个浏览器标签时,LatencyMon 显示了 DPC 问题。4K60 视频播放也不尽如人意,在 60 秒的时间范围内出现了 6 次丢帧,即使经过多次重新测试也是如此。尽管检查了后台活动,但 CPU 使用率也异常高,达到 100%,这意味着在视频播放过程中执行多任务很可能会导致跳帧或卡顿。
| DPC Latencies / LatencyMon - interrupt to process latency (max), Web, Youtube, Prime95 | |
| GMK NucBox K9 | |
| Beelink Mini S12 Pro | |
| Asus ExpertCenter PN42-BBN200MV | |
| Maxtang MTN-ALN50 | |
| Beelink EQ14 | |
| Newsmay AC8F-POE | |
* ... smaller is better
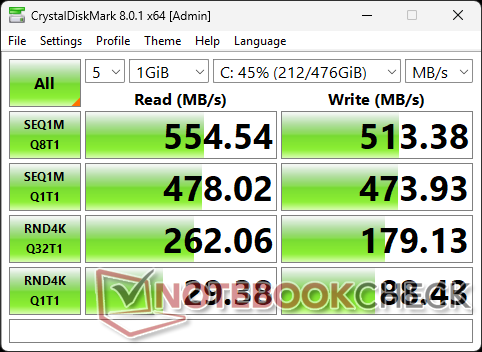
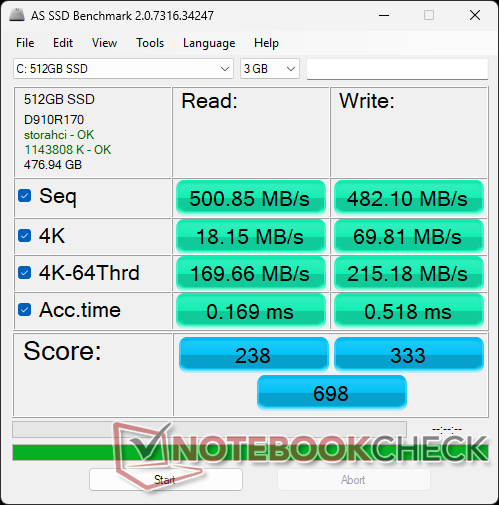
存储设备
作为一项节约成本的措施,该系统配备了 M.2 SATA III 固态硬盘,而不是 NVMe。传输速率稳定在每秒约 500 MB,这基本上是 SATA III 接口的极限。


| Drive Performance Rating - Percent | |
| GMK NucBox K9 | |
| Beelink SER9 | |
| Beelink Mini S12 Pro | |
| Asus ExpertCenter PN42-BBN200MV | |
| Maxtang MTN-ALN50 | |
| Beelink EQ14 | |
| Newsmay AC8F-POE | |
* ... smaller is better
Disk Throttling: DiskSpd Read Loop, Queue Depth 8
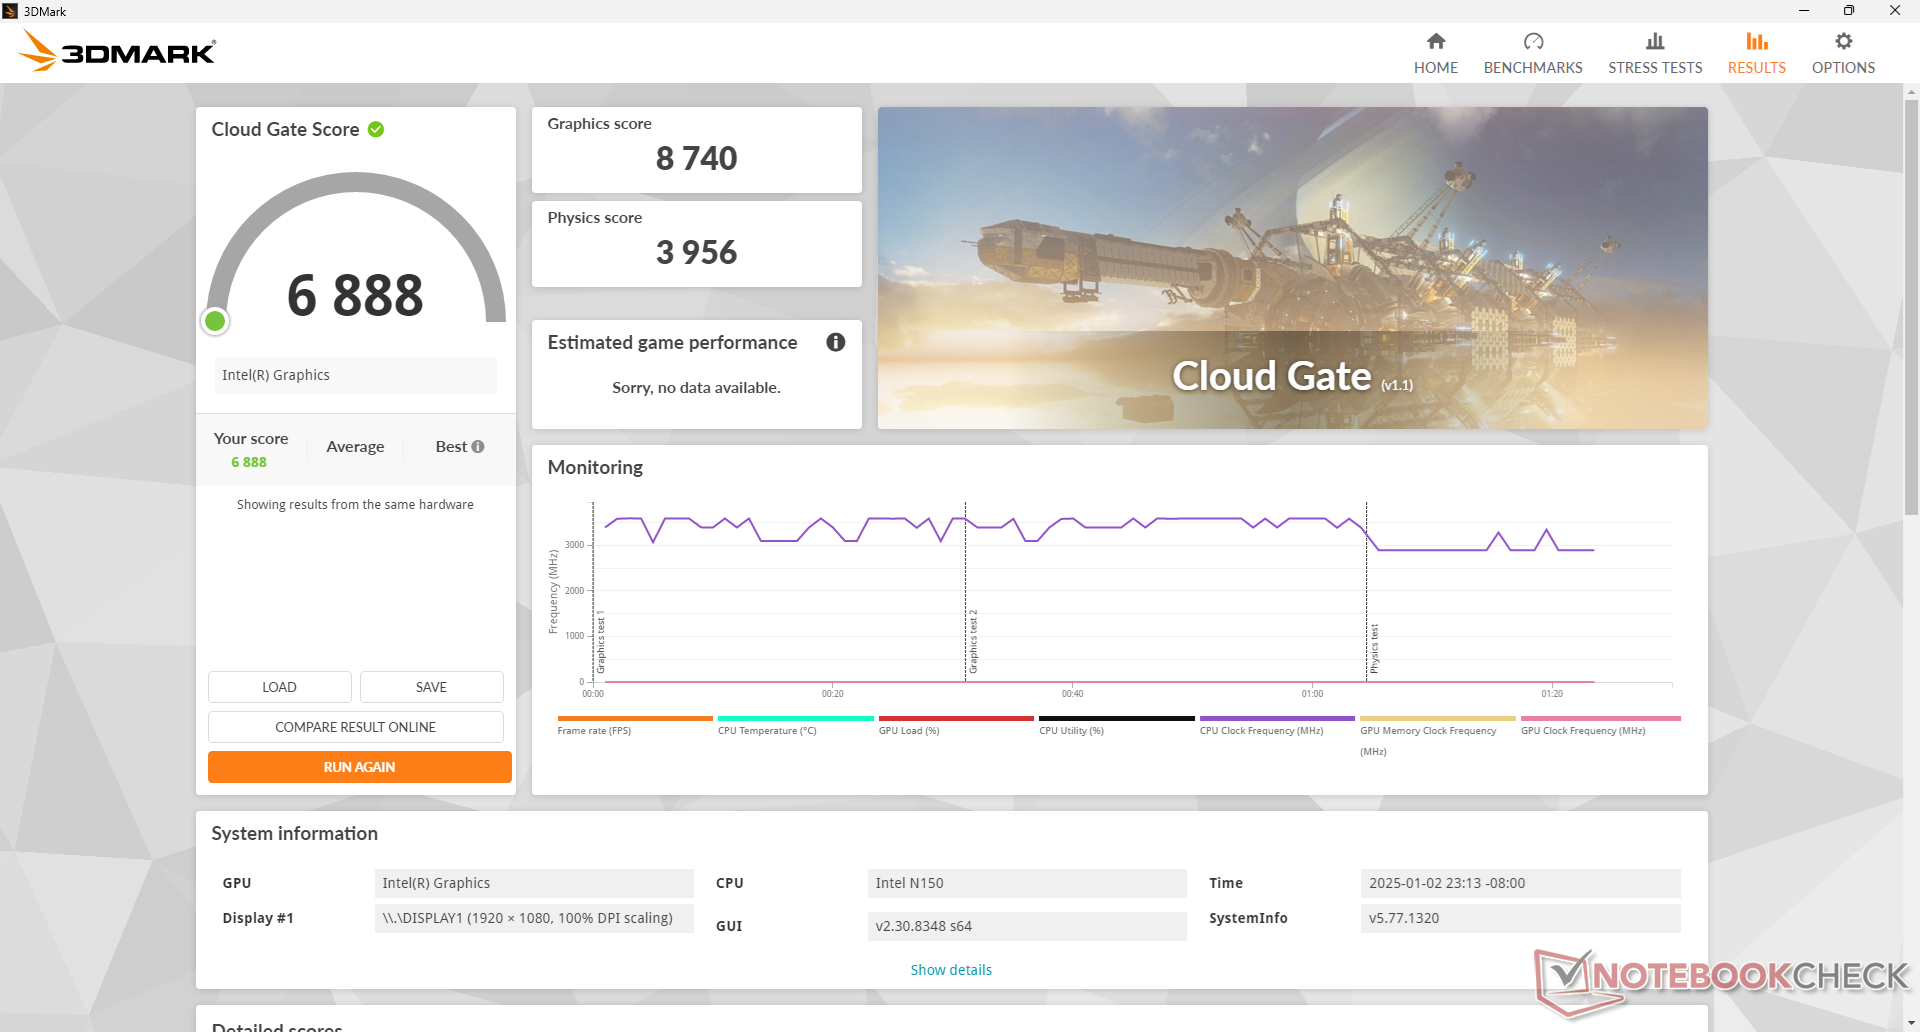
图形处理器性能
综合 UHD Graphics 24 个欧盟和以前一样,性能没有明显提升。无论图形设置如何,它都无法在本地运行大多数游戏。
某些游戏无法启动,包括X-Plane 11.11。
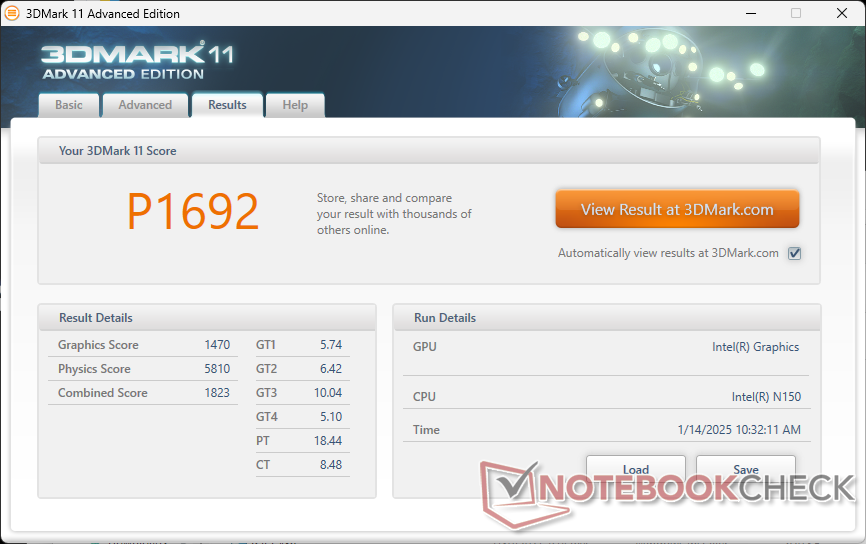
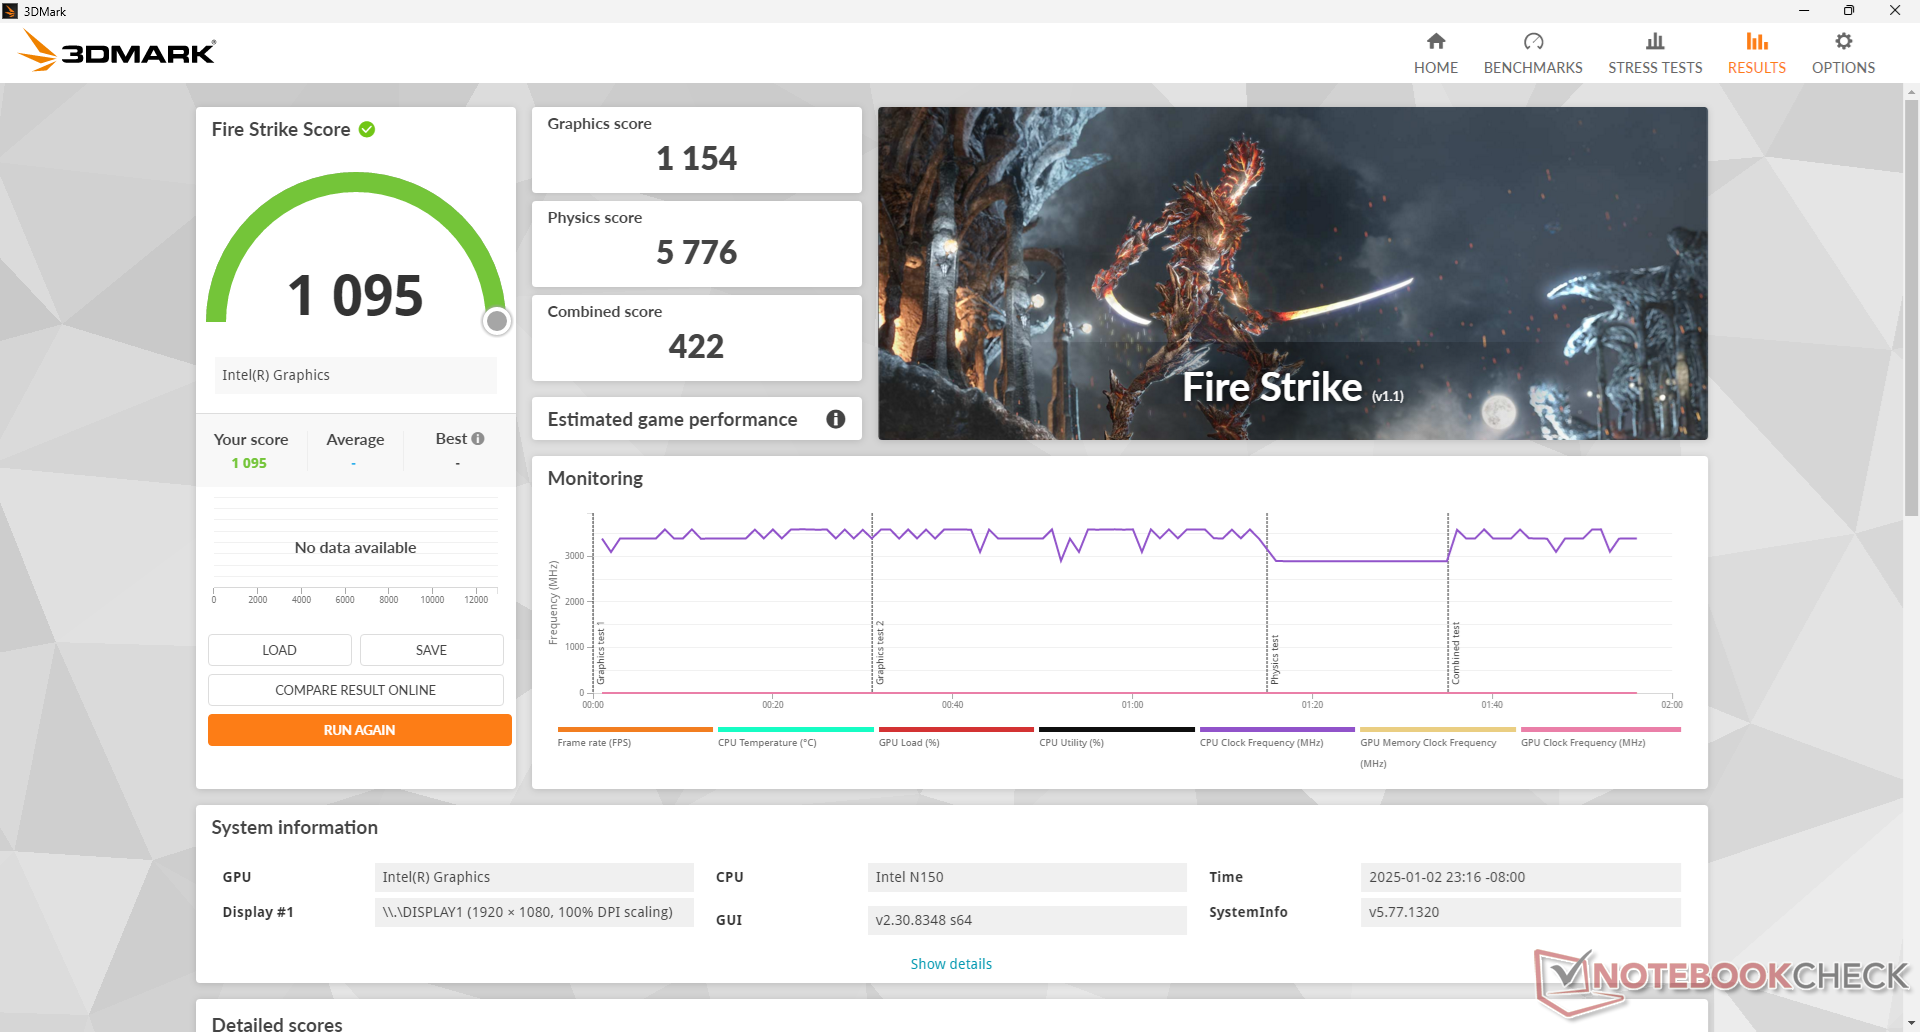
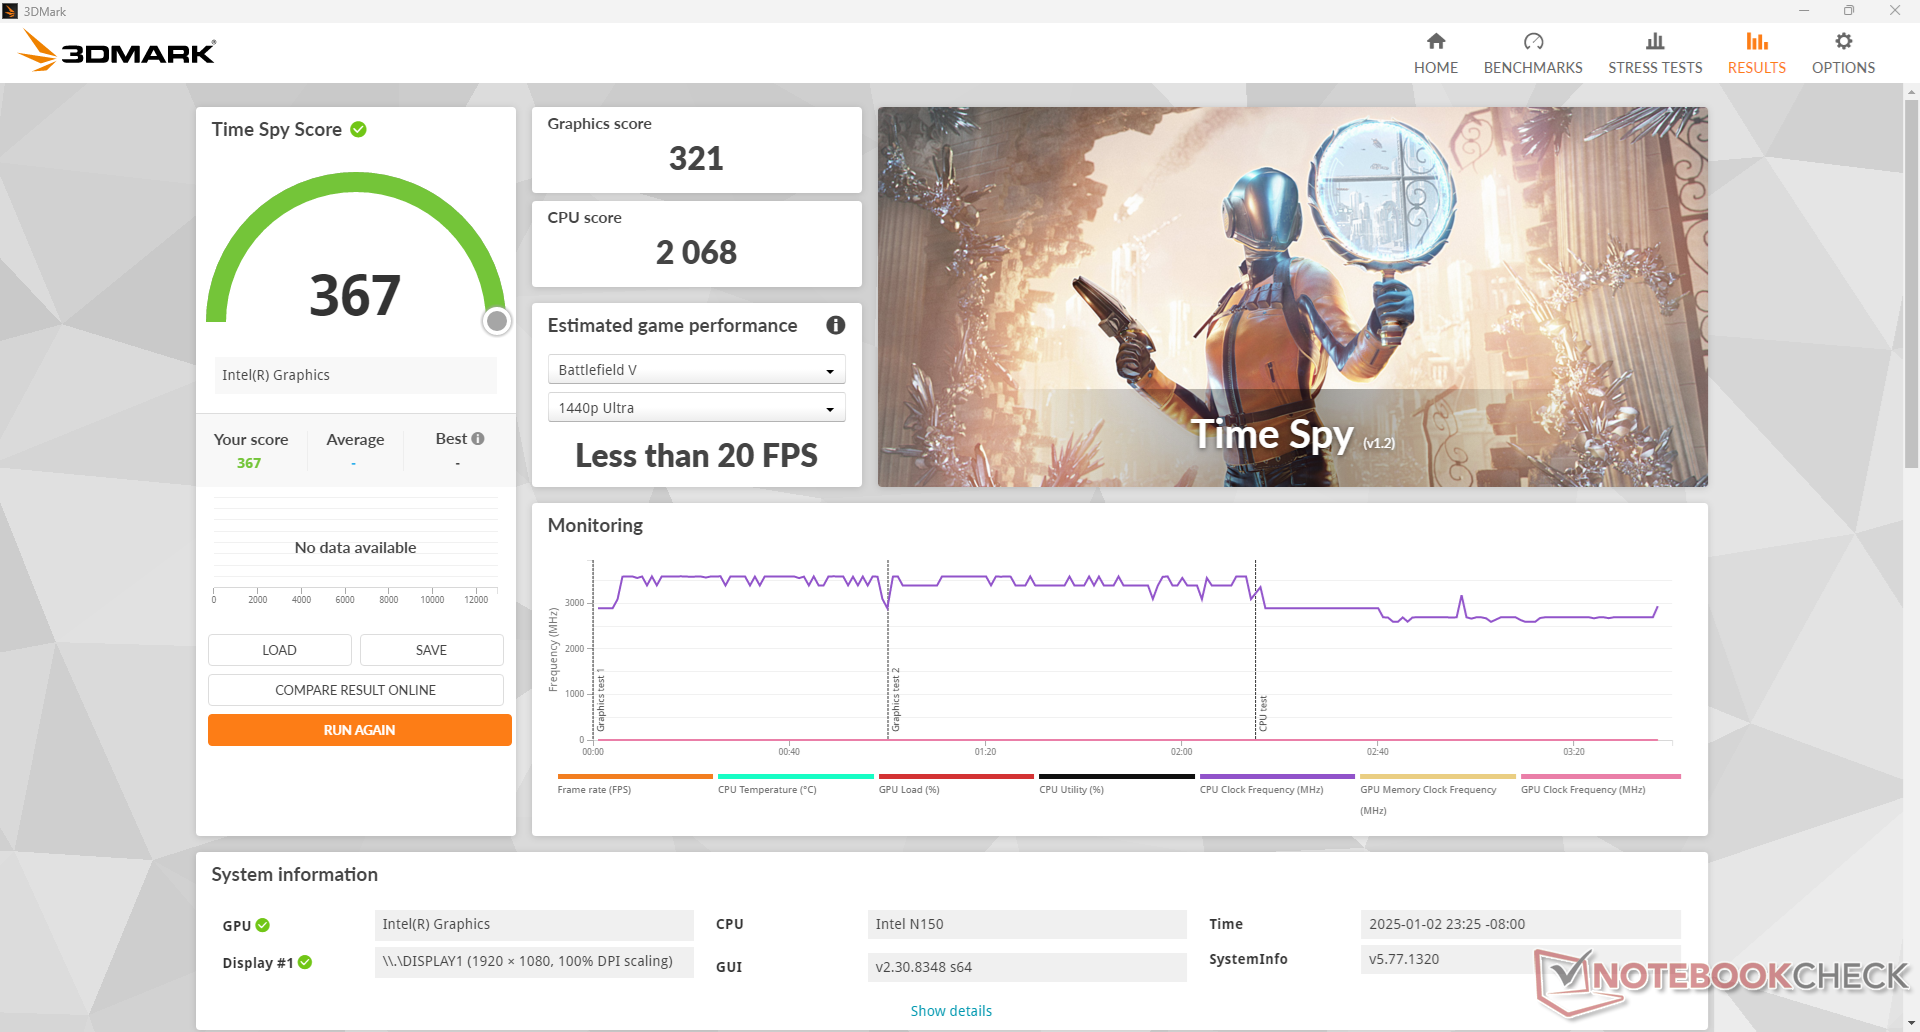
| 3DMark 11 Performance | 1692 points | |
| 3DMark Cloud Gate Standard Score | 6888 points | |
| 3DMark Fire Strike Score | 1095 points | |
| 3DMark Time Spy Score | 367 points | |
Help | ||
* ... smaller is better
Cyberpunk 2077 ultra FPS Chart
| low | med. | high | ultra | |
|---|---|---|---|---|
| GTA V (2015) | 54.4 | 43.1 | 6.05 | 2.71 |
| Dota 2 Reborn (2015) | 58.2 | 28.8 | 21.8 | 20.1 |
| Final Fantasy XV Benchmark (2018) | 17.2 | |||
| Far Cry 5 (2018) | 10 | |||
| Strange Brigade (2018) | 26.6 | 10.1 | ||
| Tiny Tina's Wonderlands (2022) | ||||
| F1 22 (2022) | 10.7 | |||
| Baldur's Gate 3 (2023) | ||||
| Cyberpunk 2077 2.2 Phantom Liberty (2023) |
排放量
系统噪音
虽然有一个内部风扇,但在 22.5 dB(A) 的静音背景下,风扇噪音仅为 24 dB(A)左右,几乎听不到。在典型的 HTPC 或办公环境中,即使运行苛刻的负载,它也能保持安静,基本上不会被察觉。
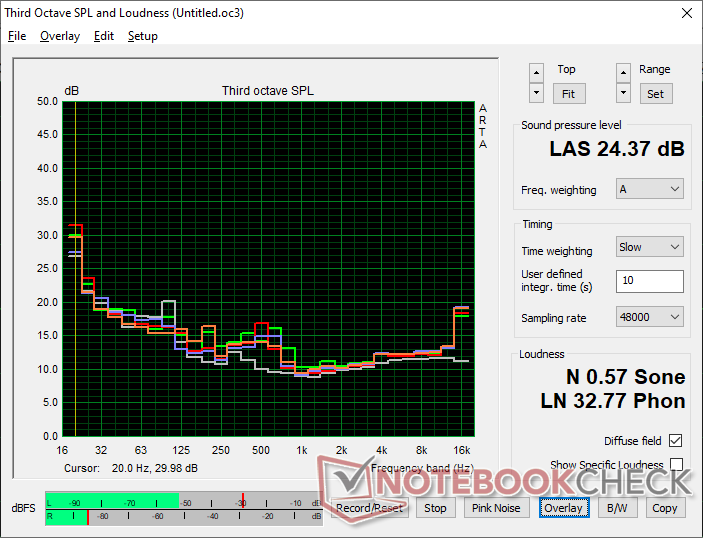
Noise Level
| Idle |
| 23.5 / 23.5 / 23.8 dB(A) |
| Load |
| 24 / 24.4 dB(A) |
 | ||
30 dB silent 40 dB(A) audible 50 dB(A) loud |
||
min: | ||
| Beelink EQ14 UHD Graphics 24EUs (Alder Lake-N), Processor N150 | Beelink SER9 Radeon 890M, Ryzen AI 9 HX 370, Crucial P3 Plus CT1000P3PSSD8 | GMK NucBox K9 Arc 7-Core, Ultra 5 125H, MasonSemi 1TB MC7000 | Newsmay AC8F-POE UHD Graphics 24EUs (Alder Lake-N), N100, AirDisk AFF 10-128G | Maxtang MTN-ALN50 UHD Graphics 32EUs, i3-N305, Foresee 512GB | Asus ExpertCenter PN42-BBN200MV UHD Graphics Xe 750 32EUs, N200, Kingston KC3000 2048G SKC3000D2048G | Beelink Mini S12 Pro UHD Graphics 24EUs (Alder Lake-N), N100 | |
|---|---|---|---|---|---|---|---|
| Noise | -24% | -53% | -5% | -25% | -6% | -20% | |
| off / environment * | 22.5 | 23.2 -3% | 23 -2% | 24.8 -10% | 25 -11% | 25 -11% | 23.3 -4% |
| Idle Minimum * | 23.5 | 26.6 -13% | 29.8 -27% | 24.8 -6% | 25.1 -7% | 25 -6% | 26.3 -12% |
| Idle Average * | 23.5 | 26.8 -14% | 35.7 -52% | 24.8 -6% | 25.1 -7% | 25 -6% | 26.3 -12% |
| Idle Maximum * | 23.8 | 26.8 -13% | 35.7 -50% | 24.8 -4% | 25.1 -5% | 25 -5% | 26.3 -11% |
| Load Average * | 24 | 33.4 -39% | 41.9 -75% | 24.9 -4% | 34.5 -44% | 25 -4% | 31.9 -33% |
| Cyberpunk 2077 ultra * | 23.8 | 34.6 -45% | 43.8 -84% | ||||
| Load Maximum * | 24.4 | 33.8 -39% | 44 -80% | 25 -2% | 43 -76% | 25 -2% | 36.7 -50% |
| Witcher 3 ultra * | 33 |
* ... smaller is better
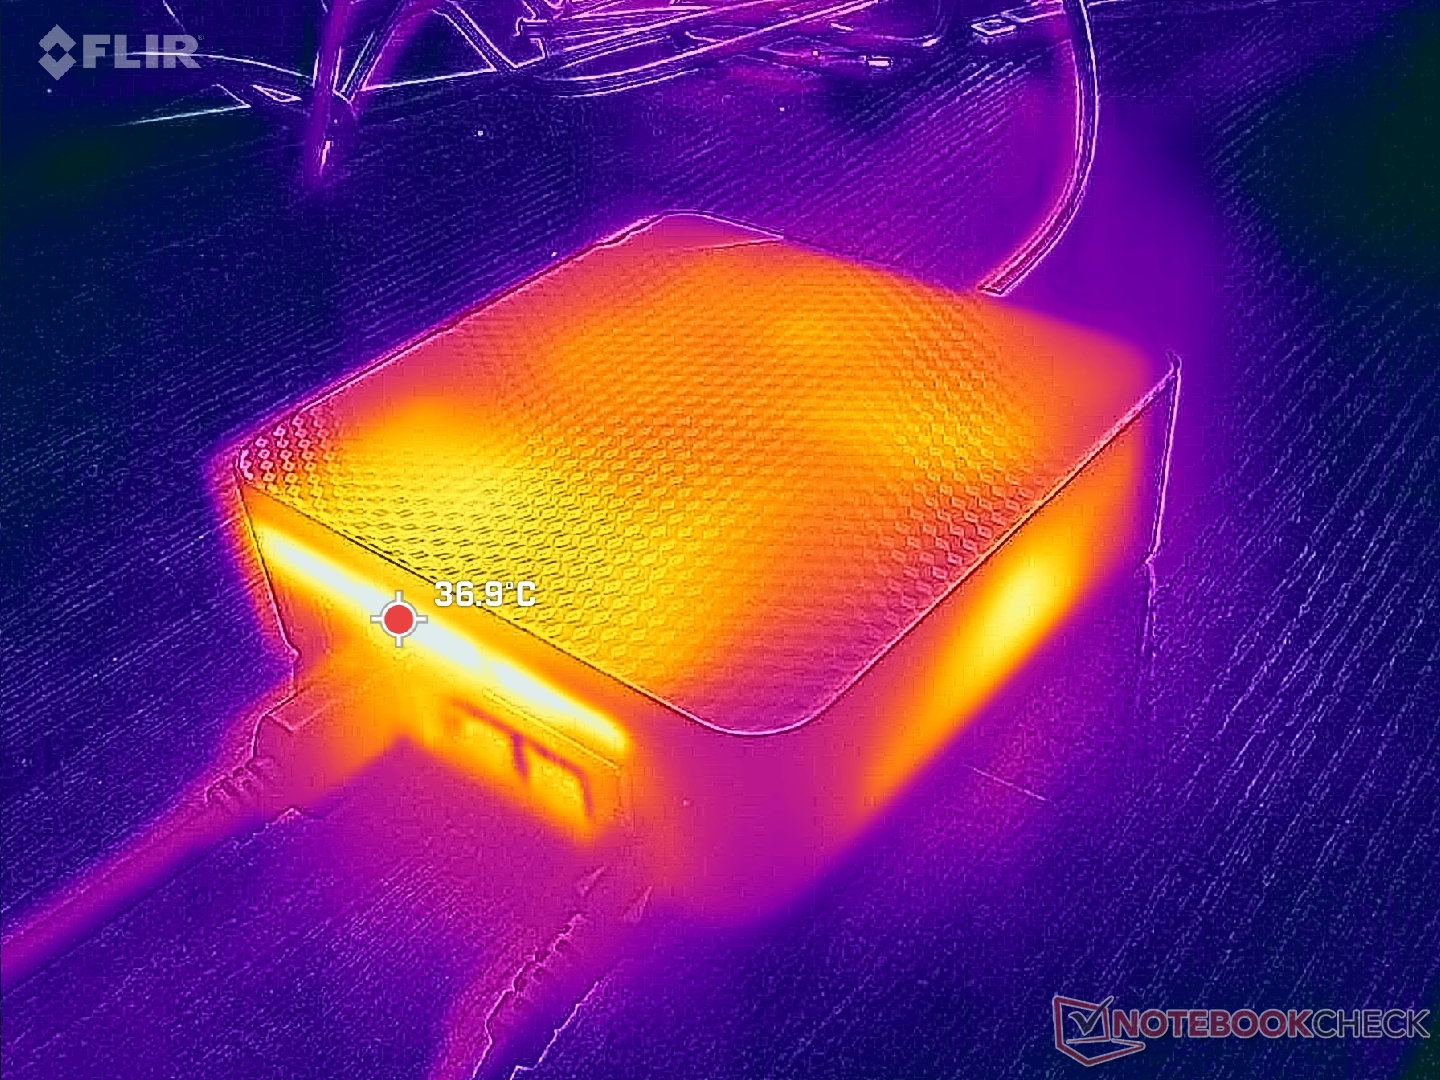
温度
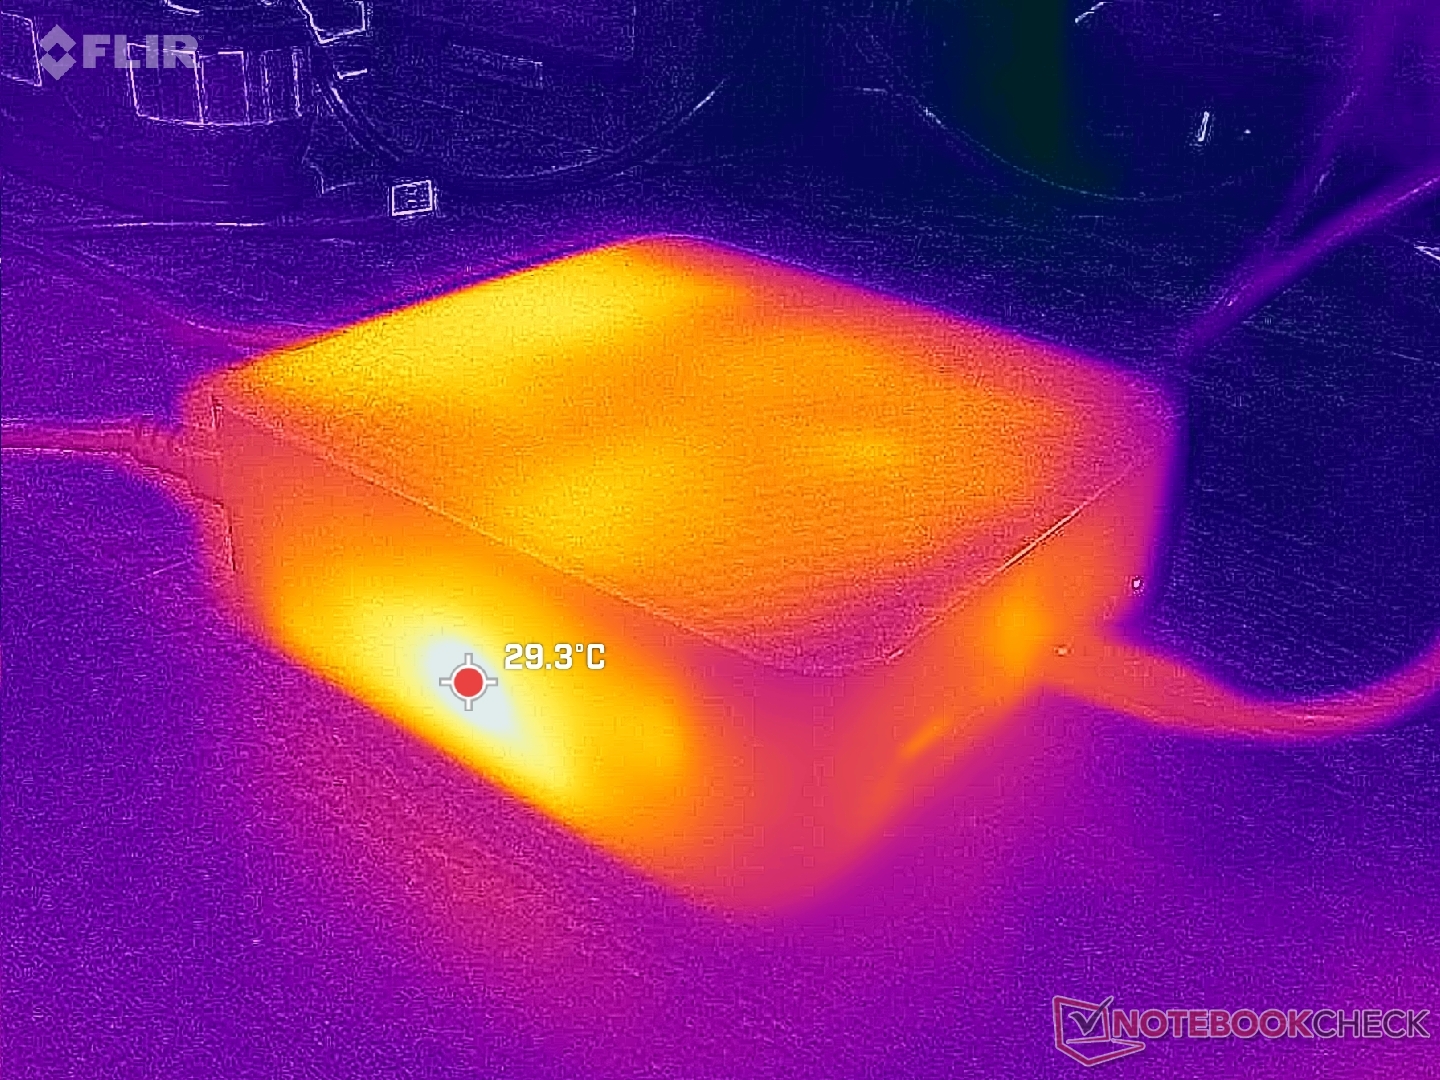
表面温度很低,无论负载多大,都不会出现问题,这对于这样一台集成 PSU 的小型迷你 PC 来说令人印象深刻。无论是怠速运行还是长时间运行要求苛刻的应用程序,机身后部的最高温度都达到了 37 摄氏度。


压力测试
在启动 Prime95 压力测试时,CPU 会提升到 2.9 GHz 和 24 W。然而,几秒钟后核心温度达到 70 摄氏度时,处理器频率会下降并稳定在 2.4 GHz 和 20 W,以保持 66 摄氏度的稍低核心温度。
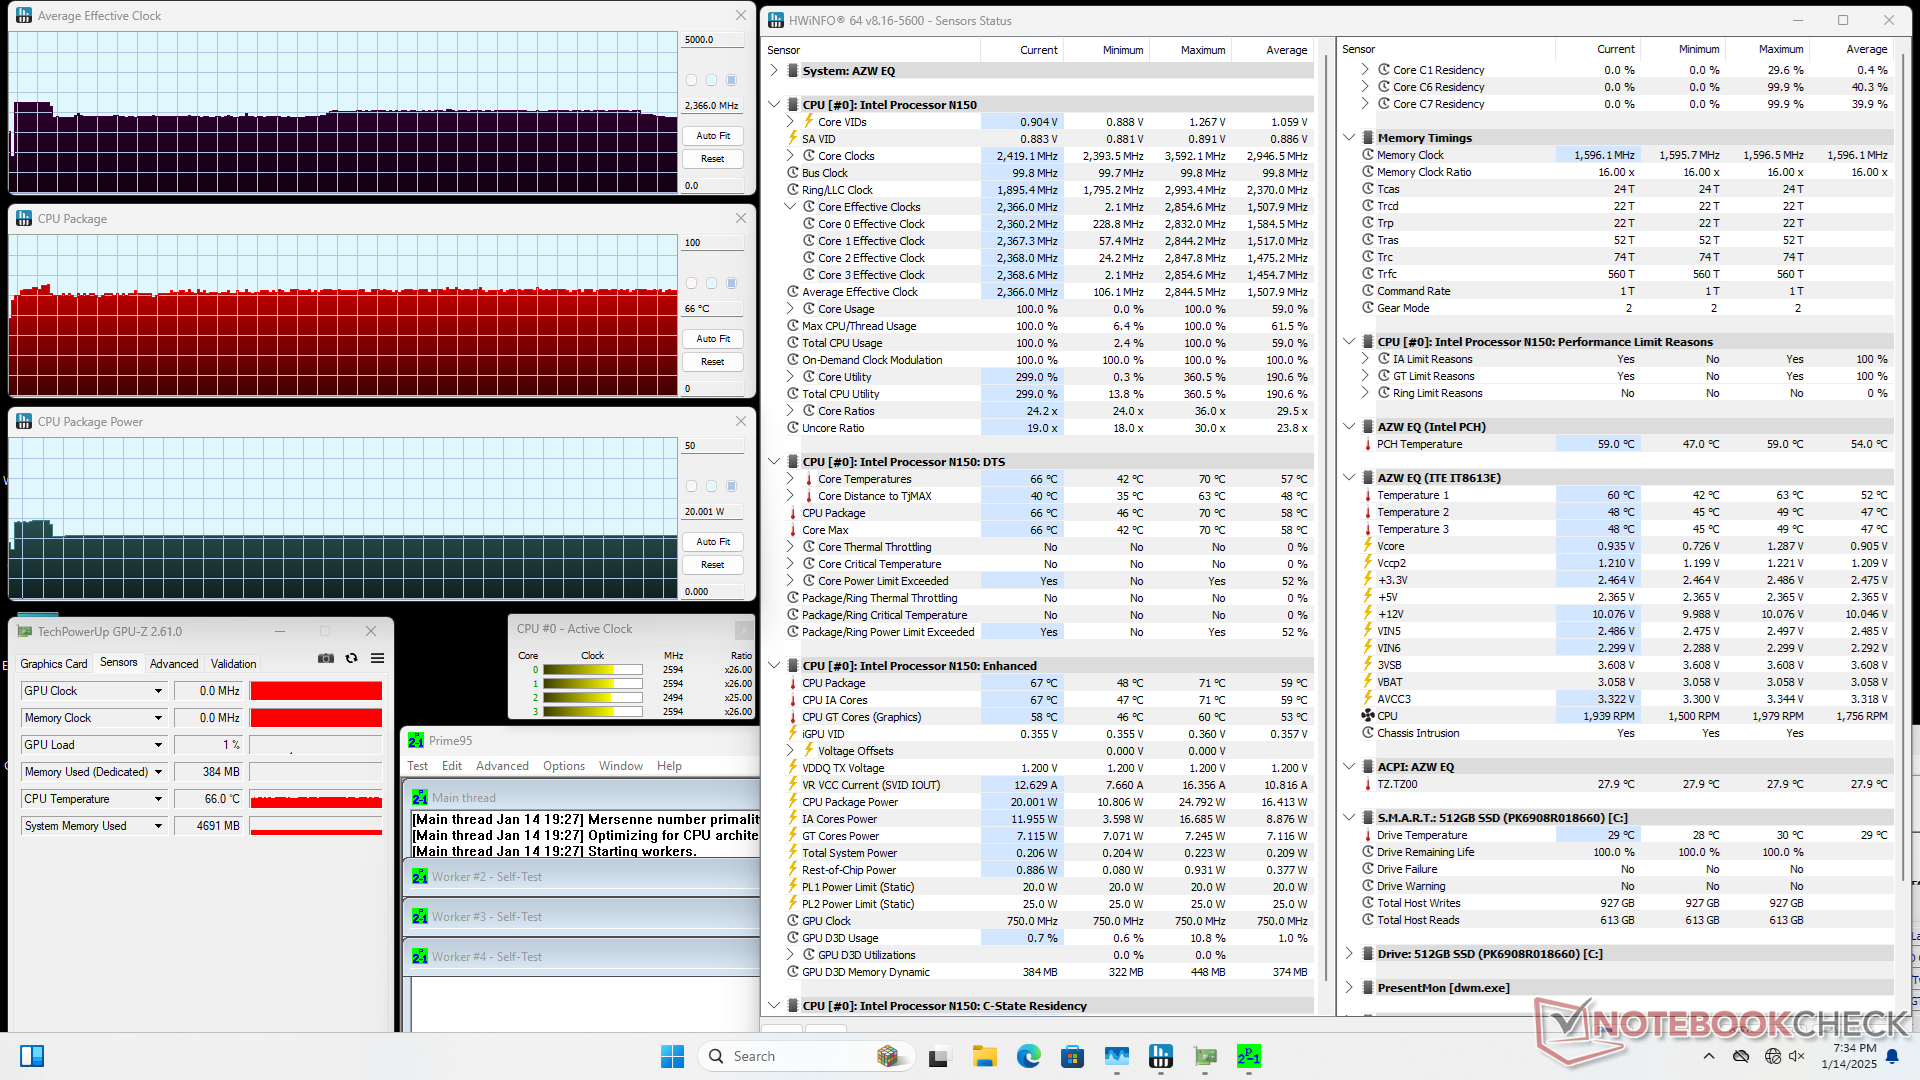
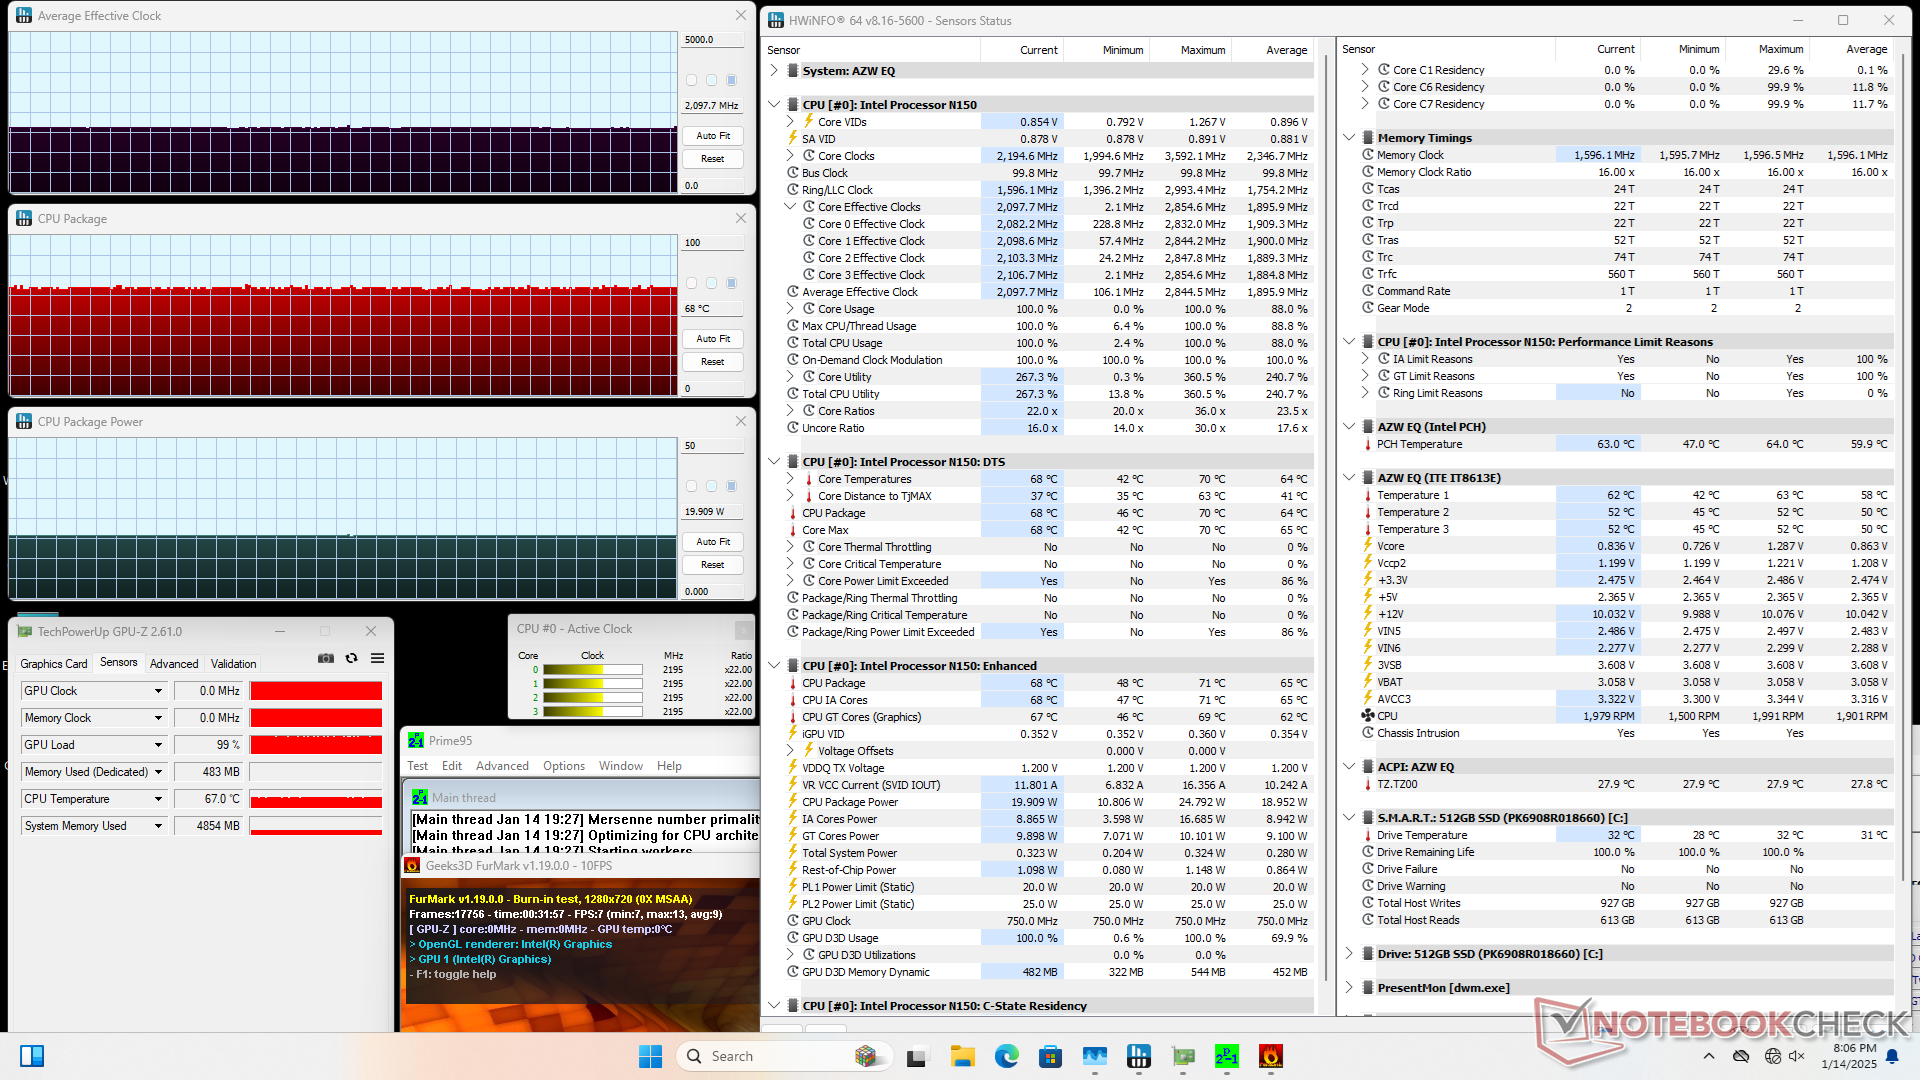
| CPU 平均时钟 (GHz) | GPU 时钟 (MHz) | CPU 平均温度 (°C) | |
| 系统闲置 | -- | -- | 48 |
| Prime95 压力 | 2.4 | -- | 66 |
| Prime95 + FurMark Stress | 2.1 | 750 | 68 |
| 赛博朋克 2077》压力 | 1.5 | 750 | 64 |
能源管理
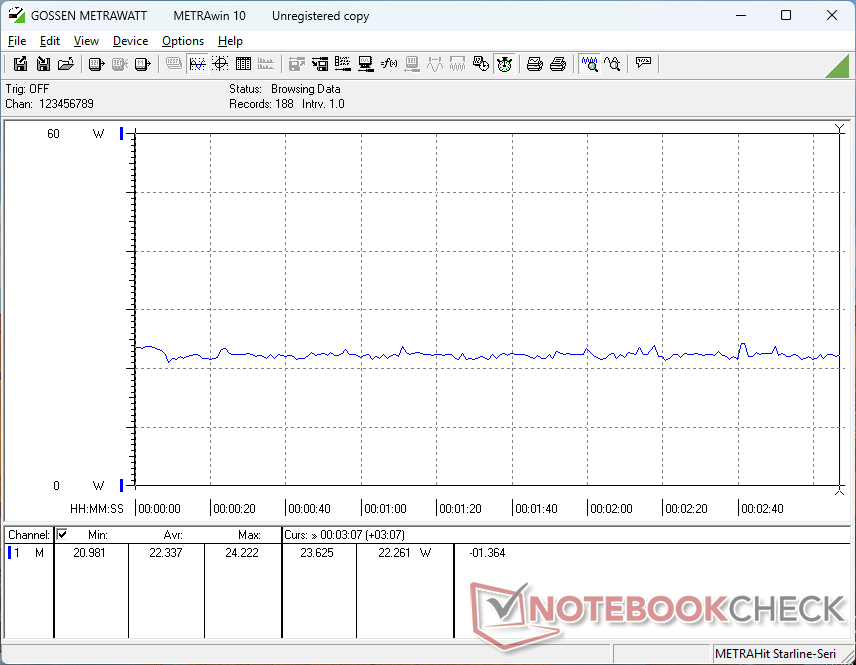
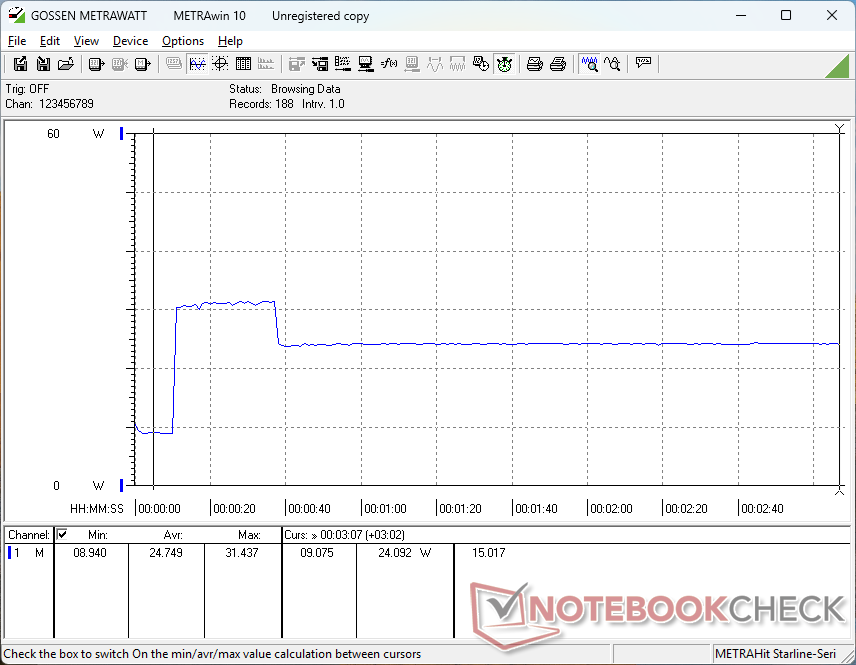
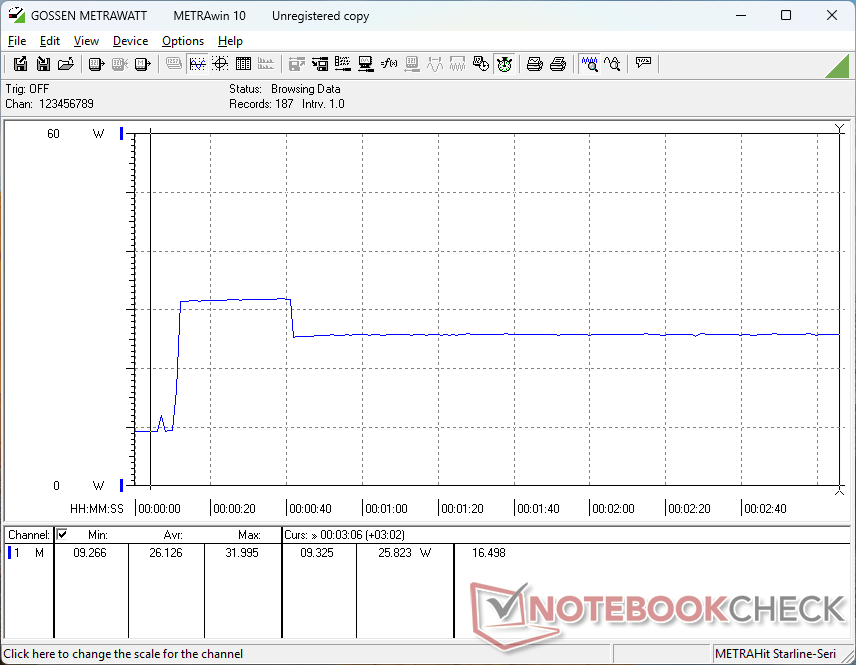
耗电量
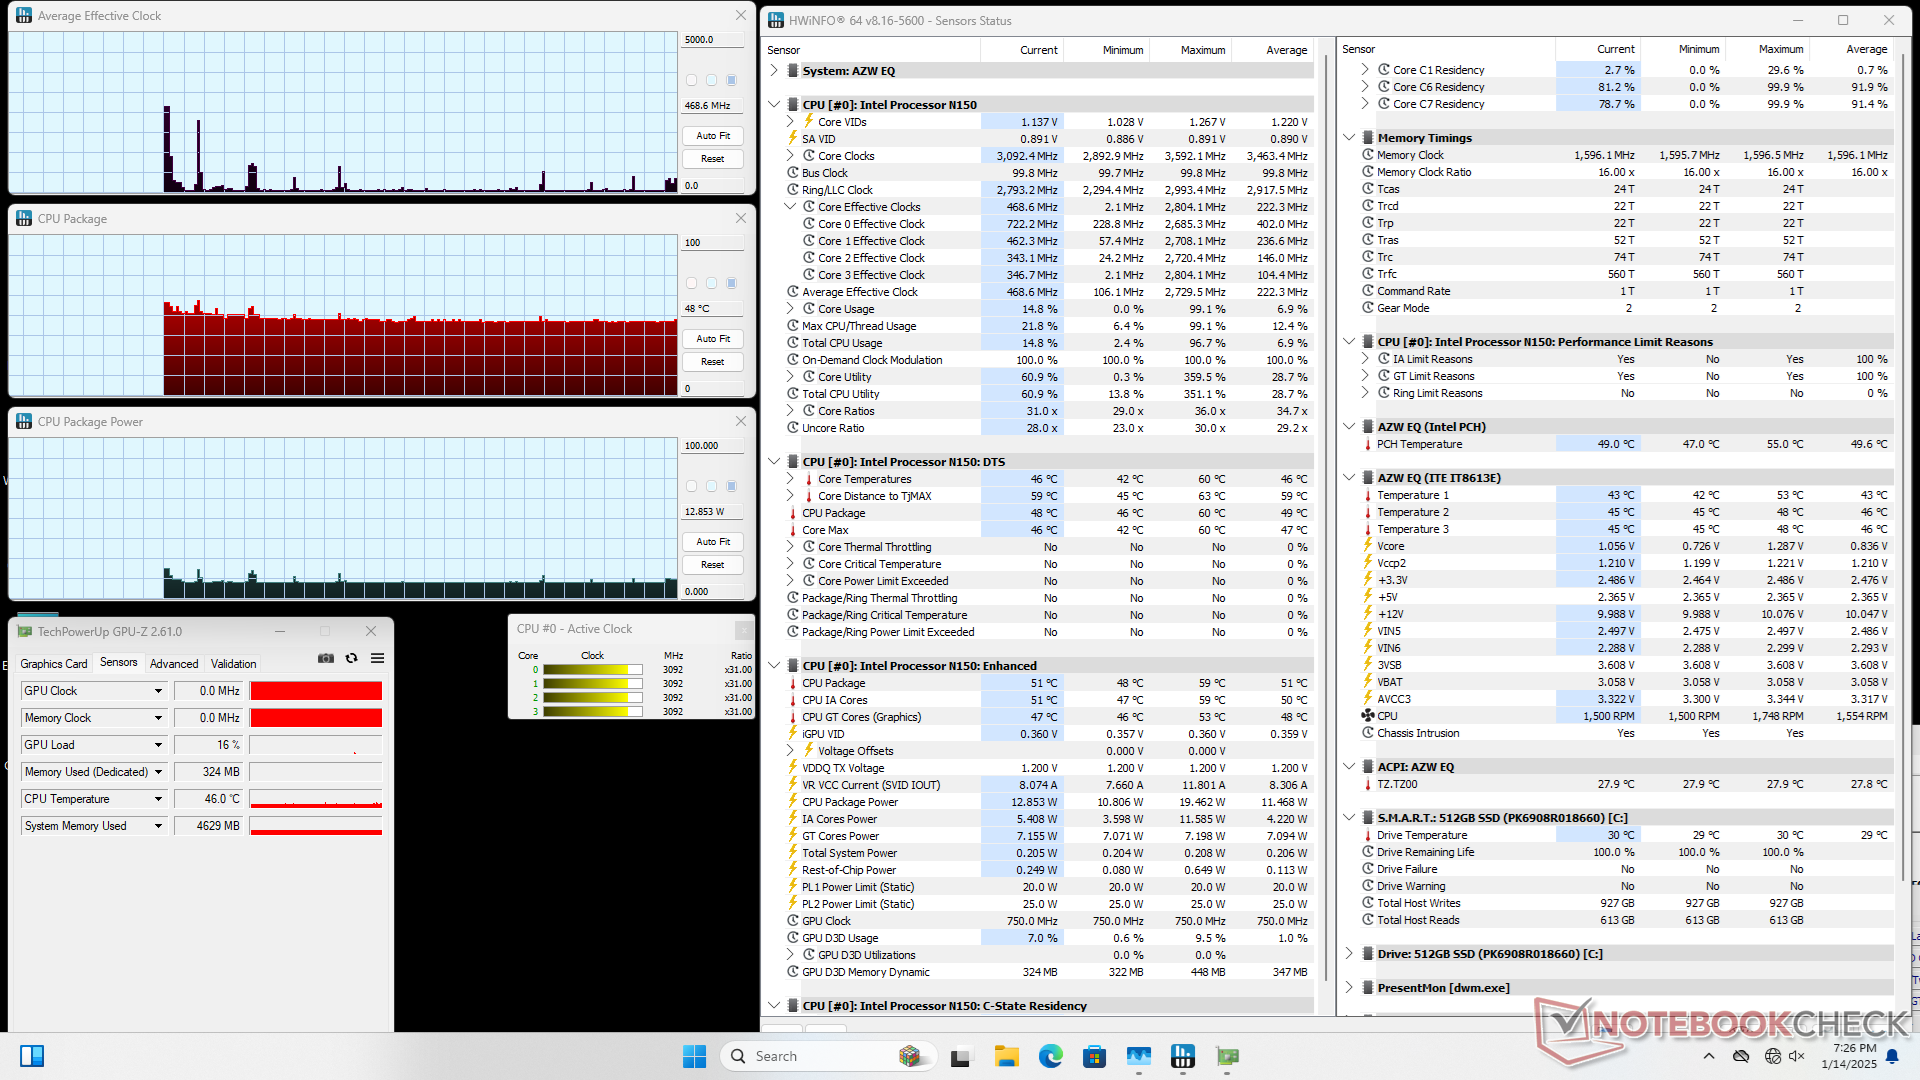
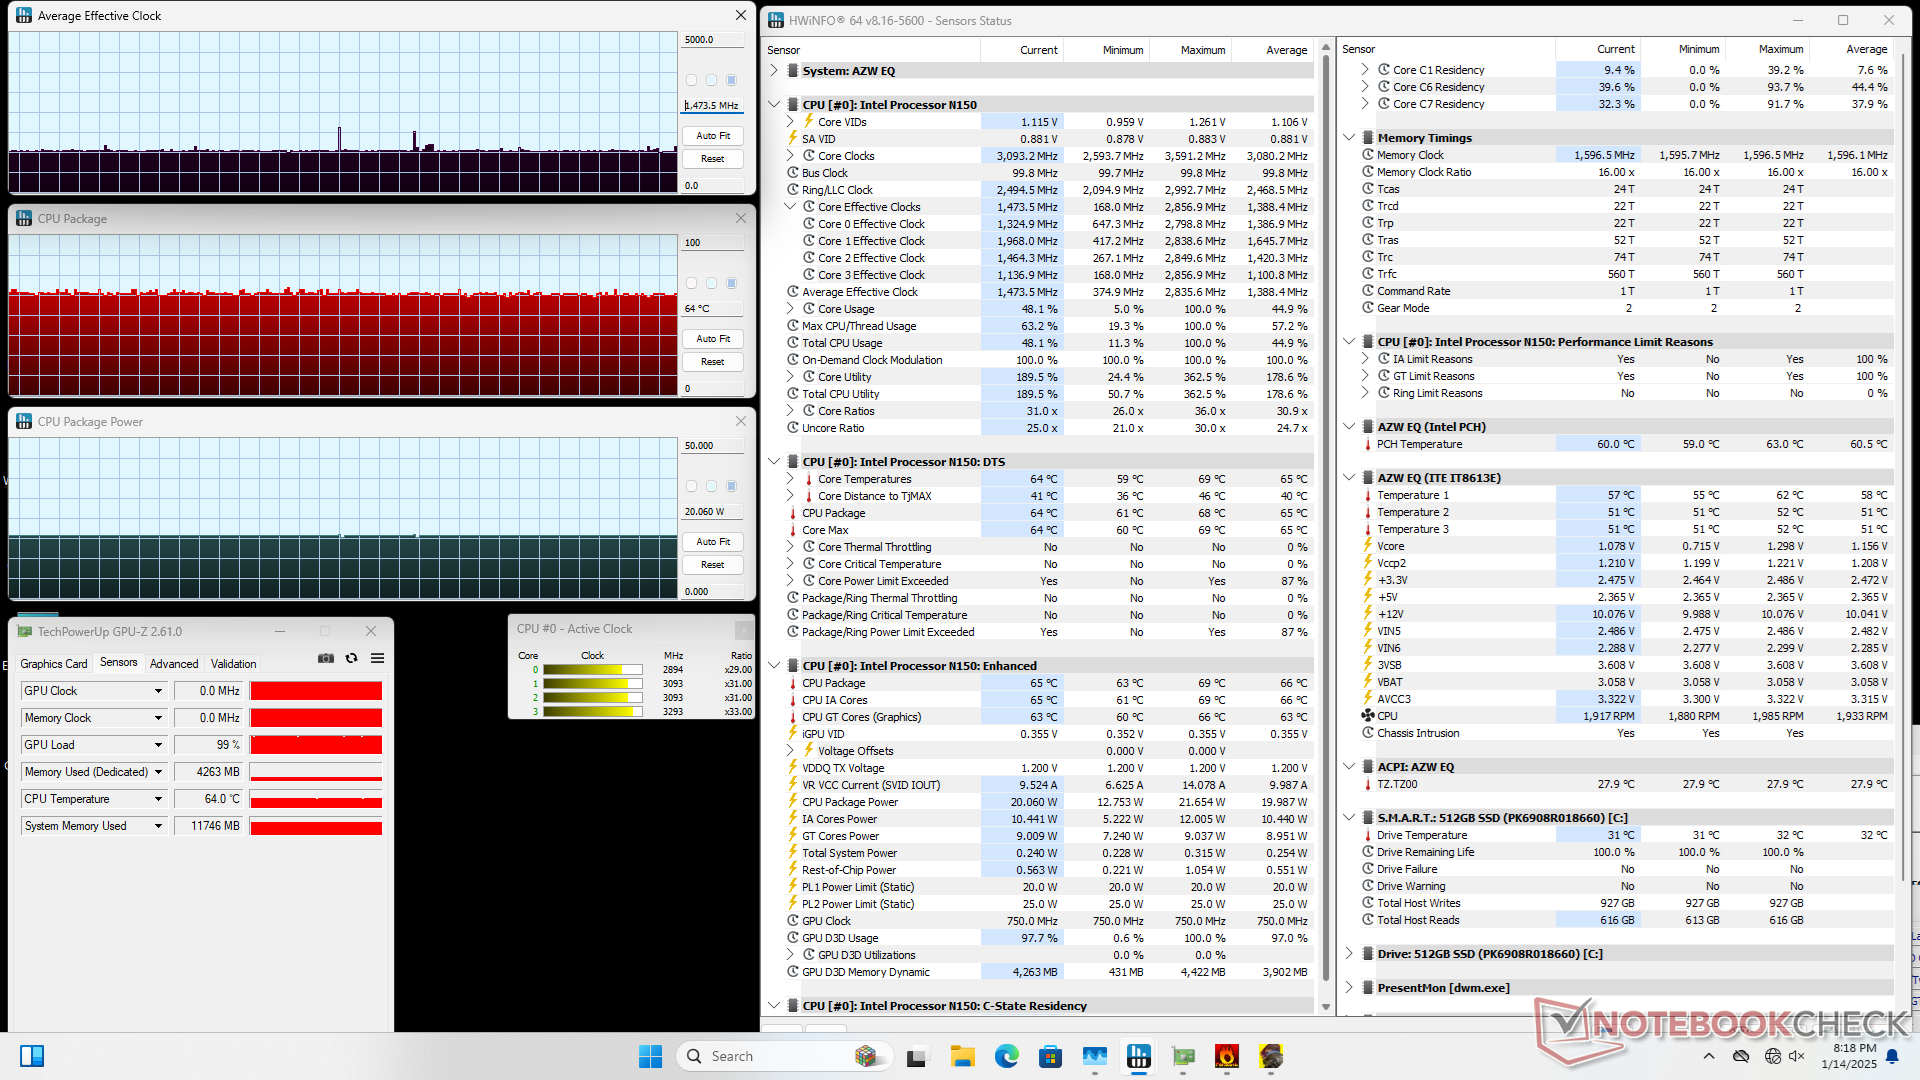
空转时的功耗在 7 瓦到 10 瓦之间,超出了 N 系列处理器的预期。不过,当运行压力较大的负载时,系统的能效仅比配备老式 N100 处理器的 Beelink Mini S12 Pro 高出几瓦。当 CPU 使用率达到 100% 时,最大功耗可暂时达到 32 W,大约 30 秒后才降至 24 W。
| Off / Standby | |
| Idle | |
| Load |
|
Key:
min: | |
| Beelink EQ14 Processor N150, UHD Graphics 24EUs (Alder Lake-N), , , x, | Beelink SER9 Ryzen AI 9 HX 370, Radeon 890M, Crucial P3 Plus CT1000P3PSSD8, , x, | GMK NucBox K9 Ultra 5 125H, Arc 7-Core, MasonSemi 1TB MC7000, , x, | Newsmay AC8F-POE N100, UHD Graphics 24EUs (Alder Lake-N), AirDisk AFF 10-128G, , x, | Maxtang MTN-ALN50 i3-N305, UHD Graphics 32EUs, Foresee 512GB, , x, | Asus ExpertCenter PN42-BBN200MV N200, UHD Graphics Xe 750 32EUs, Kingston KC3000 2048G SKC3000D2048G, , x, | Beelink Mini S12 Pro N100, UHD Graphics 24EUs (Alder Lake-N), , , x, | |
|---|---|---|---|---|---|---|---|
| Power Consumption | -90% | -87% | -2% | -1% | 21% | 0% | |
| Idle Minimum * | 7.9 | 5.7 28% | 10.9 -38% | 7.9 -0% | 3.9 51% | 4.4 44% | 8.3 -5% |
| Idle Average * | 8.9 | 5.9 34% | 11 -24% | 10.1 -13% | 7 21% | 6 33% | 8.8 1% |
| Idle Maximum * | 9.1 | 6 34% | 11.4 -25% | 10.3 -13% | 7.2 21% | 9.7 -7% | 8.9 2% |
| Load Average * | 21.2 | 68.7 -224% | 52.8 -149% | 17.3 18% | 30.1 -42% | 14.6 31% | 20.1 5% |
| Cyberpunk 2077 ultra external monitor * | 22.3 | 78.2 -251% | 57.1 -156% | ||||
| Load Maximum * | 31.6 | 82 -159% | 72.2 -128% | 31.6 -0% | 48.7 -54% | 30.2 4% | 32.2 -2% |
| Witcher 3 ultra * | 21.5 |
* ... smaller is better
Power Consumption Cyberpunk / Stress Test
Power Consumption external Monitor
笔记本检查评级
Beelink EQ14
- 01/27/2025 v8
Allen Ngo
 Total Sustainability Score:
 Transparency
The selection of devices to be reviewed is made by our editorial team. The test sample was provided to the author as a loan by the manufacturer or retailer for the purpose of this review. The lender had no influence on this review, nor did the manufacturer receive a copy of this review before publication. There was no obligation to publish this review. We never accept compensation or payment in return for our reviews. As an independent media company, Notebookcheck is not subjected to the authority of manufacturers, retailers or publishers.
This is how Notebookcheck is testing
Every year, Notebookcheck independently reviews hundreds of laptops and smartphones using standardized procedures to ensure that all results are comparable. We have continuously developed our test methods for around 20 years and set industry standards in the process. In our test labs, high-quality measuring equipment is utilized by experienced technicians and editors. These tests involve a multi-stage validation process. Our complex rating system is based on hundreds of well-founded measurements and benchmarks, which maintains objectivity. Further information on our test methods can be found here.

