

Beelink GTI12 Ultra EX 扩展坞迷你电脑评测:比预期更实惠

迄今为止,人们对 Beelink 迷你 PC 的一大抱怨就是它们都只配备了集成显卡。虽然最新的 GTI Ultra 系列没有直接解决这个问题,但它仍然是 Beelink 首次通过 EX 扩展坞正式支持 eGPU,以吸引高级用户或游戏玩家。
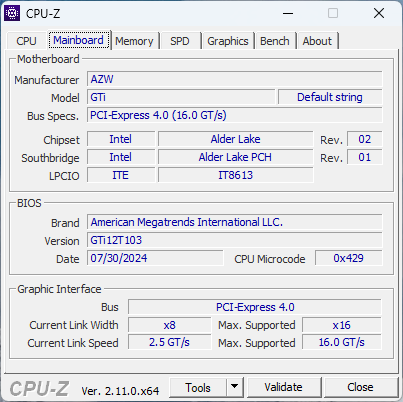
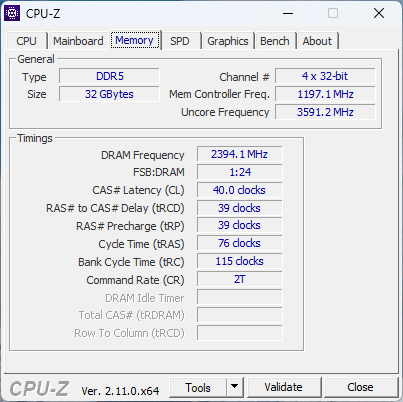
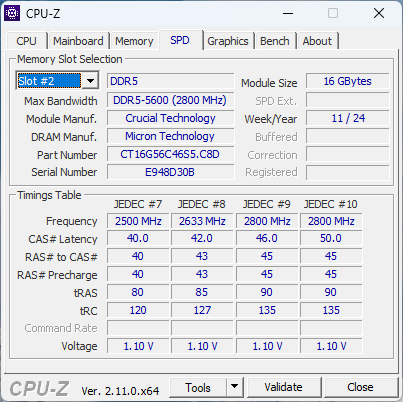
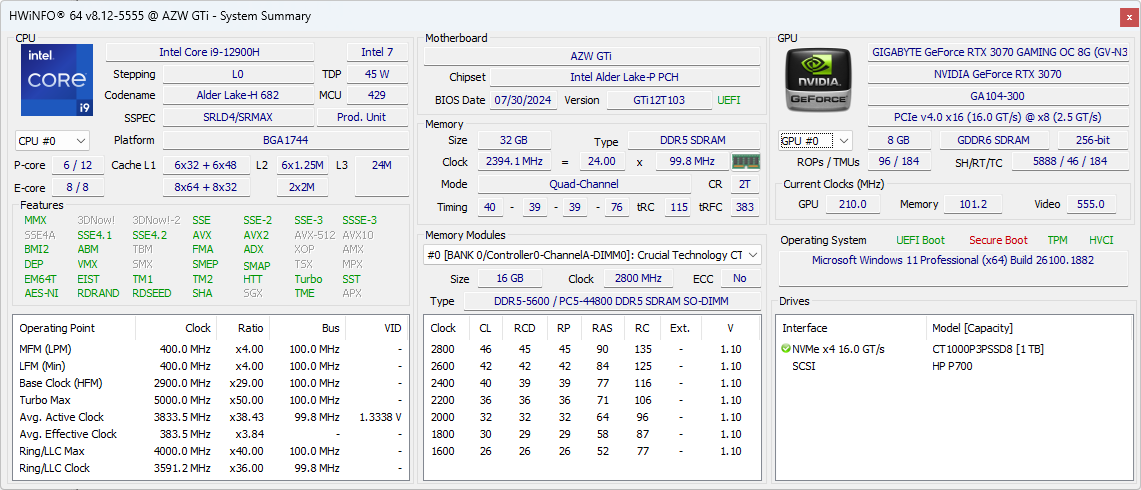
我们的测试机是 GTI12 Ultra,配备酷睿 i9-12900H、1 TB 固态硬盘和 32 GB DDR5-5600 内存,与 EX 扩展坞搭配使用时的价格约为 740 美元。更新的流星湖 CPU 型号为 GTI14 Ultra,外观与 GTI12 Ultra 相同。
我们获得了技嘉GeForce RTX 3070 GPU用于测试 EX 扩展坞,但扩展坞本身可支持最大 600 W 的 RTX 4090 GPU。
更多 Beelink 评论:
潜在的竞争对手比较
Rating | Version | Date | Model | Weight | Height | Size | Resolution | Price |
|---|---|---|---|---|---|---|---|---|
| 76.5 % | v8 | 10 / 2024 | Beelink GTI12 Ultra EX Docking Station i9-12900H, NVIDIA GeForce RTX 3070 | 1.3 kg | 55.8 mm | x | ||
| 76.7 % | v8 | 10 / 2024 | Minisforum MS-A1 Ryzen 7 8700G, Radeon 780M | 1.7 kg | 48 mm | x | ||
| 67.3 % | v8 | 09 / 2024 | GMK NucBox K9 Ultra 5 125H, Arc 7-Core | 528 g | 47 mm | x | ||
| 74.7 % | v8 | 08 / 2024 | Asus NUC 14 Pro Ultra 5 125H, Arc 7-Core | 525 g | 37 mm | x | ||
| 78.4 % | v8 | 08 / 2024 | Geekom AX8 Pro R9 8945HS, Radeon 780M | 548 g | 37 mm | x | ||
| 86 % | v8 | 08 / 2024 | Asus ROG NUC 14-90AS0051 Ultra 9 185H, NVIDIA GeForce RTX 4070 Laptop GPU | 2.6 kg | 50 mm | x |
案例
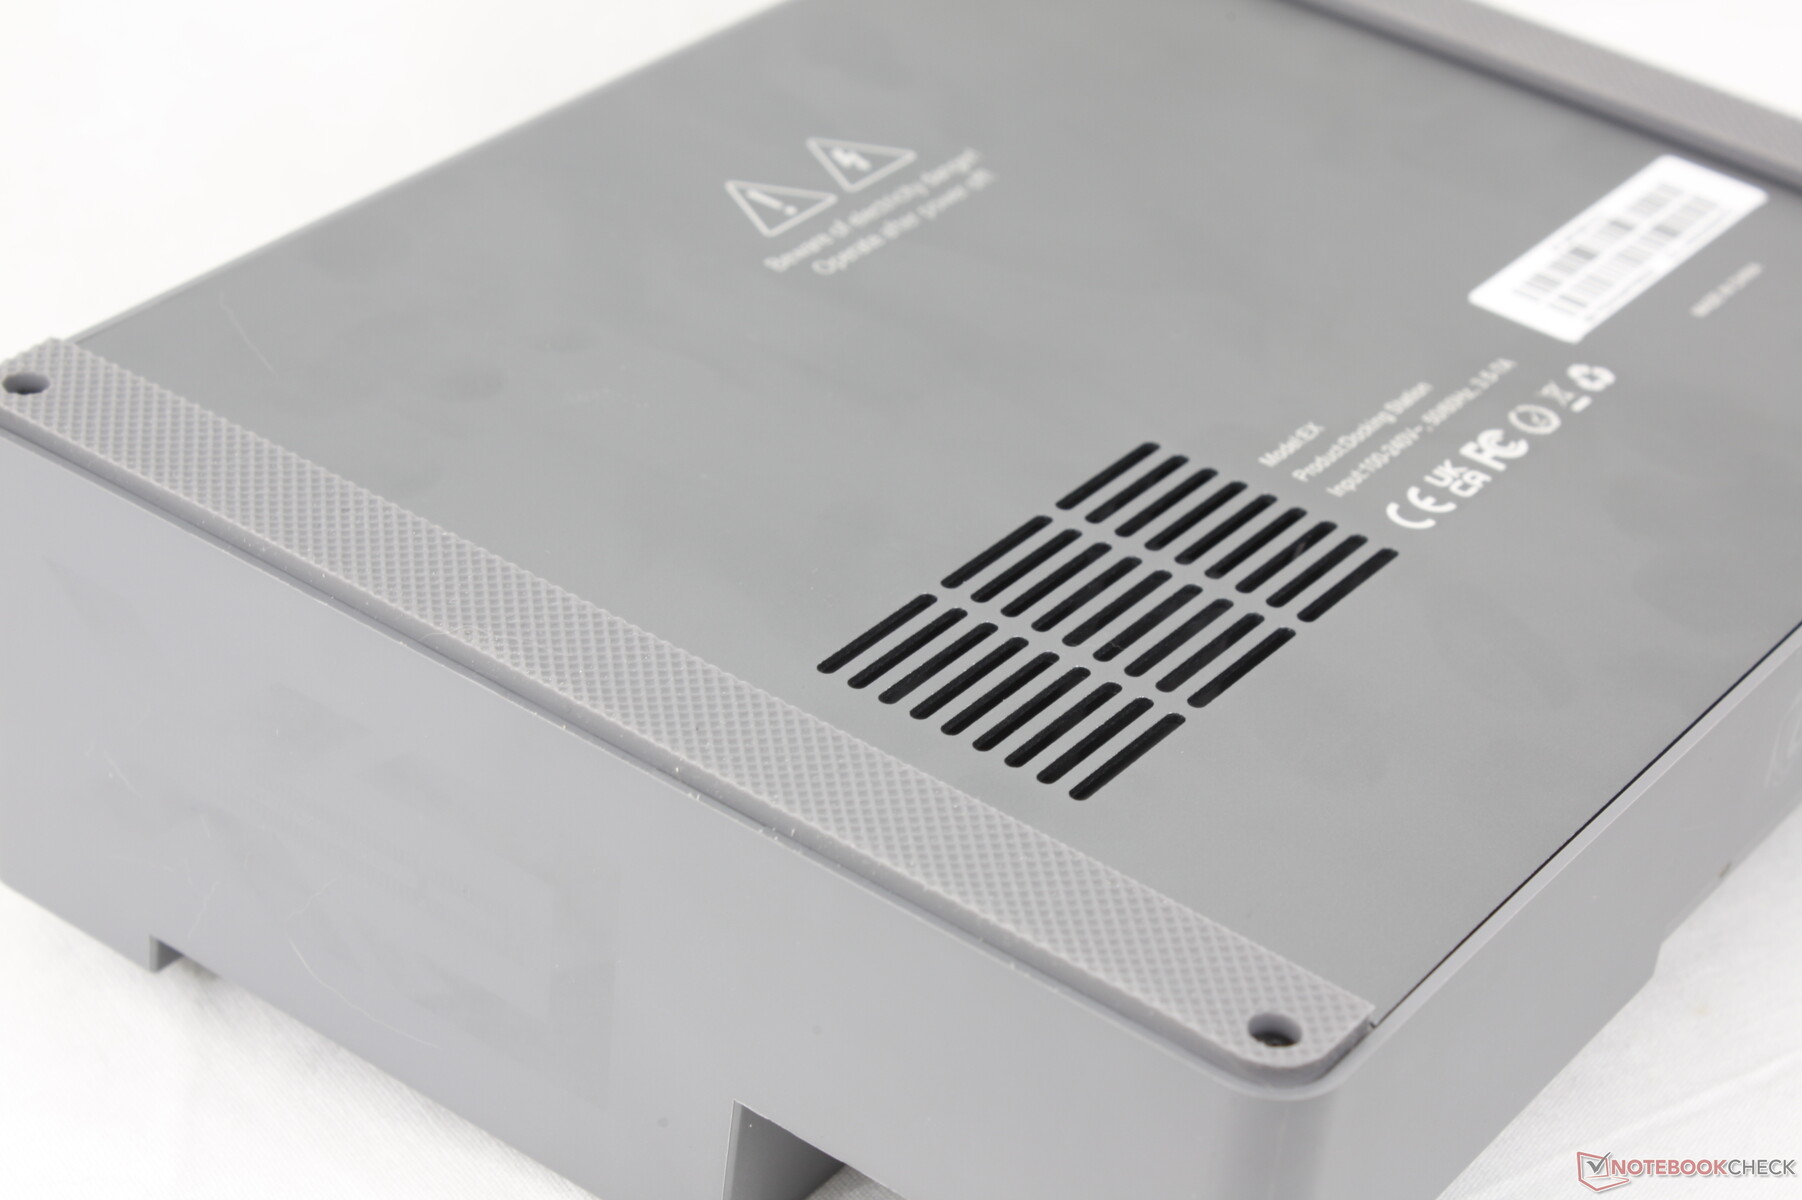
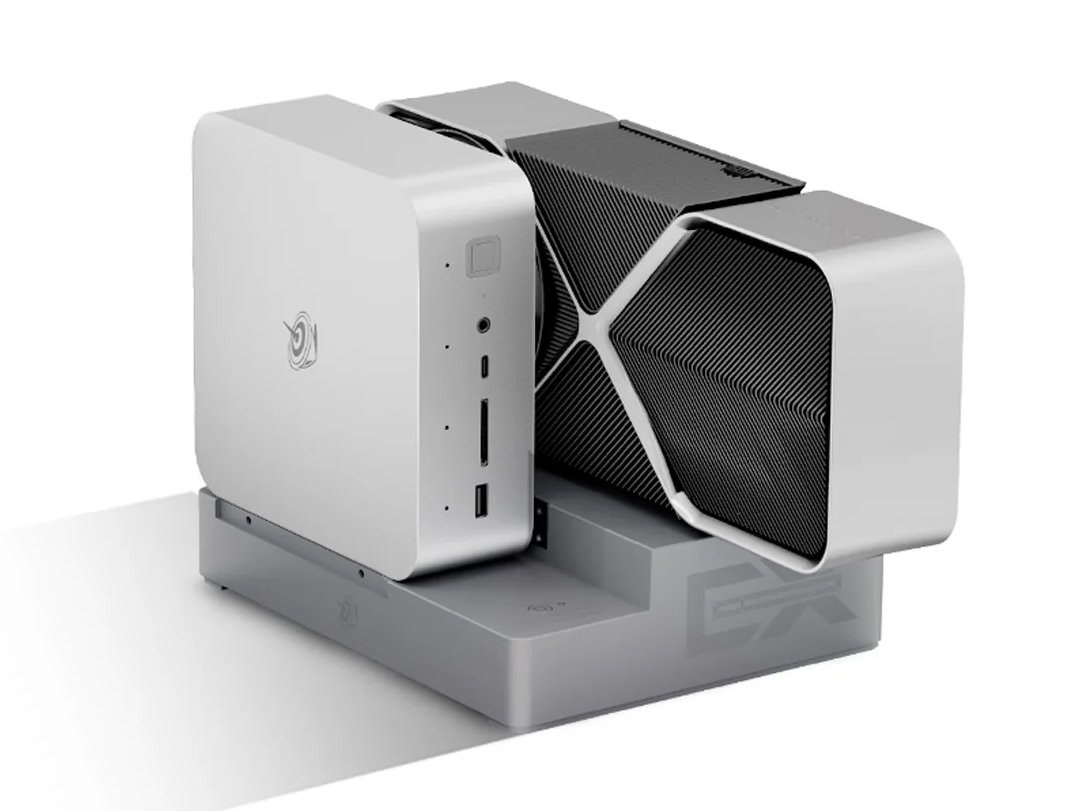
GTI12 Ultra 本质上是一个放大的 SER8 采用了相同的金属机箱材料、塑料底部和光滑的磨砂表面。不过,从内部结构来看,两款机型有很大不同,GTI12 Ultra 集成了 145 W PSU,而不是依赖外置电源模块。它还集成了两个扬声器,是为数不多的同时集成音频和 PSU 的微型电脑之一。
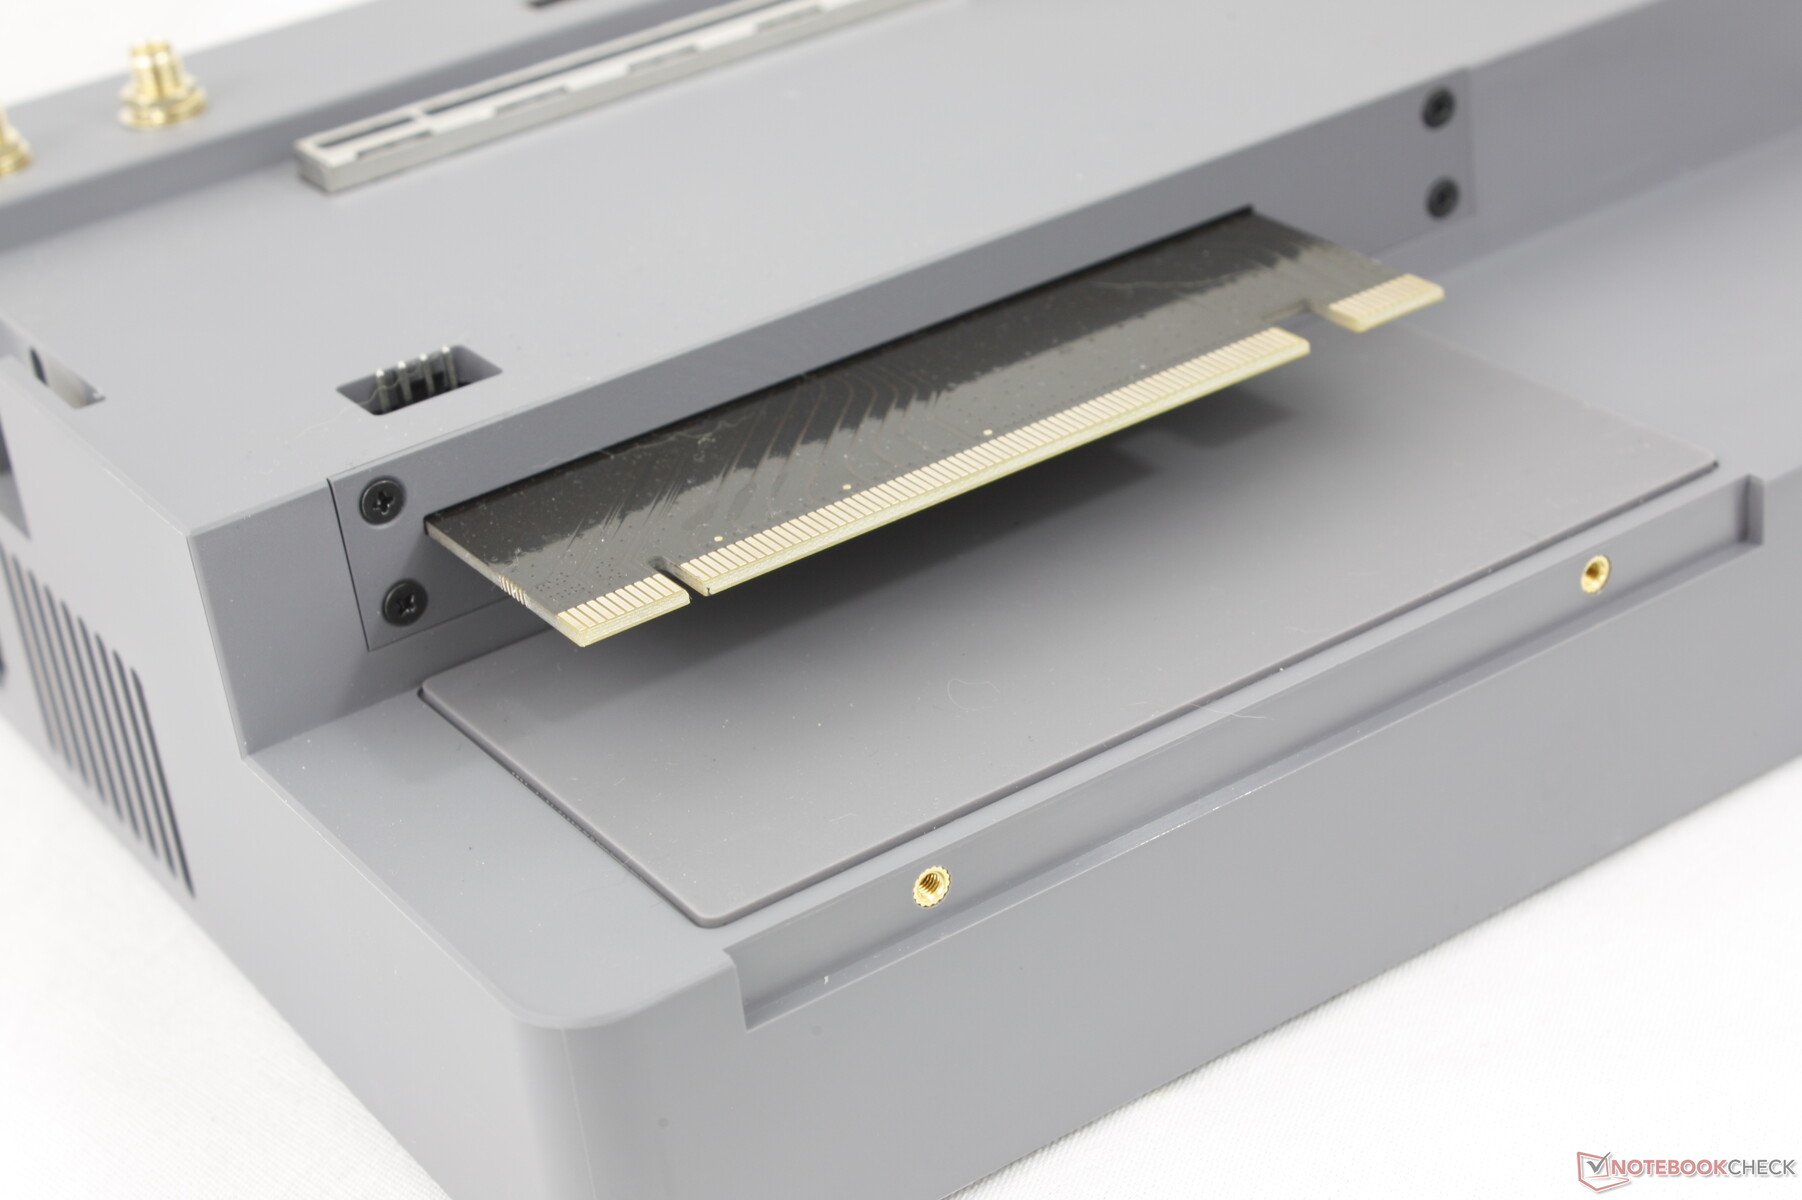
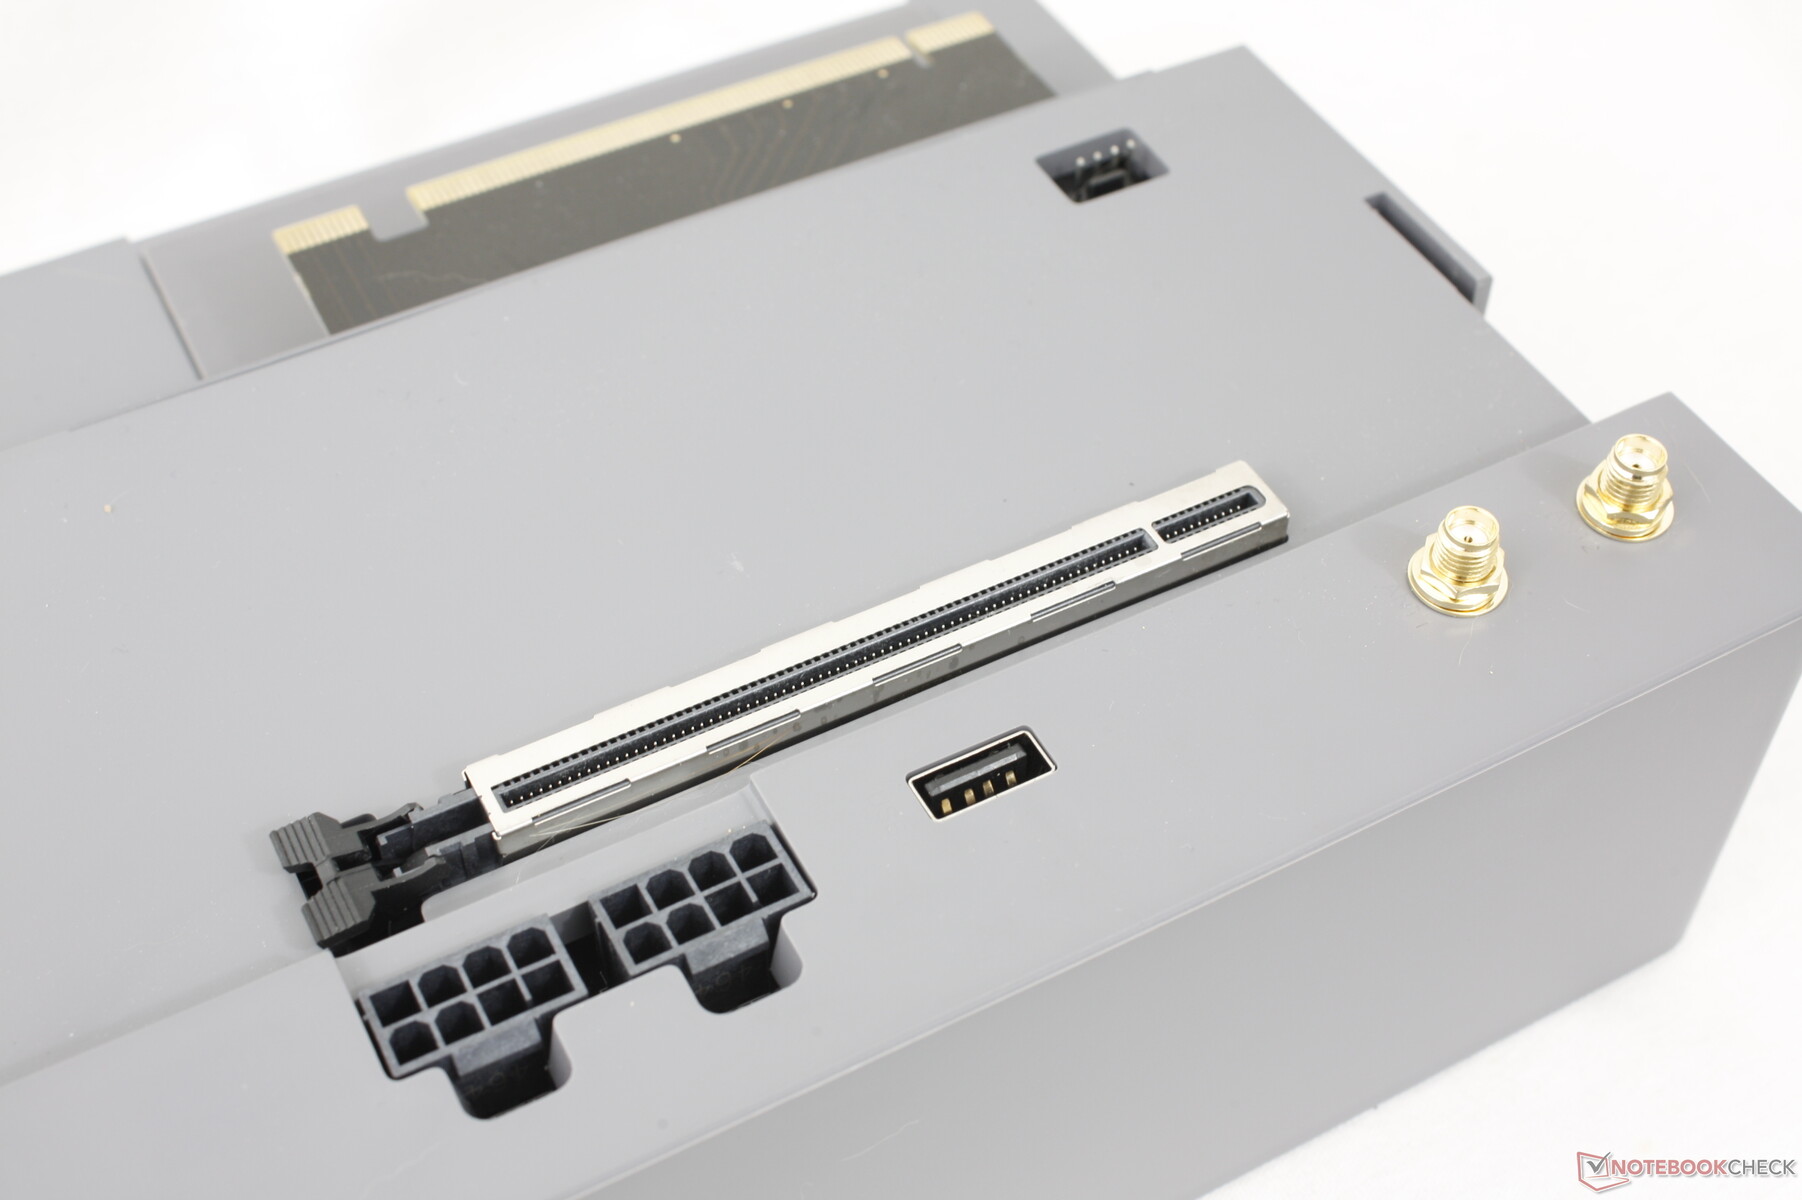
如下图所示,它的另一个独特之处是底部的 PCI x8 插槽,可用于连接 EX 扩展坞。与华硕 ROG XG 移动电脑不同,该连接器不是专有的,我们对此表示赞赏。 华硕 ROG XG Mobile.
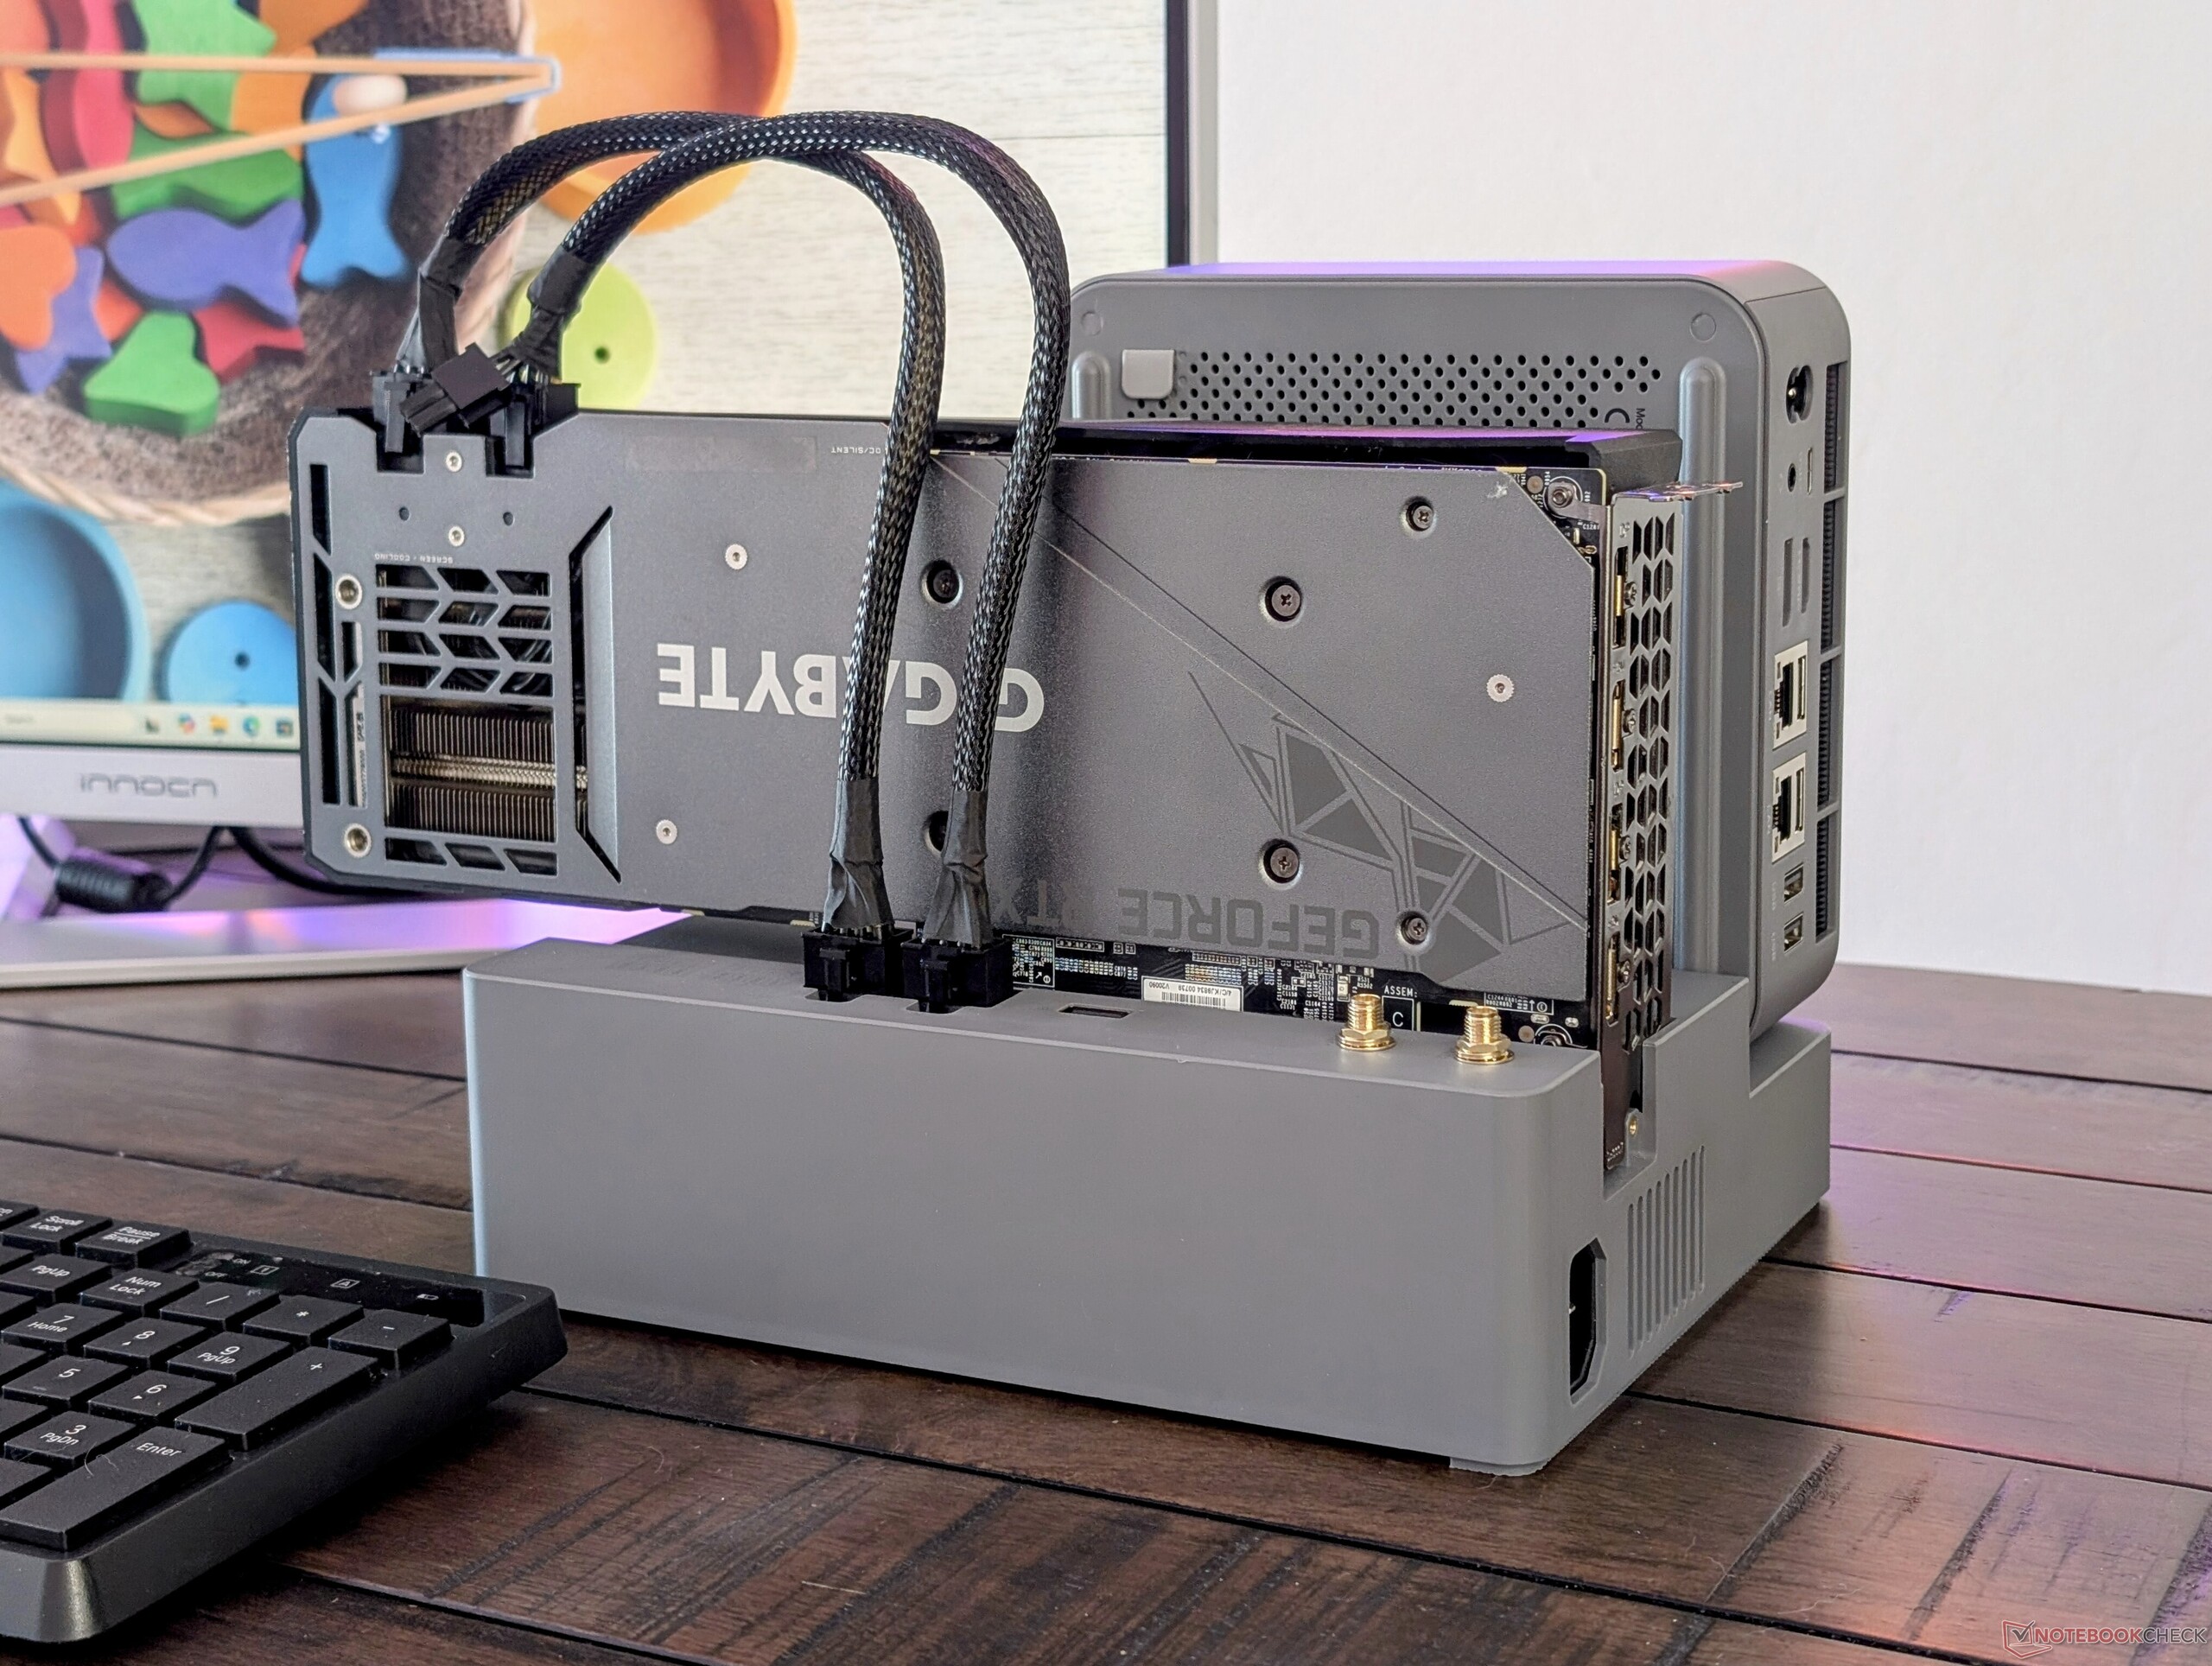
与其他大多数集成显卡的微型电脑相比,该设备的体积和重量都要大得多,这是因为它具有上述独特的特性。
| 迷你 PC | EX 扩展坞 | 迷你 PC + EX 扩展坞 |
| 1316 g | 1419 g | 2735 g |

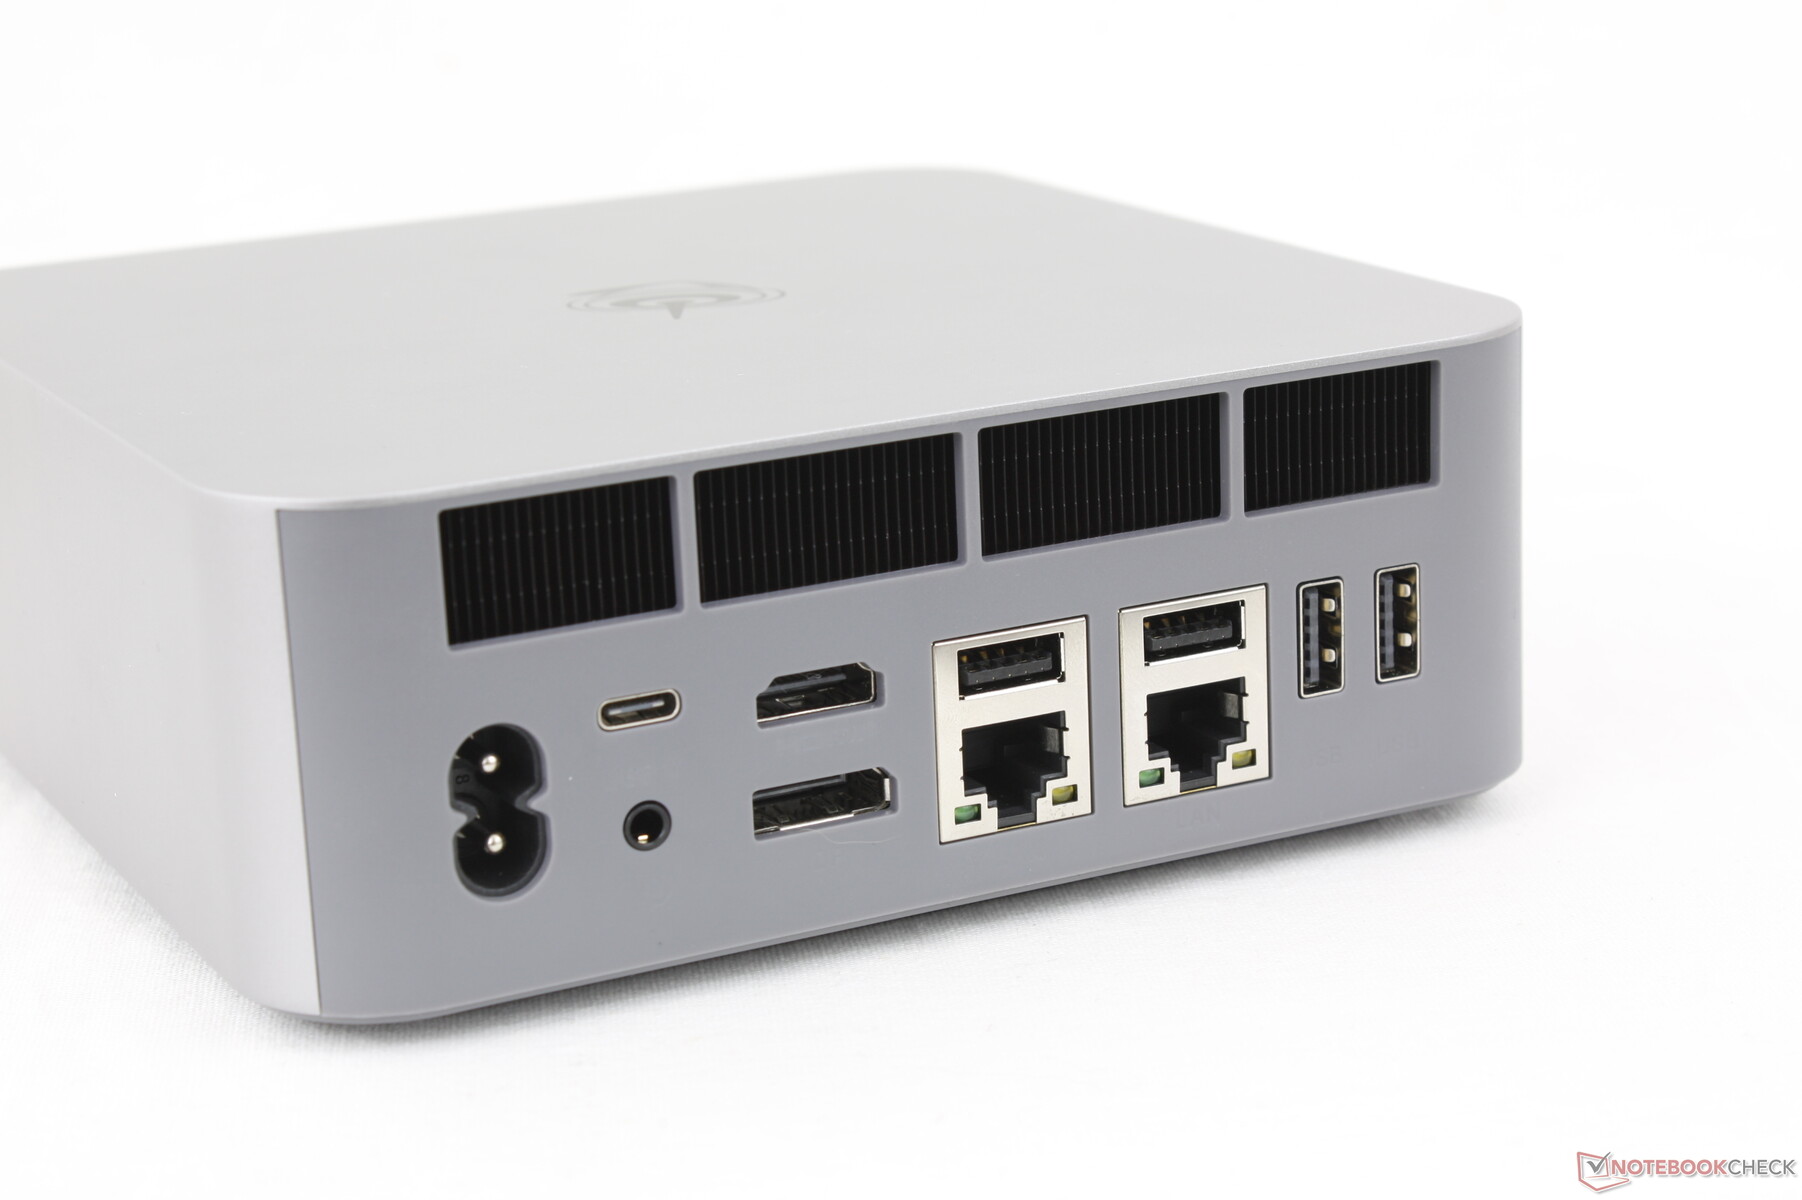
连接性
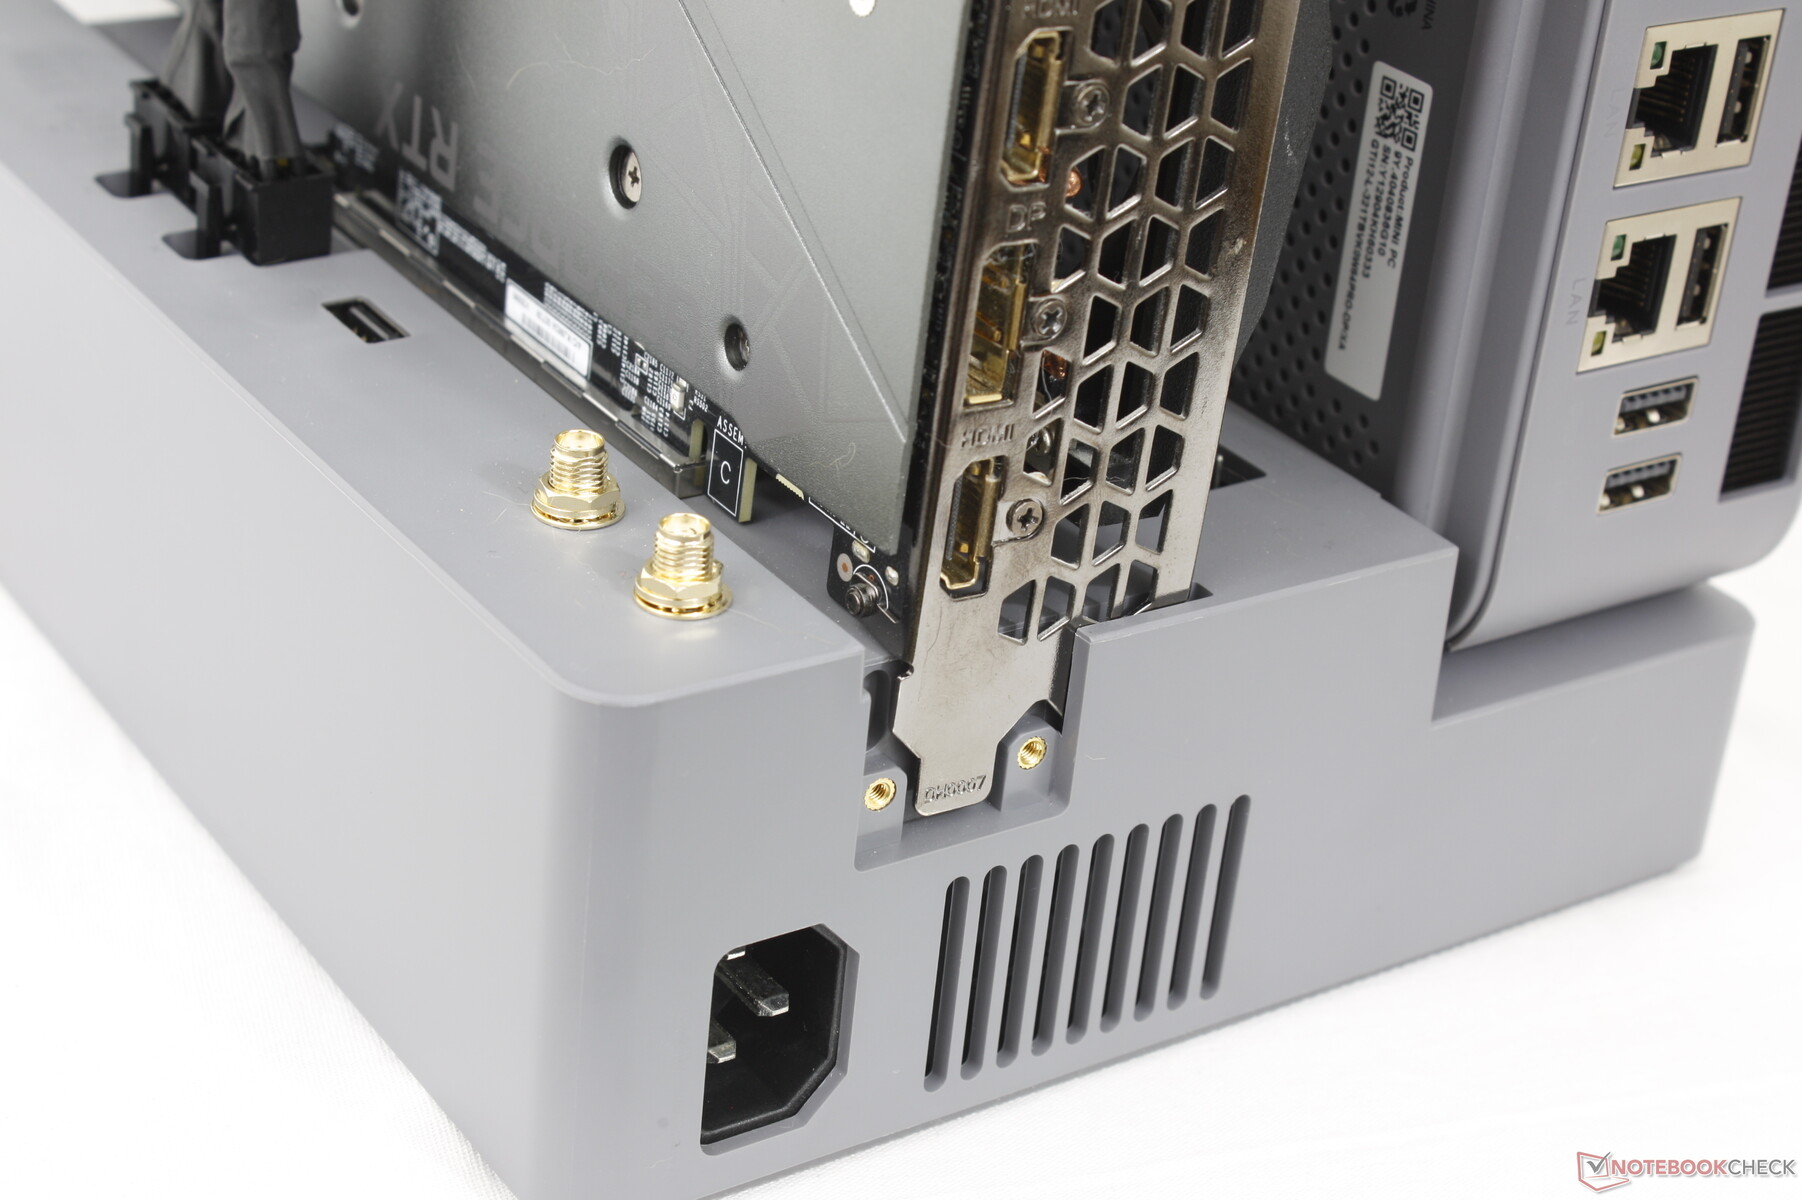
由于 GTI12 Ultra 体积庞大,因此端口选项比 SER8 和许多其他 NUC 尺寸的迷你 PC 都要多。除了额外的 USB-A 端口和 RJ-45 端口外,该机型还集成了 SD 读卡器。
没有 Kensington 锁。

SD 读卡器
| SD Card Reader | |
| average JPG Copy Test (av. of 3 runs) | |
| Asus ROG NUC 14-90AS0051 (AV Pro SD microSD 128 GB V60) | |
| Beelink GTI12 Ultra EX Docking Station (Toshiba Exceria Pro SDXC 64 GB UHS-II) | |
| maximum AS SSD Seq Read Test (1GB) | |
| Asus ROG NUC 14-90AS0051 (AV Pro SD microSD 128 GB V60) | |
| Beelink GTI12 Ultra EX Docking Station (Toshiba Exceria Pro SDXC 64 GB UHS-II) | |
交流
不支持 Wi-Fi 6E 和 Wi-Fi 7 可能是为了节省成本。
| Networking | |
| iperf3 transmit AXE11000 | |
| Asus NUC 14 Pro | |
| Beelink GTI12 Ultra EX Docking Station | |
| Asus ROG NUC 14-90AS0051 | |
| Geekom AX8 Pro | |
| Minisforum MS-A1 | |
| GMK NucBox K9 | |
| iperf3 receive AXE11000 | |
| Asus NUC 14 Pro | |
| Beelink GTI12 Ultra EX Docking Station | |
| Geekom AX8 Pro | |
| Asus ROG NUC 14-90AS0051 | |
| Minisforum MS-A1 | |
| GMK NucBox K9 | |
| iperf3 transmit AXE11000 6GHz | |
| Geekom AX8 Pro | |
| Asus ROG NUC 14-90AS0051 | |
| Minisforum MS-A1 | |
| Asus NUC 14 Pro | |
| iperf3 receive AXE11000 6GHz | |
| Minisforum MS-A1 | |
| Asus ROG NUC 14-90AS0051 | |
| Asus NUC 14 Pro | |
| Geekom AX8 Pro | |
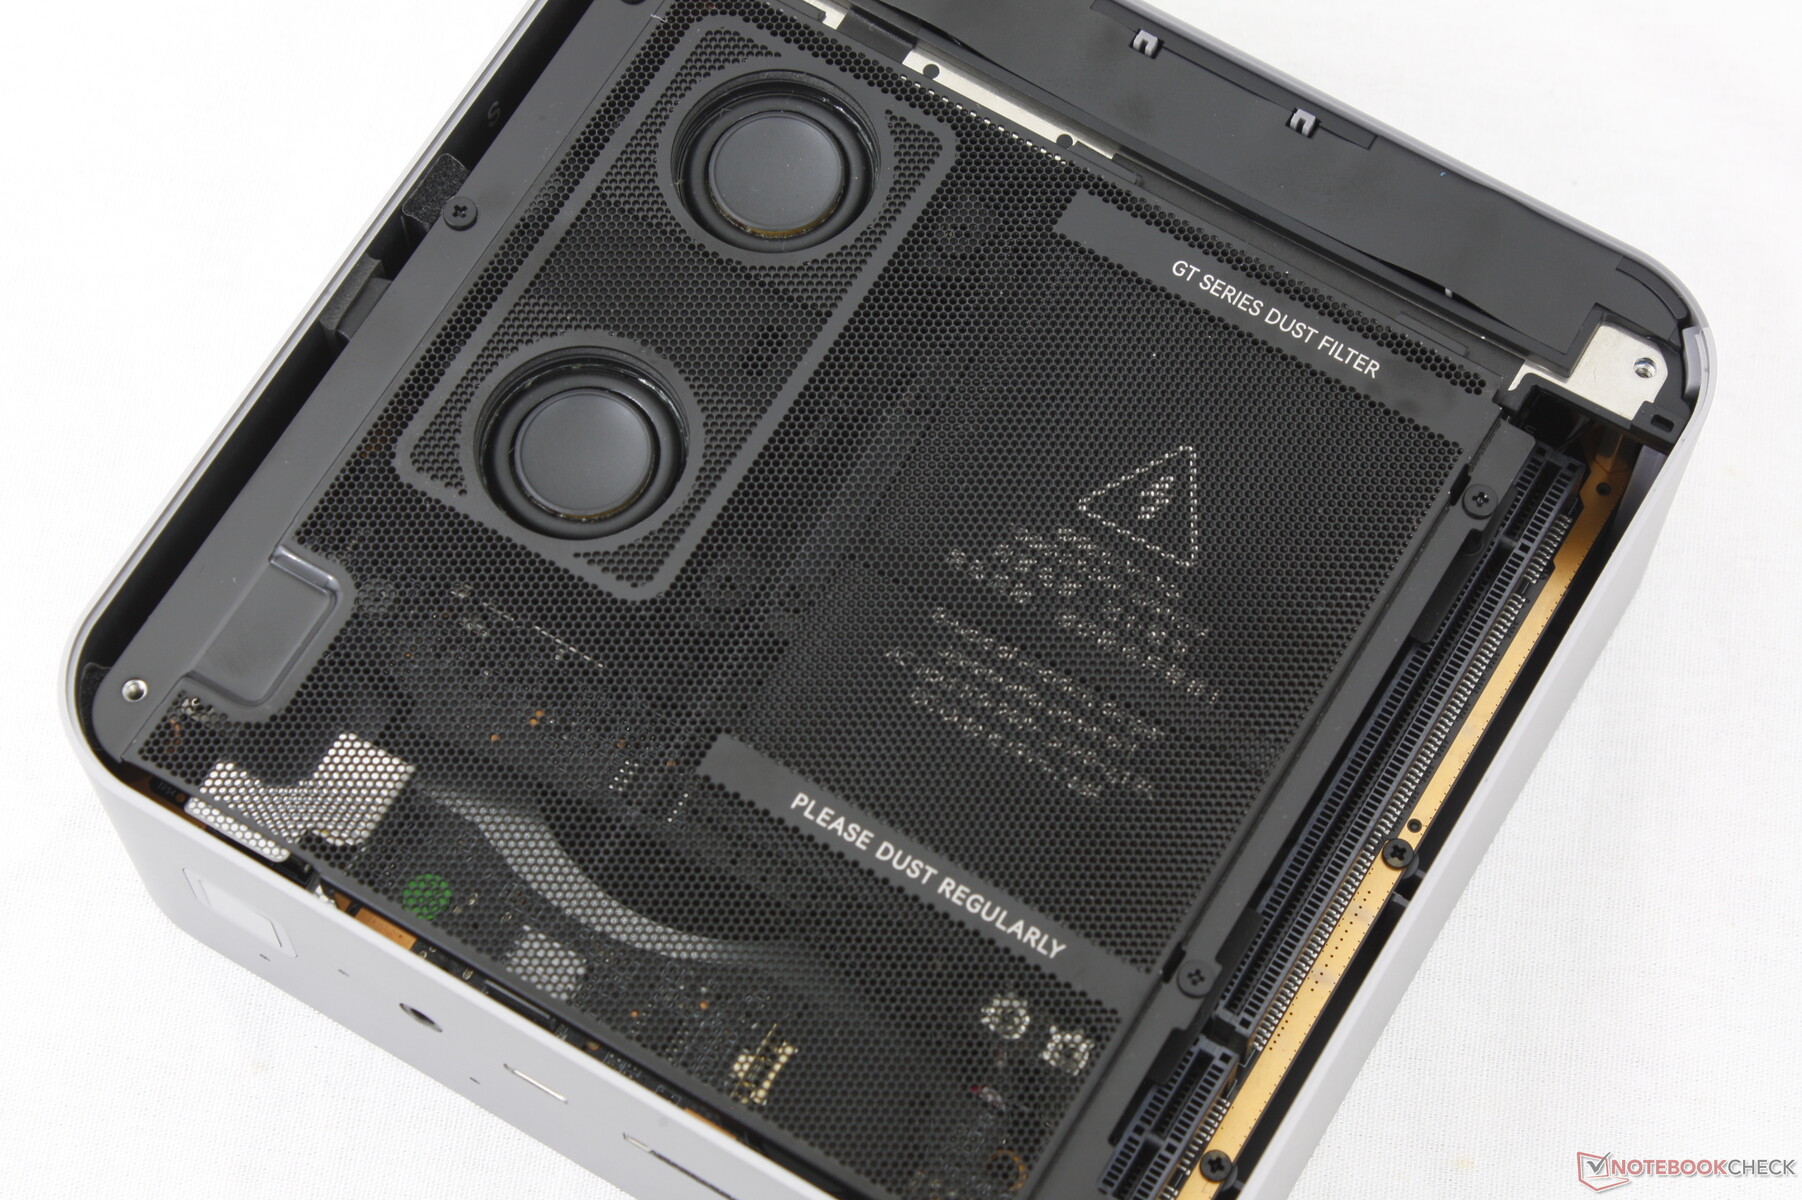
维护
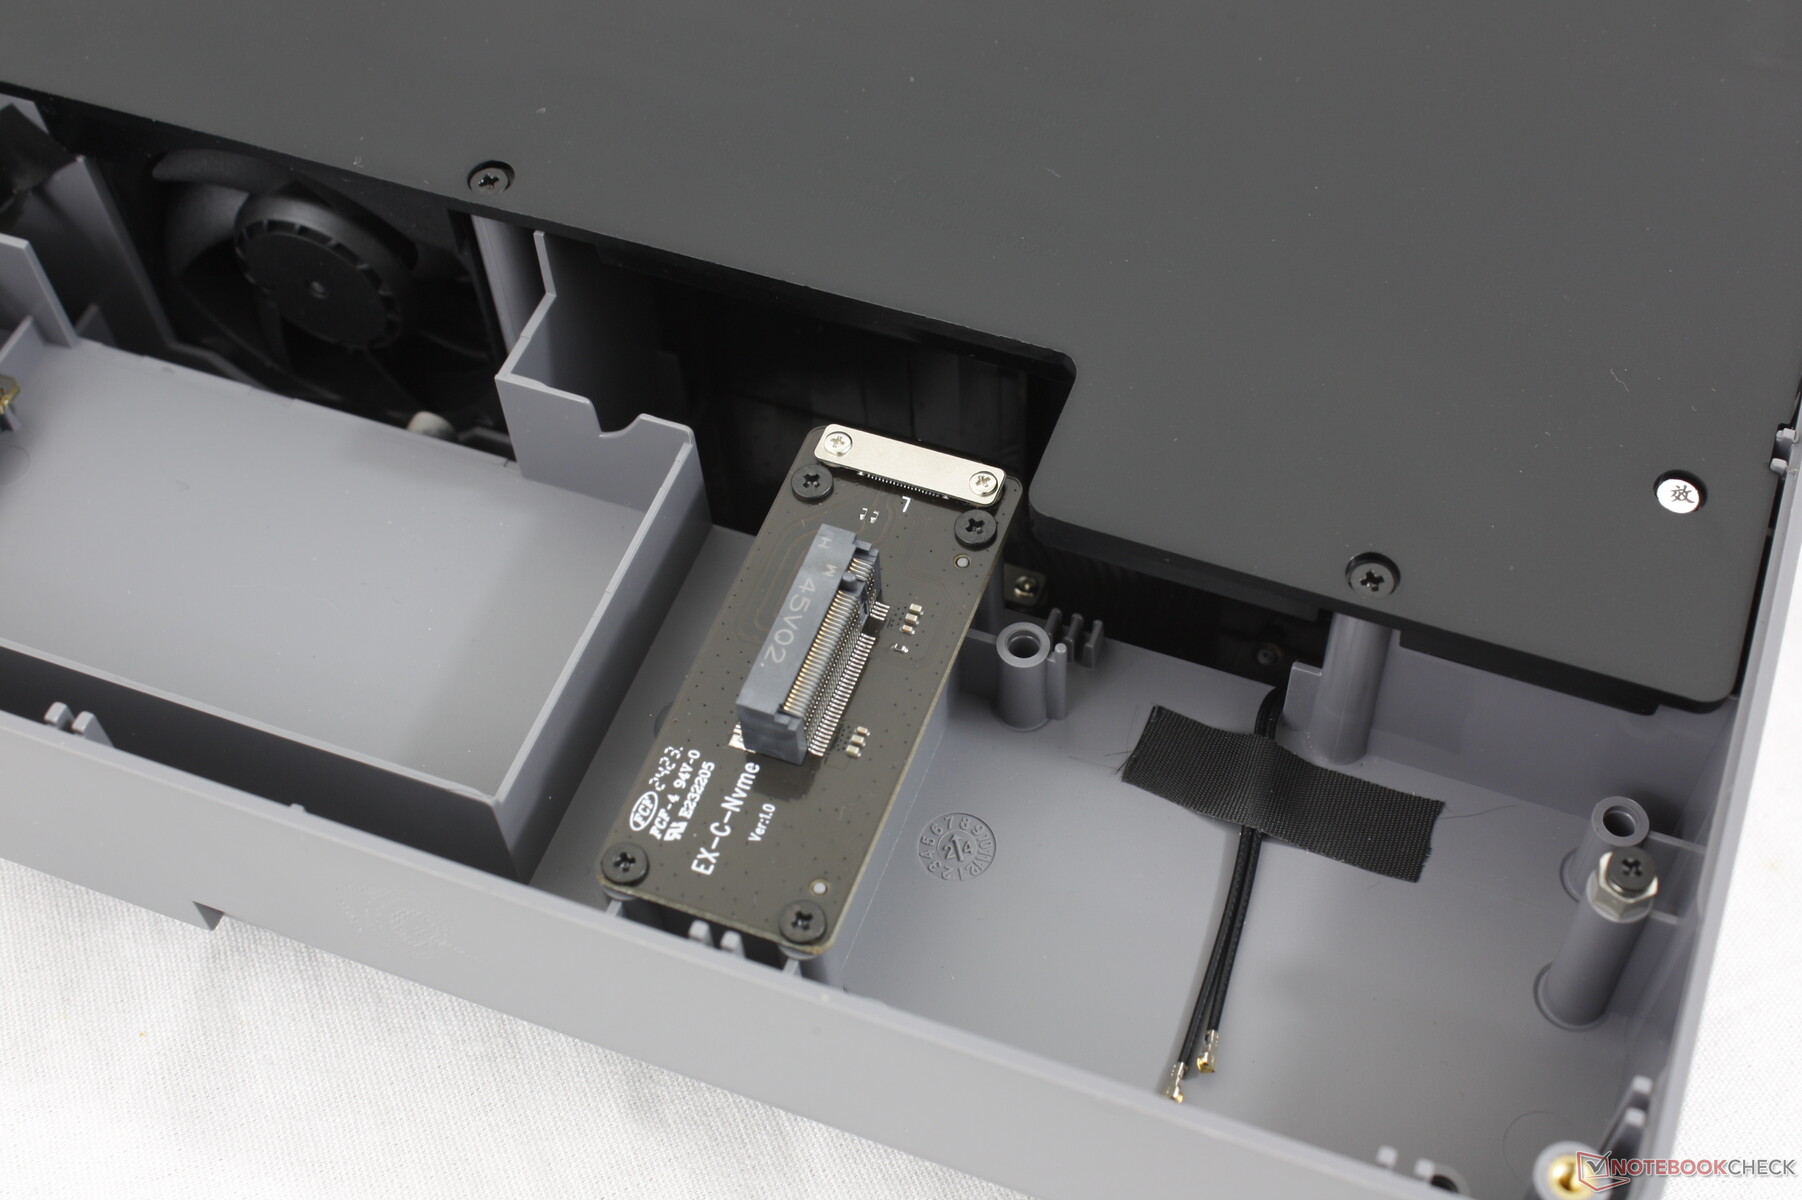
由于 GTI12 Ultra 集成了更多其他型号所没有的部件,因此与同类产品相比,维修难度要大得多。扬声器、防尘滤网和集成 PSU 位于主板顶部,而且它们的螺丝尺寸各不相同,因此维修起来更加头疼。
可持续性
Beelink 宣称在生产 GTI12 时没有采取任何可持续发展措施。包装主要由纸张和一些低密度聚乙烯包装和塑料组成。
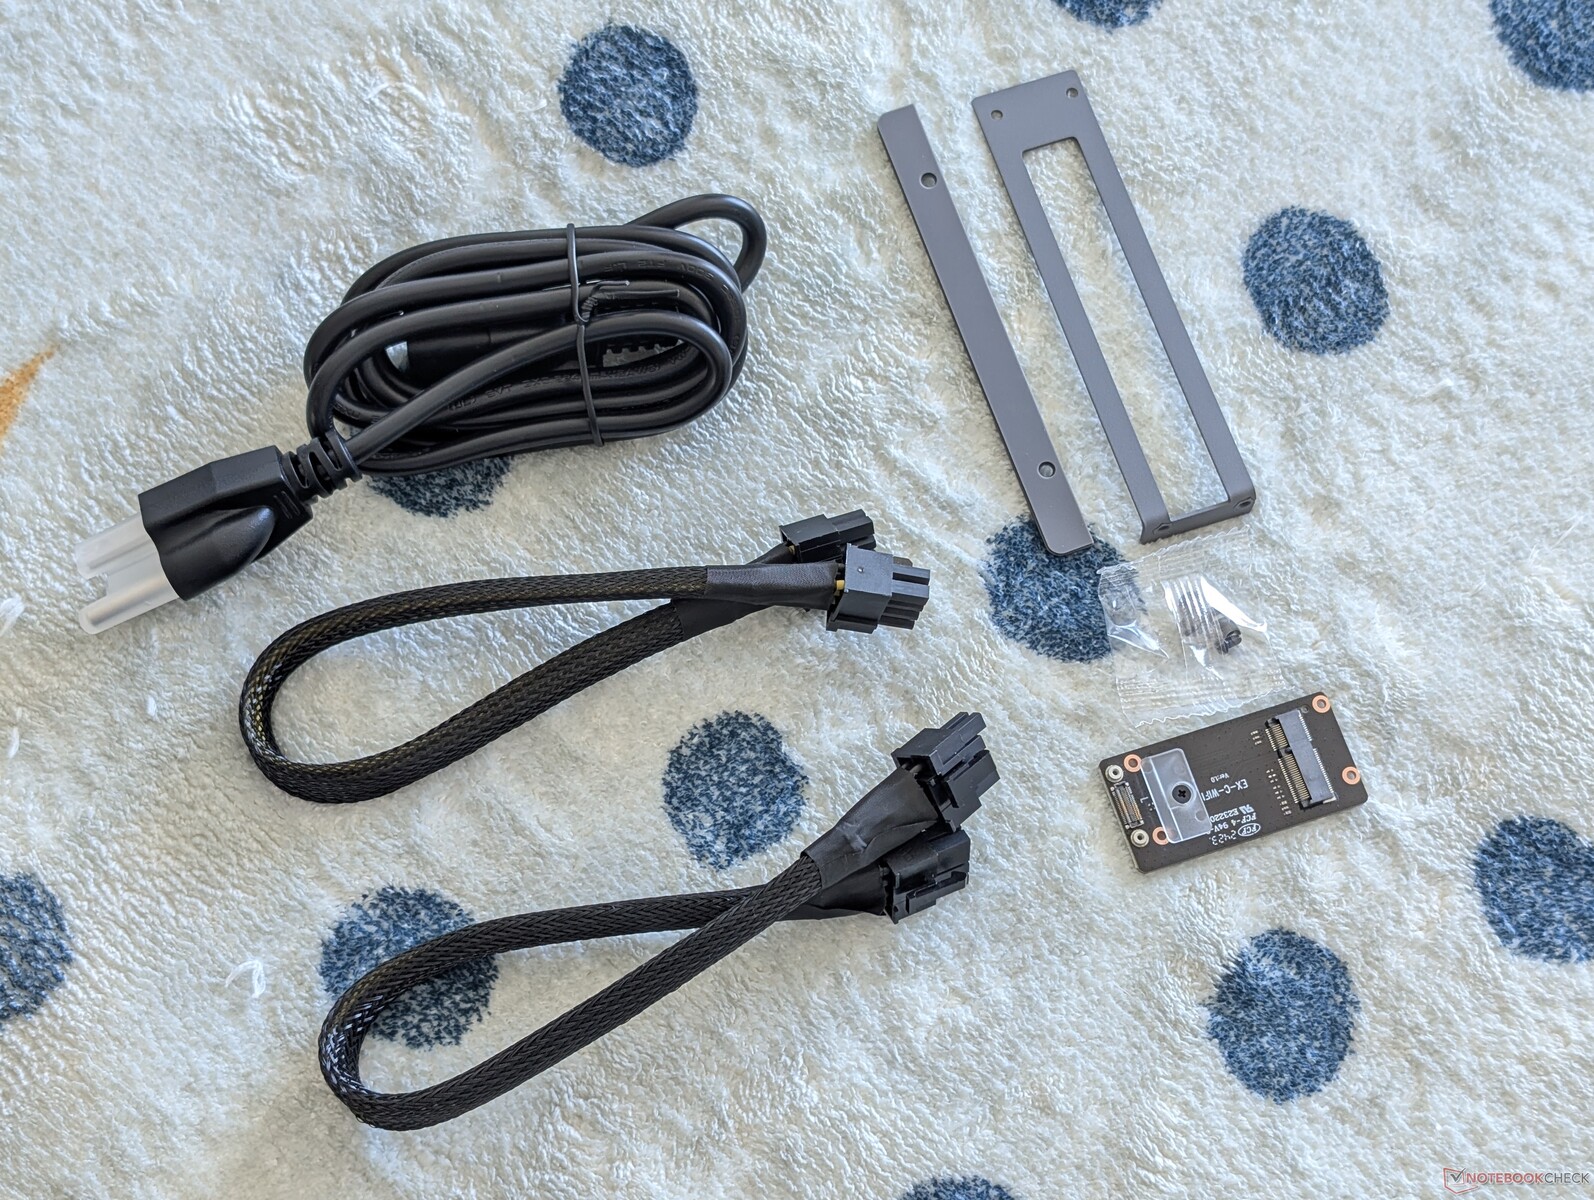
配件和保修
EX 扩展坞包括两条 6+2 针电源线和两块小板,用于将 GPU 和迷你 PC 固定在扩展坞上。M.2 Wi-Fi 插槽和天线是可选项,适用于希望将 WLAN 模块安装在扩展坞上而不是迷你 PC 内部的用户。几乎所有的迷你 PC 都集成了 WLAN,因此大多数用户都可以忽略扩展坞的这一特殊功能。
性能
测试条件
在运行以下基准测试之前,我们将 Windows 设置为性能模式。
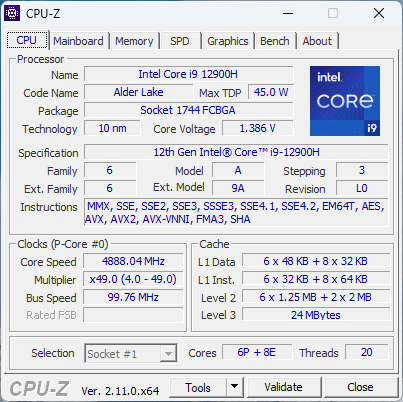
处理器
酷睿 i9-12900H 酷睿 i9-12900H比目前的 Raptor Lake-R 系列落后两到三代,基准测试结果也反映了这一点。较新的 酷睿 i9-14900HX的多线程性能几乎是我们 Beelink 设备的 2 倍。即使是像 Beelink SER7也能提供几乎相同的处理器性能。
该机型还有更新的流星湖酷睿 Ultra 处理器可供选择,型号为 GTI14。
Cinebench R15 Multi Loop
Cinebench R23: Multi Core | Single Core
Cinebench R20: CPU (Multi Core) | CPU (Single Core)
Cinebench R15: CPU Multi 64Bit | CPU Single 64Bit
Blender: v2.79 BMW27 CPU
7-Zip 18.03: 7z b 4 | 7z b 4 -mmt1
Geekbench 6.4: Multi-Core | Single-Core
Geekbench 5.5: Multi-Core | Single-Core
HWBOT x265 Benchmark v2.2: 4k Preset
LibreOffice : 20 Documents To PDF
R Benchmark 2.5: Overall mean
| CPU Performance Rating | |
| Minisforum G7 PT | |
| Lenovo Legion 9 16IRX9, RTX 4090 | |
| Asus TUF Gaming A14 FA401WV-WB94 | |
| Lenovo IdeaPad Pro 5 16IMH G9 RTX 4050 | |
| Beelink SER8 | |
| Beelink SER7 | |
| Asus ROG NUC 14-90AS0051 | |
| Beelink GTI12 Ultra EX Docking Station | |
| Lenovo IdeaCentre Mini 01IRH8 | |
| Acemagic M2A | |
| Average Intel Core i9-12900H | |
| Maingear ML-16 MK2 | |
| Acemagic Tank03 | |
| Geekom XT13 Pro | |
| MSI GeForce RTX 3070 Ventus 3X -8! | |
| Beelink SER6 Pro -2! | |
| Blender / v2.79 BMW27 CPU | |
| Beelink SER6 Pro | |
| Geekom XT13 Pro | |
| Acemagic M2A | |
| Acemagic Tank03 | |
| Average Intel Core i9-12900H (160 - 451, n=28) | |
| Maingear ML-16 MK2 | |
| Lenovo IdeaCentre Mini 01IRH8 | |
| Beelink SER7 | |
| Beelink GTI12 Ultra EX Docking Station | |
| Beelink SER8 | |
| Lenovo IdeaPad Pro 5 16IMH G9 RTX 4050 | |
| Asus ROG NUC 14-90AS0051 | |
| MSI GeForce RTX 3070 Ventus 3X | |
| Asus TUF Gaming A14 FA401WV-WB94 | |
| Lenovo Legion 9 16IRX9, RTX 4090 | |
| Minisforum G7 PT | |
| 7-Zip 18.03 / 7z b 4 | |
| Minisforum G7 PT | |
| Lenovo Legion 9 16IRX9, RTX 4090 | |
| MSI GeForce RTX 3070 Ventus 3X | |
| Asus TUF Gaming A14 FA401WV-WB94 | |
| Lenovo IdeaPad Pro 5 16IMH G9 RTX 4050 | |
| Asus ROG NUC 14-90AS0051 | |
| Beelink SER8 | |
| Beelink SER7 | |
| Beelink GTI12 Ultra EX Docking Station | |
| Maingear ML-16 MK2 | |
| Average Intel Core i9-12900H (34684 - 76677, n=28) | |
| Geekom XT13 Pro | |
| Beelink SER6 Pro | |
| Acemagic Tank03 | |
| Lenovo IdeaCentre Mini 01IRH8 | |
| Acemagic M2A | |
| 7-Zip 18.03 / 7z b 4 -mmt1 | |
| Minisforum G7 PT | |
| Beelink SER7 | |
| Beelink SER8 | |
| MSI GeForce RTX 3070 Ventus 3X | |
| Asus TUF Gaming A14 FA401WV-WB94 | |
| Acemagic M2A | |
| Lenovo IdeaCentre Mini 01IRH8 | |
| Average Intel Core i9-12900H (5302 - 6289, n=28) | |
| Geekom XT13 Pro | |
| Beelink GTI12 Ultra EX Docking Station | |
| Beelink SER6 Pro | |
| Lenovo IdeaPad Pro 5 16IMH G9 RTX 4050 | |
| Acemagic Tank03 | |
| Lenovo Legion 9 16IRX9, RTX 4090 | |
| Asus ROG NUC 14-90AS0051 | |
| Maingear ML-16 MK2 | |
| Geekbench 5.5 / Multi-Core | |
| Lenovo Legion 9 16IRX9, RTX 4090 | |
| Minisforum G7 PT | |
| Asus TUF Gaming A14 FA401WV-WB94 | |
| Lenovo IdeaPad Pro 5 16IMH G9 RTX 4050 | |
| Asus ROG NUC 14-90AS0051 | |
| Beelink GTI12 Ultra EX Docking Station | |
| Maingear ML-16 MK2 | |
| Beelink SER8 | |
| Average Intel Core i9-12900H (8519 - 14376, n=31) | |
| Geekom XT13 Pro | |
| Beelink SER7 | |
| Acemagic M2A | |
| Acemagic Tank03 | |
| Lenovo IdeaCentre Mini 01IRH8 | |
| MSI GeForce RTX 3070 Ventus 3X | |
| Beelink SER6 Pro | |
| Geekbench 5.5 / Single-Core | |
| Minisforum G7 PT | |
| Asus TUF Gaming A14 FA401WV-WB94 | |
| Beelink SER8 | |
| Beelink SER7 | |
| Beelink GTI12 Ultra EX Docking Station | |
| Lenovo IdeaPad Pro 5 16IMH G9 RTX 4050 | |
| Asus ROG NUC 14-90AS0051 | |
| Lenovo IdeaCentre Mini 01IRH8 | |
| Acemagic M2A | |
| Average Intel Core i9-12900H (1631 - 1897, n=31) | |
| Lenovo Legion 9 16IRX9, RTX 4090 | |
| Geekom XT13 Pro | |
| Acemagic Tank03 | |
| Maingear ML-16 MK2 | |
| Beelink SER6 Pro | |
| MSI GeForce RTX 3070 Ventus 3X | |
| HWBOT x265 Benchmark v2.2 / 4k Preset | |
| Minisforum G7 PT | |
| Lenovo Legion 9 16IRX9, RTX 4090 | |
| Asus TUF Gaming A14 FA401WV-WB94 | |
| Lenovo IdeaPad Pro 5 16IMH G9 RTX 4050 | |
| Asus ROG NUC 14-90AS0051 | |
| MSI GeForce RTX 3070 Ventus 3X | |
| Beelink SER8 | |
| Beelink SER7 | |
| Maingear ML-16 MK2 | |
| Beelink GTI12 Ultra EX Docking Station | |
| Lenovo IdeaCentre Mini 01IRH8 | |
| Average Intel Core i9-12900H (8.05 - 22.5, n=28) | |
| Beelink SER6 Pro | |
| Acemagic M2A | |
| Acemagic Tank03 | |
| Geekom XT13 Pro | |
| LibreOffice / 20 Documents To PDF | |
| Asus ROG NUC 14-90AS0051 | |
| MSI GeForce RTX 3070 Ventus 3X | |
| Lenovo Legion 9 16IRX9, RTX 4090 | |
| Asus TUF Gaming A14 FA401WV-WB94 | |
| Minisforum G7 PT | |
| Beelink SER6 Pro | |
| Geekom XT13 Pro | |
| Beelink SER8 | |
| Maingear ML-16 MK2 | |
| Average Intel Core i9-12900H (36.8 - 59.8, n=28) | |
| Beelink GTI12 Ultra EX Docking Station | |
| Acemagic M2A | |
| Beelink SER7 | |
| Lenovo IdeaPad Pro 5 16IMH G9 RTX 4050 | |
| Lenovo IdeaCentre Mini 01IRH8 | |
| Acemagic Tank03 | |
| R Benchmark 2.5 / Overall mean | |
| MSI GeForce RTX 3070 Ventus 3X | |
| Acemagic Tank03 | |
| Maingear ML-16 MK2 | |
| Beelink SER6 Pro | |
| Lenovo Legion 9 16IRX9, RTX 4090 | |
| Geekom XT13 Pro | |
| Average Intel Core i9-12900H (0.4218 - 0.506, n=28) | |
| Lenovo IdeaCentre Mini 01IRH8 | |
| Asus ROG NUC 14-90AS0051 | |
| Beelink GTI12 Ultra EX Docking Station | |
| Beelink SER7 | |
| Lenovo IdeaPad Pro 5 16IMH G9 RTX 4050 | |
| Acemagic M2A | |
| Beelink SER8 | |
| Asus TUF Gaming A14 FA401WV-WB94 | |
| Minisforum G7 PT | |
Cinebench R23: Multi Core | Single Core
Cinebench R20: CPU (Multi Core) | CPU (Single Core)
Cinebench R15: CPU Multi 64Bit | CPU Single 64Bit
Blender: v2.79 BMW27 CPU
7-Zip 18.03: 7z b 4 | 7z b 4 -mmt1
Geekbench 6.4: Multi-Core | Single-Core
Geekbench 5.5: Multi-Core | Single-Core
HWBOT x265 Benchmark v2.2: 4k Preset
LibreOffice : 20 Documents To PDF
R Benchmark 2.5: Overall mean
* ... smaller is better
AIDA64: FP32 Ray-Trace | FPU Julia | CPU SHA3 | CPU Queen | FPU SinJulia | FPU Mandel | CPU AES | CPU ZLib | FP64 Ray-Trace | CPU PhotoWorxx
| Performance Rating | |
| Minisforum MS-A1 | |
| Geekom AX8 Pro | |
| Asus ROG NUC 14-90AS0051 | |
| Beelink GTI12 Ultra EX Docking Station | |
| Asus NUC 14 Pro | |
| Average Intel Core i9-12900H | |
| GMK NucBox K9 | |
| AIDA64 / FP32 Ray-Trace | |
| Minisforum MS-A1 | |
| Geekom AX8 Pro | |
| Asus ROG NUC 14-90AS0051 | |
| Beelink GTI12 Ultra EX Docking Station | |
| Asus NUC 14 Pro | |
| Average Intel Core i9-12900H (4074 - 18289, n=28) | |
| GMK NucBox K9 | |
| AIDA64 / FPU Julia | |
| Minisforum MS-A1 | |
| Geekom AX8 Pro | |
| Asus ROG NUC 14-90AS0051 | |
| Beelink GTI12 Ultra EX Docking Station | |
| Asus NUC 14 Pro | |
| GMK NucBox K9 | |
| Average Intel Core i9-12900H (22307 - 93236, n=28) | |
| AIDA64 / CPU SHA3 | |
| Minisforum MS-A1 | |
| Geekom AX8 Pro | |
| Asus ROG NUC 14-90AS0051 | |
| Beelink GTI12 Ultra EX Docking Station | |
| Asus NUC 14 Pro | |
| Average Intel Core i9-12900H (1378 - 4215, n=28) | |
| GMK NucBox K9 | |
| AIDA64 / CPU Queen | |
| Minisforum MS-A1 | |
| Geekom AX8 Pro | |
| Average Intel Core i9-12900H (78172 - 111241, n=28) | |
| Beelink GTI12 Ultra EX Docking Station | |
| Asus ROG NUC 14-90AS0051 | |
| Asus NUC 14 Pro | |
| GMK NucBox K9 | |
| AIDA64 / FPU SinJulia | |
| Minisforum MS-A1 | |
| Geekom AX8 Pro | |
| Asus ROG NUC 14-90AS0051 | |
| Beelink GTI12 Ultra EX Docking Station | |
| Average Intel Core i9-12900H (5709 - 10410, n=28) | |
| Asus NUC 14 Pro | |
| GMK NucBox K9 | |
| AIDA64 / FPU Mandel | |
| Minisforum MS-A1 | |
| Geekom AX8 Pro | |
| Asus ROG NUC 14-90AS0051 | |
| Beelink GTI12 Ultra EX Docking Station | |
| Asus NUC 14 Pro | |
| Average Intel Core i9-12900H (11257 - 45581, n=28) | |
| GMK NucBox K9 | |
| AIDA64 / CPU AES | |
| Minisforum MS-A1 | |
| Geekom AX8 Pro | |
| GMK NucBox K9 | |
| Asus ROG NUC 14-90AS0051 | |
| Average Intel Core i9-12900H (31935 - 151546, n=28) | |
| Beelink GTI12 Ultra EX Docking Station | |
| Asus NUC 14 Pro | |
| AIDA64 / CPU ZLib | |
| Asus ROG NUC 14-90AS0051 | |
| Minisforum MS-A1 | |
| Beelink GTI12 Ultra EX Docking Station | |
| Geekom AX8 Pro | |
| Asus NUC 14 Pro | |
| Average Intel Core i9-12900H (449 - 1193, n=28) | |
| GMK NucBox K9 | |
| AIDA64 / FP64 Ray-Trace | |
| Minisforum MS-A1 | |
| Geekom AX8 Pro | |
| Asus ROG NUC 14-90AS0051 | |
| Beelink GTI12 Ultra EX Docking Station | |
| Asus NUC 14 Pro | |
| Average Intel Core i9-12900H (2235 - 10511, n=28) | |
| GMK NucBox K9 | |
| AIDA64 / CPU PhotoWorxx | |
| Asus NUC 14 Pro | |
| GMK NucBox K9 | |
| Asus ROG NUC 14-90AS0051 | |
| Beelink GTI12 Ultra EX Docking Station | |
| Minisforum MS-A1 | |
| Geekom AX8 Pro | |
| Average Intel Core i9-12900H (20960 - 48269, n=29) | |
系统性能
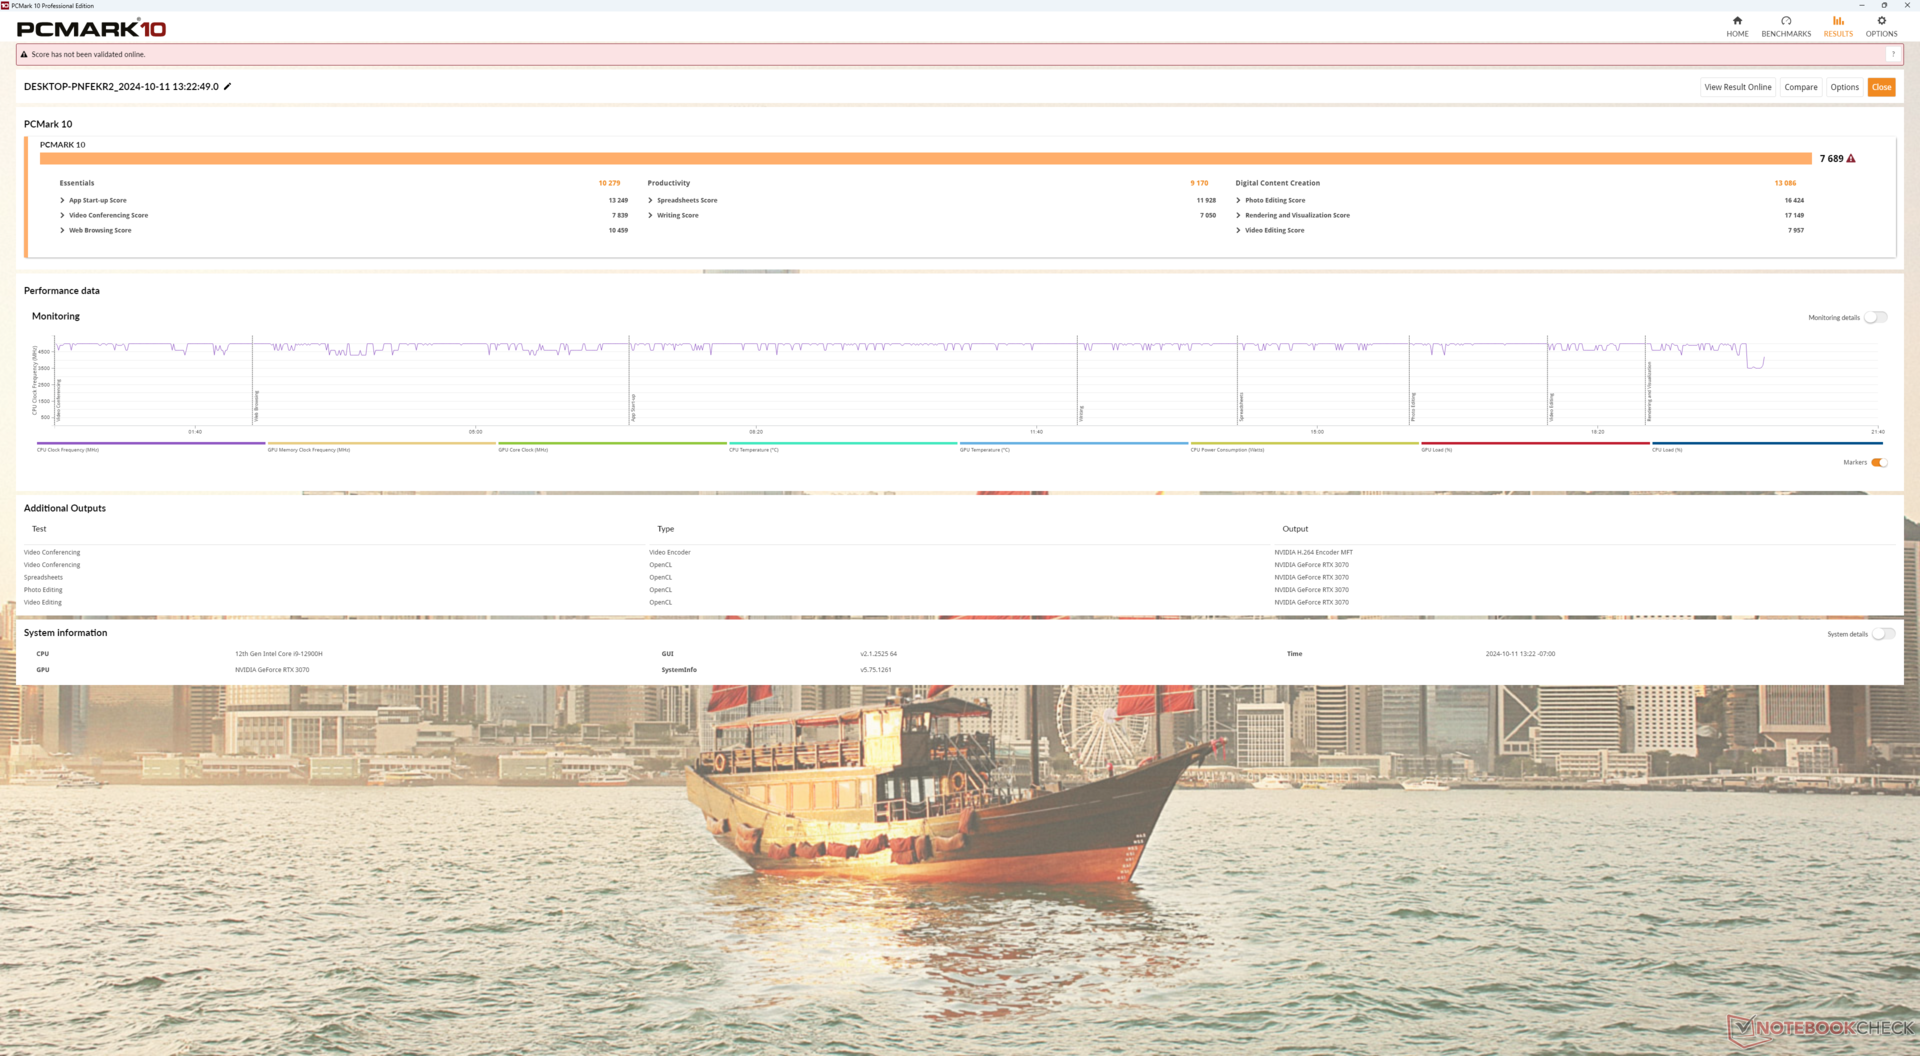
PCMark 结果可与使用独立显卡的笔记本电脑和其他迷你 PC 相媲美,包括 华硕 ROG NUC 14.不过,我们的生产力得分相对较低,这可能是由于采用了较旧的第 12 代英特尔 CPU。
CrossMark: Overall | Productivity | Creativity | Responsiveness
WebXPRT 3: Overall
WebXPRT 4: Overall
Mozilla Kraken 1.1: Total
| PCMark 10 / Digital Content Creation | |
| Minisforum G7 PT | |
| Lenovo Legion 9 16IRX9, RTX 4090 | |
| Asus TUF Gaming A14 FA401WV-WB94 | |
| Asus ROG NUC 14-90AS0051 | |
| Beelink GTI12 Ultra EX Docking Station | |
| Maingear ML-16 MK2 | |
| MSI GeForce RTX 3070 Ventus 3X | |
| Acemagic M2A | |
| Lenovo IdeaPad Pro 5 16IMH G9 RTX 4050 | |
| Acemagic Tank03 | |
| Mozilla Kraken 1.1 / Total | |
| MSI GeForce RTX 3070 Ventus 3X | |
| Acemagic Tank03 | |
| Maingear ML-16 MK2 | |
| Lenovo Legion 9 16IRX9, RTX 4090 | |
| Asus ROG NUC 14-90AS0051 | |
| Beelink GTI12 Ultra EX Docking Station | |
| Lenovo IdeaPad Pro 5 16IMH G9 RTX 4050 | |
| Acemagic M2A | |
| Minisforum G7 PT | |
| Asus TUF Gaming A14 FA401WV-WB94 | |
* ... smaller is better
| PCMark 10 Score | 7689 points | |
Help | ||
| AIDA64 / Memory Copy | |
| Asus ROG NUC 14-90AS0051 | |
| Asus NUC 14 Pro | |
| Geekom AX8 Pro | |
| GMK NucBox K9 | |
| Minisforum MS-A1 | |
| Beelink GTI12 Ultra EX Docking Station | |
| Average Intel Core i9-12900H (34438 - 74264, n=28) | |
| AIDA64 / Memory Read | |
| Asus NUC 14 Pro | |
| Asus ROG NUC 14-90AS0051 | |
| GMK NucBox K9 | |
| Beelink GTI12 Ultra EX Docking Station | |
| Average Intel Core i9-12900H (36365 - 74642, n=28) | |
| Geekom AX8 Pro | |
| Minisforum MS-A1 | |
| AIDA64 / Memory Write | |
| Geekom AX8 Pro | |
| Minisforum MS-A1 | |
| Asus NUC 14 Pro | |
| GMK NucBox K9 | |
| Asus ROG NUC 14-90AS0051 | |
| Beelink GTI12 Ultra EX Docking Station | |
| Average Intel Core i9-12900H (32276 - 67858, n=28) | |
| AIDA64 / Memory Latency | |
| Asus ROG NUC 14-90AS0051 | |
| GMK NucBox K9 | |
| Asus NUC 14 Pro | |
| Geekom AX8 Pro | |
| Beelink GTI12 Ultra EX Docking Station | |
| Minisforum MS-A1 | |
| Average Intel Core i9-12900H (74.7 - 118.1, n=27) | |
* ... smaller is better
DPC 延迟
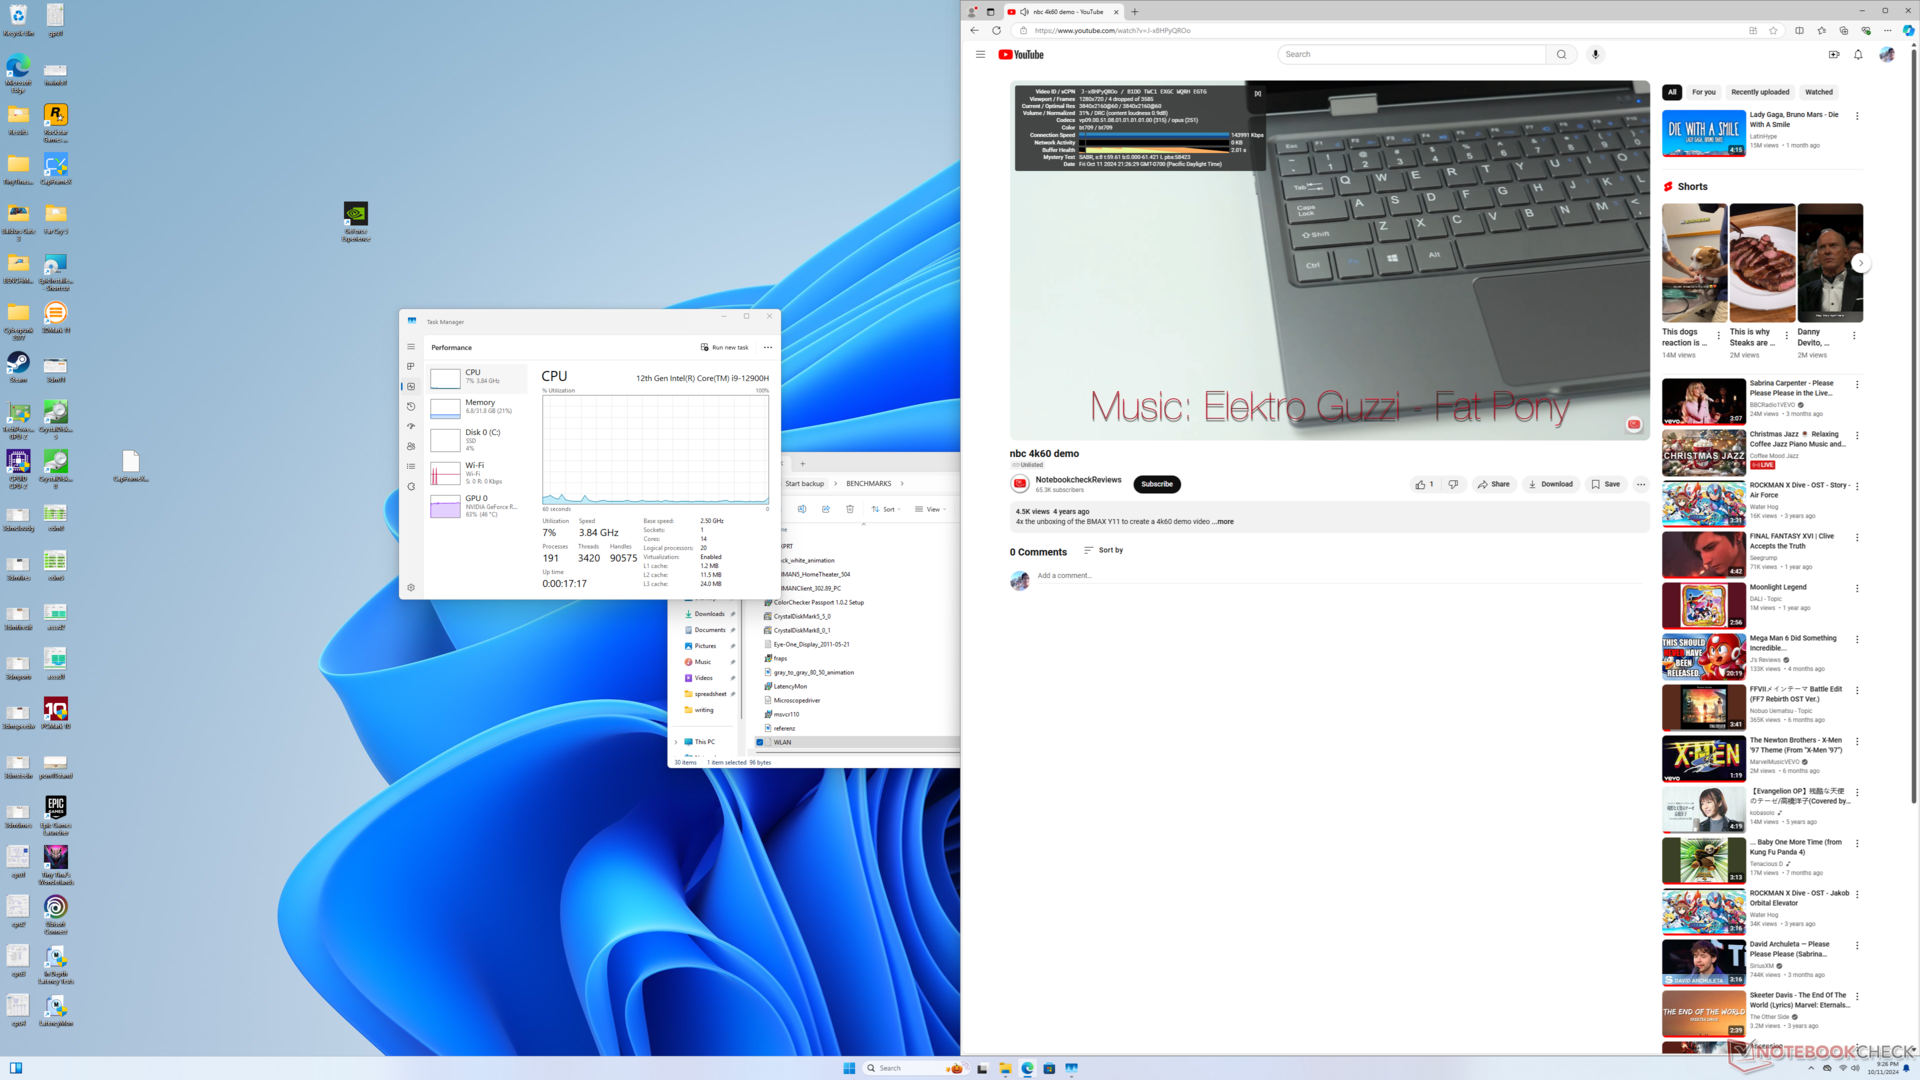
以 60 FPS 播放 4K 视频几乎完美。奇怪的是,在按下播放按钮后总会立即出现几帧跳帧,而我们在其他电脑上通常不会遇到这种情况。否则,在测试视频的其余部分都不会出现跳帧现象。
LatencyMon 与当前版本的系统不兼容。
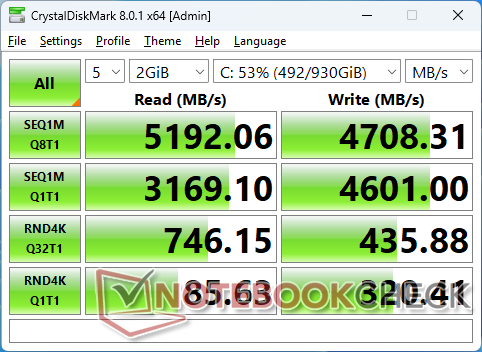
存储设备
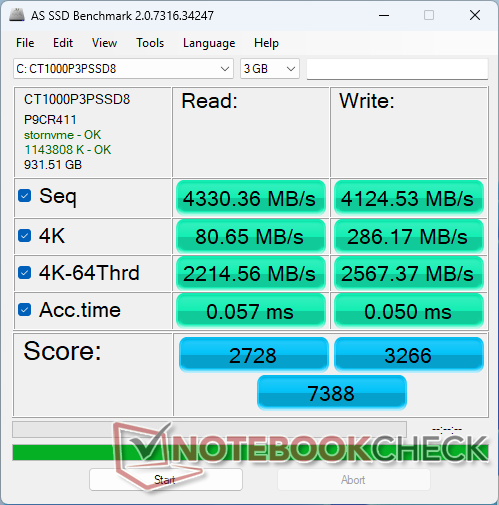
我们的设备配备了 1 TB 固态硬盘.最大传输速率达到 5200 MB/s,几分钟后又降至 4800 MB/s。相比之下,华硕 NUC 14 中速度更快的三星 PM9A1a 可维持每秒 6700 MB 的速度。

| Drive Performance Rating - Percent | |
| Beelink GTI12 Ultra EX Docking Station | |
| GMK NucBox K9 | |
| Minisforum MS-A1 | |
| Geekom AX8 Pro | |
| Asus ROG NUC 14-90AS0051 | |
| Asus NUC 14 Pro | |
* ... smaller is better
Disk Throttling: DiskSpd Read Loop, Queue Depth 8
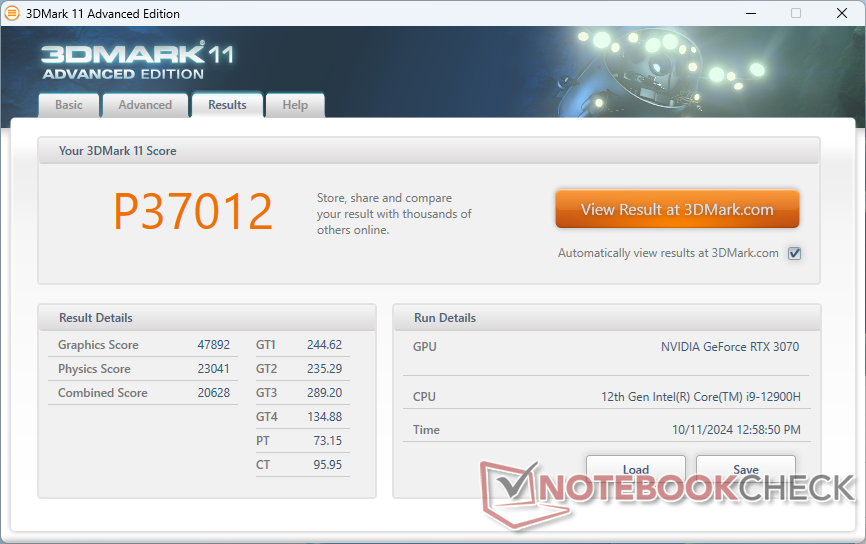
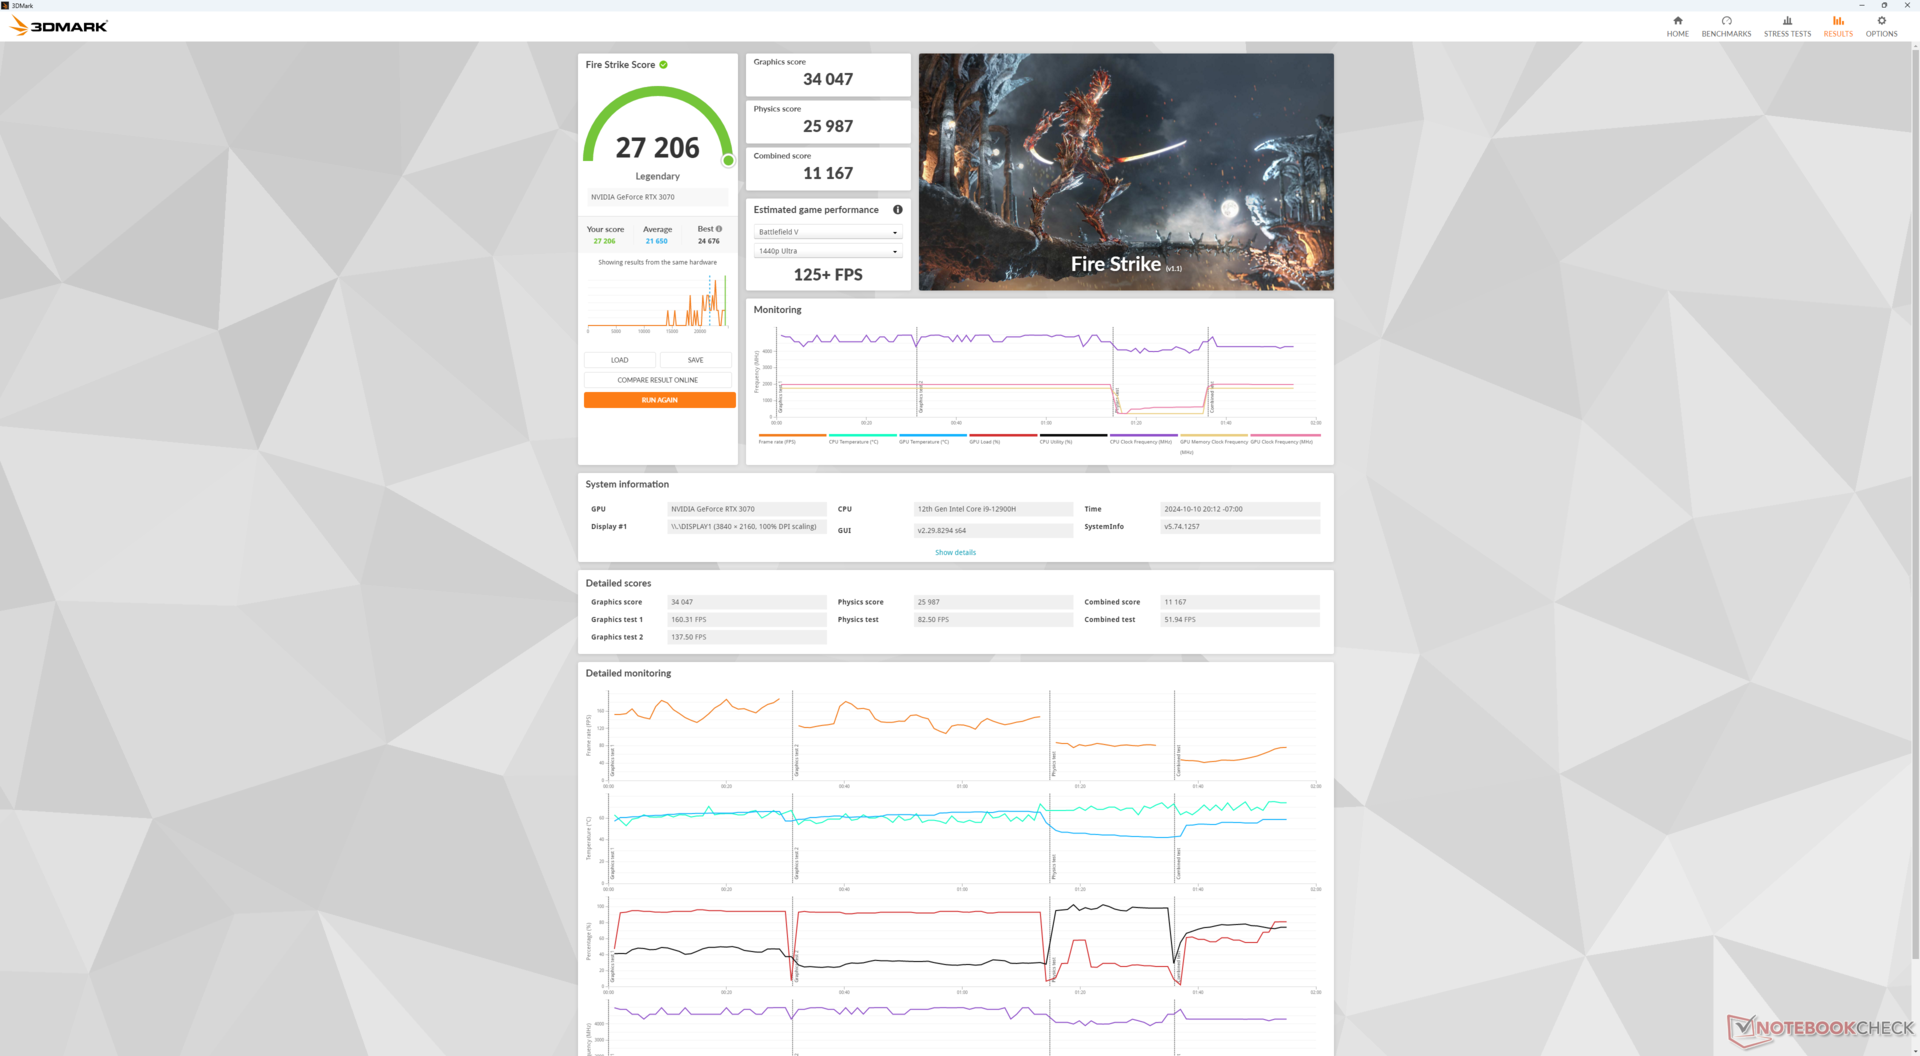
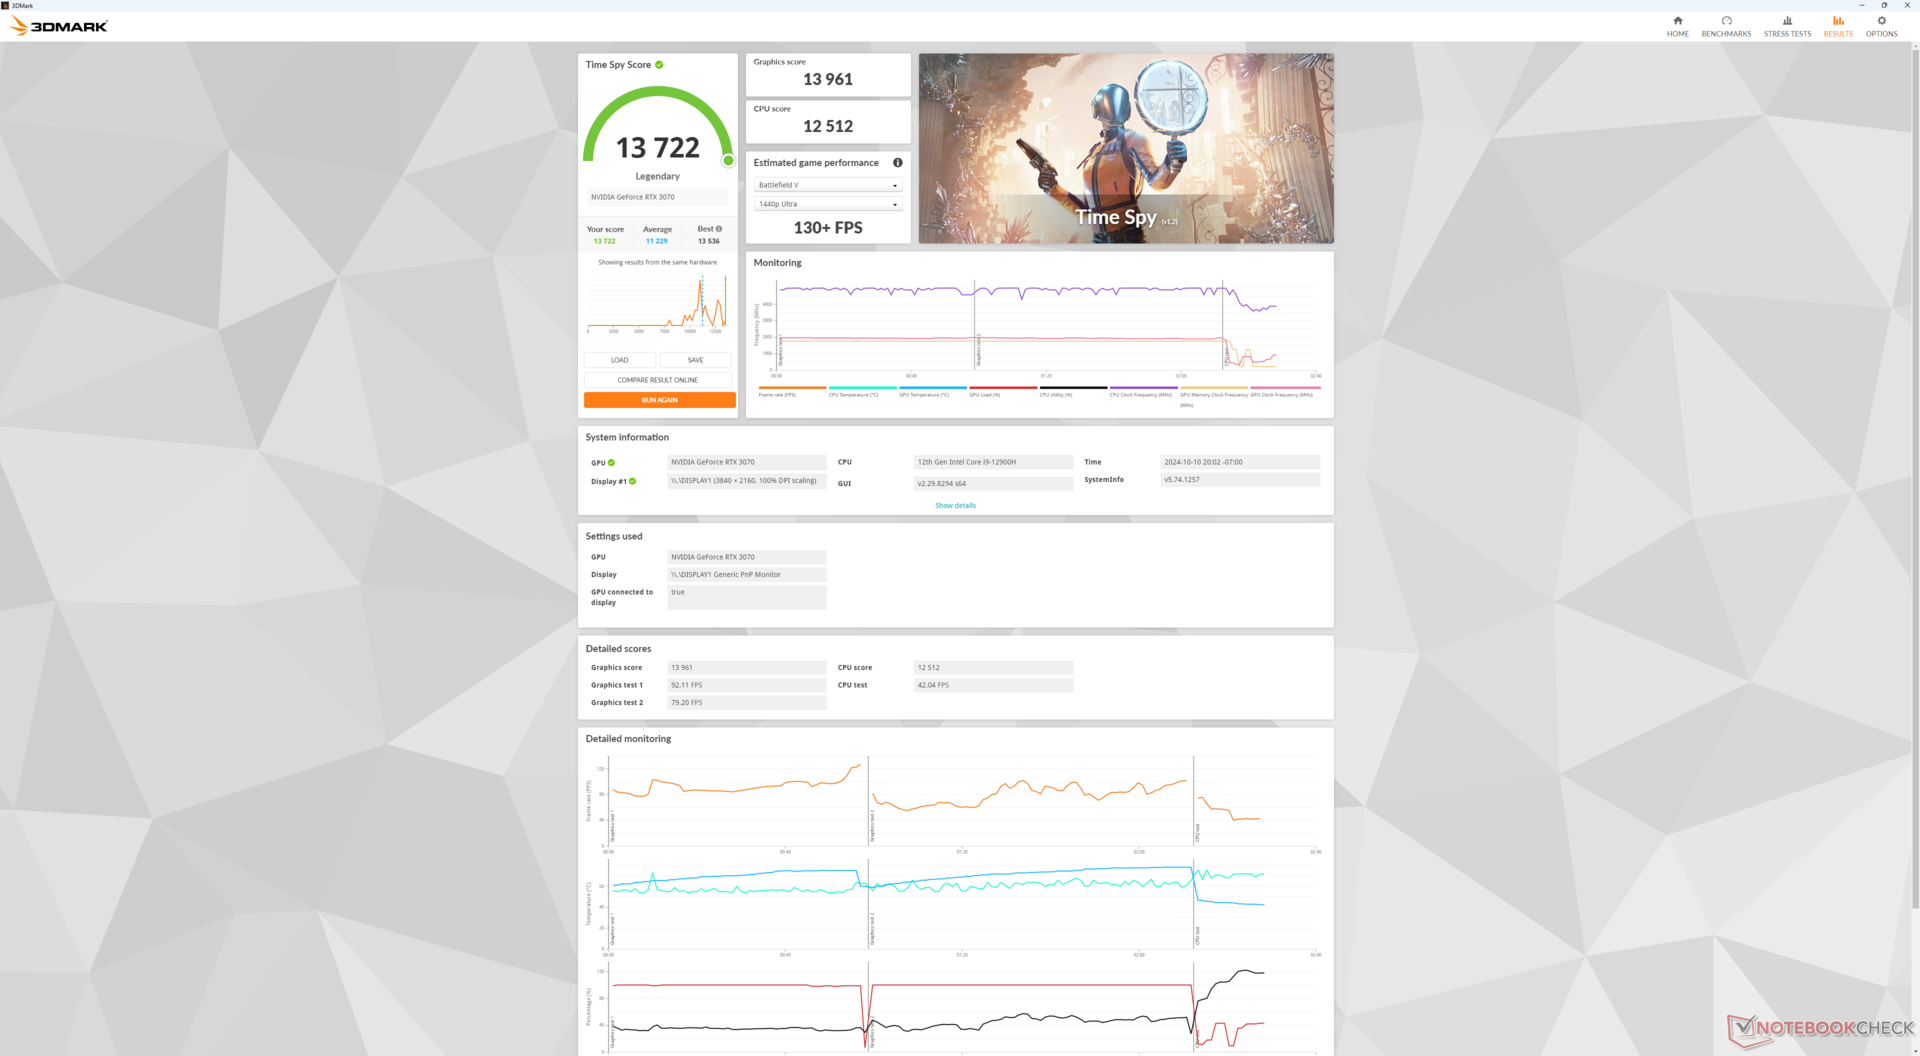
图形处理器性能
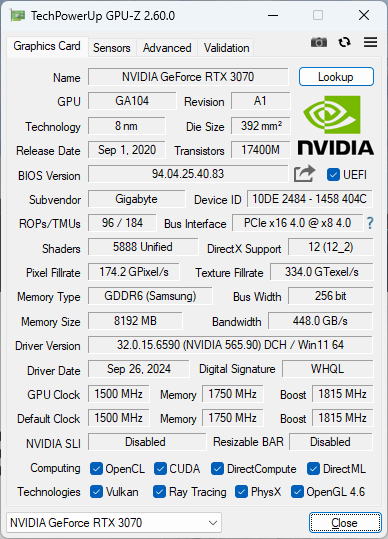
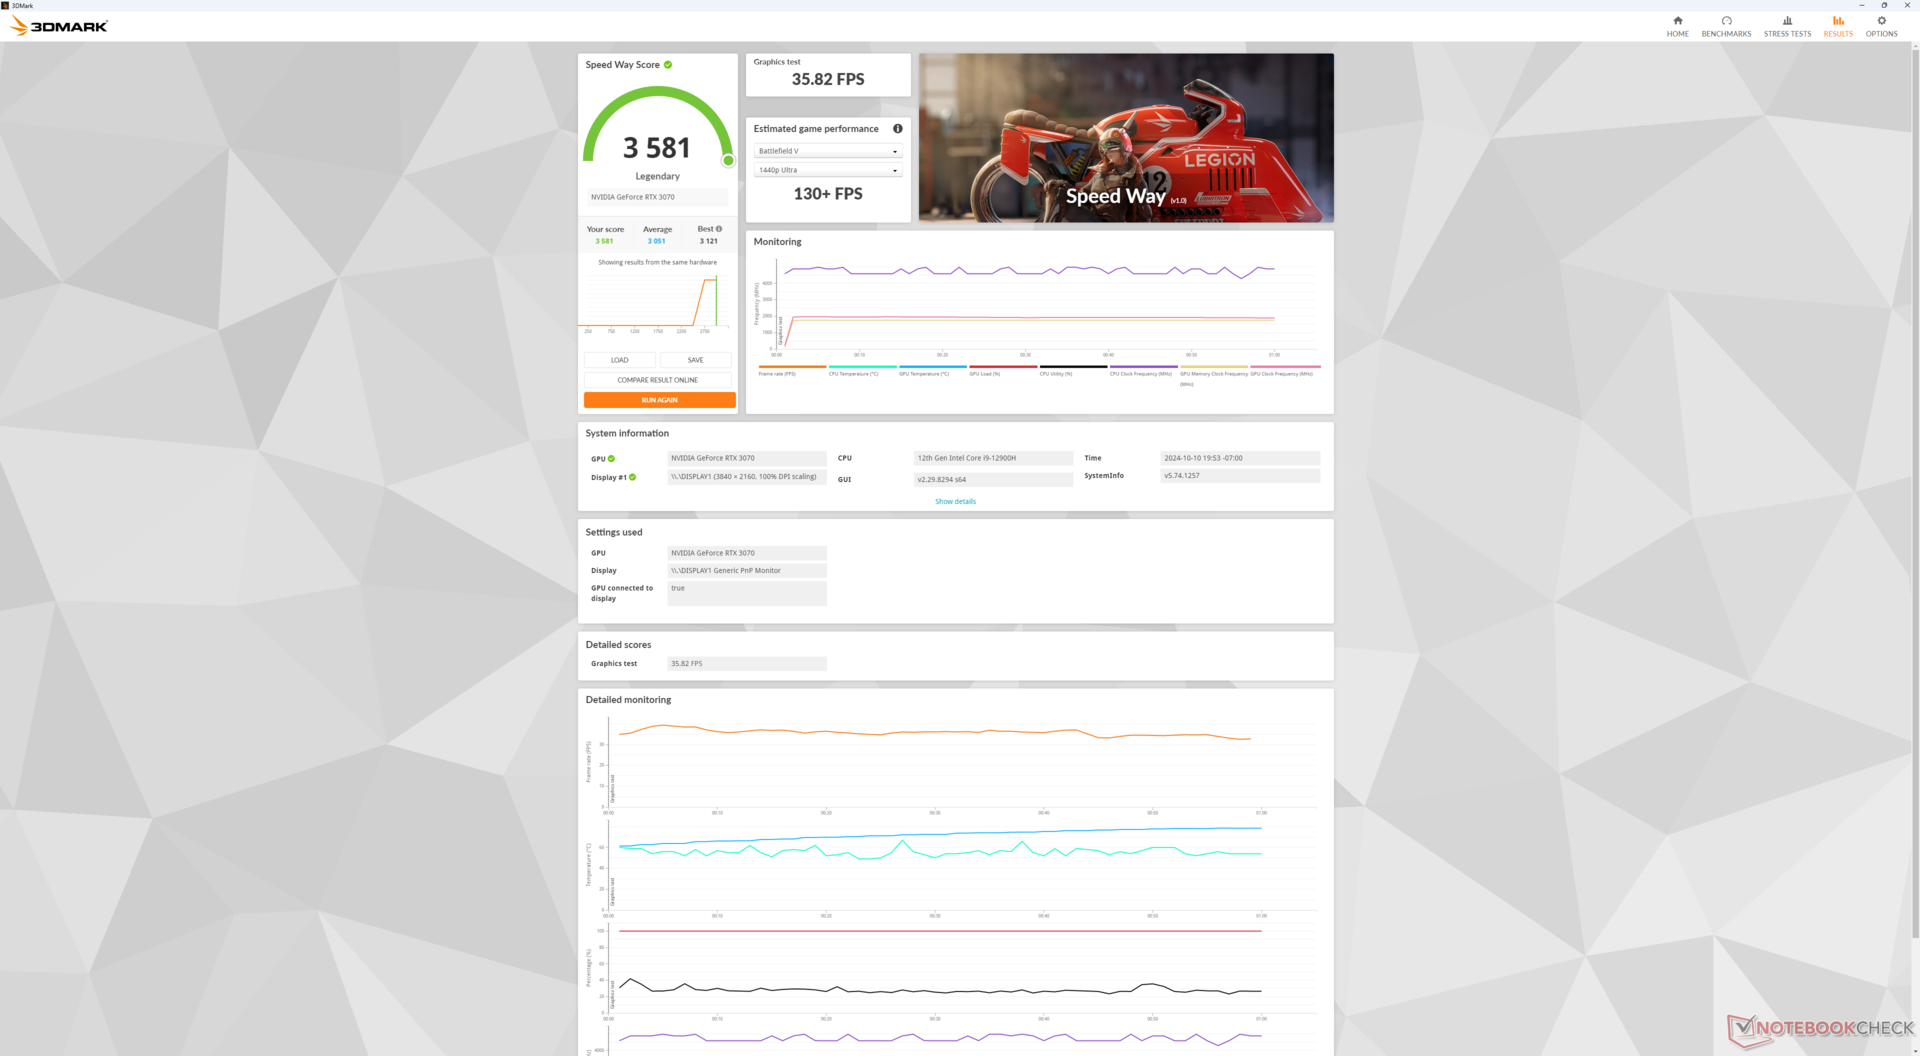
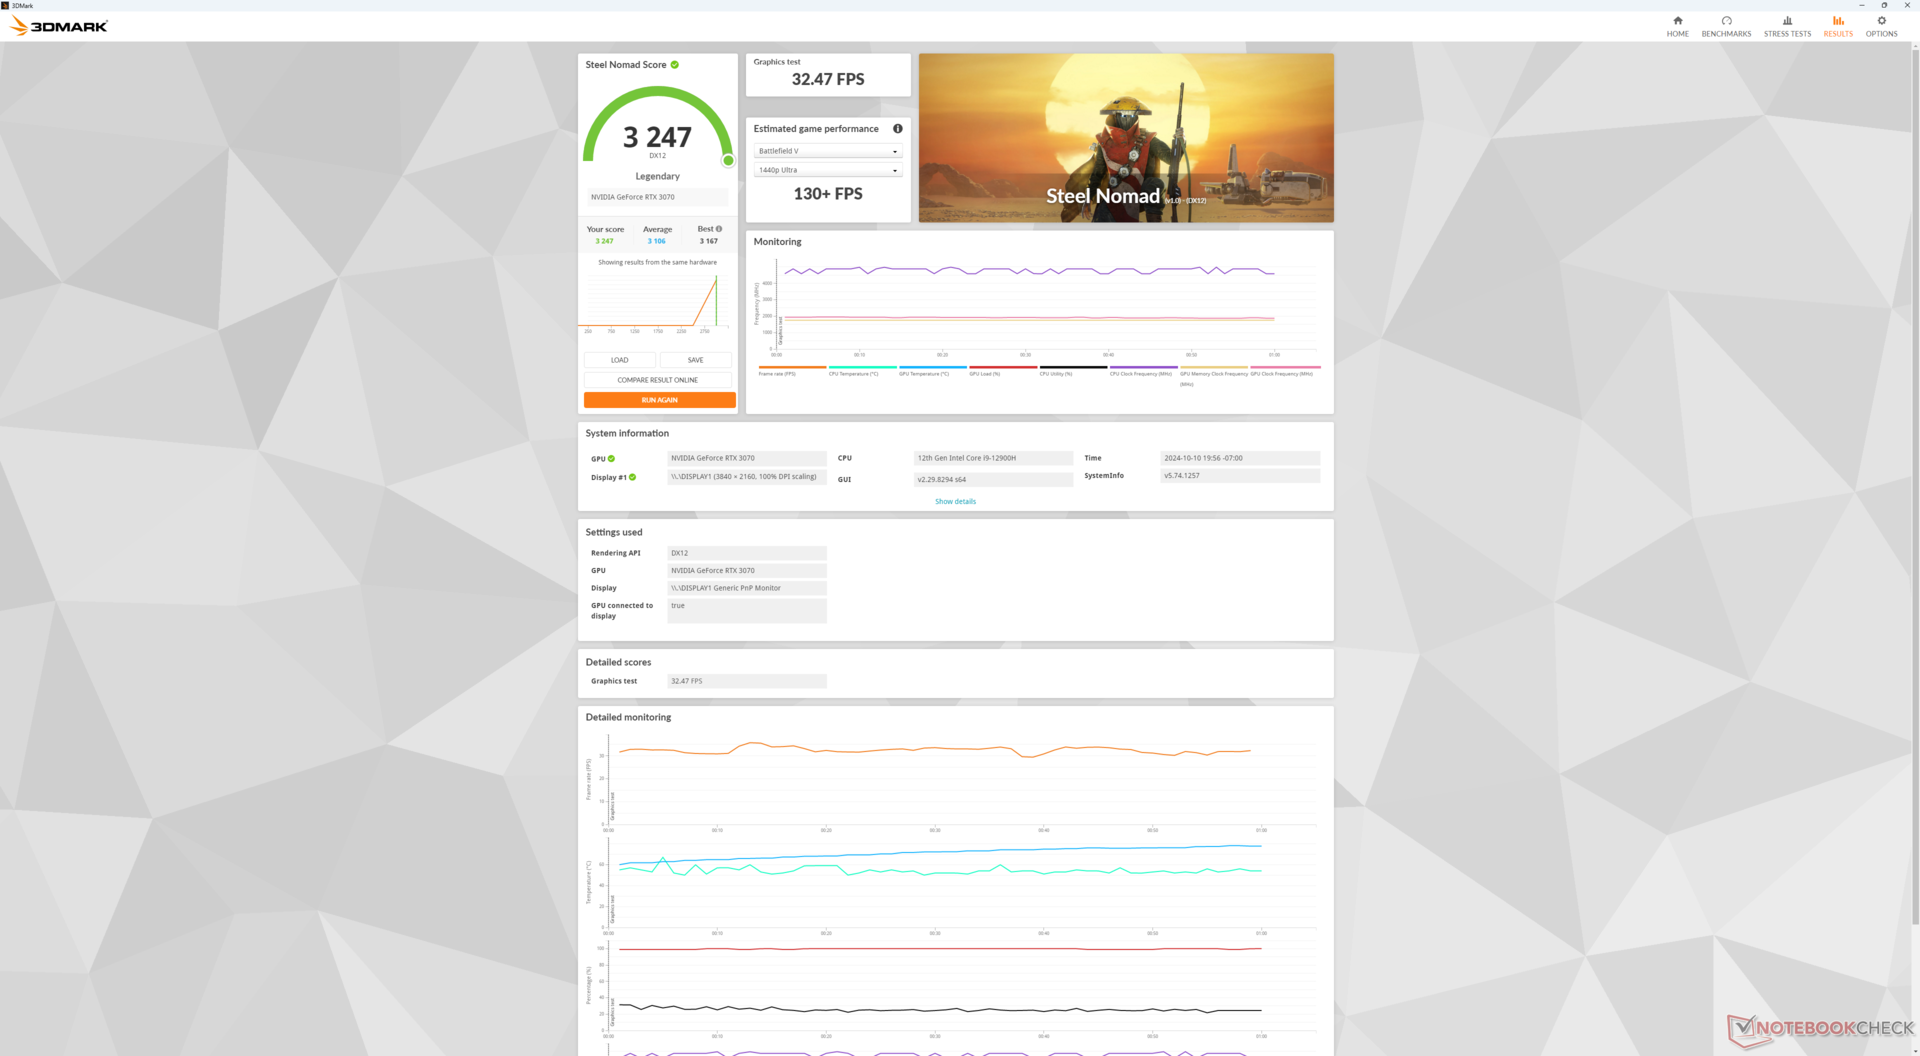
......(英文 GeForce RTX 3070已经过大量测试,因此其性能不会带来任何惊喜。相反,我们感兴趣的是,与配备 RTX 3070 的 "正规 "台式电脑相比,我们的插接式 RTX 3070 在性能上可能存在的任何不足。在这种情况下,性能基本上与我们的参考台式机 RTX 3070 PC 相当,甚至略快几个百分点,没有明显的性能损失。当然,如果安装更快的 GPU(如 RTX 4090),PCIe x8 接口可能会成为更多限制因素,结果可能会有所不同。
| 3DMark Performance Rating - Percent | |
| Lenovo Legion 9 16IRX9, RTX 4090 -2! | |
| Beelink GTI12 Ultra EX Docking Station | |
| Average NVIDIA GeForce RTX 3070 | |
| Asus ROG NUC 14-90AS0051 | |
| MSI GeForce RTX 3070 Ventus 3X -2! | |
| Maingear ML-16 MK2 | |
| Minisforum G7 PT | |
| Asus TUF Gaming A14 FA401WV-WB94 | |
| Acemagic M2A | |
| Acemagic Tank03 -1! | |
| Lenovo IdeaPad Pro 5 16IMH G9 RTX 4050 | |
| 3DMark 11 - 1280x720 Performance GPU | |
| Lenovo Legion 9 16IRX9, RTX 4090 | |
| Beelink GTI12 Ultra EX Docking Station | |
| Minisforum G7 PT | |
| MSI GeForce RTX 3070 Ventus 3X | |
| Average NVIDIA GeForce RTX 3070 (26812 - 47892, n=10) | |
| Asus ROG NUC 14-90AS0051 | |
| Maingear ML-16 MK2 | |
| Asus TUF Gaming A14 FA401WV-WB94 | |
| Acemagic Tank03 | |
| Acemagic M2A | |
| Lenovo IdeaPad Pro 5 16IMH G9 RTX 4050 | |
| 3DMark 11 Performance | 37012 points | |
| 3DMark Cloud Gate Standard Score | 57634 points | |
| 3DMark Fire Strike Score | 27206 points | |
| 3DMark Time Spy Score | 13722 points | |
| 3DMark Steel Nomad Score | 3247 points | |
Help | ||
* ... smaller is better
游戏性能
尽管是四年前(!)的 GPU,台式机GeForce RTX 3070 的性能依然强劲,尤其是与功率包络线更小的游戏笔记本电脑相比。我们选择的 GTI12 Ultra 和 eGPU 可以轻松超越配备GeForce RTX 4070 的笔记本电脑,如 Maingear ML-16 MK2更符合 移动 RTX 4080.请注意,这还没有考虑任何 DLSS 升频方法,因此如果游戏支持 DLSS 3,移动 RTX 40 系列仍有可能运行得更好。
| Performance Rating - Percent | |
| Lenovo Legion 9 16IRX9, RTX 4090 -1! | |
| Beelink GTI12 Ultra EX Docking Station | |
| MSI GeForce RTX 3070 Ventus 3X -2! | |
| Acemagic M2A | |
| Asus ROG NUC 14-90AS0051 -1! | |
| Minisforum G7 PT | |
| Acemagic Tank03 | |
| Asus TUF Gaming A14 FA401WV-WB94 | |
| Lenovo IdeaPad Pro 5 16IMH G9 RTX 4050 | |
| GTA V - 1920x1080 Highest Settings possible AA:4xMSAA + FX AF:16x | |
| Lenovo Legion 9 16IRX9, RTX 4090 | |
| Acemagic M2A | |
| Beelink GTI12 Ultra EX Docking Station | |
| Acemagic Tank03 | |
| Asus TUF Gaming A14 FA401WV-WB94 | |
| MSI GeForce RTX 3070 Ventus 3X | |
| Asus ROG NUC 14-90AS0051 | |
| Minisforum G7 PT | |
| Lenovo IdeaPad Pro 5 16IMH G9 RTX 4050 | |
| Final Fantasy XV Benchmark - 1920x1080 High Quality | |
| Lenovo Legion 9 16IRX9, RTX 4090 | |
| Beelink GTI12 Ultra EX Docking Station | |
| MSI GeForce RTX 3070 Ventus 3X | |
| Acemagic Tank03 | |
| Acemagic M2A | |
| Asus TUF Gaming A14 FA401WV-WB94 | |
| Minisforum G7 PT | |
| Lenovo IdeaPad Pro 5 16IMH G9 RTX 4050 | |
| Strange Brigade - 1920x1080 ultra AA:ultra AF:16 | |
| Lenovo Legion 9 16IRX9, RTX 4090 | |
| Beelink GTI12 Ultra EX Docking Station | |
| MSI GeForce RTX 3070 Ventus 3X | |
| Asus ROG NUC 14-90AS0051 | |
| Asus TUF Gaming A14 FA401WV-WB94 | |
| Minisforum G7 PT | |
| Acemagic Tank03 | |
| Acemagic M2A | |
| Lenovo IdeaPad Pro 5 16IMH G9 RTX 4050 | |
| Dota 2 Reborn - 1920x1080 ultra (3/3) best looking | |
| Lenovo Legion 9 16IRX9, RTX 4090 | |
| Minisforum G7 PT | |
| Beelink GTI12 Ultra EX Docking Station | |
| Acemagic M2A | |
| Acemagic Tank03 | |
| Lenovo IdeaPad Pro 5 16IMH G9 RTX 4050 | |
| MSI GeForce RTX 3070 Ventus 3X | |
| Asus TUF Gaming A14 FA401WV-WB94 | |
| Asus ROG NUC 14-90AS0051 | |
| X-Plane 11.11 - 1920x1080 high (fps_test=3) | |
| Lenovo Legion 9 16IRX9, RTX 4090 | |
| Acemagic M2A | |
| Acemagic Tank03 | |
| MSI GeForce RTX 3070 Ventus 3X | |
| Beelink GTI12 Ultra EX Docking Station | |
| Minisforum G7 PT | |
| Lenovo IdeaPad Pro 5 16IMH G9 RTX 4050 | |
| Asus ROG NUC 14-90AS0051 | |
| Asus TUF Gaming A14 FA401WV-WB94 | |
| Cyberpunk 2077 2.2 Phantom Liberty - 1920x1080 Ultra Preset (FSR off) | |
| Lenovo Legion 9 16IRX9, RTX 4090 | |
| Beelink GTI12 Ultra EX Docking Station | |
| Minisforum G7 PT | |
| Asus ROG NUC 14-90AS0051 | |
| Acemagic M2A | |
| Acemagic Tank03 | |
| Asus TUF Gaming A14 FA401WV-WB94 | |
| Lenovo IdeaPad Pro 5 16IMH G9 RTX 4050 | |
| Dota 2 Reborn | |
| 1920x1080 ultra (3/3) best looking | |
| Lenovo Legion 9 16IRX9, RTX 4090 | |
| Minisforum G7 PT | |
| Beelink GTI12 Ultra EX Docking Station | |
| Acemagic M2A | |
| Maingear ML-16 MK2 | |
| Acemagic Tank03 | |
| Lenovo IdeaPad Pro 5 16IMH G9 RTX 4050 | |
| MSI GeForce RTX 3070 Ventus 3X | |
| Asus TUF Gaming A14 FA401WV-WB94 | |
| Asus ROG NUC 14-90AS0051 | |
| Average NVIDIA GeForce RTX 3070 (92.1 - 149.3, n=7) | |
| 3840x2160 ultra (3/3) best looking | |
| Lenovo Legion 9 16IRX9, RTX 4090 | |
| Beelink GTI12 Ultra EX Docking Station | |
| Asus ROG NUC 14-90AS0051 | |
| Average NVIDIA GeForce RTX 3070 (122.7 - 144.3, n=5) | |
| MSI GeForce RTX 3070 Ventus 3X | |
| Acemagic M2A | |
| Acemagic Tank03 | |
| Minisforum G7 PT | |
| Final Fantasy XV Benchmark | |
| 1920x1080 High Quality | |
| Lenovo Legion 9 16IRX9, RTX 4090 | |
| Beelink GTI12 Ultra EX Docking Station | |
| Average NVIDIA GeForce RTX 3070 (112 - 138.7, n=5) | |
| MSI GeForce RTX 3070 Ventus 3X | |
| Maingear ML-16 MK2 | |
| Acemagic Tank03 | |
| Acemagic M2A | |
| Asus TUF Gaming A14 FA401WV-WB94 | |
| Minisforum G7 PT | |
| Lenovo IdeaPad Pro 5 16IMH G9 RTX 4050 | |
| 2560x1440 High Quality | |
| Lenovo Legion 9 16IRX9, RTX 4090 | |
| Beelink GTI12 Ultra EX Docking Station | |
| Average NVIDIA GeForce RTX 3070 (89.2 - 104.9, n=5) | |
| MSI GeForce RTX 3070 Ventus 3X | |
| Maingear ML-16 MK2 | |
| Acemagic Tank03 | |
| Acemagic M2A | |
| Asus TUF Gaming A14 FA401WV-WB94 | |
| Minisforum G7 PT | |
| 3840x2160 High Quality | |
| Beelink GTI12 Ultra EX Docking Station | |
| Average NVIDIA GeForce RTX 3070 (54.8 - 61.5, n=5) | |
| MSI GeForce RTX 3070 Ventus 3X | |
| Acemagic M2A | |
| Acemagic Tank03 | |
| Minisforum G7 PT | |
| X-Plane 11.11 | |
| 1920x1080 med (fps_test=2) | |
| Lenovo Legion 9 16IRX9, RTX 4090 | |
| Acemagic M2A | |
| Acemagic Tank03 | |
| Maingear ML-16 MK2 | |
| MSI GeForce RTX 3070 Ventus 3X | |
| Lenovo IdeaPad Pro 5 16IMH G9 RTX 4050 | |
| Asus ROG NUC 14-90AS0051 | |
| Minisforum G7 PT | |
| Average NVIDIA GeForce RTX 3070 (55.4 - 137.4, n=7) | |
| Beelink GTI12 Ultra EX Docking Station | |
| Asus TUF Gaming A14 FA401WV-WB94 | |
| 1920x1080 high (fps_test=3) | |
| Lenovo Legion 9 16IRX9, RTX 4090 | |
| Acemagic M2A | |
| Acemagic Tank03 | |
| MSI GeForce RTX 3070 Ventus 3X | |
| Maingear ML-16 MK2 | |
| Beelink GTI12 Ultra EX Docking Station | |
| Minisforum G7 PT | |
| Average NVIDIA GeForce RTX 3070 (53.7 - 111.3, n=7) | |
| Lenovo IdeaPad Pro 5 16IMH G9 RTX 4050 | |
| Asus ROG NUC 14-90AS0051 | |
| Asus TUF Gaming A14 FA401WV-WB94 | |
| 3840x2160 high (fps_test=3) | |
| Lenovo Legion 9 16IRX9, RTX 4090 | |
| Acemagic M2A | |
| Acemagic Tank03 | |
| Average NVIDIA GeForce RTX 3070 (78.8 - 98.4, n=5) | |
| MSI GeForce RTX 3070 Ventus 3X | |
| Beelink GTI12 Ultra EX Docking Station | |
| Asus ROG NUC 14-90AS0051 | |
| Minisforum G7 PT | |
Cyberpunk 2077 ultra FPS Chart
| low | med. | high | ultra | QHD | 4K | |
|---|---|---|---|---|---|---|
| GTA V (2015) | 184.3 | 178.9 | 176.5 | 111.3 | 108.8 | 129 |
| Dota 2 Reborn (2015) | 175.9 | 162 | 158.5 | 149.3 | 144.3 | |
| Final Fantasy XV Benchmark (2018) | 209 | 184.8 | 138.7 | 104.9 | 61.5 | |
| X-Plane 11.11 (2018) | 118.2 | 106.1 | 89.5 | 79.4 | ||
| Far Cry 5 (2018) | 170 | 154 | 148 | 142 | 130 | 75 |
| Strange Brigade (2018) | 459 | 339 | 280 | 245 | 181.1 | 104.6 |
| Tiny Tina's Wonderlands (2022) | 268.9 | 216.7 | 154.9 | 122.6 | 87.1 | 48.9 |
| F1 22 (2022) | 282 | 277 | 264 | 91.8 | 58.8 | 28.8 |
| Baldur's Gate 3 (2023) | 174.5 | 152.6 | 137.1 | 132.9 | 93.5 | 49.7 |
| Cyberpunk 2077 2.2 Phantom Liberty (2023) | 148.5 | 133.9 | 115.3 | 102.2 | 65.7 | 29.9 |
排放量
系统噪音
风扇噪音始终存在,因为即使微型 PC 和 GPU 的风扇处于非活动状态,EX 底座的内部 PSU 风扇也始终处于活动状态。在相同的 15 厘米记录距离下,噪音水平普遍高于大多数其他迷你 PC,但噪音曲线较宽,不像我们习惯的那样尖锐。与游戏笔记本电脑通常更尖锐、更响亮的风扇相比,低分贝频率的干扰较小,更容易忍受。
Noise Level
| Idle |
| 32.7 / 32.7 / 35.3 dB(A) |
| Load |
| 36.8 / 52.9 dB(A) |
 | ||
30 dB silent 40 dB(A) audible 50 dB(A) loud |
||
min: | ||
| Beelink GTI12 Ultra EX Docking Station NVIDIA GeForce RTX 3070, i9-12900H, Crucial P3 Plus CT1000P3PSSD8 | Minisforum MS-A1 Radeon 780M, Ryzen 7 8700G, Kingston OM8PGP41024Q-A0 | GMK NucBox K9 Arc 7-Core, Ultra 5 125H, MasonSemi 1TB MC7000 | Asus NUC 14 Pro Arc 7-Core, Ultra 5 125H, Kingston KC3000 2048G SKC3000D2048G | Geekom AX8 Pro Radeon 780M, R9 8945HS, Acer N7000 2 TB | Asus ROG NUC 14-90AS0051 NVIDIA GeForce RTX 4070 Laptop GPU, Ultra 9 185H, Samsung PM9A1a MZVL21T0HDLU | |
|---|---|---|---|---|---|---|
| Noise | 1% | 2% | 9% | 5% | 15% | |
| off / environment * | 22.8 | 24.8 -9% | 23 -1% | 24 -5% | 24.9 -9% | 24.9 -9% |
| Idle Minimum * | 32.7 | 33.9 -4% | 29.8 9% | 26 20% | 24.9 24% | 24.9 24% |
| Idle Average * | 32.7 | 34 -4% | 35.7 -9% | 26.2 20% | 24.9 24% | 24.9 24% |
| Idle Maximum * | 35.3 | 34 4% | 35.7 -1% | 26.2 26% | 24.9 29% | 24.9 29% |
| Load Average * | 36.8 | 41.1 -12% | 41.9 -14% | 42.4 -15% | 50.1 -36% | 37.9 -3% |
| Cyberpunk 2077 ultra * | 50.3 | 42.2 16% | 43.8 13% | 47.7 5% | 50 1% | 38.3 24% |
| Load Maximum * | 52.9 | 46.2 13% | 44 17% | 47.8 10% | 50.2 5% | 44.2 16% |
* ... smaller is better
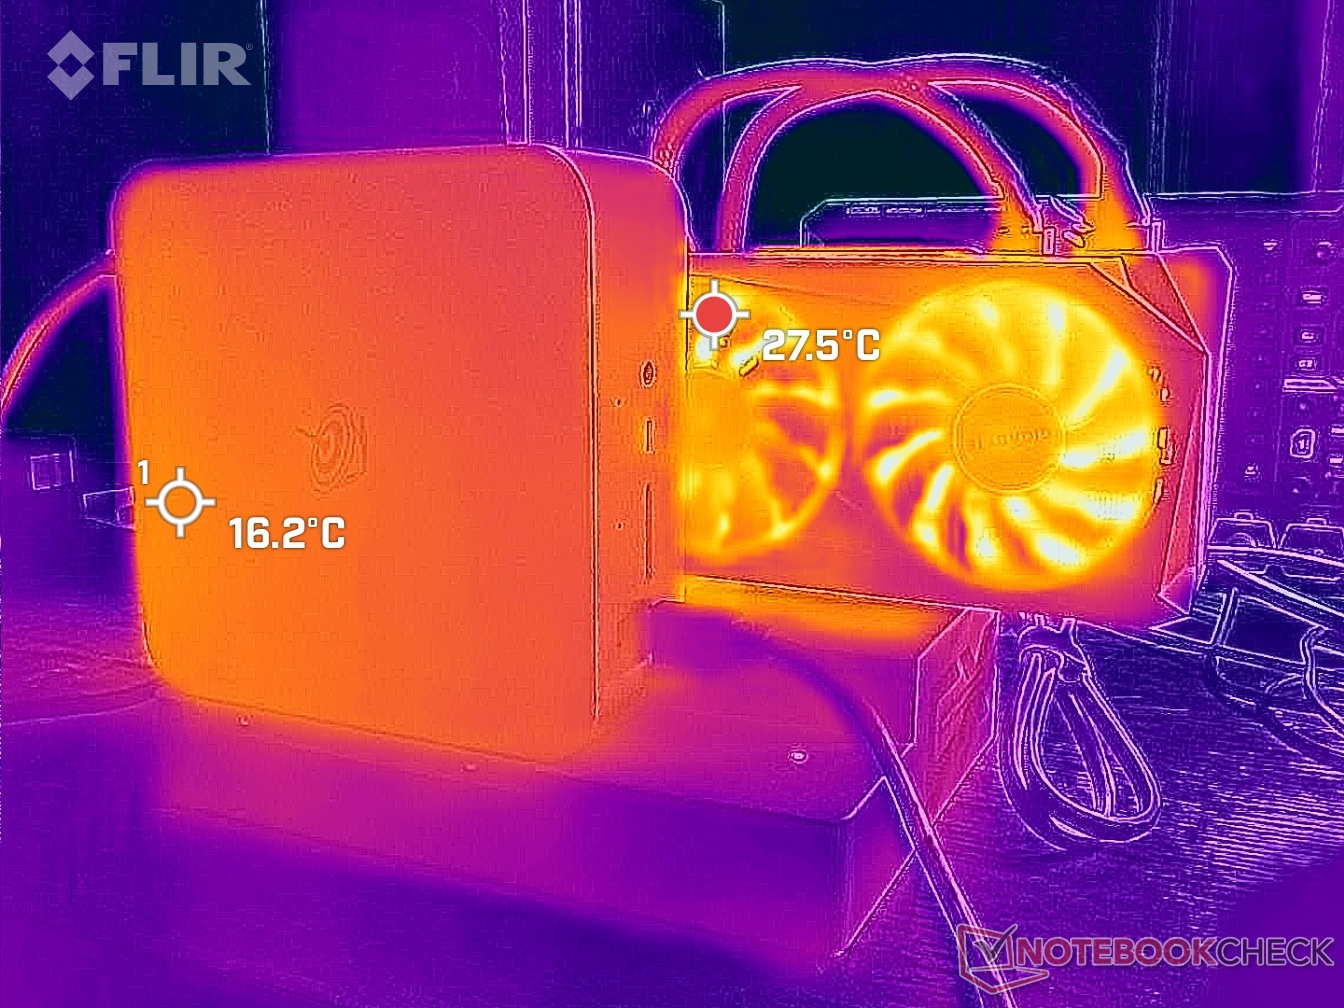
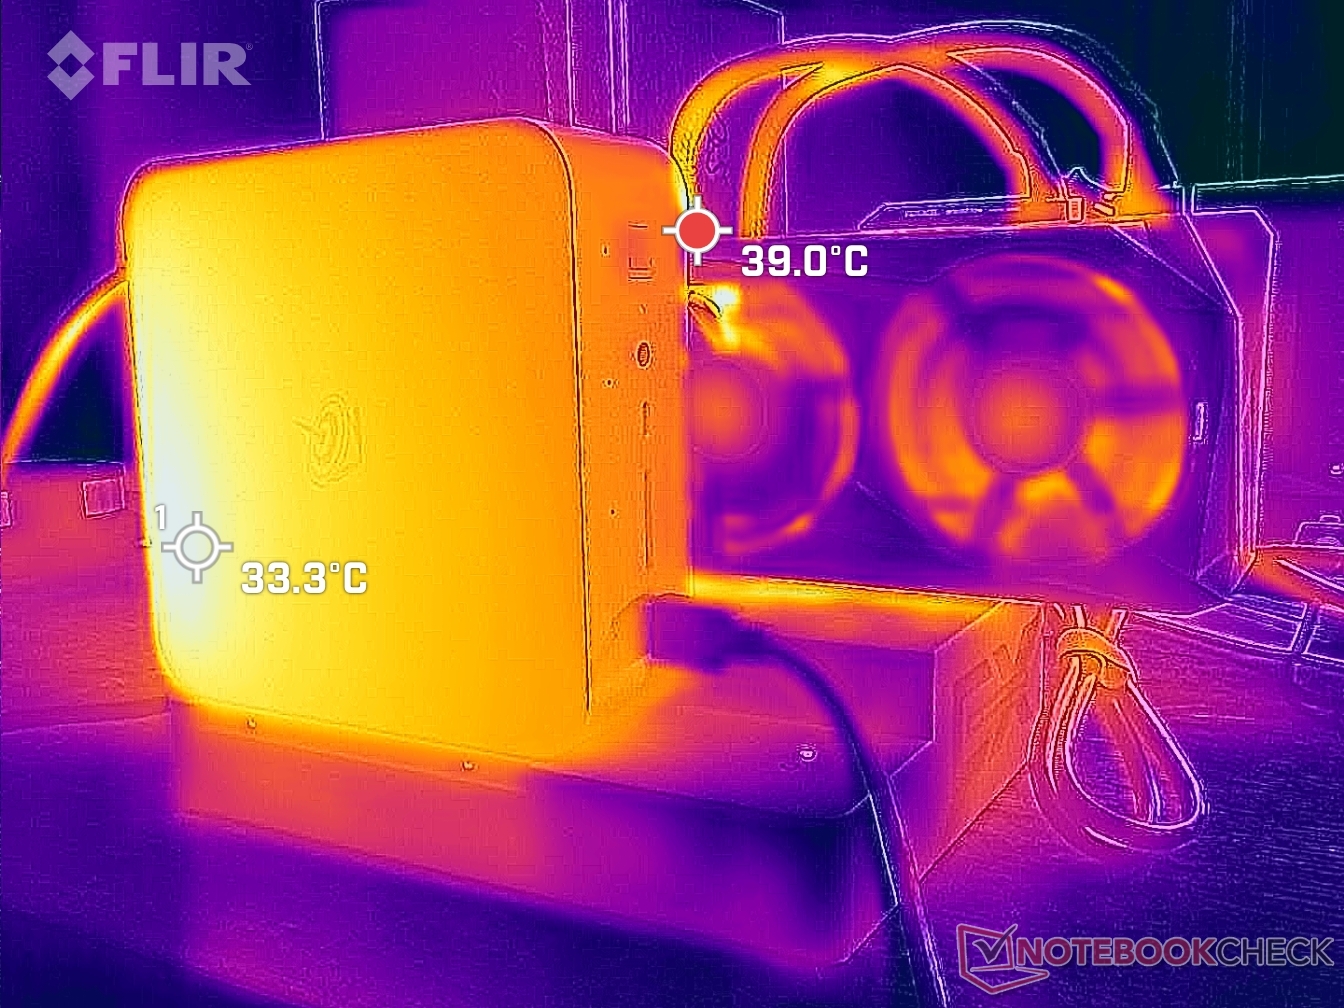
温度
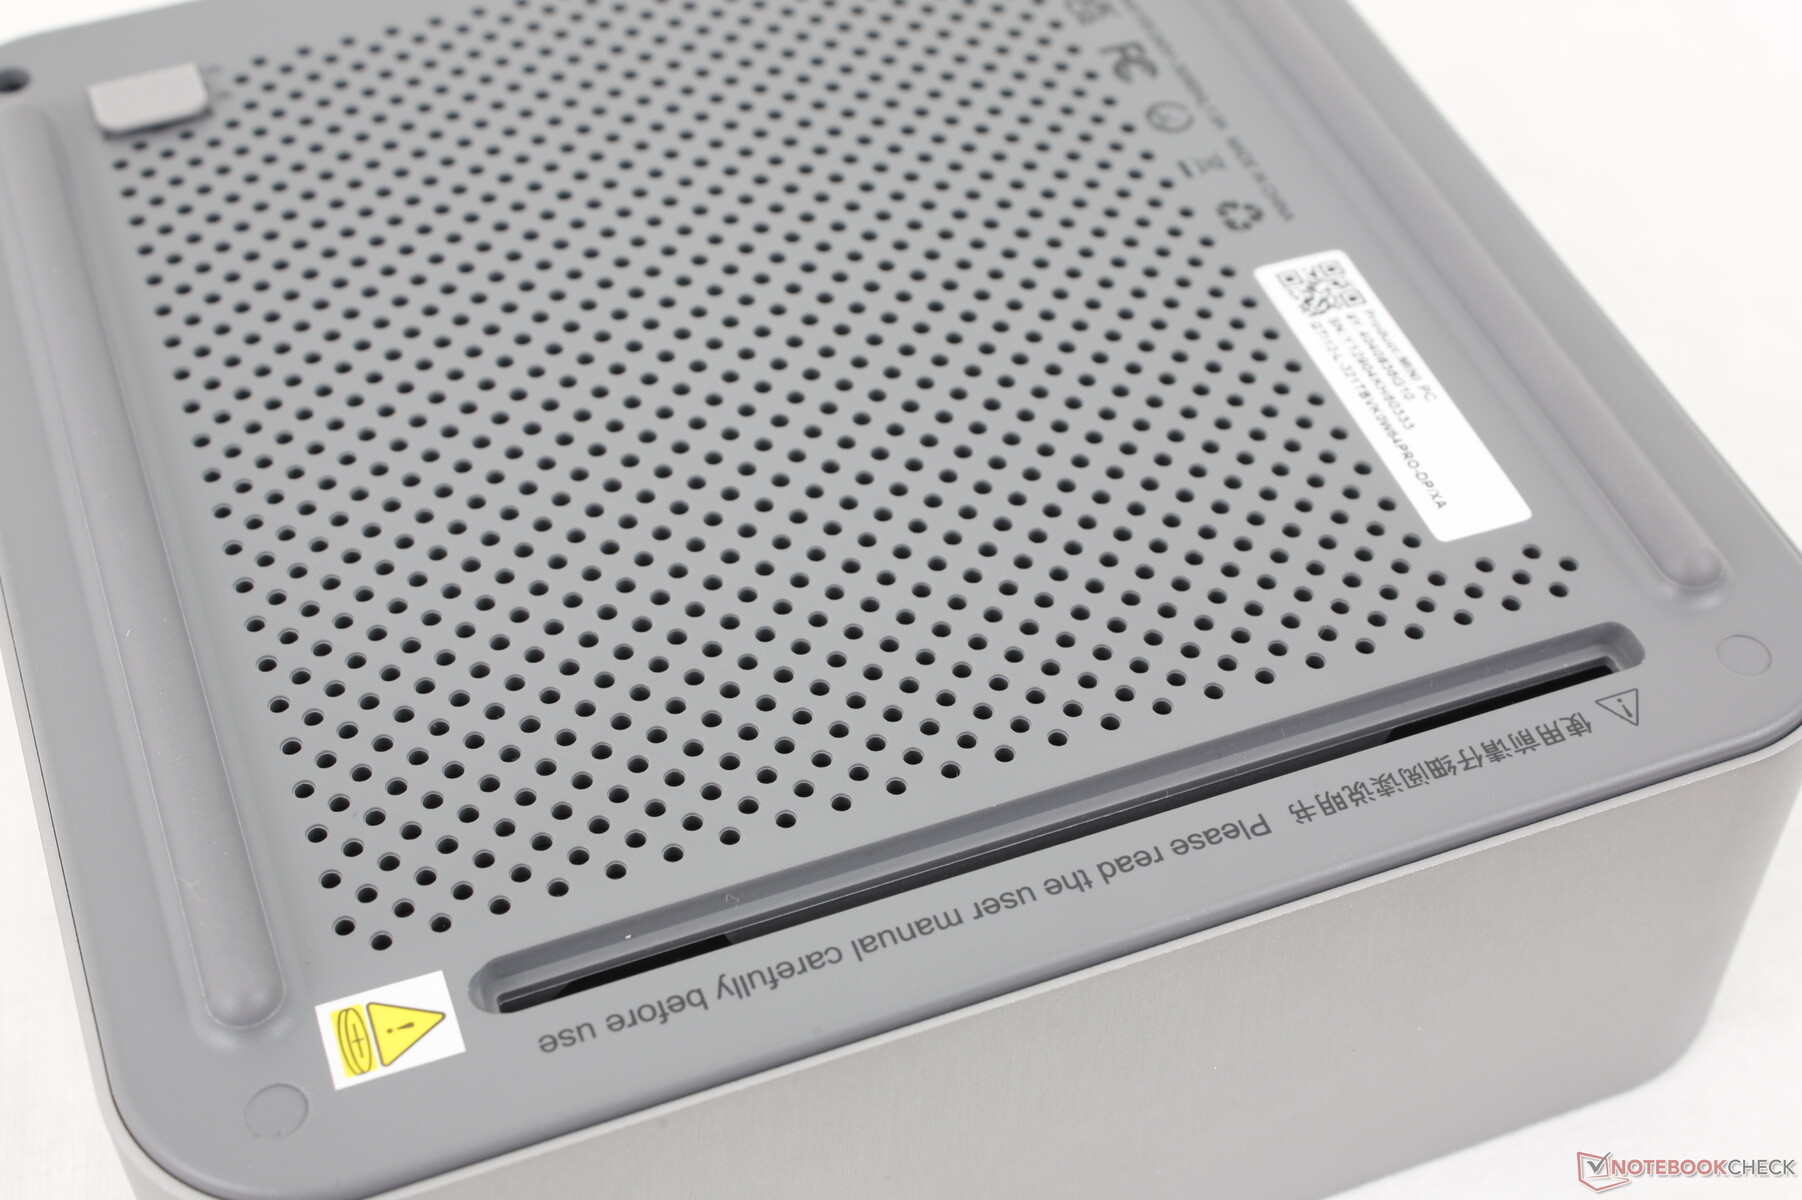
在游戏时,这款迷你 PC 的上表面温度可达 34 摄氏度左右,而当 CPU 的利用率达到 100% 时,温度则会超过 41 摄氏度,比许多其他迷你 PC 都要高。这主要是因为该设备将整个 PSU 集成在机箱内,两侧没有通风栅。
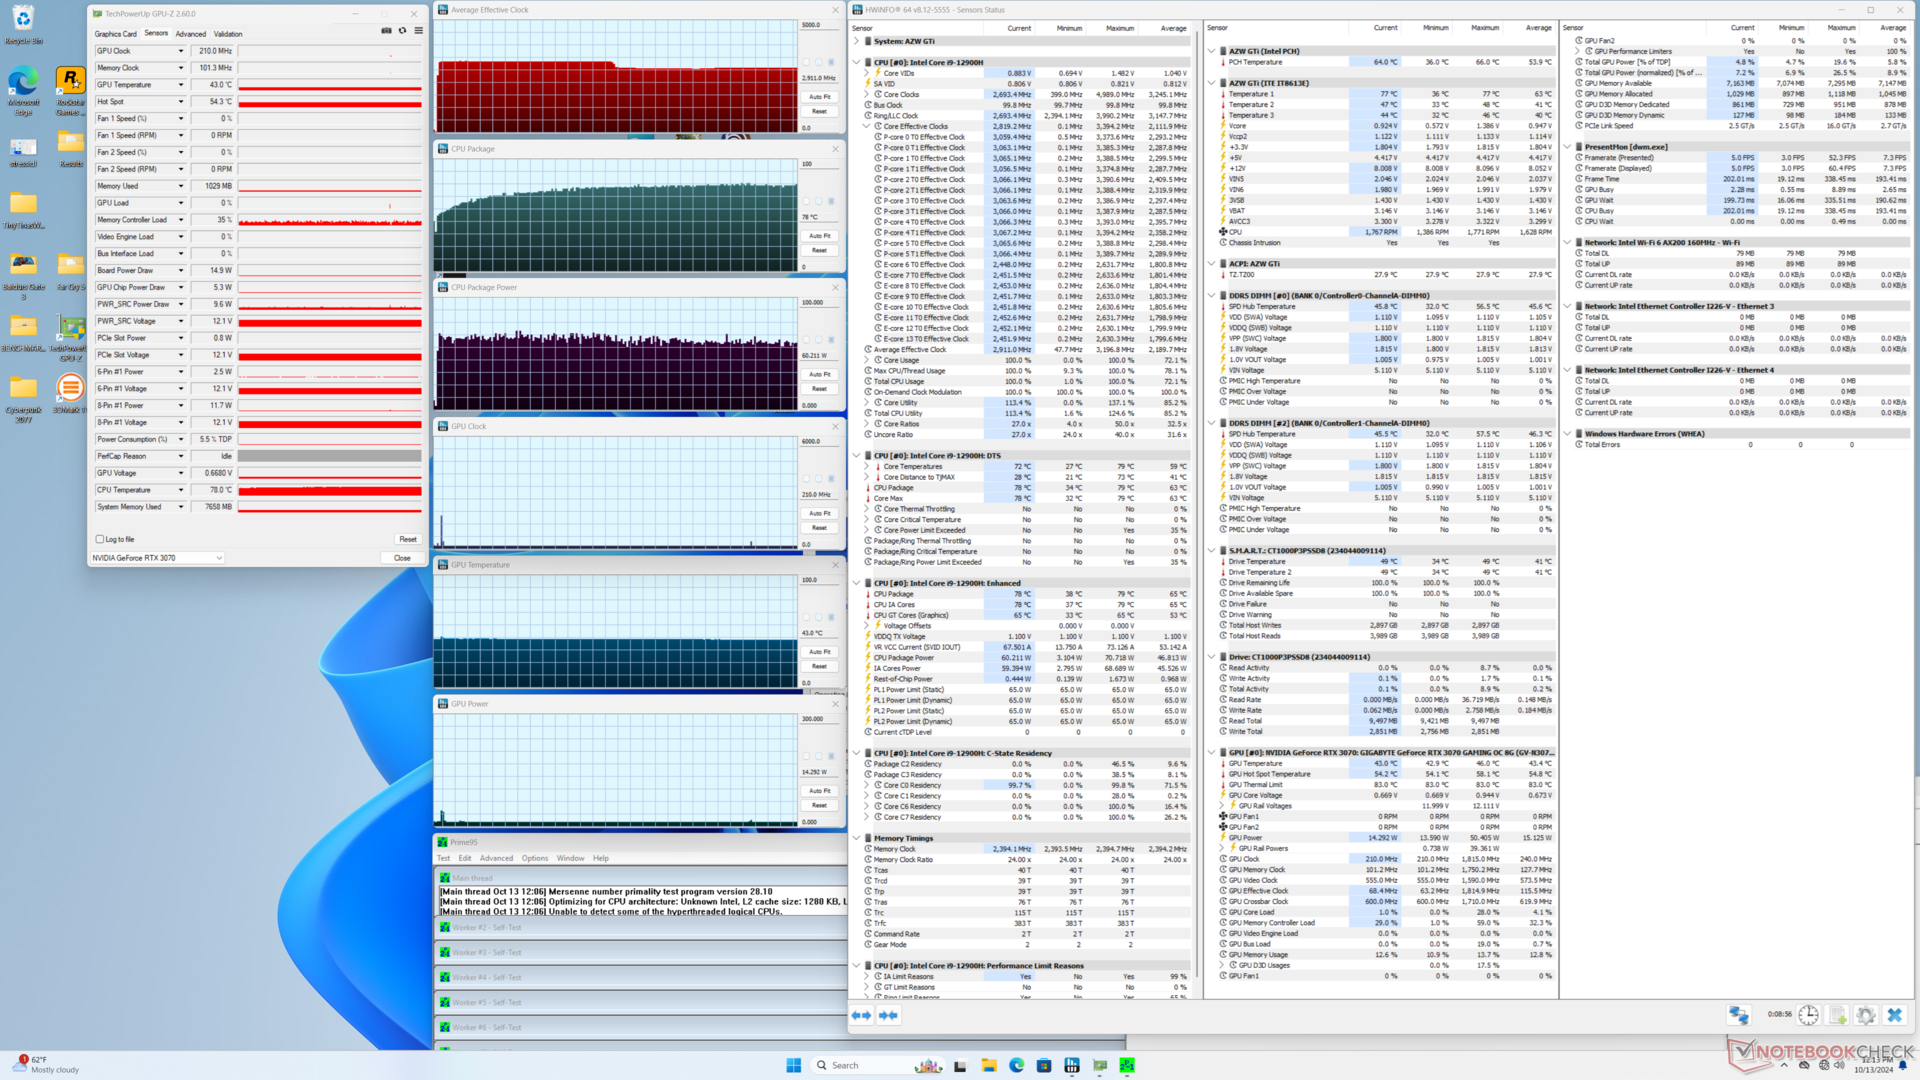
压力测试
在启动 Prime95 压力测试时,CPU 会提升到 3.2 GHz 和 69 W。然而,大约一到两分钟后,CPU 会降至 2.9 GHz 和 61 W,以维持 78 C 的合理核心温度。尽管机箱尺寸较大,但遗憾的是,最大 Turbo Boost 并不是无限的,但至少性能下降相对较小。
游戏时,核心温度将稳定在 83 摄氏度,这对于迷你 PC 来说比预期的要高。
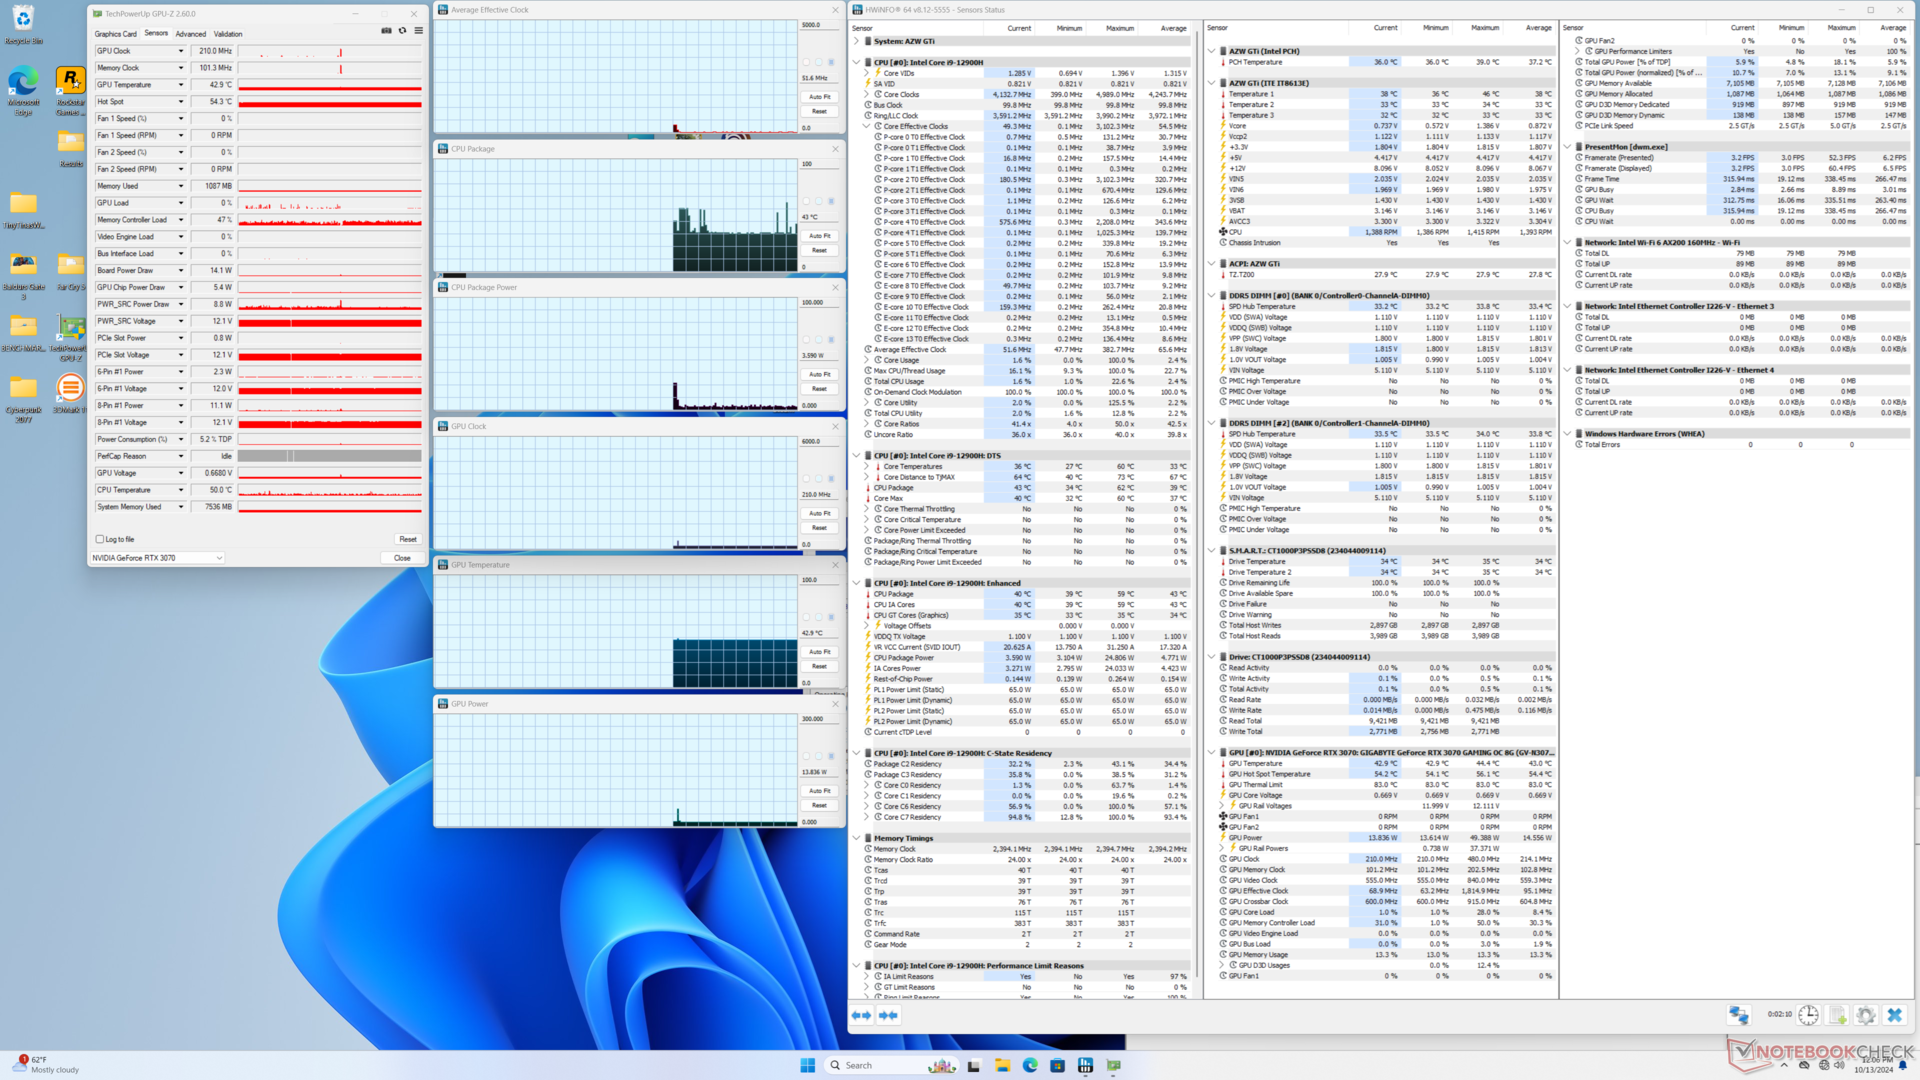
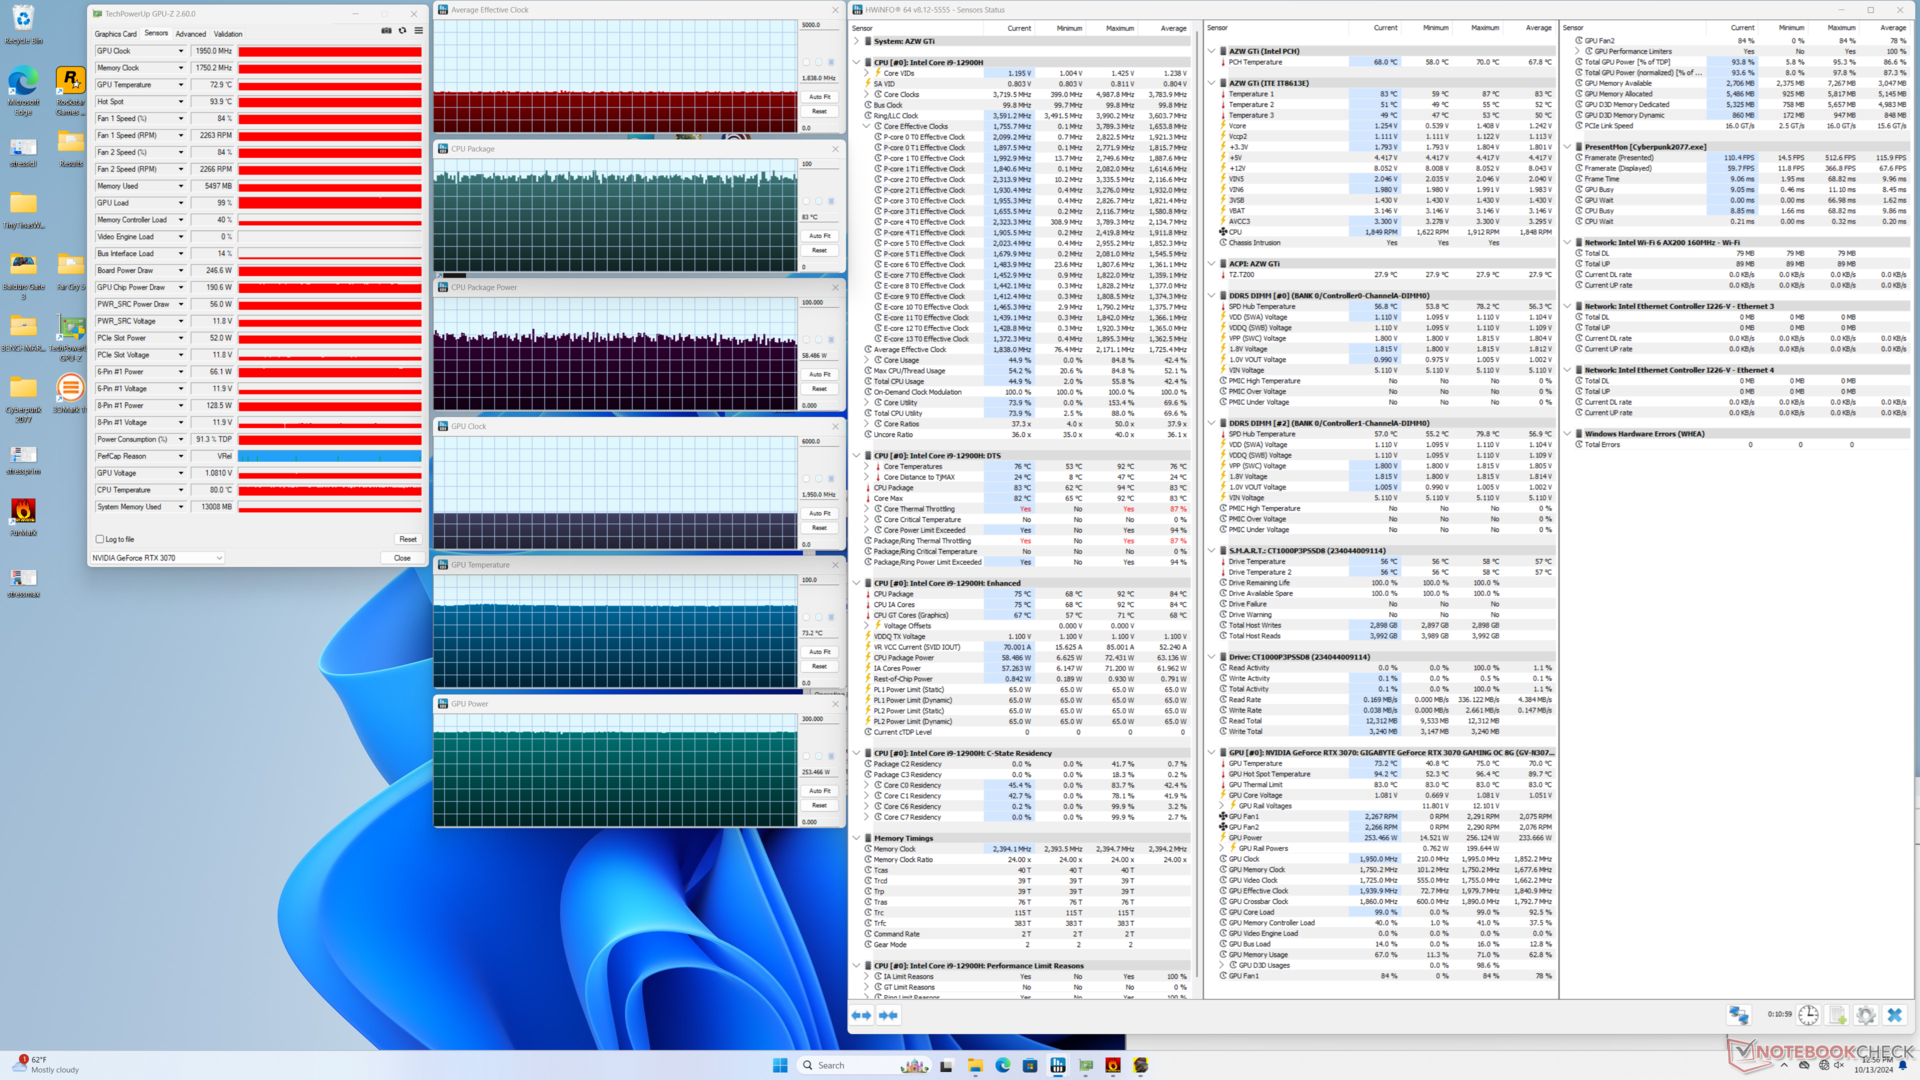
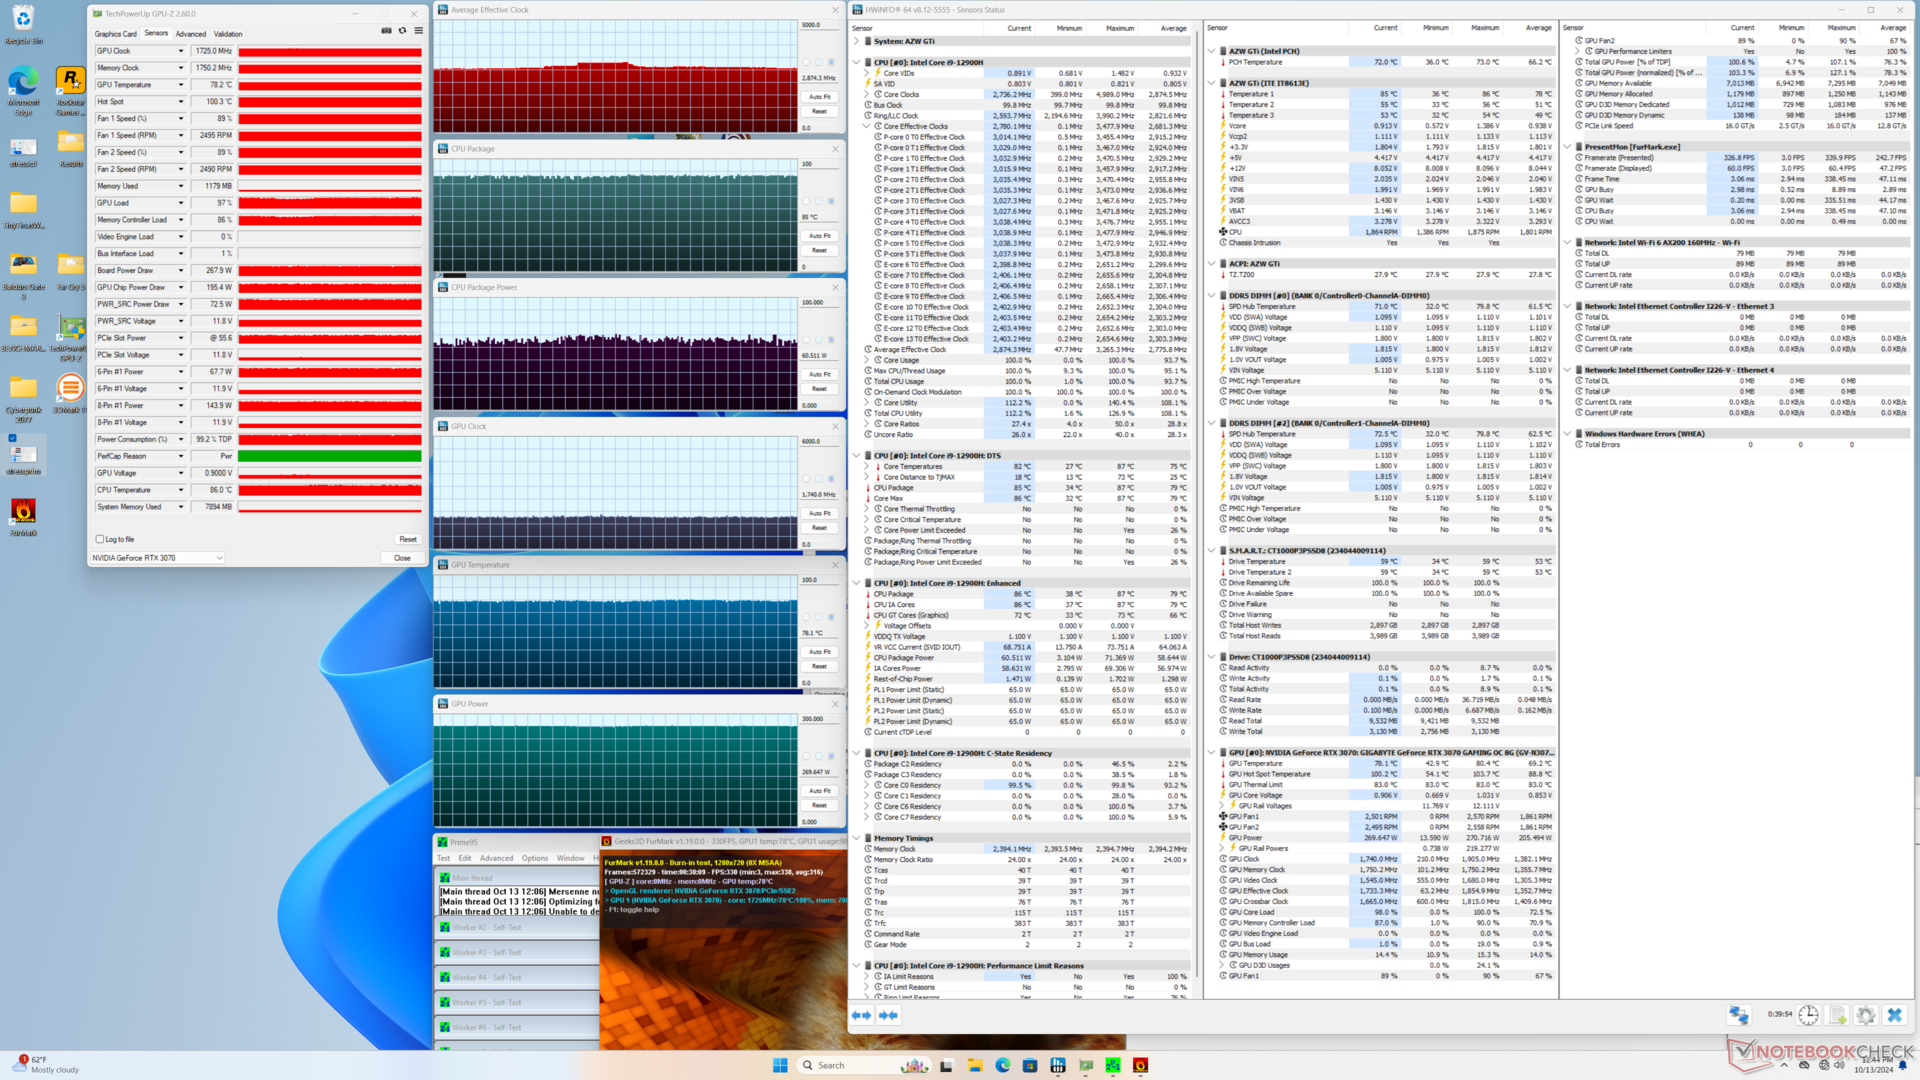
| 平均 CPU 时钟 (GHz) | GPU 时钟 (MHz) | 平均 CPU 温度 (°C) | 平均 GPU 温度 (°C) | |
| 系统闲置 | -- | -- | 40 | 43 |
| Prime95 压力 | 2.9 | -- | 78 | 43 |
| Prime95 + FurMark 压力 | 2.9 | 1725 | 85 | 78 |
| 赛博朋克 2077》压力 | 1.8 | 1950 | 83 | 73 |
发言人
内部扬声器的音量并不大,也不令人印象深刻,这与我们在最近的 Bosame 最近的 Bosgame.它们更适合用于会议或小房间等音频质量要求不高的辅助功能。在进行任何多媒体播放时,还是建议使用合适的外置扬声器。
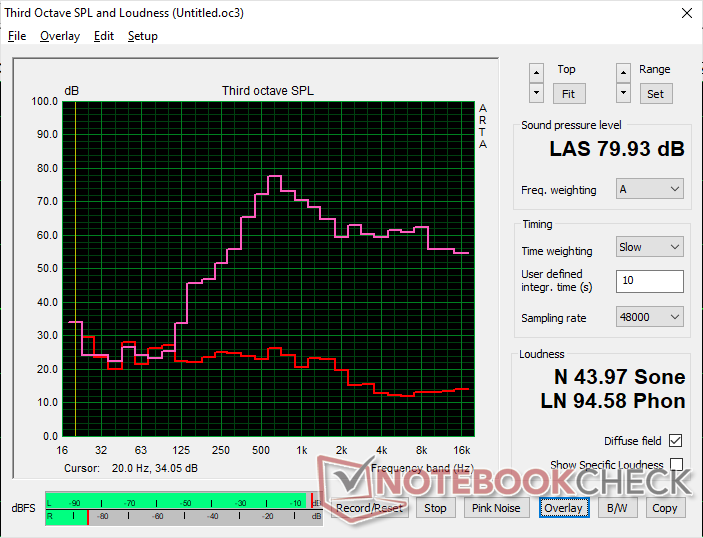
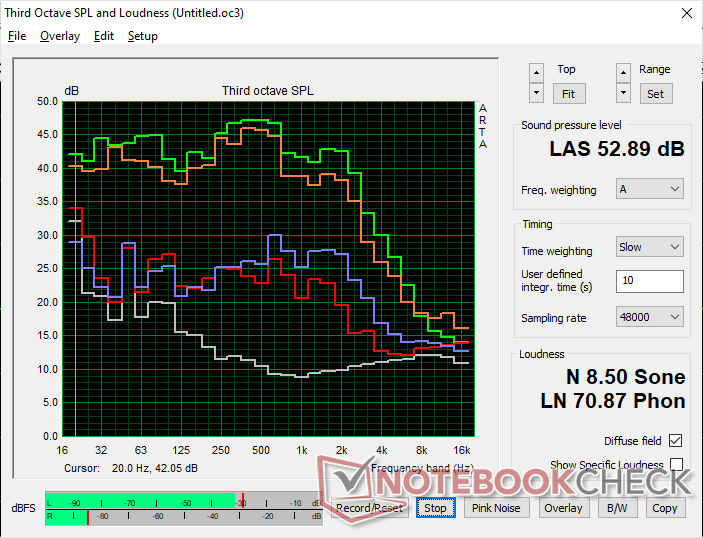
Beelink GTI12 Ultra EX Docking Station audio analysis
(±) | speaker loudness is average but good (79.9 dB)
Bass 100 - 315 Hz
(-) | nearly no bass - on average 17.1% lower than median
(±) | linearity of bass is average (14.3% delta to prev. frequency)
Mids 400 - 2000 Hz
(±) | higher mids - on average 8.9% higher than median
(±) | linearity of mids is average (13% delta to prev. frequency)
Highs 2 - 16 kHz
(+) | balanced highs - only 1.7% away from median
(+) | highs are linear (6.7% delta to prev. frequency)
Overall 100 - 16.000 Hz
(±) | linearity of overall sound is average (24.2% difference to median)
Compared to same class
» 58% of all tested devices in this class were better, 11% similar, 32% worse
» The best had a delta of 13%, average was 25%, worst was 64%
Compared to all devices tested
» 71% of all tested devices were better, 6% similar, 23% worse
» The best had a delta of 4%, average was 24%, worst was 134%
Apple MacBook Pro 16 2021 M1 Pro audio analysis
(+) | speakers can play relatively loud (84.7 dB)
Bass 100 - 315 Hz
(+) | good bass - only 3.8% away from median
(+) | bass is linear (5.2% delta to prev. frequency)
Mids 400 - 2000 Hz
(+) | balanced mids - only 1.3% away from median
(+) | mids are linear (2.1% delta to prev. frequency)
Highs 2 - 16 kHz
(+) | balanced highs - only 1.9% away from median
(+) | highs are linear (2.7% delta to prev. frequency)
Overall 100 - 16.000 Hz
(+) | overall sound is linear (4.6% difference to median)
Compared to same class
» 0% of all tested devices in this class were better, 0% similar, 100% worse
» The best had a delta of 5%, average was 18%, worst was 45%
Compared to all devices tested
» 0% of all tested devices were better, 0% similar, 100% worse
» The best had a delta of 4%, average was 24%, worst was 134%
能源管理
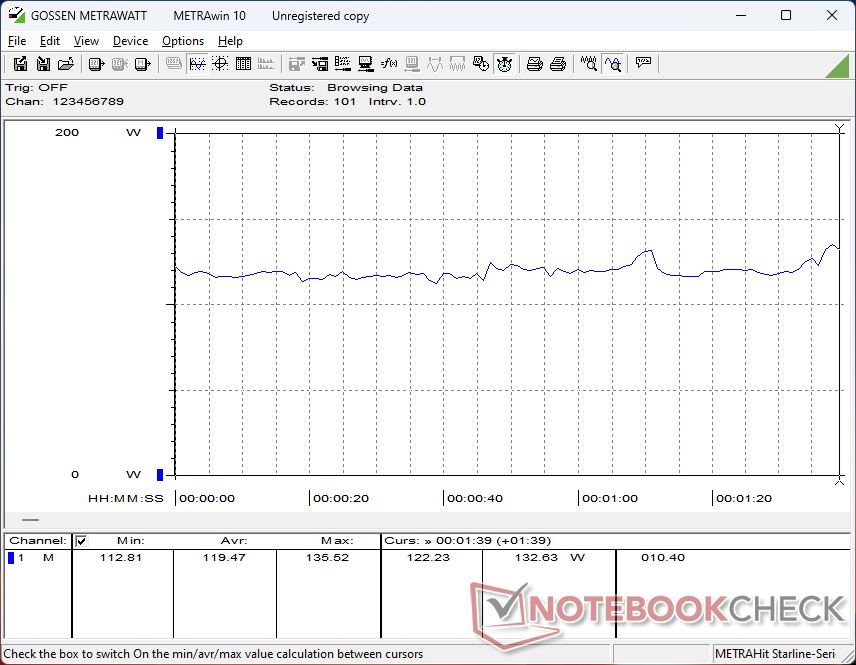
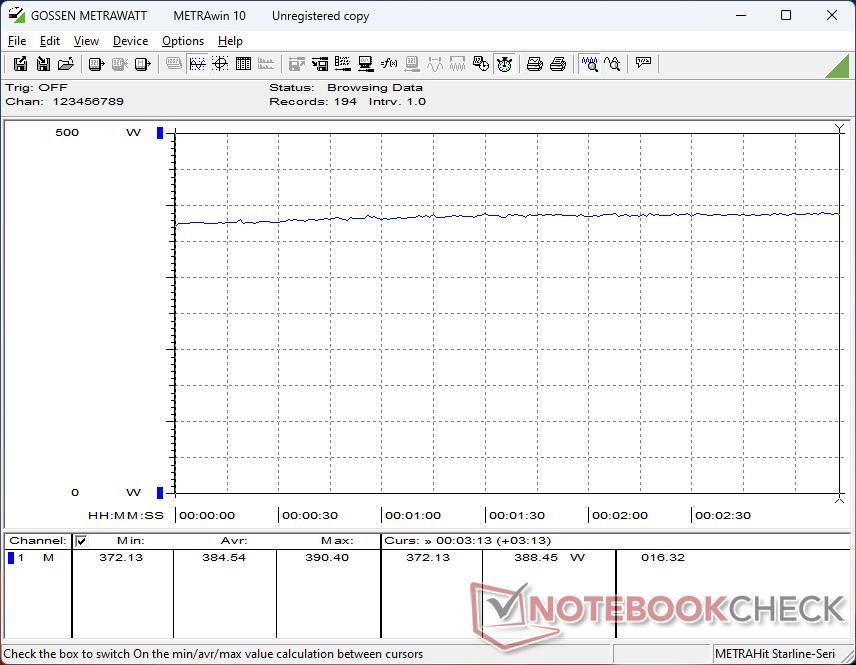
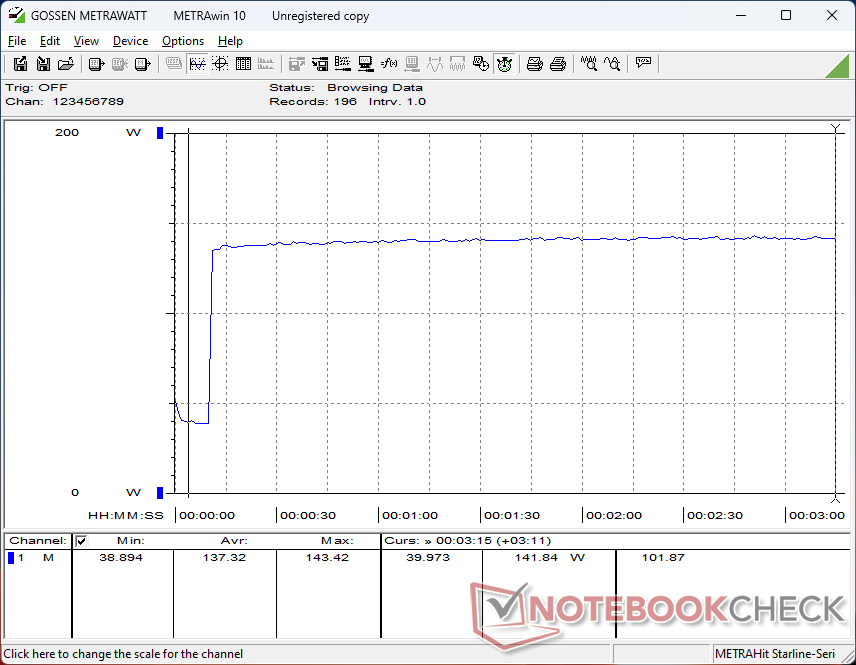
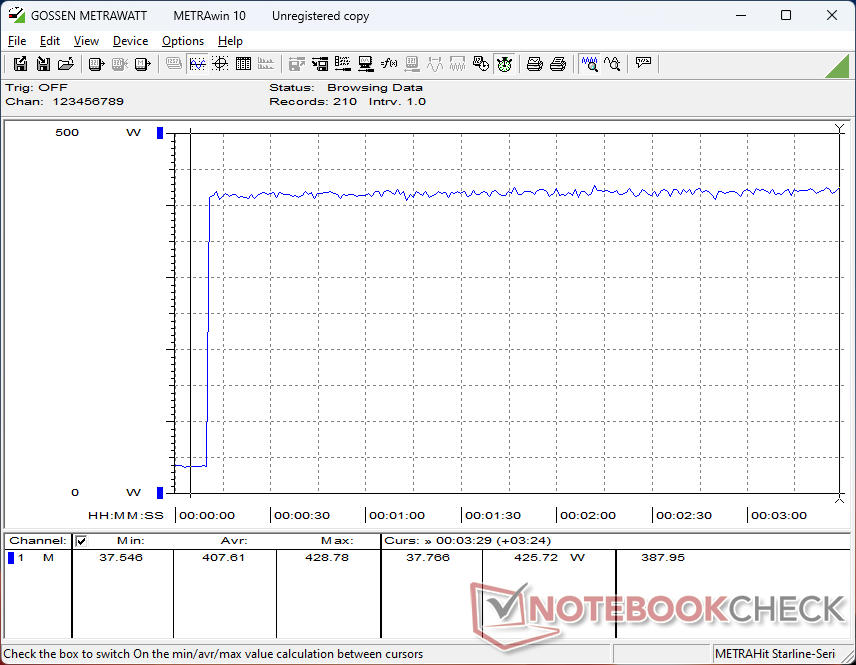
耗电量
GTI12 Ultra 和 EX 扩展坞的要求预计要比其他迷你 PC 高得多,包括 华硕 ROG NUC 14及其自己的 RTX 4070 扩展坞解决方案。台式机闲置时的耗电量已经是大多数笔记本电脑的两倍多,而游戏时的耗电量则超过 380 瓦,相比之下,微星 Titan 18 HX 的耗电量仅为 336 瓦。 微星泰坦 18 HX 而微星 Titan 18 HX 是目前速度最快的游戏笔记本电脑之一。
如上所述,GTI12 Ultra 和 EX 底座都没有外接电源模块,这与大多数其他迷你 PC 和笔记本电脑不同。
| Off / Standby | |
| Idle | |
| Load |
|
Key:
min: | |
| Beelink GTI12 Ultra EX Docking Station i9-12900H, NVIDIA GeForce RTX 3070, Crucial P3 Plus CT1000P3PSSD8, , x, | Minisforum MS-A1 Ryzen 7 8700G, Radeon 780M, Kingston OM8PGP41024Q-A0, , x, | GMK NucBox K9 Ultra 5 125H, Arc 7-Core, MasonSemi 1TB MC7000, , x, | Asus NUC 14 Pro Ultra 5 125H, Arc 7-Core, Kingston KC3000 2048G SKC3000D2048G, , x, | Geekom AX8 Pro R9 8945HS, Radeon 780M, Acer N7000 2 TB, , x, | Asus ROG NUC 14-90AS0051 Ultra 9 185H, NVIDIA GeForce RTX 4070 Laptop GPU, Samsung PM9A1a MZVL21T0HDLU, , x, | |
|---|---|---|---|---|---|---|
| Power Consumption | 62% | 72% | 74% | 60% | 47% | |
| Idle Minimum * | 35.9 | 8.8 75% | 10.9 70% | 5.1 86% | 14 61% | 10.6 70% |
| Idle Average * | 35.9 | 12.6 65% | 11 69% | 6.4 82% | 15.9 56% | 14.8 59% |
| Idle Maximum * | 36 | 14 61% | 11.4 68% | 14.7 59% | 19.5 46% | 27.5 24% |
| Load Average * | 119.5 | 93.2 22% | 52.8 56% | 55.5 54% | 76.4 36% | 84.6 29% |
| Cyberpunk 2077 ultra external monitor * | 384 | 102.1 73% | 57.1 85% | 59.1 85% | 54.3 86% | 171.4 55% |
| Load Maximum * | 422.9 | 105.4 75% | 72.2 83% | 103.3 76% | 99.1 77% | 244 42% |
* ... smaller is better
Power Consumption Cyberpunk / Stress Test
Power Consumption external Monitor
Pros
Cons
评价:性价比极高的制造质量
与普通的 Beelink GTI 或 SER 系列相比,GTI12 Ultra 不负其 "Ultra "之名,采用了更大的机箱设计和更多的功能。机箱的设计和质量也是一流的,就像 SER8.
需要维修时,主要缺点就显而易见了。要打开 M.2 固态硬盘和内存插槽,必须先拆下扬声器和 PSU,因此比其他大多数迷你 PC 更不方便。尽管它比同类产品明显更大更重,但运行时的温度也比我们希望的要高。集成的 SD 读卡器速度非常慢,这对内容创作者来说也是一记响亮的耳光,尤其是该机型被当作更高端的迷你 PC 来销售。
至于 EX 扩展坞,即使你决定不使用扩展坞的任何无线局域网功能,它也是一个坚固的设计,尽管它的电源线和天线附件裸露在外,显得很不雅观。EX 的 "露天 "设计与盒装 eGPU 解决方案(如 Aorus 游戏盒相比,EX 的 "开放式 "设计会吸附更多的灰尘和毛发。EX 也不适合展示显卡,因为 GPU 必须朝向迷你 PC 安装,而不是远离它。
GTI12 Ultra 和 EX 扩展坞的价格出乎意料的实惠,考虑到其制造质量和竞争优势。
去掉 EX 很少使用的 Wi-Fi 功能或换上更多的端口,有可能进一步缩小基座的尺寸和降低价格。
价格和供应情况
Beelink 目前正在出货GTI12 Ultra 与 1 TB 固态硬盘、32 GB 内存和 EX 扩展坞捆绑销售,仅售 738 美元。较新的流星湖处理器可供选择,起价高出 200 美元。
Beelink GTI12 Ultra EX Docking Station
- 10/21/2024 v8
Allen Ngo
 Total Sustainability Score:
 Transparency
The selection of devices to be reviewed is made by our editorial team. The test sample was provided to the author as a loan by the manufacturer or retailer for the purpose of this review. The lender had no influence on this review, nor did the manufacturer receive a copy of this review before publication. There was no obligation to publish this review. We never accept compensation or payment in return for our reviews. As an independent media company, Notebookcheck is not subjected to the authority of manufacturers, retailers or publishers.
This is how Notebookcheck is testing
Every year, Notebookcheck independently reviews hundreds of laptops and smartphones using standardized procedures to ensure that all results are comparable. We have continuously developed our test methods for around 20 years and set industry standards in the process. In our test labs, high-quality measuring equipment is utilized by experienced technicians and editors. These tests involve a multi-stage validation process. Our complex rating system is based on hundreds of well-founded measurements and benchmarks, which maintains objectivity. Further information on our test methods can be found here.
Price comparison

