|
|
Lenovo ThinkStation P3 Tiny-30H0006AGE
Intel Core i9-14900, NVIDIA T1000 | |
GMK NucBox K6
AMD Ryzen 7 7840HS, AMD Radeon 780M | |
Beelink SER8
AMD Ryzen 7 8845HS, AMD Radeon 780M | |
GMK NucBox K9
Intel Core Ultra 5 125H, Intel Arc 7-Core iGPU | |
GMK NucBox M6
AMD Ryzen 5 6600H, AMD Radeon 660M | |
GMK NucBox M5
AMD Ryzen 7 5700U, AMD Radeon RX Vega 8 (Ryzen 4000/5000) | |
Average Intel Iris Xe Graphics G7 96EUs
(25.9 - 67.3, n=32) | |
Lenovo IdeaPad Slim 3i 15IRU9
Intel Core 5 120U, Intel Iris Xe Graphics G7 80EUs | |
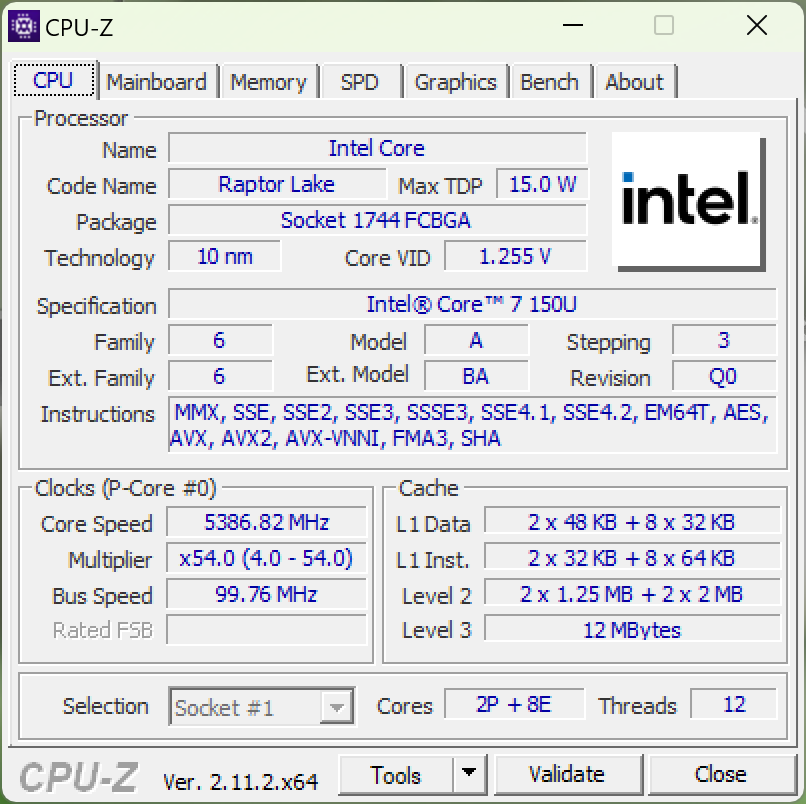
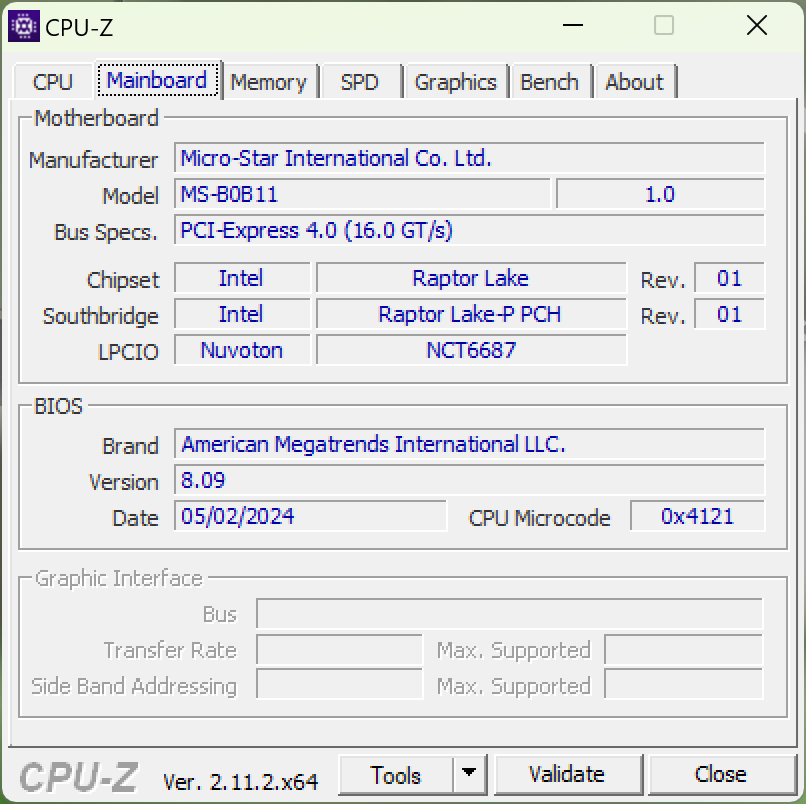
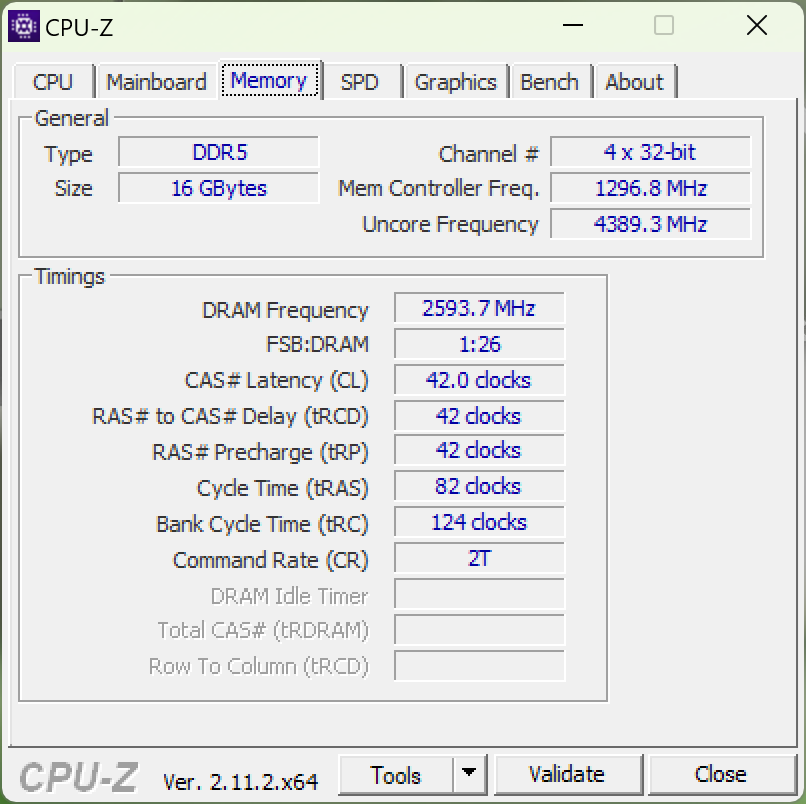
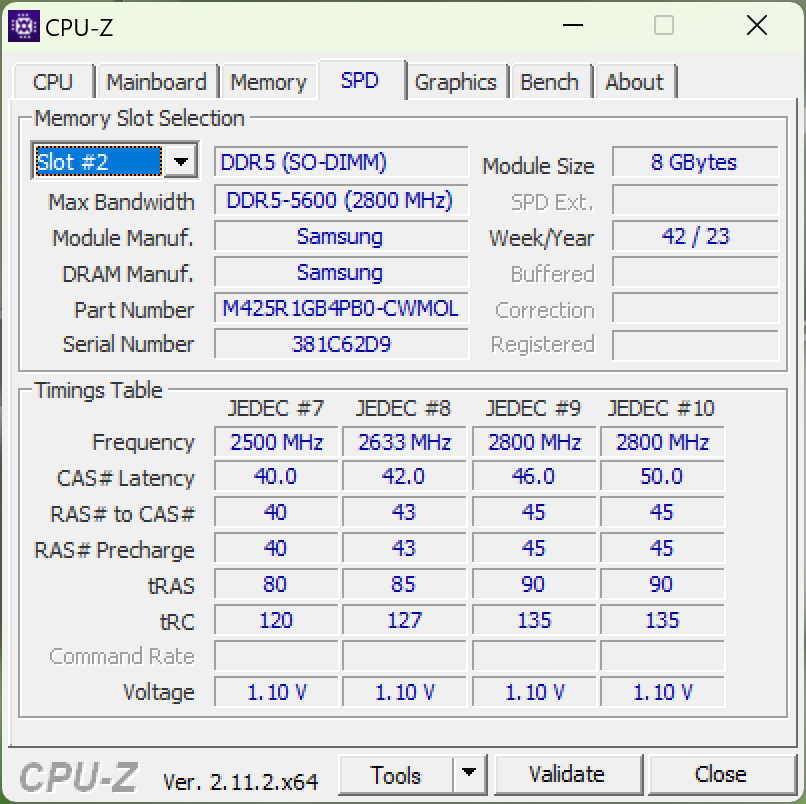
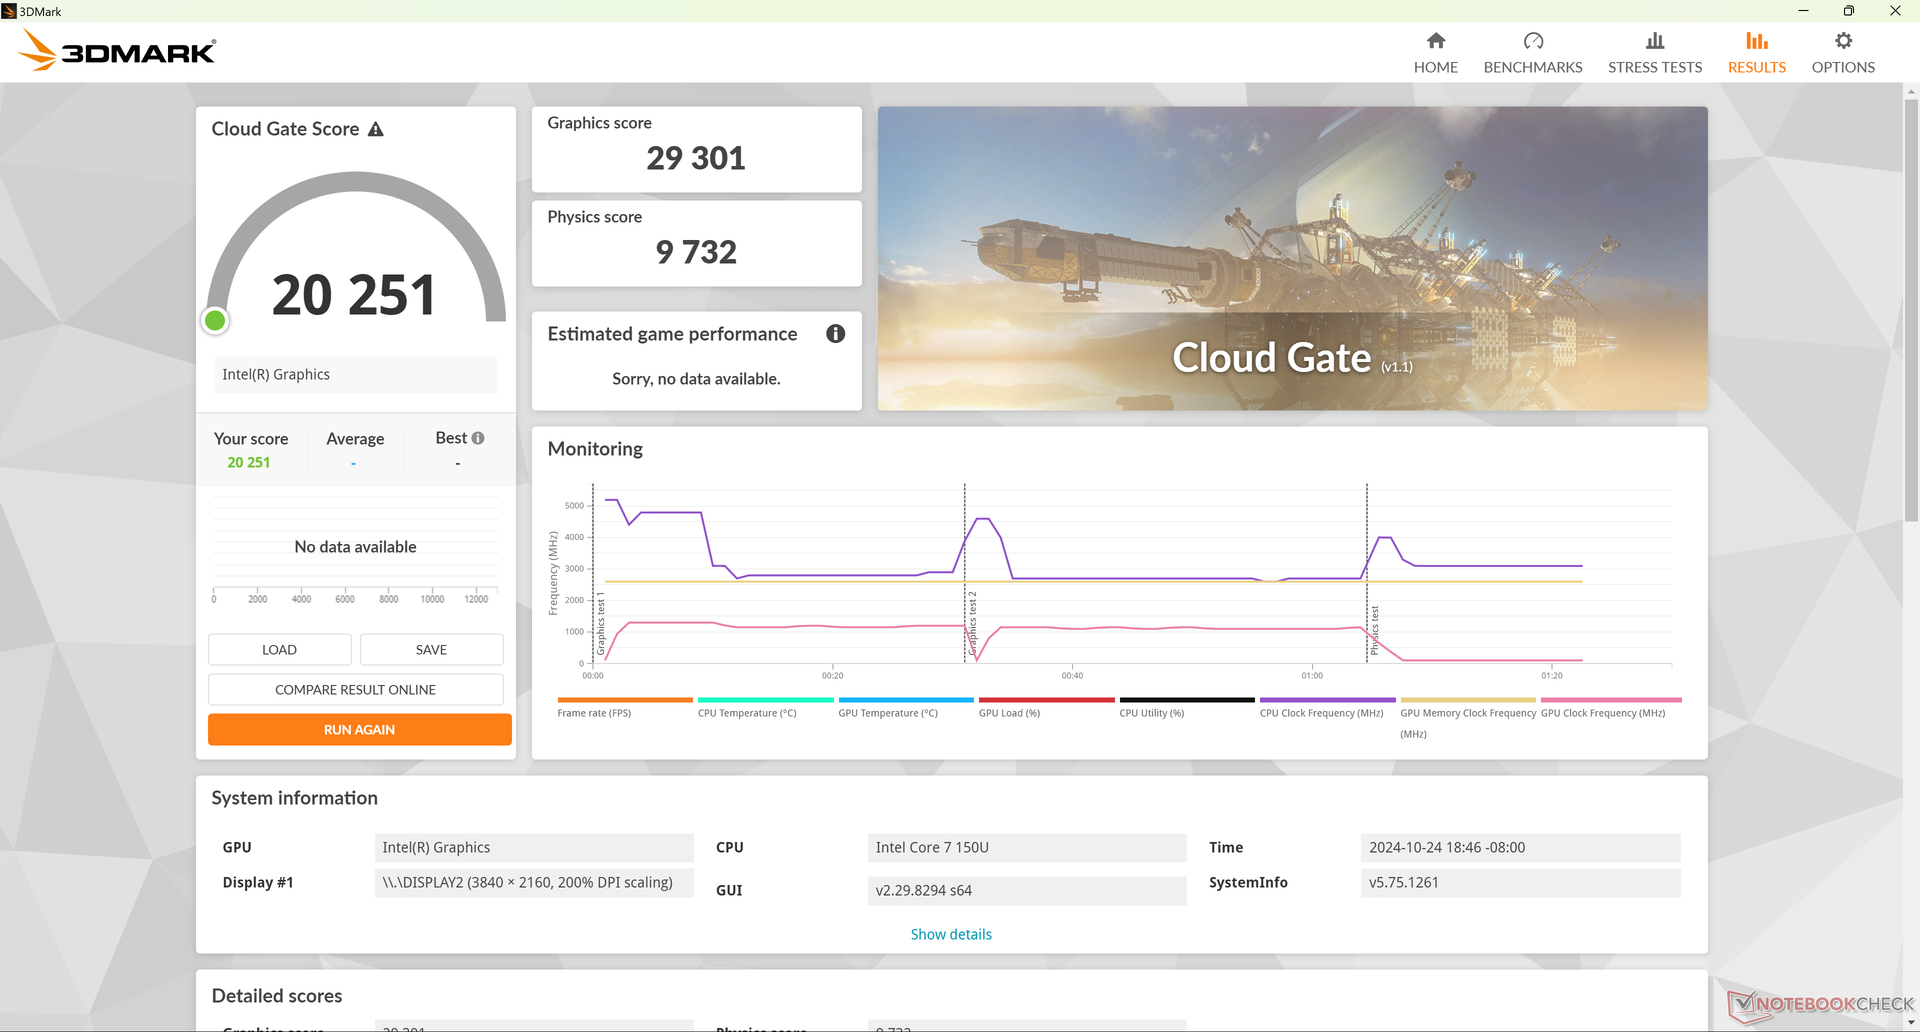
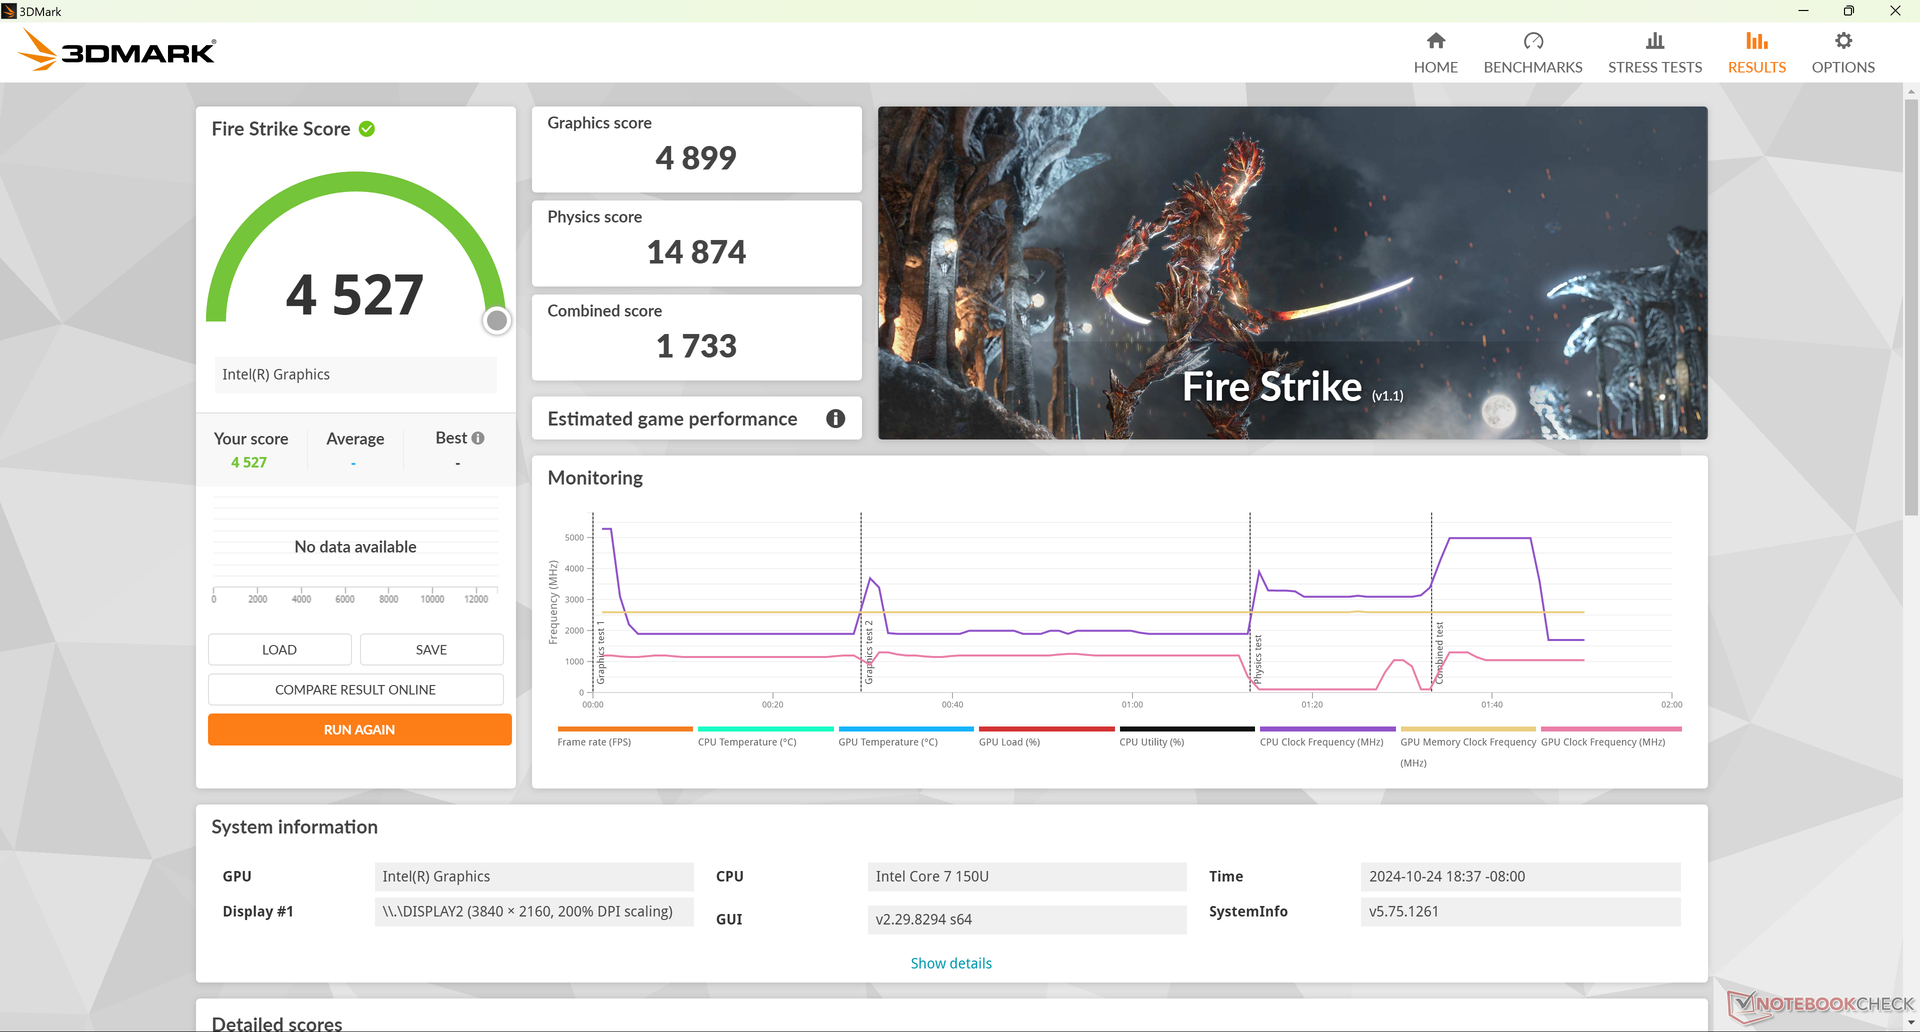
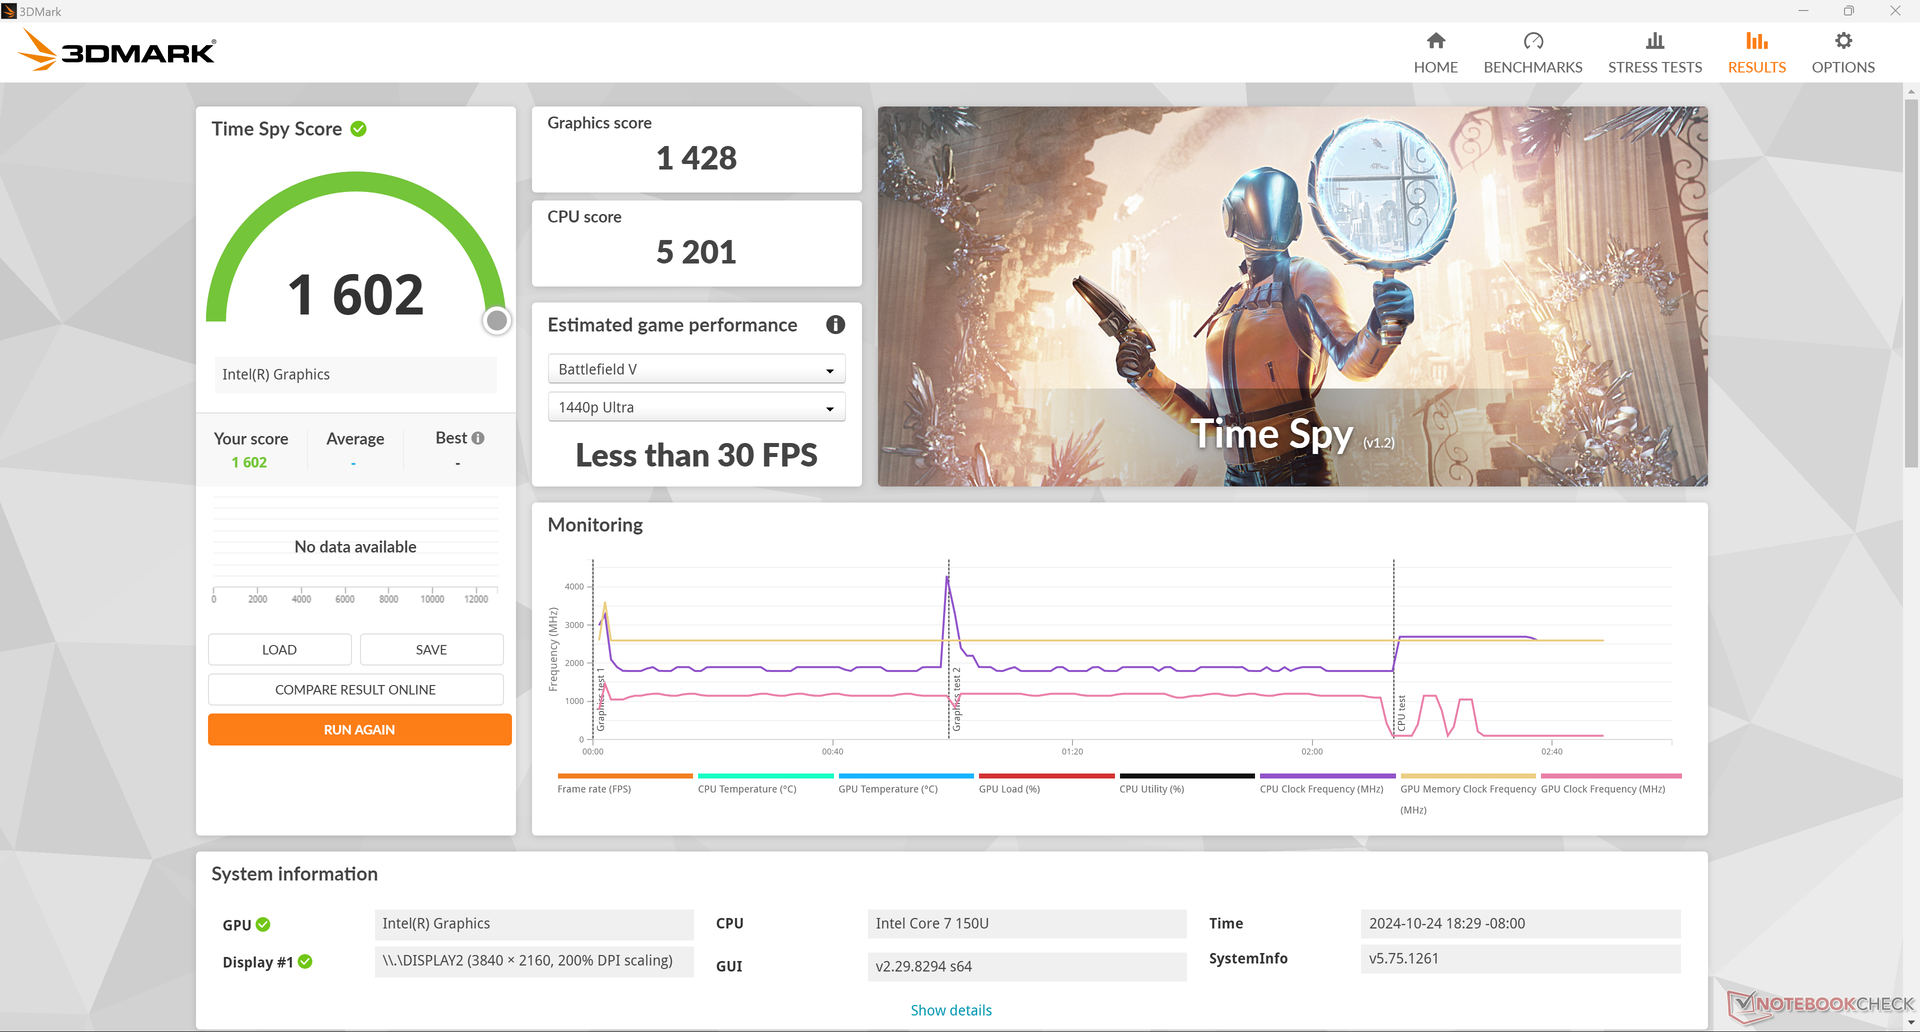
MSI Cubi NUC 1M
Intel Core 7 150U, Intel Iris Xe Graphics G7 96EUs | |
|
GMK NucBox K6
AMD Ryzen 7 7840HS, AMD Radeon 780M | |
Beelink SER8
AMD Ryzen 7 8845HS, AMD Radeon 780M | |
Lenovo ThinkStation P3 Tiny-30H0006AGE
Intel Core i9-14900, NVIDIA T1000 | |
Beelink SER6 Pro Ryzen 7 7735HS
AMD Ryzen 7 7735HS, AMD Radeon 680M | |
GMK NucBox K9
Intel Core Ultra 5 125H, Intel Arc 7-Core iGPU | |
GMK NucBox M6
AMD Ryzen 5 6600H, AMD Radeon 660M | |
Average Intel Iris Xe Graphics G7 96EUs
(22.3 - 53, n=32) | |
MSI Cubi NUC 1M
Intel Core 7 150U, Intel Iris Xe Graphics G7 96EUs | |
GMK NucBox M5
AMD Ryzen 7 5700U, AMD Radeon RX Vega 8 (Ryzen 4000/5000) | |
Lenovo IdeaPad Slim 3i 15IRU9
Intel Core 5 120U, Intel Iris Xe Graphics G7 80EUs | |
|
Lenovo ThinkStation P3 Tiny-30H0006AGE
Intel Core i9-14900, NVIDIA T1000 | |
Beelink SER8
AMD Ryzen 7 8845HS, AMD Radeon 780M | |
GMK NucBox K6
AMD Ryzen 7 7840HS, AMD Radeon 780M | |
Beelink SER6 Pro Ryzen 7 7735HS
AMD Ryzen 7 7735HS, AMD Radeon 680M | |
GMK NucBox K9
Intel Core Ultra 5 125H, Intel Arc 7-Core iGPU | |
GMK NucBox M6
AMD Ryzen 5 6600H, AMD Radeon 660M | |
Average Intel Iris Xe Graphics G7 96EUs
(17 - 40.1, n=30) | |
GMK NucBox M5
AMD Ryzen 7 5700U, AMD Radeon RX Vega 8 (Ryzen 4000/5000) | |
MSI Cubi NUC 1M
Intel Core 7 150U, Intel Iris Xe Graphics G7 96EUs | |
Lenovo IdeaPad Slim 3i 15IRU9
Intel Core 5 120U, Intel Iris Xe Graphics G7 80EUs | |
|
Beelink SER8
AMD Ryzen 7 8845HS, AMD Radeon 780M | |
GMK NucBox K6
AMD Ryzen 7 7840HS, AMD Radeon 780M | |
Lenovo ThinkStation P3 Tiny-30H0006AGE
Intel Core i9-14900, NVIDIA T1000 | |
Beelink SER6 Pro Ryzen 7 7735HS
AMD Ryzen 7 7735HS, AMD Radeon 680M | |
GMK NucBox K9
Intel Core Ultra 5 125H, Intel Arc 7-Core iGPU | |
GMK NucBox M6
AMD Ryzen 5 6600H, AMD Radeon 660M | |
Average Intel Iris Xe Graphics G7 96EUs
(10.6 - 24.1, n=29) | |
MSI Cubi NUC 1M
Intel Core 7 150U, Intel Iris Xe Graphics G7 96EUs | |
GMK NucBox M5
AMD Ryzen 7 5700U, AMD Radeon RX Vega 8 (Ryzen 4000/5000) | |
Lenovo IdeaPad Slim 3i 15IRU9
Intel Core 5 120U, Intel Iris Xe Graphics G7 80EUs | |
|
Beelink SER8
AMD Ryzen 7 8845HS, AMD Radeon 780M | |
GMK NucBox K6
AMD Ryzen 7 7840HS, AMD Radeon 780M | |
Lenovo ThinkStation P3 Tiny-30H0006AGE
Intel Core i9-14900, NVIDIA T1000 | |
Beelink SER6 Pro Ryzen 7 7735HS
AMD Ryzen 7 7735HS, AMD Radeon 680M | |
GMK NucBox K9
Intel Core Ultra 5 125H, Intel Arc 7-Core iGPU | |
GMK NucBox M6
AMD Ryzen 5 6600H, AMD Radeon 660M | |
Average Intel Iris Xe Graphics G7 96EUs
(8.4 - 18.4, n=26) | |
MSI Cubi NUC 1M
Intel Core 7 150U, Intel Iris Xe Graphics G7 96EUs | |
GMK NucBox M5
AMD Ryzen 7 5700U, AMD Radeon RX Vega 8 (Ryzen 4000/5000) | |
Lenovo IdeaPad Slim 3i 15IRU9
Intel Core 5 120U, Intel Iris Xe Graphics G7 80EUs | |
|
|
Lenovo ThinkStation P3 Tiny-30H0006AGE
Intel Core i9-14900, NVIDIA T1000 |
187.4 (1.697min, 200P1) fps +87% |
Geekom AX8 Pro
AMD Ryzen 9 8945HS, AMD Radeon 780M |
169.4 (3.69min, 125P1) fps +69% |
GMK NucBox K6
AMD Ryzen 7 7840HS, AMD Radeon 780M |
163.4 (2.4min, 100P1) fps +63% |
Asus NUC 14 Pro
Intel Core Ultra 5 125H, Intel Arc 7-Core iGPU |
156.3 (4.92min, 90.9P1) fps +56% |
Beelink SER6 Pro
AMD Ryzen 7 6800H, AMD Radeon 680M |
152.3 (4.42min, 100P1) fps +52% |
Khadas Mind 2
Intel Core Ultra 7 155H, Intel Arc 8-Core iGPU |
145.4 (4.75min, 83.3P1) fps +45% |
GMK NucBox K9
Intel Core Ultra 5 125H, Intel Arc 7-Core iGPU |
143.6 (5.11min, 83.3P1) fps +43% |
Geekom XT13 Pro
Intel Core i9-13900H, Intel Iris Xe Graphics G7 96EUs |
123.5 (30.5min, 66.7P1) fps +23% |
Lenovo IdeaPad Slim 3i 15IRU9
Intel Core 5 120U, Intel Iris Xe Graphics G7 80EUs |
103.1 (12.1min, 62.5P1) fps +3% |
HP Elite Mini 800 G9-5M9X6EA
Intel Core i5-14500, Intel UHD Graphics 770 |
102.4 (25.3min, 71.4P1) fps +2% |
MSI Cubi NUC 1M
Intel Core 7 150U, Intel Iris Xe Graphics G7 96EUs |
100.3 (39.9min, 62.5P1) fps |
Average Intel Iris Xe Graphics G7 96EUs
(52 - 166.4, n=166) | |
Beelink SEi11 Pro
Intel Core i5-11320H, Intel Iris Xe Graphics G7 96EUs |
94.2 (16.5min, 58.8P1) fps -6% |
|
Lenovo ThinkStation P3 Tiny-30H0006AGE
Intel Core i9-14900, NVIDIA T1000 |
187.3 (4.93min, 166.7P1) fps +138% |
Asus NUC 14 Pro
Intel Core Ultra 5 125H, Intel Arc 7-Core iGPU |
129.8 (58.5min, 90.9P1) fps +65% |
Geekom AX8 Pro
AMD Ryzen 9 8945HS, AMD Radeon 780M |
129.3 (19.9min, 90.9P1) fps +65% |
GMK NucBox K6
AMD Ryzen 7 7840HS, AMD Radeon 780M |
124.7 (11.8min, 83.3P1) fps +59% |
Khadas Mind 2
Intel Core Ultra 7 155H, Intel Arc 8-Core iGPU |
121.4 (39.2min, 83.3P1) fps +54% |
GMK NucBox K9
Intel Core Ultra 5 125H, Intel Arc 7-Core iGPU |
118.7 (7.47min, 83.3P1) fps +51% |
Beelink SER6 Pro
AMD Ryzen 7 6800H, AMD Radeon 680M |
111.4 (35min, 71.4P1) fps +42% |
Geekom XT13 Pro
Intel Core i9-13900H, Intel Iris Xe Graphics G7 96EUs |
91.3 (21.4min, 52.6P1) fps +16% |
MSI Cubi NUC 1M
Intel Core 7 150U, Intel Iris Xe Graphics G7 96EUs | |
Lenovo IdeaPad Slim 3i 15IRU9
Intel Core 5 120U, Intel Iris Xe Graphics G7 80EUs |
77.2 (14.6min, 50P1) fps -2% |
Average Intel Iris Xe Graphics G7 96EUs
(34.7 - 132.1, n=139) | |
Beelink SEi11 Pro
Intel Core i5-11320H, Intel Iris Xe Graphics G7 96EUs |
65.9 (13.2min, 45.5P1) fps -16% |
HP Elite Mini 800 G9-5M9X6EA
Intel Core i5-14500, Intel UHD Graphics 770 |
53.9 (29.4min, 40P1) fps -31% |
|
Lenovo ThinkStation P3 Tiny-30H0006AGE
Intel Core i9-14900, NVIDIA T1000 |
187.1 (1.566min, 200P1) fps +117% |
Geekom AX8 Pro
AMD Ryzen 9 8945HS, AMD Radeon 780M |
158.3 (4.14min, 111.1P1) fps +84% |
GMK NucBox K6
AMD Ryzen 7 7840HS, AMD Radeon 780M |
153.8 (4.97min, 90.9P1) fps +79% |
Asus NUC 14 Pro
Intel Core Ultra 5 125H, Intel Arc 7-Core iGPU |
148.8 (4.43min, 83.3P1) fps +73% |
Beelink SER6 Pro
AMD Ryzen 7 6800H, AMD Radeon 680M |
139.7 (5.95min, 90.9P1) fps +62% |
Khadas Mind 2
Intel Core Ultra 7 155H, Intel Arc 8-Core iGPU |
131.5 (4.53min, 47.6P1) fps +53% |
GMK NucBox K9
Intel Core Ultra 5 125H, Intel Arc 7-Core iGPU |
125.5 (15.3min, 76.9P1) fps +46% |
Geekom XT13 Pro
Intel Core i9-13900H, Intel Iris Xe Graphics G7 96EUs |
105.9 (23.9min, 47.6P1) fps +23% |
Lenovo IdeaPad Slim 3i 15IRU9
Intel Core 5 120U, Intel Iris Xe Graphics G7 80EUs |
91 (14.4min, 58.8P1) fps +6% |
HP Elite Mini 800 G9-5M9X6EA
Intel Core i5-14500, Intel UHD Graphics 770 |
90.8 (26.7min, 62.5P1) fps +5% |
MSI Cubi NUC 1M
Intel Core 7 150U, Intel Iris Xe Graphics G7 96EUs | |
Average Intel Iris Xe Graphics G7 96EUs
(24.1 - 152.7, n=167) | |
Beelink SEi11 Pro
Intel Core i5-11320H, Intel Iris Xe Graphics G7 96EUs |
77.6 (21.9min, 50P1) fps -10% |
|
Lenovo ThinkStation P3 Tiny-30H0006AGE
Intel Core i9-14900, NVIDIA T1000 |
185.8 (1.693min, 142.9P1) fps +162% |
Geekom AX8 Pro
AMD Ryzen 9 8945HS, AMD Radeon 780M |
132.3 (12min, 90.9P1) fps +86% |
GMK NucBox K6
AMD Ryzen 7 7840HS, AMD Radeon 780M |
128.7 (21.5min, 76.9P1) fps +81% |
Asus NUC 14 Pro
Intel Core Ultra 5 125H, Intel Arc 7-Core iGPU |
117.6 (36.7min, 83.3P1) fps +66% |
Beelink SER6 Pro
AMD Ryzen 7 6800H, AMD Radeon 680M |
110.4 (6.6min, 71.4P1) fps +55% |
Khadas Mind 2
Intel Core Ultra 7 155H, Intel Arc 8-Core iGPU |
109.8 (7.83min, 50P1) fps +55% |
GMK NucBox K9
Intel Core Ultra 5 125H, Intel Arc 7-Core iGPU |
95.2 (10.5min, 66.7P1) fps +34% |
Geekom XT13 Pro
Intel Core i9-13900H, Intel Iris Xe Graphics G7 96EUs |
78.5 (6.01min, 40P1) fps +11% |
Lenovo IdeaPad Slim 3i 15IRU9
Intel Core 5 120U, Intel Iris Xe Graphics G7 80EUs |
73.3 (17.6min, 45.5P1) fps +3% |
MSI Cubi NUC 1M
Intel Core 7 150U, Intel Iris Xe Graphics G7 96EUs | |
Average Intel Iris Xe Graphics G7 96EUs
(20 - 119.3, n=140) | |
Beelink SEi11 Pro
Intel Core i5-11320H, Intel Iris Xe Graphics G7 96EUs |
57.3 (22.2min, 38.5P1) fps -19% |
HP Elite Mini 800 G9-5M9X6EA
Intel Core i5-14500, Intel UHD Graphics 770 |
53.9 (16min, 38.5P1) fps -24% |
|
Lenovo ThinkStation P3 Tiny-30H0006AGE
Intel Core i9-14900, NVIDIA T1000 |
103.5 (6.88min, 76.9P1) fps +339% |
Geekom AX8 Pro
AMD Ryzen 9 8945HS, AMD Radeon 780M |
65.9 (2.44min, 41.7P1) fps +179% |
GMK NucBox K6
AMD Ryzen 7 7840HS, AMD Radeon 780M |
65.7 (3.85min, 40P1) fps +178% |
Beelink SER6 Pro
AMD Ryzen 7 6800H, AMD Radeon 680M |
51.9 (14.3min, 37P1) fps +120% |
Asus NUC 14 Pro
Intel Core Ultra 5 125H, Intel Arc 7-Core iGPU |
39.9 (3.1min, 29.4P1) fps +69% |
Khadas Mind 2
Intel Core Ultra 7 155H, Intel Arc 8-Core iGPU |
35.9 (2.99min, 27P1) fps +52% |
GMK NucBox K9
Intel Core Ultra 5 125H, Intel Arc 7-Core iGPU |
33.6 (6.68min, 22.7P1) fps +42% |
MSI Cubi NUC 1M
Intel Core 7 150U, Intel Iris Xe Graphics G7 96EUs |
23.6 (8.96min, 17.2P1) fps |
Beelink SEi11 Pro
Intel Core i5-11320H, Intel Iris Xe Graphics G7 96EUs |
23.2 (11.5min, 15.9P1) fps -2% |
Average Intel Iris Xe Graphics G7 96EUs
(9.39 - 51.6, n=160) | |
Lenovo IdeaPad Slim 3i 15IRU9
Intel Core 5 120U, Intel Iris Xe Graphics G7 80EUs |
22.3 (8.86min, 15.9P1) fps -6% |
Geekom XT13 Pro
Intel Core i9-13900H, Intel Iris Xe Graphics G7 96EUs |
22.1 (7.08min, 16.4P1) fps -6% |
HP Elite Mini 800 G9-5M9X6EA
Intel Core i5-14500, Intel UHD Graphics 770 |
12.3 (4.52min, 9.35P1) fps -48% |
|
Lenovo ThinkStation P3 Tiny-30H0006AGE
Intel Core i9-14900, NVIDIA T1000 |
50.2 (6.23min, 34.5P1) fps +403% |
Geekom AX8 Pro
AMD Ryzen 9 8945HS, AMD Radeon 780M |
27.7 (13.2min, 18.2P1) fps +178% |
GMK NucBox K6
AMD Ryzen 7 7840HS, AMD Radeon 780M |
26 (2.62min, 17.5P1) fps +161% |
Beelink SER6 Pro
AMD Ryzen 7 6800H, AMD Radeon 680M |
23.7 (9.52min, 16.4P1) fps +137% |
Asus NUC 14 Pro
Intel Core Ultra 5 125H, Intel Arc 7-Core iGPU |
16.6 (2.85min, 11.4P1) fps +66% |
Khadas Mind 2
Intel Core Ultra 7 155H, Intel Arc 8-Core iGPU |
13.9 (2.71min, 10.6P1) fps +39% |
GMK NucBox K9
Intel Core Ultra 5 125H, Intel Arc 7-Core iGPU |
12.7 (2.89min, 8.93P1) fps +27% |
MSI Cubi NUC 1M
Intel Core 7 150U, Intel Iris Xe Graphics G7 96EUs |
9.98 (4.2min, 6.21P1) fps |
Lenovo IdeaPad Slim 3i 15IRU9
Intel Core 5 120U, Intel Iris Xe Graphics G7 80EUs |
9.55 (4.54min, 5.43P1) fps -4% |
Average Intel Iris Xe Graphics G7 96EUs
(4.13 - 22.9, n=154) | |
Geekom XT13 Pro
Intel Core i9-13900H, Intel Iris Xe Graphics G7 96EUs |
9 (3.72min, 7.14P1) fps -10% |
HP Elite Mini 800 G9-5M9X6EA
Intel Core i5-14500, Intel UHD Graphics 770 |
5.34 (2.38min, 2.94P1) fps -46% |
|
|
Lenovo ThinkStation P3 Tiny-30H0006AGE
Intel Core i9-14900, NVIDIA T1000 | |
GMK NucBox K6
AMD Ryzen 7 7840HS, AMD Radeon 780M | |
Beelink SER8
AMD Ryzen 7 8845HS, AMD Radeon 780M | |
Geekom AX8 Pro
AMD Ryzen 9 8945HS, AMD Radeon 780M | |
Beelink SER6 Pro
AMD Ryzen 7 6800H, AMD Radeon 680M | |
Khadas Mind 2
Intel Core Ultra 7 155H, Intel Arc 8-Core iGPU | |
Beelink SER6 Pro Ryzen 7 7735HS
AMD Ryzen 7 7735HS, AMD Radeon 680M | |
Asus NUC 14 Pro
Intel Core Ultra 5 125H, Intel Arc 7-Core iGPU | |
GMK NucBox K9
Intel Core Ultra 5 125H, Intel Arc 7-Core iGPU | |
GMK NucBox M6
AMD Ryzen 5 6600H, AMD Radeon 660M | |
Geekom XT13 Pro
Intel Core i9-13900H, Intel Iris Xe Graphics G7 96EUs | |
MSI Cubi NUC 1M
Intel Core 7 150U, Intel Iris Xe Graphics G7 96EUs | |
Average Intel Iris Xe Graphics G7 96EUs
(14.9 - 56.5, n=186) | |
Beelink SEi11 Pro
Intel Core i5-11320H, Intel Iris Xe Graphics G7 96EUs | |
Lenovo IdeaPad Slim 3i 15IRU9
Intel Core 5 120U, Intel Iris Xe Graphics G7 80EUs | |
GMK NucBox M5
AMD Ryzen 7 5700U, AMD Radeon RX Vega 8 (Ryzen 4000/5000) | |
HP Elite Mini 800 G9-5M9X6EA
Intel Core i5-14500, Intel UHD Graphics 770 | |
|
Lenovo ThinkStation P3 Tiny-30H0006AGE
Intel Core i9-14900, NVIDIA T1000 | |
Beelink SER8
AMD Ryzen 7 8845HS, AMD Radeon 780M | |
GMK NucBox K6
AMD Ryzen 7 7840HS, AMD Radeon 780M | |
Geekom AX8 Pro
AMD Ryzen 9 8945HS, AMD Radeon 780M | |
Khadas Mind 2
Intel Core Ultra 7 155H, Intel Arc 8-Core iGPU | |
Asus NUC 14 Pro
Intel Core Ultra 5 125H, Intel Arc 7-Core iGPU | |
Beelink SER6 Pro
AMD Ryzen 7 6800H, AMD Radeon 680M | |
GMK NucBox K9
Intel Core Ultra 5 125H, Intel Arc 7-Core iGPU | |
Beelink SER6 Pro Ryzen 7 7735HS
AMD Ryzen 7 7735HS, AMD Radeon 680M | |
Geekom XT13 Pro
Intel Core i9-13900H, Intel Iris Xe Graphics G7 96EUs | |
GMK NucBox M6
AMD Ryzen 5 6600H, AMD Radeon 660M | |
MSI Cubi NUC 1M
Intel Core 7 150U, Intel Iris Xe Graphics G7 96EUs | |
Average Intel Iris Xe Graphics G7 96EUs
(10.5 - 31.2, n=182) | |
Lenovo IdeaPad Slim 3i 15IRU9
Intel Core 5 120U, Intel Iris Xe Graphics G7 80EUs | |
Beelink SEi11 Pro
Intel Core i5-11320H, Intel Iris Xe Graphics G7 96EUs | |
GMK NucBox M5
AMD Ryzen 7 5700U, AMD Radeon RX Vega 8 (Ryzen 4000/5000) | |
HP Elite Mini 800 G9-5M9X6EA
Intel Core i5-14500, Intel UHD Graphics 770 | |
|
Lenovo ThinkStation P3 Tiny-30H0006AGE
Intel Core i9-14900, NVIDIA T1000 | |
Beelink SER8
AMD Ryzen 7 8845HS, AMD Radeon 780M | |
GMK NucBox K6
AMD Ryzen 7 7840HS, AMD Radeon 780M | |
Geekom AX8 Pro
AMD Ryzen 9 8945HS, AMD Radeon 780M | |
Khadas Mind 2
Intel Core Ultra 7 155H, Intel Arc 8-Core iGPU | |
Asus NUC 14 Pro
Intel Core Ultra 5 125H, Intel Arc 7-Core iGPU | |
Beelink SER6 Pro Ryzen 7 7735HS
AMD Ryzen 7 7735HS, AMD Radeon 680M | |
Beelink SER6 Pro
AMD Ryzen 7 6800H, AMD Radeon 680M | |
GMK NucBox K9
Intel Core Ultra 5 125H, Intel Arc 7-Core iGPU | |
Geekom XT13 Pro
Intel Core i9-13900H, Intel Iris Xe Graphics G7 96EUs | |
GMK NucBox M6
AMD Ryzen 5 6600H, AMD Radeon 660M | |
Average Intel Iris Xe Graphics G7 96EUs
(8.15 - 27.8, n=175) | |
MSI Cubi NUC 1M
Intel Core 7 150U, Intel Iris Xe Graphics G7 96EUs | |
Beelink SEi11 Pro
Intel Core i5-11320H, Intel Iris Xe Graphics G7 96EUs | |
Lenovo IdeaPad Slim 3i 15IRU9
Intel Core 5 120U, Intel Iris Xe Graphics G7 80EUs | |
GMK NucBox M5
AMD Ryzen 7 5700U, AMD Radeon RX Vega 8 (Ryzen 4000/5000) | |
HP Elite Mini 800 G9-5M9X6EA
Intel Core i5-14500, Intel UHD Graphics 770 | |
|
|
Lenovo ThinkStation P3 Tiny-30H0006AGE
Intel Core i9-14900, NVIDIA T1000 |
246.2 (207.1min) fps +152% |
GMK NucBox K6
AMD Ryzen 7 7840HS, AMD Radeon 780M | |
Geekom AX8 Pro
AMD Ryzen 9 8945HS, AMD Radeon 780M | |
Beelink SER8
AMD Ryzen 7 8845HS, AMD Radeon 780M |
151.9 (101.9min) fps +55% |
GMK NucBox M6
AMD Ryzen 5 6600H, AMD Radeon 660M |
144.9 (123.5min) fps +48% |
Beelink SER6 Pro
AMD Ryzen 7 6800H, AMD Radeon 680M |
143.3 (123.8min) fps +47% |
Beelink SER6 Pro Ryzen 7 7735HS
AMD Ryzen 7 7735HS, AMD Radeon 680M |
142.2 (123.6min) fps +46% |
Beelink SEi11 Pro
Intel Core i5-11320H, Intel Iris Xe Graphics G7 96EUs |
119.6 (108.4min) fps +22% |
Geekom XT13 Pro
Intel Core i9-13900H, Intel Iris Xe Graphics G7 96EUs | |
HP Elite Mini 800 G9-5M9X6EA
Intel Core i5-14500, Intel UHD Graphics 770 | |
Lenovo IdeaPad Slim 3i 15IRU9
Intel Core 5 120U, Intel Iris Xe Graphics G7 80EUs | |
Khadas Mind 2
Intel Core Ultra 7 155H, Intel Arc 8-Core iGPU | |
Average Intel Iris Xe Graphics G7 96EUs
(36 - 148, n=218) | |
GMK NucBox M5
AMD Ryzen 7 5700U, AMD Radeon RX Vega 8 (Ryzen 4000/5000) | |
GMK NucBox K9
Intel Core Ultra 5 125H, Intel Arc 7-Core iGPU | |
MSI Cubi NUC 1M
Intel Core 7 150U, Intel Iris Xe Graphics G7 96EUs | |
Asus NUC 14 Pro
Intel Core Ultra 5 125H, Intel Arc 7-Core iGPU | |
|
Lenovo ThinkStation P3 Tiny-30H0006AGE
Intel Core i9-14900, NVIDIA T1000 |
217.7 (183.7min) fps +252% |
Beelink SER8
AMD Ryzen 7 8845HS, AMD Radeon 780M |
130.1 (91.5min) fps +110% |
GMK NucBox K6
AMD Ryzen 7 7840HS, AMD Radeon 780M |
124.8 (104.5min) fps +102% |
Geekom AX8 Pro
AMD Ryzen 9 8945HS, AMD Radeon 780M | |
Beelink SER6 Pro Ryzen 7 7735HS
AMD Ryzen 7 7735HS, AMD Radeon 680M | |
Beelink SER6 Pro
AMD Ryzen 7 6800H, AMD Radeon 680M | |
GMK NucBox M6
AMD Ryzen 5 6600H, AMD Radeon 660M | |
GMK NucBox K9
Intel Core Ultra 5 125H, Intel Arc 7-Core iGPU | |
Geekom XT13 Pro
Intel Core i9-13900H, Intel Iris Xe Graphics G7 96EUs | |
GMK NucBox M5
AMD Ryzen 7 5700U, AMD Radeon RX Vega 8 (Ryzen 4000/5000) | |
Asus NUC 14 Pro
Intel Core Ultra 5 125H, Intel Arc 7-Core iGPU | |
Beelink SEi11 Pro
Intel Core i5-11320H, Intel Iris Xe Graphics G7 96EUs | |
HP Elite Mini 800 G9-5M9X6EA
Intel Core i5-14500, Intel UHD Graphics 770 | |
Lenovo IdeaPad Slim 3i 15IRU9
Intel Core 5 120U, Intel Iris Xe Graphics G7 80EUs | |
Average Intel Iris Xe Graphics G7 96EUs
(31.6 - 108.5, n=218) | |
MSI Cubi NUC 1M
Intel Core 7 150U, Intel Iris Xe Graphics G7 96EUs | |
Khadas Mind 2
Intel Core Ultra 7 155H, Intel Arc 8-Core iGPU | |
|
Lenovo ThinkStation P3 Tiny-30H0006AGE
Intel Core i9-14900, NVIDIA T1000 |
150.4 (134.4min) fps +141% |
Beelink SER8
AMD Ryzen 7 8845HS, AMD Radeon 780M | |
GMK NucBox K6
AMD Ryzen 7 7840HS, AMD Radeon 780M | |
Beelink SER6 Pro Ryzen 7 7735HS
AMD Ryzen 7 7735HS, AMD Radeon 680M | |
Geekom AX8 Pro
AMD Ryzen 9 8945HS, AMD Radeon 780M | |
Beelink SER6 Pro
AMD Ryzen 7 6800H, AMD Radeon 680M | |
Asus NUC 14 Pro
Intel Core Ultra 5 125H, Intel Arc 7-Core iGPU | |
GMK NucBox K9
Intel Core Ultra 5 125H, Intel Arc 7-Core iGPU | |
Geekom XT13 Pro
Intel Core i9-13900H, Intel Iris Xe Graphics G7 96EUs | |
GMK NucBox M6
AMD Ryzen 5 6600H, AMD Radeon 660M | |
MSI Cubi NUC 1M
Intel Core 7 150U, Intel Iris Xe Graphics G7 96EUs | |
Lenovo IdeaPad Slim 3i 15IRU9
Intel Core 5 120U, Intel Iris Xe Graphics G7 80EUs | |
Average Intel Iris Xe Graphics G7 96EUs
(23.2 - 88.1, n=218) | |
GMK NucBox M5
AMD Ryzen 7 5700U, AMD Radeon RX Vega 8 (Ryzen 4000/5000) | |
Beelink SEi11 Pro
Intel Core i5-11320H, Intel Iris Xe Graphics G7 96EUs | |
Khadas Mind 2
Intel Core Ultra 7 155H, Intel Arc 8-Core iGPU | |
HP Elite Mini 800 G9-5M9X6EA
Intel Core i5-14500, Intel UHD Graphics 770 | |
|
Lenovo ThinkStation P3 Tiny-30H0006AGE
Intel Core i9-14900, NVIDIA T1000 |
136.5 (120.3min) fps +136% |
Beelink SER8
AMD Ryzen 7 8845HS, AMD Radeon 780M | |
GMK NucBox K6
AMD Ryzen 7 7840HS, AMD Radeon 780M | |
Geekom AX8 Pro
AMD Ryzen 9 8945HS, AMD Radeon 780M | |
GMK NucBox K9
Intel Core Ultra 5 125H, Intel Arc 7-Core iGPU | |
Beelink SER6 Pro
AMD Ryzen 7 6800H, AMD Radeon 680M | |
Asus NUC 14 Pro
Intel Core Ultra 5 125H, Intel Arc 7-Core iGPU | |
Beelink SER6 Pro Ryzen 7 7735HS
AMD Ryzen 7 7735HS, AMD Radeon 680M | |
Geekom XT13 Pro
Intel Core i9-13900H, Intel Iris Xe Graphics G7 96EUs | |
GMK NucBox M6
AMD Ryzen 5 6600H, AMD Radeon 660M | |
MSI Cubi NUC 1M
Intel Core 7 150U, Intel Iris Xe Graphics G7 96EUs | |
Lenovo IdeaPad Slim 3i 15IRU9
Intel Core 5 120U, Intel Iris Xe Graphics G7 80EUs | |
Average Intel Iris Xe Graphics G7 96EUs
(20.6 - 78.5, n=218) | |
GMK NucBox M5
AMD Ryzen 7 5700U, AMD Radeon RX Vega 8 (Ryzen 4000/5000) | |
Beelink SEi11 Pro
Intel Core i5-11320H, Intel Iris Xe Graphics G7 96EUs | |
Khadas Mind 2
Intel Core Ultra 7 155H, Intel Arc 8-Core iGPU | |
HP Elite Mini 800 G9-5M9X6EA
Intel Core i5-14500, Intel UHD Graphics 770 | |
|
|
Lenovo ThinkStation P3 Tiny-30H0006AGE
Intel Core i9-14900, NVIDIA T1000 | |
Beelink SER8
AMD Ryzen 7 8845HS, AMD Radeon 780M | |
GMK NucBox K6
AMD Ryzen 7 7840HS, AMD Radeon 780M | |
GMK NucBox M6
AMD Ryzen 5 6600H, AMD Radeon 660M | |
GMK NucBox K9
Intel Core Ultra 5 125H, Intel Arc 7-Core iGPU | |
MSI Cubi NUC 1M
Intel Core 7 150U, Intel Iris Xe Graphics G7 96EUs | |
Average Intel Iris Xe Graphics G7 96EUs
(23 - 75, n=93) | |
GMK NucBox M5
AMD Ryzen 7 5700U, AMD Radeon RX Vega 8 (Ryzen 4000/5000) | |
Lenovo IdeaPad Slim 3i 15IRU9
Intel Core 5 120U, Intel Iris Xe Graphics G7 80EUs | |
|
Lenovo ThinkStation P3 Tiny-30H0006AGE
Intel Core i9-14900, NVIDIA T1000 | |
Beelink SER8
AMD Ryzen 7 8845HS, AMD Radeon 780M | |
GMK NucBox K6
AMD Ryzen 7 7840HS, AMD Radeon 780M | |
GMK NucBox K9
Intel Core Ultra 5 125H, Intel Arc 7-Core iGPU | |
GMK NucBox M6
AMD Ryzen 5 6600H, AMD Radeon 660M | |
MSI Cubi NUC 1M
Intel Core 7 150U, Intel Iris Xe Graphics G7 96EUs | |
Average Intel Iris Xe Graphics G7 96EUs
(14 - 39, n=91) | |
Lenovo IdeaPad Slim 3i 15IRU9
Intel Core 5 120U, Intel Iris Xe Graphics G7 80EUs | |
GMK NucBox M5
AMD Ryzen 7 5700U, AMD Radeon RX Vega 8 (Ryzen 4000/5000) | |
|
Lenovo ThinkStation P3 Tiny-30H0006AGE
Intel Core i9-14900, NVIDIA T1000 | |
Beelink SER8
AMD Ryzen 7 8845HS, AMD Radeon 780M | |
GMK NucBox K6
AMD Ryzen 7 7840HS, AMD Radeon 780M | |
GMK NucBox K9
Intel Core Ultra 5 125H, Intel Arc 7-Core iGPU | |
GMK NucBox M6
AMD Ryzen 5 6600H, AMD Radeon 660M | |
MSI Cubi NUC 1M
Intel Core 7 150U, Intel Iris Xe Graphics G7 96EUs | |
Average Intel Iris Xe Graphics G7 96EUs
(10 - 35, n=89) | |
Lenovo IdeaPad Slim 3i 15IRU9
Intel Core 5 120U, Intel Iris Xe Graphics G7 80EUs | |
GMK NucBox M5
AMD Ryzen 7 5700U, AMD Radeon RX Vega 8 (Ryzen 4000/5000) | |
|
Lenovo ThinkStation P3 Tiny-30H0006AGE
Intel Core i9-14900, NVIDIA T1000 | |
Beelink SER8
AMD Ryzen 7 8845HS, AMD Radeon 780M | |
GMK NucBox K6
AMD Ryzen 7 7840HS, AMD Radeon 780M | |
GMK NucBox K9
Intel Core Ultra 5 125H, Intel Arc 7-Core iGPU | |
GMK NucBox M6
AMD Ryzen 5 6600H, AMD Radeon 660M | |
MSI Cubi NUC 1M
Intel Core 7 150U, Intel Iris Xe Graphics G7 96EUs | |
Average Intel Iris Xe Graphics G7 96EUs
(11 - 33, n=75) | |
Lenovo IdeaPad Slim 3i 15IRU9
Intel Core 5 120U, Intel Iris Xe Graphics G7 80EUs | |
GMK NucBox M5
AMD Ryzen 7 5700U, AMD Radeon RX Vega 8 (Ryzen 4000/5000) | |
|
|
GMK NucBox K6
AMD Ryzen 7 7840HS, AMD Radeon 780M |
170 (137min, 113P1) fps +137% |
Beelink SER8
AMD Ryzen 7 8845HS, AMD Radeon 780M |
145.7 (108min, 89P1) fps +103% |
Beelink SER6 Pro Ryzen 7 7735HS
AMD Ryzen 7 7735HS, AMD Radeon 680M |
141.3 (116min, 93P1) fps +97% |
GMK NucBox K9
Intel Core Ultra 5 125H, Intel Arc 7-Core iGPU |
130.2 (112min, 96P1) fps +81% |
GMK NucBox M6
AMD Ryzen 5 6600H, AMD Radeon 660M |
107.3 (86min, 79P1) fps +49% |
Average Intel Iris Xe Graphics G7 96EUs
(57.4 - 94.9, n=53) | |
MSI Cubi NUC 1M
Intel Core 7 150U, Intel Iris Xe Graphics G7 96EUs | |
Lenovo IdeaPad Slim 3i 15IRU9
Intel Core 5 120U, Intel Iris Xe Graphics G7 80EUs |
67.7 (48min, 54P1) fps -6% |
GMK NucBox M5
AMD Ryzen 7 5700U, AMD Radeon RX Vega 8 (Ryzen 4000/5000) |
64.5 (55min, 54P1) fps -10% |
|
GMK NucBox K6
AMD Ryzen 7 7840HS, AMD Radeon 780M |
99.8 (12min, 70P1) fps +136% |
Beelink SER8
AMD Ryzen 7 8845HS, AMD Radeon 780M |
99 (86min, 76P1) fps +134% |
Beelink SER6 Pro Ryzen 7 7735HS
AMD Ryzen 7 7735HS, AMD Radeon 680M |
80.1 (69min, 55P1) fps +89% |
GMK NucBox K9
Intel Core Ultra 5 125H, Intel Arc 7-Core iGPU |
79.4 (63min, 66P1) fps +88% |
GMK NucBox M6
AMD Ryzen 5 6600H, AMD Radeon 660M |
58.3 (43min, 42P1) fps +38% |
Average Intel Iris Xe Graphics G7 96EUs
(33.3 - 57.2, n=58) | |
MSI Cubi NUC 1M
Intel Core 7 150U, Intel Iris Xe Graphics G7 96EUs | |
Lenovo IdeaPad Slim 3i 15IRU9
Intel Core 5 120U, Intel Iris Xe Graphics G7 80EUs |
40.1 (33min, 32P1) fps -5% |
GMK NucBox M5
AMD Ryzen 7 5700U, AMD Radeon RX Vega 8 (Ryzen 4000/5000) |
35.7 (31min, 27P1) fps -16% |
|
GMK NucBox K6
AMD Ryzen 7 7840HS, AMD Radeon 780M |
85.9 (67min, 59P1) fps +125% |
Beelink SER8
AMD Ryzen 7 8845HS, AMD Radeon 780M |
85.9 (73min, 68P1) fps +125% |
GMK NucBox K9
Intel Core Ultra 5 125H, Intel Arc 7-Core iGPU |
71.9 (61min, 59P1) fps +88% |
Beelink SER6 Pro Ryzen 7 7735HS
AMD Ryzen 7 7735HS, AMD Radeon 680M |
69.5 (57min, 49P1) fps +82% |
GMK NucBox M6
AMD Ryzen 5 6600H, AMD Radeon 660M |
52.3 (41min, 39P1) fps +37% |
Average Intel Iris Xe Graphics G7 96EUs
(28 - 52.3, n=58) | |
MSI Cubi NUC 1M
Intel Core 7 150U, Intel Iris Xe Graphics G7 96EUs | |
Lenovo IdeaPad Slim 3i 15IRU9
Intel Core 5 120U, Intel Iris Xe Graphics G7 80EUs | |
GMK NucBox M5
AMD Ryzen 7 5700U, AMD Radeon RX Vega 8 (Ryzen 4000/5000) |
32.3 (28min, 25P1) fps -15% |
|
GMK NucBox K6
AMD Ryzen 7 7840HS, AMD Radeon 780M |
66.7 (53min, 36P1) fps +136% |
Beelink SER8
AMD Ryzen 7 8845HS, AMD Radeon 780M |
65.6 (54min, 52P1) fps +132% |
Beelink SER6 Pro Ryzen 7 7735HS
AMD Ryzen 7 7735HS, AMD Radeon 680M |
52.9 (43min, 38P1) fps +87% |
GMK NucBox K9
Intel Core Ultra 5 125H, Intel Arc 7-Core iGPU |
52.9 (46min, 45P1) fps +87% |
GMK NucBox M6
AMD Ryzen 5 6600H, AMD Radeon 660M |
37.2 (31min, 29P1) fps +31% |
Average Intel Iris Xe Graphics G7 96EUs
(21.7 - 37.1, n=58) | |
MSI Cubi NUC 1M
Intel Core 7 150U, Intel Iris Xe Graphics G7 96EUs | |
Lenovo IdeaPad Slim 3i 15IRU9
Intel Core 5 120U, Intel Iris Xe Graphics G7 80EUs |
25.9 (22min, 21P1) fps -8% |
GMK NucBox M5
AMD Ryzen 7 5700U, AMD Radeon RX Vega 8 (Ryzen 4000/5000) |
23.8 (20min, 18P1) fps -16% |
|
Average Intel Iris Xe Graphics G7 96EUs
(16.1 - 28.2, n=49) | |
MSI Cubi NUC 1M
Intel Core 7 150U, Intel Iris Xe Graphics G7 96EUs | |
Lenovo IdeaPad Slim 3i 15IRU9
Intel Core 5 120U, Intel Iris Xe Graphics G7 80EUs |
19.4 (16min, 15P1) fps -9% |
GMK NucBox K6
AMD Ryzen 7 7840HS, AMD Radeon 780M |
18.4 (12min, 12P1) fps -14% |
Beelink SER8
AMD Ryzen 7 8845HS, AMD Radeon 780M |
17.9 (13min, 13P1) fps -16% |
GMK NucBox M5
AMD Ryzen 7 5700U, AMD Radeon RX Vega 8 (Ryzen 4000/5000) |
16.8 (13min, 13P1) fps -21% |
Beelink SER6 Pro Ryzen 7 7735HS
AMD Ryzen 7 7735HS, AMD Radeon 680M |
13.9 (10min, 9P1) fps -35% |
GMK NucBox M6
AMD Ryzen 5 6600H, AMD Radeon 660M |
8.43 (6min, 6P1) fps -61% |
|
|
GMK NucBox K6
AMD Ryzen 7 7840HS, AMD Radeon 780M | |
Lenovo ThinkStation P3 Tiny-30H0006AGE
Intel Core i9-14900, NVIDIA T1000 | |
Beelink SER8
AMD Ryzen 7 8845HS, AMD Radeon 780M | |
Geekom AX8 Pro
AMD Ryzen 9 8945HS, AMD Radeon 780M | |
Khadas Mind 2
Intel Core Ultra 7 155H, Intel Arc 8-Core iGPU | |
GMK NucBox K9
Intel Core Ultra 5 125H, Intel Arc 7-Core iGPU | |
Asus NUC 14 Pro
Intel Core Ultra 5 125H, Intel Arc 7-Core iGPU | |
Geekom XT13 Pro
Intel Core i9-13900H, Intel Iris Xe Graphics G7 96EUs | |
Average Intel Iris Xe Graphics G7 96EUs
(21.4 - 37.3, n=16) | |
MSI Cubi NUC 1M
Intel Core 7 150U, Intel Iris Xe Graphics G7 96EUs | |
Lenovo IdeaPad Slim 3i 15IRU9
Intel Core 5 120U, Intel Iris Xe Graphics G7 80EUs | |
GMK NucBox M5
AMD Ryzen 7 5700U, AMD Radeon RX Vega 8 (Ryzen 4000/5000) | |
HP Elite Mini 800 G9-5M9X6EA
Intel Core i5-14500, Intel UHD Graphics 770 | |
|
GMK NucBox K6
AMD Ryzen 7 7840HS, AMD Radeon 780M | |
Lenovo ThinkStation P3 Tiny-30H0006AGE
Intel Core i9-14900, NVIDIA T1000 | |
Beelink SER8
AMD Ryzen 7 8845HS, AMD Radeon 780M | |
Geekom AX8 Pro
AMD Ryzen 9 8945HS, AMD Radeon 780M | |
Khadas Mind 2
Intel Core Ultra 7 155H, Intel Arc 8-Core iGPU | |
GMK NucBox K9
Intel Core Ultra 5 125H, Intel Arc 7-Core iGPU | |
Asus NUC 14 Pro
Intel Core Ultra 5 125H, Intel Arc 7-Core iGPU | |
GMK NucBox M6
AMD Ryzen 5 6600H, AMD Radeon 660M | |
Geekom XT13 Pro
Intel Core i9-13900H, Intel Iris Xe Graphics G7 96EUs | |
Average Intel Iris Xe Graphics G7 96EUs
(13.1 - 22.5, n=16) | |
MSI Cubi NUC 1M
Intel Core 7 150U, Intel Iris Xe Graphics G7 96EUs | |
Lenovo IdeaPad Slim 3i 15IRU9
Intel Core 5 120U, Intel Iris Xe Graphics G7 80EUs | |
GMK NucBox M5
AMD Ryzen 7 5700U, AMD Radeon RX Vega 8 (Ryzen 4000/5000) | |
HP Elite Mini 800 G9-5M9X6EA
Intel Core i5-14500, Intel UHD Graphics 770 | |
|
GMK NucBox K6
AMD Ryzen 7 7840HS, AMD Radeon 780M | |
Beelink SER8
AMD Ryzen 7 8845HS, AMD Radeon 780M | |
Lenovo ThinkStation P3 Tiny-30H0006AGE
Intel Core i9-14900, NVIDIA T1000 | |
Geekom AX8 Pro
AMD Ryzen 9 8945HS, AMD Radeon 780M | |
Khadas Mind 2
Intel Core Ultra 7 155H, Intel Arc 8-Core iGPU | |
Asus NUC 14 Pro
Intel Core Ultra 5 125H, Intel Arc 7-Core iGPU | |
GMK NucBox K9
Intel Core Ultra 5 125H, Intel Arc 7-Core iGPU | |
GMK NucBox M6
AMD Ryzen 5 6600H, AMD Radeon 660M | |
Geekom XT13 Pro
Intel Core i9-13900H, Intel Iris Xe Graphics G7 96EUs | |
Average Intel Iris Xe Graphics G7 96EUs
(11.4 - 17.7, n=13) | |
MSI Cubi NUC 1M
Intel Core 7 150U, Intel Iris Xe Graphics G7 96EUs | |
Lenovo IdeaPad Slim 3i 15IRU9
Intel Core 5 120U, Intel Iris Xe Graphics G7 80EUs | |
GMK NucBox M5
AMD Ryzen 7 5700U, AMD Radeon RX Vega 8 (Ryzen 4000/5000) | |
HP Elite Mini 800 G9-5M9X6EA
Intel Core i5-14500, Intel UHD Graphics 770 | |
|
|
Lenovo ThinkStation P3 Tiny-30H0006AGE
Intel Core i9-14900, NVIDIA T1000 |
226 (39.2min, 192.3P1) fps +156% |
Beelink SER8
AMD Ryzen 7 8845HS, AMD Radeon 780M |
173.7 (119.2min, 145.2P1) fps +97% |
GMK NucBox K6
AMD Ryzen 7 7840HS, AMD Radeon 780M |
167.7 (34.3min, 142.9P1) fps +90% |
GMK NucBox K9
Intel Core Ultra 5 125H, Intel Arc 7-Core iGPU |
148.6 (45.8min, 118.4P1) fps +68% |
Beelink SER6 Pro
AMD Ryzen 7 6800H, AMD Radeon 680M |
141.9 (78.6min, 116.6P1) fps +61% |
Beelink SER6 Pro Ryzen 7 7735HS
AMD Ryzen 7 7735HS, AMD Radeon 680M |
137.8 (107.9min, 119.9P1) fps +56% |
GMK NucBox M6
AMD Ryzen 5 6600H, AMD Radeon 660M |
120.2 (78.3min, 104.5P1) fps +36% |
MSI Cubi NUC 1M
Intel Core 7 150U, Intel Iris Xe Graphics G7 96EUs | |
Average Intel Iris Xe Graphics G7 96EUs
(48.5 - 115.1, n=170) | |
Lenovo IdeaPad Slim 3i 15IRU9
Intel Core 5 120U, Intel Iris Xe Graphics G7 80EUs |
84.7 (19.2min, 27.3P1) fps -4% |
GMK NucBox M5
AMD Ryzen 7 5700U, AMD Radeon RX Vega 8 (Ryzen 4000/5000) |
79.8 (20.7min, 69.9P1) fps -10% |
Beelink SEi11 Pro
Intel Core i5-11320H, Intel Iris Xe Graphics G7 96EUs |
79.3 (18.8min, 25.6P1) fps -10% |
|
Lenovo ThinkStation P3 Tiny-30H0006AGE
Intel Core i9-14900, NVIDIA T1000 |
87.2 (73.7min, 77P1) fps +124% |
Beelink SER8
AMD Ryzen 7 8845HS, AMD Radeon 780M |
68.9 (55.3min, 59.1P1) fps +77% |
GMK NucBox K6
AMD Ryzen 7 7840HS, AMD Radeon 780M |
67.9 (43.7min, 58.3P1) fps +75% |
GMK NucBox K9
Intel Core Ultra 5 125H, Intel Arc 7-Core iGPU |
63.9 (33.2min, 54.3P1) fps +64% |
Beelink SER6 Pro
AMD Ryzen 7 6800H, AMD Radeon 680M |
57.8 (43.1min, 50.8P1) fps +49% |
Beelink SER6 Pro Ryzen 7 7735HS
AMD Ryzen 7 7735HS, AMD Radeon 680M |
56.4 (47.8min, 49P1) fps +45% |
GMK NucBox M6
AMD Ryzen 5 6600H, AMD Radeon 660M |
43 (36.6min, 37.4P1) fps +11% |
MSI Cubi NUC 1M
Intel Core 7 150U, Intel Iris Xe Graphics G7 96EUs |
38.9 (14.7min, 28.5P1) fps |
Average Intel Iris Xe Graphics G7 96EUs
(18.2 - 51.4, n=168) | |
Lenovo IdeaPad Slim 3i 15IRU9
Intel Core 5 120U, Intel Iris Xe Graphics G7 80EUs |
35.9 (12.8min, 20.8P1) fps -8% |
Beelink SEi11 Pro
Intel Core i5-11320H, Intel Iris Xe Graphics G7 96EUs |
33.9 (10.3min, 19.8P1) fps -13% |
GMK NucBox M5
AMD Ryzen 7 5700U, AMD Radeon RX Vega 8 (Ryzen 4000/5000) |
32.4 (15.3min, 28.3P1) fps -17% |
|
Lenovo ThinkStation P3 Tiny-30H0006AGE
Intel Core i9-14900, NVIDIA T1000 |
69.4 (49.4min, 53.4P1) fps +123% |
Beelink SER8
AMD Ryzen 7 8845HS, AMD Radeon 780M |
58.7 (43.2min, 45.6P1) fps +89% |
GMK NucBox K6
AMD Ryzen 7 7840HS, AMD Radeon 780M |
57.9 (7min, 45P1) fps +86% |
GMK NucBox K9
Intel Core Ultra 5 125H, Intel Arc 7-Core iGPU |
53.5 (28.6min, 42P1) fps +72% |
Beelink SER6 Pro
AMD Ryzen 7 6800H, AMD Radeon 680M |
48.6 (34.2min, 38.3P1) fps +56% |
Beelink SER6 Pro Ryzen 7 7735HS
AMD Ryzen 7 7735HS, AMD Radeon 680M |
47.1 (35.1min, 37.2P1) fps +51% |
GMK NucBox M6
AMD Ryzen 5 6600H, AMD Radeon 660M |
35.9 (28.5min, 29.1P1) fps +15% |
MSI Cubi NUC 1M
Intel Core 7 150U, Intel Iris Xe Graphics G7 96EUs |
31.1 (8.7min, 16.3P1) fps |
Average Intel Iris Xe Graphics G7 96EUs
(15.4 - 39.8, n=167) | |
Lenovo IdeaPad Slim 3i 15IRU9
Intel Core 5 120U, Intel Iris Xe Graphics G7 80EUs |
28.5 (6.4min, 14.3P1) fps -8% |
Beelink SEi11 Pro
Intel Core i5-11320H, Intel Iris Xe Graphics G7 96EUs |
27.7 (10min, 15.1P1) fps -11% |
GMK NucBox M5
AMD Ryzen 7 5700U, AMD Radeon RX Vega 8 (Ryzen 4000/5000) |
26.8 (14.8min, 19.1P1) fps -14% |
|
Lenovo ThinkStation P3 Tiny-30H0006AGE
Intel Core i9-14900, NVIDIA T1000 |
59.9 (44.2min, 47.8P1) fps +138% |
Beelink SER8
AMD Ryzen 7 8845HS, AMD Radeon 780M |
50.8 (24.5min, 33.9P1) fps +102% |
GMK NucBox K6
AMD Ryzen 7 7840HS, AMD Radeon 780M |
48.8 (11.1min, 31.1P1) fps +94% |
GMK NucBox K9
Intel Core Ultra 5 125H, Intel Arc 7-Core iGPU |
43.5 (8.2min, 17.8P1) fps +73% |
Beelink SER6 Pro
AMD Ryzen 7 6800H, AMD Radeon 680M |
41.9 (32.6min, 33.4P1) fps +66% |
Beelink SER6 Pro Ryzen 7 7735HS
AMD Ryzen 7 7735HS, AMD Radeon 680M |
40.7 (31.5min, 32.4P1) fps +62% |
GMK NucBox M6
AMD Ryzen 5 6600H, AMD Radeon 660M |
29.6 (21min, 24.7P1) fps +17% |
MSI Cubi NUC 1M
Intel Core 7 150U, Intel Iris Xe Graphics G7 96EUs |
25.2 (5.3min, 6.89P1) fps |
Average Intel Iris Xe Graphics G7 96EUs
(13.2 - 31.7, n=165) | |
Lenovo IdeaPad Slim 3i 15IRU9
Intel Core 5 120U, Intel Iris Xe Graphics G7 80EUs |
22.8 (5min, 5.93P1) fps -10% |
GMK NucBox M5
AMD Ryzen 7 5700U, AMD Radeon RX Vega 8 (Ryzen 4000/5000) |
22.7 (11.3min, 12.5P1) fps -10% |
Beelink SEi11 Pro
Intel Core i5-11320H, Intel Iris Xe Graphics G7 96EUs |
22.2 (5.6min, 7.76P1) fps -12% |
|
|
Lenovo ThinkStation P3 Tiny-30H0006AGE
Intel Core i9-14900, NVIDIA T1000 |
75.9 (36.6min, 56P0.1, 65.8P1) fps +231% |
Beelink SER8
AMD Ryzen 7 8845HS, AMD Radeon 780M | |
Geekom AX8 Pro
AMD Ryzen 9 8945HS, AMD Radeon 780M |
60.8 (21.6min, 28.1P0.1, 35.6P1) fps +166% |
GMK NucBox K9
Intel Core Ultra 5 125H, Intel Arc 7-Core iGPU | |
Asus NUC 14 Pro
Intel Core Ultra 5 125H, Intel Arc 7-Core iGPU |
50.2 (27.7min, 29.7P0.1, 32.6P1) fps +119% |
Khadas Mind 2
Intel Core Ultra 7 155H, Intel Arc 8-Core iGPU |
48.5 (16.6min, 27.3P0.1, 31.4P1) fps +112% |
GMK NucBox M6
AMD Ryzen 5 6600H, AMD Radeon 660M | |
Geekom XT13 Pro
Intel Core i9-13900H, Intel Iris Xe Graphics G7 96EUs |
28.2 (13.8min, 15.1P0.1, 19.8P1) fps +23% |
Average Intel Iris Xe Graphics G7 96EUs
(14.5 - 66.1, n=11) | |
MSI Cubi NUC 1M
Intel Core 7 150U, Intel Iris Xe Graphics G7 96EUs | |
GMK NucBox M5
AMD Ryzen 7 5700U, AMD Radeon RX Vega 8 (Ryzen 4000/5000) | |
Lenovo IdeaPad Slim 3i 15IRU9
Intel Core 5 120U, Intel Iris Xe Graphics G7 80EUs | |
HP Elite Mini 800 G9-5M9X6EA
Intel Core i5-14500, Intel UHD Graphics 770 |
16.9 (10.9min, 11.1P0.1, 12.8P1) fps -26% |
|
Lenovo ThinkStation P3 Tiny-30H0006AGE
Intel Core i9-14900, NVIDIA T1000 |
45 (22.4min, 36.9P0.1, 38.2P1) fps +194% |
Beelink SER8
AMD Ryzen 7 8845HS, AMD Radeon 780M | |
GMK NucBox K6
AMD Ryzen 7 7840HS, AMD Radeon 780M | |
Geekom AX8 Pro
AMD Ryzen 9 8945HS, AMD Radeon 780M |
38.5 (19.4min, 19.8P0.1, 29.1P1) fps +152% |
GMK NucBox K9
Intel Core Ultra 5 125H, Intel Arc 7-Core iGPU | |
Asus NUC 14 Pro
Intel Core Ultra 5 125H, Intel Arc 7-Core iGPU |
33.5 (20.9min, 21P0.1, 23.4P1) fps +119% |
Khadas Mind 2
Intel Core Ultra 7 155H, Intel Arc 8-Core iGPU |
32.9 (20.4min, 20.8P0.1, 22.7P1) fps +115% |
GMK NucBox M6
AMD Ryzen 5 6600H, AMD Radeon 660M | |
Geekom XT13 Pro
Intel Core i9-13900H, Intel Iris Xe Graphics G7 96EUs |
19.9 (15.5min, 15.6P0.1, 16.4P1) fps +30% |
Average Intel Iris Xe Graphics G7 96EUs
(9.4 - 29.3, n=11) | |
MSI Cubi NUC 1M
Intel Core 7 150U, Intel Iris Xe Graphics G7 96EUs | |
GMK NucBox M5
AMD Ryzen 7 5700U, AMD Radeon RX Vega 8 (Ryzen 4000/5000) | |
Lenovo IdeaPad Slim 3i 15IRU9
Intel Core 5 120U, Intel Iris Xe Graphics G7 80EUs | |
HP Elite Mini 800 G9-5M9X6EA
Intel Core i5-14500, Intel UHD Graphics 770 |
10.2 (7.83min, 7.9P0.1, 8.15P1) fps -33% |
|
Lenovo ThinkStation P3 Tiny-30H0006AGE
Intel Core i9-14900, NVIDIA T1000 |
35.2 (20.6min, 26.7P0.1, 30.6P1) fps |
Beelink SER8
AMD Ryzen 7 8845HS, AMD Radeon 780M | |
GMK NucBox K6
AMD Ryzen 7 7840HS, AMD Radeon 780M | |
Geekom AX8 Pro
AMD Ryzen 9 8945HS, AMD Radeon 780M |
29.9 (11.8min, 18.6P0.1, 23.5P1) fps |
GMK NucBox K9
Intel Core Ultra 5 125H, Intel Arc 7-Core iGPU | |
Asus NUC 14 Pro
Intel Core Ultra 5 125H, Intel Arc 7-Core iGPU |
25.9 (5.81min, 8.8P0.1, 15.9P1) fps |
Khadas Mind 2
Intel Core Ultra 7 155H, Intel Arc 8-Core iGPU |
25 (9.42min, 11.3P0.1, 16.1P1) fps |
Geekom XT13 Pro
Intel Core i9-13900H, Intel Iris Xe Graphics G7 96EUs |
15.4 (11.8min, 11.9P0.1, 12.7P1) fps |
GMK NucBox M6
AMD Ryzen 5 6600H, AMD Radeon 660M | |
Average Intel Iris Xe Graphics G7 96EUs
(13 - 18.2, n=8) | |
Lenovo IdeaPad Slim 3i 15IRU9
Intel Core 5 120U, Intel Iris Xe Graphics G7 80EUs | |
HP Elite Mini 800 G9-5M9X6EA
Intel Core i5-14500, Intel UHD Graphics 770 |
7.86 (5.51min, 5.72P0.1, 6.18P1) fps |
|
Lenovo ThinkStation P3 Tiny-30H0006AGE
Intel Core i9-14900, NVIDIA T1000 |
30.2 (10.5min, 12.6P0.1, 26.4P1) fps |
Beelink SER8
AMD Ryzen 7 8845HS, AMD Radeon 780M | |
GMK NucBox K6
AMD Ryzen 7 7840HS, AMD Radeon 780M | |
Geekom AX8 Pro
AMD Ryzen 9 8945HS, AMD Radeon 780M |
24.5 (17.7min, 17.7P0.1, 19.8P1) fps |
GMK NucBox K9
Intel Core Ultra 5 125H, Intel Arc 7-Core iGPU | |
Asus NUC 14 Pro
Intel Core Ultra 5 125H, Intel Arc 7-Core iGPU |
22.4 (14min, 14.2P0.1, 15.3P1) fps |
Khadas Mind 2
Intel Core Ultra 7 155H, Intel Arc 8-Core iGPU |
21.6 (11.7min, 12.4P0.1, 13.9P1) fps |
Geekom XT13 Pro
Intel Core i9-13900H, Intel Iris Xe Graphics G7 96EUs |
13.5 (11.2min, 11.2P0.1, 11.6P1) fps |
GMK NucBox M6
AMD Ryzen 5 6600H, AMD Radeon 660M | |
Average Intel Iris Xe Graphics G7 96EUs
(10.6 - 14.1, n=8) | |
HP Elite Mini 800 G9-5M9X6EA
Intel Core i5-14500, Intel UHD Graphics 770 |
6.88 (5.24min, 5.26P0.1, 5.41P1) fps |
|
Lenovo ThinkStation P3 Tiny-30H0006AGE
Intel Core i9-14900, NVIDIA T1000 |
29.5 (13.3min, 21.5P0.1, 25.7P1) fps |
Beelink SER8
AMD Ryzen 7 8845HS, AMD Radeon 780M | |
GMK NucBox K6
AMD Ryzen 7 7840HS, AMD Radeon 780M | |
Geekom AX8 Pro
AMD Ryzen 9 8945HS, AMD Radeon 780M |
24.4 (8.81min, 15.2P0.1, 19.3P1) fps |
GMK NucBox K9
Intel Core Ultra 5 125H, Intel Arc 7-Core iGPU | |
Asus NUC 14 Pro
Intel Core Ultra 5 125H, Intel Arc 7-Core iGPU |
21.5 (13.6min, 13.7P0.1, 14.1P1) fps |
Khadas Mind 2
Intel Core Ultra 7 155H, Intel Arc 8-Core iGPU |
21 (12.8min, 12.9P0.1, 13.6P1) fps |
Geekom XT13 Pro
Intel Core i9-13900H, Intel Iris Xe Graphics G7 96EUs |
13 (10.1min, 10.1P0.1, 11P1) fps |
GMK NucBox M6
AMD Ryzen 5 6600H, AMD Radeon 660M | |
Average Intel Iris Xe Graphics G7 96EUs
(9.3 - 13.1, n=7) | |
|
|
Lenovo ThinkStation P3 Tiny-30H0006AGE
Intel Core i9-14900, NVIDIA T1000 | |
Beelink SER6 Pro
AMD Ryzen 7 6800H, AMD Radeon 680M | |
GMK NucBox K6
AMD Ryzen 7 7840HS, AMD Radeon 780M | |
Beelink SER8
AMD Ryzen 7 8845HS, AMD Radeon 780M | |
Beelink SER6 Pro Ryzen 7 7735HS
AMD Ryzen 7 7735HS, AMD Radeon 680M | |
Geekom AX8 Pro
AMD Ryzen 9 8945HS, AMD Radeon 780M | |
Beelink SEi11 Pro
Intel Core i5-11320H, Intel Iris Xe Graphics G7 96EUs | |
GMK NucBox K9
Intel Core Ultra 5 125H, Intel Arc 7-Core iGPU | |
Khadas Mind 2
Intel Core Ultra 7 155H, Intel Arc 8-Core iGPU | |
GMK NucBox M6
AMD Ryzen 5 6600H, AMD Radeon 660M | |
Asus NUC 14 Pro
Intel Core Ultra 5 125H, Intel Arc 7-Core iGPU | |
Average Intel Iris Xe Graphics G7 96EUs
(13.4 - 88.4, n=212) | |
GMK NucBox M5
AMD Ryzen 7 5700U, AMD Radeon RX Vega 8 (Ryzen 4000/5000) | |
Lenovo IdeaPad Slim 3i 15IRU9
Intel Core 5 120U, Intel Iris Xe Graphics G7 80EUs | |
|
Lenovo ThinkStation P3 Tiny-30H0006AGE
Intel Core i9-14900, NVIDIA T1000 | |
Beelink SER6 Pro
AMD Ryzen 7 6800H, AMD Radeon 680M | |
Beelink SER6 Pro Ryzen 7 7735HS
AMD Ryzen 7 7735HS, AMD Radeon 680M | |
Beelink SER8
AMD Ryzen 7 8845HS, AMD Radeon 780M | |
GMK NucBox K6
AMD Ryzen 7 7840HS, AMD Radeon 780M | |
Geekom AX8 Pro
AMD Ryzen 9 8945HS, AMD Radeon 780M | |
GMK NucBox K9
Intel Core Ultra 5 125H, Intel Arc 7-Core iGPU | |
Beelink SEi11 Pro
Intel Core i5-11320H, Intel Iris Xe Graphics G7 96EUs | |
Khadas Mind 2
Intel Core Ultra 7 155H, Intel Arc 8-Core iGPU | |
GMK NucBox M6
AMD Ryzen 5 6600H, AMD Radeon 660M | |
Asus NUC 14 Pro
Intel Core Ultra 5 125H, Intel Arc 7-Core iGPU | |
Average Intel Iris Xe Graphics G7 96EUs
(11.6 - 69.5, n=213) | |
GMK NucBox M5
AMD Ryzen 7 5700U, AMD Radeon RX Vega 8 (Ryzen 4000/5000) | |
Lenovo IdeaPad Slim 3i 15IRU9
Intel Core 5 120U, Intel Iris Xe Graphics G7 80EUs | |
|
Lenovo ThinkStation P3 Tiny-30H0006AGE
Intel Core i9-14900, NVIDIA T1000 | |
Beelink SER6 Pro
AMD Ryzen 7 6800H, AMD Radeon 680M | |
Beelink SER6 Pro Ryzen 7 7735HS
AMD Ryzen 7 7735HS, AMD Radeon 680M | |
Geekom AX8 Pro
AMD Ryzen 9 8945HS, AMD Radeon 780M | |
GMK NucBox K6
AMD Ryzen 7 7840HS, AMD Radeon 780M | |
Beelink SER8
AMD Ryzen 7 8845HS, AMD Radeon 780M | |
Beelink SEi11 Pro
Intel Core i5-11320H, Intel Iris Xe Graphics G7 96EUs | |
GMK NucBox K9
Intel Core Ultra 5 125H, Intel Arc 7-Core iGPU | |
Khadas Mind 2
Intel Core Ultra 7 155H, Intel Arc 8-Core iGPU | |
GMK NucBox M6
AMD Ryzen 5 6600H, AMD Radeon 660M | |
Asus NUC 14 Pro
Intel Core Ultra 5 125H, Intel Arc 7-Core iGPU | |
Average Intel Iris Xe Graphics G7 96EUs
(11.1 - 59.8, n=212) | |
GMK NucBox M5
AMD Ryzen 7 5700U, AMD Radeon RX Vega 8 (Ryzen 4000/5000) | |
Lenovo IdeaPad Slim 3i 15IRU9
Intel Core 5 120U, Intel Iris Xe Graphics G7 80EUs | |


 Total Sustainability Score:
