

微星 Raider 18 HX A14V 评测:泰坦性能而非泰坦价格
")
随着产品线的不断扩大,18 英寸的大型游戏笔记本电脑正在卷土重来。微星已经推出了 "终极 "18 英寸游戏体验的 泰坦 18 HX但这款最新的 Raider 18 HX 型号在功能方面降低了一个层级,以降低入门门槛。
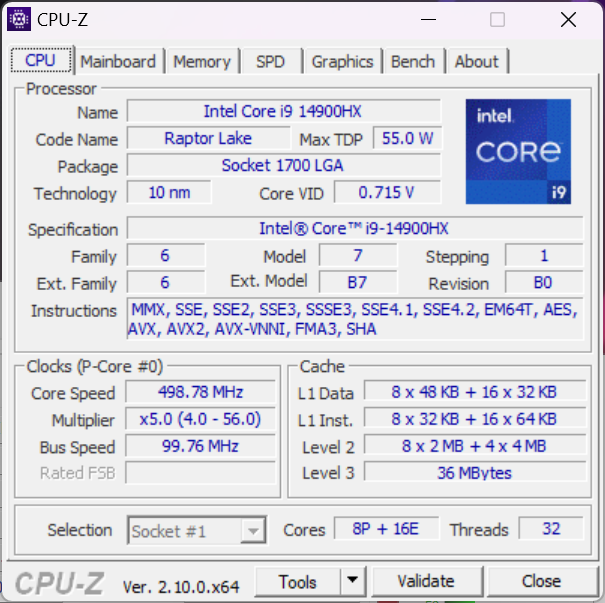
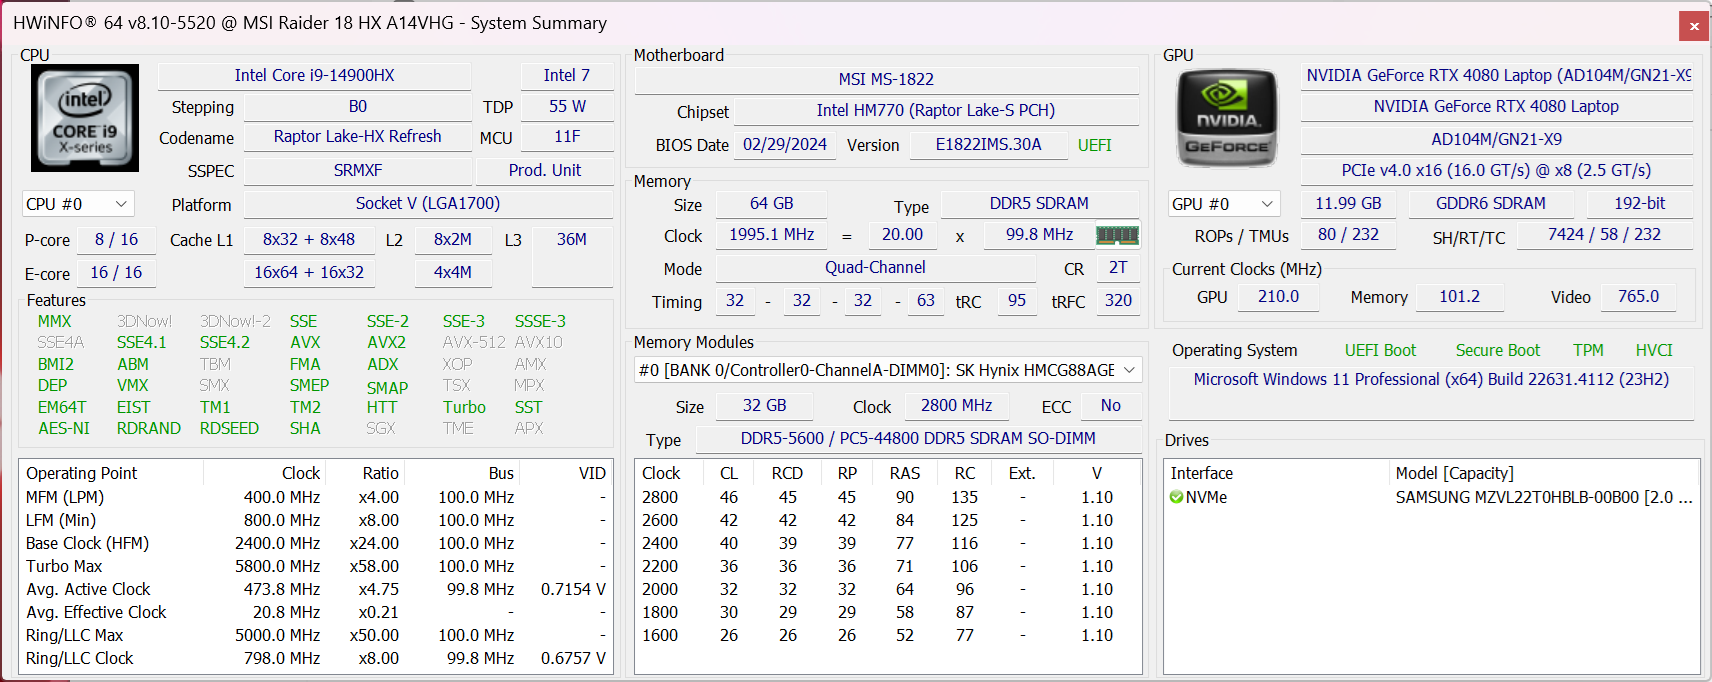
我们的测试机为中间配置,配备 Raptor Lake-R Core i9-14900HX CPU、175 WGeForce RTX 4080 GPU 和 3840 x 2400 120 Hz Mini-LED 显示屏,零售价约为 3200 美元。其他 SKU 包括 Zen 4 Ryzen 9 7945HX、RTX 4070、RTX 4090 或 QHD+ 2560 x 1600 240 Hz IPS 显示屏。
Raider 18 HX 的竞争对手包括其他 18 英寸游戏笔记本电脑,如 雷蛇刀锋 18, Alienware m18 R2或 华硕 ROG Strix G18.
更多微星评论:
潜在的竞争对手比较
Rating | Version | Date | Model | Weight | Height | Size | Resolution | Price |
|---|---|---|---|---|---|---|---|---|
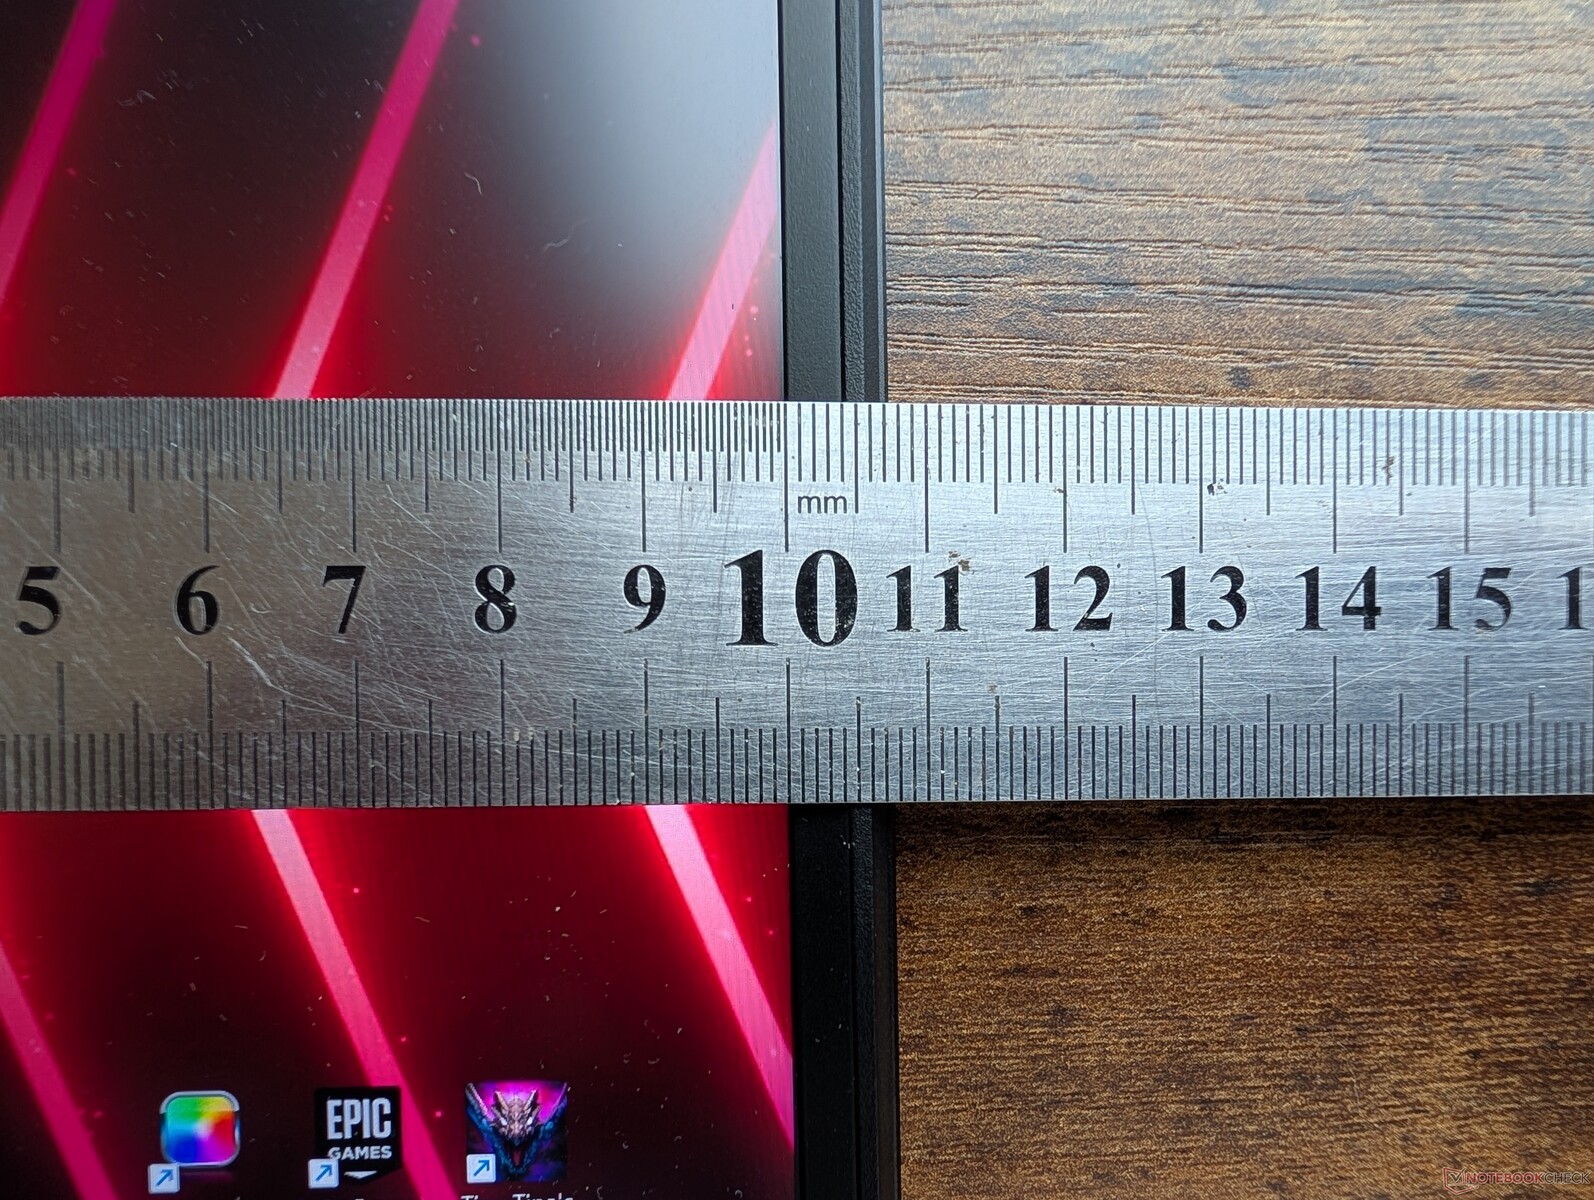
| 84.7 % | v8 | 09 / 2024 | MSI Raider 18 HX A14V i9-14900HX, NVIDIA GeForce RTX 4080 Laptop GPU | 3.6 kg | 32 mm | 18.00" | 3840x2400 | |
| 90.5 % v7 (old) | v7 (old) | 05 / 2024 | Razer Blade 18 2024 RZ09-0509 i9-14900HX, NVIDIA GeForce RTX 4090 Laptop GPU | 3.1 kg | 21.9 mm | 18.00" | 2560x1600 | |
| 89.5 % v7 (old) | v7 (old) | 03 / 2024 | Alienware m18 R2 i9-14900HX, NVIDIA GeForce RTX 4090 Laptop GPU | 4 kg | 26.7 mm | 18.00" | 2560x1600 | |
| 88.8 % v7 (old) | v7 (old) | 01 / 2024 | MSI Titan 18 HX A14VIG i9-14900HX, NVIDIA GeForce RTX 4090 Laptop GPU | 3.6 kg | 32.1 mm | 18.00" | 3840x2400 | |
| 87.4 % v7 (old) | v7 (old) | 03 / 2023 | Asus ROG Strix G18 G814JI i7-13650HX, NVIDIA GeForce RTX 4070 Laptop GPU | 3 kg | 31 mm | 18.00" | 2560x1600 | |
| 87.1 % v7 (old) | v7 (old) | 03 / 2024 | Acer Predator Helios 18 PH18-72-98MW i9-14900HX, NVIDIA GeForce RTX 4090 Laptop GPU | 3.3 kg | 29.5 mm | 18.00" | 2560x1600 |
注:我们最近更新了评级系统,第 8 版的结果与第 7 版的结果不具可比性。更多信息 此处.
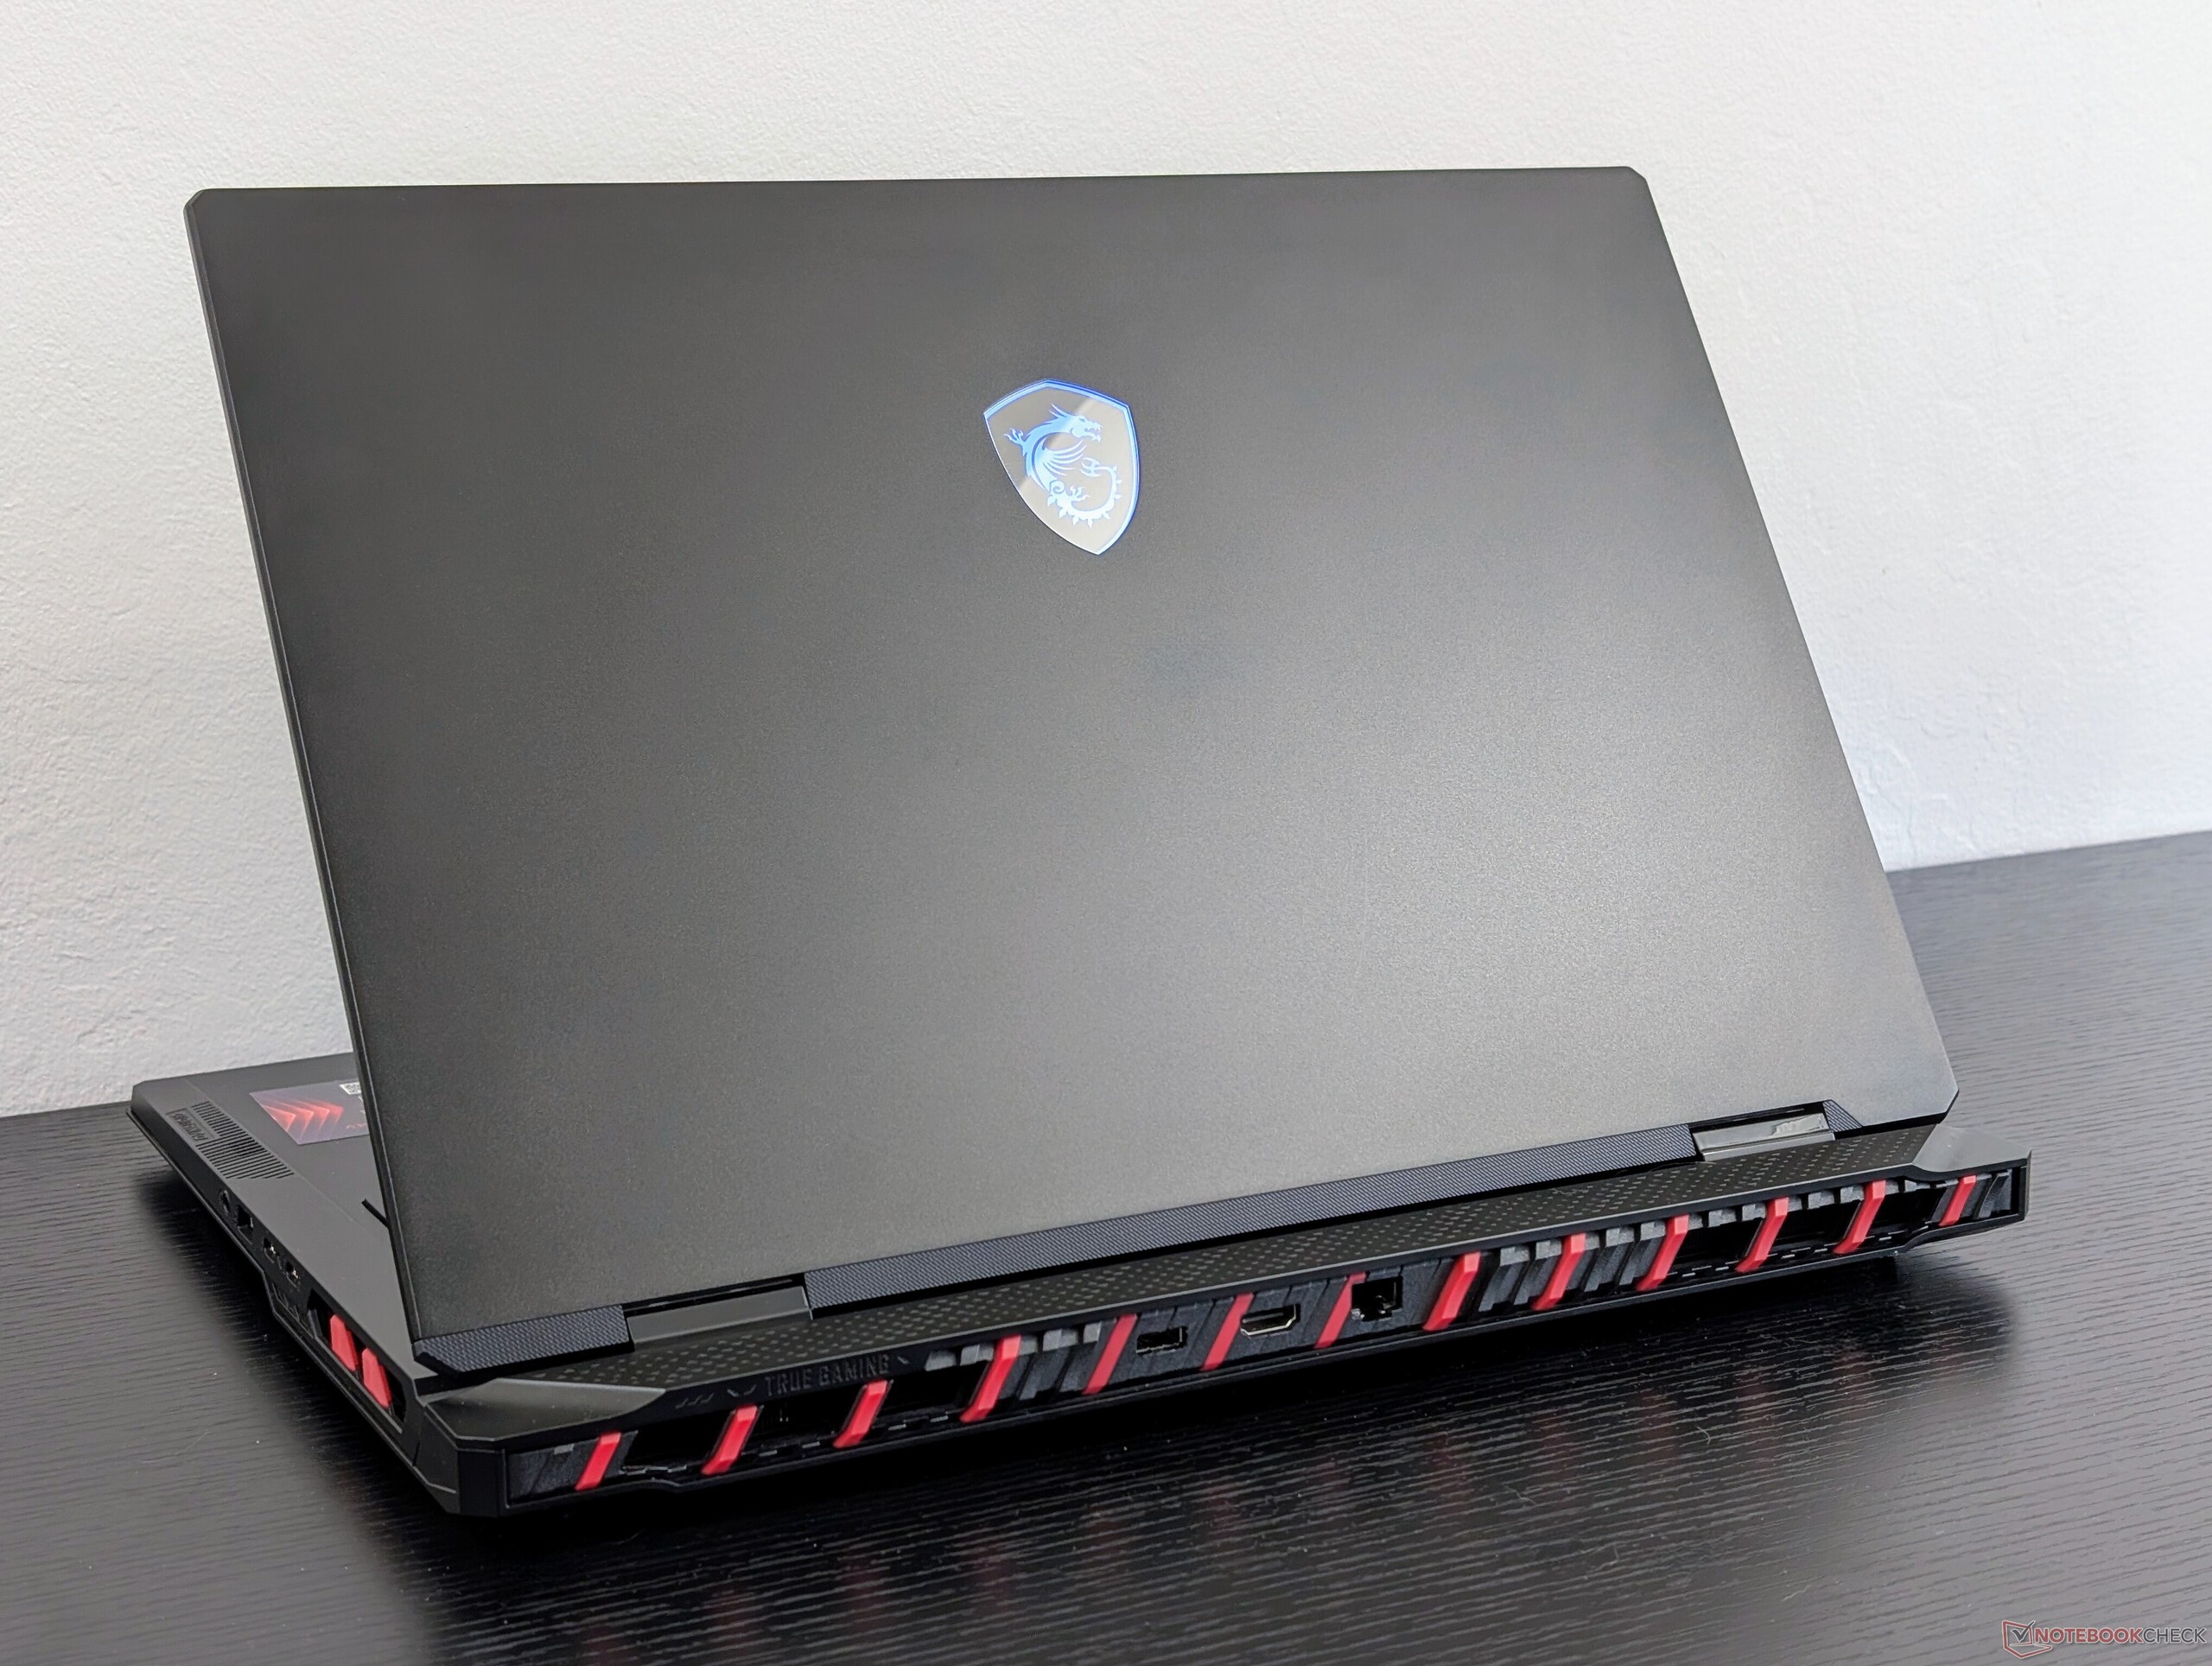
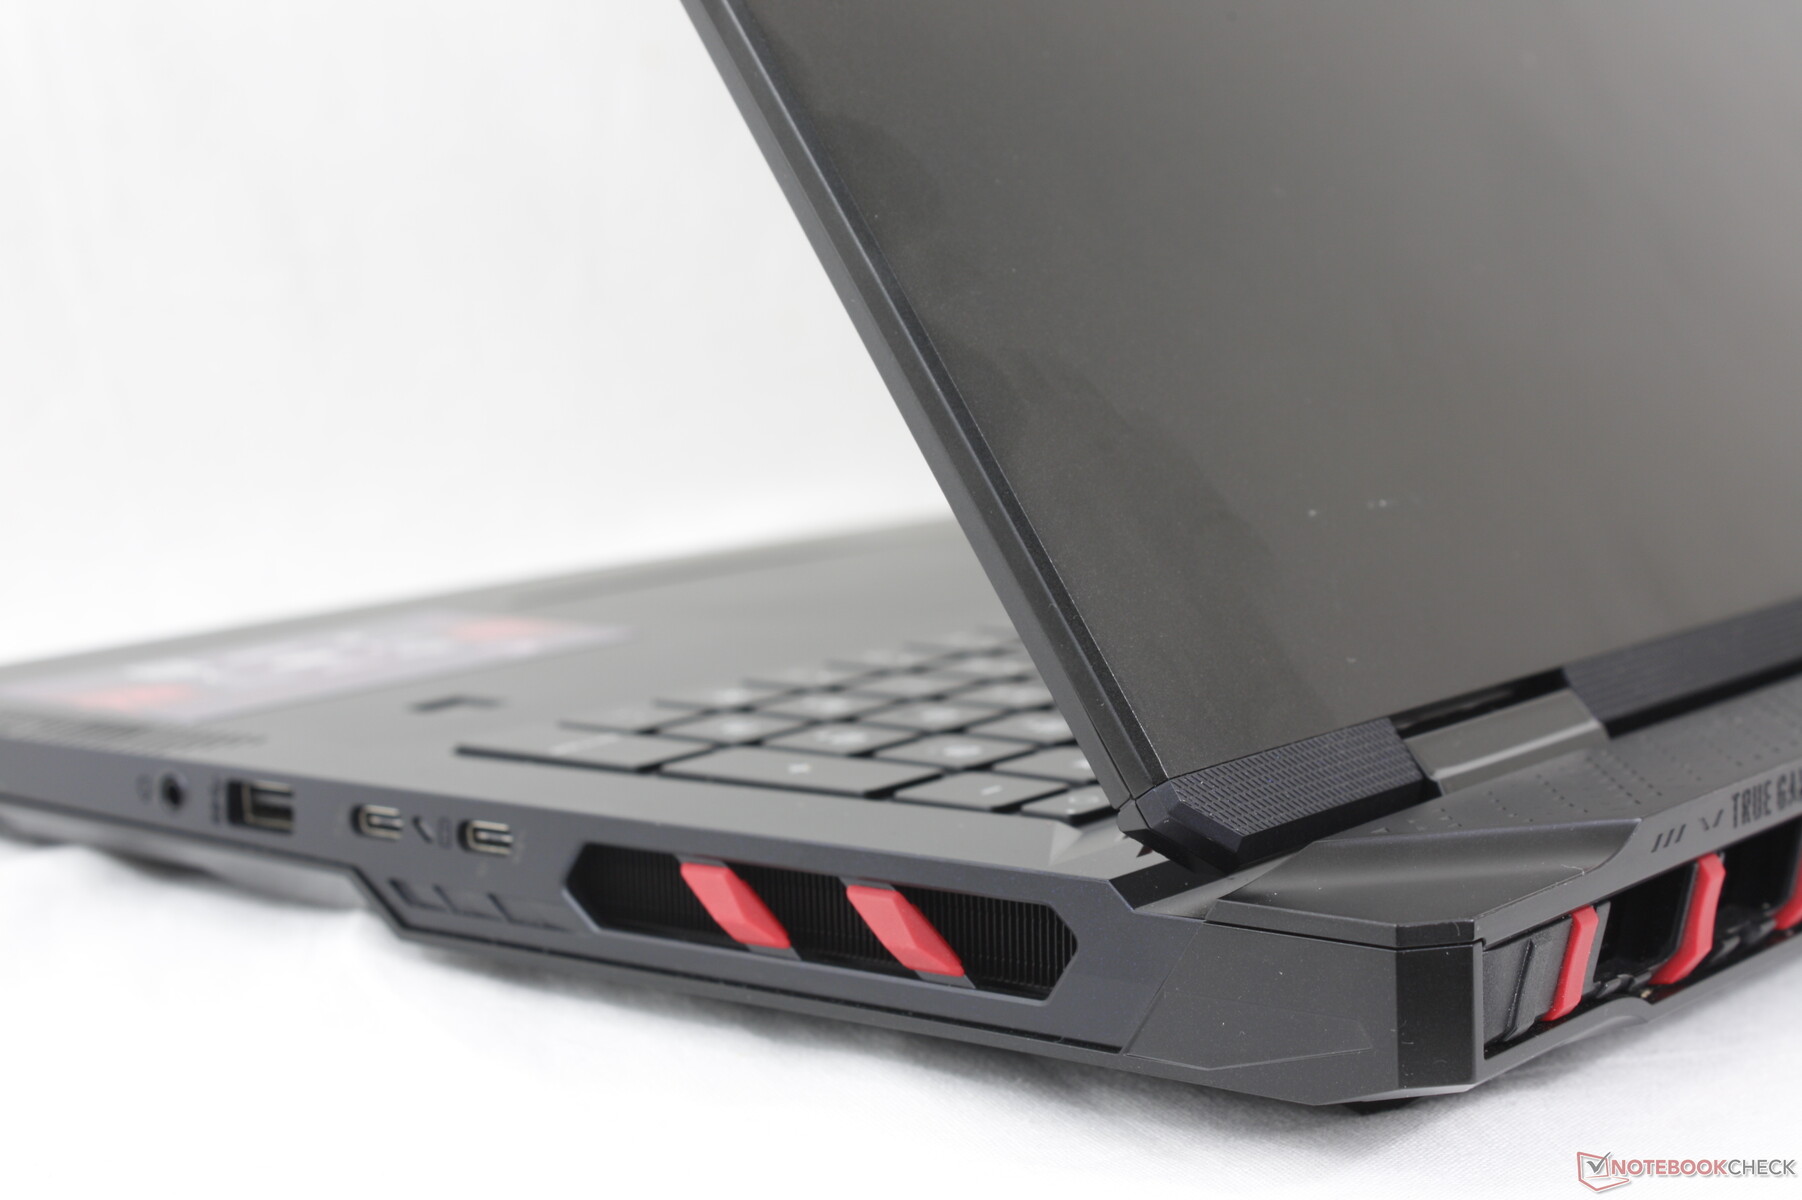
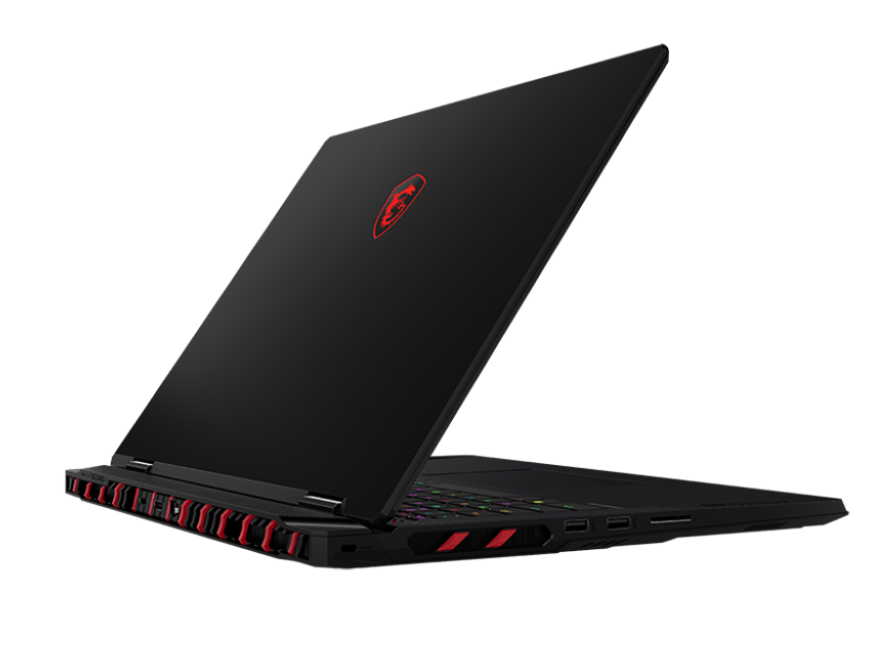
案例 - 从青龙到红龙
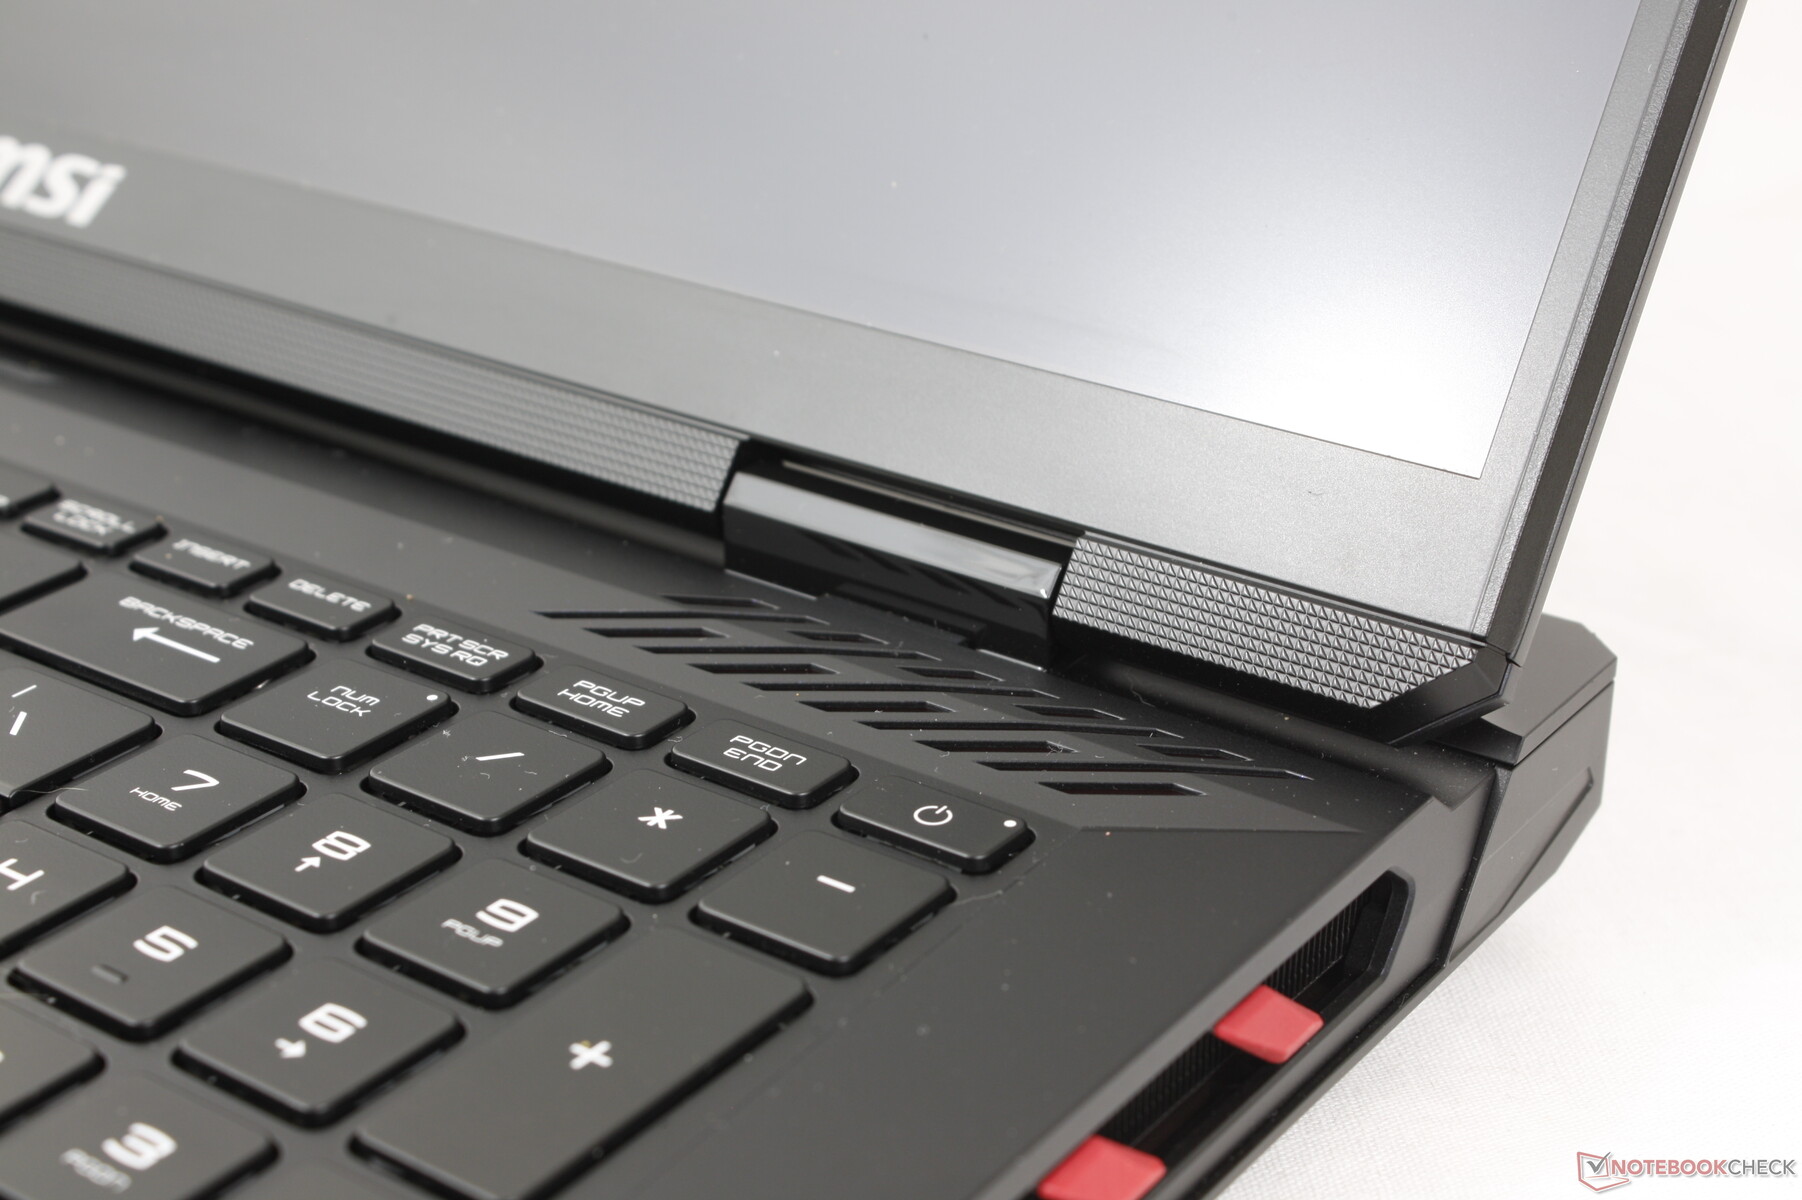
底盘是泰坦 18 HX 的衍生车型。在新款 Raider 上,Titan 的红色点缀变成了蓝色,大部分表面也由灰色或银色变成了漆黑色,整体看起来更加深沉。微星还在系统前沿增加了一个 LED 灯条,而泰坦上则没有。由于底层材料和骨架相同,因此 Raider 与更昂贵的同类产品相比,仍然给人以坚固耐用的感觉。
Raider 18 HX 和 Titan 18 HX 在视觉上最显著的区别可能就是重新设计的键盘面板。Titan 18 HX 的键盘面板更扁平,并在掌托和点击板上延伸了一块花哨的玻璃面板,而 Raider 则采用了更传统的方式,没有玻璃面板,只有一块基本的点击板。
尽管两者在外观上存在差异,但其尺寸和重量与 Titan 18 HX 基本相同。因此,就便携性而言,该机型在同类产品中处于中等水平。 Alienware m18 R2更重、更大,而 ROG Strix G18 或 Blade 18 则更轻。
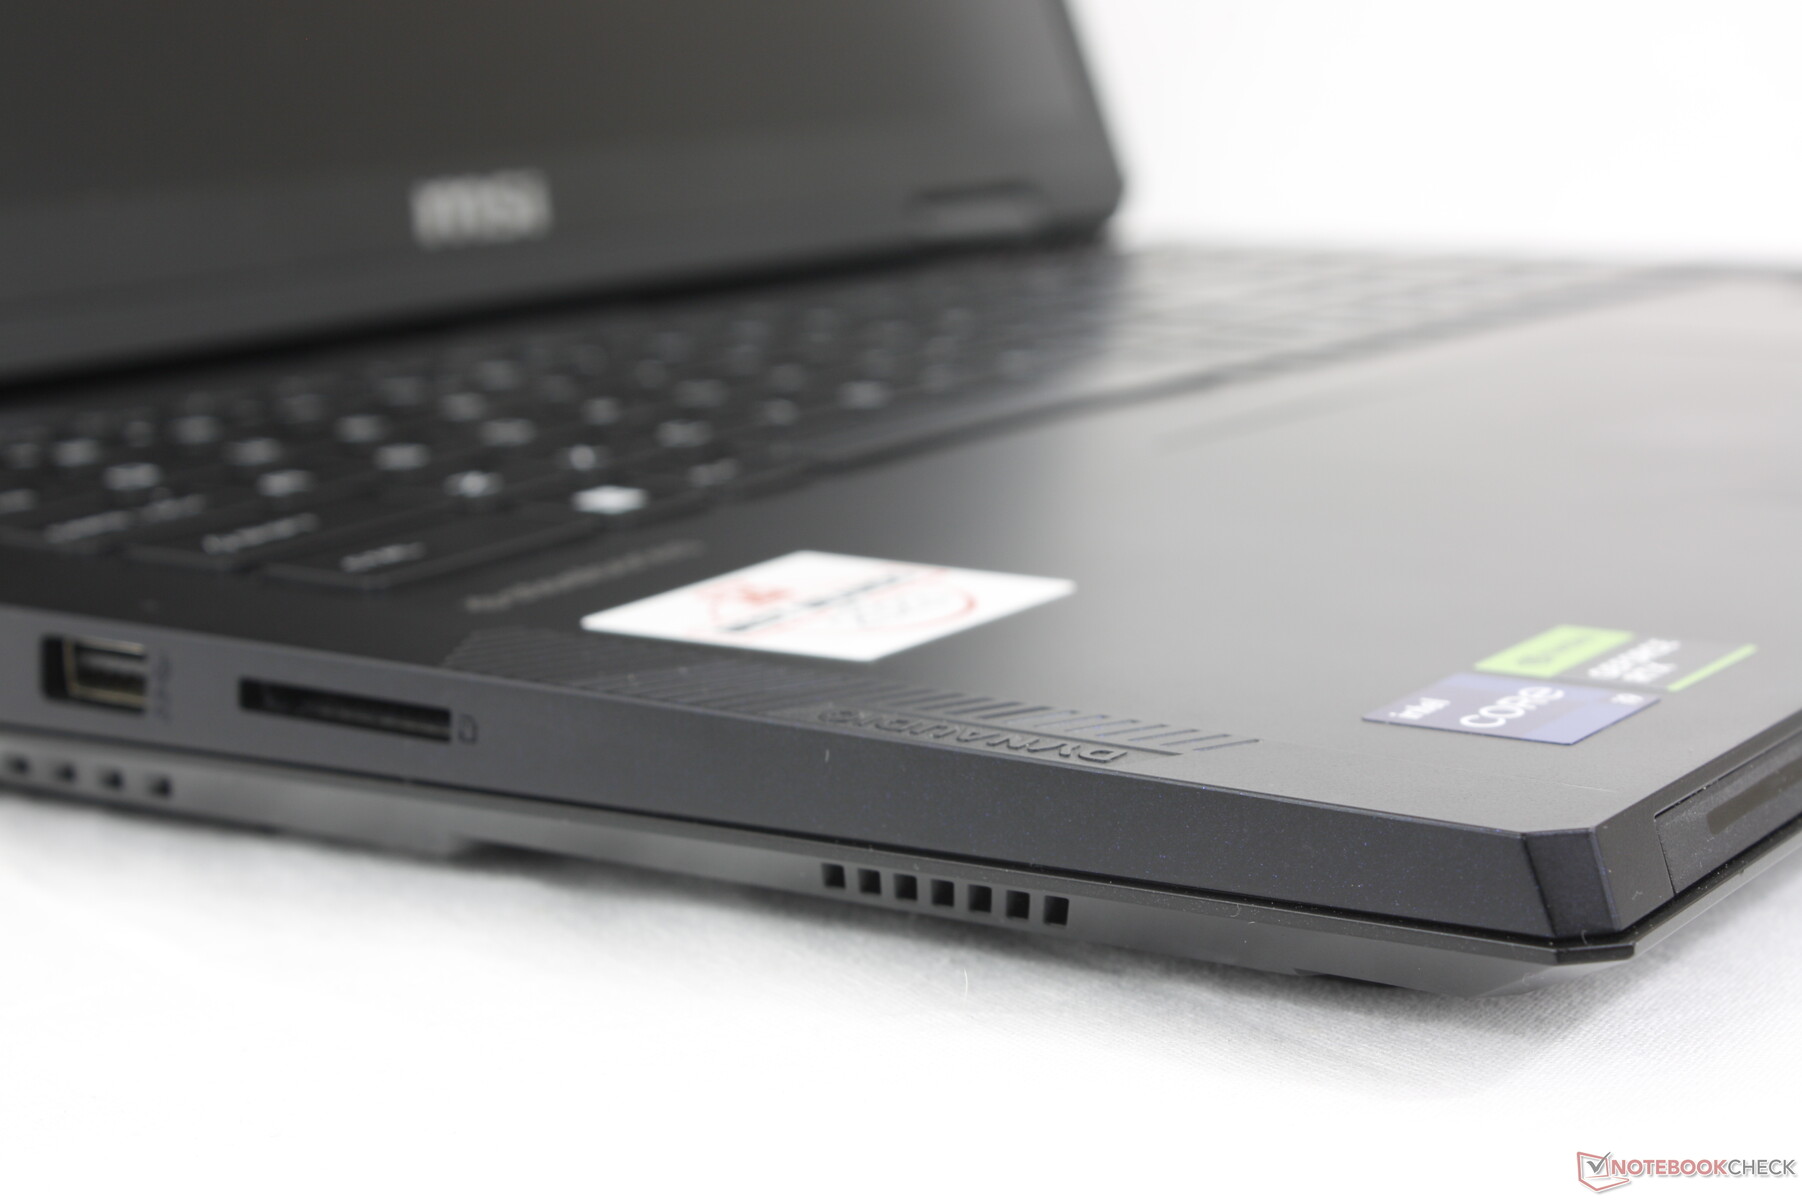
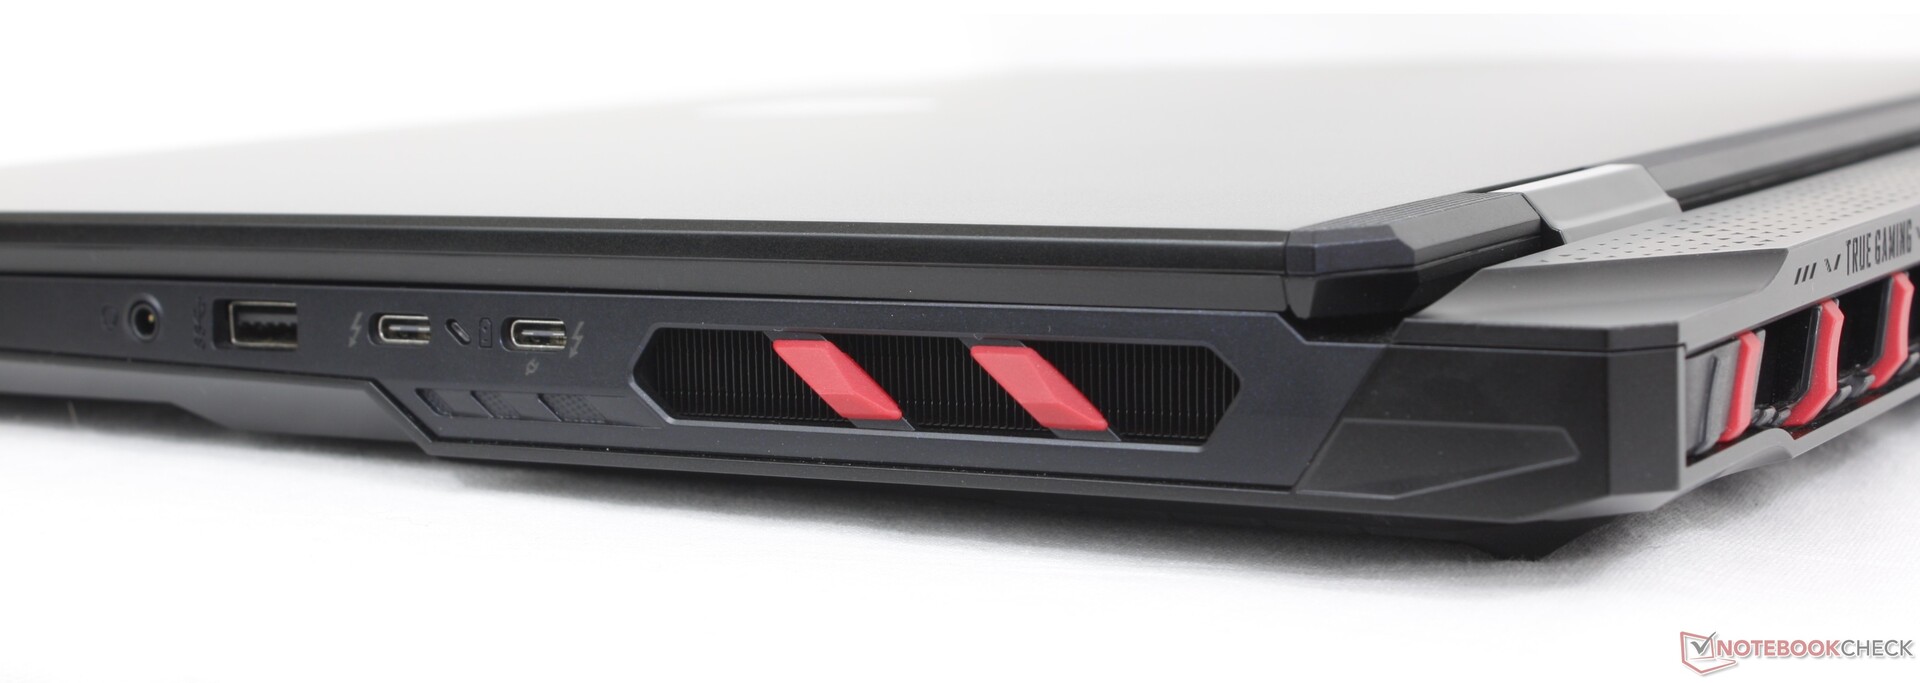
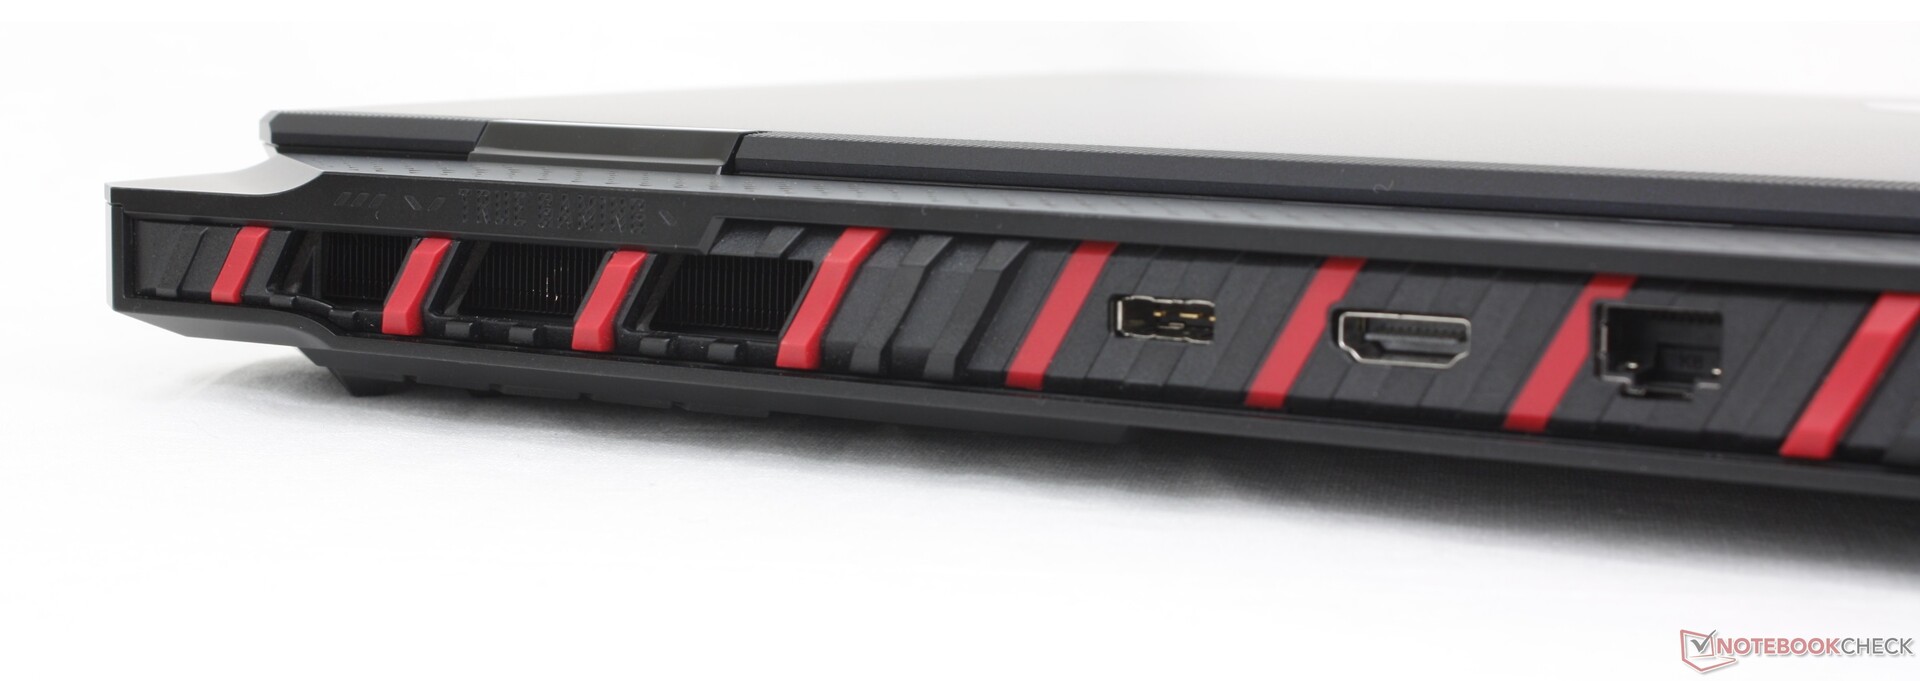
连接性
端口和位置与 Titan 18 HX 完全相同,这是该机箱内部的一大亮点。集成选项与 刀锋 18或 ROG Strix G18 上的集成选项类似,但排列方式截然不同。
请记住,两个 USB-C 端口中只有一个支持 Power Delivery。除此之外,这两个端口都兼容 DisplayPort。

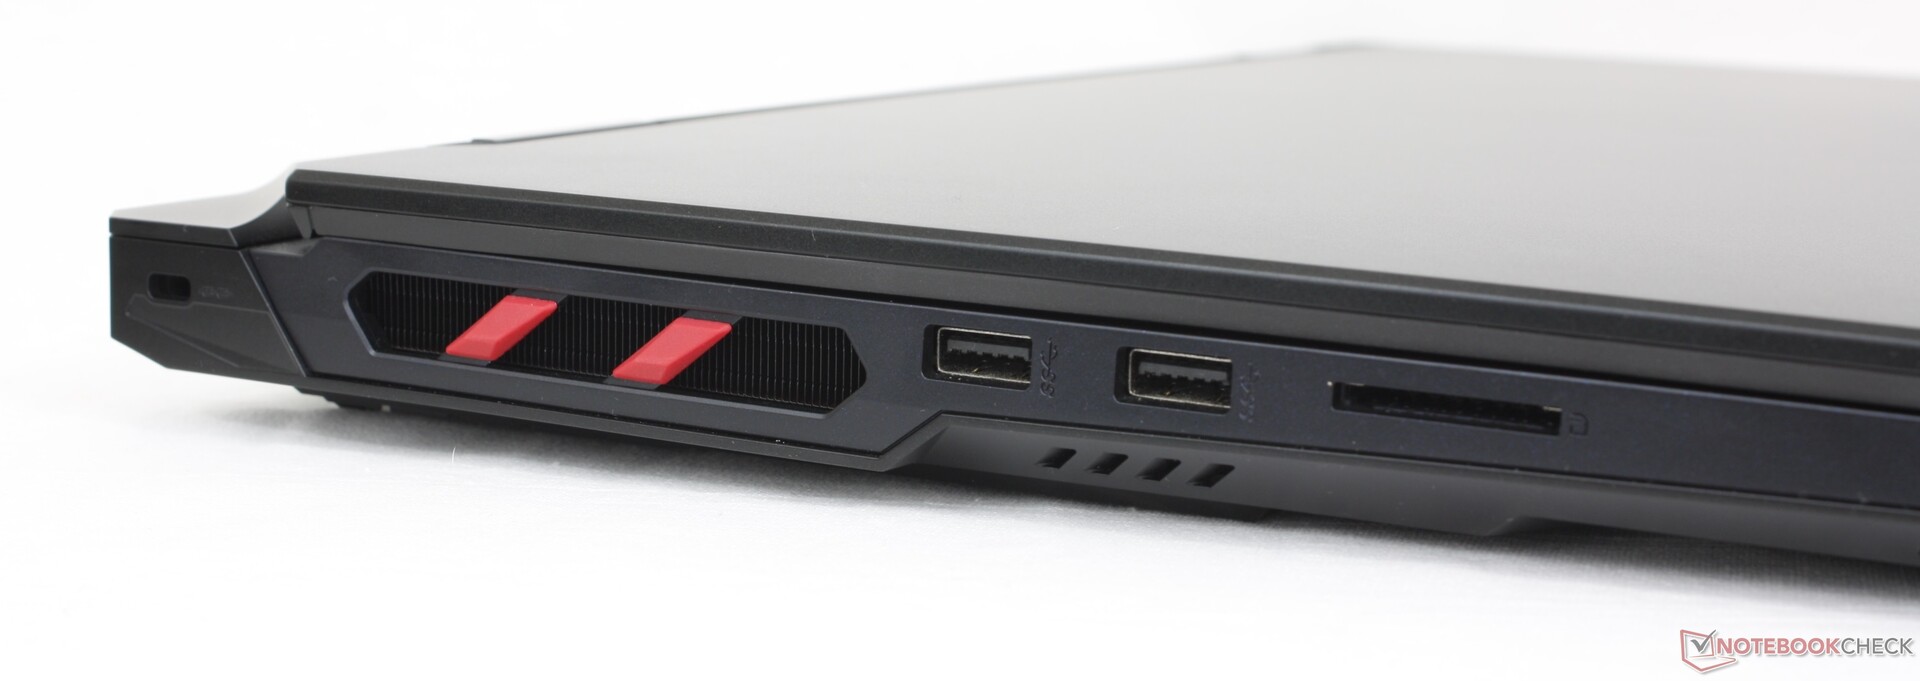
SD 读卡器
集成式 SD 读卡器的速度约为 90 MB/s,还算不错,但相对于 Raider 18 HX 的高价而言,速度还是比较慢。Razer Blade 18 或 Alienware m18 R2等设备上的 SD 读卡器相比,速度快了两倍多。
| SD Card Reader | |
| average JPG Copy Test (av. of 3 runs) | |
| Alienware m18 R2 (Toshiba Exceria Pro SDXC 64 GB UHS-II) | |
| Razer Blade 18 2024 RZ09-0509 (Toshiba Exceria Pro SDXC 64 GB UHS-II) | |
| Acer Predator Helios 18 PH18-72-98MW (AV PRO microSD 128 GB V60) | |
| MSI Raider 18 HX A14V (Toshiba Exceria Pro SDXC 64 GB UHS-II) | |
| MSI Titan 18 HX A14VIG (Toshiba Exceria Pro SDXC 64 GB UHS-II) | |
| maximum AS SSD Seq Read Test (1GB) | |
| Razer Blade 18 2024 RZ09-0509 (Toshiba Exceria Pro SDXC 64 GB UHS-II) | |
| Alienware m18 R2 (Toshiba Exceria Pro SDXC 64 GB UHS-II) | |
| MSI Titan 18 HX A14VIG (Toshiba Exceria Pro SDXC 64 GB UHS-II) | |
| MSI Raider 18 HX A14V (Toshiba Exceria Pro SDXC 64 GB UHS-II) | |
| Acer Predator Helios 18 PH18-72-98MW (AV PRO microSD 128 GB V60) | |
交流
Killer BE1750x 标配 Wi-Fi 7 和蓝牙 5.4 连接。与我们的 Wi-Fi 6E 测试路由器配对时,传输速率稳定可靠。
网络摄像头
与 Titan 18 HX 相似,该机标配了一个带红外和物理快门的 200 万像素网络摄像头。有趣的是,摄像头也会出现类似的亮度问题。


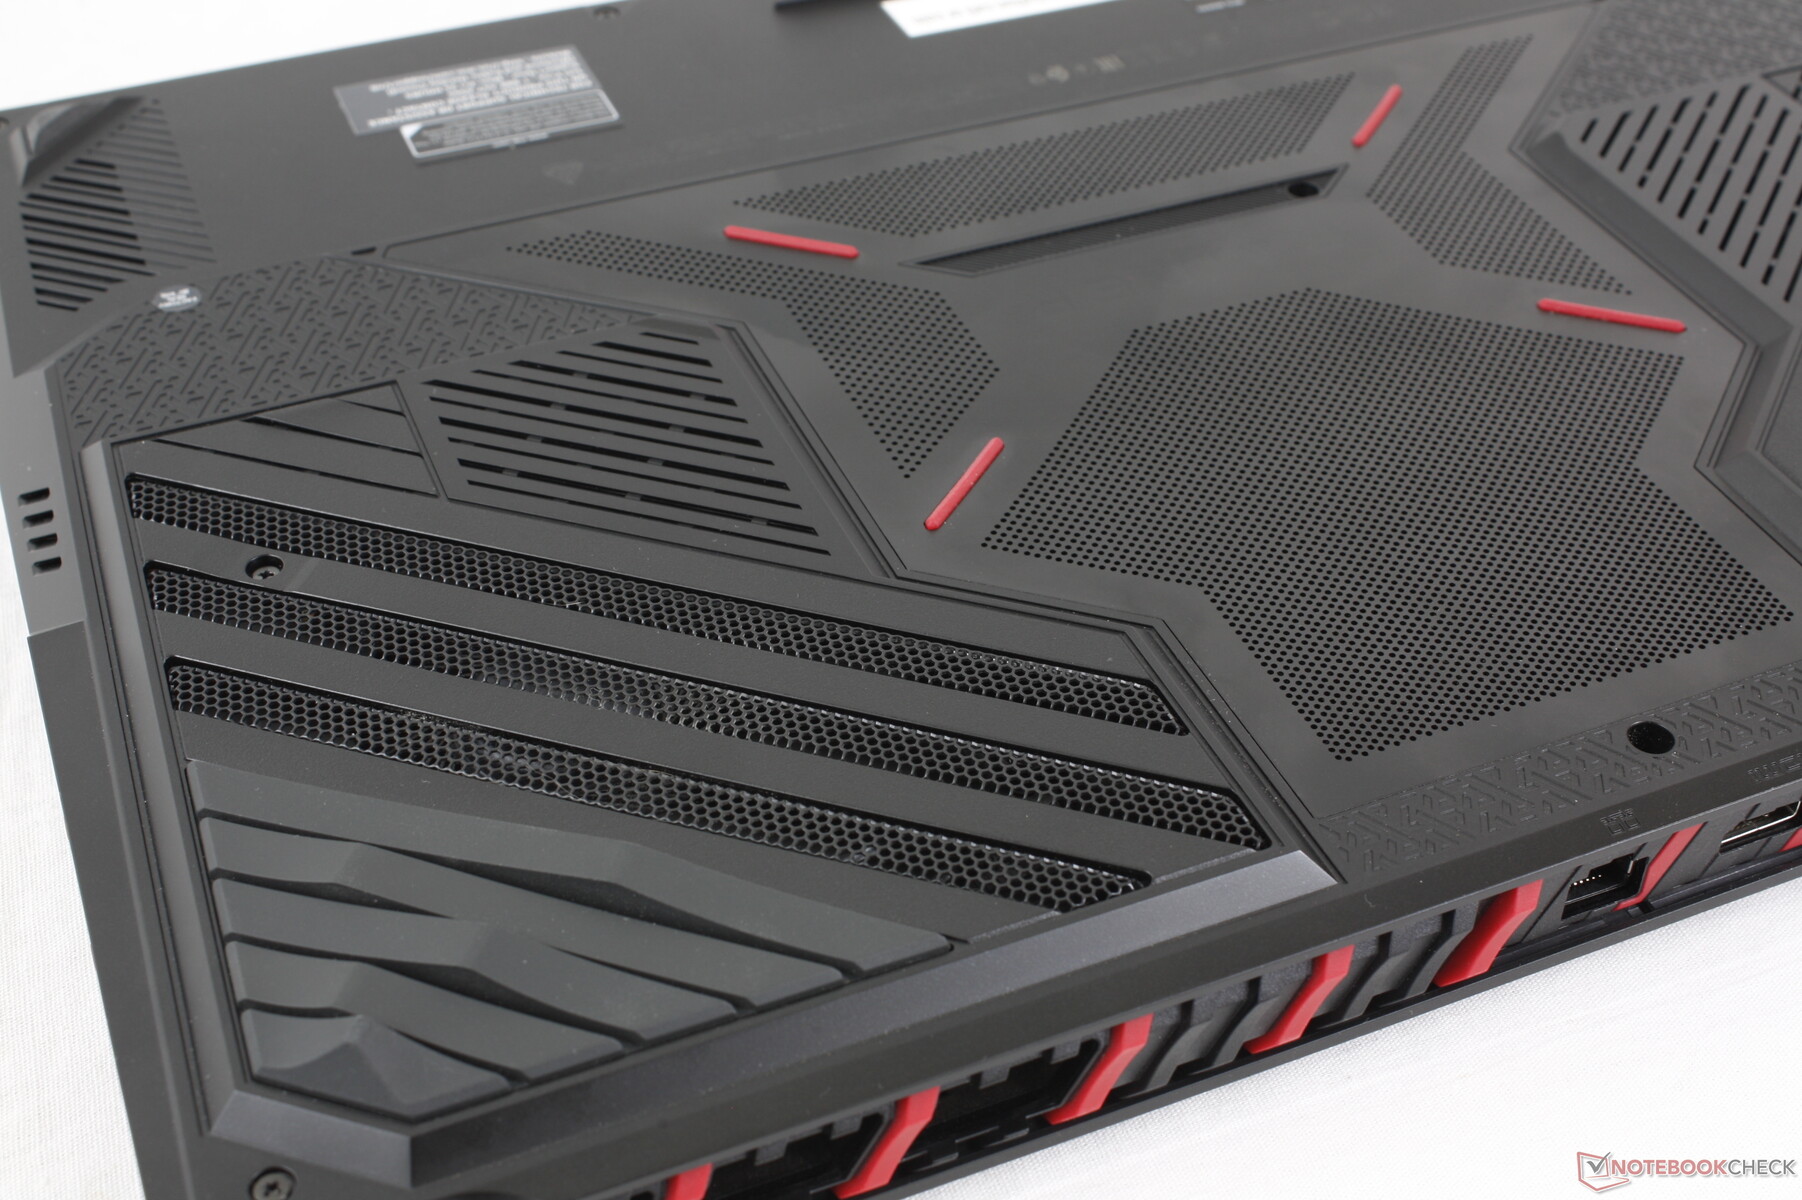
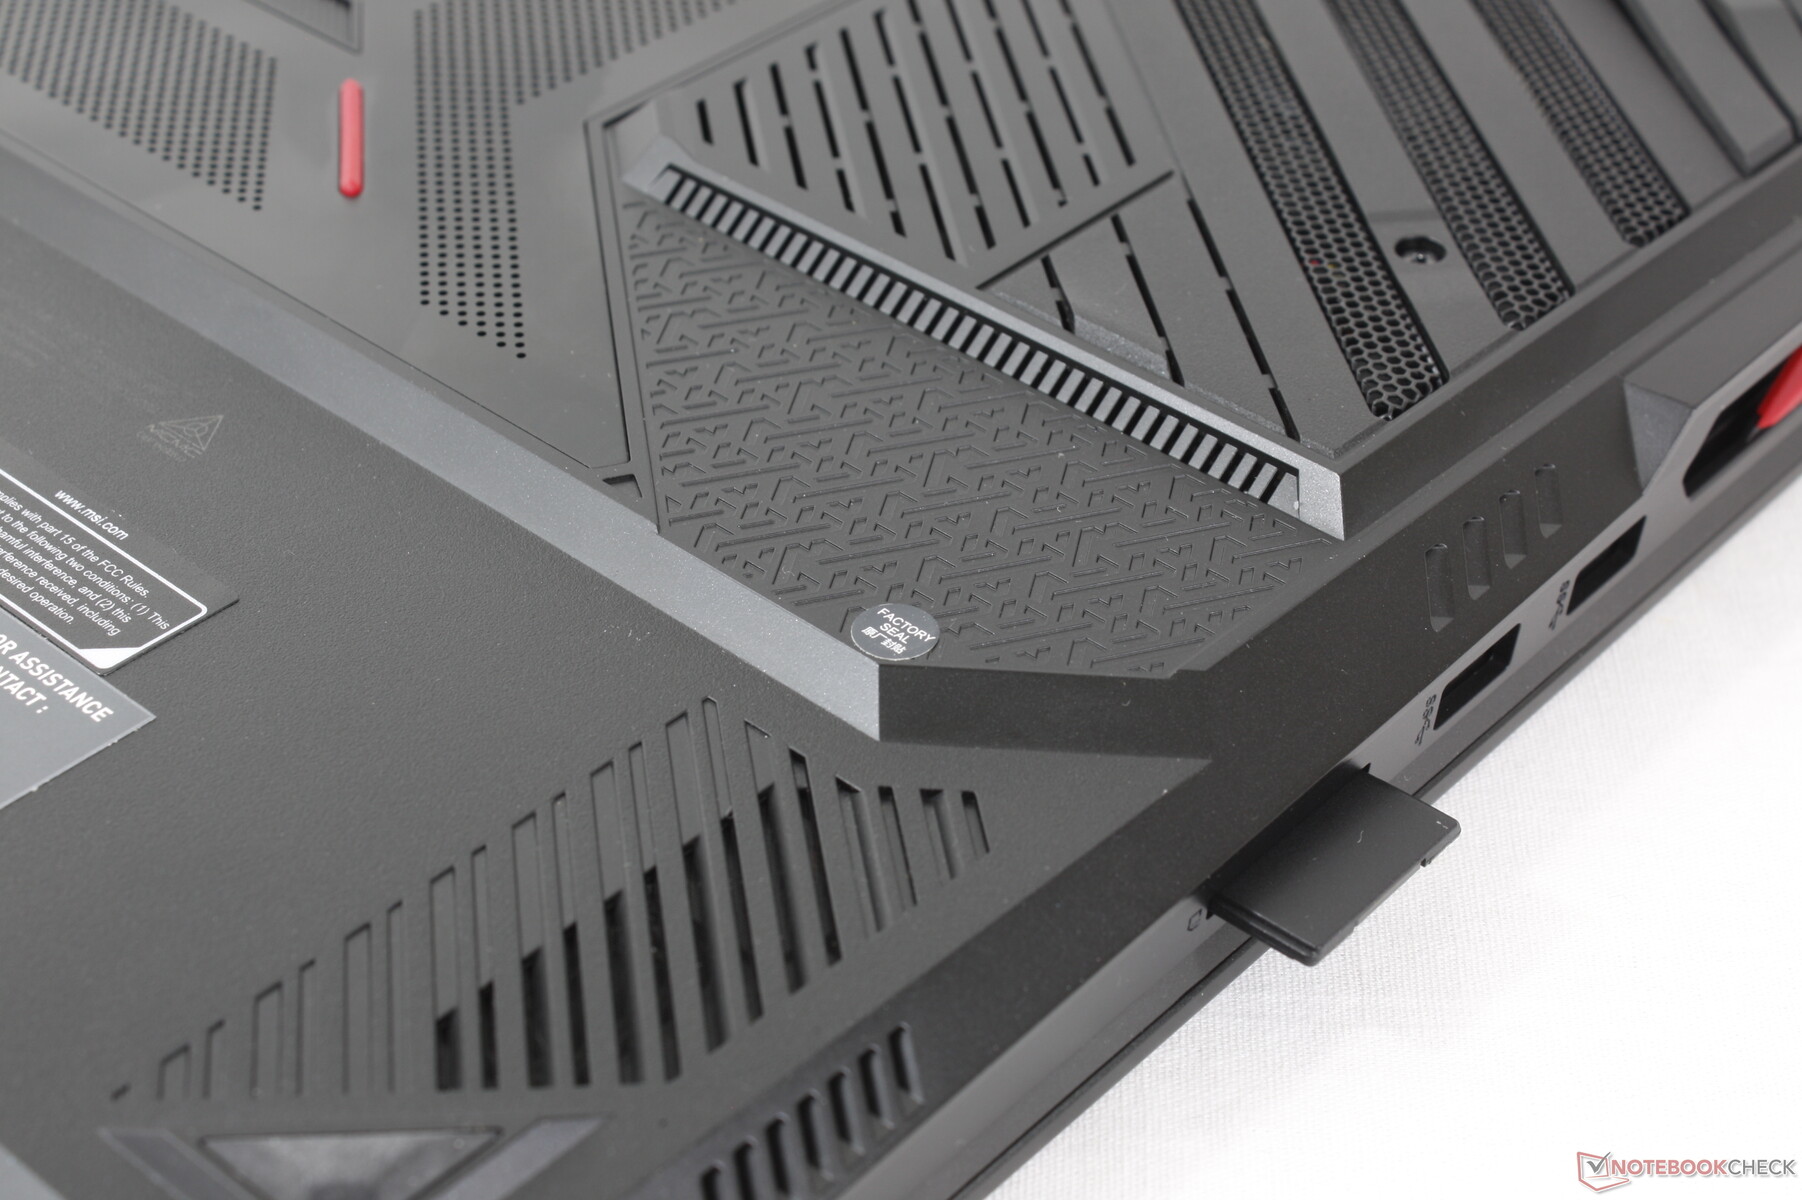
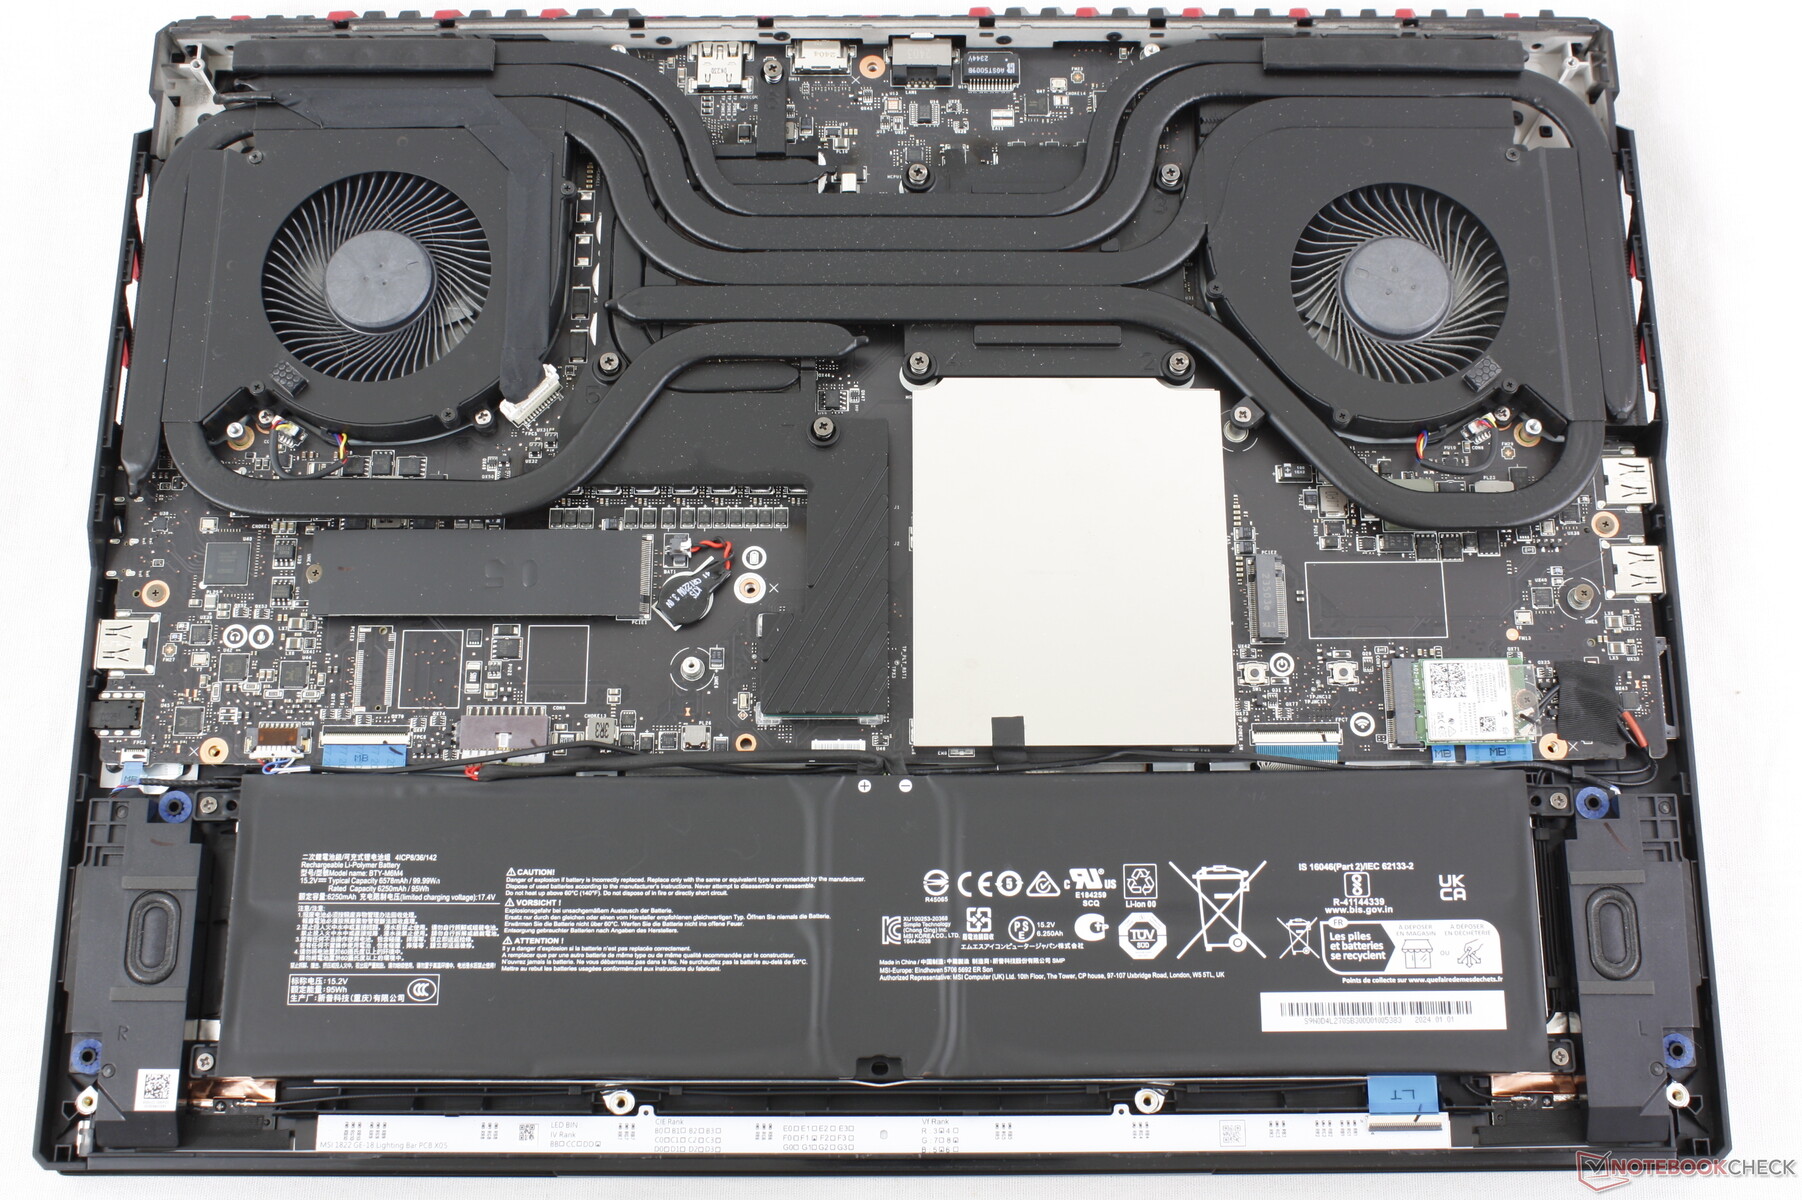
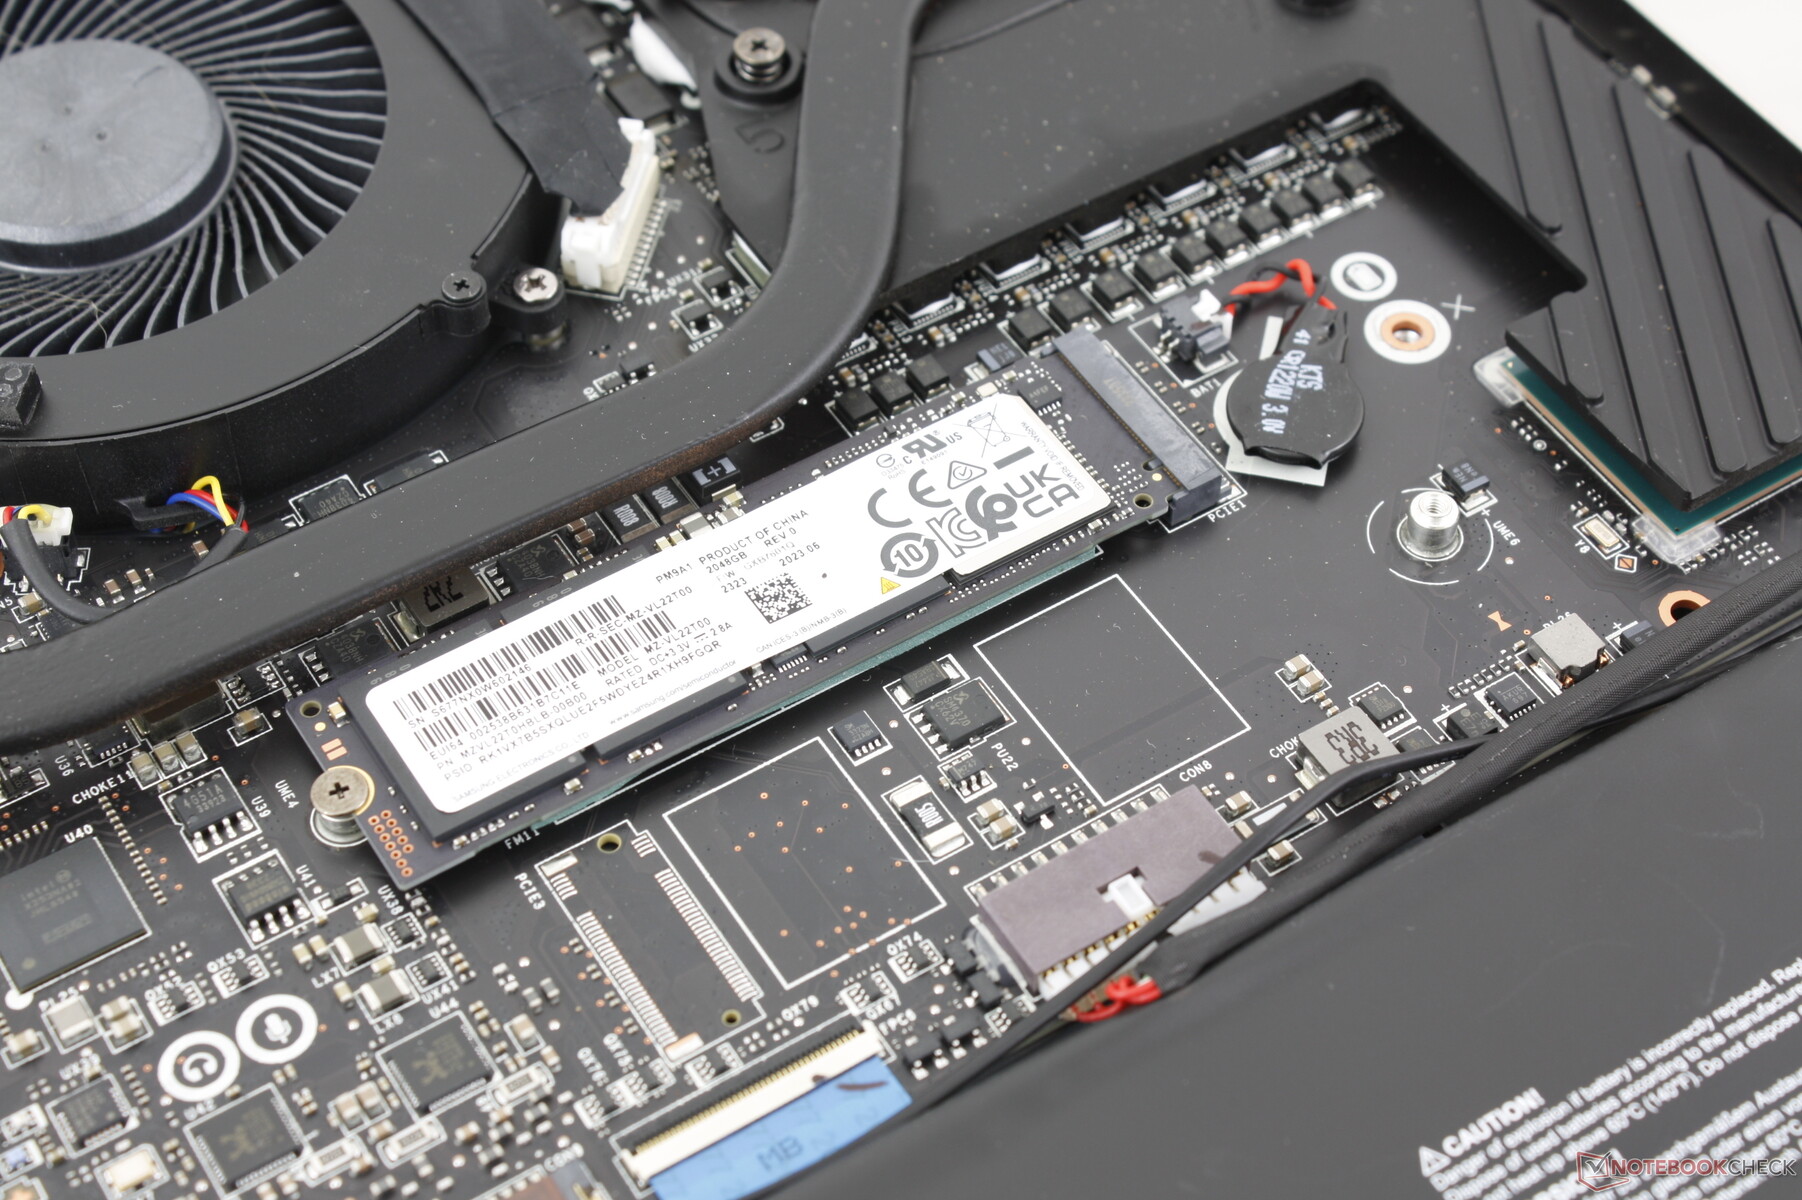
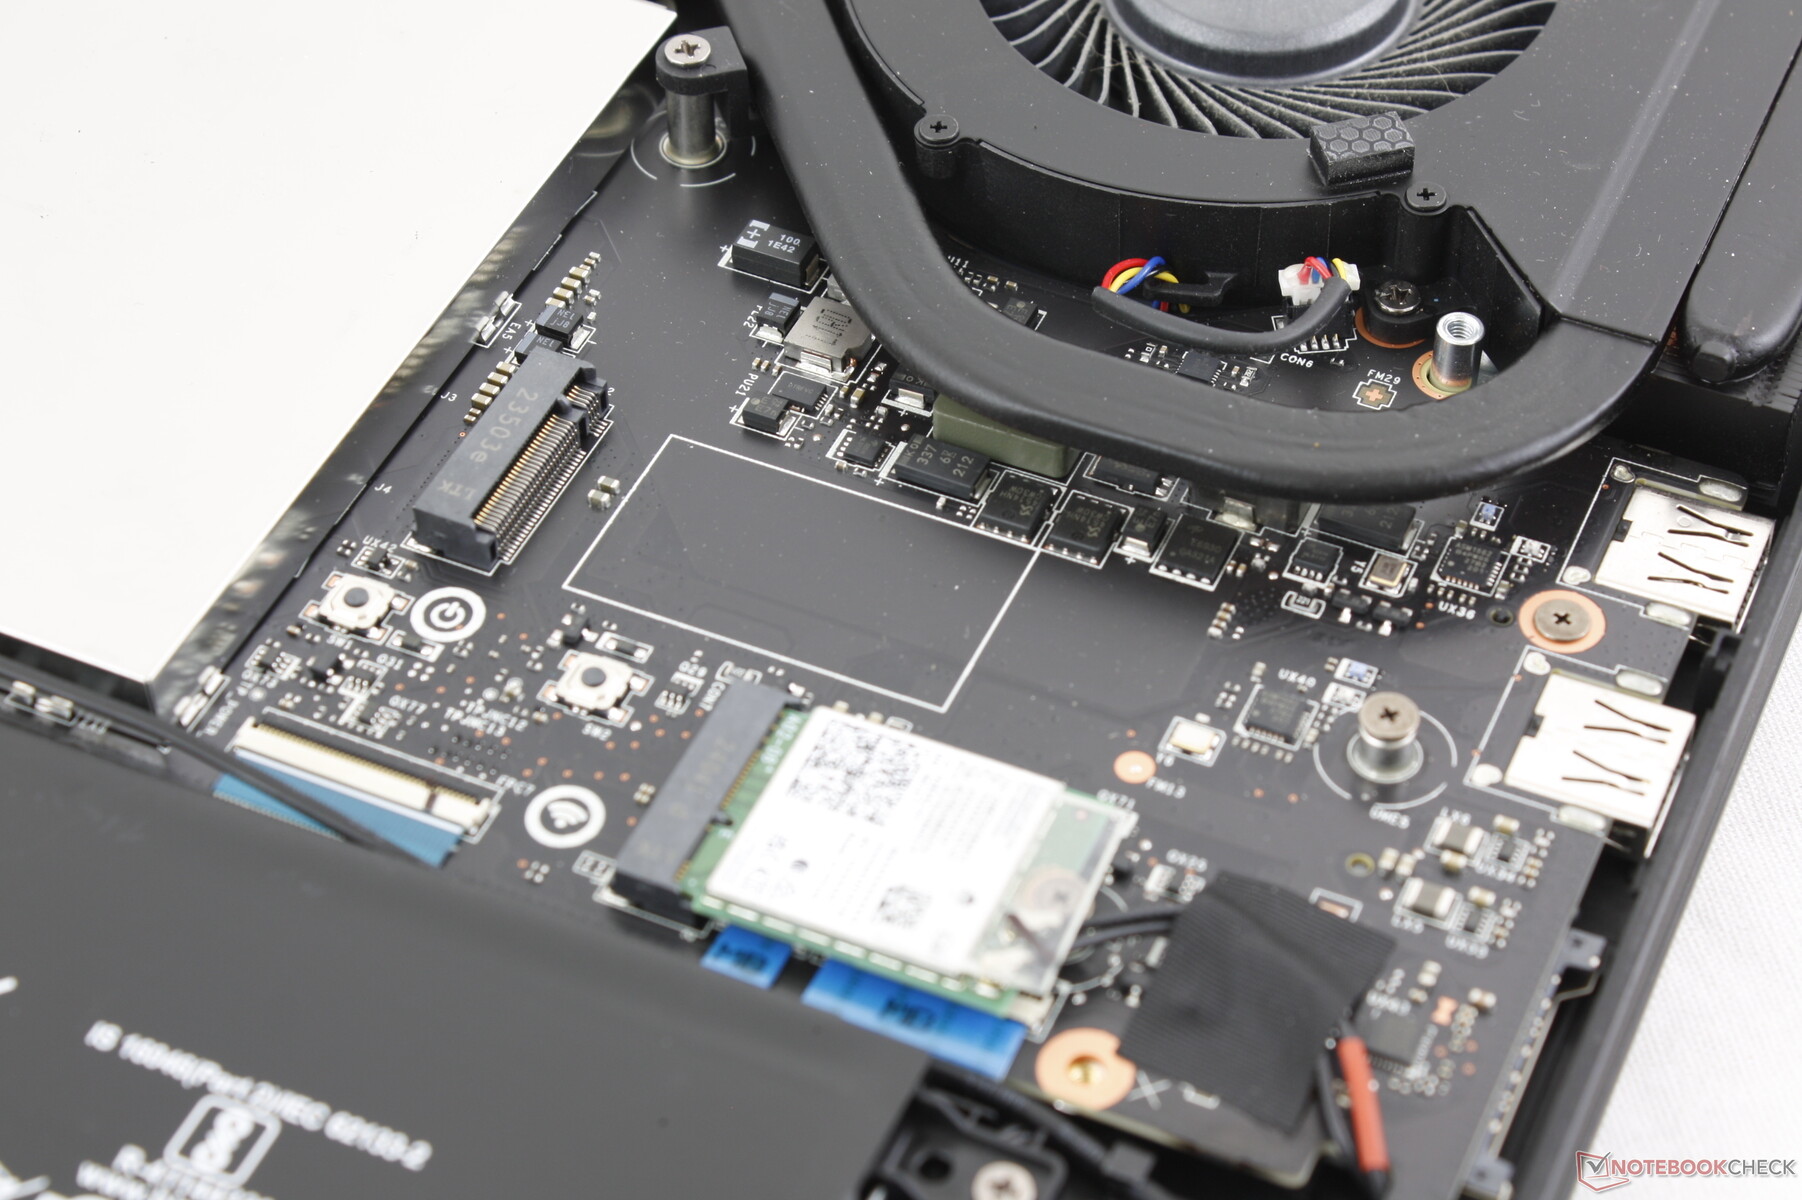
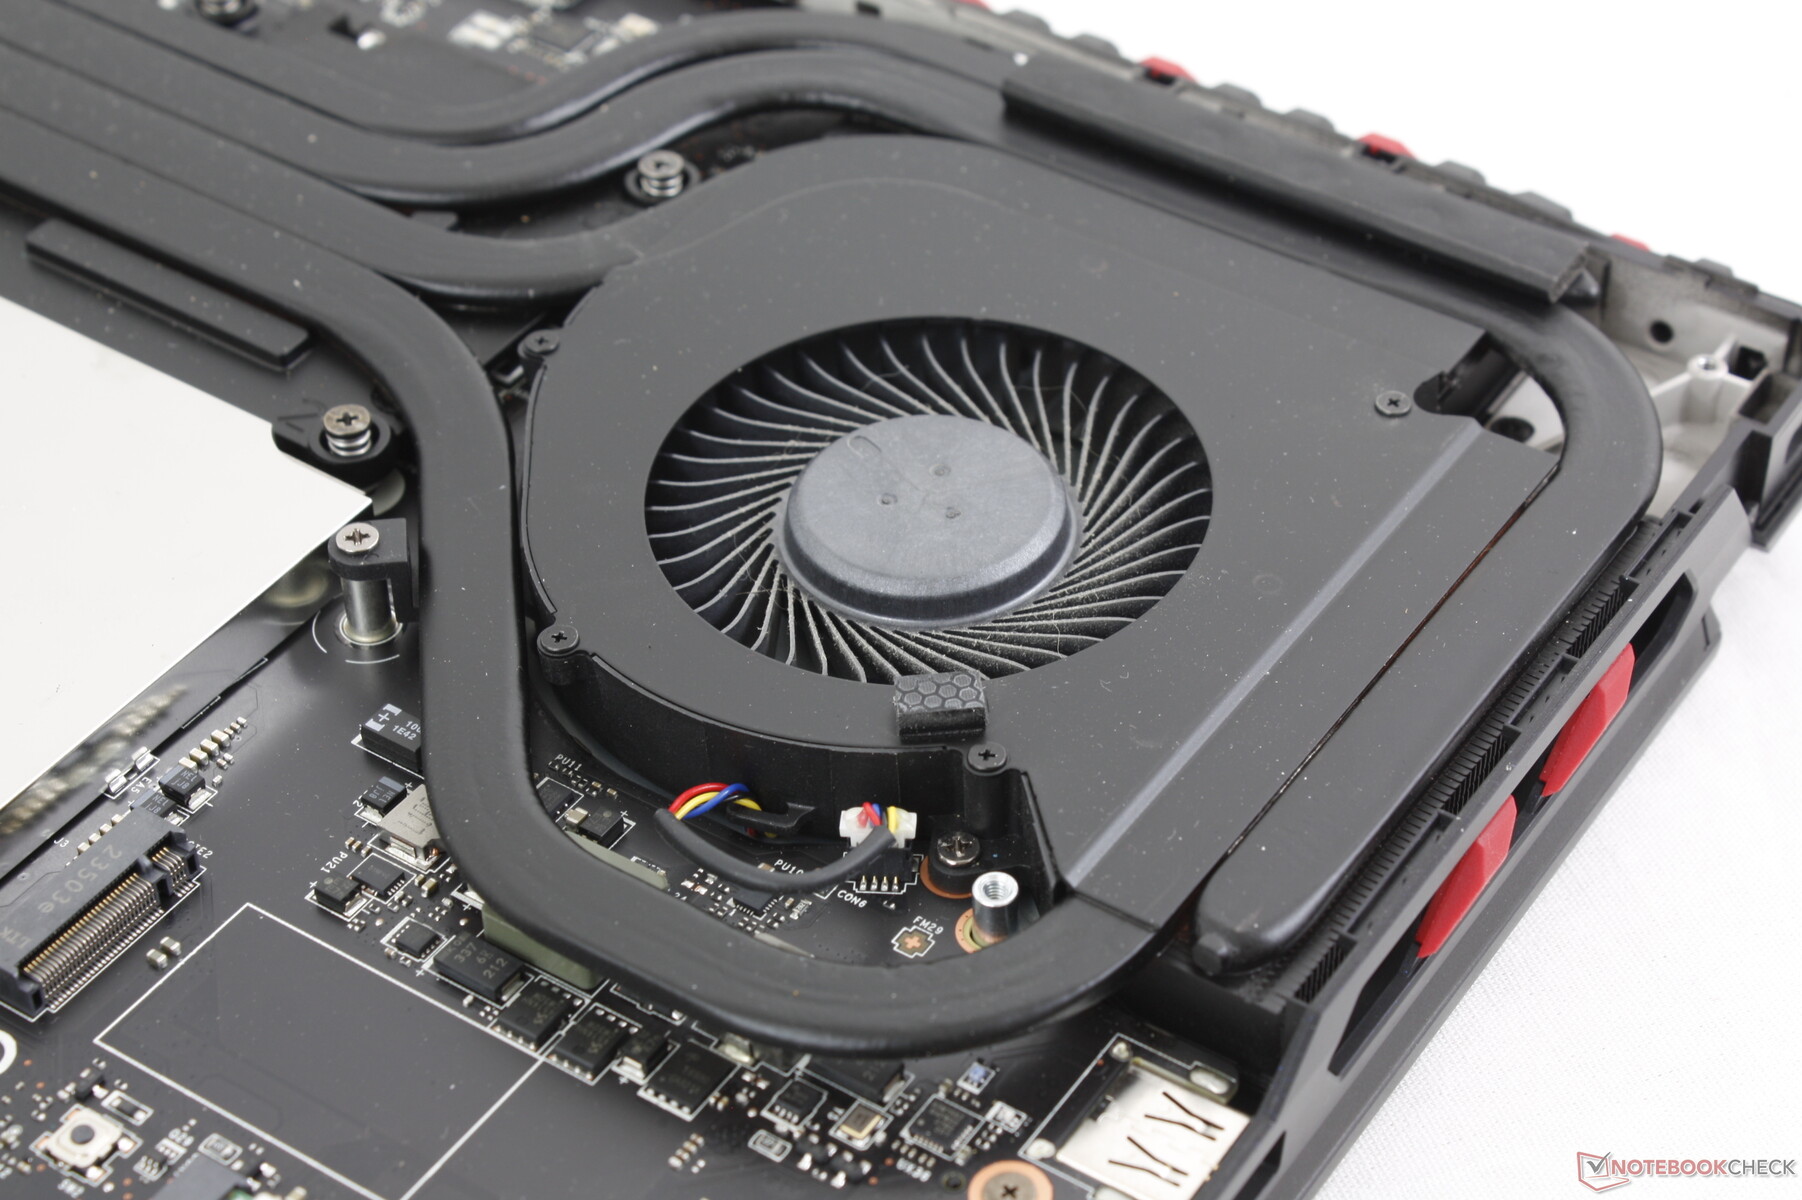
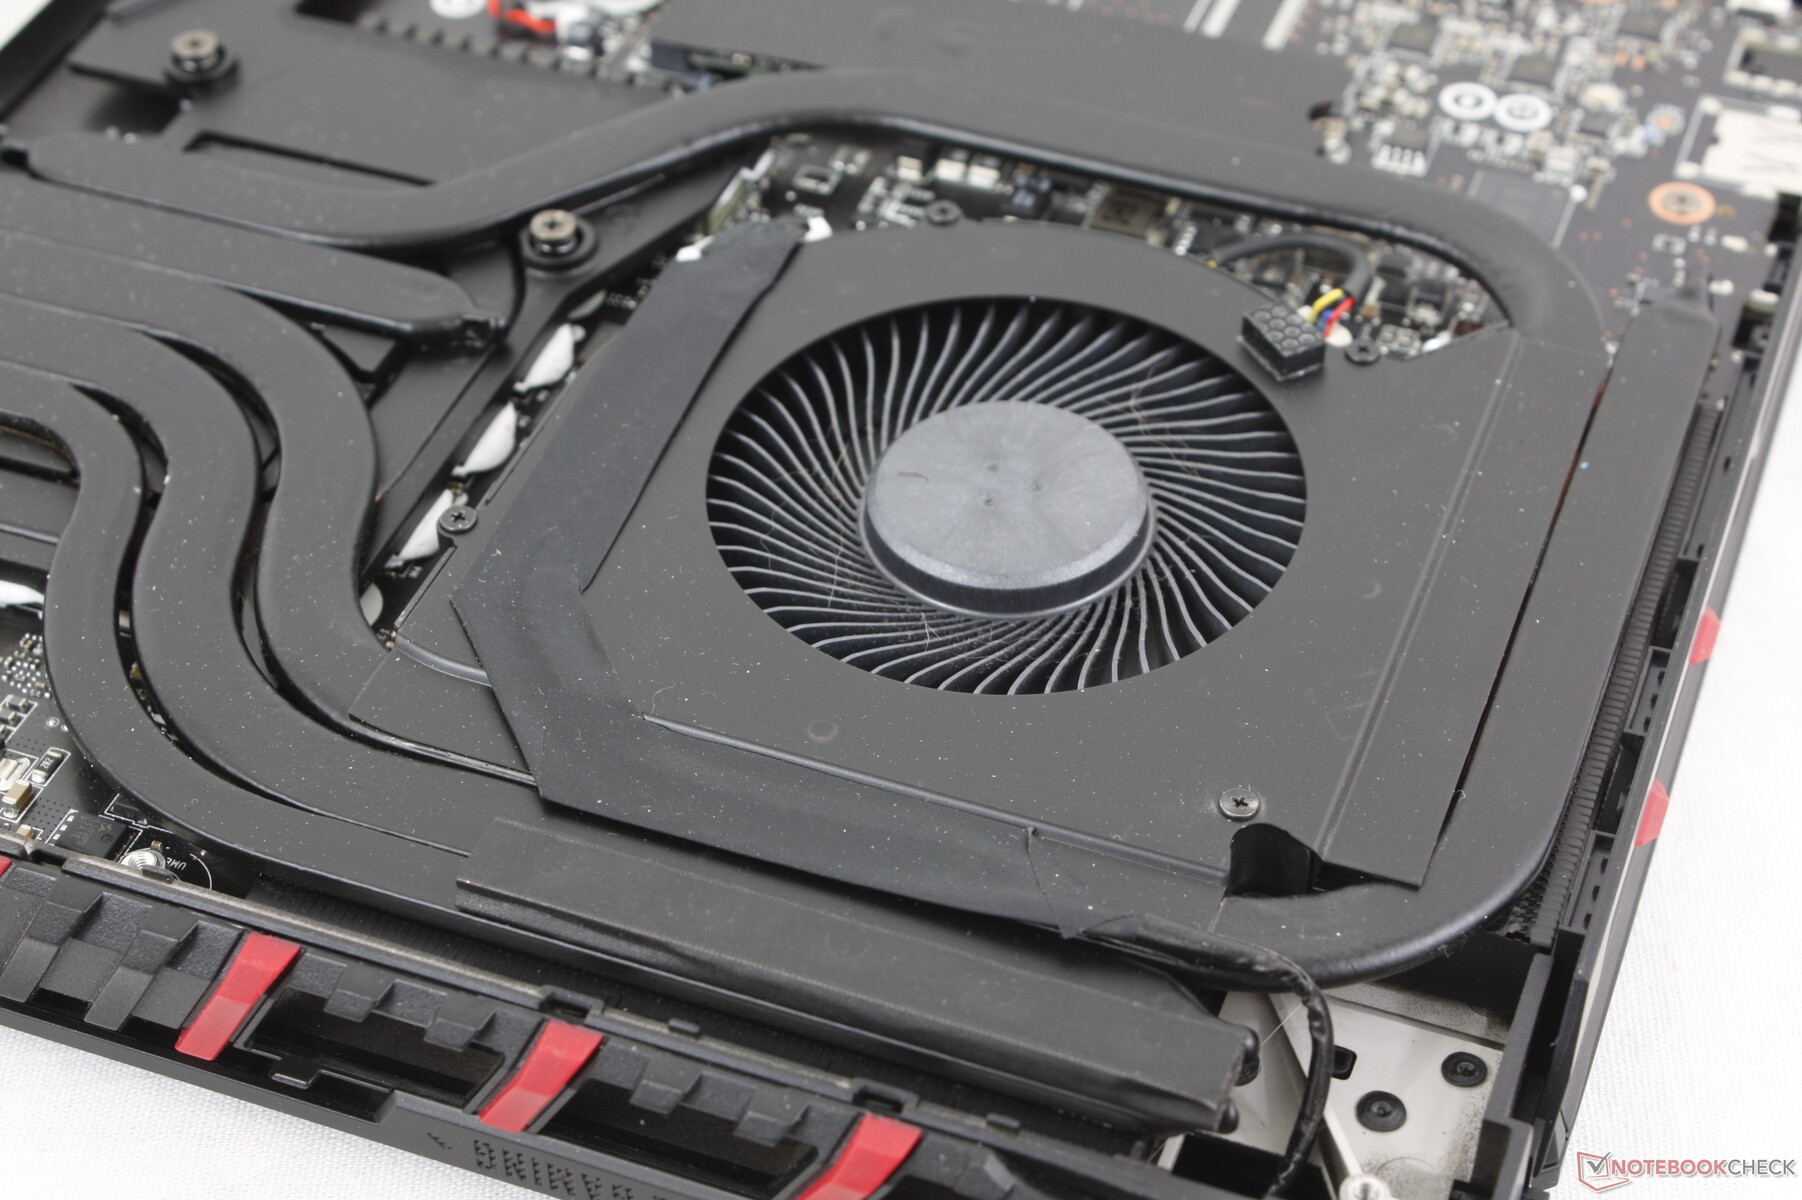
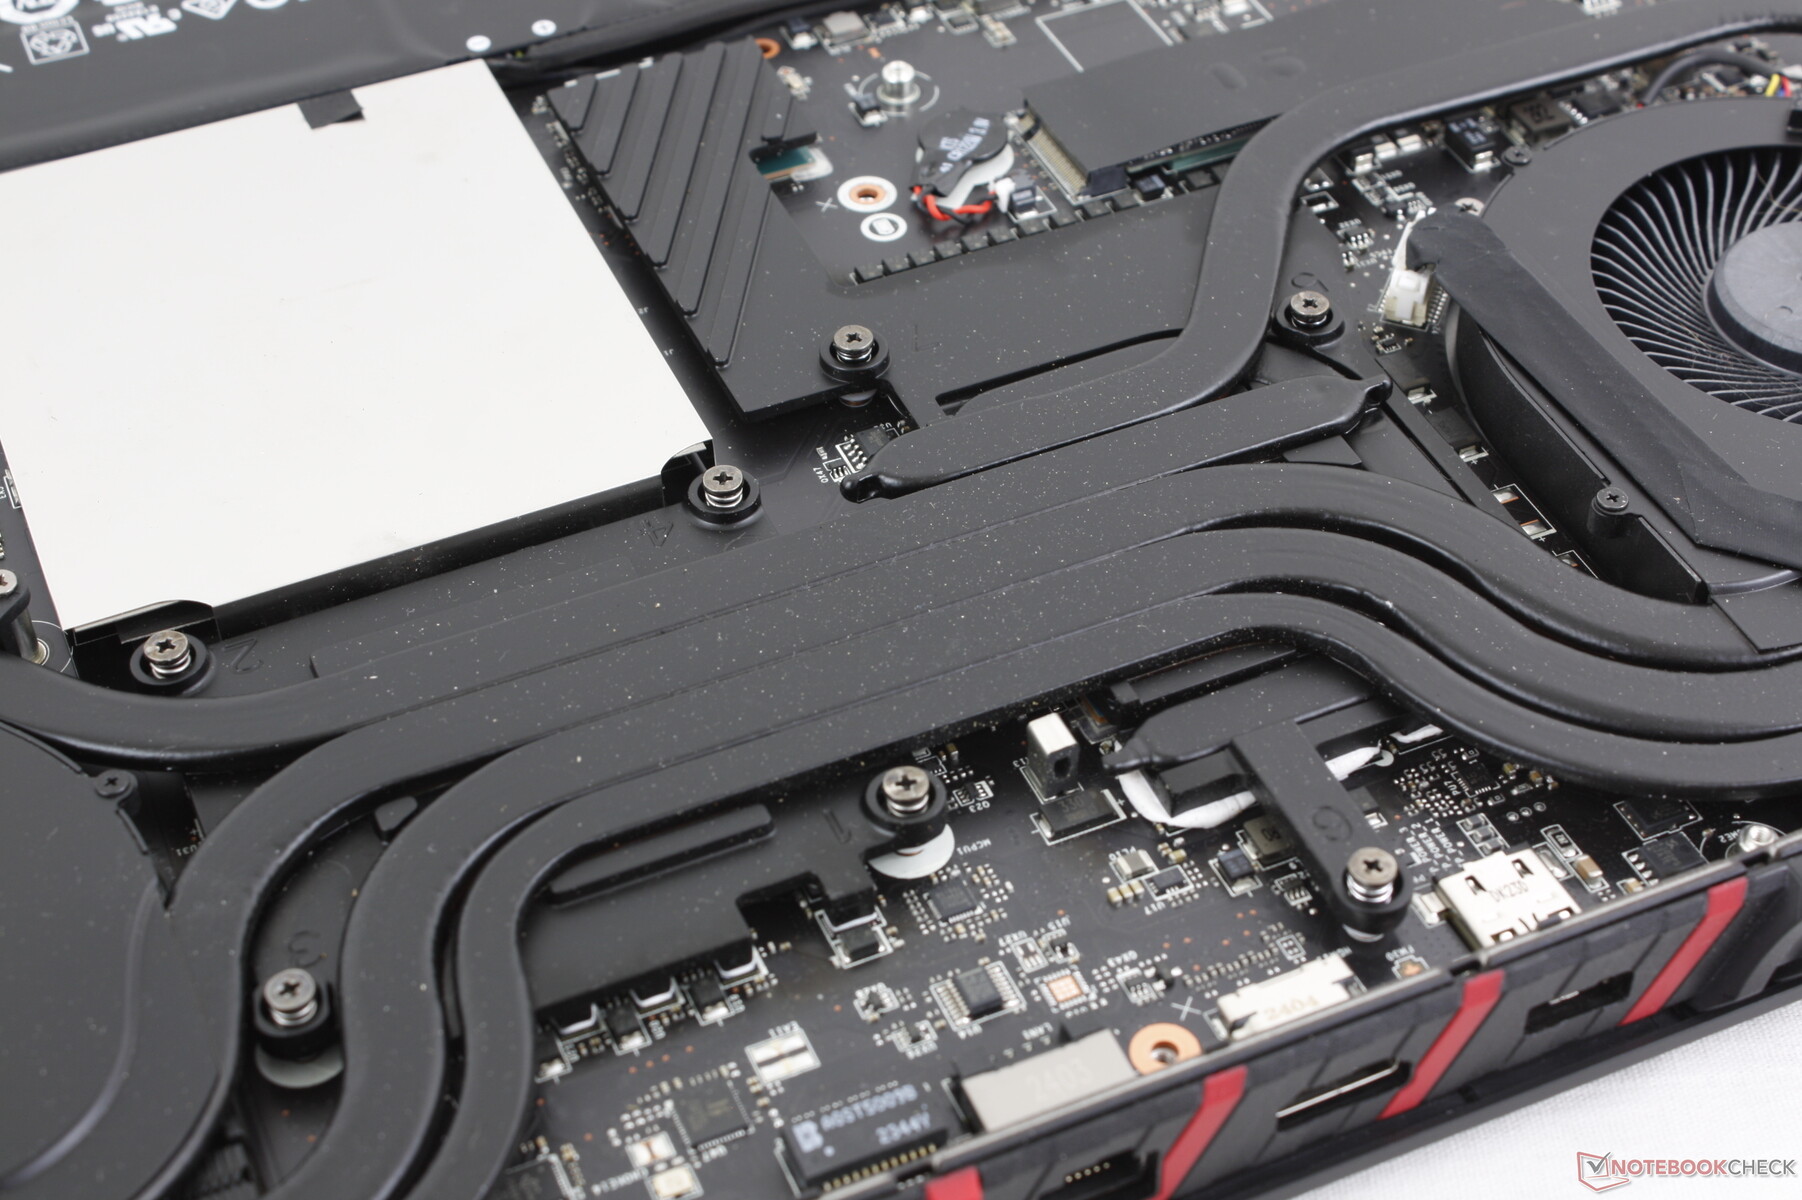
维护
底部面板由 12 颗十字螺丝固定,拆卸相对容易。不过,微星仍然是少数几家用防篡改贴纸覆盖其中一颗螺丝的厂商之一,即使是简单的升级(如内存或存储),也必须拧开这颗螺丝。
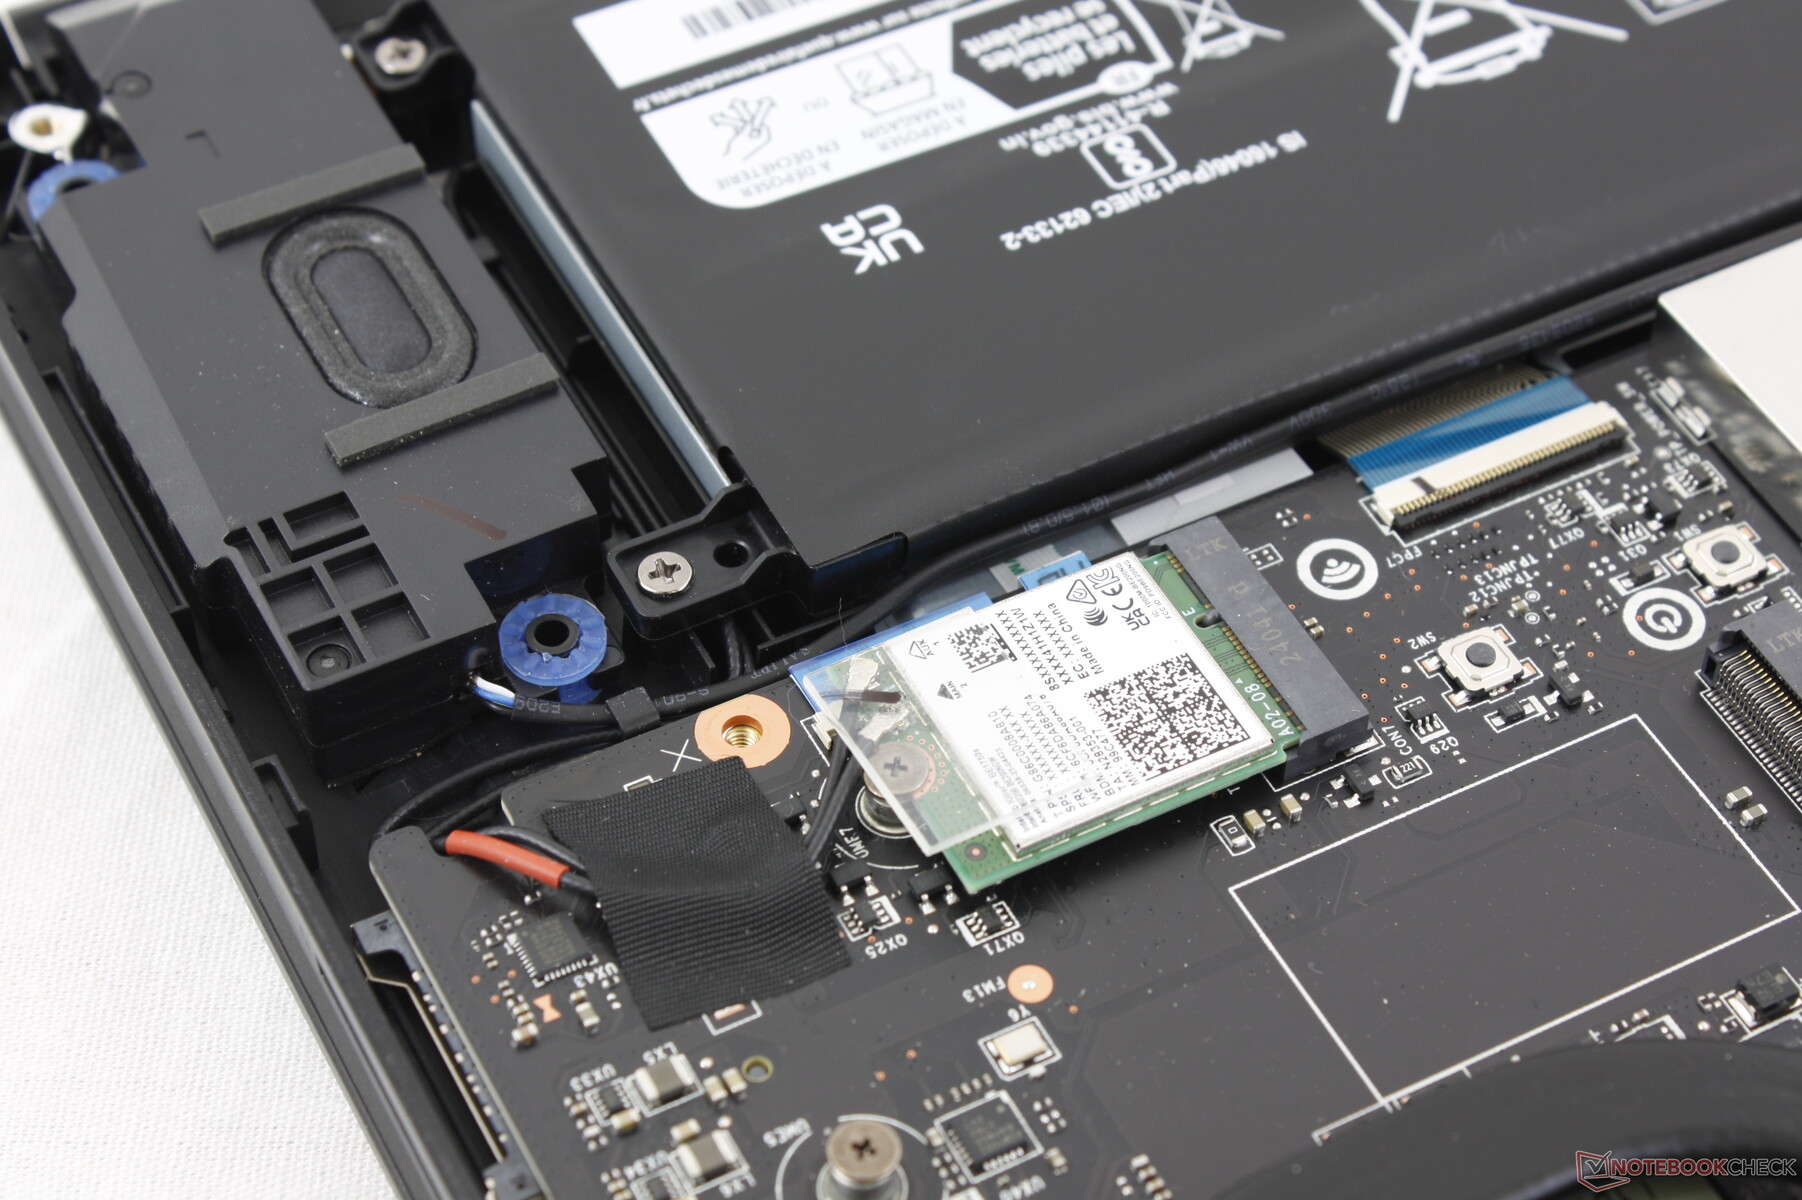
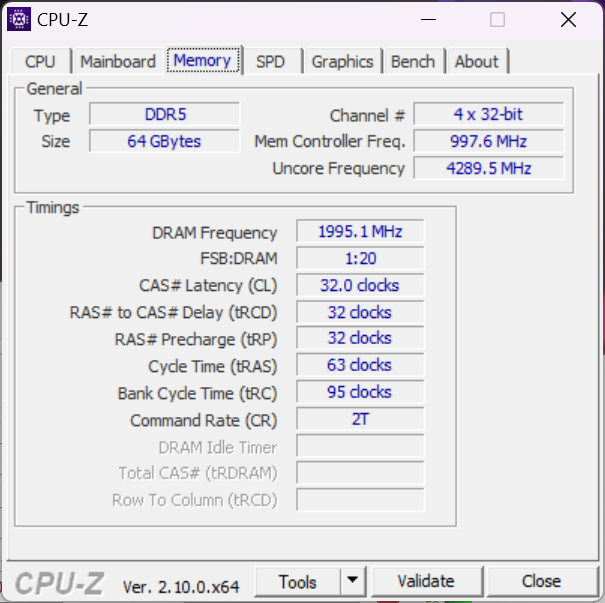
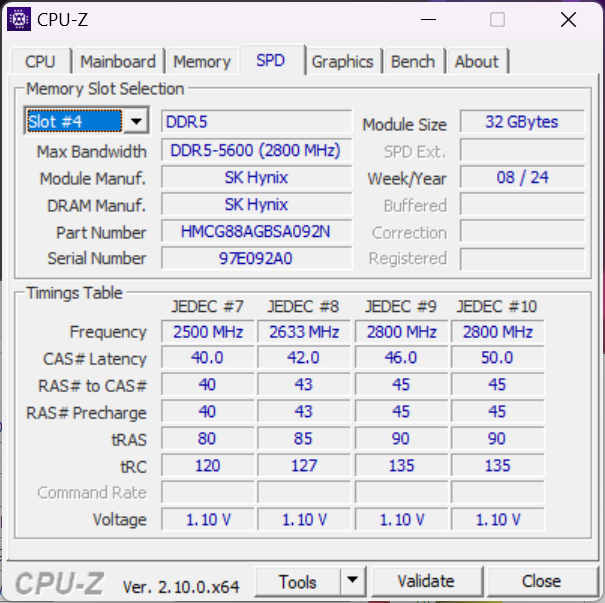
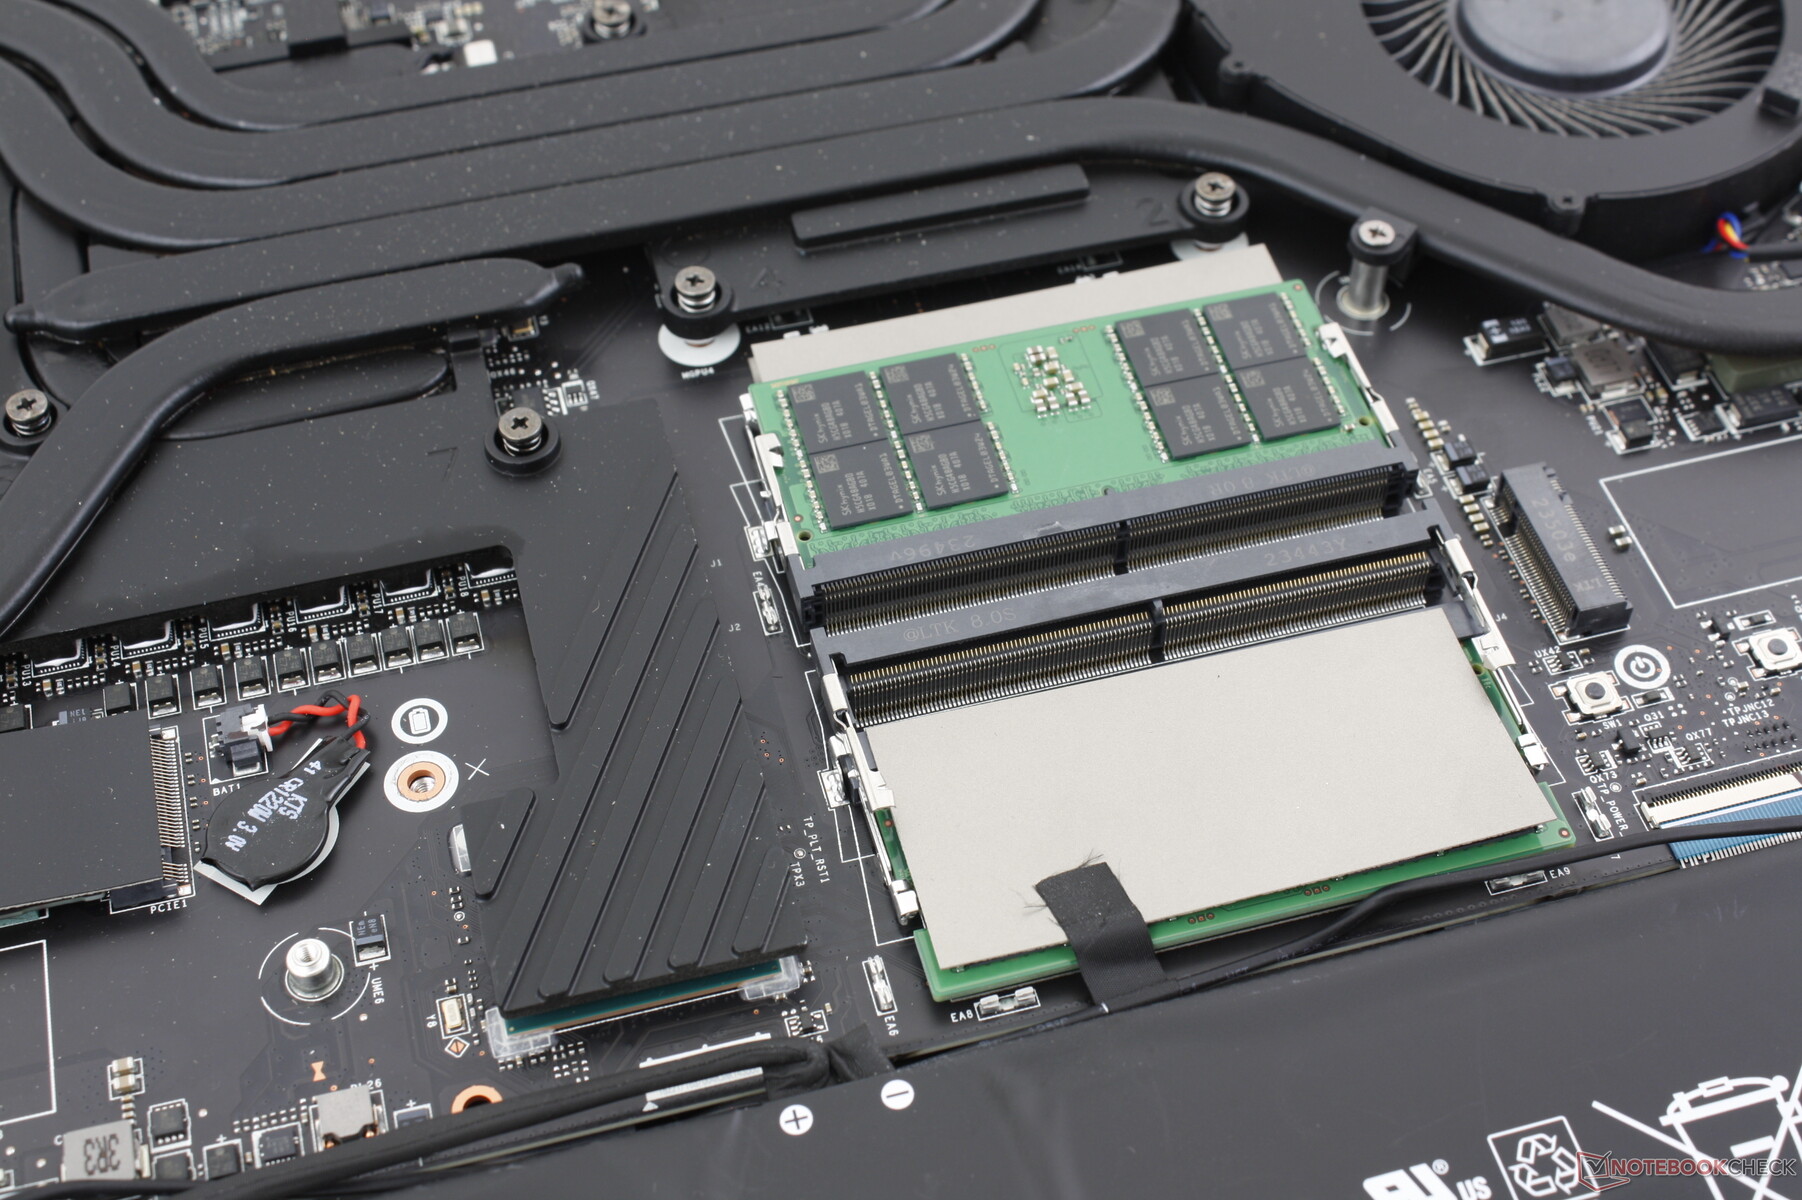
Raider 18 HX 与 Titan 18 HX 共享许多相同的内部组件。用户可以使用两个 M.2 2280 SSD 插槽和四个 DDR5 SODIMM 插槽。需要注意的是,该机型取消了第三个 M.2 SSD 插槽;用户必须升级到 Titan 18 HX 才能获得此功能。

可持续性
包装完全可回收,几乎全是纸板,只有用户手册有一点塑料包装。不过,目前还没有关于该系统在生产过程中使用任何可回收材料的信息。
配件和保修
包装盒内除了交流适配器和文件外没有其他附件。早期的 Raider 型号在发货时会附带一块天鹅绒清洁布,但现在似乎不再附带了。
如果在美国购买,制造商通常提供一年有限保修。
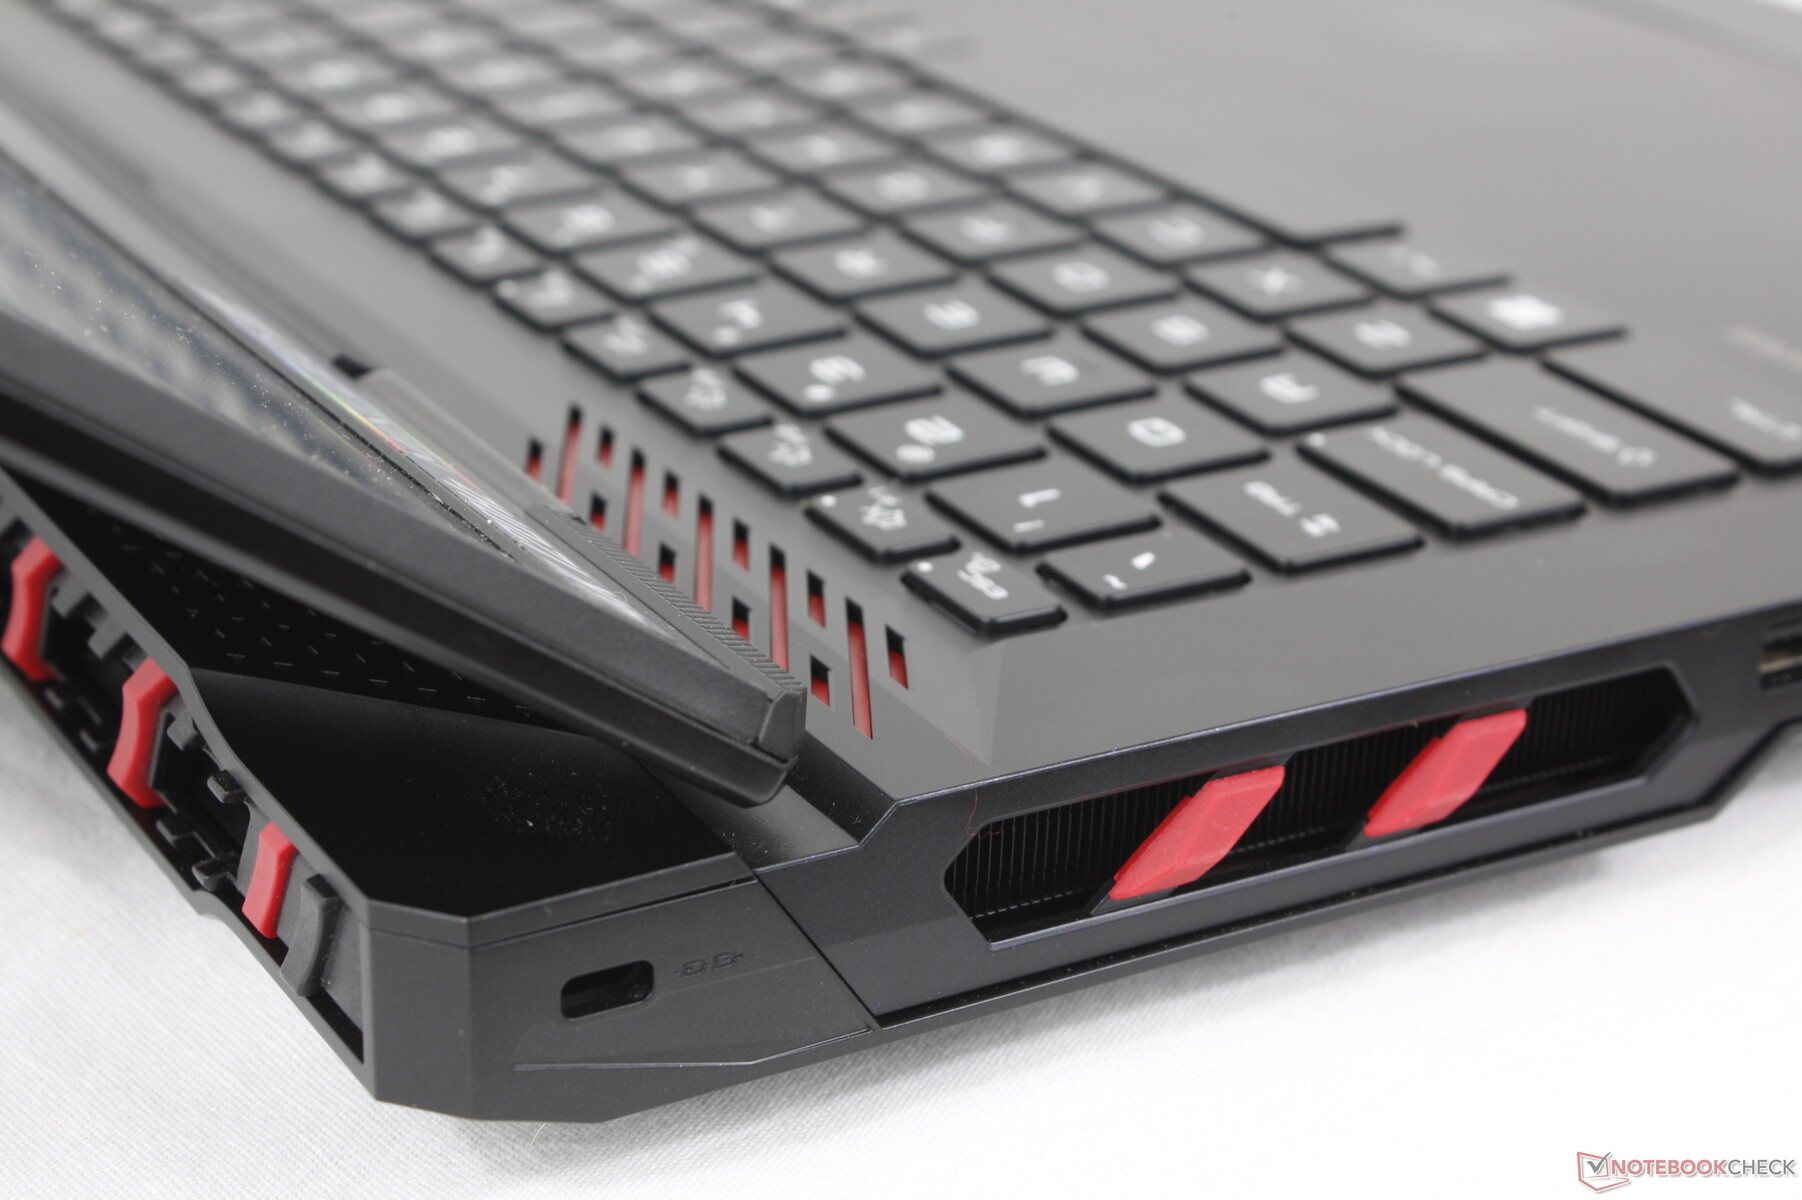
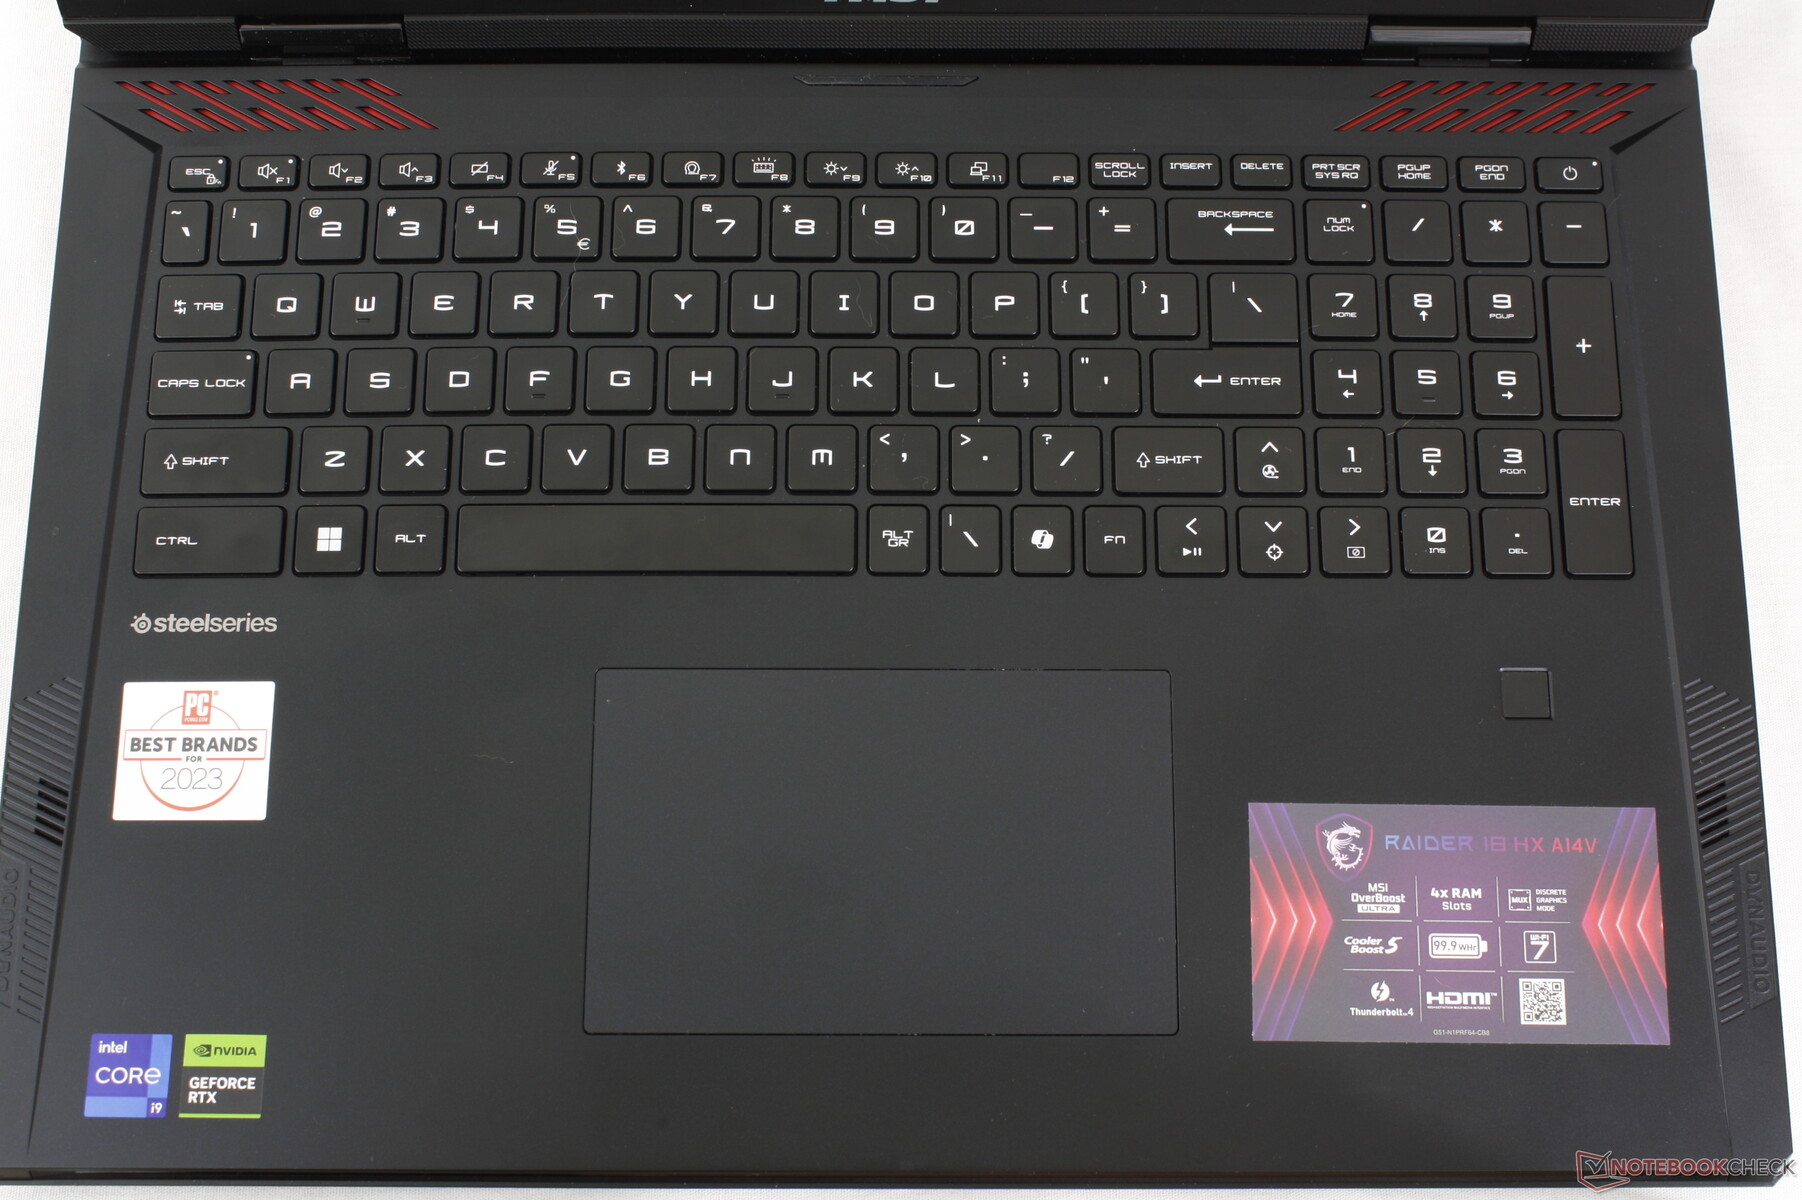
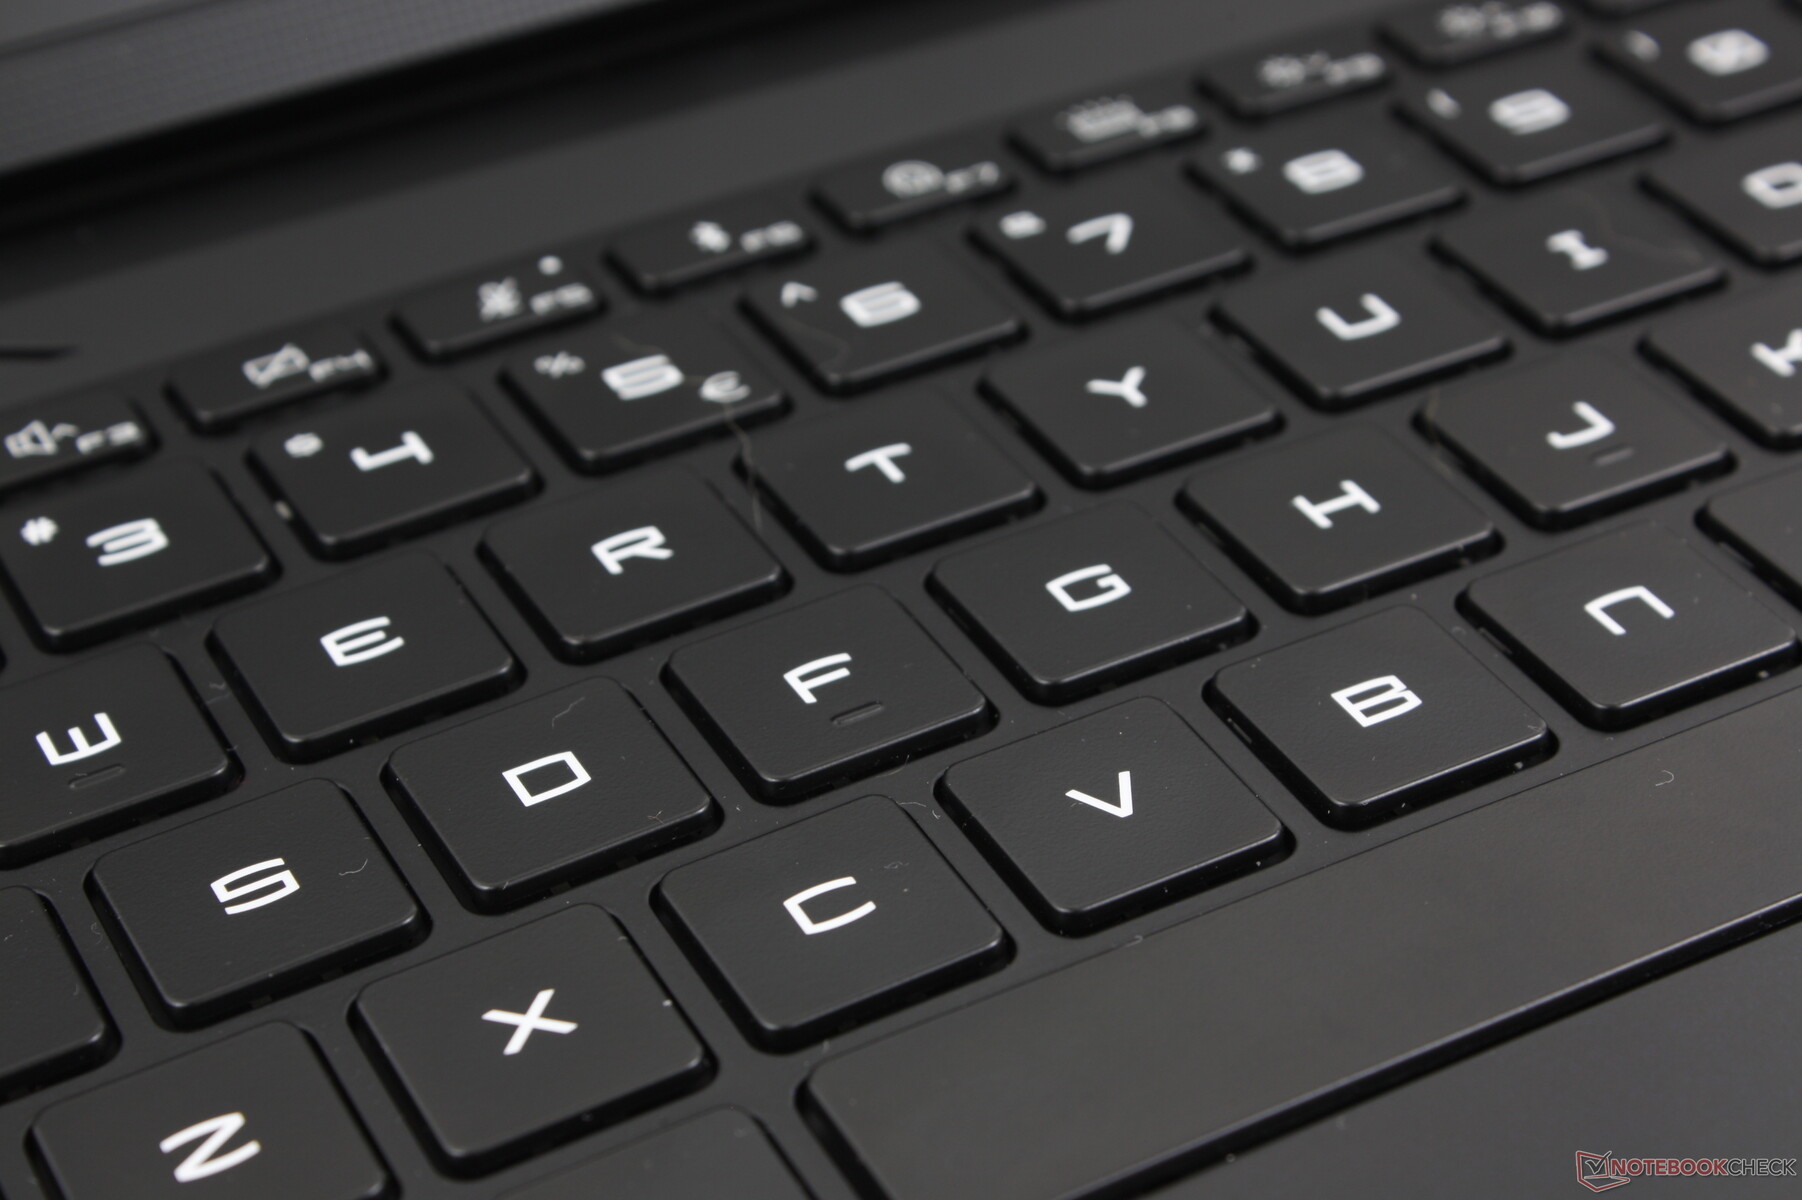
输入设备--熟悉胜过花哨
键盘
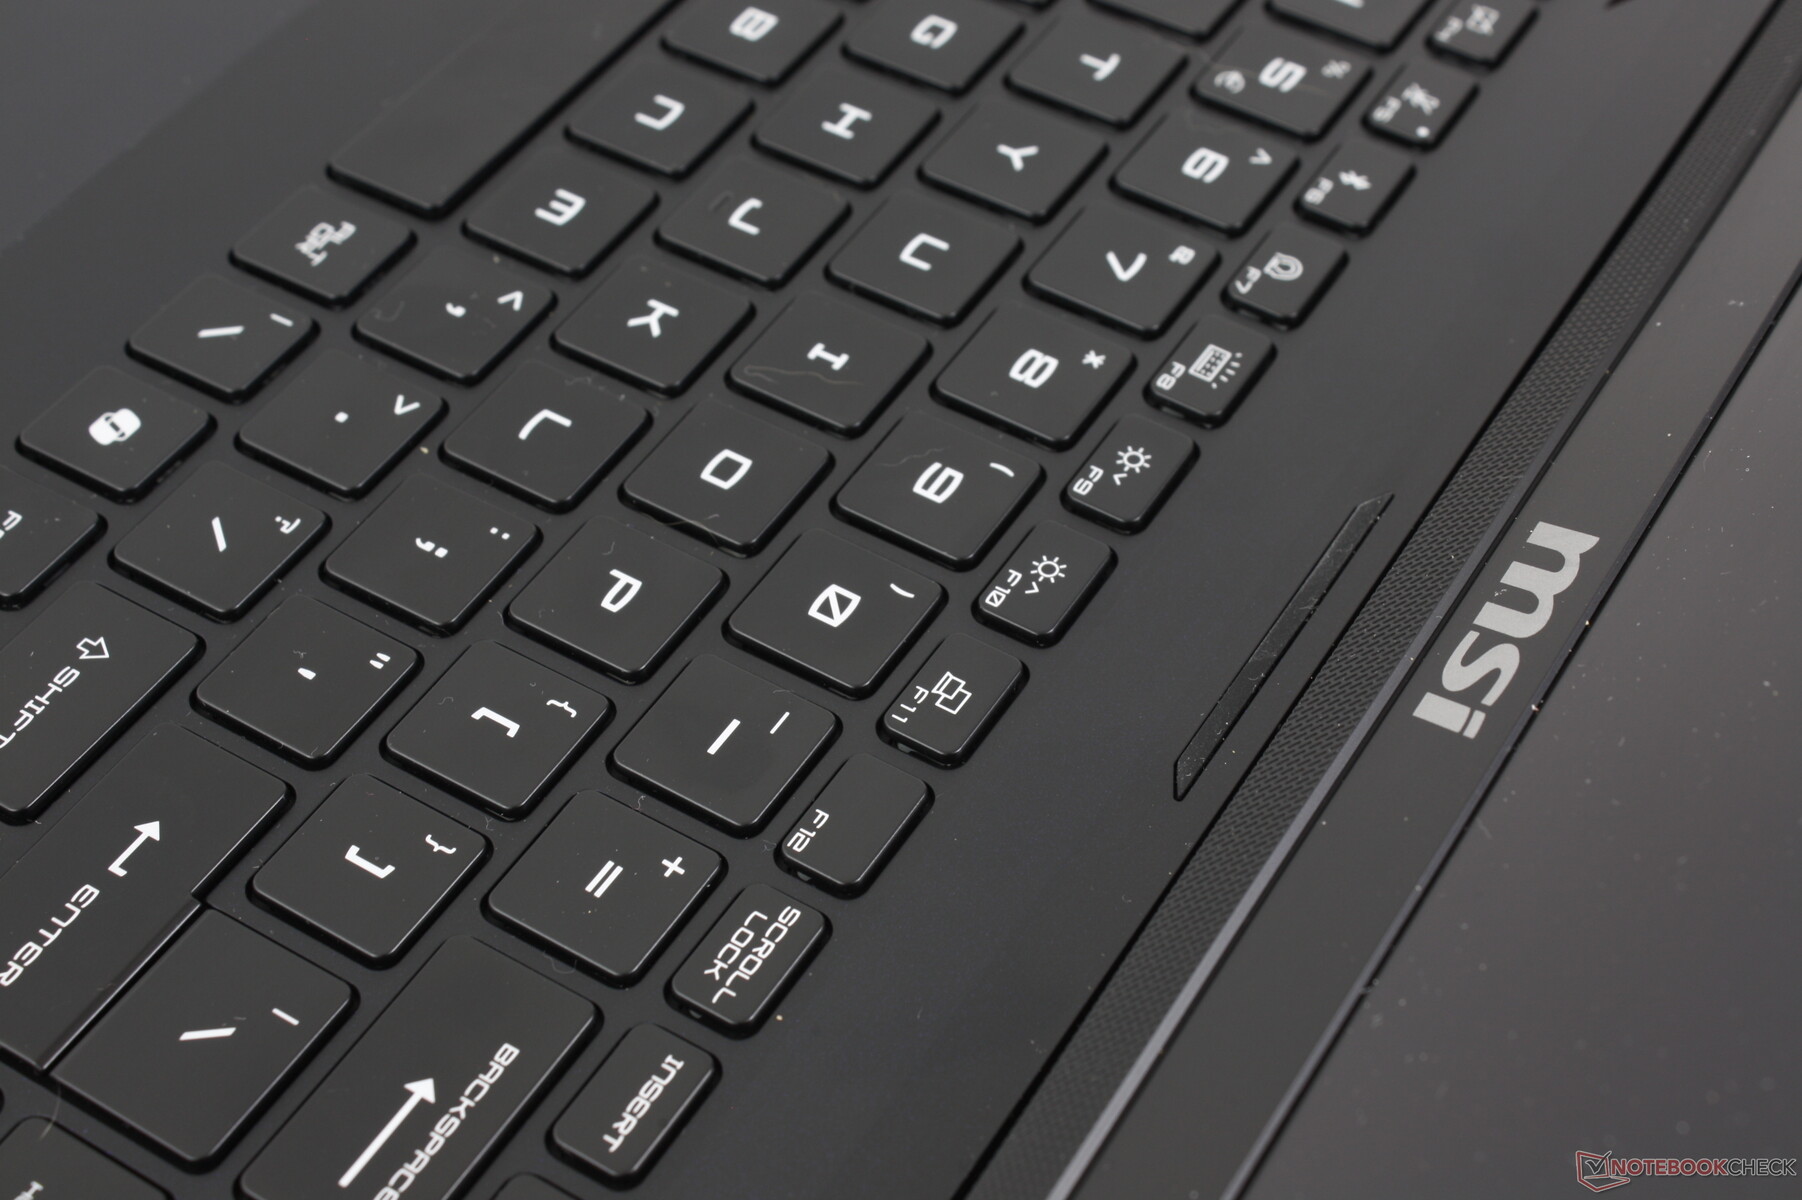
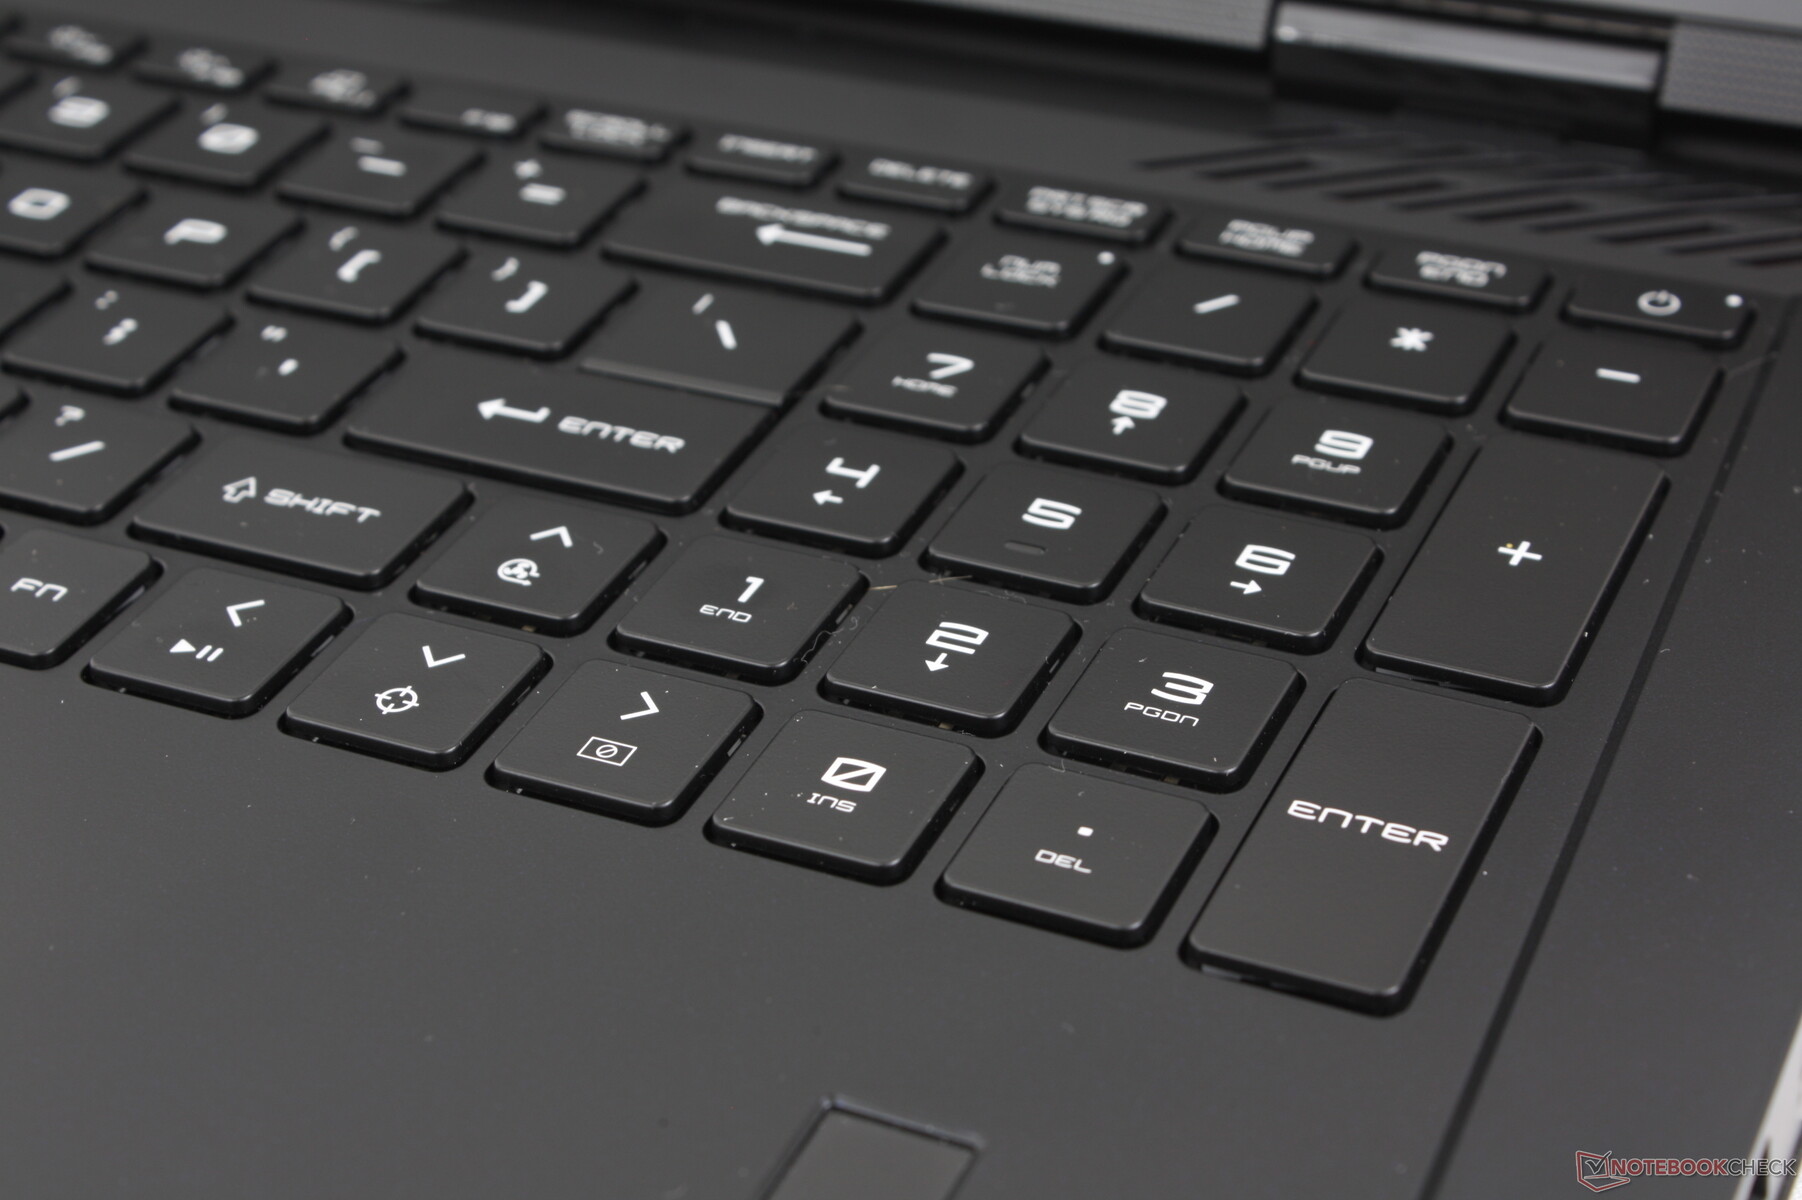
这款键盘在外观上与 Titan 18 HX 上的键盘完全相同,但有一个非常重要的区别:没有任何 CherryMX 机械选项。因此,在 Raider 18 HX 上打字更接近于在更传统的笔记本电脑键盘上打字,例如在 微星隐形 16或老一代 Raider 型号。键盘的反馈没有那么铿锵有力,但在会议室、教室、图书馆或寝室等环境中,较柔和的铿锵声可能更受欢迎。
我们尤其欣赏全尺寸数字键盘和方向键,因为它们通常比其他大多数笔记本电脑的 QWERTY 主键更窄更小。因此,在 Raider 18 HX 上进行电子表格工作比在 Blade 18 或 ROG Strix G18.
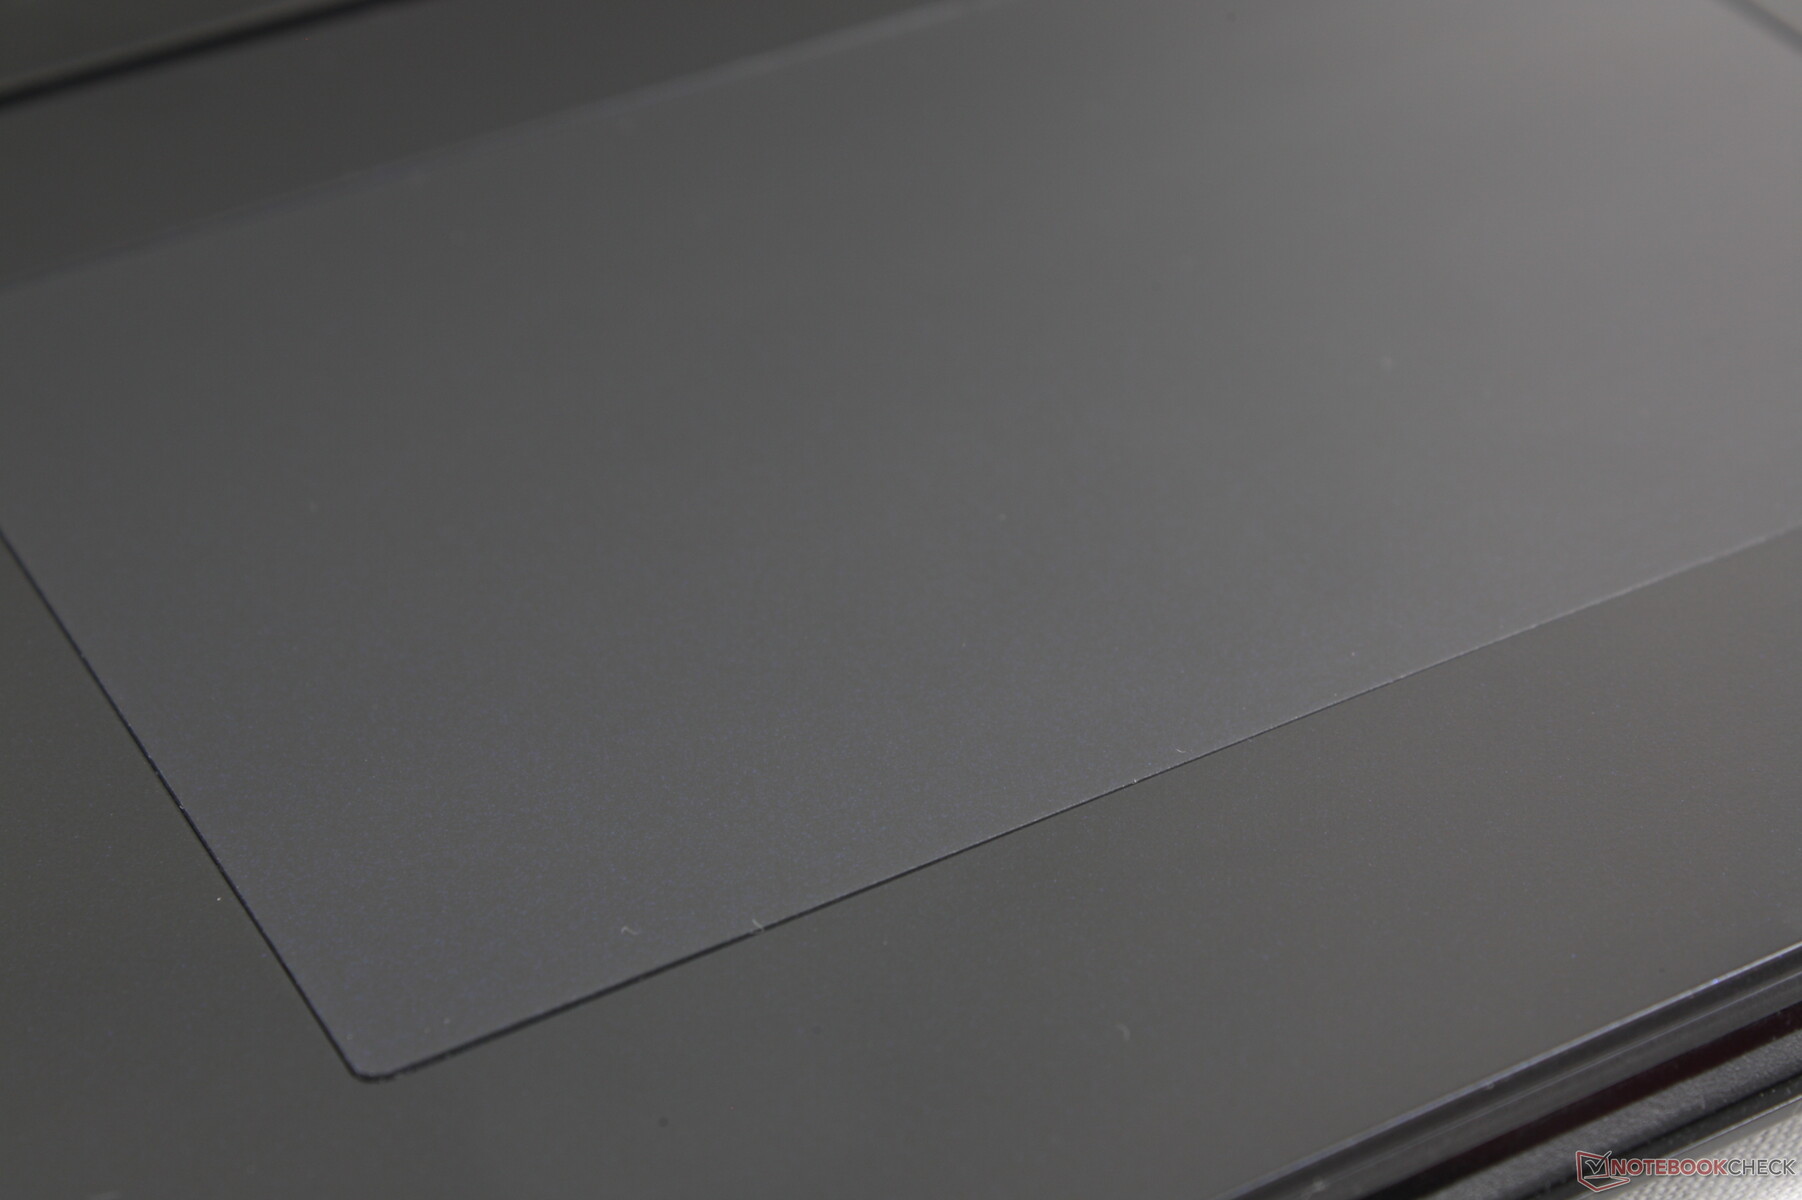
触摸板
与 Titan 18 HX 上花哨的 LED 无边缘点击板不同,Raider 18 HX 采用了传统的点击板,给人更熟悉的感觉。它的尺寸保持不变(13 x 8.2 厘米),可以说使用起来更加舒适,因为它并没有试图标新立异或解决原本不存在的问题。牵引非常顺畅,只是在较慢的速度下会有一点粘滞感,以保证准确性。
遗憾的是,向下按压以输入 "咔嗒 "声的反馈仍然浅而柔和,令人不甚满意。如果能提供更有力、更坚固的点击,甚至恢复鼠标专用键就更好了,因为键盘的空间相当大。
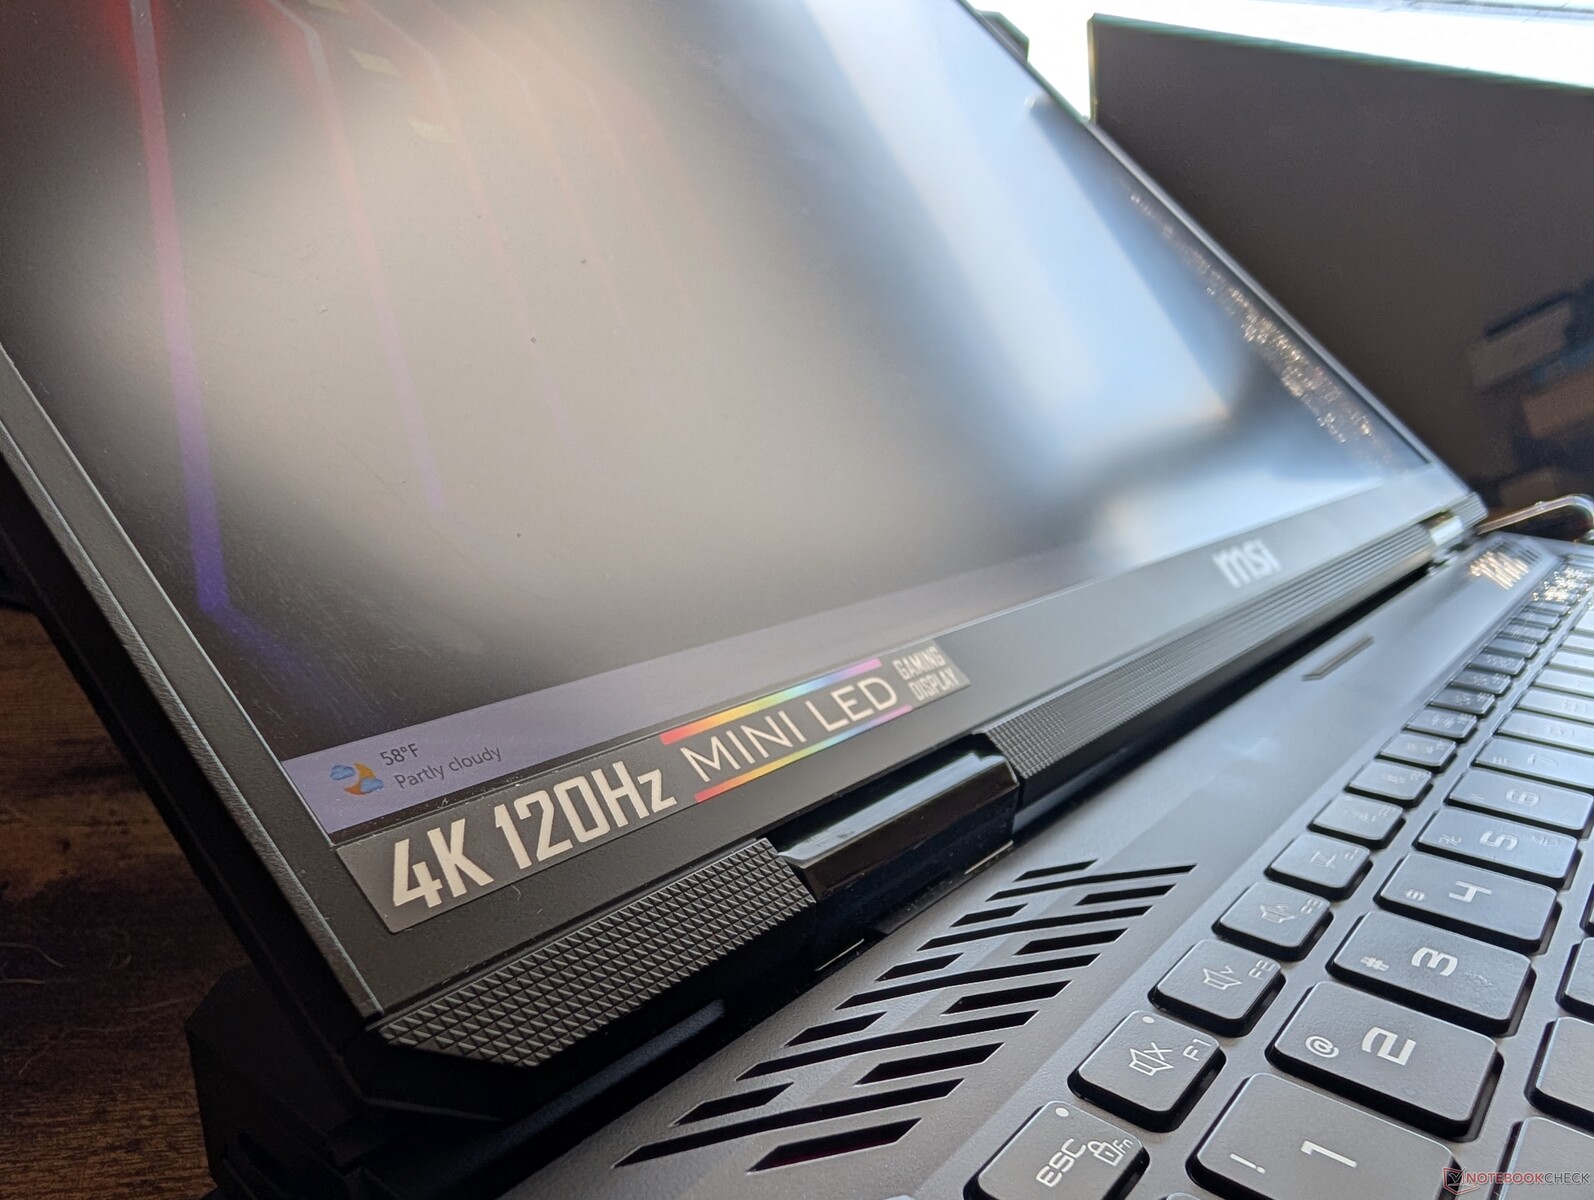
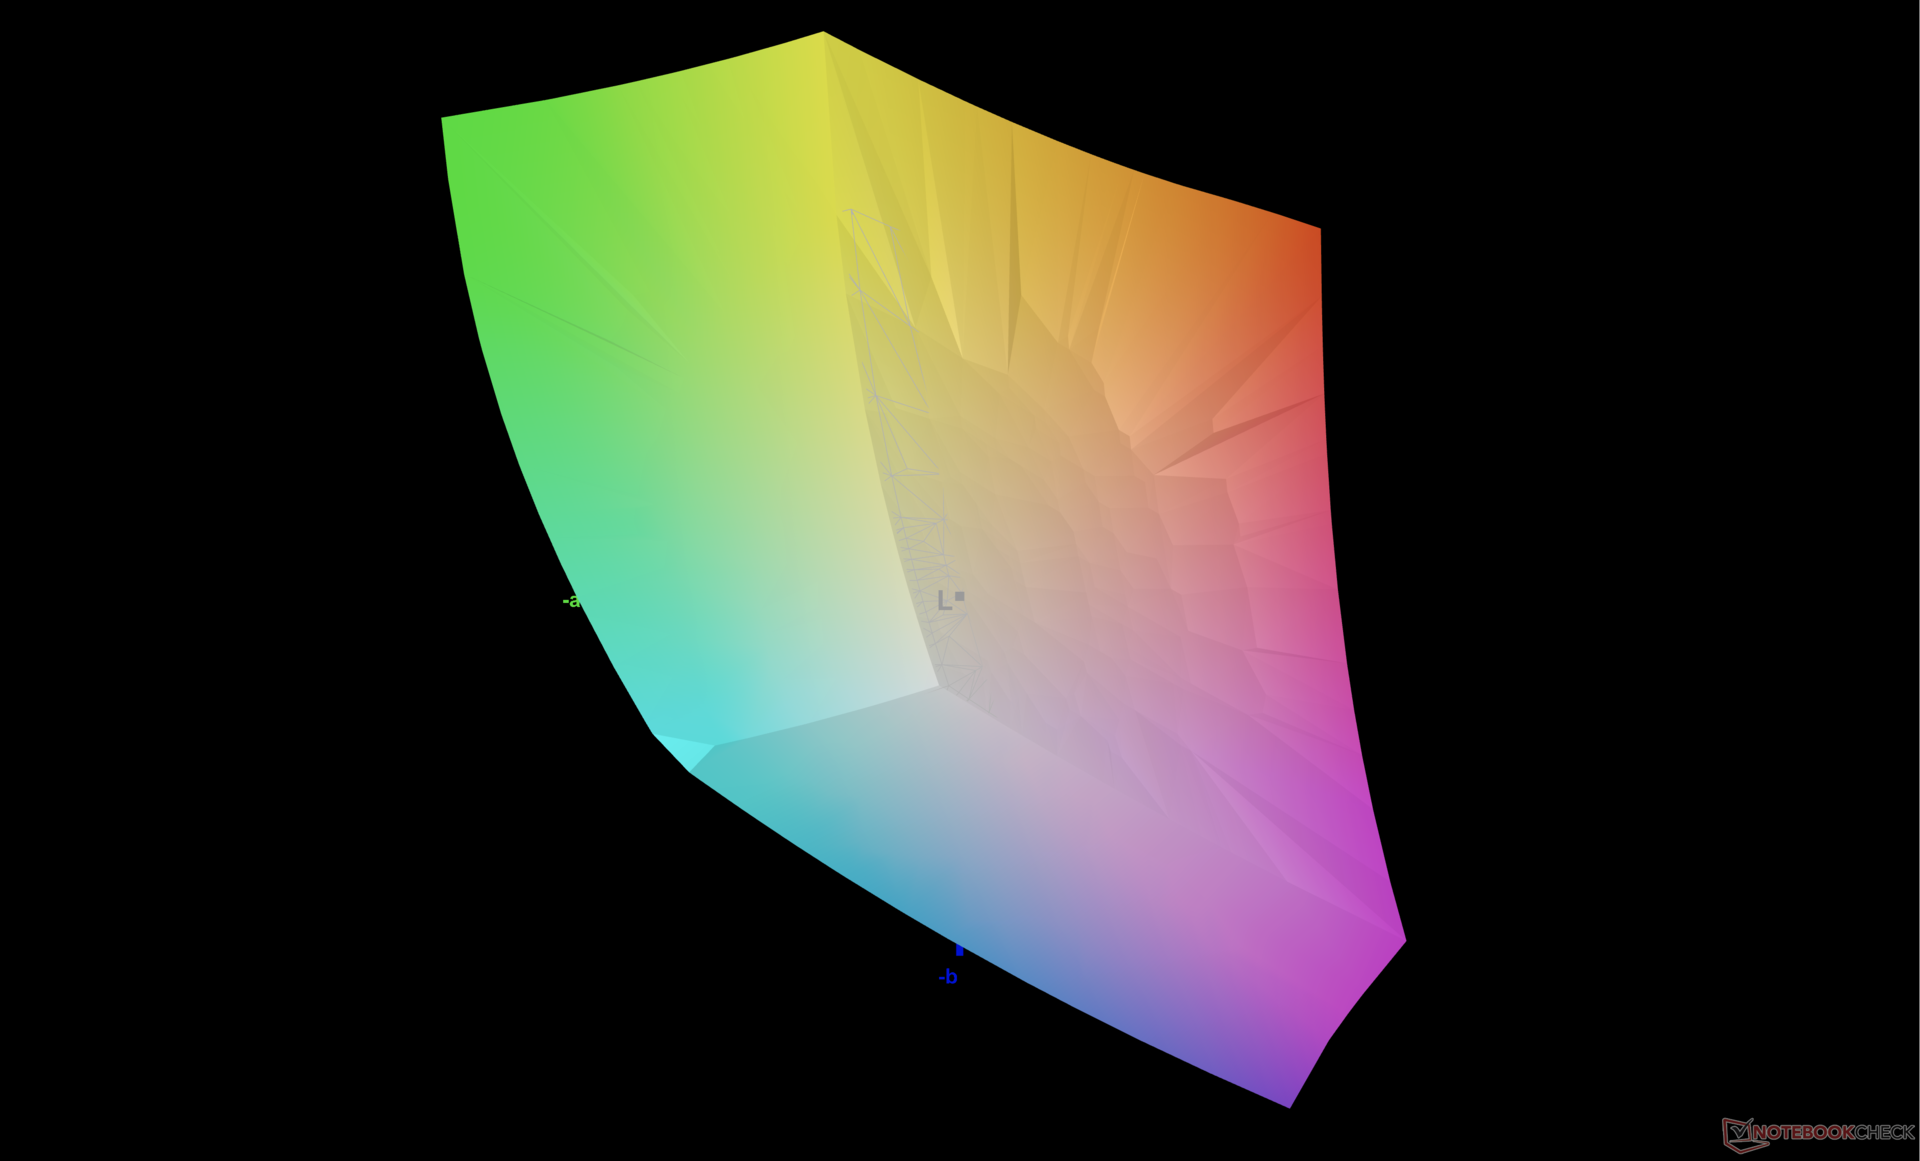
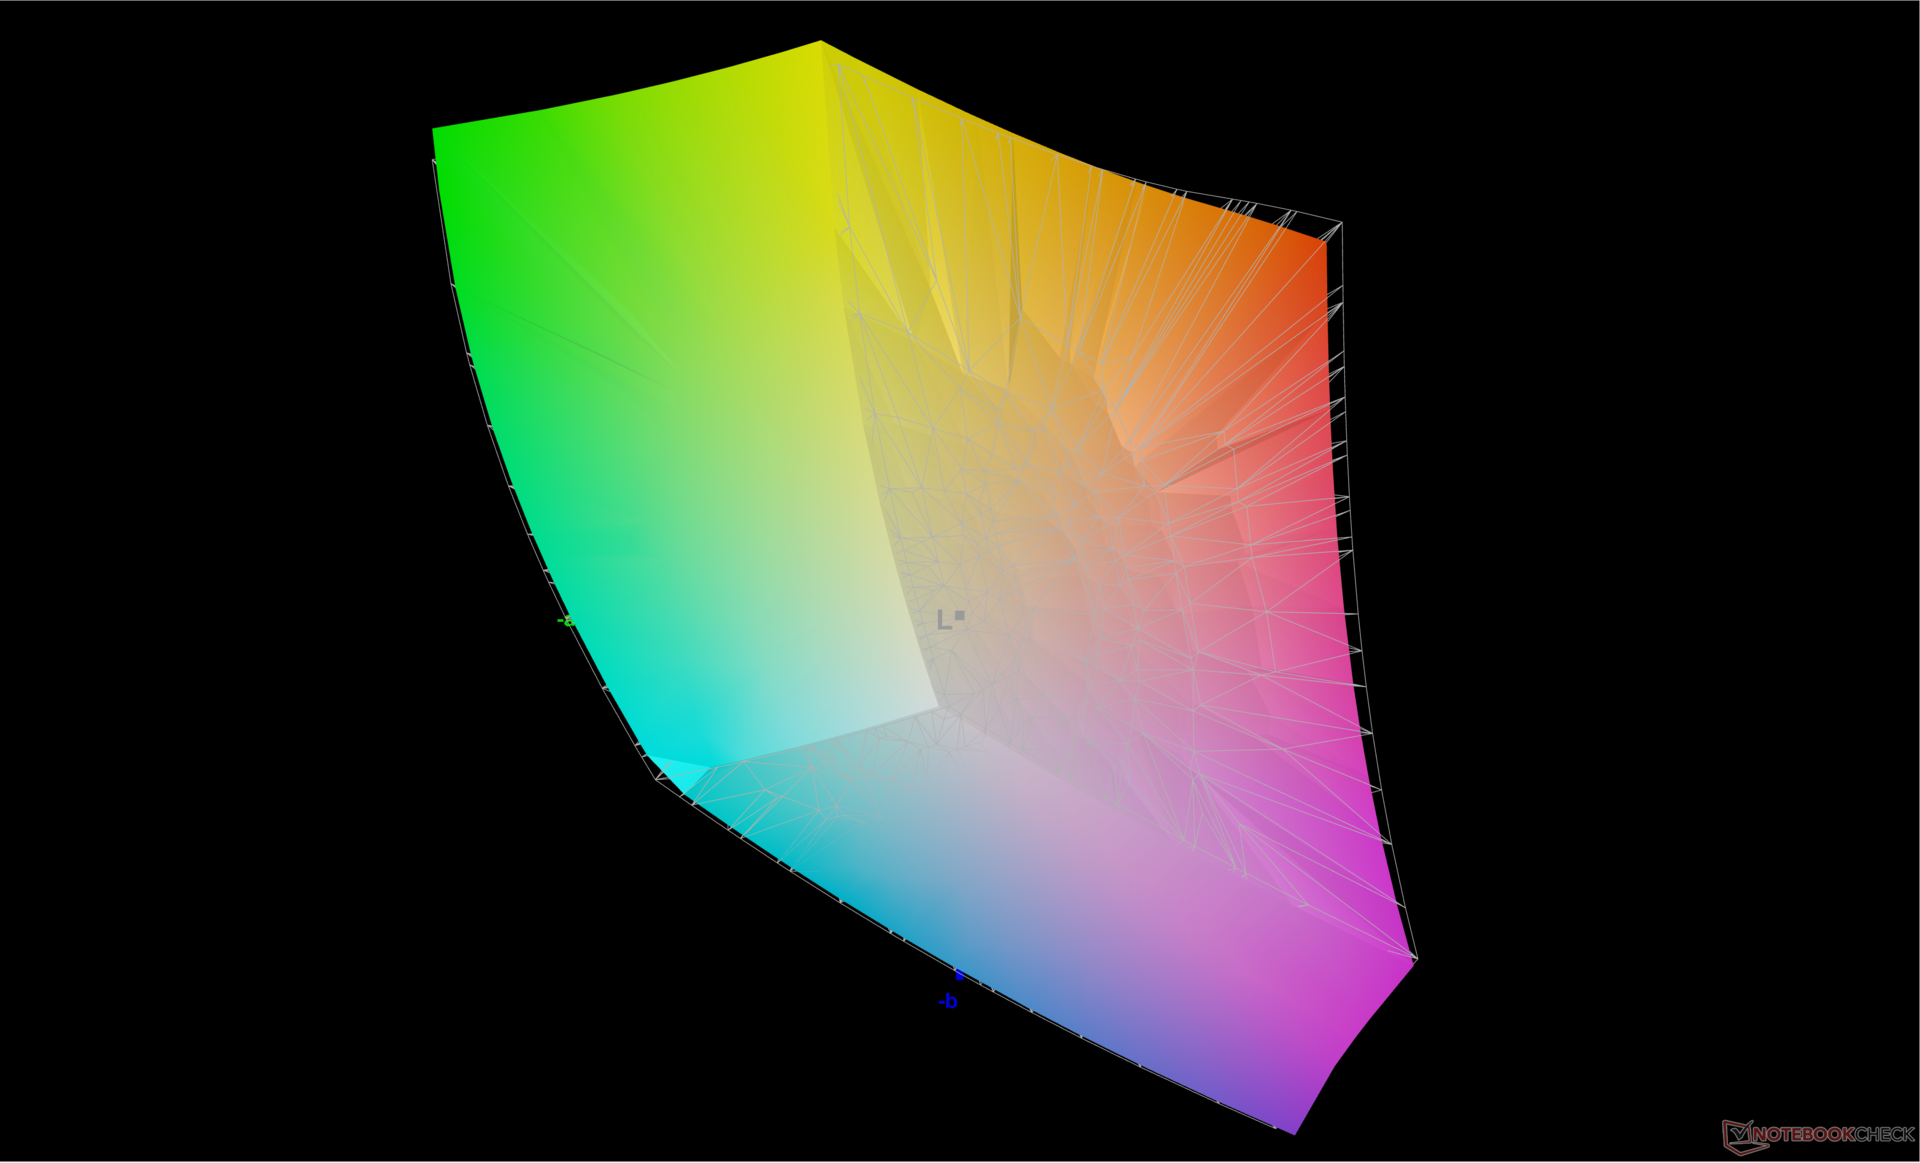
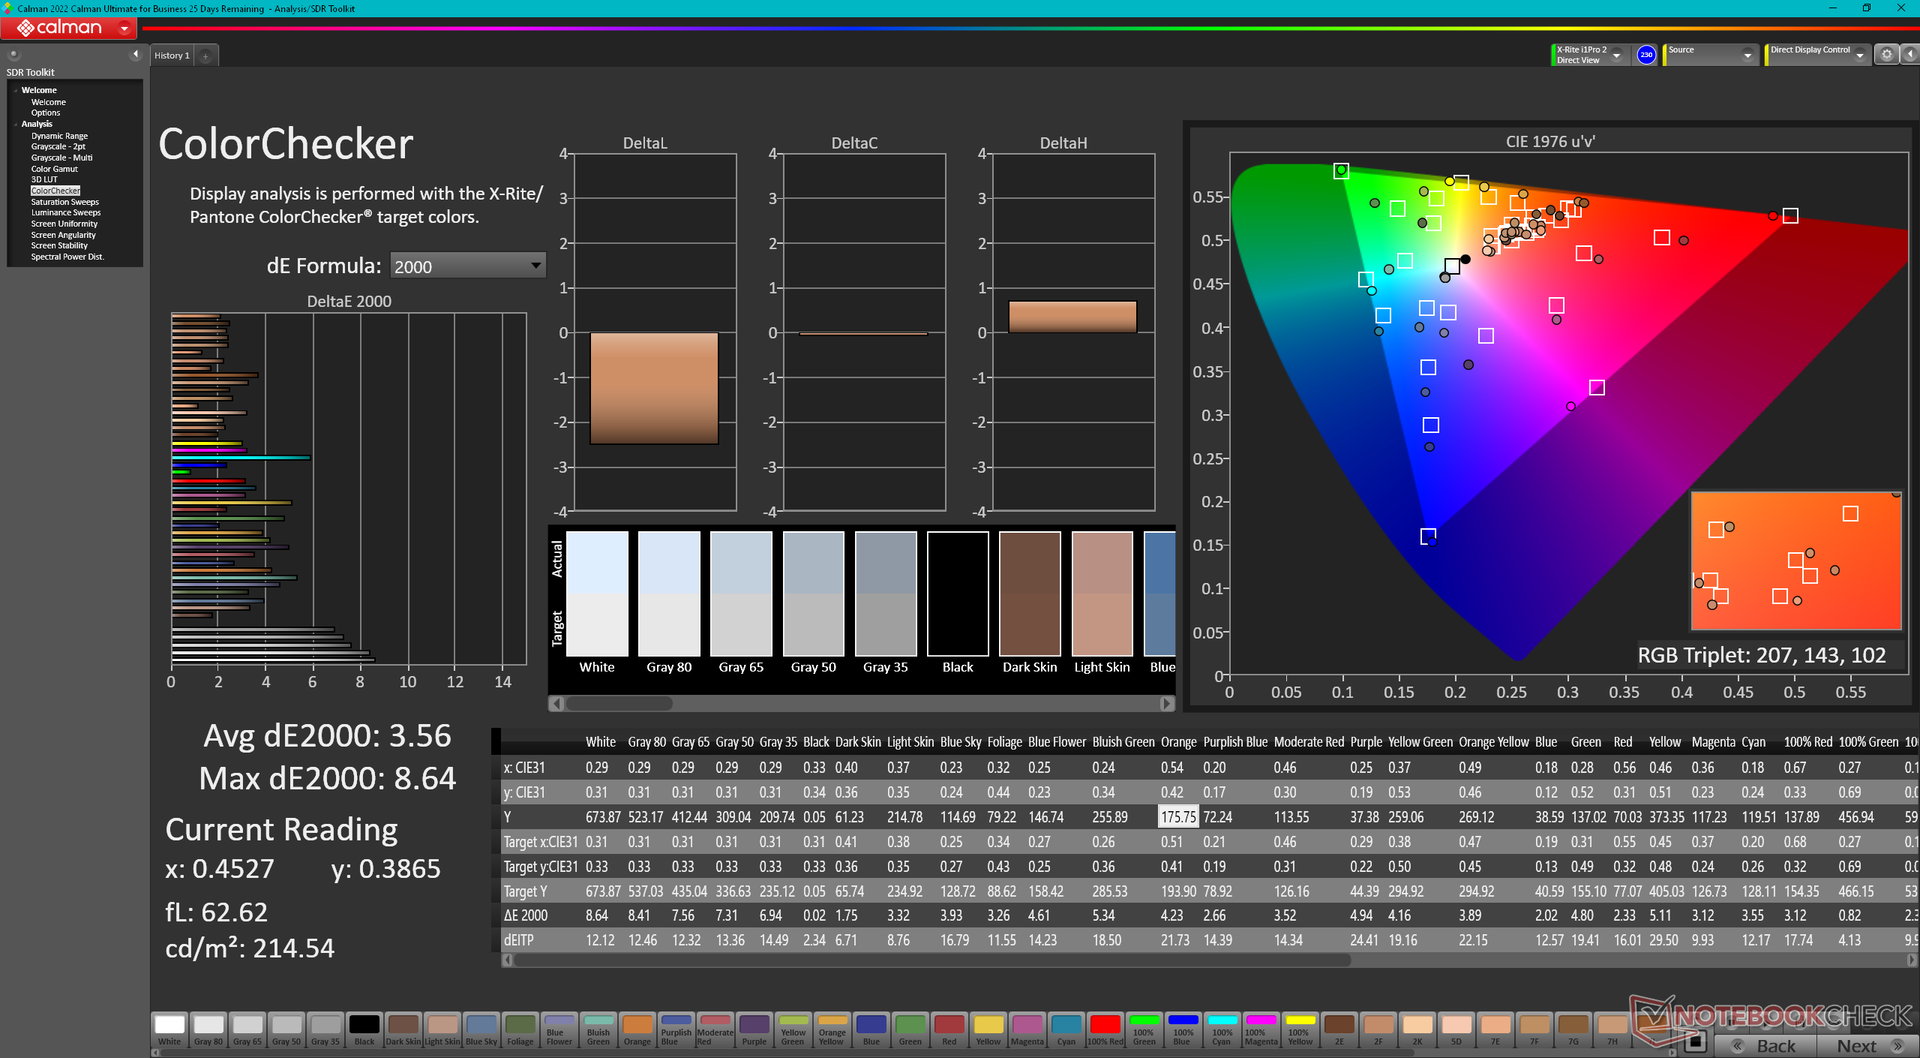
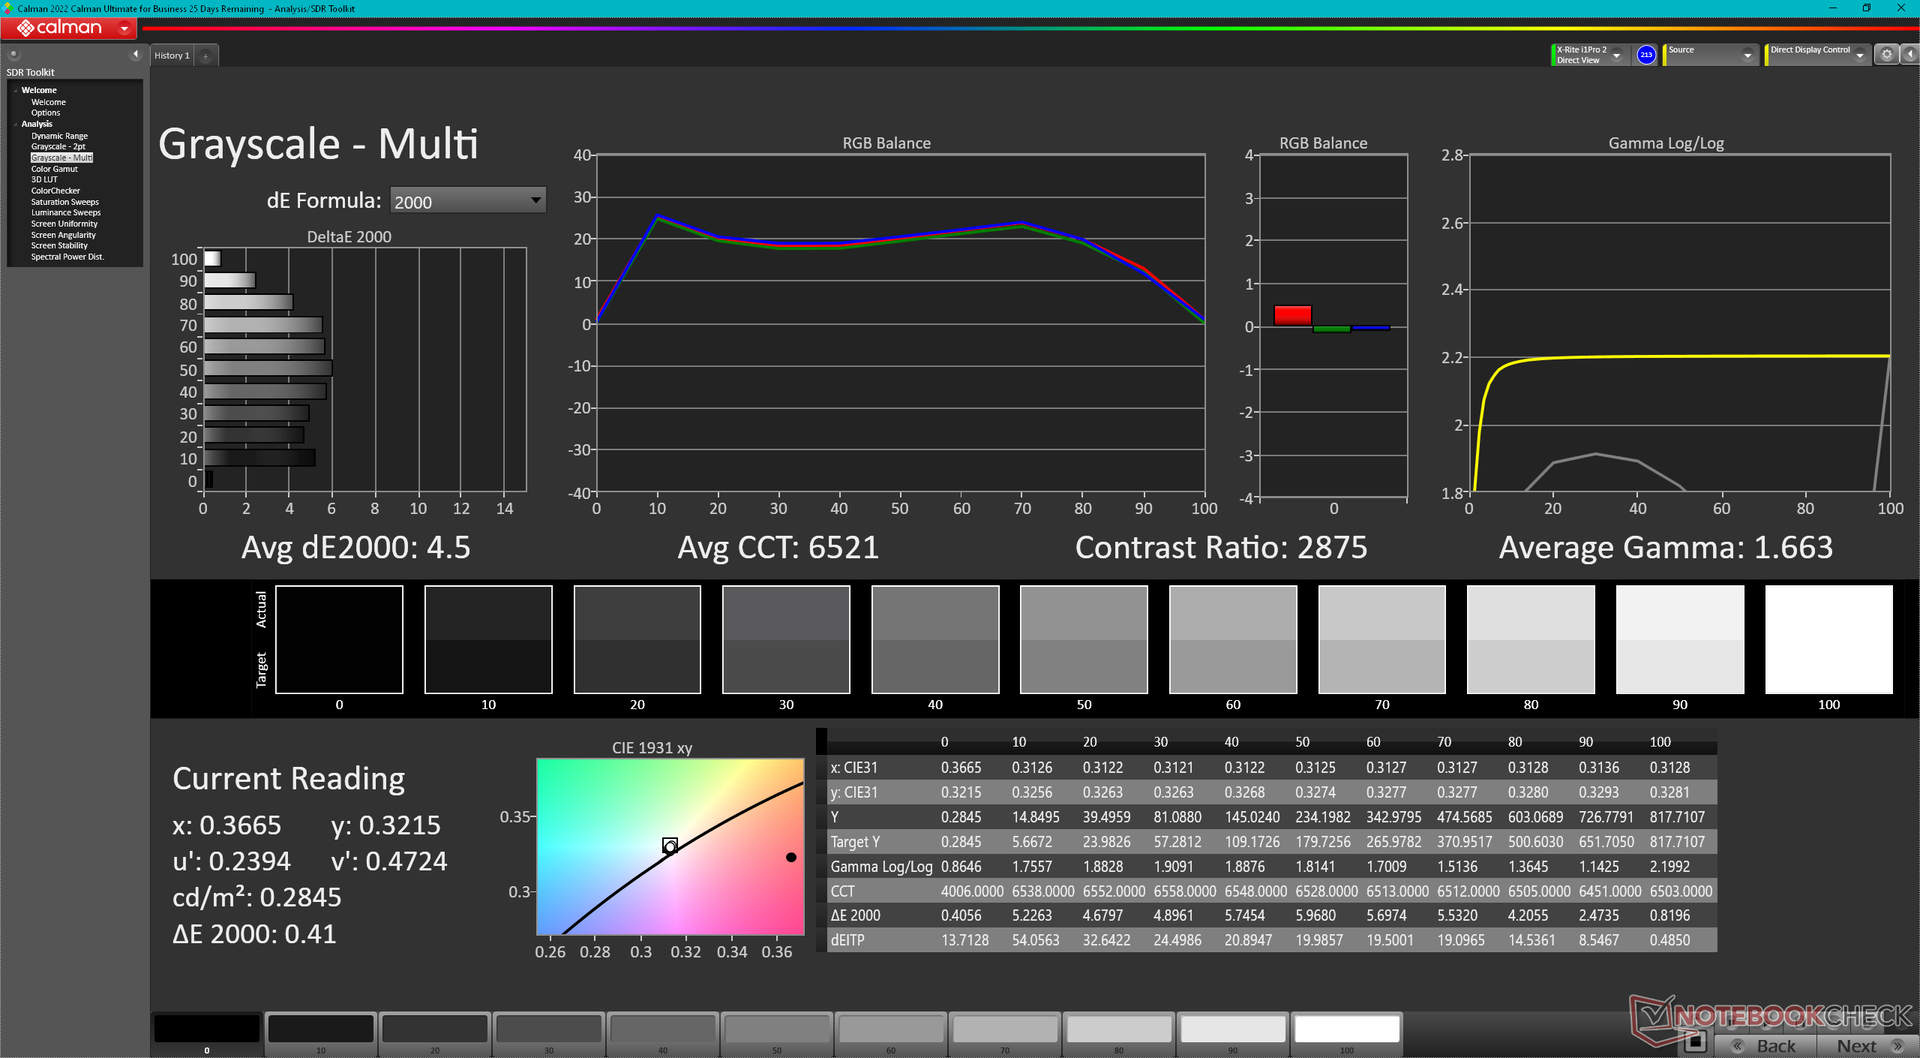
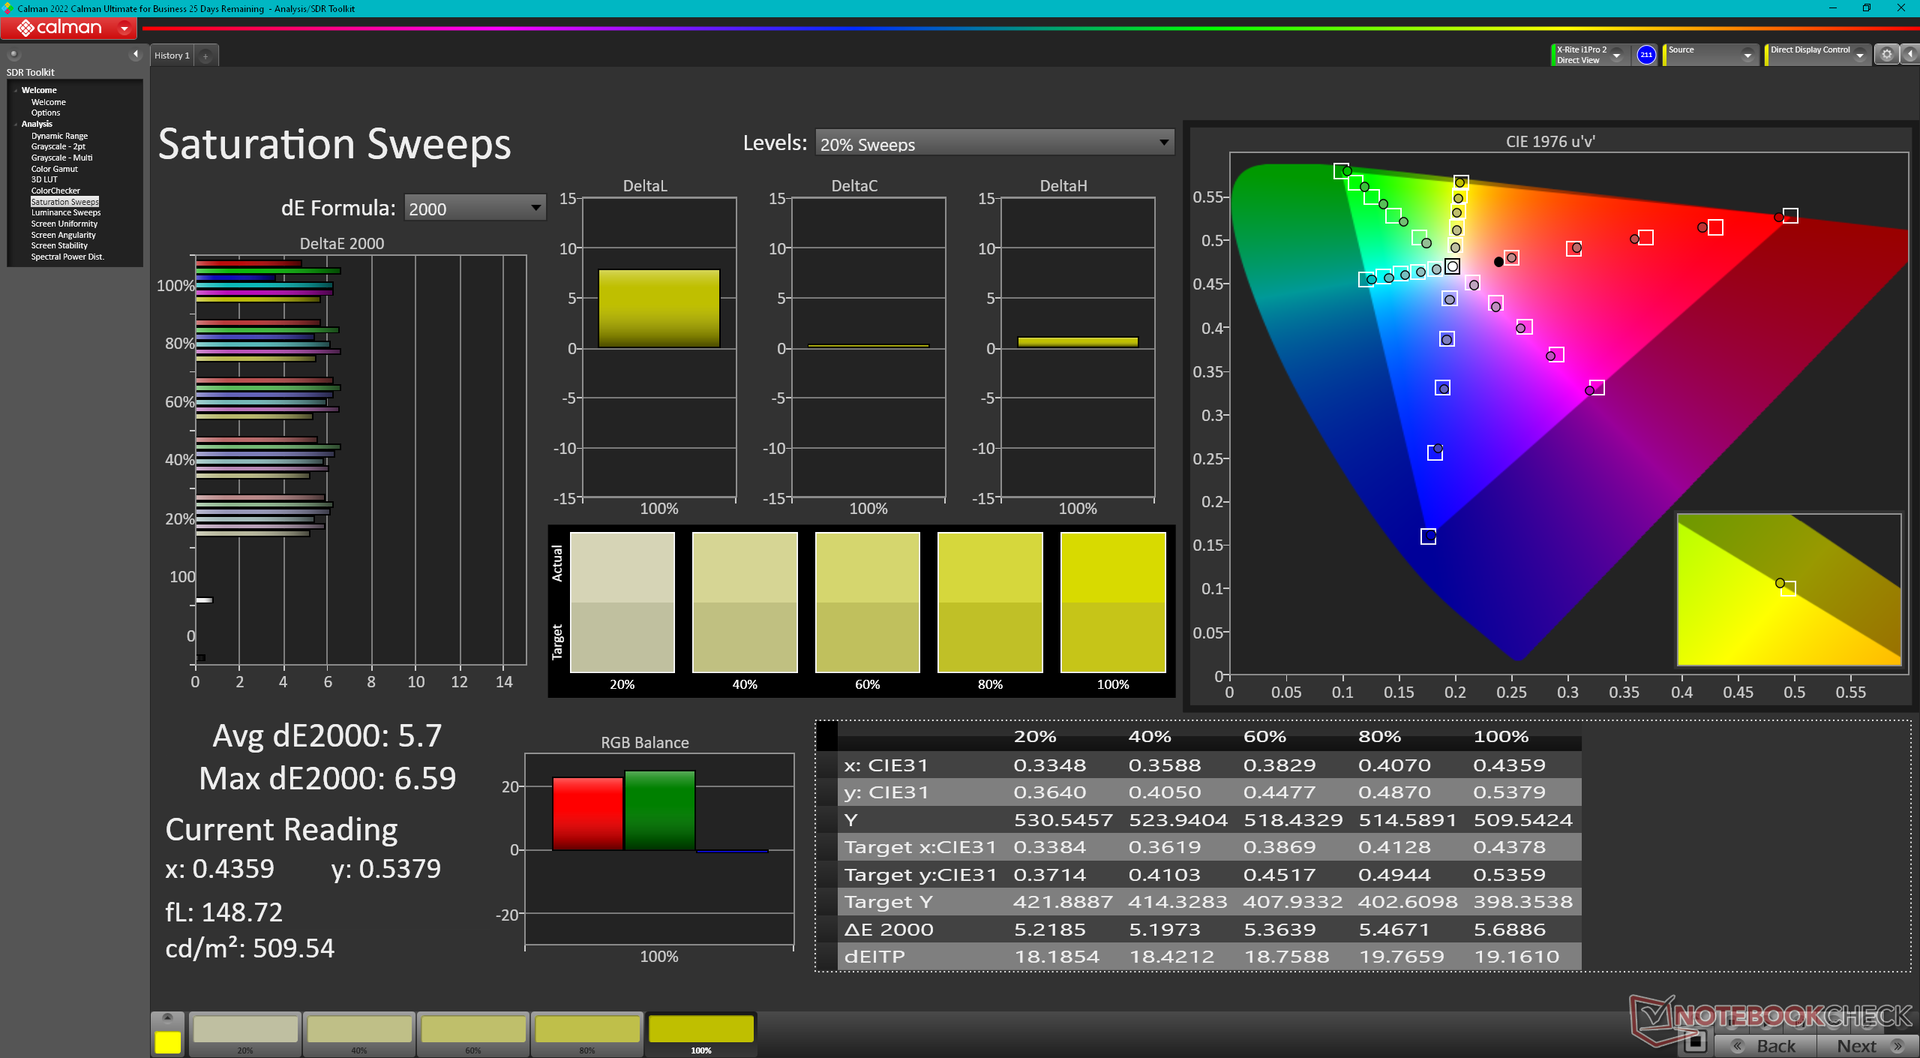
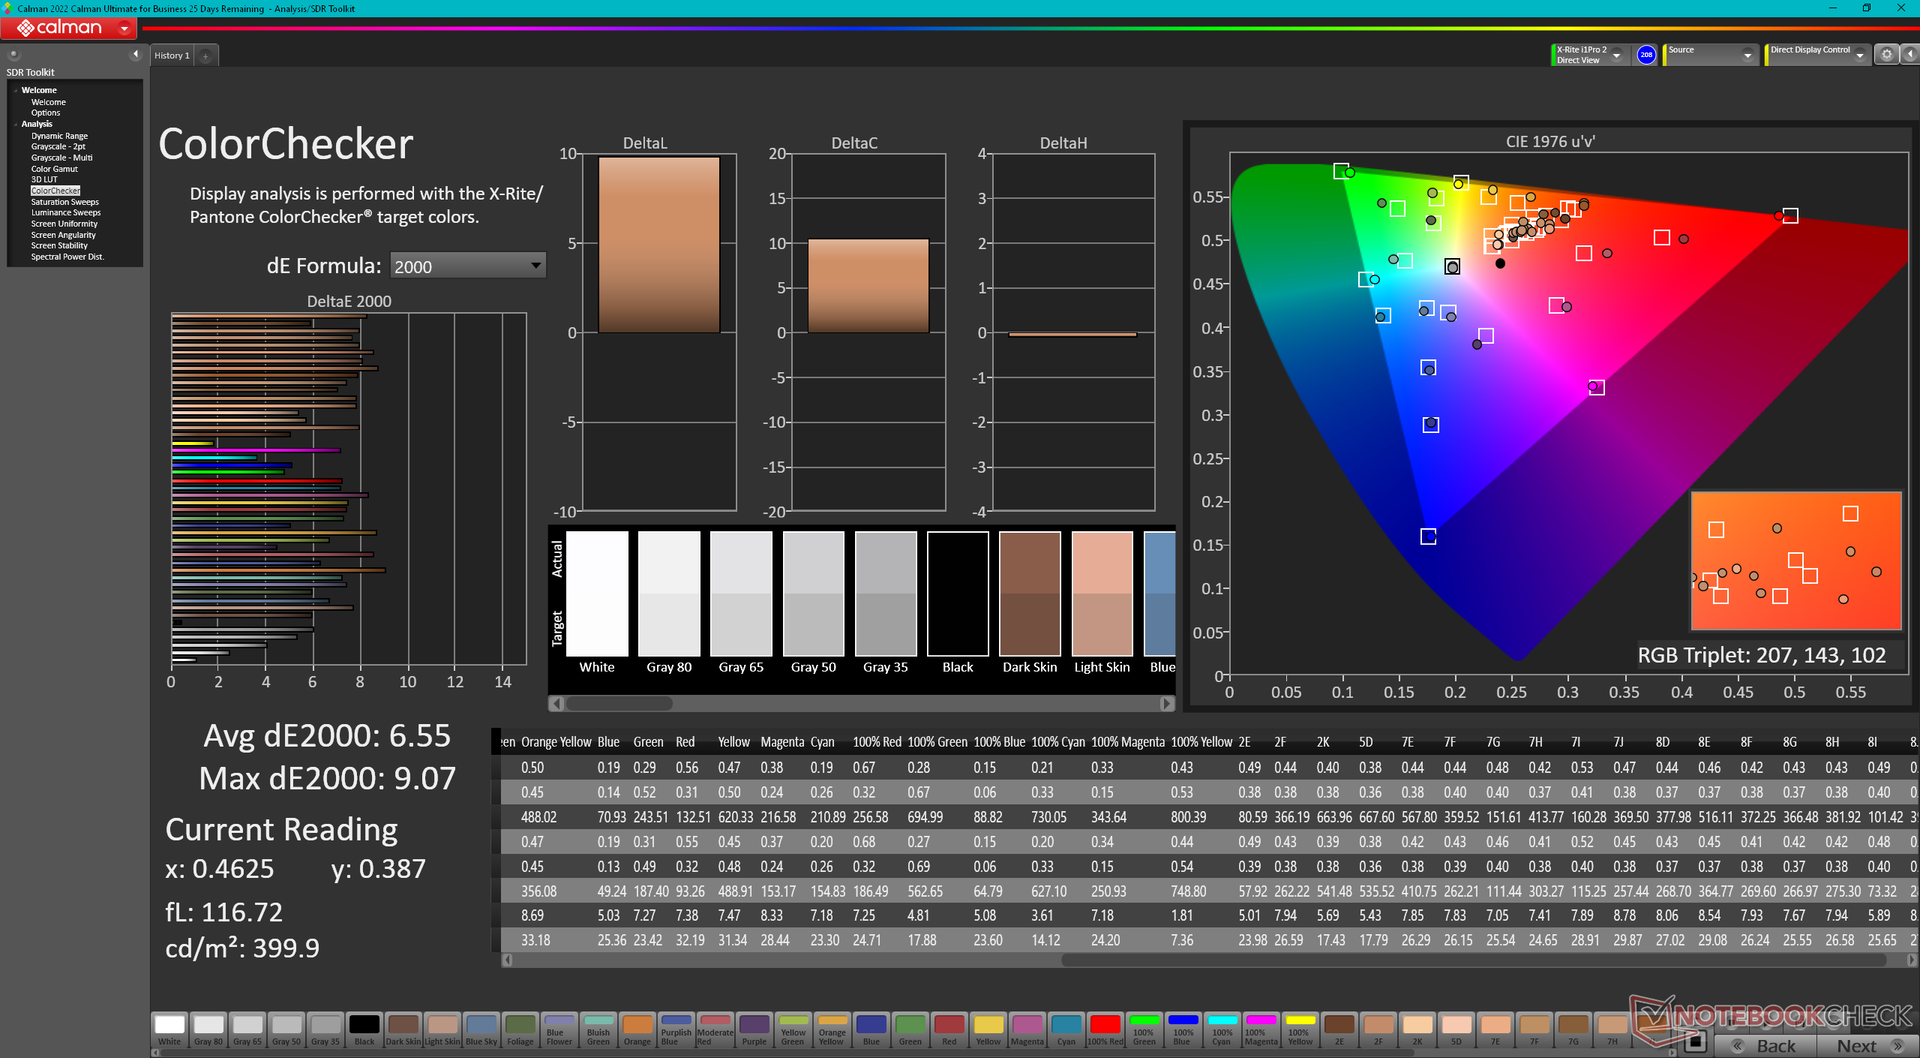
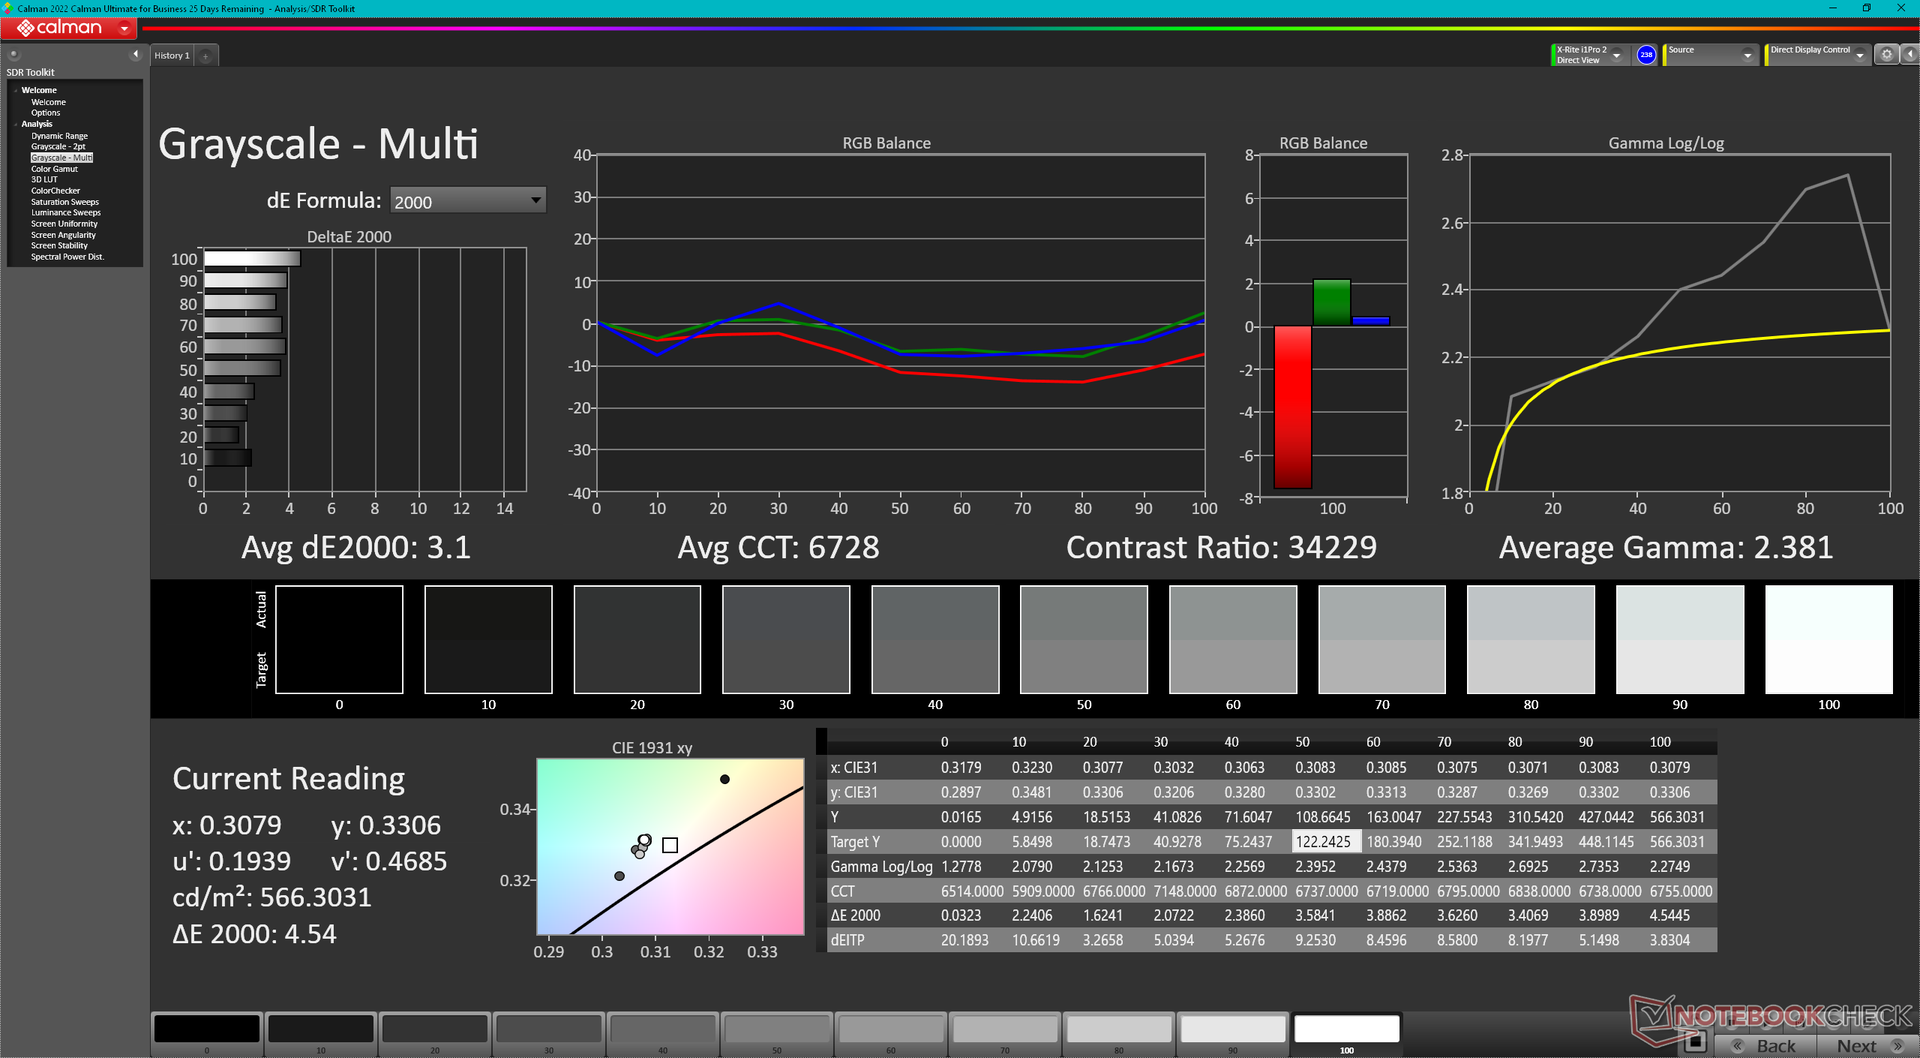
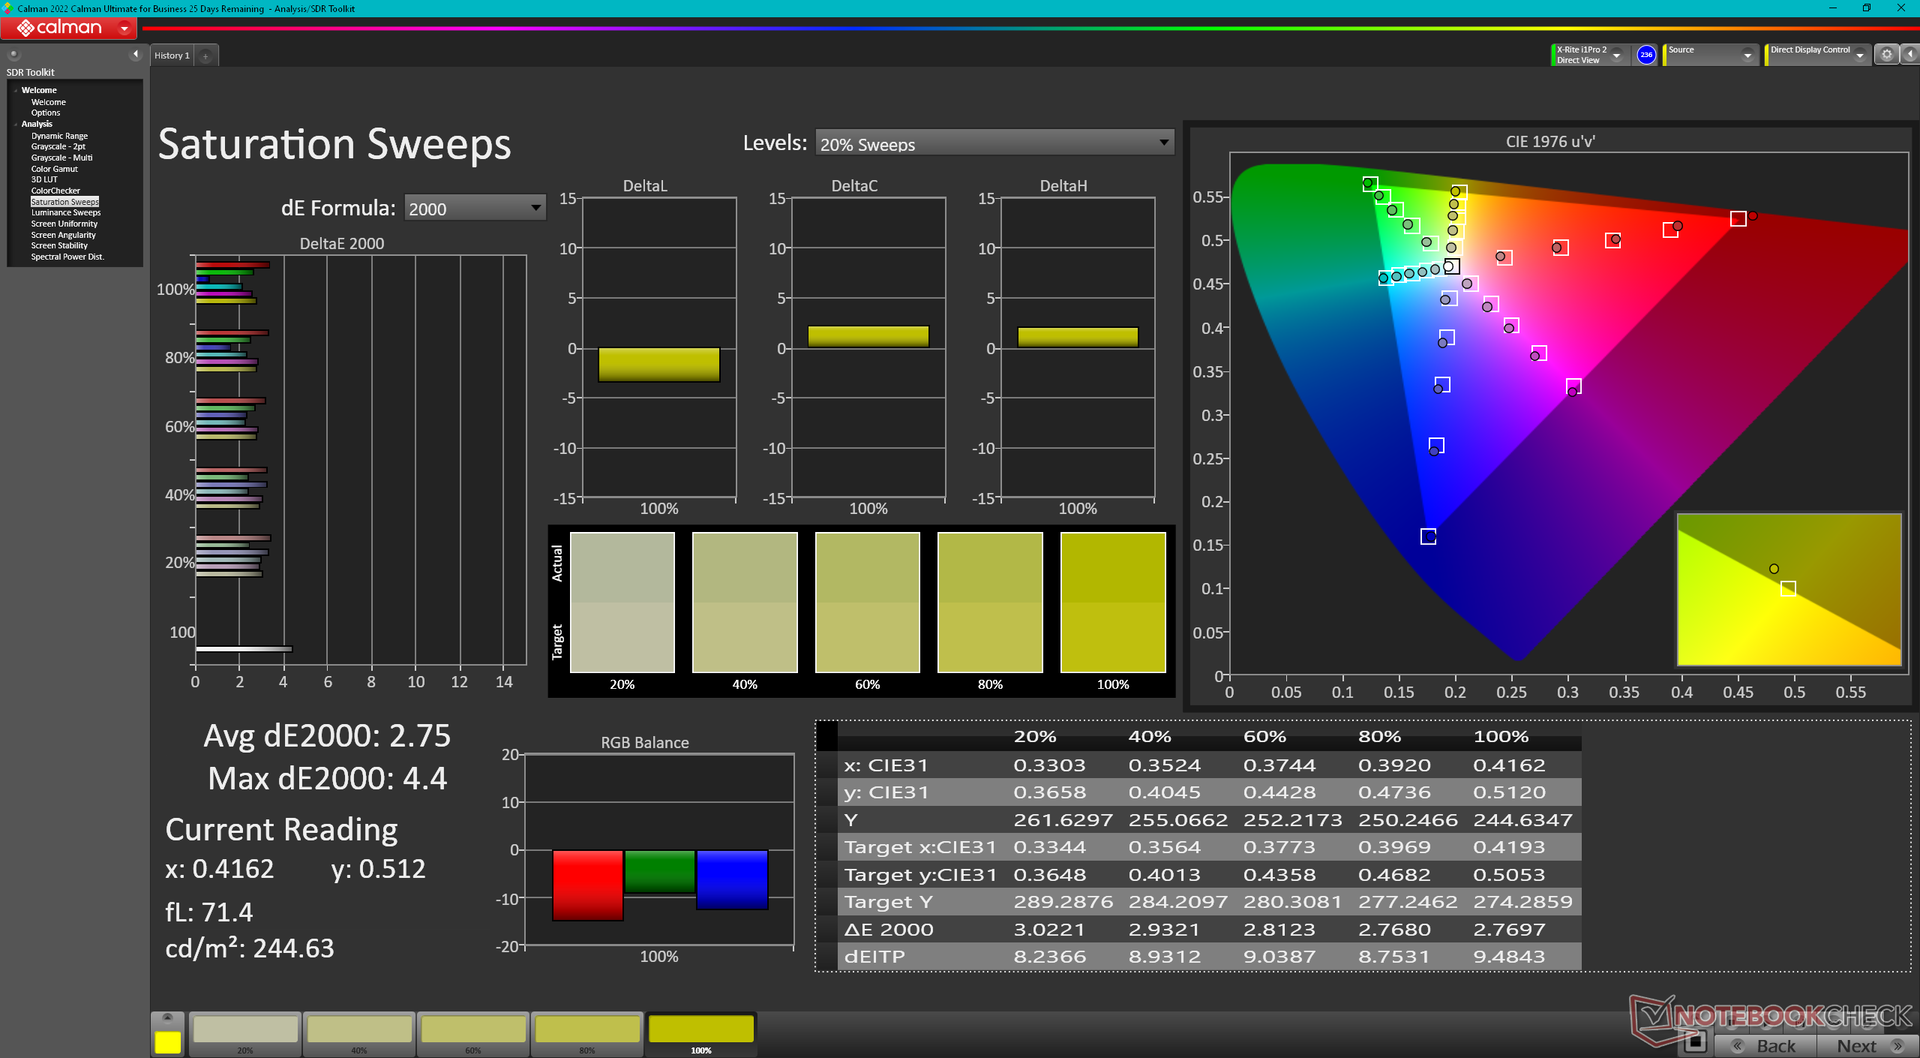
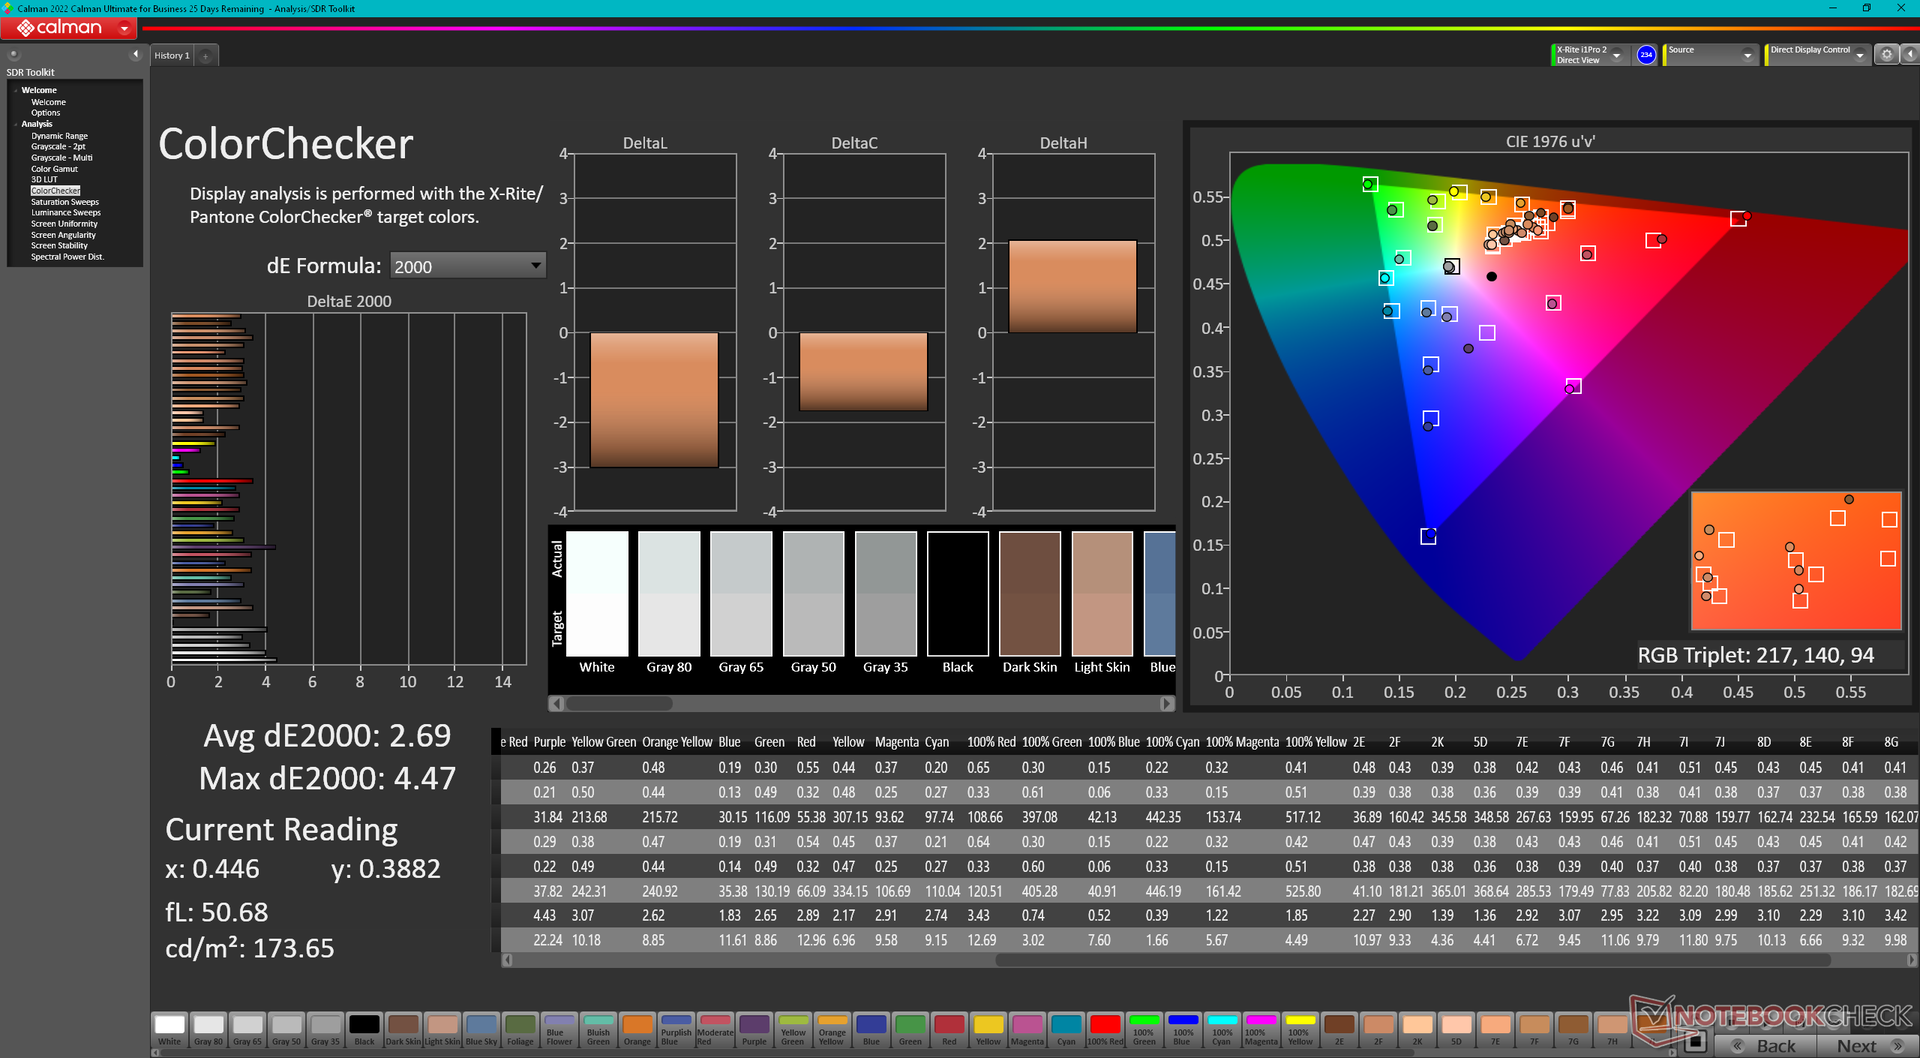
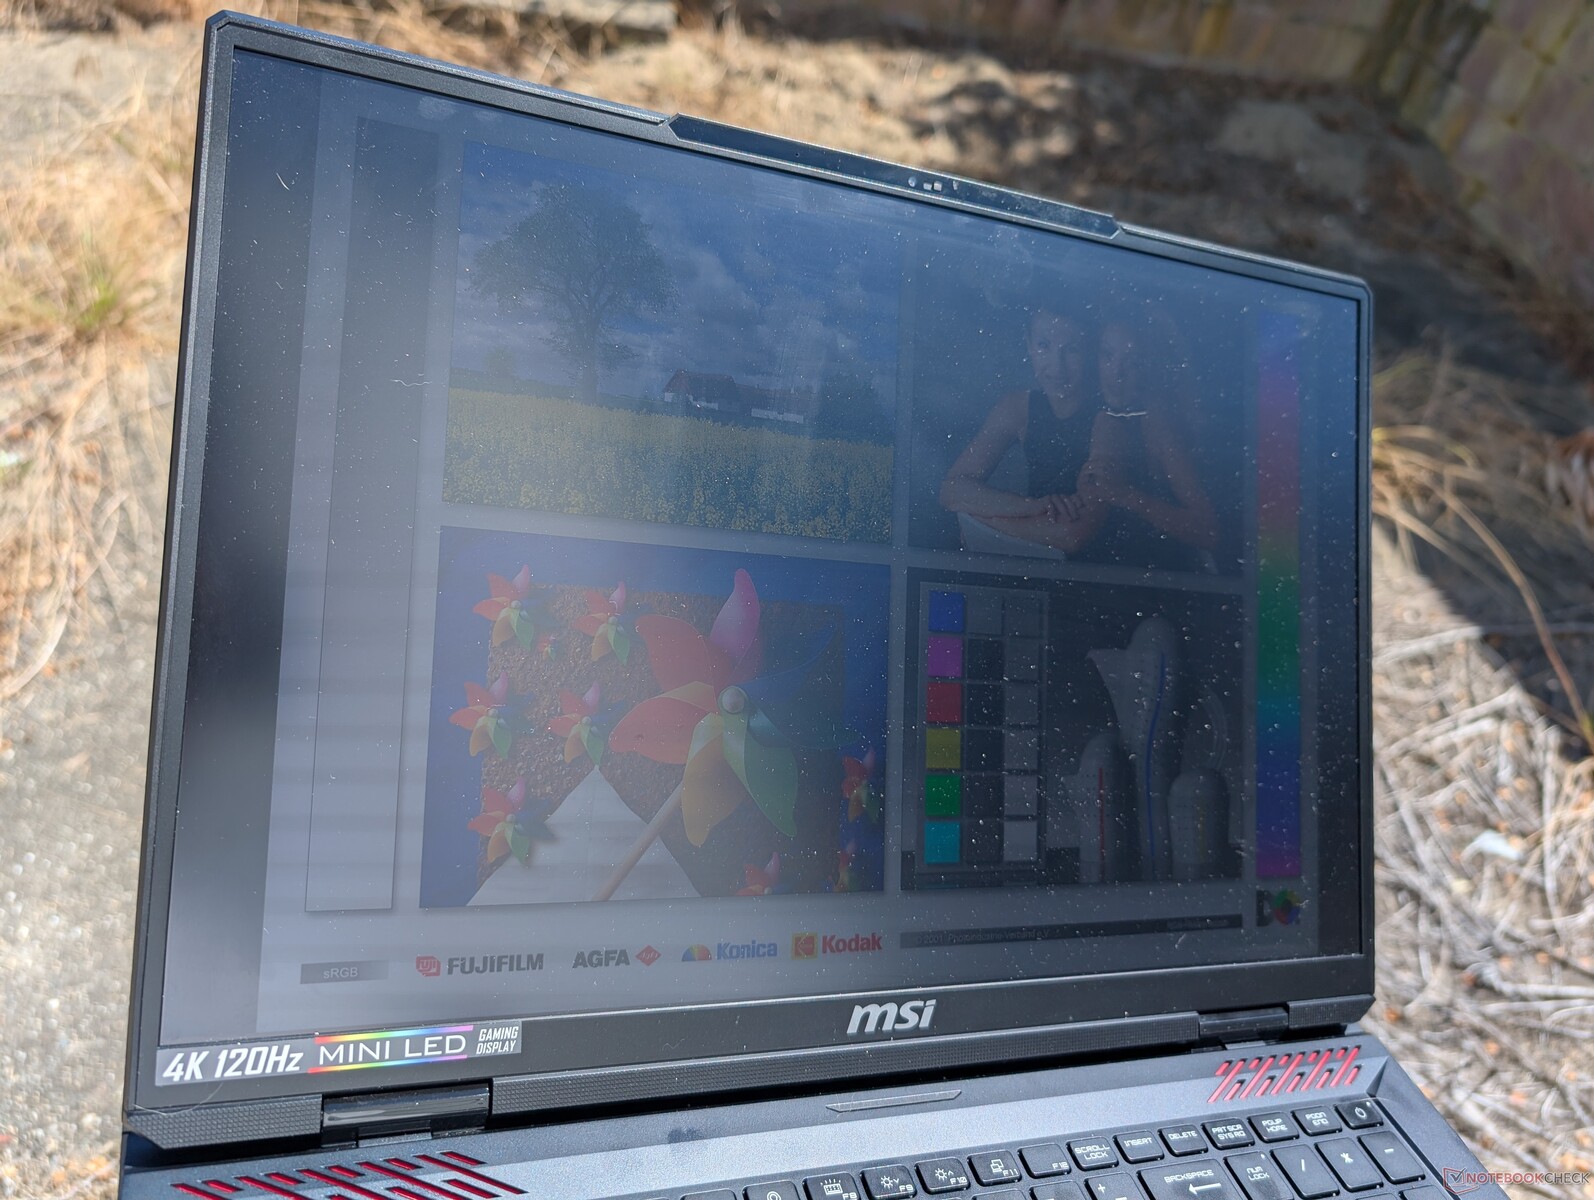
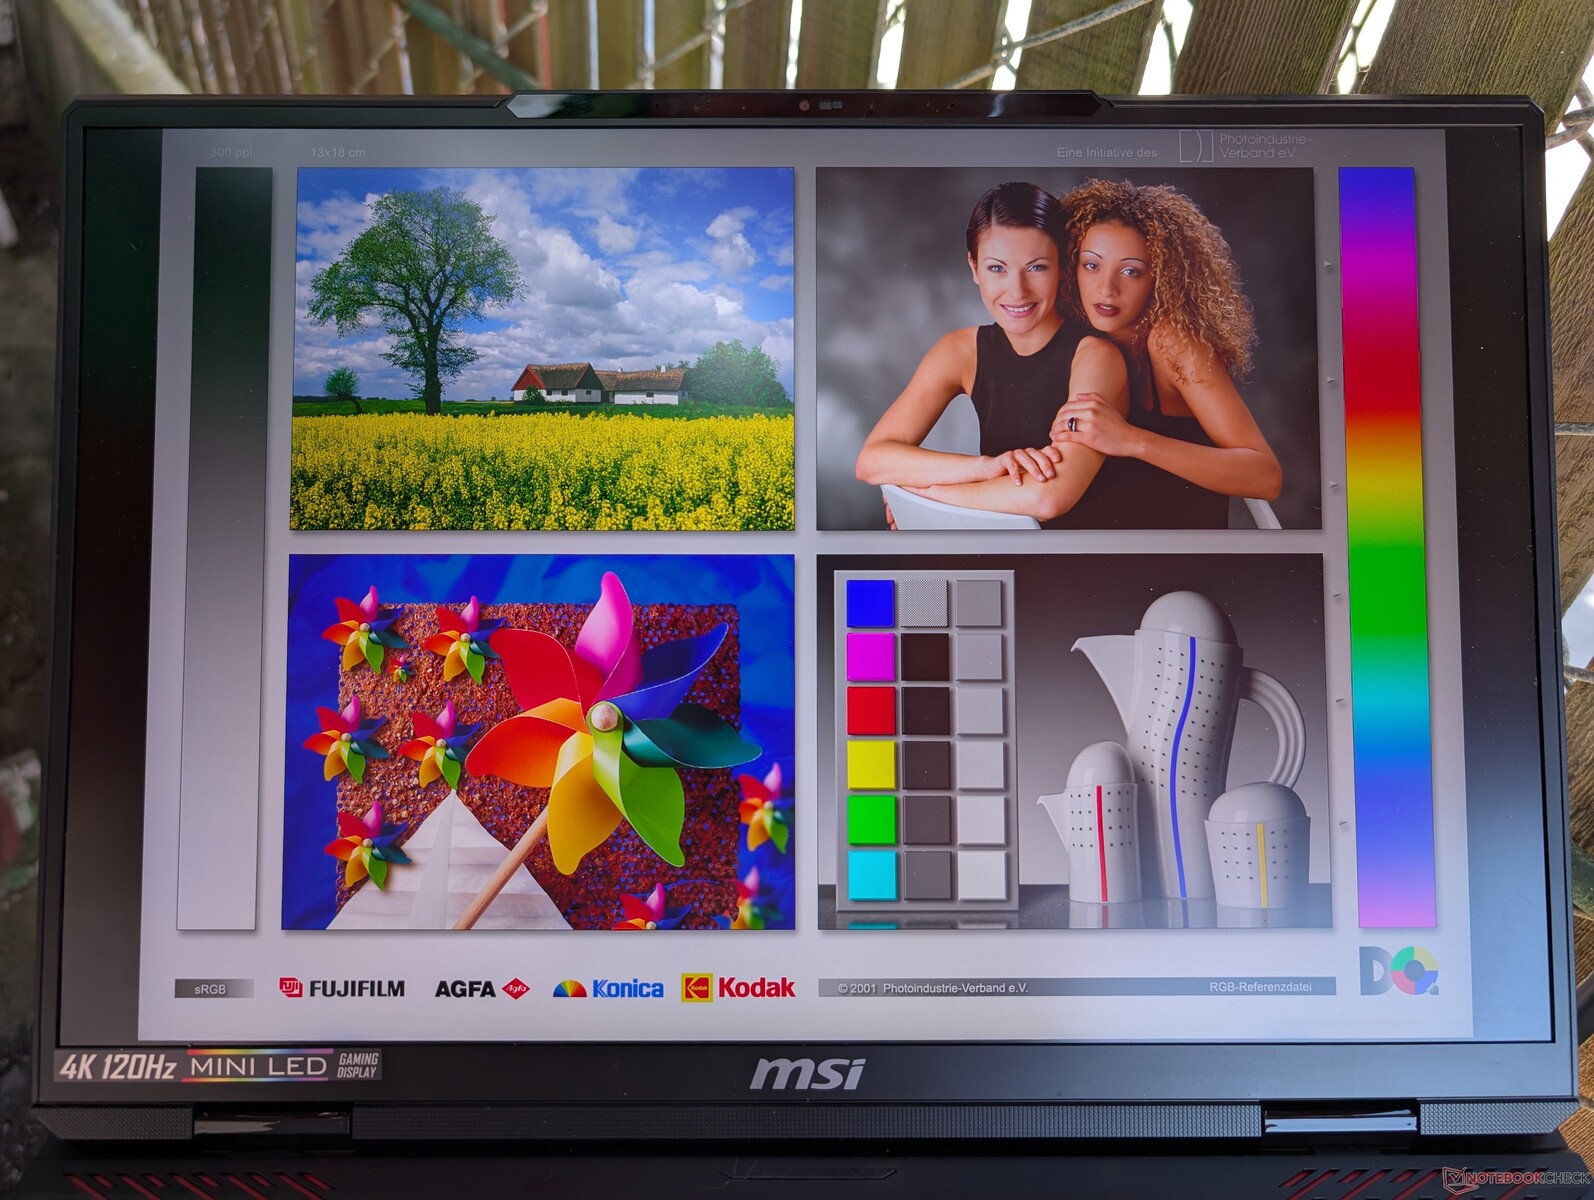
显示屏 - Titan 18 HX 低成本体验
Raider 18 HX 配备了与 Titan 18 HX 完全相同的友达光电 B180ZAN01.0 120 Hz 迷你 LED 面板,带来几乎完全相同的观看体验。当 HDR 关闭时,最高亮度可达近 600 尼特;当 HDR 打开时,最高亮度可达 935 尼特。与 IPS 或 OLED 相比,mini-LED 能提供更好的 HDR 观赏体验,因为它能达到比 IPS 或 OLED 更高的亮度水平,但代价是更高的功耗。IPS 或 OLED 笔记本电脑通常最多支持 HDR600,而 mini-LED 面板通常承诺支持 HDR1000。
| |||||||||||||||||||||||||
Brightness Distribution: 94 %
Center on Battery: 392.2 cd/m²
Contrast: ∞:1 (Black: 0 cd/m²)
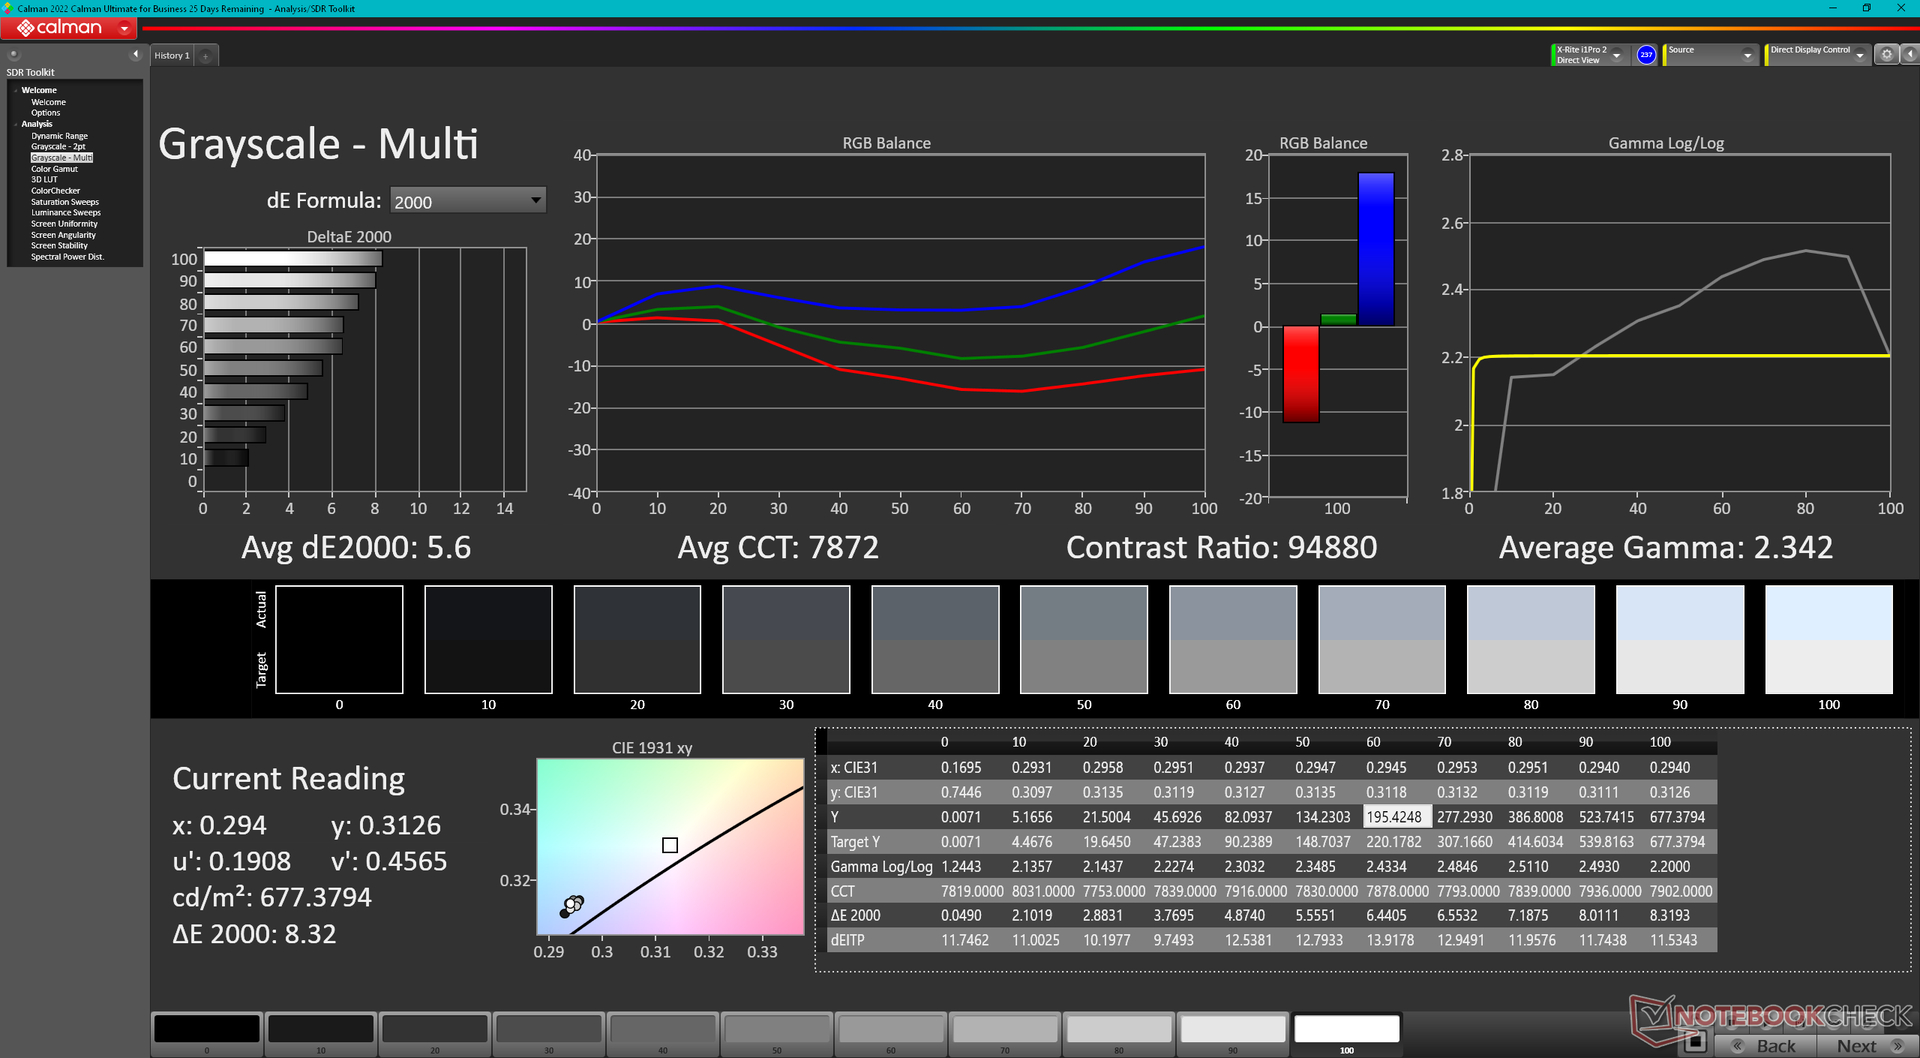
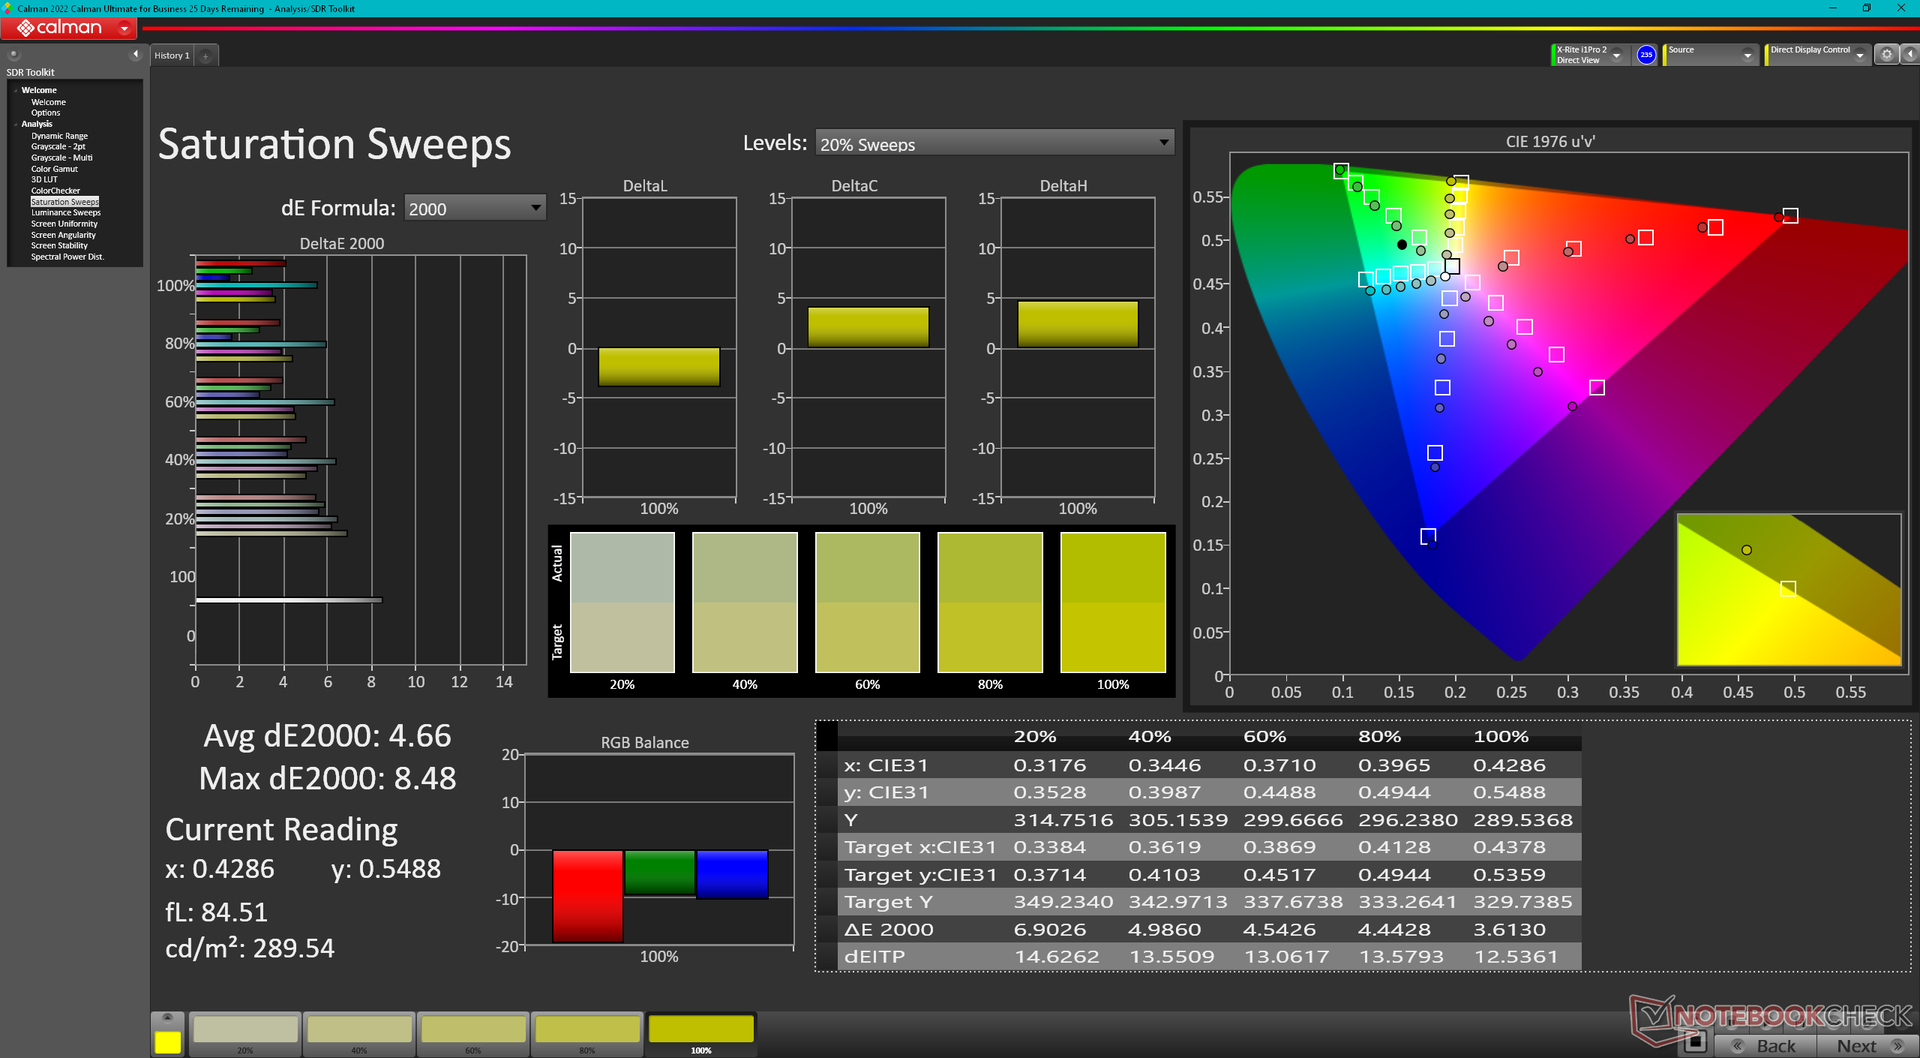
ΔE Color 3.56 | 0.5-29.43 Ø4.87, calibrated: 2.69
ΔE Greyscale 5.6 | 0.5-98 Ø5.1
84.8% AdobeRGB 1998 (Argyll 2.2.0 3D)
99.9% sRGB (Argyll 2.2.0 3D)
96.6% Display P3 (Argyll 2.2.0 3D)
Gamma: 2.34
| MSI Raider 18 HX A14V AU Optronics B180ZAN1.0, Mini-LED, 3840x2400, 18", 120 Hz | Razer Blade 18 2024 RZ09-0509 BOE NE180QDM-NM1, Mini-LED, 2560x1600, 18", 300 Hz | Alienware m18 R2 BOE NE18NZ1, IPS, 2560x1600, 18", 165 Hz | MSI Titan 18 HX A14VIG AU Optronics B180ZAN01.0, Mini-LED, 3840x2400, 18", 120 Hz | Asus ROG Strix G18 G814JI NE180QDM-NZ2 (BOE0B35), IPS, 2560x1600, 18", 240 Hz | Acer Predator Helios 18 PH18-72-98MW B180QAN01.2 (AUO45A8), Mini-LED, 2560x1600, 18", 250 Hz | |
|---|---|---|---|---|---|---|
| Display | 1% | 2% | 1% | 1% | 4% | |
| Display P3 Coverage | 96.6 | 99 2% | 97.8 1% | 98.1 2% | 98.1 2% | 99.7 3% |
| sRGB Coverage | 99.9 | 100 0% | 99.5 0% | 99.8 0% | 99.9 0% | 100 0% |
| AdobeRGB 1998 Coverage | 84.8 | 86.9 2% | 88.9 5% | 86.2 2% | 85.6 1% | 91.6 8% |
| Response Times | 341% | 68% | 3% | 67% | 62% | |
| Response Time Grey 50% / Grey 80% * | 10.4 ? | 7.6 ? 27% | 5.3 ? 49% | 8.6 ? 17% | 5.6 ? 46% | 8 ? 23% |
| Response Time Black / White * | 75.8 ? | 14 ? 82% | 10.4 ? 86% | 81.8 ? -8% | 9 ? 88% | 17.6 ? 77% |
| PWM Frequency | 2606.2 ? | 26444 ? 915% | 2592 ? -1% | 4832 ? 85% | ||
| Screen | 29% | 8% | 2% | 23% | 24% | |
| Brightness middle | 575.7 | 605.4 5% | 271.8 -53% | 467.5 -19% | 471 -18% | 722 25% |
| Brightness | 574 | 600 5% | 275 -52% | 459 -20% | 422 -26% | 724 26% |
| Brightness Distribution | 94 | 97 3% | 78 -17% | 90 -4% | 83 -12% | 93 -1% |
| Black Level * | 0.62 | 0.27 | 0.47 | 0.04 | ||
| Colorchecker dE 2000 * | 3.56 | 1.53 57% | 2.48 30% | 3.77 -6% | 2.05 42% | 3.4 4% |
| Colorchecker dE 2000 max. * | 8.64 | 4.15 52% | 5.59 35% | 6.12 29% | 4.15 52% | 5.32 38% |
| Colorchecker dE 2000 calibrated * | 2.69 | 0.56 79% | 2.94 -9% | 0.8 70% | 1.6 41% | |
| Greyscale dE 2000 * | 5.6 | 2.6 54% | 3.7 34% | 3.2 43% | 2.8 50% | 3.8 32% |
| Gamma | 2.34 94% | 2.22 99% | 2.2 100% | 2.43 91% | 2.204 100% | 2.383 92% |
| CCT | 7872 83% | 6843 95% | 6355 102% | 6478 100% | 7122 91% | 7051 92% |
| Contrast | 976 | 1007 | 1002 | 18050 | ||
| Total Average (Program / Settings) | 124% /
100% | 26% /
16% | 2% /
2% | 30% /
25% | 30% /
28% |
* ... smaller is better
当设置为显示 P3 和关闭 HDR 时,色温为 7872,相当冷。启用 HDR 会自动禁用任何微星 TrueColor 设置,但色温也会在 6521 时自动变暖,以获得更准确的色彩。微星没有对这款 Raider 型号进行出厂校准。
Display Response Times
| ↔ Response Time Black to White | ||
|---|---|---|
| 75.8 ms ... rise ↗ and fall ↘ combined | ↗ 71 ms rise | 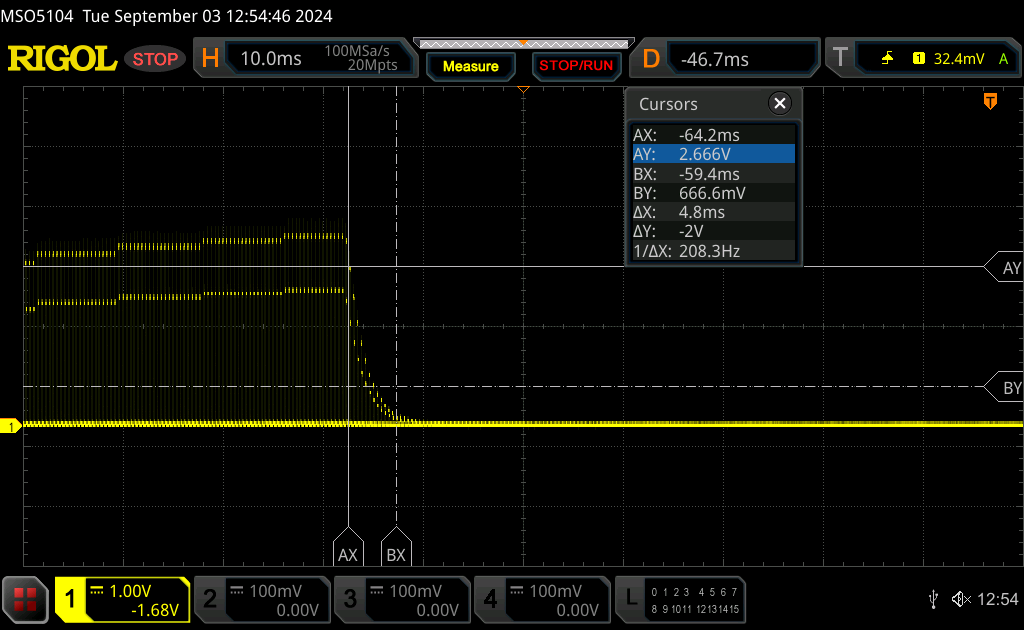 |
| ↘ 4.8 ms fall | ||
| The screen shows slow response rates in our tests and will be unsatisfactory for gamers. In comparison, all tested devices range from 0.1 (minimum) to 240 (maximum) ms. » 100 % of all devices are better. This means that the measured response time is worse than the average of all tested devices (20.8 ms). | ||
| ↔ Response Time 50% Grey to 80% Grey | ||
| 10.4 ms ... rise ↗ and fall ↘ combined | ↗ 4.8 ms rise | 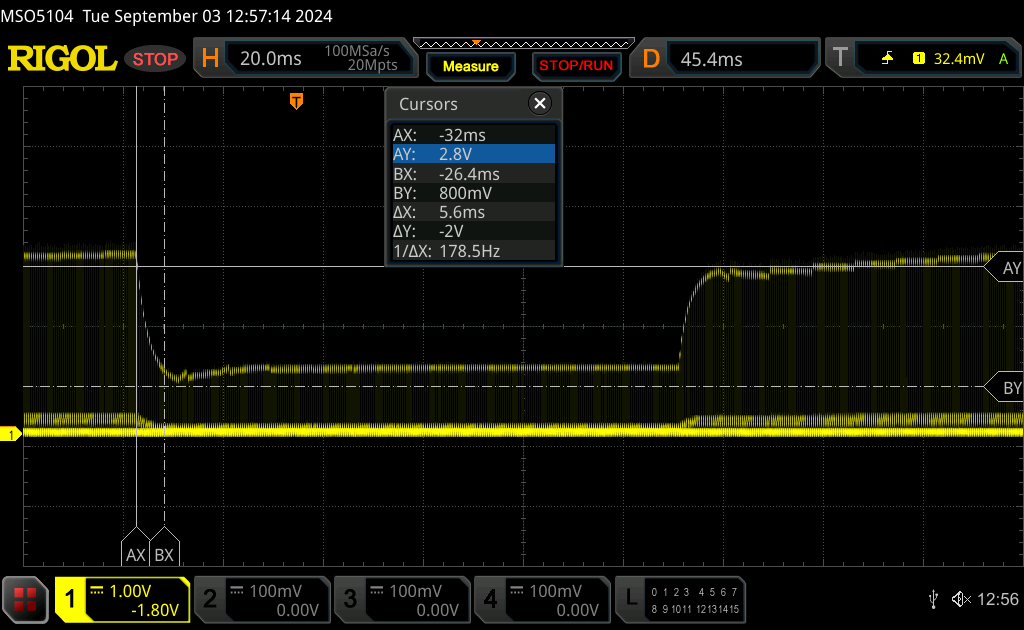 |
| ↘ 5.6 ms fall | ||
| The screen shows good response rates in our tests, but may be too slow for competitive gamers. In comparison, all tested devices range from 0.165 (minimum) to 636 (maximum) ms. » 21 % of all devices are better. This means that the measured response time is better than the average of all tested devices (32.5 ms). | ||
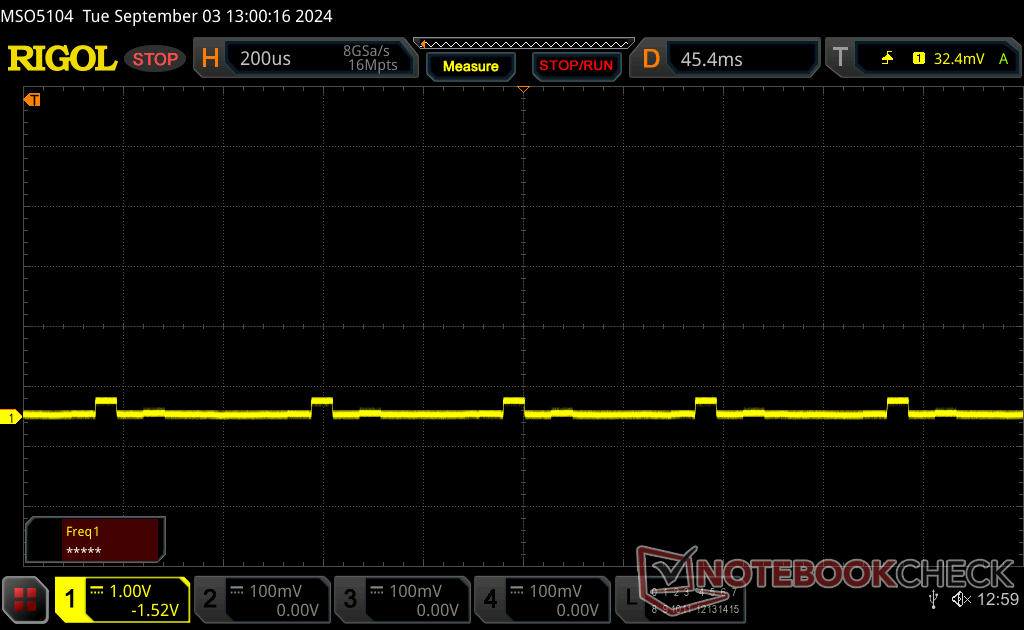
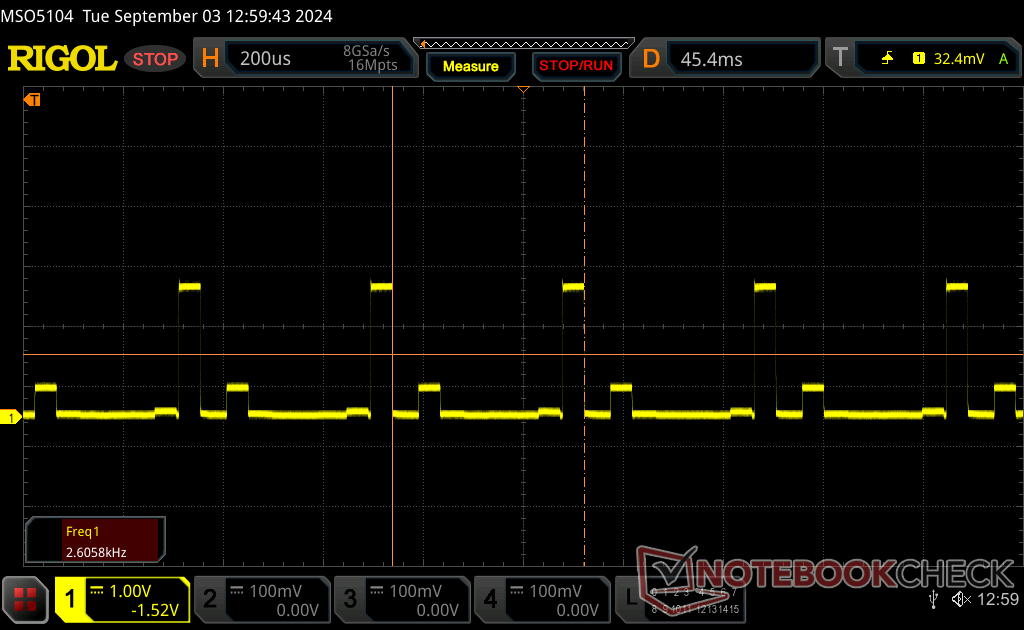
Screen Flickering / PWM (Pulse-Width Modulation)
| Screen flickering / PWM detected | 2606.2 Hz Amplitude: 90 % | ≤ 100 % brightness setting | 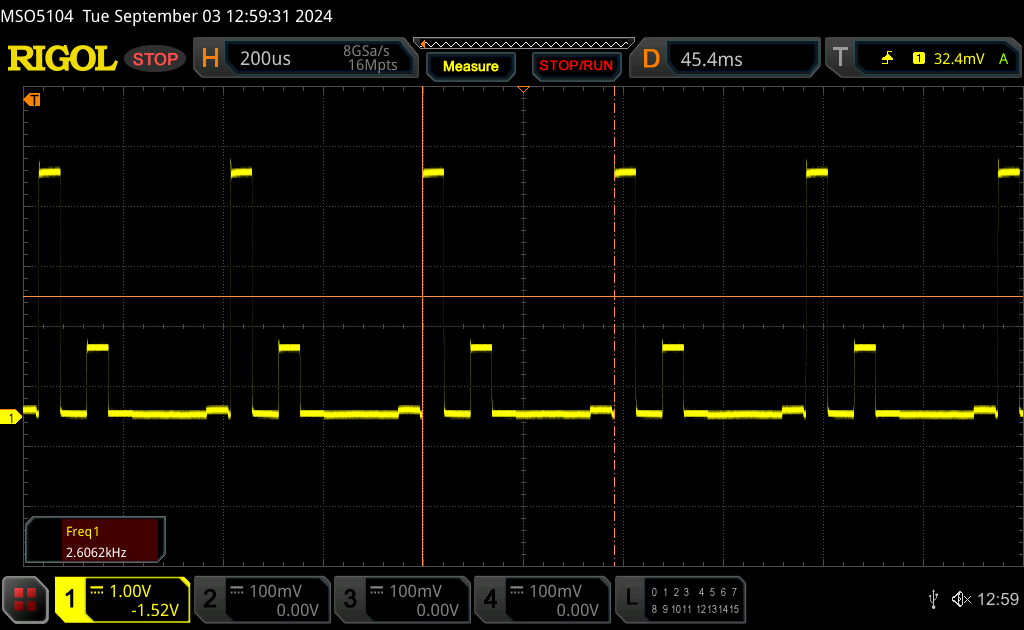 |
The display backlight flickers at 2606.2 Hz (worst case, e.g., utilizing PWM) Flickering detected at a brightness setting of 100 % and below. There should be no flickering or PWM above this brightness setting. The frequency of 2606.2 Hz is quite high, so most users sensitive to PWM should not notice any flickering. In comparison: 53 % of all tested devices do not use PWM to dim the display. If PWM was detected, an average of 8519 (minimum: 5 - maximum: 343500) Hz was measured. | |||


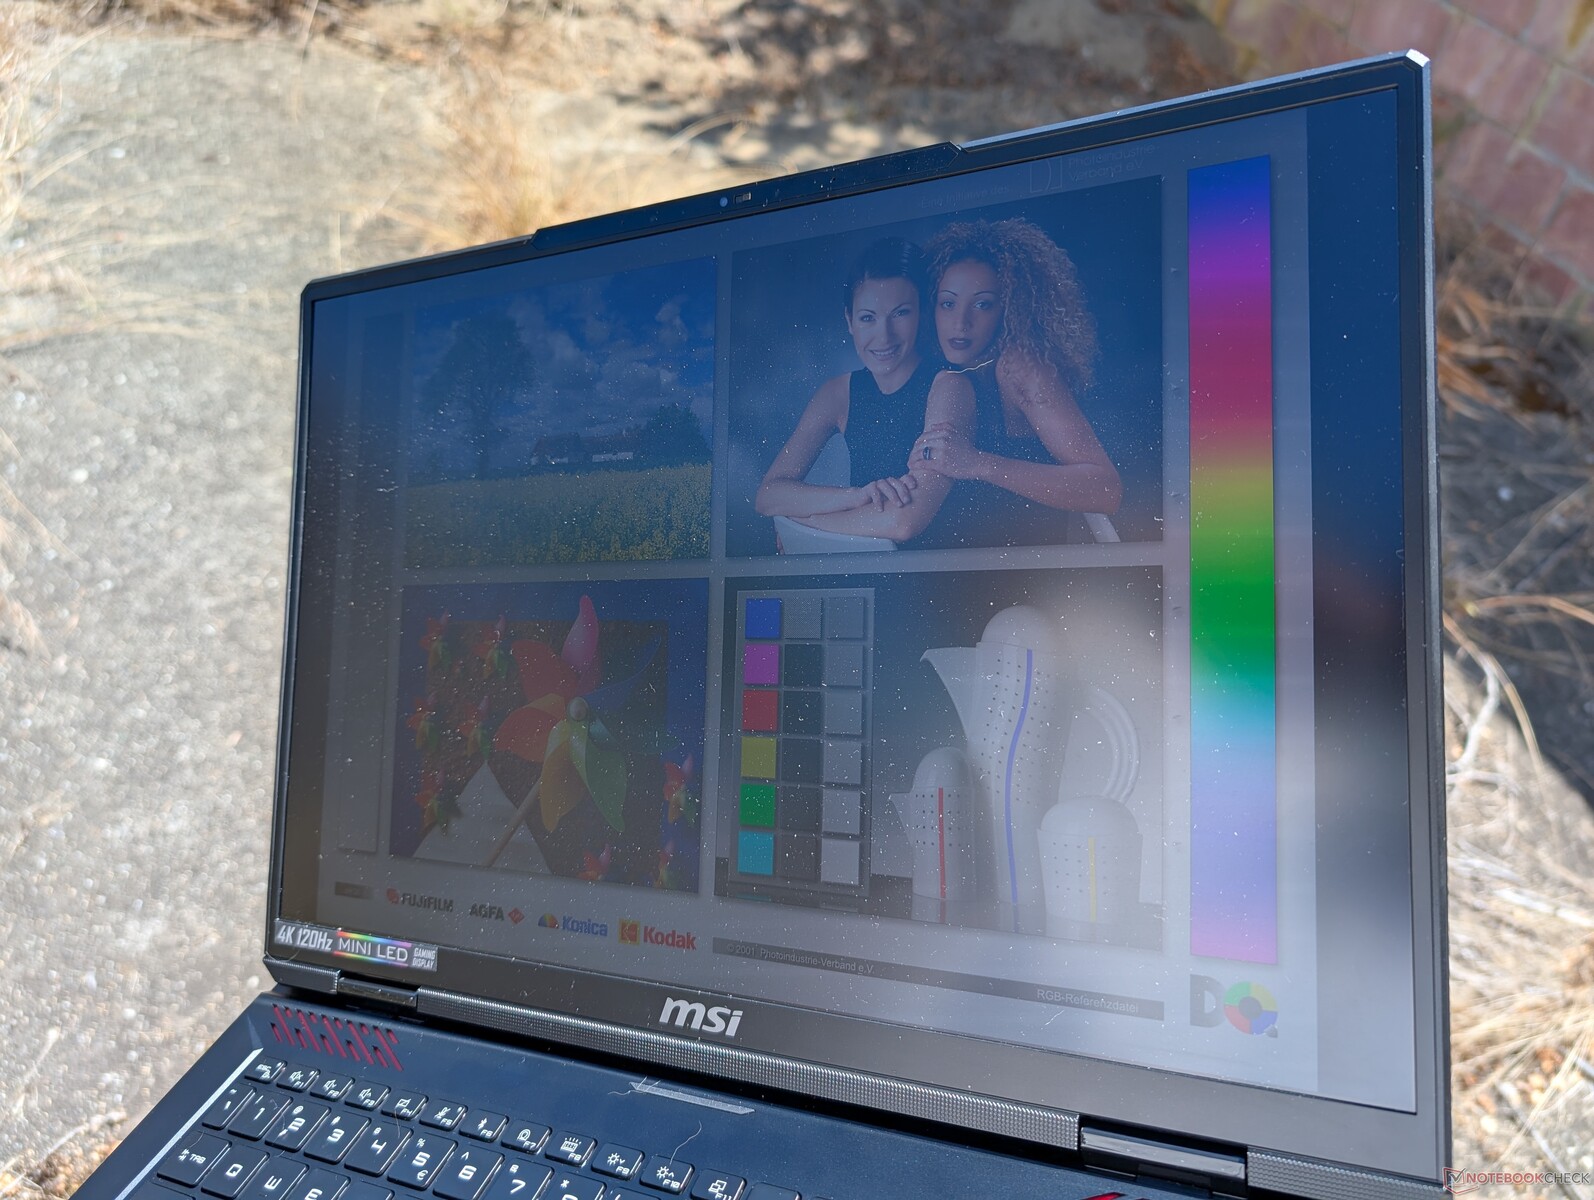
室外能见度在阴凉处尚可,在阳光下就不太理想了。使用电池供电时,最大亮度仅为 392 尼特,而且 Windows HDR 会自动禁用。
性能 - 新的 CPU 名称,相同的 CPU 性能
测试条件
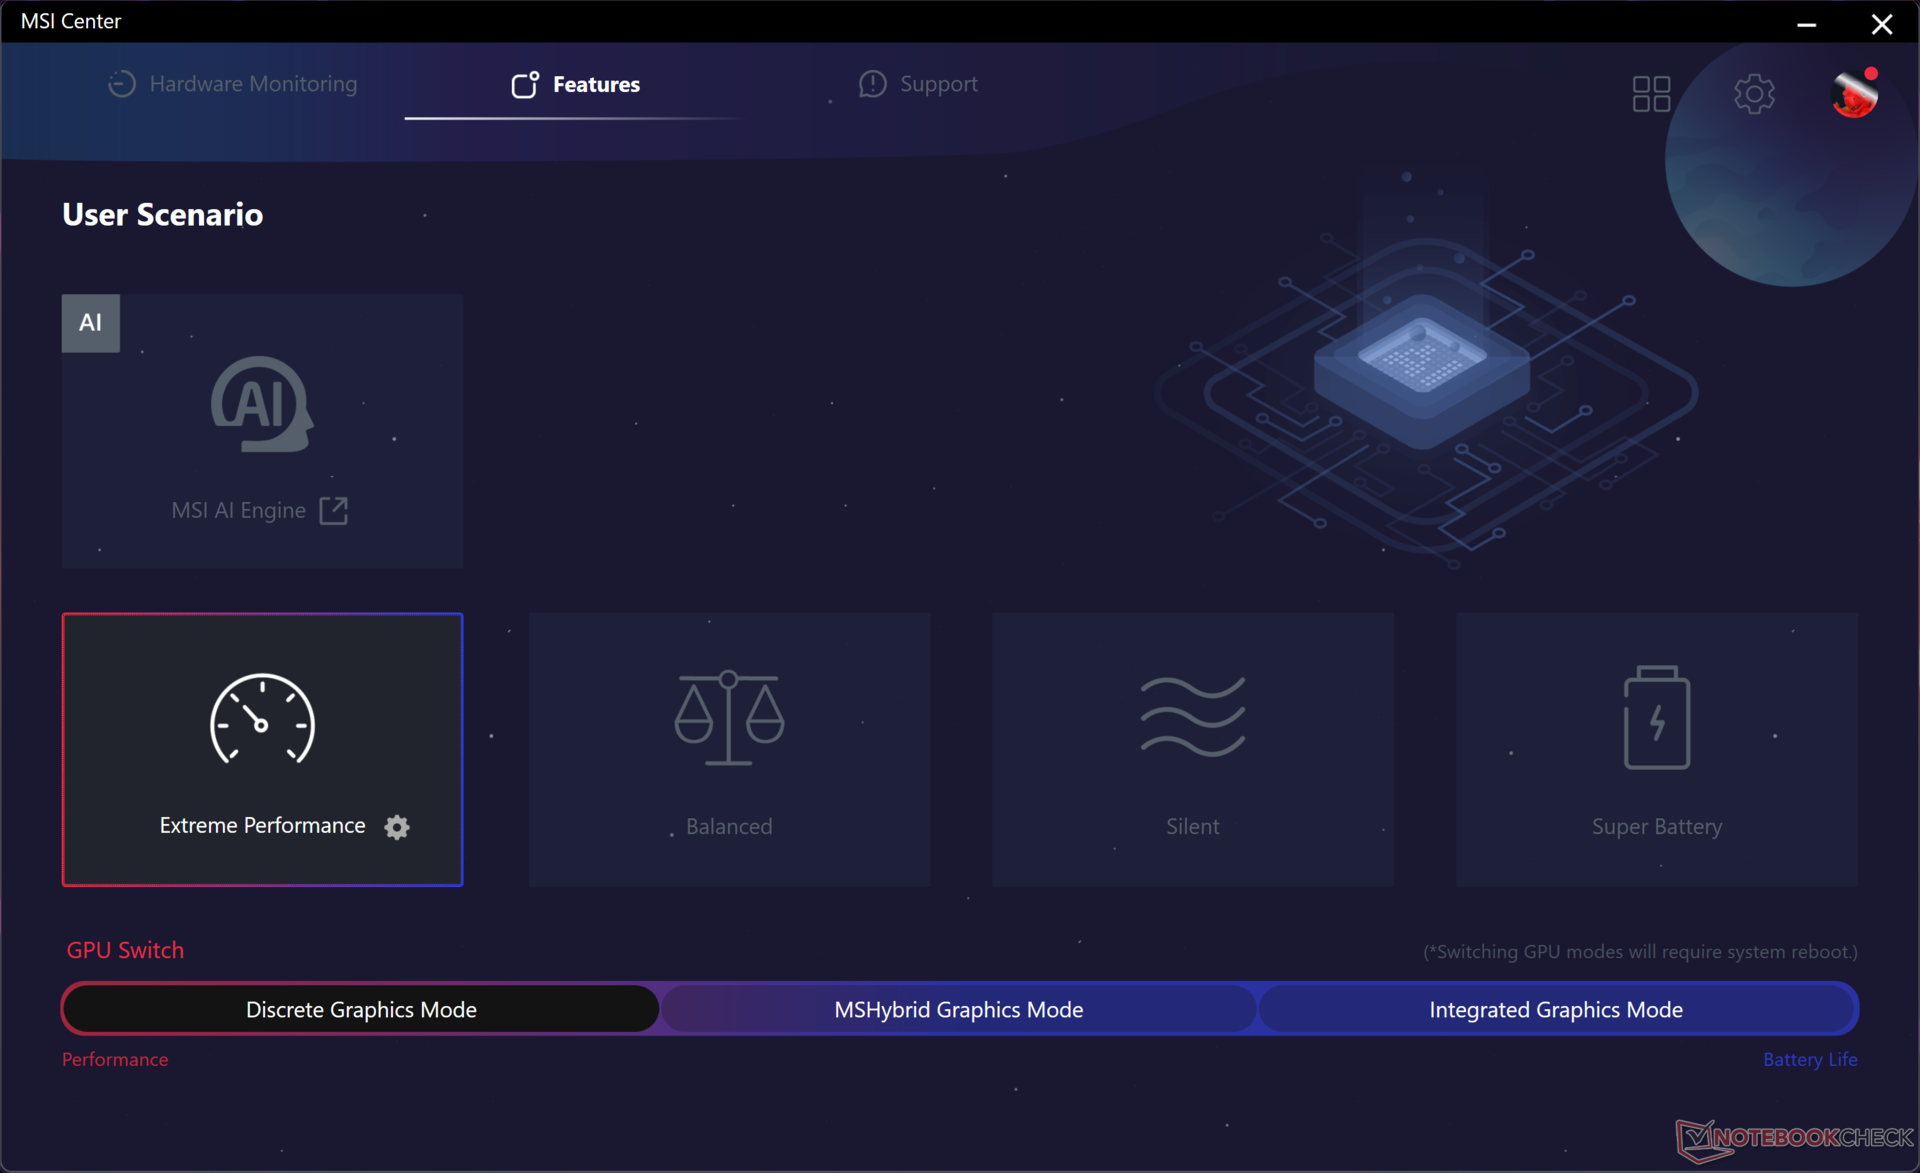
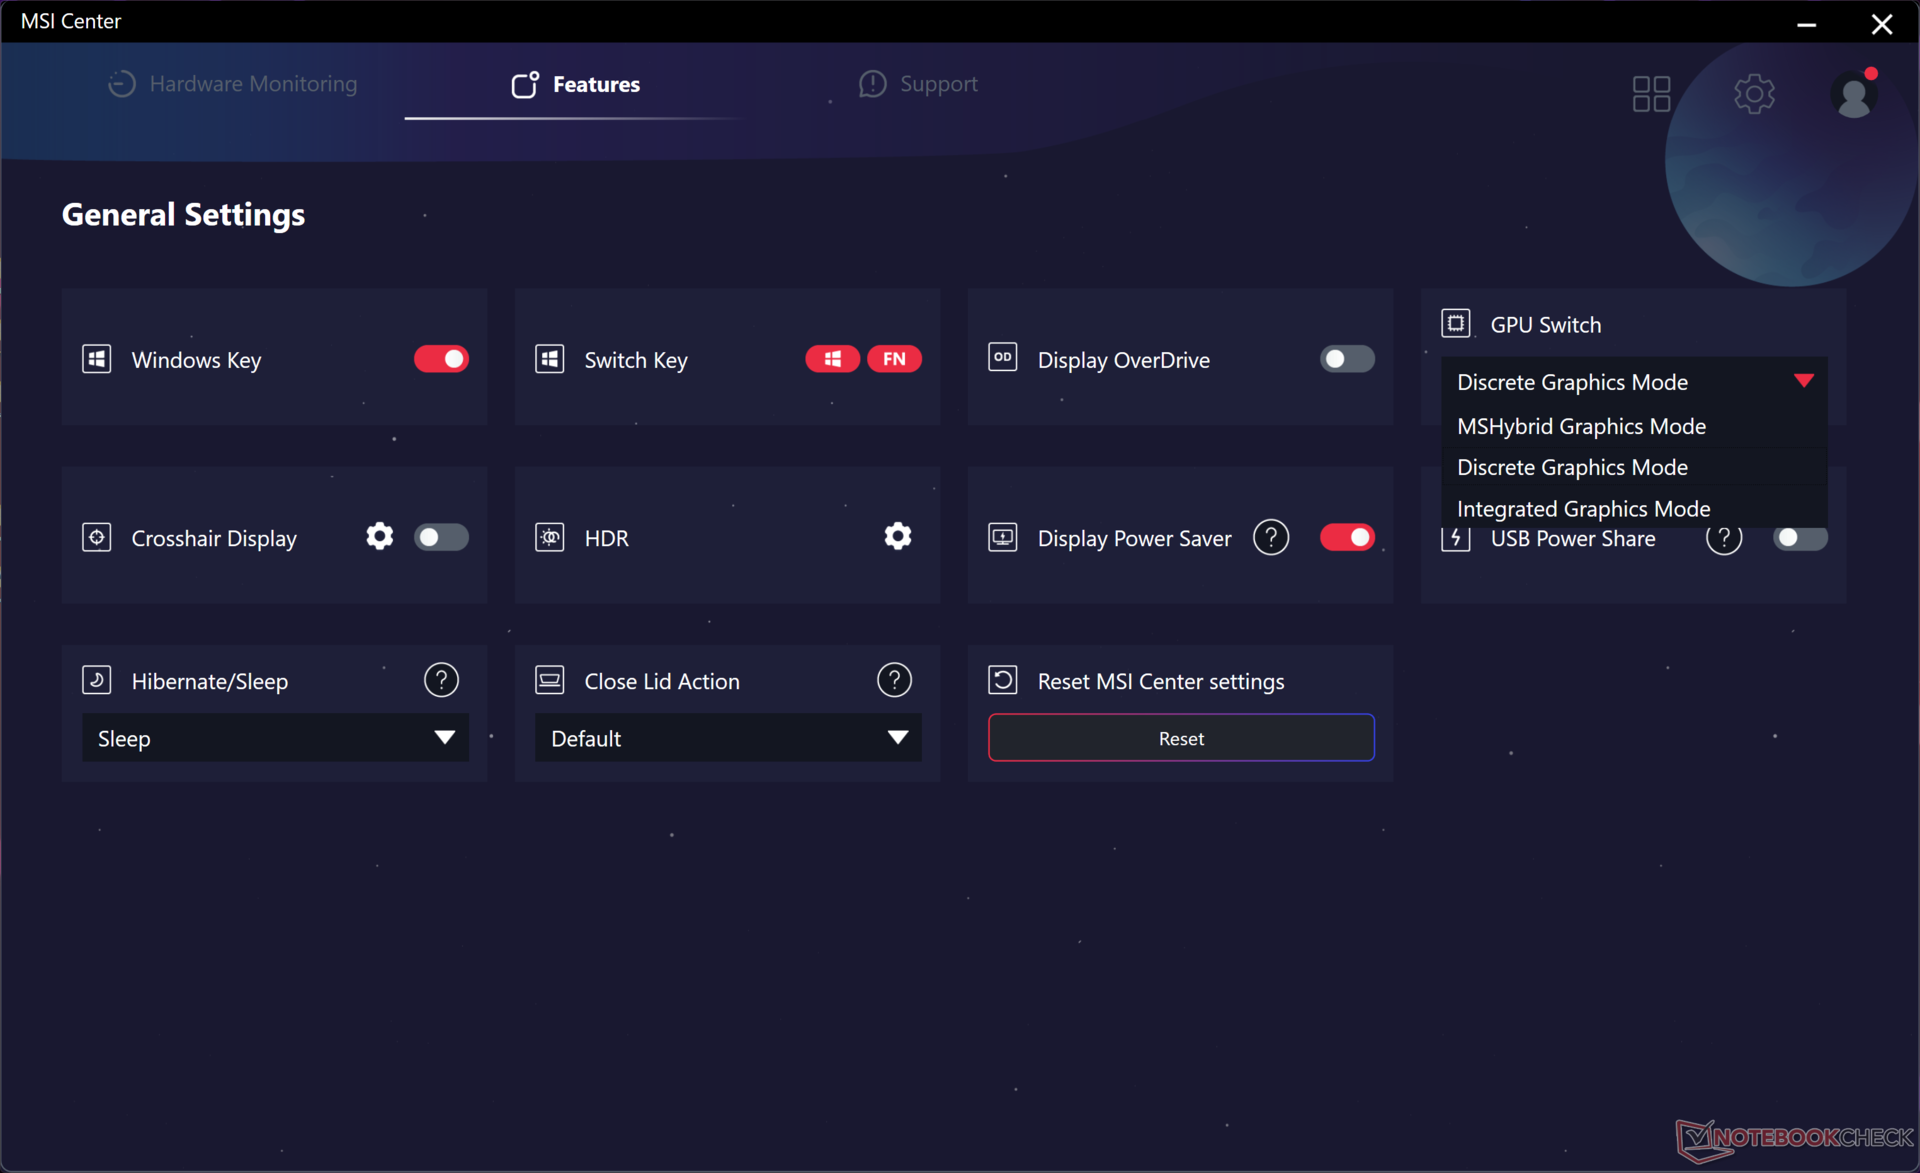
在运行以下基准测试之前,我们将 GPU 设置为独立显卡模式,Windows 设置为性能模式,MSI Center 设置为极致性能模式。Cooler Boost 模式(即最大风扇模式)是极致性能模式下的另一项设置,但正如我们的研究结果所显示的那样,要获得最高性能通常并不需要这个选项。这与我们在其他具有相同 Cooler Boost 功能的微星笔记本电脑上的体验是一致的。
MUX 支持在 dGPU、iGPU 和 MSHybrid 模式之间切换,但高级优化功能与 Titan 18 HX 不同。事实上,4K mini-LED 面板的一个主要缺点是不支持 G-Sync。
处理器
酷睿 i9-14900HX 酷睿 i9-14900HX仅仅是一个重新命名的 酷睿 i9-13900HX因此充其量只能提供微不足道的优势。即便如此,在 CineBench 或 Blender 渲染等传统性能指标方面,它仍然是笔记本电脑上速度最快的 CPU 之一。该 CPU 与 Meteor Lake 酷睿至尊 9 185H的补充,该处理器通过集成的 NPU 实现了部分原始性能,从而加速了人工智能任务。
与我们在宏碁 Predator Helios 18 上观察到的情况不同,该机的性能可持续性非常出色,在受压时时钟频率不会出现大幅下降。 宏碁掠夺者 Helios 18上的情况不同。
切换到基于 AMD 的 Ryzen 9 7945HX配置有望将多线程性能提升 10% 至 15%,而单线程性能则会下降 10% 至 15%。
Cinebench R15 Multi Loop
Cinebench R23: Multi Core | Single Core
Cinebench R20: CPU (Multi Core) | CPU (Single Core)
Cinebench R15: CPU Multi 64Bit | CPU Single 64Bit
Blender: v2.79 BMW27 CPU
7-Zip 18.03: 7z b 4 | 7z b 4 -mmt1
Geekbench 6.4: Multi-Core | Single-Core
Geekbench 5.5: Multi-Core | Single-Core
HWBOT x265 Benchmark v2.2: 4k Preset
LibreOffice : 20 Documents To PDF
R Benchmark 2.5: Overall mean
* ... smaller is better
AIDA64: FP32 Ray-Trace | FPU Julia | CPU SHA3 | CPU Queen | FPU SinJulia | FPU Mandel | CPU AES | CPU ZLib | FP64 Ray-Trace | CPU PhotoWorxx
| Performance Rating | |
| Alienware m18 R2 | |
| MSI Titan 18 HX A14VIG | |
| MSI Raider 18 HX A14V | |
| Average Intel Core i9-14900HX | |
| Razer Blade 18 2024 RZ09-0509 | |
| Acer Predator Helios 18 PH18-72-98MW | |
| Asus ROG Strix G18 G814JI | |
| AIDA64 / FP32 Ray-Trace | |
| MSI Titan 18 HX A14VIG | |
| Alienware m18 R2 | |
| MSI Raider 18 HX A14V | |
| Razer Blade 18 2024 RZ09-0509 | |
| Average Intel Core i9-14900HX (13098 - 33474, n=36) | |
| Acer Predator Helios 18 PH18-72-98MW | |
| Asus ROG Strix G18 G814JI | |
| AIDA64 / FPU Julia | |
| MSI Titan 18 HX A14VIG | |
| Alienware m18 R2 | |
| MSI Raider 18 HX A14V | |
| Razer Blade 18 2024 RZ09-0509 | |
| Average Intel Core i9-14900HX (67573 - 166040, n=36) | |
| Acer Predator Helios 18 PH18-72-98MW | |
| Asus ROG Strix G18 G814JI | |
| AIDA64 / CPU SHA3 | |
| MSI Titan 18 HX A14VIG | |
| Alienware m18 R2 | |
| MSI Raider 18 HX A14V | |
| Razer Blade 18 2024 RZ09-0509 | |
| Average Intel Core i9-14900HX (3589 - 7979, n=36) | |
| Acer Predator Helios 18 PH18-72-98MW | |
| Asus ROG Strix G18 G814JI | |
| AIDA64 / CPU Queen | |
| MSI Titan 18 HX A14VIG | |
| MSI Raider 18 HX A14V | |
| Alienware m18 R2 | |
| Acer Predator Helios 18 PH18-72-98MW | |
| Average Intel Core i9-14900HX (118405 - 148966, n=36) | |
| Razer Blade 18 2024 RZ09-0509 | |
| Asus ROG Strix G18 G814JI | |
| AIDA64 / FPU SinJulia | |
| MSI Titan 18 HX A14VIG | |
| MSI Raider 18 HX A14V | |
| Alienware m18 R2 | |
| Razer Blade 18 2024 RZ09-0509 | |
| Average Intel Core i9-14900HX (10475 - 18517, n=36) | |
| Acer Predator Helios 18 PH18-72-98MW | |
| Asus ROG Strix G18 G814JI | |
| AIDA64 / FPU Mandel | |
| Alienware m18 R2 | |
| MSI Titan 18 HX A14VIG | |
| MSI Raider 18 HX A14V | |
| Razer Blade 18 2024 RZ09-0509 | |
| Average Intel Core i9-14900HX (32543 - 83662, n=36) | |
| Acer Predator Helios 18 PH18-72-98MW | |
| Asus ROG Strix G18 G814JI | |
| AIDA64 / CPU AES | |
| Average Intel Core i9-14900HX (86964 - 241777, n=36) | |
| MSI Titan 18 HX A14VIG | |
| Alienware m18 R2 | |
| MSI Raider 18 HX A14V | |
| Razer Blade 18 2024 RZ09-0509 | |
| Acer Predator Helios 18 PH18-72-98MW | |
| Asus ROG Strix G18 G814JI | |
| AIDA64 / CPU ZLib | |
| MSI Titan 18 HX A14VIG | |
| Alienware m18 R2 | |
| MSI Raider 18 HX A14V | |
| Razer Blade 18 2024 RZ09-0509 | |
| Average Intel Core i9-14900HX (1054 - 2292, n=36) | |
| Acer Predator Helios 18 PH18-72-98MW | |
| Asus ROG Strix G18 G814JI | |
| AIDA64 / FP64 Ray-Trace | |
| Alienware m18 R2 | |
| MSI Titan 18 HX A14VIG | |
| MSI Raider 18 HX A14V | |
| Razer Blade 18 2024 RZ09-0509 | |
| Average Intel Core i9-14900HX (6809 - 18349, n=36) | |
| Acer Predator Helios 18 PH18-72-98MW | |
| Asus ROG Strix G18 G814JI | |
| AIDA64 / CPU PhotoWorxx | |
| Alienware m18 R2 | |
| Razer Blade 18 2024 RZ09-0509 | |
| Acer Predator Helios 18 PH18-72-98MW | |
| Average Intel Core i9-14900HX (23903 - 54702, n=36) | |
| Asus ROG Strix G18 G814JI | |
| MSI Raider 18 HX A14V | |
| MSI Titan 18 HX A14VIG | |
压力测试
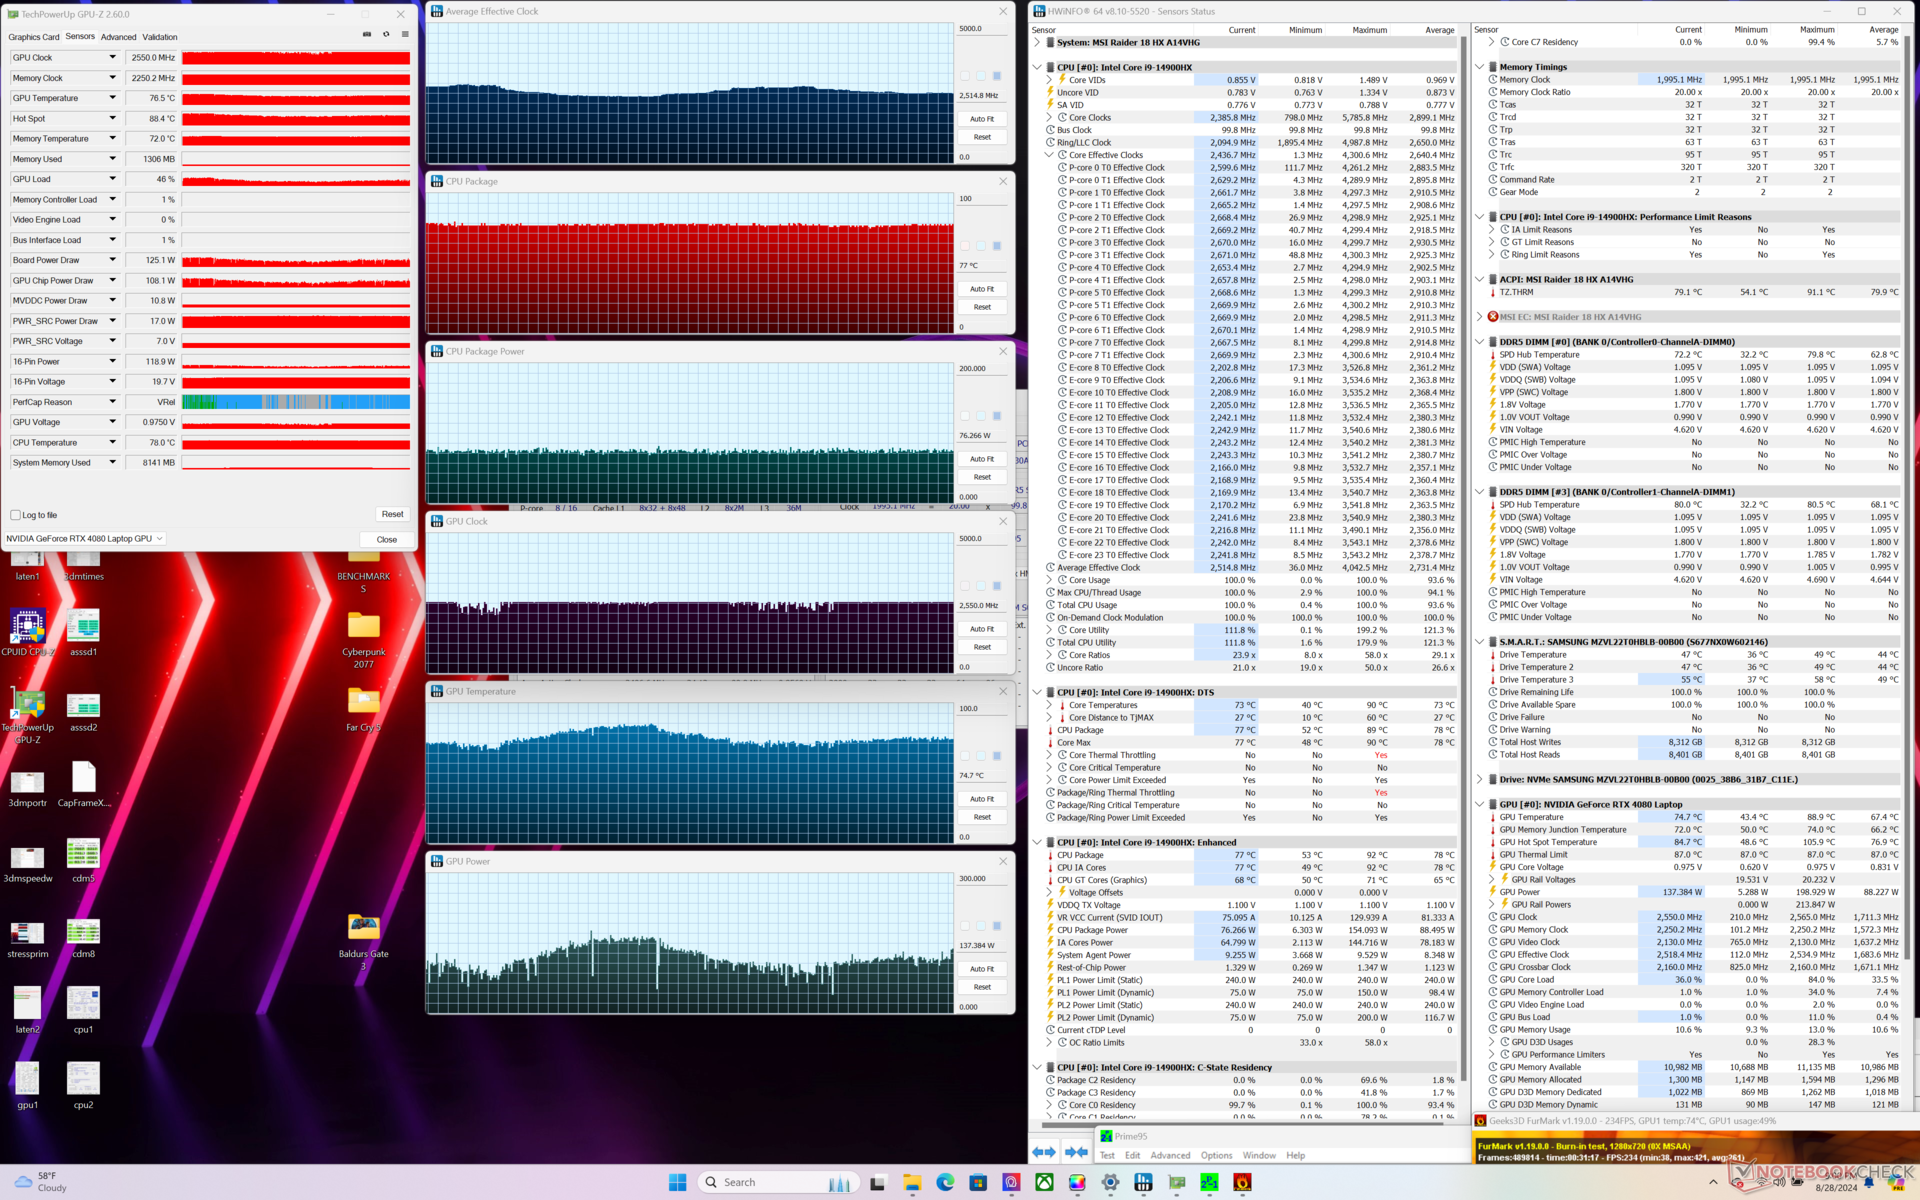
在启动 Prime95 压力时,CPU 的频率将升至 4 GHz、86 C 和 145 W,随着时间的推移,时钟频率或性能不会出现重大下降。与采用相同处理器的小型系统相比,大型机箱和冷却解决方案可以从酷睿 i9-14900HX 中提取更多性能,例如 RedMagic Titan 16 Pro相比,酷睿 i9-14900HX 可以发挥出更高的性能。
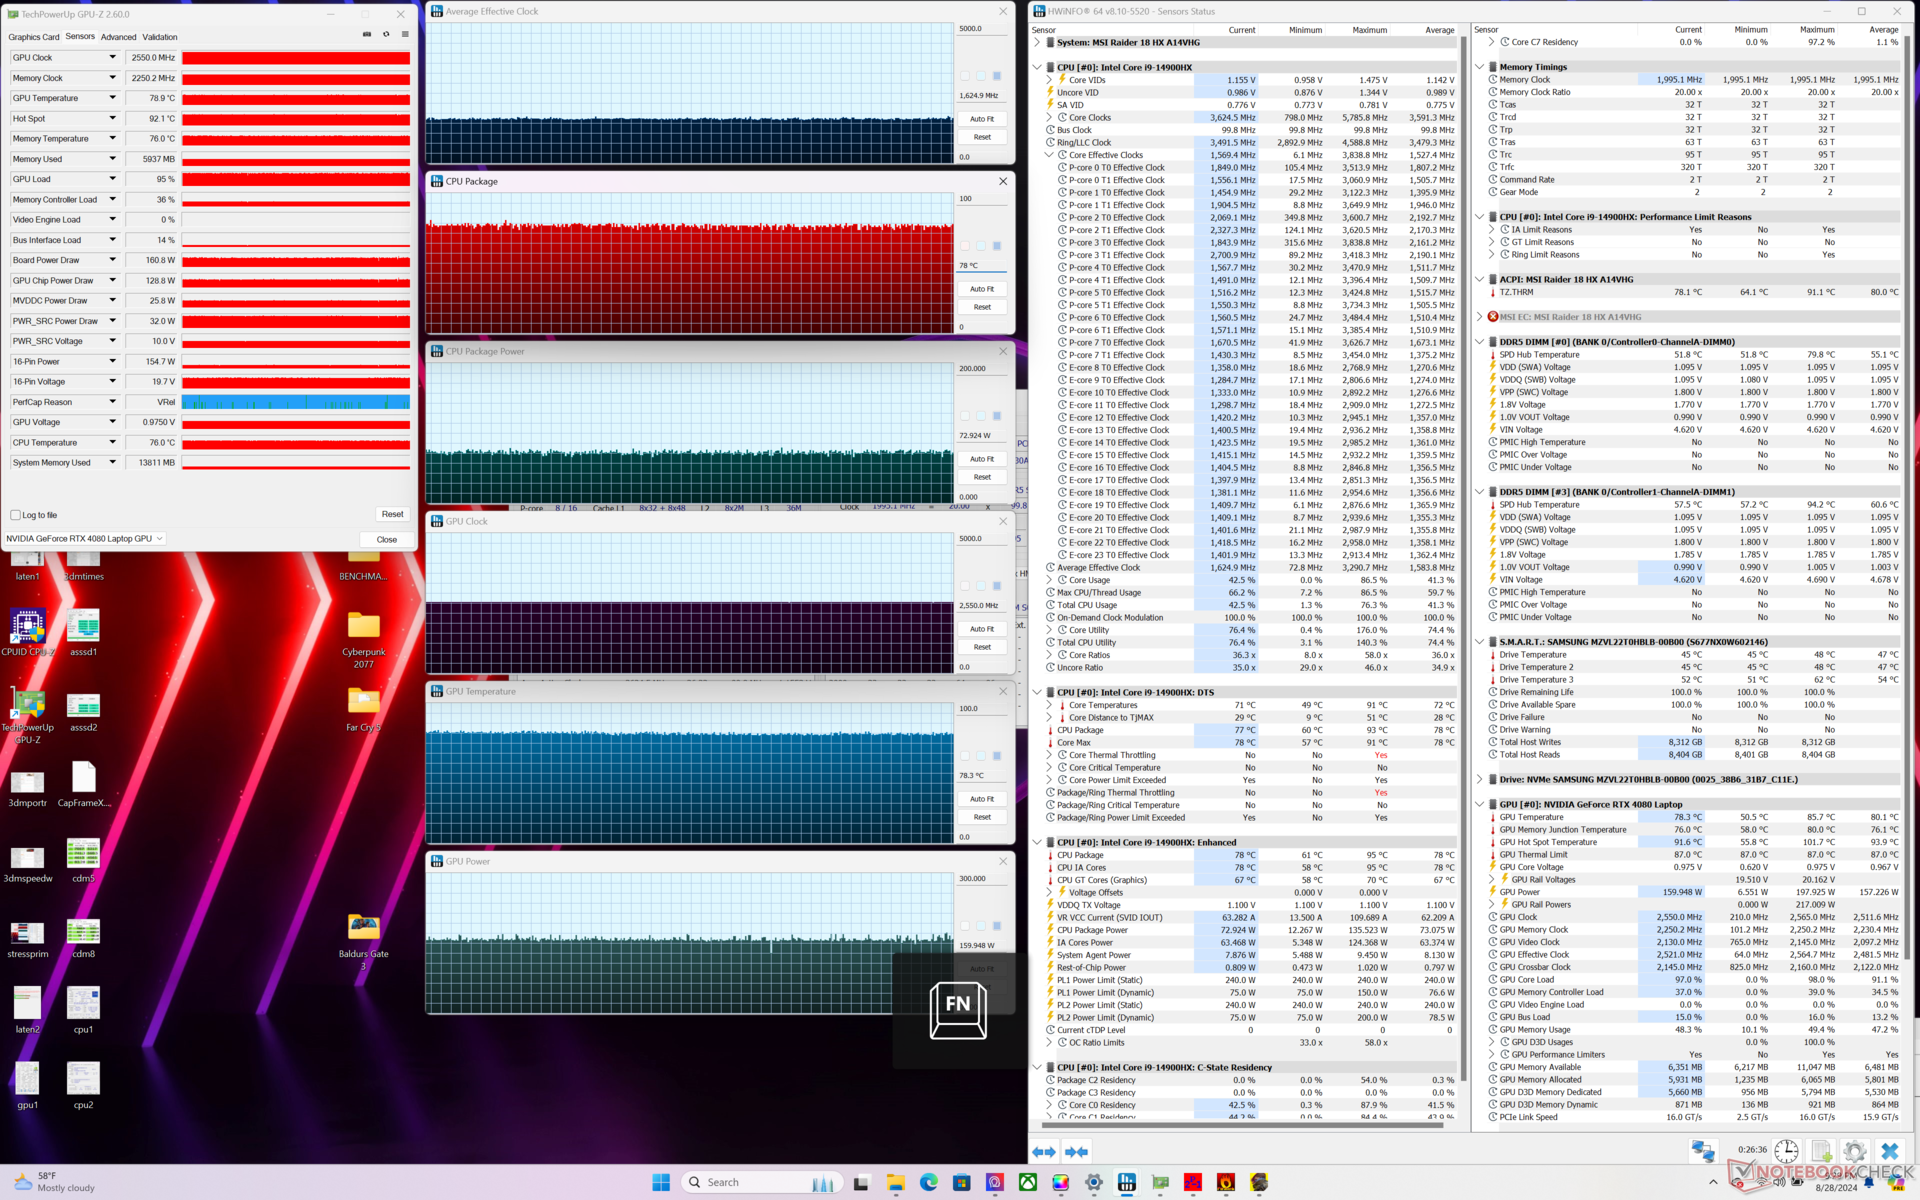
与关闭 Cooler Boost 相比,开启 Cooler Boost 的极致性能模式在游戏时没有明显的性能优势。在运行《赛博朋克 2077》时,两种设置下的 GPU 时钟率、内存时钟率和板载功耗分别稳定在 2550 MHz、2250 MHz 和 159 W。由于风扇噪音较大,Cooler Boost 模式下的核心温度略低几摄氏度,但这是唯一明显的优势。
降至平衡模式后,GPU 时钟频率和板载功耗分别降至 2295 MHz 和 150 W,仅比极限性能模式略低。因此,平衡模式和极致性能模式之间的性能差距比预期的要小。
GPU 温度比 Razer Blade 18游戏时的 GPU 温度比 Razer Blade 18 高出 9 摄氏度,尽管我们的微星系统更厚更重。

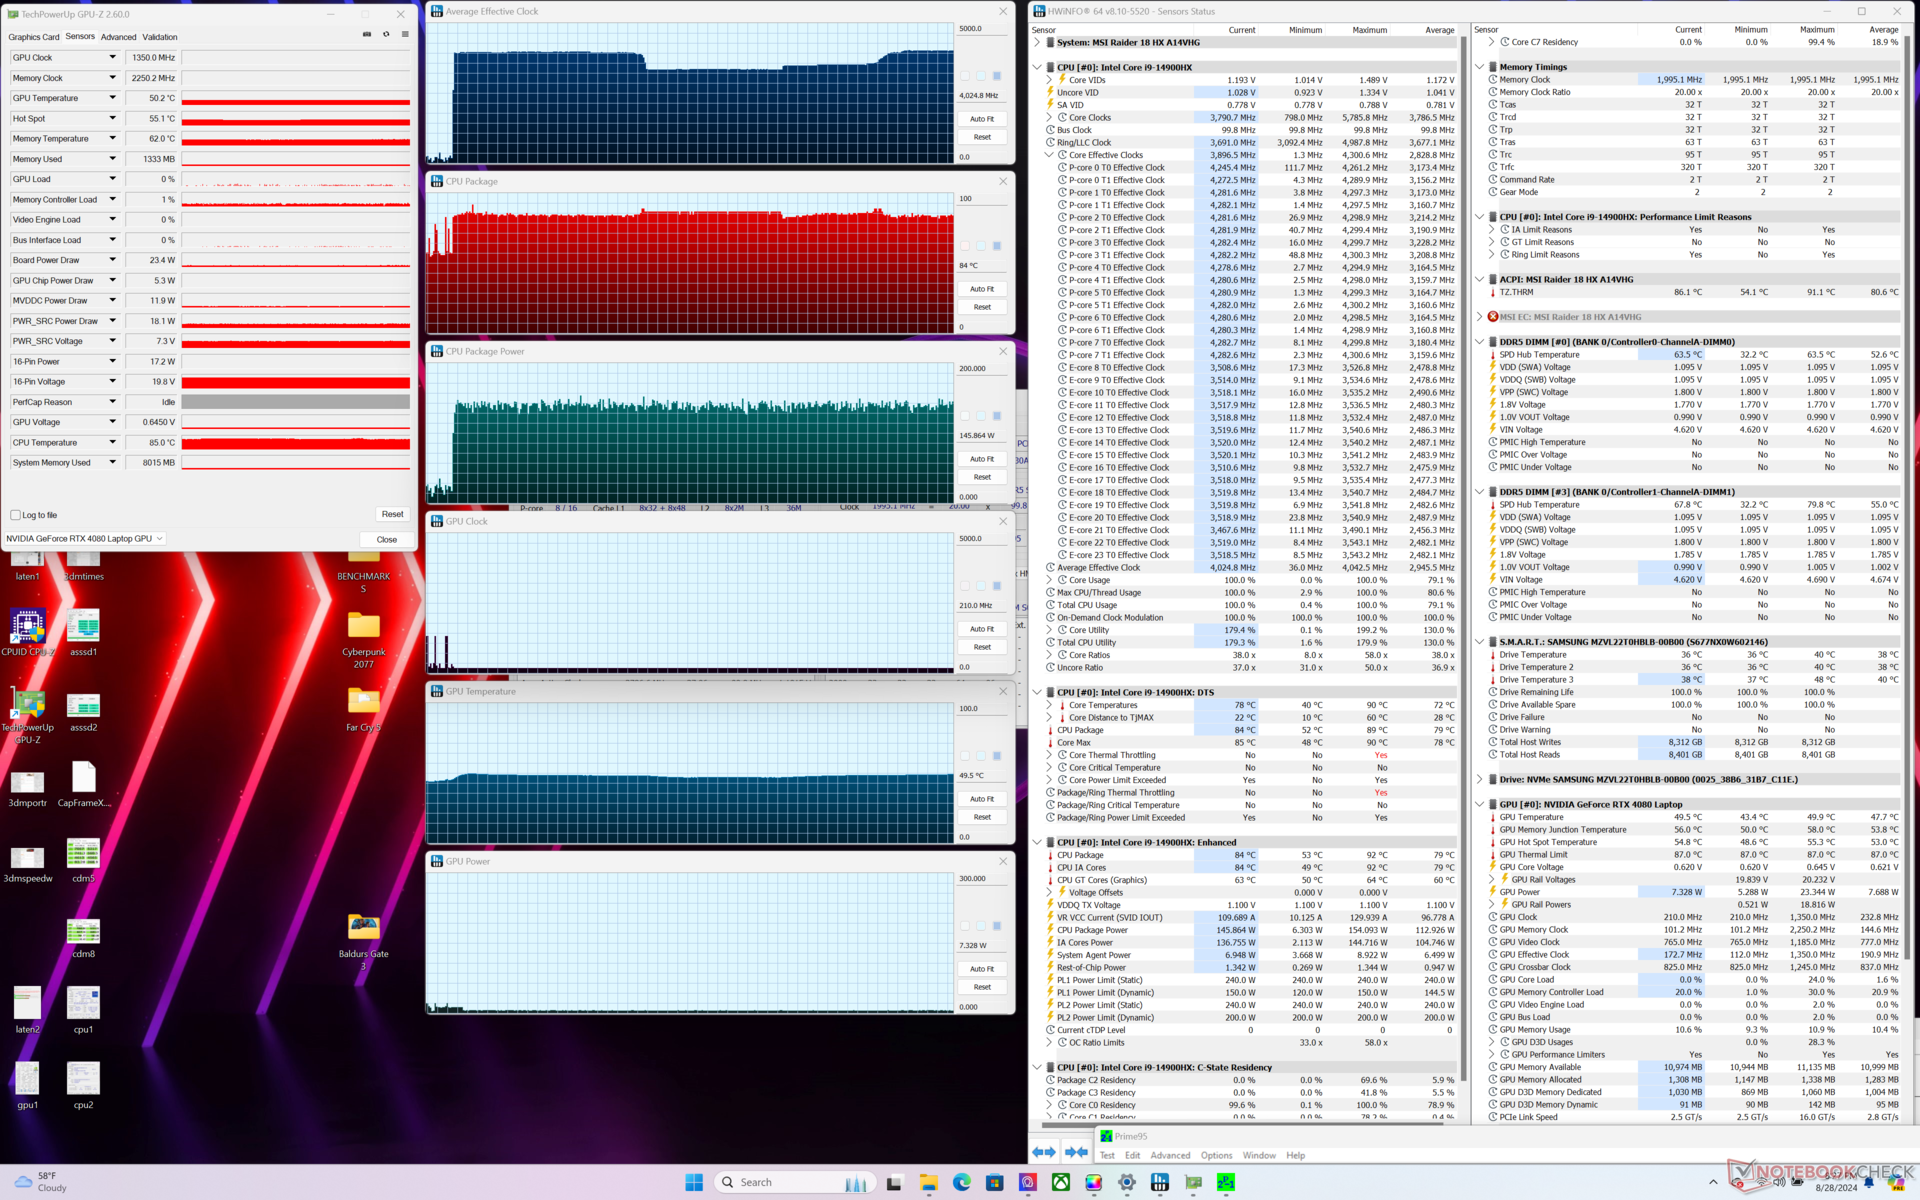
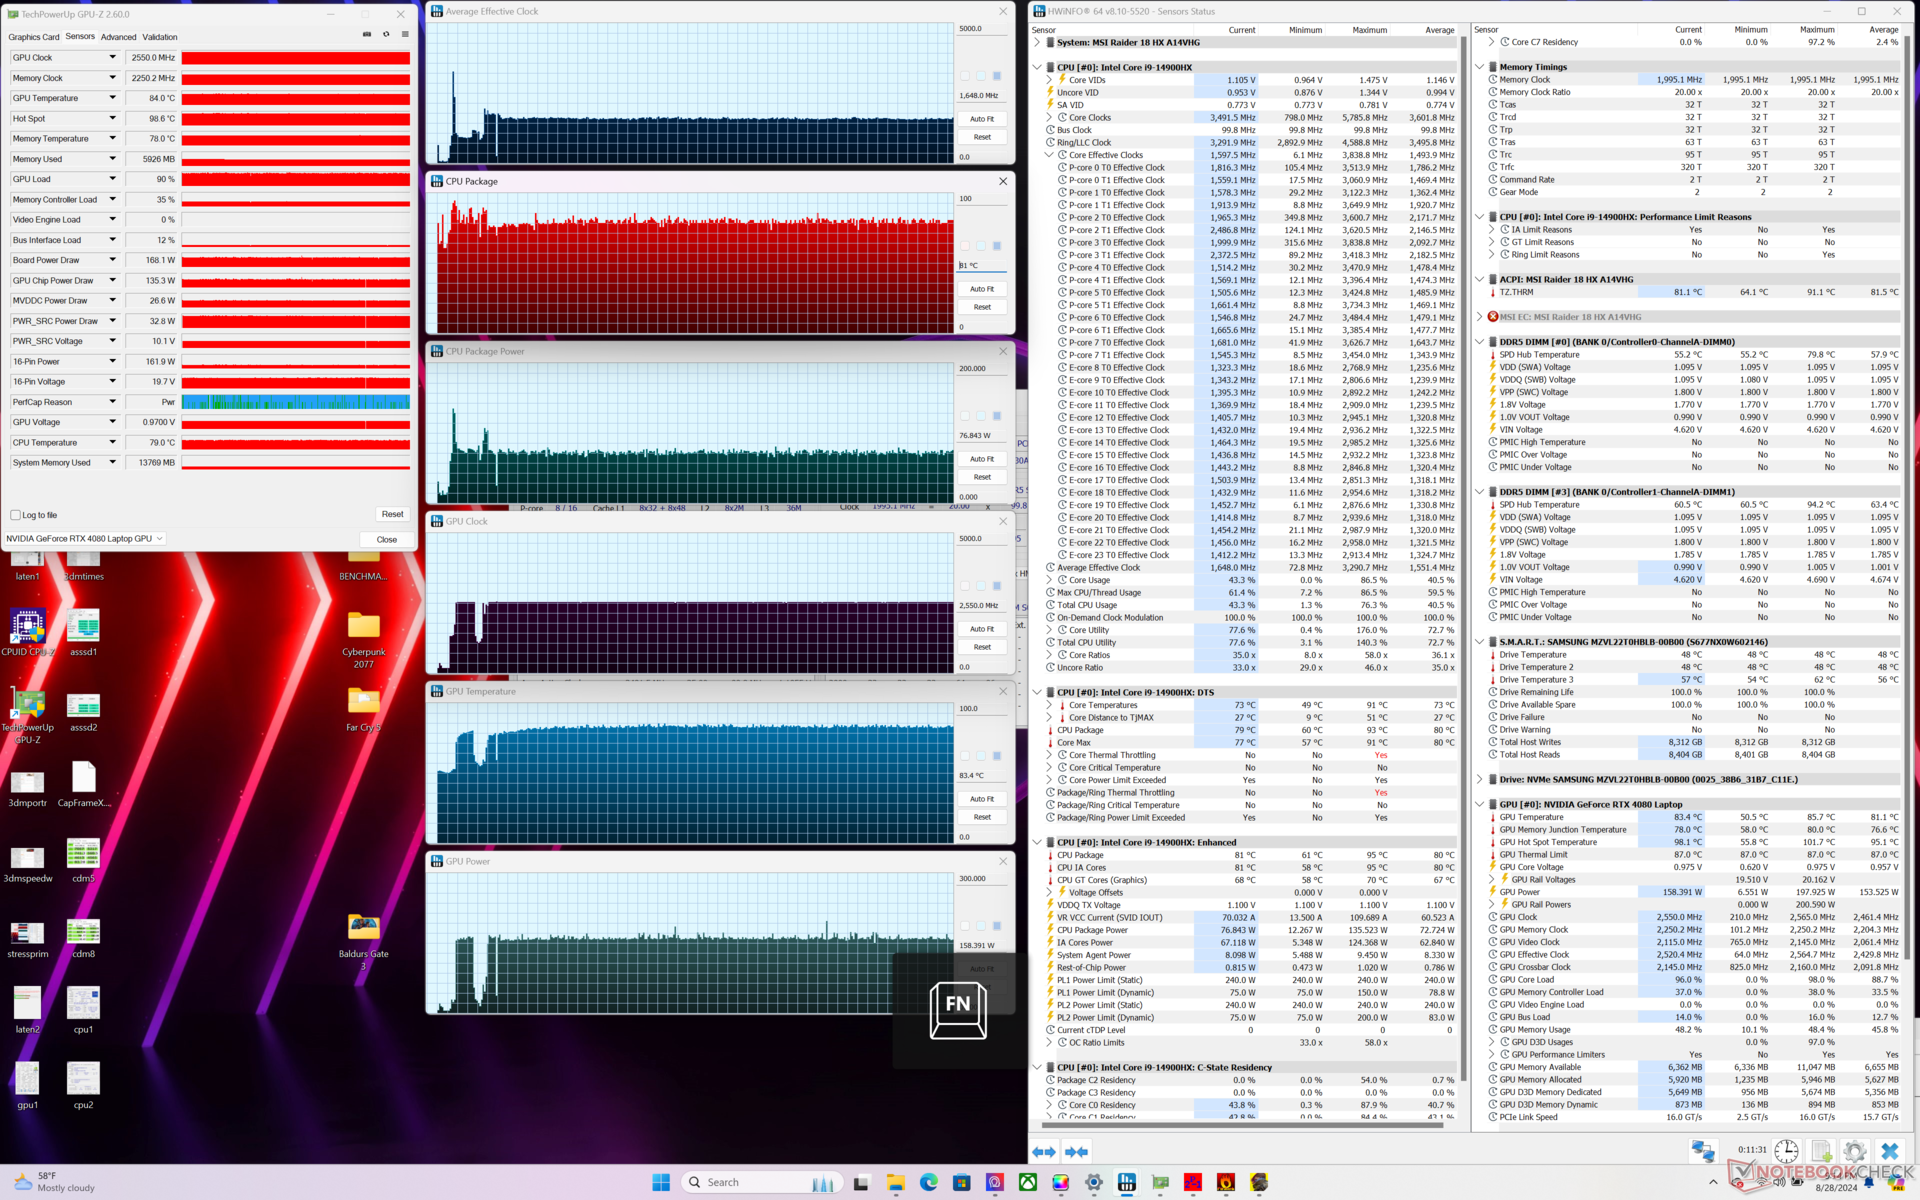
| 平均 CPU 时钟 (GHz) | GPU 时钟 (MHz) | 平均 CPU 温度 (°C) | 平均 GPU 温度 (°C) | |
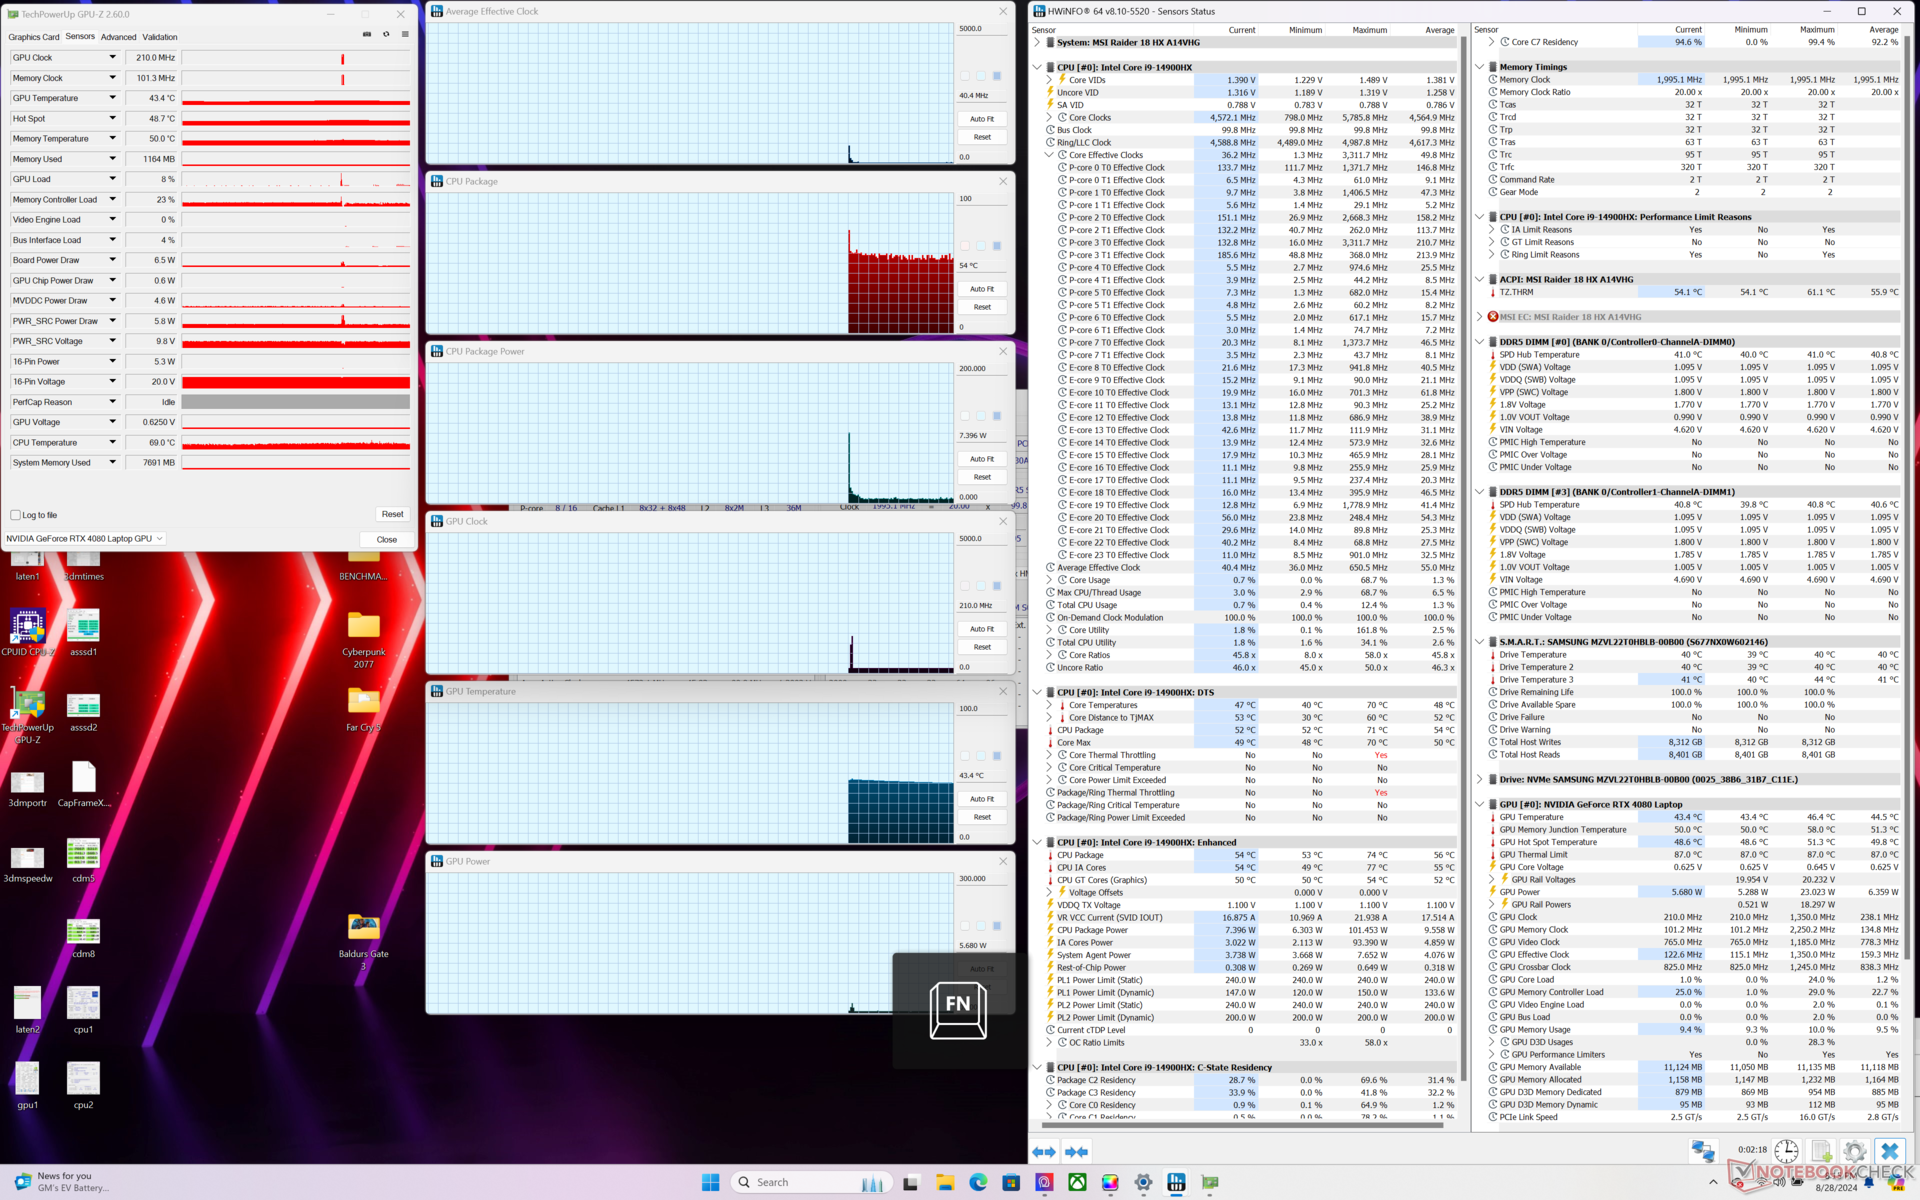
| 系统闲置 | -- | -- | 54 | 43 |
| Prime95 压力 | 4.0 | -- | 84 | 50 |
| Prime95 + FurMark Stress | 2.5 | 2550 | 77 | 75 |
| 赛博朋克 2077》压力(平衡模式) | 1.5 | 2295 | 78 | 85 |
| 赛博朋克 2077》压力模式(极致性能/冷却器升压关闭) | 1.7 | 2550 | 81 | 83 |
| 赛博朋克 2077》压力模式(极致性能/开启散热器升压) | 1.6 | 2550 | 78 | 78 |
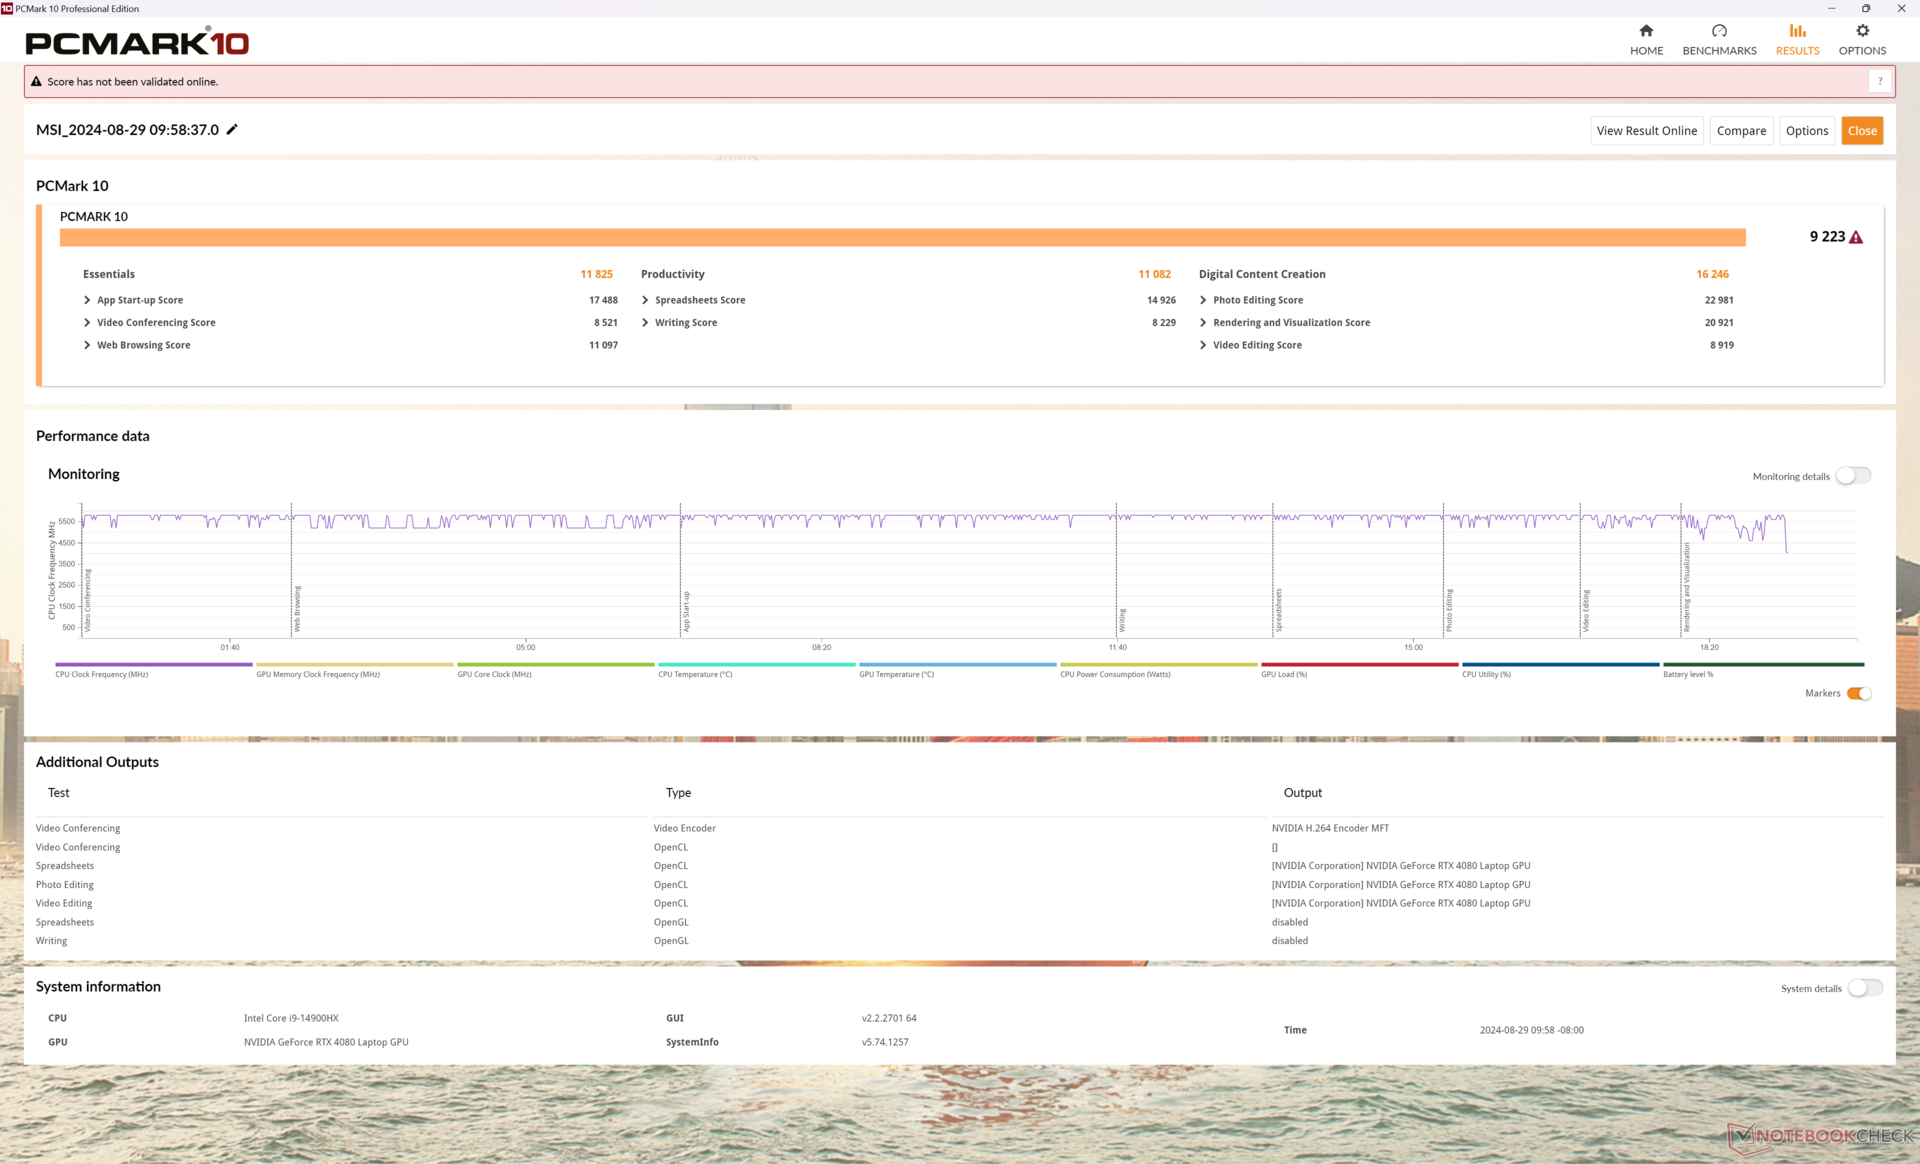
系统性能
PCMark 10 分数与微星 Titan 18 HX 相当,这表明尽管 Raider 18 HX 本质上是一款低调的 Titan,但其日常任务执行速度并不慢。
我们的测试设备在 dGPU 和 iGPU 模式之间切换时遇到了奇怪的登录问题,每次都会迫使我们重置 PIN 码。
CrossMark: Overall | Productivity | Creativity | Responsiveness
WebXPRT 3: Overall
WebXPRT 4: Overall
Mozilla Kraken 1.1: Total
| PCMark 10 / Score | |
| Alienware m18 R2 | |
| MSI Raider 18 HX A14V | |
| MSI Titan 18 HX A14VIG | |
| Razer Blade 18 2024 RZ09-0509 | |
| Average Intel Core i9-14900HX, NVIDIA GeForce RTX 4080 Laptop GPU (7703 - 9223, n=7) | |
| Acer Predator Helios 18 PH18-72-98MW | |
| Asus ROG Strix G18 G814JI | |
| PCMark 10 / Essentials | |
| MSI Raider 18 HX A14V | |
| Average Intel Core i9-14900HX, NVIDIA GeForce RTX 4080 Laptop GPU (11255 - 12600, n=7) | |
| MSI Titan 18 HX A14VIG | |
| Alienware m18 R2 | |
| Razer Blade 18 2024 RZ09-0509 | |
| Acer Predator Helios 18 PH18-72-98MW | |
| Asus ROG Strix G18 G814JI | |
| PCMark 10 / Productivity | |
| Alienware m18 R2 | |
| MSI Raider 18 HX A14V | |
| Average Intel Core i9-14900HX, NVIDIA GeForce RTX 4080 Laptop GPU (6662 - 11410, n=7) | |
| MSI Titan 18 HX A14VIG | |
| Razer Blade 18 2024 RZ09-0509 | |
| Acer Predator Helios 18 PH18-72-98MW | |
| Asus ROG Strix G18 G814JI | |
| PCMark 10 / Digital Content Creation | |
| MSI Titan 18 HX A14VIG | |
| Alienware m18 R2 | |
| MSI Raider 18 HX A14V | |
| Razer Blade 18 2024 RZ09-0509 | |
| Average Intel Core i9-14900HX, NVIDIA GeForce RTX 4080 Laptop GPU (14211 - 16246, n=7) | |
| Acer Predator Helios 18 PH18-72-98MW | |
| Asus ROG Strix G18 G814JI | |
| CrossMark / Overall | |
| Average Intel Core i9-14900HX, NVIDIA GeForce RTX 4080 Laptop GPU (1992 - 2334, n=7) | |
| MSI Raider 18 HX A14V | |
| Alienware m18 R2 | |
| Razer Blade 18 2024 RZ09-0509 | |
| MSI Titan 18 HX A14VIG | |
| CrossMark / Productivity | |
| Average Intel Core i9-14900HX, NVIDIA GeForce RTX 4080 Laptop GPU (1812 - 2204, n=7) | |
| MSI Raider 18 HX A14V | |
| Razer Blade 18 2024 RZ09-0509 | |
| Alienware m18 R2 | |
| MSI Titan 18 HX A14VIG | |
| CrossMark / Creativity | |
| Average Intel Core i9-14900HX, NVIDIA GeForce RTX 4080 Laptop GPU (2327 - 2500, n=7) | |
| Alienware m18 R2 | |
| MSI Raider 18 HX A14V | |
| Razer Blade 18 2024 RZ09-0509 | |
| MSI Titan 18 HX A14VIG | |
| CrossMark / Responsiveness | |
| Average Intel Core i9-14900HX, NVIDIA GeForce RTX 4080 Laptop GPU (1520 - 2254, n=7) | |
| MSI Raider 18 HX A14V | |
| Alienware m18 R2 | |
| Razer Blade 18 2024 RZ09-0509 | |
| MSI Titan 18 HX A14VIG | |
| WebXPRT 3 / Overall | |
| Razer Blade 18 2024 RZ09-0509 | |
| MSI Raider 18 HX A14V | |
| Average Intel Core i9-14900HX, NVIDIA GeForce RTX 4080 Laptop GPU (310 - 345, n=7) | |
| MSI Titan 18 HX A14VIG | |
| Alienware m18 R2 | |
| Asus ROG Strix G18 G814JI | |
| Asus ROG Strix G18 G814JI | |
| WebXPRT 4 / Overall | |
| MSI Raider 18 HX A14V | |
| Average Intel Core i9-14900HX, NVIDIA GeForce RTX 4080 Laptop GPU (300 - 321, n=7) | |
| Alienware m18 R2 | |
| MSI Titan 18 HX A14VIG | |
| Asus ROG Strix G18 G814JI | |
| Asus ROG Strix G18 G814JI | |
| Mozilla Kraken 1.1 / Total | |
| Asus ROG Strix G18 G814JI | |
| Asus ROG Strix G18 G814JI | |
| MSI Titan 18 HX A14VIG | |
| Razer Blade 18 2024 RZ09-0509 | |
| MSI Raider 18 HX A14V | |
| Acer Predator Helios 18 PH18-72-98MW | |
| Average Intel Core i9-14900HX, NVIDIA GeForce RTX 4080 Laptop GPU (437 - 446, n=7) | |
| Alienware m18 R2 | |
* ... smaller is better
| PCMark 10 Score | 9223 points | |
Help | ||
| AIDA64 / Memory Copy | |
| Alienware m18 R2 | |
| Acer Predator Helios 18 PH18-72-98MW | |
| Razer Blade 18 2024 RZ09-0509 | |
| Average Intel Core i9-14900HX (38028 - 83392, n=36) | |
| MSI Raider 18 HX A14V | |
| Asus ROG Strix G18 G814JI | |
| MSI Titan 18 HX A14VIG | |
| AIDA64 / Memory Read | |
| Alienware m18 R2 | |
| Acer Predator Helios 18 PH18-72-98MW | |
| Razer Blade 18 2024 RZ09-0509 | |
| Average Intel Core i9-14900HX (43306 - 87568, n=36) | |
| Asus ROG Strix G18 G814JI | |
| MSI Raider 18 HX A14V | |
| MSI Titan 18 HX A14VIG | |
| AIDA64 / Memory Write | |
| Alienware m18 R2 | |
| Average Intel Core i9-14900HX (37146 - 80589, n=36) | |
| Acer Predator Helios 18 PH18-72-98MW | |
| Razer Blade 18 2024 RZ09-0509 | |
| MSI Raider 18 HX A14V | |
| Asus ROG Strix G18 G814JI | |
| MSI Titan 18 HX A14VIG | |
| AIDA64 / Memory Latency | |
| MSI Titan 18 HX A14VIG | |
| MSI Raider 18 HX A14V | |
| Razer Blade 18 2024 RZ09-0509 | |
| Alienware m18 R2 | |
| Average Intel Core i9-14900HX (76.1 - 105, n=36) | |
| Asus ROG Strix G18 G814JI | |
| Acer Predator Helios 18 PH18-72-98MW | |
* ... smaller is better
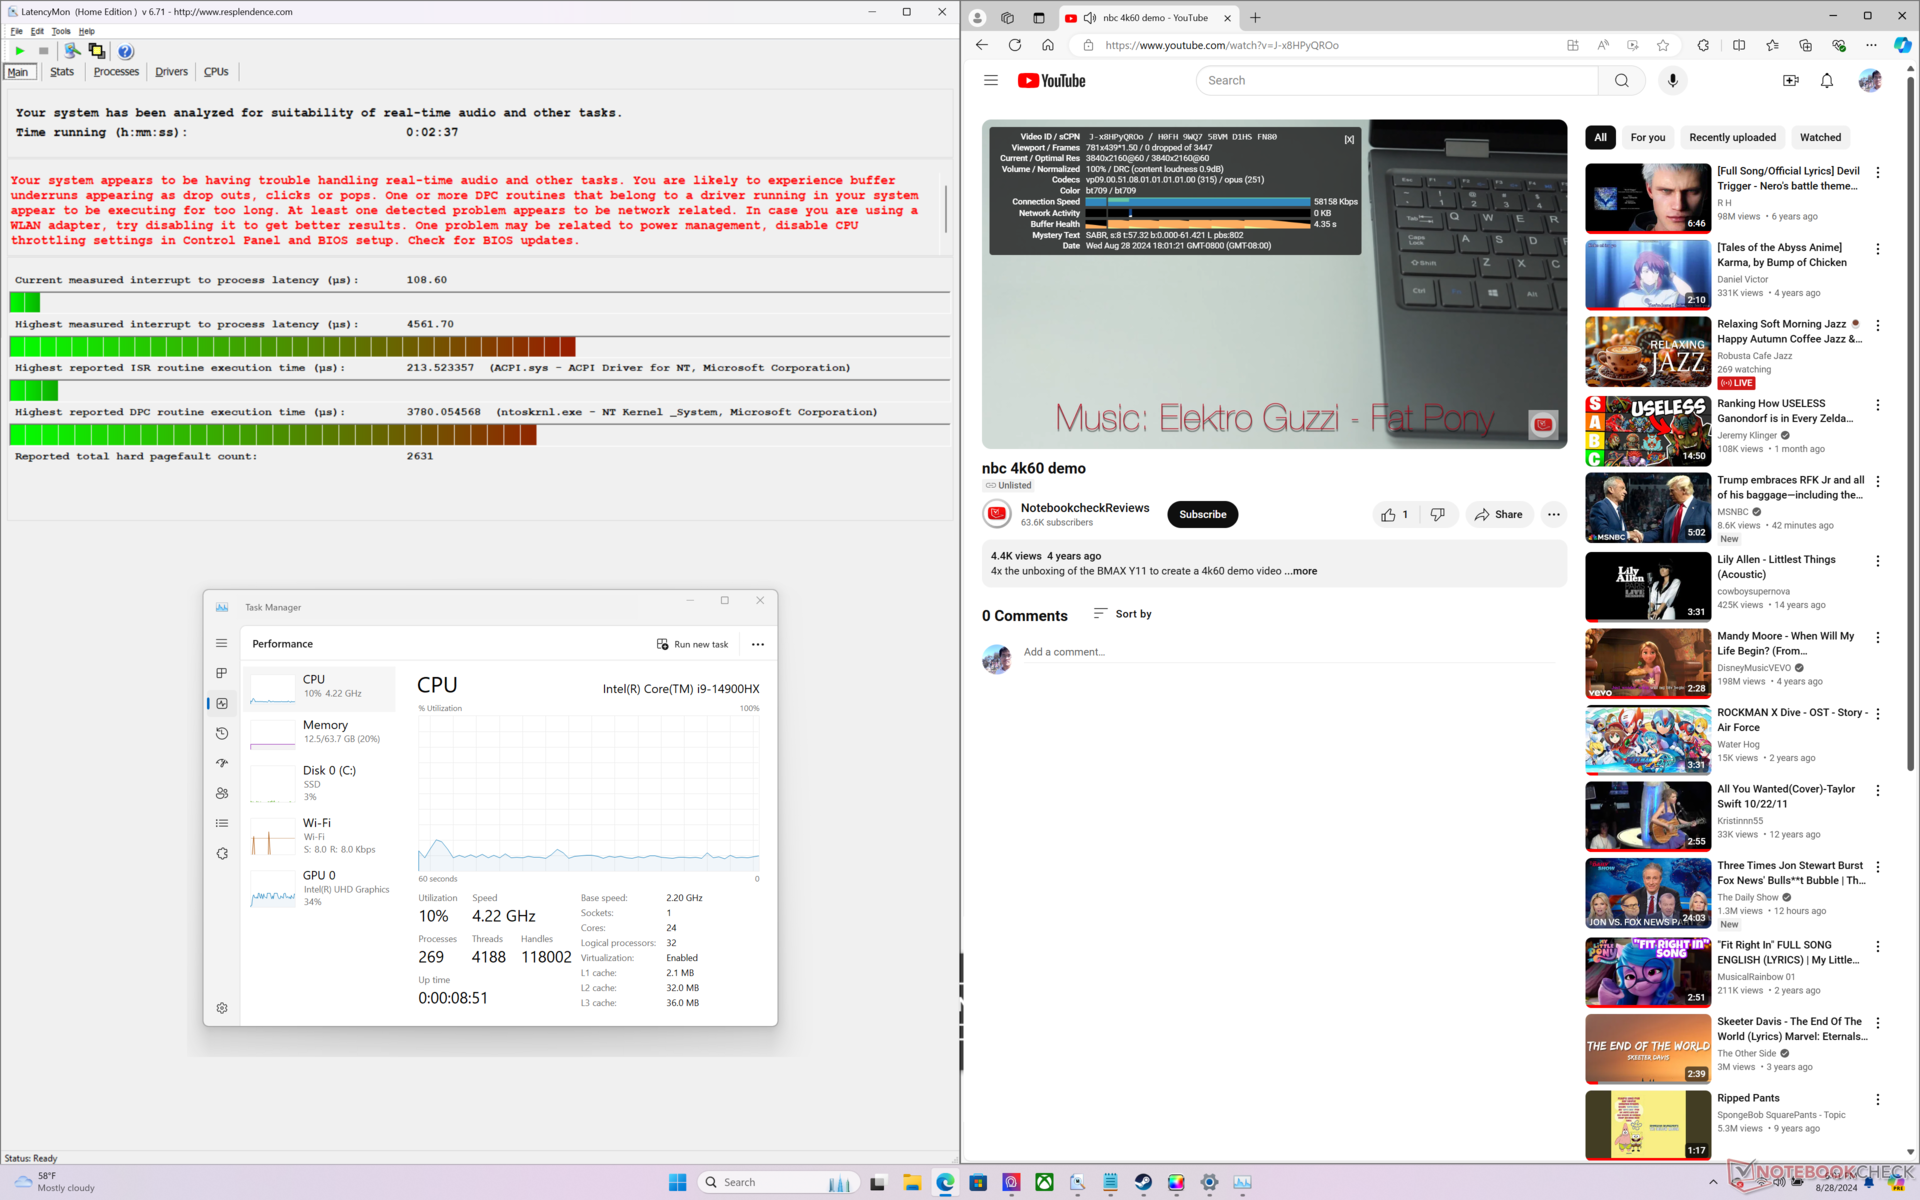
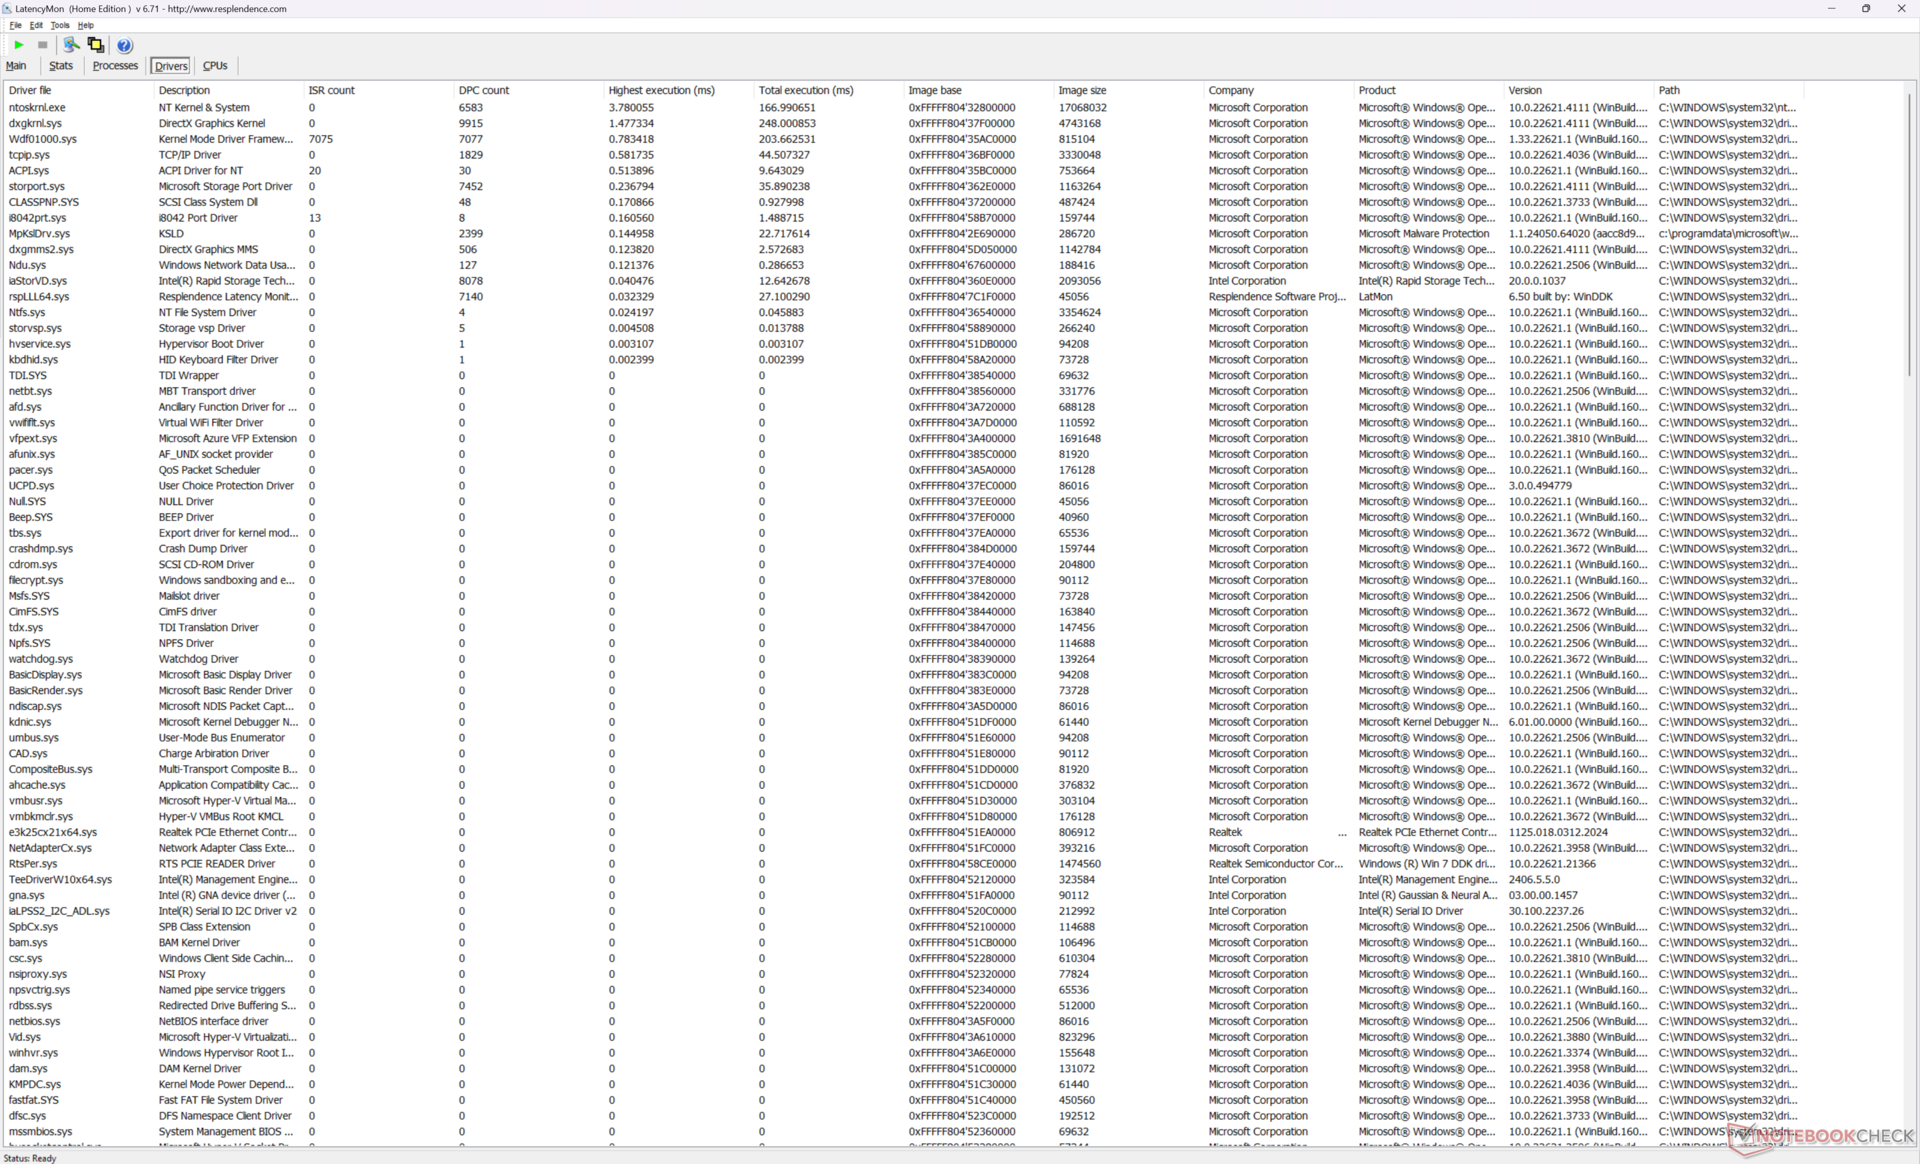
DPC 延迟
LatencyMon 显示,即使设置为 iGPU 模式,在打开多个主页标签时也会出现 DPC 问题。在其他方面,以 60 FPS 播放 4K 视频也非常完美,没有掉帧记录。
| DPC Latencies / LatencyMon - interrupt to process latency (max), Web, Youtube, Prime95 | |
| MSI Raider 18 HX A14V | |
| Acer Predator Helios 18 PH18-72-98MW | |
| Alienware m18 R2 | |
| MSI Titan 18 HX A14VIG | |
| Razer Blade 18 2024 RZ09-0509 | |
| Asus ROG Strix G18 G814JI | |
* ... smaller is better
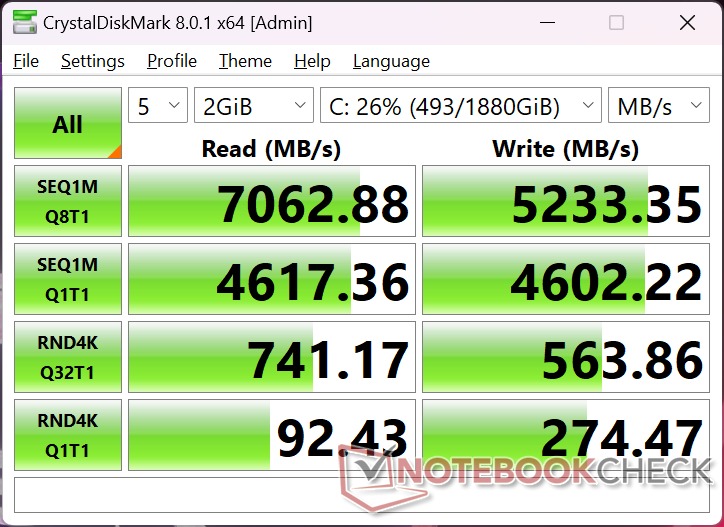
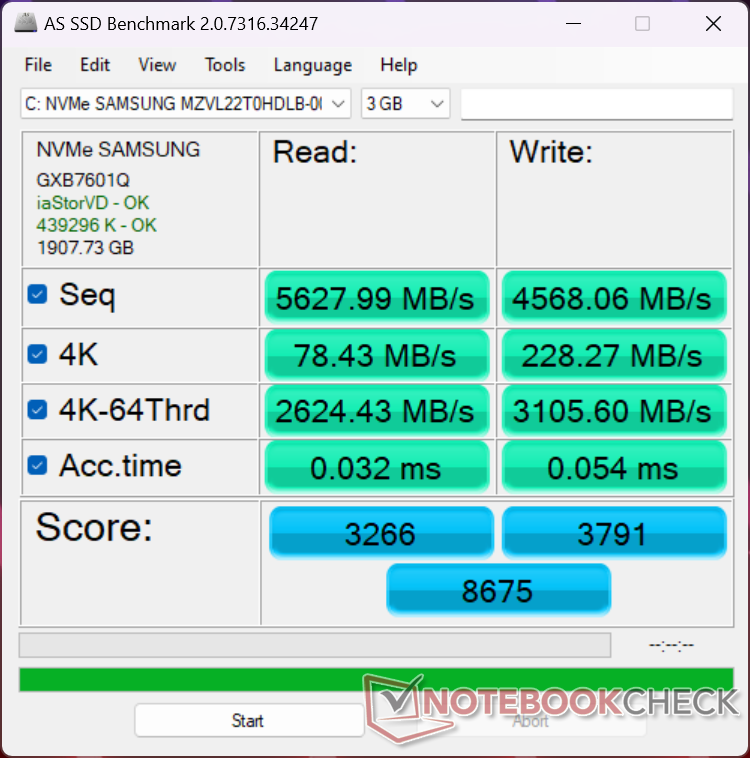
存储设备
我们的设备配有 三星 PM9A1a MZVL22T0HDLBPCIe4 固态硬盘,常见于高端笔记本电脑。即使在压力下,传输速率也能稳定在 7000 MB/s 左右,如果配置 PCIe5 硬盘,传输速率还会更快。不过,由于没有内置散热器,PCIe5 硬盘可能更容易出现故障。

| Drive Performance Rating - Percent | |
| Alienware m18 R2 | |
| MSI Raider 18 HX A14V | |
| Acer Predator Helios 18 PH18-72-98MW | |
| MSI Titan 18 HX A14VIG | |
| Razer Blade 18 2024 RZ09-0509 | |
| Asus ROG Strix G18 G814JI | |
* ... smaller is better
Disk Throttling: DiskSpd Read Loop, Queue Depth 8
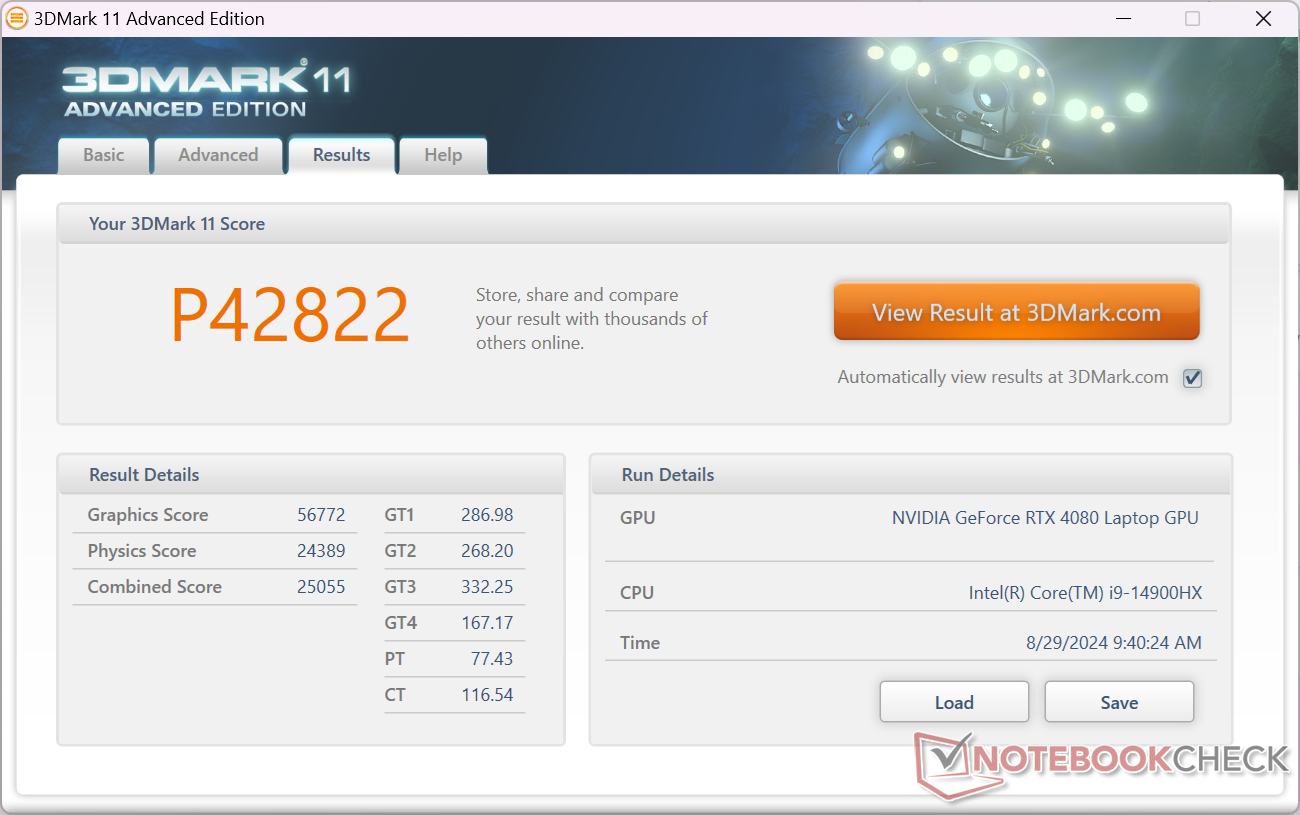
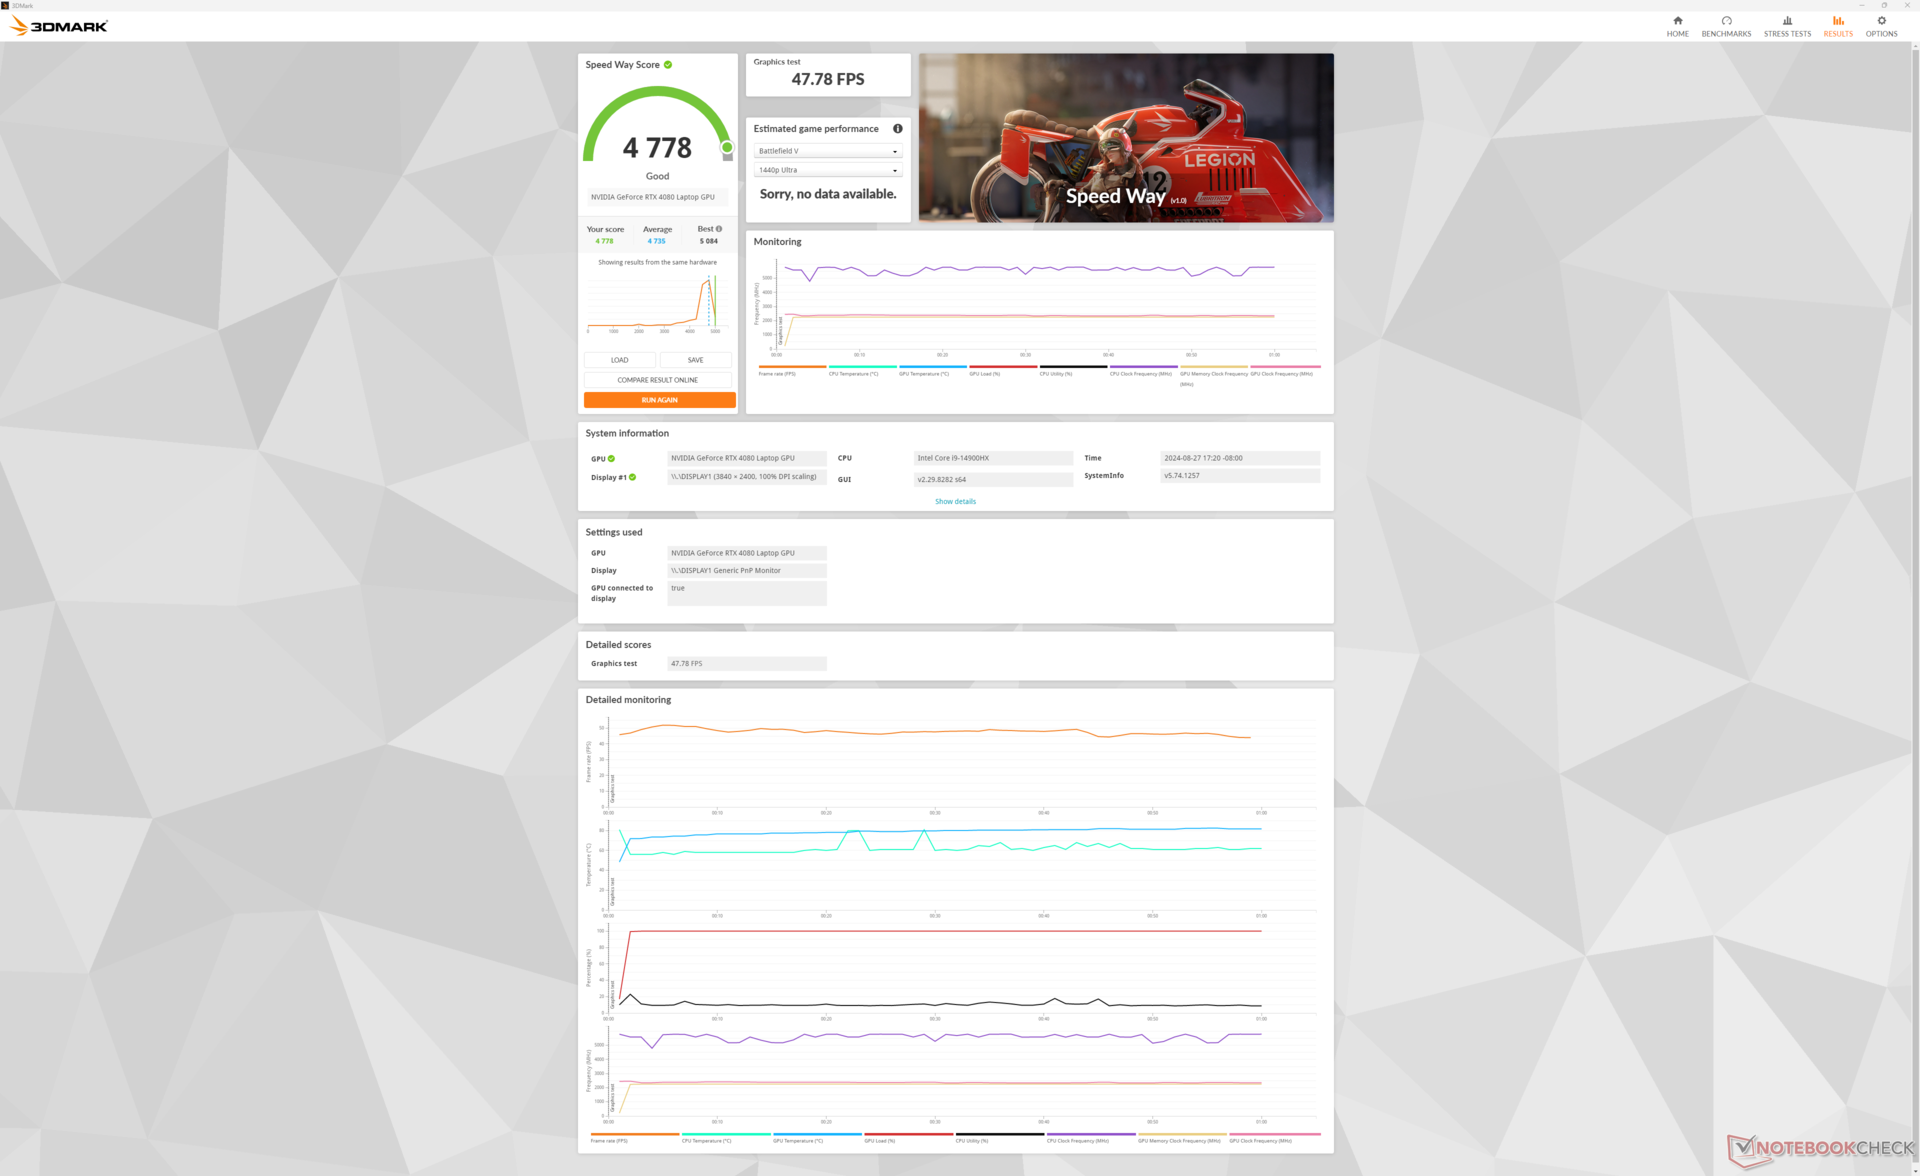
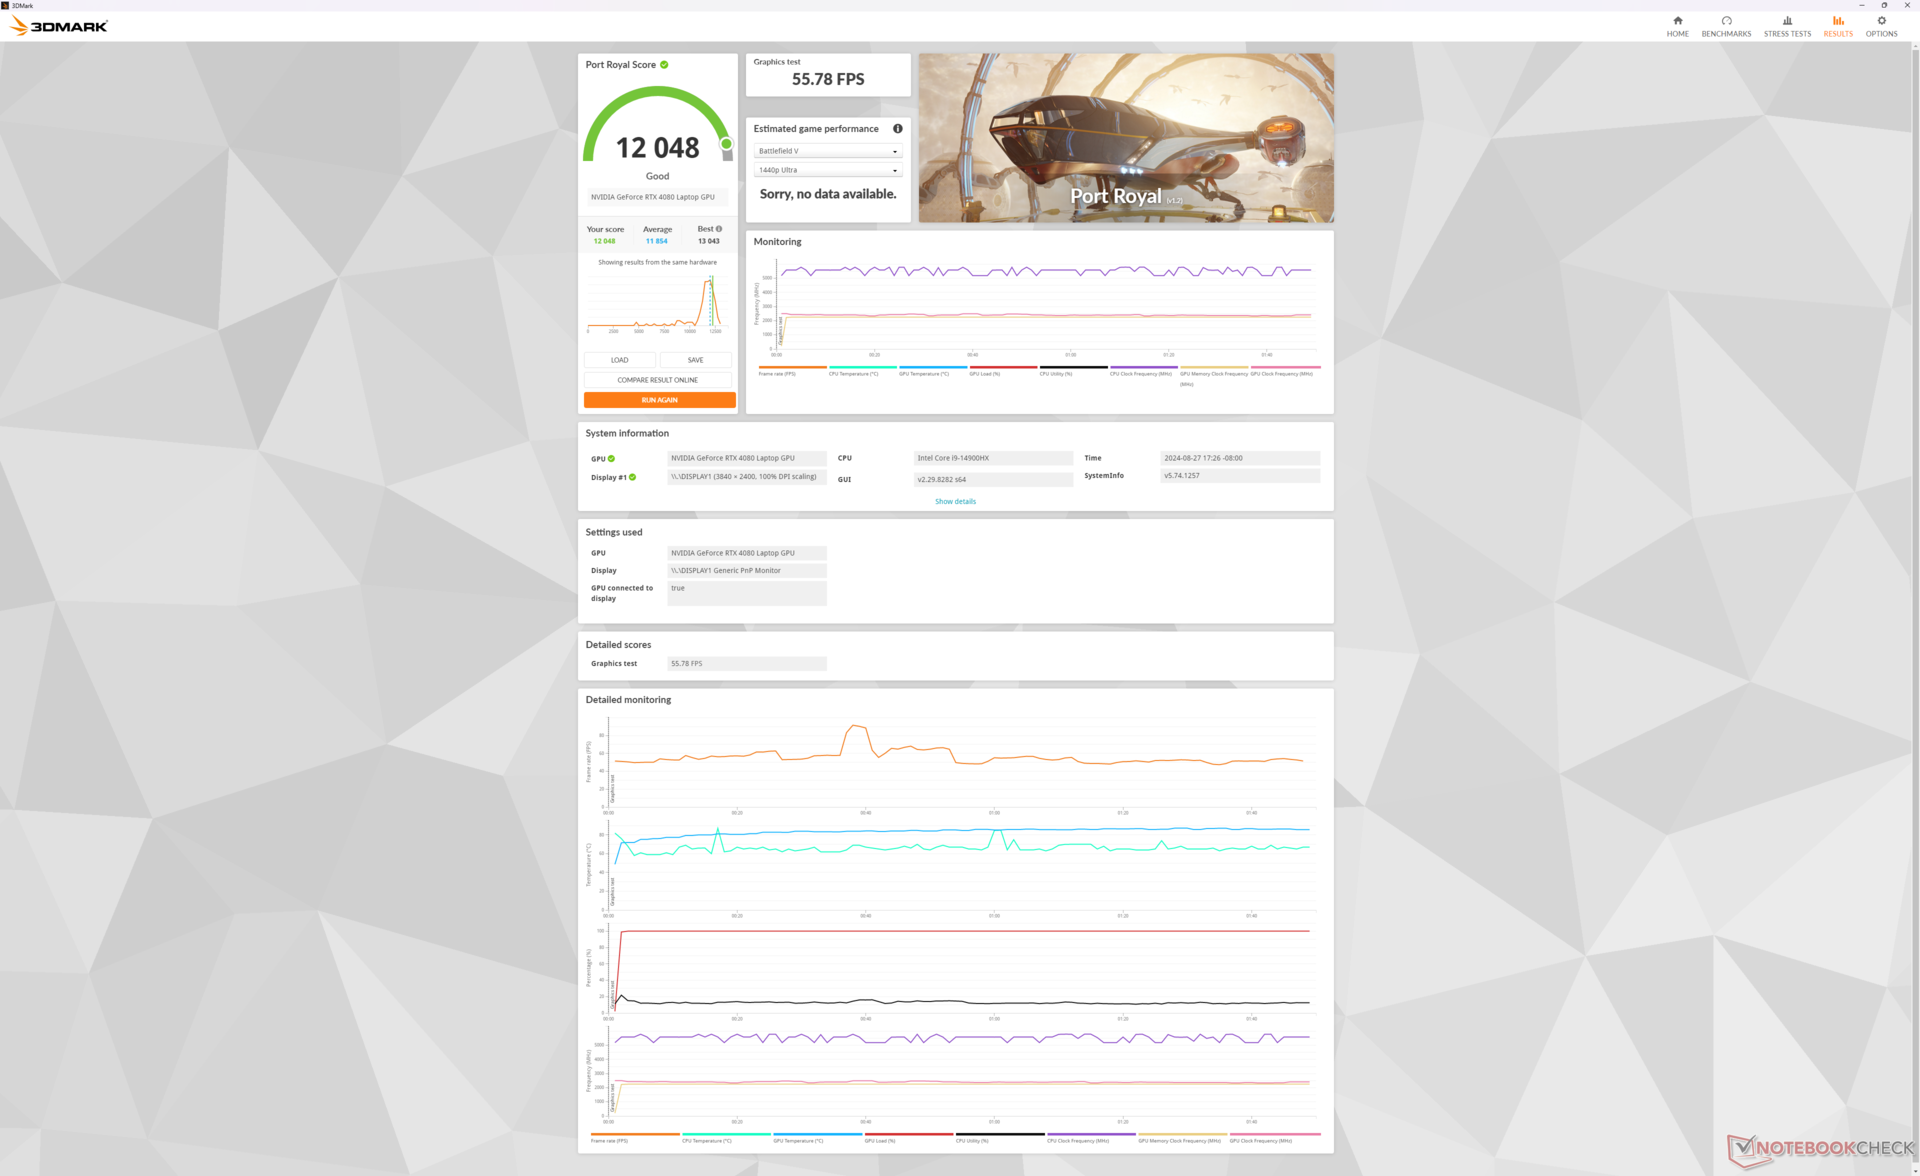
图形处理器性能 - 175 W TGP 图形处理器
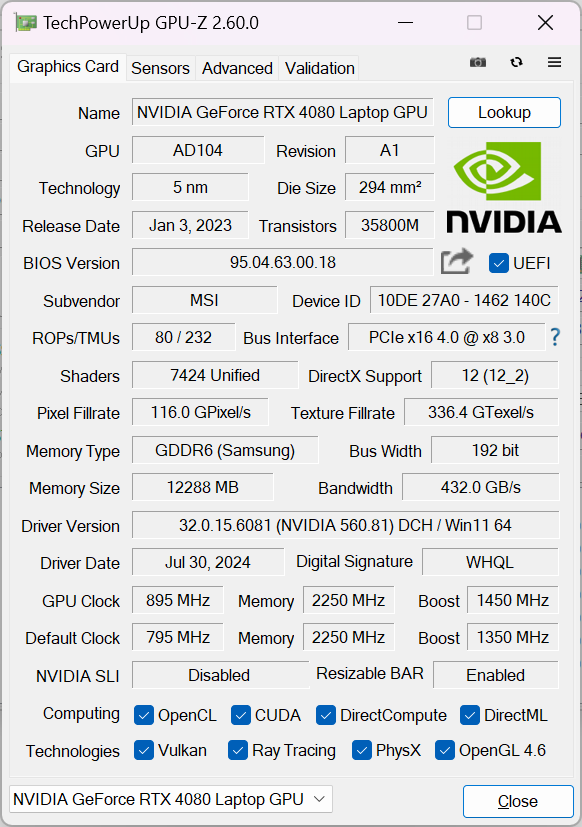
与较薄的笔记本电脑不同,它们可能会配备 80 WGeForce RTX 4080 显卡的薄型笔记本电脑不同。较大的 Raider 18 HX 配备了更强劲的 175 W(150 W + 25 W 动态提升)显卡。性能比我们数据库中配备相同 GPU 的普通笔记本电脑快约 5%。 相同 GPU而升级到 RTX 4090 将使性能再提升 10%。
请记住,总体性能仍比台式机版的 桌面版的GeForce RTX 4080尽管移动版的名称相同。因此,我们的移动 RTX 4080 在性能上更接近于 桌面版 RTX 4070.
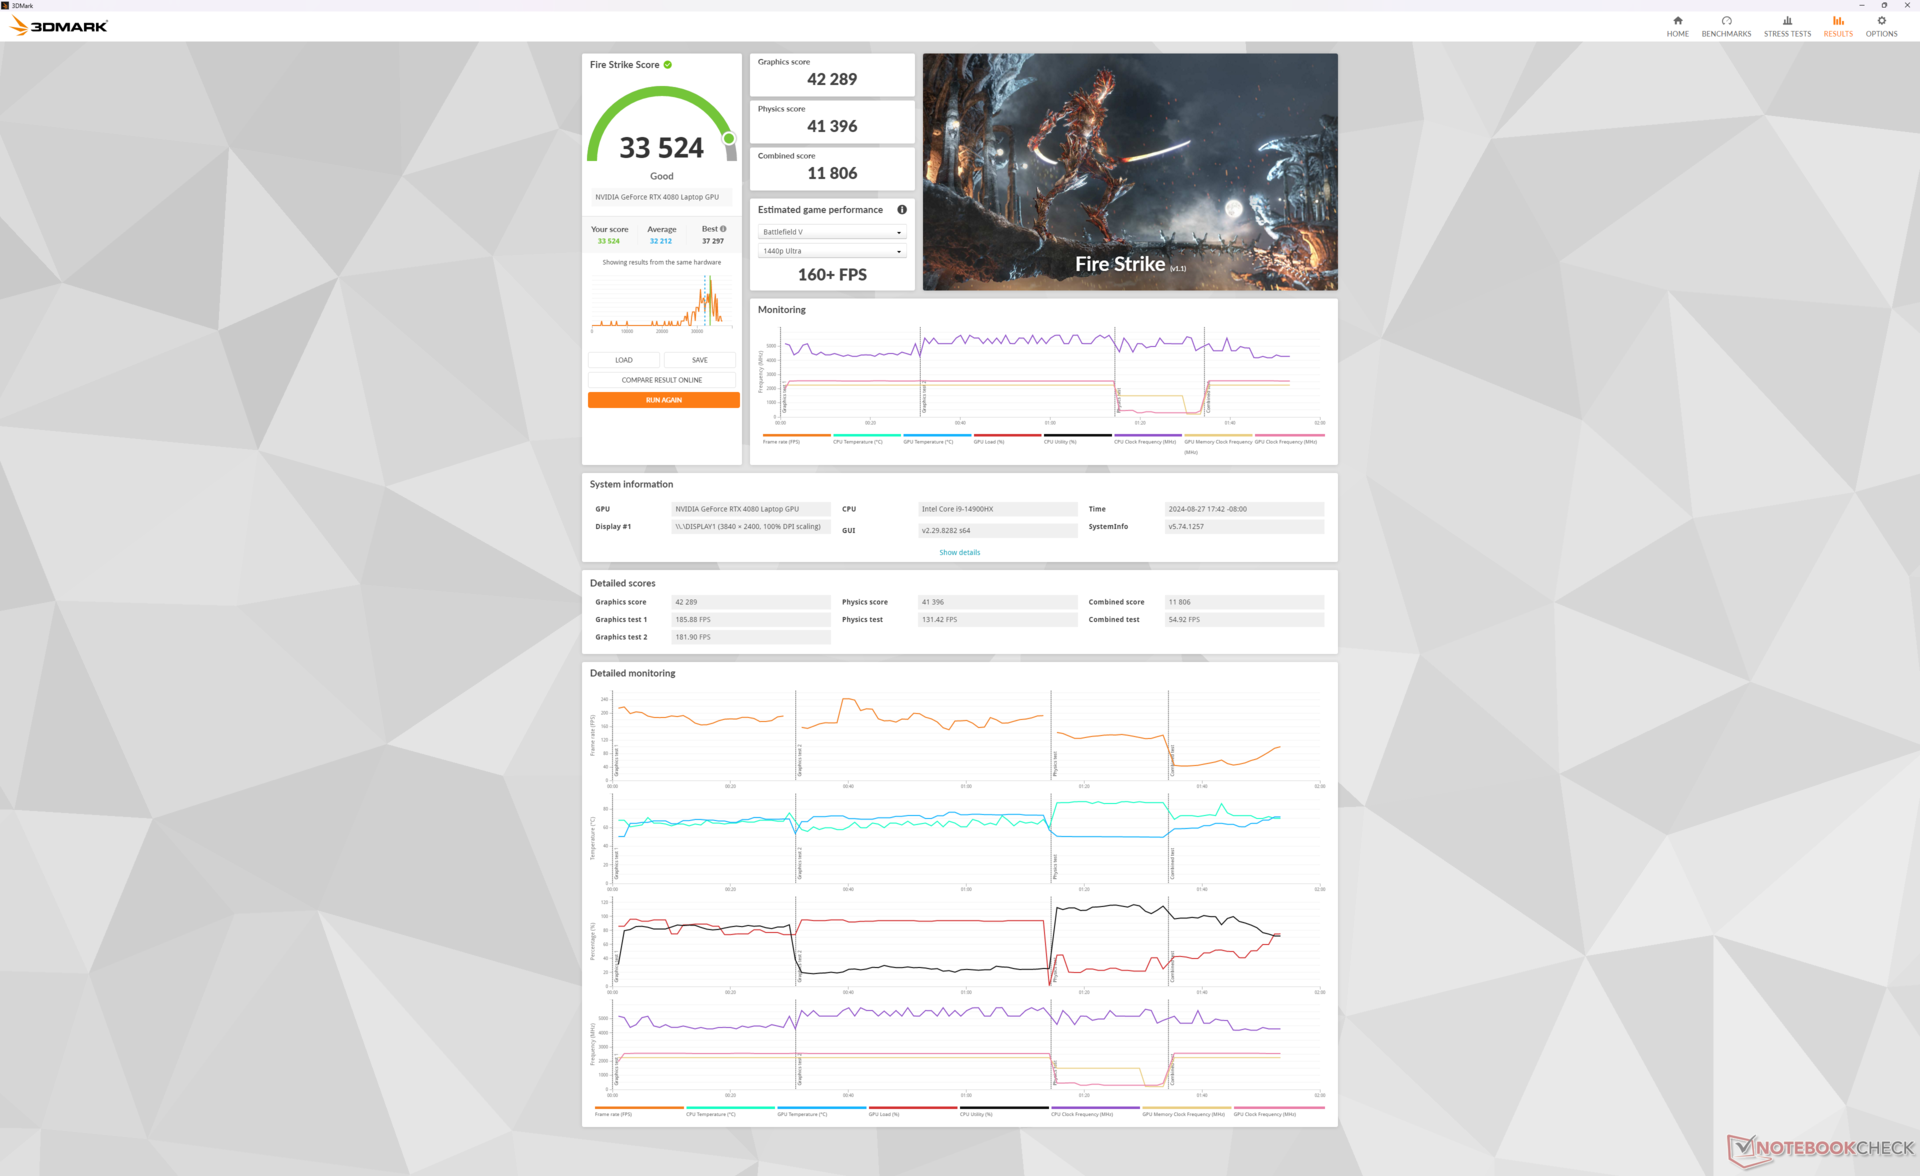
| 电源配置文件 | 图形分数 | 物理得分 | 综合得分 |
| 极致性能(开启冷却器增强功能) | 42289 | 41396 | 11806 |
| 极致性能(关闭冷却器增强功能) | 41778 (-1%) | 40723 (-2%) | 11968 (-1%) |
| 平衡模式 | 41673 (-2%) | 41013 (-1%) | 10404 (-12%) |
| 电池供电 | 21731 (-49%) | 17988 (-57%) | 5809 (-51%) |
从 "极致性能 "模式降至 "平衡 "模式对性能的影响微乎其微,这与上述压力测试的观察结果一致。启用 Cooler Boost 除了通过大幅增加风扇噪音来降低核心温度外,几乎没有其他影响。

| 3DMark Performance Rating - Percent | |
| NVIDIA GeForce RTX 4080 Founders Edition -1! | |
| Alienware m18 R2 -1! | |
| Razer Blade 18 2024 RZ09-0509 -1! | |
| MSI Raider 18 HX A14V | |
| Alienware m18 R1 AMD -2! | |
| Average NVIDIA GeForce RTX 4080 Laptop GPU | |
| Zotac Gaming GeForce RTX 4070 AMP Airo -1! | |
| Asus ROG Strix Scar 17 SE G733CX-LL014W -1! | |
| Alienware x17 RTX 3080 P48E -2! | |
| Asus ROG Strix G18 G814JI -2! | |
| SCHENKER XMG Ultra 17 Comet Lake -2! | |
| MSI Pulse GL76 12UGK -1! | |
| 3DMark 11 Performance | 42822 points | |
| 3DMark Fire Strike Score | 33524 points | |
| 3DMark Time Spy Score | 18608 points | |
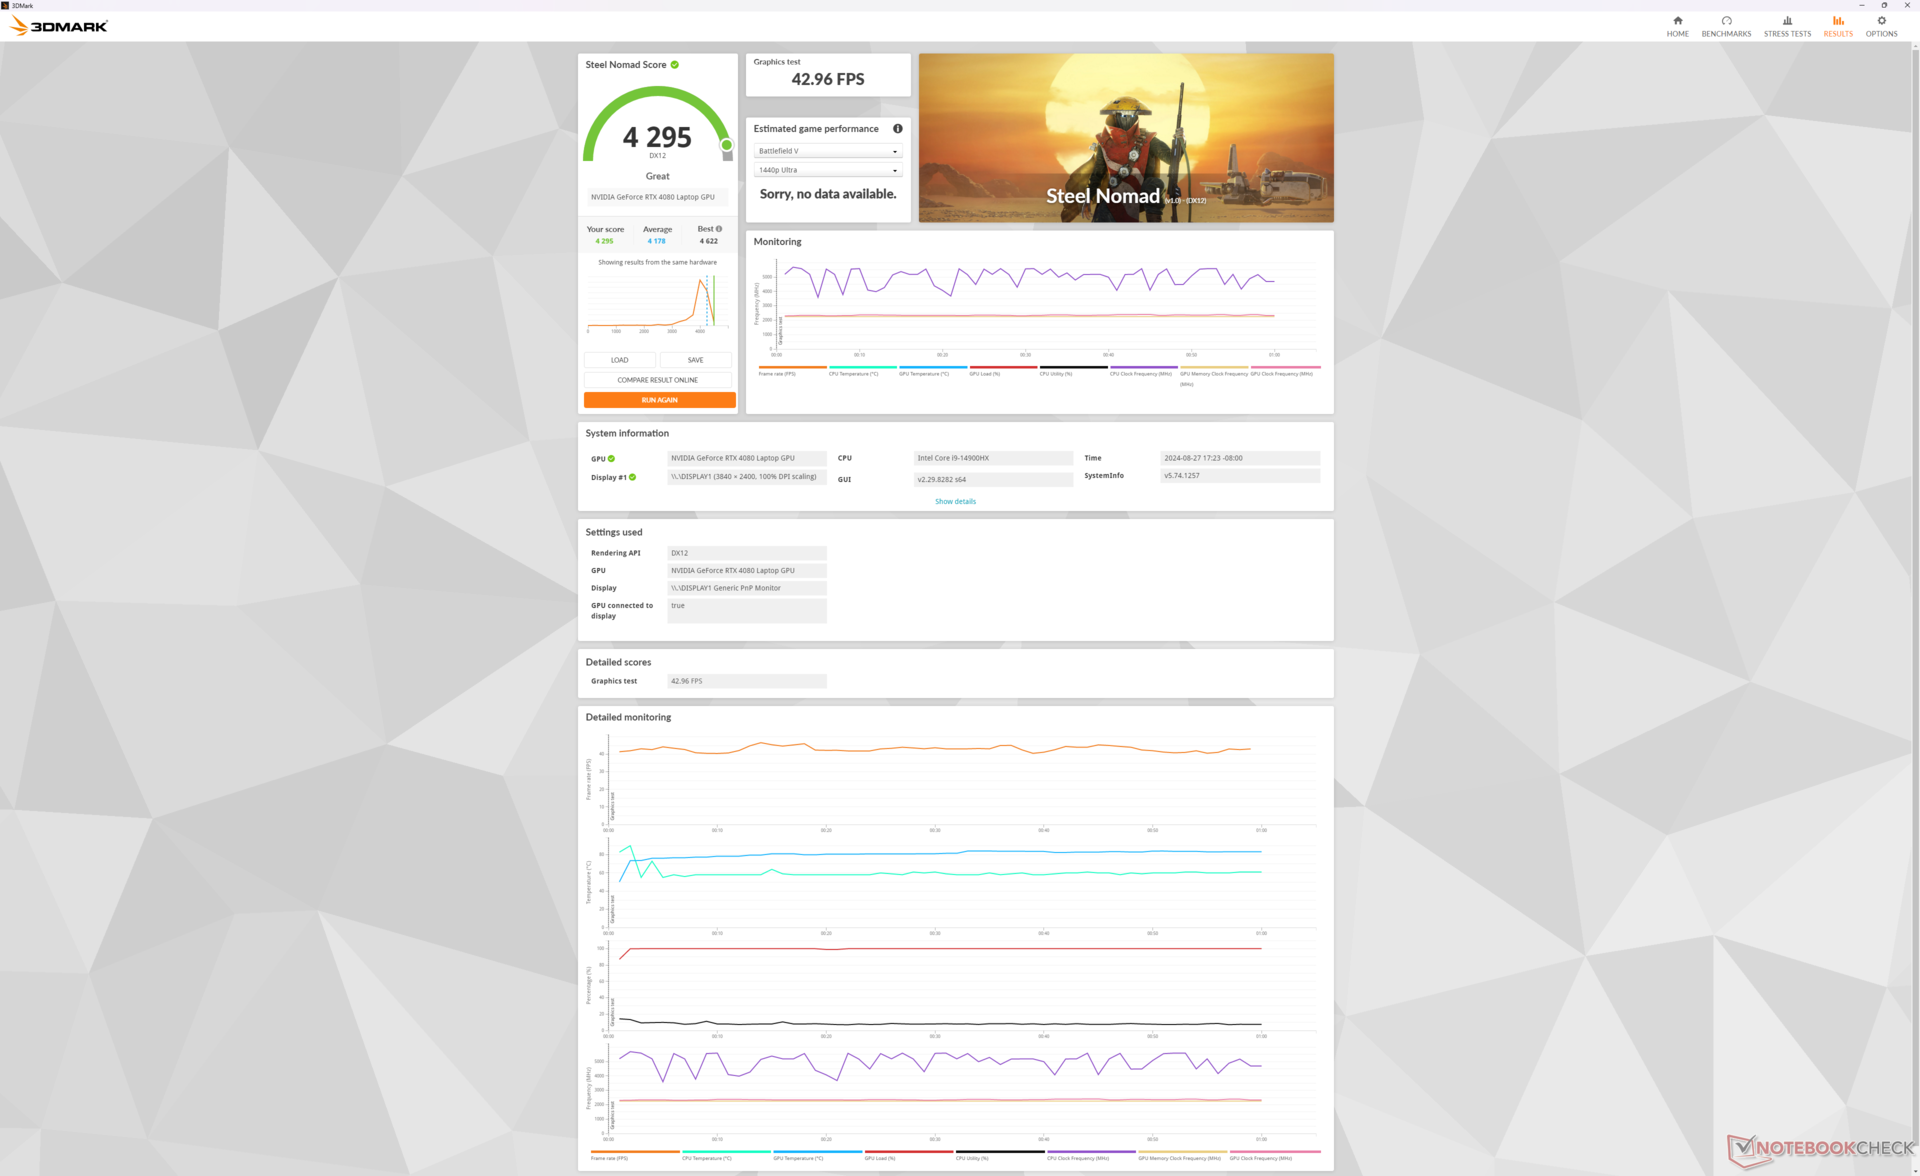
| 3DMark Steel Nomad Score | 4295 points | |
Help | ||
* ... smaller is better
游戏性能
现代游戏能以原生 4K UHD+ 分辨率正常运行。在运行《赛博朋克 2077》等要求更高的游戏时,建议使用 DLSS 来提升帧率,使其接近 60 FPS。
奇怪的是,即使在 DX11 或 DX12 模式下多次重置系统,《博德之门 3》也无法在我们的设备上启动。
| Performance Rating - Percent | |
| Alienware m18 R2 | |
| MSI Titan 18 HX A14VIG | |
| MSI Raider 18 HX A14V | |
| Razer Blade 18 2024 RZ09-0509 -1! | |
| Acer Predator Helios 18 PH18-72-98MW | |
| Asus ROG Strix G18 G814JI | |
| GTA V - 1920x1080 Highest Settings possible AA:4xMSAA + FX AF:16x | |
| MSI Raider 18 HX A14V | |
| MSI Titan 18 HX A14VIG | |
| Alienware m18 R2 | |
| Acer Predator Helios 18 PH18-72-98MW | |
| Razer Blade 18 2024 RZ09-0509 | |
| Asus ROG Strix G18 G814JI | |
| Final Fantasy XV Benchmark - 1920x1080 High Quality | |
| Alienware m18 R2 | |
| MSI Titan 18 HX A14VIG | |
| MSI Raider 18 HX A14V | |
| Acer Predator Helios 18 PH18-72-98MW | |
| Razer Blade 18 2024 RZ09-0509 | |
| Asus ROG Strix G18 G814JI | |
| Strange Brigade - 1920x1080 ultra AA:ultra AF:16 | |
| MSI Titan 18 HX A14VIG | |
| Alienware m18 R2 | |
| MSI Raider 18 HX A14V | |
| Razer Blade 18 2024 RZ09-0509 | |
| Acer Predator Helios 18 PH18-72-98MW | |
| Asus ROG Strix G18 G814JI | |
| Dota 2 Reborn - 1920x1080 ultra (3/3) best looking | |
| Acer Predator Helios 18 PH18-72-98MW | |
| MSI Titan 18 HX A14VIG | |
| MSI Raider 18 HX A14V | |
| Alienware m18 R2 | |
| Razer Blade 18 2024 RZ09-0509 | |
| Asus ROG Strix G18 G814JI | |
| X-Plane 11.11 - 1920x1080 high (fps_test=3) | |
| MSI Raider 18 HX A14V | |
| Alienware m18 R2 | |
| Razer Blade 18 2024 RZ09-0509 | |
| MSI Titan 18 HX A14VIG | |
| Acer Predator Helios 18 PH18-72-98MW | |
| Asus ROG Strix G18 G814JI | |
| Far Cry 5 - 1920x1080 Ultra Preset AA:T | |
| Alienware m18 R2 | |
| MSI Titan 18 HX A14VIG | |
| MSI Raider 18 HX A14V | |
| Asus ROG Strix G18 G814JI | |
| Acer Predator Helios 18 PH18-72-98MW | |
| Tiny Tina's Wonderlands | |
| 1920x1080 High Preset (DX12) | |
| Alienware m18 R2 | |
| MSI Raider 18 HX A14V | |
| Average NVIDIA GeForce RTX 4080 Laptop GPU (166.7 - 213, n=6) | |
| 1920x1080 Badass Preset (DX12) | |
| Alienware m18 R2 | |
| MSI Raider 18 HX A14V | |
| Alienware m18 R1 AMD | |
| Average NVIDIA GeForce RTX 4080 Laptop GPU (112.9 - 167.1, n=9) | |
| 2560x1440 Badass Preset (DX12) | |
| Alienware m18 R2 | |
| MSI Raider 18 HX A14V | |
| Alienware m18 R1 AMD | |
| Average NVIDIA GeForce RTX 4080 Laptop GPU (85 - 114.8, n=9) | |
| 3840x2160 Badass Preset (DX12) | |
| Alienware m18 R2 | |
| MSI Raider 18 HX A14V | |
| Alienware m18 R1 AMD | |
| Average NVIDIA GeForce RTX 4080 Laptop GPU (46.4 - 60.9, n=9) | |
Cyberpunk 2077 ultra FPS Chart
| low | med. | high | ultra | QHD | 4K | |
|---|---|---|---|---|---|---|
| GTA V (2015) | 185.1 | 183.8 | 181.6 | 143.4 | 134.6 | 158.3 |
| Dota 2 Reborn (2015) | 218 | 193.1 | 184.6 | 172.5 | 166.4 | |
| Final Fantasy XV Benchmark (2018) | 223 | 212 | 177 | 141.8 | 78.6 | |
| X-Plane 11.11 (2018) | 199 | 178.5 | 143.5 | 119.3 | ||
| Far Cry 5 (2018) | 173 | 163 | 151 | 149 | 96 | |
| Strange Brigade (2018) | 504 | 408 | 378 | 349 | 246 | 122.6 |
| Tiny Tina's Wonderlands (2022) | 352.5 | 292.6 | 203.3 | 159.4 | 111.2 | 60.9 |
| F1 22 (2022) | 305 | 299 | 271 | 121.2 | 77.8 | 39.8 |
| Cyberpunk 2077 2.2 Phantom Liberty (2023) | 150.6 | 150 | 140.7 | 125.5 | 82.5 | 35.1 |
排放 - 怠速时安静,游戏时响亮
系统噪音
风扇噪音和性能与 泰坦 18 HX尽管散热方案不同。即使在平衡模式或静音模式下浏览网页,风扇也容易出现脉动,这一点与泰坦很相似,但值得庆幸的是,噪音的增加并不剧烈,不会让人分心。
微星中心直接影响游戏体验,因为风扇噪音与所选的电源配置文件密切相关。在平衡模式、极限性能模式(关闭 Cooler Boost)和极限性能模式(开启 Cooler Boost)下运行《赛博朋克 2077》,风扇噪音分别为 52.8 dB(A)、59.4 dB(A) 和 62.7 dB(A)。尽管平衡模式和极致性能模式之间的性能差距很小,但它们之间的噪音差距却很大,这意味着在大多数游戏场景中,建议使用平衡模式。因此,Cooler Boost 主要适用于手动超频,否则在默认设置下不会带来很大的游戏优势。
游戏时的中低 50 dB(A) 范围与 Blade 18 或 Alienware m18 R2.建议使用耳机,尤其是在极限性能模式下进行游戏时。
Noise Level
| Idle |
| 28.6 / 28.6 / 31.3 dB(A) |
| Load |
| 44.1 / 62.7 dB(A) |
 | ||
30 dB silent 40 dB(A) audible 50 dB(A) loud |
||
min: | ||
| MSI Raider 18 HX A14V NVIDIA GeForce RTX 4080 Laptop GPU, i9-14900HX, Samsung PM9A1 MZVL22T0HBLB | Razer Blade 18 2024 RZ09-0509 NVIDIA GeForce RTX 4090 Laptop GPU, i9-14900HX | Alienware m18 R2 NVIDIA GeForce RTX 4090 Laptop GPU, i9-14900HX, SK Hynix PC811 HFS002TEM9X152N | MSI Titan 18 HX A14VIG NVIDIA GeForce RTX 4090 Laptop GPU, i9-14900HX, 2x Samsung PM9A1a MZVL22T0HDLB (RAID 0) | Asus ROG Strix G18 G814JI NVIDIA GeForce RTX 4070 Laptop GPU, i7-13650HX, Micron 2400 MTFDKBA1T0QFM | Acer Predator Helios 18 PH18-72-98MW NVIDIA GeForce RTX 4090 Laptop GPU, i9-14900HX, 2x SK Hynix HFS001TEJ9X115N (RAID 0) | |
|---|---|---|---|---|---|---|
| Noise | 7% | 11% | 10% | 8% | -12% | |
| off / environment * | 23.3 | 23.4 -0% | 23.6 -1% | 22.8 2% | 25 -7% | 25 -7% |
| Idle Minimum * | 28.6 | 23.9 16% | 23.8 17% | 23.8 17% | 26 9% | 30 -5% |
| Idle Average * | 28.6 | 28.2 1% | 26.1 9% | 23.8 17% | 28 2% | 36 -26% |
| Idle Maximum * | 31.3 | 29 7% | 31.5 -1% | 28 11% | 29 7% | 44 -41% |
| Load Average * | 44.1 | 36.8 17% | 31.5 29% | 38 14% | 41 7% | 48 -9% |
| Cyberpunk 2077 ultra * | 59.4 | |||||
| Load Maximum * | 62.7 | 61.1 3% | 56.6 10% | 62.8 -0% | 46 27% | 51 19% |
| Witcher 3 ultra * | 54.1 | 52.1 | 57.3 | 44 | 49 |
* ... smaller is better
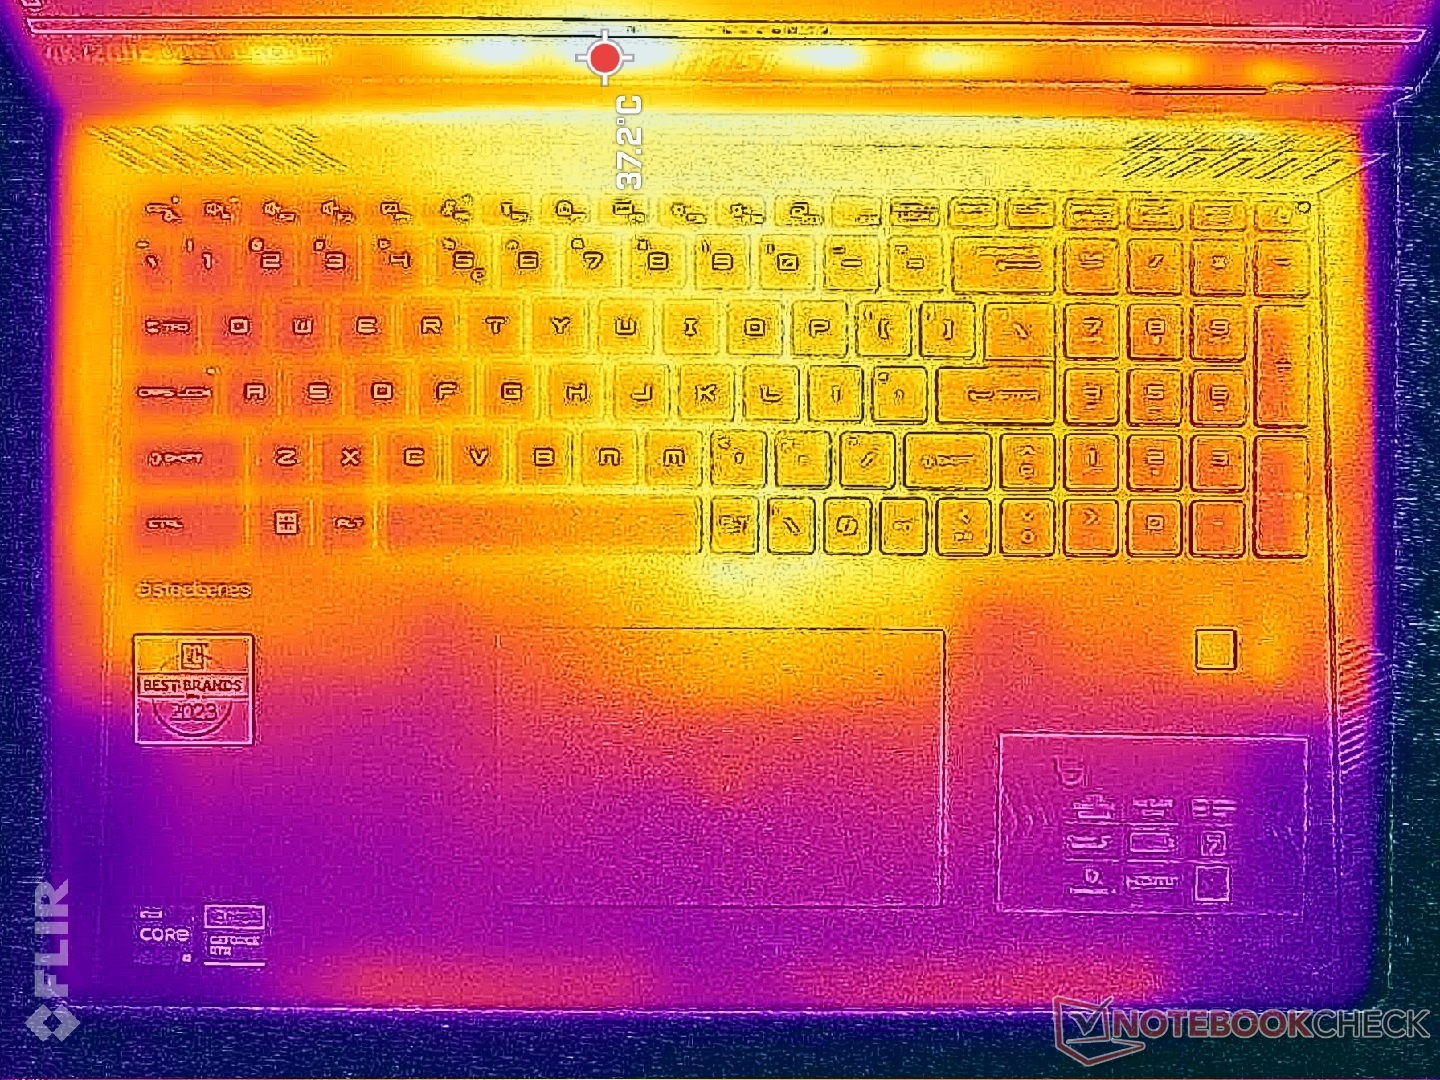
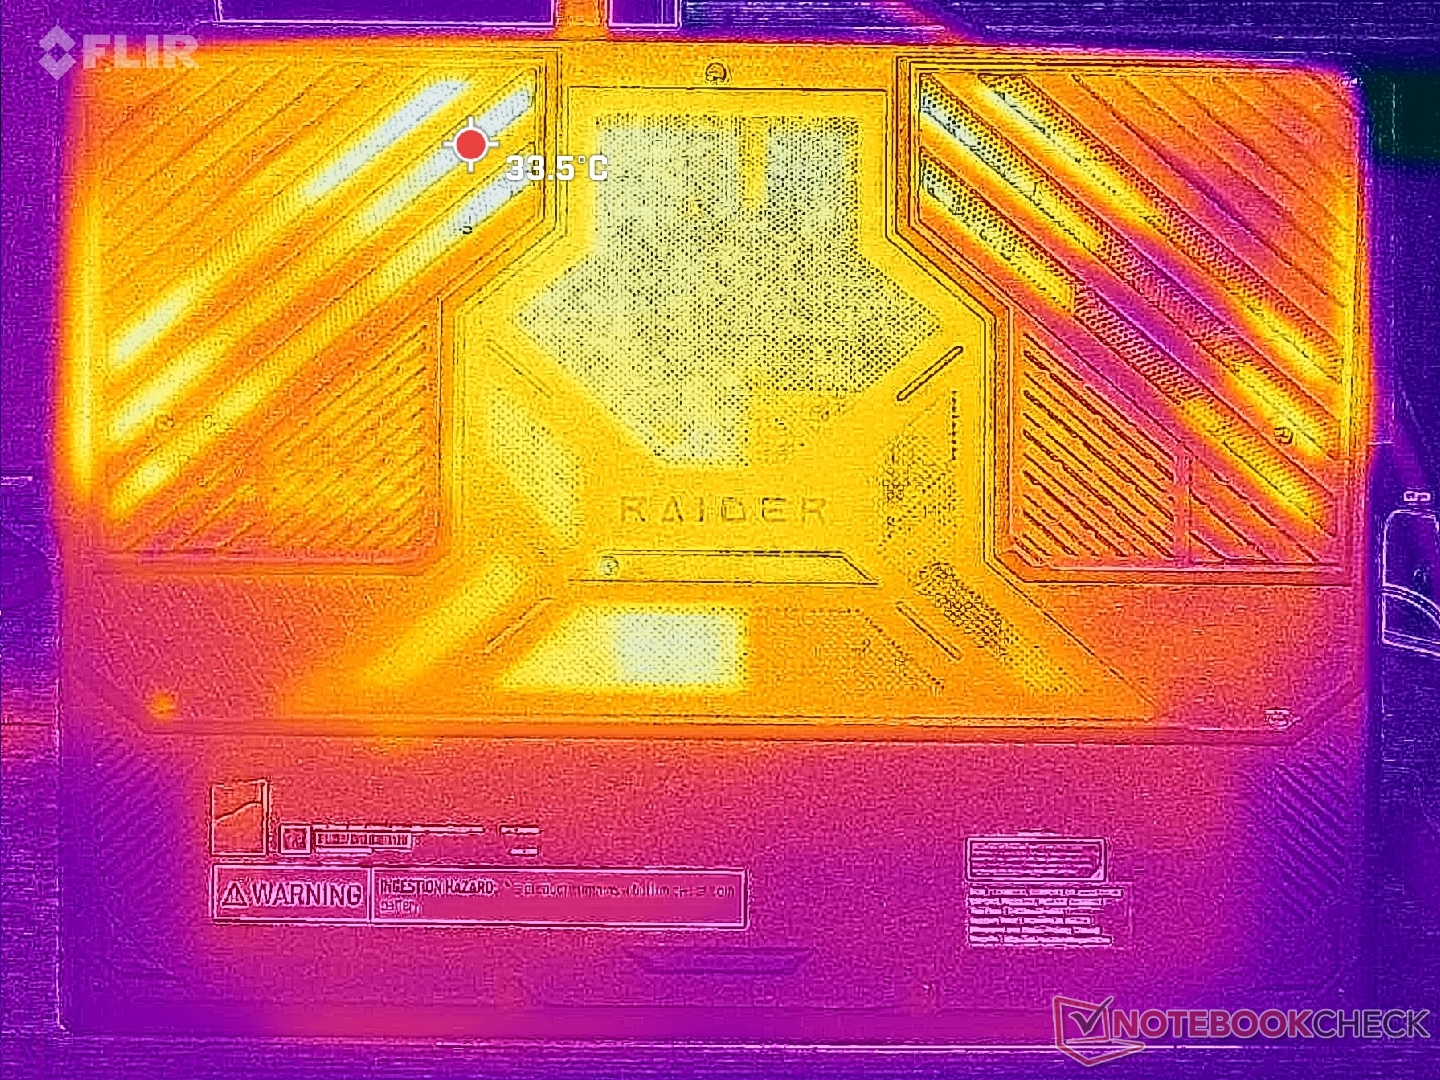
温度
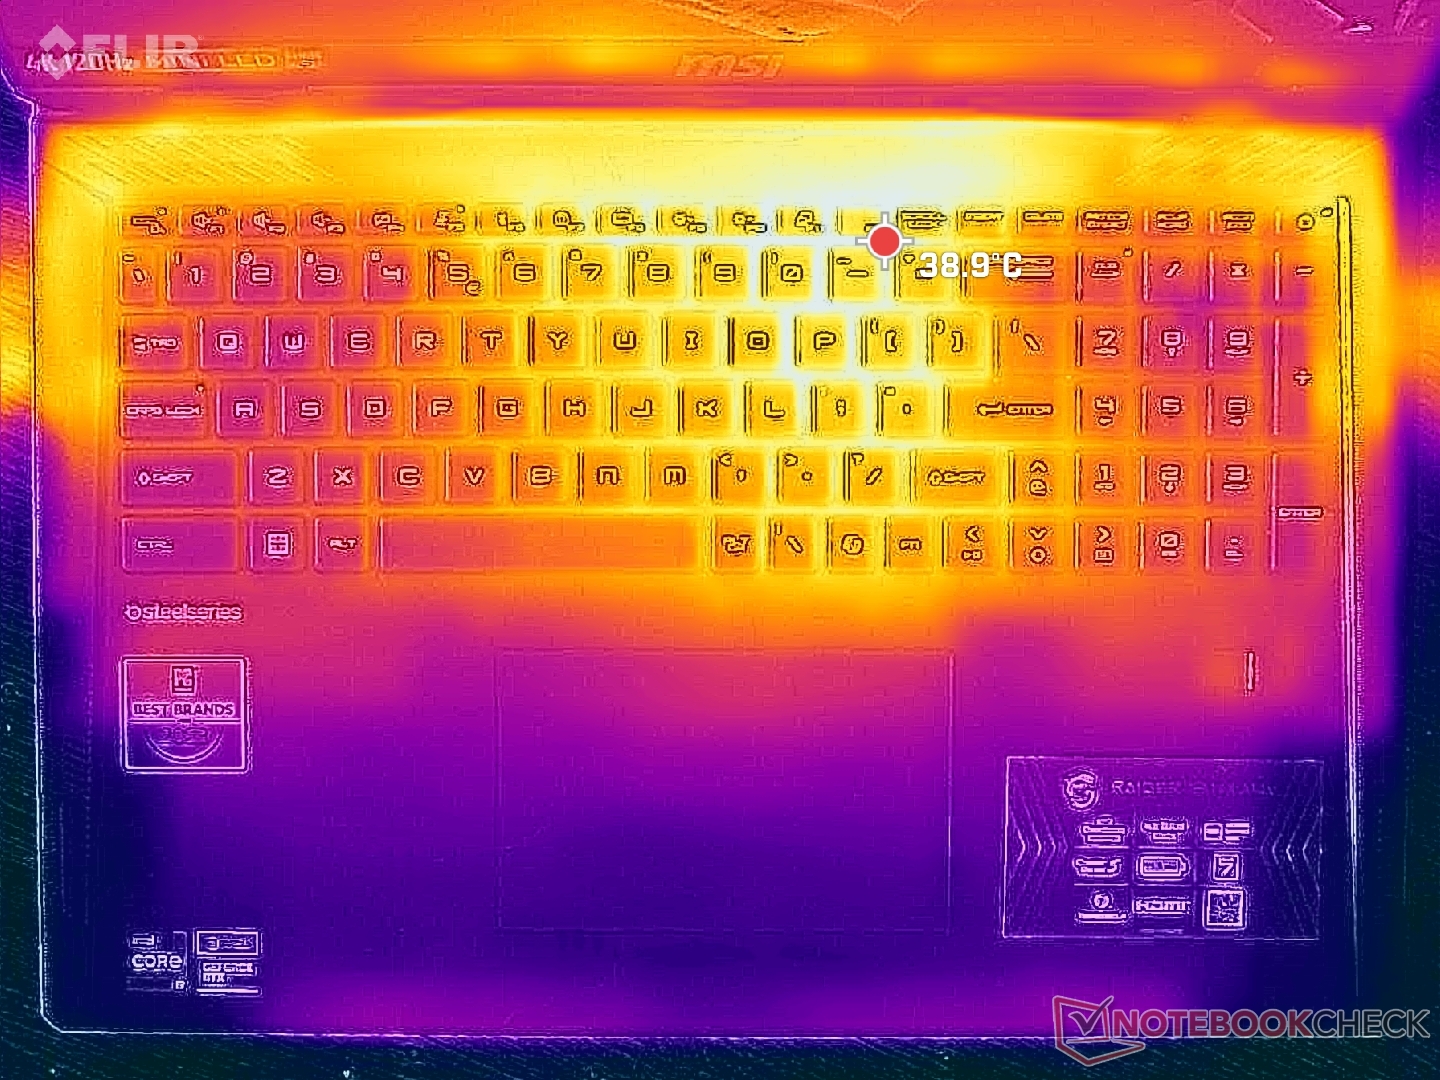
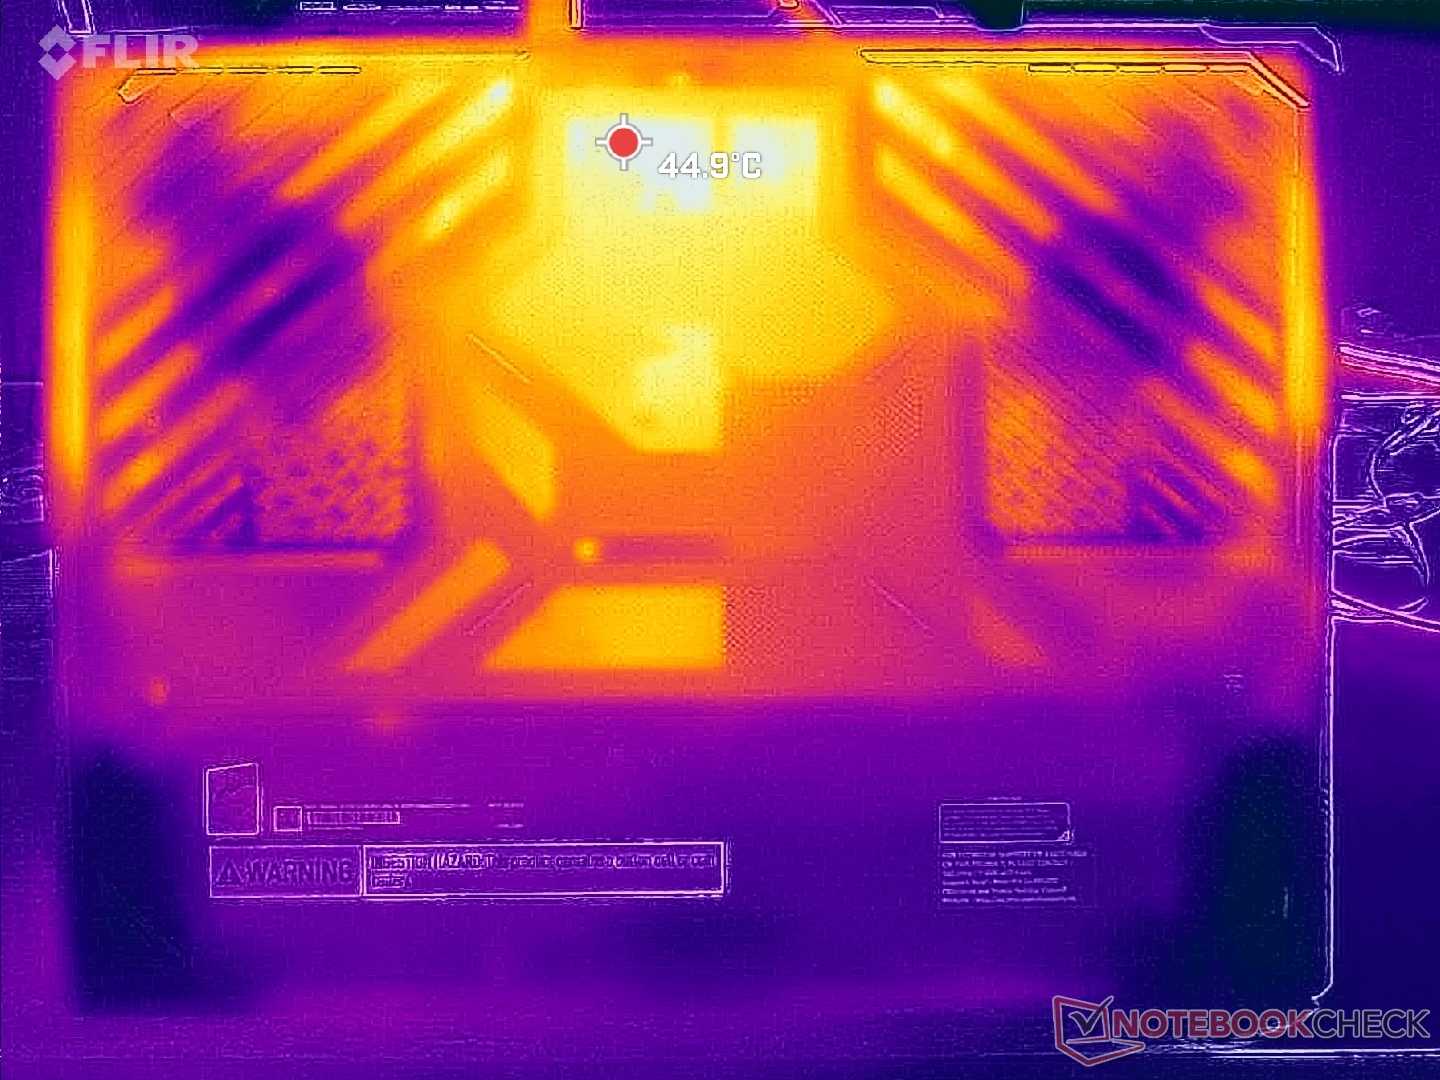
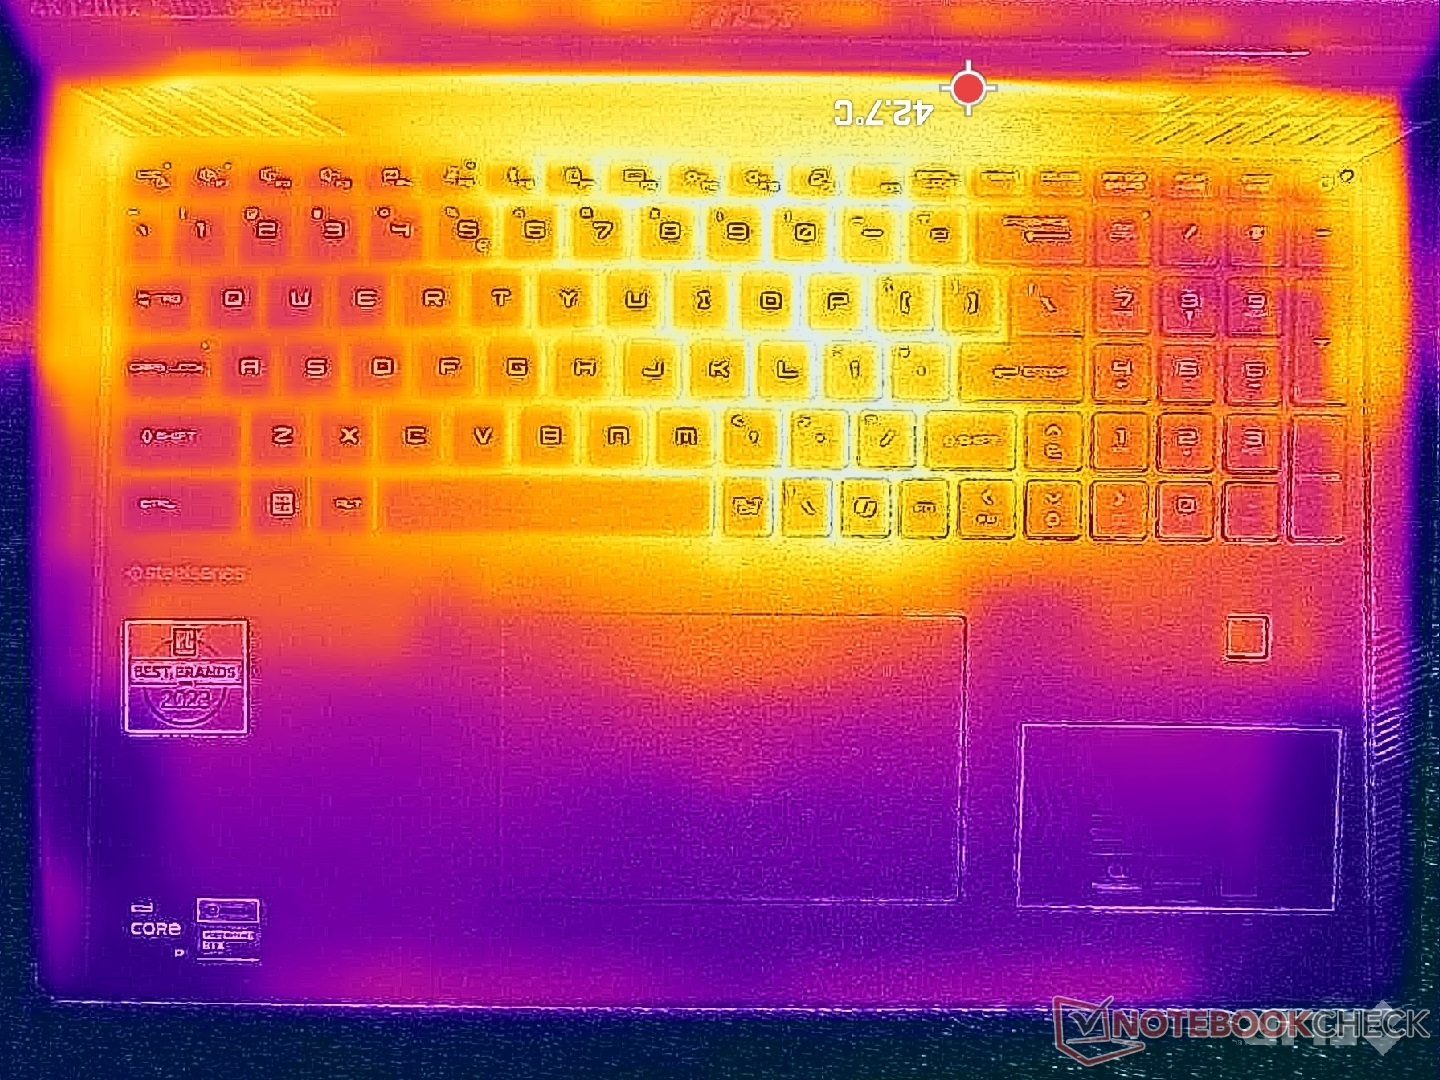
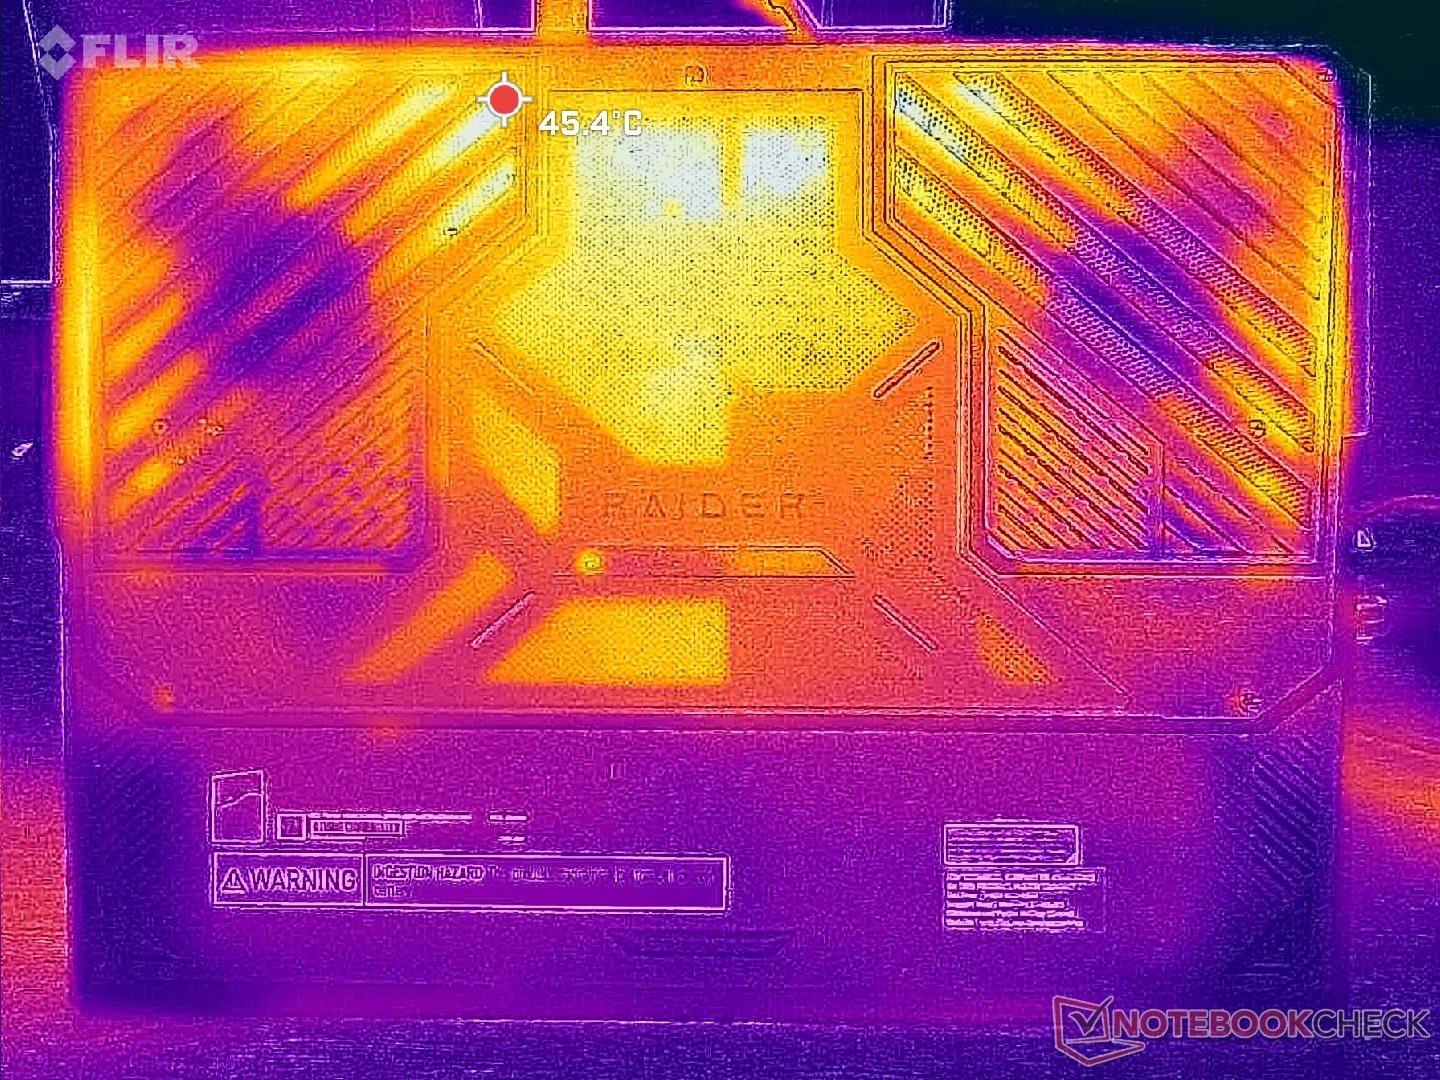
与 Titan 18 HX 一样,游戏时的热点温度也会超过 40 摄氏度。较热的区域位于键盘中心,因此 WASD 键、数字键盘和掌托会保持更低的温度,让皮肤感觉更舒适。
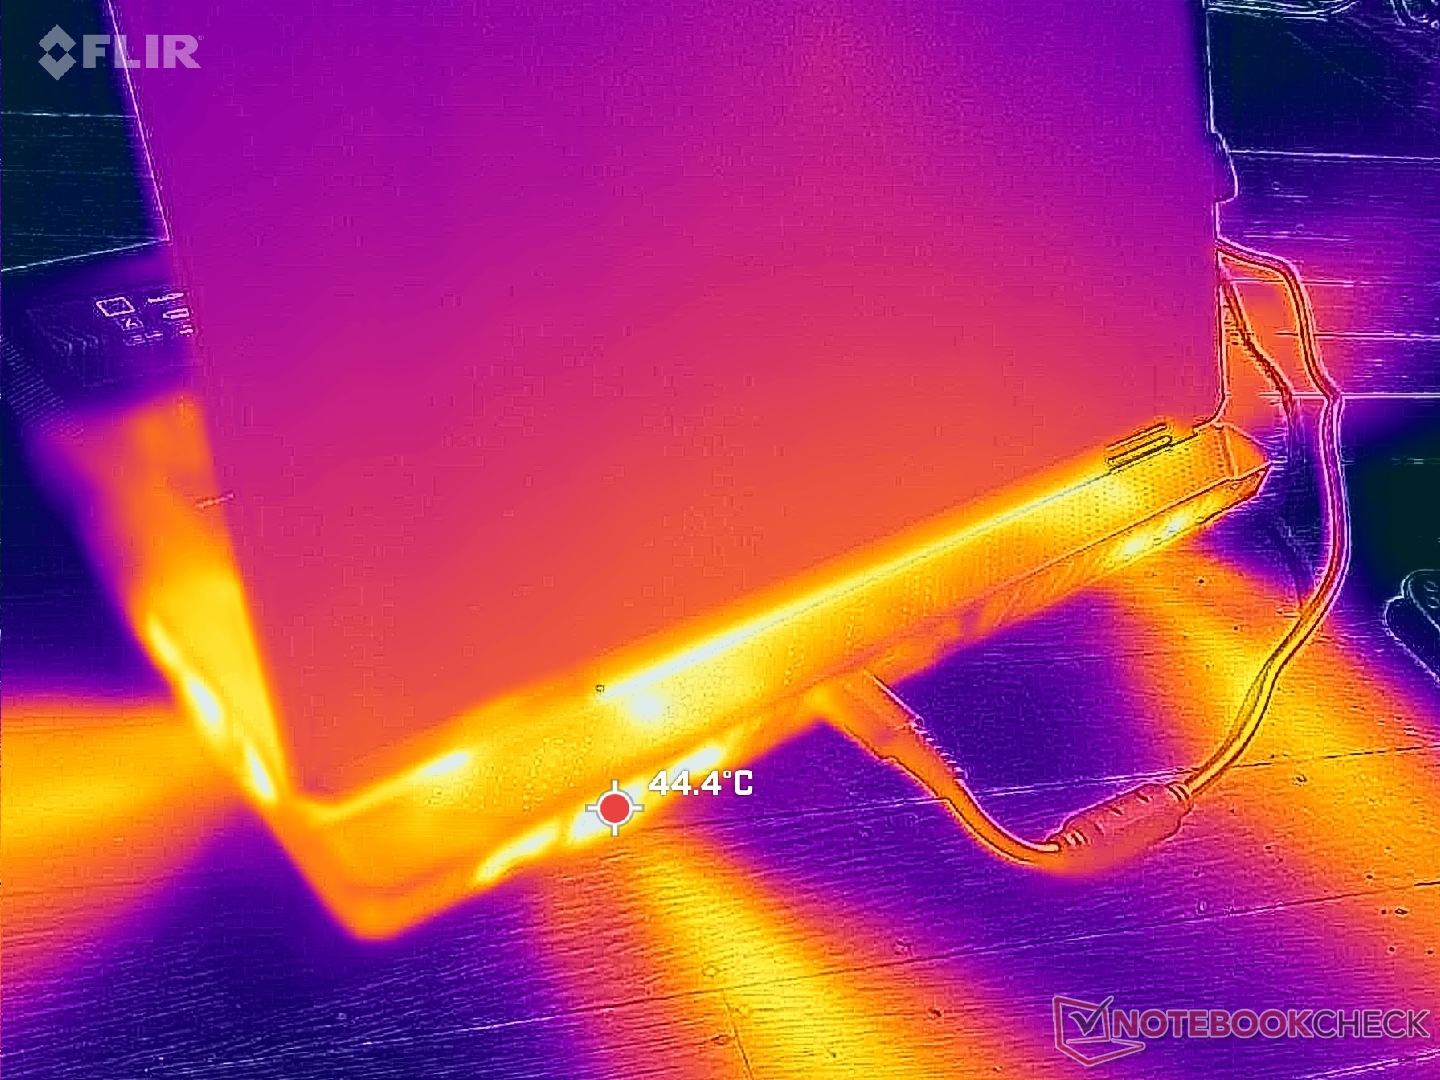
(±) The maximum temperature on the upper side is 40.8 °C / 105 F, compared to the average of 40.4 °C / 105 F, ranging from 21.2 to 68.8 °C for the class Gaming.
(±) The bottom heats up to a maximum of 43.4 °C / 110 F, compared to the average of 43.2 °C / 110 F
(±) In idle usage, the average temperature for the upper side is 33.7 °C / 93 F, compared to the device average of 33.9 °C / 93 F.
(±) 3: The average temperature for the upper side is 34.4 °C / 94 F, compared to the average of 33.9 °C / 93 F for the class Gaming.
(+) The palmrests and touchpad are reaching skin temperature as a maximum (32.6 °C / 90.7 F) and are therefore not hot.
(-) The average temperature of the palmrest area of similar devices was 28.9 °C / 84 F (-3.7 °C / -6.7 F).
| MSI Raider 18 HX A14V Intel Core i9-14900HX, NVIDIA GeForce RTX 4080 Laptop GPU | Razer Blade 18 2024 RZ09-0509 Intel Core i9-14900HX, NVIDIA GeForce RTX 4090 Laptop GPU | Alienware m18 R2 Intel Core i9-14900HX, NVIDIA GeForce RTX 4090 Laptop GPU | MSI Titan 18 HX A14VIG Intel Core i9-14900HX, NVIDIA GeForce RTX 4090 Laptop GPU | Asus ROG Strix G18 G814JI Intel Core i7-13650HX, NVIDIA GeForce RTX 4070 Laptop GPU | Acer Predator Helios 18 PH18-72-98MW Intel Core i9-14900HX, NVIDIA GeForce RTX 4090 Laptop GPU | |
|---|---|---|---|---|---|---|
| Heat | -1% | -5% | 6% | 5% | -6% | |
| Maximum Upper Side * | 40.8 | 43.2 -6% | 41.2 -1% | 37.8 7% | 45 -10% | 43 -5% |
| Maximum Bottom * | 43.4 | 42.6 2% | 34.6 20% | 37.6 13% | 47 -8% | 59 -36% |
| Idle Upper Side * | 36.4 | 36 1% | 42.8 -18% | 34.8 4% | 28 23% | 32 12% |
| Idle Bottom * | 36.4 | 36.4 -0% | 43.6 -20% | 36 1% | 31 15% | 34 7% |
* ... smaller is better
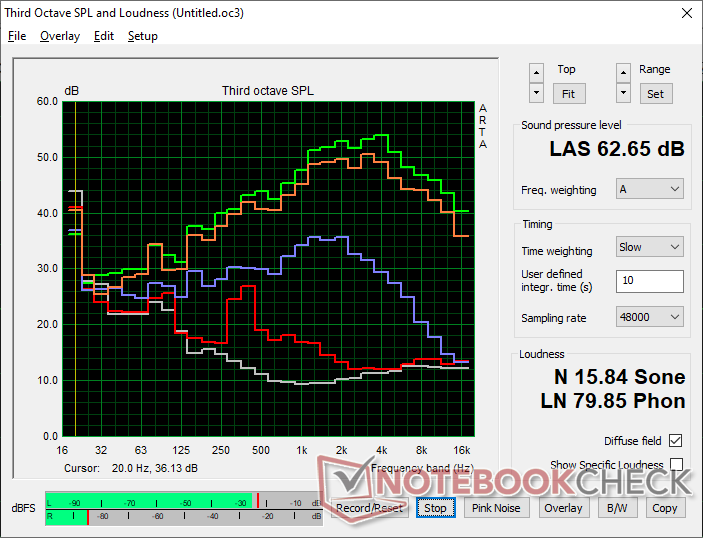
发言人
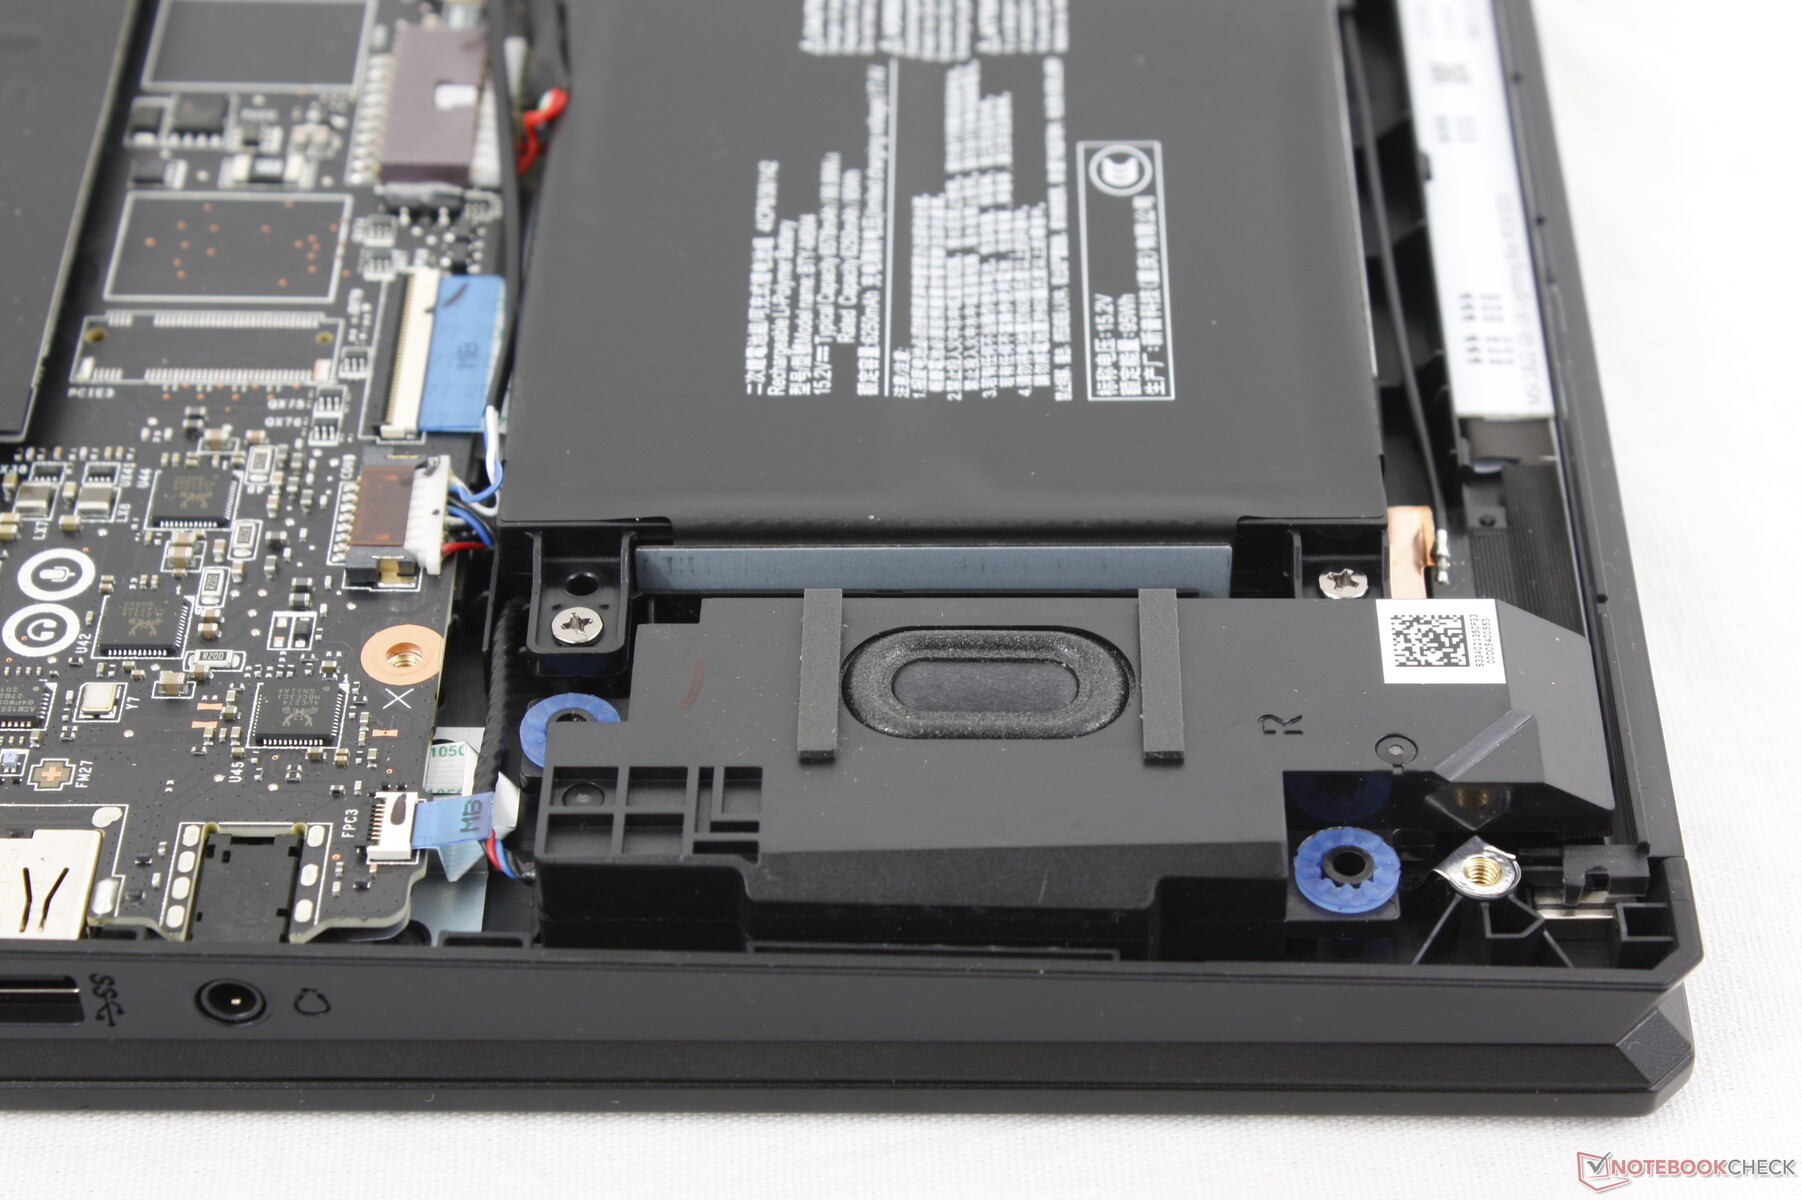
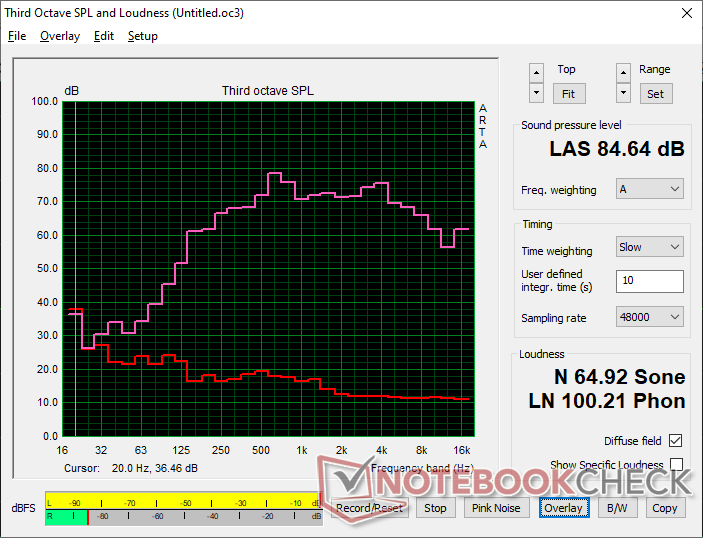
MSI Raider 18 HX A14V audio analysis
(+) | speakers can play relatively loud (84.6 dB)
Bass 100 - 315 Hz
(±) | reduced bass - on average 9.2% lower than median
(±) | linearity of bass is average (9.2% delta to prev. frequency)
Mids 400 - 2000 Hz
(+) | balanced mids - only 4.3% away from median
(+) | mids are linear (5.1% delta to prev. frequency)
Highs 2 - 16 kHz
(+) | balanced highs - only 3.8% away from median
(+) | highs are linear (4.9% delta to prev. frequency)
Overall 100 - 16.000 Hz
(+) | overall sound is linear (11.9% difference to median)
Compared to same class
» 11% of all tested devices in this class were better, 4% similar, 85% worse
» The best had a delta of 6%, average was 18%, worst was 132%
Compared to all devices tested
» 8% of all tested devices were better, 2% similar, 90% worse
» The best had a delta of 4%, average was 24%, worst was 134%
Apple MacBook Pro 16 2021 M1 Pro audio analysis
(+) | speakers can play relatively loud (84.7 dB)
Bass 100 - 315 Hz
(+) | good bass - only 3.8% away from median
(+) | bass is linear (5.2% delta to prev. frequency)
Mids 400 - 2000 Hz
(+) | balanced mids - only 1.3% away from median
(+) | mids are linear (2.1% delta to prev. frequency)
Highs 2 - 16 kHz
(+) | balanced highs - only 1.9% away from median
(+) | highs are linear (2.7% delta to prev. frequency)
Overall 100 - 16.000 Hz
(+) | overall sound is linear (4.6% difference to median)
Compared to same class
» 0% of all tested devices in this class were better, 0% similar, 100% worse
» The best had a delta of 5%, average was 18%, worst was 45%
Compared to all devices tested
» 0% of all tested devices were better, 0% similar, 100% worse
» The best had a delta of 4%, average was 24%, worst was 134%
能源管理
耗电量
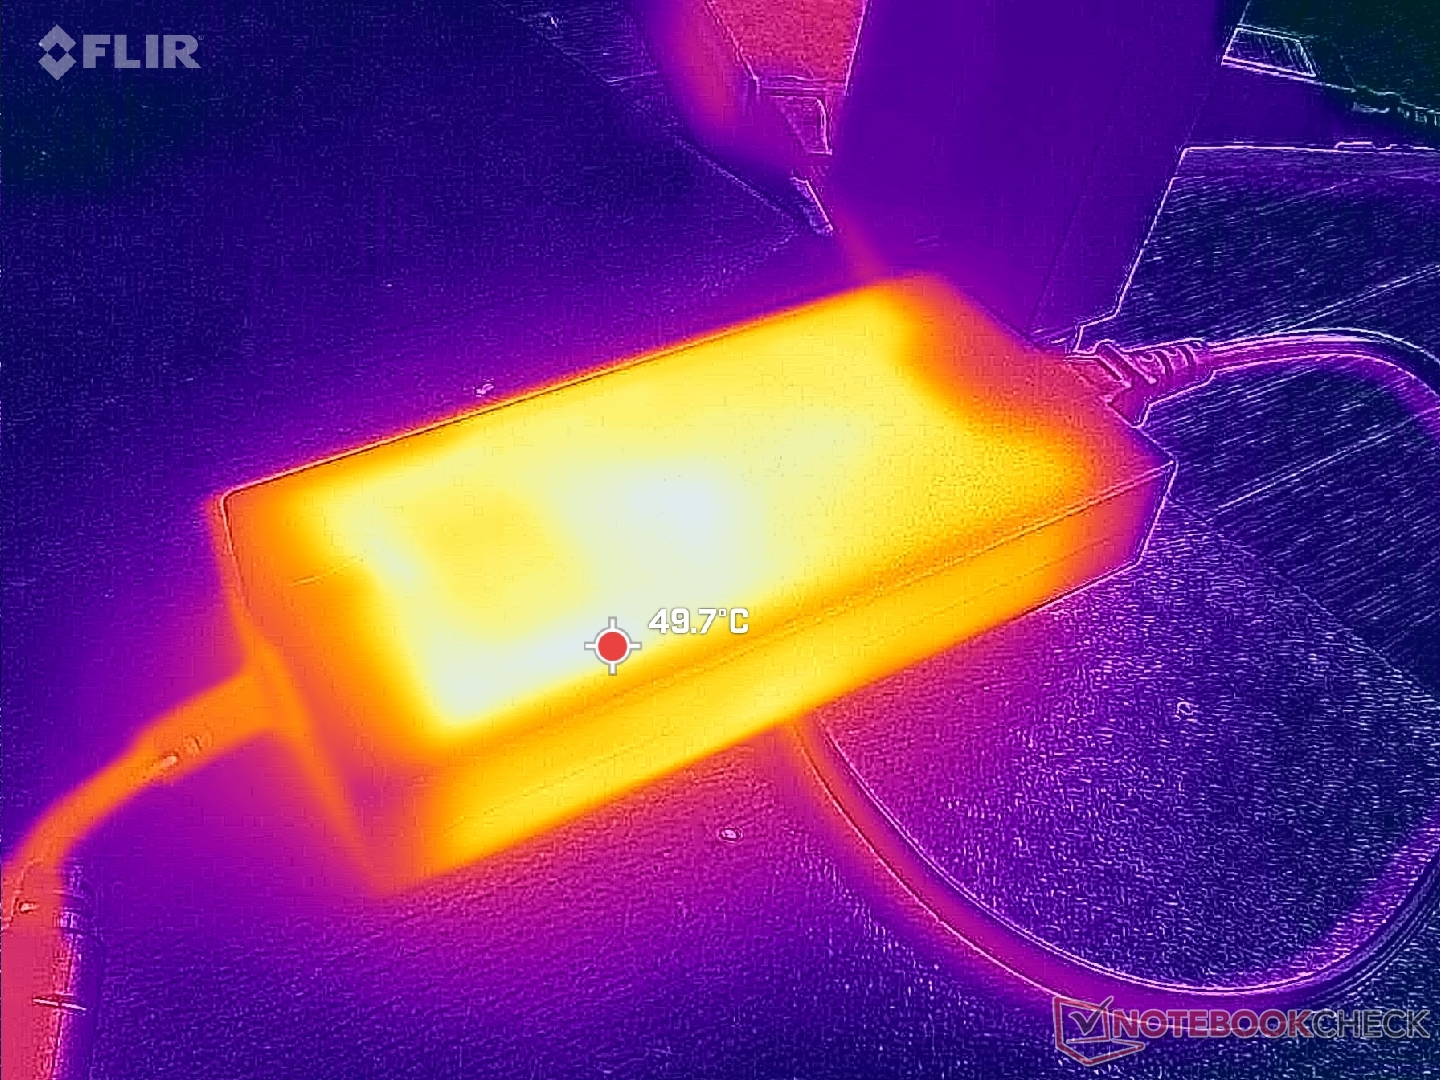
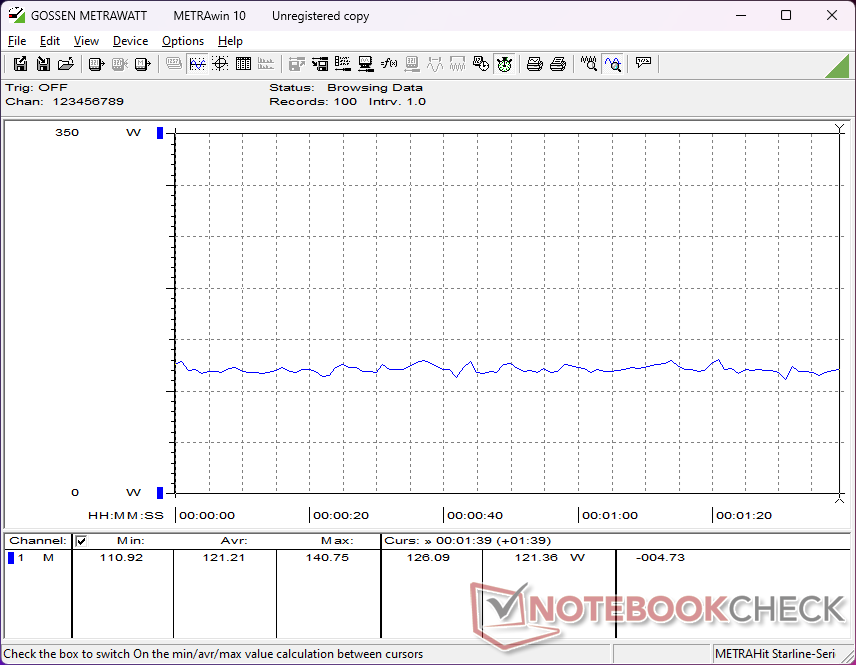
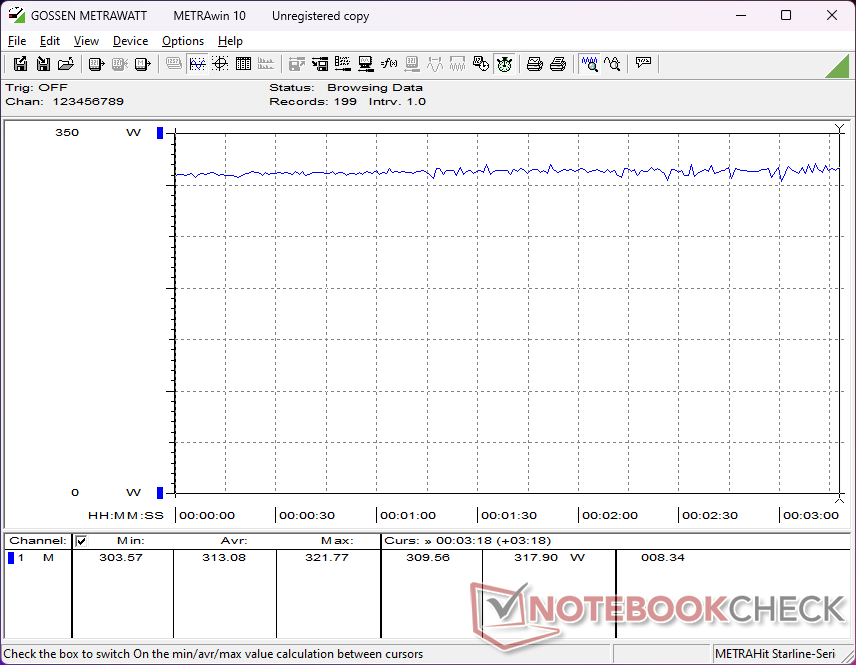
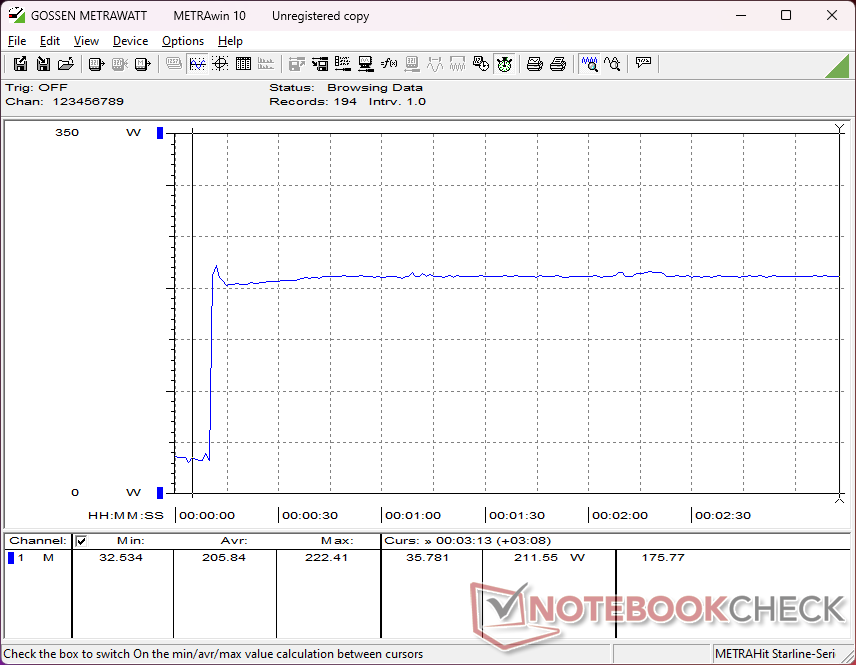
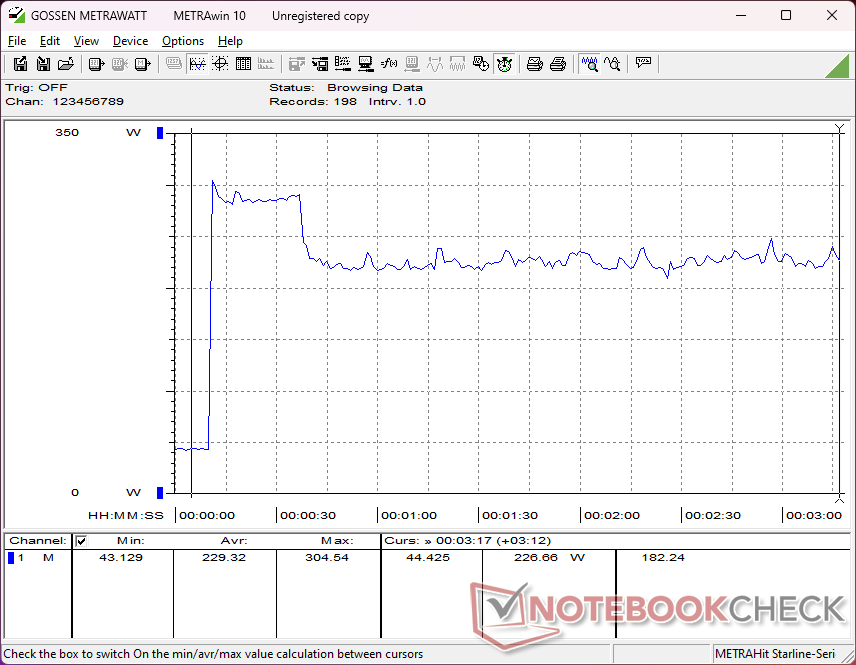
配备高要求 4K miniLED 面板的 18 英寸 DTR 的整体功耗非常高,这在意料之中。根据亮度设置、GPU 设置和电源配置文件设置的不同,台式机闲置时的功耗在 27 W 到 48 W 之间。游戏时的功耗略高于 300 瓦,而宏碁掠夺者 Helios 18 的功耗仅为 220 瓦。 宏碁掠夺者 Helios 18.
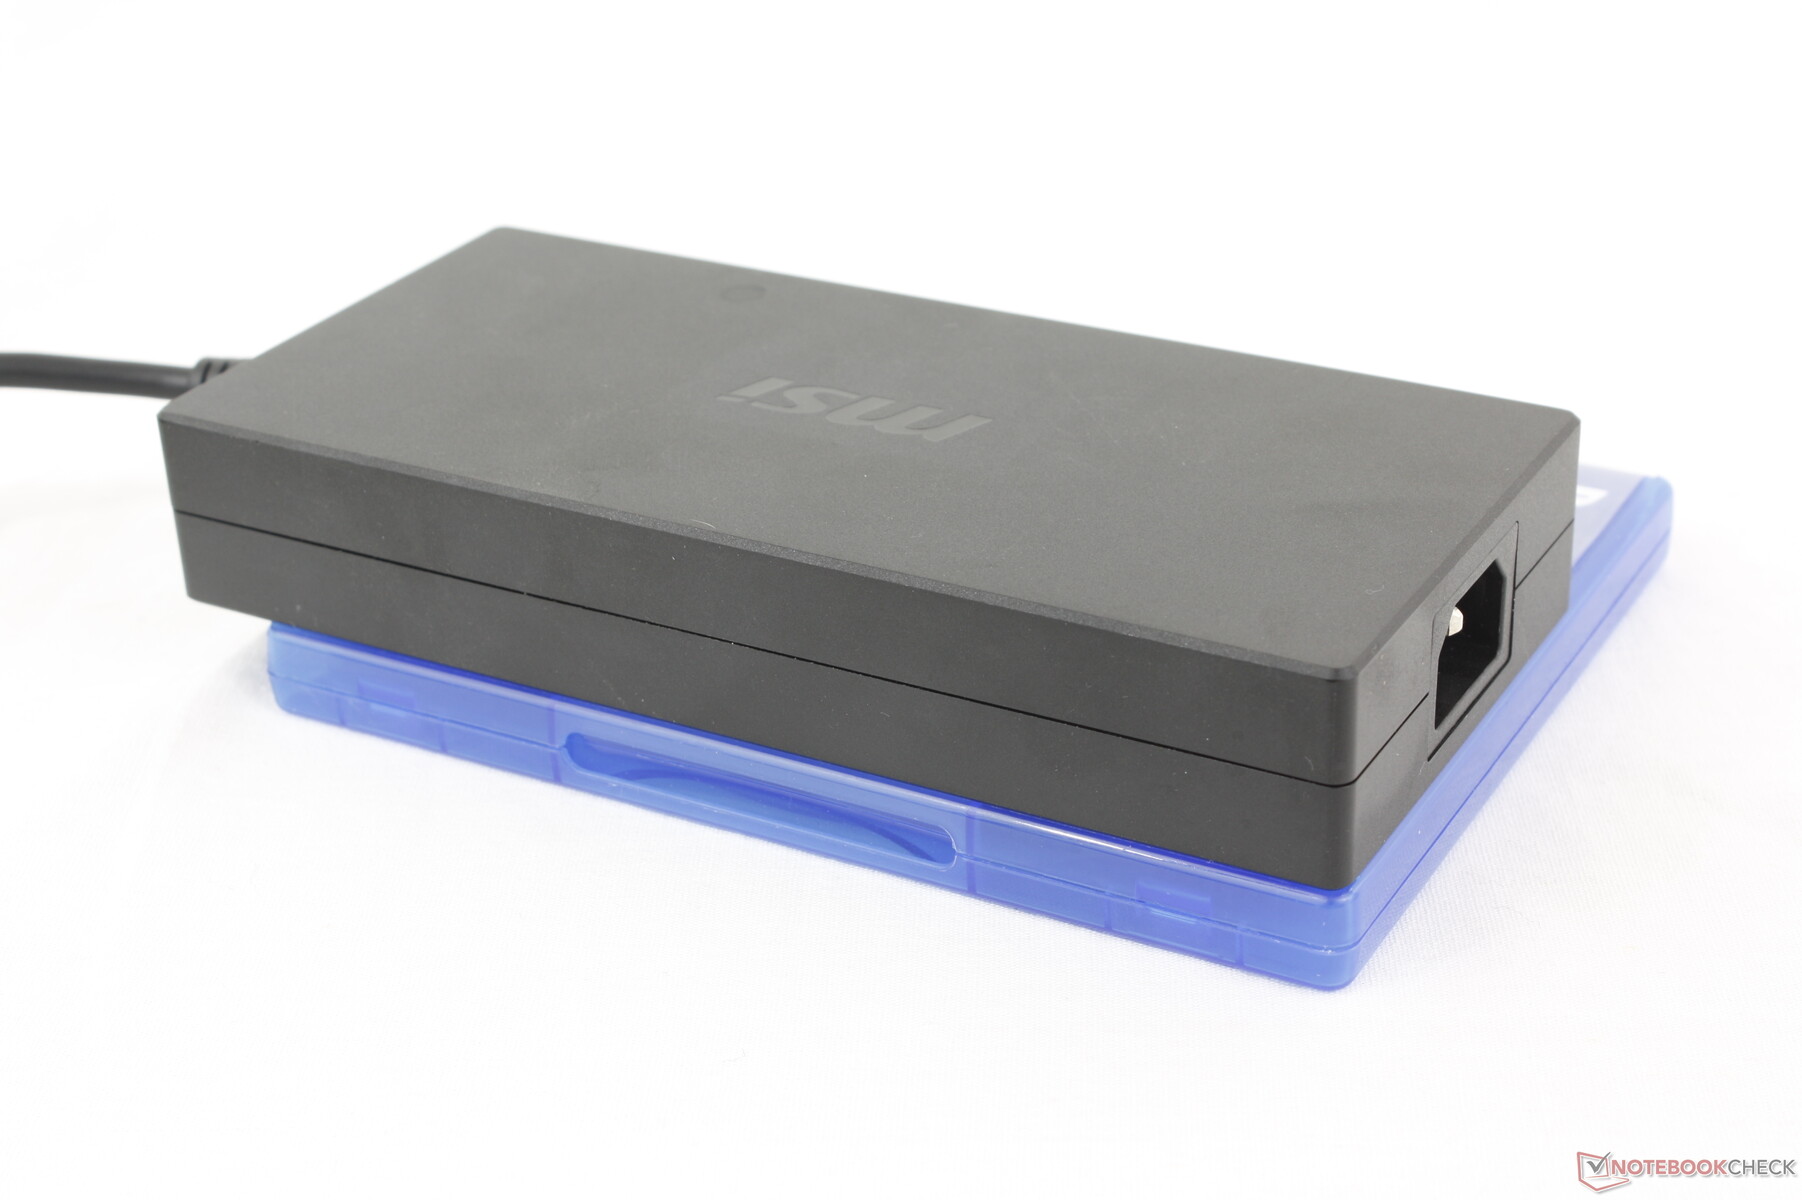
我们可以记录到 330 瓦大型交流适配器的耗电量高达 322 瓦。与 Titan 18 HX 的 400 W AC 适配器相比,330 W 适配器略小(约 18.4 x 8.4 x 3.1 厘米,约 18.8 x 8.8 x 3.2 厘米)。尽管 Raider 18 HX 配备了与 Titan 18 HX 相同的 CPU,但在运行 CPU 密集型任务时,Raider 18 HX 的功耗普遍较低,这与上文 CineBench 部分记录的稍慢的 CPU 性能相符。
| Off / Standby | |
| Idle | |
| Load |
|
Key:
min: | |
| MSI Raider 18 HX A14V i9-14900HX, NVIDIA GeForce RTX 4080 Laptop GPU, Samsung PM9A1 MZVL22T0HBLB, Mini-LED, 3840x2400, 18" | Razer Blade 18 2024 RZ09-0509 i9-14900HX, NVIDIA GeForce RTX 4090 Laptop GPU, , Mini-LED, 2560x1600, 18" | Alienware m18 R2 i9-14900HX, NVIDIA GeForce RTX 4090 Laptop GPU, SK Hynix PC811 HFS002TEM9X152N, IPS, 2560x1600, 18" | MSI Titan 18 HX A14VIG i9-14900HX, NVIDIA GeForce RTX 4090 Laptop GPU, 2x Samsung PM9A1a MZVL22T0HDLB (RAID 0), Mini-LED, 3840x2400, 18" | Asus ROG Strix G18 G814JI i7-13650HX, NVIDIA GeForce RTX 4070 Laptop GPU, Micron 2400 MTFDKBA1T0QFM, IPS, 2560x1600, 18" | Acer Predator Helios 18 PH18-72-98MW i9-14900HX, NVIDIA GeForce RTX 4090 Laptop GPU, 2x SK Hynix HFS001TEJ9X115N (RAID 0), Mini-LED, 2560x1600, 18" | |
|---|---|---|---|---|---|---|
| Power Consumption | -2% | 8% | 5% | 42% | -2% | |
| Idle Minimum * | 27.7 | 25.4 8% | 10.6 62% | 13.2 52% | 8 71% | 31 -12% |
| Idle Average * | 38.3 | 37.7 2% | 20.9 45% | 25.4 34% | 15 61% | 35 9% |
| Idle Maximum * | 47.1 | 57.9 -23% | 40 15% | 53.5 -14% | 26 45% | 43 9% |
| Load Average * | 121.2 | 128.4 -6% | 201.1 -66% | 151.4 -25% | 102 16% | 144 -19% |
| Cyberpunk 2077 ultra * | 313 | |||||
| Cyberpunk 2077 ultra external monitor * | 306 | |||||
| Load Maximum * | 321.8 | 297.9 7% | 378.9 -18% | 395.2 -23% | 267 17% | 318 1% |
| Witcher 3 ultra * | 273.1 | 358 | 336 | 178.6 | 228 |
* ... smaller is better
Power Consumption Cyberpunk / Stress Test
Power Consumption external Monitor
电池寿命
由于硬件要求较高,运行时间较短。即使设置为省电模式和 iGPU 模式,我们也只能记录下 3 个多小时的 WLAN 实际使用时间,而 ROG Strix G18 却能达到这个水平。 ROG Strix G18的 IPS 显示屏则可以使用两倍以上的时间。电池容量已达到 99.9 Wh 的法定上限。
从空电充至满电需要近 2.5 小时,比其他大多数笔记本电脑都要长一些。使用第三方 USB-C AC 适配器充电会更慢。
| MSI Raider 18 HX A14V i9-14900HX, NVIDIA GeForce RTX 4080 Laptop GPU, 99.9 Wh | Razer Blade 18 2024 RZ09-0509 i9-14900HX, NVIDIA GeForce RTX 4090 Laptop GPU, 91.7 Wh | Alienware m18 R2 i9-14900HX, NVIDIA GeForce RTX 4090 Laptop GPU, 97 Wh | MSI Titan 18 HX A14VIG i9-14900HX, NVIDIA GeForce RTX 4090 Laptop GPU, 99.9 Wh | Asus ROG Strix G18 G814JI i7-13650HX, NVIDIA GeForce RTX 4070 Laptop GPU, 90 Wh | Acer Predator Helios 18 PH18-72-98MW i9-14900HX, NVIDIA GeForce RTX 4090 Laptop GPU, 90 Wh | |
|---|---|---|---|---|---|---|
| Battery Runtime | 20% | 46% | 19% | 101% | -10% | |
| Reader / Idle | 264 | 395 50% | 353 34% | 702 166% | ||
| WiFi v1.3 | 198 | 263 33% | 290 46% | 252 27% | 484 144% | 192 -3% |
| Load | 76 | 58 -24% | 72 -5% | 71 -7% | 64 -16% |
Pros
Cons
结论 - 内心的泰坦
当我们回顾 Titan 18 HX时,我们对其性能大加赞赏,但在得知其售价超过 5000 美元时却大吃一惊。事实上,CPU 和 GPU 并无新意,这使得该机型的吸引力大打折扣。Raider 18 HX 解决了 Titan 18 HX 价格过高的问题,在保留相同 CPU、GPU 和显示屏选项的同时,对其进行了删减。虽然 Raider 的用户失去了背光点击板、蒸汽腔冷却、机械按键和三级 M.2 SSD 支持,但在 Raider 和 Titan 的游戏体验完全相同的情况下,这些奢侈功能还是很容易舍弃的。事实上,可以说 Raider 使用起来更舒适,因为其传统的点击式键盘和薄膜式键盘比 Titan 上的非典型键盘更熟悉。
Raider 18 HX 从酷睿 i9 CPU 和 175 W GPU 中榨取了每一丝性能,即使它不得不比许多竞争对手更大、更重,有时声音也更大。
与其他 18 英寸游戏笔记本电脑相比,Raider 18 HX 提供了更宽敞的打字空间和四个 SODIMM 插槽,而其他同类产品如 刀锋 18或 ROG Strix G18则完全没有数字键盘或仅支持两个 SODIMM 模块。不过,微星系统的体积和重量仍明显高于大多数竞争对手,而且运行时也不一定更安静。CPU 和 GPU 性能可能会稍快一些,但许多用户在实际使用中可能不会注意到。在这种情况下,你必须看重 Raider 更方便的维修和 4K mini-LED 选项,以证明其重量是合理的。
注:我们最近更新了评级系统,第 8 版的结果与第 7 版的结果不具可比性。更多信息 此处.
MSI Raider 18 HX A14V
- 09/03/2024 v8
Allen Ngo
 Total Sustainability Score:
 Transparency
The selection of devices to be reviewed is made by our editorial team. The test sample was provided to the author as a loan by the manufacturer or retailer for the purpose of this review. The lender had no influence on this review, nor did the manufacturer receive a copy of this review before publication. There was no obligation to publish this review. We never accept compensation or payment in return for our reviews. As an independent media company, Notebookcheck is not subjected to the authority of manufacturers, retailers or publishers.
This is how Notebookcheck is testing
Every year, Notebookcheck independently reviews hundreds of laptops and smartphones using standardized procedures to ensure that all results are comparable. We have continuously developed our test methods for around 20 years and set industry standards in the process. In our test labs, high-quality measuring equipment is utilized by experienced technicians and editors. These tests involve a multi-stage validation process. Our complex rating system is based on hundreds of well-founded measurements and benchmarks, which maintains objectivity. Further information on our test methods can be found here.
Price comparison

