

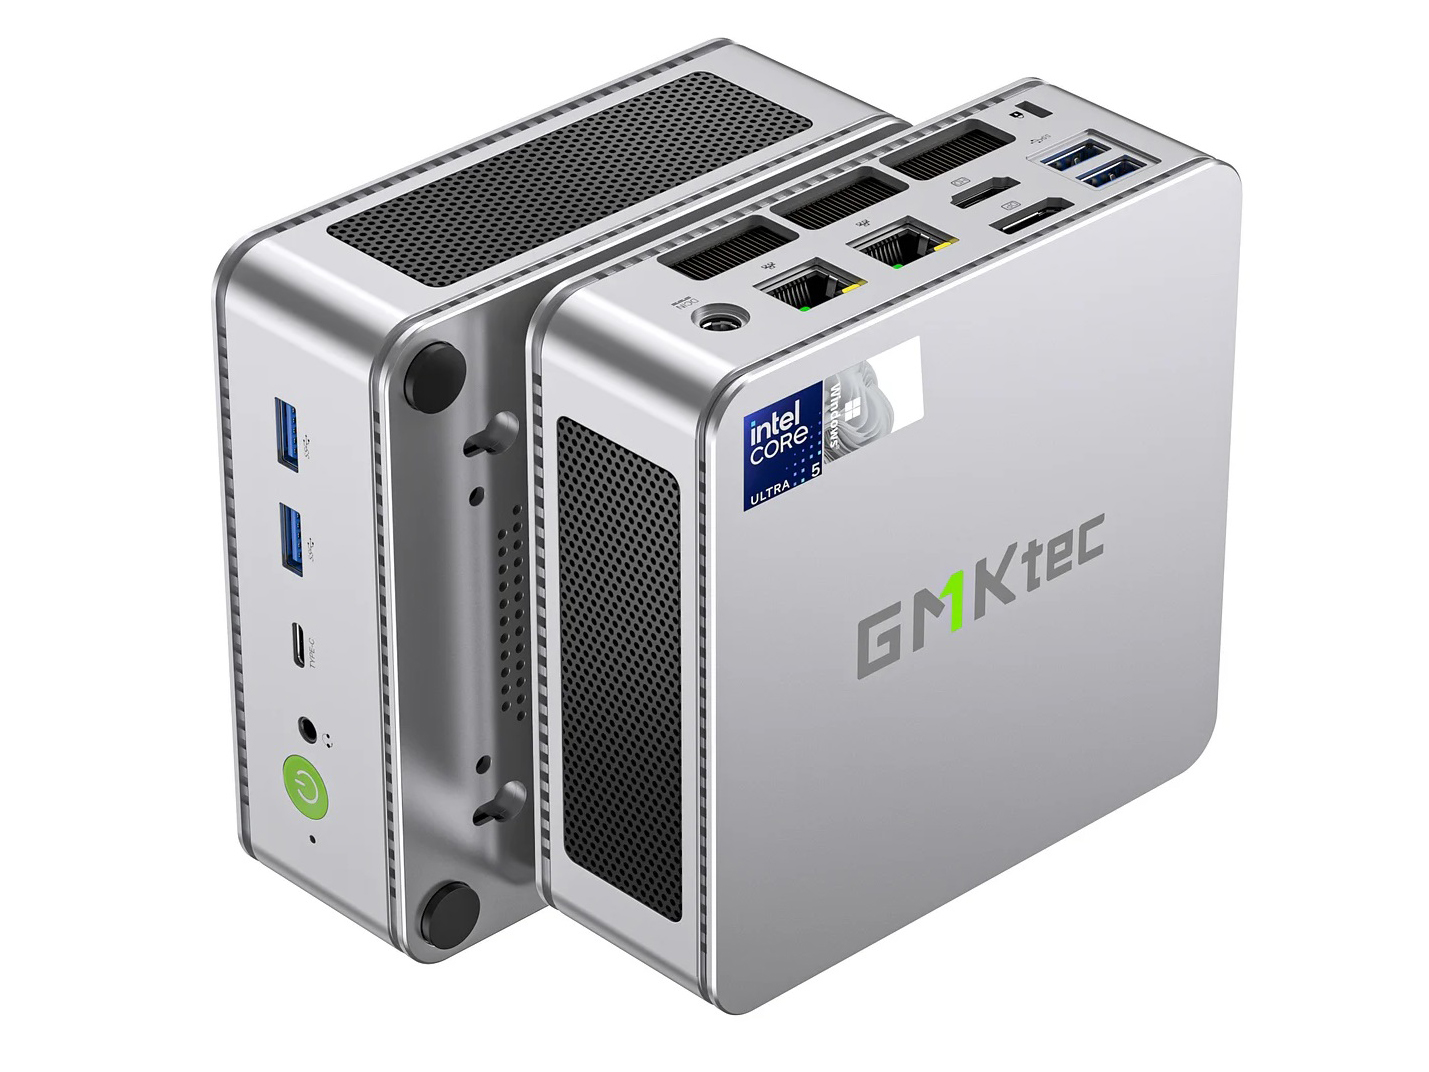
GMK NucBox K9 迷你电脑评测:配备 Arc 7 图形处理器的酷睿 5 125H

几个月前,我们刚刚评测过 GMK NucBox K6,现在我们又准备评测配备了最新人工智能流星湖处理器的 NucBox K9。不过,除了 CPU 从 AMD 换成了英特尔之外,这两款机型的机箱仍然完全相同,因此我们建议您查看我们对 NucBox K6了解该系统的更多物理特性。
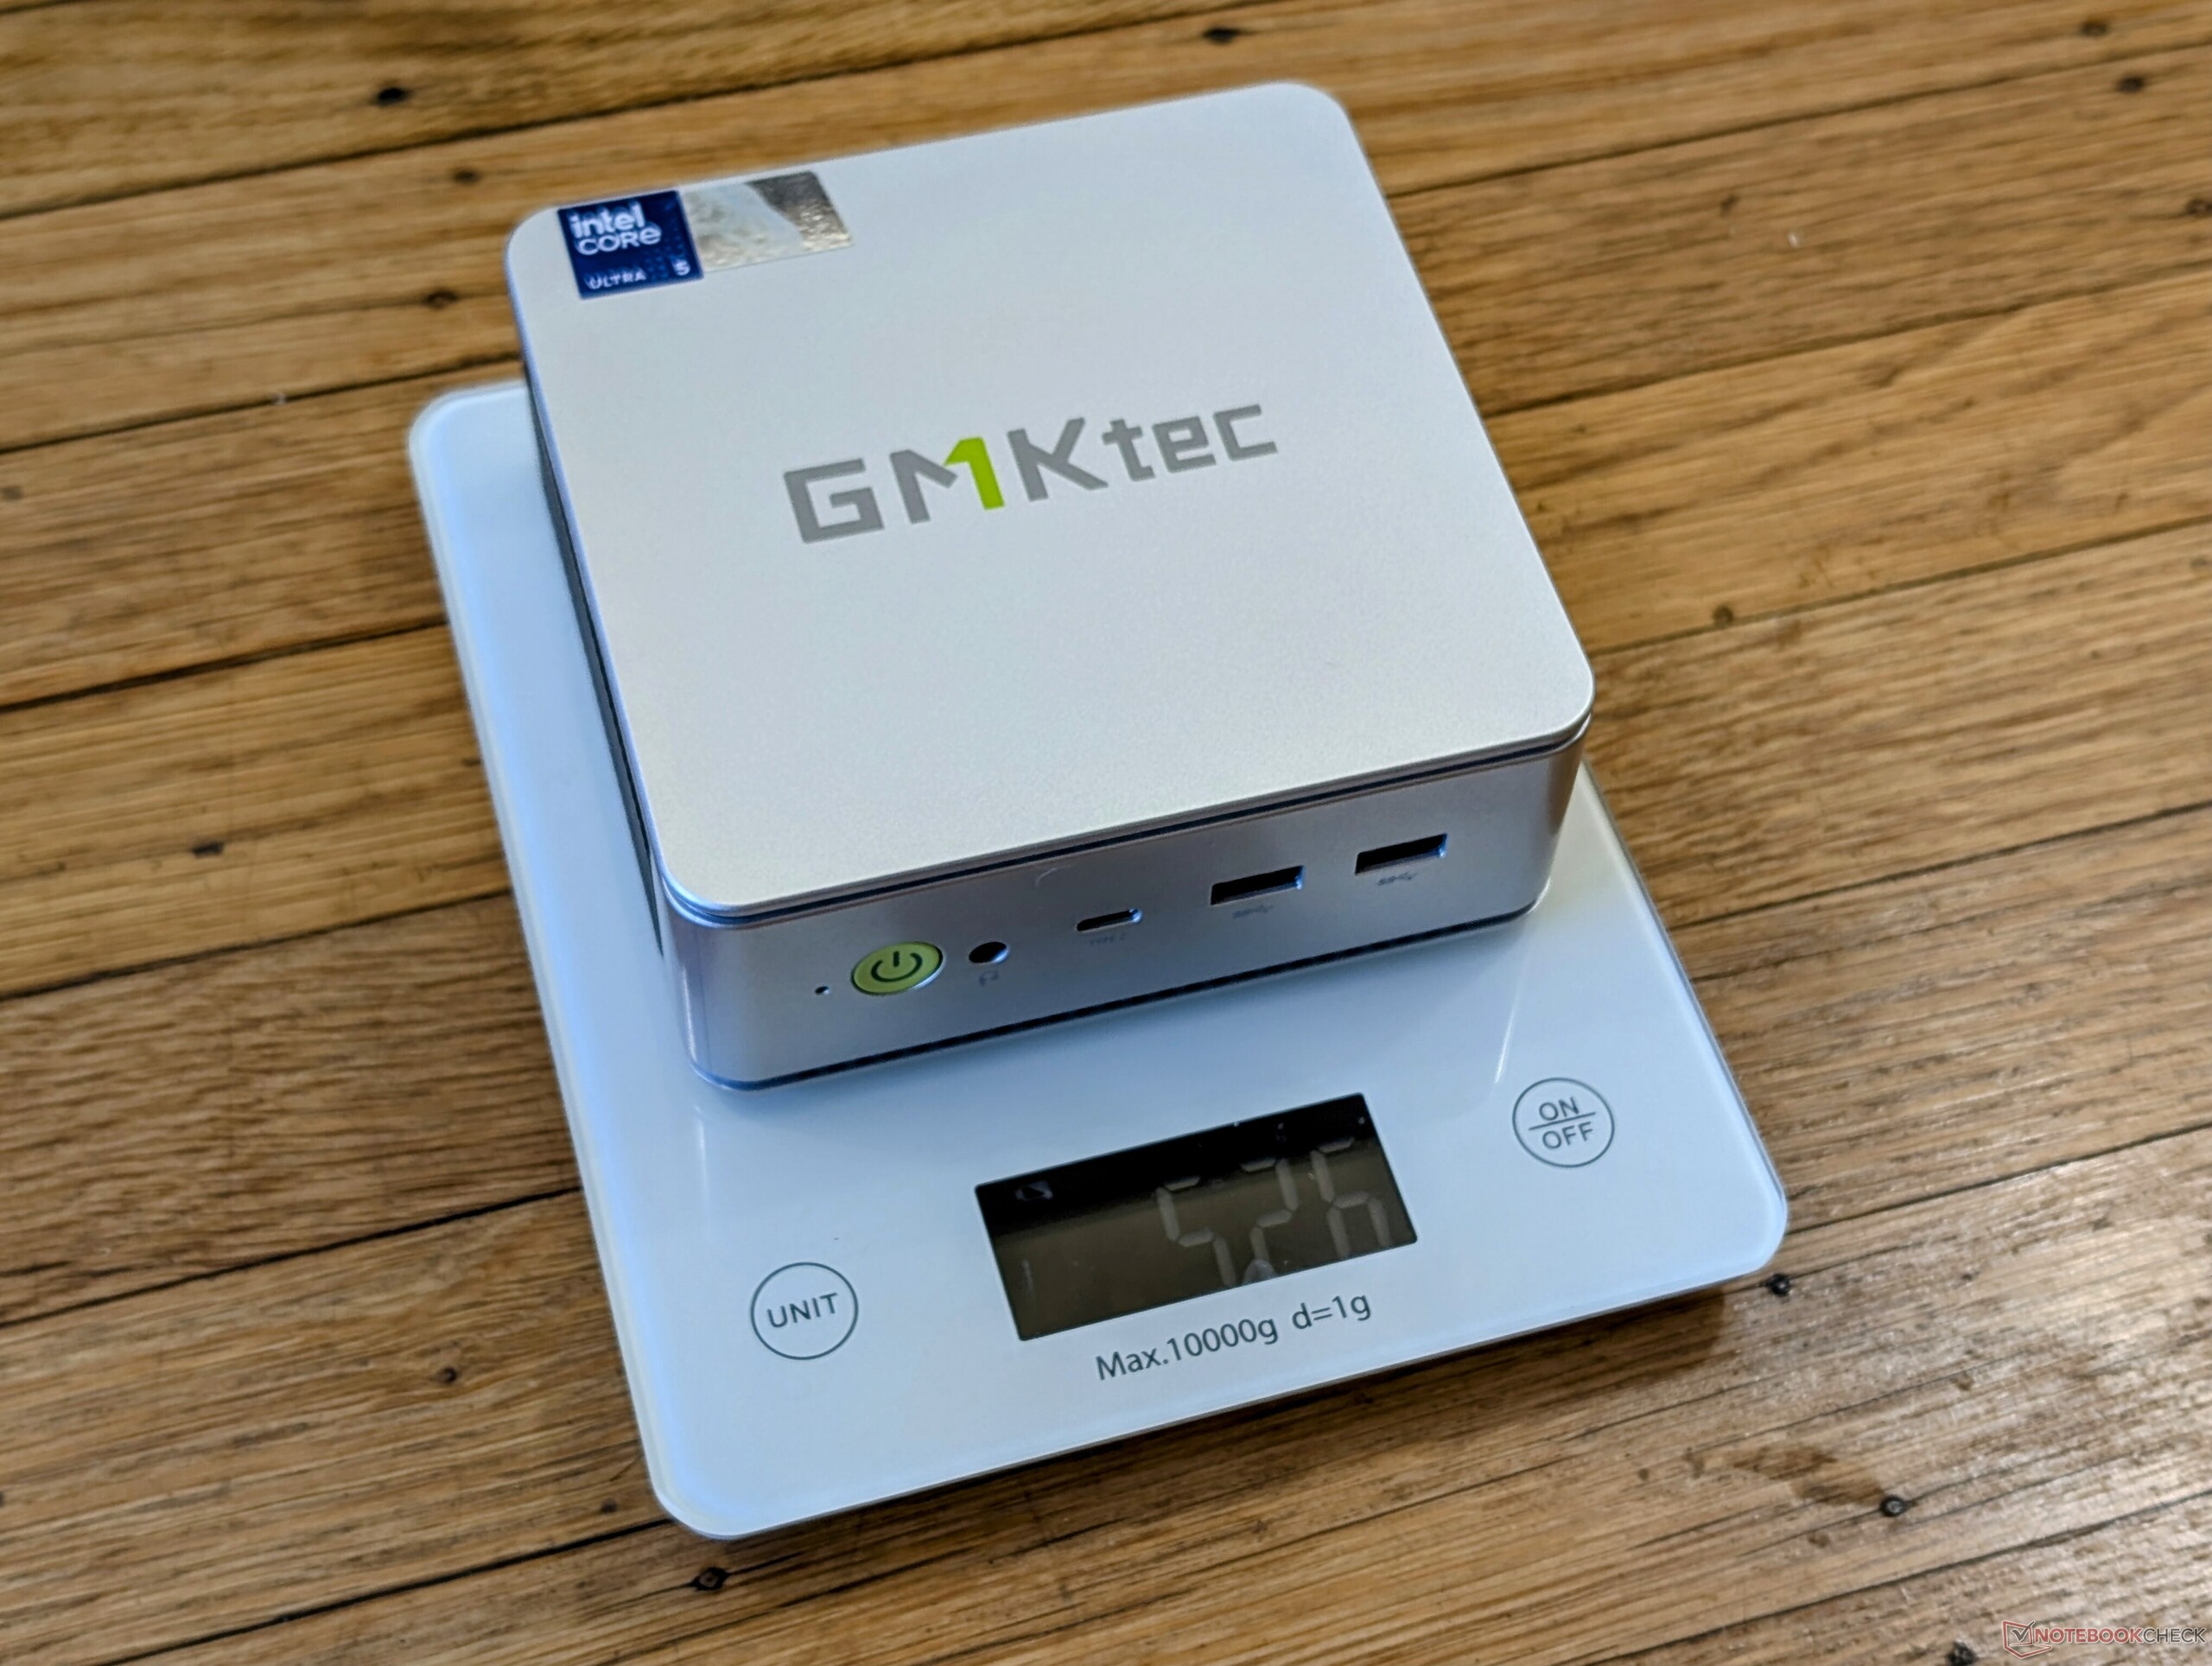
我们的测试机配备了酷睿Ultra 5 125H CPU、1 TB固态硬盘和32 GB内存,售价约为860美元,如果打折则为570美元。用户可以完全不配置内存或固态硬盘,进行裸机设置,但所有选项的酷睿Ultra 5 CPU都是固定的。
其他选择包括其他高性能迷你电脑,如 Beelink SER8, 博弈 M1或 Geekom AX8 Pro.
更多 GMKtec 评论:
潜在的竞争对手比较
Rating | Version | Date | Model | Weight | Height | Size | Resolution | Price |
|---|---|---|---|---|---|---|---|---|
| 67.3 % | v8 | 09 / 2024 | GMK NucBox K9 Ultra 5 125H, Arc 7-Core | 528 g | 47 mm | x | ||
| 83.6 % v7 (old) | v7 (old) | 04 / 2024 | GMK NucBox K6 R7 7840HS, Radeon 780M | 514 g | 47 mm | x | ||
| 63.6 % | v8 | 07 / 2024 | GMK NucBox M6 R5 6600H, Radeon 660M | 526 g | 48 mm | x | ||
| 74.9 % | v8 | 07 / 2024 | Beelink SER8 R7 8845HS, Radeon 780M | 776 g | 44.7 mm | x | ||
v (old) | 12 / 2022 | Beelink SEi12 Core i5-1235U i5-1235U, Iris Xe G7 80EUs | 465 g | 42 mm | x | |||
| 84.5 % v7 (old) | v7 (old) | 05 / 2024 | BOSGAME M1 R7 7840HS, Radeon 780M | 766 g | 51 mm | x |
注:我们最近更新了评级系统,第 8 版的结果与第 7 版的结果不具可比性。更多信息 此处.
案例 - 改变颜色
塑料和金属机身与采用 AMD 技术的 NucBox K6 保持一致,只是采用了哑光灰/银色。
连接性 - 更快的 USB 端口
虽然端口选项和位置与 NucBox K6 相比没有变化,但 USB 端口已经升级。所有 USB-A 端口现在都是 USB4,而不是 2.0 或 3.2。同时,USB-C 端口正式支持 Thunderbolt 4。
如果第三方 USB-C 交流适配器能提供足够的电力,则可代替桶装交流适配器为系统供电。但不能保证所有 USB-C 适配器的性能和兼容性。
交流
Wi-Fi 6 和蓝牙 5.2 连接标配英特尔 AX201,而不是联发科 RZ616。为了节约成本,Wi-Fi 6E 和 Wi-Fi 7 未包括在内。
| Networking | |
| iperf3 transmit AXE11000 | |
| GMK NucBox M6 | |
| Beelink SEi12 Core i5-1235U | |
| BOSGAME M1 | |
| GMK NucBox K9 | |
| Beelink SER8 | |
| GMK NucBox K6 | |
| iperf3 receive AXE11000 | |
| BOSGAME M1 | |
| GMK NucBox M6 | |
| Beelink SEi12 Core i5-1235U | |
| GMK NucBox K6 | |
| Beelink SER8 | |
| GMK NucBox K9 | |
| iperf3 transmit AXE11000 6GHz | |
| BOSGAME M1 | |
| GMK NucBox K6 | |
| GMK NucBox M6 | |
| iperf3 receive AXE11000 6GHz | |
| BOSGAME M1 | |
| GMK NucBox K6 | |
| GMK NucBox M6 | |
维护
可升级组件与 NucBox K6 相同。
可持续性
制造商宣传 "可持续制造 "系统,但没有详细说明这意味着什么。包装本身主要是纸板和一些塑料包装。
配件和保修
零售包装盒包括一个 VESA 安装支架和 HDMI 线缆,以及常见的文件和交流适配器。如果在美国购买,制造商提供为期一年的保修服务。
性能 - 流星湖标准
测试条件
在运行以下基准测试之前,我们将 Windows 设置为性能模式。
处理器
CPU 性能是我们数据库中其他 PC 的预期性能,这些 PC 具有相同的 酷睿至尊 5 125H处理器。流星湖处理器与上一代 酷睿 i9-13900H这在纸面上听起来很不错,但当你想起搭载 AMD 处理器的 NucBox K6 采用较早的 Ryzen 7 7840HS的 NucBox K6 甚至比这两种英特尔解决方案都要快。因此,考虑到 NucBox K9 是较新的机箱,缺少酷睿至尊 7 的选择就显得有些奇怪了。
虽然集成了人工智能,但它与 Co-Pilot+ 不兼容。
Cinebench R15 Multi Loop
Cinebench R23: Multi Core | Single Core
Cinebench R20: CPU (Multi Core) | CPU (Single Core)
Cinebench R15: CPU Multi 64Bit | CPU Single 64Bit
Blender: v2.79 BMW27 CPU
7-Zip 18.03: 7z b 4 | 7z b 4 -mmt1
Geekbench 6.4: Multi-Core | Single-Core
Geekbench 5.5: Multi-Core | Single-Core
HWBOT x265 Benchmark v2.2: 4k Preset
LibreOffice : 20 Documents To PDF
R Benchmark 2.5: Overall mean
* ... smaller is better
AIDA64: FP32 Ray-Trace | FPU Julia | CPU SHA3 | CPU Queen | FPU SinJulia | FPU Mandel | CPU AES | CPU ZLib | FP64 Ray-Trace | CPU PhotoWorxx
| Performance Rating | |
| Beelink SER8 | |
| BOSGAME M1 | |
| GMK NucBox K6 | |
| GMK NucBox M6 | |
| GMK NucBox K9 | |
| Average Intel Core Ultra 5 125H | |
| Beelink SEi12 Core i5-1235U | |
| AIDA64 / FP32 Ray-Trace | |
| Beelink SER8 | |
| BOSGAME M1 | |
| GMK NucBox K6 | |
| GMK NucBox M6 | |
| Average Intel Core Ultra 5 125H (8430 - 13639, n=6) | |
| GMK NucBox K9 | |
| Beelink SEi12 Core i5-1235U | |
| AIDA64 / FPU Julia | |
| Beelink SER8 | |
| BOSGAME M1 | |
| GMK NucBox K6 | |
| GMK NucBox M6 | |
| GMK NucBox K9 | |
| Average Intel Core Ultra 5 125H (43652 - 70880, n=6) | |
| Beelink SEi12 Core i5-1235U | |
| AIDA64 / CPU SHA3 | |
| Beelink SER8 | |
| BOSGAME M1 | |
| GMK NucBox K6 | |
| GMK NucBox K9 | |
| Average Intel Core Ultra 5 125H (2047 - 3404, n=6) | |
| GMK NucBox M6 | |
| Beelink SEi12 Core i5-1235U | |
| AIDA64 / CPU Queen | |
| BOSGAME M1 | |
| Beelink SER8 | |
| GMK NucBox K6 | |
| GMK NucBox M6 | |
| Average Intel Core Ultra 5 125H (77892 - 79986, n=6) | |
| GMK NucBox K9 | |
| Beelink SEi12 Core i5-1235U | |
| AIDA64 / FPU SinJulia | |
| Beelink SER8 | |
| BOSGAME M1 | |
| GMK NucBox K6 | |
| GMK NucBox M6 | |
| GMK NucBox K9 | |
| Average Intel Core Ultra 5 125H (6588 - 7851, n=6) | |
| Beelink SEi12 Core i5-1235U | |
| AIDA64 / FPU Mandel | |
| Beelink SER8 | |
| BOSGAME M1 | |
| GMK NucBox K6 | |
| GMK NucBox M6 | |
| GMK NucBox K9 | |
| Average Intel Core Ultra 5 125H (21210 - 35321, n=6) | |
| Beelink SEi12 Core i5-1235U | |
| AIDA64 / CPU AES | |
| Beelink SER8 | |
| BOSGAME M1 | |
| GMK NucBox K6 | |
| GMK NucBox K9 | |
| GMK NucBox M6 | |
| Beelink SEi12 Core i5-1235U | |
| Average Intel Core Ultra 5 125H (45524 - 108402, n=6) | |
| AIDA64 / CPU ZLib | |
| Beelink SER8 | |
| BOSGAME M1 | |
| GMK NucBox K6 | |
| GMK NucBox K9 | |
| Average Intel Core Ultra 5 125H (594 - 994, n=6) | |
| GMK NucBox M6 | |
| Beelink SEi12 Core i5-1235U | |
| AIDA64 / FP64 Ray-Trace | |
| Beelink SER8 | |
| BOSGAME M1 | |
| GMK NucBox K6 | |
| GMK NucBox M6 | |
| Average Intel Core Ultra 5 125H (4345 - 7221, n=6) | |
| GMK NucBox K9 | |
| Beelink SEi12 Core i5-1235U | |
| AIDA64 / CPU PhotoWorxx | |
| Average Intel Core Ultra 5 125H (45724 - 49844, n=6) | |
| GMK NucBox K9 | |
| BOSGAME M1 | |
| GMK NucBox K6 | |
| Beelink SER8 | |
| GMK NucBox M6 | |
| Beelink SEi12 Core i5-1235U | |
压力测试
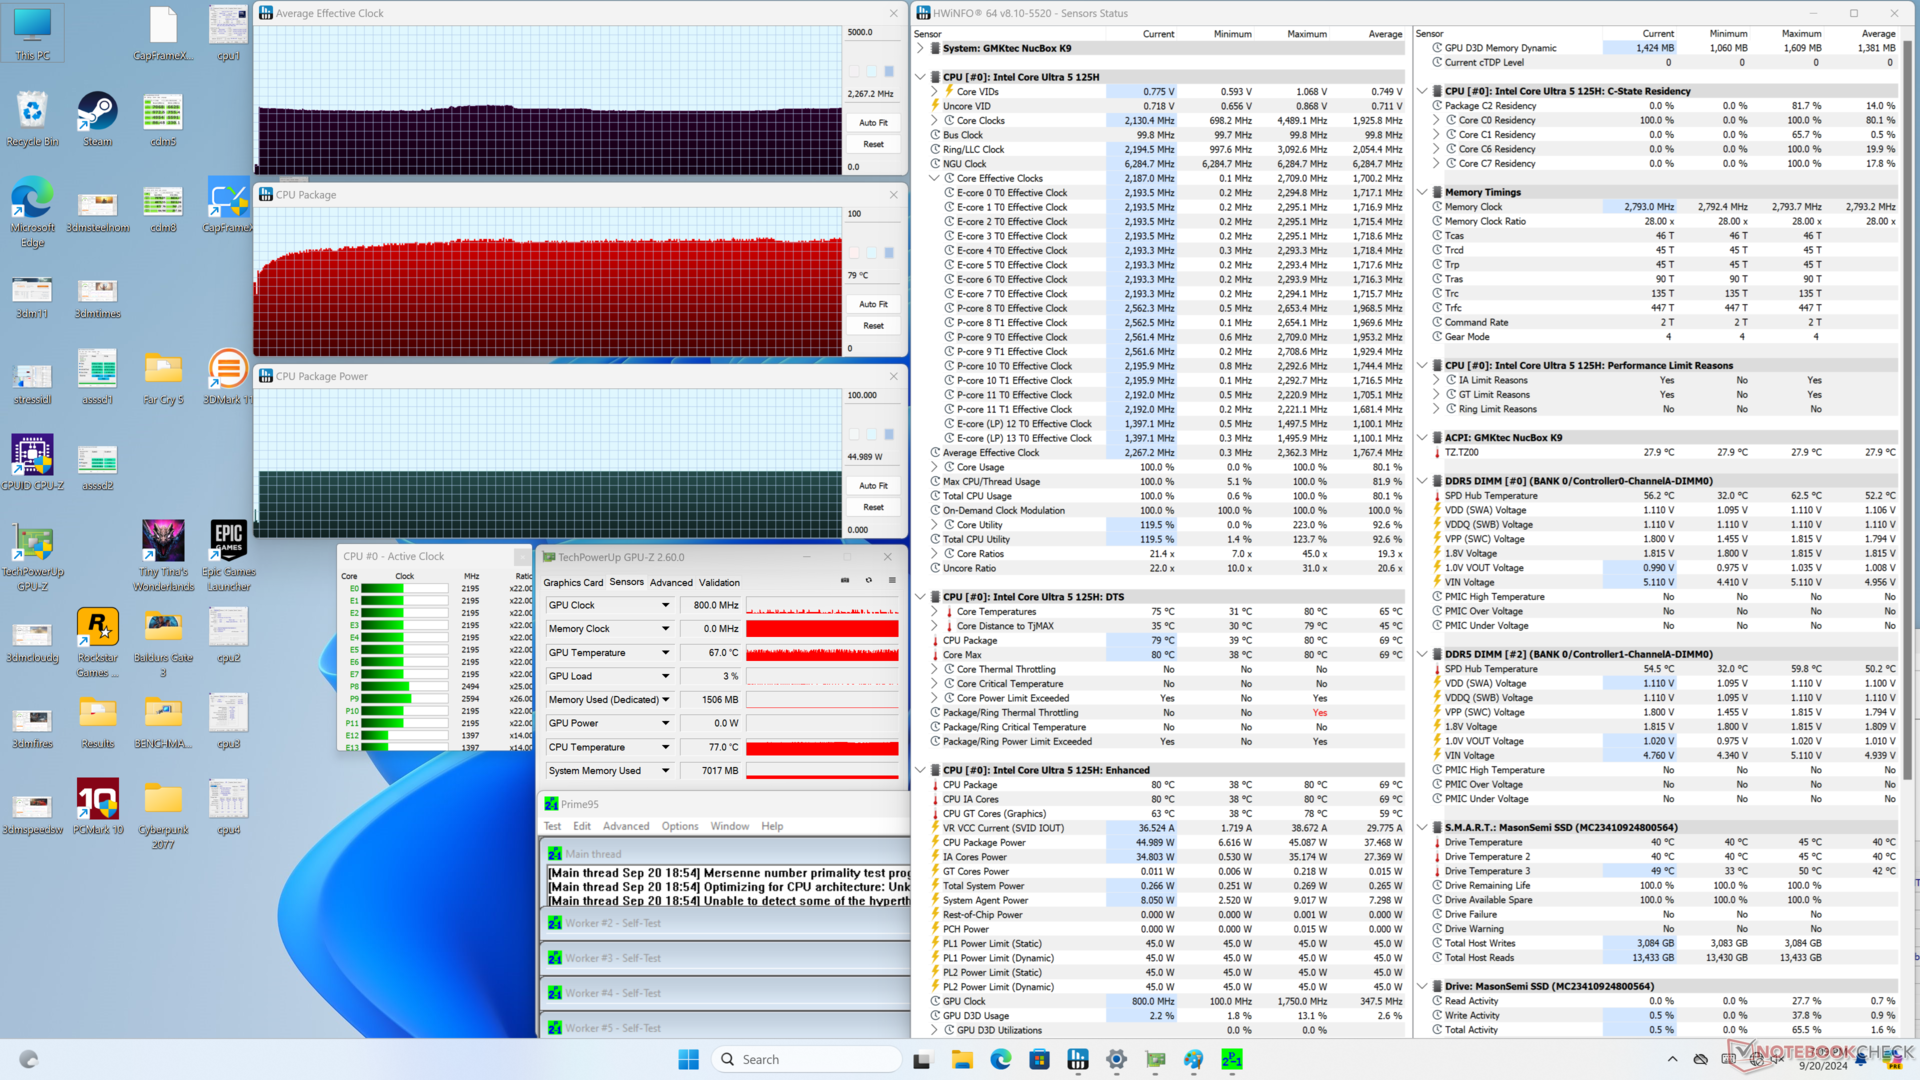
在启动 Prime95 压力测试时,CPU 会提升到 2.3 GHz 和 45 W,然后在整个压力测试期间保持这些值。核心温度稳定在 80 摄氏度,比我们在速度更快的 AMD NucBox K6 上记录的温度略低。
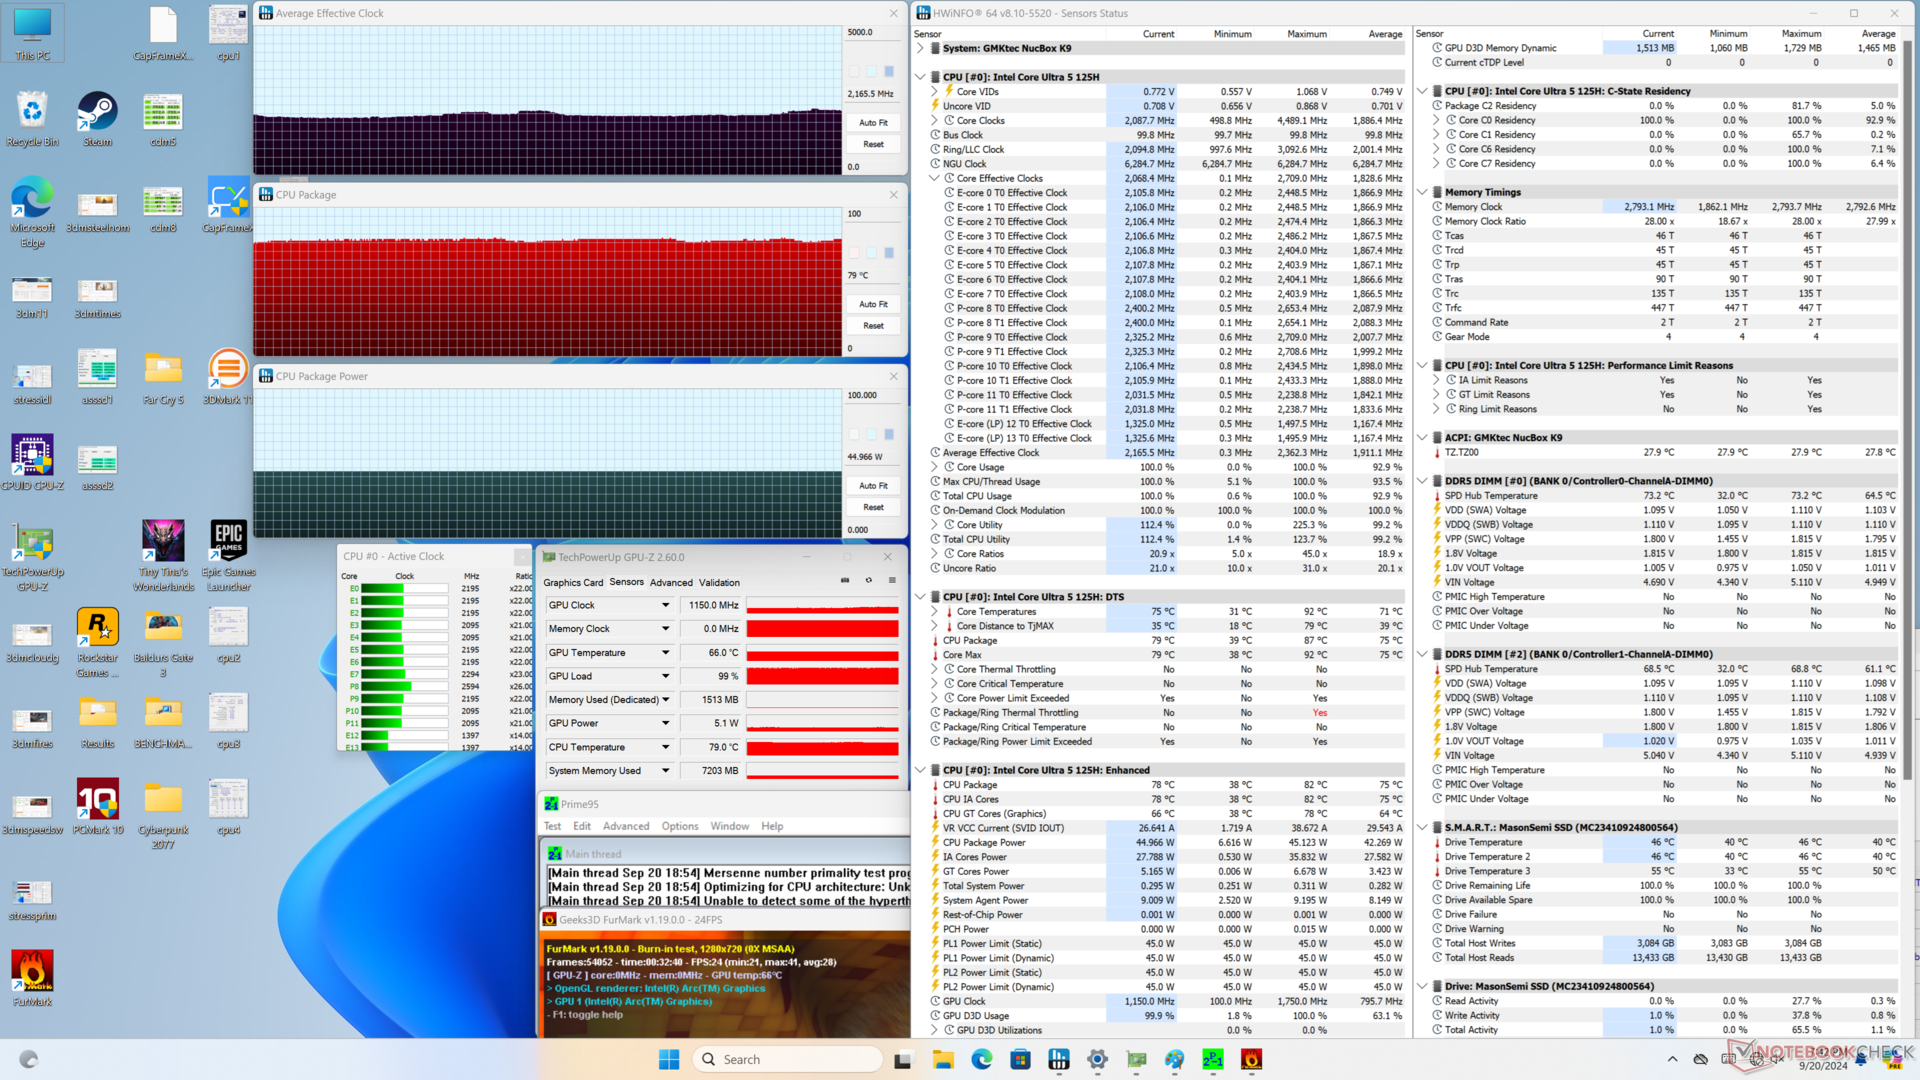
当运行《赛博朋克 2077》来代表游戏压力时,核心温度将稳定在 72 C,与 NucBox K6 相似,尽管 NucBox K9 运行游戏的速度较慢,正如我们下面的游戏性能部分所显示的那样。

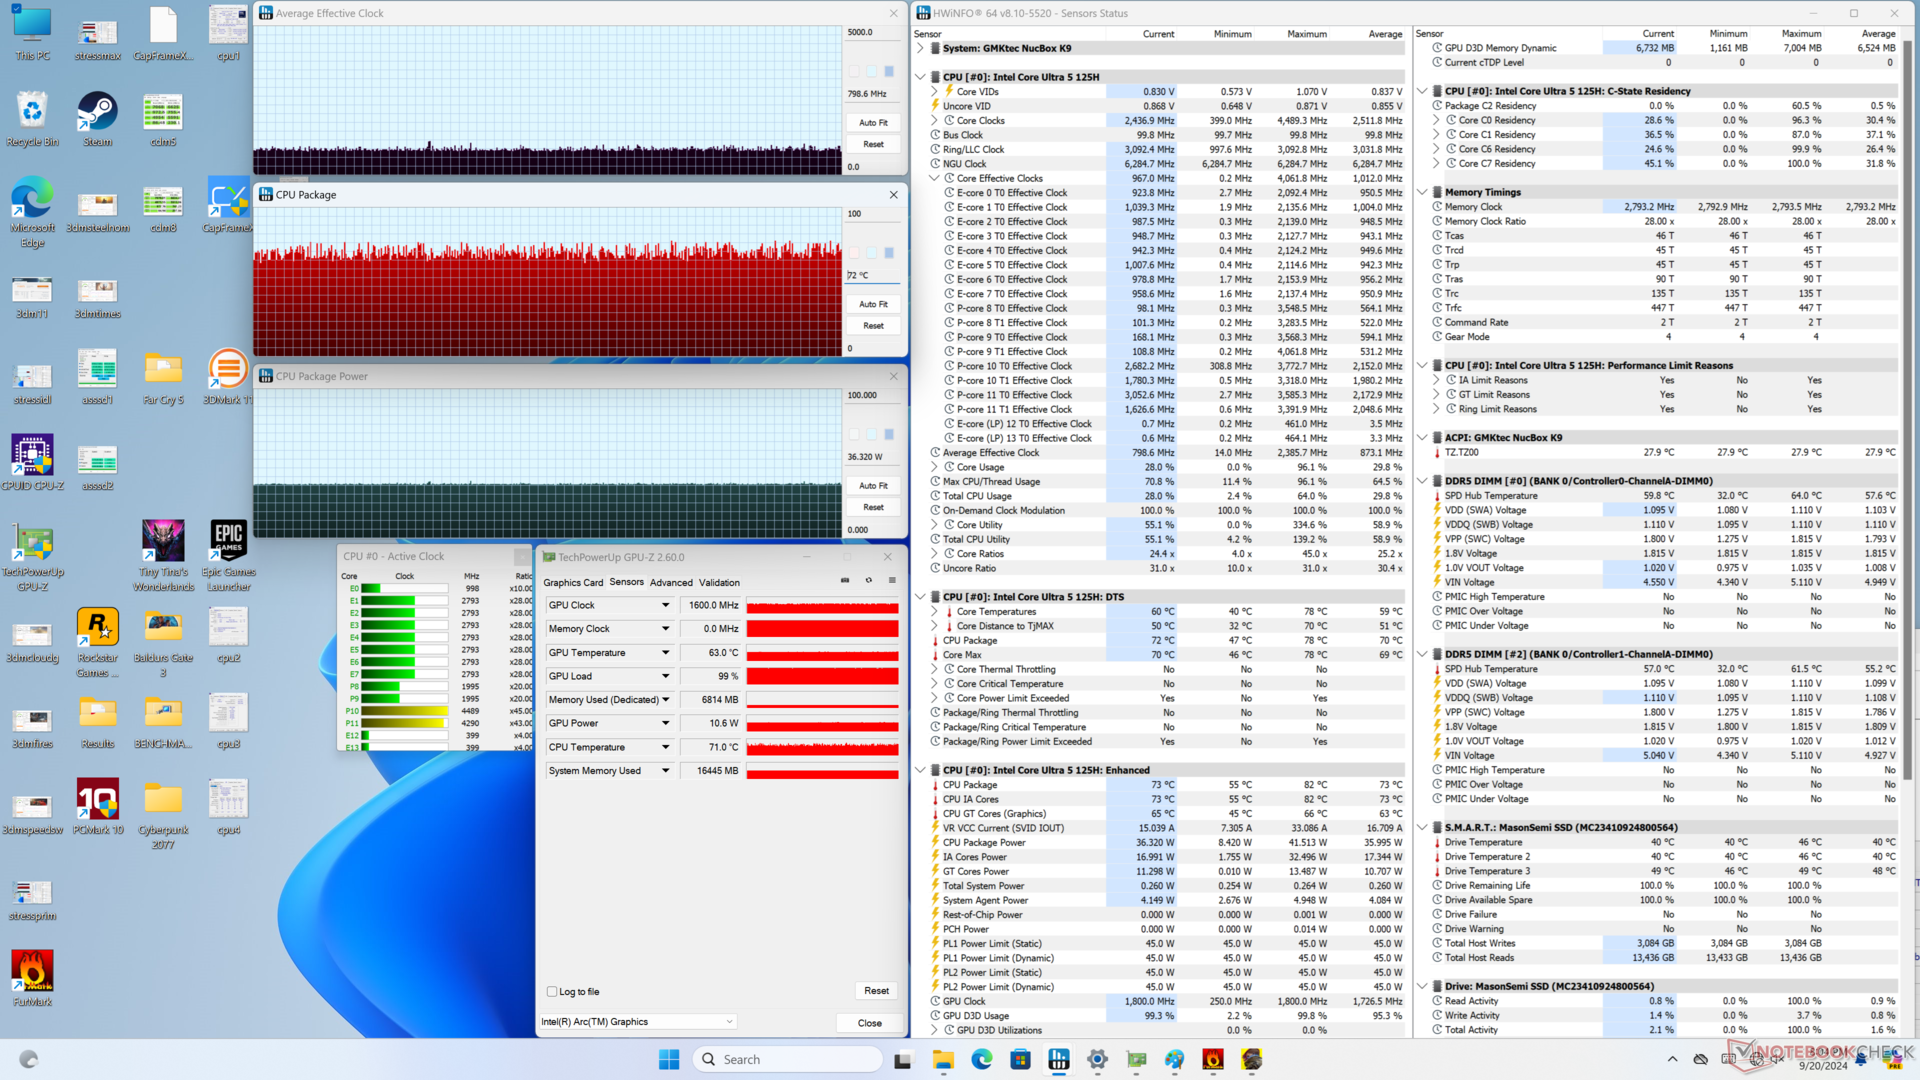
| CPU 平均时钟 (GHz) | GPU 时钟 (MHz) | CPU 平均温度 (°C) | |
| 系统闲置 | -- | -- | 40 |
| Prime95 压力 | 2.3 | -- | 79 |
| Prime95 + FurMark Stress | 2.2 | 1150 | 79 |
| 赛博朋克 2077》压力 | 0.9 | 1600 | 72 |
系统性能
CrossMark: Overall | Productivity | Creativity | Responsiveness
WebXPRT 3: Overall
WebXPRT 4: Overall
Mozilla Kraken 1.1: Total
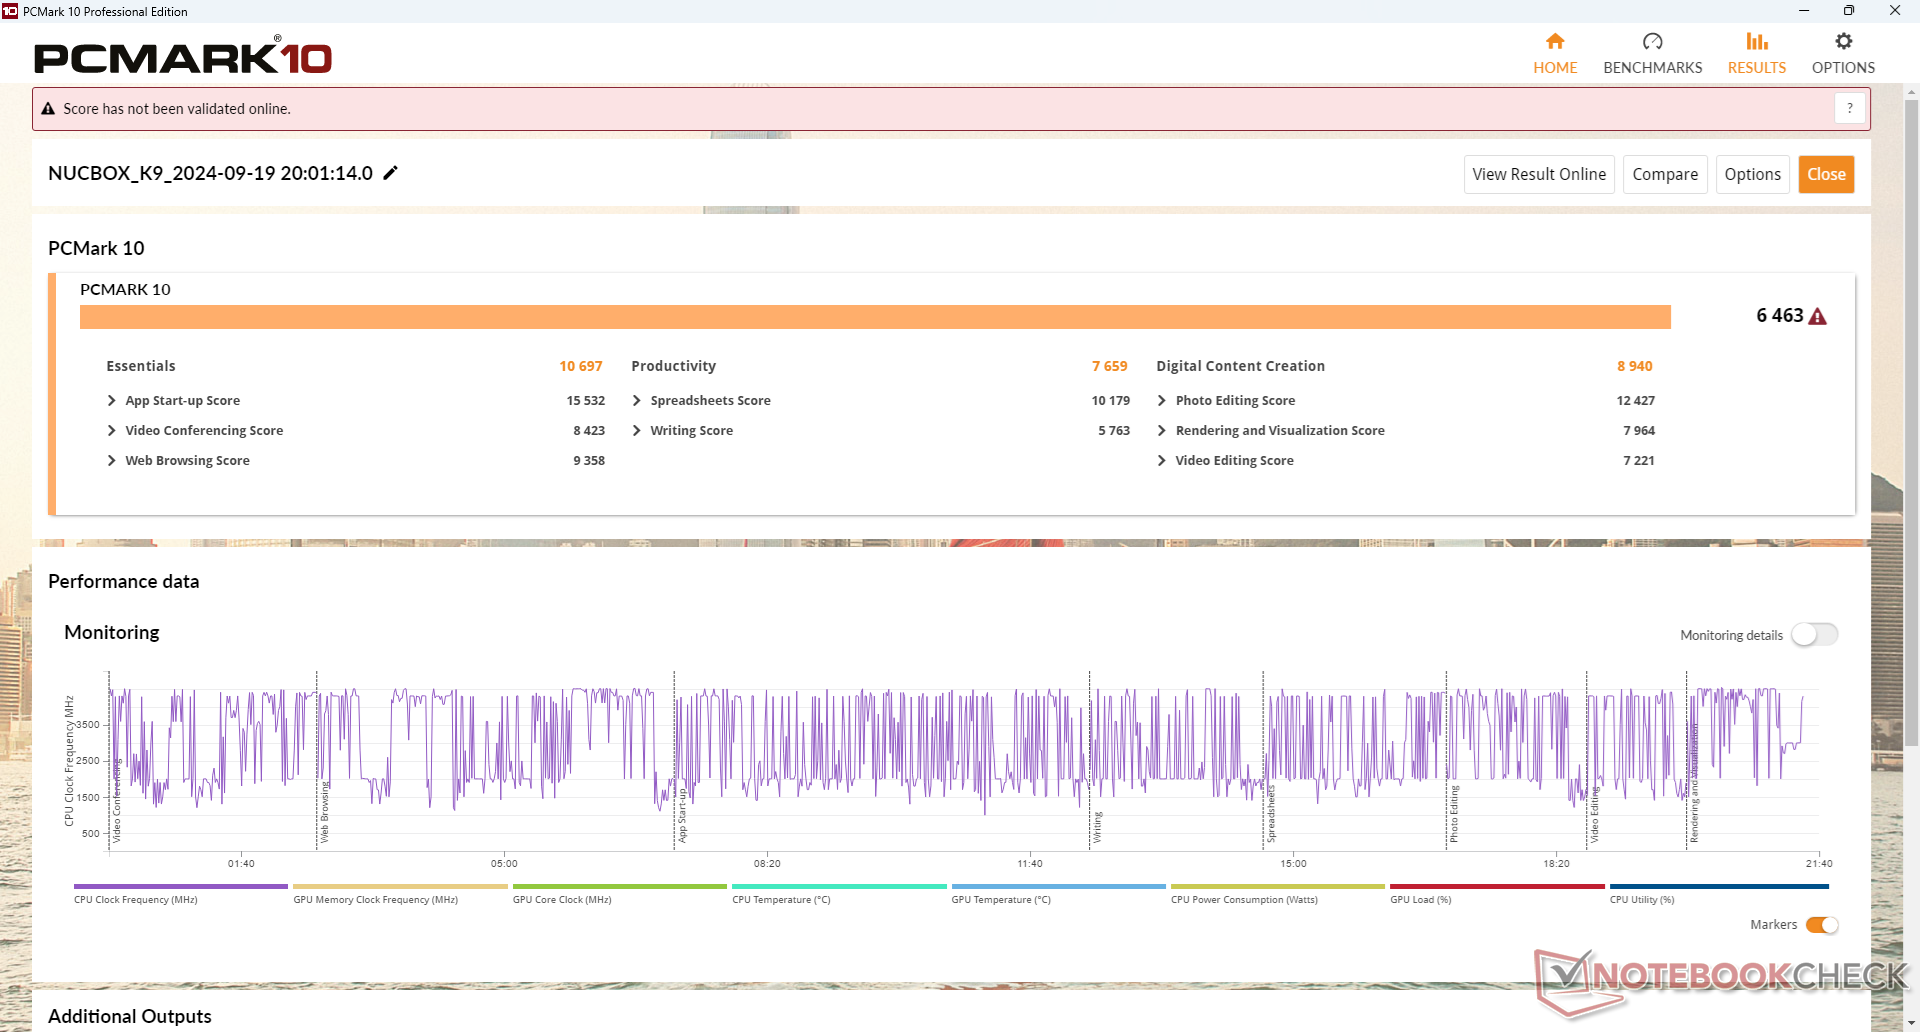
| PCMark 10 / Score | |
| Beelink SER8 | |
| GMK NucBox K6 | |
| BOSGAME M1 | |
| GMK NucBox K9 | |
| Average Intel Core Ultra 5 125H, Intel Arc 7-Core iGPU (6194 - 6463, n=6) | |
| GMK NucBox M6 | |
| Beelink SEi12 Core i5-1235U | |
| PCMark 10 / Essentials | |
| Beelink SER8 | |
| GMK NucBox K6 | |
| BOSGAME M1 | |
| Beelink SEi12 Core i5-1235U | |
| GMK NucBox K9 | |
| GMK NucBox M6 | |
| Average Intel Core Ultra 5 125H, Intel Arc 7-Core iGPU (9427 - 10697, n=6) | |
| PCMark 10 / Productivity | |
| GMK NucBox K6 | |
| Beelink SER8 | |
| BOSGAME M1 | |
| GMK NucBox M6 | |
| Average Intel Core Ultra 5 125H, Intel Arc 7-Core iGPU (7042 - 8000, n=6) | |
| GMK NucBox K9 | |
| Beelink SEi12 Core i5-1235U | |
| PCMark 10 / Digital Content Creation | |
| Beelink SER8 | |
| BOSGAME M1 | |
| GMK NucBox K6 | |
| GMK NucBox K9 | |
| Average Intel Core Ultra 5 125H, Intel Arc 7-Core iGPU (8198 - 9506, n=6) | |
| GMK NucBox M6 | |
| Beelink SEi12 Core i5-1235U | |
| CrossMark / Overall | |
| BOSGAME M1 | |
| Beelink SER8 | |
| GMK NucBox K6 | |
| Beelink SEi12 Core i5-1235U | |
| GMK NucBox K9 | |
| Average Intel Core Ultra 5 125H, Intel Arc 7-Core iGPU (1522 - 1633, n=5) | |
| GMK NucBox M6 | |
| CrossMark / Productivity | |
| BOSGAME M1 | |
| GMK NucBox K6 | |
| Beelink SER8 | |
| Beelink SEi12 Core i5-1235U | |
| GMK NucBox K9 | |
| GMK NucBox M6 | |
| Average Intel Core Ultra 5 125H, Intel Arc 7-Core iGPU (1432 - 1594, n=5) | |
| CrossMark / Creativity | |
| BOSGAME M1 | |
| Beelink SER8 | |
| GMK NucBox K6 | |
| Average Intel Core Ultra 5 125H, Intel Arc 7-Core iGPU (1683 - 1765, n=5) | |
| GMK NucBox K9 | |
| GMK NucBox M6 | |
| Beelink SEi12 Core i5-1235U | |
| CrossMark / Responsiveness | |
| Beelink SEi12 Core i5-1235U | |
| BOSGAME M1 | |
| Beelink SER8 | |
| GMK NucBox K6 | |
| GMK NucBox K9 | |
| GMK NucBox M6 | |
| Average Intel Core Ultra 5 125H, Intel Arc 7-Core iGPU (1171 - 1520, n=5) | |
| WebXPRT 3 / Overall | |
| Beelink SER8 | |
| GMK NucBox K6 | |
| BOSGAME M1 | |
| Beelink SEi12 Core i5-1235U | |
| GMK NucBox K9 | |
| Average Intel Core Ultra 5 125H, Intel Arc 7-Core iGPU (245 - 263, n=6) | |
| GMK NucBox M6 | |
| WebXPRT 4 / Overall | |
| GMK NucBox K6 | |
| Beelink SER8 | |
| BOSGAME M1 | |
| Average Intel Core Ultra 5 125H, Intel Arc 7-Core iGPU (227 - 240, n=5) | |
| Beelink SEi12 Core i5-1235U | |
| GMK NucBox K9 | |
| GMK NucBox M6 | |
| Mozilla Kraken 1.1 / Total | |
| GMK NucBox M6 | |
| Beelink SEi12 Core i5-1235U | |
| Average Intel Core Ultra 5 125H, Intel Arc 7-Core iGPU (560 - 595, n=6) | |
| GMK NucBox K9 | |
| GMK NucBox K6 | |
| BOSGAME M1 | |
| Beelink SER8 | |
* ... smaller is better
| PCMark 10 Score | 6463 points | |
Help | ||
| AIDA64 / Memory Copy | |
| Average Intel Core Ultra 5 125H (67482 - 87473, n=6) | |
| BOSGAME M1 | |
| GMK NucBox K6 | |
| Beelink SER8 | |
| GMK NucBox K9 | |
| GMK NucBox M6 | |
| Beelink SEi12 Core i5-1235U | |
| AIDA64 / Memory Read | |
| Average Intel Core Ultra 5 125H (70520 - 76803, n=6) | |
| GMK NucBox K9 | |
| Beelink SER8 | |
| BOSGAME M1 | |
| GMK NucBox K6 | |
| GMK NucBox M6 | |
| Beelink SEi12 Core i5-1235U | |
| AIDA64 / Memory Write | |
| BOSGAME M1 | |
| GMK NucBox K6 | |
| Beelink SER8 | |
| GMK NucBox K9 | |
| Average Intel Core Ultra 5 125H (63162 - 72443, n=6) | |
| GMK NucBox M6 | |
| Beelink SEi12 Core i5-1235U | |
| AIDA64 / Memory Latency | |
| Average Intel Core Ultra 5 125H (127.3 - 184.8, n=6) | |
| GMK NucBox K9 | |
| Beelink SEi12 Core i5-1235U | |
| BOSGAME M1 | |
| Beelink SER8 | |
| GMK NucBox K6 | |
| GMK NucBox M6 | |
* ... smaller is better
DPC 延迟
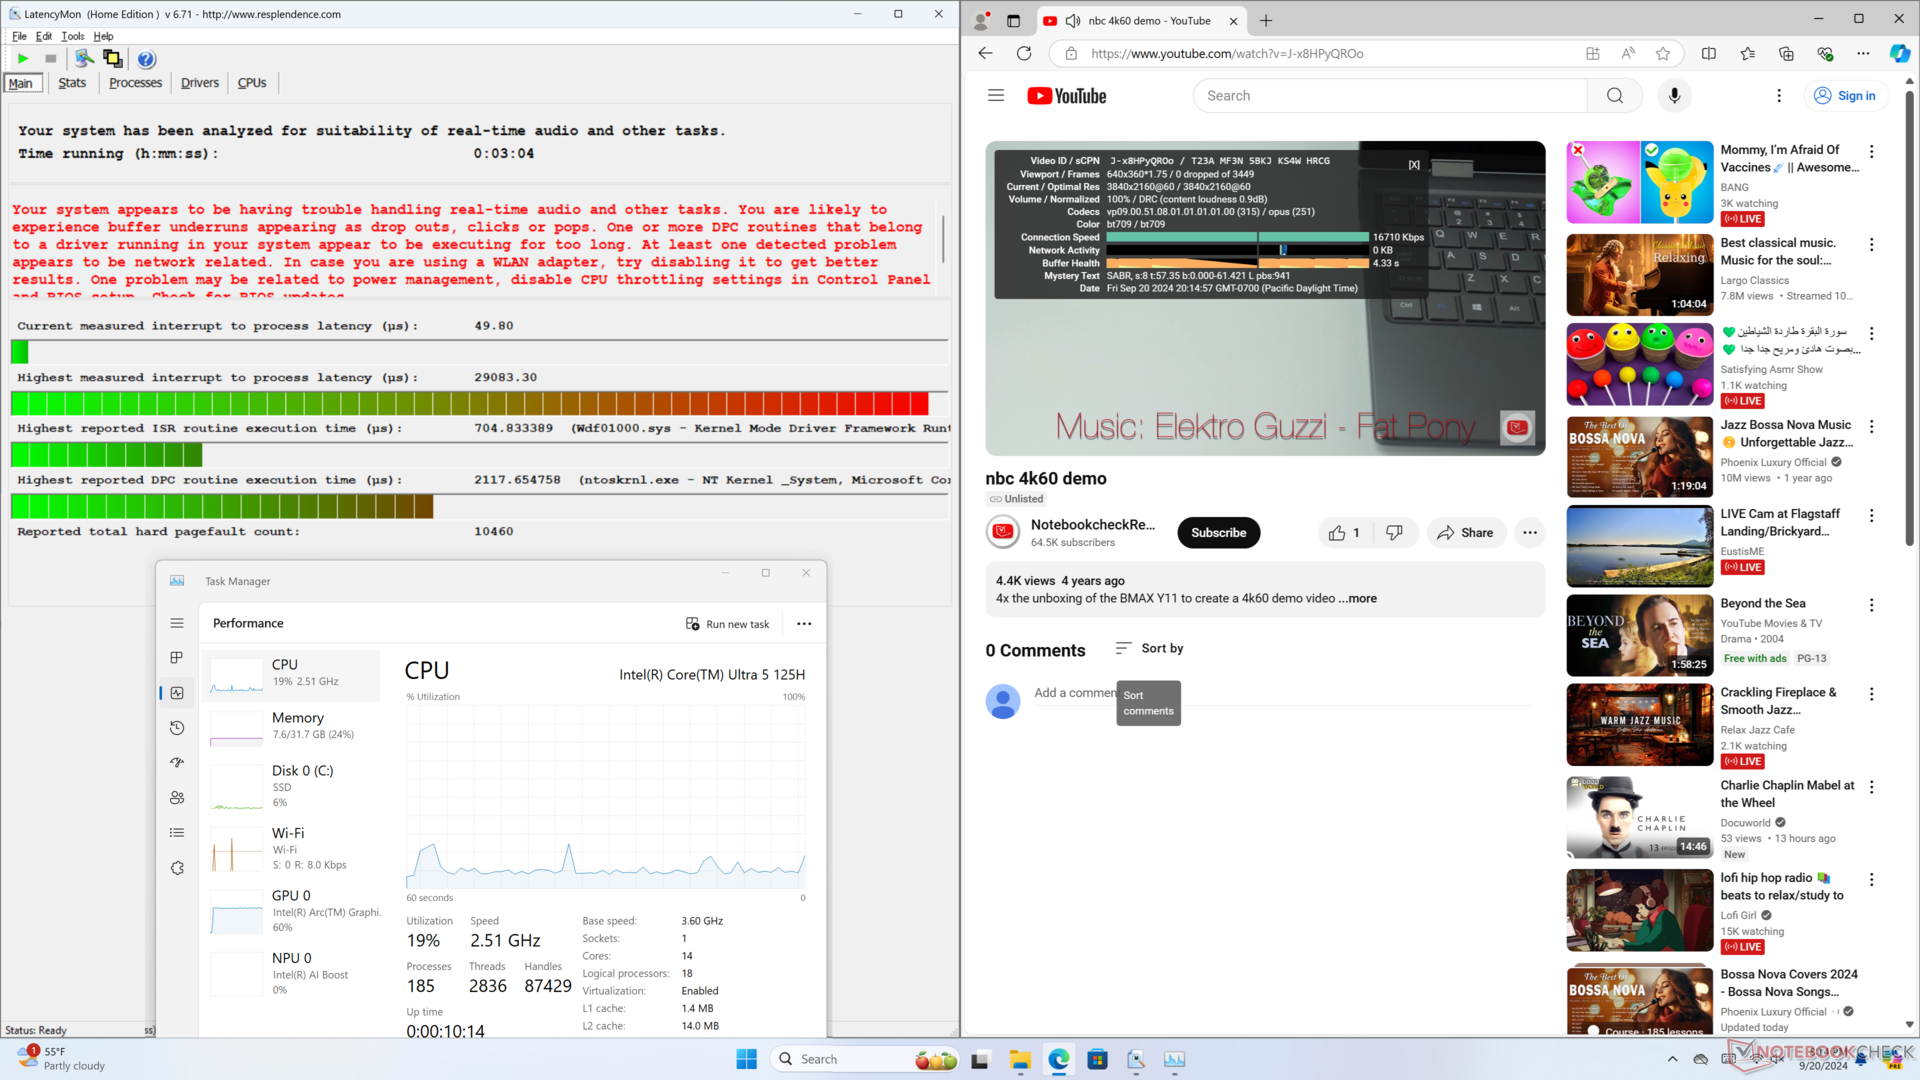
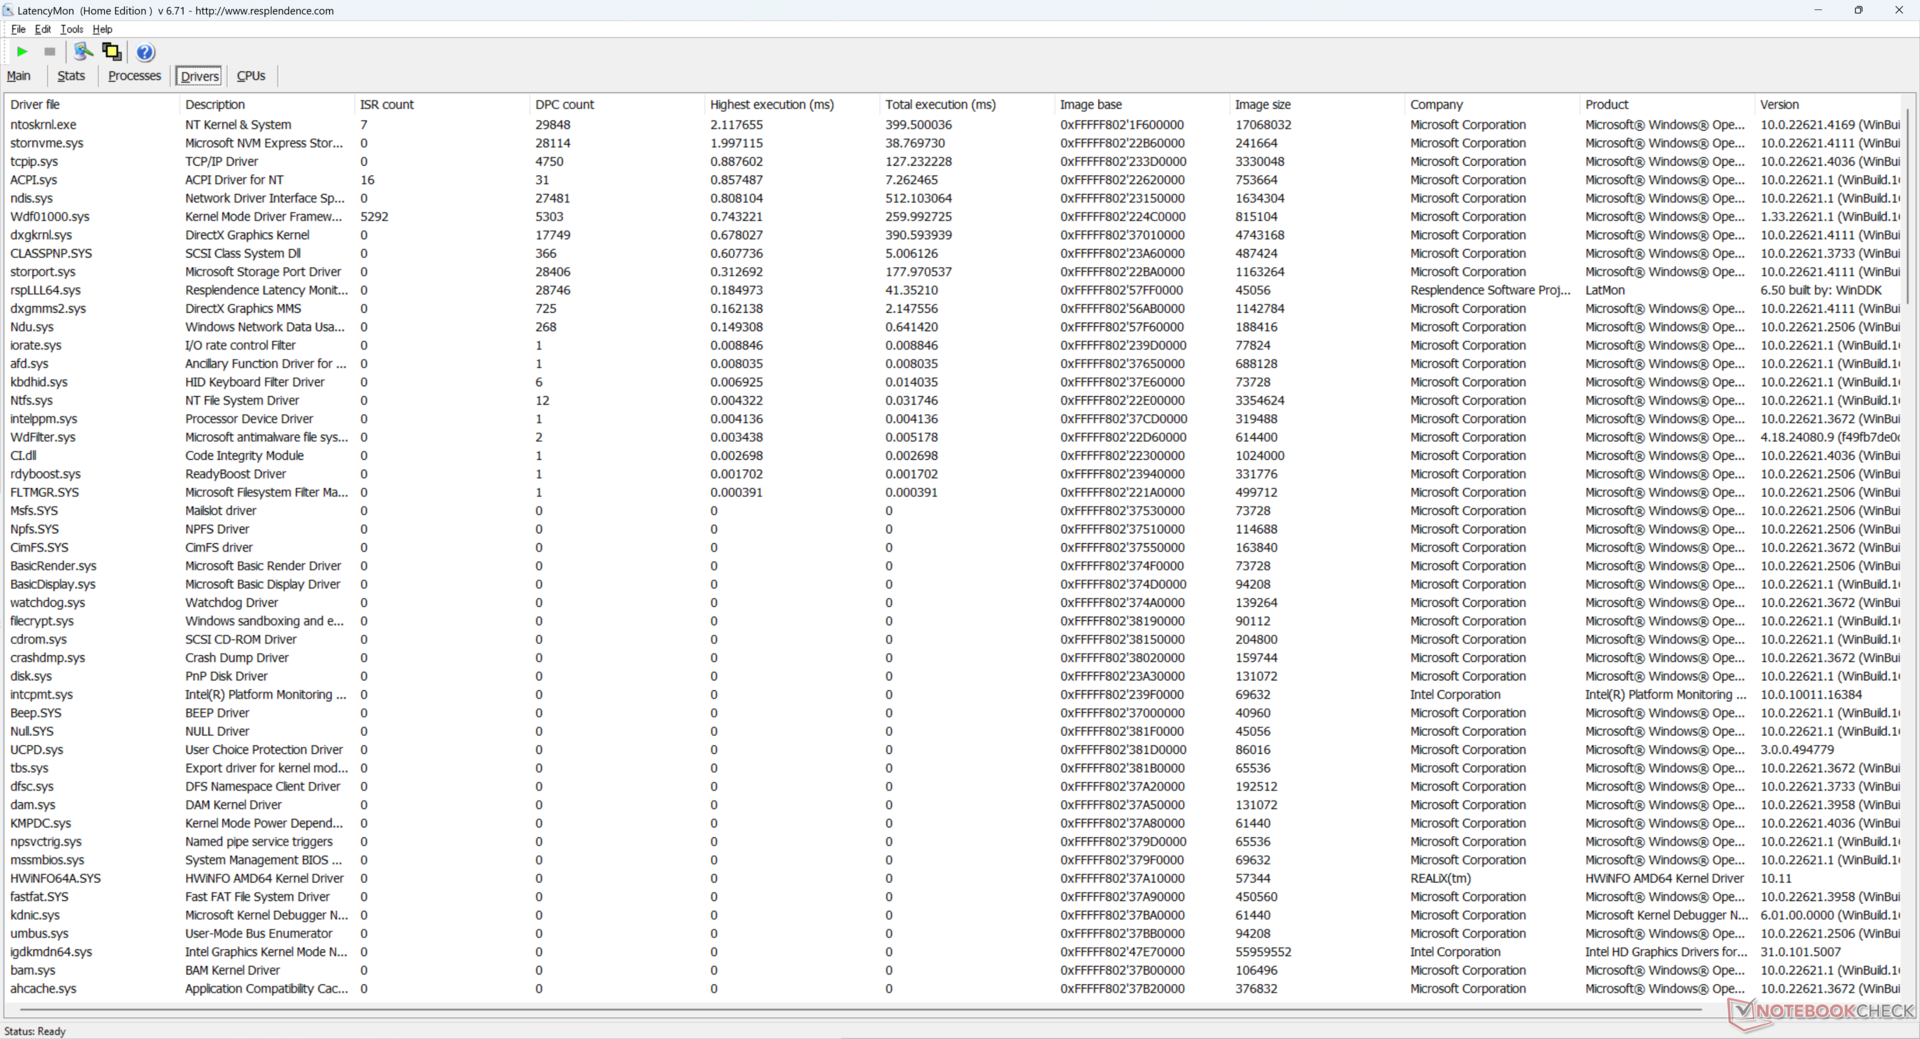
在打开我们主页的多个标签页时,LatencyMon 显示了与 ntoskrnl.exe 有关的 DPC 问题。在其他方面,以 60 FPS 播放 4K 视频也非常完美,没有掉帧记录。
| DPC Latencies / LatencyMon - interrupt to process latency (max), Web, Youtube, Prime95 | |
| GMK NucBox K9 | |
| GMK NucBox M6 | |
| GMK NucBox K6 | |
| BOSGAME M1 | |
| Beelink SER8 | |
| Beelink SEi12 Core i5-1235U | |
* ... smaller is better
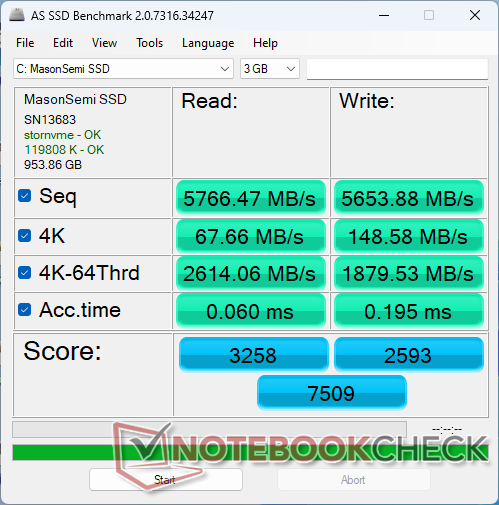
存储设备
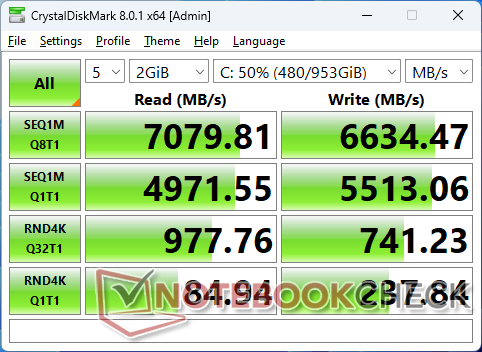
GMK 采用与 MasonSemi MC7000 相同的 1 TB MasonSemi MC7000PCIe4 x4 NVMe 固态硬盘。尽管品牌知名度较低,但性能却很快,可与高端 PC 上常见的三星 PM9A1 系列媲美。在循环运行 DiskSpd 时,我们没有观察到明显的性能节流现象。

| Drive Performance Rating - Percent | |
| GMK NucBox K6 | |
| GMK NucBox K9 | |
| Beelink SEi12 Core i5-1235U | |
| Beelink SER8 | |
| BOSGAME M1 | |
| GMK NucBox M6 | |
* ... smaller is better
Disk Throttling: DiskSpd Read Loop, Queue Depth 8
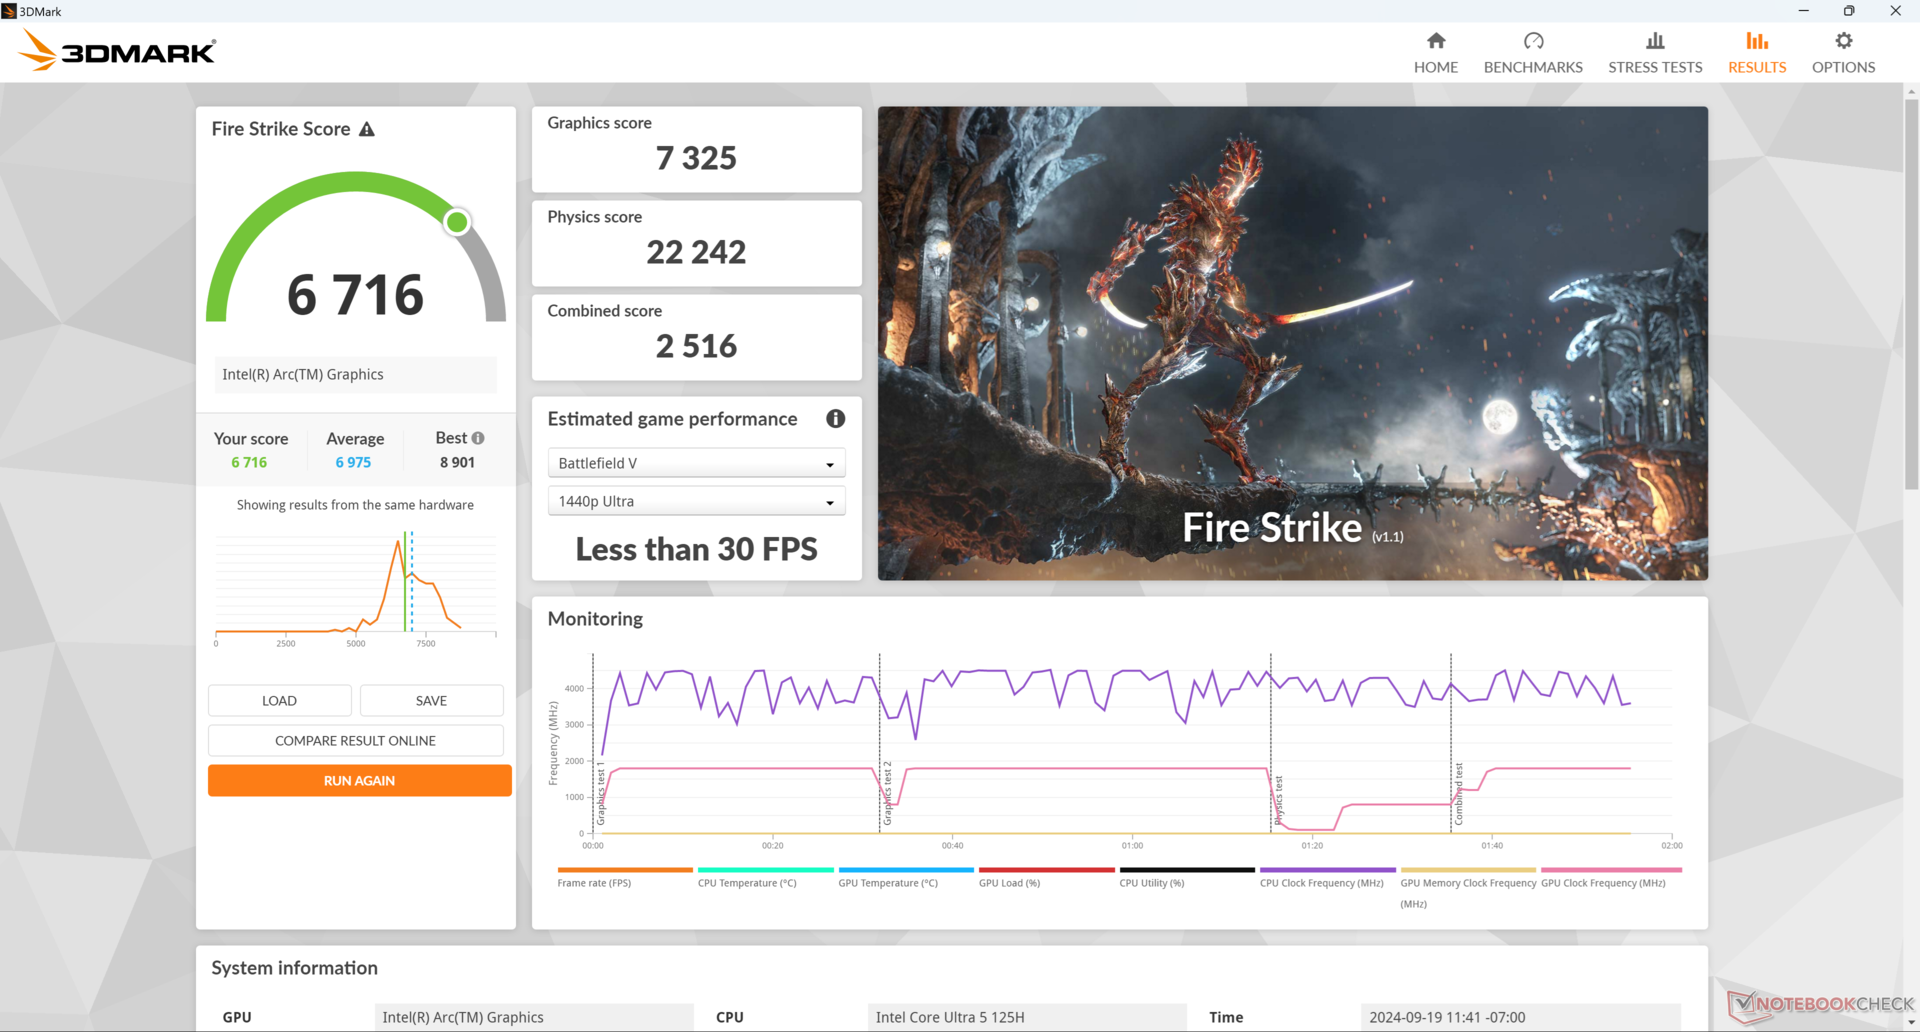
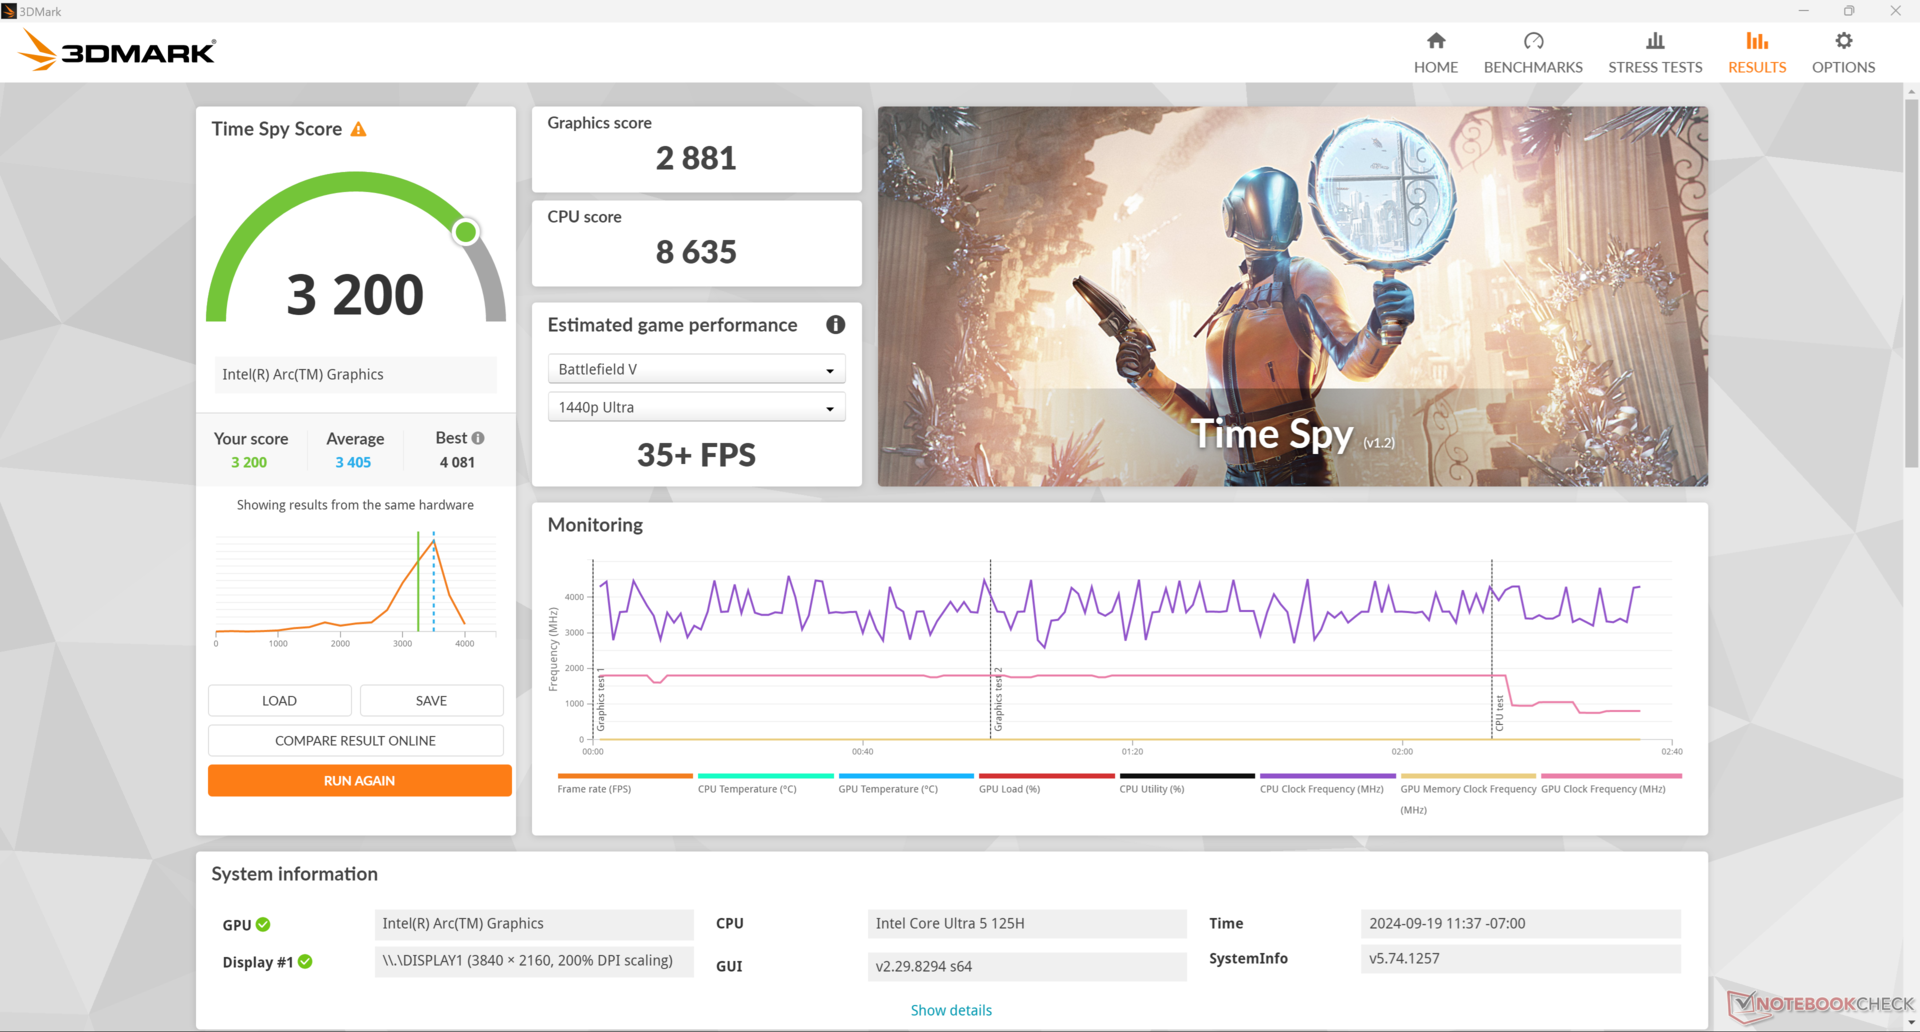
图形处理器性能
图形性能略低于我们数据库中相同集成 Arc 7 的普通电脑。 集成 Arc 7 图形处理器的图形性能比我们数据库中采用相同集成 Arc 7高端 Core Ultra 7-H 和 Core Ultra 9-H 处理器上的集成 Arc 8 GPU 比我们的 Arc 7 解决方案快约 15%,但遗憾的是,NucBox K9 没有此类 SKU。尽管如此,总体性能仍可媲美上一代竞争产品 Radeon 780M根据 3DMark 基准测试。
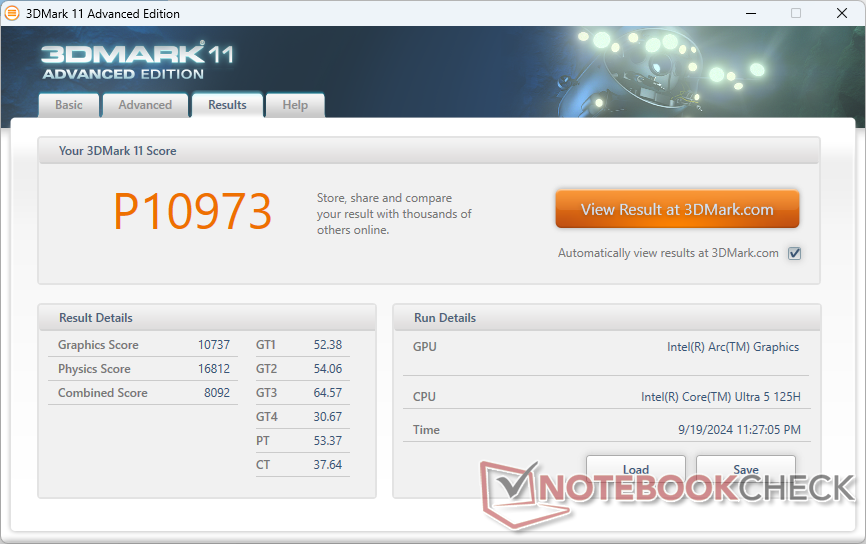
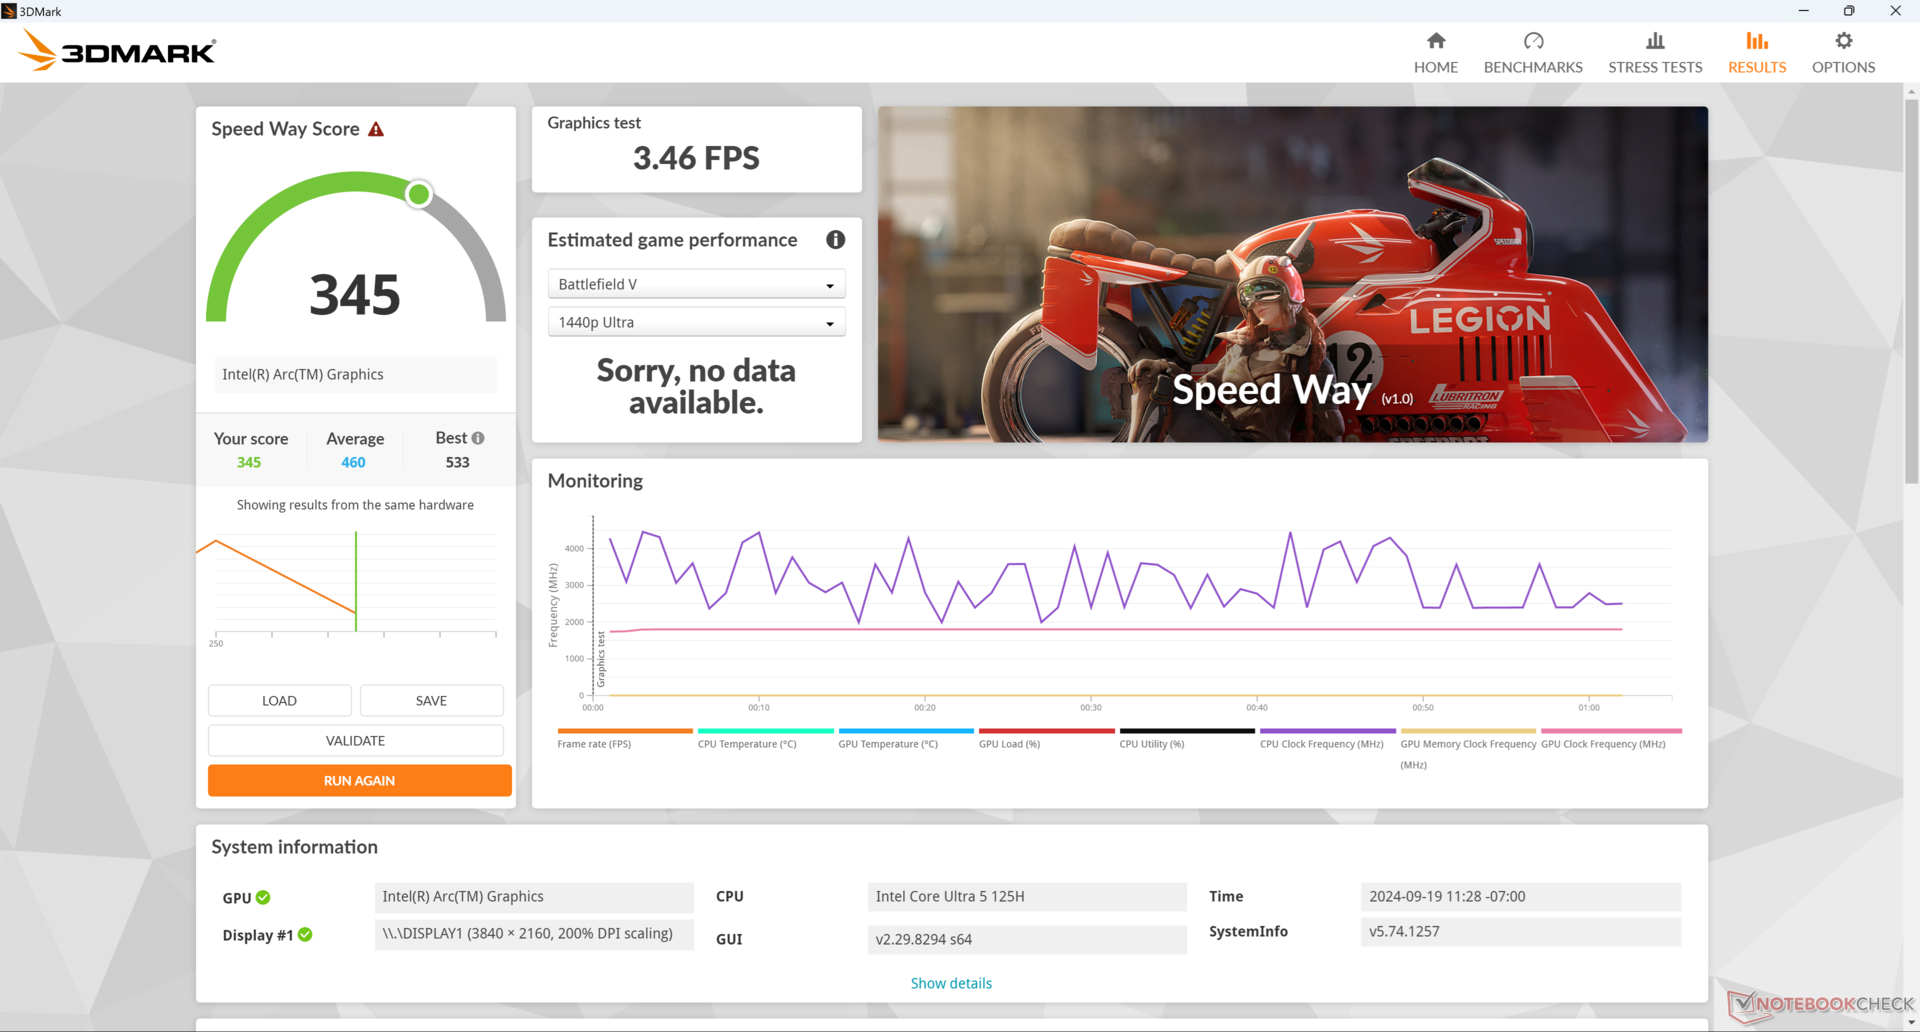
| 3DMark 11 Performance | 10973 points | |
| 3DMark Cloud Gate Standard Score | 28997 points | |
| 3DMark Fire Strike Score | 6716 points | |
| 3DMark Time Spy Score | 3200 points | |
| 3DMark Steel Nomad Score | 581 points | |
Help | ||
* ... smaller is better
游戏性能
遗憾的是,与 NucBox K6 相比,游戏性能要慢得多,尽管上面的 3DMark 结果表明并非如此。大多数测试游戏,包括《GTA V》、《DOTA 2 Reborn》、《最终幻想 XV》、《F1 22》和《博德之门 3 》,在搭载英特尔处理器的 NucBox K9 上运行速度都要慢 10% 到 40%。如下图所示,在《赛博朋克 2077》上空闲运行时,帧速率也会出现卡顿。
| Performance Rating - Percent | |
| BOSGAME M1 -1! | |
| Beelink SER8 -1! | |
| GMK NucBox K6 | |
| GMK NucBox K9 | |
| GMK NucBox M6 -1! | |
| Beelink SEi12 Core i5-1235U -1! | |
| GTA V - 1920x1080 Highest Settings possible AA:4xMSAA + FX AF:16x | |
| GMK NucBox K6 | |
| GMK NucBox K9 | |
| Beelink SEi12 Core i5-1235U | |
| Final Fantasy XV Benchmark - 1920x1080 High Quality | |
| BOSGAME M1 | |
| Beelink SER8 | |
| GMK NucBox K6 | |
| GMK NucBox K9 | |
| GMK NucBox M6 | |
| Beelink SEi12 Core i5-1235U | |
| Strange Brigade - 1920x1080 ultra AA:ultra AF:16 | |
| BOSGAME M1 | |
| Beelink SER8 | |
| GMK NucBox K6 | |
| GMK NucBox K9 | |
| GMK NucBox M6 | |
| Beelink SEi12 Core i5-1235U | |
| Dota 2 Reborn - 1920x1080 ultra (3/3) best looking | |
| Beelink SER8 | |
| BOSGAME M1 | |
| GMK NucBox K6 | |
| GMK NucBox K9 | |
| GMK NucBox M6 | |
| Beelink SEi12 Core i5-1235U | |
| X-Plane 11.11 - 1920x1080 high (fps_test=3) | |
| GMK NucBox K6 | |
| Beelink SER8 | |
| BOSGAME M1 | |
| GMK NucBox K9 | |
| GMK NucBox M6 | |
| Beelink SEi12 Core i5-1235U | |
| Far Cry 5 - 1920x1080 Ultra Preset AA:T | |
| BOSGAME M1 | |
| Beelink SER8 | |
| GMK NucBox K6 | |
| GMK NucBox K9 | |
| GMK NucBox M6 | |
| F1 22 | |
| 1280x720 Ultra Low Preset AA:T AF:16x | |
| GMK NucBox K6 | |
| Beelink SER8 | |
| GMK NucBox K9 | |
| Average Intel Arc 7-Core iGPU (n=1) | |
| Framework Laptop 13.5 Core Ultra 7 155H | |
| GMK NucBox M6 | |
| 1920x1080 Low Preset AA:T AF:16x | |
| GMK NucBox K6 | |
| Beelink SER8 | |
| GMK NucBox K9 | |
| Average Intel Arc 7-Core iGPU (n=1) | |
| Framework Laptop 13.5 Core Ultra 7 155H | |
| GMK NucBox M6 | |
| 1920x1080 Medium Preset AA:T AF:16x | |
| GMK NucBox K6 | |
| Beelink SER8 | |
| GMK NucBox K9 | |
| Average Intel Arc 7-Core iGPU (n=1) | |
| Framework Laptop 13.5 Core Ultra 7 155H | |
| GMK NucBox M6 | |
| 1920x1080 High Preset AA:T AF:16x | |
| GMK NucBox K6 | |
| Beelink SER8 | |
| Framework Laptop 13.5 Core Ultra 7 155H | |
| GMK NucBox K9 | |
| Average Intel Arc 7-Core iGPU (n=1) | |
| GMK NucBox M6 | |
Cyberpunk 2077 ultra FPS Chart
| low | med. | high | ultra | |
|---|---|---|---|---|
| GTA V (2015) | 143.6 | 125.5 | 33.6 | 12.7 |
| Dota 2 Reborn (2015) | 97.7 | 83.1 | 75.6 | 73.3 |
| Final Fantasy XV Benchmark (2018) | 59.6 | 33.3 | 22.3 | |
| X-Plane 11.11 (2018) | 57 | 44.8 | 37.3 | |
| Far Cry 5 (2018) | 71 | 40 | 37 | 35 |
| Strange Brigade (2018) | 148.6 | 63.9 | 53.5 | 43.5 |
| Tiny Tina's Wonderlands (2022) | 50.7 | 39.4 | 26.8 | 22.4 |
| F1 22 (2022) | 79.4 | 71.9 | 52.9 | |
| Baldur's Gate 3 (2023) | 33.7 | 27.9 | 24.2 | 23.1 |
| Cyberpunk 2077 2.2 Phantom Liberty (2023) | 30.9 | 25.2 | 21.3 | 18.8 |
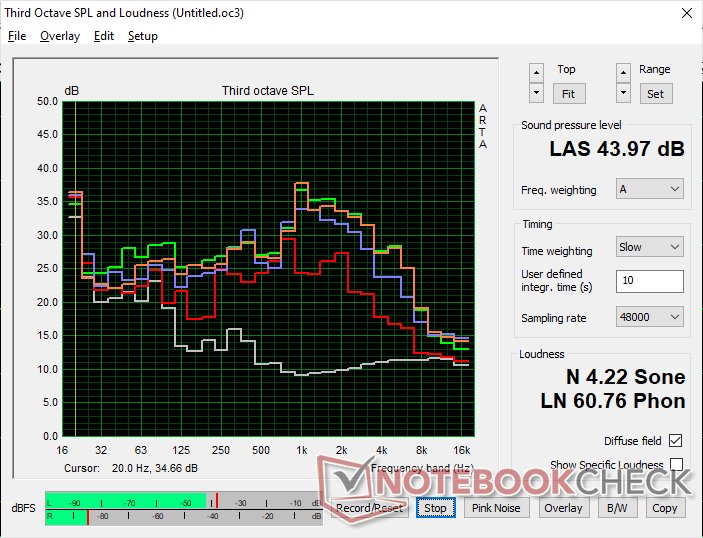
排放 - 风扇始终开启
系统噪音
与我们在 NucBox K6 上记录到的情况一样,无论屏幕负载如何,风扇噪音始终存在。即使设置为节能模式,在 23 dB(A) 的静音背景下,桌面上的空转噪音已经达到 30 至 36 dB(A)。不过,NucBox K9 在玩游戏或运行其他要求较高的负载时的风扇噪音似乎要小一些,约为 44 dB(A),而 NucBox K6 则接近 48 dB(A)。
Noise Level
| Idle |
| 29.8 / 35.7 / 35.7 dB(A) |
| Load |
| 41.9 / 44 dB(A) |
 | ||
30 dB silent 40 dB(A) audible 50 dB(A) loud |
||
min: | ||
| GMK NucBox K9 Arc 7-Core, Ultra 5 125H, MasonSemi 1TB MC7000 | GMK NucBox K6 Radeon 780M, R7 7840HS, MasonSemi 1TB MC7000 | GMK NucBox M6 Radeon 660M, R5 6600H, AirDisk APF 10-512G | Beelink SER8 Radeon 780M, R7 8845HS, Crucial P3 Plus CT1000P3PSSD8 | Beelink SEi12 Core i5-1235U Iris Xe G7 80EUs, i5-1235U, Kingston NV1 SNVS/500GCN | BOSGAME M1 Radeon 780M, R7 7840HS | |
|---|---|---|---|---|---|---|
| Noise | -2% | -4% | 14% | 14% | 4% | |
| off / environment * | 23 | 23.2 -1% | 24.2 -5% | 23.6 -3% | 23.3 -1% | 23.2 -1% |
| Idle Minimum * | 29.8 | 31.3 -5% | 31.9 -7% | 28.8 3% | 27.8 7% | 32 -7% |
| Idle Average * | 35.7 | 31.3 12% | 32 10% | 28.8 19% | 27.8 22% | 32 10% |
| Idle Maximum * | 35.7 | 33.4 6% | 33.8 5% | 30.5 15% | 27.8 22% | 32 10% |
| Load Average * | 41.9 | 47.5 -13% | 48.5 -16% | 34.6 17% | 32 24% | 38.7 8% |
| Cyberpunk 2077 ultra * | 43.8 | 34.1 22% | ||||
| Load Maximum * | 44 | 47.7 -8% | 48.5 -10% | 34.5 22% | 39.2 11% | 42 5% |
| Witcher 3 ultra * | 43.6 | 48.5 | 34.1 | 41.7 |
* ... smaller is better
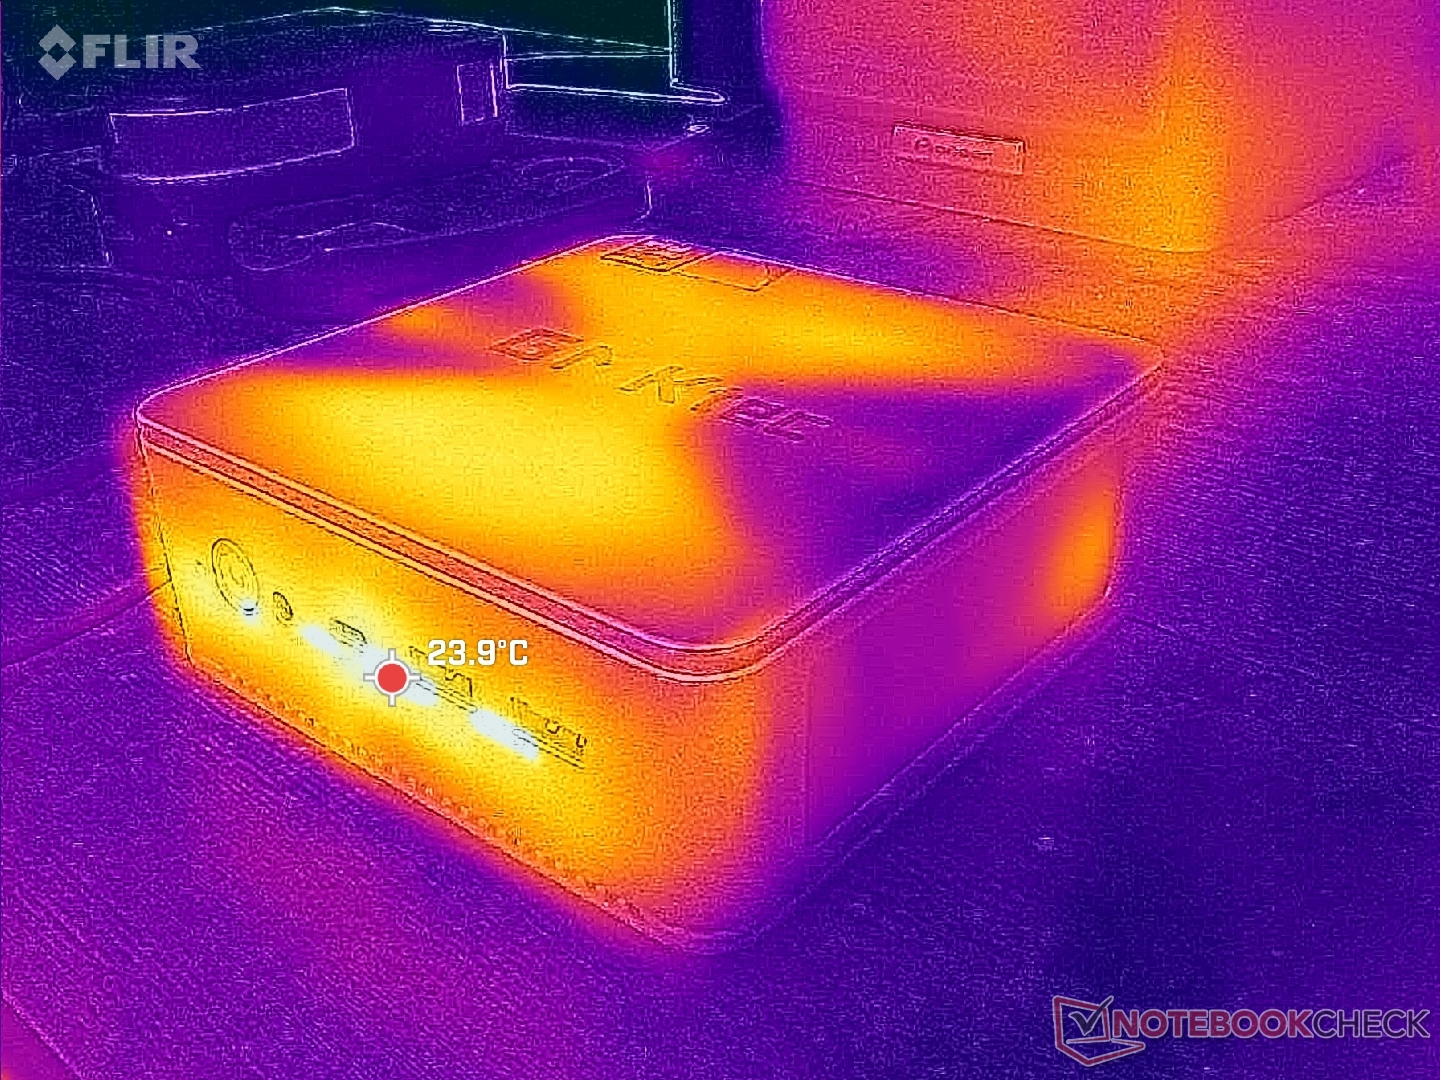
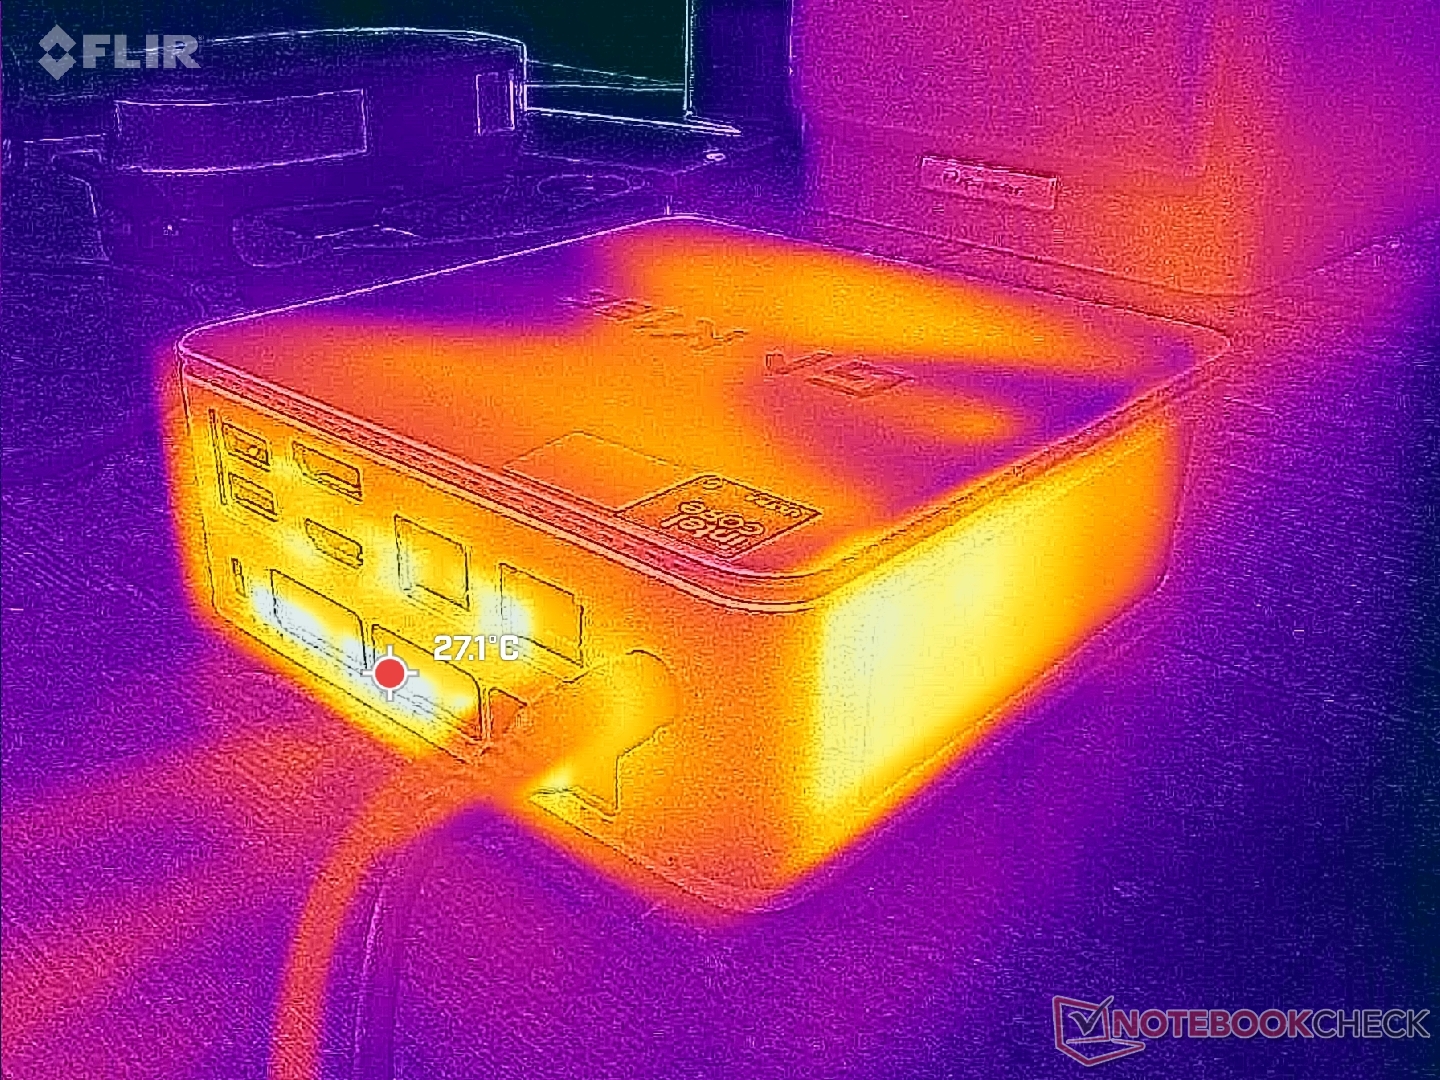
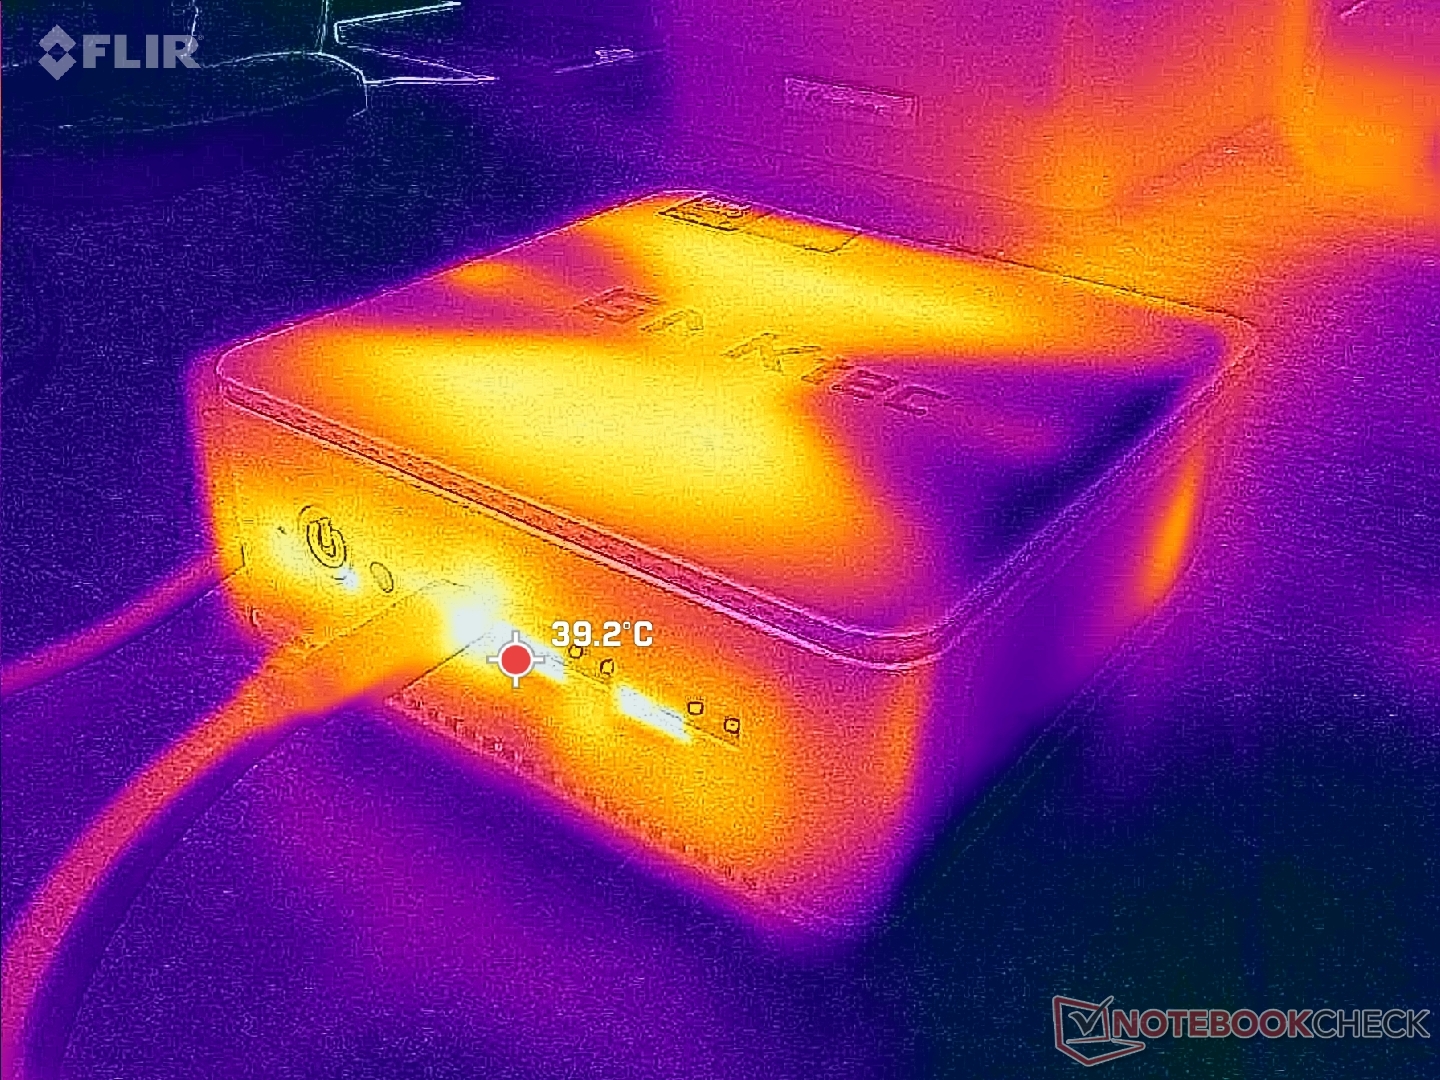
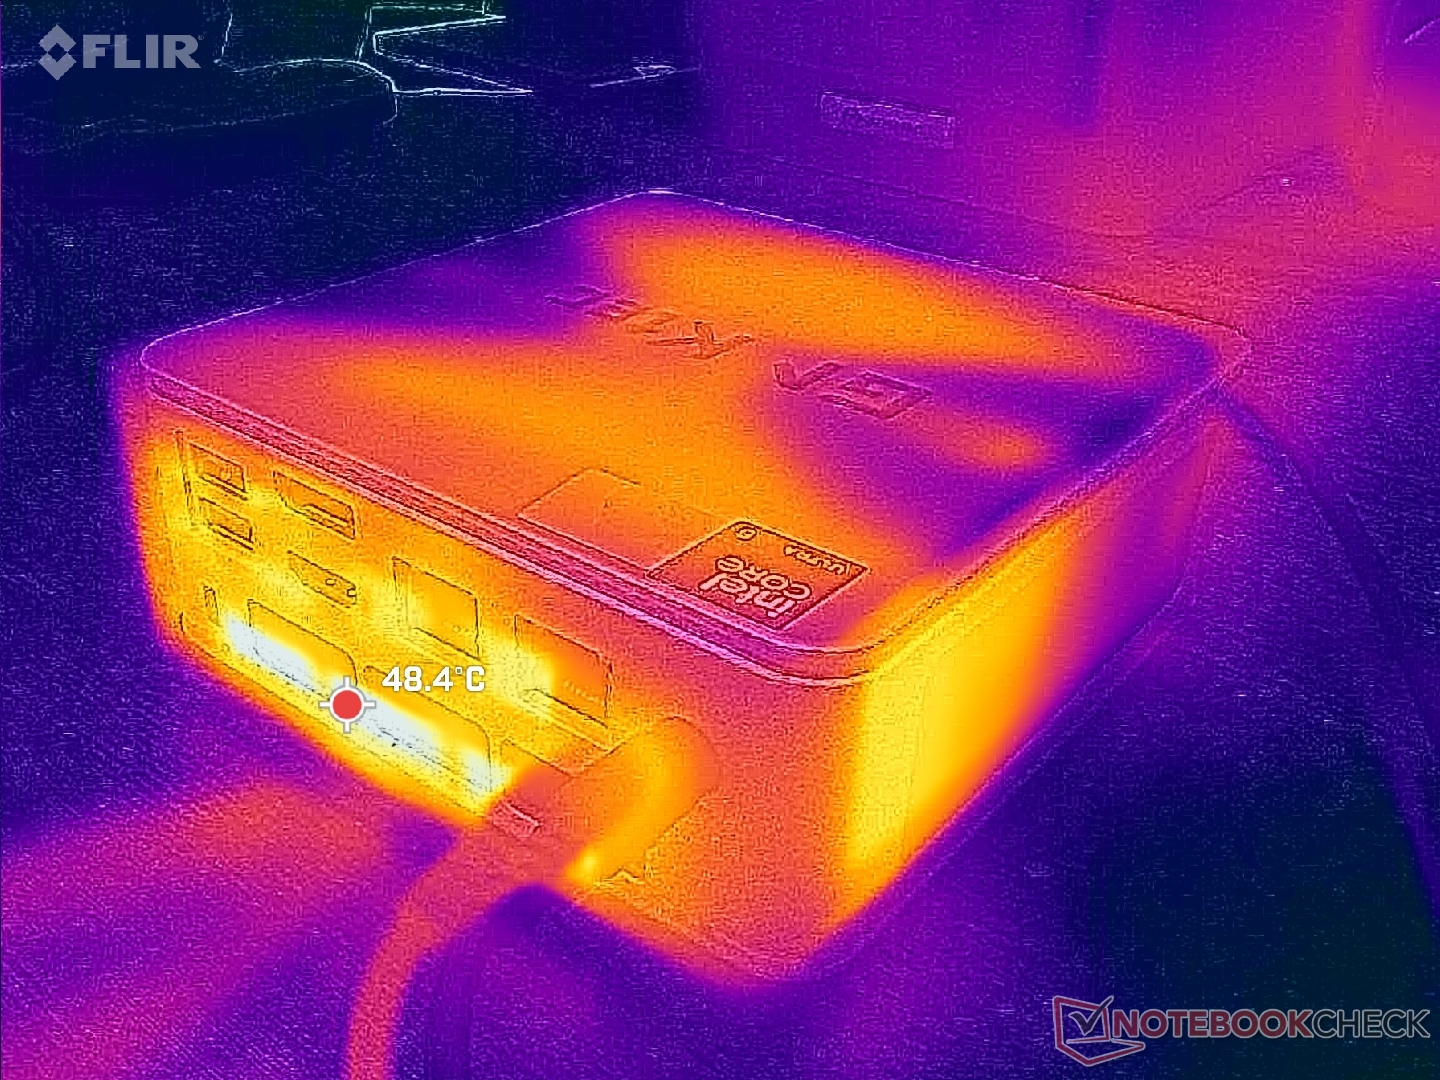
温度
除了顶部表面外,设备的两侧都有通风栅,这意味着可以安全地将笔记本电脑和其他小件物品放在上面,而不会阻碍气流。
能源管理
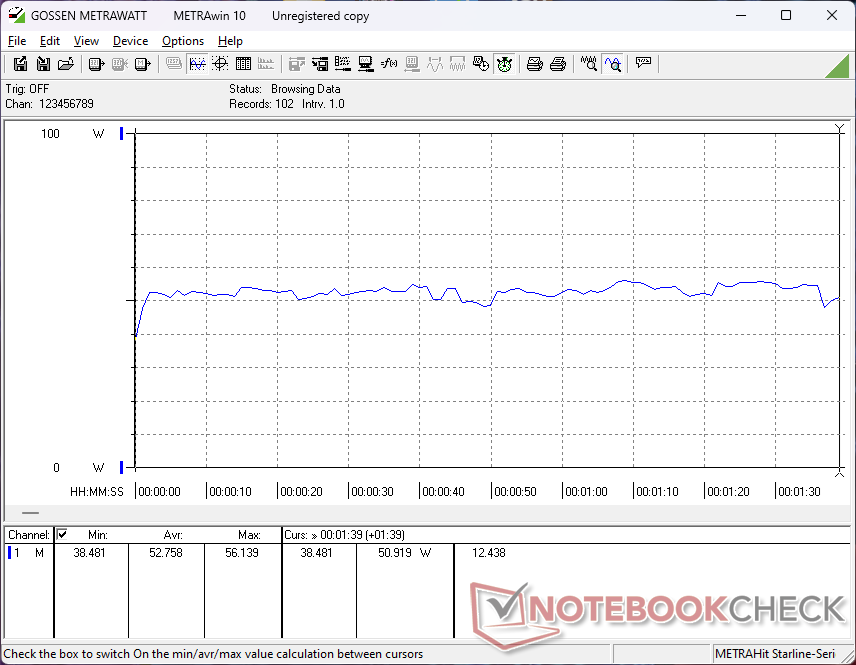
耗电量
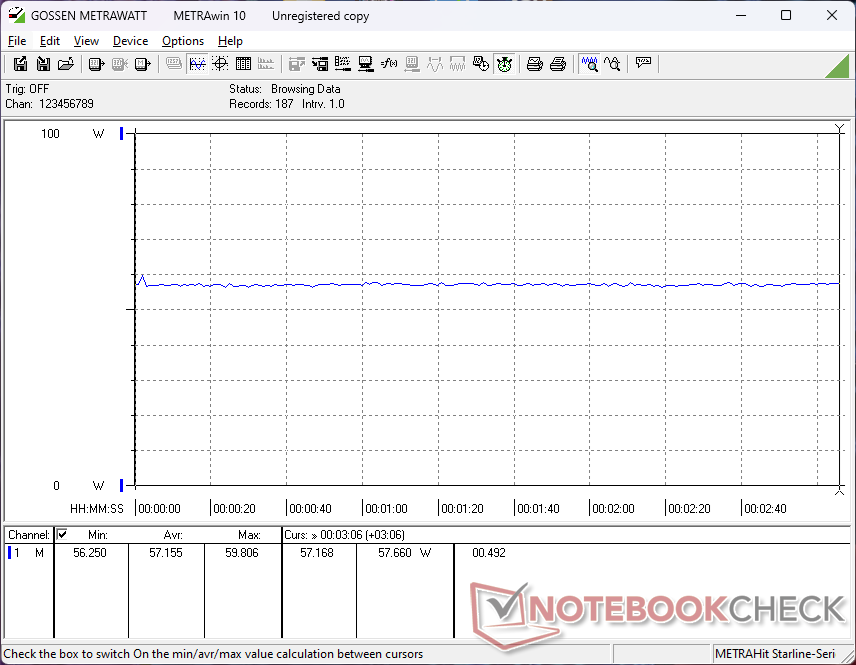
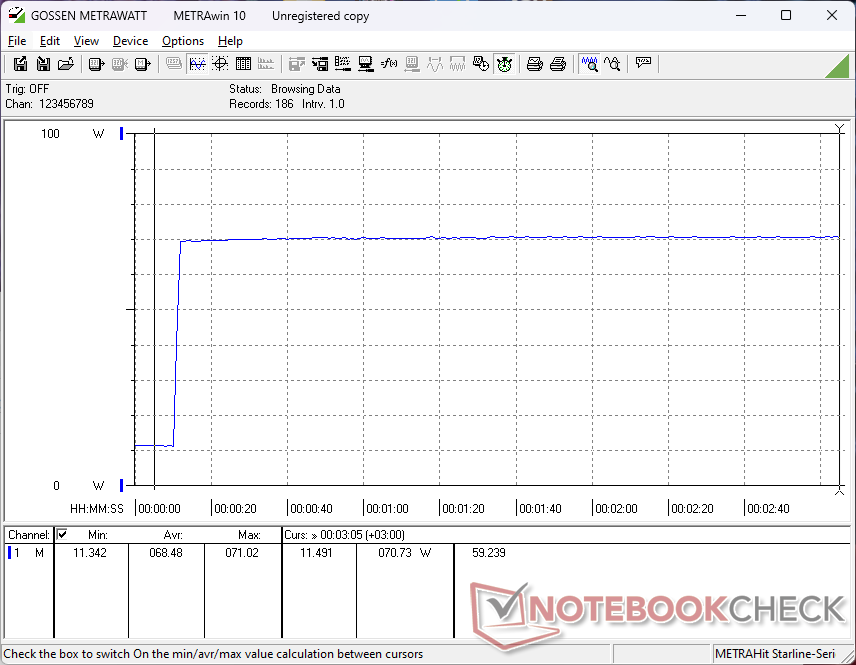
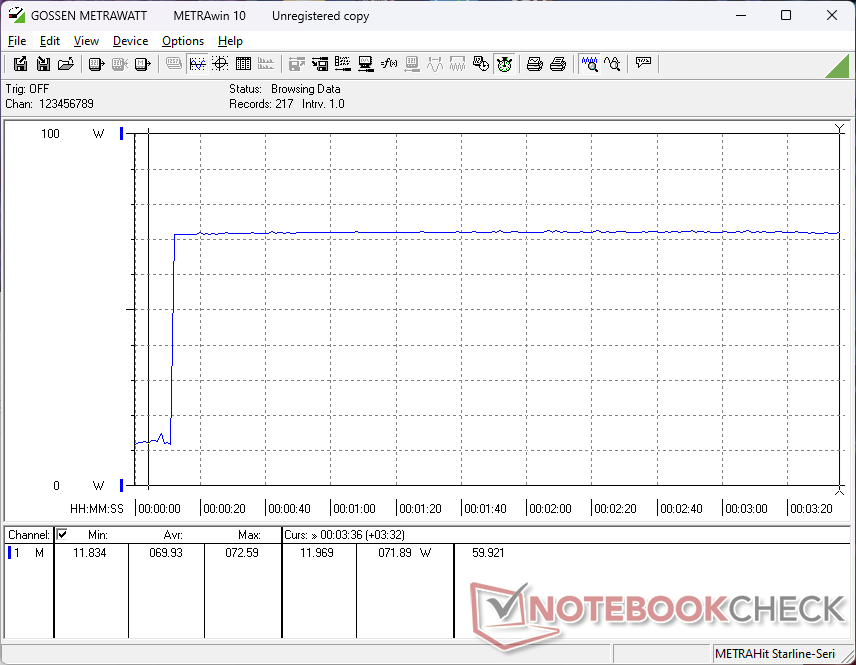
即使在省电模式下,台式机空闲时的功耗也比预期的要高,约为 11 W,而其他型号(如 NucBox M6 或 Beelink SER8)则为 6 W 至 8 W。 Beelink SER8.不过,在运行 3DMark 06 或《赛博朋克 2077》等要求更高的负载时,功耗会明显低于速度更快的 NucBox K6。
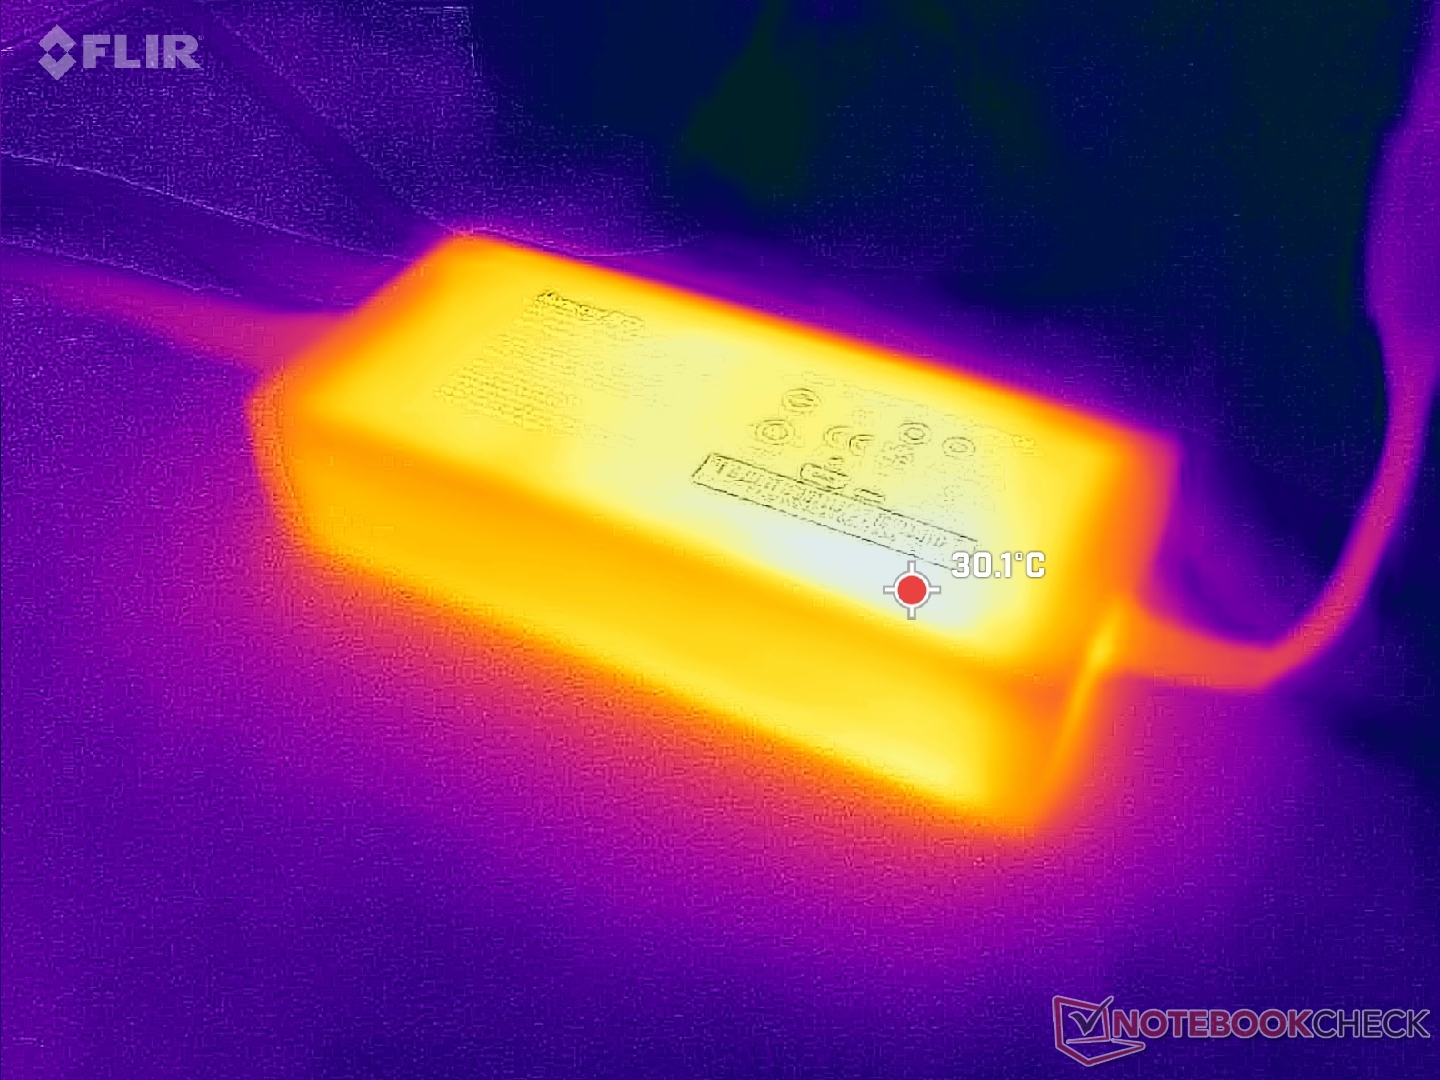
我们使用中小型(约 14.5 x 6.4 x 3 厘米)120 瓦桶装交流适配器记录的最大功耗为 73 瓦。这一巨大开销可归因于 Thunderbolt 4 端口,以防连接的显示器或配件需要额外电源。
| Off / Standby | |
| Idle | |
| Load |
|
Key:
min: | |
| GMK NucBox K9 Ultra 5 125H, Arc 7-Core, MasonSemi 1TB MC7000, , x, | GMK NucBox K6 R7 7840HS, Radeon 780M, MasonSemi 1TB MC7000, , x, | GMK NucBox M6 R5 6600H, Radeon 660M, AirDisk APF 10-512G, , x, | Beelink SER8 R7 8845HS, Radeon 780M, Crucial P3 Plus CT1000P3PSSD8, , x, | Beelink SEi12 Core i5-1235U i5-1235U, Iris Xe G7 80EUs, Kingston NV1 SNVS/500GCN, , x, | BOSGAME M1 R7 7840HS, Radeon 780M, , , x, | |
|---|---|---|---|---|---|---|
| Power Consumption | 10% | 10% | 9% | -43% | 4% | |
| Idle Minimum * | 10.9 | 6.7 39% | 7.9 28% | 7.3 33% | 15.8 -45% | 7.3 33% |
| Idle Average * | 11 | 7 36% | 8 27% | 7.3 34% | 16.8 -53% | 7.3 34% |
| Idle Maximum * | 11.4 | 7.6 33% | 8.3 27% | 8.4 26% | 17 -49% | 8.4 26% |
| Load Average * | 52.8 | 74.3 -41% | 61.5 -16% | 68.2 -29% | 54.4 -3% | 72.7 -38% |
| Cyberpunk 2077 ultra external monitor * | 57.1 | |||||
| Load Maximum * | 72.2 | 85.7 -19% | 84.6 -17% | 84.3 -17% | 119.1 -65% | 99.1 -37% |
| Witcher 3 ultra * | 75 | 47.3 | 75.1 | 50.7 | 80.5 |
* ... smaller is better
Power Consumption Prime95+FurMark Stress Test
Power Consumption external Monitor
Pros
Cons
结论:更新但不更快
NucBox K9 的售价为 570 美元,配备 32 GB 内存和 1 TB 存储空间,与 Beelink SER8 相比具有很高的性价比。 Beelink SER8相比,NucBox K9 算得上物美价廉。GMK 最大的敌人可能是 GMK 本身,因为 NucBox K6 等型号比 NucBox K9 既便宜又快,而且机箱设计和物理特性基本相同。在这种情况下,几乎没有理由购买 NucBox K9 而不是 K6,除非你优先考虑集成的 NPU 而不是原始 CPU 和 GPU 性能。即使是竞争对手 博弈 M1目前的价格也更便宜,而且速度更快,售价为 500 美元。NucBox K9 的运行噪音确实小了一点,但这只是因为该机型的运行速度本来就慢了一点。
NucBox K9 绝不是一款差劲的迷你电脑,但它比老款 NucBox K6 更高的价格和更慢的性能注定会让很多买家感到困惑,尤其是那些对人工智能加速不感兴趣的人。
除了 NucBox K6 和 K9 型号之间的价格和性能差距外,该系列的设计也开始显出老态。竞争对手如 Bosgame 采用了更坚固的金属机箱设计,而 Beelink 最近对其 SER 系列进行了重新设计,使其更加专业甚至豪华。以塑料为主的 GMK NucBox 已经足够好用,但现在可能已经到了采用更高质量材料或可能采用免工具维修方式进行大修的时候了。
价格和供应情况
GMKtec NucBox K9 目前在亚马逊上的售价为 720 美元(优惠券后),或直接从制造商处购买,售价为 570 美元。售价为 570 美元。裸机 SKU 的售价也为 400 美元。
注:我们最近更新了评级系统,第 8 版的结果与第 7 版的结果不具可比性。更多信息 此处.
GMK NucBox K9
- 10/30/2024 v8
Allen Ngo
 Total Sustainability Score:
 Transparency
The selection of devices to be reviewed is made by our editorial team. The test sample was provided to the author as a loan by the manufacturer or retailer for the purpose of this review. The lender had no influence on this review, nor did the manufacturer receive a copy of this review before publication. There was no obligation to publish this review. We never accept compensation or payment in return for our reviews. As an independent media company, Notebookcheck is not subjected to the authority of manufacturers, retailers or publishers.
This is how Notebookcheck is testing
Every year, Notebookcheck independently reviews hundreds of laptops and smartphones using standardized procedures to ensure that all results are comparable. We have continuously developed our test methods for around 20 years and set industry standards in the process. In our test labs, high-quality measuring equipment is utilized by experienced technicians and editors. These tests involve a multi-stage validation process. Our complex rating system is based on hundreds of well-founded measurements and benchmarks, which maintains objectivity. Further information on our test methods can be found here.
Price comparison

