

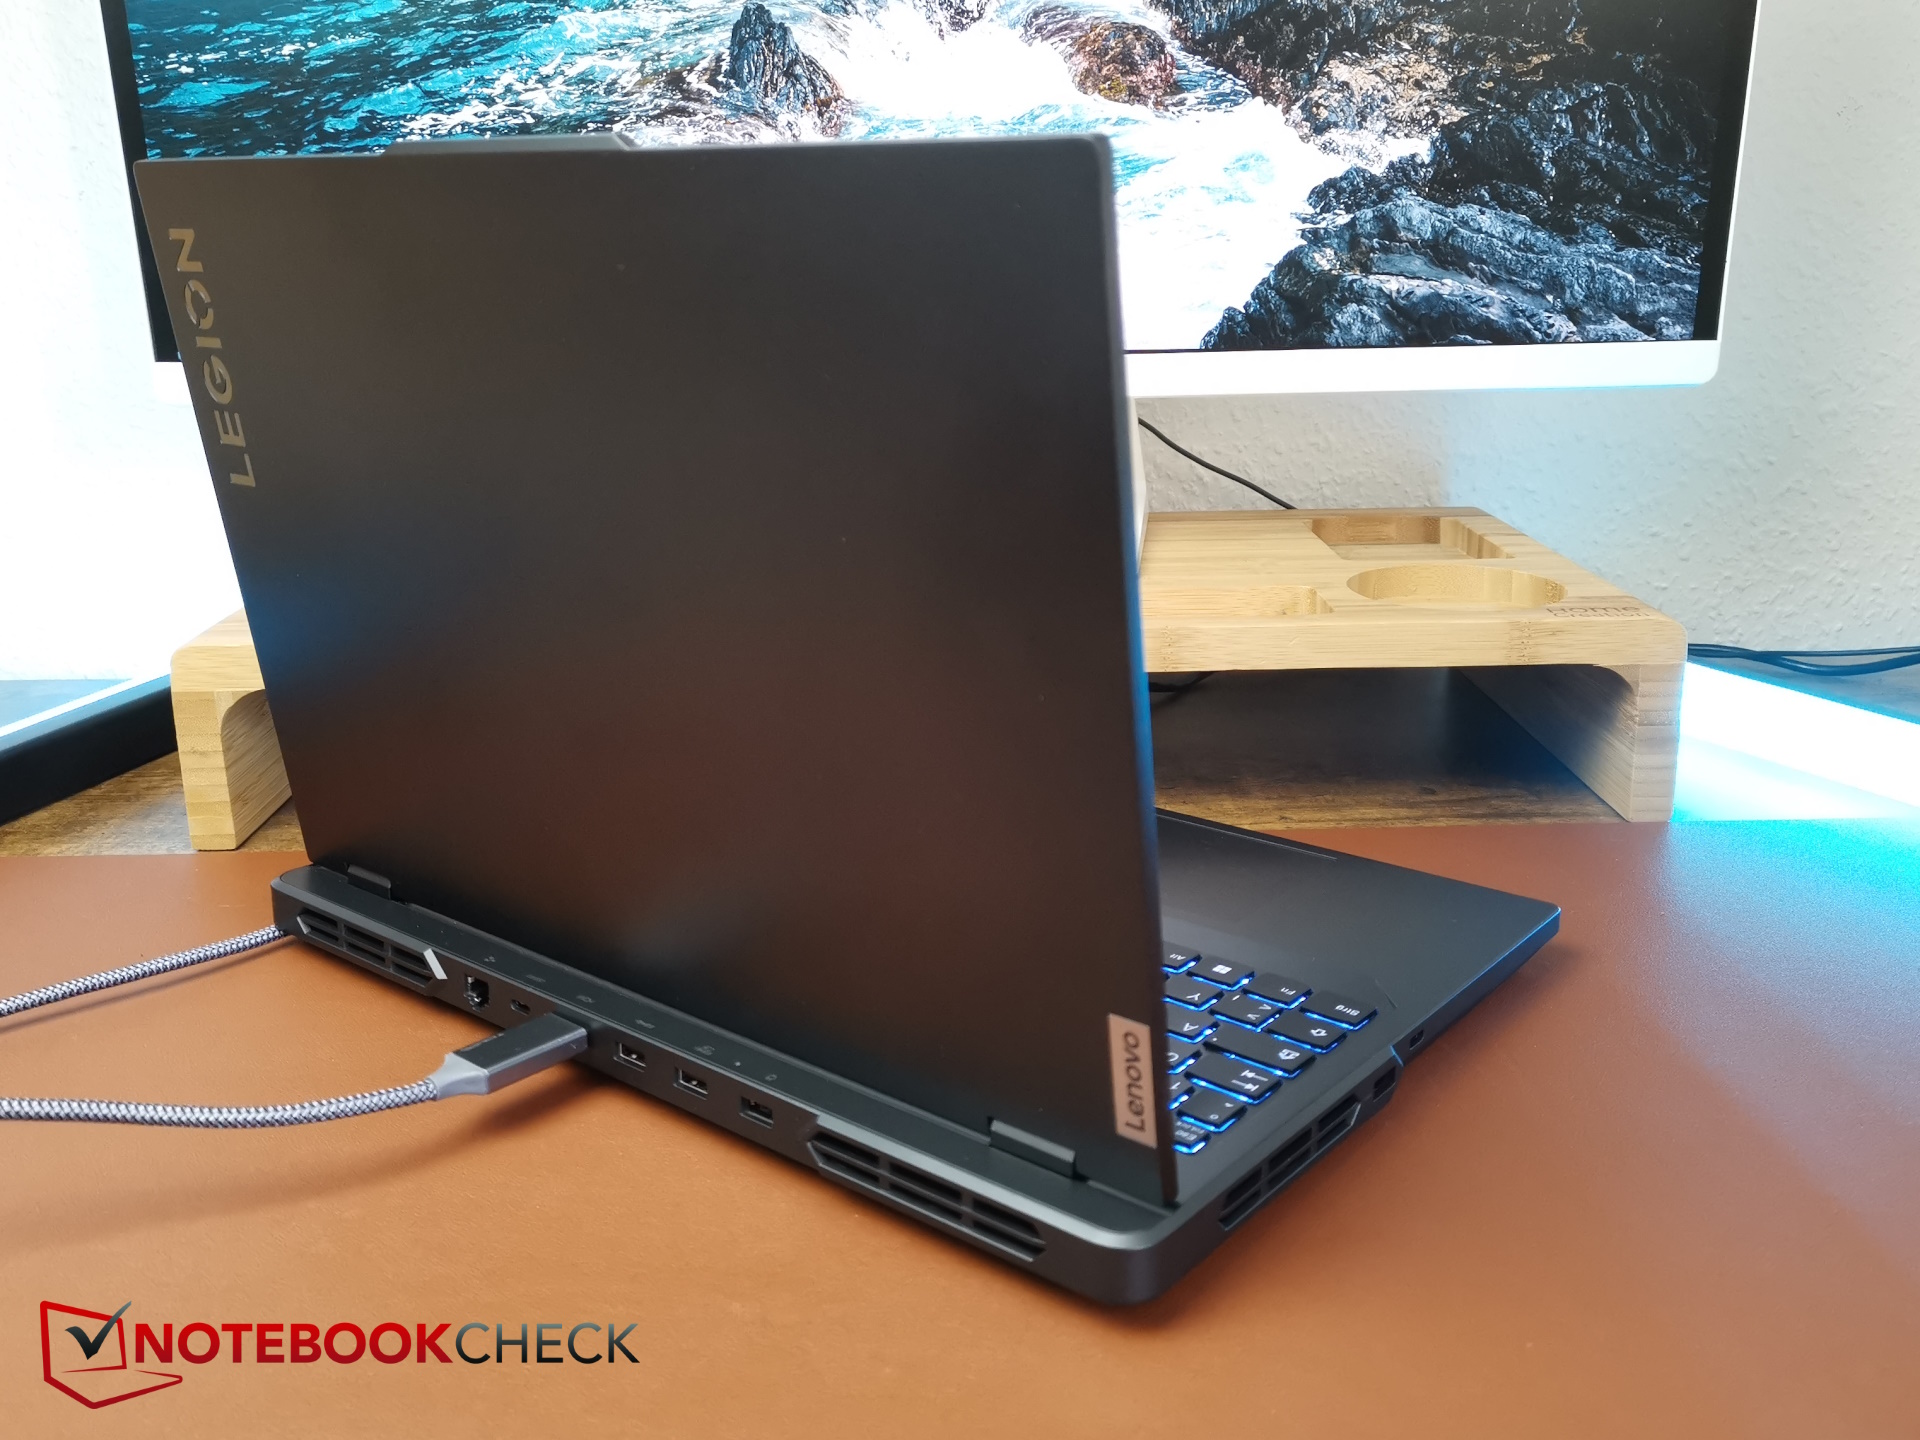
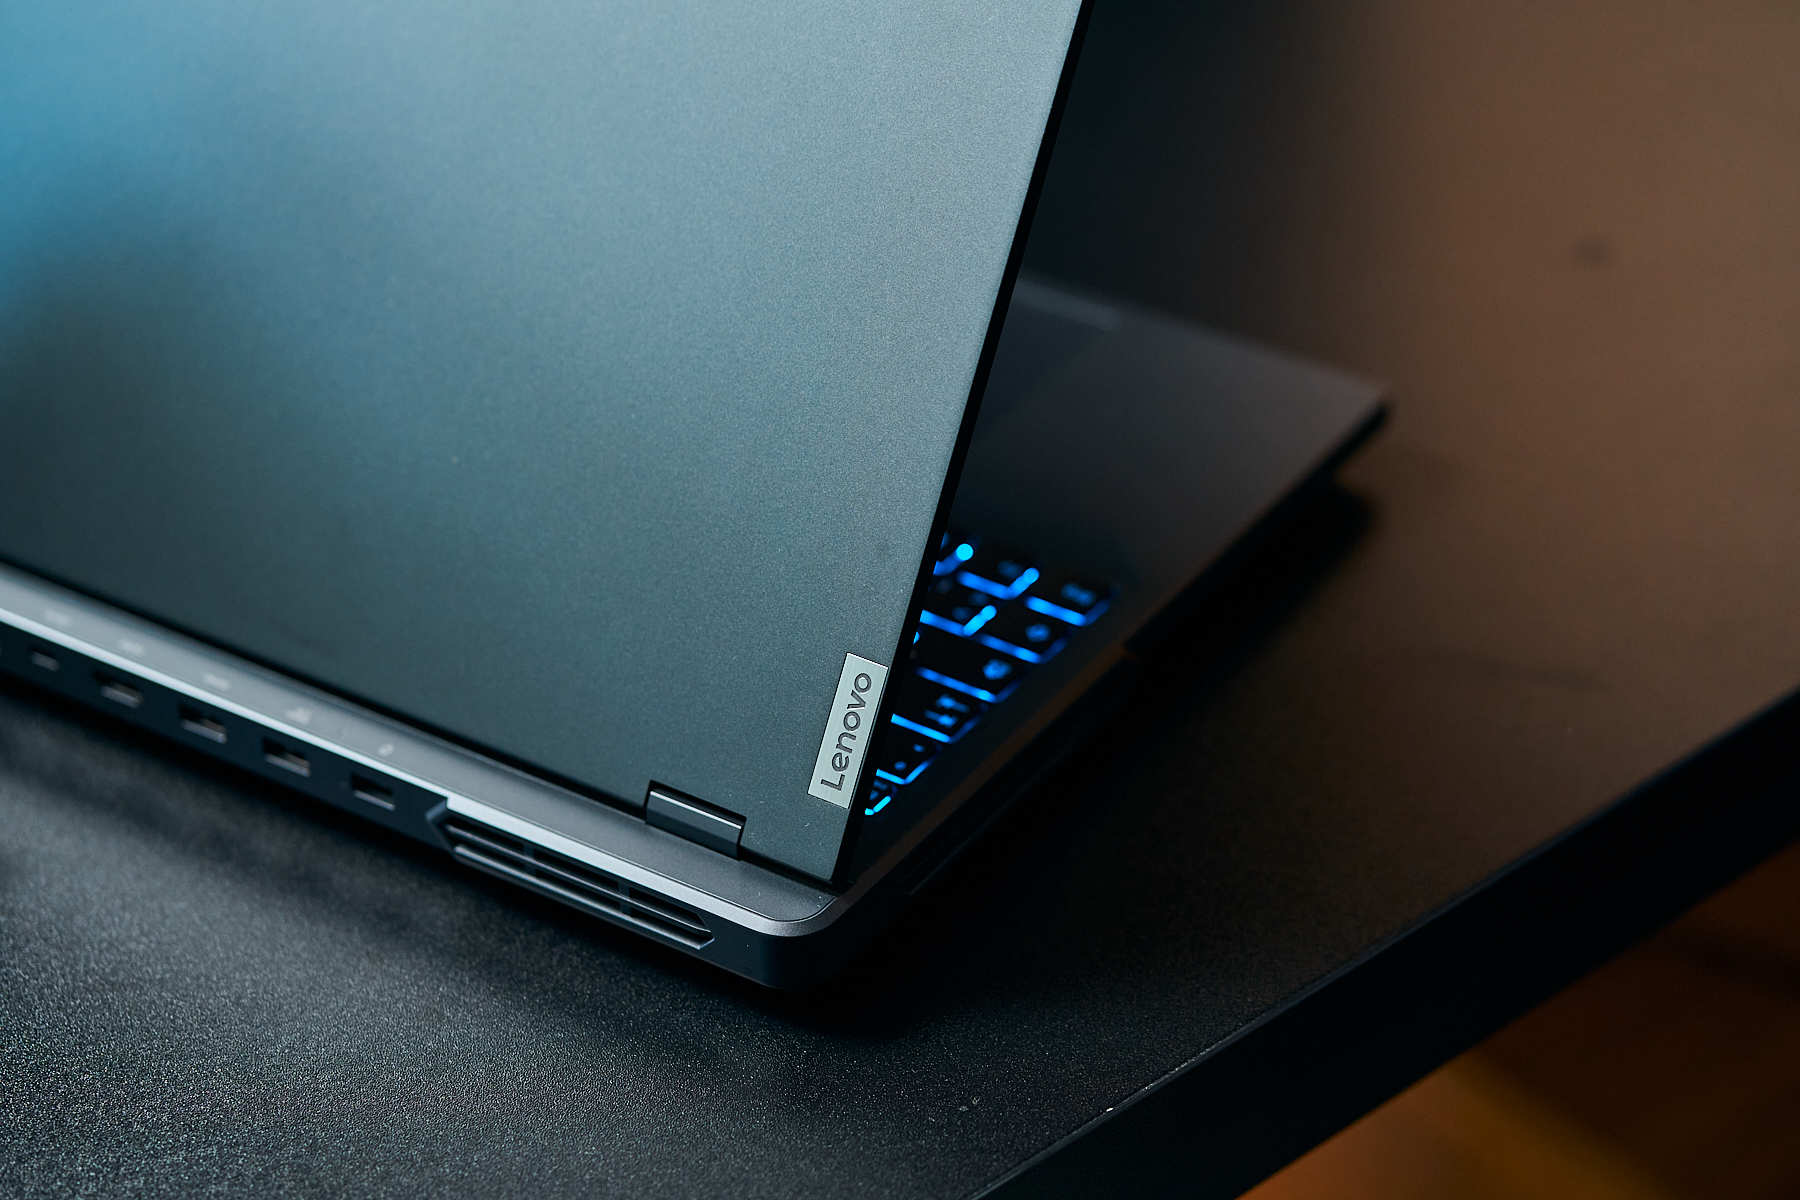
联想Legion Pro 5i 笔记本电脑评测:超强 i7-14700HX 和 RTX 4060 性能
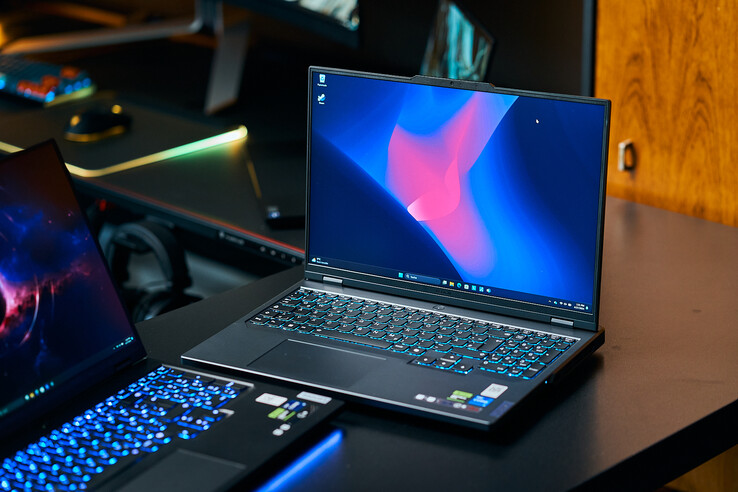
我们已经测试了其中一款配置较高的产品,它配备了 酷睿 i9 14900HX CPU和 140 瓦GeForce RTX 4070.不过,很多玩家可能会选择价格更实惠的配置,即 i7 14700HX 处理器。 i7 14700HX和 RTX 4060的配置。这款机型也可能会让人看到 "大 "机型的一些弱点,如表面温度过高和散热系统噪音过大。
除了它的 大哥和 非专业Legion 5,我们将把Legion Pro 5 与其他 RTX 4060 游戏机进行比较,如 戴尔 G16, 惠普 Victus 16和 XMG Core 15.
潜在的竞争对手比较
Version | Rating | Date | Model | Weight | Height | Size | Resolution | Price |
|---|---|---|---|---|---|---|---|---|
| v8 | 82.3 % | 07 / 2024 | Lenovo Legion Pro 5 16IRX9 G9 i7-14700HX, NVIDIA GeForce RTX 4060 Laptop GPU | 2.5 kg | 26.55 mm | 16.00" | 2560x1600 | |
| v7 (old) | 84.3 % v7 (old) | 05 / 2024 | HP Victus 16 (2024) i7-14700HX, NVIDIA GeForce RTX 4060 Laptop GPU | 2.4 kg | 23.9 mm | 16.10" | 1920x1080 | |
| v7 (old) | 85.5 % v7 (old) | 02 / 2024 | Dell G16, i7-13650HX, RTX 4060 i7-13650HX, NVIDIA GeForce RTX 4060 Laptop GPU | 2.8 kg | 25.65 mm | 16.00" | 2560x1600 | |
| v8 | 83.7 % | 06 / 2024 | SCHENKER XMG Core 15 (M24) R7 8845HS, NVIDIA GeForce RTX 4060 Laptop GPU | 2.1 kg | 21.9 mm | 15.30" | 2560x1600 | |
| v7 (old) | 89.3 % v7 (old) | 04 / 2024 | Lenovo Legion Pro 5 16IRX9 i9-14900HX, NVIDIA GeForce RTX 4070 Laptop GPU | 2.5 kg | 26.95 mm | 16.00" | 2560x1600 | |
| v7 (old) | 89.1 % v7 (old) | 02 / 2024 | Lenovo Legion 5 16IRX G9 i7-14650HX, NVIDIA GeForce RTX 4060 Laptop GPU | 2.4 kg | 25.2 mm | 16.00" | 2560x1600 |
请注意:我们更新了评级系统,第 8 版的结果与第 7 版的结果不可比。更多信息 请点击此处.
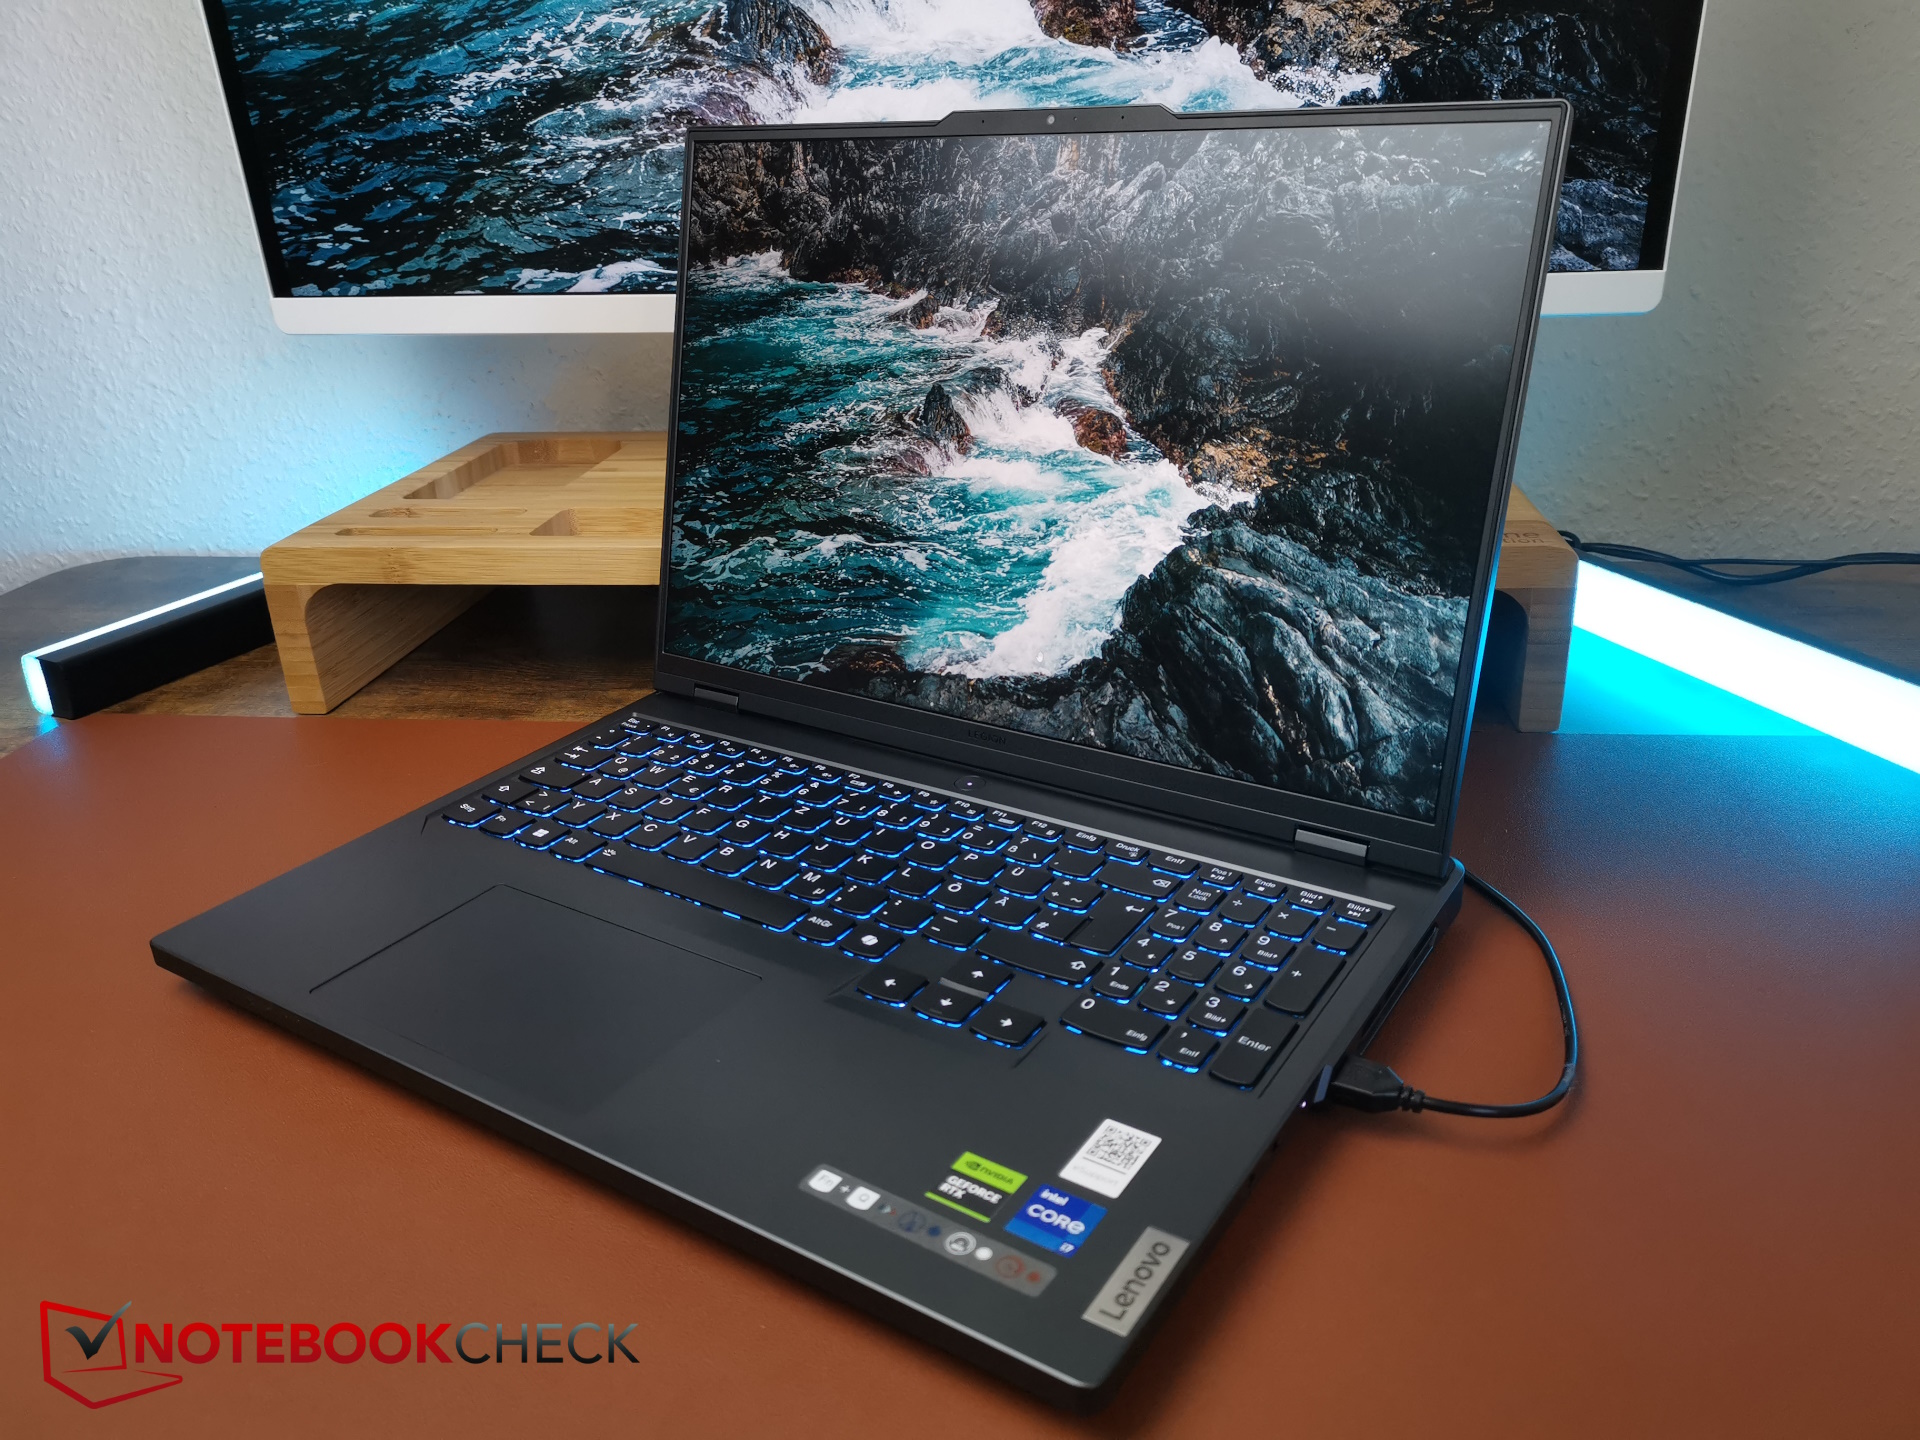


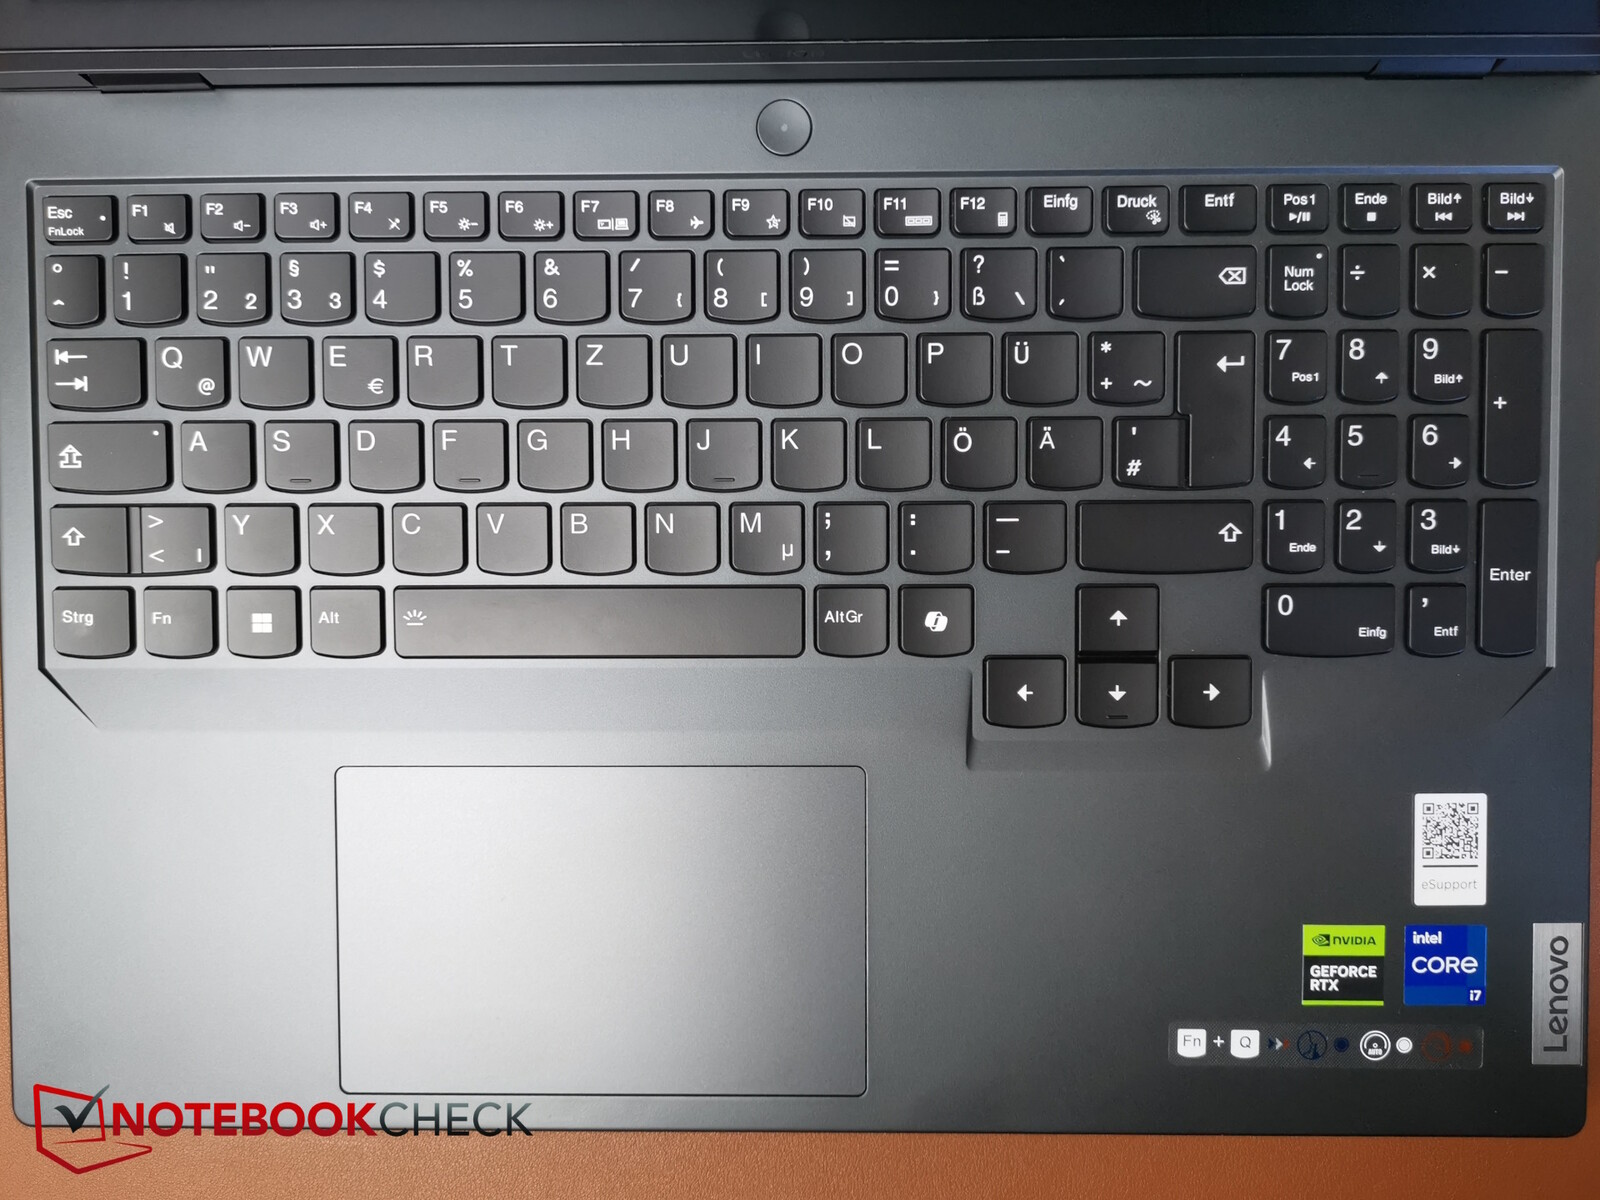
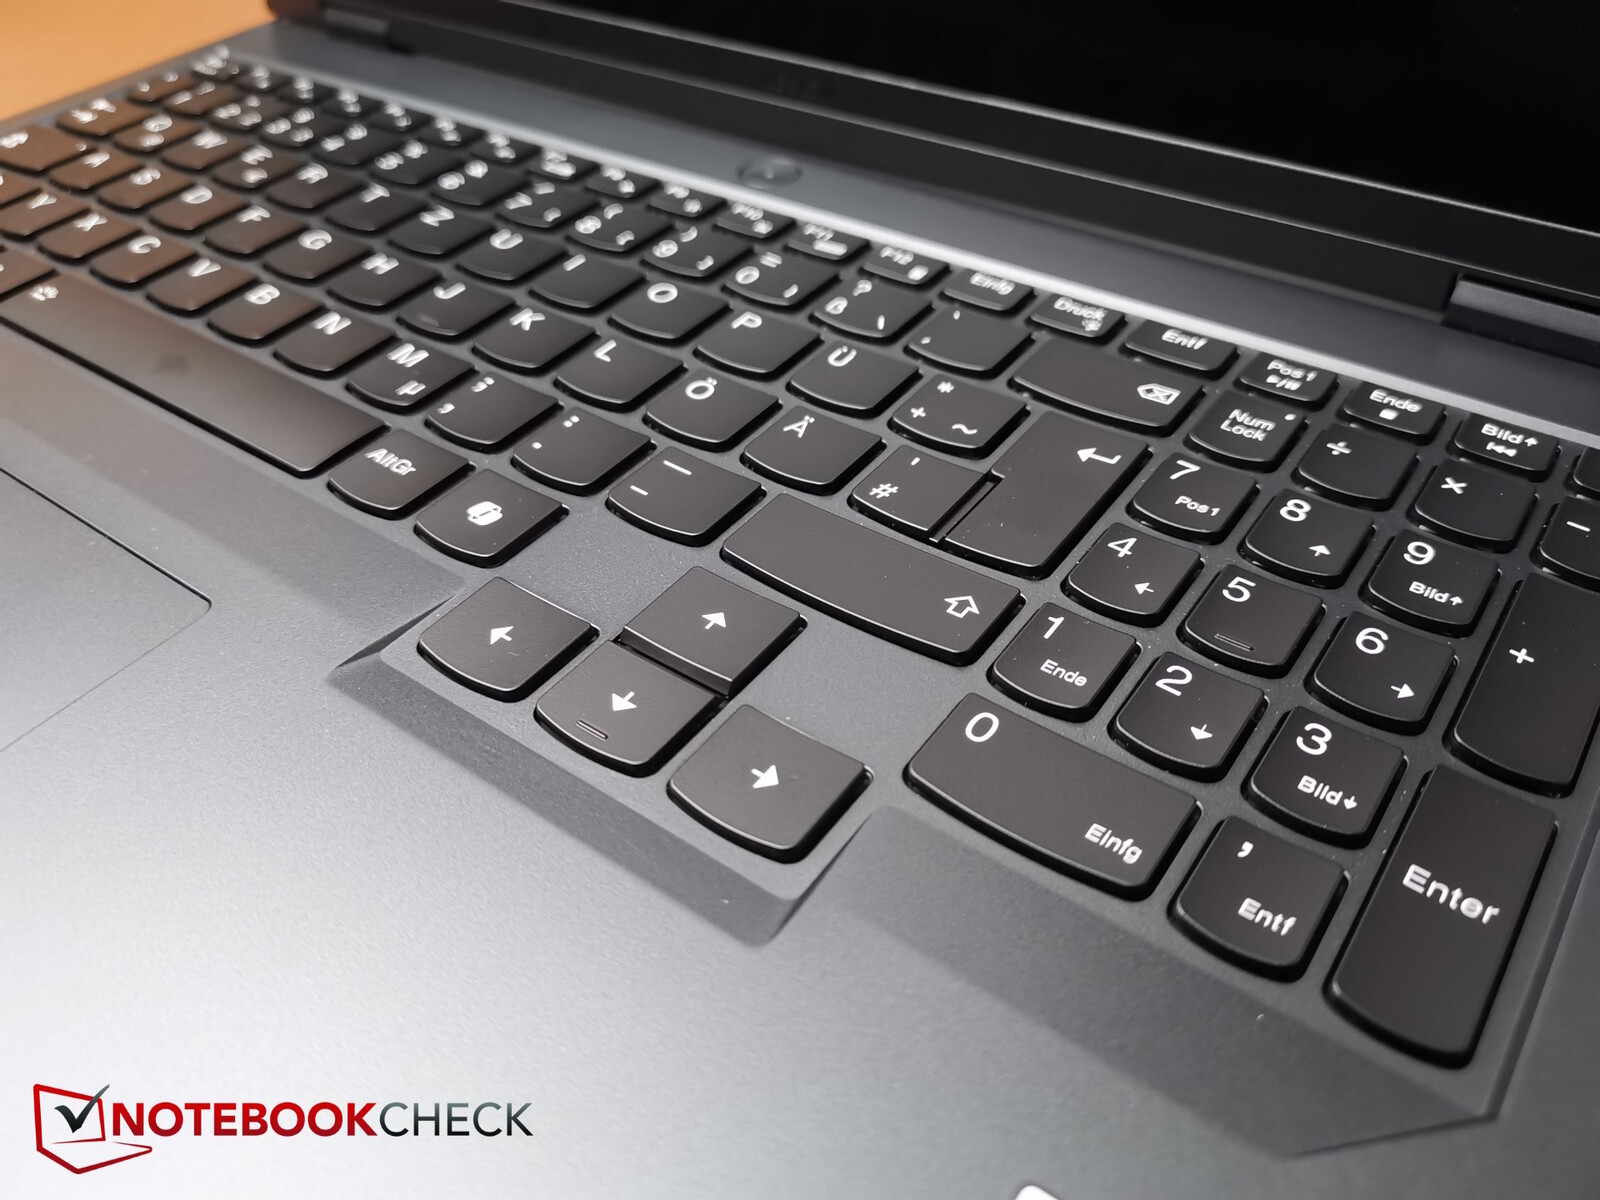
输入设备 - 享誉全球的Legion 质量
我们在第一次 Legion Pro 5i:它的刷新率可通过 Fn + R 组合键在三档(240、165 和 60 Hz)之间切换。

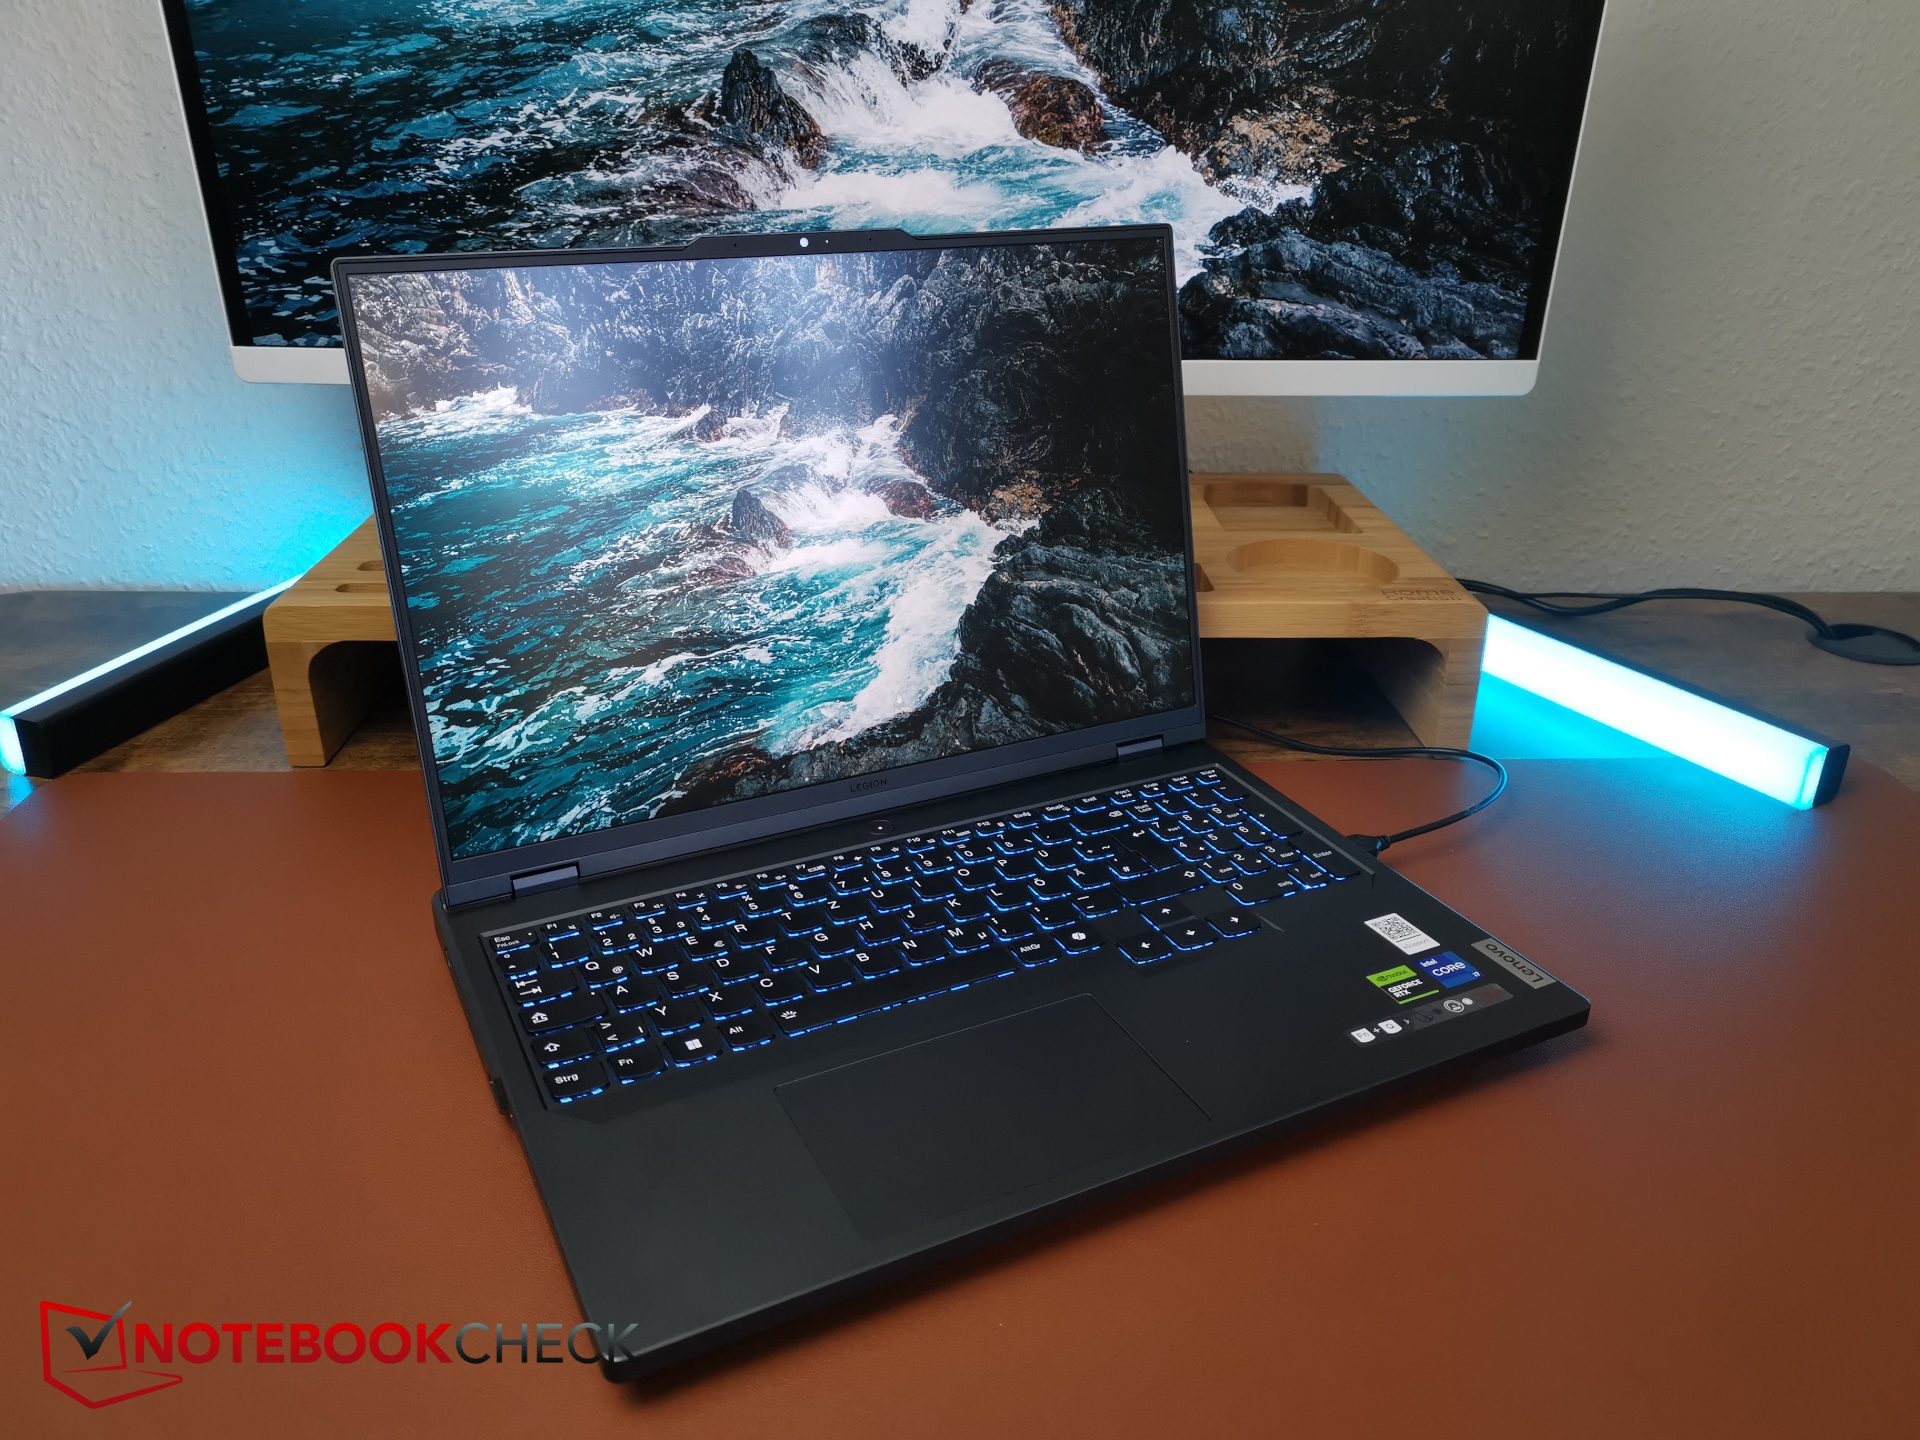
显示屏 -Legion Pro 也适用于内容创作者


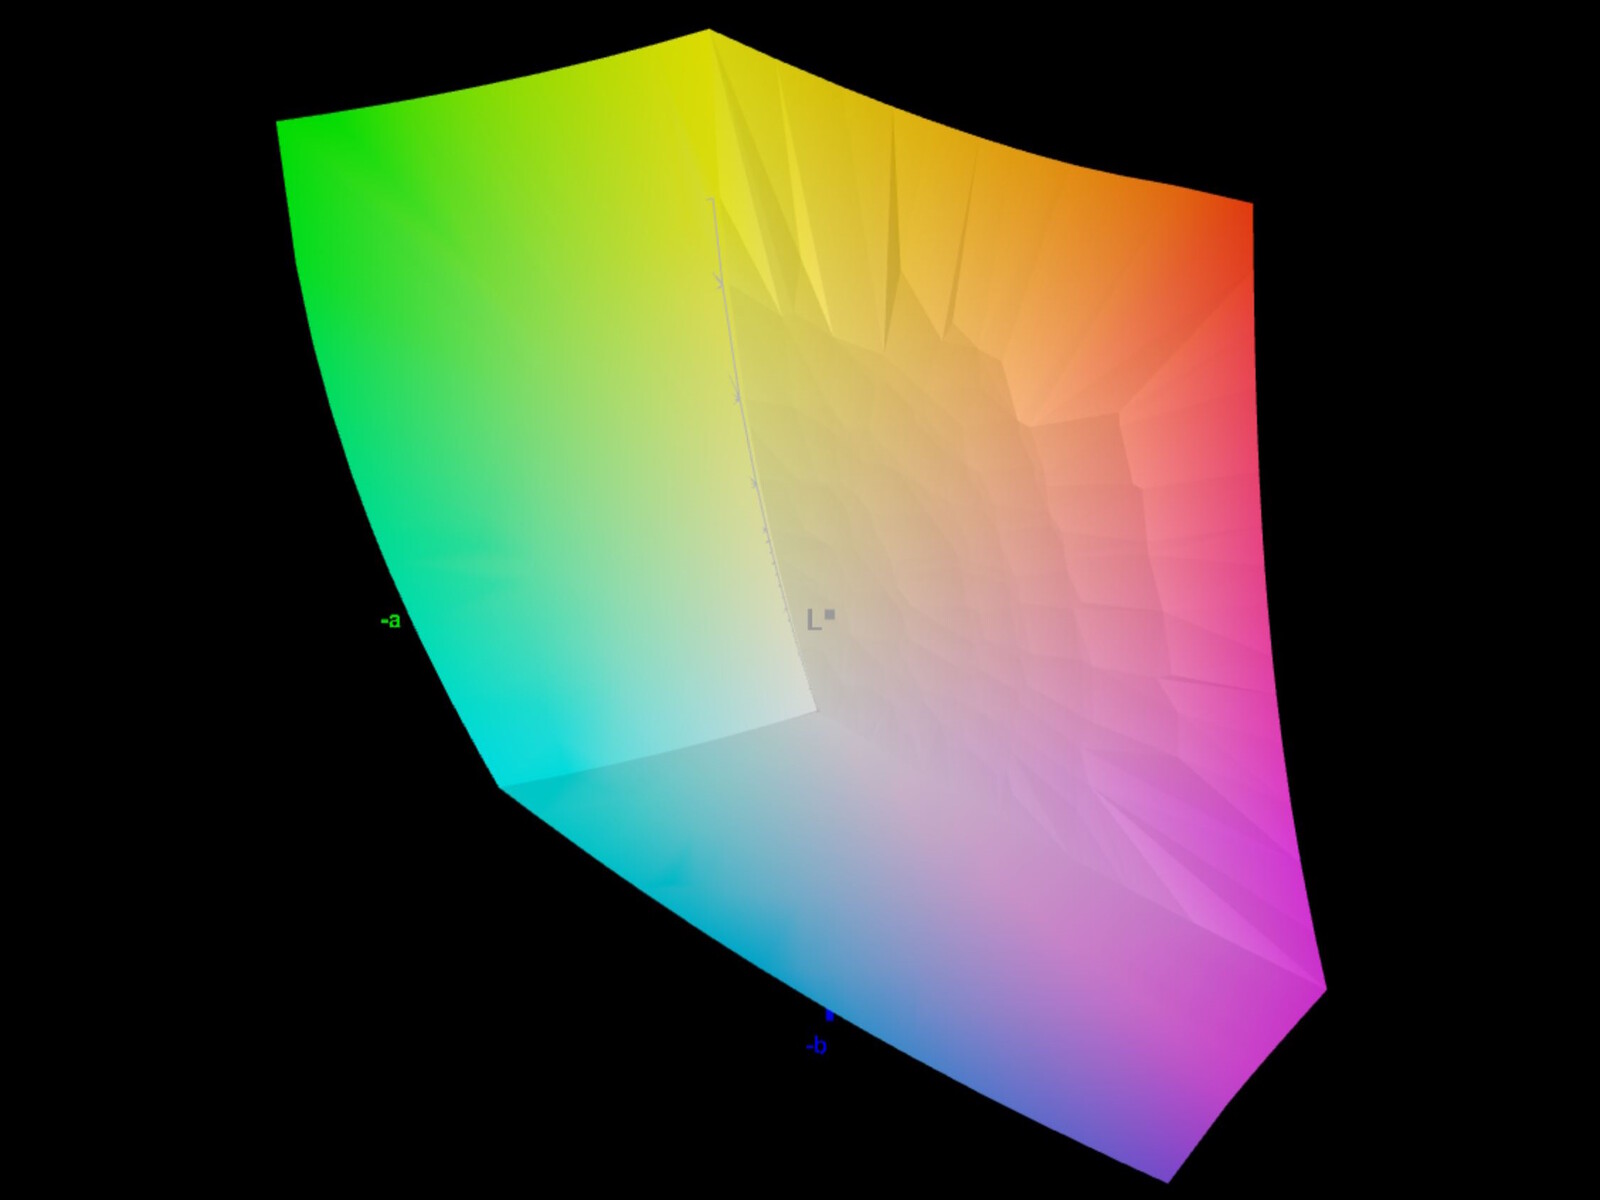
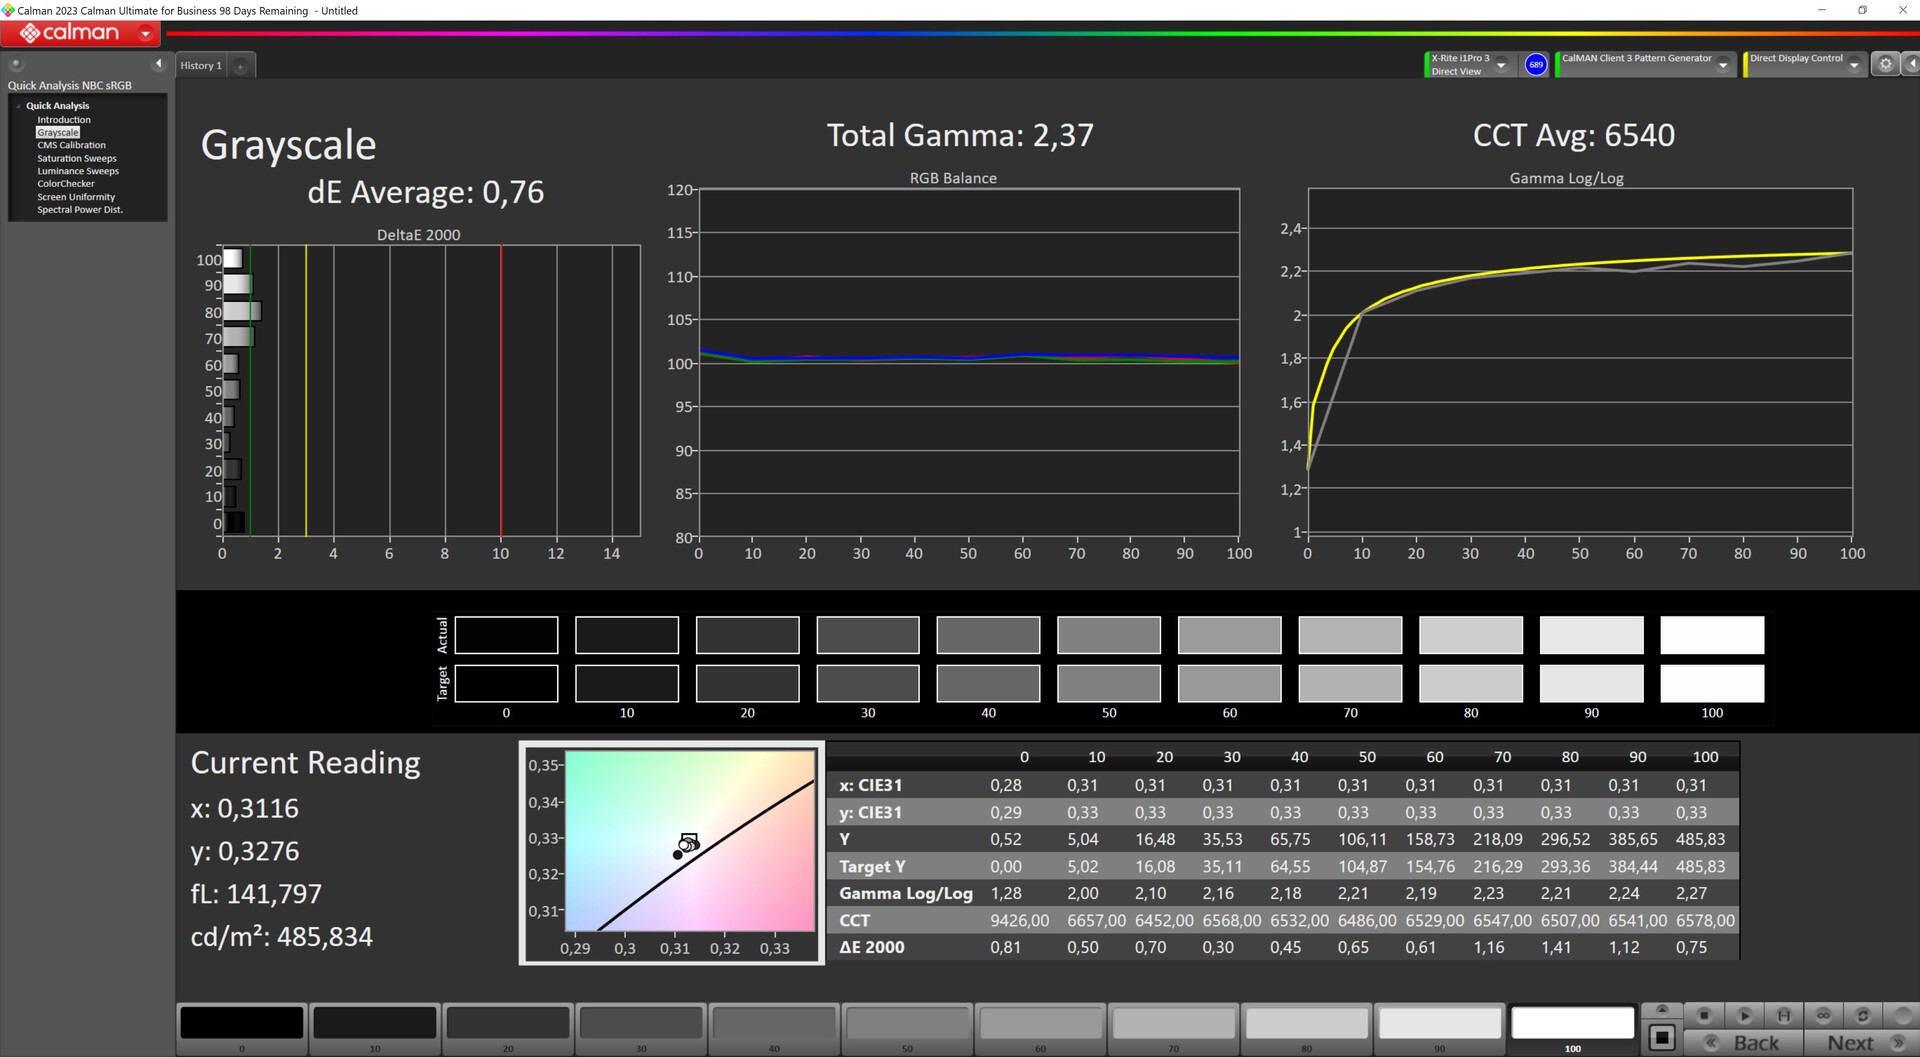
联想在这款笔记本电脑上安装了一块 2560 x 1600 像素的哑光 IPS 显示屏。不过,有三种显示屏可供选择,分辨率均相同。入门级型号覆盖 sRGB,刷新率为 165 Hz,亮度为 300 nits。另外两款亮度为 500 尼特,刷新率为 240 赫兹,其中一款还支持 DCI-P3。我们的测试机型采用了其中一款刷新率为 240 Hz 的 500 尼特显示器。
我们测得的平均亮度为 491 尼特,照度为 90%,亮度不错。不过,它的黑阶还可以更好一些,但对比度还不错。
我们测得的亮度为 150 尼特,亮度约为 58%。它不使用 PWM,因此不会出现屏幕出血问题,其响应时间对于 IPS 面板来说也相当快。
| |||||||||||||||||||||||||
Brightness Distribution: 90 %
Center on Battery: 518 cd/m²
Contrast: 1439:1 (Black: 0.36 cd/m²)
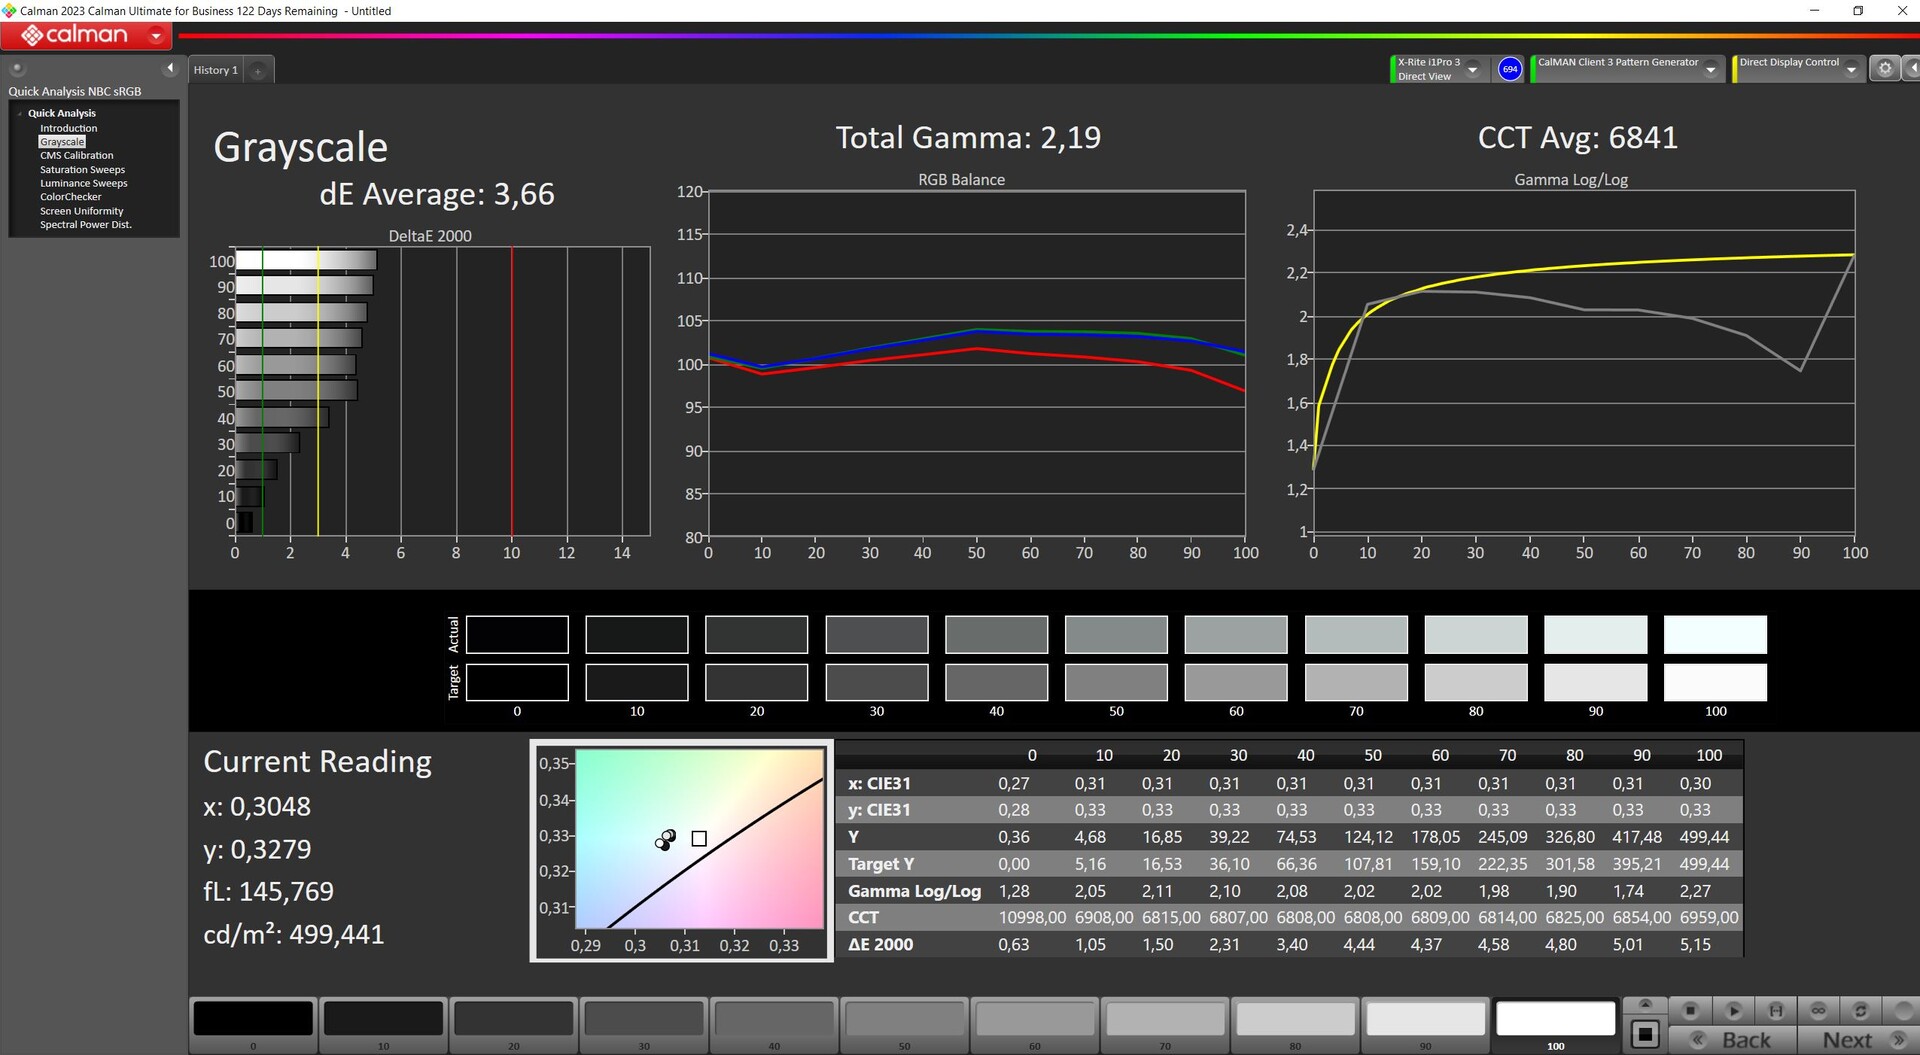
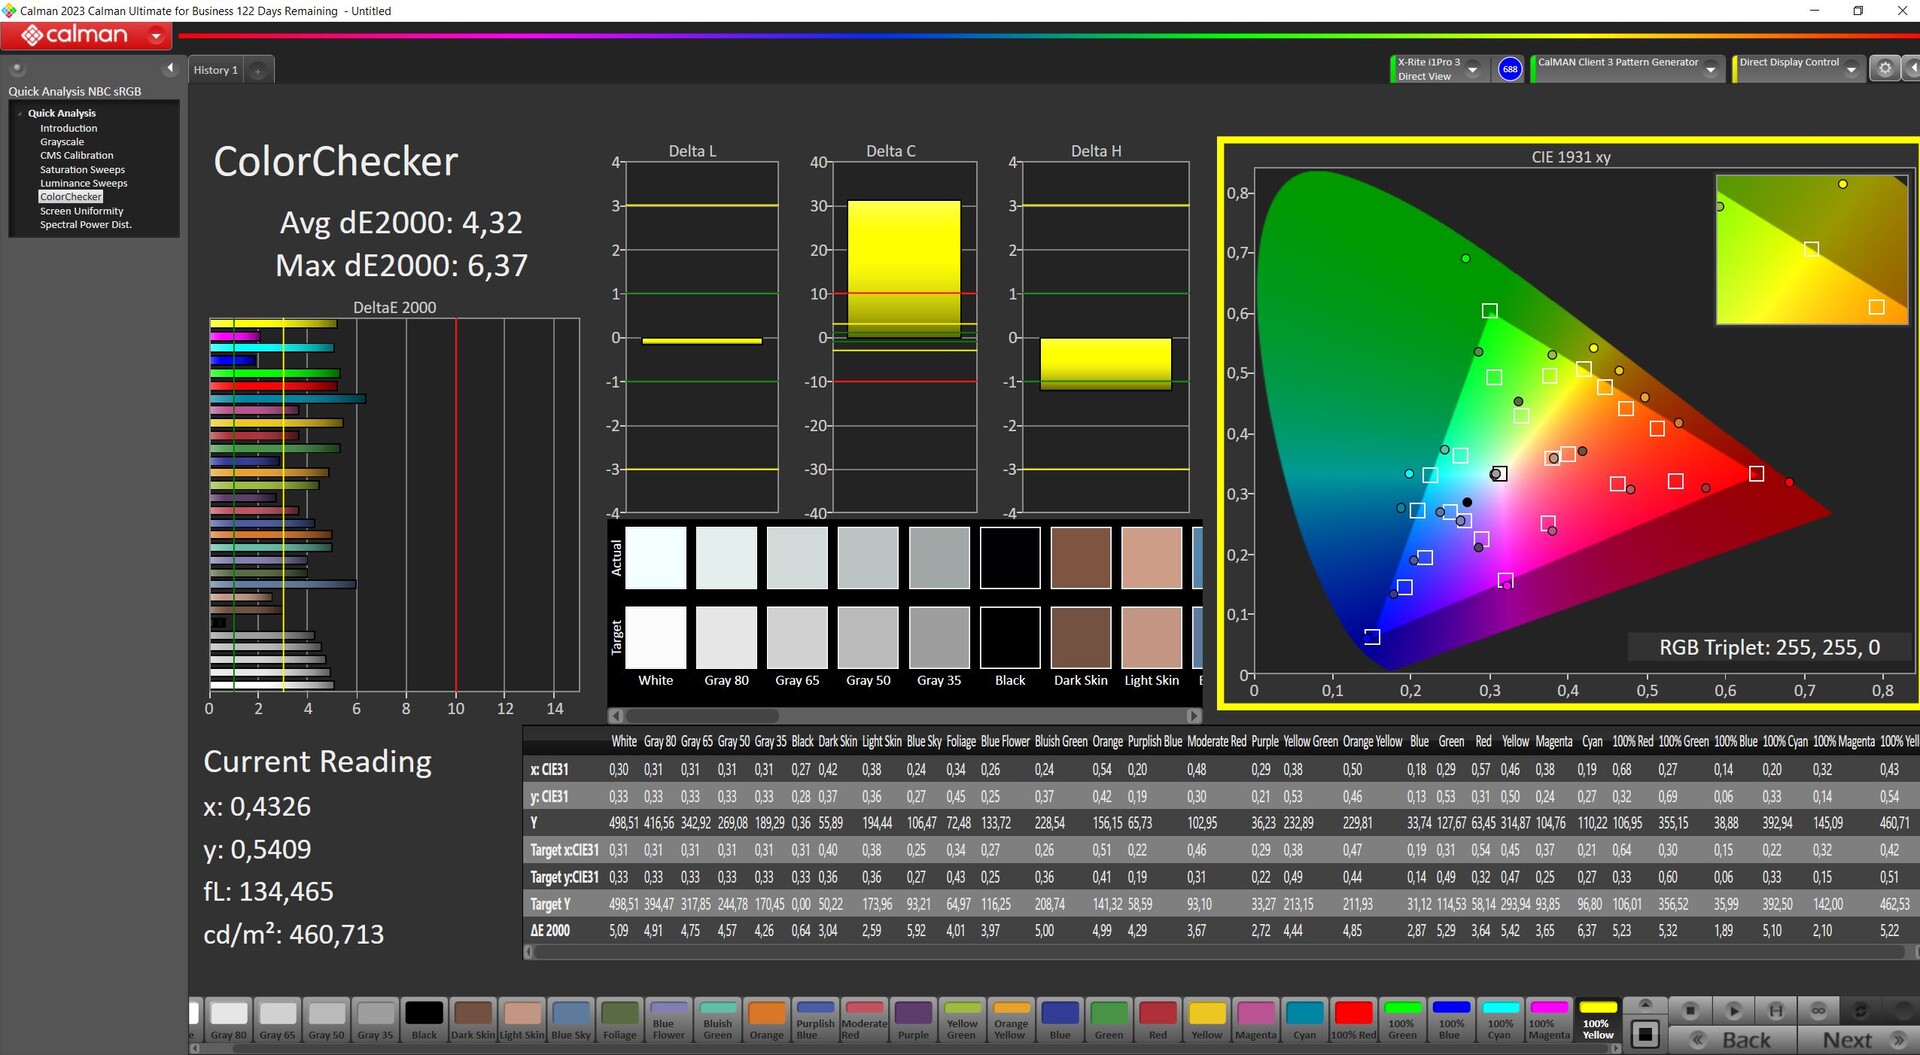
ΔE Color 4.32 | 0.5-29.43 Ø4.87, calibrated: 0.75
ΔE Greyscale 3.66 | 0.5-98 Ø5.1
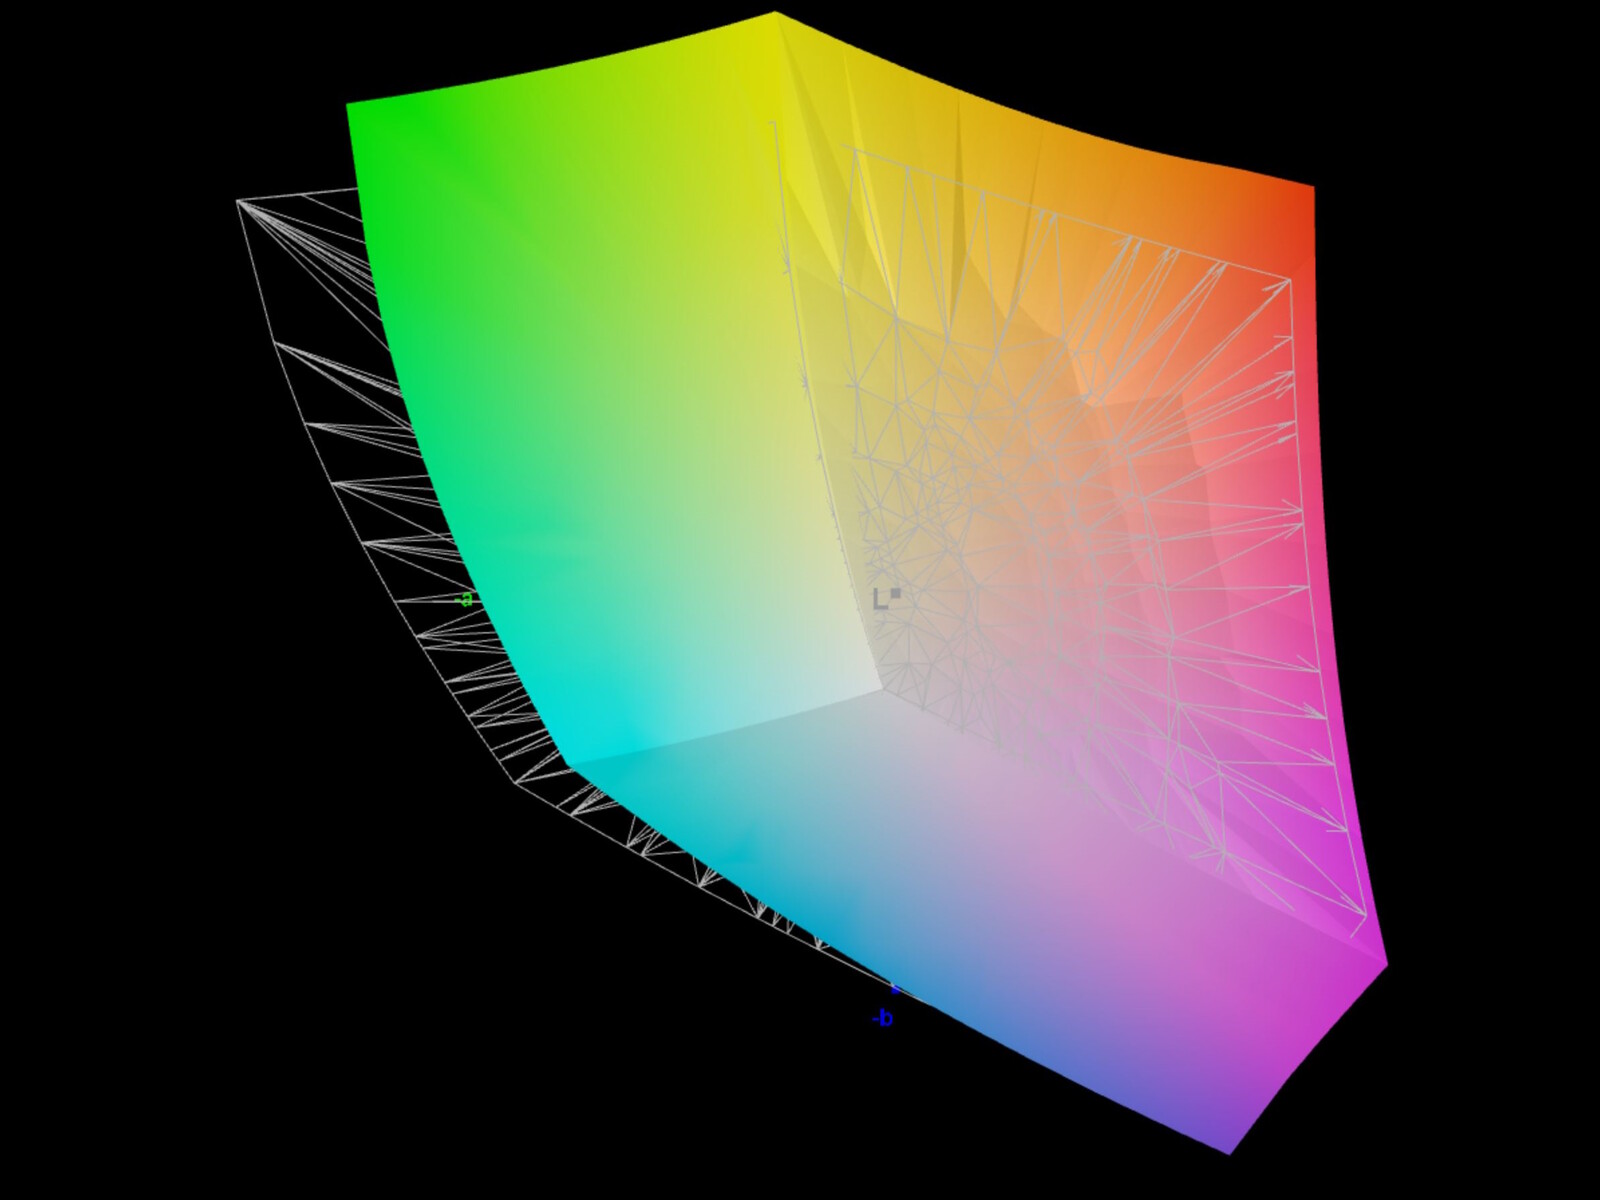
87.81% AdobeRGB 1998 (Argyll 2.2.0 3D)
99.93% sRGB (Argyll 2.2.0 3D)
99.22% Display P3 (Argyll 2.2.0 3D)
Gamma: 2.19
| Lenovo Legion Pro 5 16IRX9 G9 BOE NE160QDM-NZB, IPS, 2560x1600, 16" | HP Victus 16 (2024) Chi Mei CMN163E, IPS, 1920x1080, 16.1" | Dell G16, i7-13650HX, RTX 4060 Chi Mei CMN161D (160GME), IPS, 2560x1600, 16" | SCHENKER XMG Core 15 (M24) BOE NJ NE153QDM-NZ1 (BOE0C8E), IPS, 2560x1600, 15.3" | Lenovo Legion Pro 5 16IRX9 BOE NE160QDM-NYC, IPS, 2560x1600, 16" | Lenovo Legion 5 16IRX G9 NE160QDM-NZ3, IPS, 2560x1600, 16" | |
|---|---|---|---|---|---|---|
| Display | -49% | -18% | -14% | -17% | -14% | |
| Display P3 Coverage | 99.22 | 41.3 -58% | 67.5 -32% | 73.2 -26% | 69.3 -30% | 72.4 -27% |
| sRGB Coverage | 99.93 | 61.7 -38% | 98.5 -1% | 100 0% | 99.4 -1% | 100 0% |
| AdobeRGB 1998 Coverage | 87.81 | 42.7 -51% | 69.3 -21% | 74.6 -15% | 70.1 -20% | 74.1 -16% |
| Response Times | -300% | -36% | -50% | -73% | -78% | |
| Response Time Grey 50% / Grey 80% * | 4.8 ? | 28.6 ? -496% | 7.6 ? -58% | 9.6 ? -100% | 11.9 ? -148% | 12.5 ? -160% |
| Response Time Black / White * | 9.2 ? | 18.7 ? -103% | 10.4 ? -13% | 9.2 ? -0% | 8.9 ? 3% | 8.7 ? 5% |
| PWM Frequency | ||||||
| Screen | -76% | -22% | 3% | 12% | 21% | |
| Brightness middle | 518 | 287 -45% | 369 -29% | 635 23% | 384 -26% | 526 2% |
| Brightness | 491 | 288 -41% | 344 -30% | 604 23% | 366 -25% | 500 2% |
| Brightness Distribution | 90 | 86 -4% | 89 -1% | 91 1% | 91 1% | 87 -3% |
| Black Level * | 0.36 | 0.19 47% | 0.26 28% | 0.64 -78% | 0.35 3% | 0.33 8% |
| Contrast | 1439 | 1511 5% | 1419 -1% | 992 -31% | 1097 -24% | 1594 11% |
| Colorchecker dE 2000 * | 4.32 | 5.46 -26% | 3.04 30% | 1.89 56% | 0.97 78% | 1.2 72% |
| Colorchecker dE 2000 max. * | 6.37 | 20.36 -220% | 5.56 13% | 3.14 51% | 3.57 44% | 2.1 67% |
| Colorchecker dE 2000 calibrated * | 0.75 | 3.52 -369% | 2.35 -213% | 1.14 -52% | 0.77 -3% | 1 -33% |
| Greyscale dE 2000 * | 3.66 | 4.8 -31% | 3.38 8% | 2.53 31% | 1.5 59% | 1.3 64% |
| Gamma | 2.19 100% | 2.108 104% | 2.47 89% | 2.36 93% | 2.24 98% | 2.23 99% |
| CCT | 6841 95% | 6442 101% | 6040 108% | 6434 101% | 6709 97% | 6391 102% |
| Total Average (Program / Settings) | -142% /
-102% | -25% /
-23% | -20% /
-8% | -26% /
-6% | -24% /
-1% |
* ... smaller is better
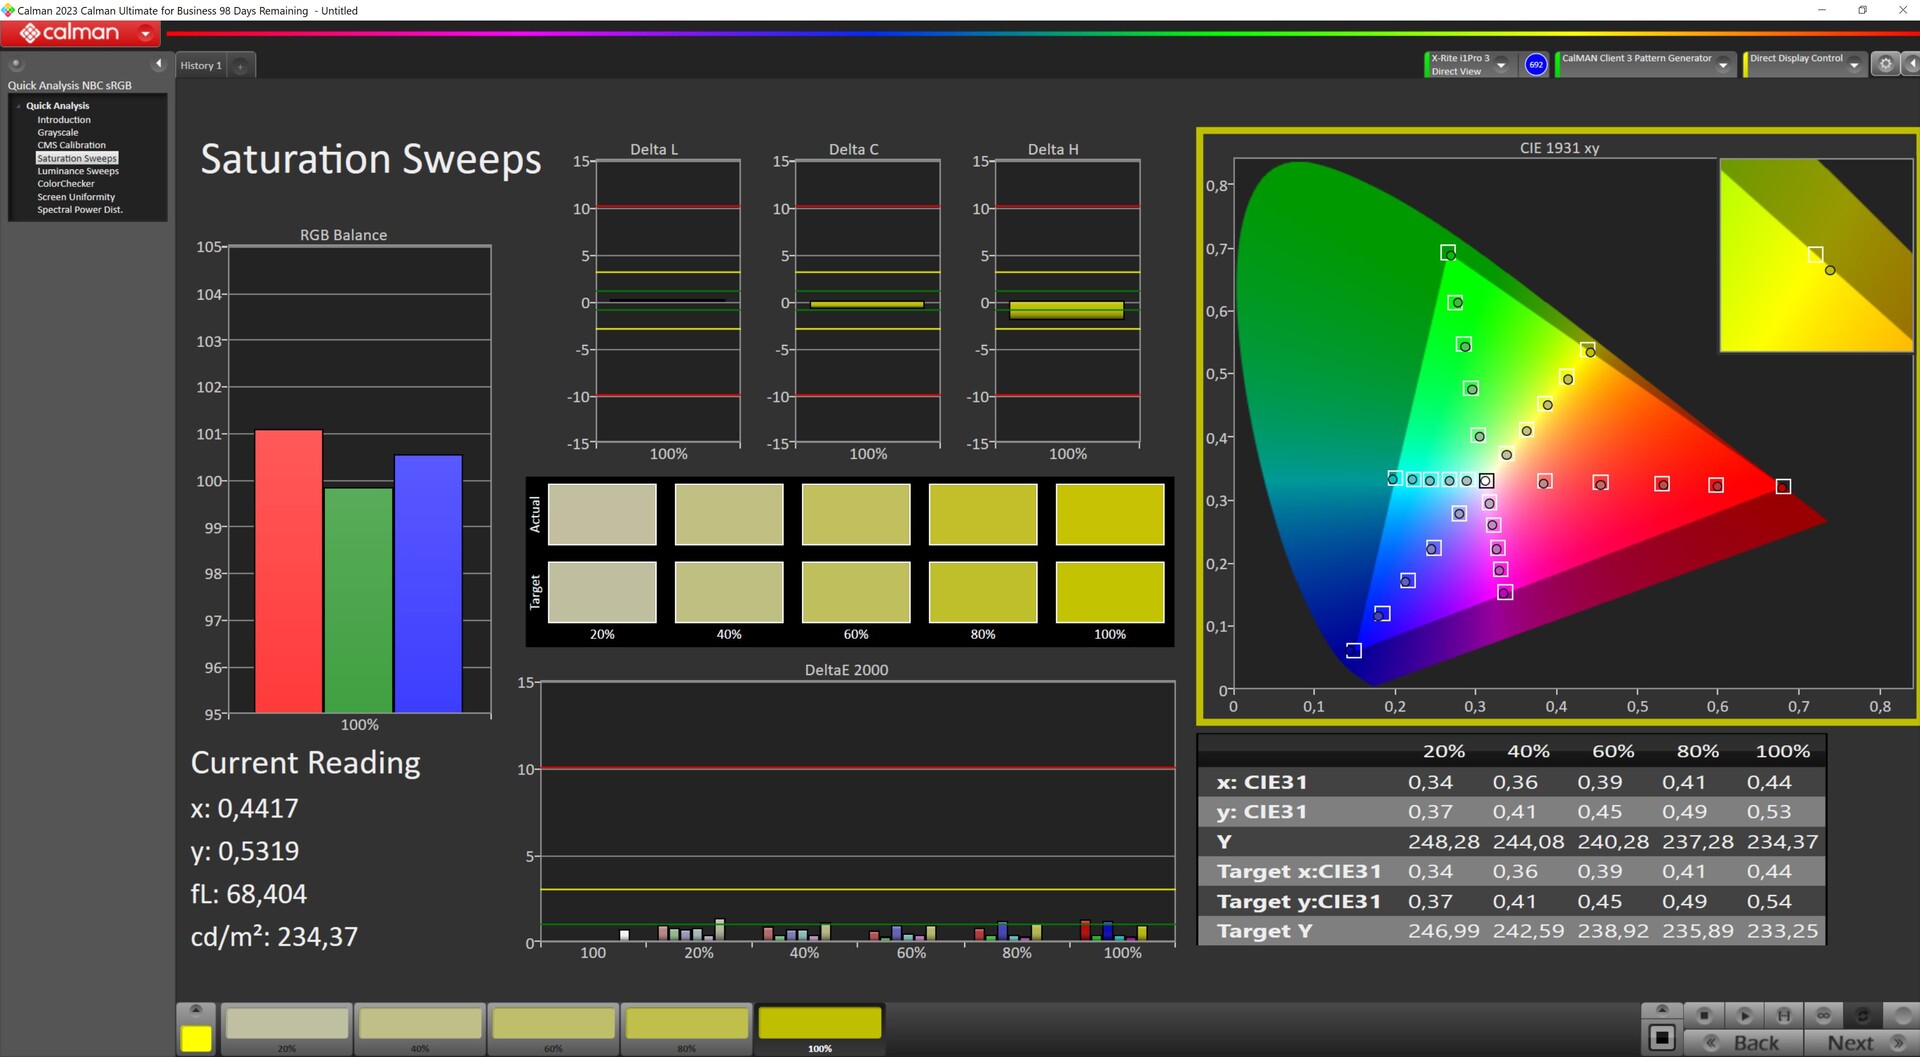
sRGB 和 Display P3 几乎完全覆盖,AdobeRGB 的覆盖率接近 88%。

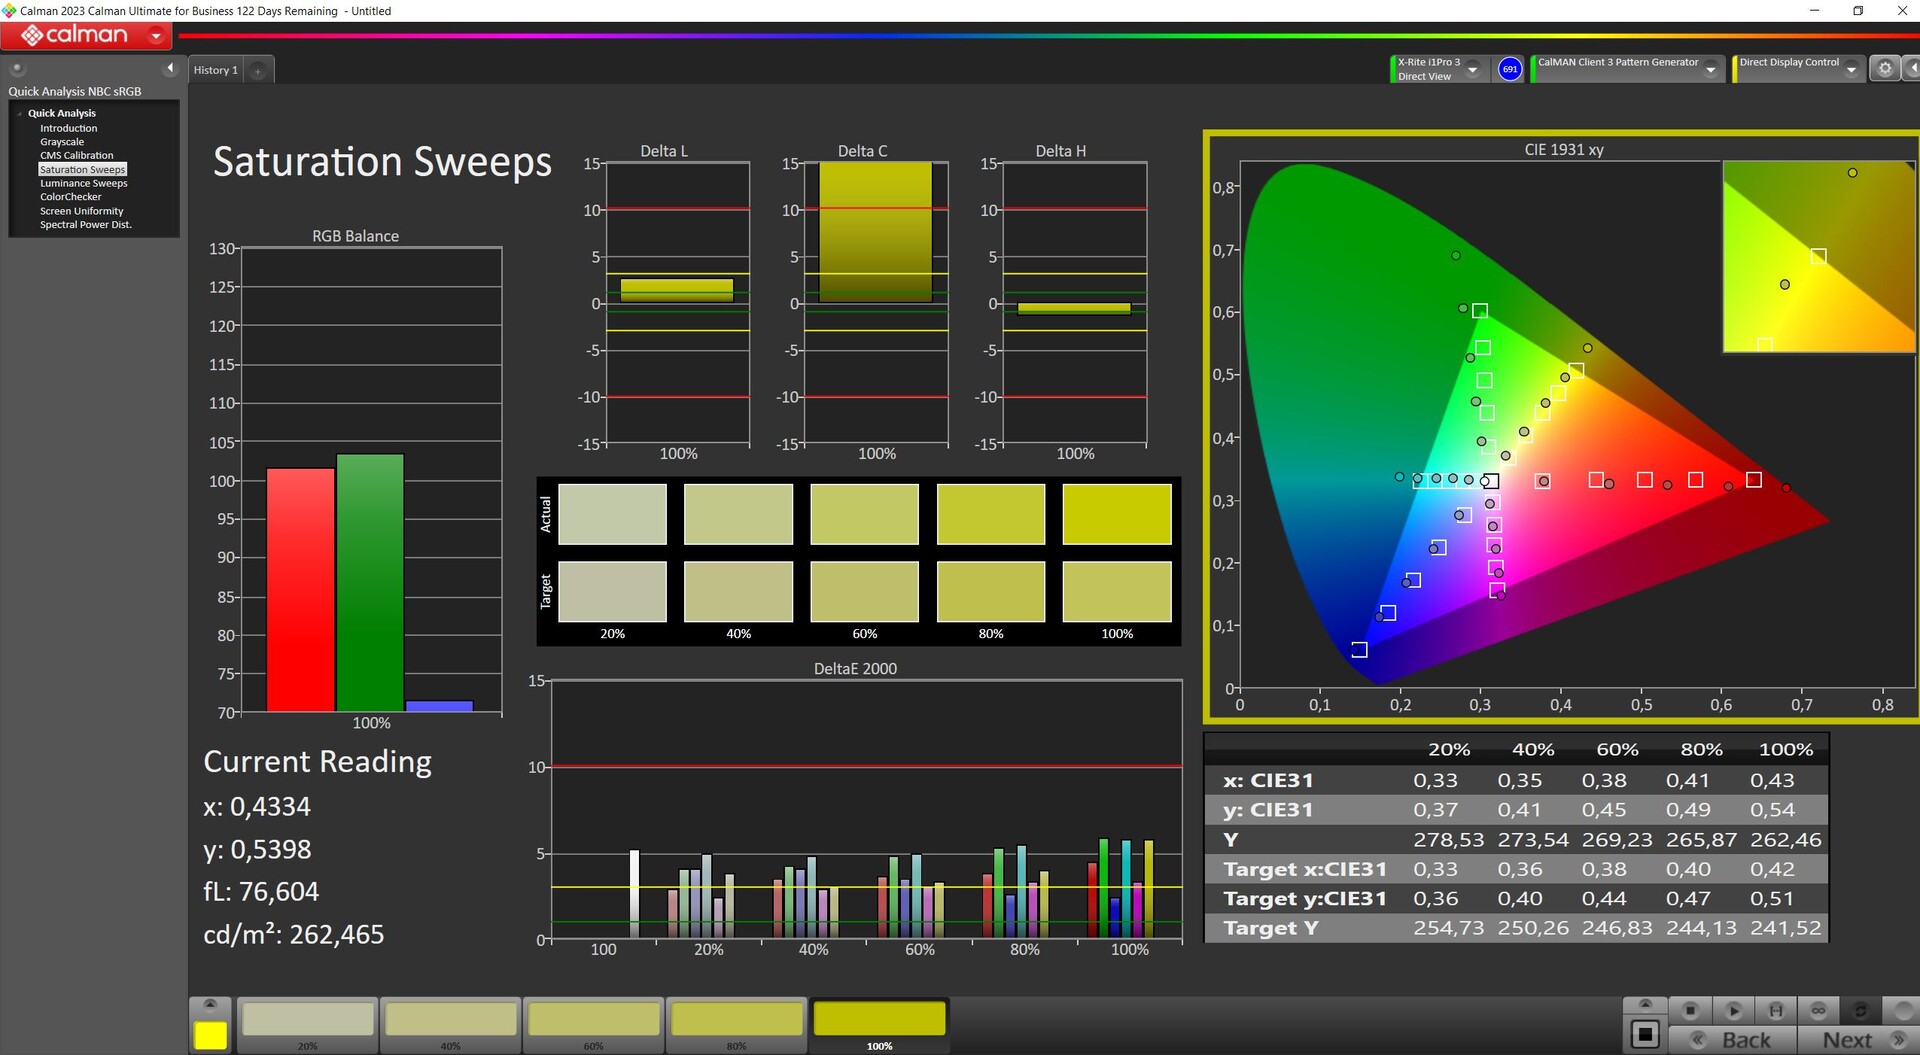
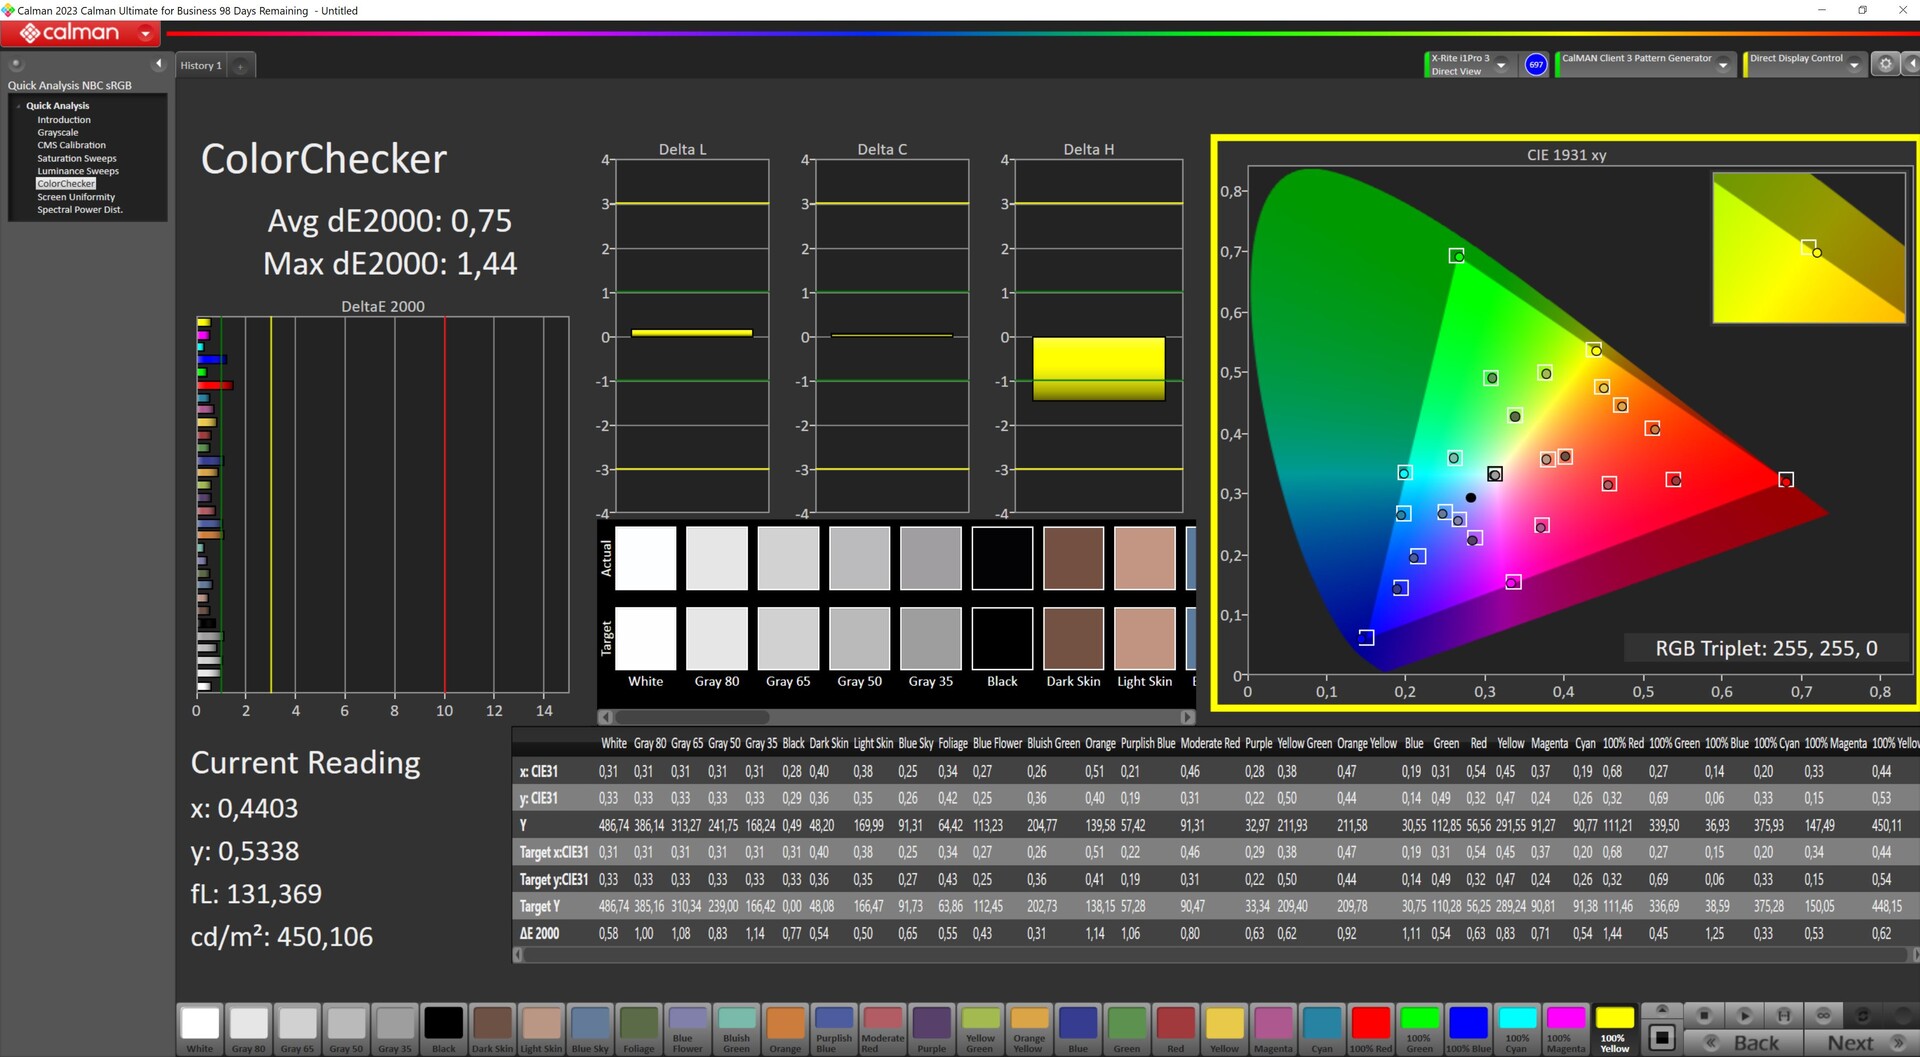
开箱后,屏幕并没有完全校准到最佳状态。我们自己使用 X-Rite i1Pro 色彩测量设备和 Calman 软件进行了校准,将其灰度和色彩 DeltaE 值降至 1 以下。
Display Response Times
| ↔ Response Time Black to White | ||
|---|---|---|
| 9.2 ms ... rise ↗ and fall ↘ combined | ↗ 4.6 ms rise | 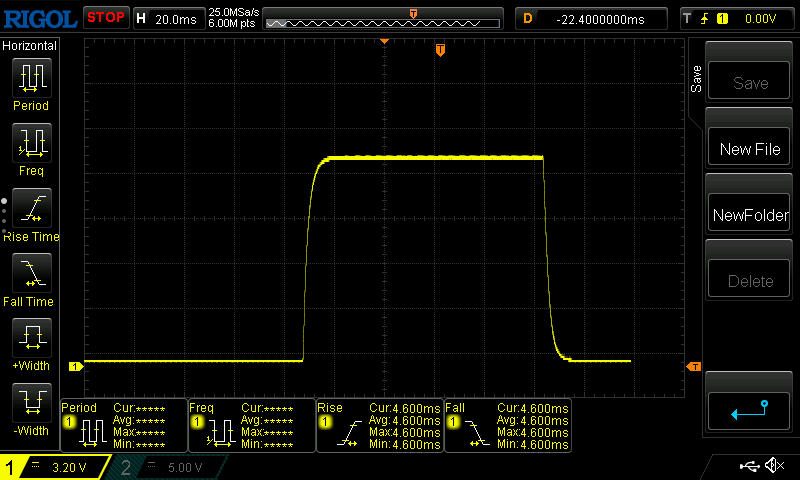 |
| ↘ 4.6 ms fall | ||
| The screen shows fast response rates in our tests and should be suited for gaming. In comparison, all tested devices range from 0.1 (minimum) to 240 (maximum) ms. » 23 % of all devices are better. This means that the measured response time is better than the average of all tested devices (20.8 ms). | ||
| ↔ Response Time 50% Grey to 80% Grey | ||
| 4.8 ms ... rise ↗ and fall ↘ combined | ↗ 2.2 ms rise | 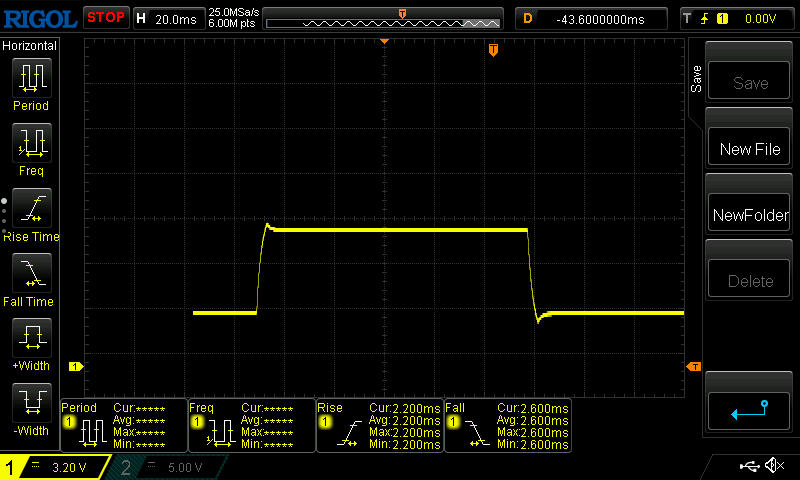 |
| ↘ 2.6 ms fall | ||
| The screen shows very fast response rates in our tests and should be very well suited for fast-paced gaming. In comparison, all tested devices range from 0.165 (minimum) to 636 (maximum) ms. » 14 % of all devices are better. This means that the measured response time is better than the average of all tested devices (32.5 ms). | ||
Screen Flickering / PWM (Pulse-Width Modulation)
| Screen flickering / PWM not detected |  | ||
In comparison: 53 % of all tested devices do not use PWM to dim the display. If PWM was detected, an average of 8516 (minimum: 5 - maximum: 343500) Hz was measured. | |||
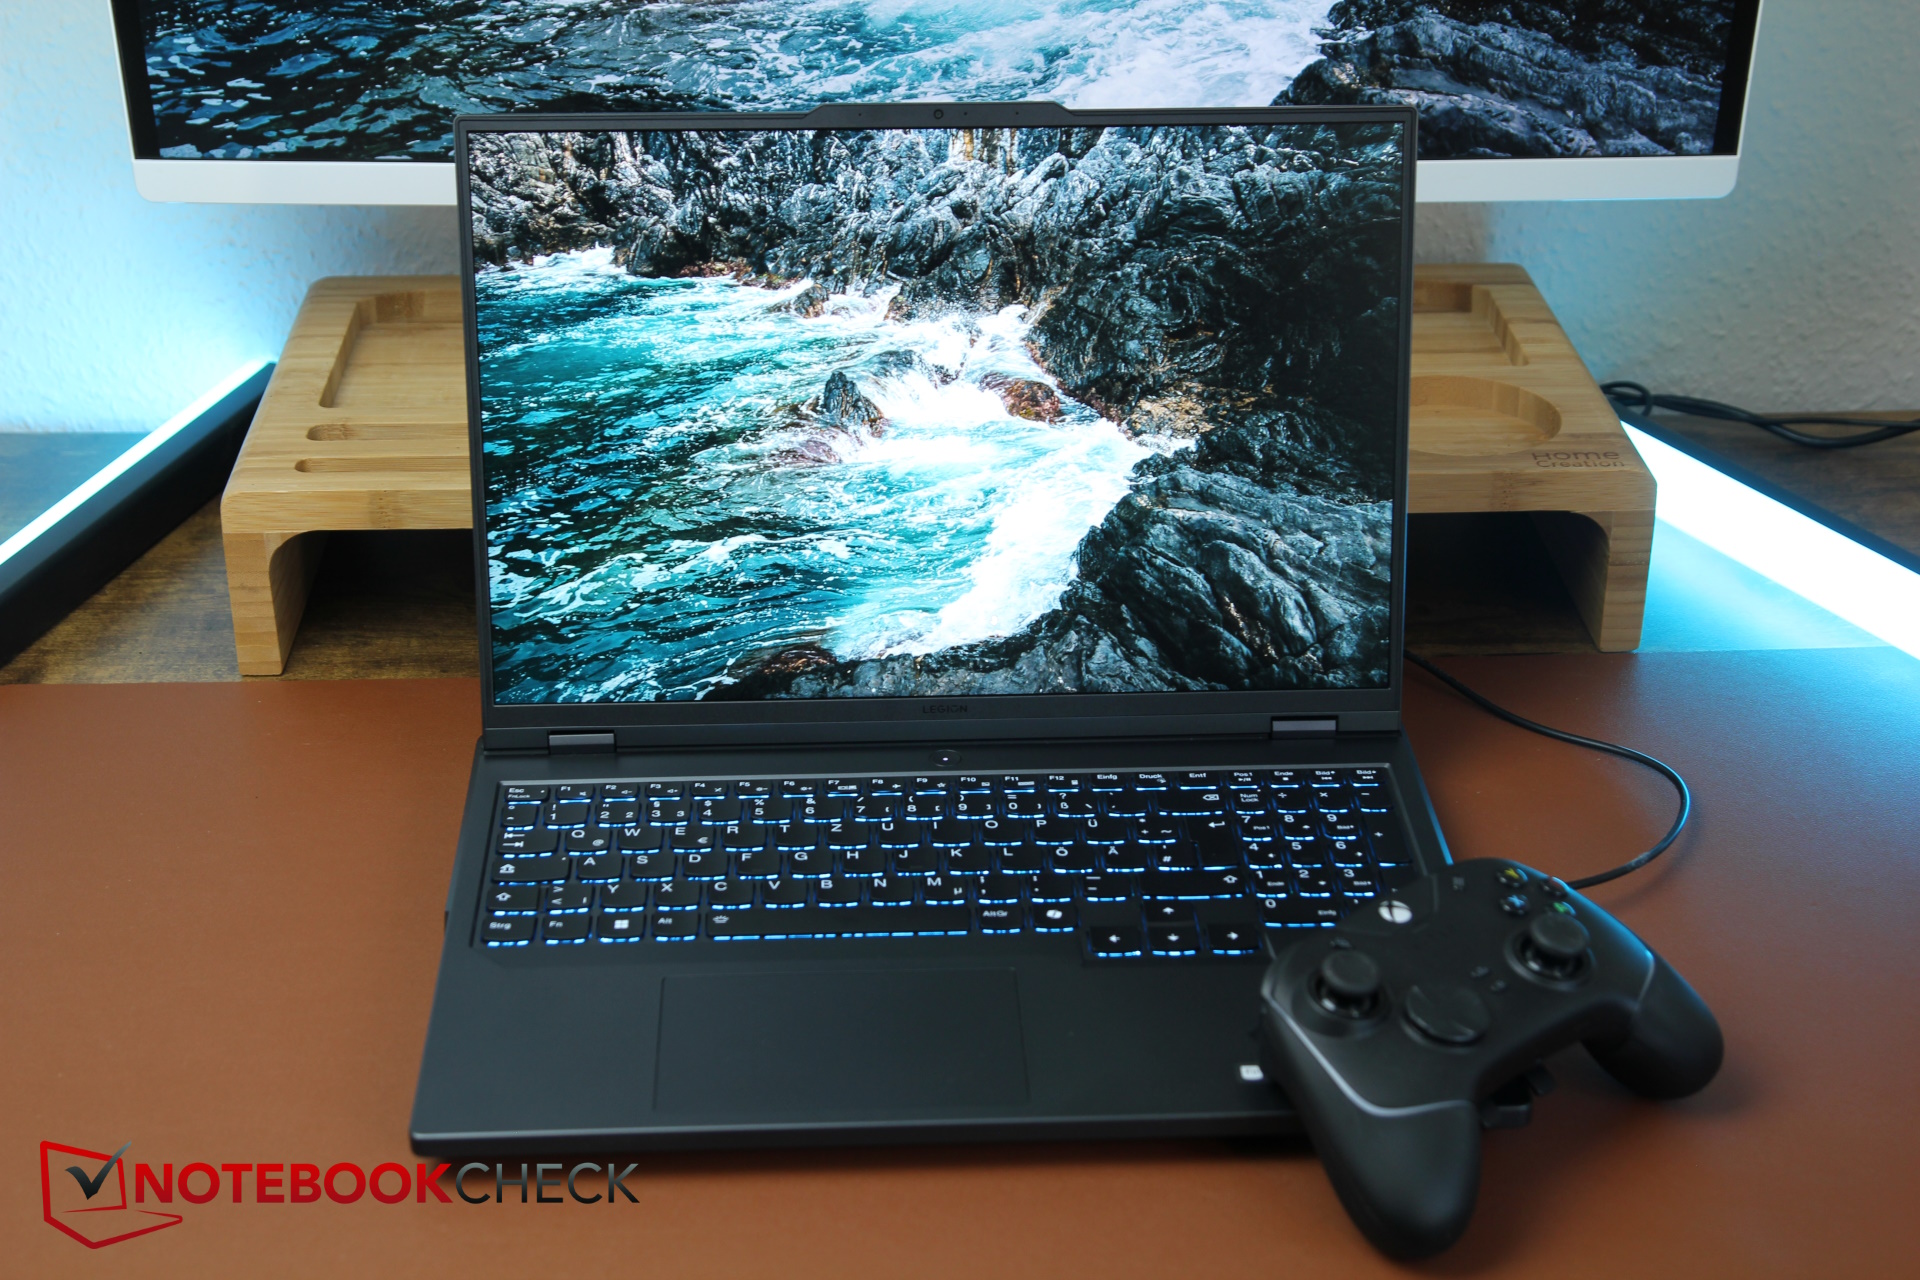
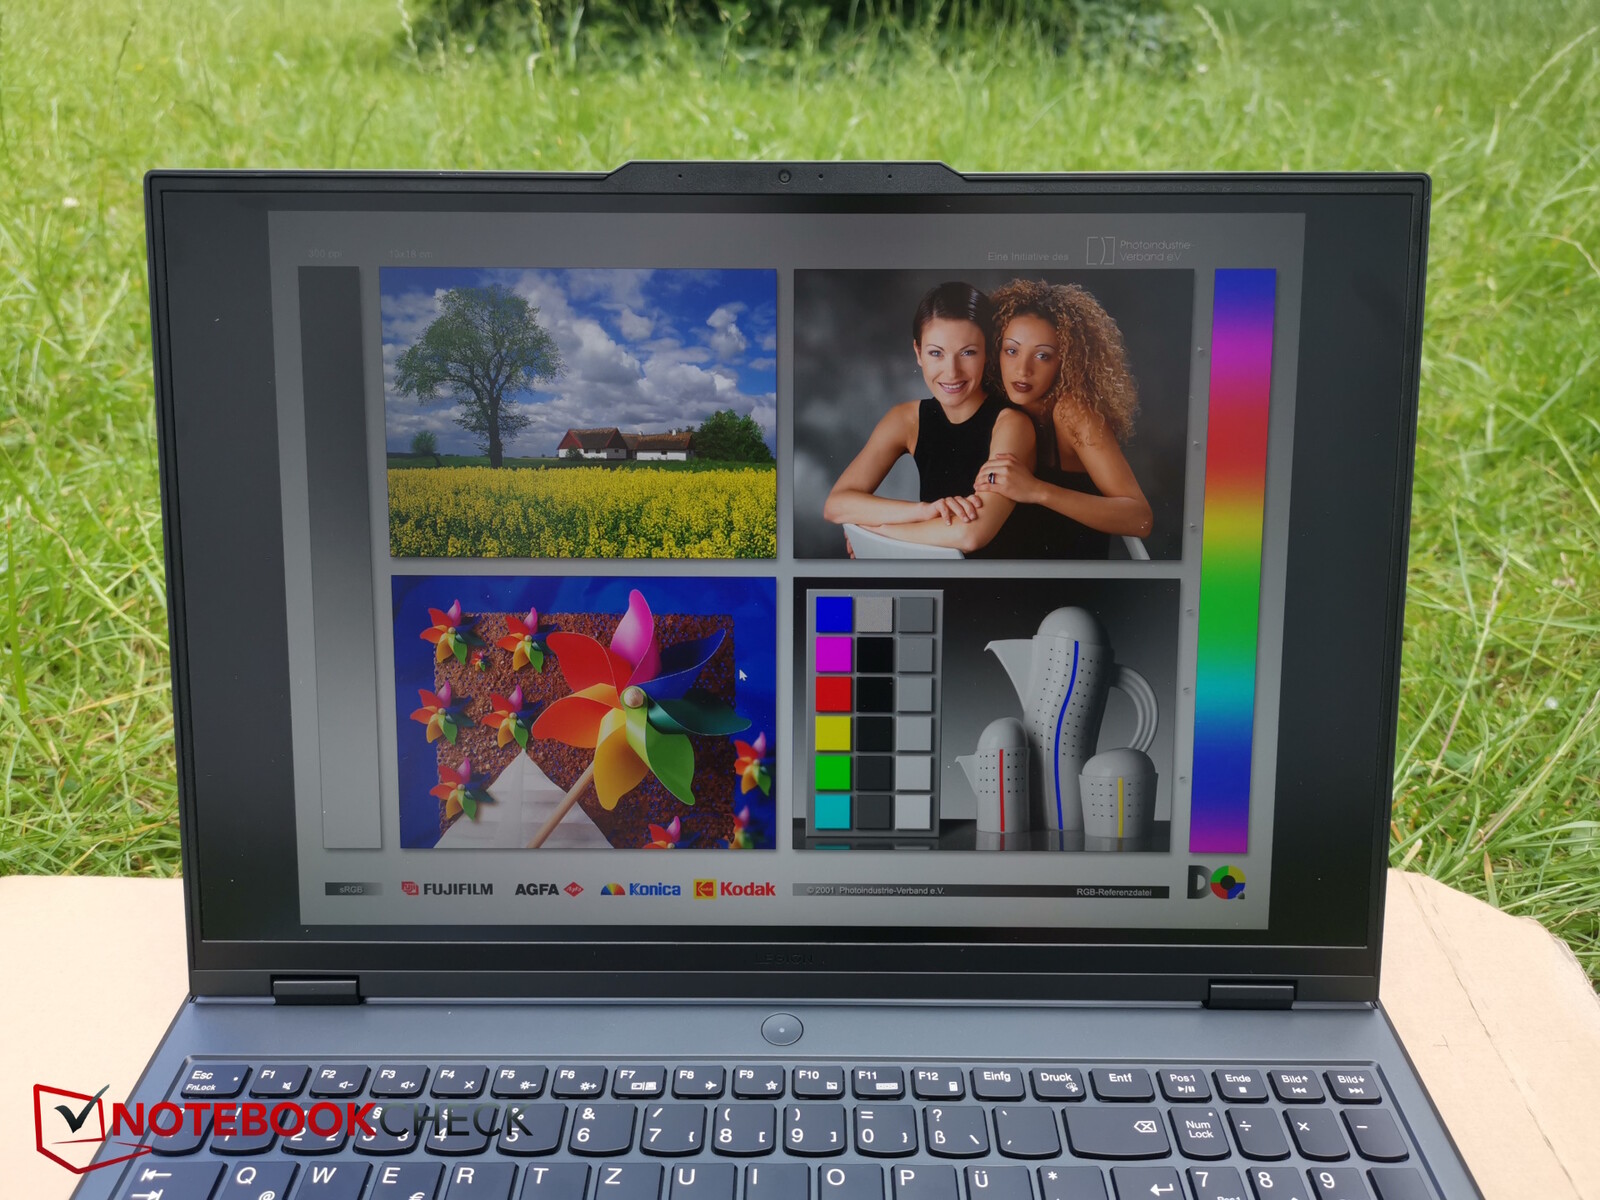
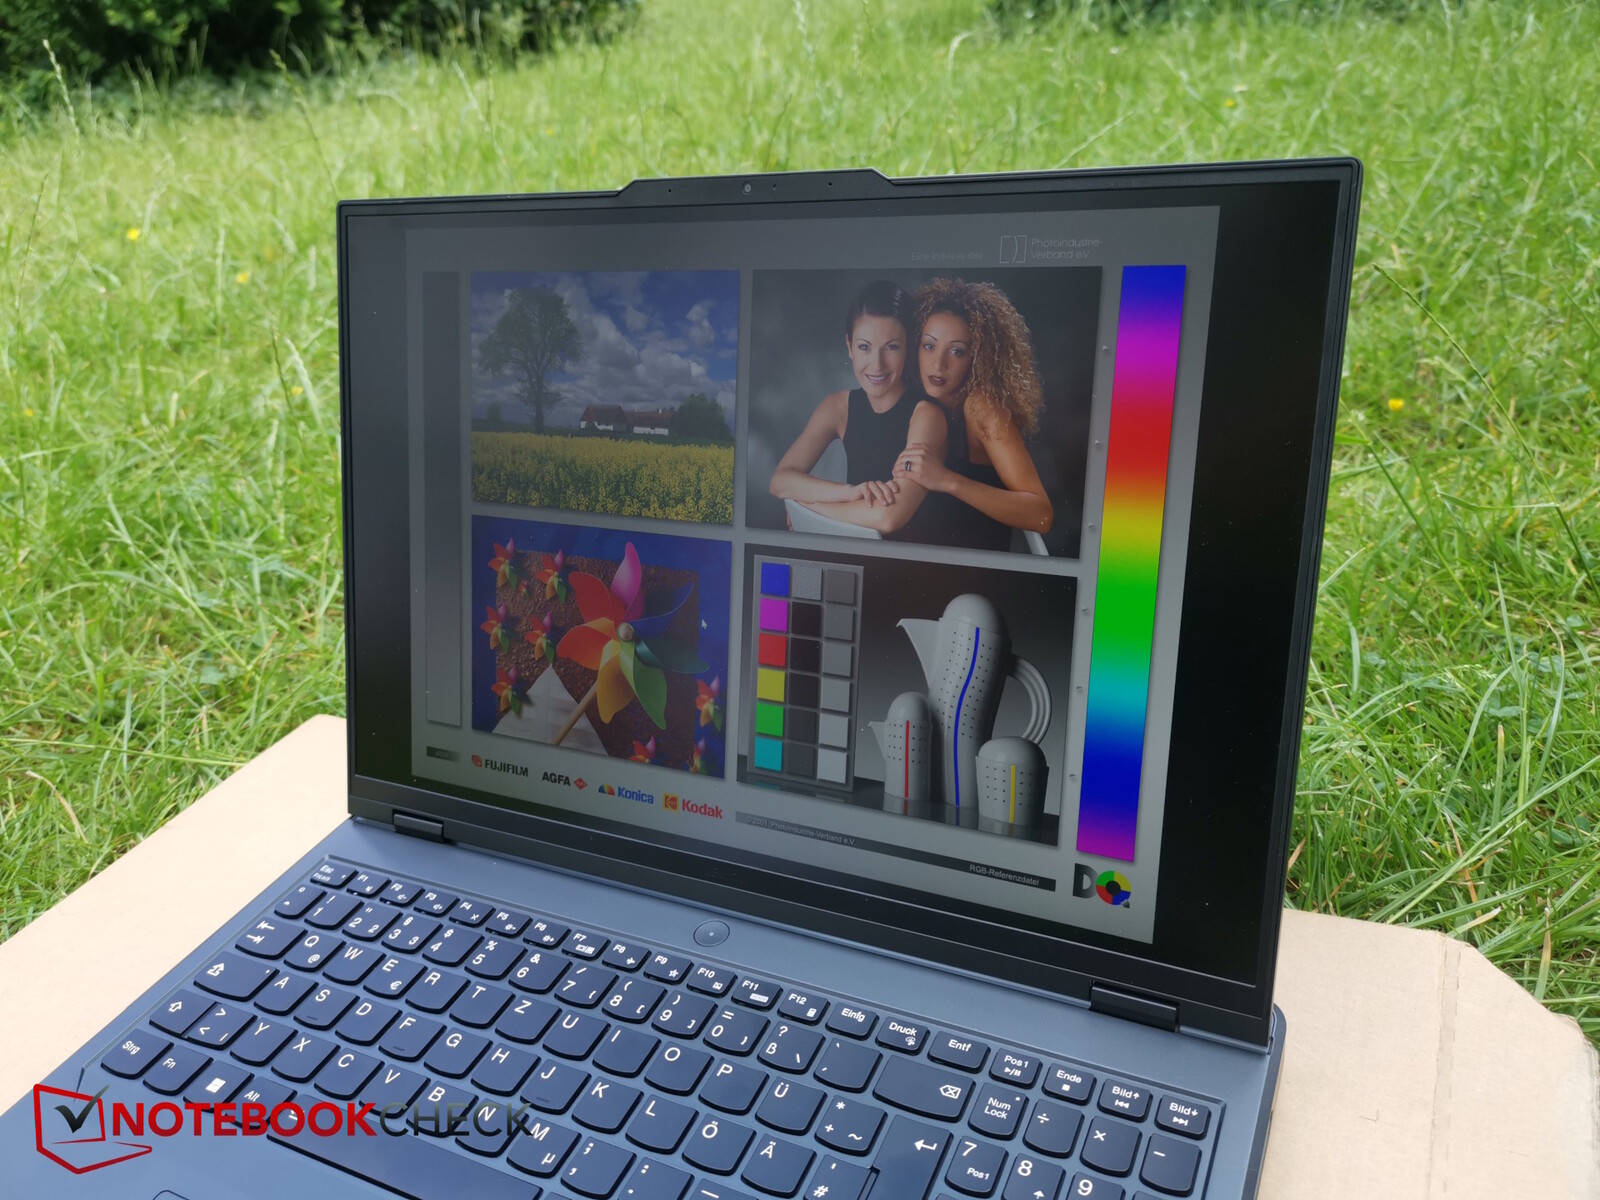
由于屏幕亮度相当高,接近 500 尼特,而且还采用了磨砂表面,因此可以减少大部分反光,只要直视屏幕并避免阳光直射,就能很好地在户外使用笔记本电脑。
性能 - Pro 5i 出色的 CPU 和游戏性能
与Legion Pro 5i 的高端组件相比 i9 14900HX和 RTX 4070相比,目前的测试设备配备了 i7 14700HX和 RTX 4060.这意味着这款笔记本电脑属于中端游戏玩家。
由于Legion 的显示屏色彩相对准确、明亮,它可能也会受到不少创作者的青睐--尽管它的设计可以做得更精致一些。
测试条件
联想 Vantage 软件是Legion Pro 5i 的控制中心。除了性能配置文件外,还可以在这里找到各种其他设置--从键盘照明和电源到 MUX 开关和系统更新。
有三种预设性能配置文件可供选择(性能、平衡、安静)--在平衡模式下还可以添加人工智能引擎,另外还有一种自定义模式,可以手动设置各种参数。
我们在基准测试中使用了不超频 GPU 的性能模式。安静模式用于电池测试。有时,我们会额外提供其他性能模式的测量值。


处理器
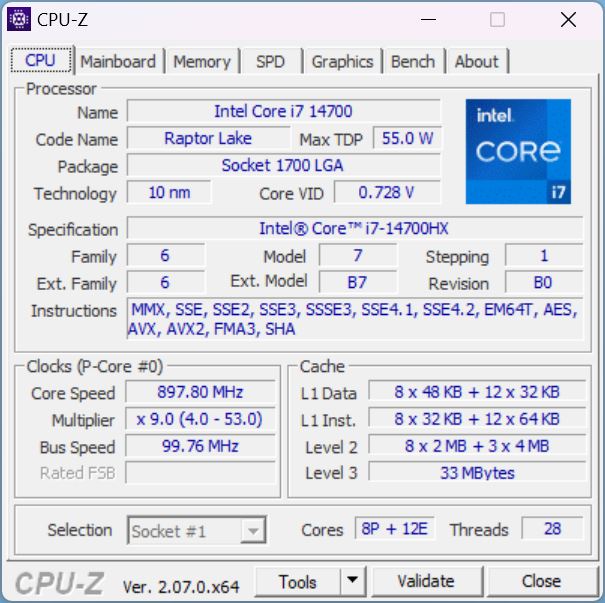
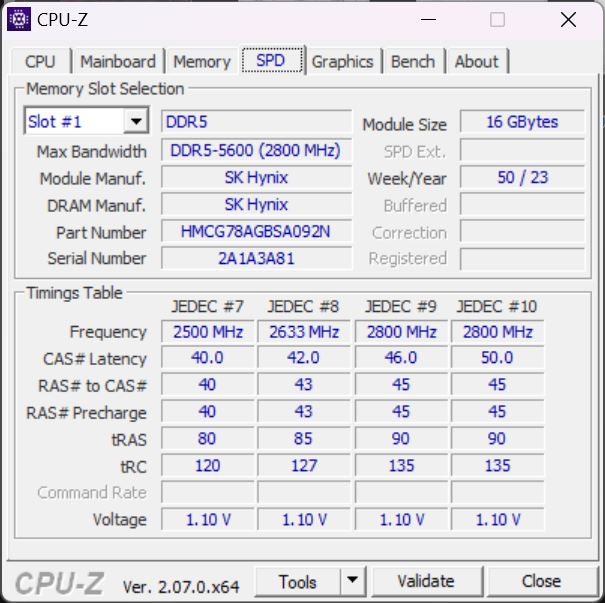
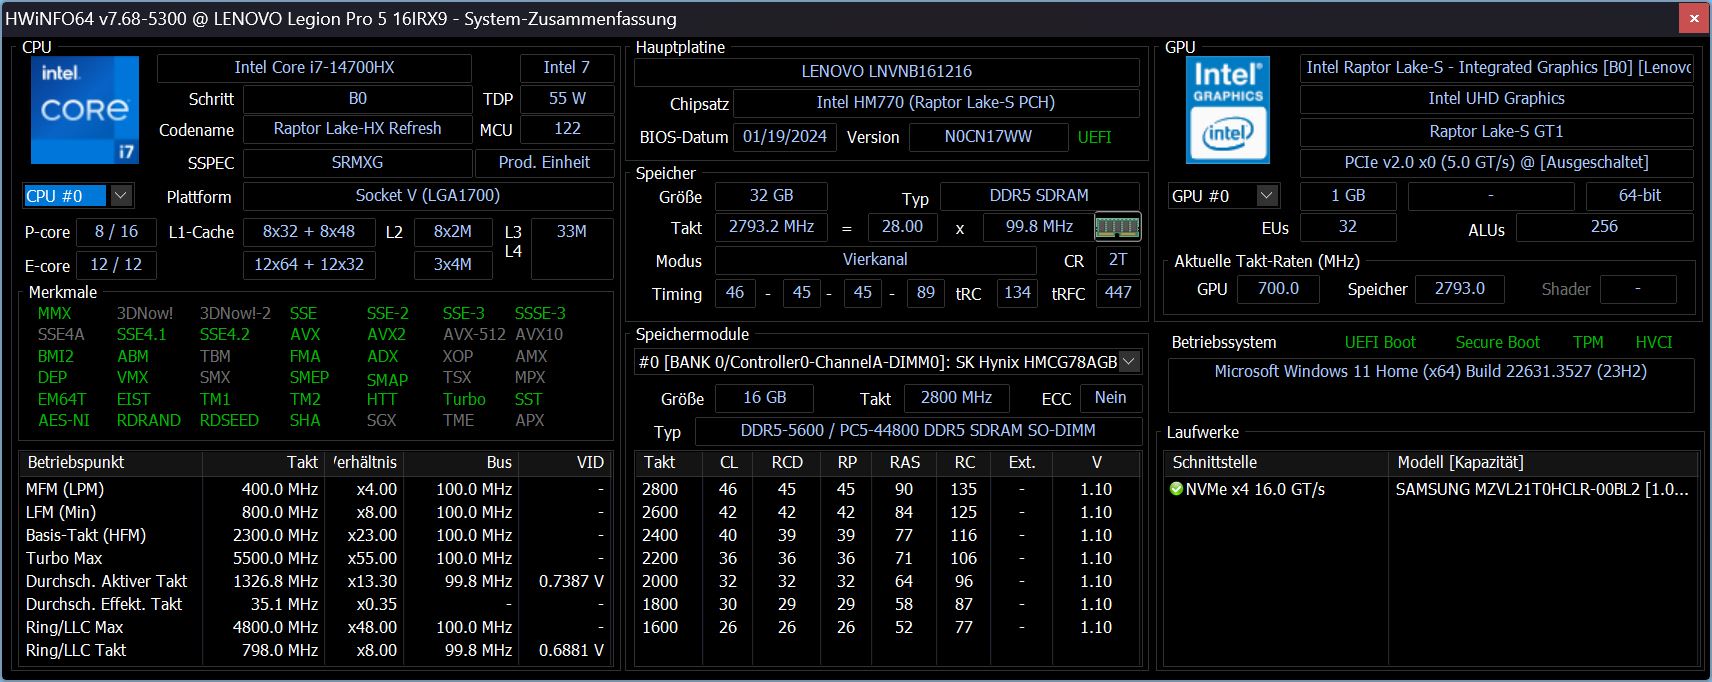
英特尔 英特尔酷睿 i7-14700HX是一款基于全新 Raptor Lake HX Refresh 系列的高端 CPU。该处理器包含 8 个 P 核心和 12 个 E 核心,由于采用了超线程技术,可以同时处理 28 个线程。
在我们的循环测试中,CPU 的性能表现非常稳定,在 30 分钟的时间里性能损失极小。它的性能超过了大多数竞争对手,只有Legion Pro 5i 配备了 i9-14900HX
不过,在所有基准测试中,我们的Legion Pro 5i 处理器都表现出色,令人印象深刻。它比我们数据库中 i7-14700HX 的平均水平高出 9%,仅比 i9-14900HX 低 5%。
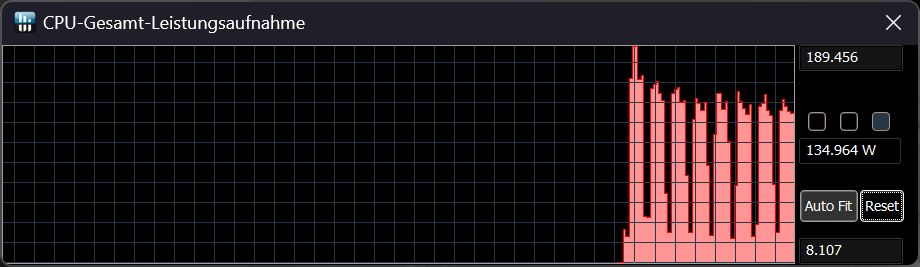
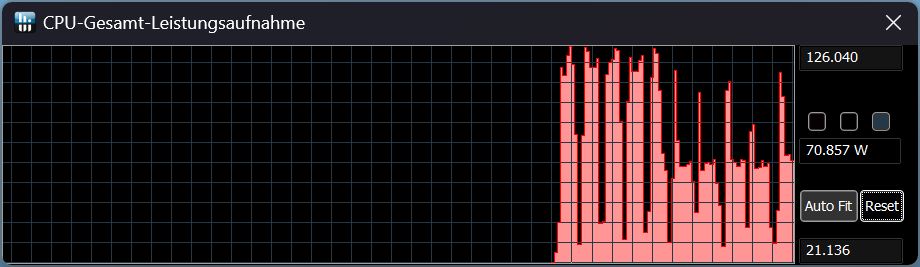
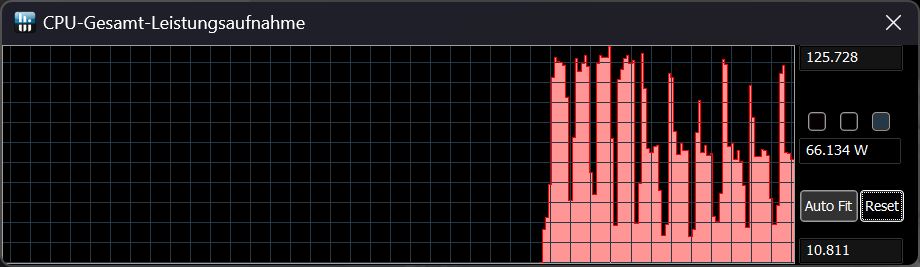
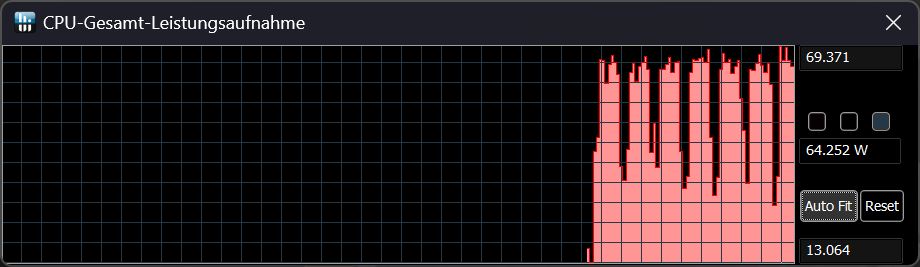
断开电源后,在运行 Cinebench R15 Multi 时,CPU 性能下降了约 44%。下表显示了 Cinebench R15 Multi 分数和 TDP(取决于性能配置文件),右侧是相应模式下的 TDP 曲线。
| 性能模式/测量值 | Cinebench R 15 Multi score | TDP |
|---|---|---|
| 性能 | 4137 | 190 - 130 |
| 带人工智能的平衡 | 3650 | 125 - 70 |
| 不带人工智能的平衡型 | 3367 | 125 - 65 |
| 静音 | 2640 | 70 - 65 |
| 电池 | 2302 | 56 - 45 |
Cinebench R15 Multi continuous test
Cinebench R23: Multi Core | Single Core
Cinebench R20: CPU (Multi Core) | CPU (Single Core)
Cinebench R15: CPU Multi 64Bit | CPU Single 64Bit
Blender: v2.79 BMW27 CPU
7-Zip 18.03: 7z b 4 | 7z b 4 -mmt1
Geekbench 6.4: Multi-Core | Single-Core
Geekbench 5.5: Multi-Core | Single-Core
HWBOT x265 Benchmark v2.2: 4k Preset
LibreOffice : 20 Documents To PDF
R Benchmark 2.5: Overall mean
| CPU Performance Rating | |
| Lenovo Legion Pro 5 16IRX9 | |
| Lenovo Legion Pro 5 16IRX9 G9 | |
| Lenovo Legion 5 16IRX G9 | |
| Average Intel Core i7-14700HX | |
| Average of class Gaming | |
| HP Victus 16 (2024) | |
| SCHENKER XMG Core 15 (M24) | |
| Dell G16, i7-13650HX, RTX 4060 | |
| Cinebench R23 / Multi Core | |
| Lenovo Legion Pro 5 16IRX9 | |
| Lenovo Legion Pro 5 16IRX9 G9 | |
| Average Intel Core i7-14700HX (22313 - 28122, n=7) | |
| Lenovo Legion 5 16IRX G9 | |
| HP Victus 16 (2024) | |
| Average of class Gaming (5668 - 39652, n=151, last 2 years) | |
| Dell G16, i7-13650HX, RTX 4060 | |
| SCHENKER XMG Core 15 (M24) | |
| Cinebench R23 / Single Core | |
| Lenovo Legion Pro 5 16IRX9 G9 | |
| Lenovo Legion Pro 5 16IRX9 | |
| Average Intel Core i7-14700HX (1702 - 2144, n=7) | |
| Lenovo Legion 5 16IRX G9 | |
| Dell G16, i7-13650HX, RTX 4060 | |
| Average of class Gaming (1136 - 2252, n=151, last 2 years) | |
| SCHENKER XMG Core 15 (M24) | |
| HP Victus 16 (2024) | |
| Cinebench R20 / CPU (Multi Core) | |
| Lenovo Legion Pro 5 16IRX9 | |
| Lenovo Legion Pro 5 16IRX9 G9 | |
| Lenovo Legion 5 16IRX G9 | |
| HP Victus 16 (2024) | |
| Average Intel Core i7-14700HX (8361 - 10498, n=7) | |
| Average of class Gaming (2179 - 15517, n=151, last 2 years) | |
| Dell G16, i7-13650HX, RTX 4060 | |
| SCHENKER XMG Core 15 (M24) | |
| Cinebench R20 / CPU (Single Core) | |
| Lenovo Legion Pro 5 16IRX9 G9 | |
| Lenovo Legion Pro 5 16IRX9 | |
| Average Intel Core i7-14700HX (651 - 821, n=7) | |
| Lenovo Legion 5 16IRX G9 | |
| Average of class Gaming (439 - 866, n=151, last 2 years) | |
| Dell G16, i7-13650HX, RTX 4060 | |
| SCHENKER XMG Core 15 (M24) | |
| HP Victus 16 (2024) | |
| Cinebench R15 / CPU Multi 64Bit | |
| Lenovo Legion Pro 5 16IRX9 | |
| Lenovo Legion Pro 5 16IRX9 G9 | |
| HP Victus 16 (2024) | |
| Lenovo Legion 5 16IRX G9 | |
| Average Intel Core i7-14700HX (3328 - 4137, n=7) | |
| Average of class Gaming (905 - 6074, n=154, last 2 years) | |
| Dell G16, i7-13650HX, RTX 4060 | |
| SCHENKER XMG Core 15 (M24) | |
| Cinebench R15 / CPU Single 64Bit | |
| Lenovo Legion Pro 5 16IRX9 G9 | |
| Lenovo Legion Pro 5 16IRX9 | |
| Lenovo Legion 5 16IRX G9 | |
| Average Intel Core i7-14700HX (238 - 304, n=7) | |
| SCHENKER XMG Core 15 (M24) | |
| Average of class Gaming (191.9 - 343, n=151, last 2 years) | |
| Dell G16, i7-13650HX, RTX 4060 | |
| HP Victus 16 (2024) | |
| Blender / v2.79 BMW27 CPU | |
| SCHENKER XMG Core 15 (M24) | |
| Average of class Gaming (81 - 555, n=144, last 2 years) | |
| HP Victus 16 (2024) | |
| Dell G16, i7-13650HX, RTX 4060 | |
| Average Intel Core i7-14700HX (126 - 184, n=7) | |
| Lenovo Legion 5 16IRX G9 | |
| Lenovo Legion Pro 5 16IRX9 G9 | |
| Lenovo Legion Pro 5 16IRX9 | |
| 7-Zip 18.03 / 7z b 4 | |
| Lenovo Legion Pro 5 16IRX9 | |
| Lenovo Legion Pro 5 16IRX9 G9 | |
| Average Intel Core i7-14700HX (84799 - 104730, n=7) | |
| Lenovo Legion 5 16IRX G9 | |
| HP Victus 16 (2024) | |
| Average of class Gaming (23795 - 144064, n=149, last 2 years) | |
| Dell G16, i7-13650HX, RTX 4060 | |
| SCHENKER XMG Core 15 (M24) | |
| 7-Zip 18.03 / 7z b 4 -mmt1 | |
| Lenovo Legion Pro 5 16IRX9 G9 | |
| Lenovo Legion Pro 5 16IRX9 | |
| Lenovo Legion 5 16IRX G9 | |
| Average Intel Core i7-14700HX (5641 - 7041, n=7) | |
| SCHENKER XMG Core 15 (M24) | |
| Average of class Gaming (4199 - 7573, n=149, last 2 years) | |
| Dell G16, i7-13650HX, RTX 4060 | |
| HP Victus 16 (2024) | |
| Geekbench 6.4 / Multi-Core | |
| Lenovo Legion Pro 5 16IRX9 | |
| Lenovo Legion Pro 5 16IRX9 G9 | |
| Average Intel Core i7-14700HX (14807 - 17562, n=7) | |
| Lenovo Legion 5 16IRX G9 | |
| HP Victus 16 (2024) | |
| Average of class Gaming (5340 - 21668, n=119, last 2 years) | |
| SCHENKER XMG Core 15 (M24) | |
| Dell G16, i7-13650HX, RTX 4060 | |
| Geekbench 6.4 / Single-Core | |
| Lenovo Legion Pro 5 16IRX9 | |
| Lenovo Legion Pro 5 16IRX9 G9 | |
| Average Intel Core i7-14700HX (2378 - 2975, n=7) | |
| Lenovo Legion 5 16IRX G9 | |
| SCHENKER XMG Core 15 (M24) | |
| Average of class Gaming (1490 - 3219, n=119, last 2 years) | |
| Dell G16, i7-13650HX, RTX 4060 | |
| HP Victus 16 (2024) | |
| Geekbench 5.5 / Multi-Core | |
| Lenovo Legion Pro 5 16IRX9 | |
| Lenovo Legion Pro 5 16IRX9 G9 | |
| Average Intel Core i7-14700HX (15705 - 19597, n=7) | |
| Lenovo Legion 5 16IRX G9 | |
| HP Victus 16 (2024) | |
| Average of class Gaming (4557 - 25855, n=148, last 2 years) | |
| SCHENKER XMG Core 15 (M24) | |
| Dell G16, i7-13650HX, RTX 4060 | |
| Geekbench 5.5 / Single-Core | |
| Lenovo Legion Pro 5 16IRX9 G9 | |
| Lenovo Legion Pro 5 16IRX9 | |
| Average Intel Core i7-14700HX (1700 - 2133, n=7) | |
| SCHENKER XMG Core 15 (M24) | |
| Lenovo Legion 5 16IRX G9 | |
| Average of class Gaming (986 - 2423, n=148, last 2 years) | |
| Dell G16, i7-13650HX, RTX 4060 | |
| HP Victus 16 (2024) | |
| HWBOT x265 Benchmark v2.2 / 4k Preset | |
| Lenovo Legion Pro 5 16IRX9 | |
| Lenovo Legion Pro 5 16IRX9 G9 | |
| Lenovo Legion 5 16IRX G9 | |
| Average Intel Core i7-14700HX (22 - 27.4, n=7) | |
| Average of class Gaming (6.72 - 42.9, n=148, last 2 years) | |
| SCHENKER XMG Core 15 (M24) | |
| HP Victus 16 (2024) | |
| Dell G16, i7-13650HX, RTX 4060 | |
| LibreOffice / 20 Documents To PDF | |
| HP Victus 16 (2024) | |
| Dell G16, i7-13650HX, RTX 4060 | |
| Lenovo Legion Pro 5 16IRX9 G9 | |
| SCHENKER XMG Core 15 (M24) | |
| Average of class Gaming (19 - 96.6, n=147, last 2 years) | |
| Average Intel Core i7-14700HX (41.9 - 55.3, n=7) | |
| Lenovo Legion 5 16IRX G9 | |
| Lenovo Legion Pro 5 16IRX9 | |
| R Benchmark 2.5 / Overall mean | |
| HP Victus 16 (2024) | |
| Average of class Gaming (0.3609 - 0.759, n=150, last 2 years) | |
| SCHENKER XMG Core 15 (M24) | |
| Dell G16, i7-13650HX, RTX 4060 | |
| Dell G16, i7-13650HX, RTX 4060 | |
| Lenovo Legion 5 16IRX G9 | |
| Average Intel Core i7-14700HX (0.3821 - 0.4896, n=7) | |
| Lenovo Legion Pro 5 16IRX9 G9 | |
| Lenovo Legion Pro 5 16IRX9 | |
* ... smaller is better
AIDA64: FP32 Ray-Trace | FPU Julia | CPU SHA3 | CPU Queen | FPU SinJulia | FPU Mandel | CPU AES | CPU ZLib | FP64 Ray-Trace | CPU PhotoWorxx
| Performance Rating | |
| Lenovo Legion Pro 5 16IRX9 | |
| Lenovo Legion Pro 5 16IRX9 G9 | |
| SCHENKER XMG Core 15 (M24) | |
| Average Intel Core i7-14700HX | |
| Average of class Gaming | |
| Lenovo Legion 5 16IRX G9 | |
| Dell G16, i7-13650HX, RTX 4060 | |
| HP Victus 16 (2024) | |
| AIDA64 / FP32 Ray-Trace | |
| SCHENKER XMG Core 15 (M24) | |
| Lenovo Legion Pro 5 16IRX9 | |
| Lenovo Legion Pro 5 16IRX9 G9 | |
| Average of class Gaming (4986 - 81639, n=147, last 2 years) | |
| Average Intel Core i7-14700HX (16932 - 23676, n=7) | |
| Lenovo Legion 5 16IRX G9 | |
| Dell G16, i7-13650HX, RTX 4060 | |
| HP Victus 16 (2024) | |
| AIDA64 / FPU Julia | |
| Lenovo Legion Pro 5 16IRX9 | |
| SCHENKER XMG Core 15 (M24) | |
| Lenovo Legion Pro 5 16IRX9 G9 | |
| Average Intel Core i7-14700HX (86338 - 116556, n=7) | |
| Average of class Gaming (25360 - 252486, n=147, last 2 years) | |
| Lenovo Legion 5 16IRX G9 | |
| Dell G16, i7-13650HX, RTX 4060 | |
| HP Victus 16 (2024) | |
| AIDA64 / CPU SHA3 | |
| Lenovo Legion Pro 5 16IRX9 | |
| Lenovo Legion Pro 5 16IRX9 G9 | |
| SCHENKER XMG Core 15 (M24) | |
| Average Intel Core i7-14700HX (4008 - 5567, n=7) | |
| Average of class Gaming (1339 - 10389, n=147, last 2 years) | |
| Dell G16, i7-13650HX, RTX 4060 | |
| Lenovo Legion 5 16IRX G9 | |
| HP Victus 16 (2024) | |
| AIDA64 / CPU Queen | |
| Lenovo Legion Pro 5 16IRX9 G9 | |
| Lenovo Legion Pro 5 16IRX9 | |
| Average Intel Core i7-14700HX (129836 - 152200, n=7) | |
| HP Victus 16 (2024) | |
| SCHENKER XMG Core 15 (M24) | |
| Average of class Gaming (50699 - 200651, n=147, last 2 years) | |
| Dell G16, i7-13650HX, RTX 4060 | |
| Lenovo Legion 5 16IRX G9 | |
| AIDA64 / FPU SinJulia | |
| SCHENKER XMG Core 15 (M24) | |
| Lenovo Legion Pro 5 16IRX9 | |
| Lenovo Legion Pro 5 16IRX9 G9 | |
| Average Intel Core i7-14700HX (11704 - 14434, n=7) | |
| Average of class Gaming (4800 - 32988, n=147, last 2 years) | |
| Lenovo Legion 5 16IRX G9 | |
| HP Victus 16 (2024) | |
| Dell G16, i7-13650HX, RTX 4060 | |
| AIDA64 / FPU Mandel | |
| SCHENKER XMG Core 15 (M24) | |
| Lenovo Legion Pro 5 16IRX9 | |
| Lenovo Legion Pro 5 16IRX9 G9 | |
| Average of class Gaming (12321 - 134044, n=147, last 2 years) | |
| Average Intel Core i7-14700HX (42125 - 58380, n=7) | |
| Lenovo Legion 5 16IRX G9 | |
| Dell G16, i7-13650HX, RTX 4060 | |
| HP Victus 16 (2024) | |
| AIDA64 / CPU AES | |
| Lenovo Legion Pro 5 16IRX9 | |
| Lenovo Legion Pro 5 16IRX9 G9 | |
| Average of class Gaming (19065 - 328679, n=147, last 2 years) | |
| Average Intel Core i7-14700HX (82161 - 113157, n=7) | |
| SCHENKER XMG Core 15 (M24) | |
| Lenovo Legion 5 16IRX G9 | |
| Dell G16, i7-13650HX, RTX 4060 | |
| HP Victus 16 (2024) | |
| AIDA64 / CPU ZLib | |
| Lenovo Legion Pro 5 16IRX9 | |
| Lenovo Legion Pro 5 16IRX9 G9 | |
| Average Intel Core i7-14700HX (1177 - 1682, n=7) | |
| Average of class Gaming (373 - 2531, n=147, last 2 years) | |
| Lenovo Legion 5 16IRX G9 | |
| Dell G16, i7-13650HX, RTX 4060 | |
| HP Victus 16 (2024) | |
| SCHENKER XMG Core 15 (M24) | |
| AIDA64 / FP64 Ray-Trace | |
| SCHENKER XMG Core 15 (M24) | |
| Lenovo Legion Pro 5 16IRX9 | |
| Lenovo Legion Pro 5 16IRX9 G9 | |
| Average of class Gaming (2540 - 43430, n=147, last 2 years) | |
| Average Intel Core i7-14700HX (9029 - 12928, n=7) | |
| Dell G16, i7-13650HX, RTX 4060 | |
| Lenovo Legion 5 16IRX G9 | |
| HP Victus 16 (2024) | |
| AIDA64 / CPU PhotoWorxx | |
| Lenovo Legion Pro 5 16IRX9 | |
| Lenovo Legion Pro 5 16IRX9 G9 | |
| Average Intel Core i7-14700HX (39151 - 49671, n=7) | |
| SCHENKER XMG Core 15 (M24) | |
| Average of class Gaming (10805 - 60161, n=147, last 2 years) | |
| HP Victus 16 (2024) | |
| Dell G16, i7-13650HX, RTX 4060 | |
| Lenovo Legion 5 16IRX G9 | |
系统性能
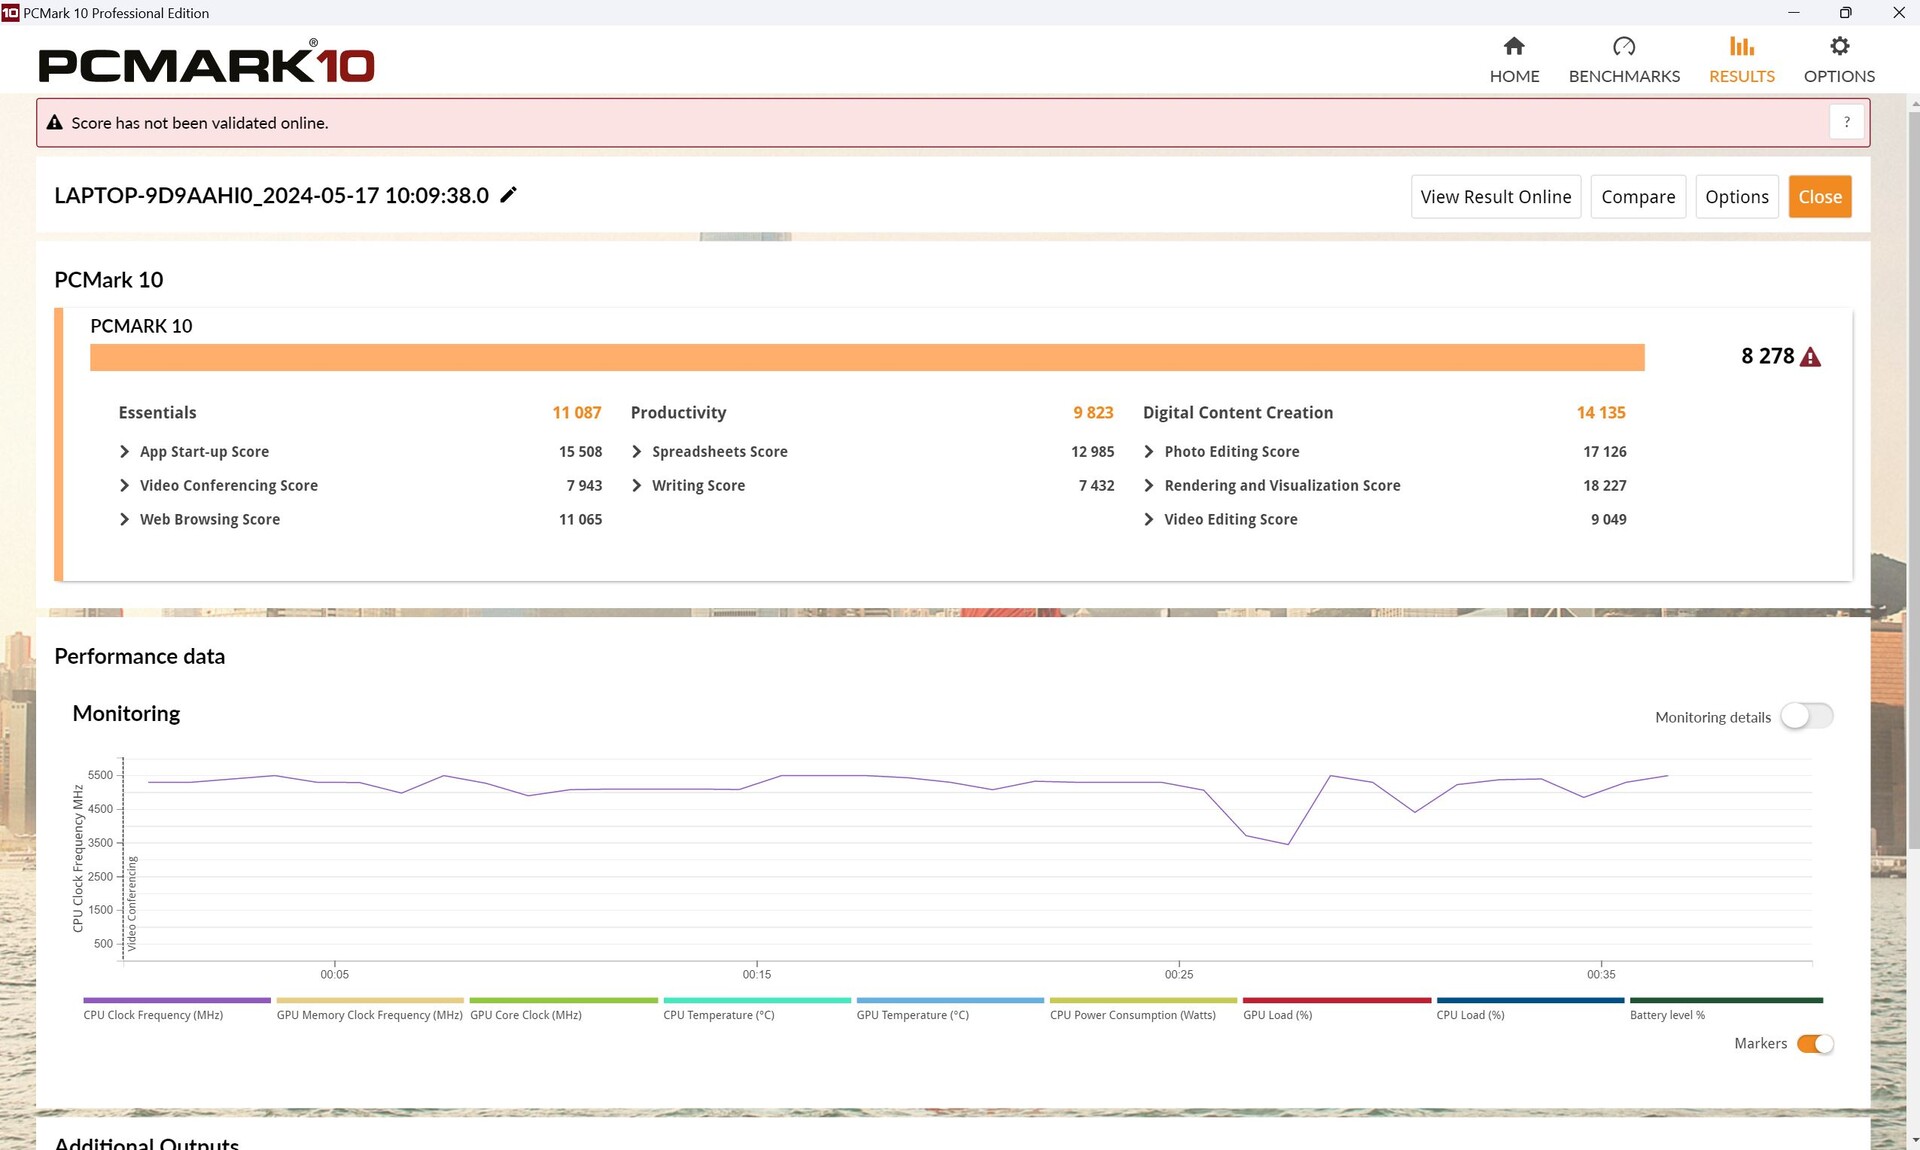
在 PCMark 10 中,我们的Legion Pro 仅在生产效率方面稍逊一筹,但在其他方面,它总是直接落后于配置更好的Legion Pro,位居第二。
在 CrossMark 中,它的成绩也特别好,我们的测试机型甚至击败了 "更好 "的自己。
CrossMark: Overall | Productivity | Creativity | Responsiveness
WebXPRT 3: Overall
WebXPRT 4: Overall
Mozilla Kraken 1.1: Total
| PCMark 10 / Score | |
| SCHENKER XMG Core 15 (M24) | |
| Lenovo Legion Pro 5 16IRX9 | |
| Lenovo Legion Pro 5 16IRX9 G9 | |
| Average Intel Core i7-14700HX, NVIDIA GeForce RTX 4060 Laptop GPU (7528 - 8278, n=2) | |
| Average of class Gaming (5776 - 9852, n=133, last 2 years) | |
| Lenovo Legion 5 16IRX G9 | |
| HP Victus 16 (2024) | |
| Dell G16, i7-13650HX, RTX 4060 | |
| PCMark 10 / Essentials | |
| Lenovo Legion Pro 5 16IRX9 | |
| Lenovo Legion Pro 5 16IRX9 G9 | |
| Average Intel Core i7-14700HX, NVIDIA GeForce RTX 4060 Laptop GPU (10778 - 11087, n=2) | |
| Lenovo Legion 5 16IRX G9 | |
| HP Victus 16 (2024) | |
| Average of class Gaming (9057 - 12600, n=133, last 2 years) | |
| SCHENKER XMG Core 15 (M24) | |
| Dell G16, i7-13650HX, RTX 4060 | |
| PCMark 10 / Productivity | |
| SCHENKER XMG Core 15 (M24) | |
| Lenovo Legion Pro 5 16IRX9 | |
| Dell G16, i7-13650HX, RTX 4060 | |
| HP Victus 16 (2024) | |
| Average of class Gaming (6662 - 14612, n=133, last 2 years) | |
| Average Intel Core i7-14700HX, NVIDIA GeForce RTX 4060 Laptop GPU (9823 - 9910, n=2) | |
| Lenovo Legion Pro 5 16IRX9 G9 | |
| Lenovo Legion 5 16IRX G9 | |
| PCMark 10 / Digital Content Creation | |
| Lenovo Legion Pro 5 16IRX9 | |
| Lenovo Legion Pro 5 16IRX9 G9 | |
| SCHENKER XMG Core 15 (M24) | |
| Average Intel Core i7-14700HX, NVIDIA GeForce RTX 4060 Laptop GPU (10841 - 14135, n=2) | |
| Average of class Gaming (6807 - 18475, n=133, last 2 years) | |
| Lenovo Legion 5 16IRX G9 | |
| Dell G16, i7-13650HX, RTX 4060 | |
| HP Victus 16 (2024) | |
| CrossMark / Overall | |
| Lenovo Legion Pro 5 16IRX9 G9 | |
| Lenovo Legion 5 16IRX G9 | |
| Average Intel Core i7-14700HX, NVIDIA GeForce RTX 4060 Laptop GPU (1923 - 2132, n=2) | |
| Lenovo Legion Pro 5 16IRX9 | |
| HP Victus 16 (2024) | |
| Average of class Gaming (1247 - 2344, n=114, last 2 years) | |
| SCHENKER XMG Core 15 (M24) | |
| Dell G16, i7-13650HX, RTX 4060 | |
| CrossMark / Productivity | |
| Lenovo Legion Pro 5 16IRX9 G9 | |
| Lenovo Legion 5 16IRX G9 | |
| Average Intel Core i7-14700HX, NVIDIA GeForce RTX 4060 Laptop GPU (1782 - 1973, n=2) | |
| Lenovo Legion Pro 5 16IRX9 | |
| Average of class Gaming (1299 - 2204, n=114, last 2 years) | |
| SCHENKER XMG Core 15 (M24) | |
| HP Victus 16 (2024) | |
| Dell G16, i7-13650HX, RTX 4060 | |
| CrossMark / Creativity | |
| Lenovo Legion Pro 5 16IRX9 G9 | |
| Lenovo Legion 5 16IRX G9 | |
| Lenovo Legion Pro 5 16IRX9 | |
| Average Intel Core i7-14700HX, NVIDIA GeForce RTX 4060 Laptop GPU (2107 - 2399, n=2) | |
| HP Victus 16 (2024) | |
| SCHENKER XMG Core 15 (M24) | |
| Average of class Gaming (1275 - 2660, n=114, last 2 years) | |
| Dell G16, i7-13650HX, RTX 4060 | |
| CrossMark / Responsiveness | |
| Lenovo Legion 5 16IRX G9 | |
| Lenovo Legion Pro 5 16IRX9 G9 | |
| Average Intel Core i7-14700HX, NVIDIA GeForce RTX 4060 Laptop GPU (1835 - 1885, n=2) | |
| HP Victus 16 (2024) | |
| Lenovo Legion Pro 5 16IRX9 | |
| Average of class Gaming (1030 - 2330, n=114, last 2 years) | |
| Dell G16, i7-13650HX, RTX 4060 | |
| SCHENKER XMG Core 15 (M24) | |
| WebXPRT 3 / Overall | |
| Lenovo Legion Pro 5 16IRX9 | |
| Lenovo Legion 5 16IRX G9 | |
| SCHENKER XMG Core 15 (M24) | |
| Lenovo Legion Pro 5 16IRX9 G9 | |
| Average of class Gaming (215 - 480, n=127, last 2 years) | |
| Average Intel Core i7-14700HX, NVIDIA GeForce RTX 4060 Laptop GPU (276 - 301, n=2) | |
| HP Victus 16 (2024) | |
| Dell G16, i7-13650HX, RTX 4060 | |
| WebXPRT 4 / Overall | |
| Lenovo Legion Pro 5 16IRX9 | |
| Lenovo Legion 5 16IRX G9 | |
| Lenovo Legion Pro 5 16IRX9 G9 | |
| Average of class Gaming (176.4 - 335, n=115, last 2 years) | |
| SCHENKER XMG Core 15 (M24) | |
| Average Intel Core i7-14700HX, NVIDIA GeForce RTX 4060 Laptop GPU (251 - 273, n=2) | |
| HP Victus 16 (2024) | |
| Mozilla Kraken 1.1 / Total | |
| HP Victus 16 (2024) | |
| Dell G16, i7-13650HX, RTX 4060 | |
| Average Intel Core i7-14700HX, NVIDIA GeForce RTX 4060 Laptop GPU (467 - 542, n=2) | |
| Average of class Gaming (409 - 674, n=139, last 2 years) | |
| SCHENKER XMG Core 15 (M24) | |
| Lenovo Legion 5 16IRX G9 | |
| Lenovo Legion Pro 5 16IRX9 G9 | |
| Lenovo Legion Pro 5 16IRX9 | |
* ... smaller is better
| PCMark 10 Score | 8278 points | |
Help | ||
| AIDA64 / Memory Copy | |
| Lenovo Legion Pro 5 16IRX9 | |
| Lenovo Legion Pro 5 16IRX9 G9 | |
| Average Intel Core i7-14700HX (63949 - 78742, n=7) | |
| SCHENKER XMG Core 15 (M24) | |
| HP Victus 16 (2024) | |
| Average of class Gaming (21750 - 97515, n=147, last 2 years) | |
| Lenovo Legion 5 16IRX G9 | |
| Dell G16, i7-13650HX, RTX 4060 | |
| AIDA64 / Memory Read | |
| Lenovo Legion Pro 5 16IRX9 | |
| Lenovo Legion Pro 5 16IRX9 G9 | |
| Average Intel Core i7-14700HX (68593 - 86175, n=7) | |
| HP Victus 16 (2024) | |
| Lenovo Legion 5 16IRX G9 | |
| Average of class Gaming (22956 - 102937, n=147, last 2 years) | |
| Dell G16, i7-13650HX, RTX 4060 | |
| SCHENKER XMG Core 15 (M24) | |
| AIDA64 / Memory Write | |
| SCHENKER XMG Core 15 (M24) | |
| Lenovo Legion Pro 5 16IRX9 | |
| Lenovo Legion Pro 5 16IRX9 G9 | |
| Average Intel Core i7-14700HX (64033 - 76689, n=7) | |
| Average of class Gaming (22297 - 108954, n=147, last 2 years) | |
| HP Victus 16 (2024) | |
| Dell G16, i7-13650HX, RTX 4060 | |
| Lenovo Legion 5 16IRX G9 | |
| AIDA64 / Memory Latency | |
| HP Victus 16 (2024) | |
| Average of class Gaming (59.5 - 259, n=147, last 2 years) | |
| Dell G16, i7-13650HX, RTX 4060 | |
| Lenovo Legion 5 16IRX G9 | |
| Average Intel Core i7-14700HX (82.7 - 96.4, n=7) | |
| SCHENKER XMG Core 15 (M24) | |
| Lenovo Legion Pro 5 16IRX9 | |
| Lenovo Legion Pro 5 16IRX9 G9 | |
* ... smaller is better
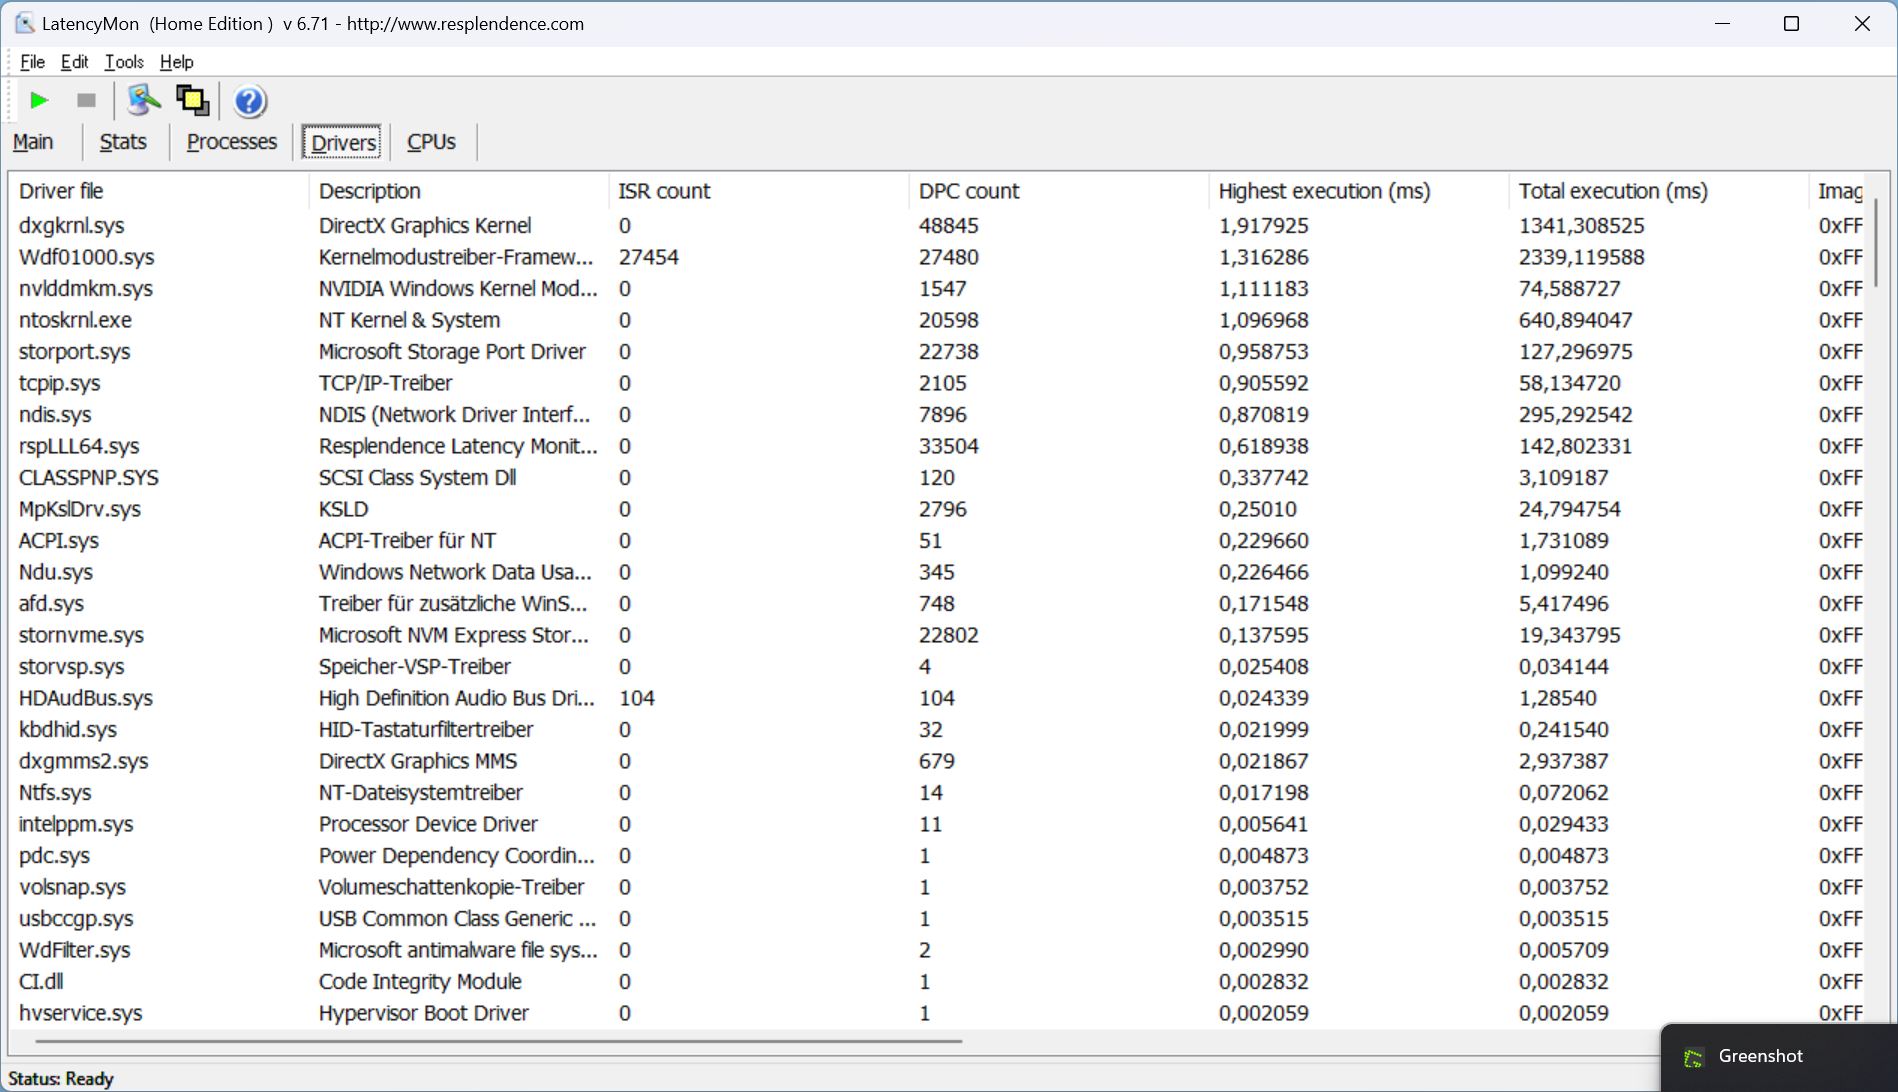
DPC 延迟
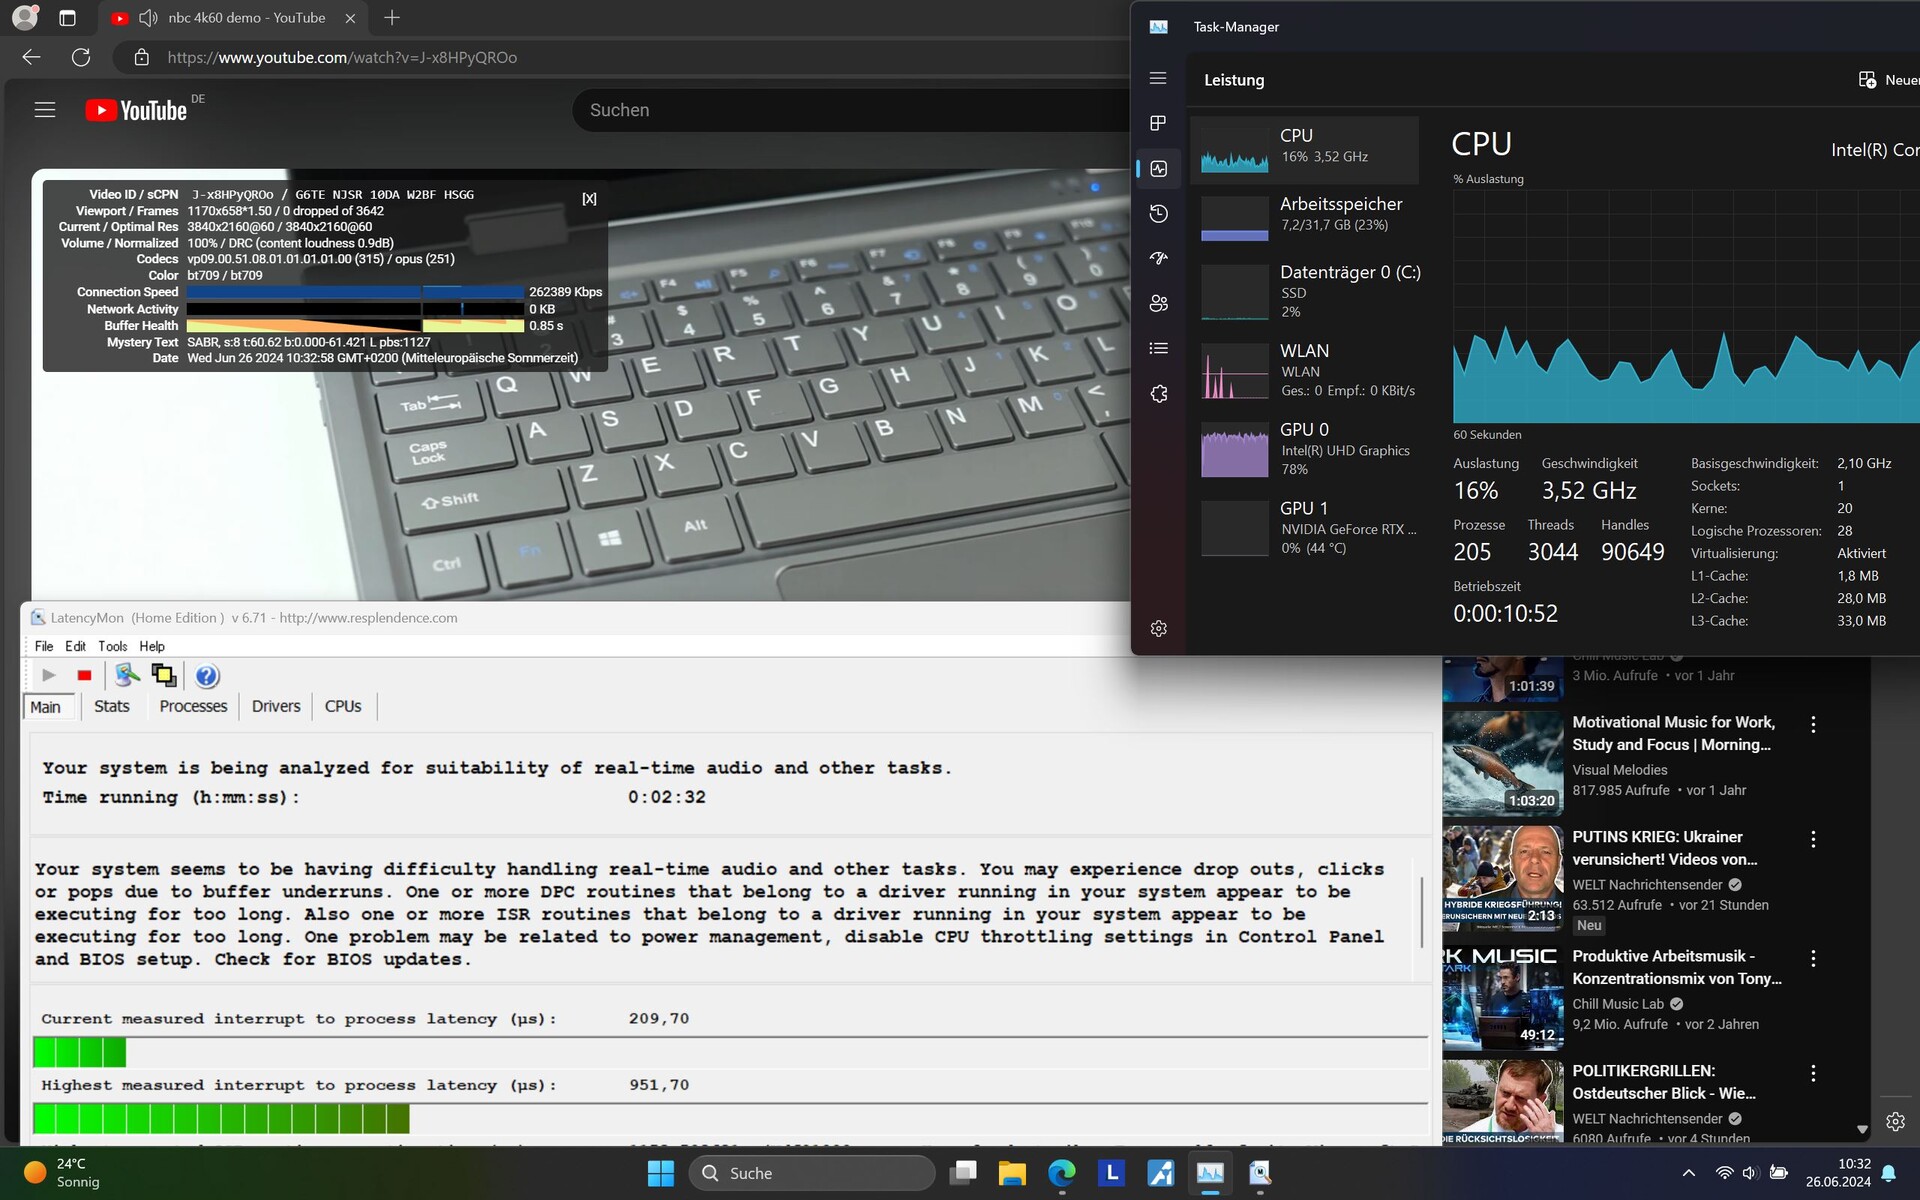
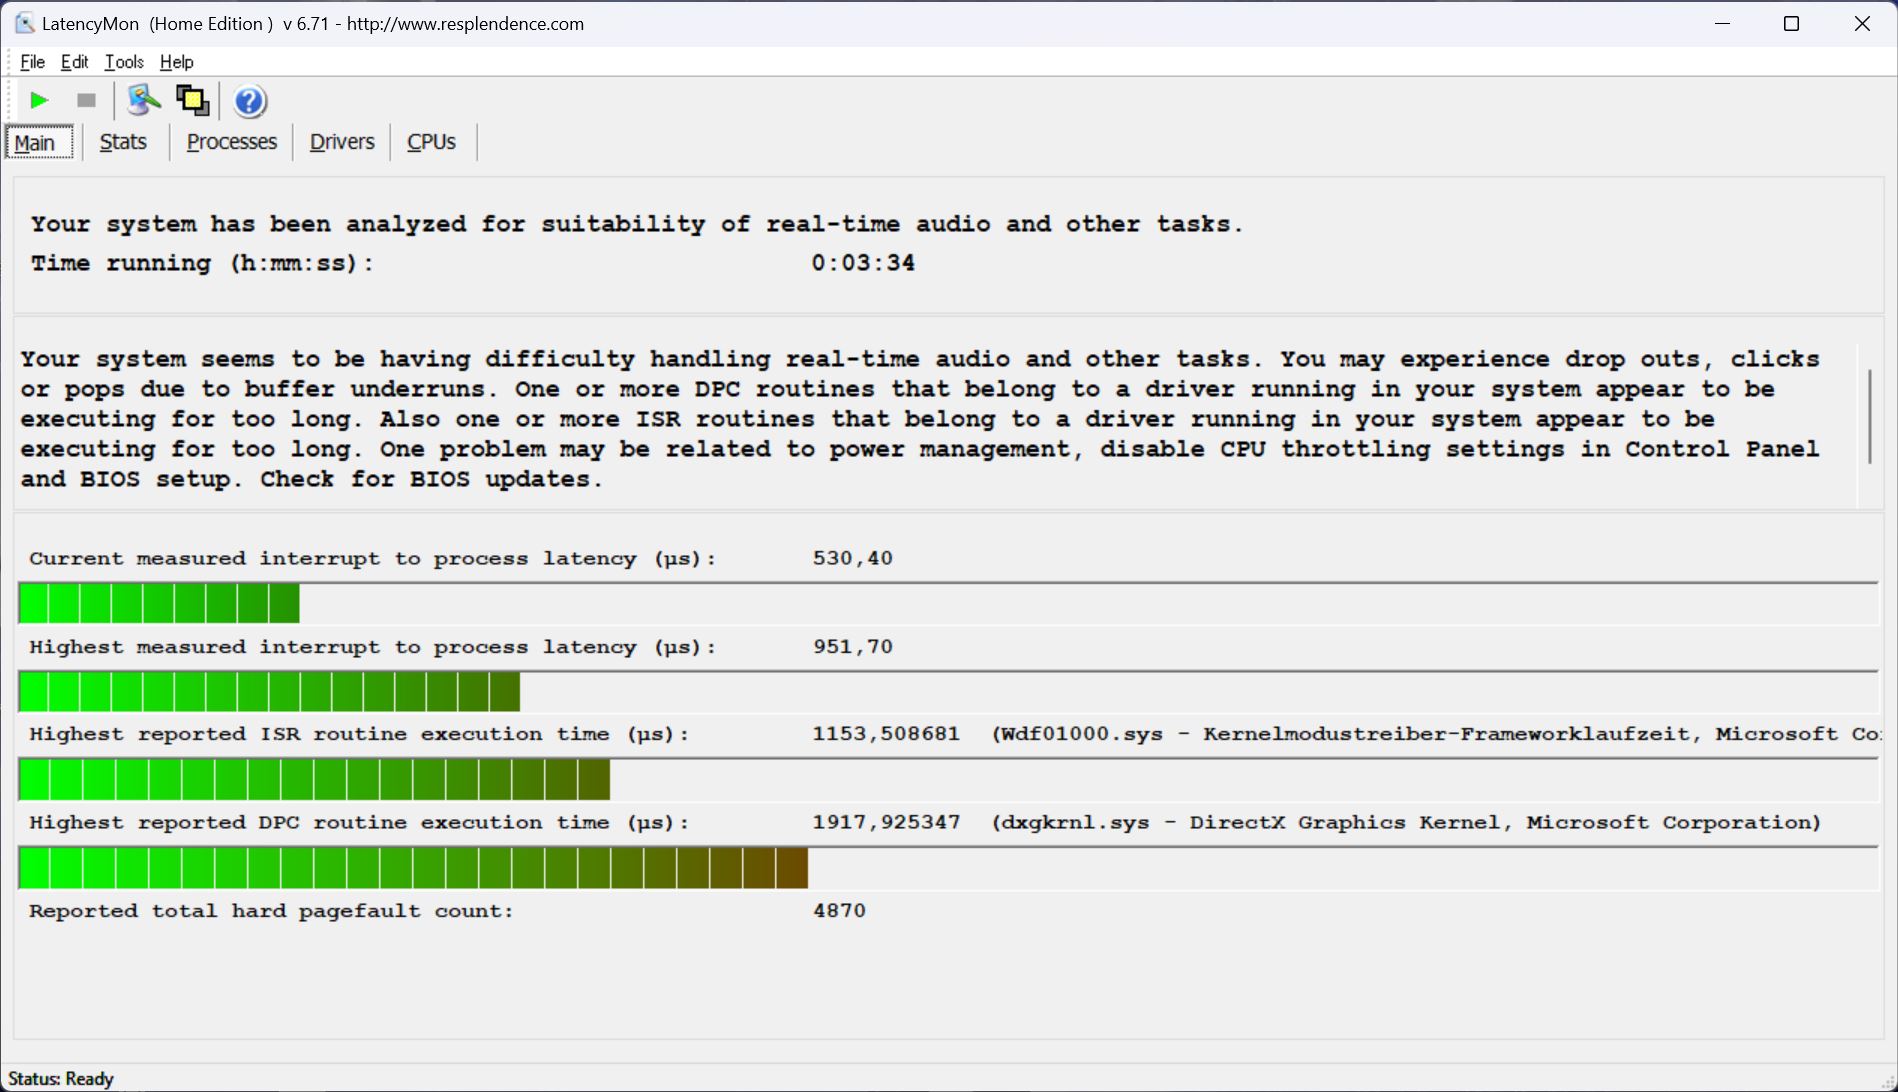
在打开浏览器时已经出现了第一次较小的延迟。在我们的网站上打开多个标签页时,延迟值又略有增加。不过,我们的 4K/60fps YouTube 视频在播放时没有出现任何问题或掉帧。其内部 GPU 负载非常高,达到 78%。
| DPC Latencies / LatencyMon - interrupt to process latency (max), Web, Youtube, Prime95 | |
| Lenovo Legion 5 16IRX G9 | |
| SCHENKER XMG Core 15 (M24) | |
| Dell G16, i7-13650HX, RTX 4060 | |
| Lenovo Legion Pro 5 16IRX9 | |
| Lenovo Legion Pro 5 16IRX9 G9 | |
| HP Victus 16 (2024) | |
* ... smaller is better
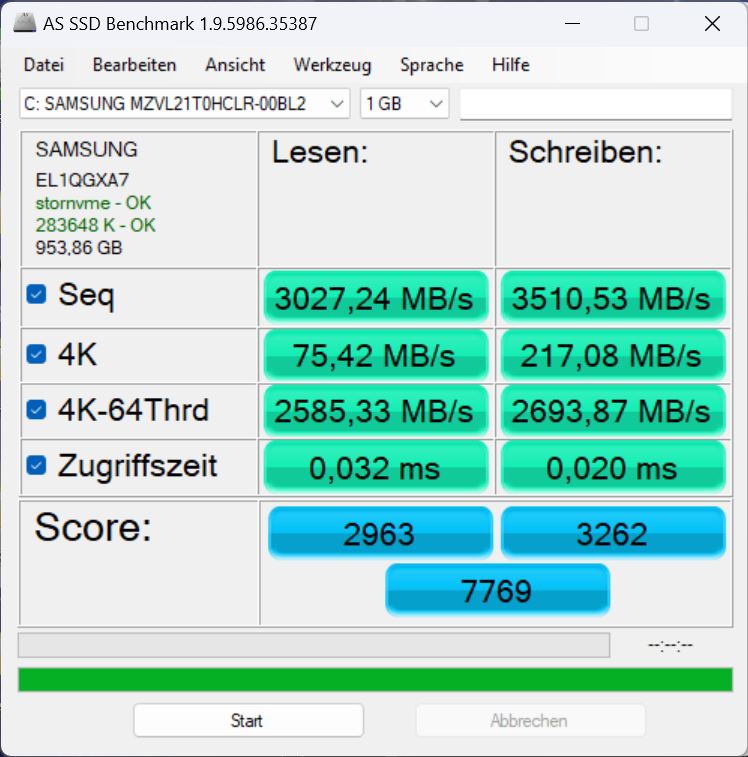
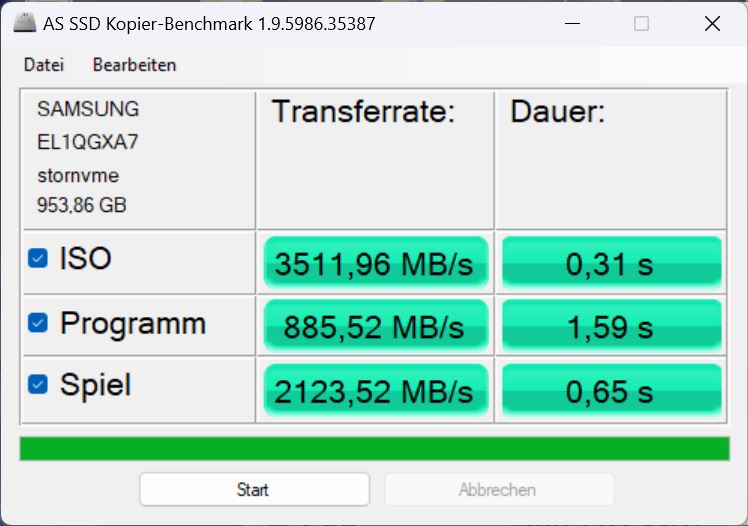
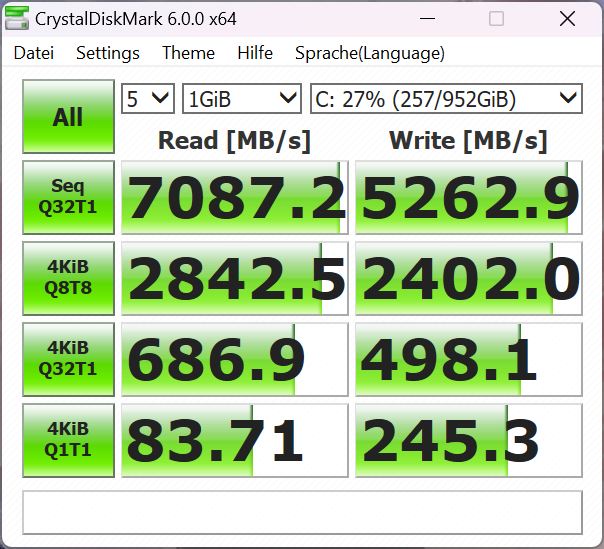
存储设备
联想在我们的机型中安装了三星的快速 PCIe 4 NVMe 固态硬盘,存储容量为 1 TB,更确切地说,是著名的 980 Pro 的 OEM 版本。该机型在我们的 固态硬盘最佳排行榜因此,它是同类产品中速度最快的存储设备之一。
在我们的基准测试中,它取得了不错的整体数值,但就像其他Legion (Pro) 5 机型的固态硬盘一样,它无法在较长时间内保持性能,并且出现了热节流现象。令人遗憾的是,联想没有为这款笔记本配备更好的散热系统,而且整个系列似乎都受到了这个问题的影响。

* ... smaller is better
Reading continuous performance: DiskSpd Read Loop, Queue Depth 8
图形卡
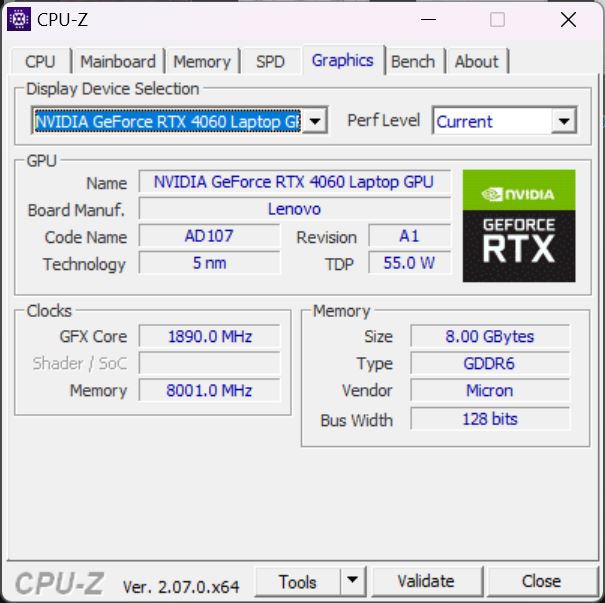
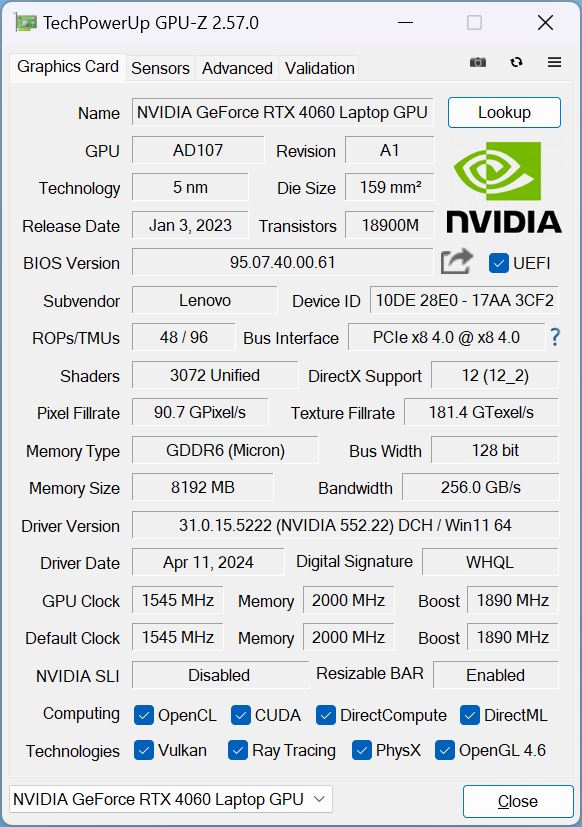
我们的配置配备了 Nvidia Geforce RTX 4060功耗为 140 瓦。
在合成 3DMark 测试中,GPU 的表现略高于平均水平,但在不带 Pro 后缀的 3DMark 测试中,同样的 RTX 4060 在 Legion 5 不带 Pro 后缀.Legion Pro 5 配备了 RTX 4070和 i9-14900HX在这些测试中快了约 20%。
在电池模式下,再次运行Fire Strike 时,其 3D 性能降低了 23%。

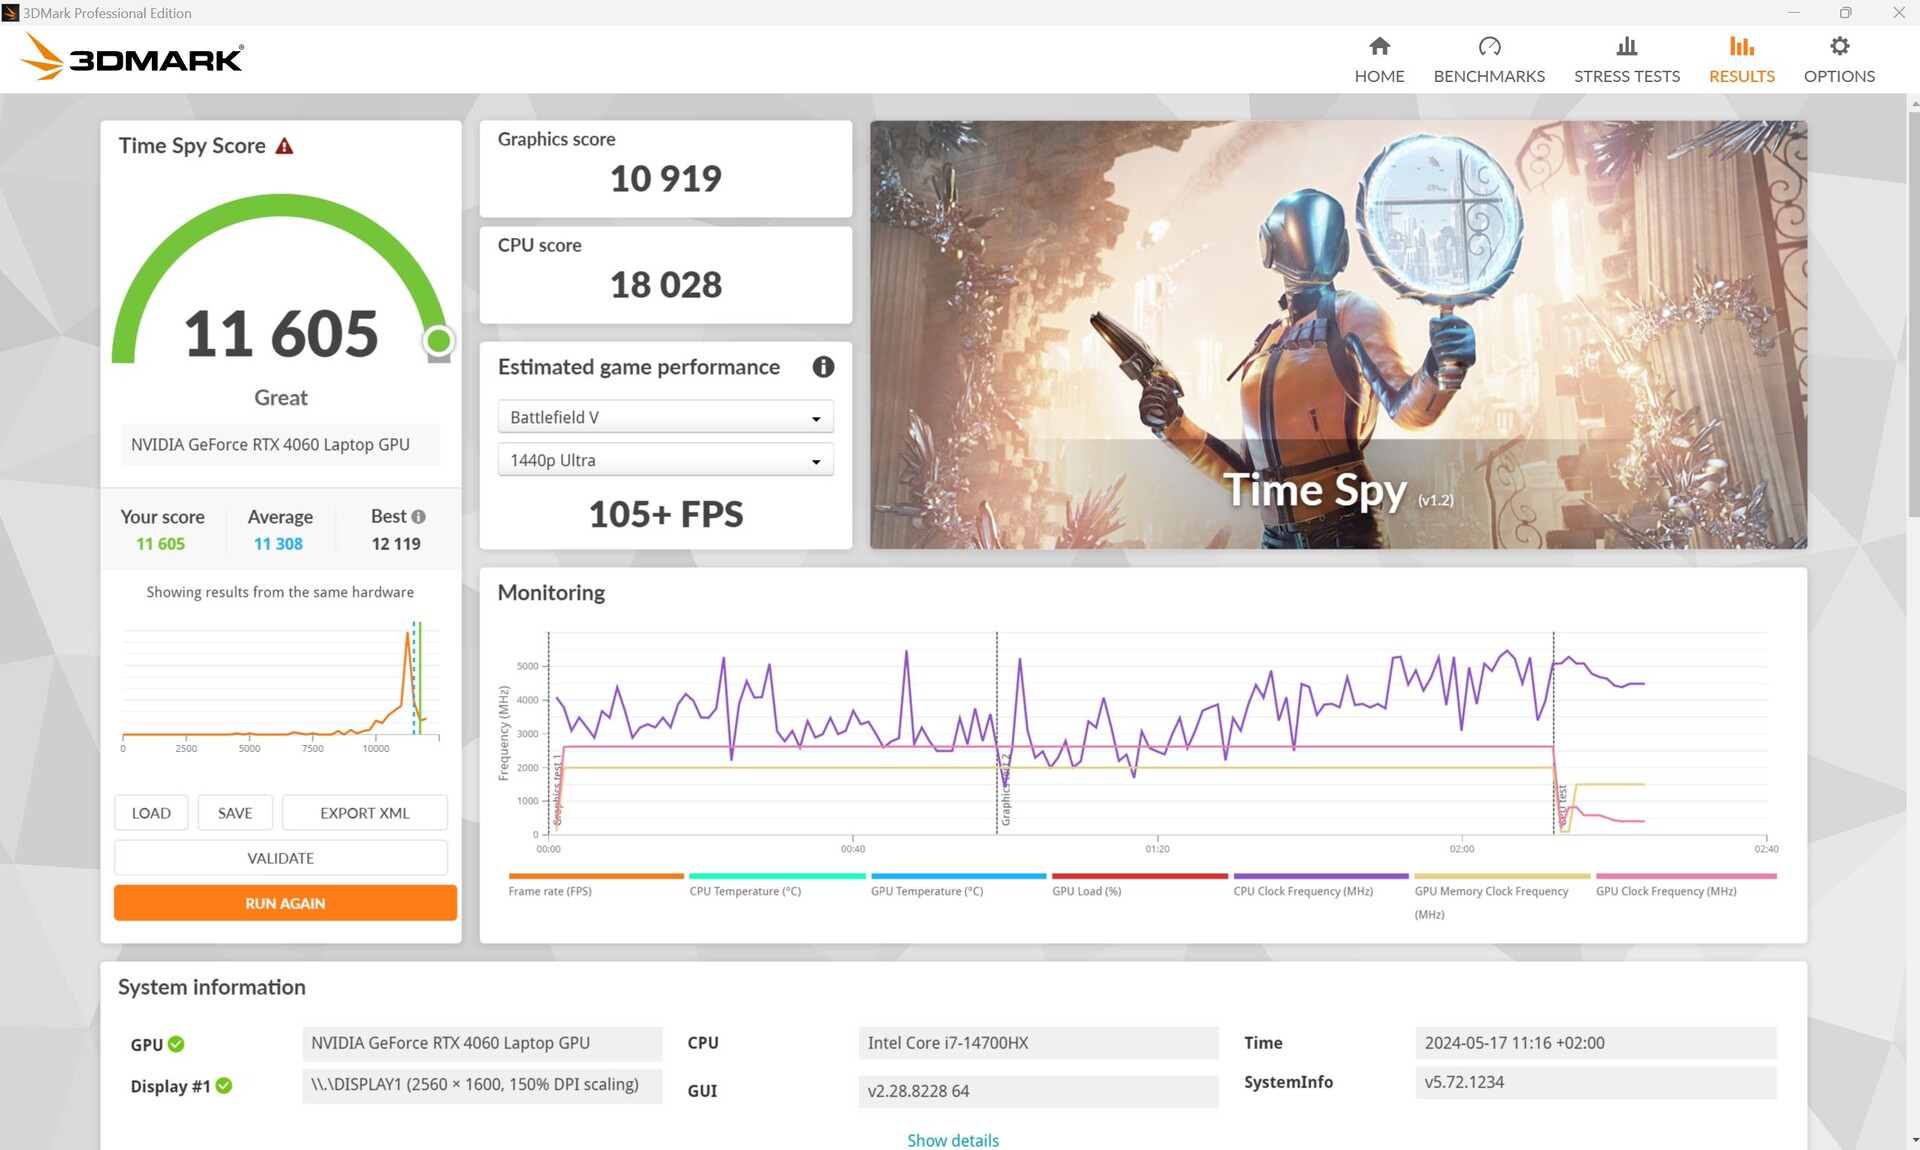
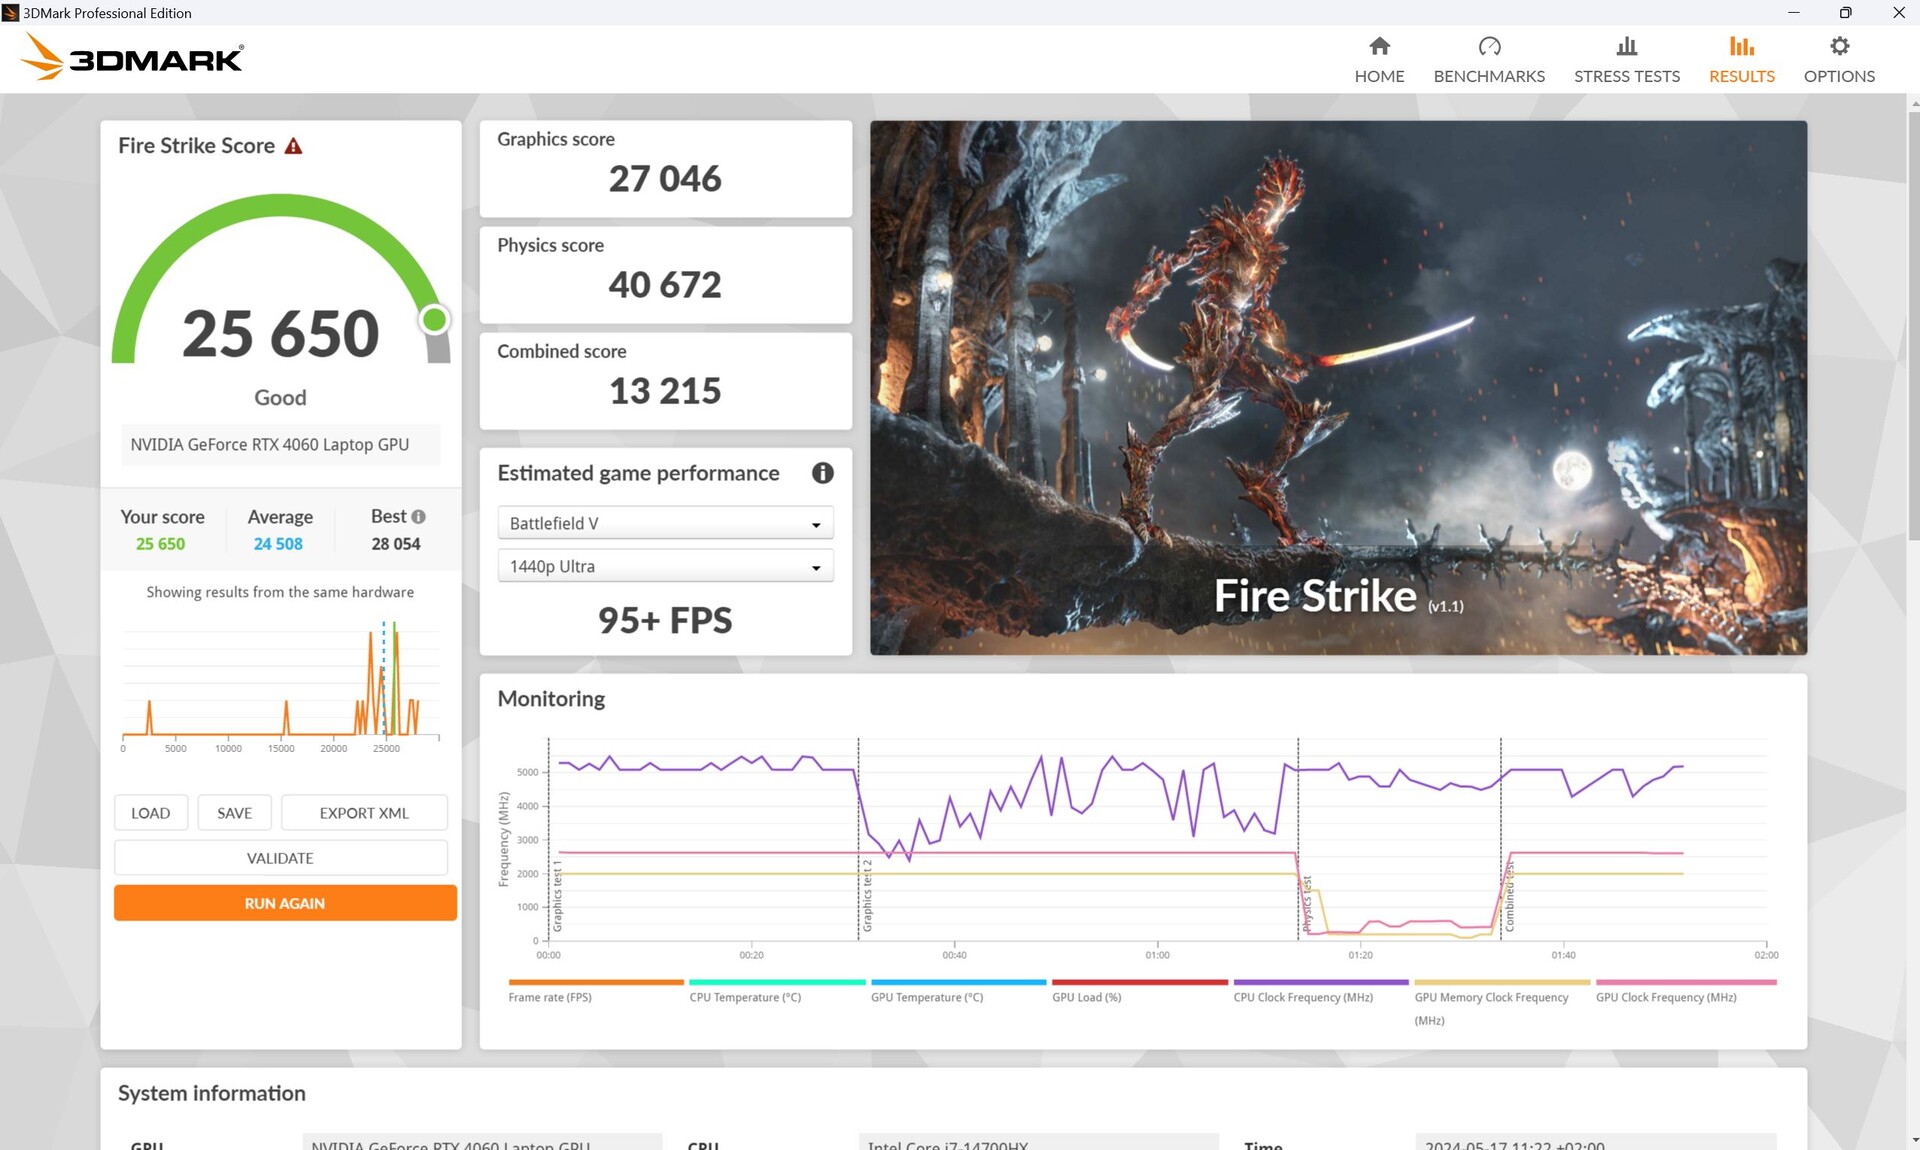
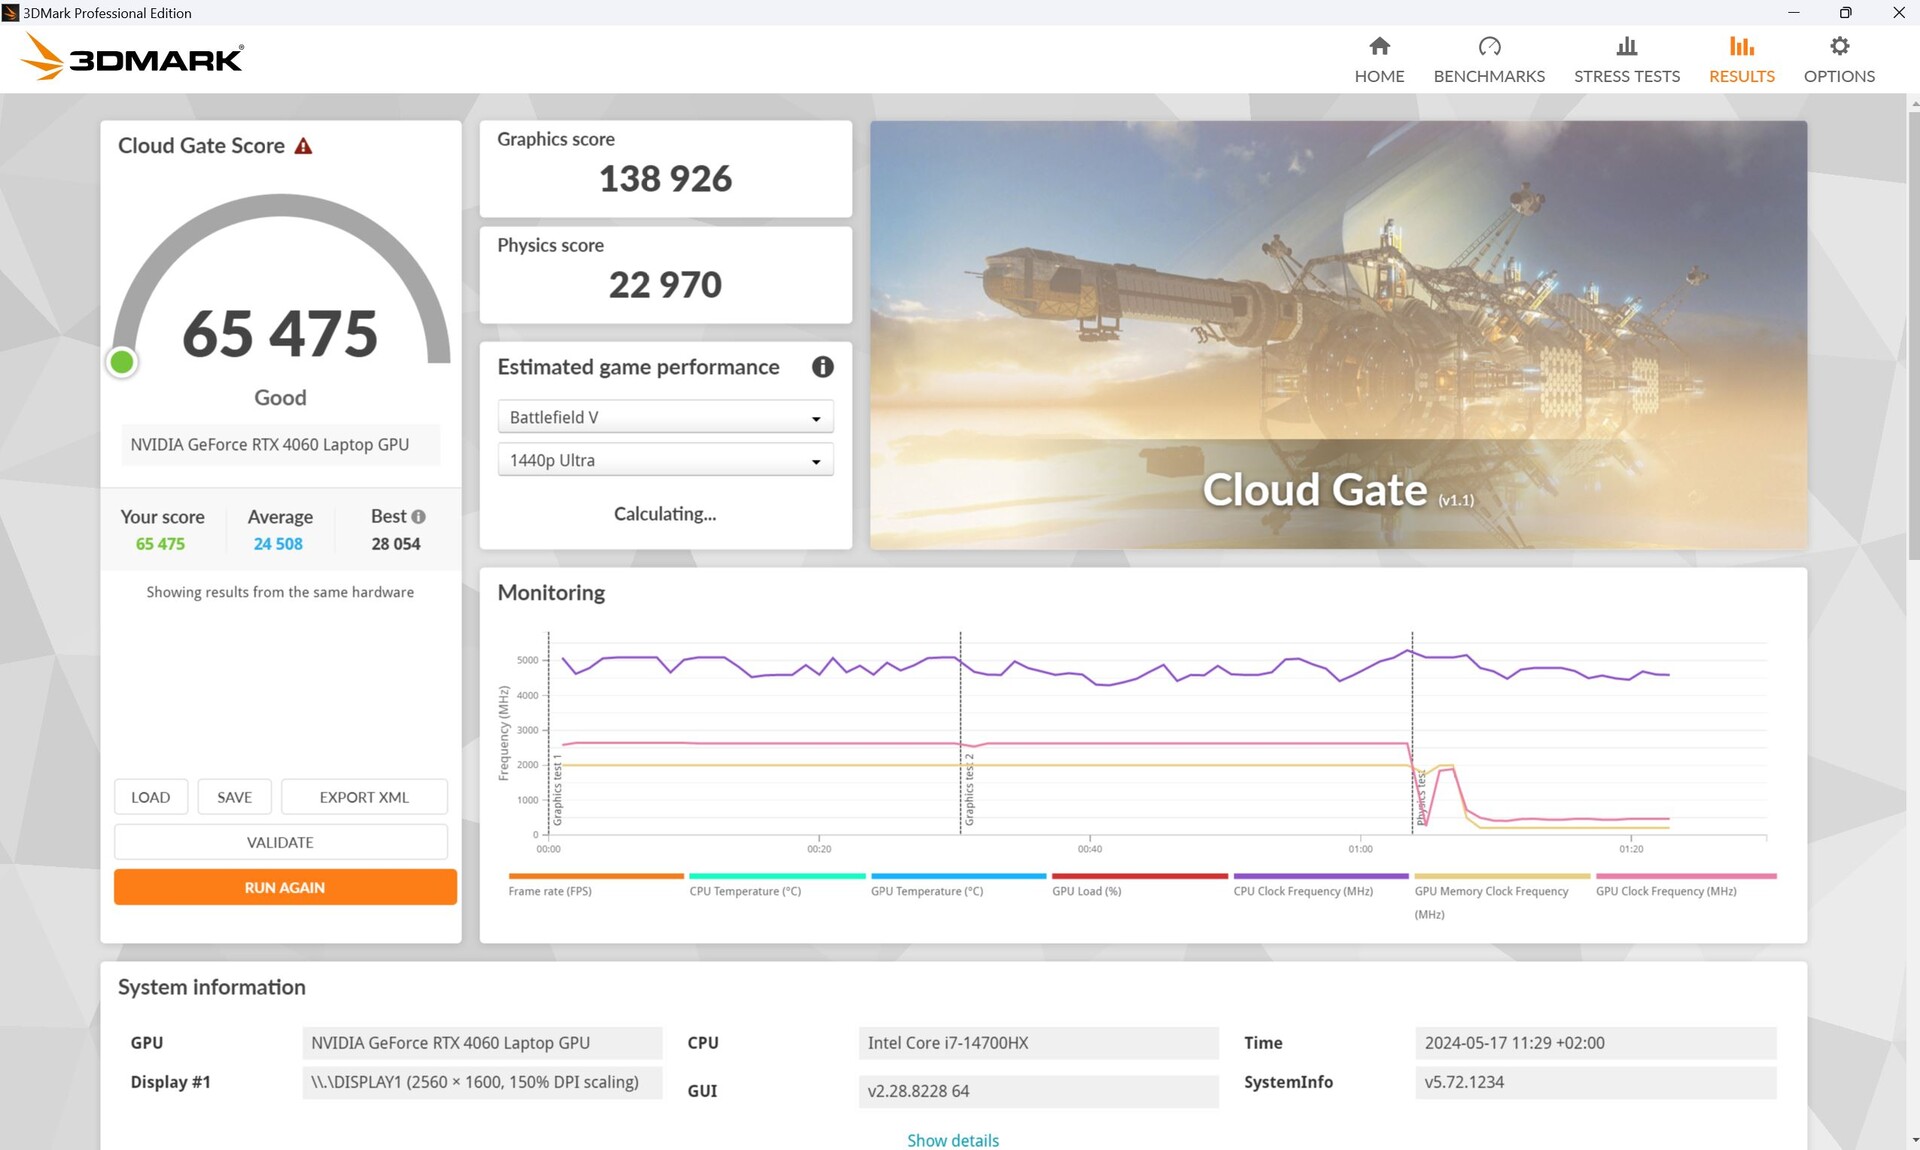
| 3DMark 11 Performance | 33600 points | |
| 3DMark Cloud Gate Standard Score | 65475 points | |
| 3DMark Fire Strike Score | 25650 points | |
| 3DMark Time Spy Score | 11605 points | |
Help | ||
* ... smaller is better
在游戏方面,Legion Pro 5 超越了所有采用 RTX 4060 的竞争对手,尤其是采用相同 CPU 和 GPU 的 Victus,它排在最后一位,得分比对手低 15 分。RTX-4070Legion Pro 仅领先 10 分。
最终,我们测试的所有游戏都可以在全高清模式下以最高细节进行;在 QHD 模式下,运行要求较高的游戏时,帧率有时可能会低于 60 fps,但即便如此,这些游戏仍能流畅运行。
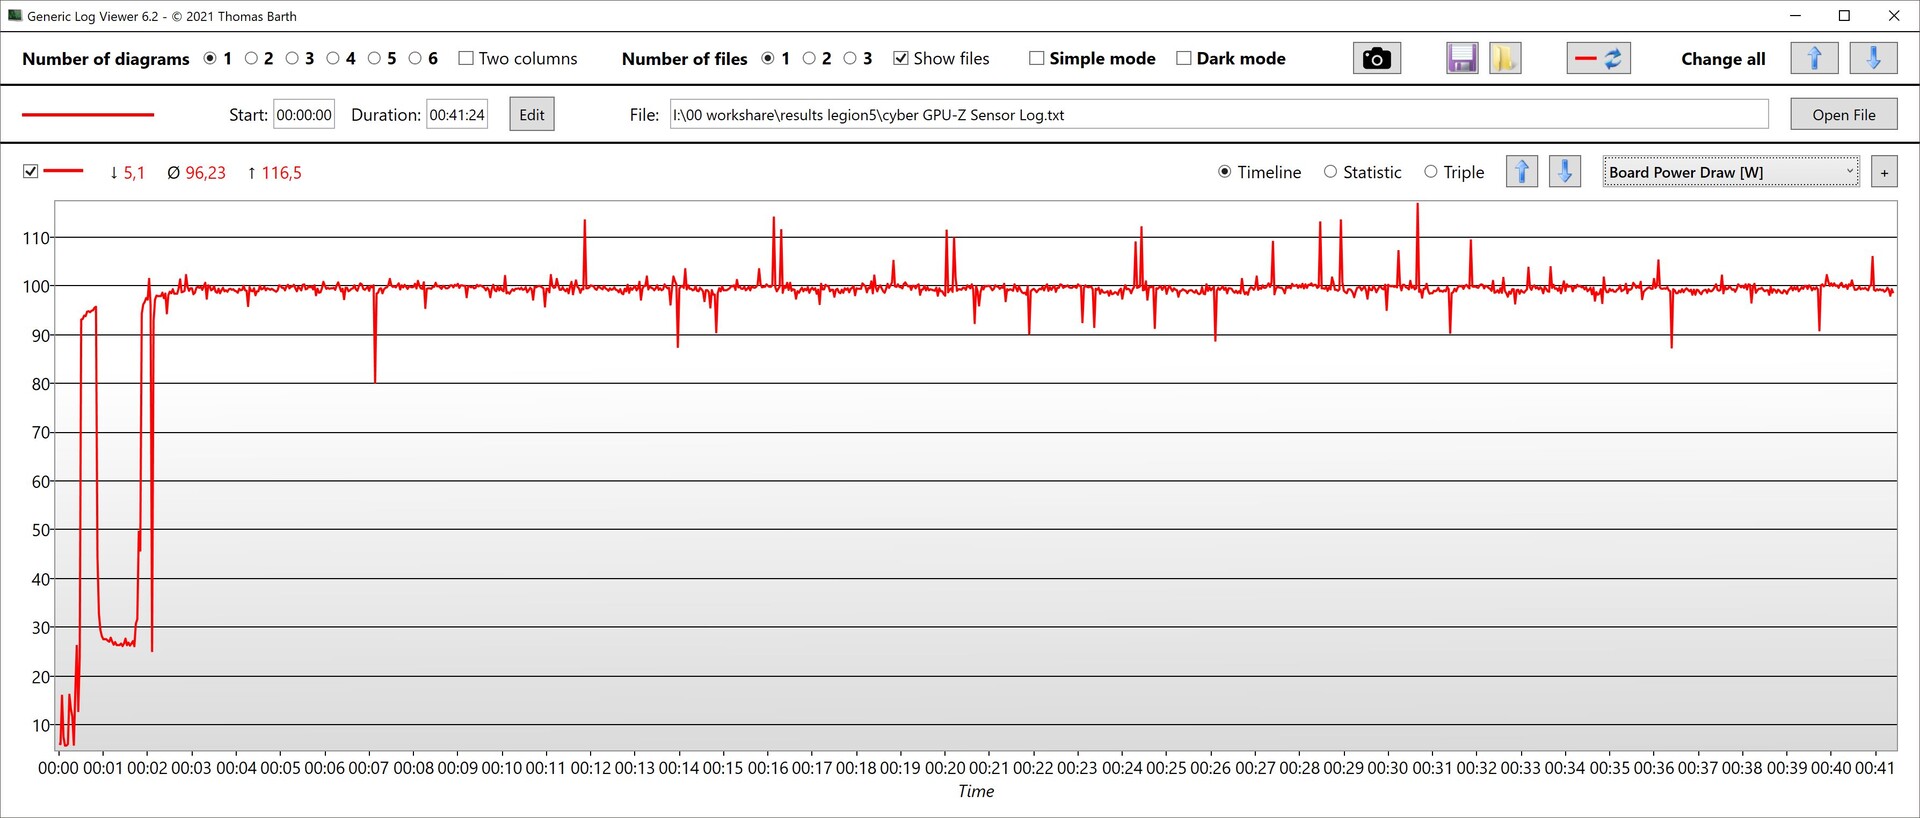
我们在连续测试《赛博朋克 2077》时发现,帧率非常稳定,没有出现任何大幅下降。GPU 的频率始终保持在 2,610 MHz,发热温度为 75 至 79 °C。功耗约为 100 瓦。


| The Witcher 3 - 1920x1080 Ultra Graphics & Postprocessing (HBAO+) | |
| Lenovo Legion Pro 5 16IRX9 | |
| Average of class Gaming (18.4 - 214, n=119, last 2 years) | |
| Lenovo Legion Pro 5 16IRX9 G9 | |
| SCHENKER XMG Core 15 (M24) | |
| Dell G16, i7-13650HX, RTX 4060 | |
| HP Victus 16 (2024) | |
| Lenovo Legion 5 16IRX G9 | |
| GTA V - 1920x1080 Highest Settings possible AA:4xMSAA + FX AF:16x | |
| Lenovo Legion Pro 5 16IRX9 | |
| Lenovo Legion Pro 5 16IRX9 G9 | |
| Lenovo Legion 5 16IRX G9 | |
| Dell G16, i7-13650HX, RTX 4060 | |
| SCHENKER XMG Core 15 (M24) | |
| Average of class Gaming (12.1 - 168.2, n=132, last 2 years) | |
| HP Victus 16 (2024) | |
| Final Fantasy XV Benchmark - 1920x1080 High Quality | |
| Lenovo Legion Pro 5 16IRX9 | |
| Average of class Gaming (19.2 - 201, n=144, last 2 years) | |
| SCHENKER XMG Core 15 (M24) | |
| Lenovo Legion 5 16IRX G9 | |
| Lenovo Legion Pro 5 16IRX9 G9 | |
| Dell G16, i7-13650HX, RTX 4060 | |
| HP Victus 16 (2024) | |
| Strange Brigade - 1920x1080 ultra AA:ultra AF:16 | |
| Lenovo Legion Pro 5 16IRX9 | |
| Average of class Gaming (38.9 - 420, n=140, last 2 years) | |
| Lenovo Legion 5 16IRX G9 | |
| SCHENKER XMG Core 15 (M24) | |
| Lenovo Legion Pro 5 16IRX9 G9 | |
| Dell G16, i7-13650HX, RTX 4060 | |
| HP Victus 16 (2024) | |
| Dota 2 Reborn - 1920x1080 ultra (3/3) best looking | |
| Lenovo Legion Pro 5 16IRX9 | |
| Lenovo Legion Pro 5 16IRX9 G9 | |
| Lenovo Legion 5 16IRX G9 | |
| HP Victus 16 (2024) | |
| Dell G16, i7-13650HX, RTX 4060 | |
| Average of class Gaming (65.1 - 220, n=148, last 2 years) | |
| SCHENKER XMG Core 15 (M24) | |
| The Witcher 3 | |
| 1920x1080 High Graphics & Postprocessing (Nvidia HairWorks Off) | |
| Lenovo Legion Pro 5 16IRX9 | |
| Average of class Gaming (40.1 - 424, n=86, last 2 years) | |
| Lenovo Legion 5 16IRX G9 | |
| Lenovo Legion Pro 5 16IRX9 G9 | |
| SCHENKER XMG Core 15 (M24) | |
| Average NVIDIA GeForce RTX 4060 Laptop GPU (110 - 229, n=36) | |
| HP Victus 16 (2024) | |
| Dell G16, i7-13650HX, RTX 4060 | |
| 1920x1080 Ultra Graphics & Postprocessing (HBAO+) | |
| Lenovo Legion Pro 5 16IRX9 | |
| Average of class Gaming (18.4 - 214, n=119, last 2 years) | |
| Lenovo Legion Pro 5 16IRX9 G9 | |
| SCHENKER XMG Core 15 (M24) | |
| Dell G16, i7-13650HX, RTX 4060 | |
| Average NVIDIA GeForce RTX 4060 Laptop GPU (77 - 159.7, n=42) | |
| HP Victus 16 (2024) | |
| Lenovo Legion 5 16IRX G9 | |
| Skull & Bones | |
| 1920x1080 Ultra High Preset AA:T | |
| Average of class Gaming (31 - 118, n=12, last 2 years) | |
| SCHENKER XMG Core 15 (M24) | |
| Average NVIDIA GeForce RTX 4060 Laptop GPU (65 - 73, n=5) | |
| Lenovo Legion Pro 5 16IRX9 G9 | |
| 2560x1440 Ultra High Preset AA:T | |
| Average of class Gaming (37 - 98, n=8, last 2 years) | |
| SCHENKER XMG Core 15 (M24) | |
| Average NVIDIA GeForce RTX 4060 Laptop GPU (51 - 57, n=3) | |
| Lenovo Legion Pro 5 16IRX9 G9 | |
| F1 24 - 1920x1080 Ultra High Preset AA:T AF:16x | |
| Average of class Gaming (54.1 - 148, n=19, last 2 years) | |
| Lenovo Legion Pro 5 16IRX9 G9 | |
| Average NVIDIA GeForce RTX 4060 Laptop GPU (47.5 - 61.6, n=10) | |
Cyberpunk 2077 FPS diagram
| low | med. | high | ultra | QHD | 4K | |
|---|---|---|---|---|---|---|
| GTA V (2015) | 187.2 | 185.9 | 185.2 | 124.9 | 87.3 | |
| The Witcher 3 (2015) | 531 | 364 | 217 | 112 | 83 | |
| Dota 2 Reborn (2015) | 228 | 203 | 191.7 | 183.8 | 129.4 | |
| Final Fantasy XV Benchmark (2018) | 226 | 155.5 | 106.1 | 78.1 | ||
| X-Plane 11.11 (2018) | 201 | 172.9 | 135.1 | 124.7 | ||
| Far Cry 5 (2018) | 192 | 165 | 158 | 148 | 106 | |
| Strange Brigade (2018) | 526 | 295 | 231 | 199.9 | ||
| Baldur's Gate 3 (2023) | 138.6 | 85.7 | 71.1 | 66.5 | 49.1 | |
| Cyberpunk 2077 2.2 Phantom Liberty (2023) | 135.3 | 100.8 | 88.7 | 79.5 | 47.5 | |
| Skull & Bones (2024) | 137 | 124 | 98 | 69 | 53 | |
| F1 24 (2024) | 286 | 247 | 185.3 | 60.6 |
排放和功率:联想游戏机左侧比右侧更热
噪音排放
在性能模式下,风扇大多处于活动状态,在空闲模式下通常也是如此--它们以 25 至 26 分贝的静音速度旋转。在我们通过 3DMark06 进行的中等负载情况下,它们的噪音已经达到了 45 分贝,但竞争对手的噪音同样很大。
在较高负载情况下,风扇的噪音会有所波动,不会保持恒定。表中的数据显示了其最大值。例如,在玩《赛博朋克》时,风扇噪音在 47.5 分贝和 52.69 分贝之间波动。
Noise Level
| Idle |
| 23 / 23 / 25 dB(A) |
| Load |
| 45.18 / 53.13 dB(A) |
 | ||
30 dB silent 40 dB(A) audible 50 dB(A) loud |
||
min: | ||
| Lenovo Legion Pro 5 16IRX9 G9 NVIDIA GeForce RTX 4060 Laptop GPU, i7-14700HX, Samsung PM9A1 MZVL21T0HCLR | HP Victus 16 (2024) NVIDIA GeForce RTX 4060 Laptop GPU, i7-14700HX, Kioxia XG8 KXG80ZNV512G | Dell G16, i7-13650HX, RTX 4060 NVIDIA GeForce RTX 4060 Laptop GPU, i7-13650HX, WD PC SN740 SDDPNQD-1T00 | SCHENKER XMG Core 15 (M24) NVIDIA GeForce RTX 4060 Laptop GPU, R7 8845HS, Samsung 990 Pro 1 TB | Lenovo Legion Pro 5 16IRX9 NVIDIA GeForce RTX 4070 Laptop GPU, i9-14900HX, Samsung PM9A1 MZVL21T0HCLR | Lenovo Legion 5 16IRX G9 NVIDIA GeForce RTX 4060 Laptop GPU, i7-14650HX, Samsung PM9A1 MZVL21T0HCLR | |
|---|---|---|---|---|---|---|
| Noise | -13% | 6% | 4% | -7% | -11% | |
| off / environment * | 23 | 25 -9% | 23 -0% | 23 -0% | 23.9 -4% | 24 -4% |
| Idle Minimum * | 23 | 28 -22% | 23 -0% | 23 -0% | 24.3 -6% | 24 -4% |
| Idle Average * | 23 | 29 -26% | 23 -0% | 23 -0% | 24.3 -6% | 28.8 -25% |
| Idle Maximum * | 25 | 33 -32% | 27.96 -12% | 23 8% | 28.9 -16% | 32 -28% |
| Load Average * | 45.18 | 45 -0% | 27.96 38% | 38.92 14% | 45.8 -1% | 45.5 -1% |
| Cyberpunk 2077 ultra * | 52.69 | 52.06 1% | ||||
| Load Maximum * | 53.13 | 48 10% | 47.89 10% | 52.09 2% | 56.6 -7% | 55.7 -5% |
| Witcher 3 ultra * | 43 | 47.89 | 50.96 | 51 | 53.1 |
* ... smaller is better
温度
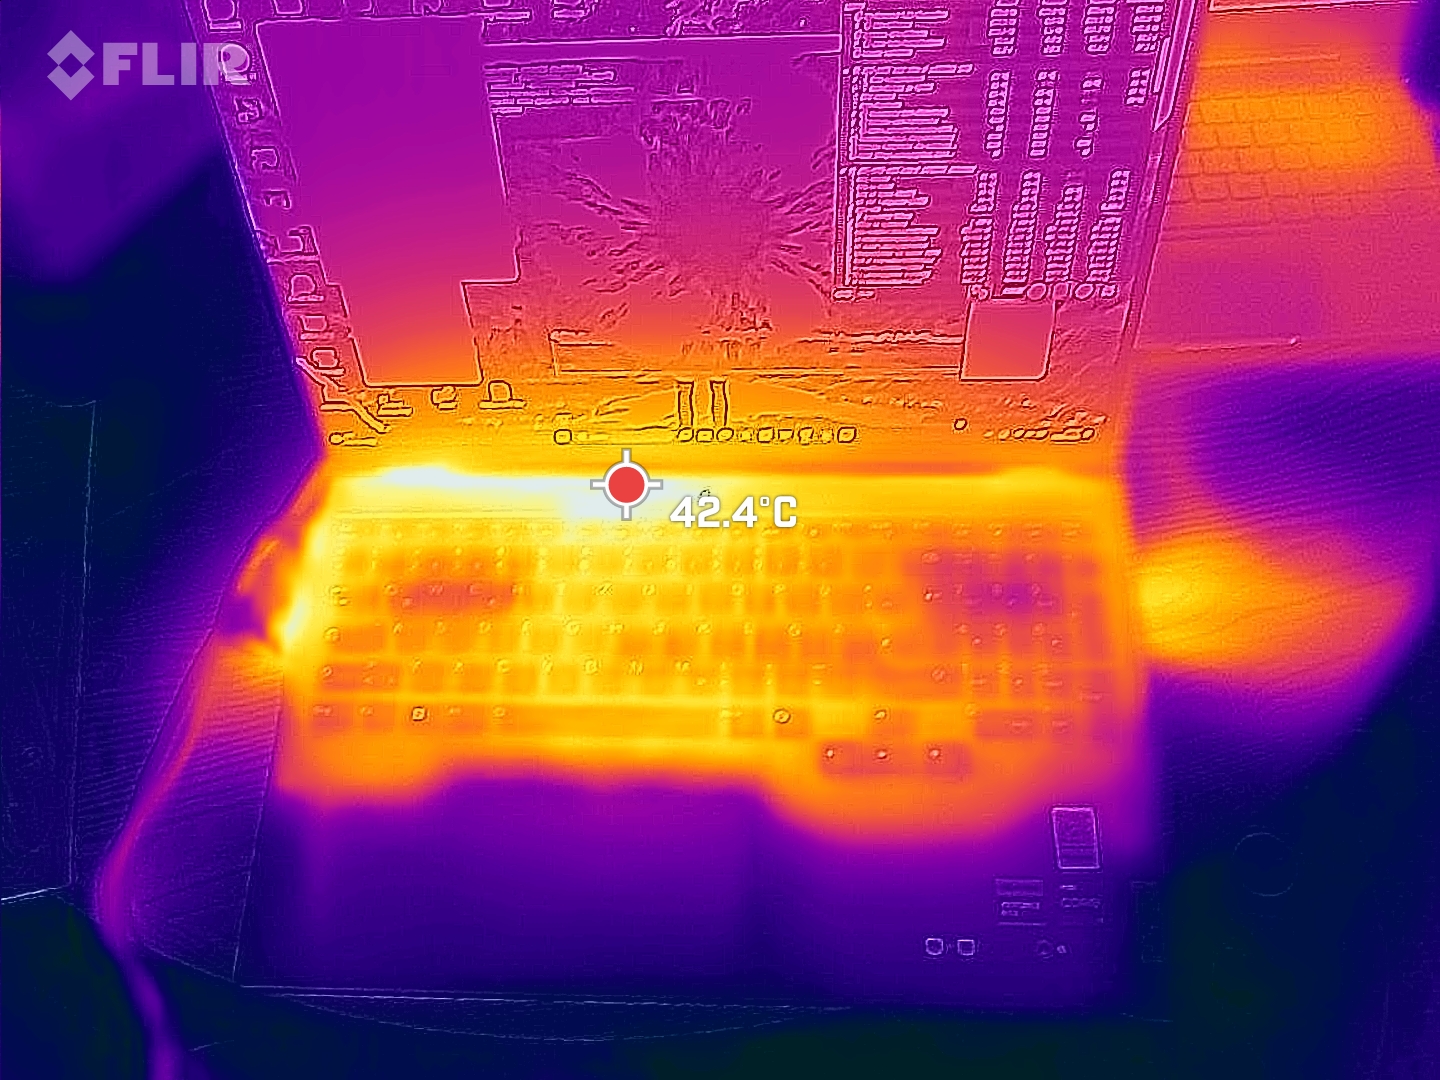
Legion 闲置时温度已经相当高,我们在设备底部测得的温度高达 39 °C。一般来说,左侧的 WASD 键(对游戏玩家很重要)似乎比右侧发热更多。
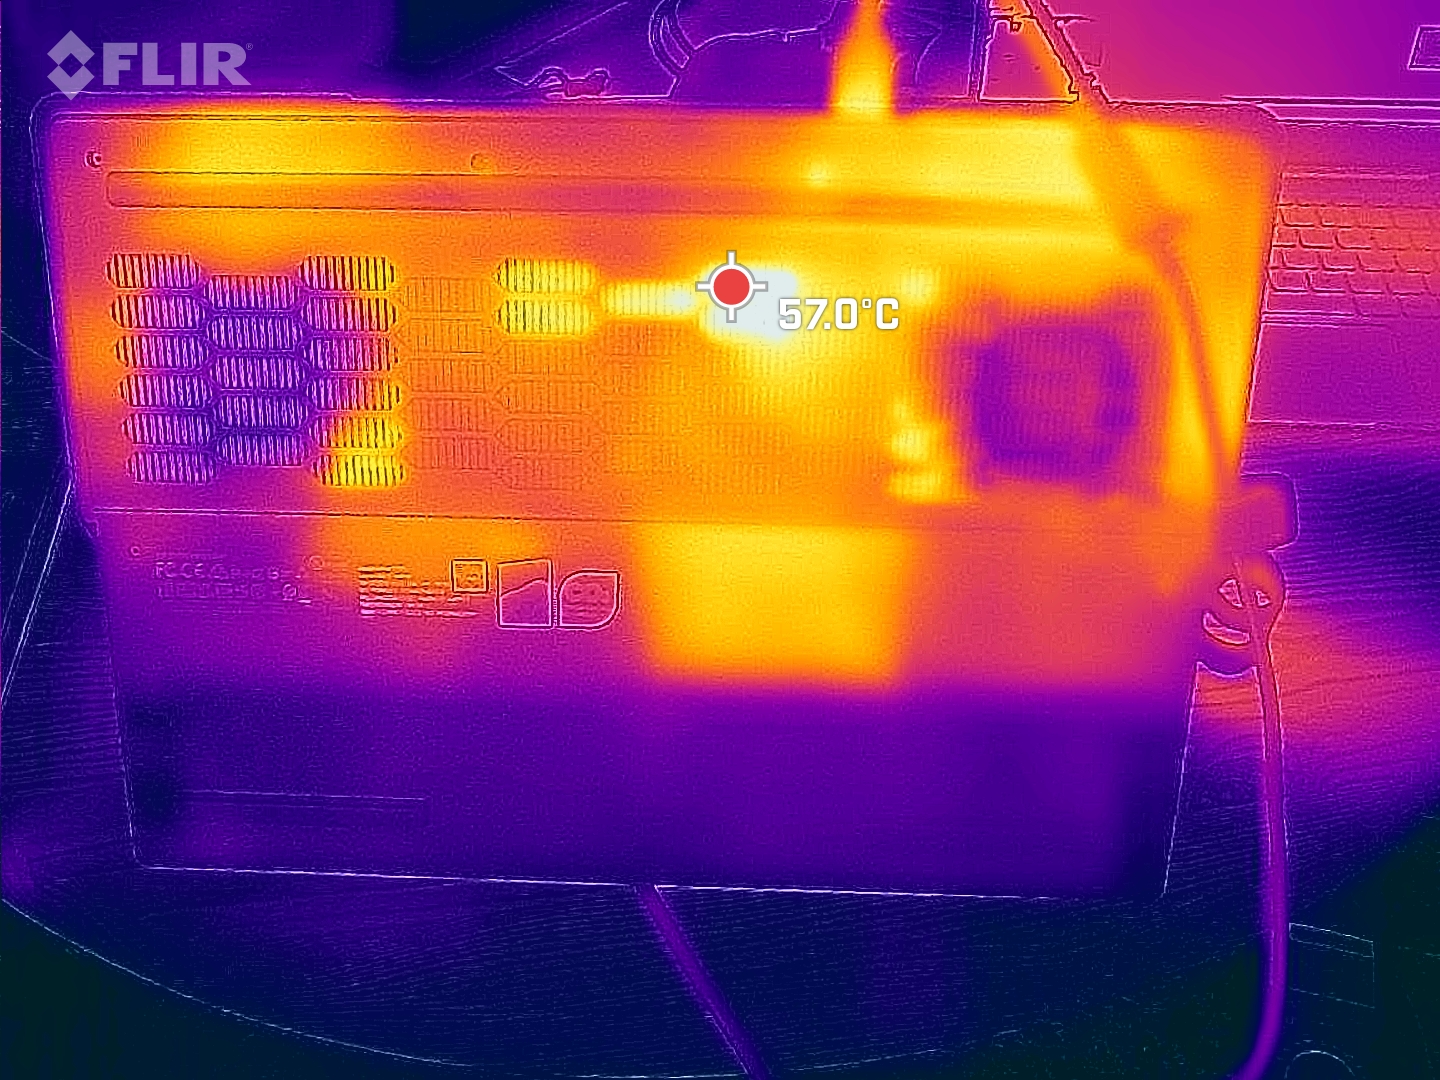
在重负载情况下,我们在底部测得的热点温度为 57 °C。戴尔 G16 和酷睿 15 的发热情况类似,而其他竞争对手的温度往往较低。
(-) The maximum temperature on the upper side is 50 °C / 122 F, compared to the average of 40.4 °C / 105 F, ranging from 21.2 to 68.8 °C for the class Gaming.
(-) The bottom heats up to a maximum of 57 °C / 135 F, compared to the average of 43.2 °C / 110 F
(±) In idle usage, the average temperature for the upper side is 32.9 °C / 91 F, compared to the device average of 33.9 °C / 93 F.
(-) 3: The average temperature for the upper side is 38.4 °C / 101 F, compared to the average of 33.9 °C / 93 F for the class Gaming.
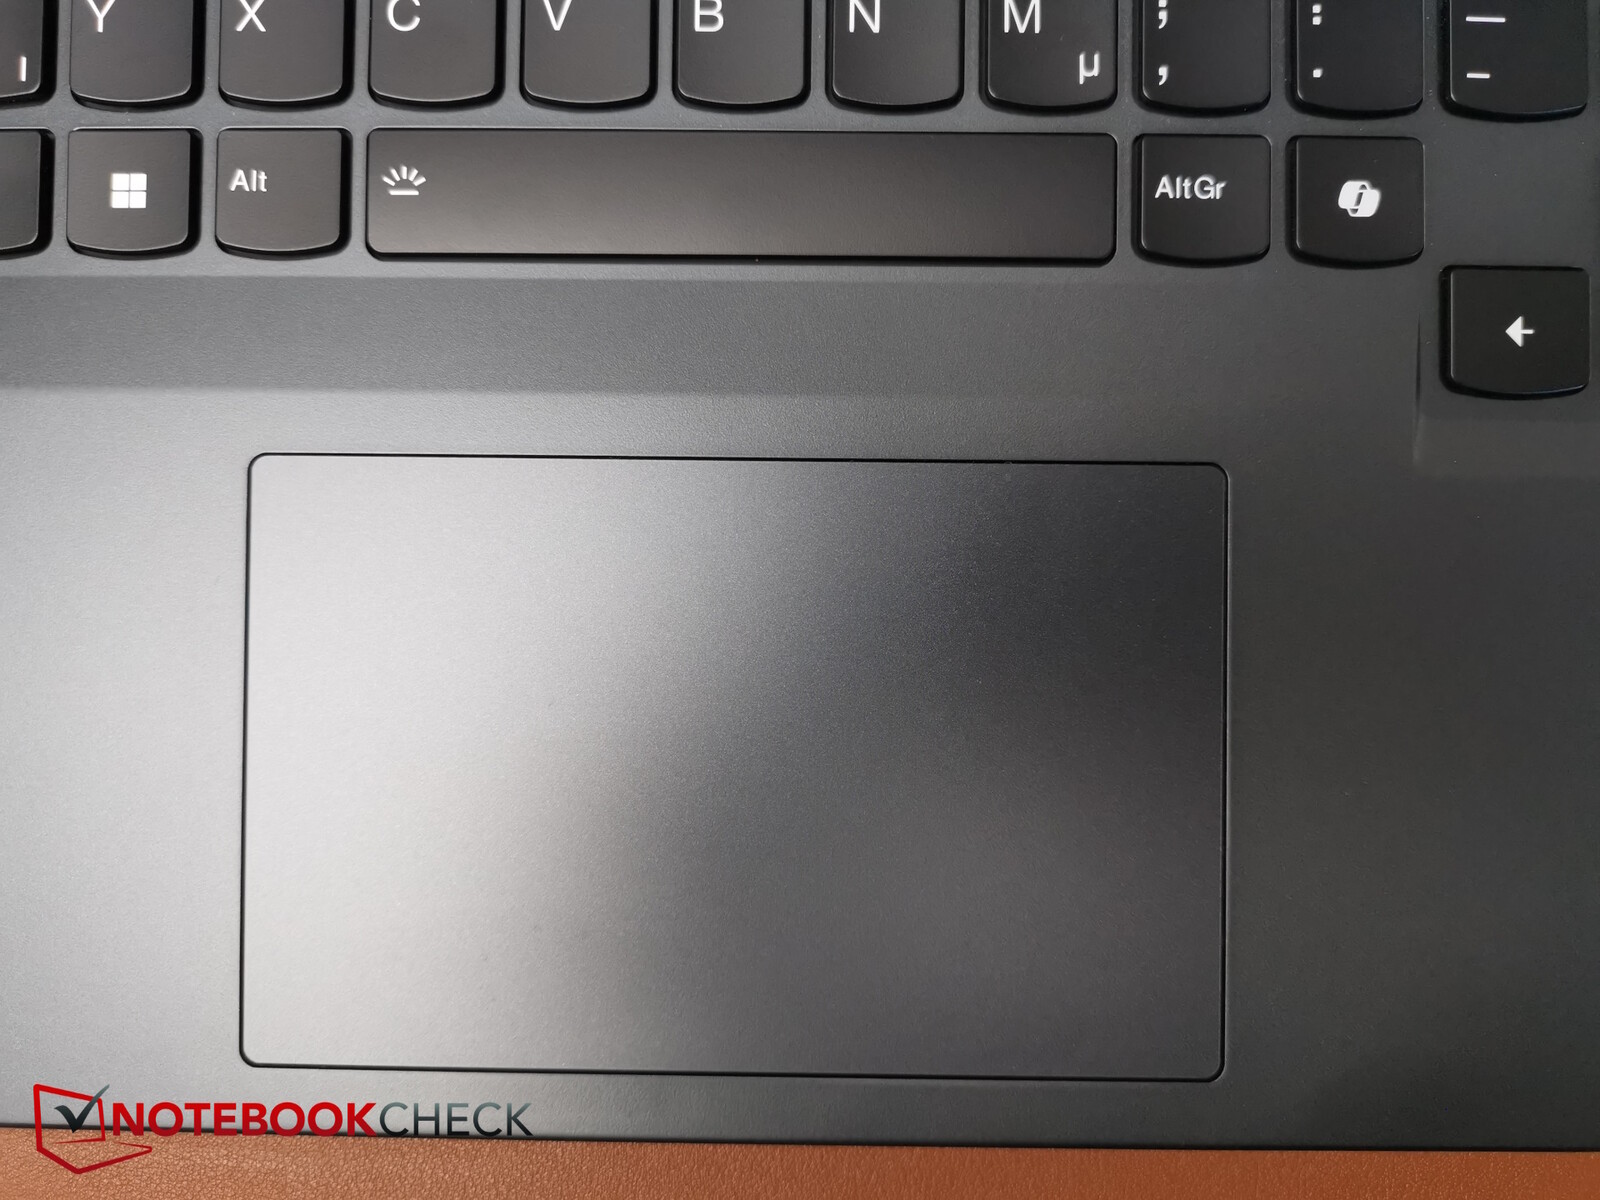
(±) The palmrests and touchpad can get very hot to the touch with a maximum of 36 °C / 96.8 F.
(-) The average temperature of the palmrest area of similar devices was 28.9 °C / 84 F (-7.1 °C / -12.8 F).
| Lenovo Legion Pro 5 16IRX9 G9 Intel Core i7-14700HX, NVIDIA GeForce RTX 4060 Laptop GPU | HP Victus 16 (2024) Intel Core i7-14700HX, NVIDIA GeForce RTX 4060 Laptop GPU | Dell G16, i7-13650HX, RTX 4060 Intel Core i7-13650HX, NVIDIA GeForce RTX 4060 Laptop GPU | SCHENKER XMG Core 15 (M24) AMD Ryzen 7 8845HS, NVIDIA GeForce RTX 4060 Laptop GPU | Lenovo Legion Pro 5 16IRX9 Intel Core i9-14900HX, NVIDIA GeForce RTX 4070 Laptop GPU | Lenovo Legion 5 16IRX G9 Intel Core i7-14650HX, NVIDIA GeForce RTX 4060 Laptop GPU | |
|---|---|---|---|---|---|---|
| Heat | 19% | 3% | -2% | 8% | 17% | |
| Maximum Upper Side * | 50 | 50 -0% | 49 2% | 52 -4% | 43.8 12% | 40.4 19% |
| Maximum Bottom * | 57 | 50 12% | 58 -2% | 61 -7% | 55.4 3% | 43.8 23% |
| Idle Upper Side * | 36 | 25 31% | 35 3% | 35 3% | 32.8 9% | 30.3 16% |
| Idle Bottom * | 39 | 26 33% | 35 10% | 39 -0% | 36 8% | 35.3 9% |
* ... smaller is better
发言人
扬声器在同类产品中并不突出:音量适中,几乎没有低音。标准耳机插孔可连接模拟设备。
Lenovo Legion Pro 5 16IRX9 G9 audio analysis
(±) | speaker loudness is average but good (77.13 dB)
Bass 100 - 315 Hz
(-) | nearly no bass - on average 18.3% lower than median
(±) | linearity of bass is average (12% delta to prev. frequency)
Mids 400 - 2000 Hz
(±) | higher mids - on average 6.9% higher than median
(+) | mids are linear (4.9% delta to prev. frequency)
Highs 2 - 16 kHz
(+) | balanced highs - only 4.5% away from median
(±) | linearity of highs is average (9.5% delta to prev. frequency)
Overall 100 - 16.000 Hz
(±) | linearity of overall sound is average (21.6% difference to median)
Compared to same class
» 76% of all tested devices in this class were better, 5% similar, 19% worse
» The best had a delta of 6%, average was 18%, worst was 132%
Compared to all devices tested
» 59% of all tested devices were better, 7% similar, 34% worse
» The best had a delta of 4%, average was 24%, worst was 134%
Dell G16, i7-13650HX, RTX 4060 audio analysis
(±) | speaker loudness is average but good (80.55 dB)
Bass 100 - 315 Hz
(-) | nearly no bass - on average 25.1% lower than median
(-) | bass is not linear (18.9% delta to prev. frequency)
Mids 400 - 2000 Hz
(±) | higher mids - on average 8% higher than median
(+) | mids are linear (5.9% delta to prev. frequency)
Highs 2 - 16 kHz
(+) | balanced highs - only 3.5% away from median
(±) | linearity of highs is average (8.6% delta to prev. frequency)
Overall 100 - 16.000 Hz
(±) | linearity of overall sound is average (23.4% difference to median)
Compared to same class
» 83% of all tested devices in this class were better, 5% similar, 12% worse
» The best had a delta of 6%, average was 18%, worst was 132%
Compared to all devices tested
» 68% of all tested devices were better, 6% similar, 26% worse
» The best had a delta of 4%, average was 24%, worst was 134%
耗电量
要测量Legion Pro 5 的真实闲置功耗并非易事,因为这款笔记本电脑几乎持续不断地从插座中消耗约 50 瓦的功率,即使在闲置状态下也是如此!如果等待很长时间,其闲置功耗最终会降低到相对正常的数值(15 至 20 瓦),但只要用 F 键改变笔记本电脑的亮度,其功耗就会回升到 50 瓦,而且会持续很长时间。因此,表中给出的空闲值相当低。
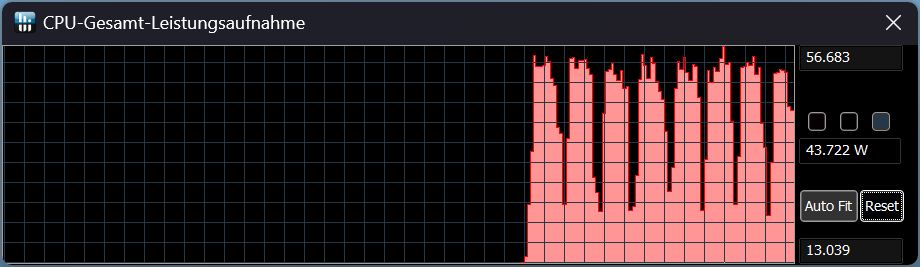
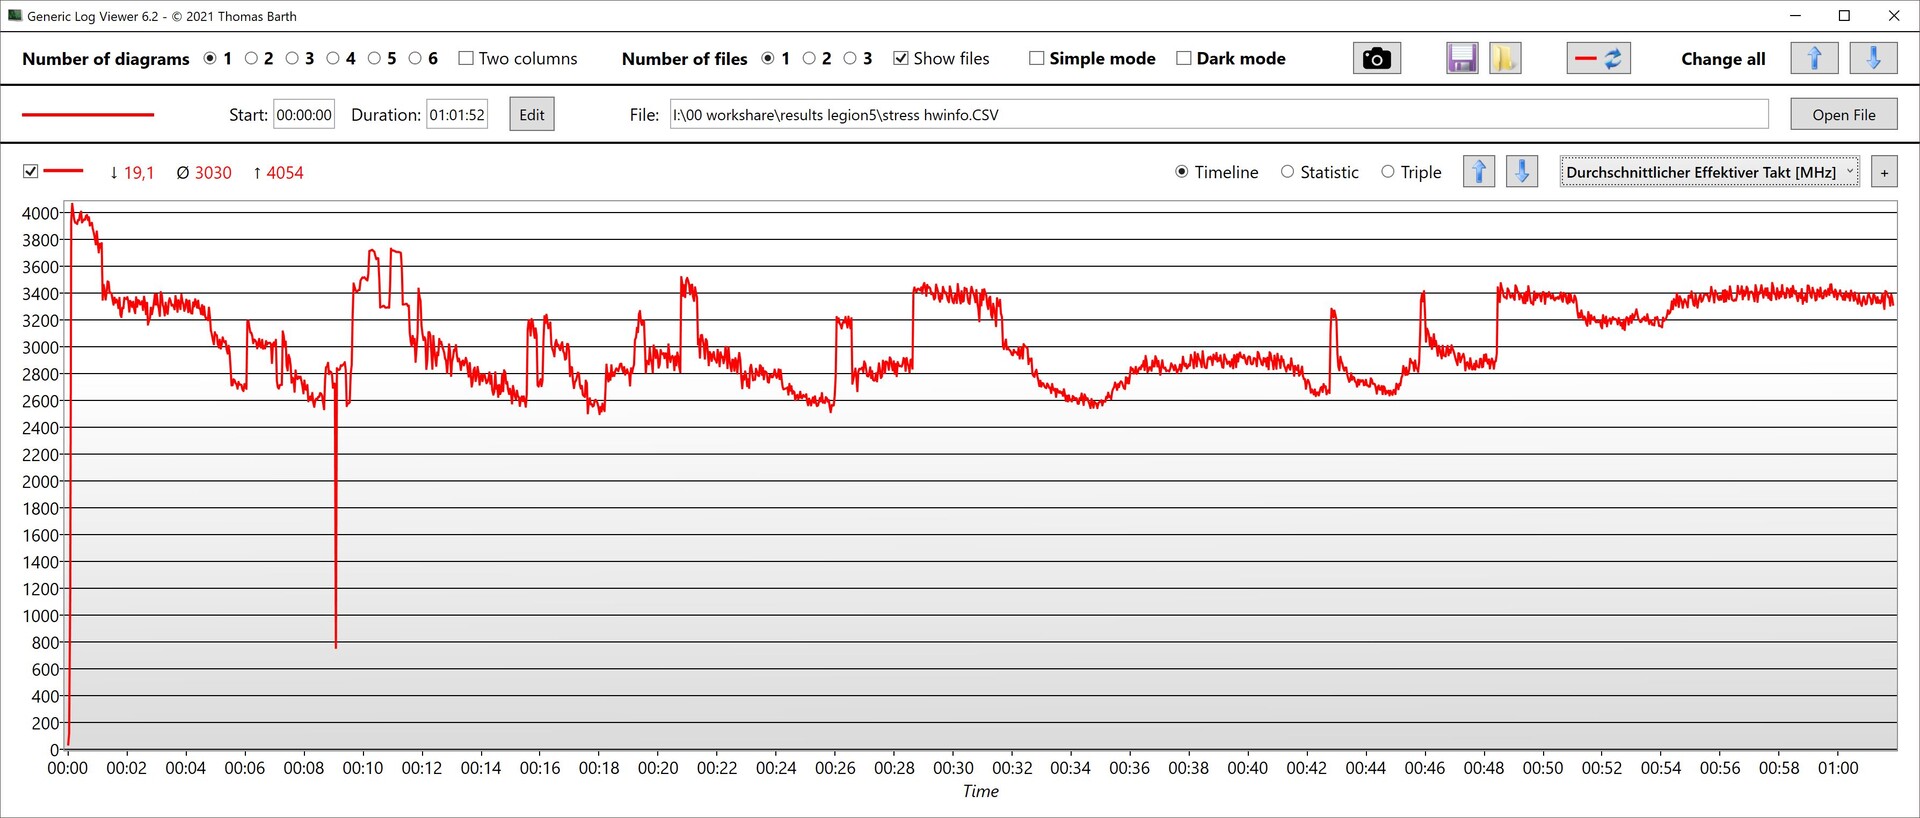
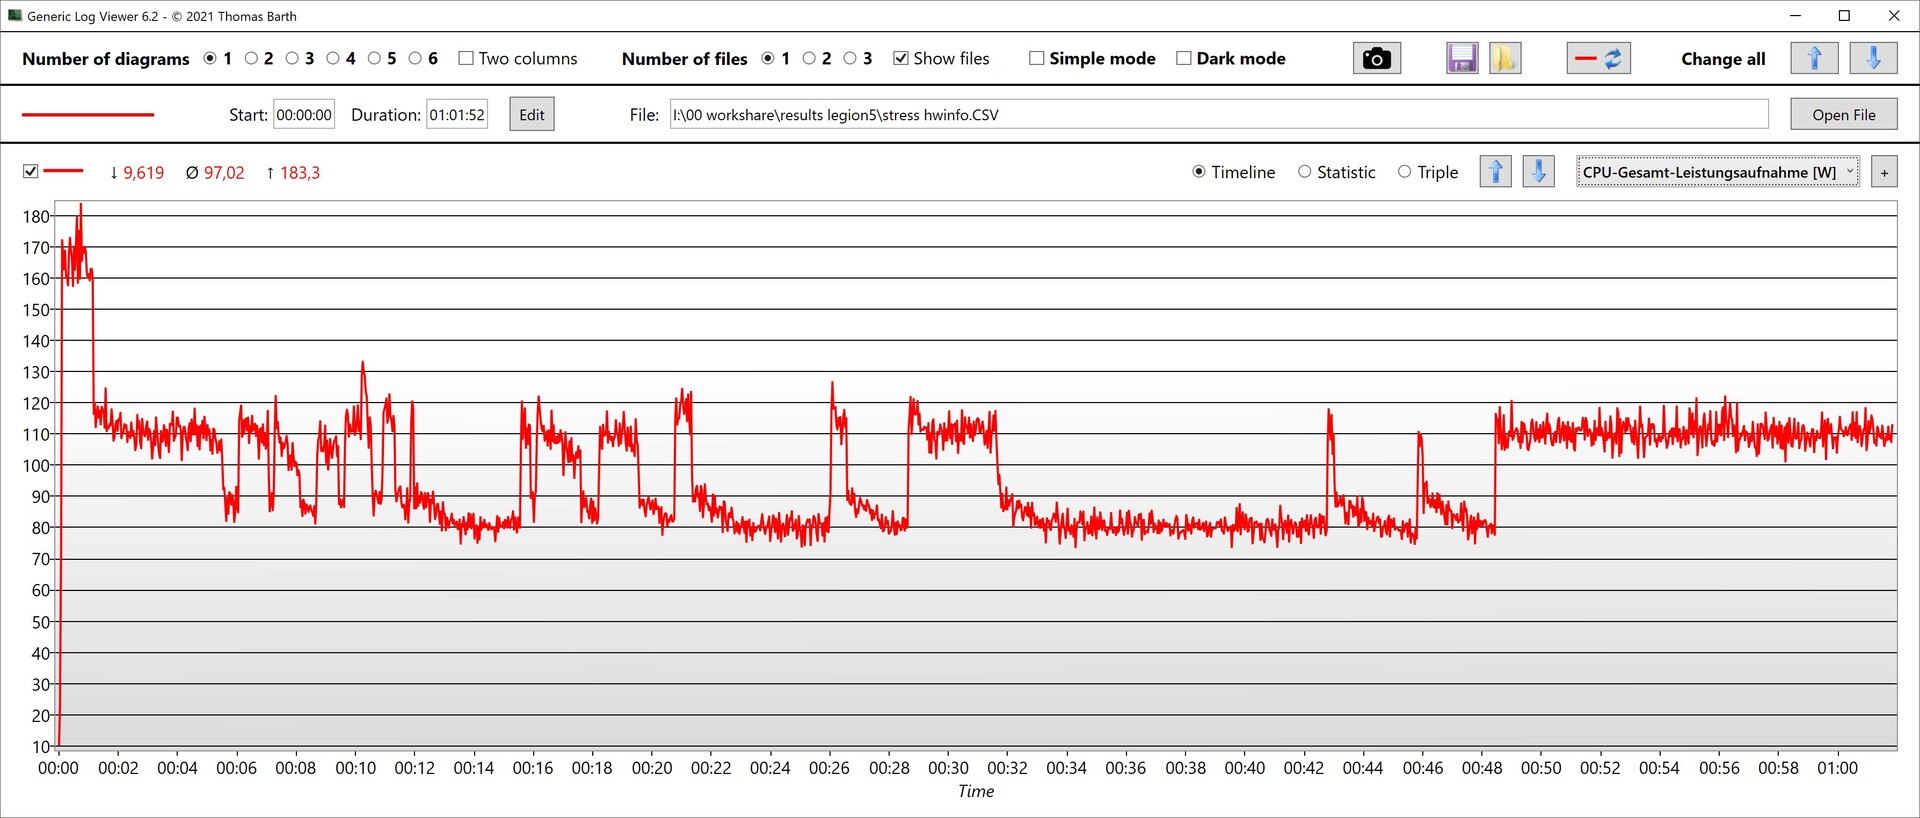
从我们的消耗曲线图中可以看出,在大负载情况下,其消耗和 GPU 性能波动相当大,尤其是当 CPU 和 GPU 承受同样压力时,比如在我们的压力测试中。

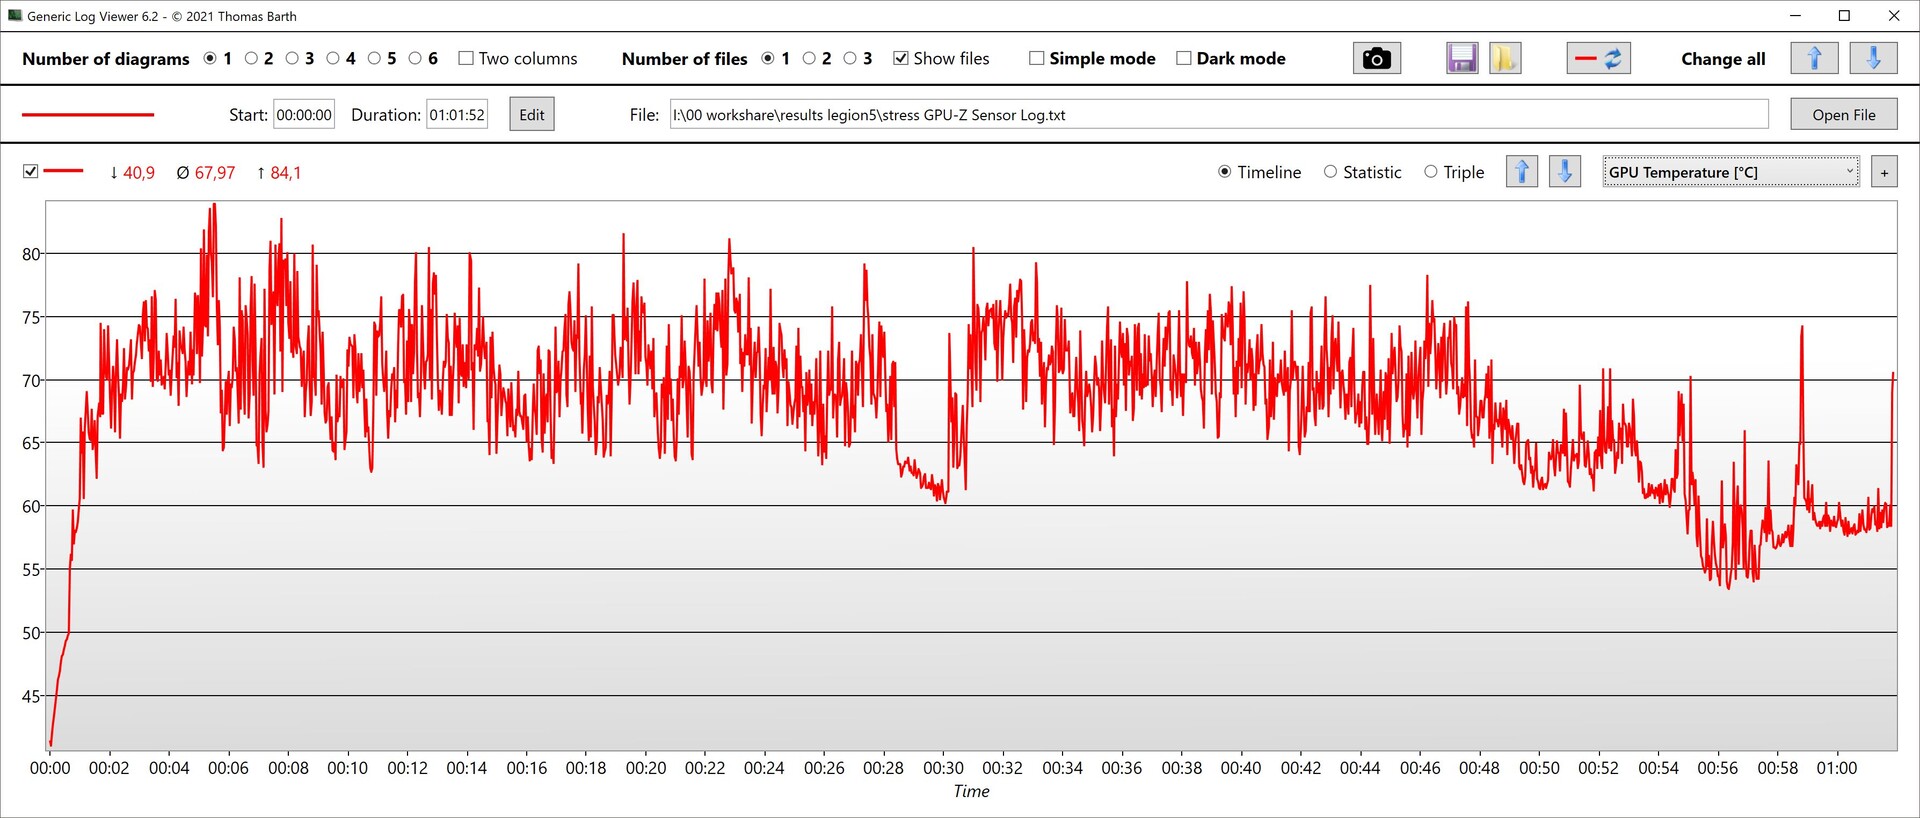
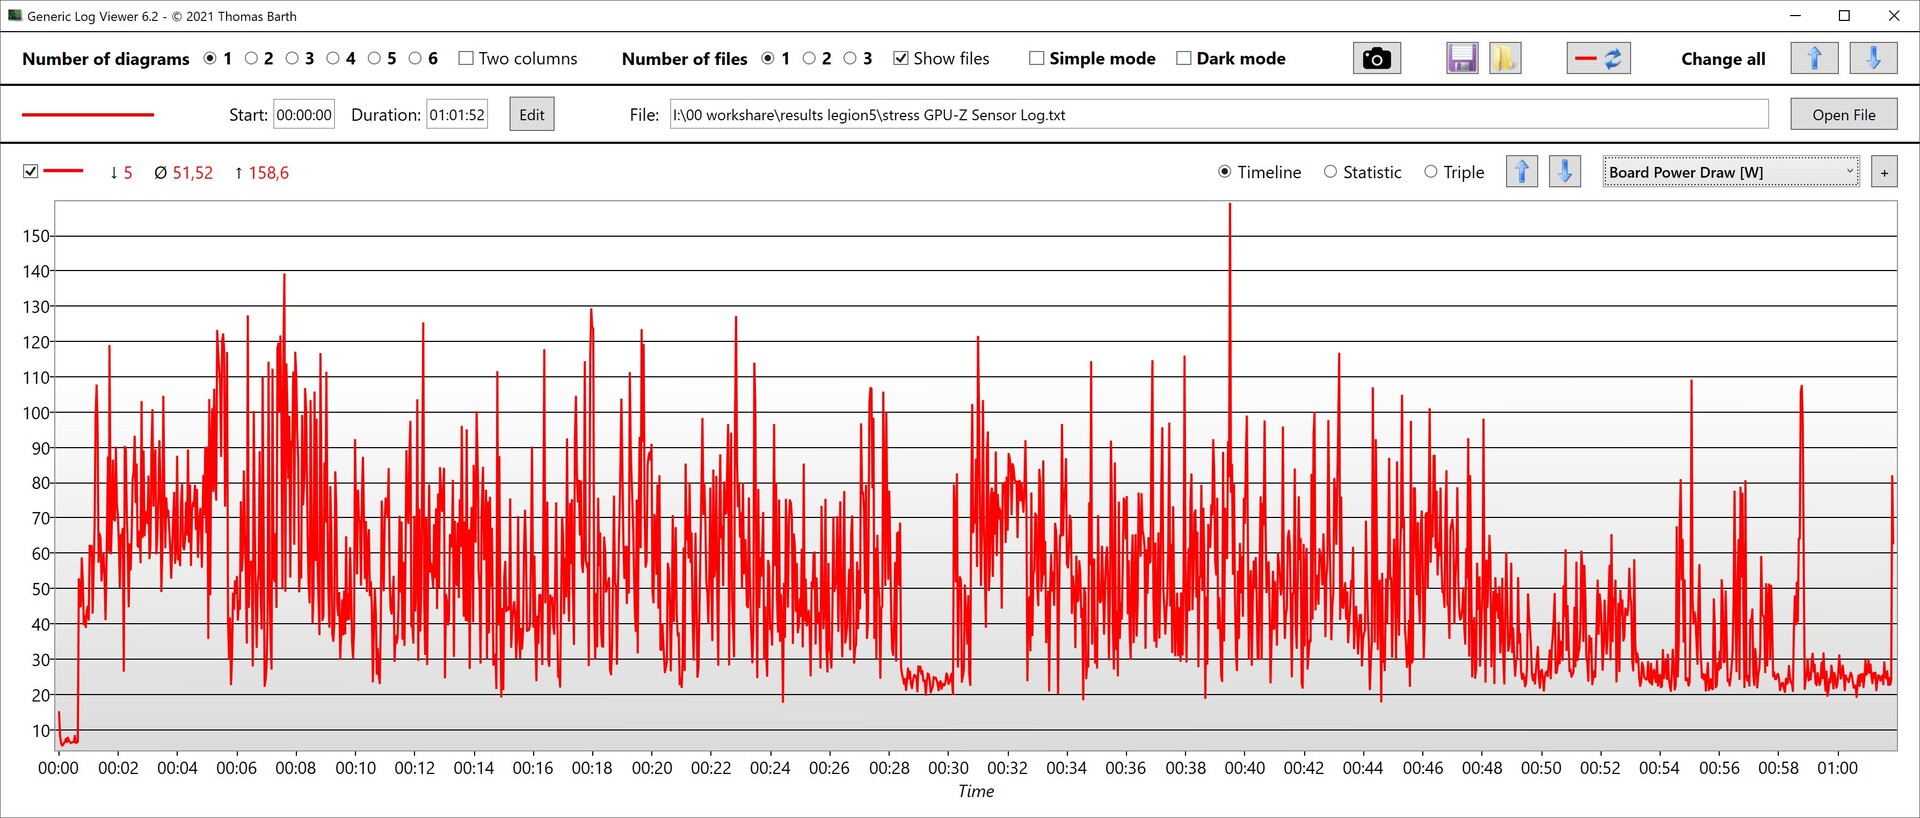
在运行《赛博朋克 2077》时,我们测得的平均耗电量为 229 瓦。在压力测试中,我们的测量设备记录的最大耗电量为 297 瓦,而这只是短期耗电量。
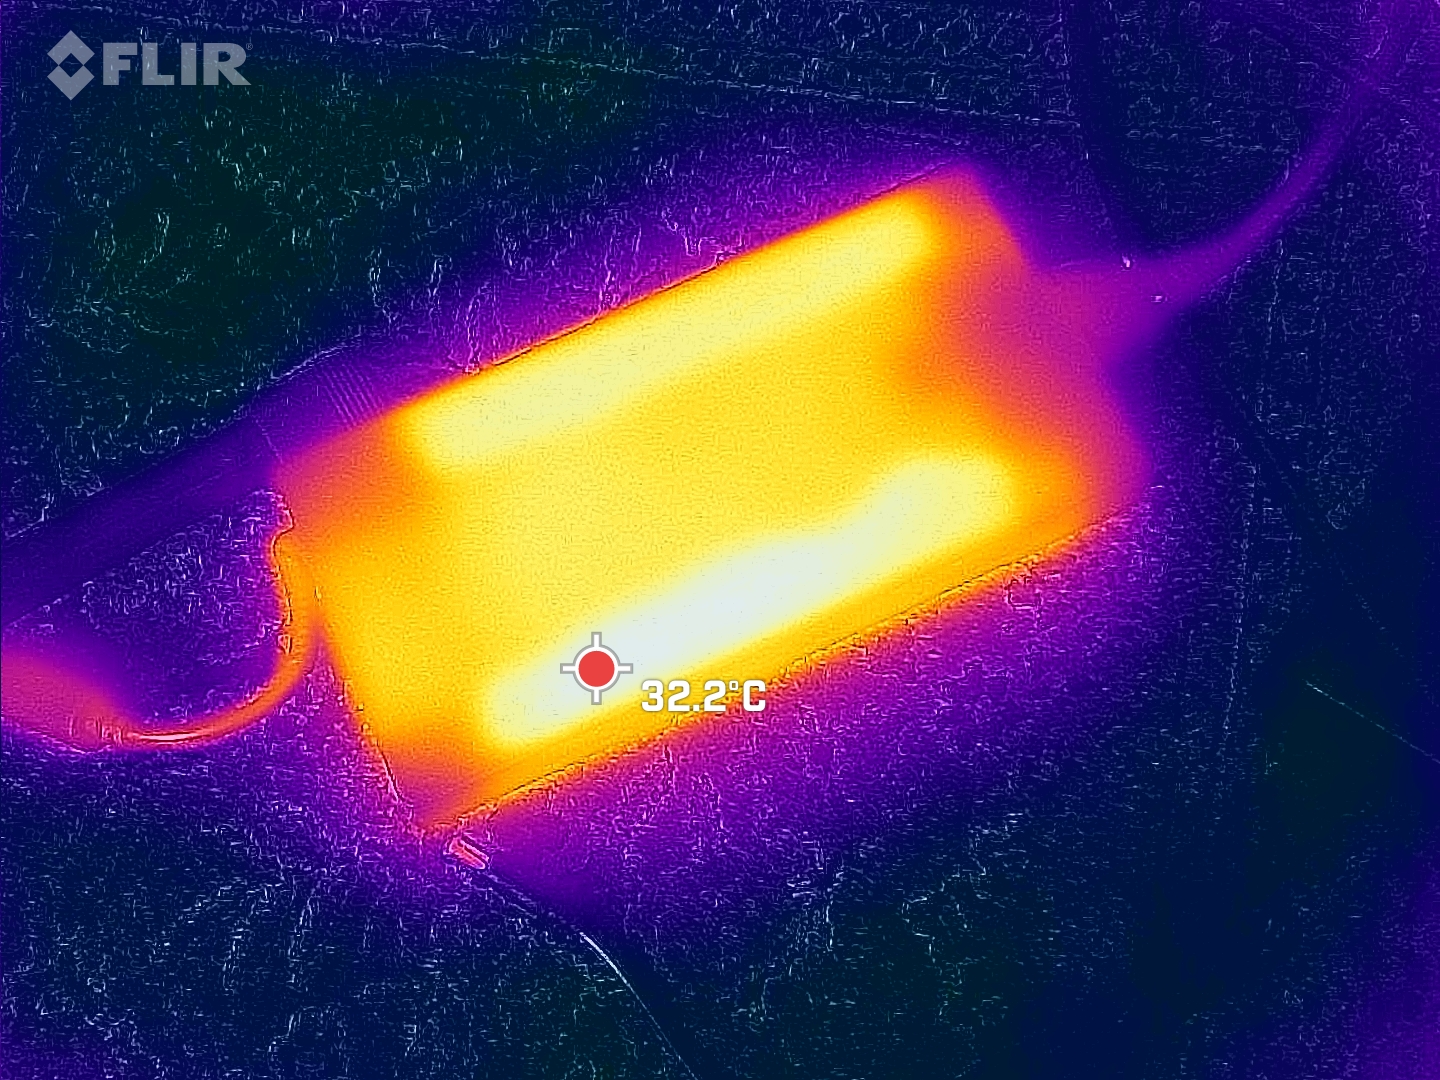
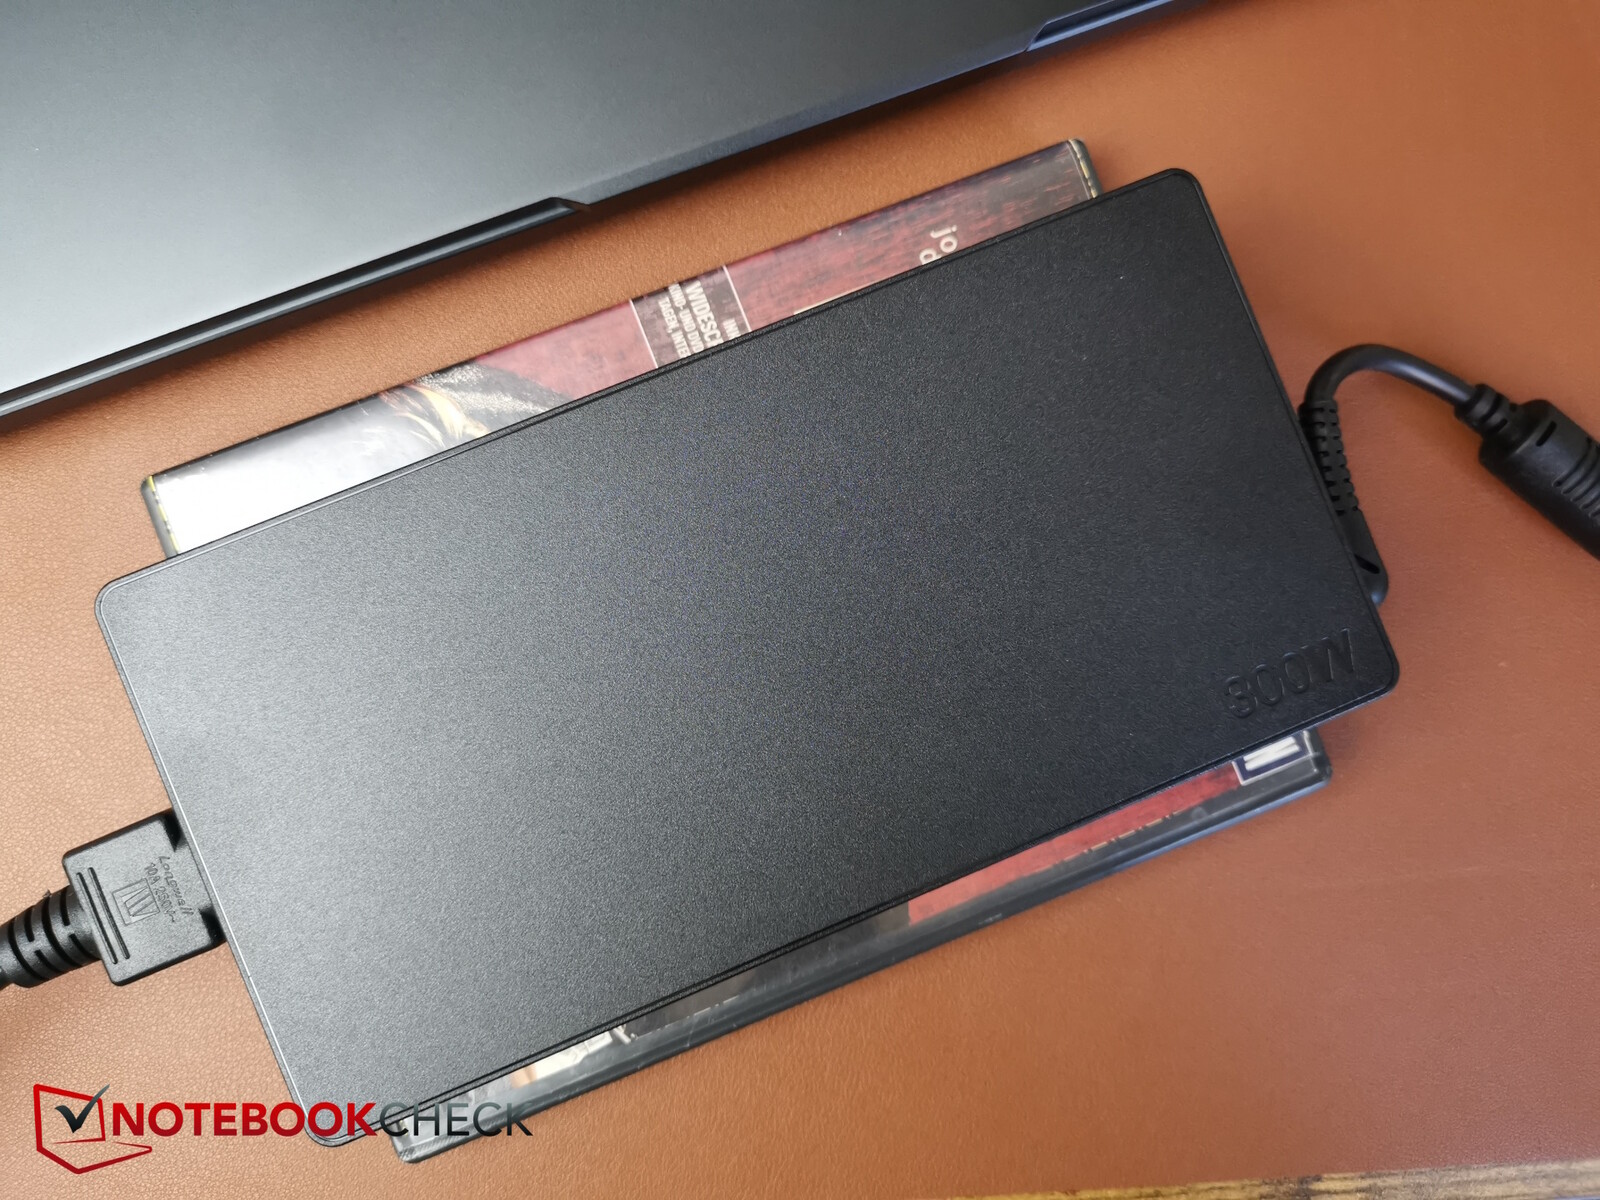
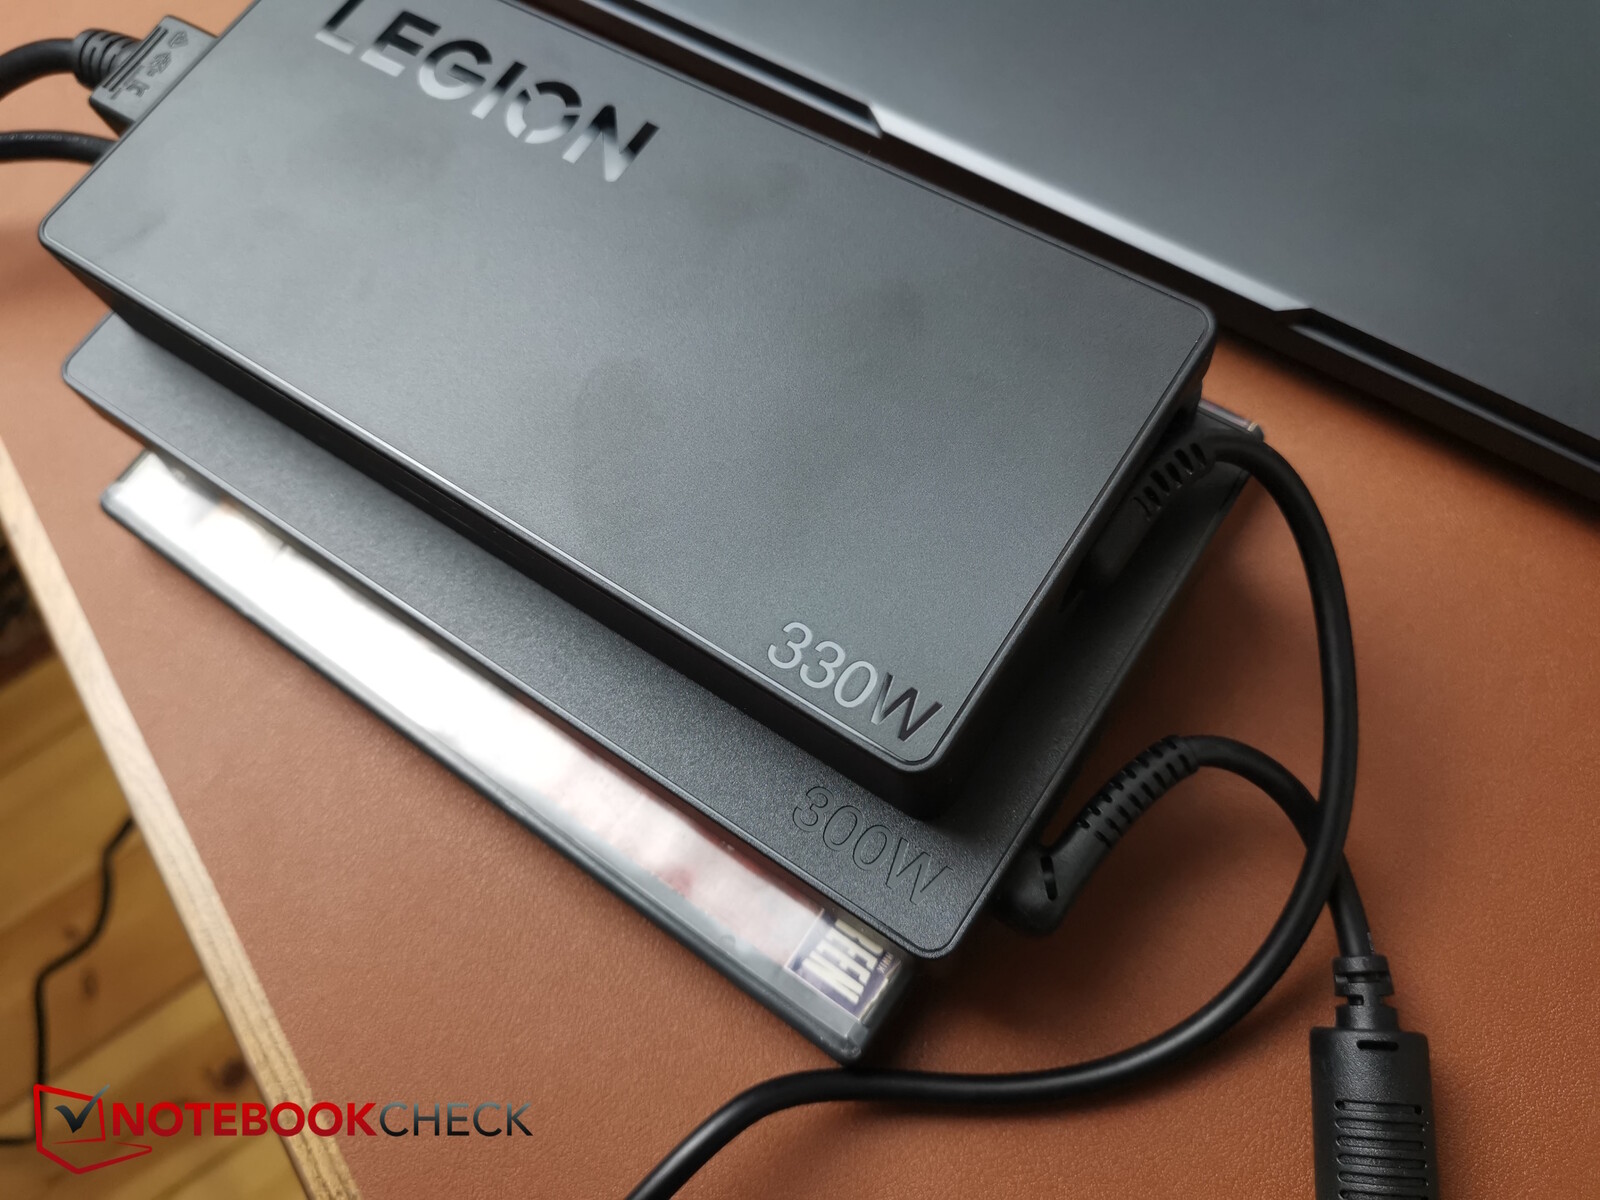
说到电源装置:Legion Pro 5i 所配备的 300 瓦电源要比价格更高的Legion 9i 的 330 瓦电源大得多。
| Off / Standby | |
| Idle | |
| Load |
|
Key:
min: | |
| Lenovo Legion Pro 5 16IRX9 G9 NVIDIA GeForce RTX 4060 Laptop GPU, i7-14700HX, Samsung PM9A1 MZVL21T0HCLR | HP Victus 16 (2024) NVIDIA GeForce RTX 4060 Laptop GPU, i7-14700HX, Kioxia XG8 KXG80ZNV512G | Dell G16, i7-13650HX, RTX 4060 NVIDIA GeForce RTX 4060 Laptop GPU, i7-13650HX, WD PC SN740 SDDPNQD-1T00 | SCHENKER XMG Core 15 (M24) NVIDIA GeForce RTX 4060 Laptop GPU, R7 8845HS, Samsung 990 Pro 1 TB | Lenovo Legion Pro 5 16IRX9 NVIDIA GeForce RTX 4070 Laptop GPU, i9-14900HX, Samsung PM9A1 MZVL21T0HCLR | Lenovo Legion 5 16IRX G9 NVIDIA GeForce RTX 4060 Laptop GPU, i7-14650HX, Samsung PM9A1 MZVL21T0HCLR | |
|---|---|---|---|---|---|---|
| Power Consumption | 11% | 14% | 23% | -22% | -8% | |
| Idle 150cd/m2 * | 16.4 | 15.4 6% | 14 15% | 11.8 28% | 21 -28% | 17.6 -7% |
| 3DMark06 Return To Proxycon * | 124 | 104 16% | 77.5 37% | |||
| Cyberpunk 2077 FHD ultra no FSR 150cd * | 229 | |||||
| 1280x720 Prime95 28.10 and Furmark 1.25 * | 211 | 176.9 16% | 190 10% | 200.6 5% | 245 -16% | 227 -8% |
* ... smaller is better
Power consumption Witcher 3 / stress test
Power consumption with external monitor
运行时间
联想为这款笔记本电脑配备了 80 瓦时的电池;除了酷睿 15 配备了更大的电池外,其他竞争机型的电池容量都差不多。
我们的测试设备在Wi-Fi和视频测试中持续了5个多小时,亮度降低到150尼特--这是一个平均值或略低于平均值的值,而竞争对手往往超过这个值。
| Lenovo Legion Pro 5 16IRX9 G9 i7-14700HX, NVIDIA GeForce RTX 4060 Laptop GPU, 80 Wh | HP Victus 16 (2024) i7-14700HX, NVIDIA GeForce RTX 4060 Laptop GPU, 83 Wh | Dell G16, i7-13650HX, RTX 4060 i7-13650HX, NVIDIA GeForce RTX 4060 Laptop GPU, 86 Wh | SCHENKER XMG Core 15 (M24) R7 8845HS, NVIDIA GeForce RTX 4060 Laptop GPU, 99.8 Wh | Lenovo Legion Pro 5 16IRX9 i9-14900HX, NVIDIA GeForce RTX 4070 Laptop GPU, 80 Wh | Lenovo Legion 5 16IRX G9 i7-14650HX, NVIDIA GeForce RTX 4060 Laptop GPU, 80 Wh | Average of class Gaming | |
|---|---|---|---|---|---|---|---|
| Battery Runtime | 66% | 6% | 109% | -22% | 24% | 16% | |
| H.264 | 312 | 381 22% | 608 95% | 576 85% | 447 ? 43% | ||
| WiFi v1.3 | 308 | 511 66% | 378 23% | 889 189% | 290 -6% | 444 44% | 387 ? 26% |
| Load | 105 | 76 -28% | 151 44% | 65 -38% | 46 -56% | 84.5 ? -20% | |
| Reader / Idle | 403 | 585 ? |
Pros
Cons
结论--全面关注性能


Legion Pro 5 只注重性能。其已经非常强大的 i7-14700HX 和 RTX 4060 的运行速度超过了平均水平,单纯就性能而言,它们甚至接近 i9-14900HX 和 RTX 4070 的配置。得益于笔记本电脑潜在的极高色彩精确度显示屏,Legion Pro 对内容创作者来说也很有吸引力。
不过,令人遗憾的是,开箱后屏幕的校准精度并不高。考虑到它的重点是游戏性能,制造商应该注意到散热系统在右侧比在 WASD 侧的效果更好一些,这对游戏玩家来说很重要。其他不足之处还包括固态硬盘的热节流以及设备的部分高空闲性能,需要相当长的时间才能恢复平静。尽管如此,总的来说还是利大于弊。
如果你正在寻找一款性能超强的游戏笔记本电脑,那么联想Legion Pro 5i 绝对是你的不二之选。内容创作者可能也会感到满意,不过,一些较小的细节还有更多潜在的优化空间。
价格和供应情况
您可以直接从制造商处订购联想Legion Pro 5i。我们测试设备的 MRSP 为 1,395 美元。
请注意:我们更新了评级系统,第 8 版的结果与第 7 版的结果不可比。更多信息 请点击此处.
Lenovo Legion Pro 5 16IRX9 G9
- 07/03/2024 v8
Christian Hintze
 Total Sustainability Score:
 Transparency
The selection of devices to be reviewed is made by our editorial team. The test sample was provided to the author as a loan by the manufacturer or retailer for the purpose of this review. The lender had no influence on this review, nor did the manufacturer receive a copy of this review before publication. There was no obligation to publish this review. We never accept compensation or payment in return for our reviews. As an independent media company, Notebookcheck is not subjected to the authority of manufacturers, retailers or publishers.
This is how Notebookcheck is testing
Every year, Notebookcheck independently reviews hundreds of laptops and smartphones using standardized procedures to ensure that all results are comparable. We have continuously developed our test methods for around 20 years and set industry standards in the process. In our test labs, high-quality measuring equipment is utilized by experienced technicians and editors. These tests involve a multi-stage validation process. Our complex rating system is based on hundreds of well-founded measurements and benchmarks, which maintains objectivity. Further information on our test methods can be found here.
Price comparison

