

框架笔记本 13.5 Ryzen AI 9 评测:跳过英特尔版本,获得更佳性能
速度越来越快。
以可持续发展为名,Framework 正在从其老化的设计中榨取尽可能多的资源。就原始性能而言,它的大部分工作都比预期的要好,但我们仍希望看到一些关键功能。Allen Ngo (translated by DeepL / Ninh Duy) Published 🇺🇸 🇫🇷 ...
结论 - 熟悉但更快
新的 Ryzen AI 9 HX 370 与 2024 Core Ultra 7 相比,升级幅度很大。 2024 Core Ultra 7或 Zen 4 Ryzen U配置的显著升级。在性能提升的同时,无需增加电源包络线或扩大冷却解决方案,就能保持与旧款笔记本电脑 13.5 配置的兼容性。
如果你不需要那么高的性能,那么旧配置的 13.5 笔记本电脑仍能以较低的价格提供基本相同的用户体验。顶级框架配置的价格明显越来越高,我们的测试机尤其突破了 2000 美元的上限。速度较慢、价格较低的 Core Ultra 配置可提供更长的电池续航时间以及四个相同的 USB-C 4.0 端口,如果不优先考虑原始性能,这也是一个不错的权衡选择。
已有五年历史的 Framework 设计在某些方面已经开始显出老态。200 万像素的网络摄像头、缺乏 OLED 或 P3 颜色选项以及相对较弱的扬声器都落后于最新的竞争机型,如来自 联想, 惠普或 戴尔.尽管 Laptop 13.5 系列采用了灵活的设计理念,但 Framework 仍未提供此类升级服务。
Pros
Cons
- $1,499.00HP 2024 OmniBook Ultra 14” 2.2K IPS Touchscreen Laptop 12-Core AMD Ryzen AI 9 HX 375 APU AMD Radeon Graphics 32GB LPDDR5 2TB SSD USB-C w/DP WiFi AX BT Webcam Backlit KB Fingerprint Windows 11 Home
- $1,499.00HP OmniBook Ultra 14 2024 Laptop, 12-Core AMD Ryzen AI 9 HX 375 APU, 14" 2.2K IPS Touchscreen Display, AMD Radeon Graphics, 32GB LPDDR5 2TB SSD, Backlit Keyboard, Fingerprint, Copilot+, Win11 Home
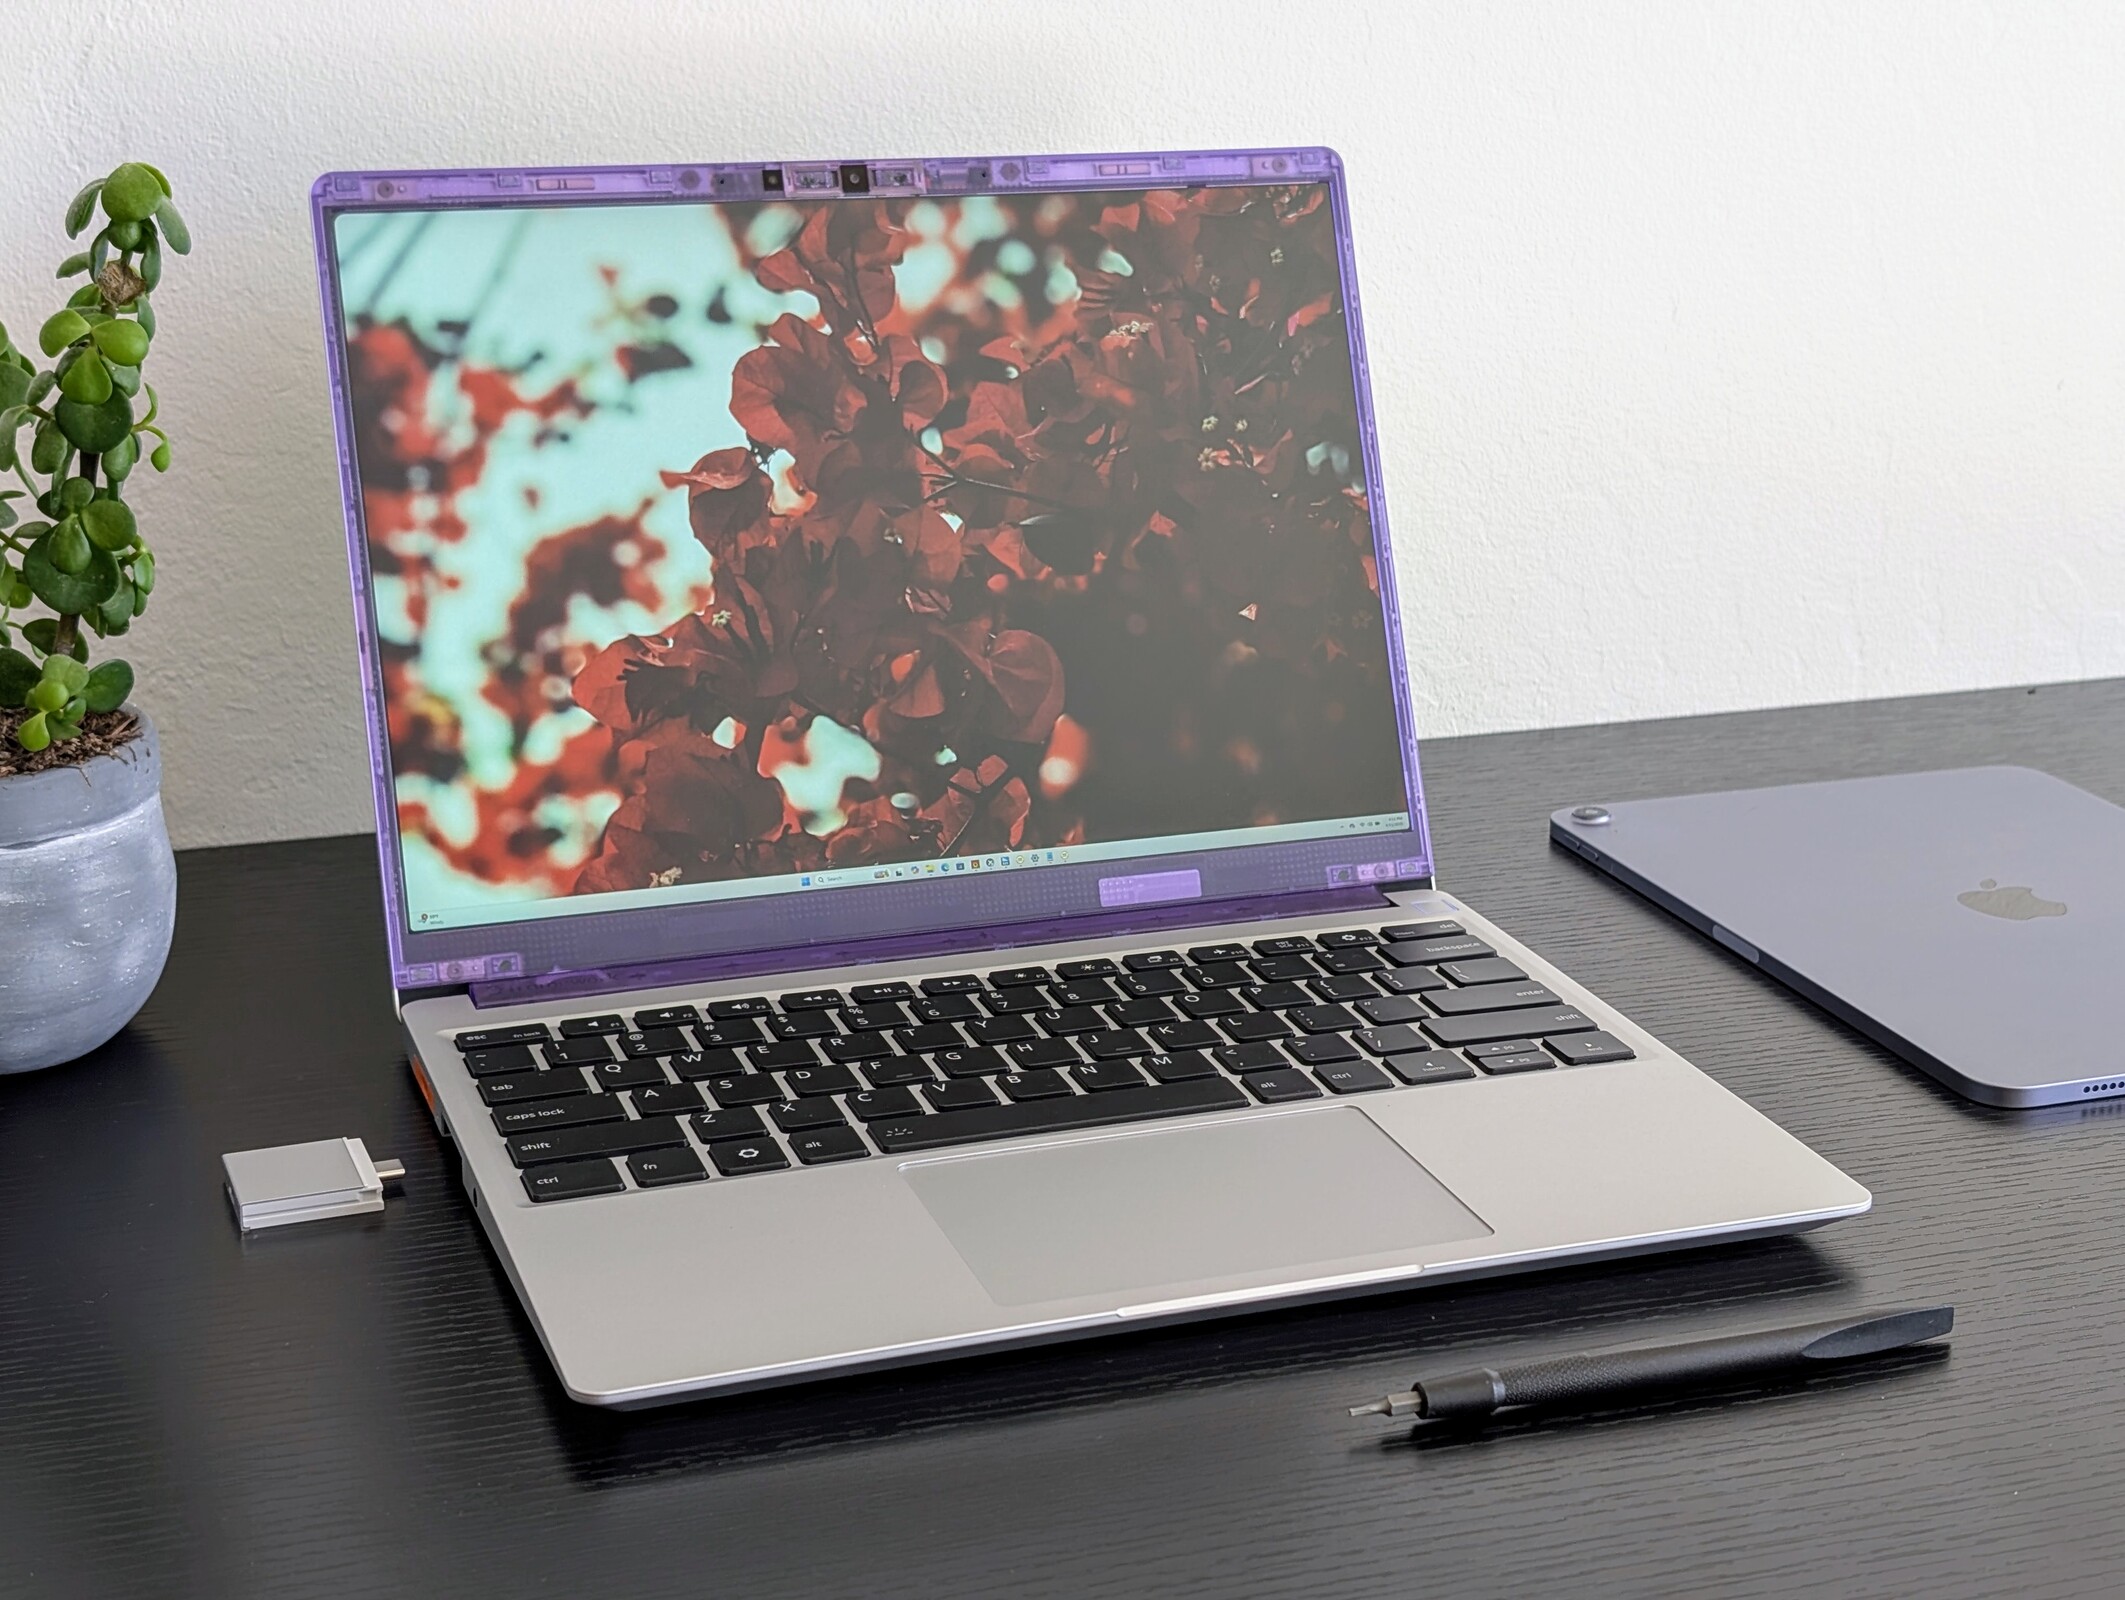
Framework 今年更新了其 13.5 笔记本电脑,采用 AMD Zen 5 HX 系列处理器,取代了去年的 Zen 4 U 系列酷睿 Ultra 7 处理器。机箱在其他方面完全相同,因此我们建议您查看我们对原机型的评测 原始型号了解该系统的更多物理特性。
我们的测试机是最高端的配置,配备 Ryzen AI 9 HX 370 CPU 和 2880 x 1920 120 Hz IPS 显示屏,售价超过 2100 美元。较低配置则采用 Ryzen AI 5 340 或 2256 x 1504 60 Hz 显示屏。
Laptop 13.5 的竞争对手包括流行的旗舰级专业消费者或商用笔记本电脑,如 联想 ThinkPad T14s, 戴尔 Pro 13或惠普 EliteBook 系列.
更多框架评论:
规格
案例
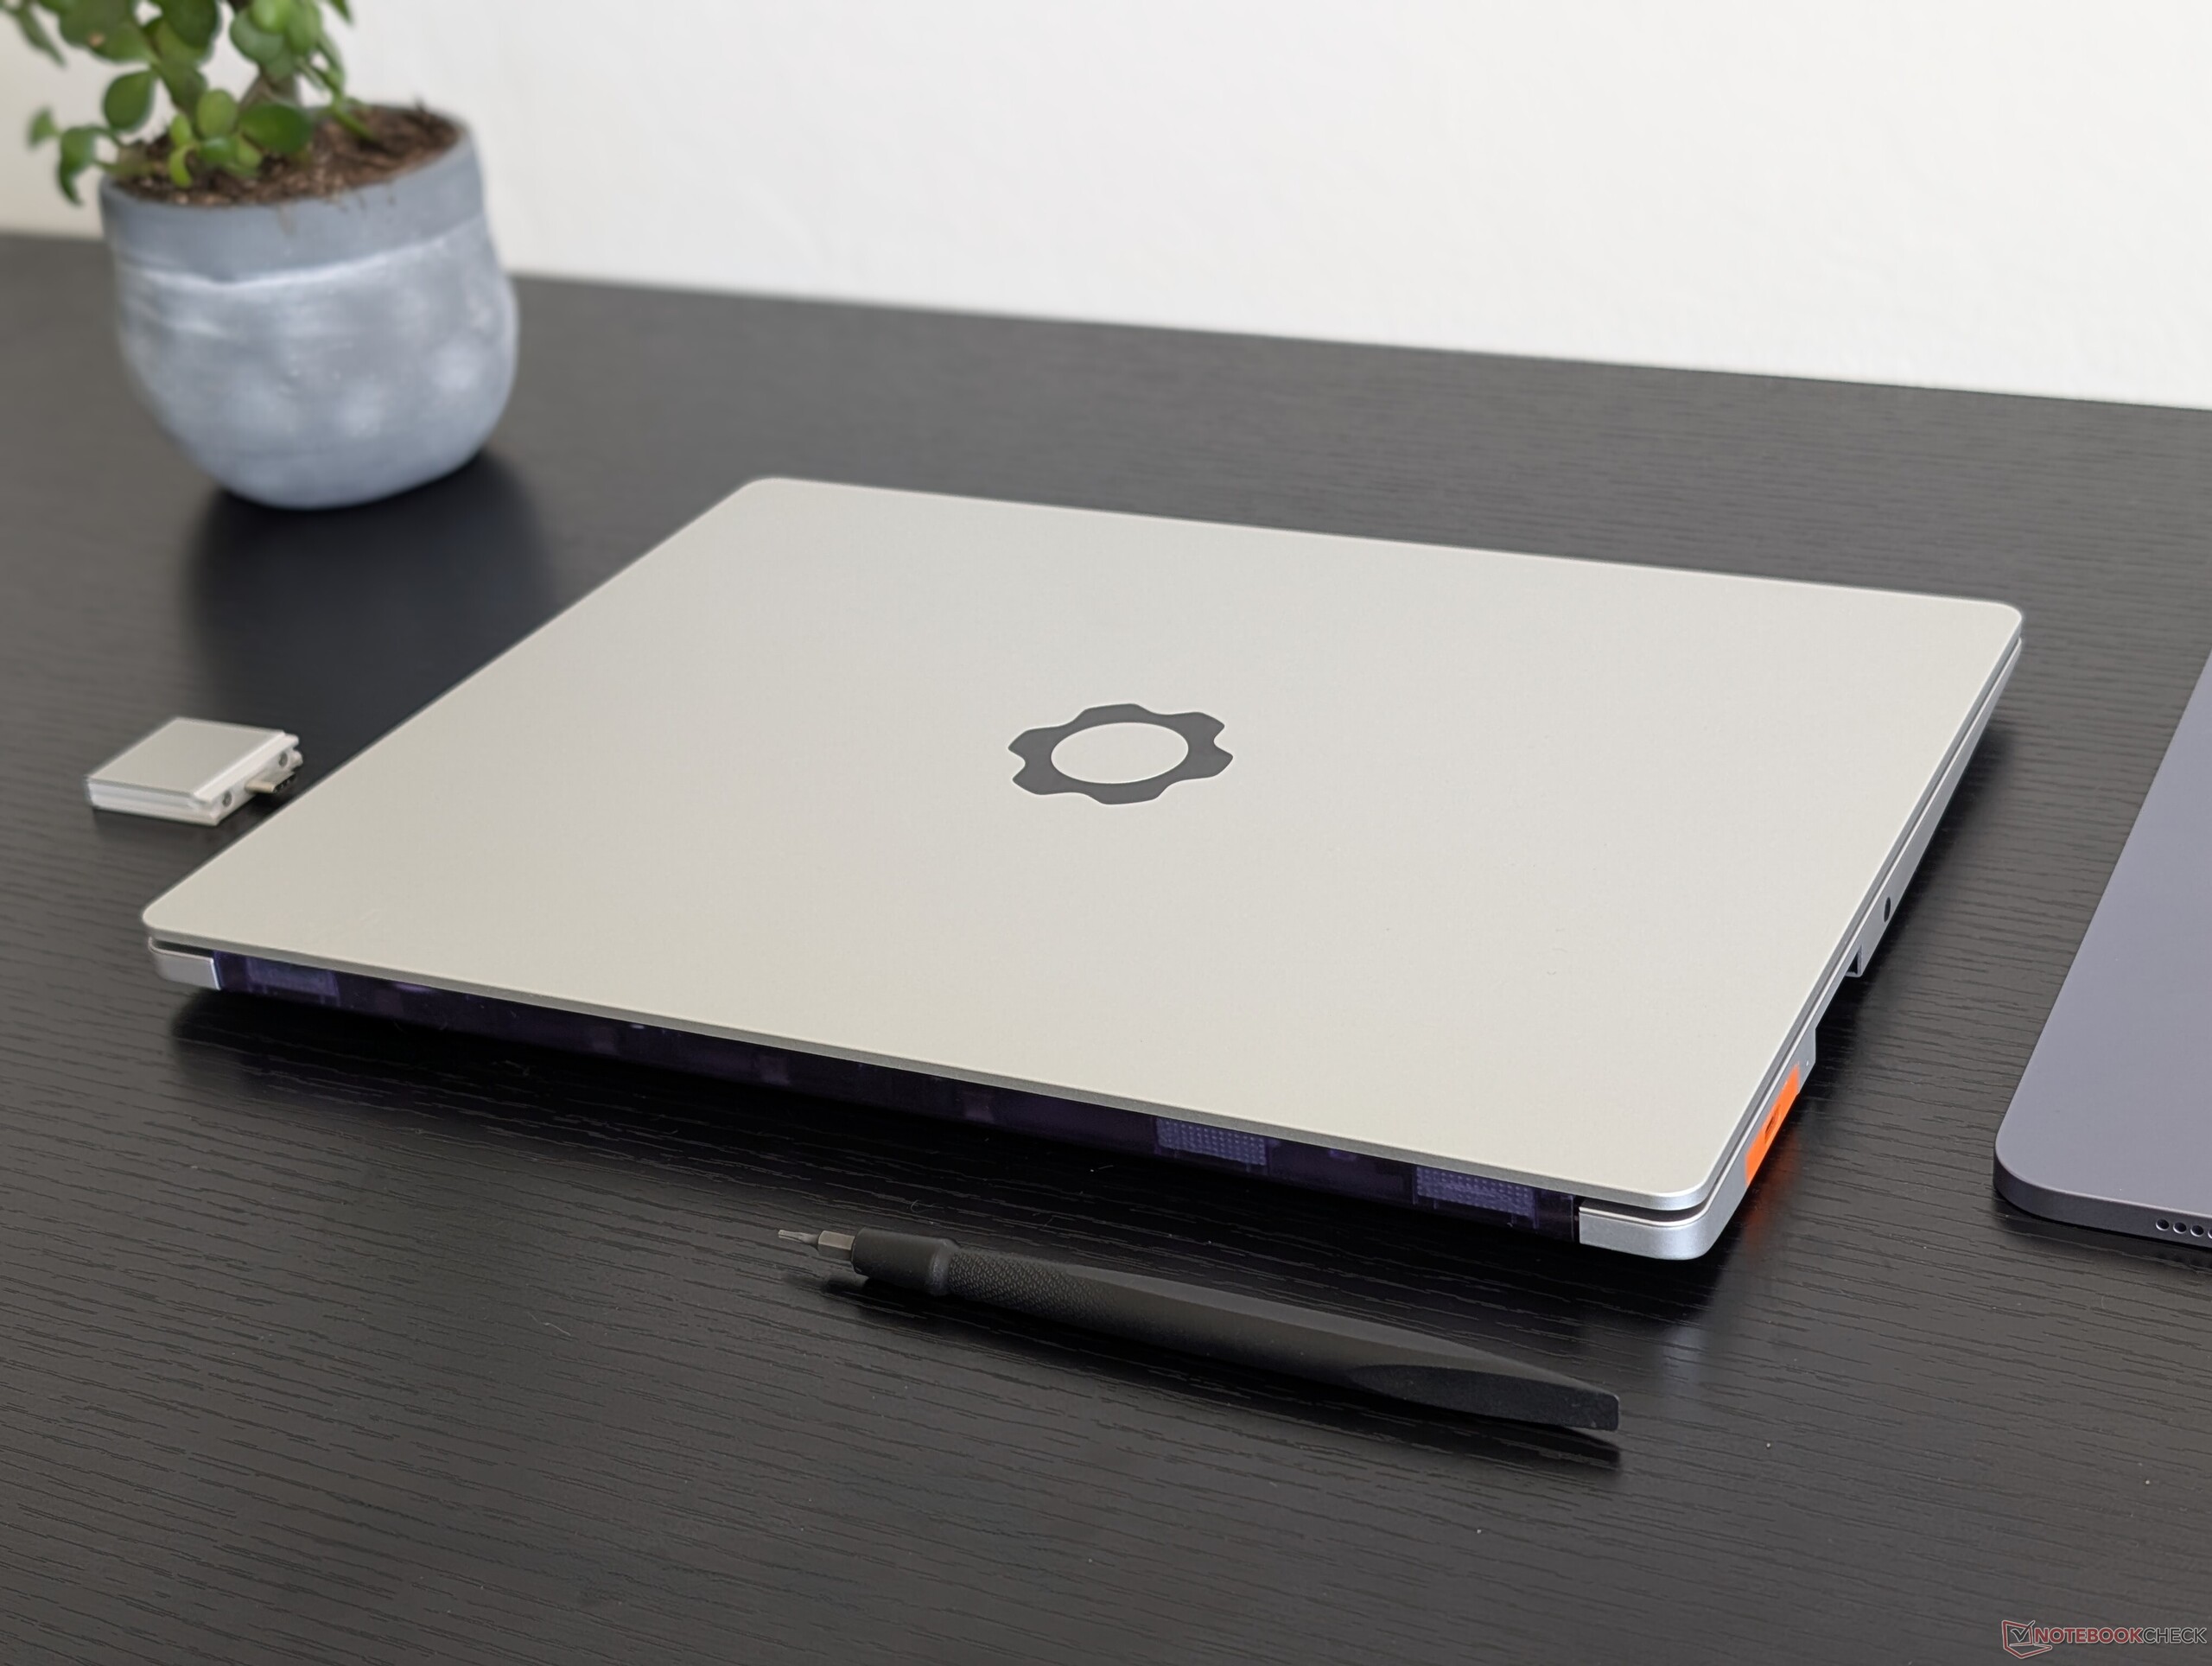
为了与现有的替换部件和配件保持兼容,机箱设计没有任何变化。
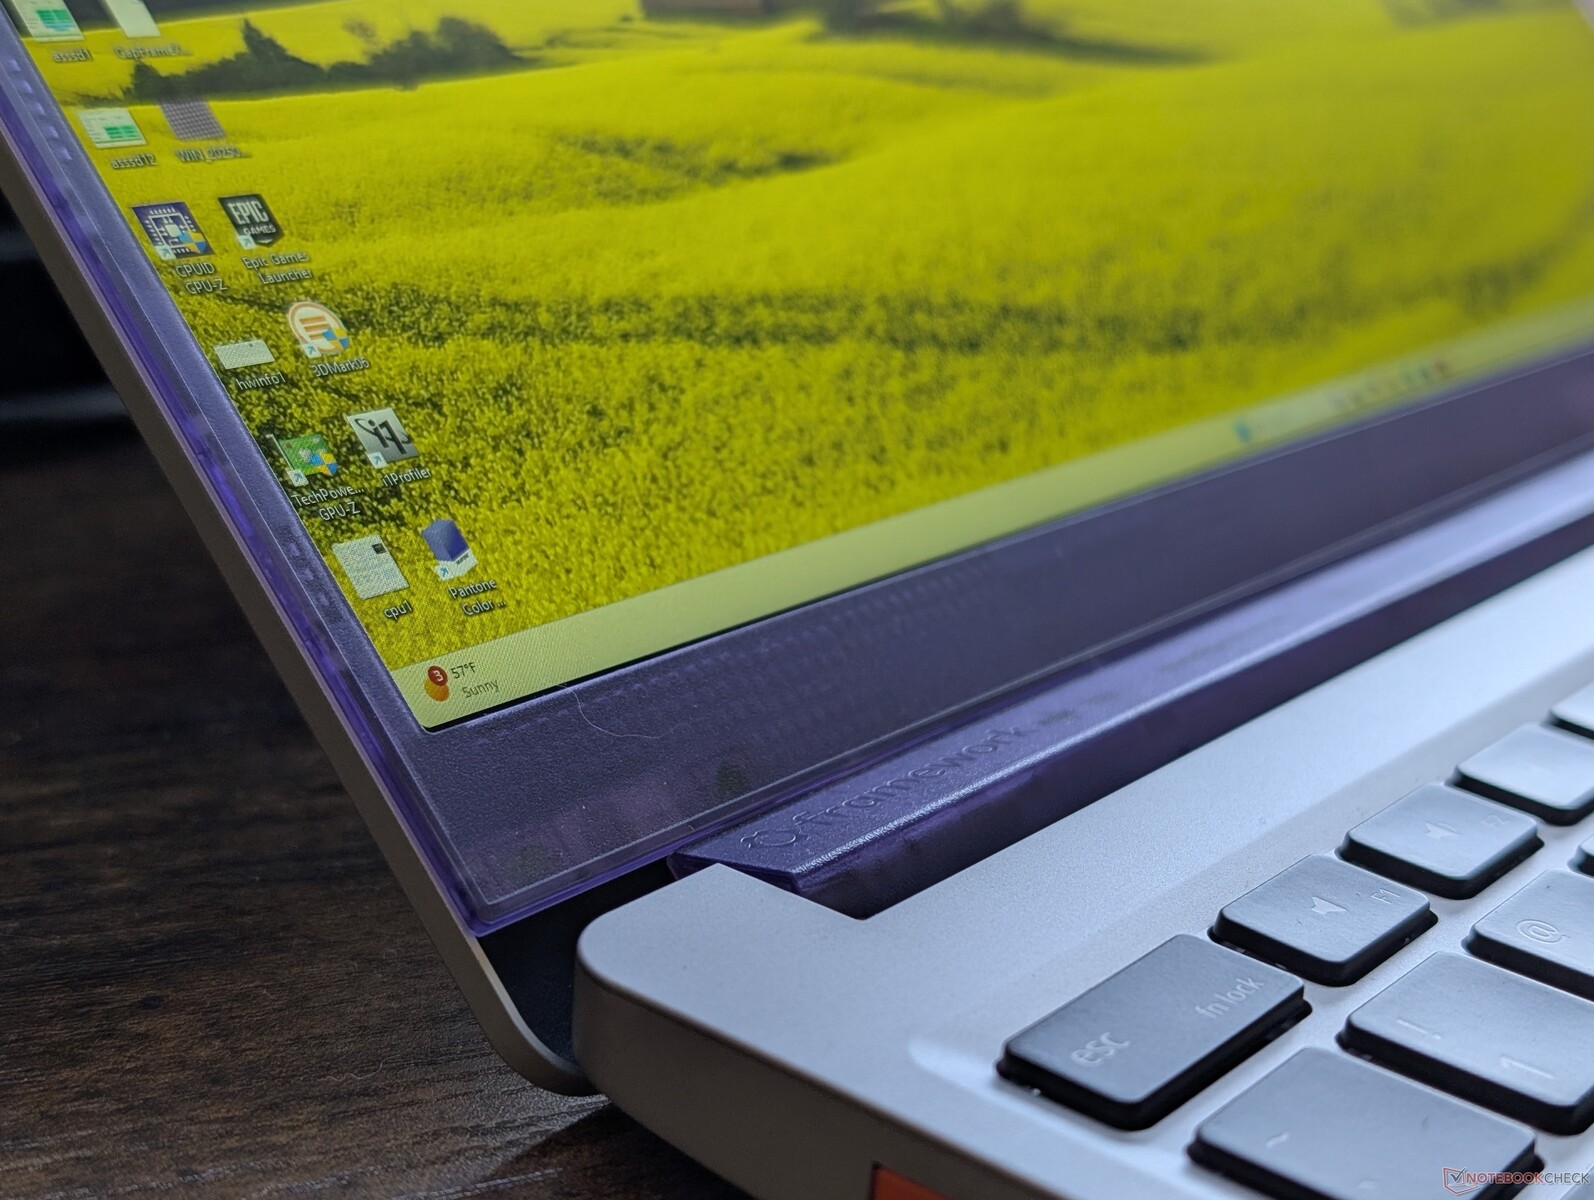
今年的新选项包括半透明彩色塑料边框,供希望为自己的系统增添一点色彩的 DIY 用户使用;第二代键盘可减少按键碰撞和集成扬声器的震动。尽管如此,这些差异可以说是微不足道,主要是美观方面的。
连接性
虽然四个 USB-C 端口已经回归,但请记住,由于 AMD 处理器的底层架构不同,它们与英特尔版本的笔记本电脑并不完全相同。特别是,这里只有后置的两个 USB-C 端口兼容 USB4 速度,而前置的两个 USB-C 端口是 USB 3.2。
SD 读卡器
| SD Card Reader | |
| average JPG Copy Test (av. of 3 runs) | |
| Framework Laptop 13.5 Core Ultra 7 155H (Toshiba Exceria Pro SDXC 64 GB UHS-II) | |
| Framework Laptop 13.5 Ryzen AI 9 HX 370 (AV PRO microSD 128 GB V60) | |
| maximum AS SSD Seq Read Test (1GB) | |
| Framework Laptop 13.5 Core Ultra 7 155H (Toshiba Exceria Pro SDXC 64 GB UHS-II) | |
| Framework Laptop 13.5 Ryzen AI 9 HX 370 (AV PRO microSD 128 GB V60) | |
交流
网络摄像头
200 万像素网络摄像头再次回归,但没有更高分辨率可供选择。


维护
与其他主要制造商的子笔记本电脑相比,其可维护性保持不变,没有受到任何挑战。有关维护功能的更深入介绍,请参阅下面的视频。
可持续性
Framework 的顶盖和扬声器使用了 75% 的可回收铝材,底盖和键盘面板使用了 50% 的可回收铝材,键帽使用了 50% 的可回收塑料,扩展卡使用了高达 30% 的可回收塑料。包装全部采用纸张和纸板,可完全回收利用。
该制造商还提供替换零件、升级模块和详细的维修指南,即使是大型制造商也无法与之媲美。
配件和保修
今年的扩展卡新增了半透明塑料色和最新的 HDMI 2.0b 选项。与现有的灰色铝合金或纯色塑料相比,半透明颜色无需额外付费。
制造商提供标准的一年有限保修服务。
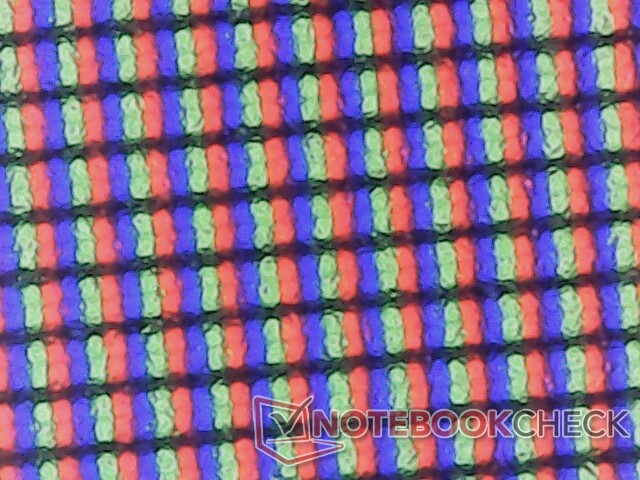
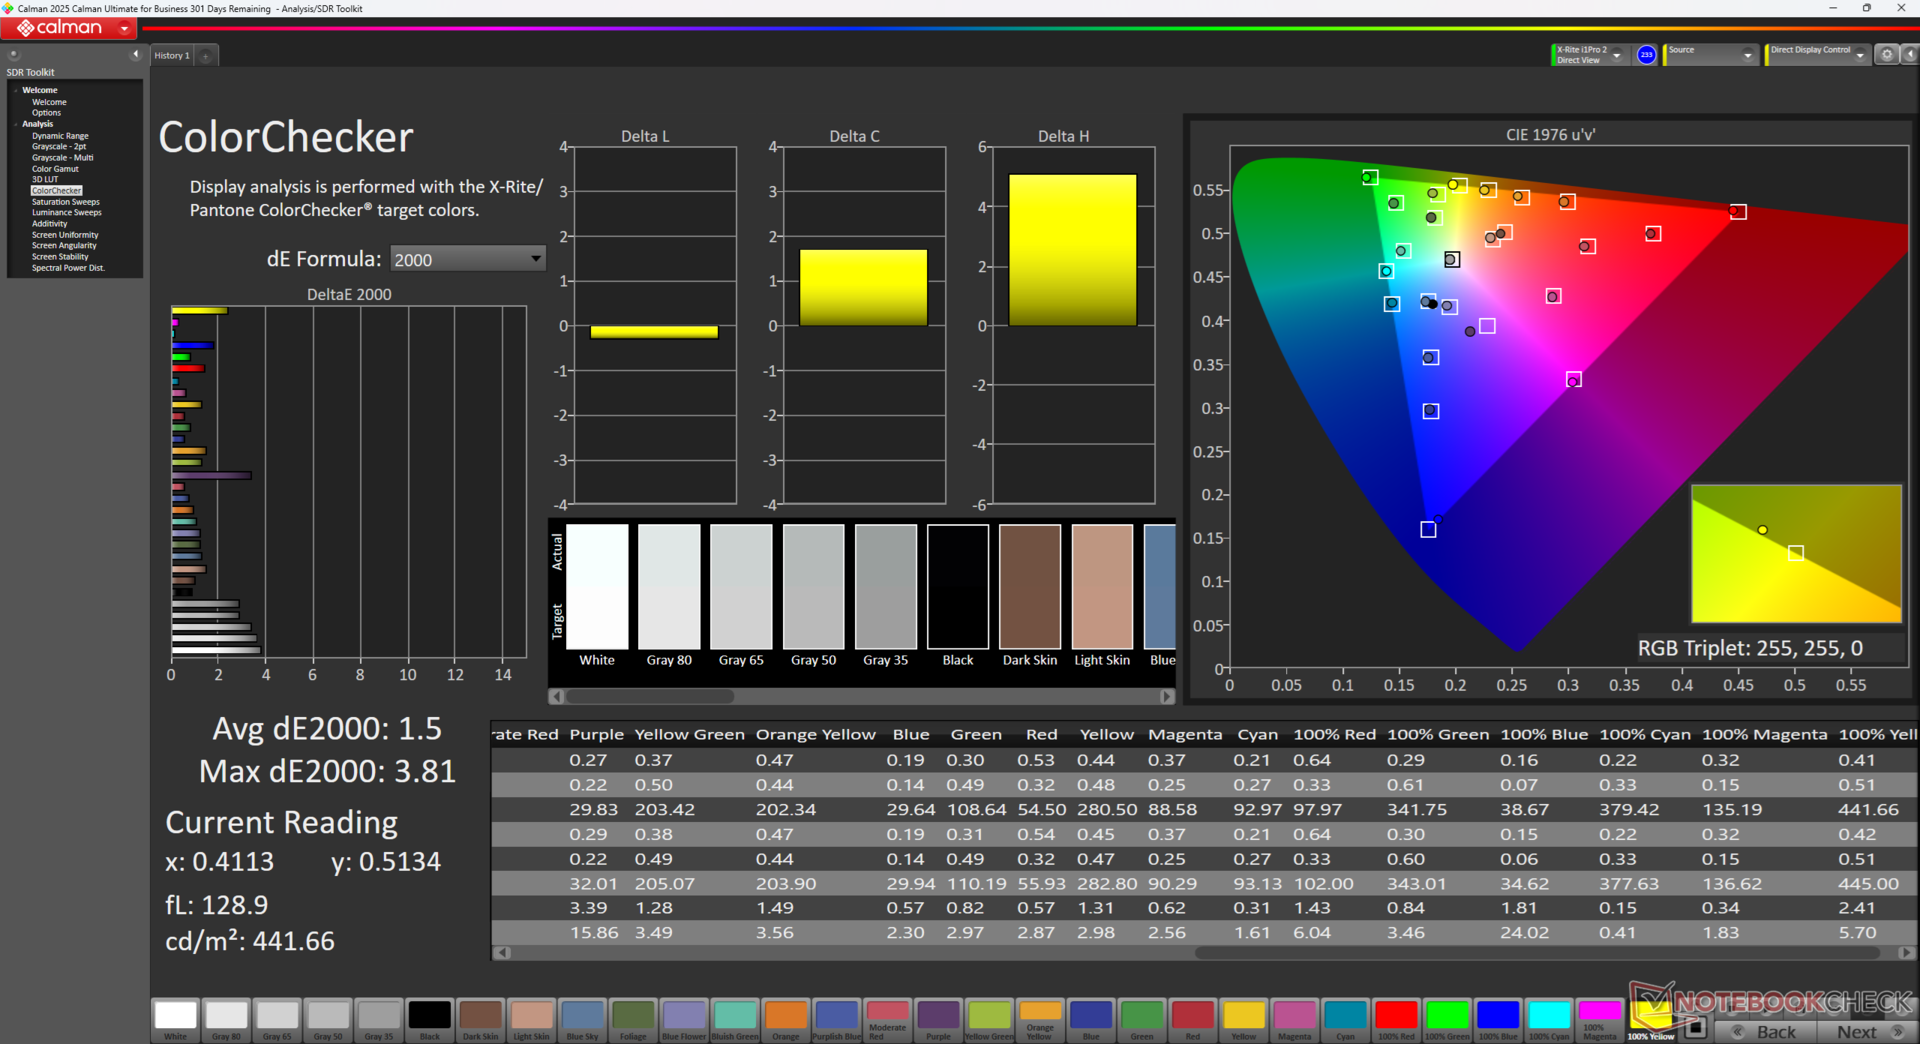
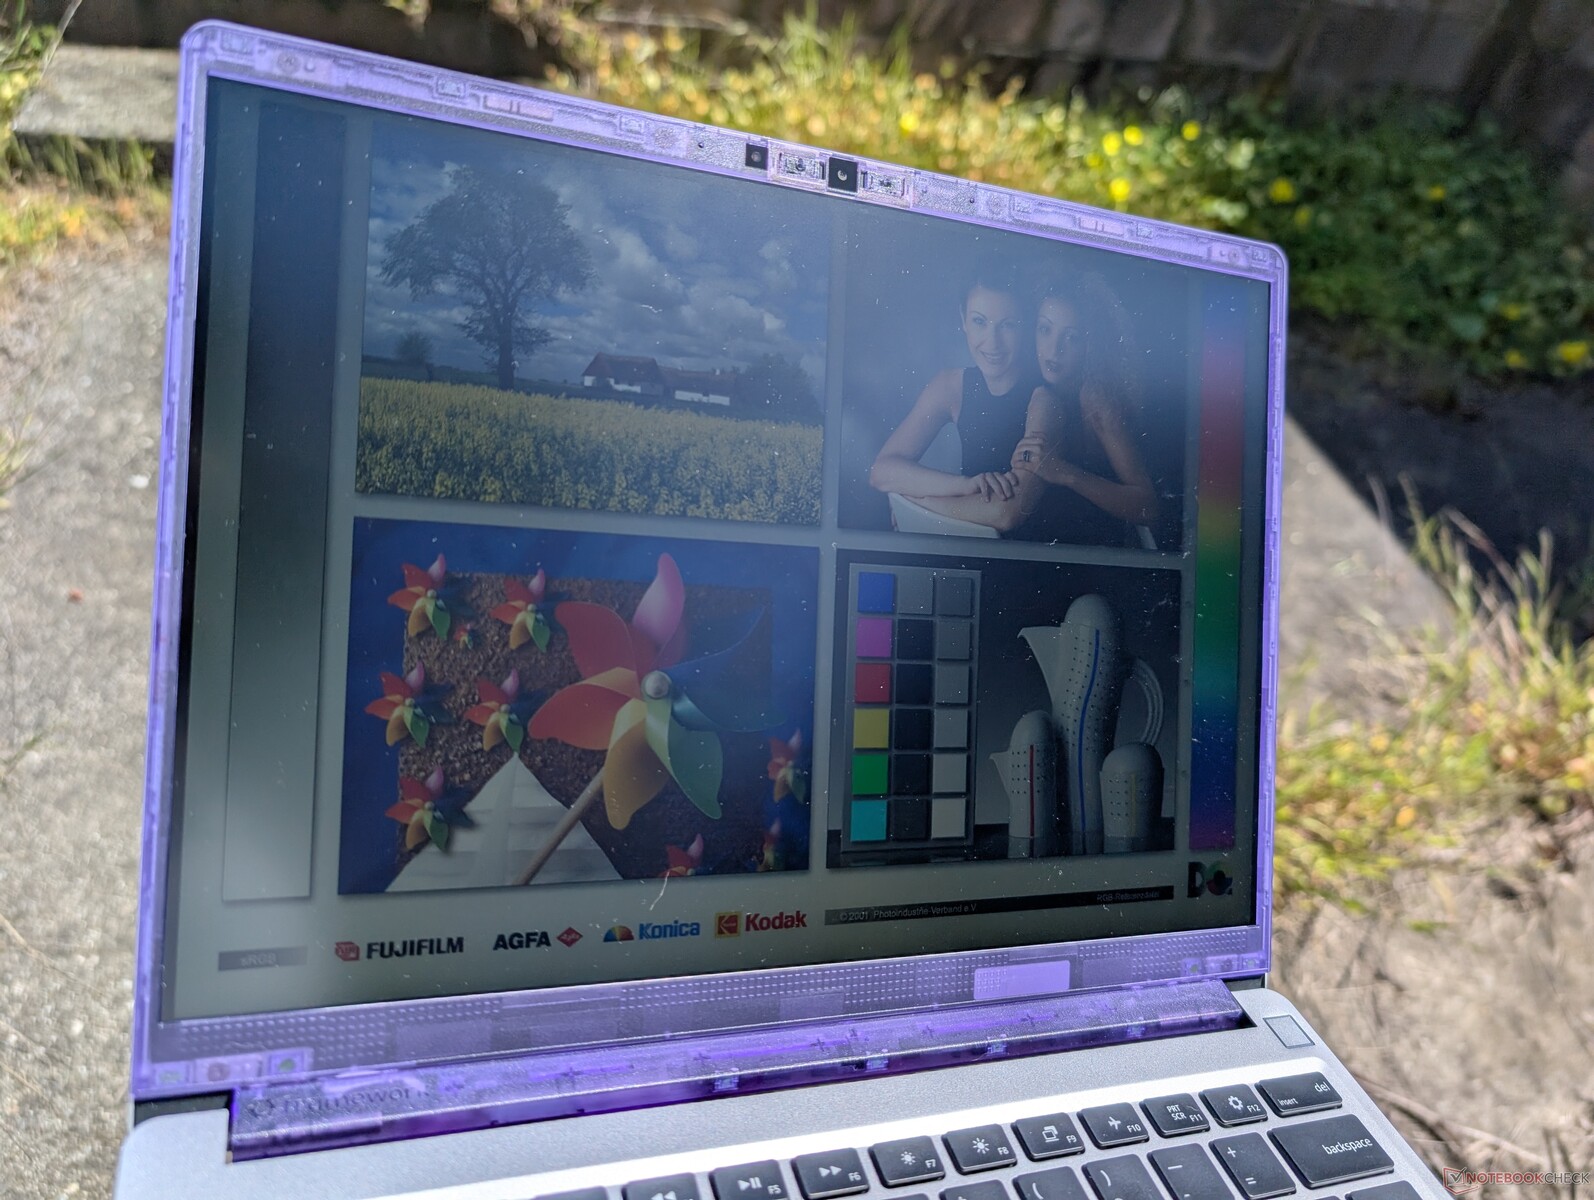
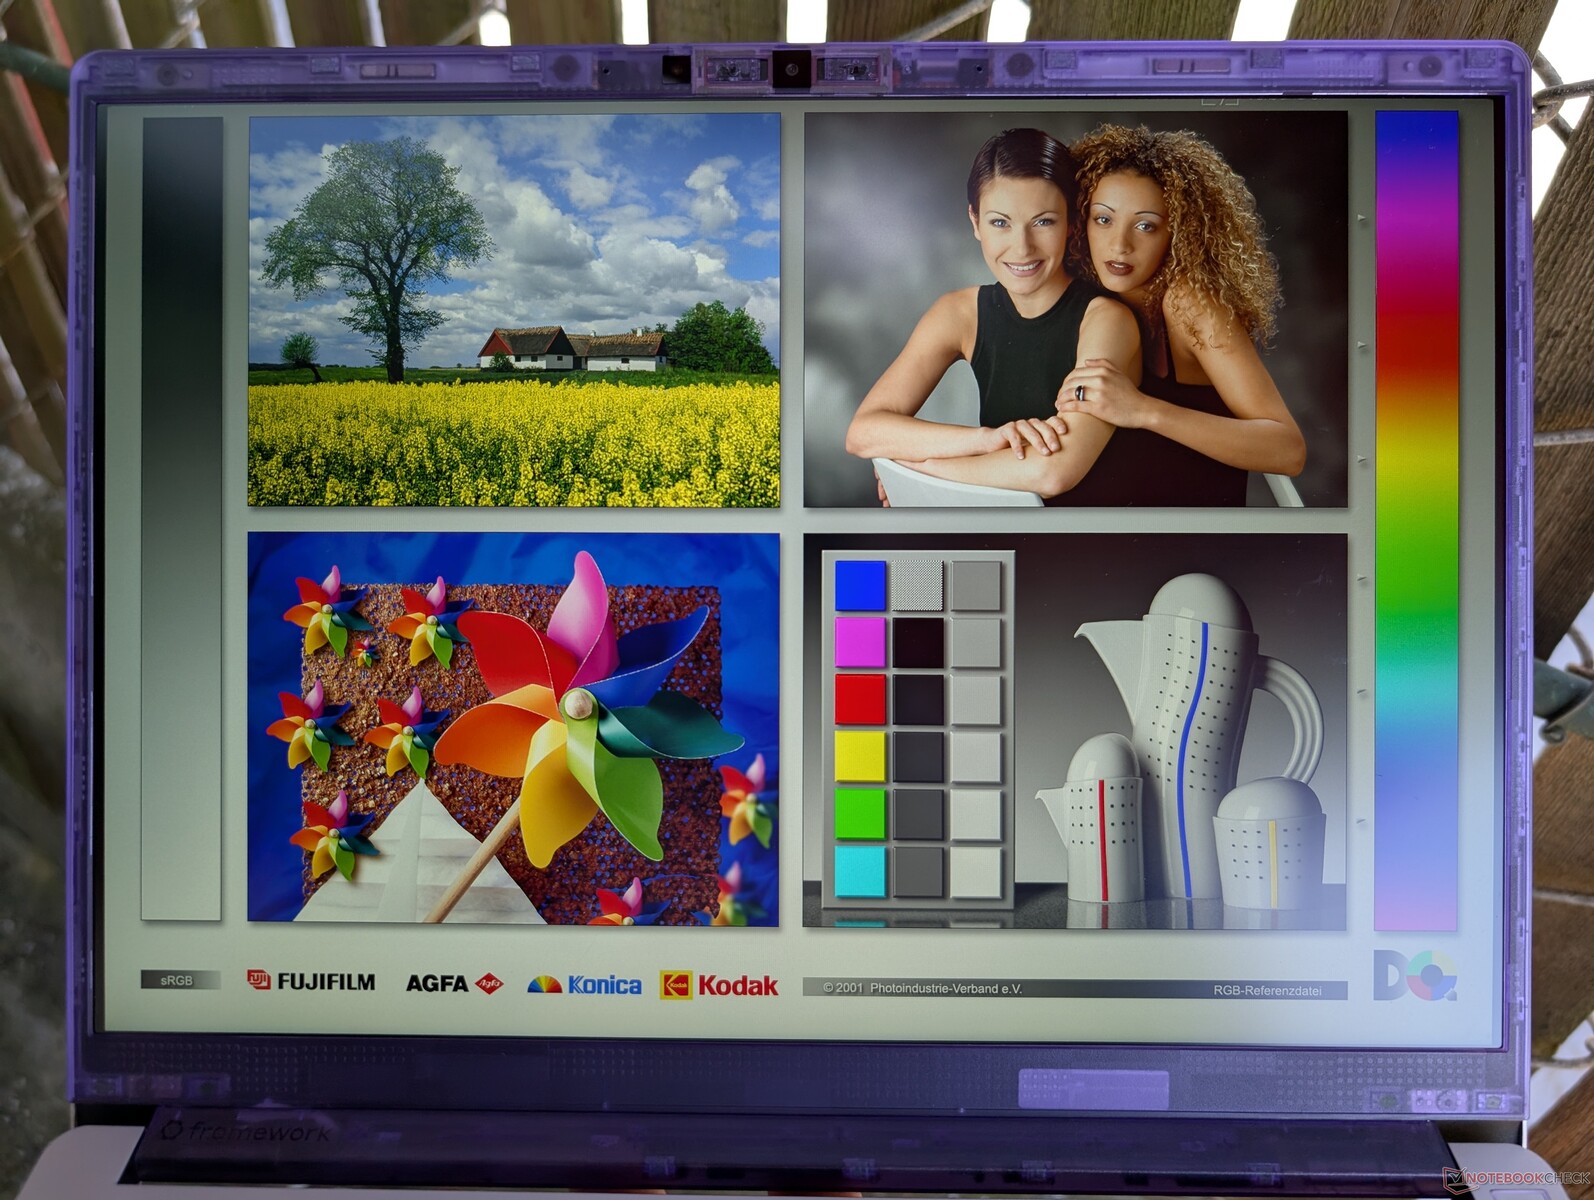
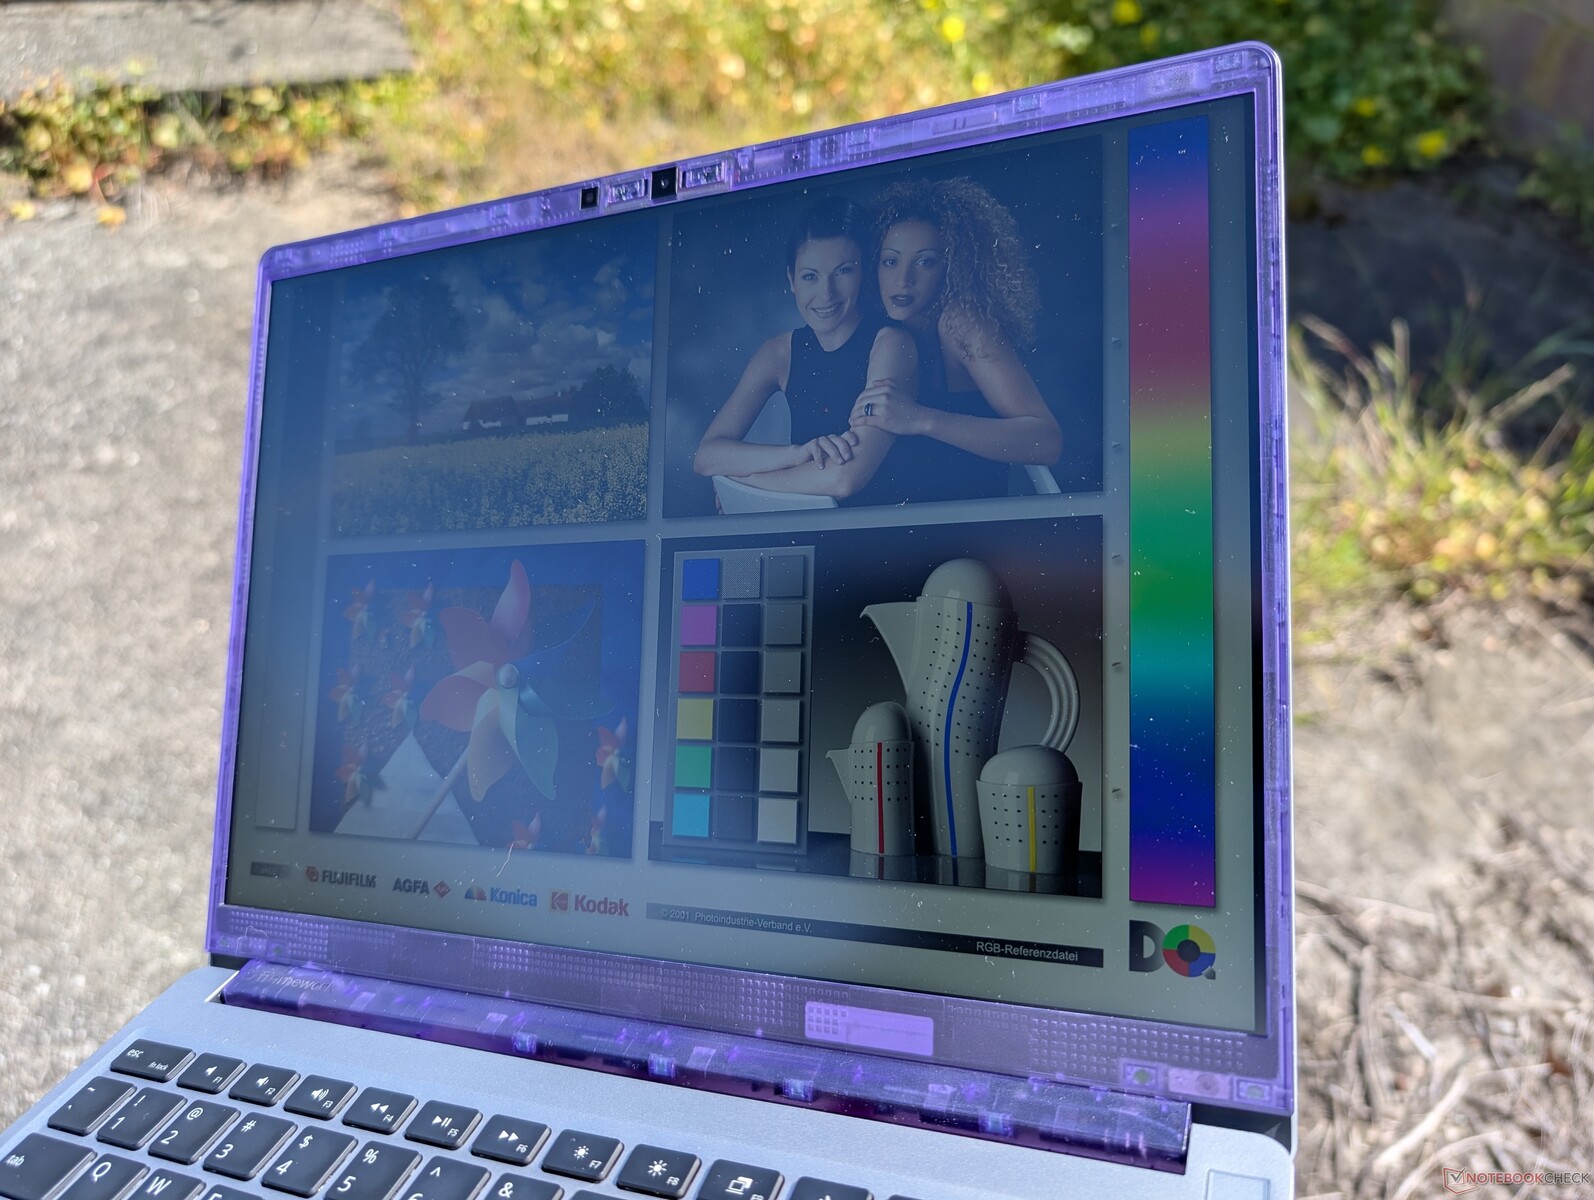
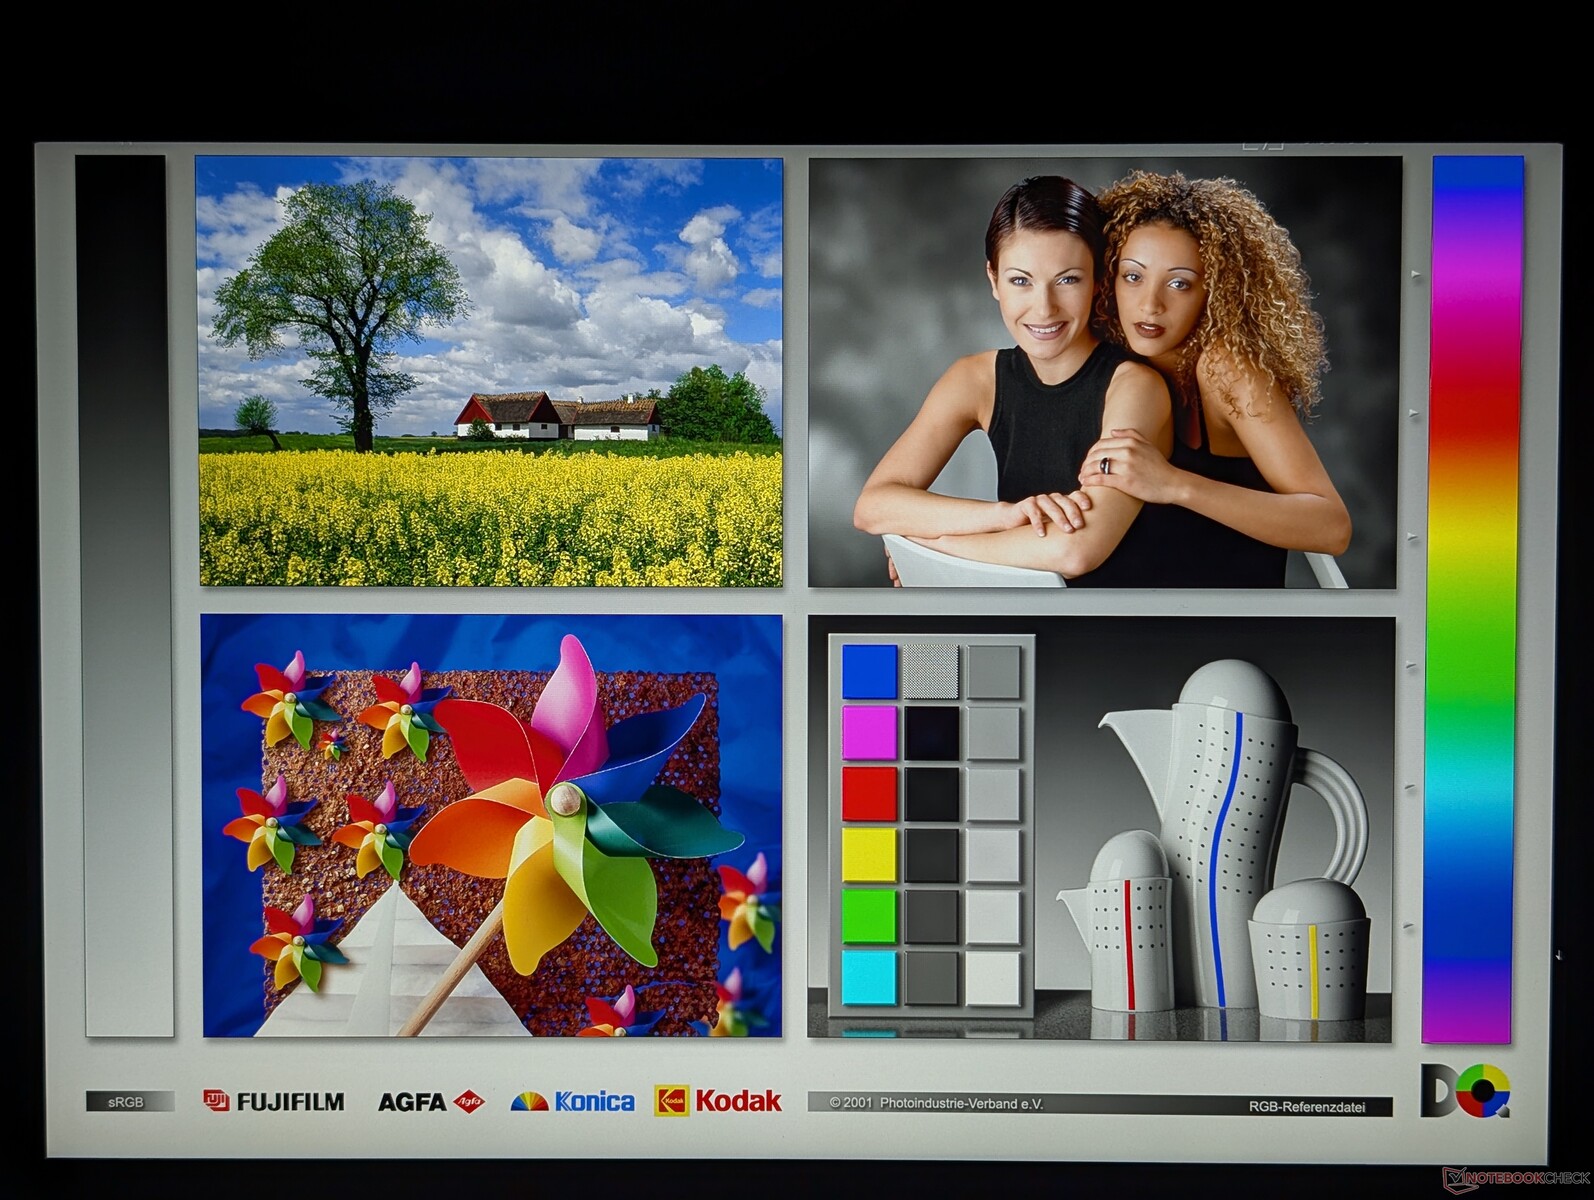
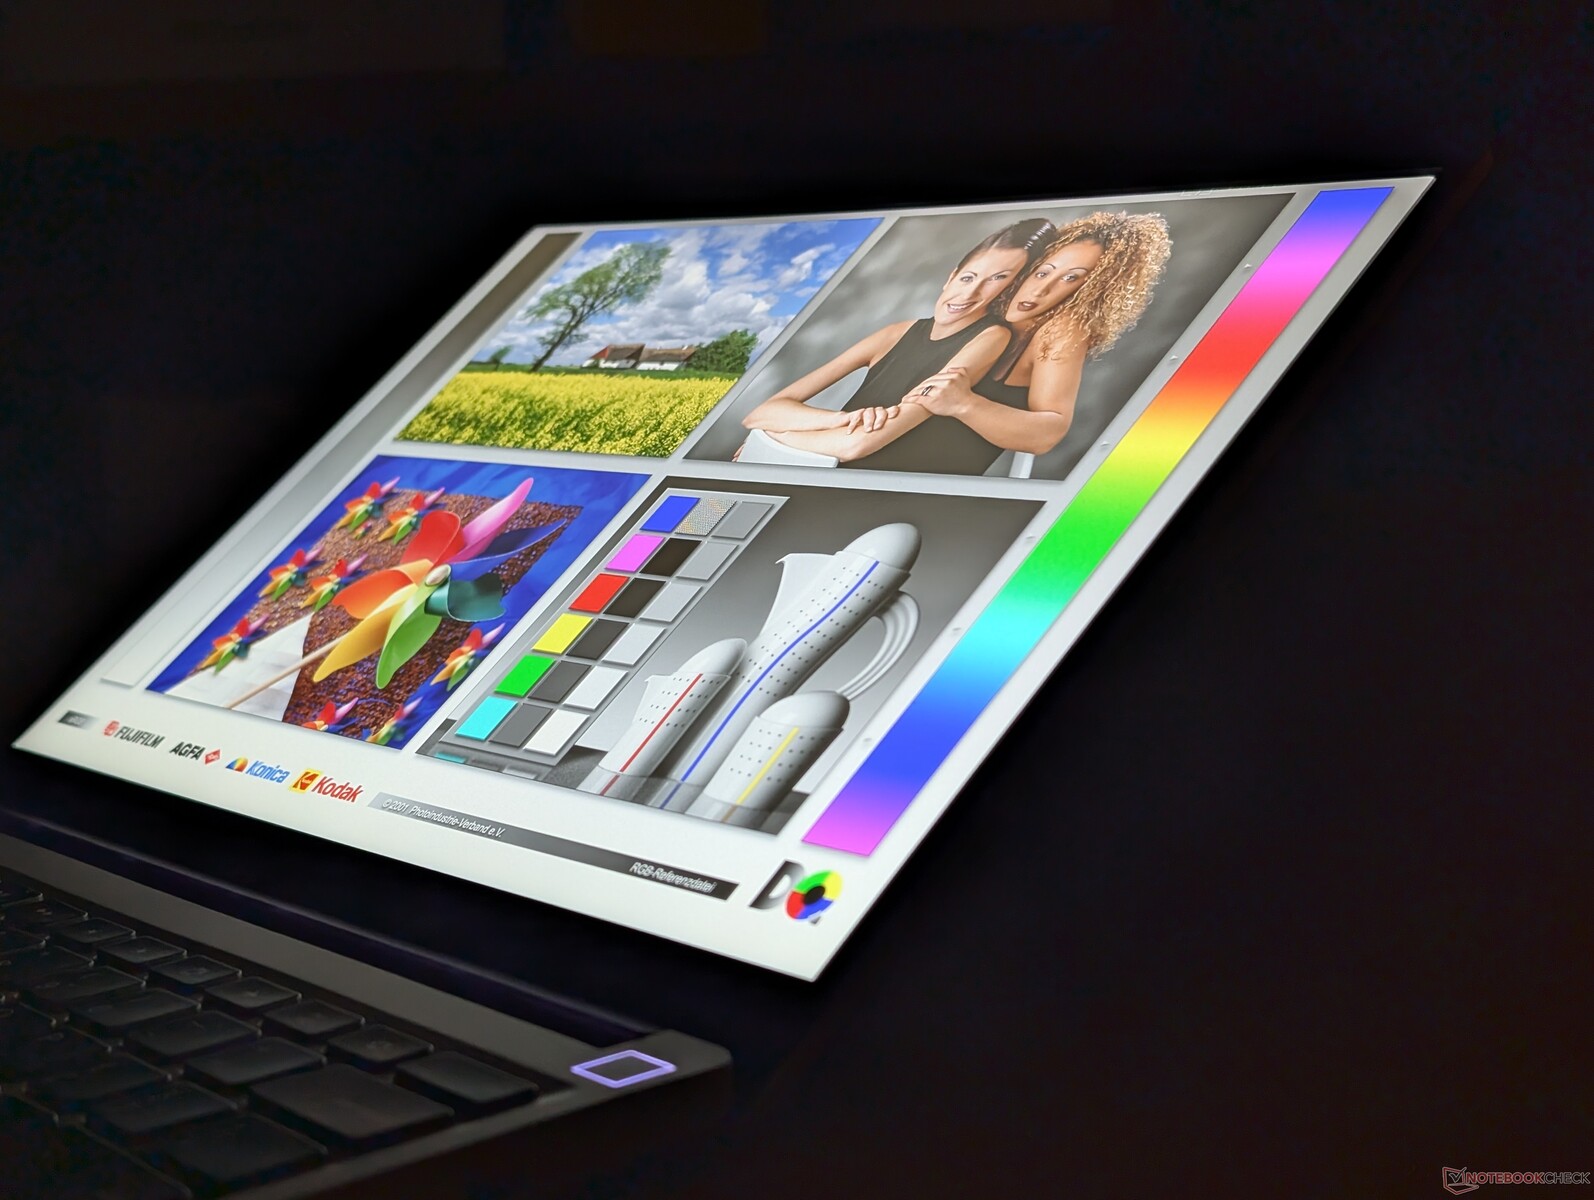
显示屏
在今年的 AMD 更新中,Framework 使用了与去年英特尔机型相同的京东方 NE135A1M-NY1 IPS 面板。虽然这仍然是一款出色的面板,但如果能为那些有需求的用户提供 OLED 选项或 P3 颜色就更好了。
| |||||||||||||||||||||||||
Brightness Distribution: 94 %
Center on Battery: 529.9 cd/m²
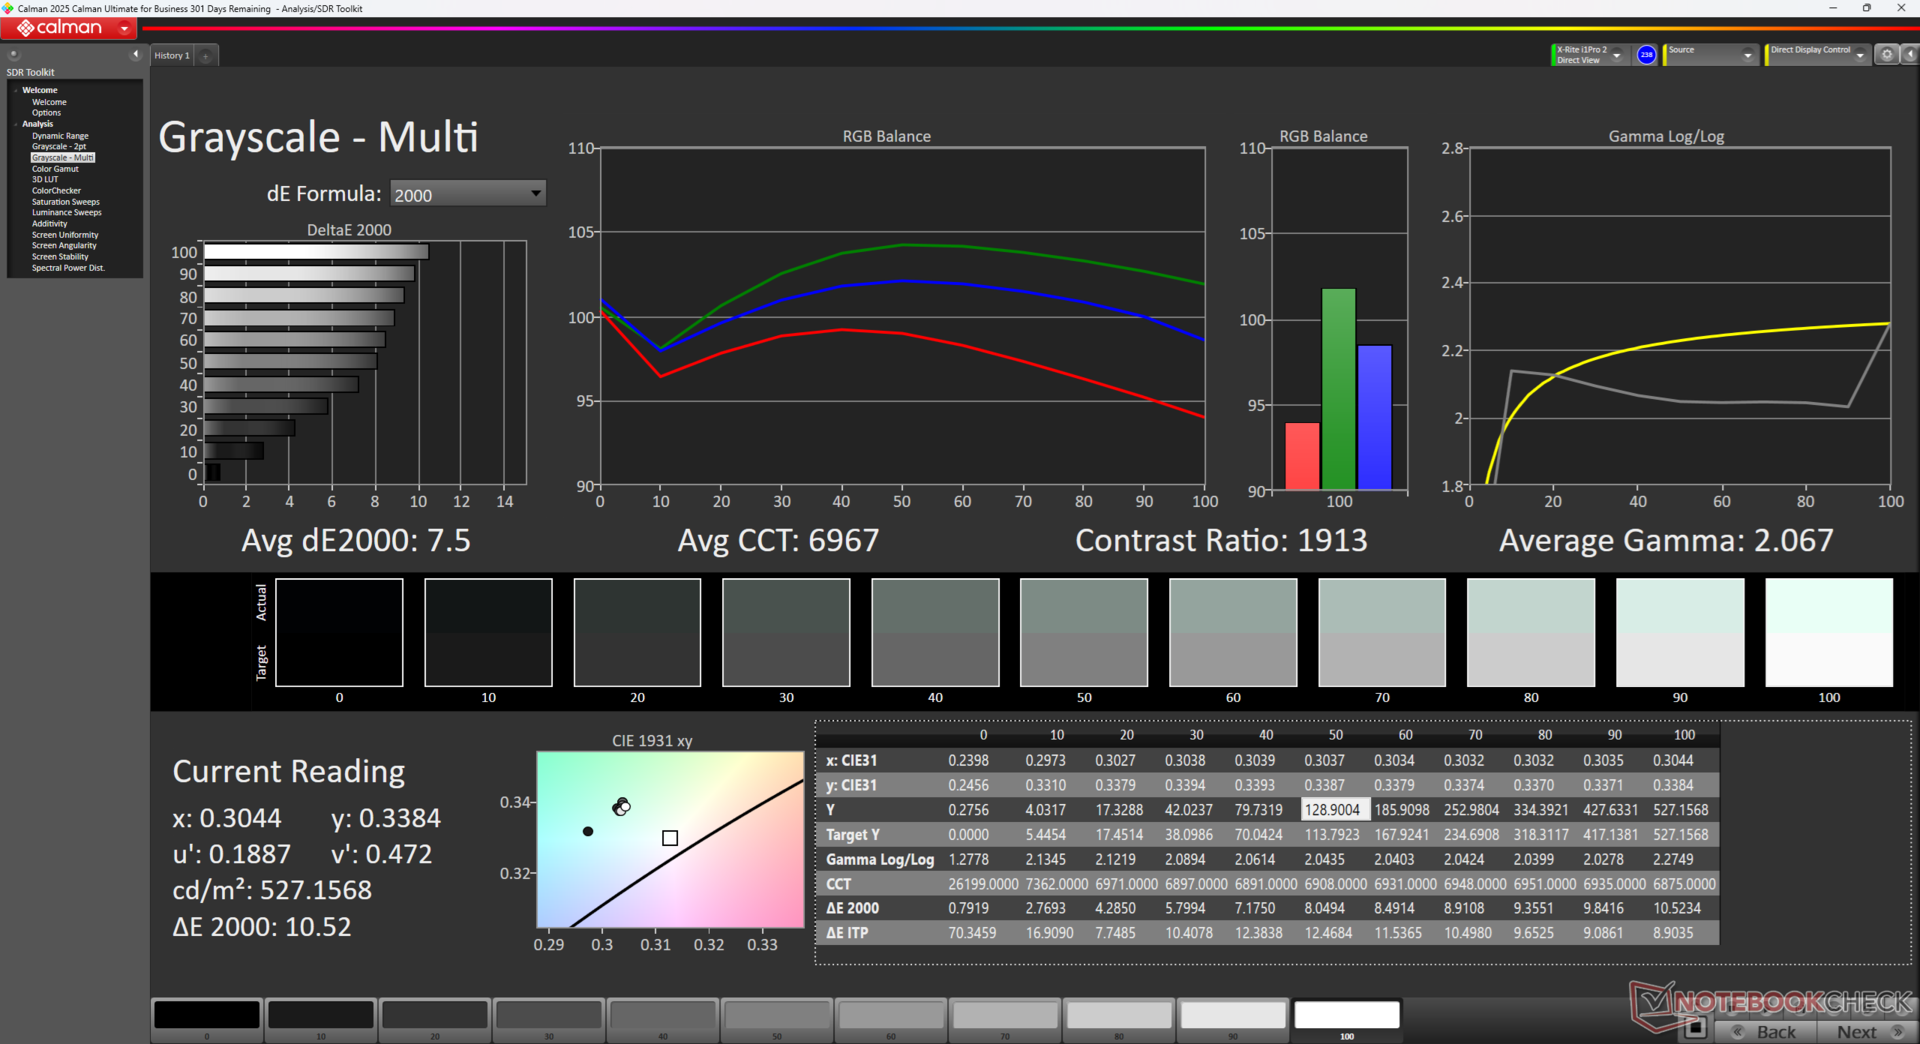
Contrast: 1766:1 (Black: 0.3 cd/m²)
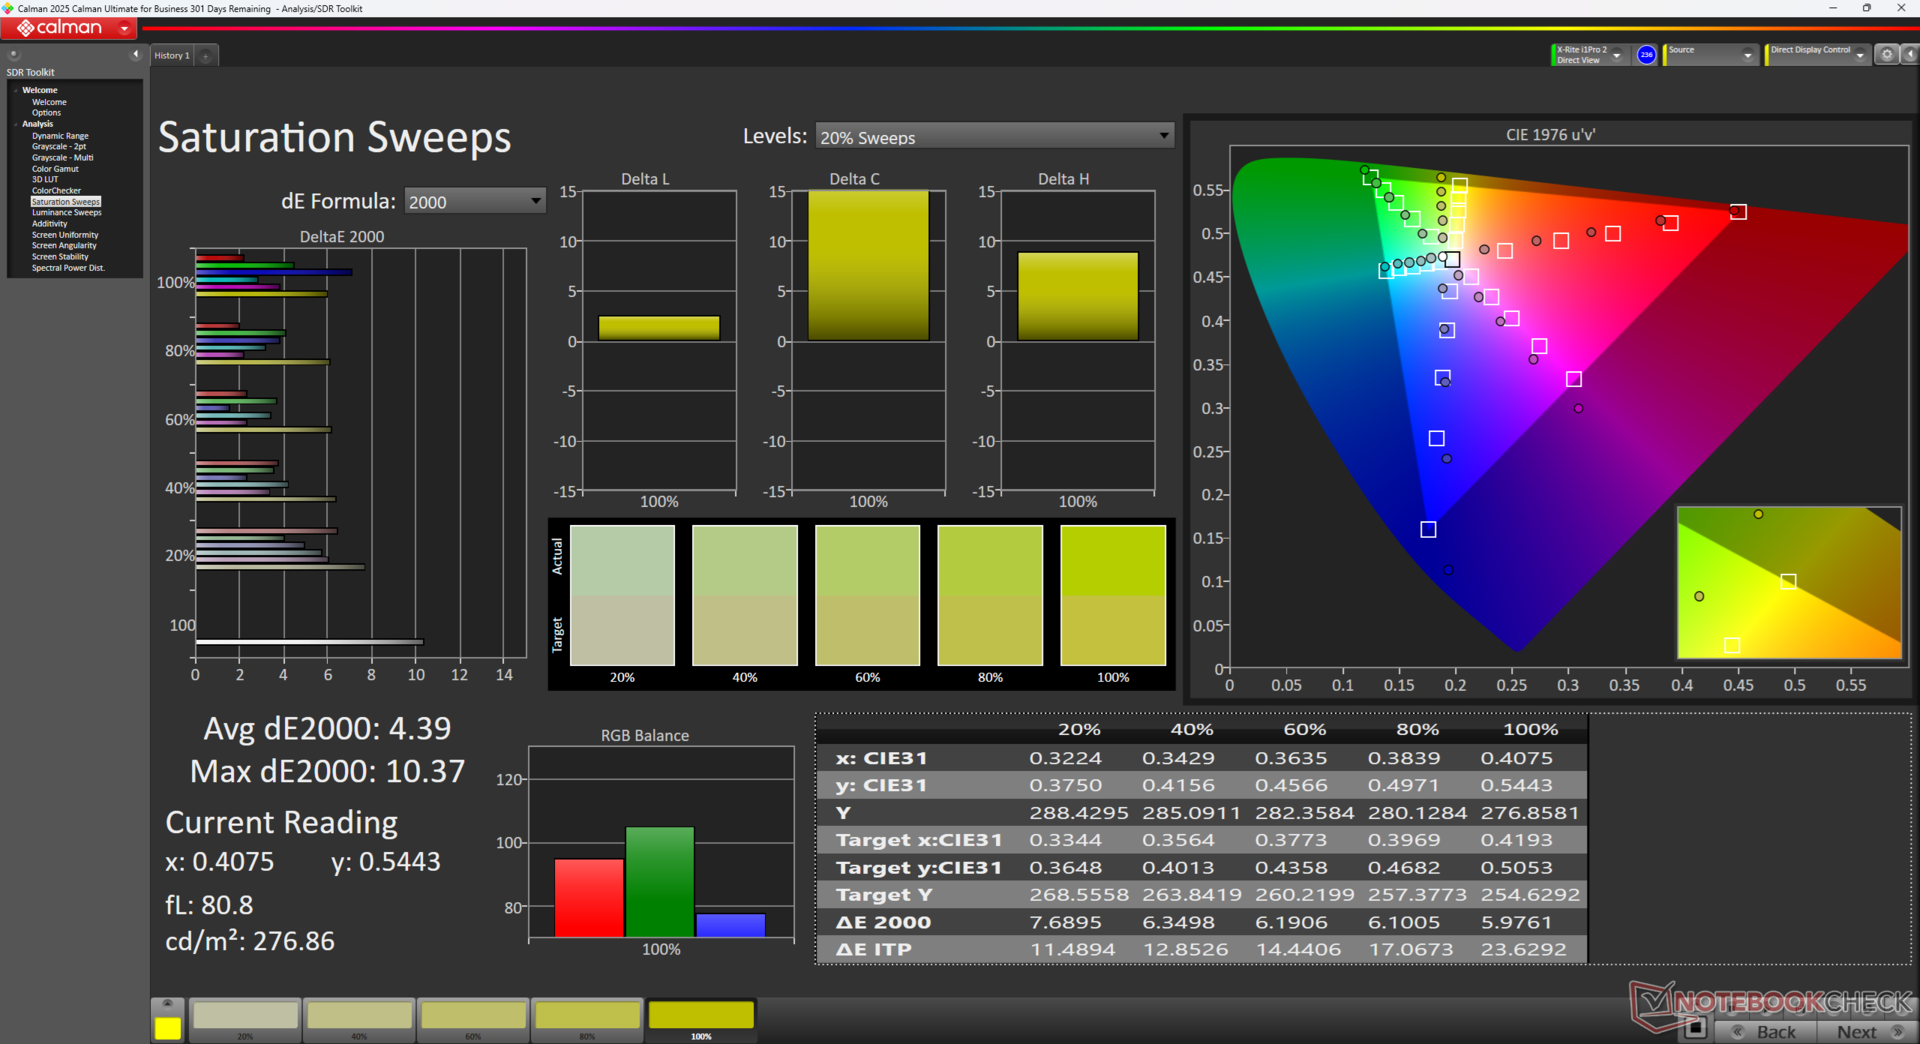
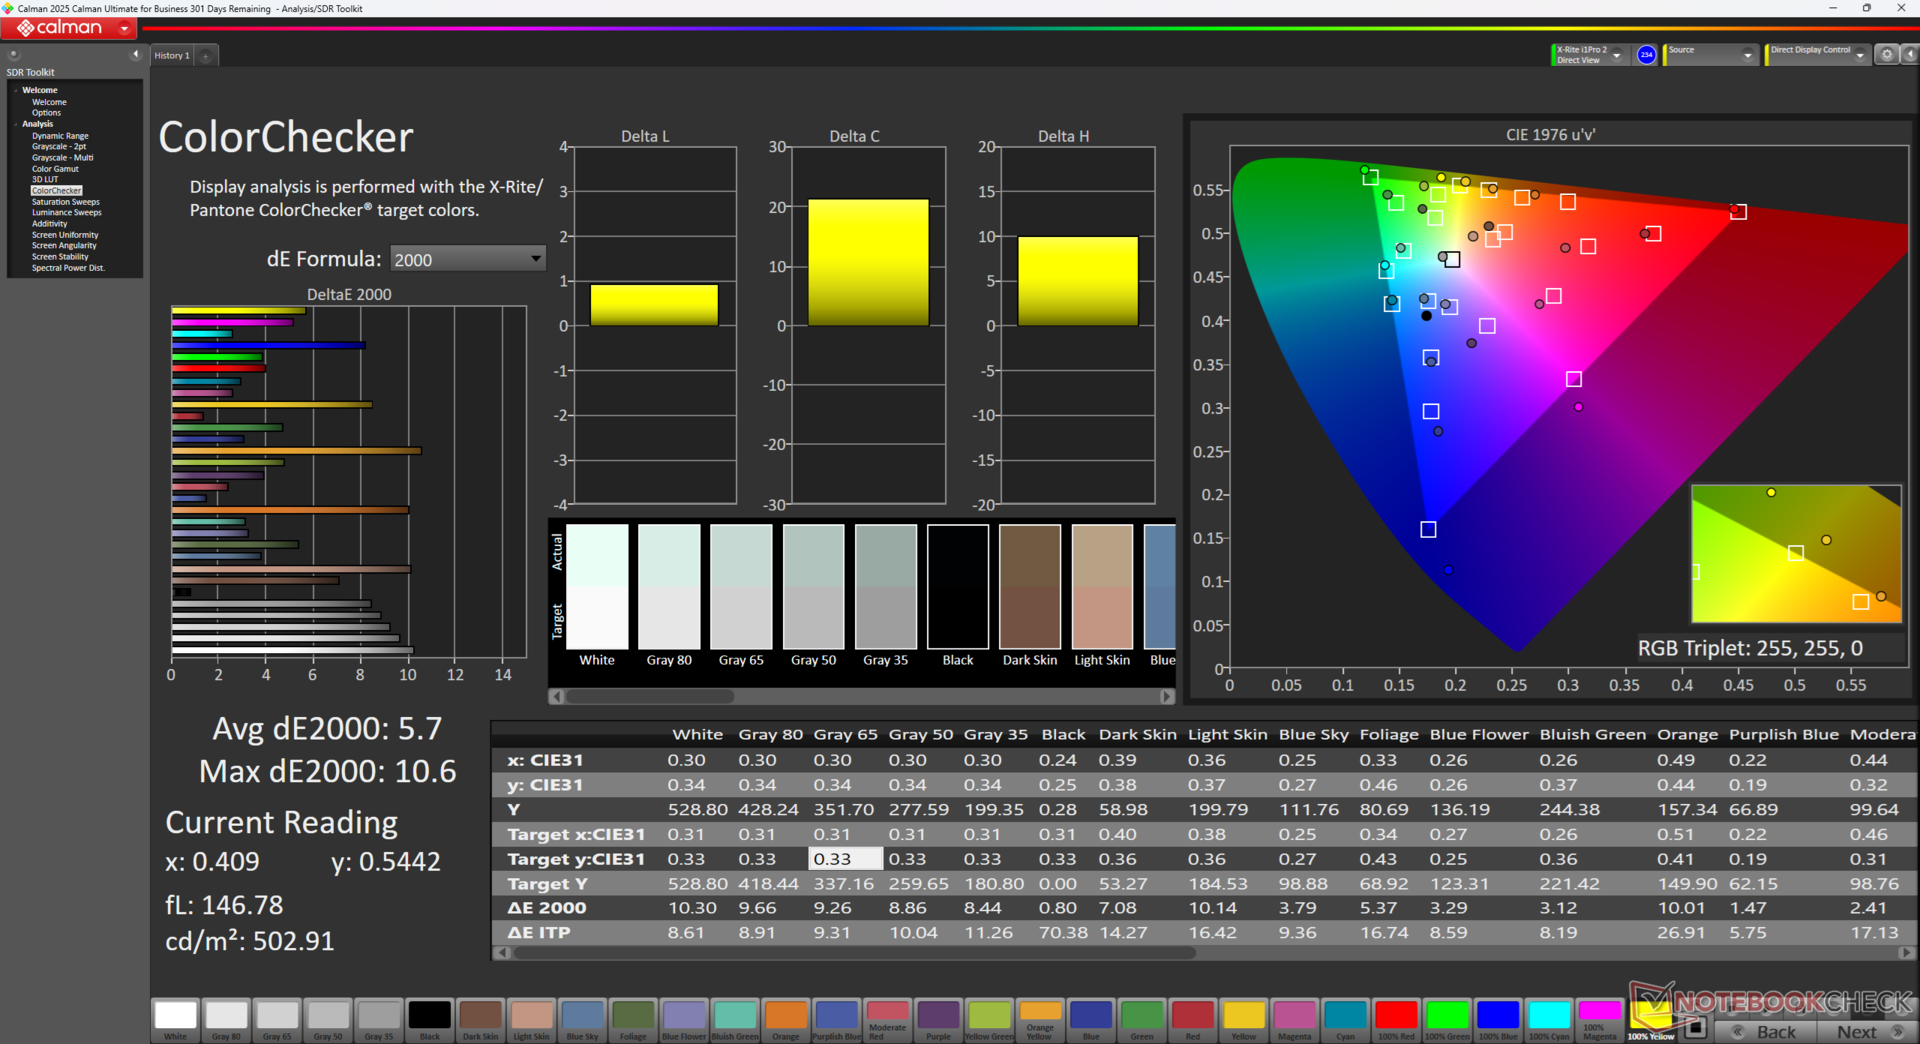
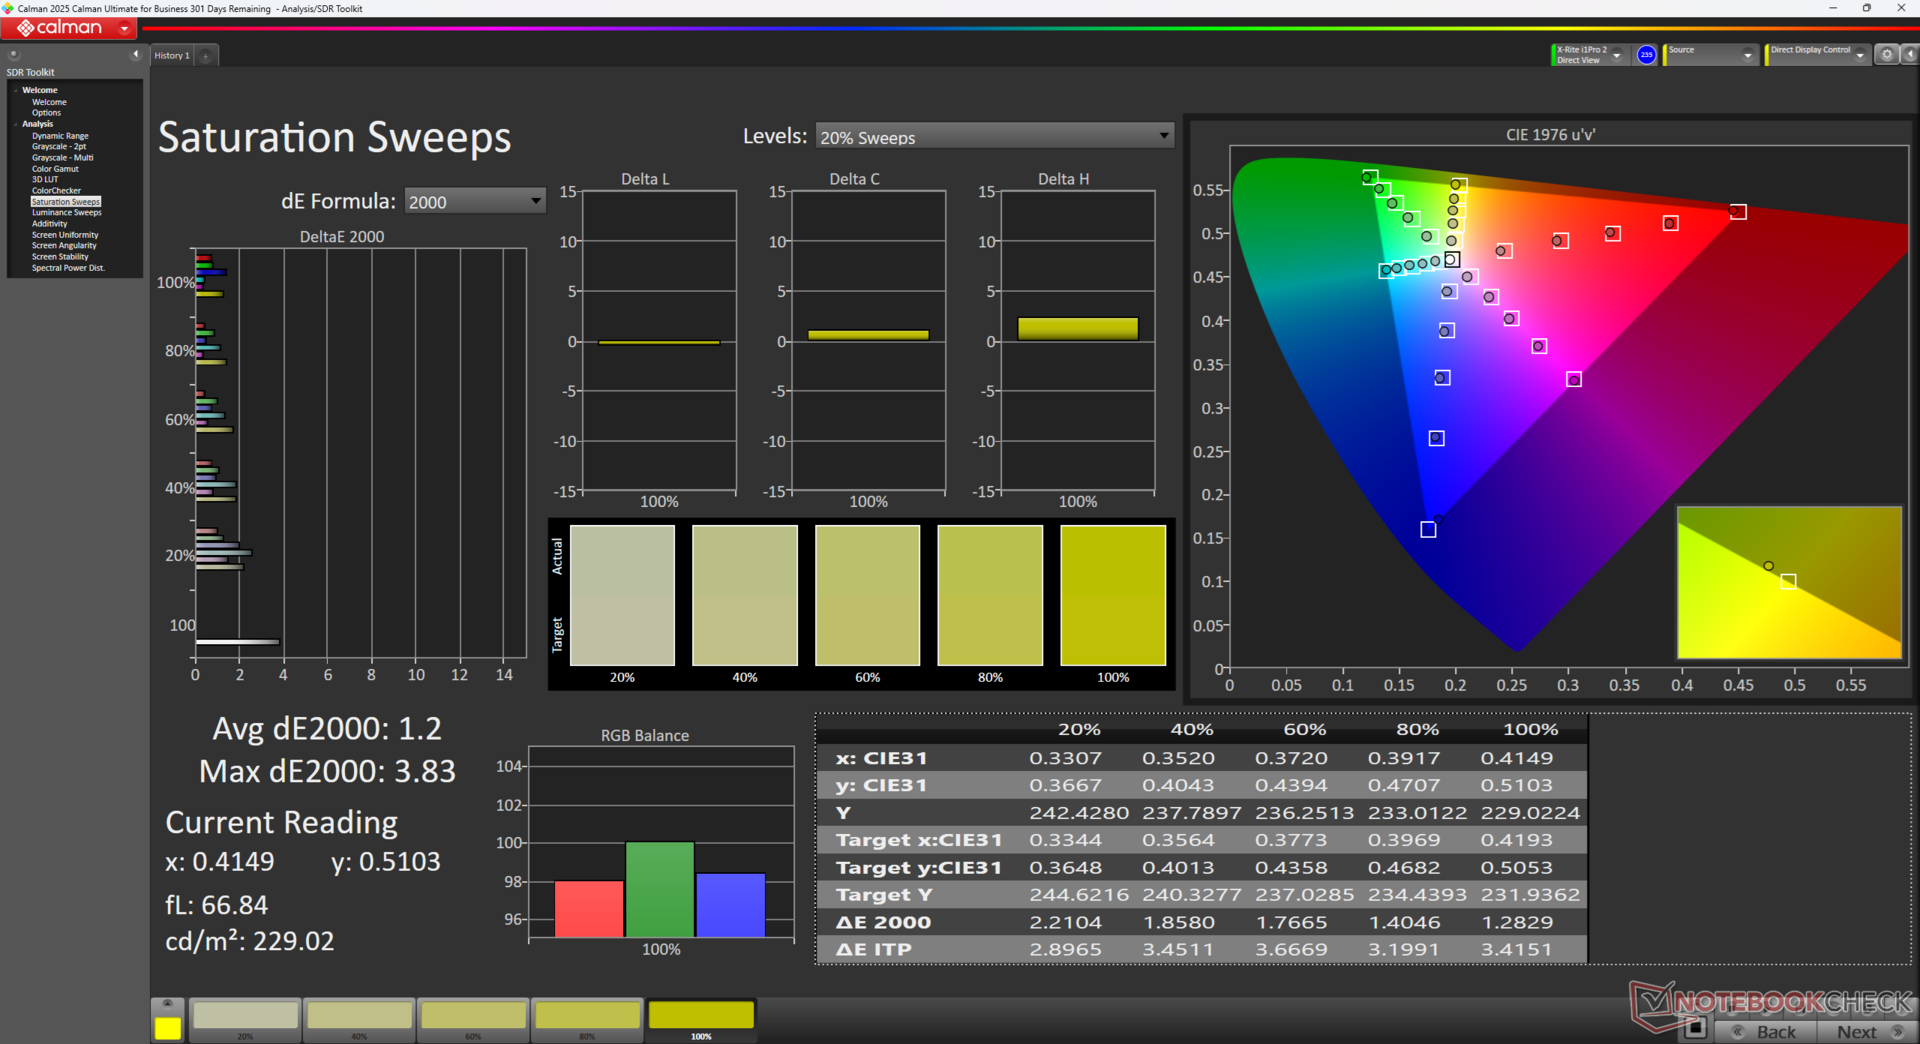
ΔE Color 5.7 | 0.5-29.43 Ø4.87, calibrated: 1.5
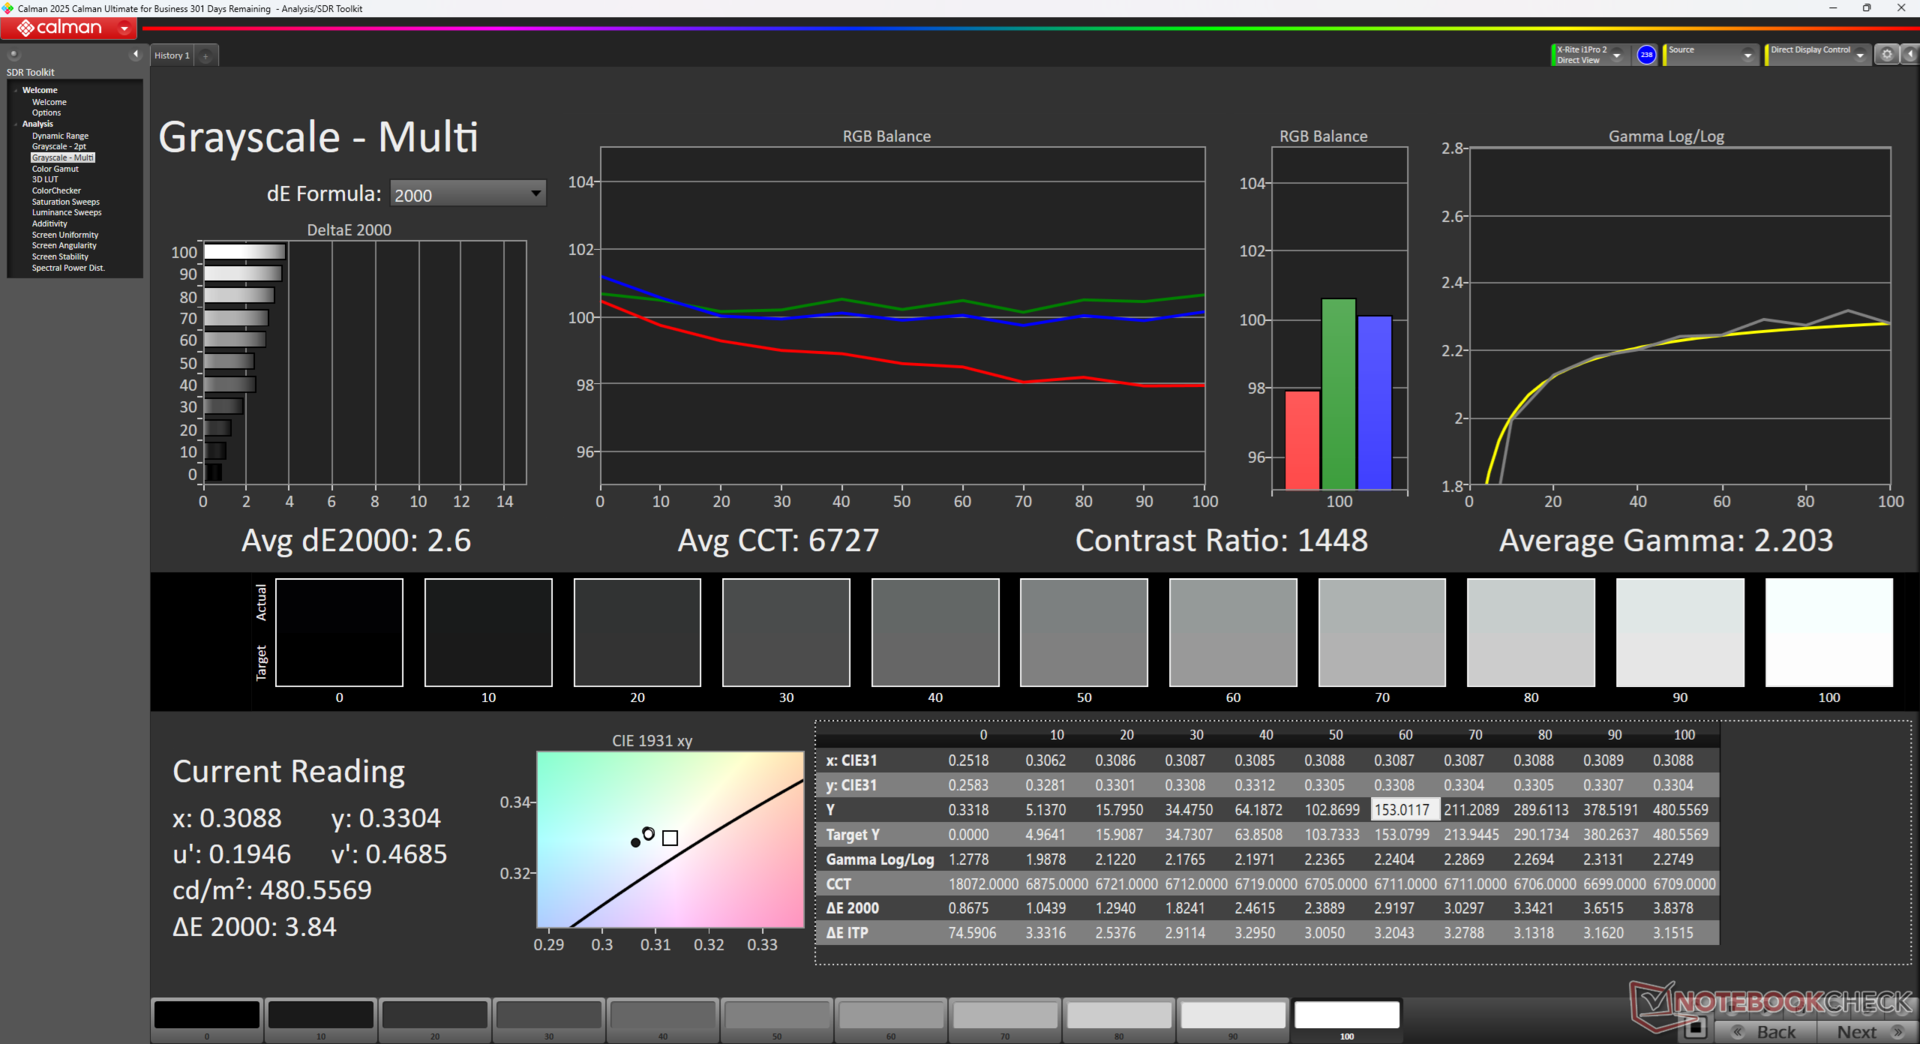
ΔE Greyscale 7.5 | 0.5-98 Ø5.1
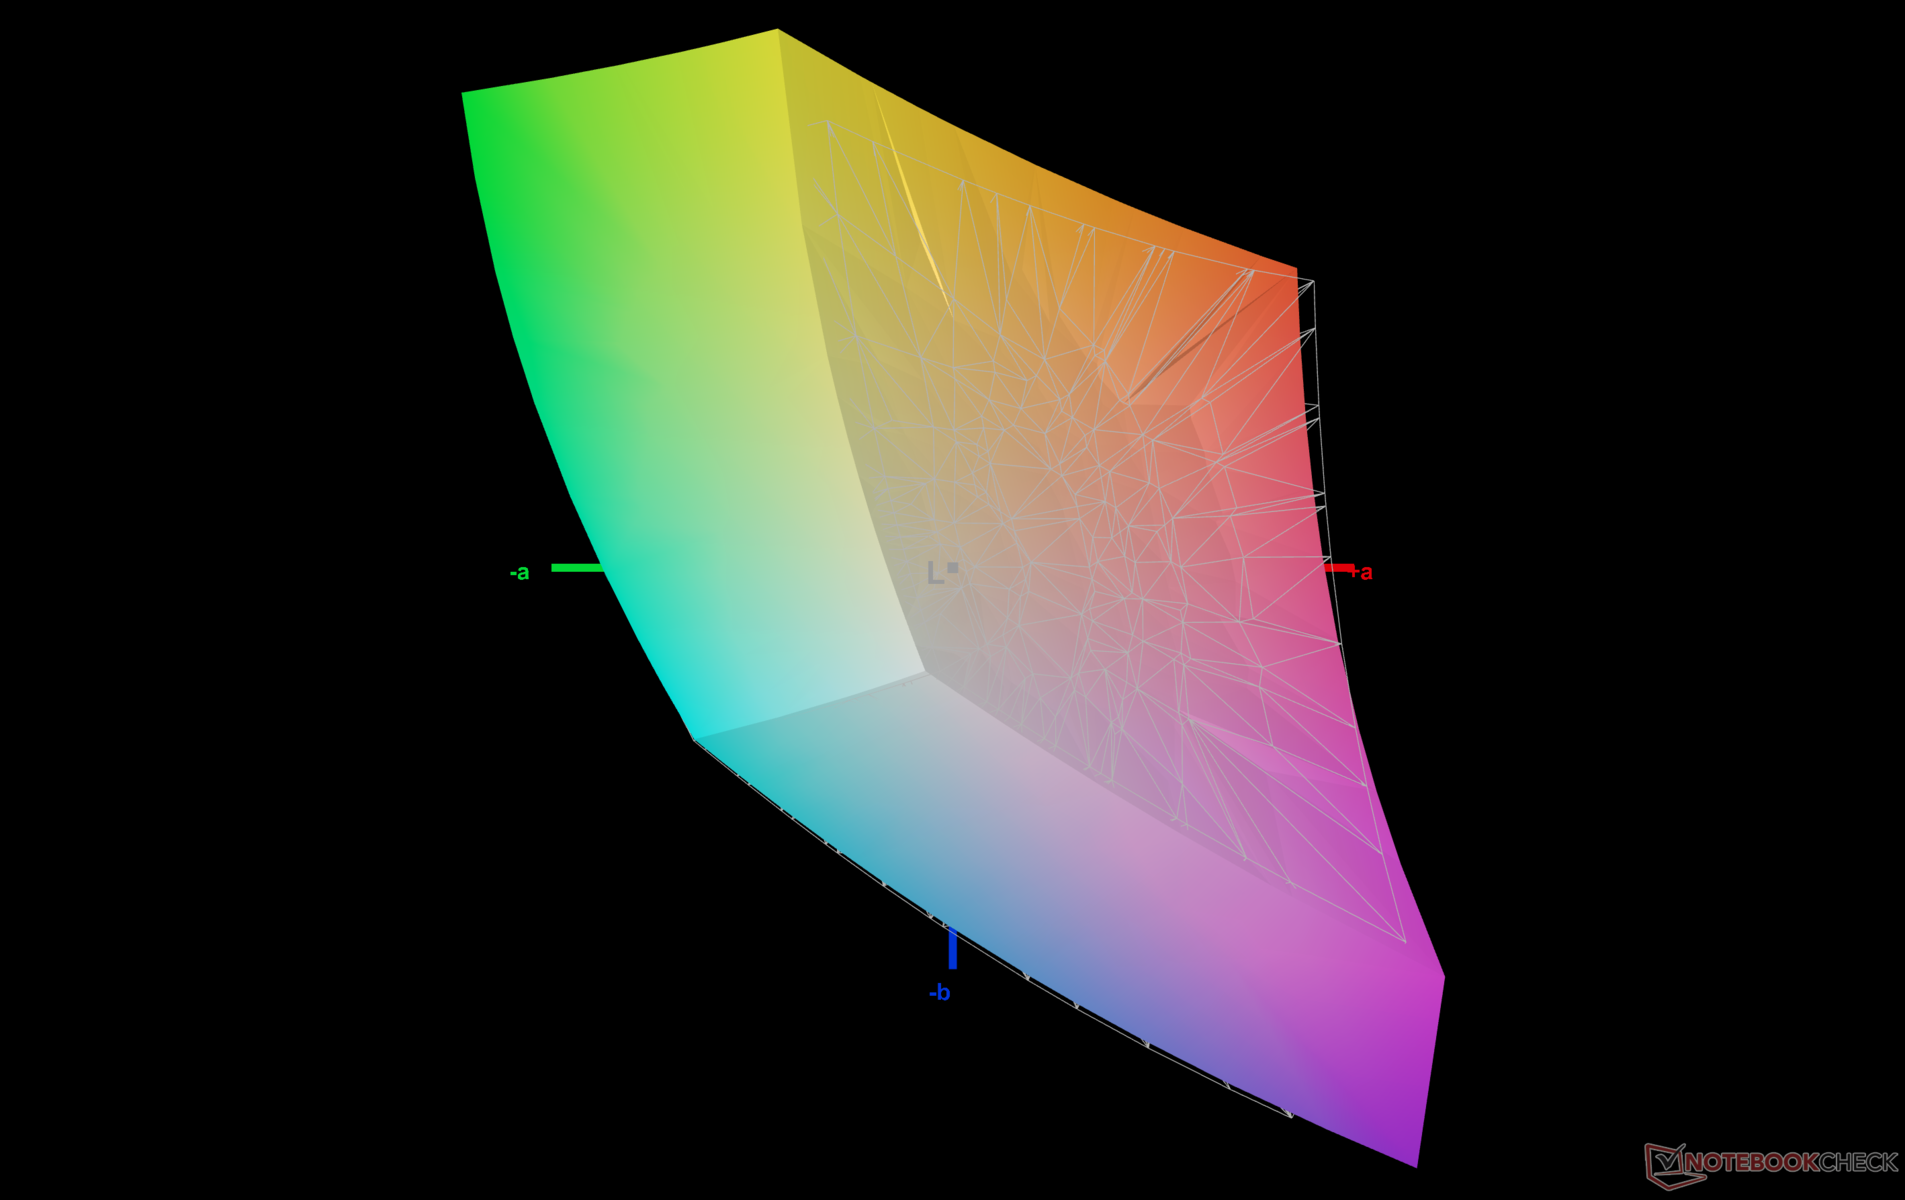
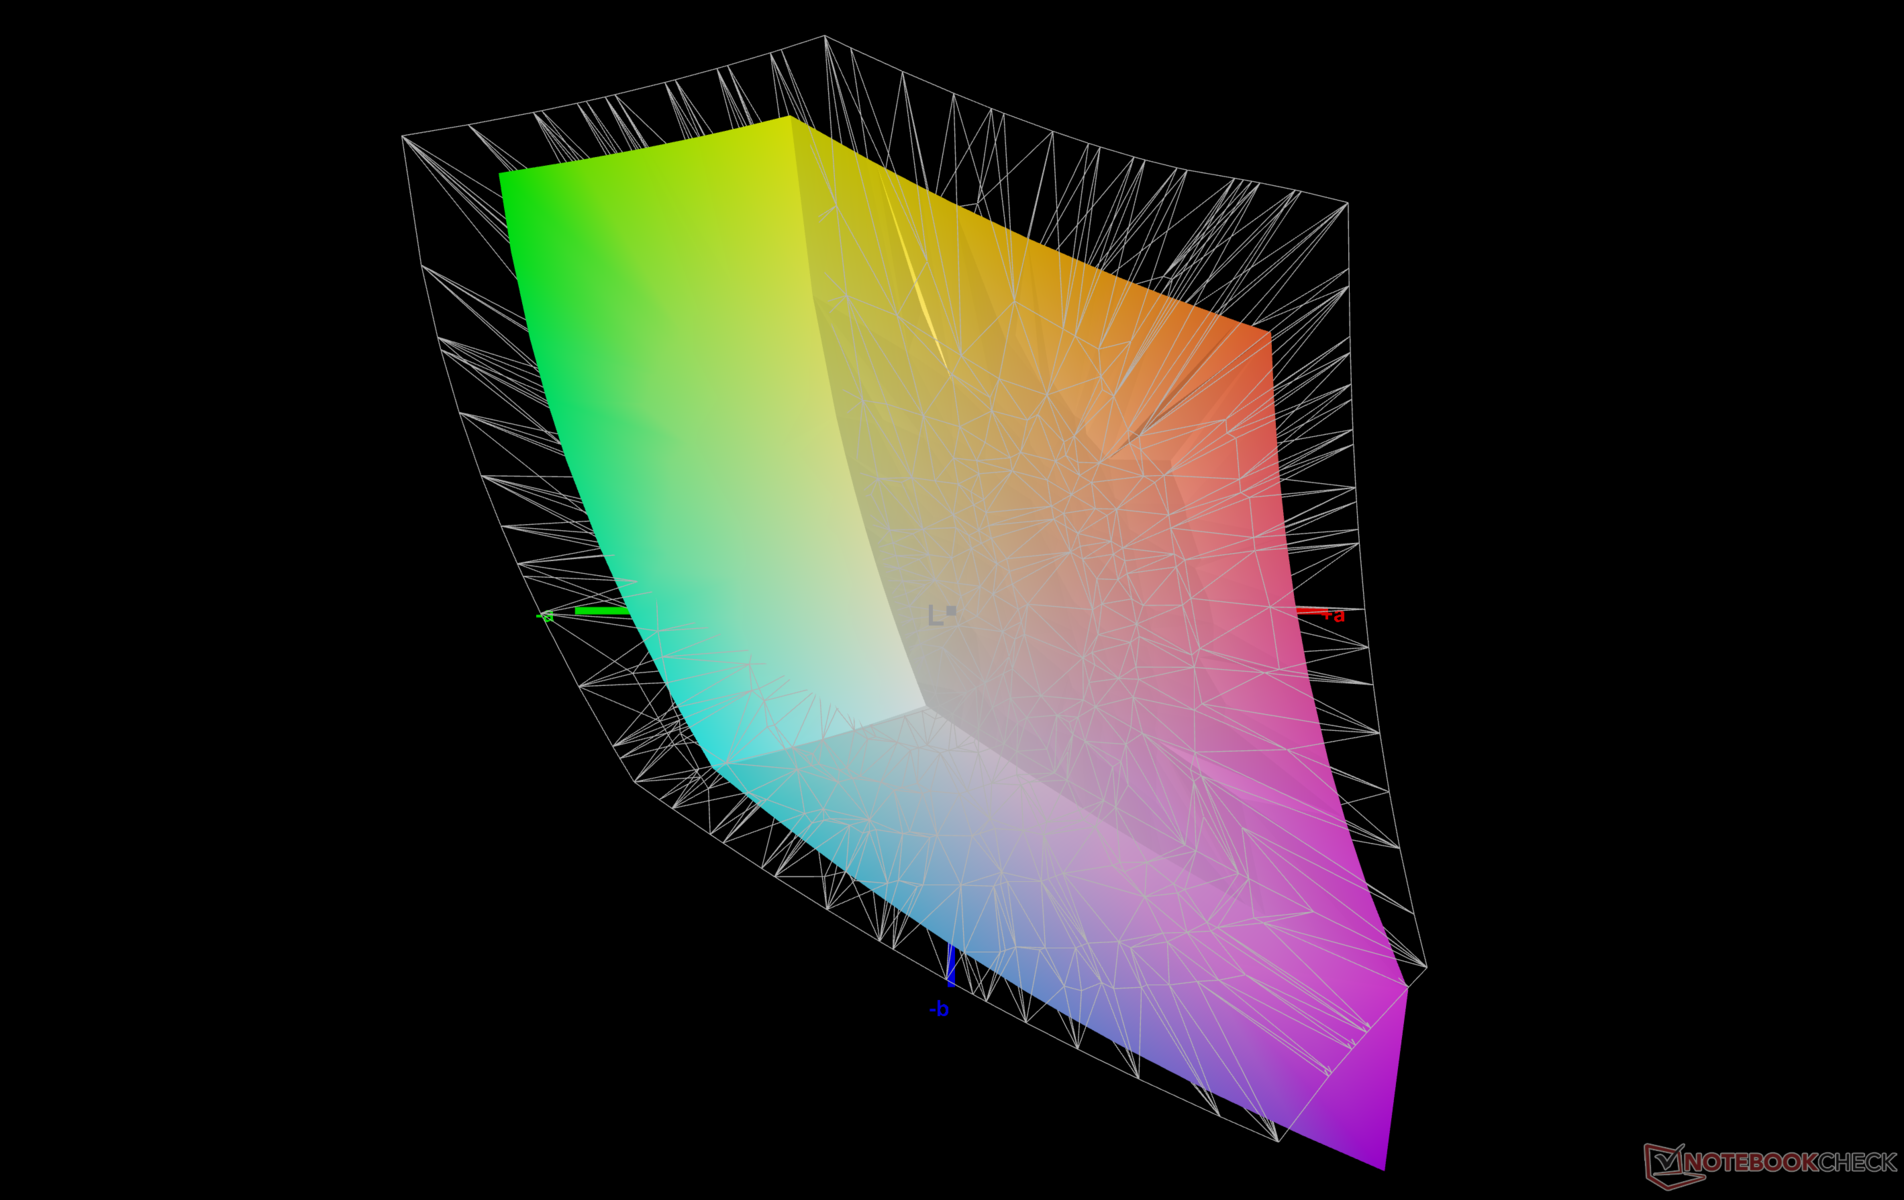
70.8% AdobeRGB 1998 (Argyll 2.2.0 3D)
95.9% sRGB (Argyll 2.2.0 3D)
71.9% Display P3 (Argyll 2.2.0 3D)
Gamma: 2.07
| Framework Laptop 13.5 Ryzen AI 9 HX 370 BOE NE135A1M-NY1, IPS, 2880x1920, 13.5", 120 Hz | Framework Laptop 13.5 Core Ultra 7 155H BOE NE135A1M-NY1, IPS, 2880x1920, 13.5", 120 Hz | Dell Pro 13 Premium PA13250 B133UAN (AUOBEB0), IPS, 1920x1200, 13.3", 60 Hz | MSI Summit E13 AI Evo A1MTG CMN13C6, IPS, 1920x1200, 13.3", 60 Hz | HP EliteBook x360 830 G10 7L7U1ET LGD06E5, IPS LED, 1920x1200, 13.3", Hz | Lenovo ThinkPad Z13 Gen 2 ATNA33AA02-0, OLED, 2880x1800, 13.3", 60 Hz | |
|---|---|---|---|---|---|---|
| Display | 2% | 4% | 2% | -8% | 27% | |
| Display P3 Coverage | 71.9 | 72.8 1% | 74.3 3% | 71.6 0% | 63.2 -12% | 99.7 39% |
| sRGB Coverage | 95.9 | 98.6 3% | 99.1 3% | 98.6 3% | 92.7 -3% | 100 4% |
| AdobeRGB 1998 Coverage | 70.8 | 72.9 3% | 75.9 7% | 73.1 3% | 65.1 -8% | 97.3 37% |
| Response Times | -6% | -25% | -54% | -10% | 93% | |
| Response Time Grey 50% / Grey 80% * | 40 ? | 41.9 ? -5% | 52.8 ? -32% | 60 ? -50% | 39.8 ? -0% | 2.1 ? 95% |
| Response Time Black / White * | 22.3 ? | 23.7 ? -6% | 26.4 ? -18% | 35.1 ? -57% | 26.8 ? -20% | 2.2 ? 90% |
| PWM Frequency | 60.1 ? | |||||
| Screen | 5% | 13% | 18% | 9% | 31% | |
| Brightness middle | 529.9 | 498.5 -6% | 456 -14% | 405.2 -24% | 394 -26% | 372 -30% |
| Brightness | 506 | 464 -8% | 460 -9% | 372 -26% | 372 -26% | 375 -26% |
| Brightness Distribution | 94 | 86 -9% | 89 -5% | 88 -6% | 84 -11% | 99 5% |
| Black Level * | 0.3 | 0.36 -20% | 0.23 23% | 0.34 -13% | 0.17 43% | |
| Contrast | 1766 | 1385 -22% | 1983 12% | 1192 -33% | 2318 31% | |
| Colorchecker dE 2000 * | 5.7 | 4.27 25% | 3.3 42% | 2.4 58% | 4.1 28% | 0.88 85% |
| Colorchecker dE 2000 max. * | 10.6 | 7.08 33% | 6.47 39% | 3.56 66% | 8.3 22% | 3.22 70% |
| Colorchecker dE 2000 calibrated * | 1.5 | 1.26 16% | 1.7 -13% | 0.54 64% | ||
| Greyscale dE 2000 * | 7.5 | 4.7 37% | 4.35 42% | 1.9 75% | 6.6 12% | 1.2 84% |
| Gamma | 2.07 106% | 2.09 105% | 2.51 88% | 2 110% | 2.17 101% | 2.18 101% |
| CCT | 6967 93% | 7417 88% | 6215 105% | 6503 100% | 6019 108% | 6326 103% |
| Total Average (Program / Settings) | 0% /
3% | -3% /
6% | -11% /
4% | -3% /
2% | 50% /
41% |
* ... smaller is better
显示器没有预校准。我们建议使用上述经过校准的 ICM 配置文件,以获得更准确的 sRGB 色彩。
Display Response Times
| ↔ Response Time Black to White | ||
|---|---|---|
| 22.3 ms ... rise ↗ and fall ↘ combined | ↗ 11.1 ms rise | 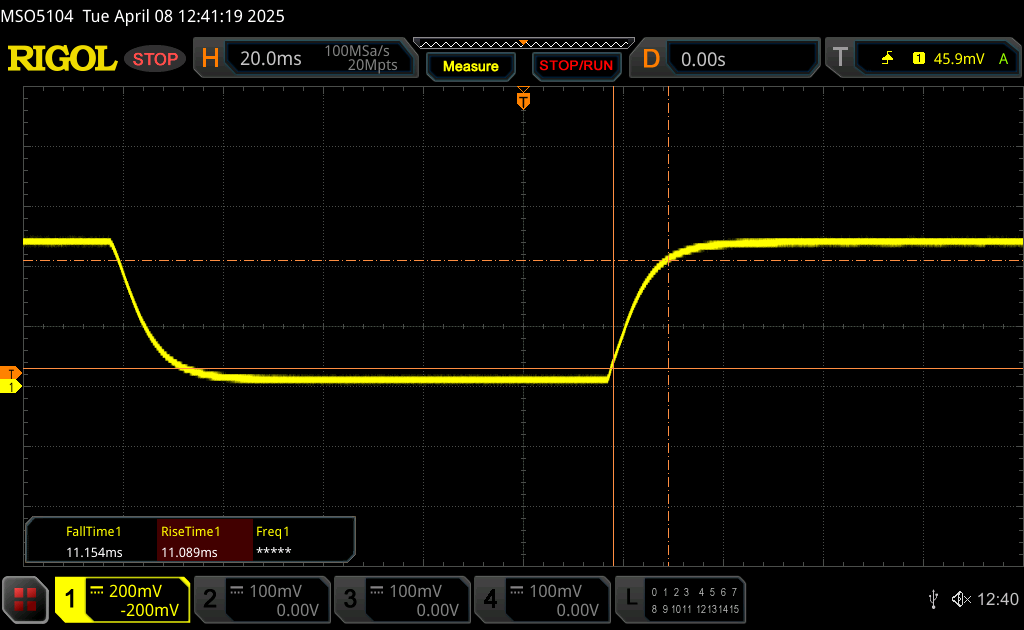 |
| ↘ 11.2 ms fall | ||
| The screen shows good response rates in our tests, but may be too slow for competitive gamers. In comparison, all tested devices range from 0.1 (minimum) to 240 (maximum) ms. » 47 % of all devices are better. This means that the measured response time is similar to the average of all tested devices (20.7 ms). | ||
| ↔ Response Time 50% Grey to 80% Grey | ||
| 40 ms ... rise ↗ and fall ↘ combined | ↗ 18.2 ms rise | 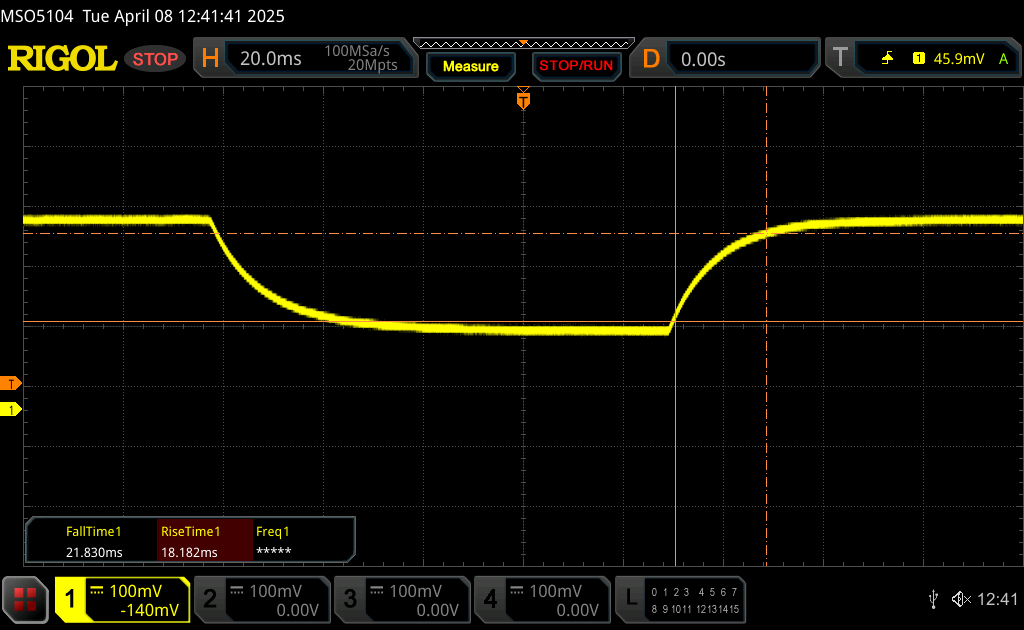 |
| ↘ 21.8 ms fall | ||
| The screen shows slow response rates in our tests and will be unsatisfactory for gamers. In comparison, all tested devices range from 0.165 (minimum) to 636 (maximum) ms. » 58 % of all devices are better. This means that the measured response time is worse than the average of all tested devices (32.5 ms). | ||
Screen Flickering / PWM (Pulse-Width Modulation)
| Screen flickering / PWM not detected | 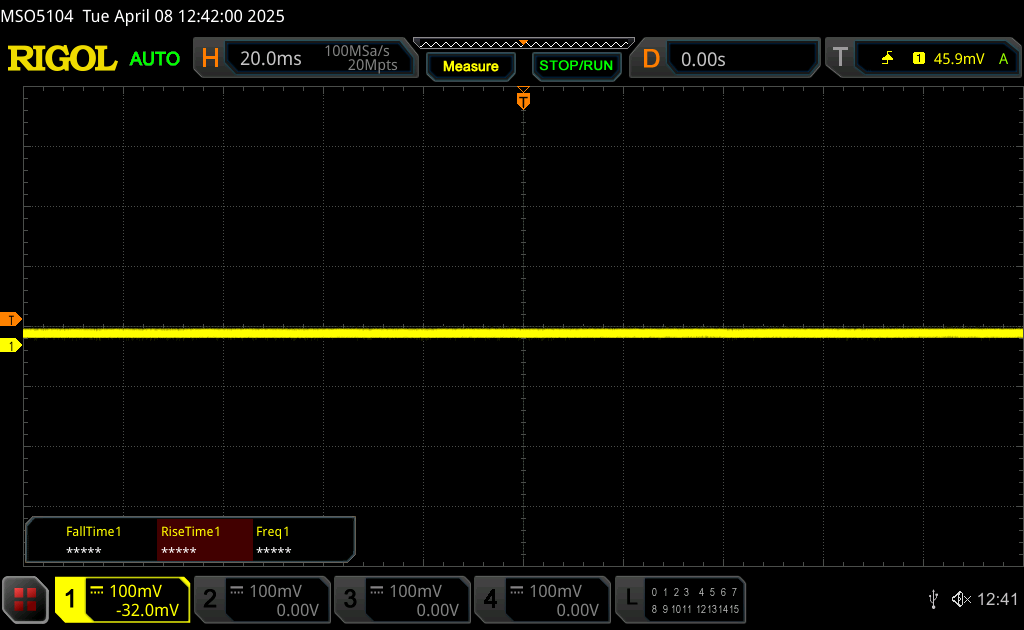 | ||
In comparison: 53 % of all tested devices do not use PWM to dim the display. If PWM was detected, an average of 8500 (minimum: 5 - maximum: 343500) Hz was measured. | |||

性能
测试条件
在运行以下基准测试之前,我们将 Windows 设置为性能模式。
处理器
产品 Ryzen AI 9 HX 370比去年的英特尔 酷睿至尊 7 155H 在多线程工作负载方面,Ryzen AI 9 HX 370 可比去年的英特尔酷睿 Ultra 7 155H 轻松快 30% 至 35%。不过,性能的持续性可能会更好,如下图所示,在运行 CineBench R15 xT 循环测试时,分数会随着时间的推移缓慢下降,降幅最高可达 15%。不过,即使考虑到轻微的节流,它仍然比以前的 Laptop 13.5 配置更快。
Cinebench R15 Multi Loop
Cinebench R23: Multi Core | Single Core
Cinebench R20: CPU (Multi Core) | CPU (Single Core)
Cinebench R15: CPU Multi 64Bit | CPU Single 64Bit
Blender: v2.79 BMW27 CPU
7-Zip 18.03: 7z b 4 | 7z b 4 -mmt1
Geekbench 6.4: Multi-Core | Single-Core
Geekbench 5.5: Multi-Core | Single-Core
HWBOT x265 Benchmark v2.2: 4k Preset
LibreOffice : 20 Documents To PDF
R Benchmark 2.5: Overall mean
| Geekbench 6.4 / Multi-Core | |
| Framework Laptop 13.5 Ryzen AI 9 HX 370 | |
| Average AMD Ryzen AI 9 HX 370 (11973 - 15671, n=18) | |
| Framework Laptop 13.5 Core Ultra 7 155H | |
| Framework Laptop 13.5 Ryzen 7 7840U | |
| MSI Summit E13 AI Evo A1MTG | |
| Dell Pro 13 Premium PA13250 | |
| Dell Latitude 13 7350 | |
| Geekbench 6.4 / Single-Core | |
| Average AMD Ryzen AI 9 HX 370 (2780 - 2965, n=18) | |
| Framework Laptop 13.5 Ryzen AI 9 HX 370 | |
| Dell Pro 13 Premium PA13250 | |
| Framework Laptop 13.5 Ryzen 7 7840U | |
| Framework Laptop 13.5 Core Ultra 7 155H | |
| MSI Summit E13 AI Evo A1MTG | |
| Dell Latitude 13 7350 | |
* ... smaller is better
AIDA64: FP32 Ray-Trace | FPU Julia | CPU SHA3 | CPU Queen | FPU SinJulia | FPU Mandel | CPU AES | CPU ZLib | FP64 Ray-Trace | CPU PhotoWorxx
| Performance Rating | |
| Average AMD Ryzen AI 9 HX 370 | |
| Framework Laptop 13.5 Ryzen AI 9 HX 370 | |
| Lenovo ThinkPad Z13 Gen 2 | |
| Framework Laptop 13.5 Core Ultra 7 155H | |
| MSI Summit E13 AI Evo A1MTG | |
| Dell Pro 13 Premium PA13250 | |
| HP EliteBook x360 830 G10 7L7U1ET | |
| AIDA64 / FP32 Ray-Trace | |
| Average AMD Ryzen AI 9 HX 370 (24673 - 37654, n=15) | |
| Framework Laptop 13.5 Ryzen AI 9 HX 370 | |
| Lenovo ThinkPad Z13 Gen 2 | |
| Framework Laptop 13.5 Core Ultra 7 155H | |
| Dell Pro 13 Premium PA13250 | |
| MSI Summit E13 AI Evo A1MTG | |
| HP EliteBook x360 830 G10 7L7U1ET | |
| AIDA64 / FPU SinJulia | |
| Average AMD Ryzen AI 9 HX 370 (16445 - 19115, n=16) | |
| Framework Laptop 13.5 Ryzen AI 9 HX 370 | |
| Lenovo ThinkPad Z13 Gen 2 | |
| Framework Laptop 13.5 Core Ultra 7 155H | |
| MSI Summit E13 AI Evo A1MTG | |
| Dell Pro 13 Premium PA13250 | |
| HP EliteBook x360 830 G10 7L7U1ET | |
| AIDA64 / FP64 Ray-Trace | |
| Average AMD Ryzen AI 9 HX 370 (13665 - 20608, n=16) | |
| Framework Laptop 13.5 Ryzen AI 9 HX 370 | |
| Lenovo ThinkPad Z13 Gen 2 | |
| Framework Laptop 13.5 Core Ultra 7 155H | |
| Dell Pro 13 Premium PA13250 | |
| MSI Summit E13 AI Evo A1MTG | |
| HP EliteBook x360 830 G10 7L7U1ET | |
| AIDA64 / CPU PhotoWorxx | |
| Average AMD Ryzen AI 9 HX 370 (36752 - 51727, n=16) | |
| Framework Laptop 13.5 Ryzen AI 9 HX 370 | |
| Dell Pro 13 Premium PA13250 | |
| Framework Laptop 13.5 Core Ultra 7 155H | |
| MSI Summit E13 AI Evo A1MTG | |
| Lenovo ThinkPad Z13 Gen 2 | |
| HP EliteBook x360 830 G10 7L7U1ET | |
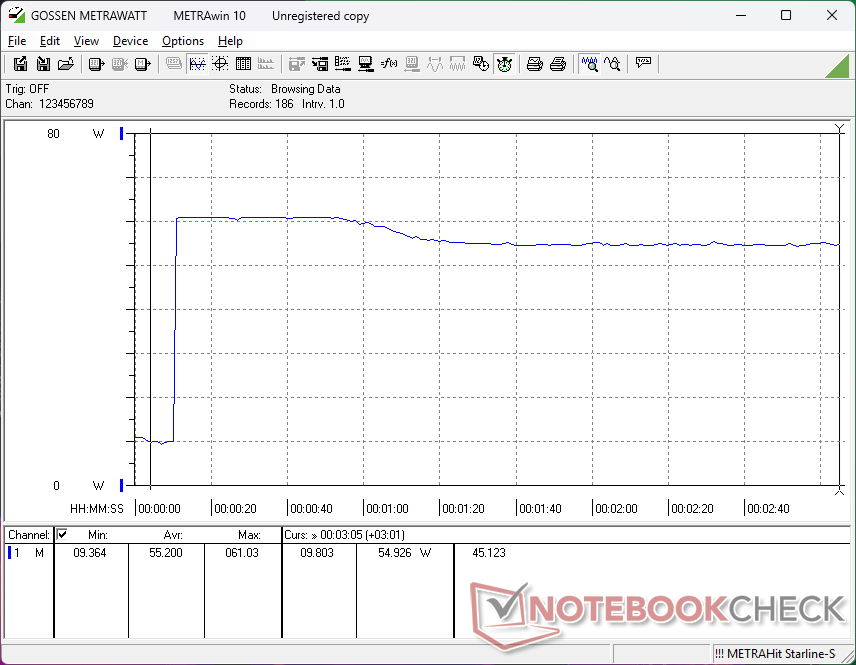
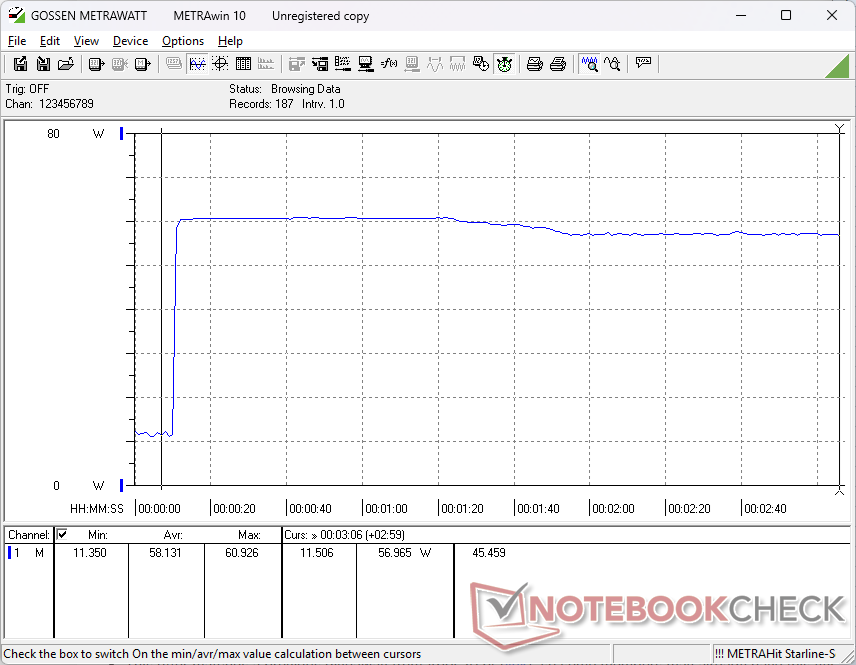
压力测试
在启动 Prime95 压力测试时,CPU 会提升至 3.2 GHz 和 46 W,然后在测试一分钟后降至 2.6 GHz 和 33 W,以表示有限的最大 Turbo Boost。在其他方面,核心温度与英特尔配置相似,甚至在游戏时略低于英特尔配置。
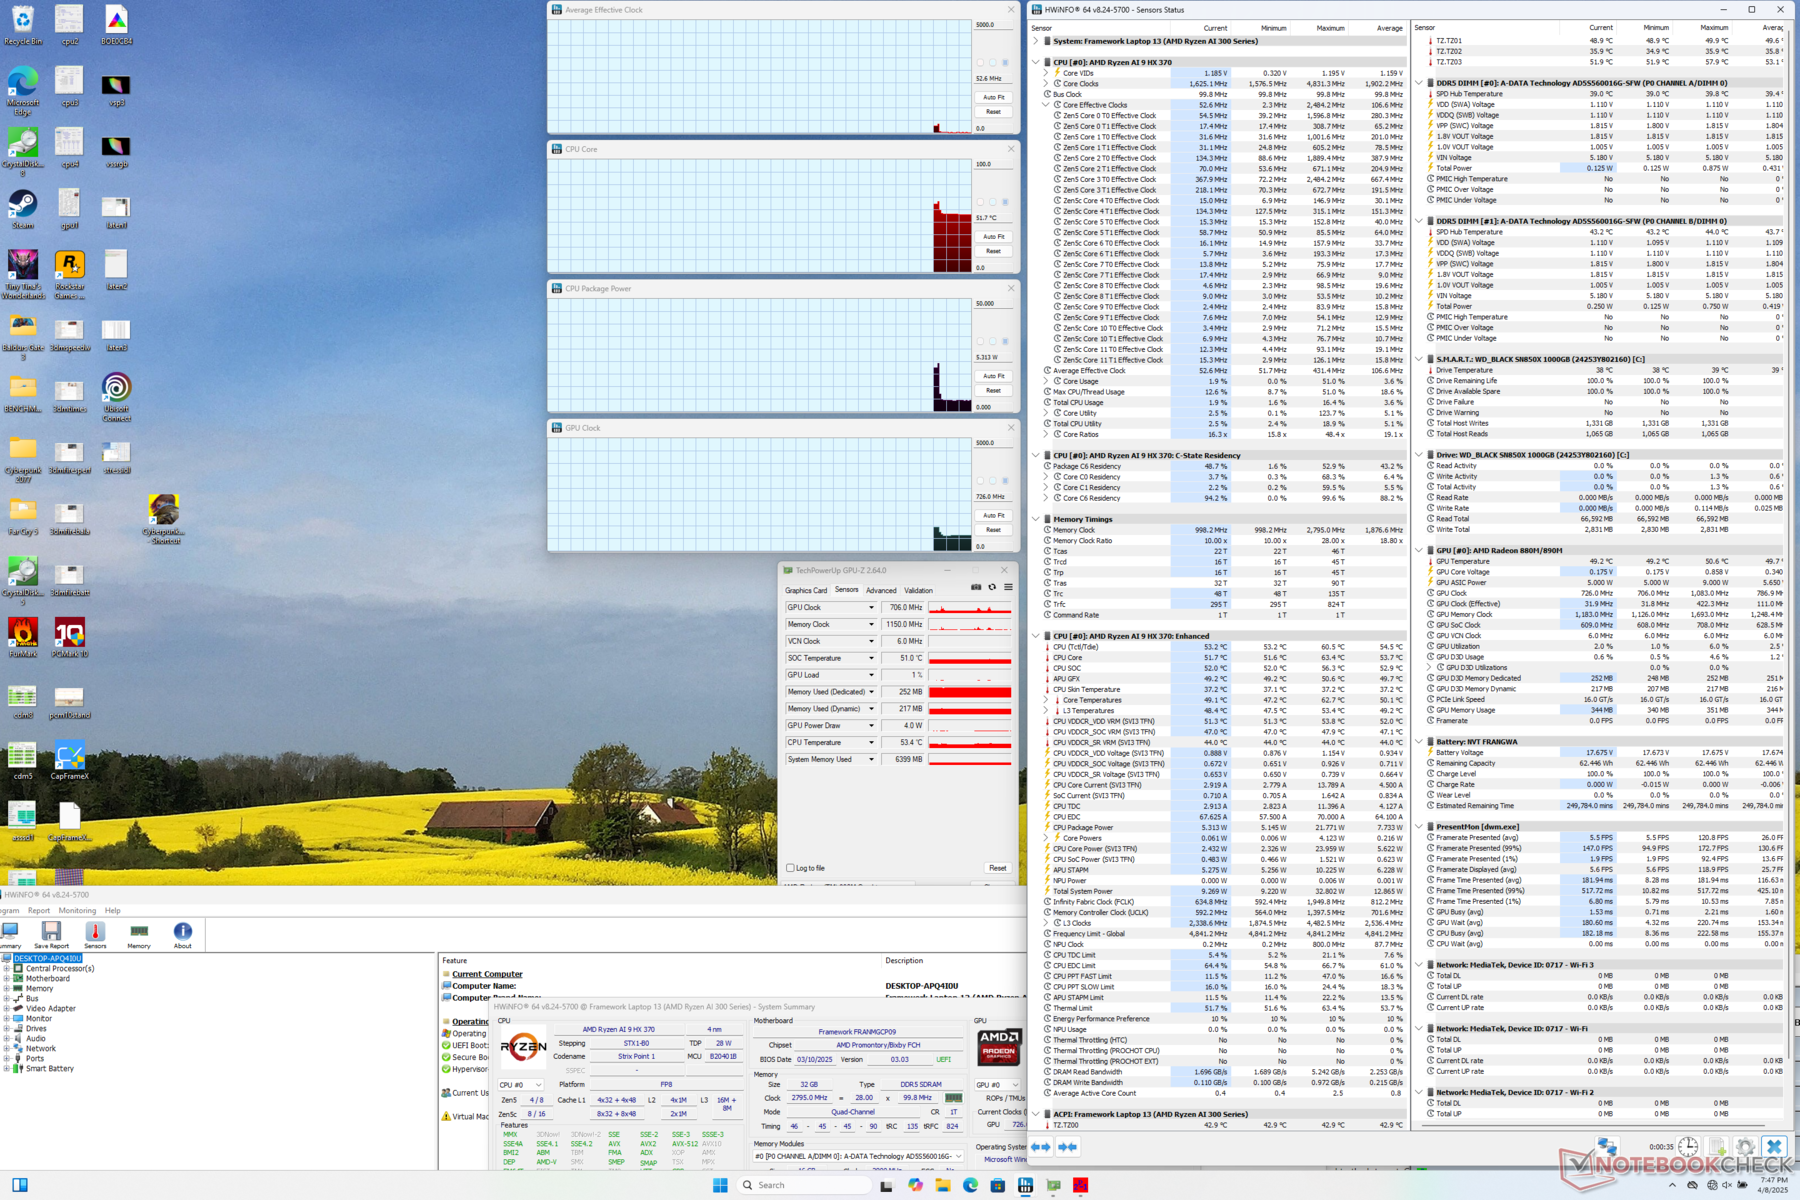
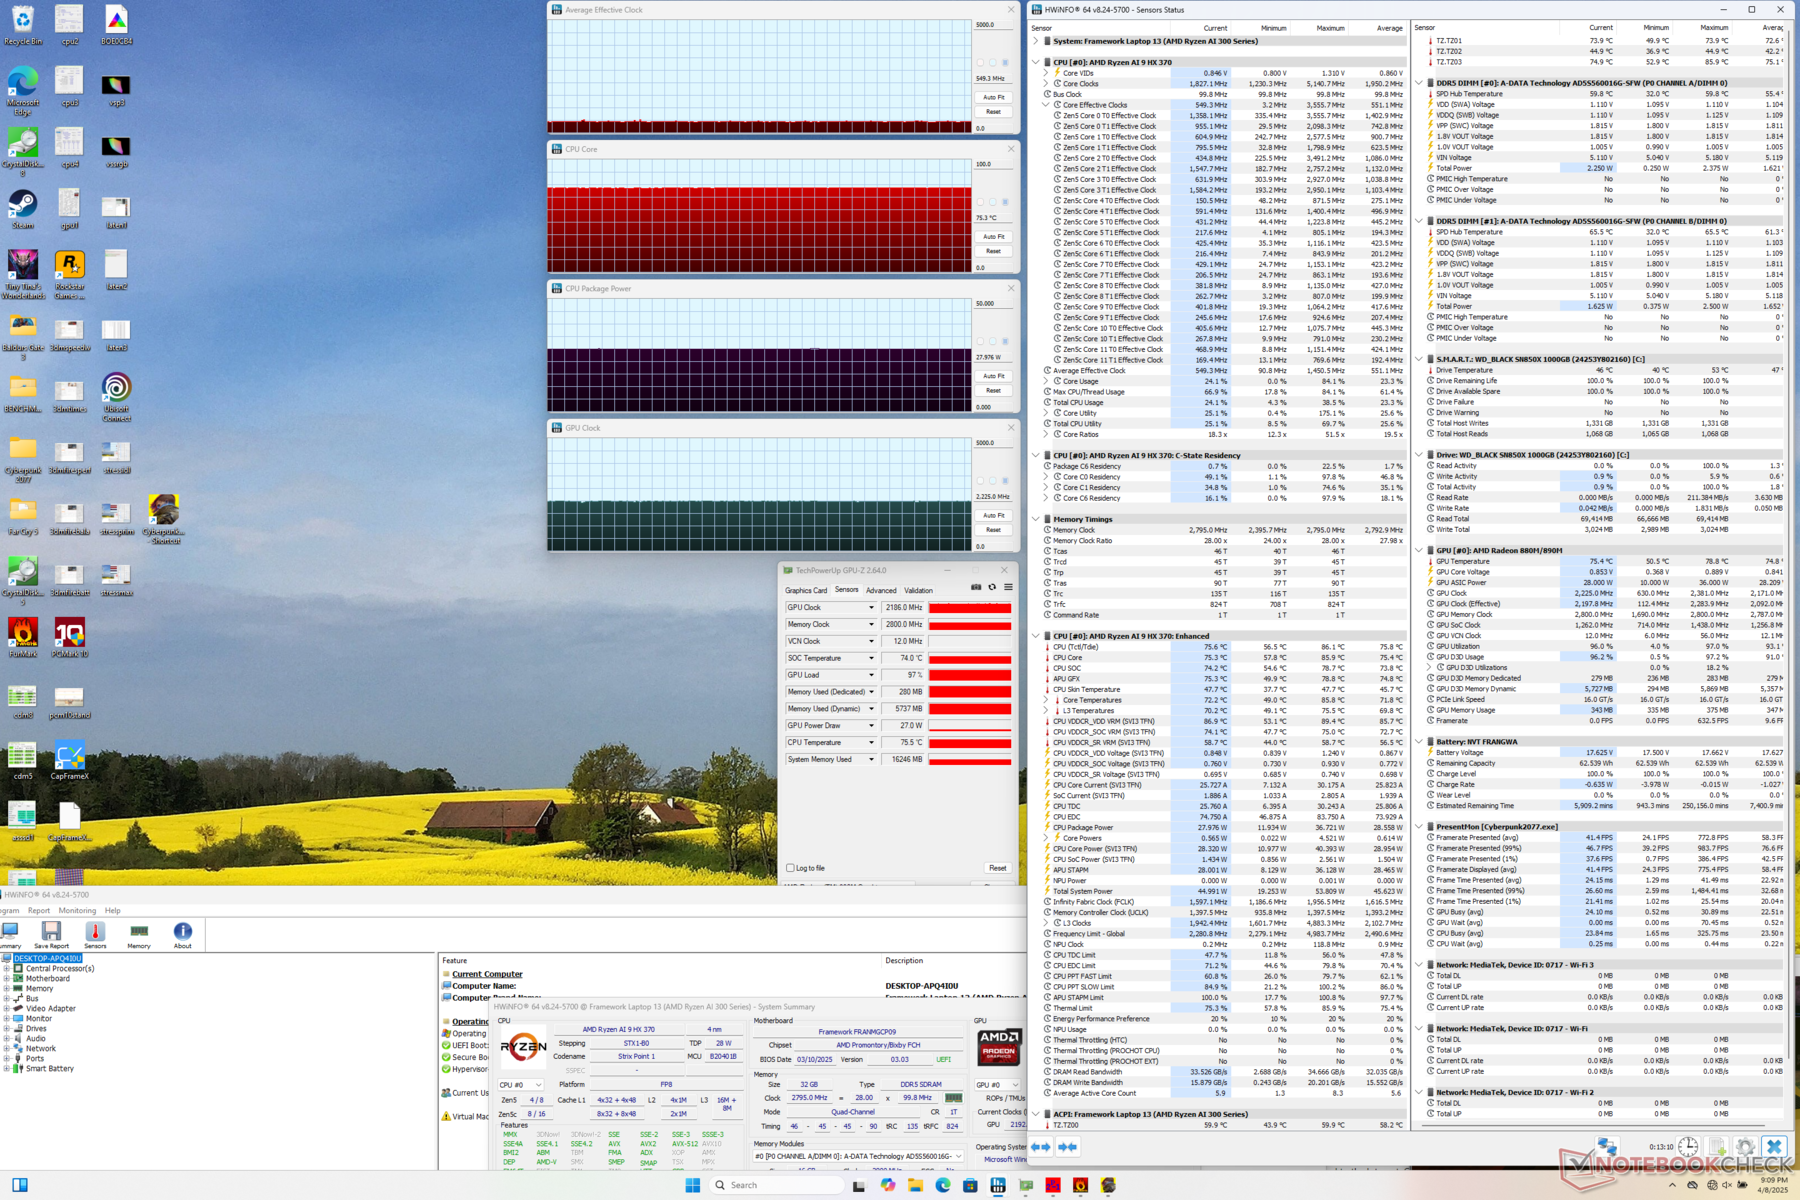
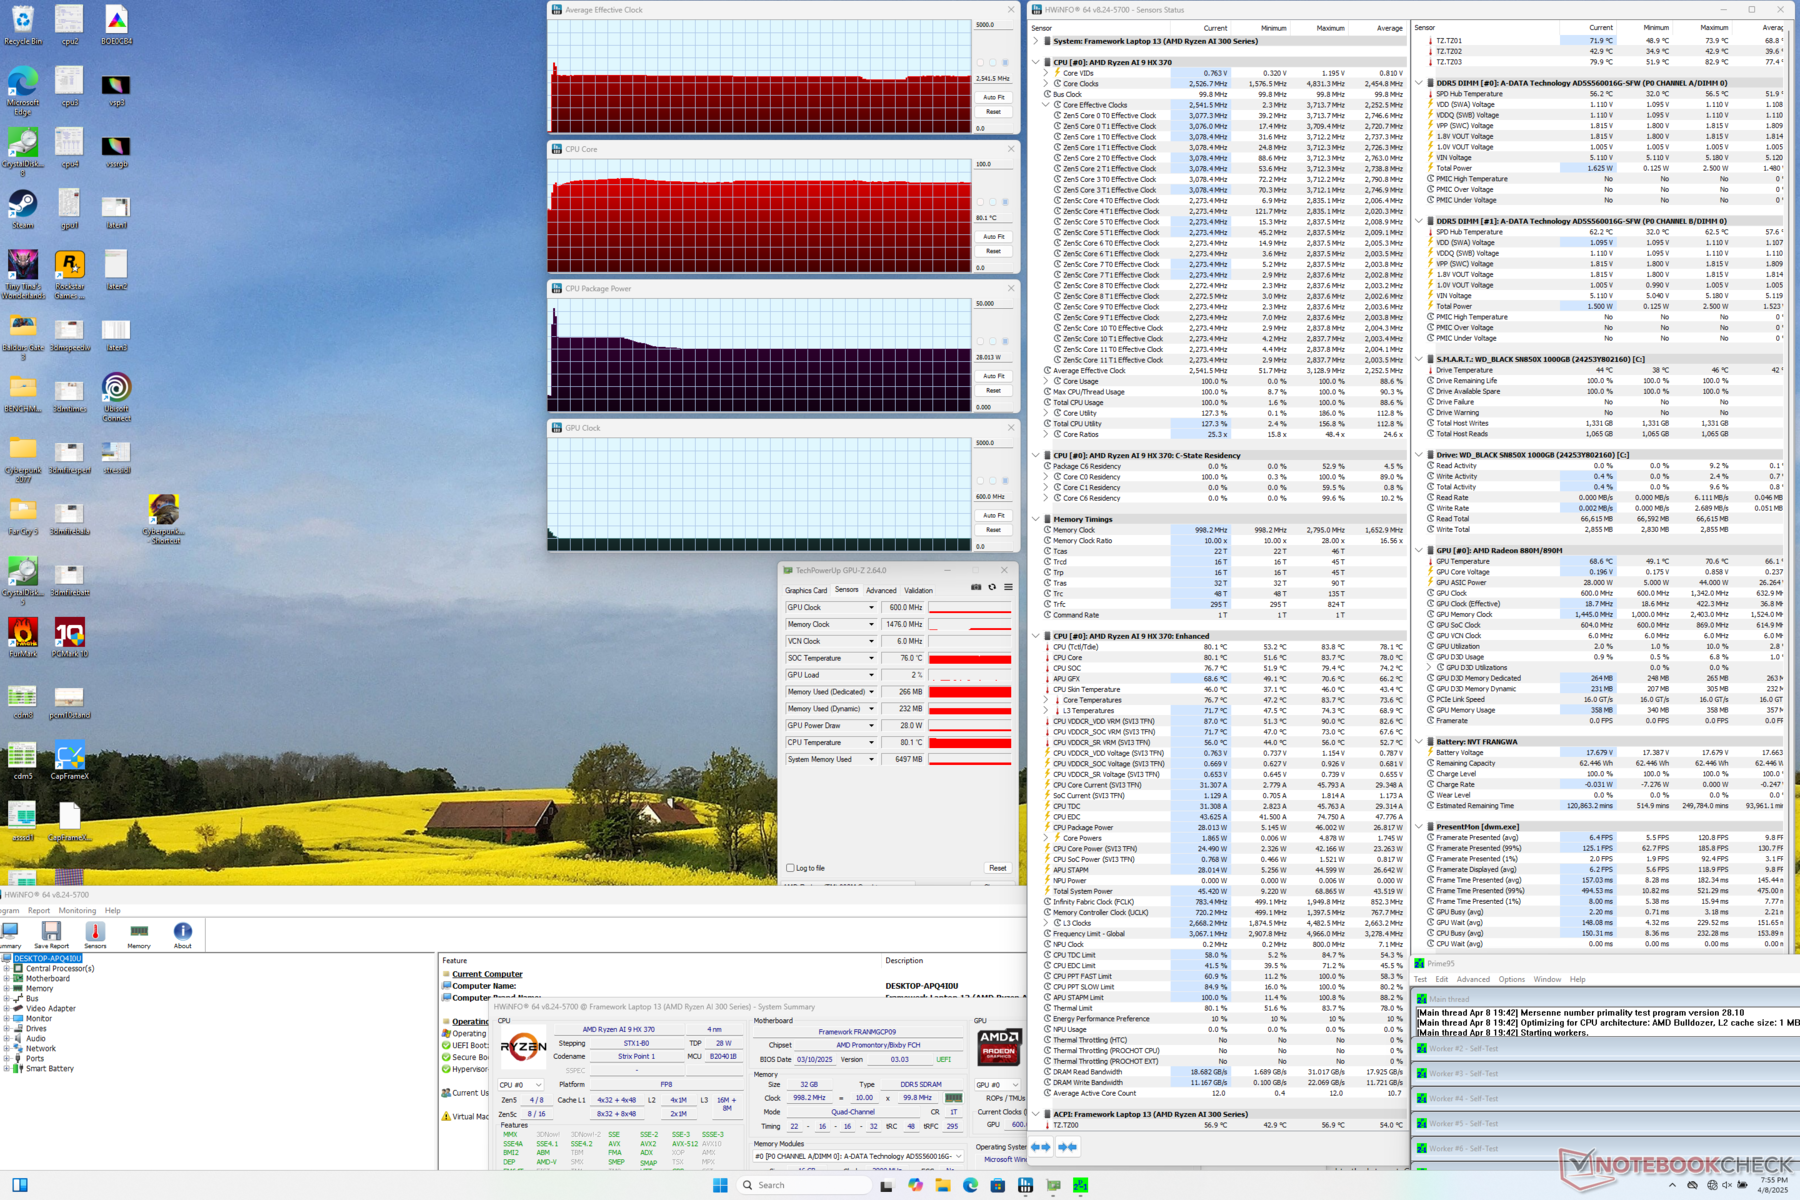
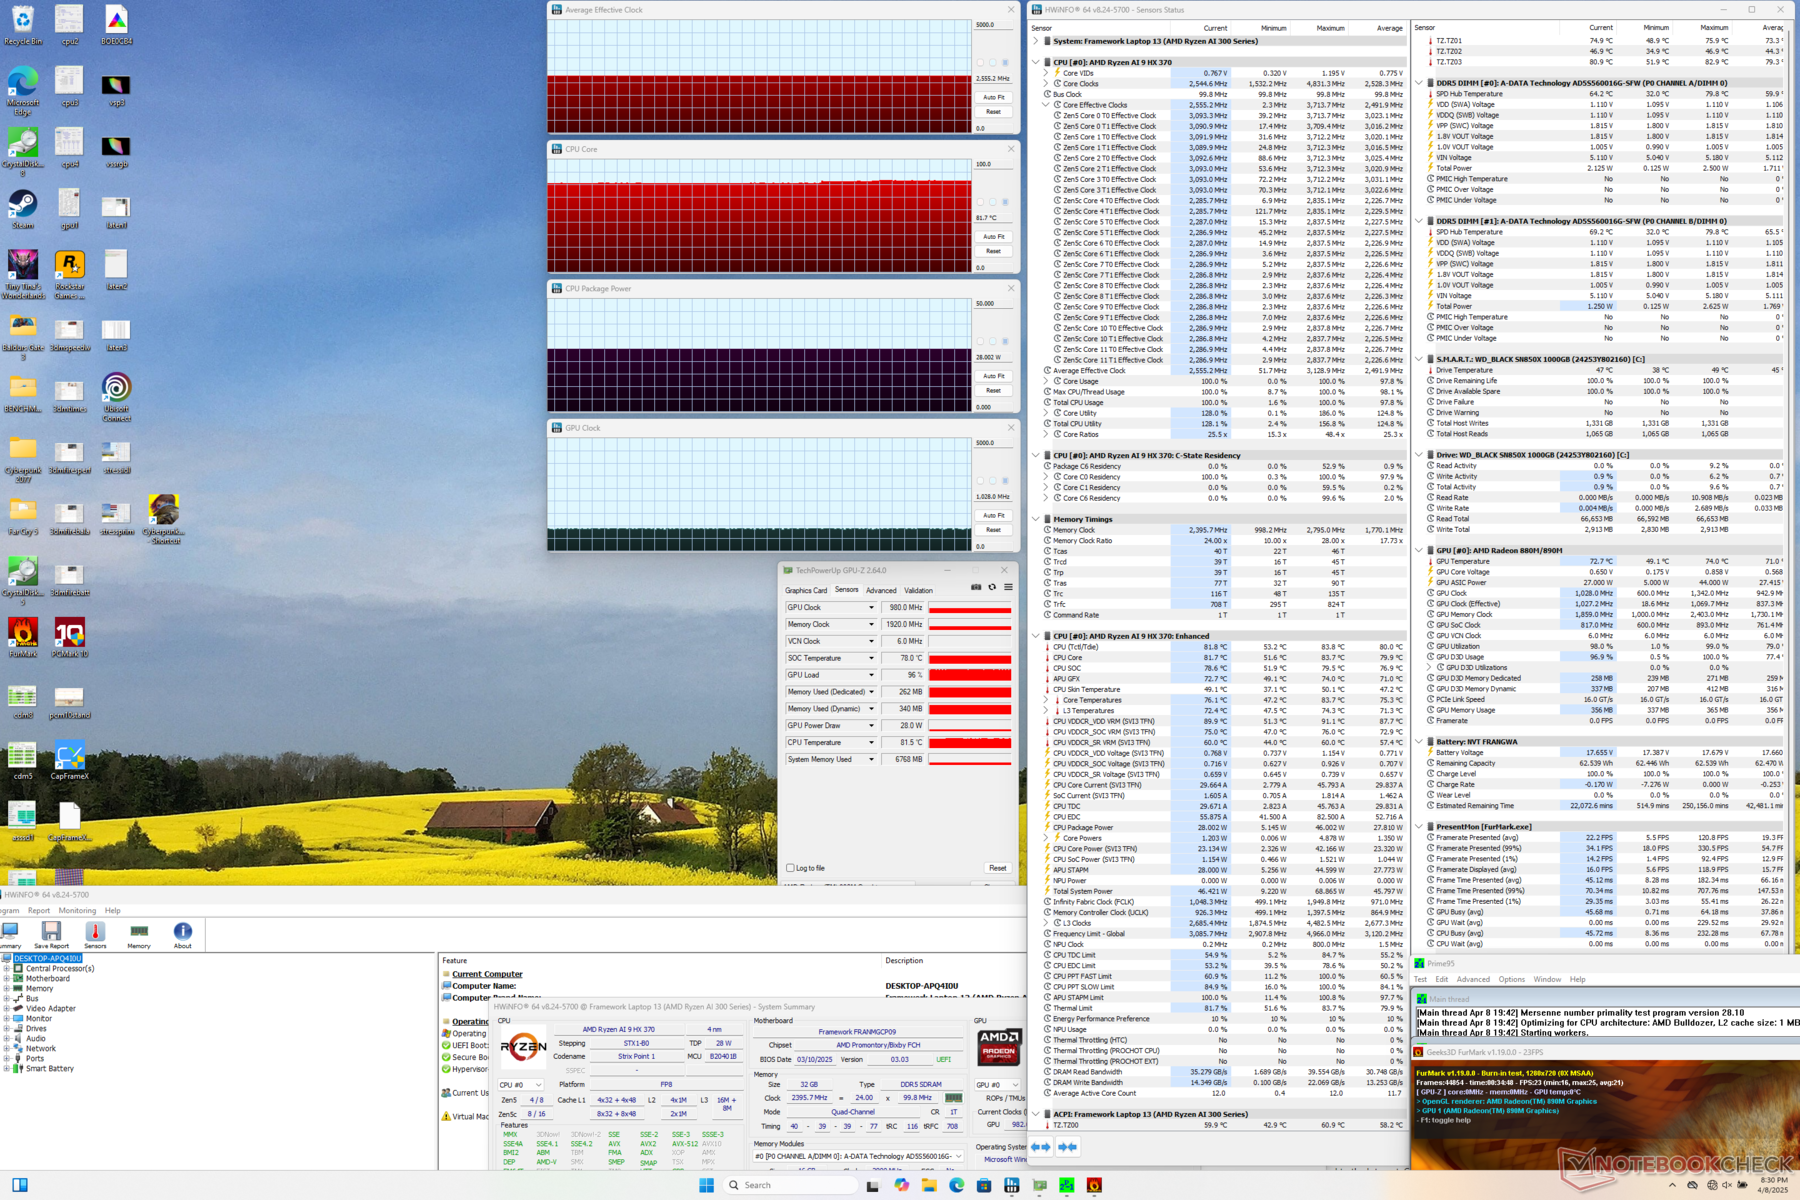
| CPU 平均时钟 (GHz) | GPU 时钟 (MHz) | CPU 平均温度 (°C) | |
| 系统闲置 | -- | -- | 52 |
| Prime95 压力 | 2.5 | -- | 80 |
| Prime95 + FurMark Stress | 2.6 | 980 | 82 |
| 赛博朋克 2077》压力 | 0.6 | 2186 | 75 |
系统性能

CrossMark: Overall | Productivity | Creativity | Responsiveness
WebXPRT 3: Overall
WebXPRT 4: Overall
Mozilla Kraken 1.1: Total
| PCMark 10 / Score | |
| Framework Laptop 13.5 Ryzen AI 9 HX 370 | |
| Average AMD Ryzen AI 9 HX 370, AMD Radeon 890M (6577 - 7646, n=10) | |
| Lenovo ThinkPad Z13 Gen 2 | |
| Framework Laptop 13.5 Core Ultra 7 155H | |
| Dell Pro 13 Premium PA13250 | |
| HP EliteBook x360 830 G10 7L7U1ET | |
| MSI Summit E13 AI Evo A1MTG | |
| PCMark 10 / Essentials | |
| Framework Laptop 13.5 Ryzen AI 9 HX 370 | |
| Lenovo ThinkPad Z13 Gen 2 | |
| Framework Laptop 13.5 Core Ultra 7 155H | |
| Average AMD Ryzen AI 9 HX 370, AMD Radeon 890M (9277 - 11262, n=10) | |
| HP EliteBook x360 830 G10 7L7U1ET | |
| Dell Pro 13 Premium PA13250 | |
| MSI Summit E13 AI Evo A1MTG | |
| PCMark 10 / Productivity | |
| Framework Laptop 13.5 Ryzen AI 9 HX 370 | |
| Average AMD Ryzen AI 9 HX 370, AMD Radeon 890M (8497 - 10615, n=10) | |
| Lenovo ThinkPad Z13 Gen 2 | |
| Dell Pro 13 Premium PA13250 | |
| Framework Laptop 13.5 Core Ultra 7 155H | |
| HP EliteBook x360 830 G10 7L7U1ET | |
| MSI Summit E13 AI Evo A1MTG | |
| PCMark 10 / Digital Content Creation | |
| Average AMD Ryzen AI 9 HX 370, AMD Radeon 890M (9334 - 11422, n=10) | |
| Framework Laptop 13.5 Ryzen AI 9 HX 370 | |
| Framework Laptop 13.5 Core Ultra 7 155H | |
| Dell Pro 13 Premium PA13250 | |
| Lenovo ThinkPad Z13 Gen 2 | |
| MSI Summit E13 AI Evo A1MTG | |
| HP EliteBook x360 830 G10 7L7U1ET | |
| CrossMark / Overall | |
| Framework Laptop 13.5 Ryzen AI 9 HX 370 | |
| Average AMD Ryzen AI 9 HX 370, AMD Radeon 890M (1686 - 1847, n=8) | |
| Framework Laptop 13.5 Core Ultra 7 155H | |
| Dell Pro 13 Premium PA13250 | |
| MSI Summit E13 AI Evo A1MTG | |
| Lenovo ThinkPad Z13 Gen 2 | |
| HP EliteBook x360 830 G10 7L7U1ET | |
| CrossMark / Productivity | |
| Framework Laptop 13.5 Ryzen AI 9 HX 370 | |
| Average AMD Ryzen AI 9 HX 370, AMD Radeon 890M (1588 - 1719, n=8) | |
| Framework Laptop 13.5 Core Ultra 7 155H | |
| Dell Pro 13 Premium PA13250 | |
| MSI Summit E13 AI Evo A1MTG | |
| Lenovo ThinkPad Z13 Gen 2 | |
| HP EliteBook x360 830 G10 7L7U1ET | |
| CrossMark / Creativity | |
| Framework Laptop 13.5 Ryzen AI 9 HX 370 | |
| Average AMD Ryzen AI 9 HX 370, AMD Radeon 890M (1817 - 2211, n=8) | |
| Framework Laptop 13.5 Core Ultra 7 155H | |
| Dell Pro 13 Premium PA13250 | |
| Lenovo ThinkPad Z13 Gen 2 | |
| MSI Summit E13 AI Evo A1MTG | |
| HP EliteBook x360 830 G10 7L7U1ET | |
| CrossMark / Responsiveness | |
| Average AMD Ryzen AI 9 HX 370, AMD Radeon 890M (1222 - 1610, n=8) | |
| Framework Laptop 13.5 Ryzen AI 9 HX 370 | |
| MSI Summit E13 AI Evo A1MTG | |
| Framework Laptop 13.5 Core Ultra 7 155H | |
| Dell Pro 13 Premium PA13250 | |
| Lenovo ThinkPad Z13 Gen 2 | |
| HP EliteBook x360 830 G10 7L7U1ET | |
| WebXPRT 3 / Overall | |
| Framework Laptop 13.5 Ryzen AI 9 HX 370 | |
| Average AMD Ryzen AI 9 HX 370, AMD Radeon 890M (252 - 342, n=9) | |
| Lenovo ThinkPad Z13 Gen 2 | |
| Framework Laptop 13.5 Core Ultra 7 155H | |
| MSI Summit E13 AI Evo A1MTG | |
| HP EliteBook x360 830 G10 7L7U1ET | |
| Dell Pro 13 Premium PA13250 | |
| WebXPRT 4 / Overall | |
| Framework Laptop 13.5 Ryzen AI 9 HX 370 | |
| Framework Laptop 13.5 Core Ultra 7 155H | |
| Average AMD Ryzen AI 9 HX 370, AMD Radeon 890M (210 - 277, n=10) | |
| Dell Pro 13 Premium PA13250 | |
| Lenovo ThinkPad Z13 Gen 2 | |
| MSI Summit E13 AI Evo A1MTG | |
| Mozilla Kraken 1.1 / Total | |
| Lenovo ThinkPad Z13 Gen 2 | |
| HP EliteBook x360 830 G10 7L7U1ET | |
| MSI Summit E13 AI Evo A1MTG | |
| Framework Laptop 13.5 Core Ultra 7 155H | |
| Dell Pro 13 Premium PA13250 | |
| Framework Laptop 13.5 Ryzen AI 9 HX 370 | |
| Average AMD Ryzen AI 9 HX 370, AMD Radeon 890M (419 - 503, n=11) | |
* ... smaller is better
| PCMark 10 Score | 7530 points | |
Help | ||
| AIDA64 / Memory Latency | |
| Framework Laptop 13.5 Core Ultra 7 155H | |
| Average AMD Ryzen AI 9 HX 370 (87.2 - 119.4, n=16) | |
| Framework Laptop 13.5 Ryzen AI 9 HX 370 | |
| Framework Laptop 13.5 Ryzen 7 7840U | |
| Framework Laptop 13.5 12th Gen Intel | |
| Framework Laptop 13.5 | |
| Framework Laptop 13.5 13th Gen Intel | |
* ... smaller is better
DPC 延迟
在播放 4K60 视频时,AMD 配置的延迟和丢帧率略高于英特尔配置。

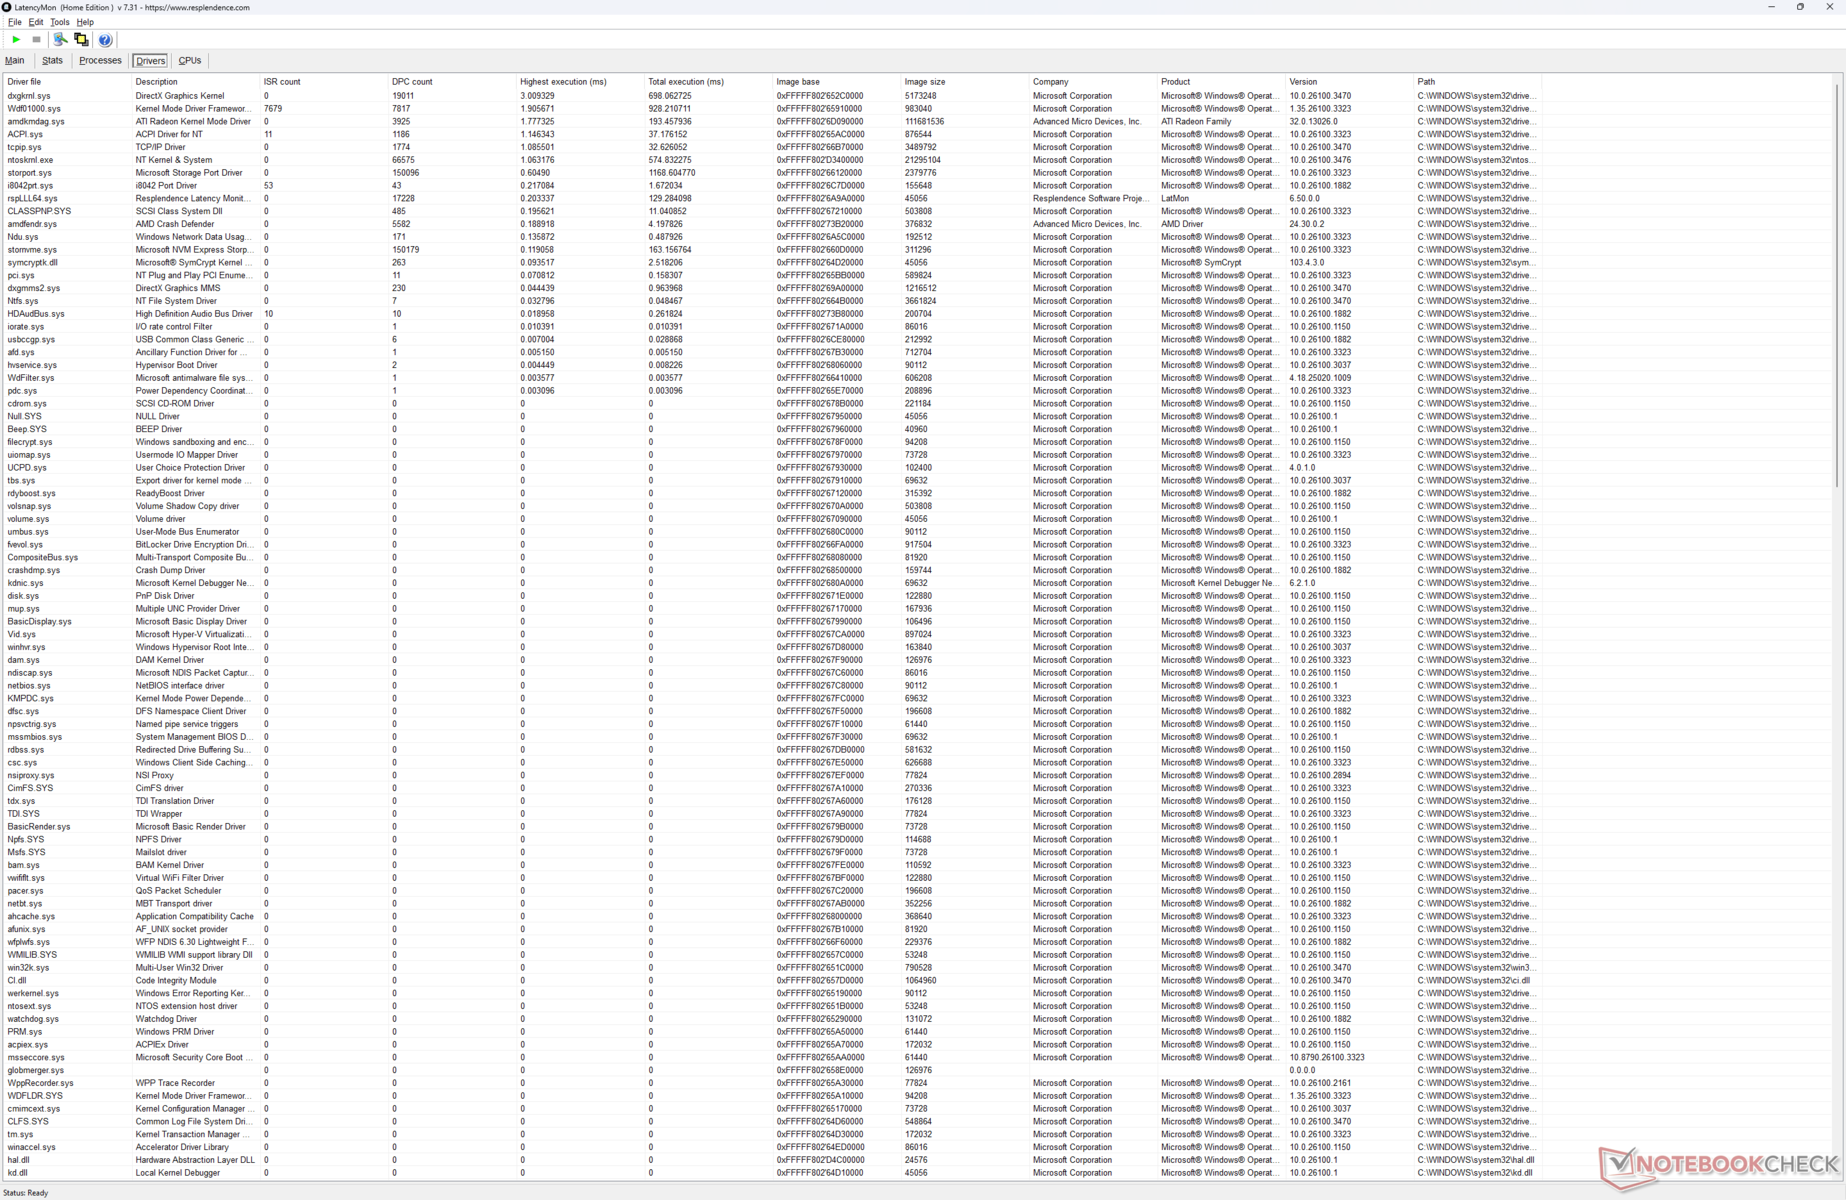
| DPC Latencies / LatencyMon - interrupt to process latency (max), Web, Youtube, Prime95 | |
| Framework Laptop 13.5 Ryzen AI 9 HX 370 | |
| MSI Summit E13 AI Evo A1MTG | |
| HP EliteBook x360 830 G10 7L7U1ET | |
| Lenovo ThinkPad Z13 Gen 2 | |
| Dell Pro 13 Premium PA13250 | |
| Framework Laptop 13.5 Core Ultra 7 155H | |
* ... smaller is better
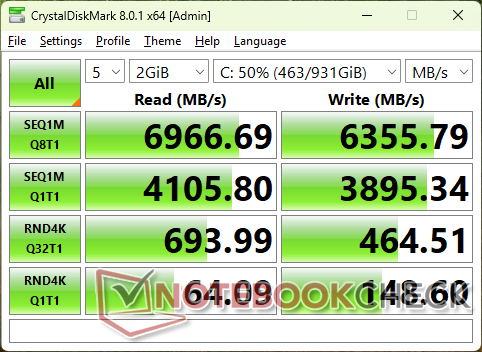
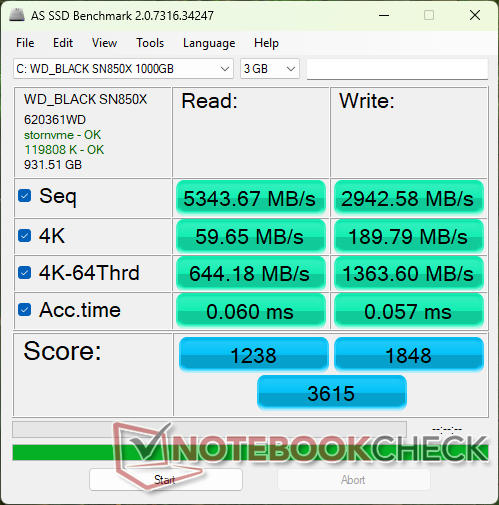
存储设备
框架提供相同的 WD Black SN850XPCIe4 NVMe 固态硬盘。

* ... smaller is better
Disk Throttling: DiskSpd Read Loop, Queue Depth 8
图形处理器性能
3DMark 结果比预期低 15%,与我们数据库中配备相同 Radeon RX 890M GPU.不过,在运行实际游戏时,我们的设备仍然始终优于较旧的 Core Ultra 7 155H 和 弧 8配置。
| 3DMark 11 Performance | 12491 points | |
| 3DMark Fire Strike Score | 7387 points | |
| 3DMark Time Spy Score | 3287 points | |
Help | ||
* ... smaller is better
Cyberpunk 2077 ultra FPS Chart
| low | med. | high | ultra | |
|---|---|---|---|---|
| GTA V (2015) | 172.7 | 159.9 | 71.2 | 29.7 |
| Dota 2 Reborn (2015) | 171.3 | 138.8 | 47.7 | 45.1 |
| Final Fantasy XV Benchmark (2018) | 73 | 39.1 | 27.8 | |
| X-Plane 11.11 (2018) | 71.6 | 55 | 45.4 | |
| Far Cry 5 (2018) | 80 | 45 | 42 | 40 |
| Strange Brigade (2018) | 174.4 | 70.8 | 58.7 | 48.5 |
| Tiny Tina's Wonderlands (2022) | 68.1 | 52.2 | 36.1 | 29.4 |
| F1 22 (2022) | 99.2 | 90.6 | 67.8 | 20.1 |
| Baldur's Gate 3 (2023) | 44.6 | 36.9 | 30.8 | 30 |
| Cyberpunk 2077 2.2 Phantom Liberty (2023) | 44.5 | 34.7 | 27.4 | 24.4 |
| Monster Hunter Wilds (2025) | 25 | 19.5 | 14 |
排放量
系统噪音
风扇噪音曲线与英特尔配置基本相同,底噪和顶噪相似。不过,AMD 配置的风扇转速往往会稍早增加。
Noise Level
| Idle |
| 24.4 / 24.4 / 28 dB(A) |
| Load |
| 46.2 / 45.9 dB(A) |
 | ||
30 dB silent 40 dB(A) audible 50 dB(A) loud |
||
min: | ||
| Framework Laptop 13.5 Ryzen AI 9 HX 370 Radeon 890M, Ryzen AI 9 HX 370 | Framework Laptop 13.5 Core Ultra 7 155H Arc 8-Core, Ultra 7 155H | Dell Pro 13 Premium PA13250 Arc 140V, Core Ultra 7 268V, Micron 2550 1TB | MSI Summit E13 AI Evo A1MTG Arc 8-Core, Ultra 7 155H, Micron 2400 MTFDKBA1T0QFM | HP EliteBook x360 830 G10 7L7U1ET Iris Xe G7 80EUs, i5-1335U, Samsung PM991 MZVLQ512HBLU | Lenovo ThinkPad Z13 Gen 2 Radeon 780M, R7 PRO 7840U, SK hynix BC901 HFS001TEJ4X164N | |
|---|---|---|---|---|---|---|
| Noise | 4% | 10% | 2% | 12% | 4% | |
| off / environment * | 24.2 | 24 1% | 23 5% | 24 1% | 23.2 4% | 25.1 -4% |
| Idle Minimum * | 24.4 | 24.1 1% | 23 6% | 24.1 1% | 23.2 5% | 25.8 -6% |
| Idle Average * | 24.4 | 25.1 -3% | 23 6% | 24.8 -2% | 23.2 5% | 25.8 -6% |
| Idle Maximum * | 28 | 27 4% | 23 18% | 26.5 5% | 23.2 17% | 28.3 -1% |
| Load Average * | 46.2 | 38.4 17% | 37 20% | 39.3 15% | 29.4 36% | 28.3 39% |
| Cyberpunk 2077 ultra * | 45.8 | 43.7 5% | 42.74 7% | 45 2% | ||
| Load Maximum * | 45.9 | 45.8 -0% | 42.74 7% | 49.1 -7% | 42.5 7% | 44.8 2% |
| Witcher 3 ultra * | 42.3 | 44.8 |
* ... smaller is better
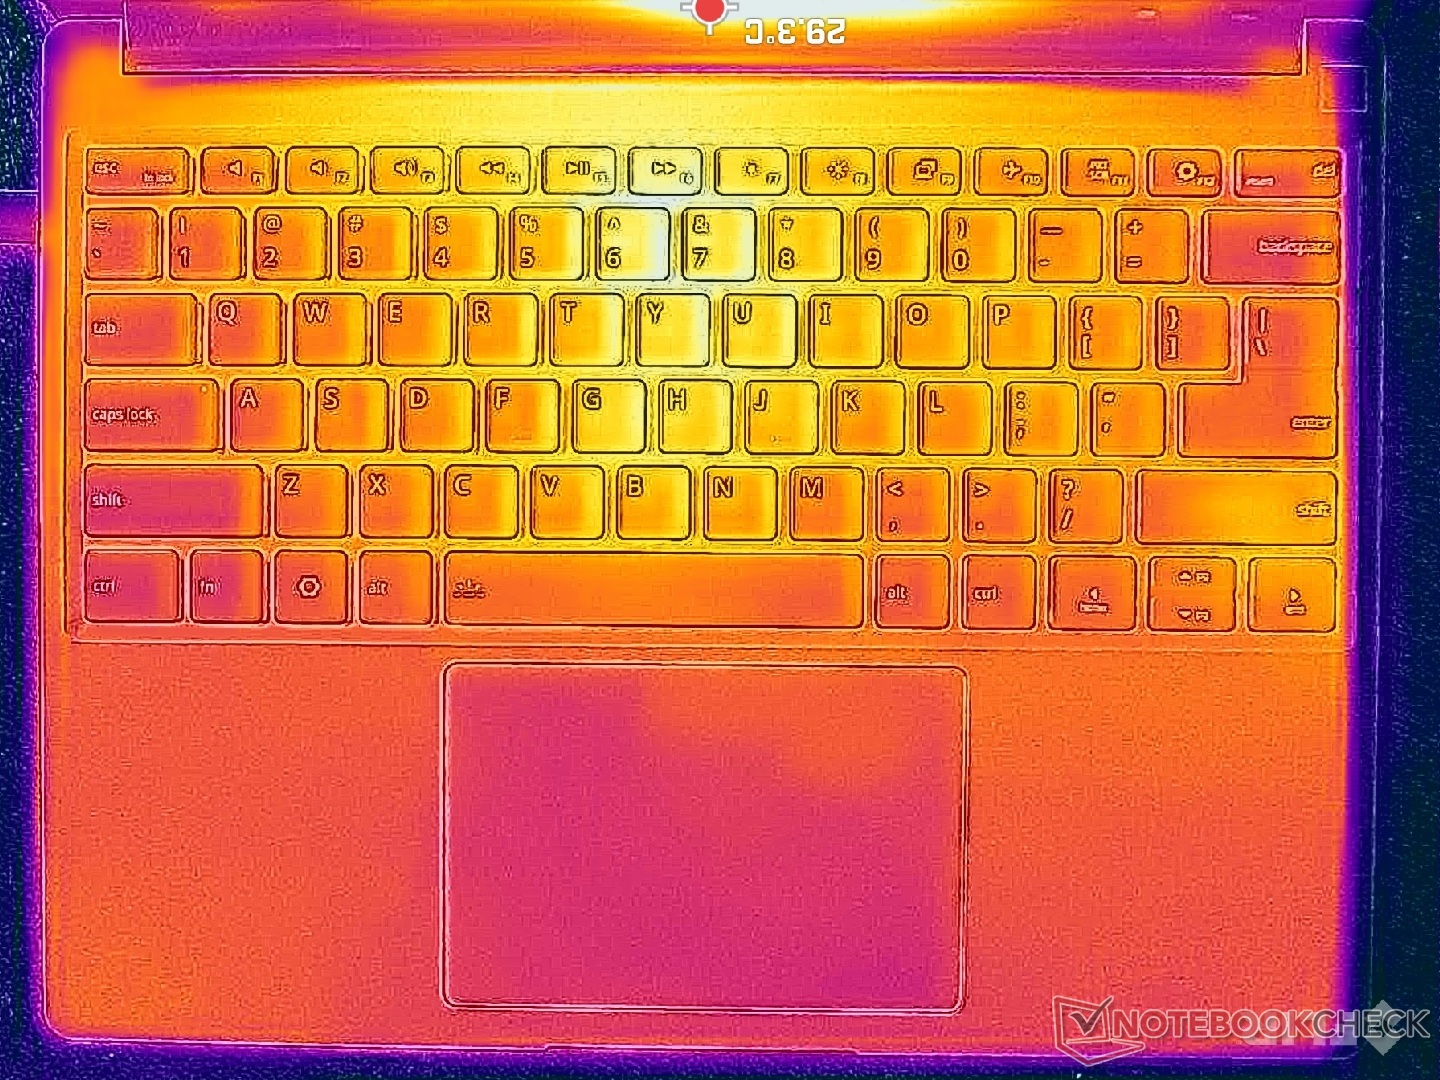
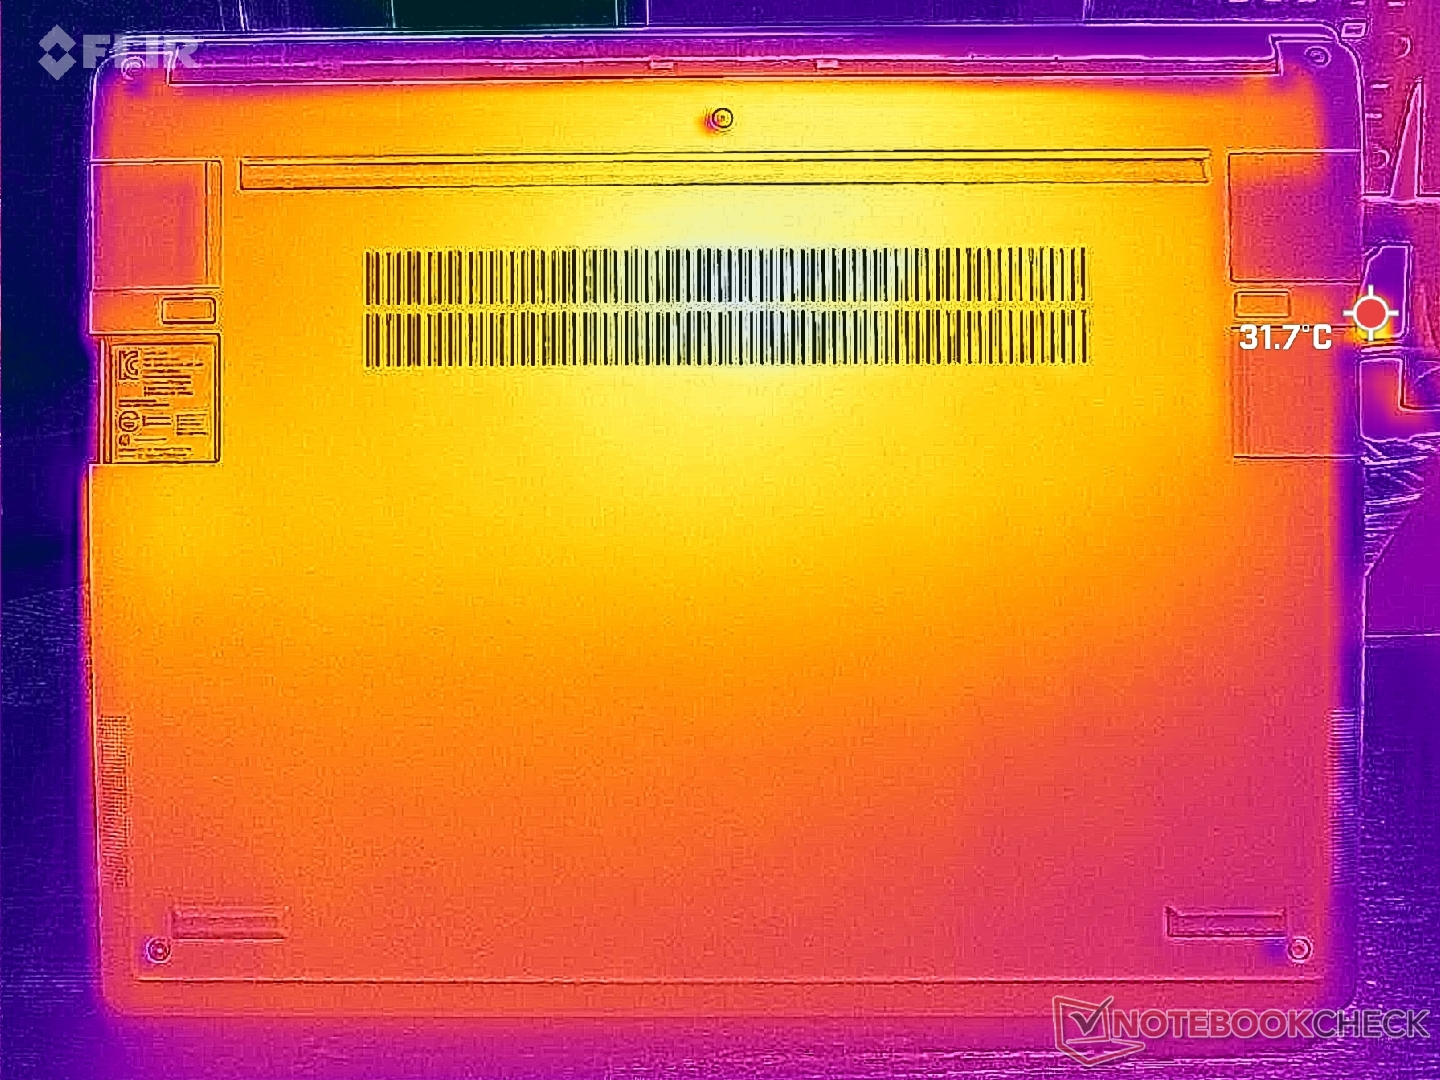
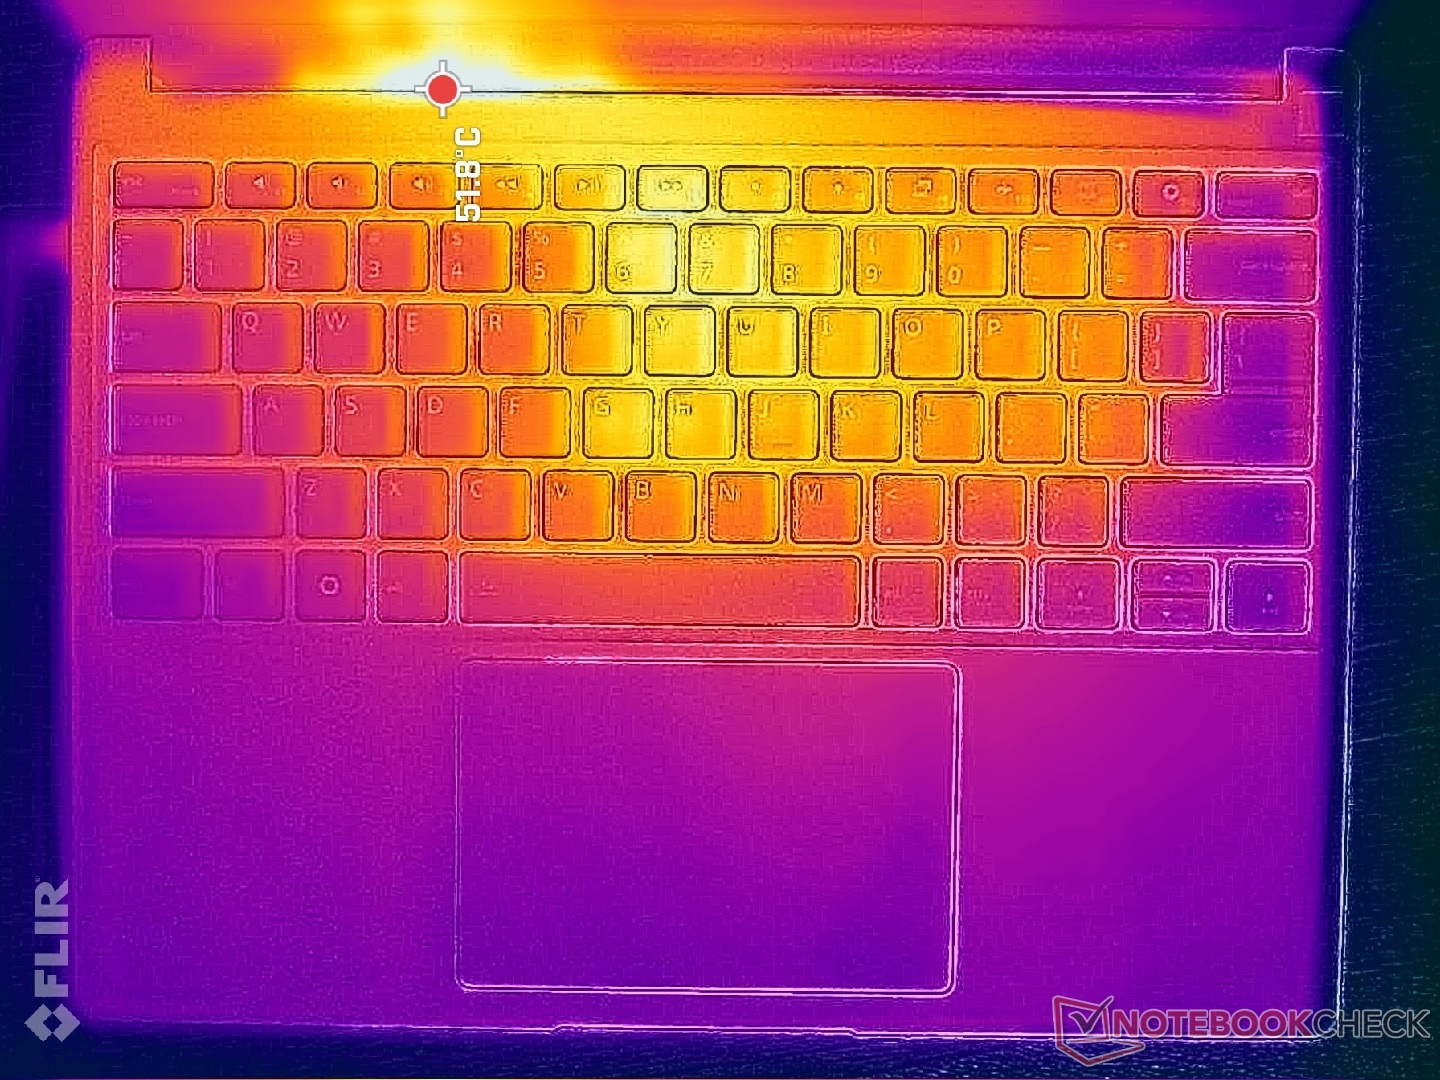
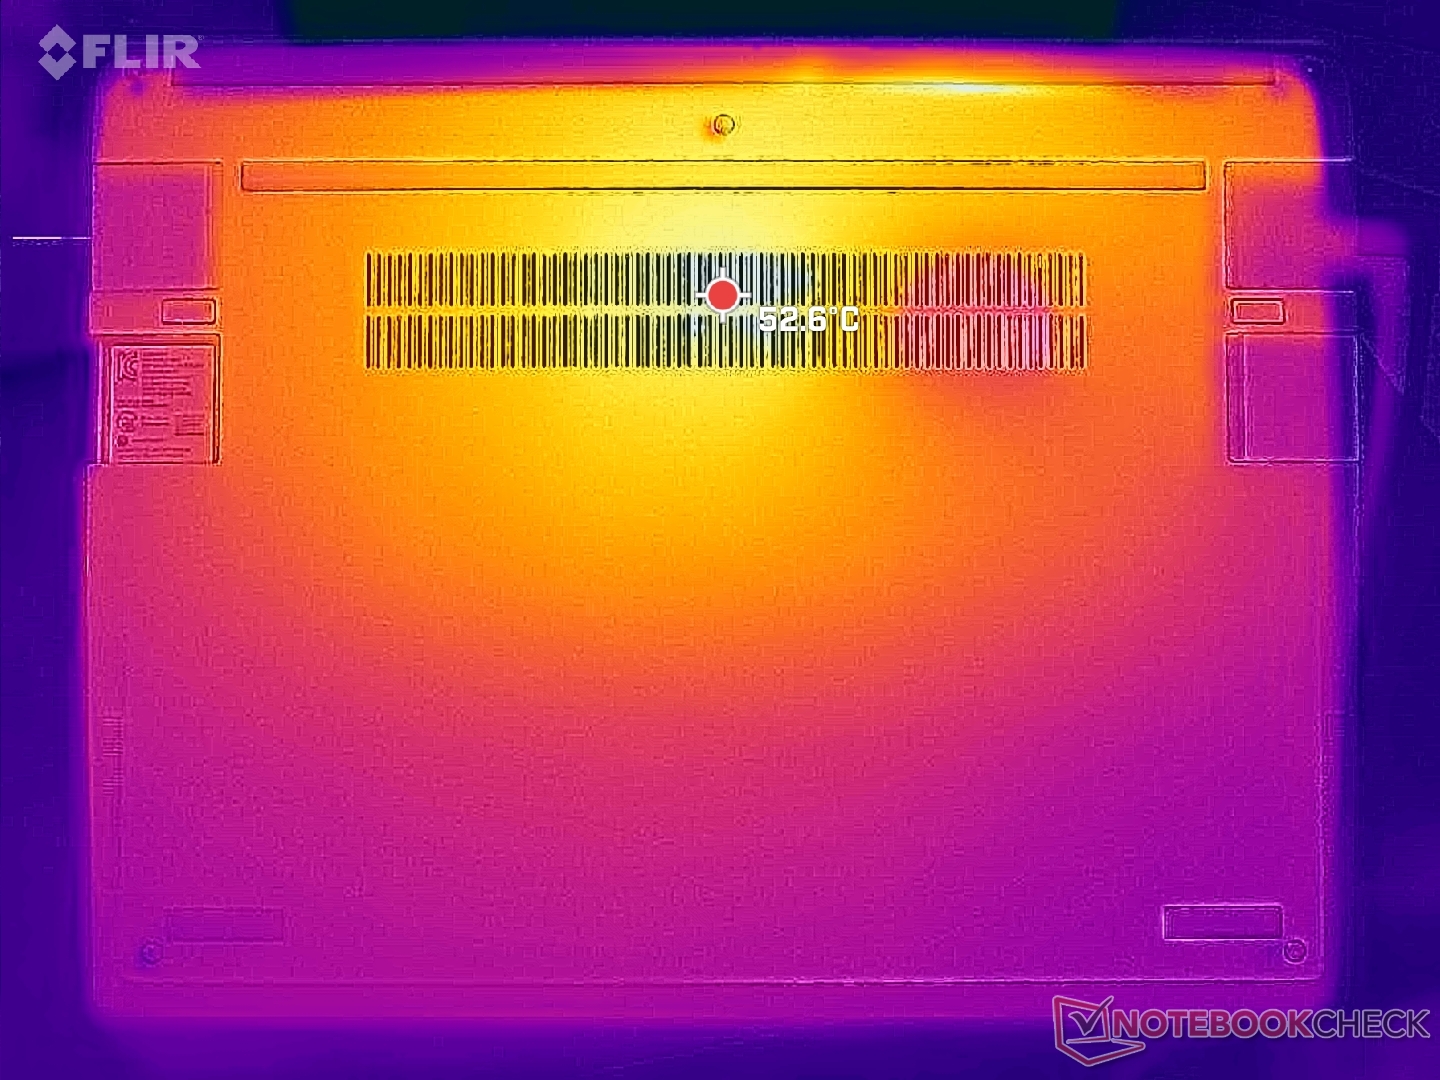
温度
由于热包层和冷却解决方案没有改变,因此表面温度的变化与之前基本相同。
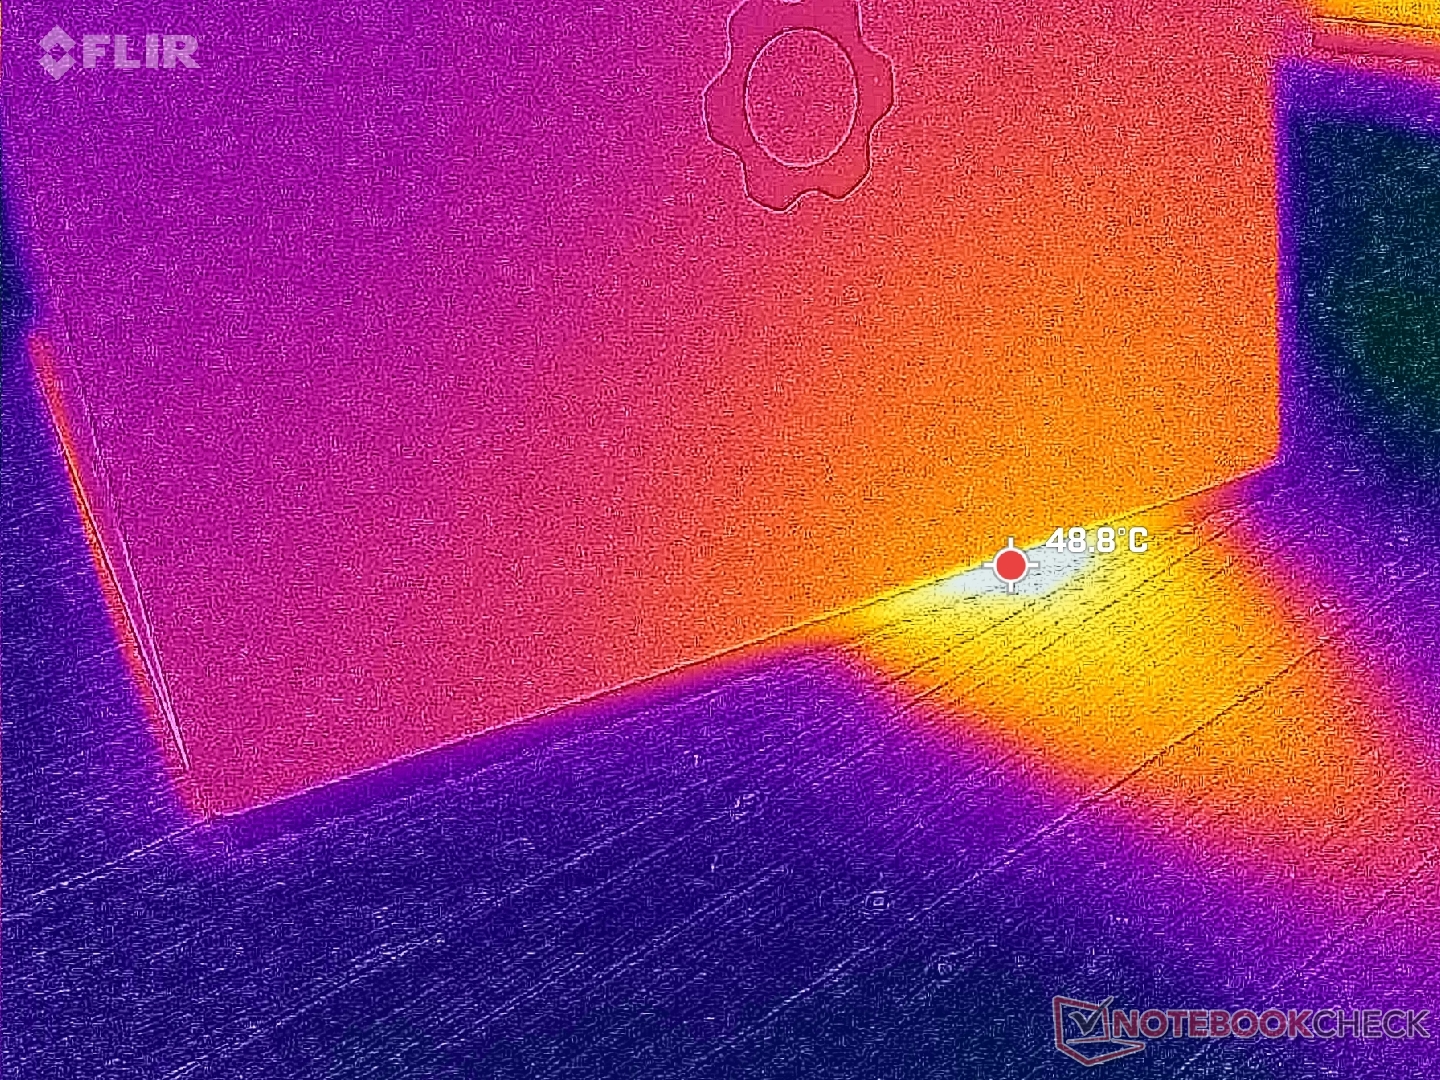
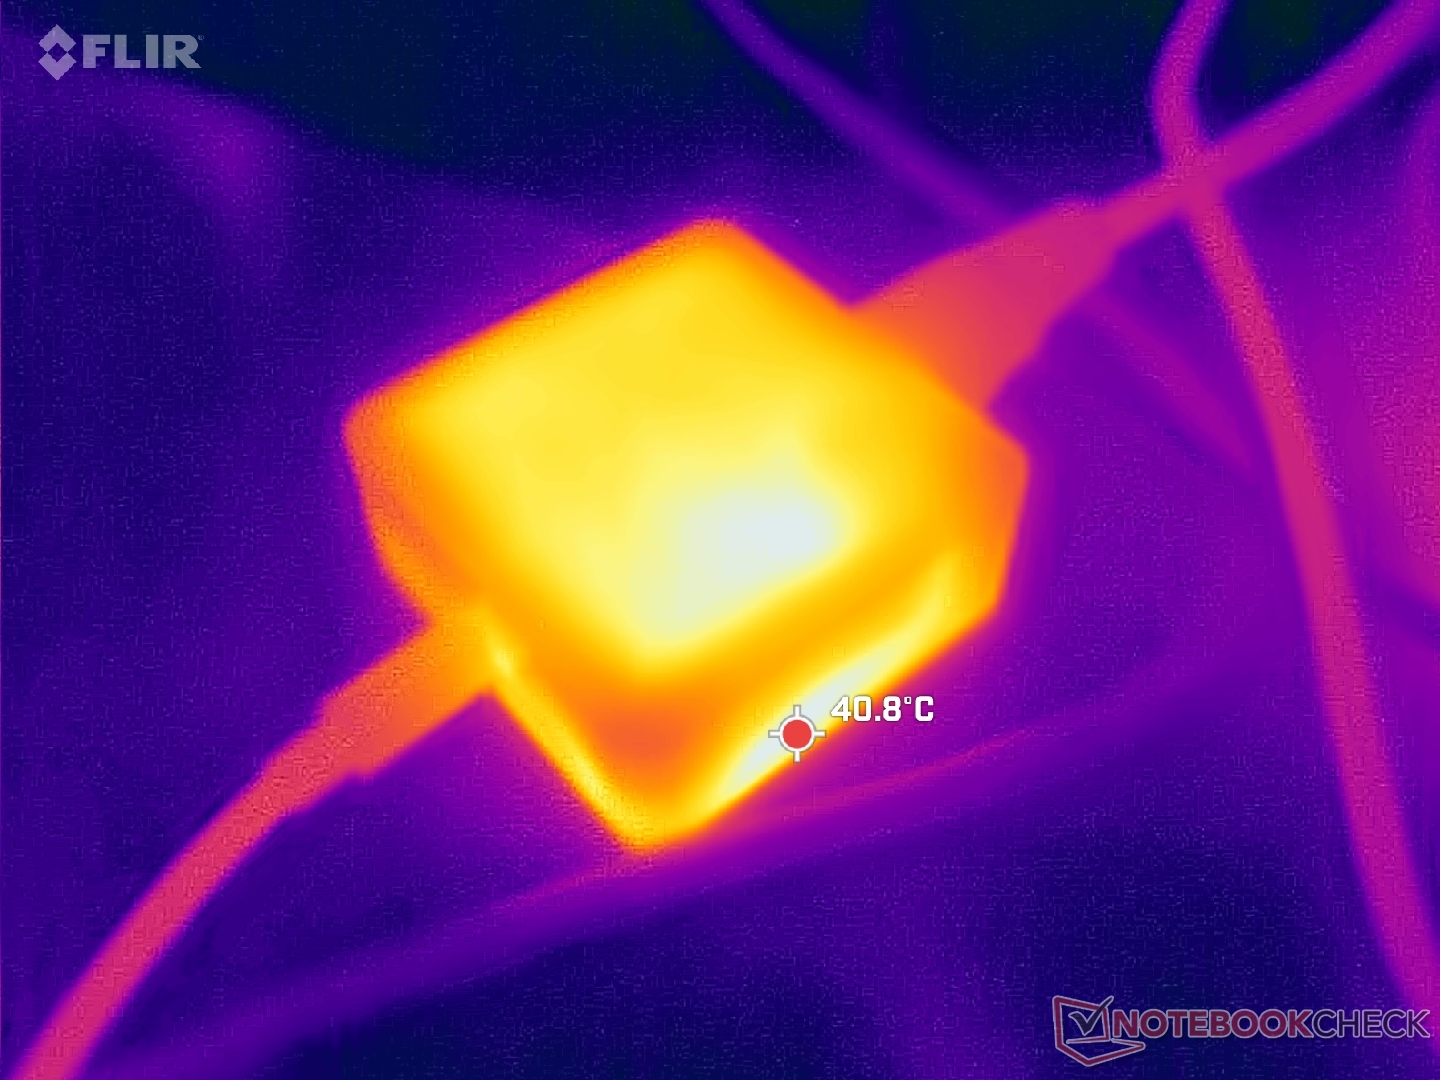
(±) The maximum temperature on the upper side is 42.2 °C / 108 F, compared to the average of 34.3 °C / 94 F, ranging from 21.2 to 62.5 °C for the class Office.
(-) The bottom heats up to a maximum of 46.8 °C / 116 F, compared to the average of 36.8 °C / 98 F
(+) In idle usage, the average temperature for the upper side is 29.2 °C / 85 F, compared to the device average of 29.5 °C / 85 F.
(+) The palmrests and touchpad are cooler than skin temperature with a maximum of 29 °C / 84.2 F and are therefore cool to the touch.
(±) The average temperature of the palmrest area of similar devices was 27.6 °C / 81.7 F (-1.4 °C / -2.5 F).
| Framework Laptop 13.5 Ryzen AI 9 HX 370 AMD Ryzen AI 9 HX 370, AMD Radeon 890M | Framework Laptop 13.5 Core Ultra 7 155H Intel Core Ultra 7 155H, Intel Arc 8-Core iGPU | Dell Pro 13 Premium PA13250 Intel Core Ultra 7 268V, Intel Arc Graphics 140V | MSI Summit E13 AI Evo A1MTG Intel Core Ultra 7 155H, Intel Arc 8-Core iGPU | HP EliteBook x360 830 G10 7L7U1ET Intel Core i5-1335U, Intel Iris Xe Graphics G7 80EUs | Lenovo ThinkPad Z13 Gen 2 AMD Ryzen 7 PRO 7840U, AMD Radeon 780M | |
|---|---|---|---|---|---|---|
| Heat | 6% | 27% | -7% | 5% | 11% | |
| Maximum Upper Side * | 42.2 | 42.8 -1% | 31 27% | 45.2 -7% | 40.2 5% | 46.2 -9% |
| Maximum Bottom * | 46.8 | 45.2 3% | 31 34% | 44.8 4% | 42.4 9% | 48.4 -3% |
| Idle Upper Side * | 31 | 27.2 12% | 24 23% | 34.8 -12% | 30 3% | 23.2 25% |
| Idle Bottom * | 32.2 | 28.6 11% | 24 25% | 35.8 -11% | 31.8 1% | 23 29% |
* ... smaller is better
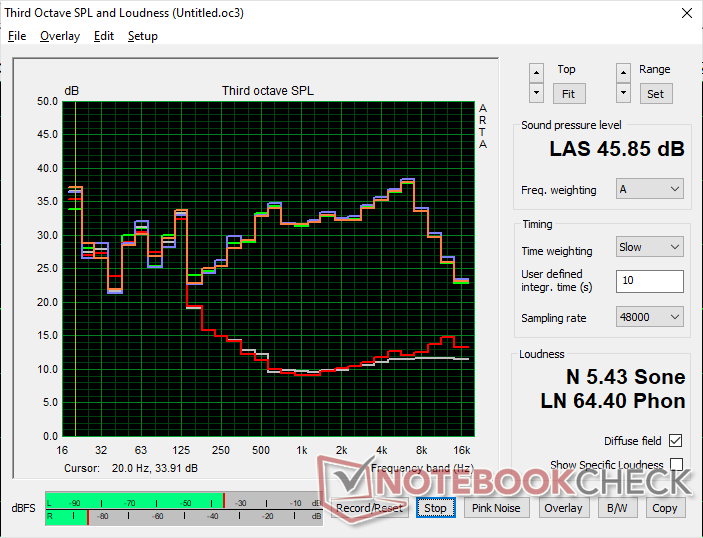
发言人
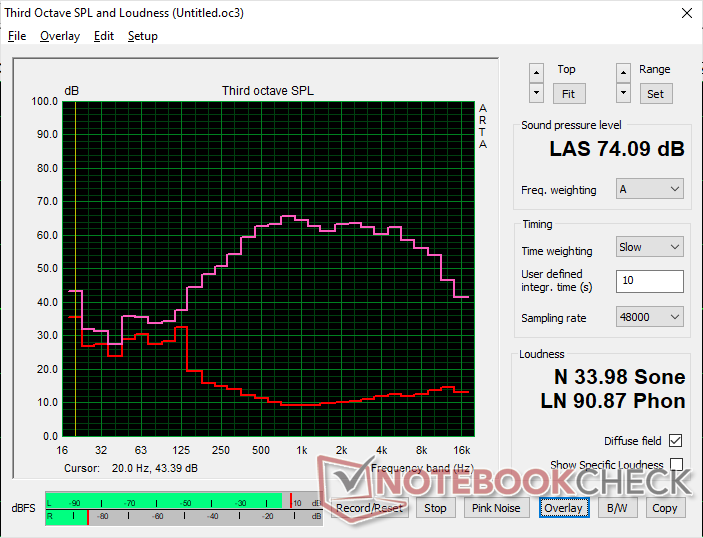
Framework Laptop 13.5 Ryzen AI 9 HX 370 audio analysis
(±) | speaker loudness is average but good (74.1 dB)
Bass 100 - 315 Hz
(±) | reduced bass - on average 14.3% lower than median
(±) | linearity of bass is average (7.3% delta to prev. frequency)
Mids 400 - 2000 Hz
(+) | balanced mids - only 3.5% away from median
(+) | mids are linear (4.7% delta to prev. frequency)
Highs 2 - 16 kHz
(+) | balanced highs - only 2.9% away from median
(+) | highs are linear (4.3% delta to prev. frequency)
Overall 100 - 16.000 Hz
(±) | linearity of overall sound is average (17.4% difference to median)
Compared to same class
» 23% of all tested devices in this class were better, 7% similar, 69% worse
» The best had a delta of 7%, average was 21%, worst was 53%
Compared to all devices tested
» 30% of all tested devices were better, 8% similar, 61% worse
» The best had a delta of 4%, average was 24%, worst was 134%
Apple MacBook Pro 16 2021 M1 Pro audio analysis
(+) | speakers can play relatively loud (84.7 dB)
Bass 100 - 315 Hz
(+) | good bass - only 3.8% away from median
(+) | bass is linear (5.2% delta to prev. frequency)
Mids 400 - 2000 Hz
(+) | balanced mids - only 1.3% away from median
(+) | mids are linear (2.1% delta to prev. frequency)
Highs 2 - 16 kHz
(+) | balanced highs - only 1.9% away from median
(+) | highs are linear (2.7% delta to prev. frequency)
Overall 100 - 16.000 Hz
(+) | overall sound is linear (4.6% difference to median)
Compared to same class
» 0% of all tested devices in this class were better, 0% similar, 100% worse
» The best had a delta of 5%, average was 18%, worst was 45%
Compared to all devices tested
» 0% of all tested devices were better, 0% similar, 100% worse
» The best had a delta of 4%, average was 24%, worst was 134%
能源管理
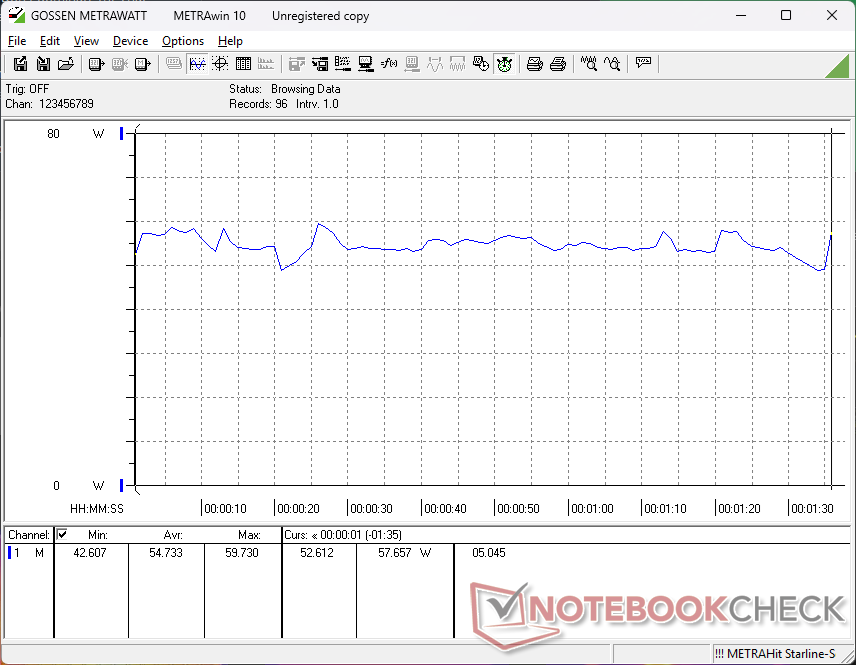
耗电量
消耗水平接近我们去年使用酷睿至尊 7 155H 时的记录,但 CPU 和 GPU 性能更快,与 AMD 配置相比每瓦性能更优。即便如此,AMD 系统在台式机上空转时要求略高,这对电池寿命产生了影响。

| Off / Standby | |
| Idle | |
| Load |
|
Key:
min: | |
| Framework Laptop 13.5 Ryzen AI 9 HX 370 Ryzen AI 9 HX 370, Radeon 890M, , IPS, 2880x1920, 13.5" | Framework Laptop 13.5 Core Ultra 7 155H Ultra 7 155H, Arc 8-Core, , IPS, 2880x1920, 13.5" | Framework Laptop 13.5 Ryzen 7 7840U R7 7840U, Radeon 780M, WD PC SN740 512GB SDDPNQD-512G, IPS, 2256x1504, 13.5" | Framework Laptop 13.5 13th Gen Intel i7-1370P, Iris Xe G7 96EUs, WD PC SN740 SDDPNQD-1T00, IPS, 2256x1504, 13.5" | Framework Laptop 13.5 12th Gen Intel i7-1260P, Iris Xe G7 96EUs, WDC PC SN730 SDBPNTY-512G, IPS, 2256x1504, 13.5" | Framework Laptop 13.5 i7-1165G7, Iris Xe G7 96EUs, Western Digital WD_BLACK SN850 WDS100T1X0E, IPS, 2256x1504, 13.5" | |
|---|---|---|---|---|---|---|
| Power Consumption | 26% | 30% | 23% | 11% | 23% | |
| Idle Minimum * | 7.6 | 2.5 67% | 4 47% | 2.9 62% | 5.3 30% | 4.3 43% |
| Idle Average * | 11.3 | 5.2 54% | 6.5 42% | 6.3 44% | 8.4 26% | 8.2 27% |
| Idle Maximum * | 11.5 | 5.8 50% | 6.8 41% | 9.9 14% | 11.2 3% | 8.7 24% |
| Load Average * | 54.7 | 47.5 13% | 48 12% | 56.2 -3% | 57.4 -5% | 43.5 20% |
| Cyberpunk 2077 ultra external monitor * | 51.3 | 52.4 -2% | ||||
| Cyberpunk 2077 ultra * | 54.6 | 54.5 -0% | ||||
| Load Maximum * | 60.9 | 61.5 -1% | 55.2 9% | 60.8 -0% | 61.2 -0% | 61.8 -1% |
| Witcher 3 ultra * | 52.3 | 56.6 | 46.7 | 43.5 |
* ... smaller is better
Power Consumption Cyberpunk / Stress Test
Power Consumption external Monitor
电池寿命
运行时间不错,但明显短于旧处理器。
| Framework Laptop 13.5 Ryzen AI 9 HX 370 Ryzen AI 9 HX 370, Radeon 890M, 61 Wh | Framework Laptop 13.5 Core Ultra 7 155H Ultra 7 155H, Arc 8-Core, 61 Wh | Framework Laptop 13.5 Ryzen 7 7840U R7 7840U, Radeon 780M, 61 Wh | Framework Laptop 13.5 13th Gen Intel i7-1370P, Iris Xe G7 96EUs, 61 Wh | Framework Laptop 13.5 12th Gen Intel i7-1260P, Iris Xe G7 96EUs, 55 Wh | Framework Laptop 13.5 i7-1165G7, Iris Xe G7 96EUs, 55 Wh | |
|---|---|---|---|---|---|---|
| Battery Runtime | 31% | 51% | 10% | -7% | 0% | |
| WiFi v1.3 | 480 | 630 31% | 726 51% | 527 10% | 447 -7% | 478 0% |
| Reader / Idle | 2296 | |||||
| Load | 90 |
笔记本检查评级
Framework Laptop 13.5 Ryzen AI 9 HX 370
- 04/14/2025 v8
Allen Ngo
 Total Sustainability Score:
 Potential Competitors in Comparison
Image | Model / Review | Price | Weight | Height | Display |
|---|---|---|---|---|---|
1. 83.8%  | Framework Laptop 13.5 Ryzen AI 9 HX 370 AMD Ryzen AI 9 HX 370 ⎘ AMD Radeon 890M ⎘ 32 GB Memory | Amazon: 1. $1,094.16 ASUS Vivobook S 14 OLED Slim... 2. $1,499.00 HP 2024 OmniBook Ultra 14”... 3. $1,499.00 HP OmniBook Ultra 14 2024 La... List Price: 2100 USD | 1.3 kg | 15.85 mm | 13.50" 2880x1920 256 PPI IPS |
2. 84%  | Framework Laptop 13.5 Core Ultra 7 155H Intel Core Ultra 7 155H ⎘ Intel Arc 8-Core iGPU ⎘ 32 GB Memory | List Price: 1500 USD | 1.4 kg | 15.85 mm | 13.50" 2880x1920 256 PPI IPS |
3. 89.9%  | Dell Pro 13 Premium PA13250 Intel Core Ultra 7 268V ⎘ Intel Arc Graphics 140V ⎘ 32 GB Memory, 1024 GB SSD | Amazon: 1. $39.99 Smatree Hard Shell Laptop Ca... 2. $29.99 Smatree Hard EVA Protective ... 3. $49.99 Smatree 13 inch Laptop Sleev... List Price: 2700 Euro | 1.1 kg | 17.2 mm | 13.30" 1920x1200 170 PPI IPS |
4. 78.6%  | MSI Summit E13 AI Evo A1MTG Intel Core Ultra 7 155H ⎘ Intel Arc 8-Core iGPU ⎘ 16 GB Memory, 1024 GB SSD | Amazon: $1,099.00 List Price: 1100 USD | 1.3 kg | 16.2 mm | 13.30" 1920x1200 170 PPI IPS |
5. 89.4% v7 (old)  | HP EliteBook x360 830 G10 7L7U1ET Intel Core i5-1335U ⎘ Intel Iris Xe Graphics G7 80EUs ⎘ 16 GB Memory, 512 GB SSD | Amazon: $1,102.64 List Price: 1300 Euro | 1.3 kg | 19.2 mm | 13.30" 1920x1200 170 PPI IPS LED |
6. 89.5% v7 (old)  | Lenovo ThinkPad Z13 Gen 2 AMD Ryzen 7 PRO 7840U ⎘ AMD Radeon 780M ⎘ 32 GB Memory, 1024 GB SSD | Amazon: 1. $1,279.00 Lenovo 2024 ThinkPad Z13 Gen... 2. $1,339.99 Lenovo ThinkPad X13 2-in-1 G... 3. $789.99 Lenovo ThinkPad E16 Gen 2 AI... List Price: 1800 USD | 1.2 kg | 13.99 mm | 13.30" 2880x1800 255 PPI OLED |
Transparency
The selection of devices to be reviewed is made by our editorial team. The test sample was provided to the author as a loan by the manufacturer or retailer for the purpose of this review. The lender had no influence on this review, nor did the manufacturer receive a copy of this review before publication. There was no obligation to publish this review. We never accept compensation or payment in return for our reviews. As an independent media company, Notebookcheck is not subjected to the authority of manufacturers, retailers or publishers.
This is how Notebookcheck is testing
Every year, Notebookcheck independently reviews hundreds of laptops and smartphones using standardized procedures to ensure that all results are comparable. We have continuously developed our test methods for around 20 years and set industry standards in the process. In our test labs, high-quality measuring equipment is utilized by experienced technicians and editors. These tests involve a multi-stage validation process. Our complex rating system is based on hundreds of well-founded measurements and benchmarks, which maintains objectivity. Further information on our test methods can be found here.

