

惠普预兆 17(2024)评测:RTX 4070 和 Ryzen 7 在游戏笔记本电脑中大显身手
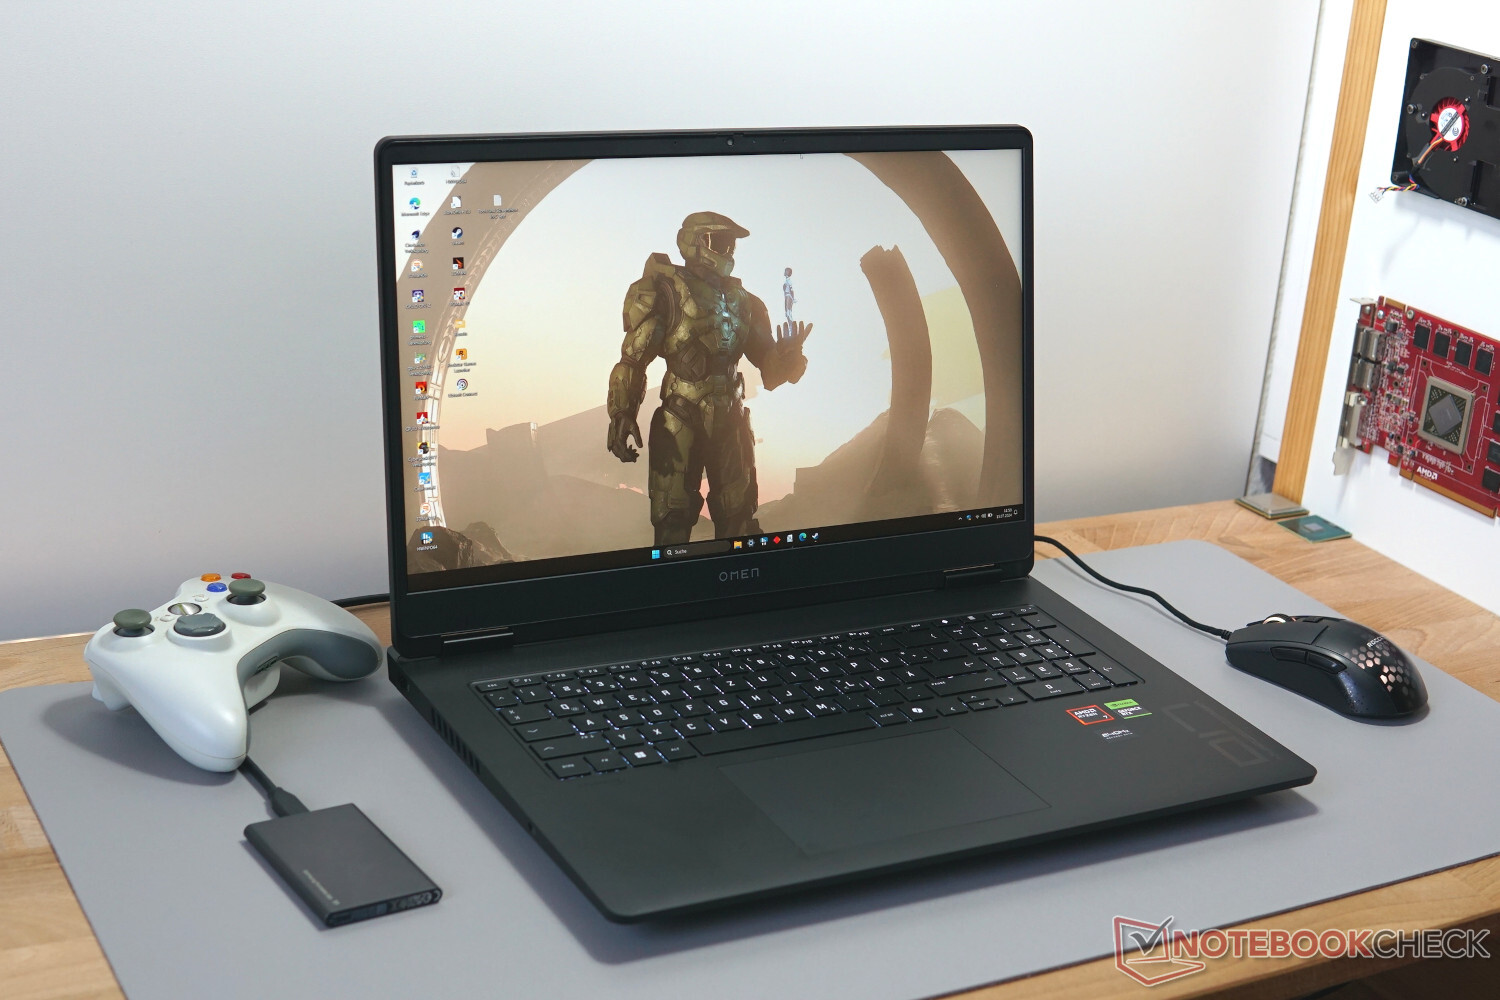
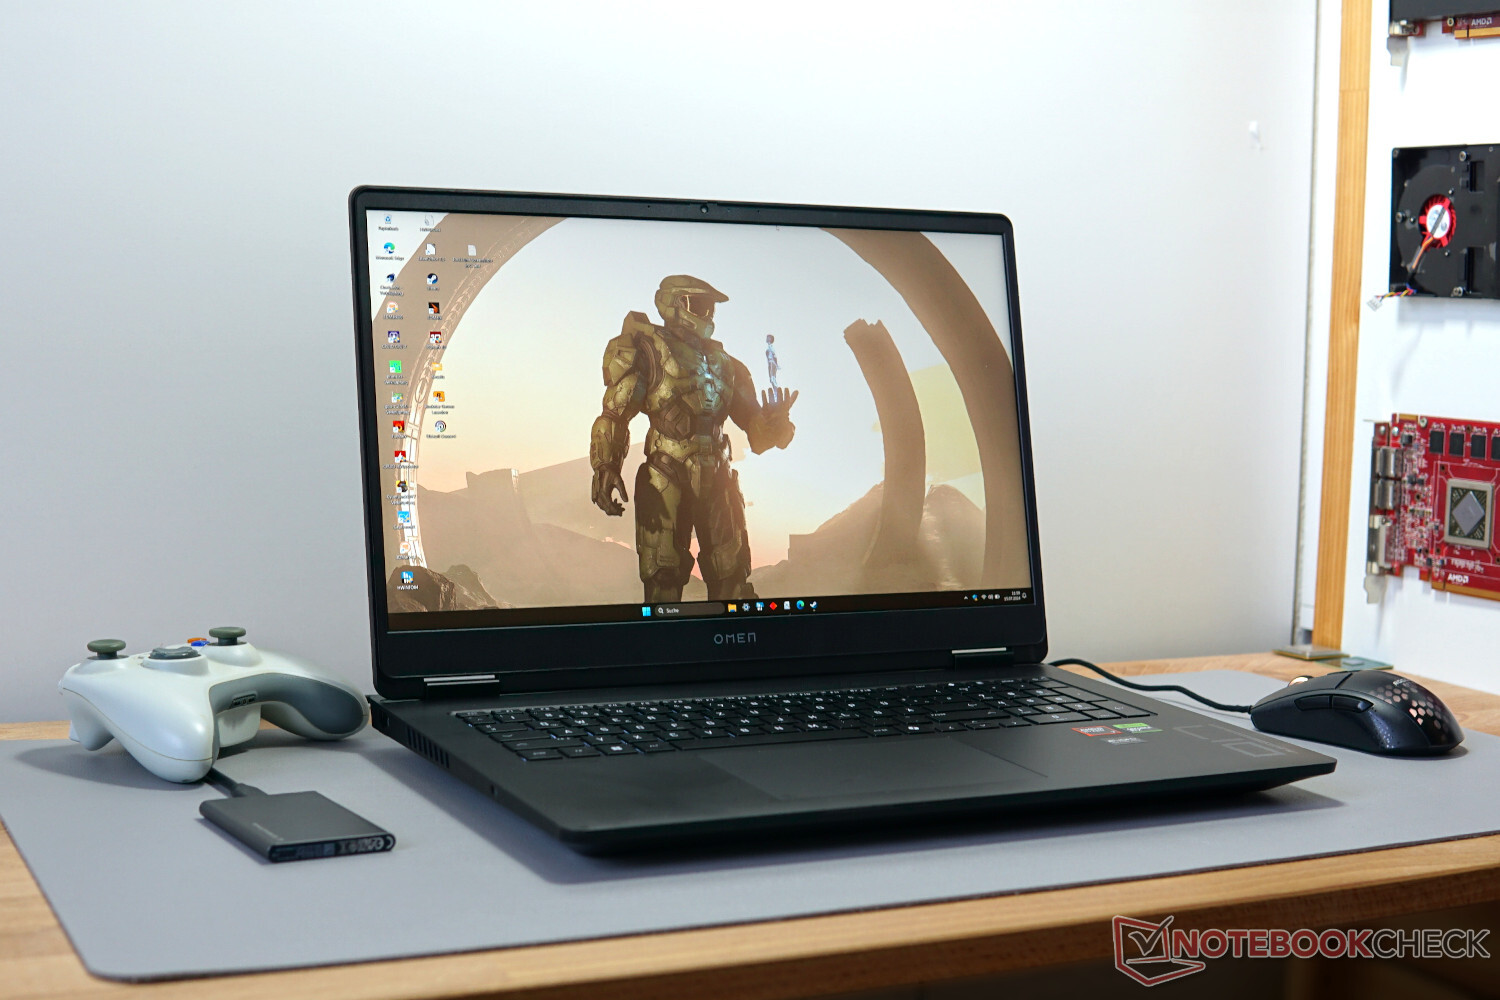
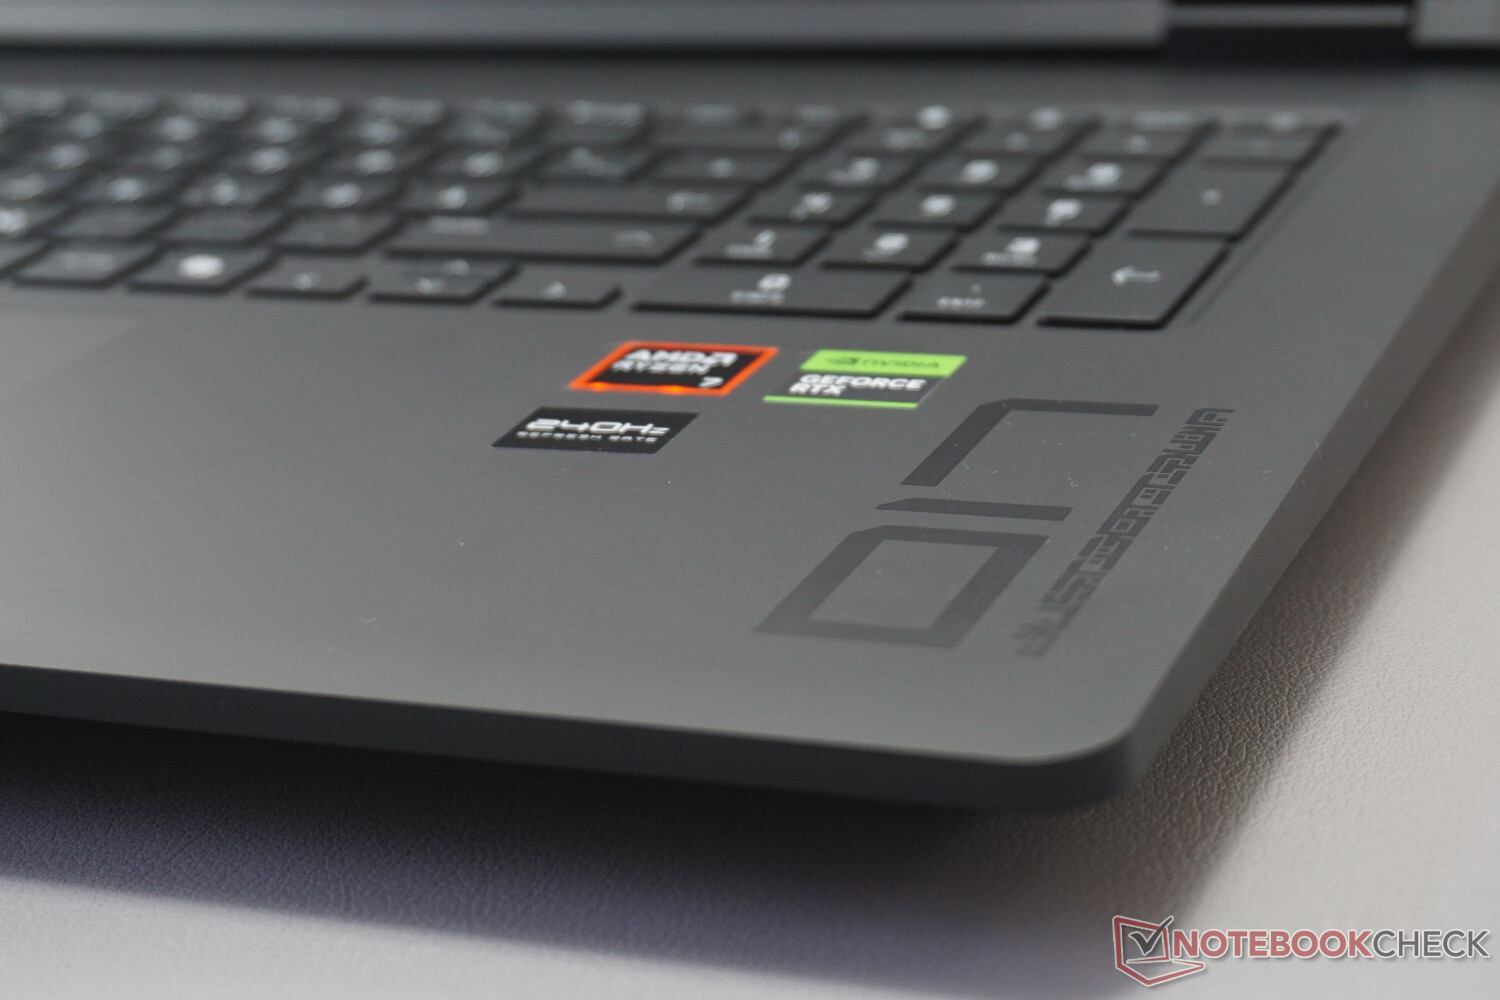
惠普预兆 17(2024)配备了 RTX 4070 和 AMD Ryzen 7 8845HS,可满足当前所有高水平游戏的需求,处于中端机型的起跑线上。此外,还配备了分辨率合适的 QHD 显示屏,刷新率也达到了 240 赫兹。有了这些,一台优秀的游戏笔记本电脑的所有基本要素都得到了满足。
有了这么大的空间,尤其是内部空间,我们还可以期待一些稳定的性能值,与小型笔记本电脑相比应该会更好。我们在大量基准测试和游戏测试中对此进行了评估。
我们的测试机尽管装备水平较高,但价格仍低于 2,000 欧元(约合 2,172 美元),这在目前已不是必然的。要做到这一点,你还必须接受一些妥协,其中有些妥协是不必要的。我们的测试将显示,它是否仍足以领先于竞争对手,如 宏碁掠夺者 Helios Neo 16或 华硕 TUF Gaming A17或采用上一代 AMD Ryzen 9 处理器的华硕 TUF Gaming A17。
潜在的竞争对手比较
Rating | Version | Date | Model | Weight | Height | Size | Resolution | Price |
|---|---|---|---|---|---|---|---|---|
| 80.4 % | v8 | 07 / 2024 | HP Omen 17-db0079ng R7 8845HS, NVIDIA GeForce RTX 4070 Laptop GPU | 2.8 kg | 30.1 mm | 17.30" | 2560x1440 | |
| 80.3 % | v8 | 07 / 2024 | Asus TUF Gaming A15 FA507UV R9 8945H, NVIDIA GeForce RTX 4060 Laptop GPU | 2.1 kg | 22.4 mm | 15.60" | 1920x1080 | |
| 90.2 % v7 (old) | v7 (old) | 03 / 2024 | Alienware m16 R2 Ultra 7 155H, NVIDIA GeForce RTX 4070 Laptop GPU | 2.5 kg | 23.5 mm | 16.00" | 2560x1600 | |
| 87.6 % v7 (old) | v7 (old) | 04 / 2024 | Asus ROG Strix Scar 16 G634JZR i9-14900HX, NVIDIA GeForce RTX 4080 Laptop GPU | 2.7 kg | 30.4 mm | 16.00" | 2560x1600 | |
| 86.8 % v7 (old) | v7 (old) | 05 / 2024 | Acer Predator Helios Neo 16 (2024) i7-14700HX, NVIDIA GeForce RTX 4070 Laptop GPU | 2.6 kg | 25.95 mm | 16.00" | 2560x1600 | |
| 85.6 % v7 (old) | v7 (old) | 01 / 2024 | Asus TUF Gaming A17 FA707XI-NS94 R9 7940HS, NVIDIA GeForce RTX 4070 Laptop GPU | 2.5 kg | 25.4 mm | 17.30" | 1920x1080 |
请注意,我们最近更新了评级系统,第 8 版的结果已不能与第 7 版相比。您可以在 这里.
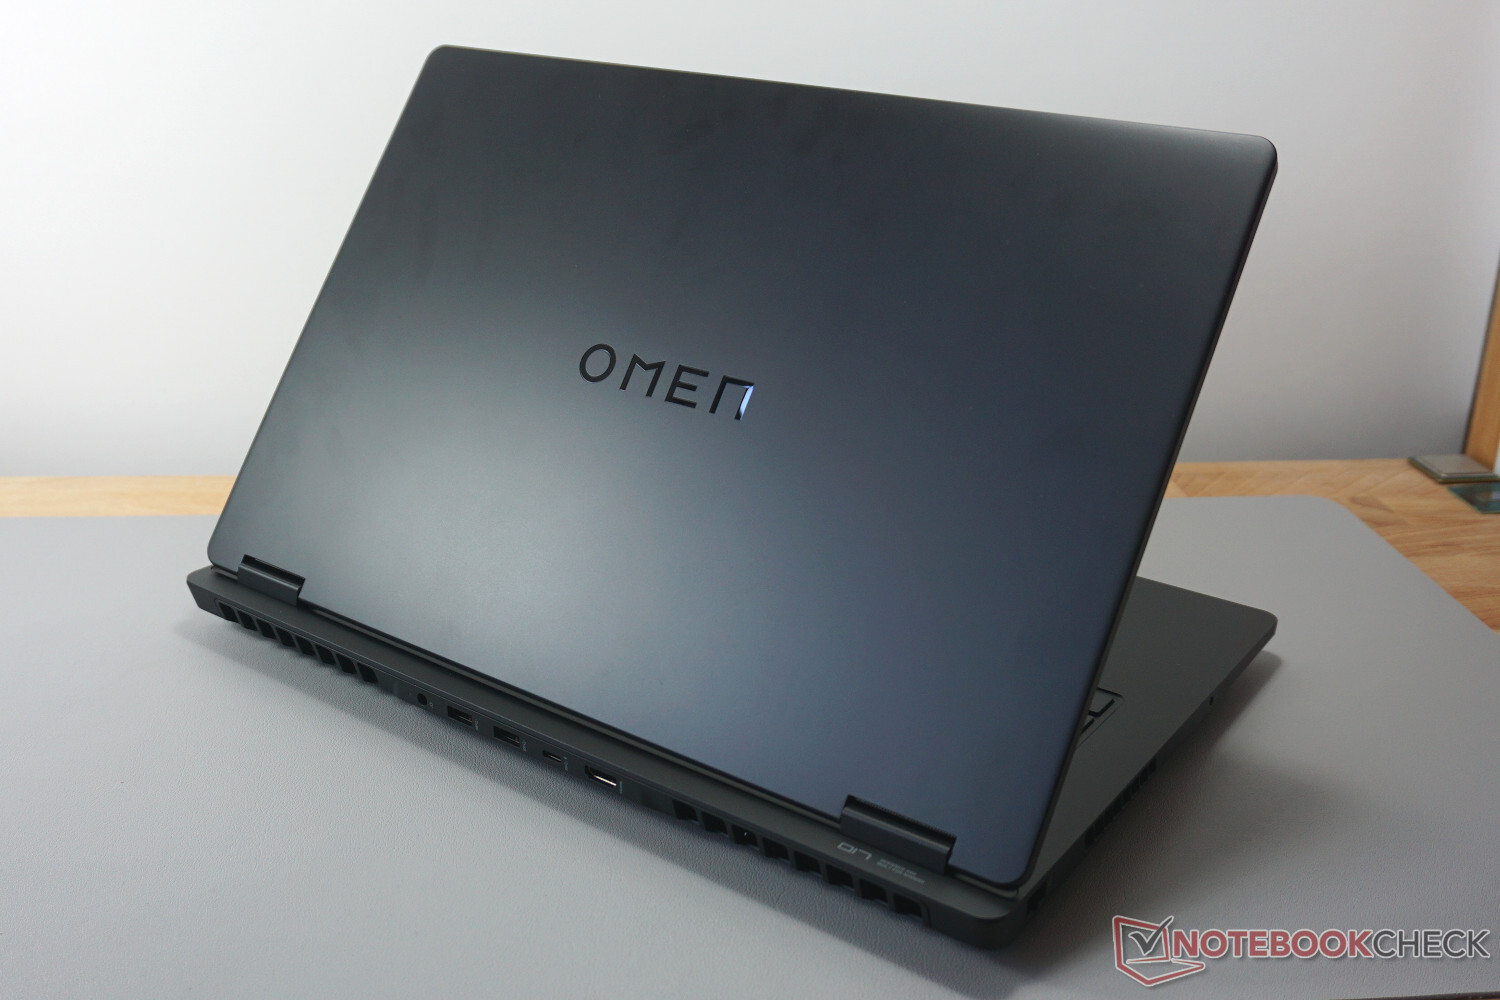
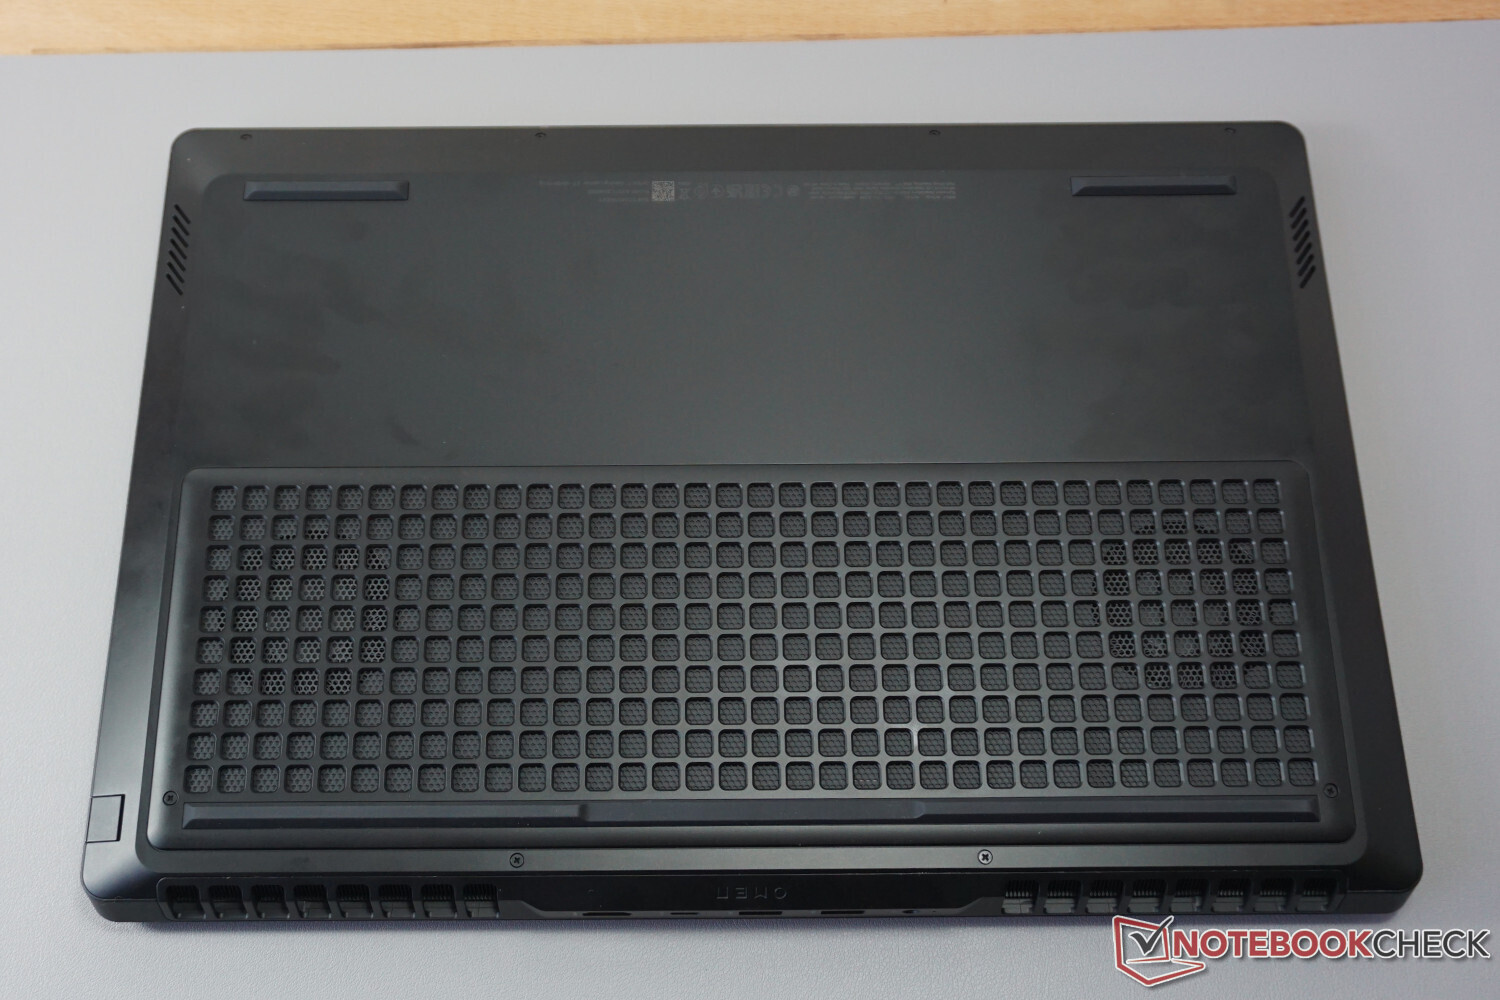
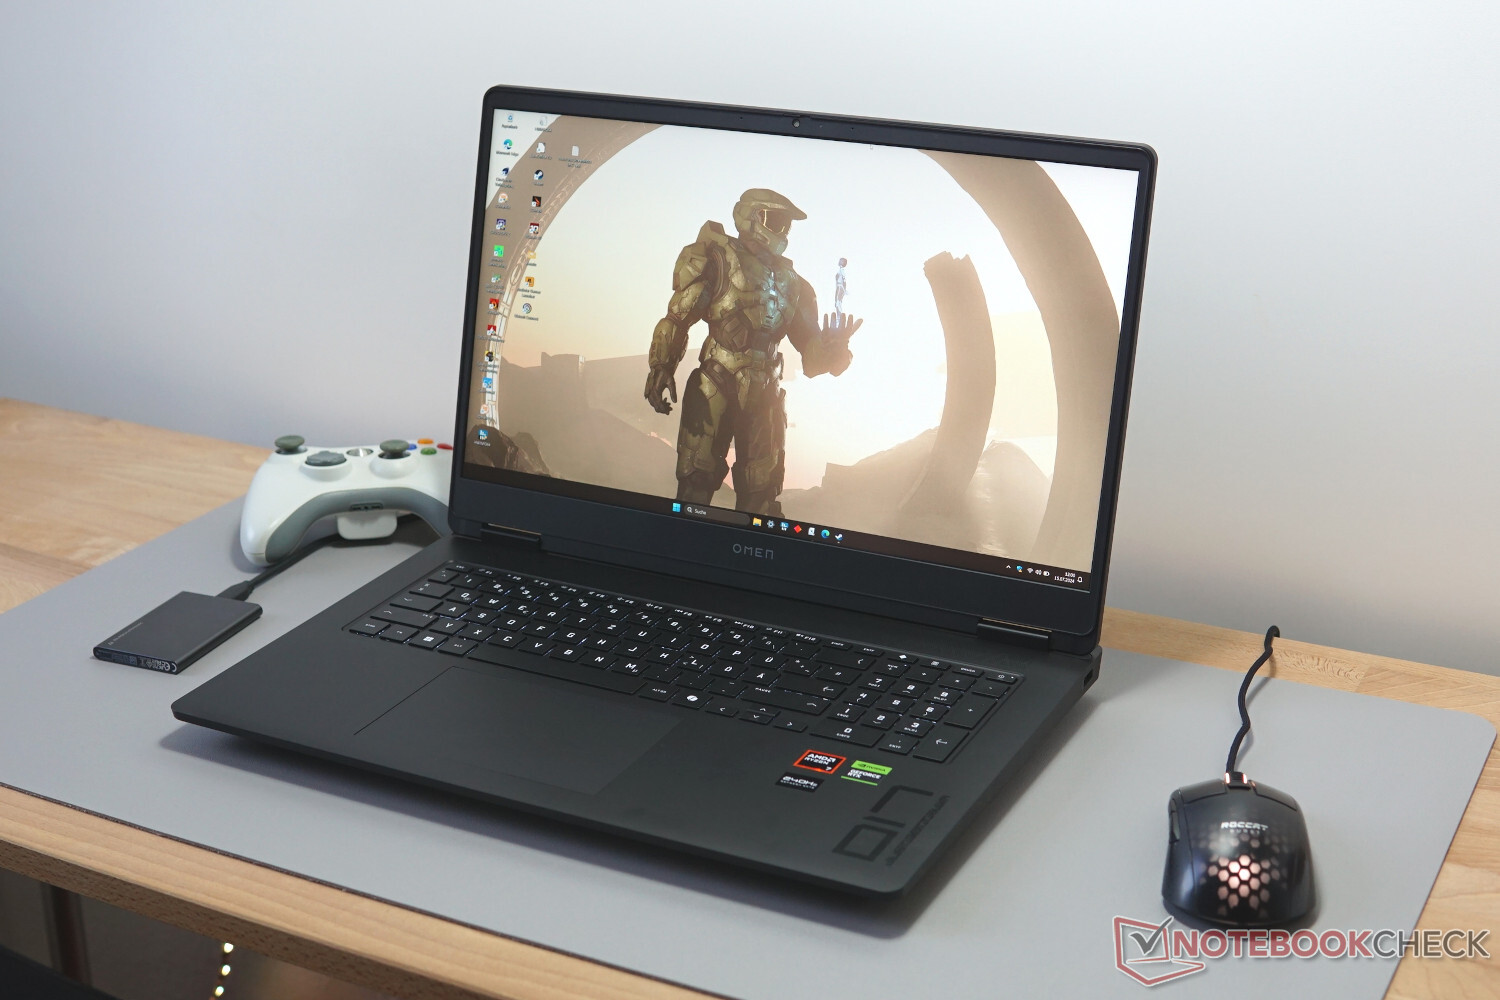
案例 - 大型重型游戏机
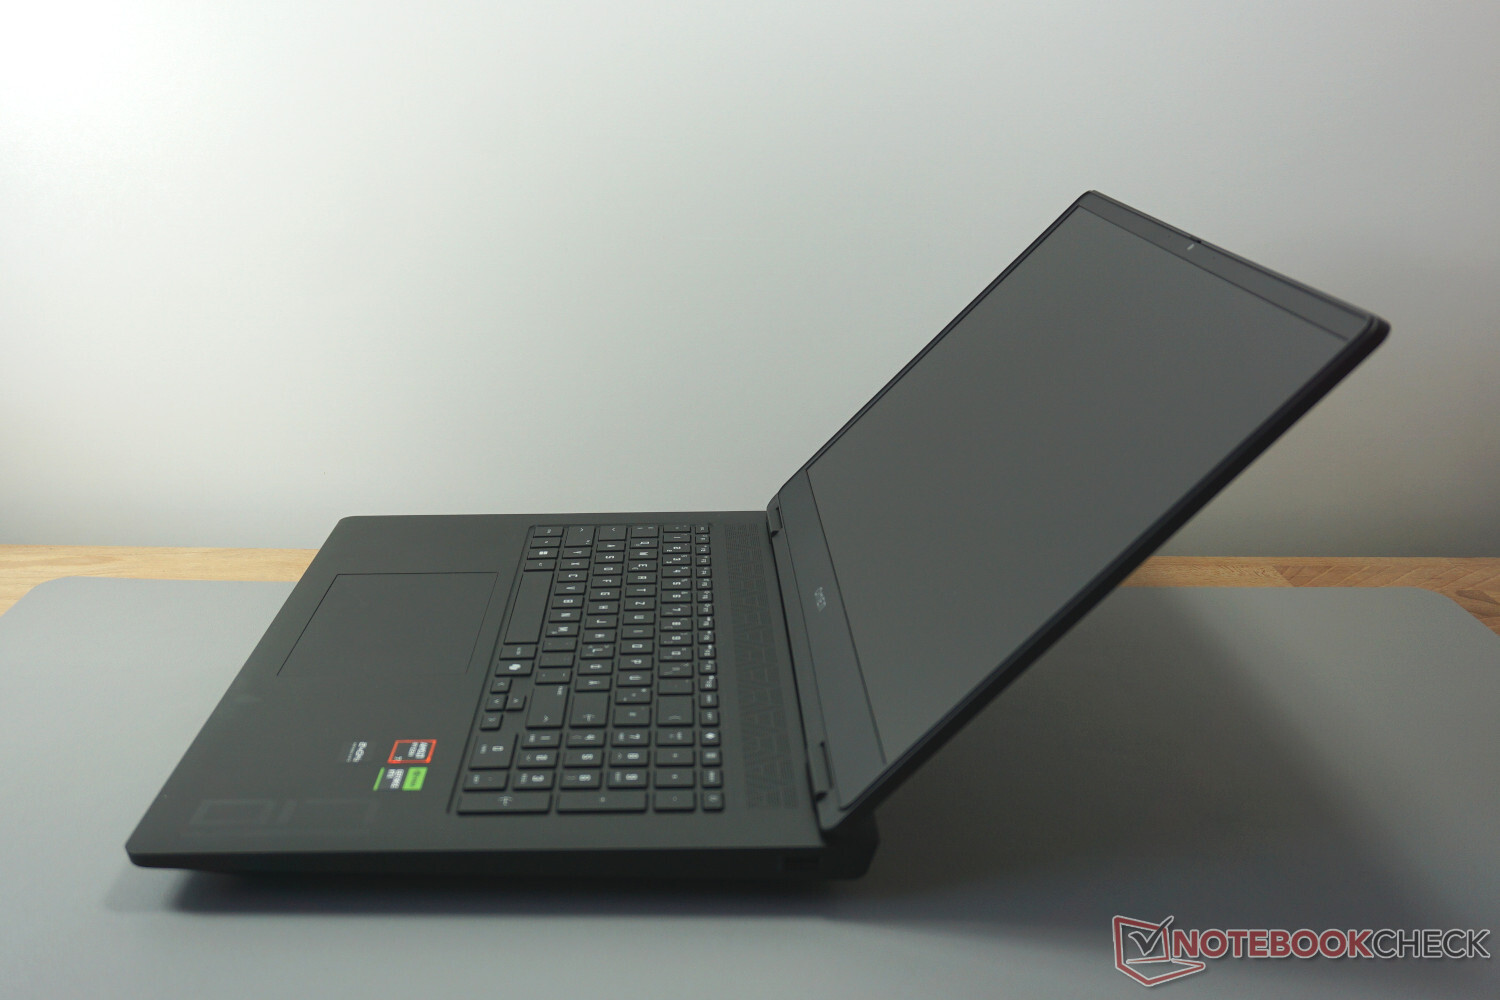
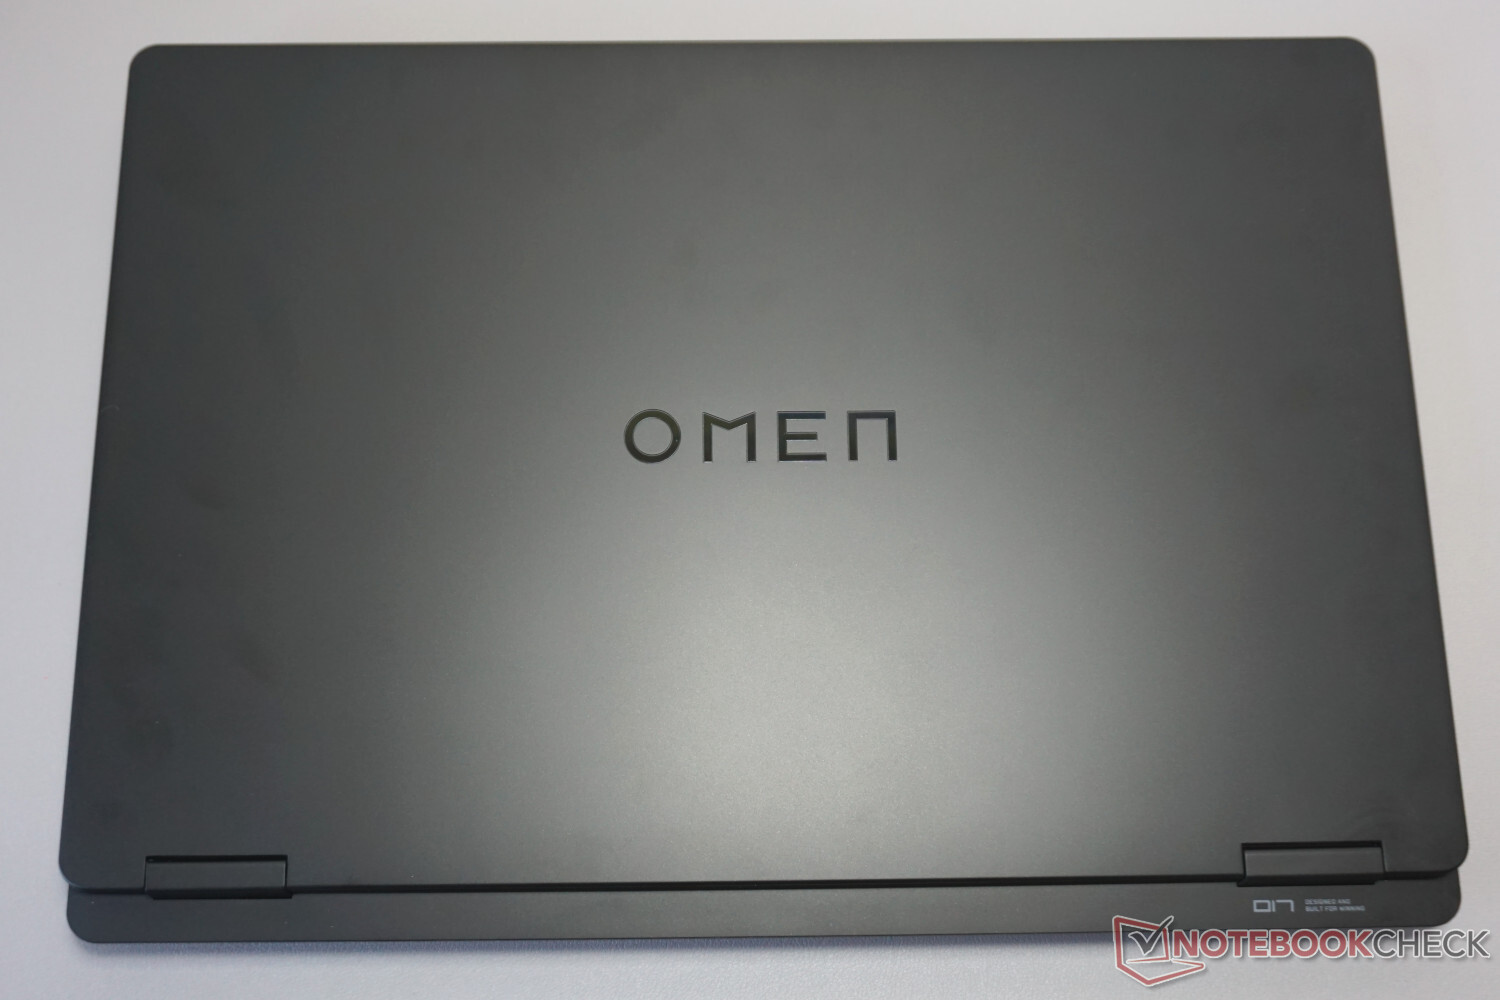
外壳看起来几乎毫无特色。黑色塑料占据了整个外壳,给人的感觉也是如此。没有任何视觉亮点、小细节,甚至连灯光效果都不值得欣赏。
但是,一旦你试着抬起笔记本电脑,或者在我们的情况下直接将其从包装盒中取出,就会发现惠普绝对没有节省使用内部的大量组件。虽然只抬起前端的一个角,底座也不会受到影响,但重量离 3 千克大关(约 6.6 磅)并不遥远。一切都保持坚硬和紧密。
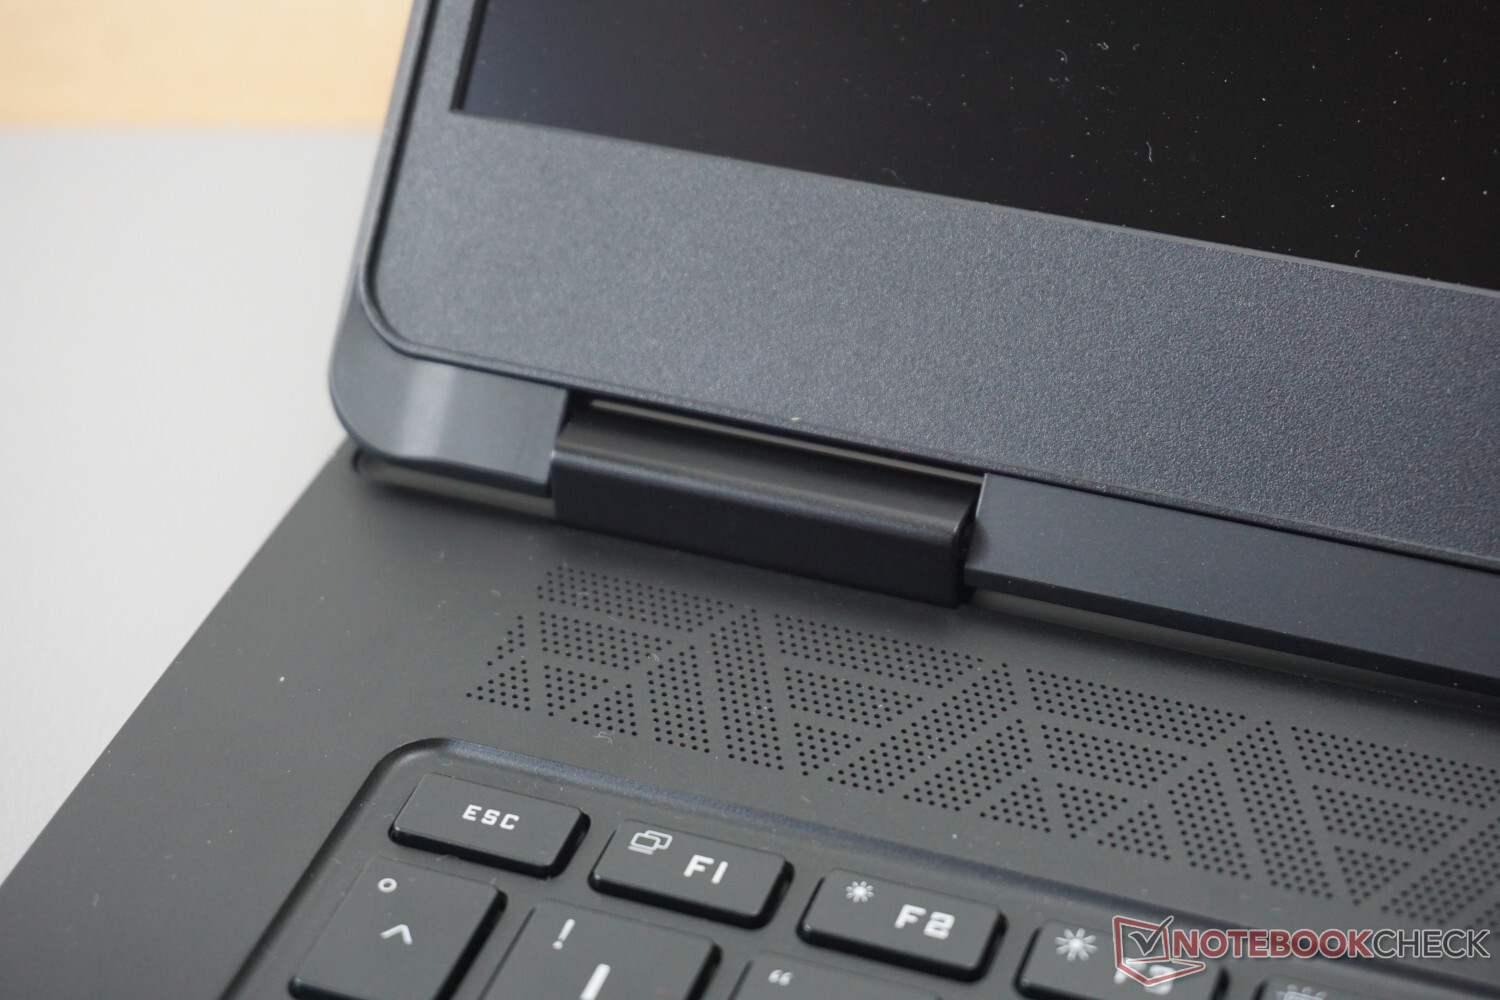
显示屏铰链也给人类似的印象,但显示屏盖子的稳定性还可以再好一些,因为没有任何额外的金属框架,仍然相当容易弯曲。
就整体尺寸而言,只有少数机型的尺寸更大。即使没有脚垫,40 厘米(约 15.7 英寸)的宽度和 3 厘米(约 1.2 英寸)的高度听起来也不太方便移动。另一方面,这也为硬件和散热提供了充足的空间,不过对于某些笔记本电脑包或背包来说可能会显得过大。
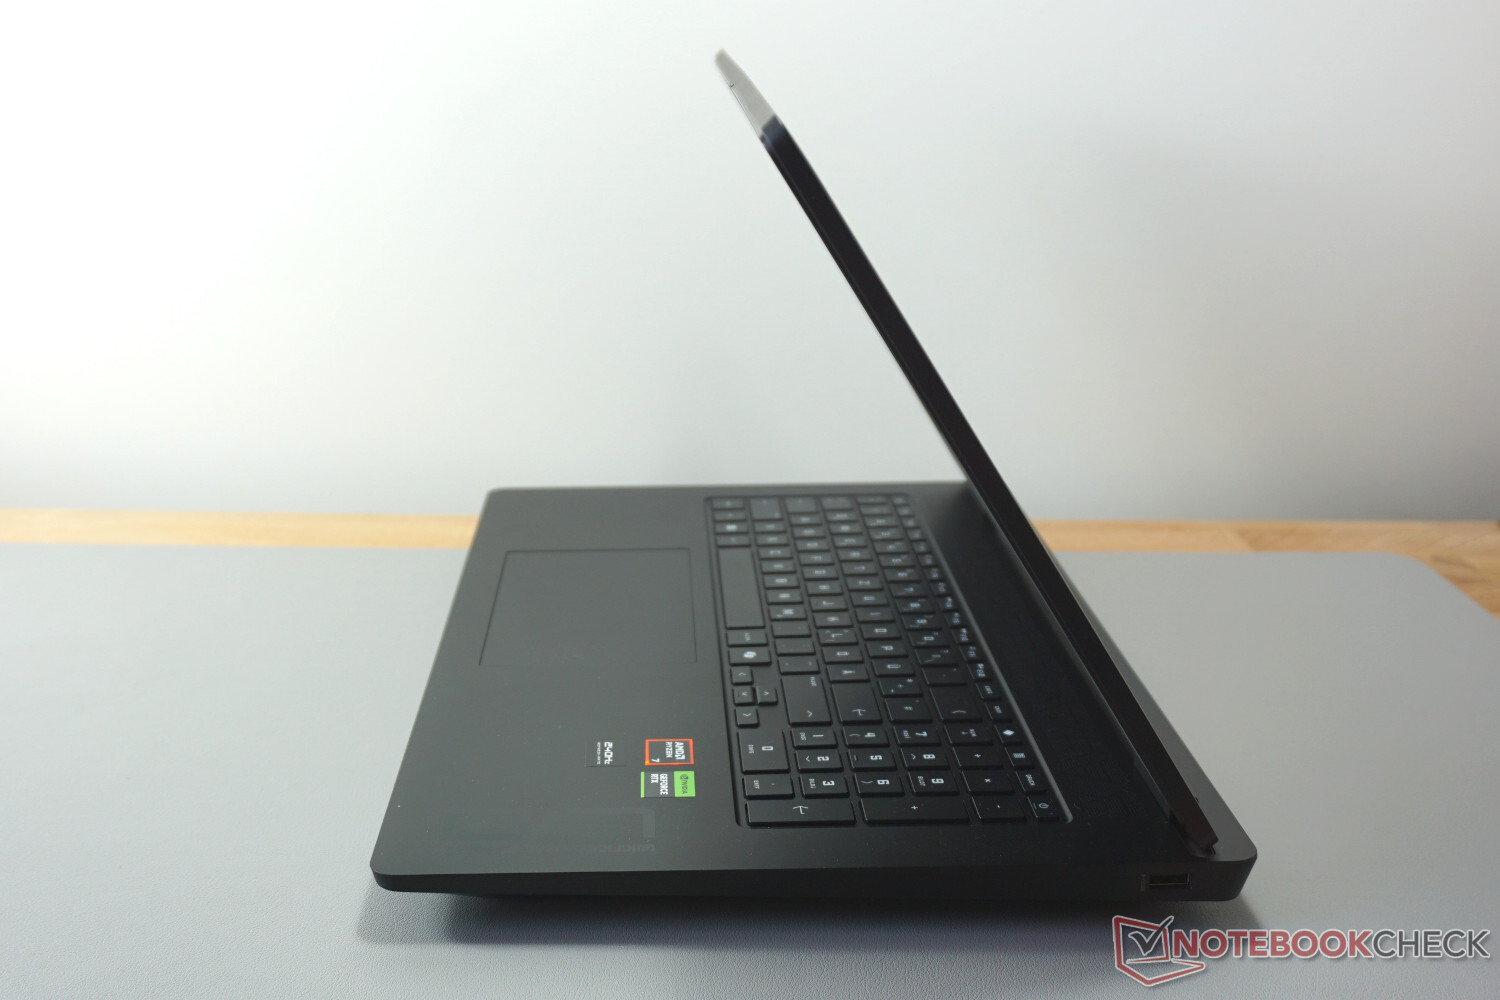
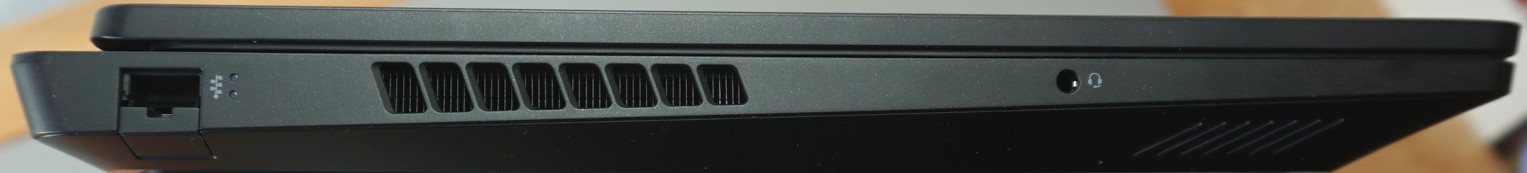
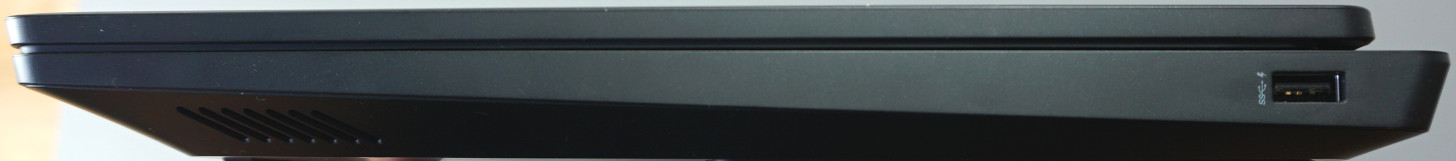
连接设备 - 奥门 17,亮点不多
尽管空间很大,但连接端口有限。不仅如此,它们还是速度较慢的版本。背面的所有 USB 接口只能达到 10 Gbit/s,侧面的甚至只有 5 Gbit/s。如果是 USB4 或 TB4,速度会是现在的四倍或八倍。但至少背面的接口还能让你通过外置固态硬盘玩很多游戏。
同样,LAN 端口的速度也只有 1 Gbit/s,而配置更好的竞争对手,如 宏碁掠夺者 Helios Neo则更加与时俱进,达到了 2.5 Gbit/s。端口在左侧的位置也不够理想,最好是在背面。此外,既没有第三个视频端口,也没有读卡器。
至少,HDMI 和 USB-C 视频输出支持显示 4K@120Hz,让那些拥有合适电视的用户能够很好地利用它。

交流
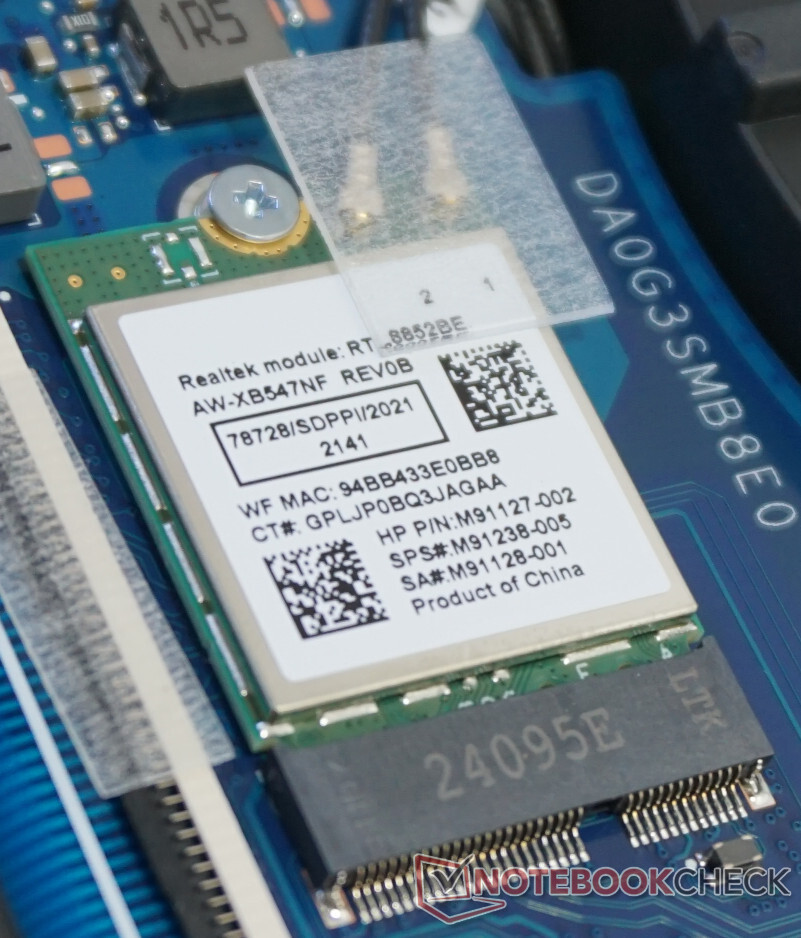
无线局域网模块在其能力范围内运行良好。在理想的条件下,它的速度接近 1 Gbit/s,几乎与有线连接一样好。在我们的测试中,没有出现任何值得一提的掉线现象。
虽然 Wi-Fi 6 模块能确保稳定可靠的连接,但它并不适合传输大量数据。
网络摄像头
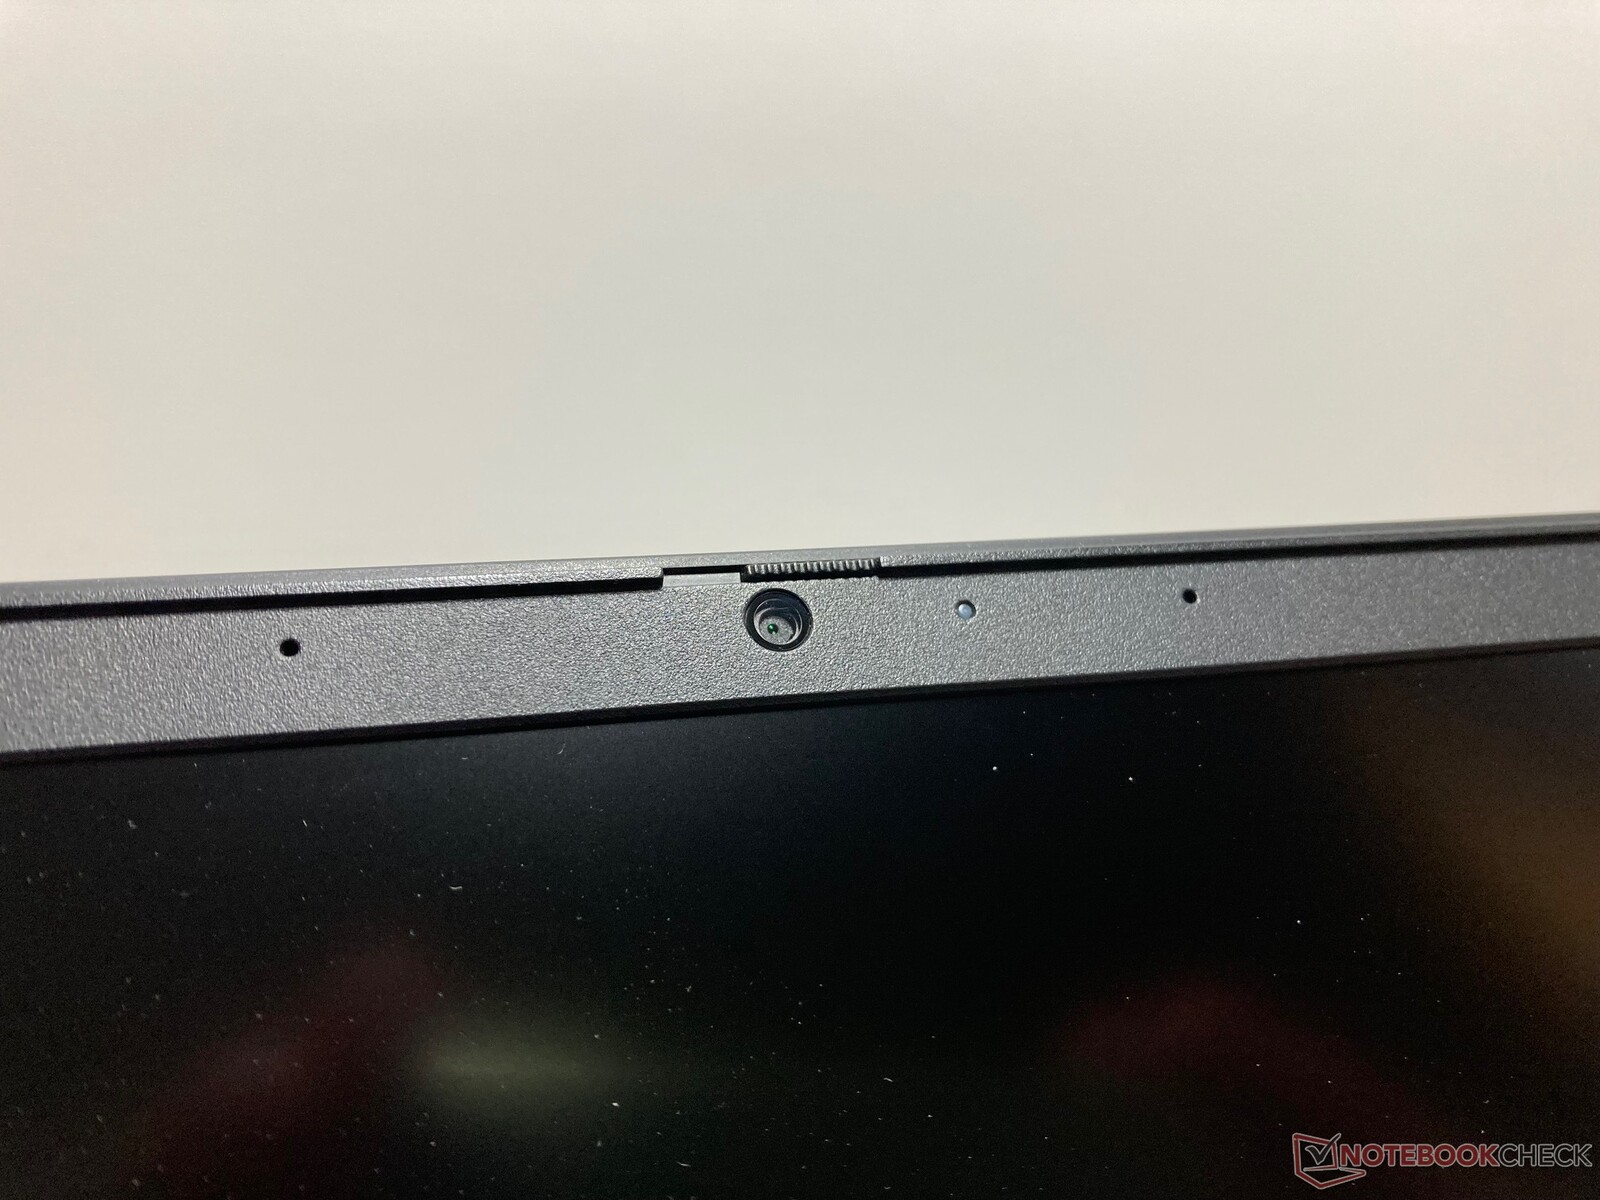
不错的全高清分辨率带来了细腻的图像。但这只适用于室内光线足够明亮的情况。即使天花板上的灯光不是很亮,也会导致图像质量下降。相机很难应对微弱的光线条件。细节会丢失,色彩还原也会大打折扣。只有在周围光线明亮的情况下,安装在显示框中的摄像头的色彩准确度才会令人信服。因此,我们不建议使用该摄像头进行几次以上的视频通话。
这是令人遗憾的,因为麦克风确实有一些潜力。虽然它的录音听起来有点刺耳,但始终以相同的音量录制,而且听起来非常清晰。你甚至可以很容易地听到房间外面的声音。


维护
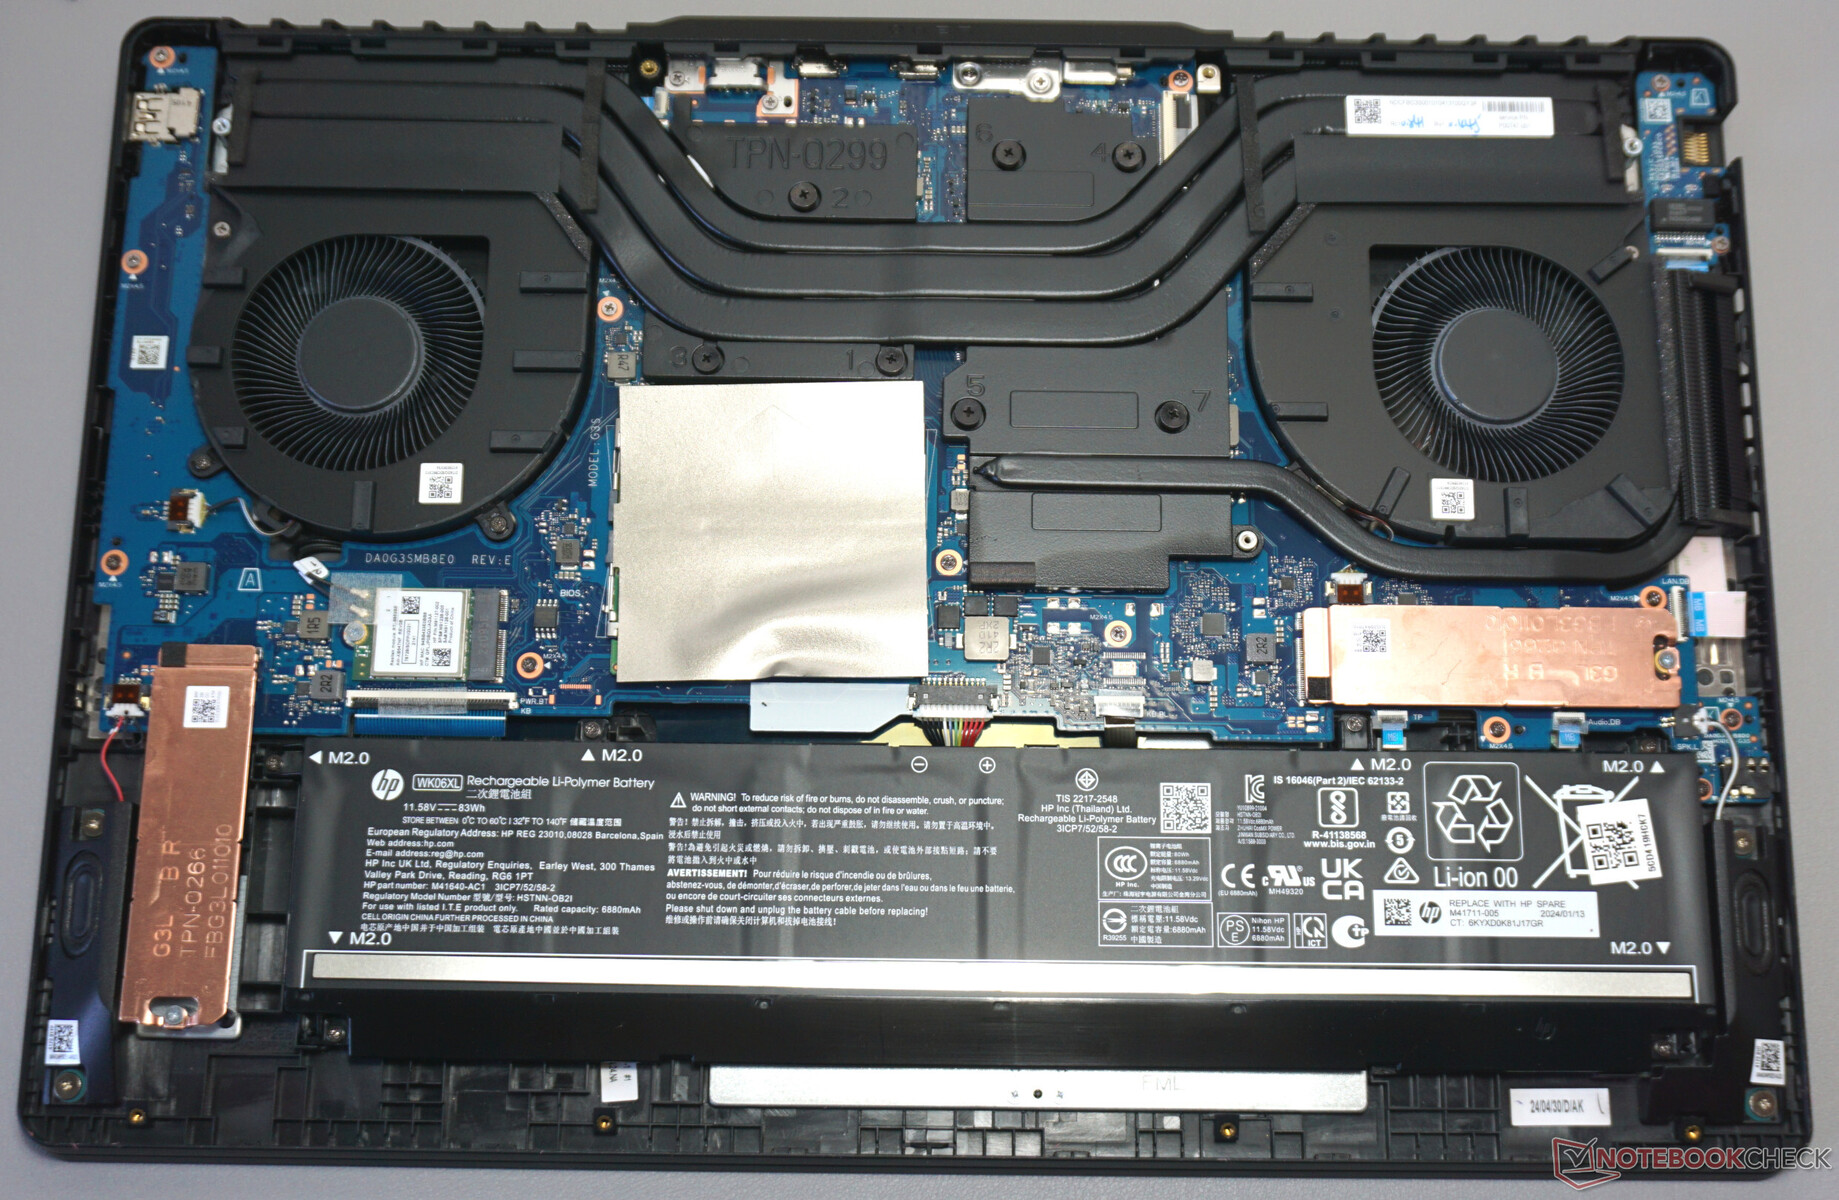
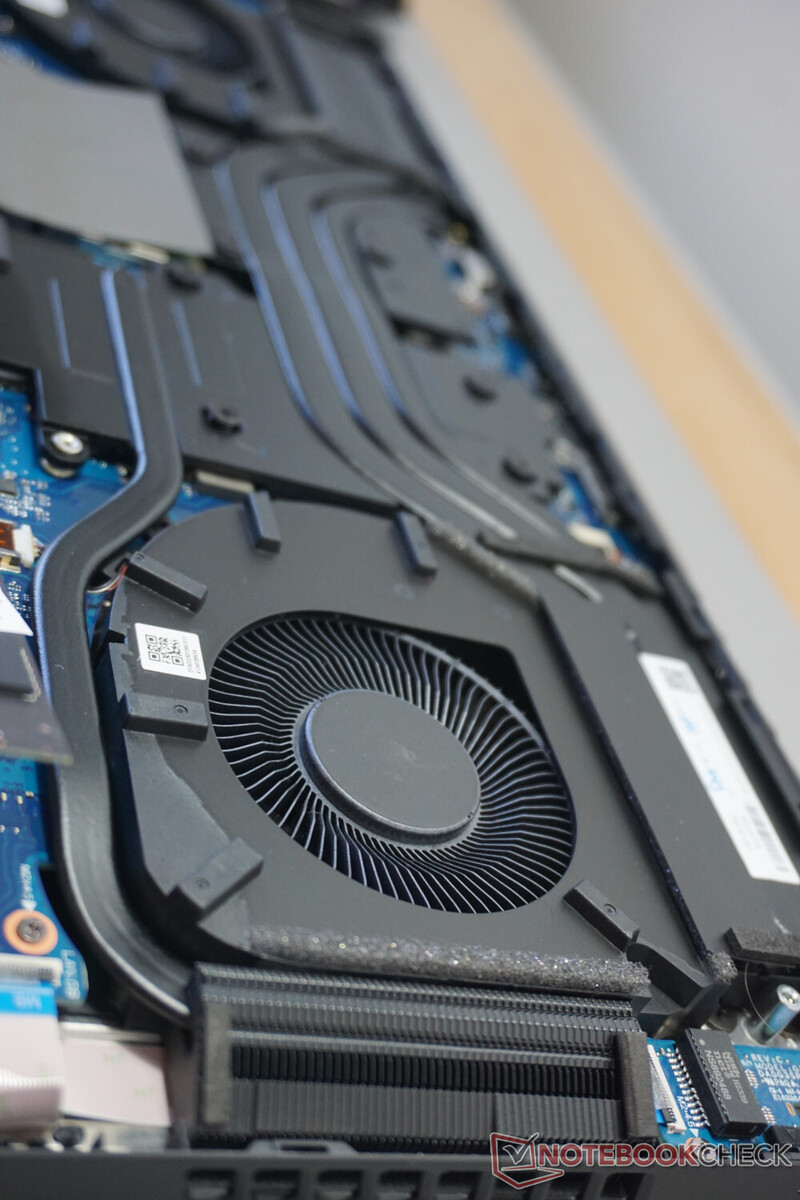
惠普 Omen 17 的机箱底部易于打开,这一点值得肯定。卸下 8 颗普通的飞利浦螺钉后,机箱盖不会产生任何阻力,无需用力即可轻松卸下。
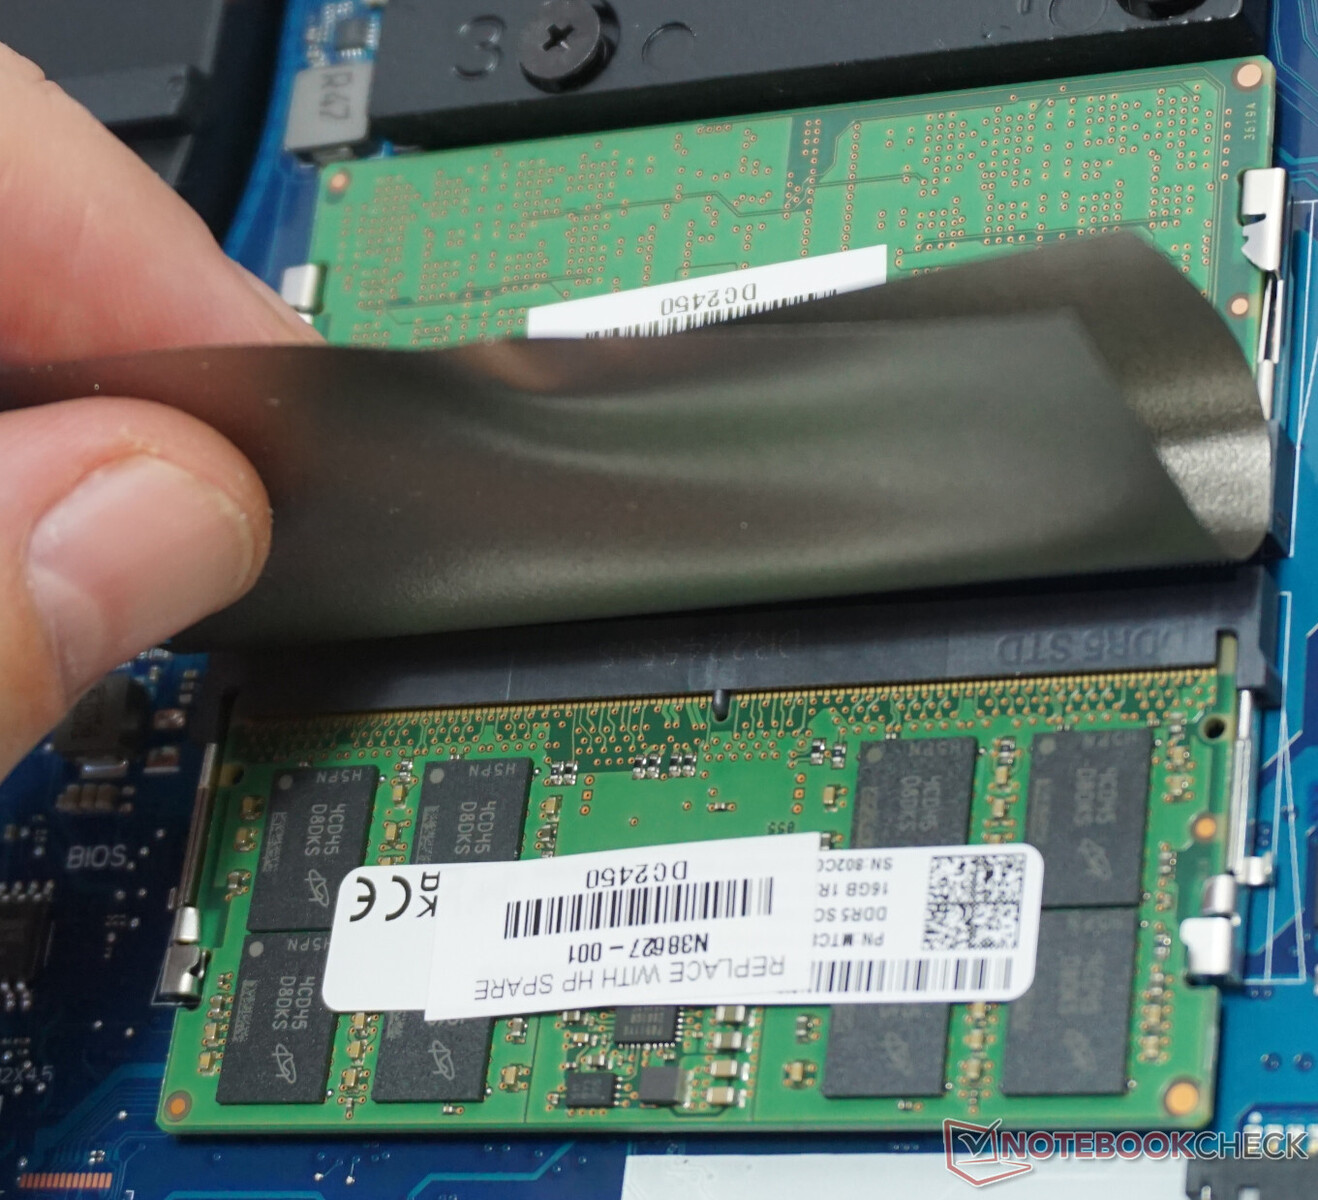
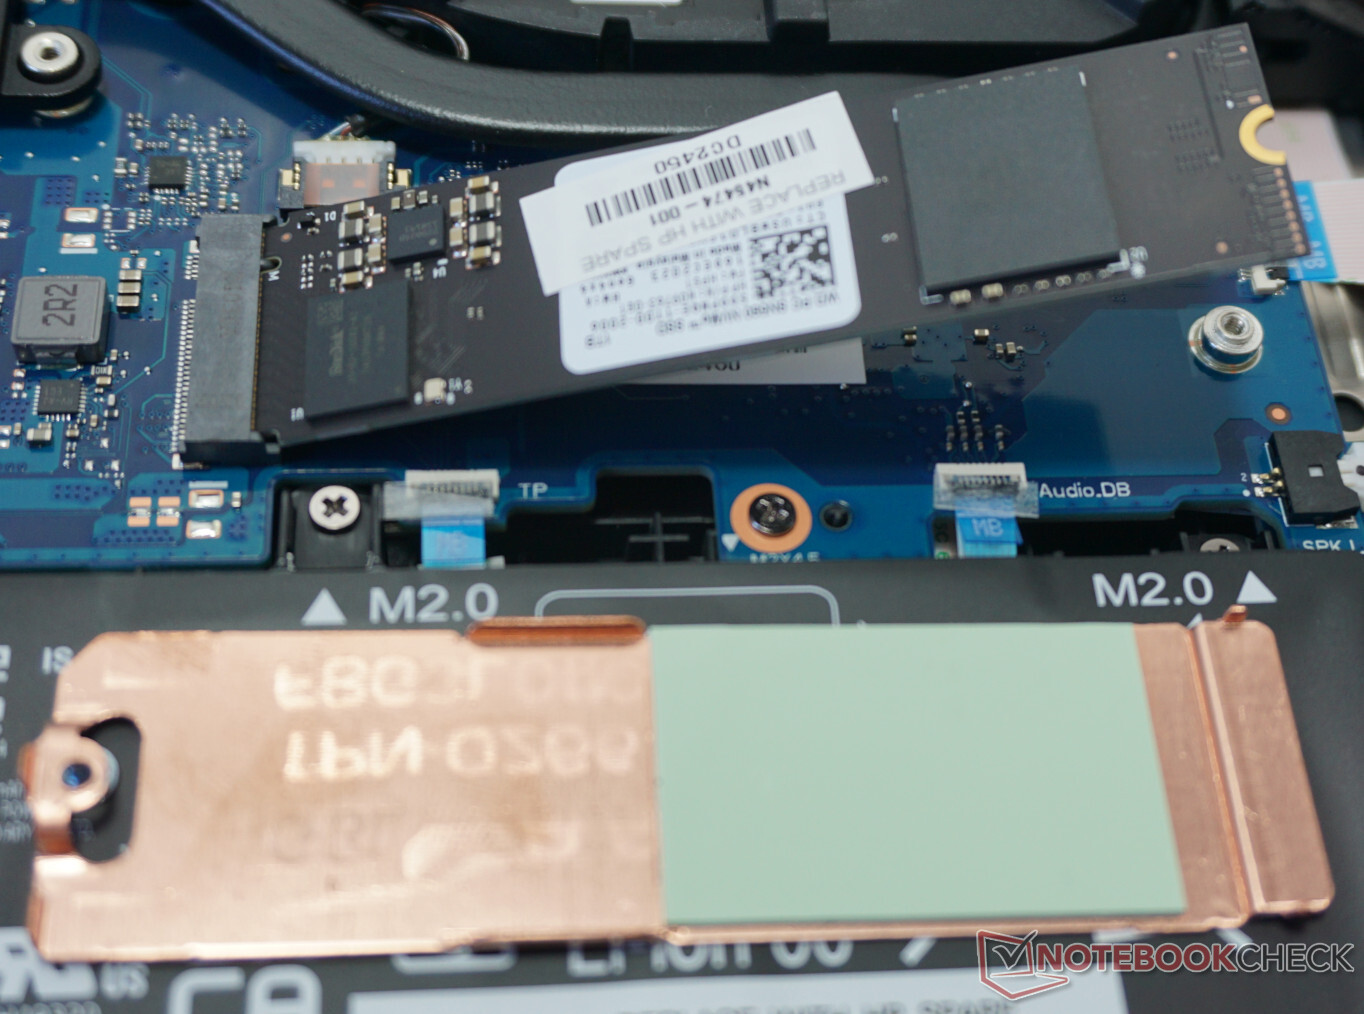
这样就可以清洁风扇和更换所有重要部件。两个内存插槽、一个 WLAN 模块(带有方便使用的天线插头)、两个固态硬盘插槽和一个可轻松拆卸的电池,这些都是许多更小巧的笔记本电脑所无法提供的,至少不是这种完整的组合。
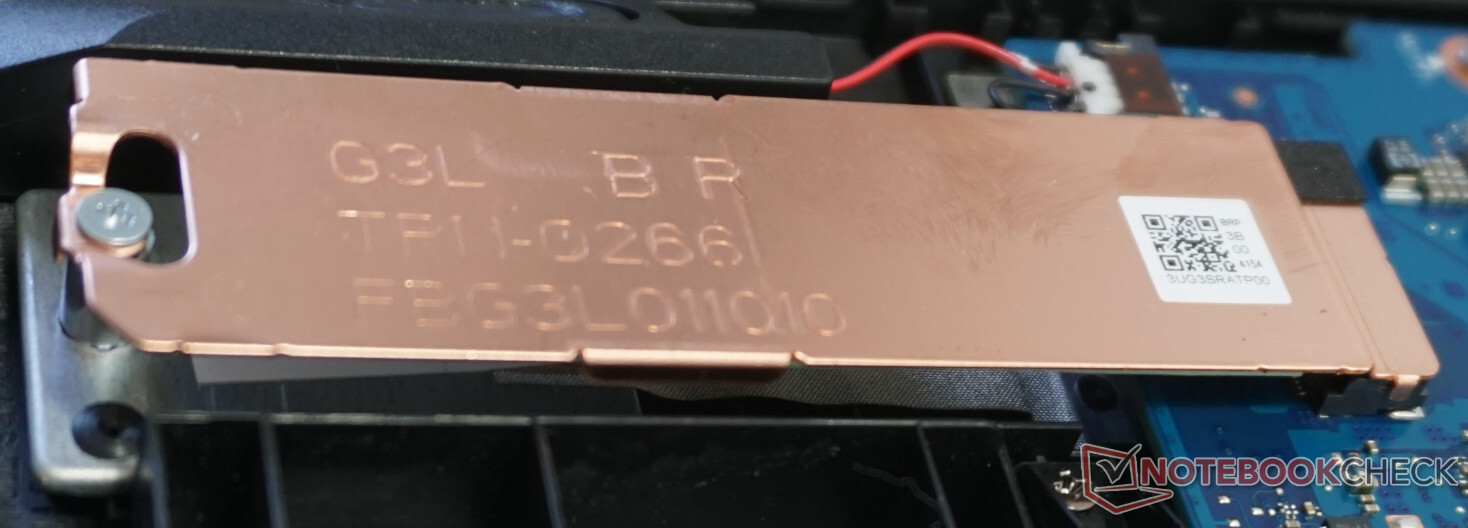
此外,M.2 固态硬盘插槽还配有铜盖,这显然也会产生影响,我们稍后在测试中就会发现。其中一个插槽仍然可用,因此以后增加存储空间很容易实现。
可持续性
包装主要由纸板和纸张组成。就连笔记本电脑和键盘的保护盖也是纸做的。只有充电器用塑料保护膜包裹。此外,笔记本电脑的维护也很方便,这肯定会延长 Omen 17 的使用寿命。从工作存储器到电池,所有部件都可以更换。
此外,Omen 17 的功耗适中,日常工作功耗大多低于 10 瓦。典型的台式电脑在这方面明显处于劣势。
最后,惠普每年都会发布一份可持续发展报告,介绍制造商采取的各种措施,从利用可再生能源发电开始,一直到实现公司结构各层次所有员工待遇平等的目标。您可以在这里了解详情。
保修
惠普提供两年保修,但不提供现场维修等额外服务。根据供应商的不同,您也可以在那里预订一些额外的保修选项。
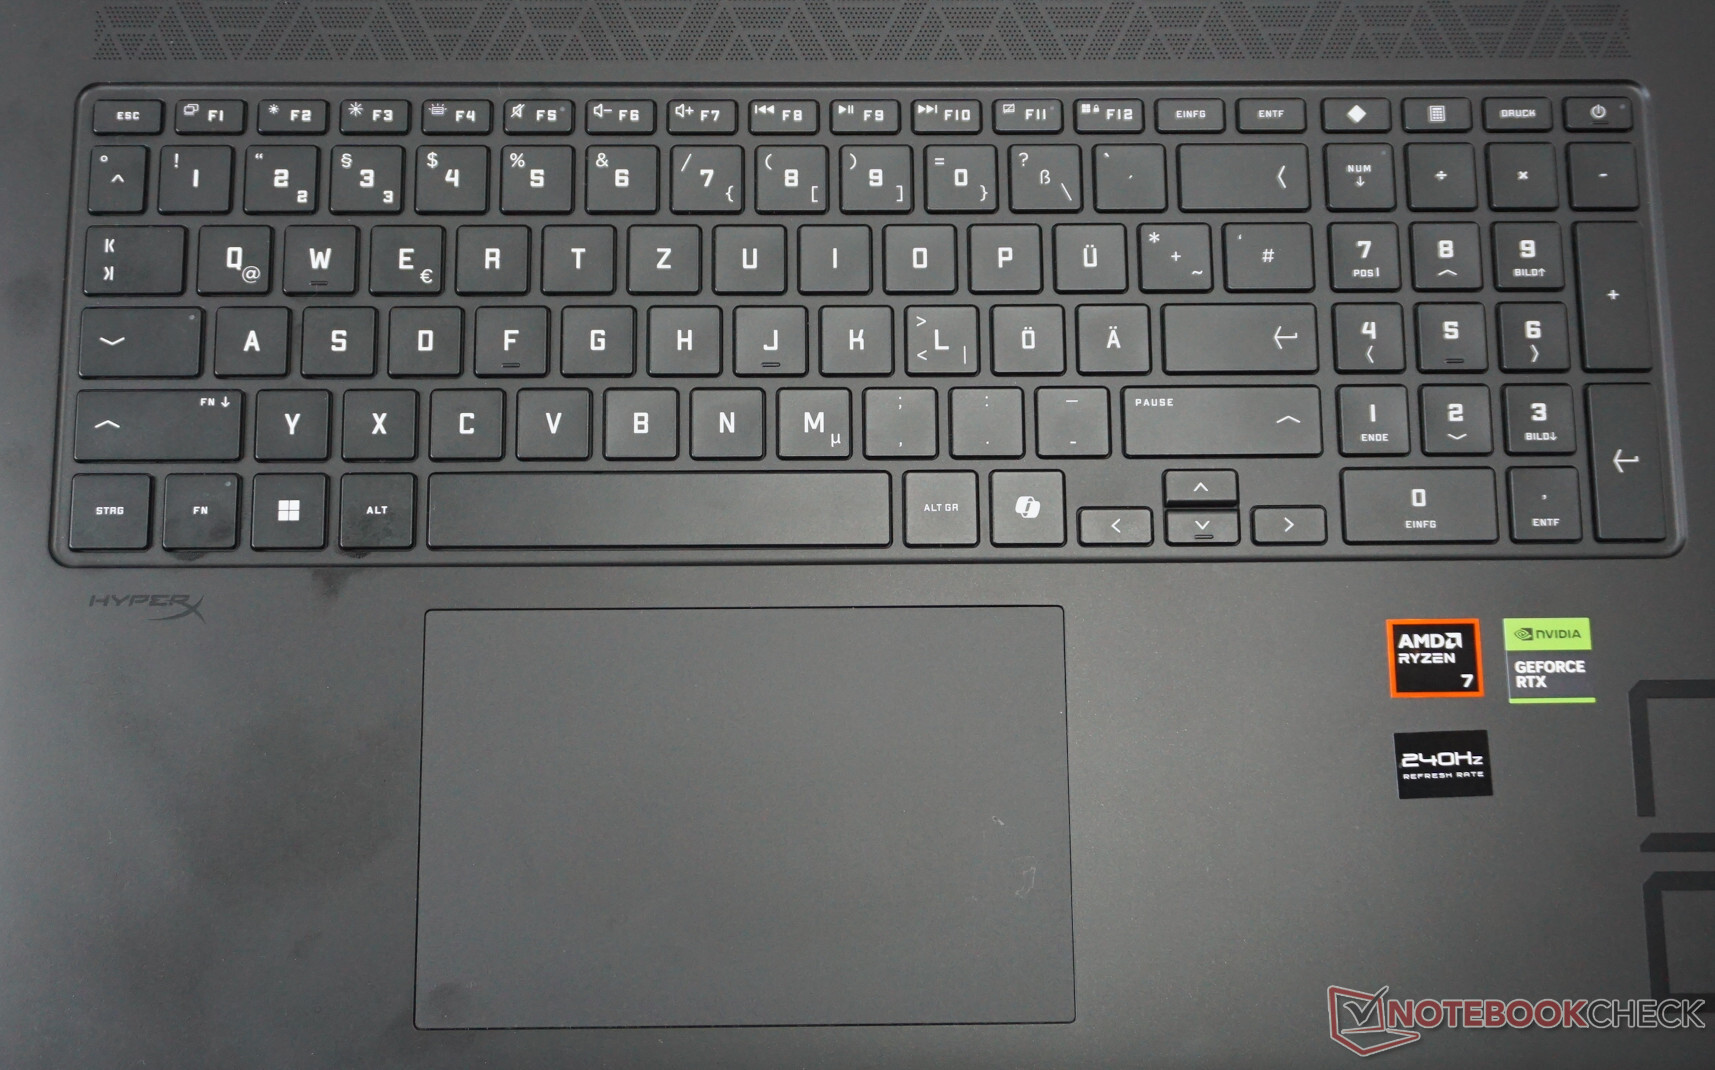
输入设备 - HP Omen 17 仅提供标准功能
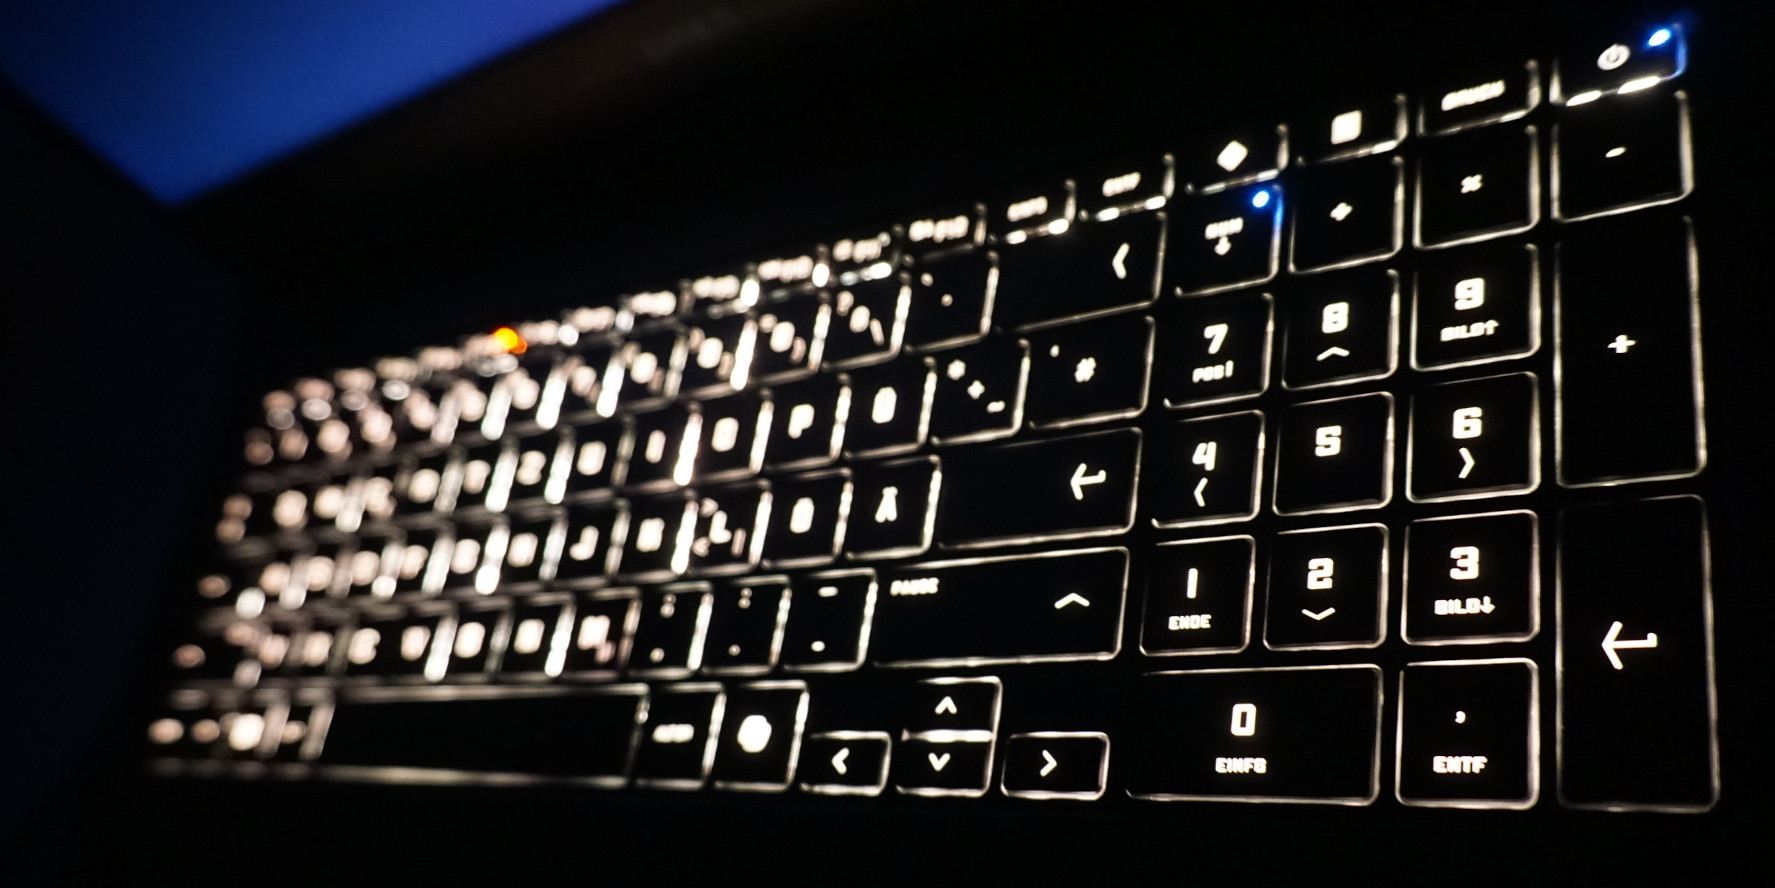
键盘看起来不太适合游戏笔记本电脑。键程较短,按键阻力几乎不明显。此外,键盘缺少可单独调节的照明功能。即使你可以选择几乎任何颜色并对亮度进行微调,但所有按键的照明颜色都是一样的。至少,方向键应该是全尺寸的。
触摸板的情况也类似。尽管触摸板的尺寸为 13 x 8 厘米(5.1 x 3.15 英寸),大小适中,反应也非常准确,但按键的调整似乎不太理想。按压力度较大时会产生一些明显的咔嗒声。虽然键盘的整体性能足以满足日常工作的需要--它还提供了紧凑的边框和良好的键入体验--但那些想玩更激烈游戏的人几乎不得不使用其他输入设备。
显示屏 - 根据所提供的游戏性能进行了很好的调整

如果你想一想一台好的笔记本电脑的游戏显示屏必须具备哪些功能,你就会对惠普 Omen 17 的 QHD 显示屏有相当准确的认识。结合 17 英寸的对角线,该分辨率可确保图像清晰细腻。
除游戏外,16:9 格式也非常适合流媒体播放。IPS 面板上的色彩看起来相当自然,磨砂表面还能防止恼人的反光。
240 赫兹的刷新率和足够大的色彩空间确保了各种游戏类型的显示效果。在我们的测量中,响应时间也能与更好的机型保持一致,达到了比 华硕 TUF GAMING 17的响应时间。
对比度和黑色值的表现不尽如人意。即使是 IPS 面板,我们也不指望它能呈现出完美的黑色,但它的图像看起来太亮了,绝对暗淡无光。另一方面,我们用肉眼根本无法发现任何屏幕出血现象,或者在长时间曝光时也只能发现很少的出血现象。在测试中,我们也没有看到脉宽调制产生的闪烁。
此外,惠普还提供 144 赫兹的全高清版本,与 RTX 4060 结合使用可能是一个明智的选择。
| |||||||||||||||||||||||||
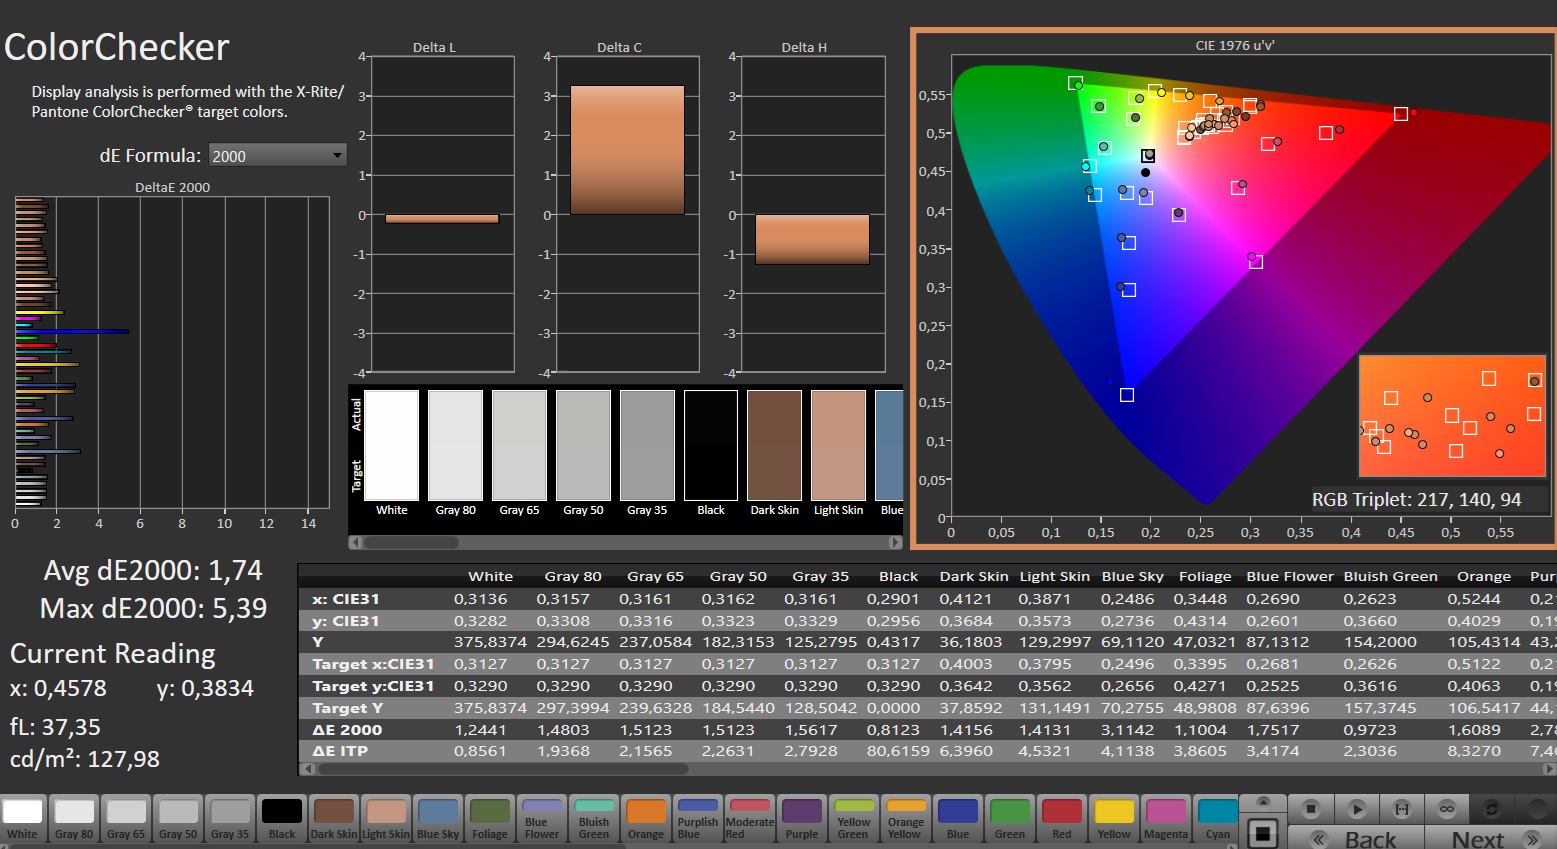
Brightness Distribution: 84 %
Center on Battery: 363 cd/m²
Contrast: 955:1 (Black: 0.38 cd/m²)
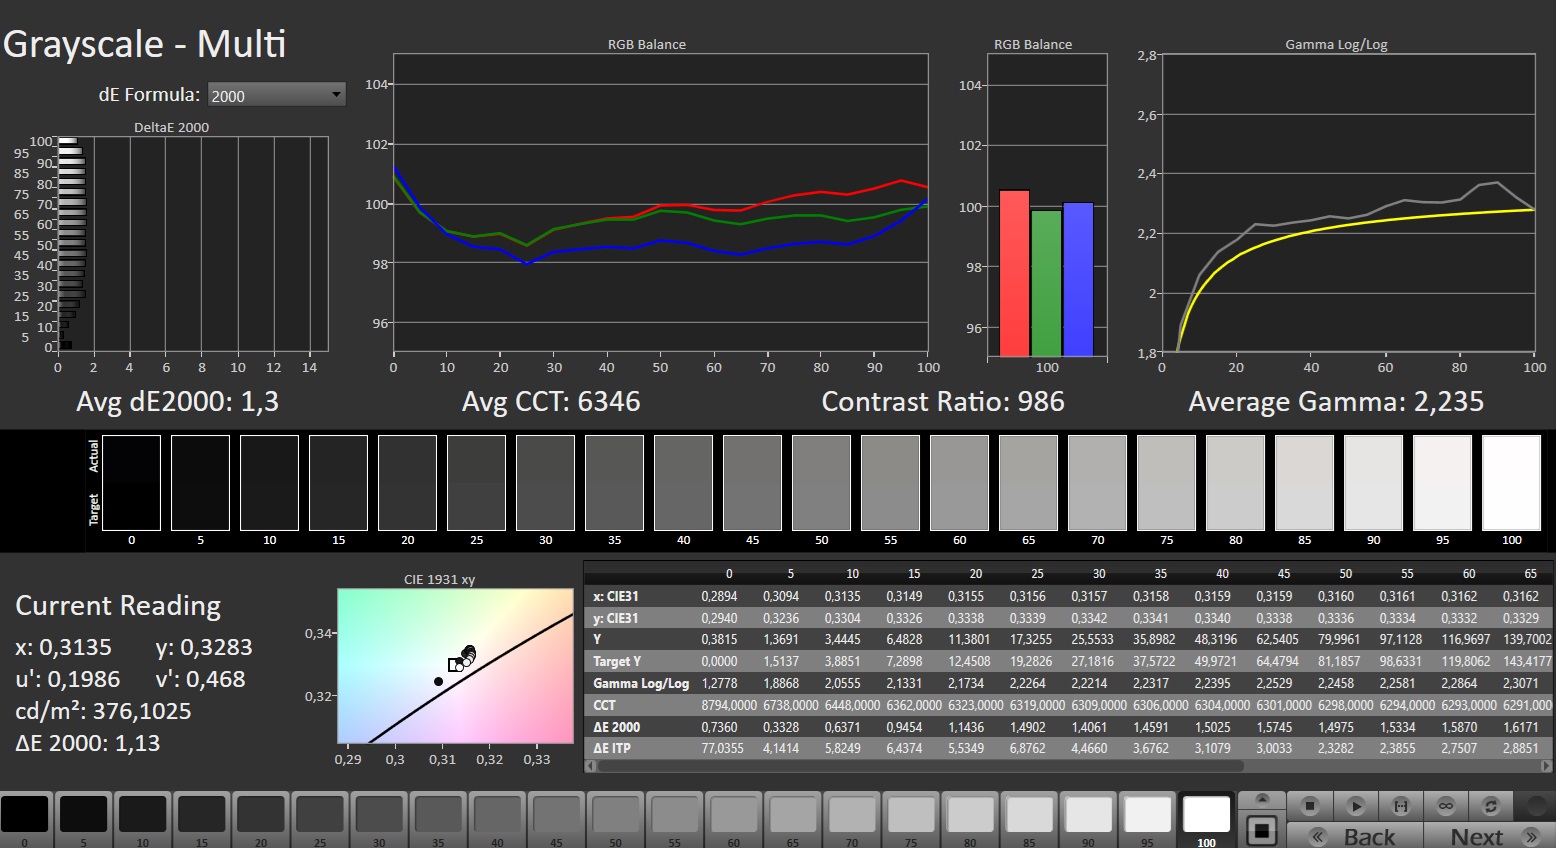
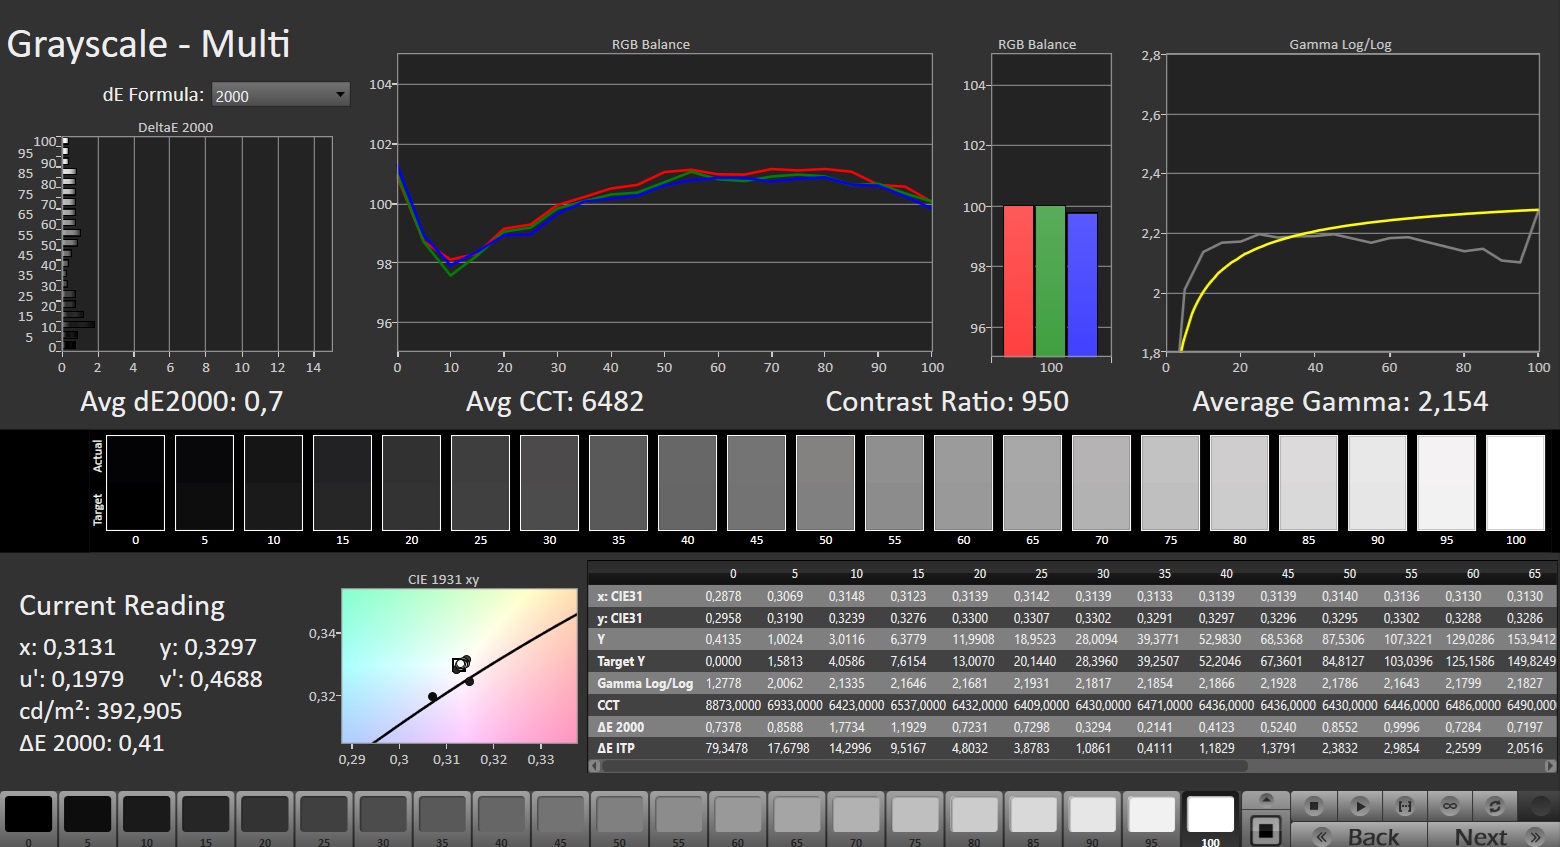
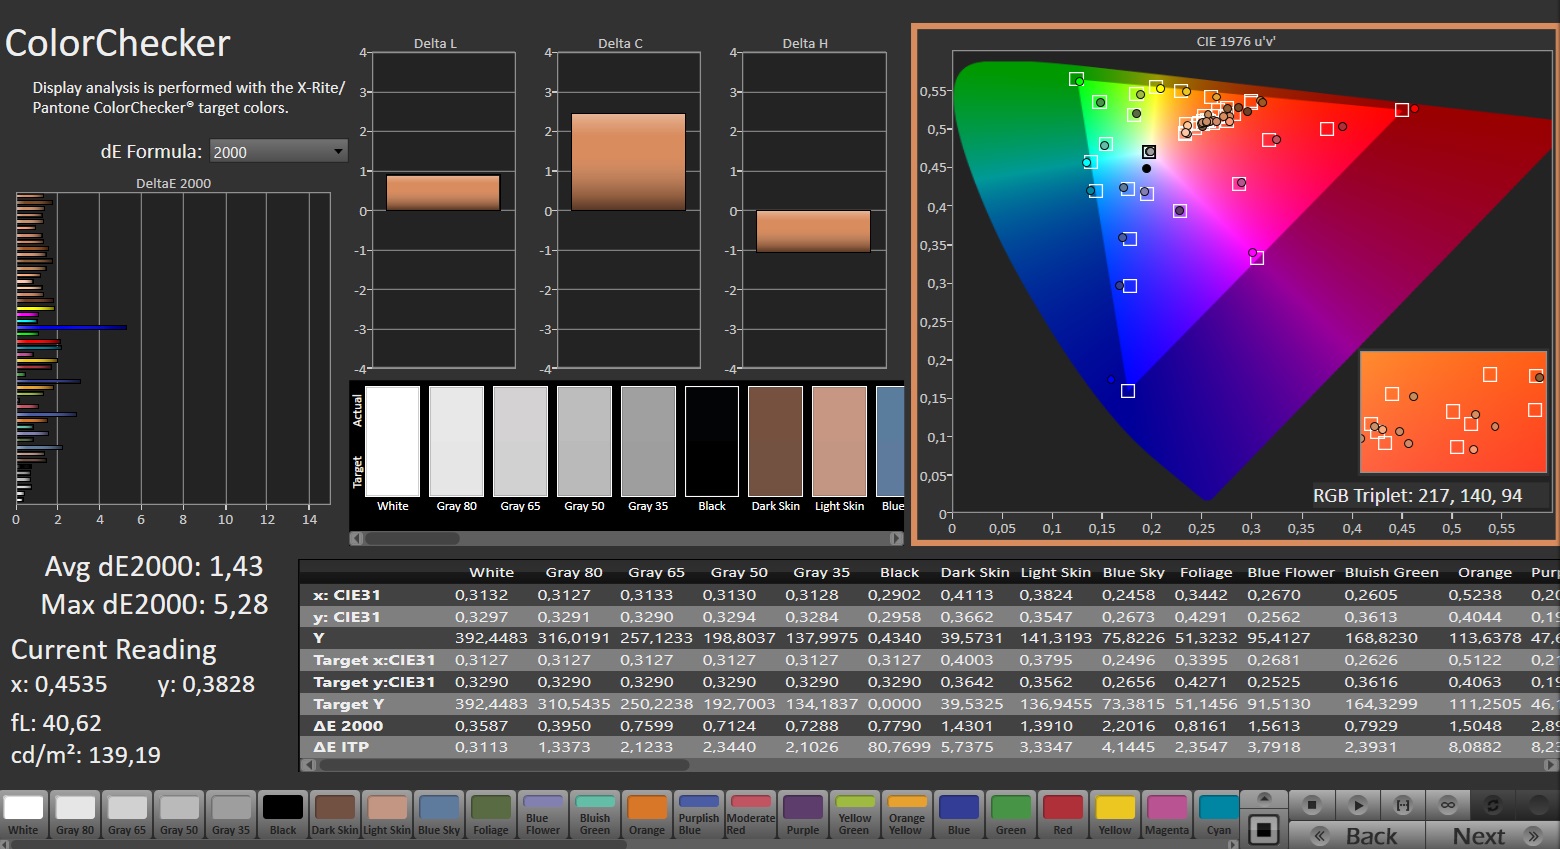
ΔE Color 1.74 | 0.5-29.43 Ø4.87, calibrated: 1.43
ΔE Greyscale 1.3 | 0.5-98 Ø5.1
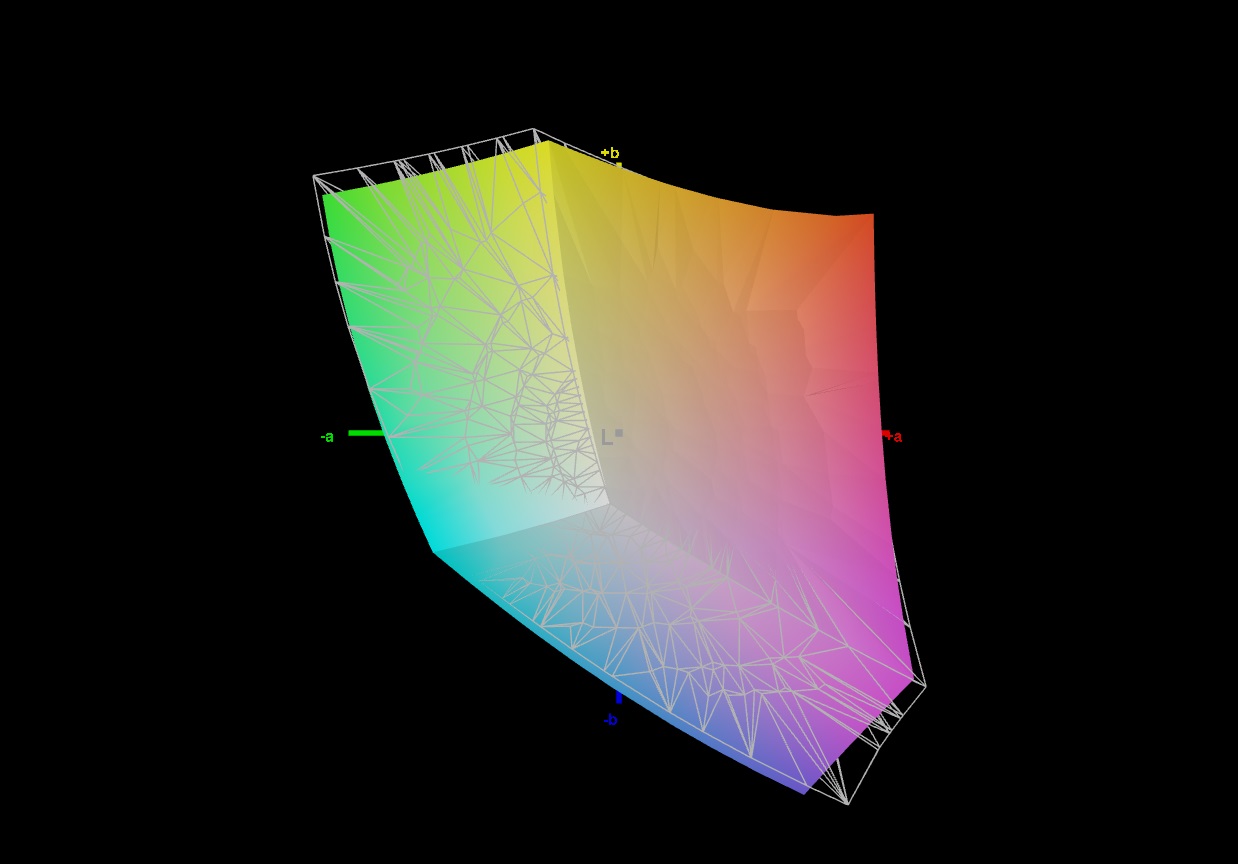
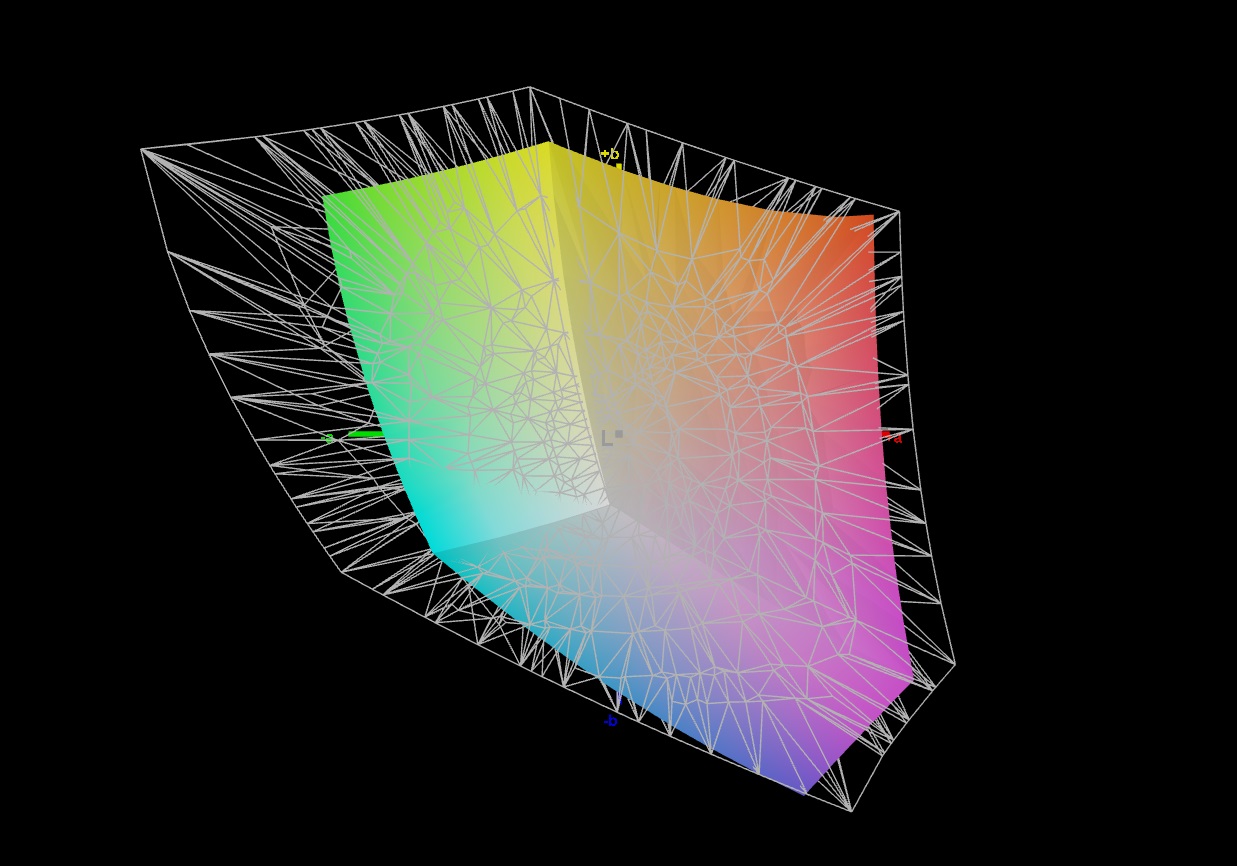
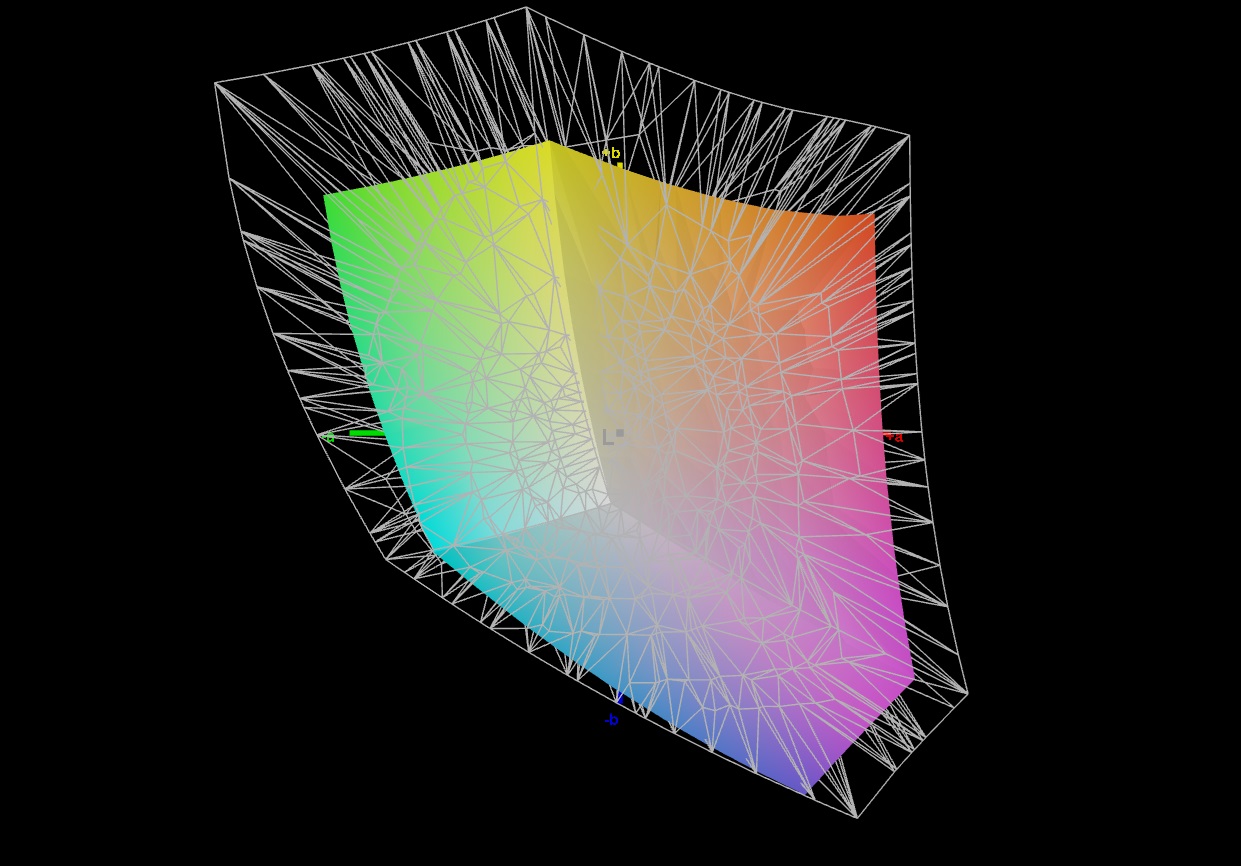
68.1% AdobeRGB 1998 (Argyll 2.2.0 3D)
95.5% sRGB (Argyll 2.2.0 3D)
66.2% Display P3 (Argyll 2.2.0 3D)
Gamma: 2.235
| HP Omen 17-db0079ng BOE0B67, IPS, 2560x1440, 17.3" | Alienware m16 R2 BOE NE16NYH, IPS, 2560x1600, 16" | Asus ROG Strix Scar 16 G634JZR BOE NE160QDM-NM7, Mini LED, 2560x1600, 16" | Acer Predator Helios Neo 16 (2024) Chi Mei N160GME-GTB, LED, 2560x1600, 16" | Asus TUF Gaming A17 FA707XI-NS94 AU Optronics B173HAN04.9, IPS, 1920x1080, 17.3" | Asus TUF Gaming A15 FA507UV AU Optronics B156HAN15.H, IPS, 1920x1080, 15.6" | |
|---|---|---|---|---|---|---|
| Display | 6% | 30% | 26% | -39% | 5% | |
| Display P3 Coverage | 66.2 | 71 7% | 99.8 51% | 95.9 45% | 39.7 -40% | 70.5 6% |
| sRGB Coverage | 95.5 | 100 5% | 100 5% | 99.8 5% | 59.1 -38% | 98.5 3% |
| AdobeRGB 1998 Coverage | 68.1 | 71.4 5% | 90.8 33% | 86.4 27% | 41 -40% | 72.7 7% |
| Response Times | 28% | 20% | 30% | -198% | -148% | |
| Response Time Grey 50% / Grey 80% * | 14.4 ? | 5.7 ? 60% | 5 ? 65% | 5 ? 65% | 39 ? -171% | 31.7 ? -120% |
| Response Time Black / White * | 8.3 ? | 8.7 ? -5% | 10.4 ? -25% | 8.8 ? -6% | 26.9 ? -224% | 22.9 ? -176% |
| PWM Frequency | 2040 ? | |||||
| Screen | 6% | 29% | 7% | -66% | -22% | |
| Brightness middle | 363 | 345.8 -5% | 490 35% | 521 44% | 255.9 -30% | 315 -13% |
| Brightness | 341 | 337 -1% | 487 43% | 506 48% | 248 -27% | 303 -11% |
| Brightness Distribution | 84 | 87 4% | 94 12% | 85 1% | 91 8% | 90 7% |
| Black Level * | 0.38 | 0.3 21% | 0.4 -5% | 0.44 -16% | 0.21 45% | 0.25 34% |
| Contrast | 955 | 1153 21% | 1225 28% | 1184 24% | 1219 28% | 1260 32% |
| Colorchecker dE 2000 * | 1.74 | 1.99 -14% | 1.08 38% | 1.74 -0% | 4.51 -159% | 2.26 -30% |
| Colorchecker dE 2000 max. * | 5.39 | 3.52 35% | 2.38 56% | 3.88 28% | 20.77 -285% | 7.37 -37% |
| Colorchecker dE 2000 calibrated * | 1.43 | 0.62 57% | 0.9 37% | 0.52 64% | 1.82 -27% | 1.03 28% |
| Greyscale dE 2000 * | 1.3 | 2.1 -62% | 1.1 15% | 3 -131% | 3.2 -146% | 4 -208% |
| Gamma | 2.235 98% | 2.32 95% | 2.13 103% | 2.164 102% | 2.08 106% | 2.116 104% |
| CCT | 6346 102% | 6369 102% | 6724 97% | 6816 95% | 6054 107% | 7570 86% |
| Total Average (Program / Settings) | 13% /
9% | 26% /
28% | 21% /
14% | -101% /
-79% | -55% /
-34% |
* ... smaller is better
即使不进行额外的校准,色彩还原也是可以的。我们只测量到蓝色的偏差较大,肉眼也能察觉到。在其他色彩区域,包括灰阶,色彩还原在交付状态下几乎是完美的。
校准后,不再有异常值,色彩准确度始终保持在较高水平。
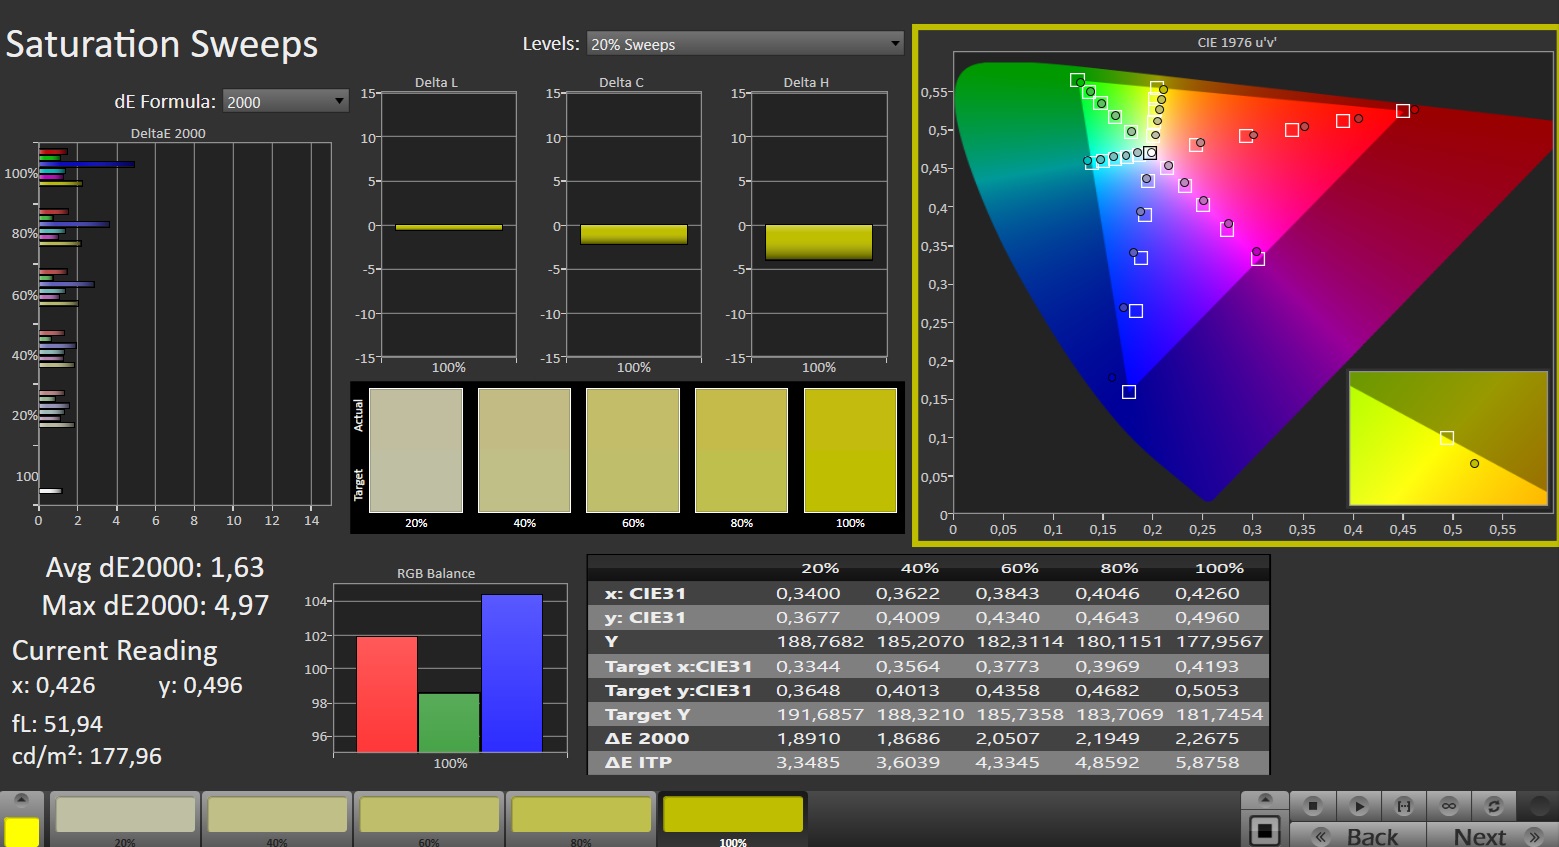
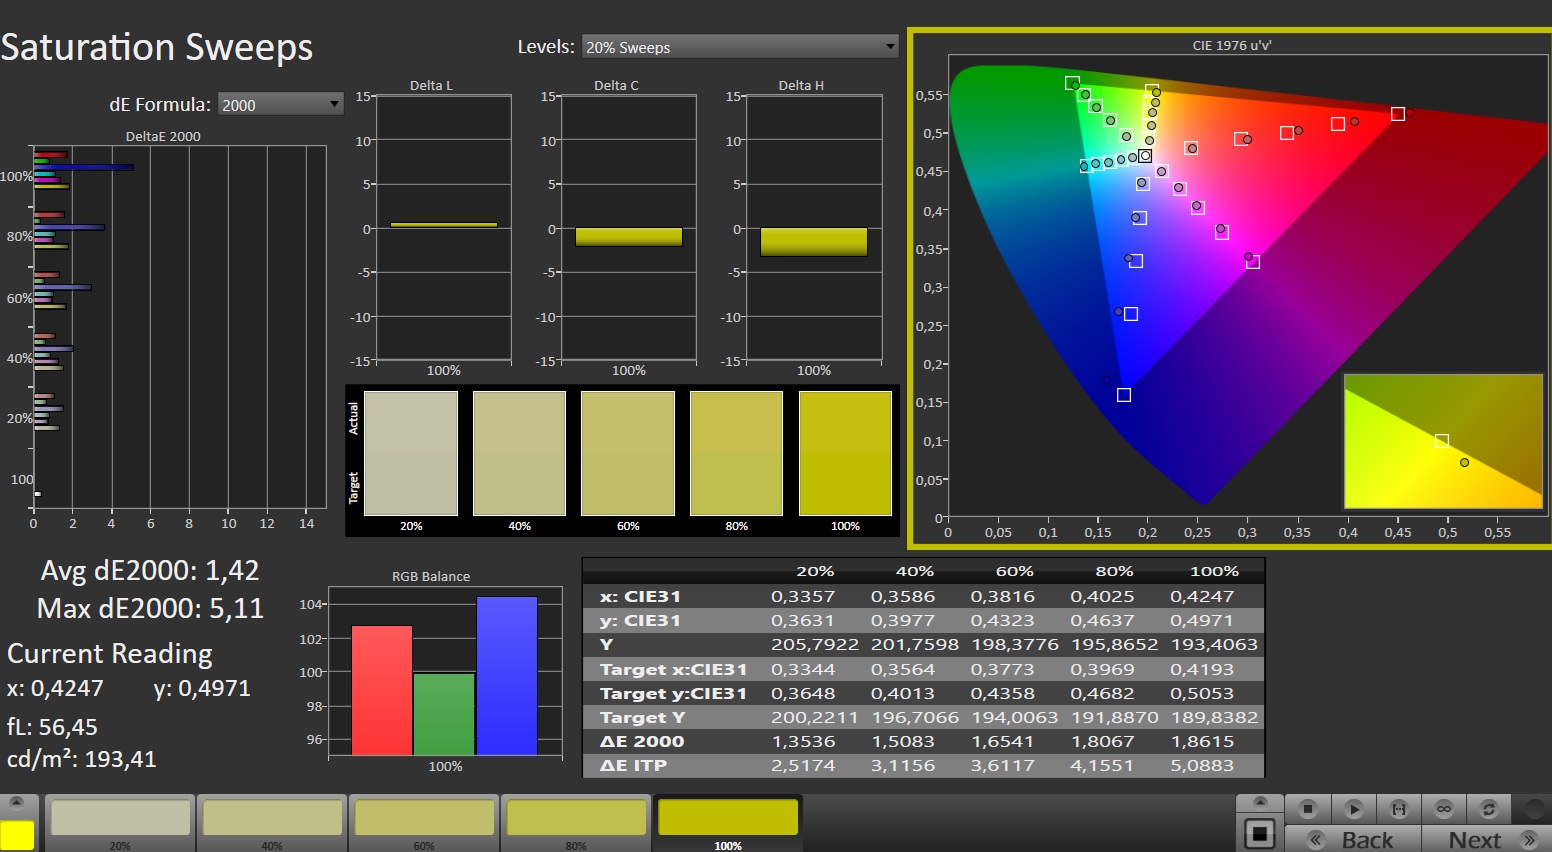
推荐用于游戏的 sRGB 色彩空间并未完全覆盖。但这在实际使用中几乎不会被察觉,而且更简单的显示器显示的色彩也要少三分之一。不过,一些竞争对手,如 Alienware m16 R2采用了相同的面板技术,可以达到 100%。如果你想在一旁进行图像和视频处理,这样的显示器会是更好的选择。
Display Response Times
| ↔ Response Time Black to White | ||
|---|---|---|
| 8.3 ms ... rise ↗ and fall ↘ combined | ↗ 3.5 ms rise | 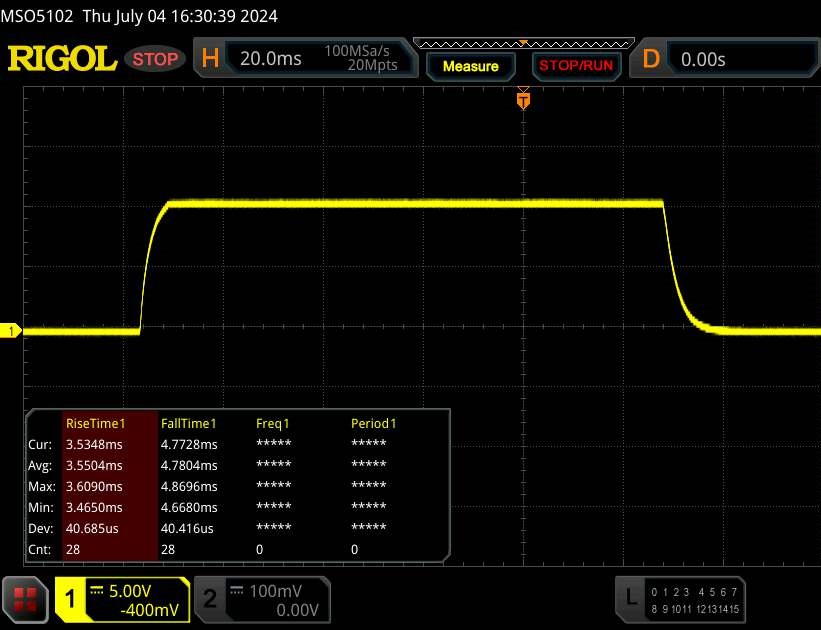 |
| ↘ 4.8 ms fall | ||
| The screen shows fast response rates in our tests and should be suited for gaming. In comparison, all tested devices range from 0.1 (minimum) to 240 (maximum) ms. » 21 % of all devices are better. This means that the measured response time is better than the average of all tested devices (20.8 ms). | ||
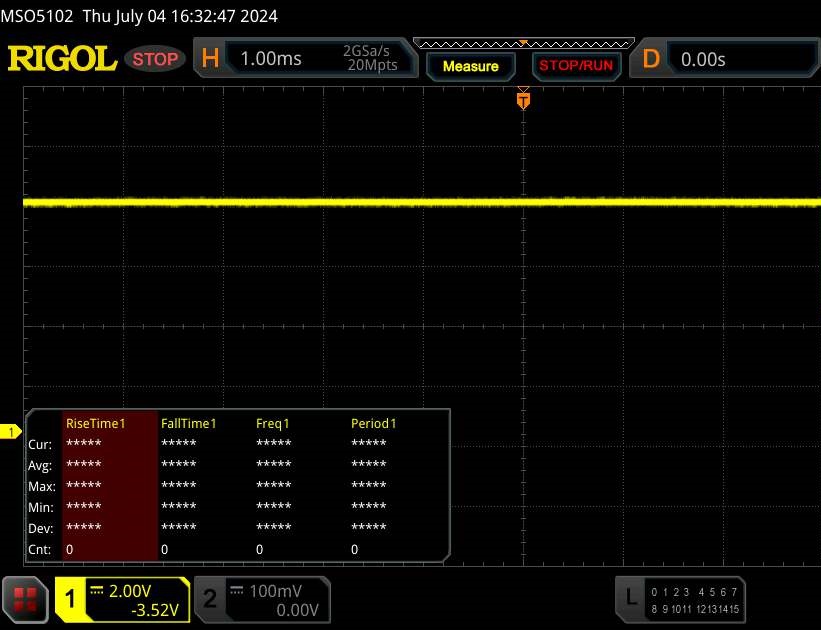
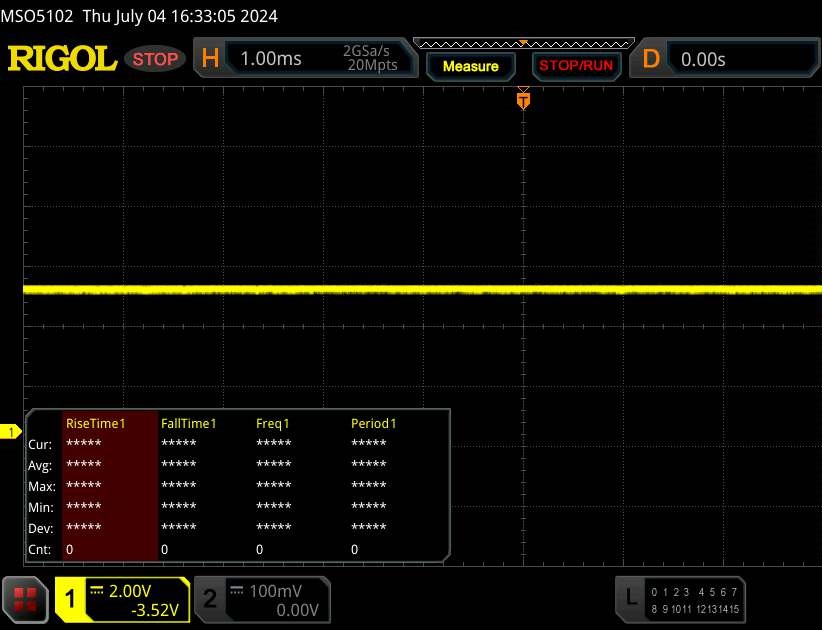
| ↔ Response Time 50% Grey to 80% Grey | ||
| 14.4 ms ... rise ↗ and fall ↘ combined | ↗ 6.8 ms rise | 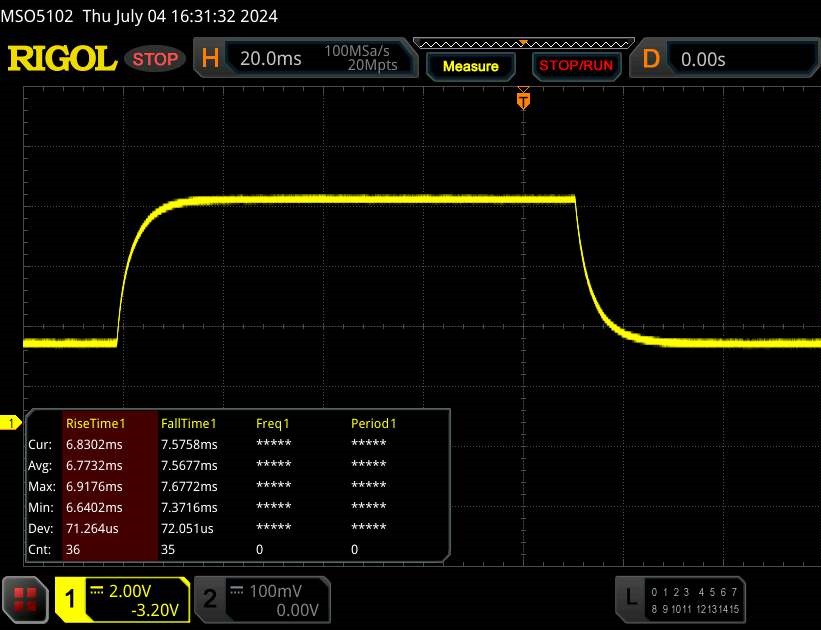 |
| ↘ 7.6 ms fall | ||
| The screen shows good response rates in our tests, but may be too slow for competitive gamers. In comparison, all tested devices range from 0.165 (minimum) to 636 (maximum) ms. » 25 % of all devices are better. This means that the measured response time is better than the average of all tested devices (32.5 ms). | ||
Screen Flickering / PWM (Pulse-Width Modulation)
| Screen flickering / PWM not detected | 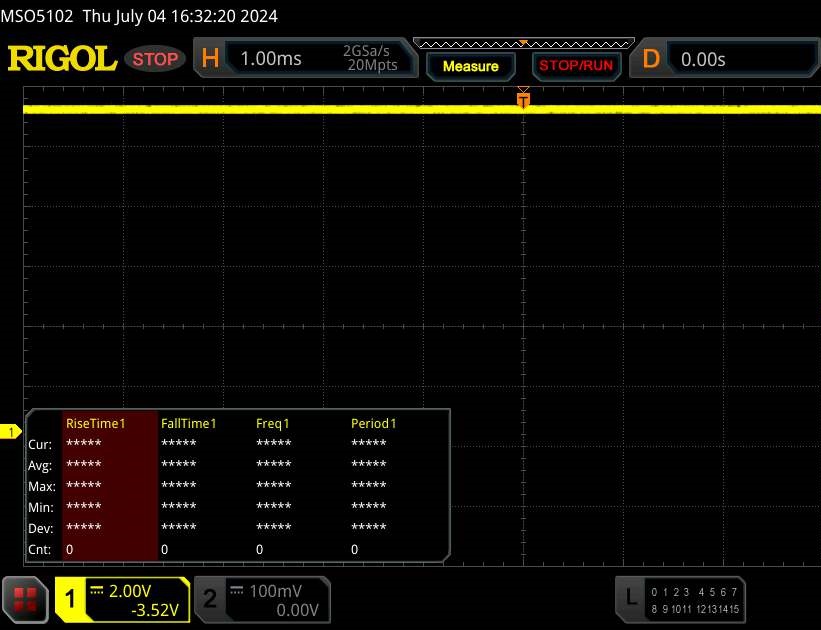 | ||
In comparison: 53 % of all tested devices do not use PWM to dim the display. If PWM was detected, an average of 8527 (minimum: 5 - maximum: 343500) Hz was measured. | |||
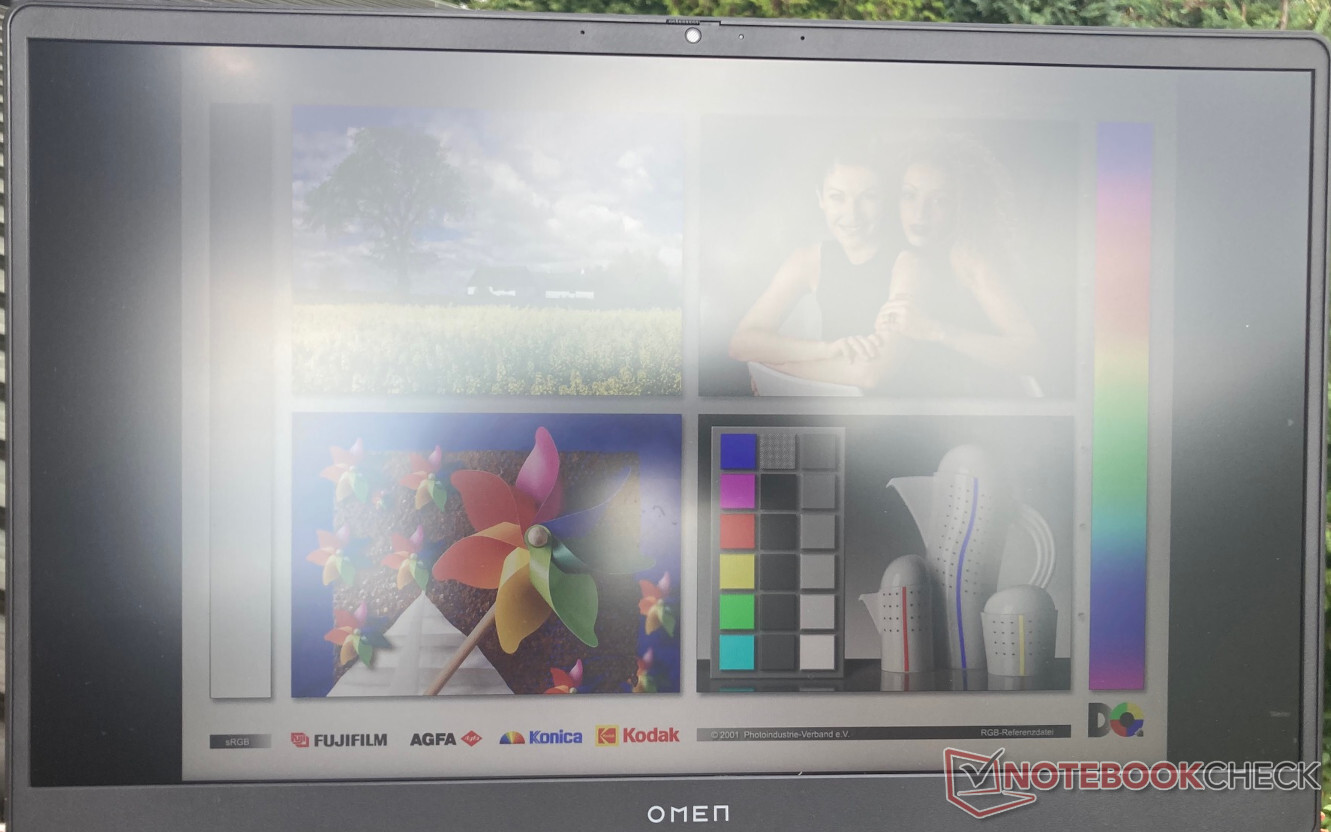
在室外,如果您还想看到屏幕上的任何内容,就一定要坐在阴凉处。Omen 17 的亮度有限,这意味着即使天空稍有阴霾,你也无法看清显示屏上的任何内容。
但即便如此,图像也显得苍白无力。色彩在室外没有活力,被一层灰色的面纱所覆盖。如果你想在色彩绚丽的环境中享受游戏乐趣,就必须在室内进行游戏。

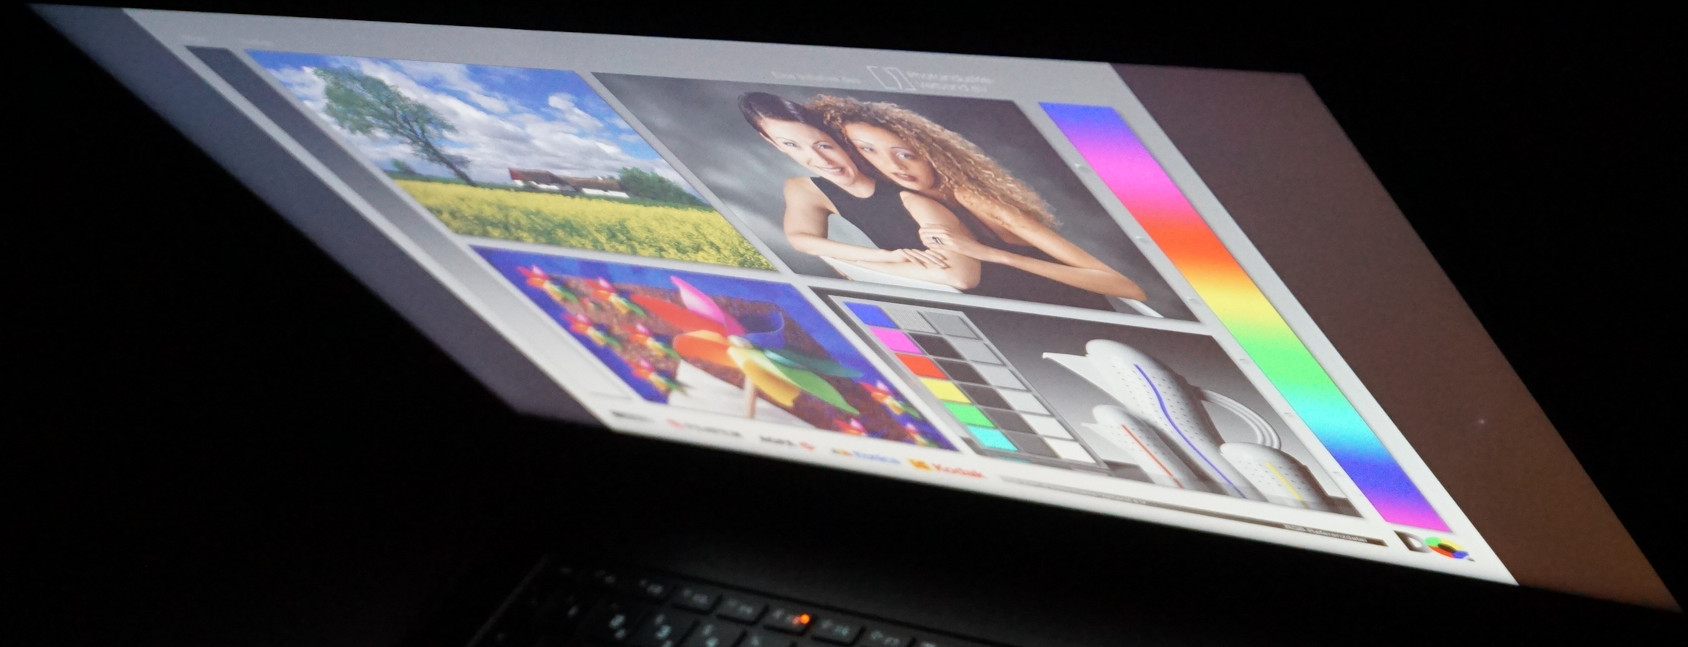
与我们通常在 IPS 面板上看到的情况不同,具有 QHD 分辨率的 HP Omen 从大约 45 度的视角开始就会出现一些明显的色彩变化。在此之前,图像仍然很容易辨认,我们也没有注意到在此之前亮度有任何下降。超过 45 度后,所有颜色都显示出轻微的黄色色调。


性能 - Omen 17 是一款性能均衡的游戏笔记本电脑
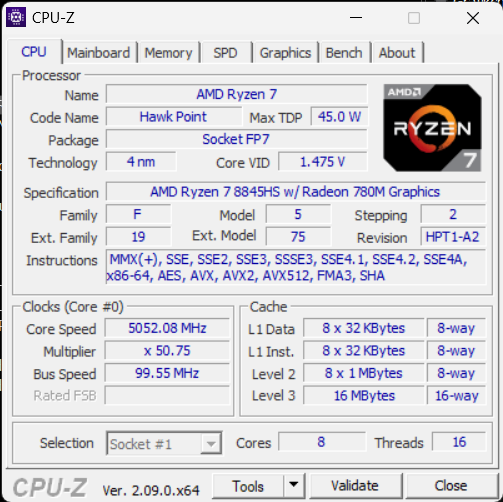
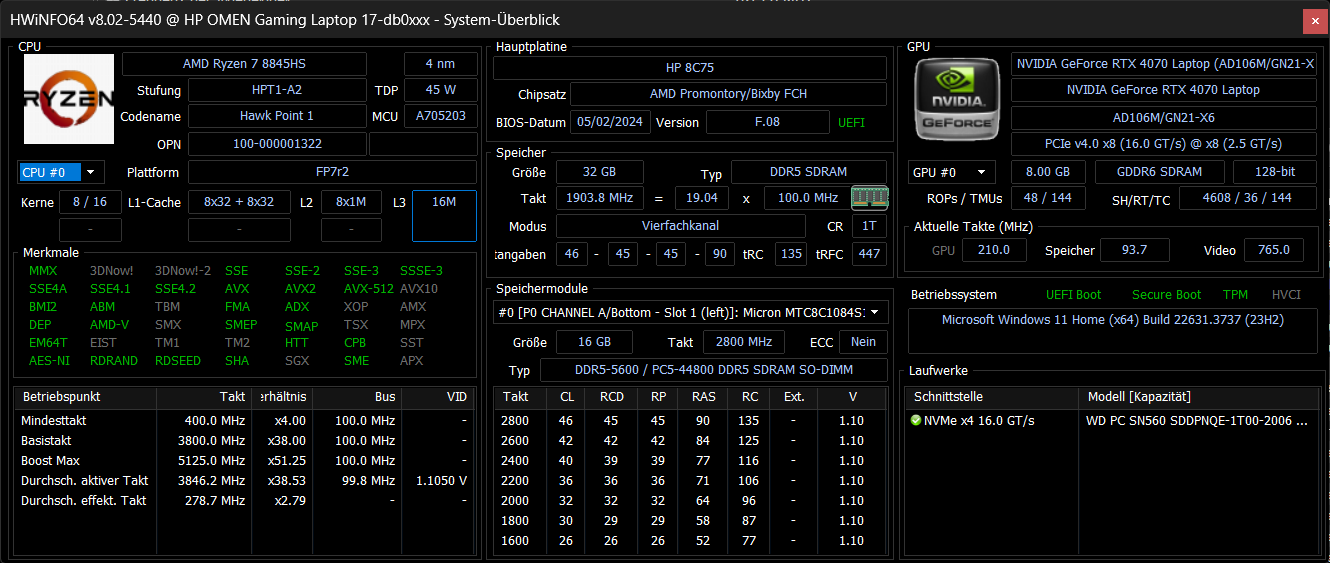
在性能方面,我们的测试机配备了 AMD Ryzen 7 8845HS和 NvidiaGeForce RTX 4070的测试设备在我们的对比设备中处于中等水平。不过,CPU 和 GPU 的性能都略低于其最大潜力。
Ryzen 7 的持续运行功耗为 65 瓦,而不是申克 XMG Core 15 的 70 瓦甚至 80 瓦。 申克 XMG Core 15为例。GPU 也略有节流,只能使用 120 瓦,而不是最大可能的 140 瓦。同类游戏笔记本电脑如 华硕 TUF GAMING A17 FA707等同类游戏笔记本电脑的显卡性能要稍高一些,但这并不是唯一的优势,也不一定会带来明显的帧率提升。
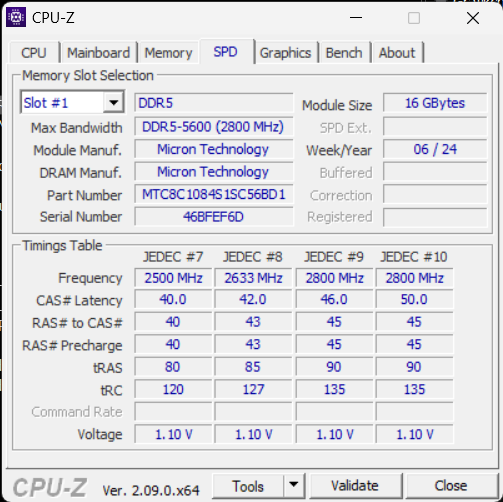
32GB 的 DDR5-5600 内存设备也非常稳固。由于内存可以轻松更换,以后还可以进行扩展。在这个级别上,我们不会因为内存只有 5,600 MHz 而受到限制。
搭载 RTX 4060 的惠普 Omen 17 还有更小的版本。
测试条件
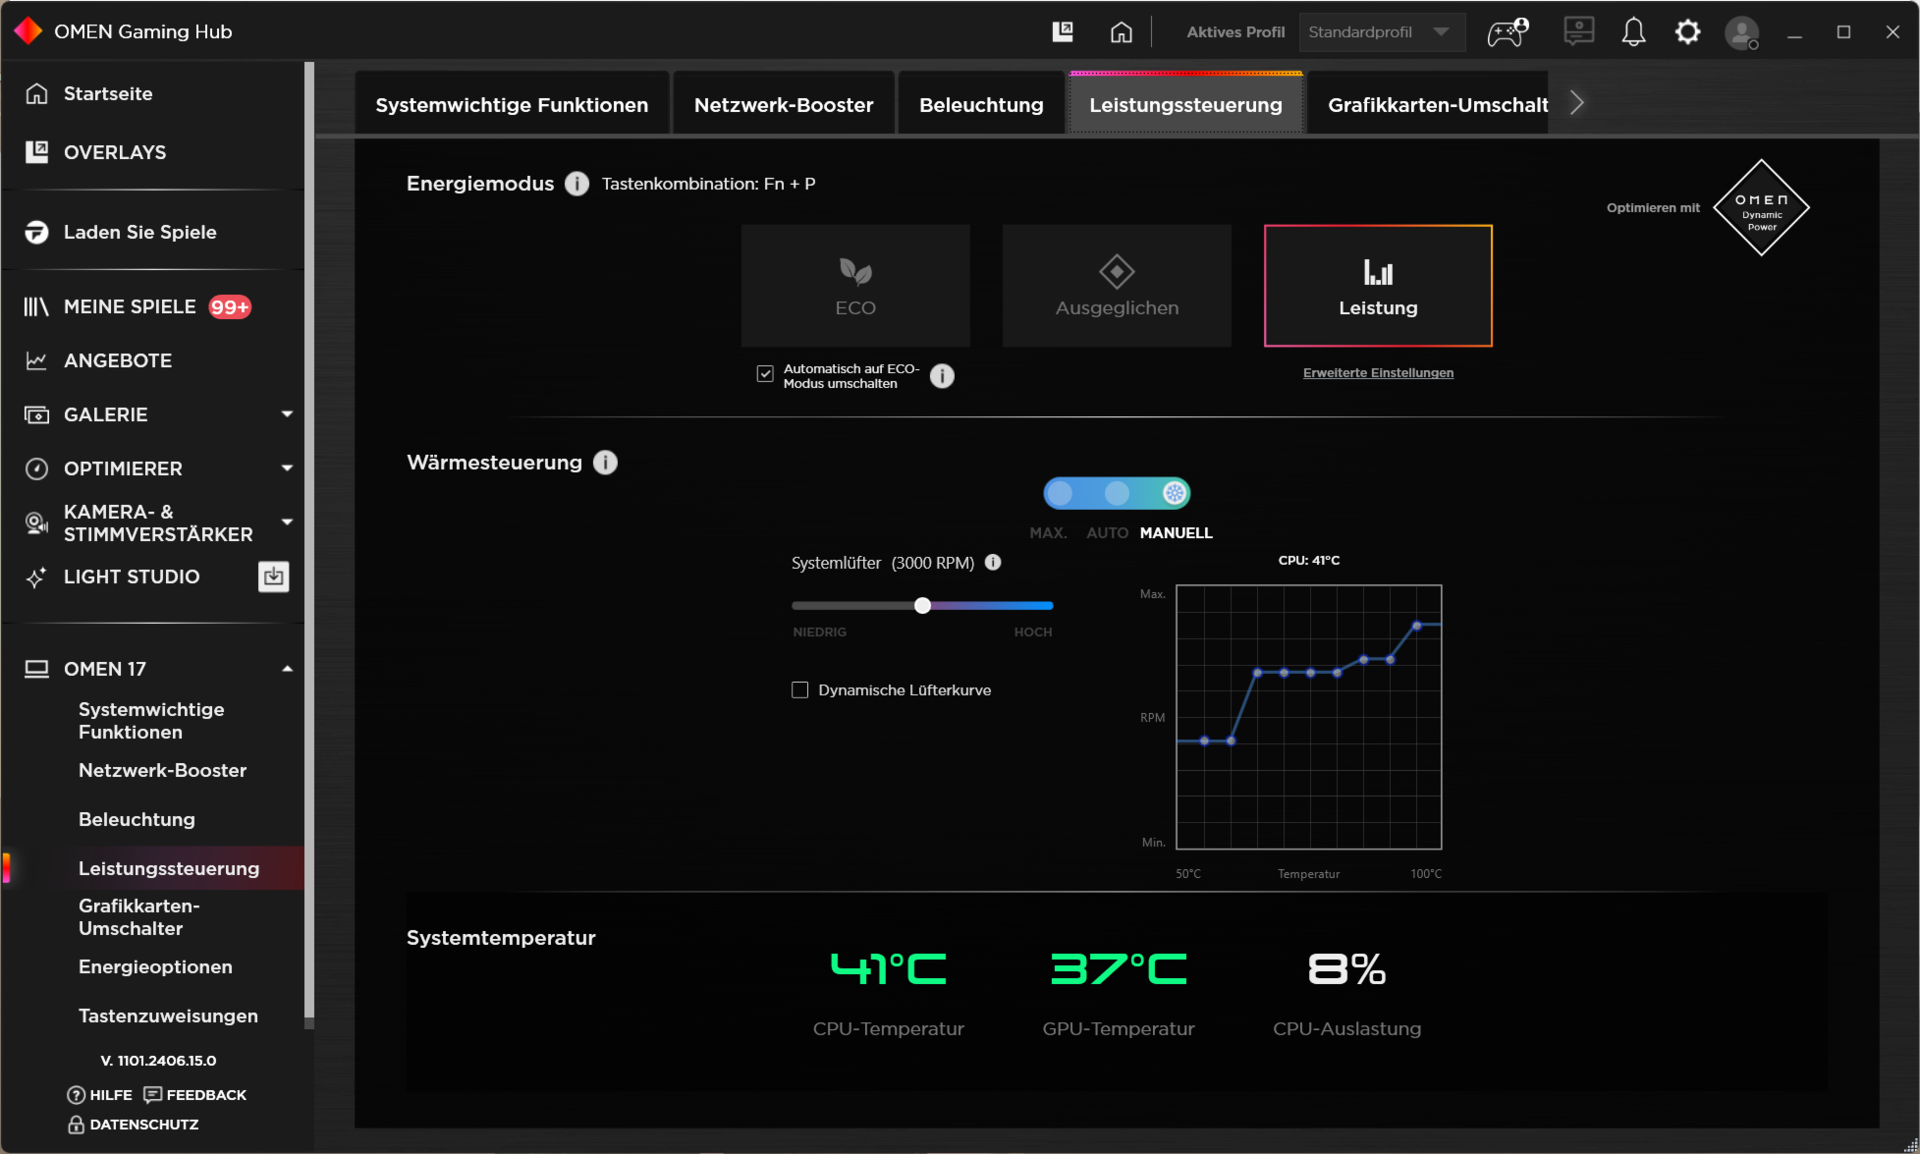
通过三种电源配置文件,您可以调整 Omen 17 以适应大多数典型场景。您可以从下表中了解对功耗、风扇行为和游戏性能的具体影响。
我们使用 "性能 "配置文件进行基准测试。此外,您还可以进行许多对风扇行为有重大影响的调整。例如,可以将风扇级别调整为更大功率,或者即使在最高性能级别也可以大幅降低风扇级别,这将对最高性能产生影响。
| 电源配置文件 | CPU 负载 | GPU 负载(包括 15 瓦提升) | Steel Nomad | 赛博朋克 2077 QHD Ultra | 最大风扇噪音 |
|---|---|---|---|---|---|
| Eco | 65->35 瓦 | 40 瓦 | 24.37 FPS | 60 FPS (Lock) | 41 dB(A) |
| 平衡型 | 65->35 瓦 | 90 瓦 | 25.23 FPS | 75 FPS | 43 dB(A) |
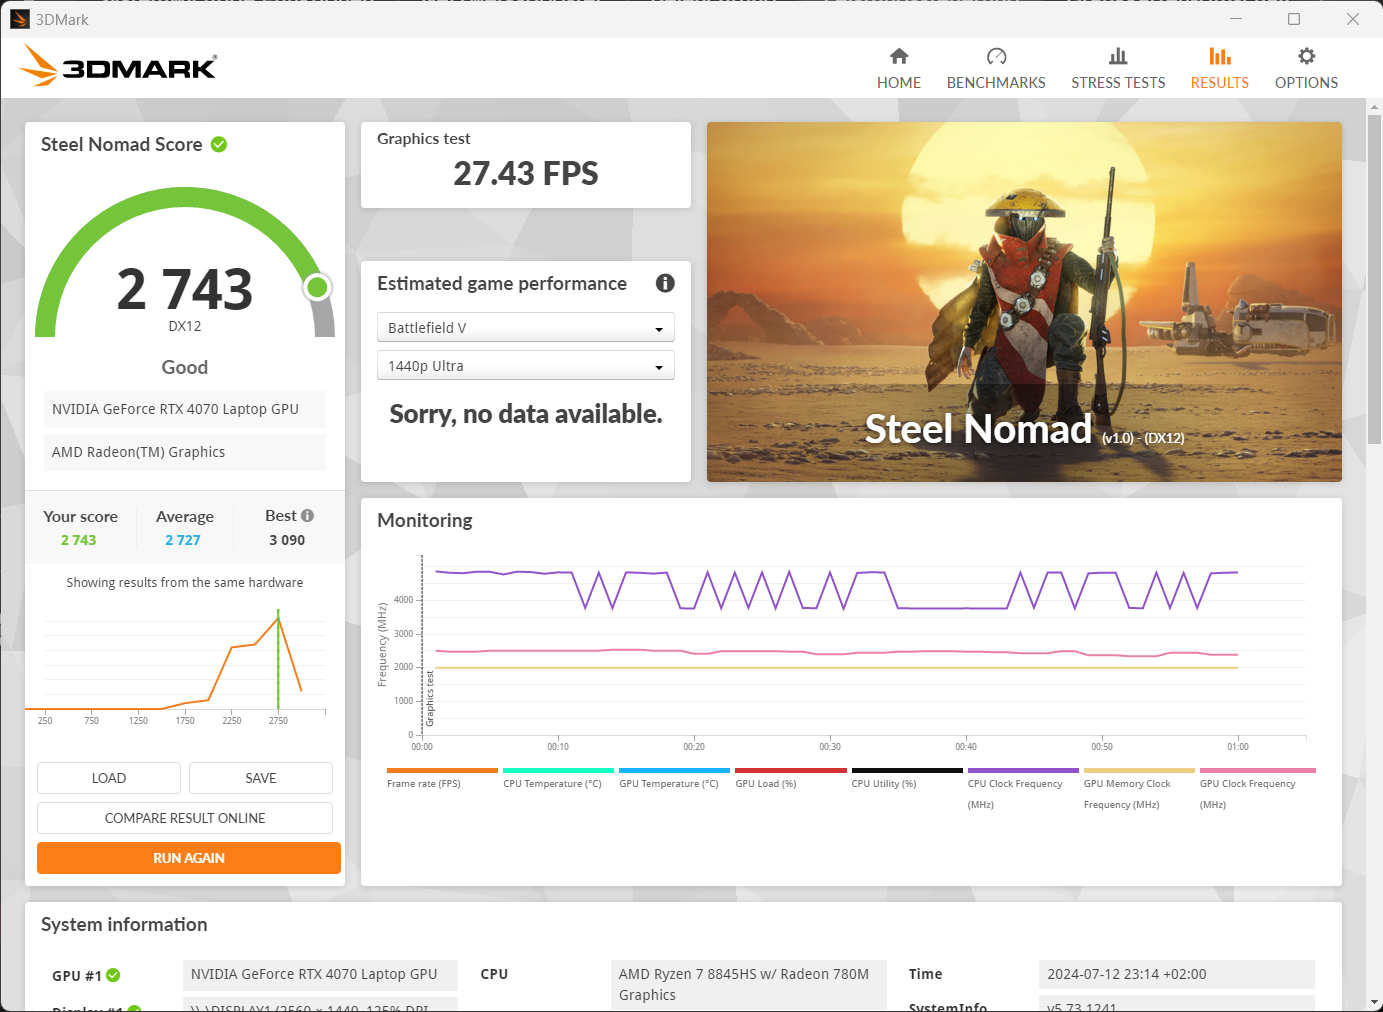
| 性能 | 100->65 瓦 | 120 瓦 | 27.43 FPS | 80 FPS | 48 dB(A) |
处理器
......(英文 AMD Ryzen 7 8845HS是鹰点系列中的一款快速处理器,采用 Zen 4 架构,性能几乎达到了 AMD Ryzen 9 7940HS的性能。它的性能也与 英特尔酷睿 i7-13700H.
不过,Ryzen 7 的 8 个相同内核屡屡能在 i7-13700H 的 6 个性能内核面前取得微弱优势,尤其是在游戏时。
虽然我们几乎总能观察到竞争对手的持续性能略有下降,但这款 CPU 却能持续保持较好的性能水平。
您可以在我们的 CPU 基准测试列表.
Cinebench R15 Multi Constant Load Test
Cinebench R23: Multi Core | Single Core
Cinebench R20: CPU (Multi Core) | CPU (Single Core)
Cinebench R15: CPU Multi 64Bit | CPU Single 64Bit
Blender: v2.79 BMW27 CPU
7-Zip 18.03: 7z b 4 | 7z b 4 -mmt1
Geekbench 6.4: Multi-Core | Single-Core
Geekbench 5.5: Multi-Core | Single-Core
HWBOT x265 Benchmark v2.2: 4k Preset
LibreOffice : 20 Documents To PDF
R Benchmark 2.5: Overall mean
| CPU Performance Rating | |
| Asus ROG Strix Scar 16 G634JZR | |
| Acer Predator Helios Neo 16 (2024) | |
| Average of class Gaming | |
| Asus TUF Gaming A17 FA707XI-NS94 | |
| Asus TUF Gaming A15 FA507UV | |
| Alienware m16 R2 -1! | |
| Average AMD Ryzen 7 8845HS | |
| Tulpar T7 V20.6 | |
| HP Omen 17-db0079ng | |
| Cinebench R23 / Multi Core | |
| Asus ROG Strix Scar 16 G634JZR | |
| Acer Predator Helios Neo 16 (2024) | |
| Average of class Gaming (5668 - 39652, n=151, last 2 years) | |
| Alienware m16 R2 | |
| Tulpar T7 V20.6 | |
| Asus TUF Gaming A17 FA707XI-NS94 | |
| Asus TUF Gaming A15 FA507UV | |
| HP Omen 17-db0079ng | |
| Average AMD Ryzen 7 8845HS (14895 - 18037, n=12) | |
| Cinebench R23 / Single Core | |
| Asus ROG Strix Scar 16 G634JZR | |
| Acer Predator Helios Neo 16 (2024) | |
| Tulpar T7 V20.6 | |
| Average of class Gaming (1136 - 2252, n=151, last 2 years) | |
| Asus TUF Gaming A17 FA707XI-NS94 | |
| Asus TUF Gaming A15 FA507UV | |
| Alienware m16 R2 | |
| Average AMD Ryzen 7 8845HS (1623 - 1783, n=12) | |
| HP Omen 17-db0079ng | |
| Cinebench R20 / CPU (Multi Core) | |
| Asus ROG Strix Scar 16 G634JZR | |
| Acer Predator Helios Neo 16 (2024) | |
| Average of class Gaming (2179 - 15517, n=151, last 2 years) | |
| Alienware m16 R2 | |
| Tulpar T7 V20.6 | |
| Asus TUF Gaming A17 FA707XI-NS94 | |
| Asus TUF Gaming A15 FA507UV | |
| HP Omen 17-db0079ng | |
| Average AMD Ryzen 7 8845HS (5808 - 7026, n=12) | |
| Cinebench R20 / CPU (Single Core) | |
| Asus ROG Strix Scar 16 G634JZR | |
| Acer Predator Helios Neo 16 (2024) | |
| Tulpar T7 V20.6 | |
| Average of class Gaming (439 - 866, n=151, last 2 years) | |
| Asus TUF Gaming A17 FA707XI-NS94 | |
| Average AMD Ryzen 7 8845HS (673 - 698, n=12) | |
| HP Omen 17-db0079ng | |
| Alienware m16 R2 | |
| Asus TUF Gaming A15 FA507UV | |
| Cinebench R15 / CPU Multi 64Bit | |
| Asus ROG Strix Scar 16 G634JZR | |
| Acer Predator Helios Neo 16 (2024) | |
| Average of class Gaming (905 - 6074, n=154, last 2 years) | |
| Alienware m16 R2 | |
| Asus TUF Gaming A17 FA707XI-NS94 | |
| Asus TUF Gaming A15 FA507UV | |
| Tulpar T7 V20.6 | |
| HP Omen 17-db0079ng | |
| Average AMD Ryzen 7 8845HS (2342 - 2908, n=12) | |
| Cinebench R15 / CPU Single 64Bit | |
| Asus ROG Strix Scar 16 G634JZR | |
| Acer Predator Helios Neo 16 (2024) | |
| Asus TUF Gaming A17 FA707XI-NS94 | |
| Asus TUF Gaming A15 FA507UV | |
| Tulpar T7 V20.6 | |
| Average of class Gaming (191.9 - 343, n=151, last 2 years) | |
| Average AMD Ryzen 7 8845HS (269 - 283, n=12) | |
| HP Omen 17-db0079ng | |
| Alienware m16 R2 | |
| Blender / v2.79 BMW27 CPU | |
| Average AMD Ryzen 7 8845HS (179 - 216, n=12) | |
| HP Omen 17-db0079ng | |
| Asus TUF Gaming A17 FA707XI-NS94 | |
| Asus TUF Gaming A15 FA507UV | |
| Average of class Gaming (81 - 555, n=144, last 2 years) | |
| Tulpar T7 V20.6 | |
| Acer Predator Helios Neo 16 (2024) | |
| Asus ROG Strix Scar 16 G634JZR | |
| 7-Zip 18.03 / 7z b 4 | |
| Asus ROG Strix Scar 16 G634JZR | |
| Acer Predator Helios Neo 16 (2024) | |
| Average of class Gaming (23795 - 144064, n=149, last 2 years) | |
| Asus TUF Gaming A15 FA507UV | |
| Asus TUF Gaming A17 FA707XI-NS94 | |
| Average AMD Ryzen 7 8845HS (62669 - 74664, n=12) | |
| Alienware m16 R2 | |
| HP Omen 17-db0079ng | |
| Tulpar T7 V20.6 | |
| 7-Zip 18.03 / 7z b 4 -mmt1 | |
| Asus ROG Strix Scar 16 G634JZR | |
| Acer Predator Helios Neo 16 (2024) | |
| Asus TUF Gaming A17 FA707XI-NS94 | |
| Asus TUF Gaming A15 FA507UV | |
| Average AMD Ryzen 7 8845HS (5197 - 6714, n=12) | |
| Average of class Gaming (4199 - 7573, n=149, last 2 years) | |
| Tulpar T7 V20.6 | |
| HP Omen 17-db0079ng | |
| Alienware m16 R2 | |
| Geekbench 6.4 / Multi-Core | |
| Asus ROG Strix Scar 16 G634JZR | |
| Acer Predator Helios Neo 16 (2024) | |
| Average of class Gaming (5340 - 21668, n=119, last 2 years) | |
| Average AMD Ryzen 7 8845HS (11073 - 14014, n=16) | |
| HP Omen 17-db0079ng | |
| Alienware m16 R2 | |
| Asus TUF Gaming A15 FA507UV | |
| Asus TUF Gaming A17 FA707XI-NS94 | |
| Tulpar T7 V20.6 | |
| Geekbench 6.4 / Single-Core | |
| Asus ROG Strix Scar 16 G634JZR | |
| Acer Predator Helios Neo 16 (2024) | |
| Asus TUF Gaming A17 FA707XI-NS94 | |
| Asus TUF Gaming A15 FA507UV | |
| Average of class Gaming (1490 - 3219, n=119, last 2 years) | |
| Average AMD Ryzen 7 8845HS (2510 - 2698, n=14) | |
| Tulpar T7 V20.6 | |
| HP Omen 17-db0079ng | |
| Alienware m16 R2 | |
| Geekbench 5.5 / Multi-Core | |
| Asus ROG Strix Scar 16 G634JZR | |
| Acer Predator Helios Neo 16 (2024) | |
| Average of class Gaming (4557 - 25855, n=148, last 2 years) | |
| Alienware m16 R2 | |
| Asus TUF Gaming A15 FA507UV | |
| HP Omen 17-db0079ng | |
| Average AMD Ryzen 7 8845HS (11256 - 12726, n=13) | |
| Asus TUF Gaming A17 FA707XI-NS94 | |
| Tulpar T7 V20.6 | |
| Geekbench 5.5 / Single-Core | |
| Asus ROG Strix Scar 16 G634JZR | |
| Acer Predator Helios Neo 16 (2024) | |
| Asus TUF Gaming A17 FA707XI-NS94 | |
| Asus TUF Gaming A15 FA507UV | |
| Average AMD Ryzen 7 8845HS (1765 - 2004, n=13) | |
| Average of class Gaming (986 - 2423, n=148, last 2 years) | |
| Tulpar T7 V20.6 | |
| HP Omen 17-db0079ng | |
| Alienware m16 R2 | |
| HWBOT x265 Benchmark v2.2 / 4k Preset | |
| Asus ROG Strix Scar 16 G634JZR | |
| Acer Predator Helios Neo 16 (2024) | |
| Average of class Gaming (6.72 - 42.9, n=148, last 2 years) | |
| Asus TUF Gaming A15 FA507UV | |
| Asus TUF Gaming A17 FA707XI-NS94 | |
| Alienware m16 R2 | |
| Average AMD Ryzen 7 8845HS (18.6 - 22.7, n=12) | |
| HP Omen 17-db0079ng | |
| Tulpar T7 V20.6 | |
| LibreOffice / 20 Documents To PDF | |
| HP Omen 17-db0079ng | |
| Tulpar T7 V20.6 | |
| Average AMD Ryzen 7 8845HS (44.4 - 77, n=12) | |
| Alienware m16 R2 | |
| Asus TUF Gaming A17 FA707XI-NS94 | |
| Asus ROG Strix Scar 16 G634JZR | |
| Average of class Gaming (19 - 96.6, n=147, last 2 years) | |
| Asus TUF Gaming A15 FA507UV | |
| Acer Predator Helios Neo 16 (2024) | |
| R Benchmark 2.5 / Overall mean | |
| HP Omen 17-db0079ng | |
| Alienware m16 R2 | |
| Average AMD Ryzen 7 8845HS (0.4304 - 0.4935, n=12) | |
| Tulpar T7 V20.6 | |
| Average of class Gaming (0.3609 - 0.759, n=150, last 2 years) | |
| Asus TUF Gaming A15 FA507UV | |
| Asus TUF Gaming A17 FA707XI-NS94 | |
| Acer Predator Helios Neo 16 (2024) | |
| Asus ROG Strix Scar 16 G634JZR | |
* ... smaller is better
AIDA64: FP32 Ray-Trace | FPU Julia | CPU SHA3 | CPU Queen | FPU SinJulia | FPU Mandel | CPU AES | CPU ZLib | FP64 Ray-Trace | CPU PhotoWorxx
| Performance Rating | |
| Asus ROG Strix Scar 16 G634JZR | |
| Asus TUF Gaming A15 FA507UV | |
| Asus TUF Gaming A17 FA707XI-NS94 | |
| Acer Predator Helios Neo 16 (2024) | |
| HP Omen 17-db0079ng | |
| Average AMD Ryzen 7 8845HS | |
| Average of class Gaming | |
| Alienware m16 R2 | |
| Tulpar T7 V20.6 | |
| AIDA64 / FP32 Ray-Trace | |
| Asus TUF Gaming A17 FA707XI-NS94 | |
| Asus TUF Gaming A15 FA507UV | |
| HP Omen 17-db0079ng | |
| Asus ROG Strix Scar 16 G634JZR | |
| Average AMD Ryzen 7 8845HS (23708 - 29544, n=12) | |
| Average of class Gaming (4986 - 81639, n=147, last 2 years) | |
| Acer Predator Helios Neo 16 (2024) | |
| Alienware m16 R2 | |
| Tulpar T7 V20.6 | |
| AIDA64 / FPU Julia | |
| Asus ROG Strix Scar 16 G634JZR | |
| Asus TUF Gaming A17 FA707XI-NS94 | |
| Asus TUF Gaming A15 FA507UV | |
| HP Omen 17-db0079ng | |
| Average AMD Ryzen 7 8845HS (99659 - 125873, n=12) | |
| Acer Predator Helios Neo 16 (2024) | |
| Average of class Gaming (25360 - 252486, n=147, last 2 years) | |
| Alienware m16 R2 | |
| Tulpar T7 V20.6 | |
| AIDA64 / CPU SHA3 | |
| Asus ROG Strix Scar 16 G634JZR | |
| Asus TUF Gaming A17 FA707XI-NS94 | |
| Asus TUF Gaming A15 FA507UV | |
| Acer Predator Helios Neo 16 (2024) | |
| Average of class Gaming (1339 - 10389, n=147, last 2 years) | |
| HP Omen 17-db0079ng | |
| Average AMD Ryzen 7 8845HS (4332 - 5180, n=12) | |
| Alienware m16 R2 | |
| Tulpar T7 V20.6 | |
| AIDA64 / CPU Queen | |
| Acer Predator Helios Neo 16 (2024) | |
| Asus ROG Strix Scar 16 G634JZR | |
| Asus TUF Gaming A15 FA507UV | |
| Asus TUF Gaming A17 FA707XI-NS94 | |
| Average AMD Ryzen 7 8845HS (109458 - 124695, n=12) | |
| HP Omen 17-db0079ng | |
| Average of class Gaming (50699 - 200651, n=147, last 2 years) | |
| Tulpar T7 V20.6 | |
| Alienware m16 R2 | |
| AIDA64 / FPU SinJulia | |
| Asus ROG Strix Scar 16 G634JZR | |
| Asus TUF Gaming A15 FA507UV | |
| Asus TUF Gaming A17 FA707XI-NS94 | |
| HP Omen 17-db0079ng | |
| Average AMD Ryzen 7 8845HS (14062 - 15519, n=12) | |
| Acer Predator Helios Neo 16 (2024) | |
| Average of class Gaming (4800 - 32988, n=147, last 2 years) | |
| Tulpar T7 V20.6 | |
| Alienware m16 R2 | |
| AIDA64 / FPU Mandel | |
| Asus TUF Gaming A17 FA707XI-NS94 | |
| Asus TUF Gaming A15 FA507UV | |
| Asus ROG Strix Scar 16 G634JZR | |
| HP Omen 17-db0079ng | |
| Average AMD Ryzen 7 8845HS (53436 - 67367, n=12) | |
| Acer Predator Helios Neo 16 (2024) | |
| Average of class Gaming (12321 - 134044, n=147, last 2 years) | |
| Alienware m16 R2 | |
| Tulpar T7 V20.6 | |
| AIDA64 / CPU AES | |
| Asus ROG Strix Scar 16 G634JZR | |
| Average of class Gaming (19065 - 328679, n=147, last 2 years) | |
| Acer Predator Helios Neo 16 (2024) | |
| Average AMD Ryzen 7 8845HS (64515 - 172642, n=12) | |
| Asus TUF Gaming A17 FA707XI-NS94 | |
| Asus TUF Gaming A15 FA507UV | |
| HP Omen 17-db0079ng | |
| Alienware m16 R2 | |
| Tulpar T7 V20.6 | |
| AIDA64 / CPU ZLib | |
| Asus ROG Strix Scar 16 G634JZR | |
| Acer Predator Helios Neo 16 (2024) | |
| Average of class Gaming (373 - 2531, n=147, last 2 years) | |
| Alienware m16 R2 | |
| Tulpar T7 V20.6 | |
| Asus TUF Gaming A17 FA707XI-NS94 | |
| Asus TUF Gaming A15 FA507UV | |
| HP Omen 17-db0079ng | |
| Average AMD Ryzen 7 8845HS (627 - 1080, n=12) | |
| AIDA64 / FP64 Ray-Trace | |
| Asus TUF Gaming A17 FA707XI-NS94 | |
| Asus TUF Gaming A15 FA507UV | |
| HP Omen 17-db0079ng | |
| Asus ROG Strix Scar 16 G634JZR | |
| Average AMD Ryzen 7 8845HS (12361 - 15911, n=12) | |
| Average of class Gaming (2540 - 43430, n=147, last 2 years) | |
| Acer Predator Helios Neo 16 (2024) | |
| Alienware m16 R2 | |
| Tulpar T7 V20.6 | |
| AIDA64 / CPU PhotoWorxx | |
| Asus ROG Strix Scar 16 G634JZR | |
| Acer Predator Helios Neo 16 (2024) | |
| HP Omen 17-db0079ng | |
| Average of class Gaming (10805 - 60161, n=147, last 2 years) | |
| Alienware m16 R2 | |
| Average AMD Ryzen 7 8845HS (33192 - 41668, n=12) | |
| Asus TUF Gaming A15 FA507UV | |
| Asus TUF Gaming A17 FA707XI-NS94 | |
| Tulpar T7 V20.6 | |
系统性能
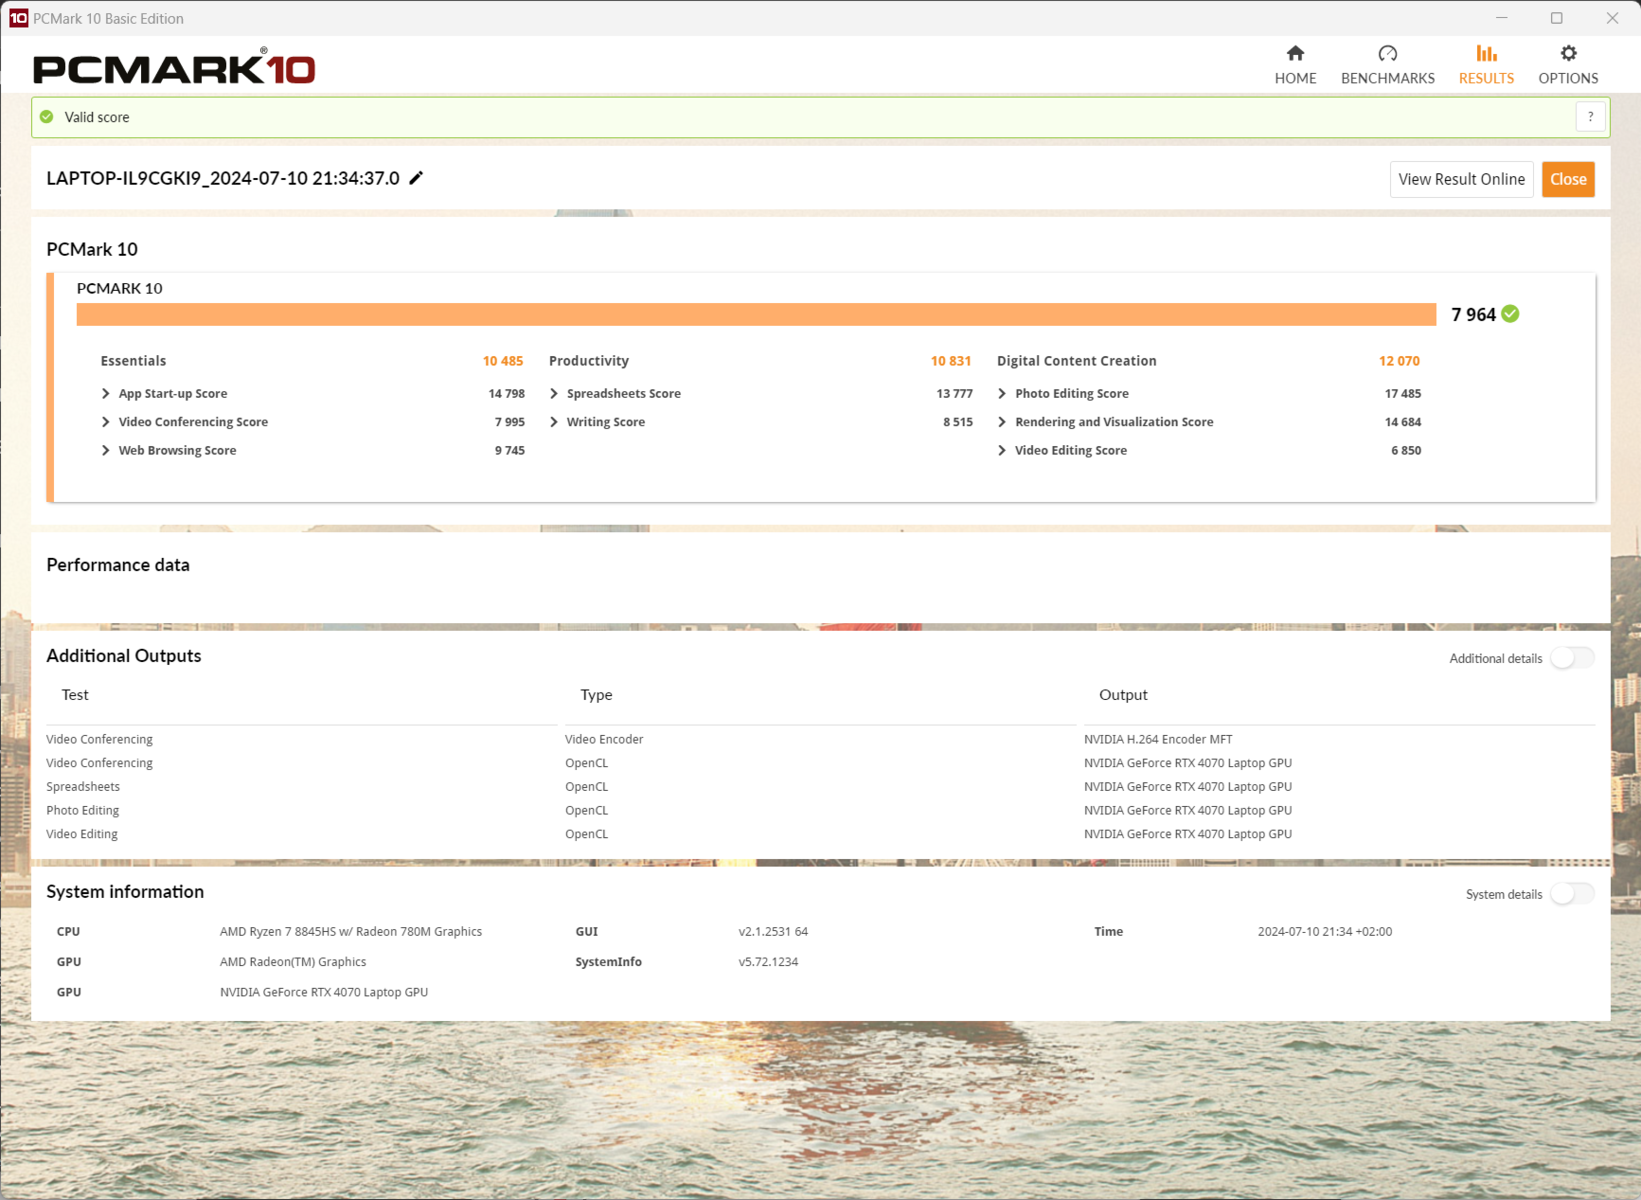
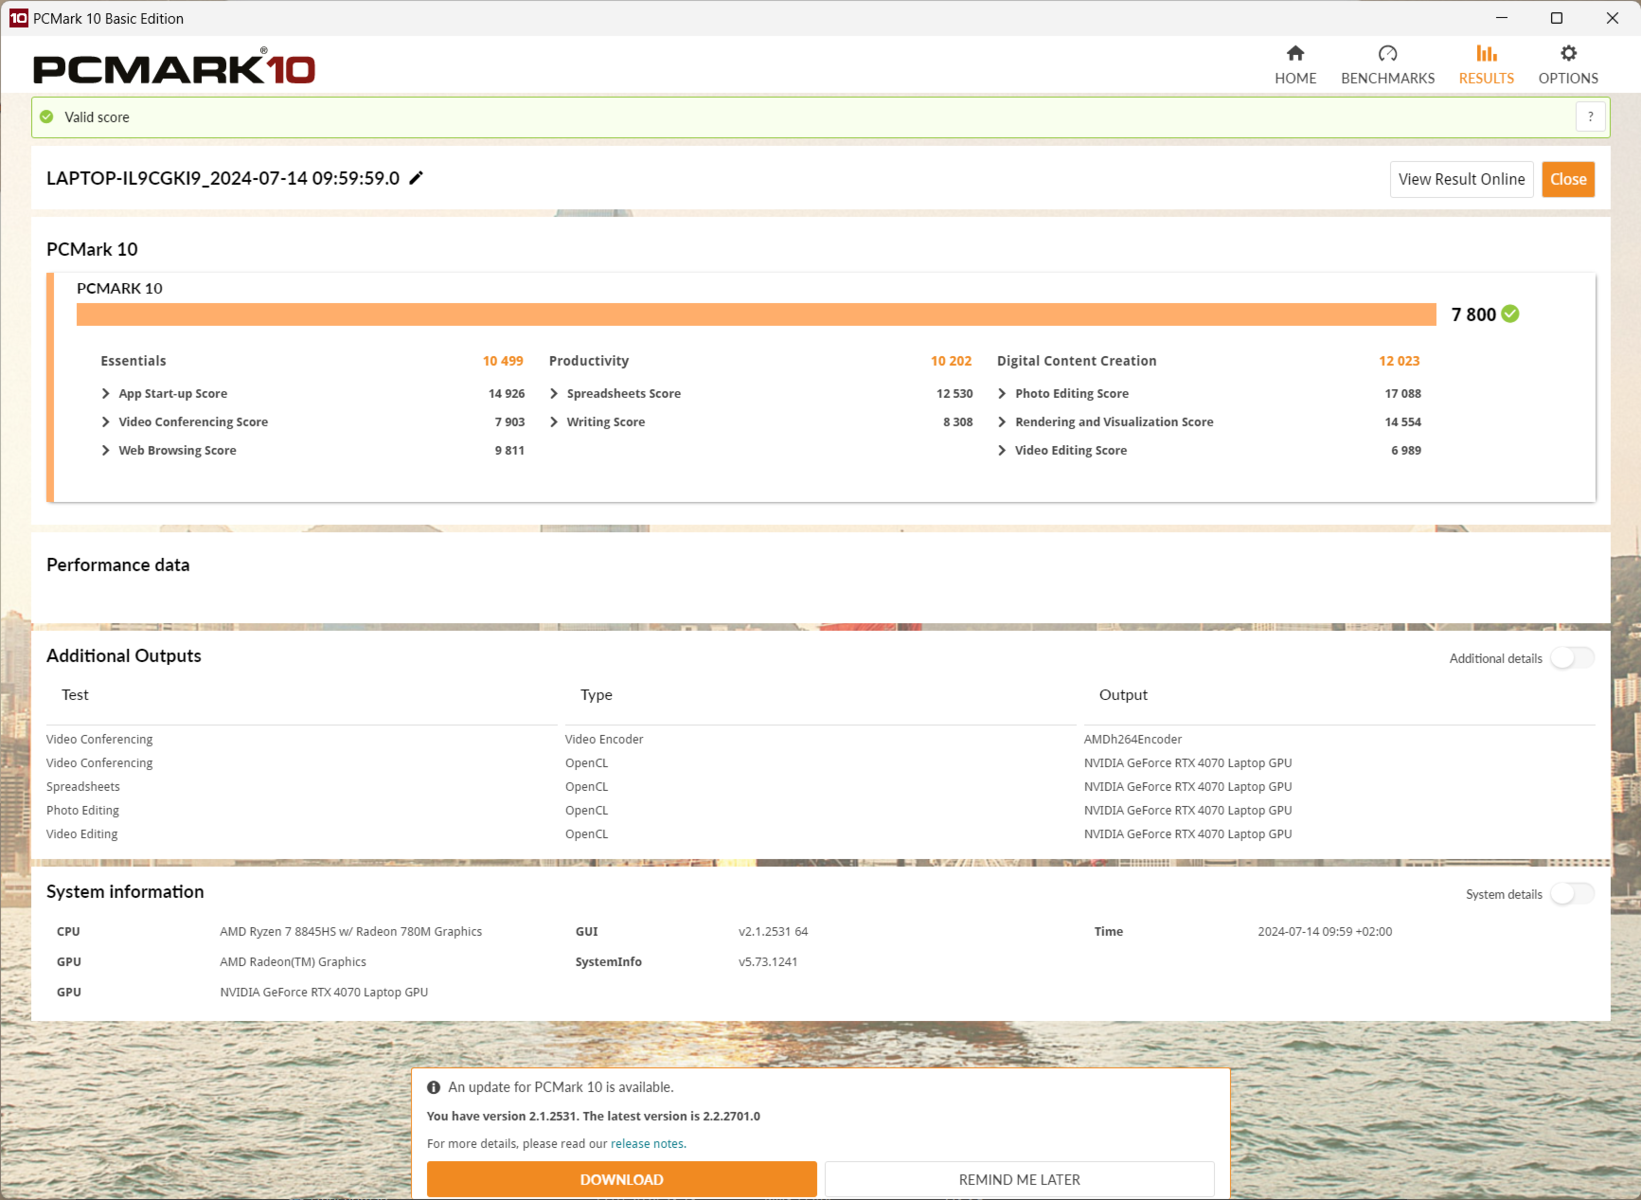
在我们使用 PCMark 10 和其他一些类似基准进行评估的日常任务中,与同类系统基本没有明显差异。虽然表格中的最高值和最低值仅相差 10%,但其数值与配置更强的 Ryzen 7 8845HS 不相上下,在竞争对手中处于中等水平。
这款笔记本电脑的响应速度一直很高,在安装过程中或同时打开多个程序时都不会出现任何等待时间。即使在玩要求较高的游戏时,也可以继续切换到另一个应用程序,不过很少建议这样做。

CrossMark: Overall | Productivity | Creativity | Responsiveness
WebXPRT 3: Overall
WebXPRT 4: Overall
Mozilla Kraken 1.1: Total
| PCMark 10 / Score | |
| Acer Predator Helios Neo 16 (2024) | |
| Asus TUF Gaming A17 FA707XI-NS94 | |
| Asus TUF Gaming A15 FA507UV | |
| Average AMD Ryzen 7 8845HS, NVIDIA GeForce RTX 4070 Laptop GPU (7800 - 8070, n=2) | |
| Average of class Gaming (5776 - 9852, n=133, last 2 years) | |
| HP Omen 17-db0079ng | |
| Alienware m16 R2 | |
| Asus ROG Strix Scar 16 G634JZR | |
| Tulpar T7 V20.6 | |
| PCMark 10 / Essentials | |
| Acer Predator Helios Neo 16 (2024) | |
| Asus ROG Strix Scar 16 G634JZR | |
| Tulpar T7 V20.6 | |
| Asus TUF Gaming A17 FA707XI-NS94 | |
| Asus TUF Gaming A15 FA507UV | |
| Average of class Gaming (9057 - 12600, n=133, last 2 years) | |
| Average AMD Ryzen 7 8845HS, NVIDIA GeForce RTX 4070 Laptop GPU (10499 - 10664, n=2) | |
| HP Omen 17-db0079ng | |
| Alienware m16 R2 | |
| PCMark 10 / Productivity | |
| Acer Predator Helios Neo 16 (2024) | |
| Asus TUF Gaming A15 FA507UV | |
| HP Omen 17-db0079ng | |
| Average AMD Ryzen 7 8845HS, NVIDIA GeForce RTX 4070 Laptop GPU (9887 - 10202, n=2) | |
| Average of class Gaming (6662 - 14612, n=133, last 2 years) | |
| Tulpar T7 V20.6 | |
| Asus TUF Gaming A17 FA707XI-NS94 | |
| Alienware m16 R2 | |
| Asus ROG Strix Scar 16 G634JZR | |
| PCMark 10 / Digital Content Creation | |
| Asus ROG Strix Scar 16 G634JZR | |
| Asus TUF Gaming A17 FA707XI-NS94 | |
| Alienware m16 R2 | |
| Acer Predator Helios Neo 16 (2024) | |
| Average AMD Ryzen 7 8845HS, NVIDIA GeForce RTX 4070 Laptop GPU (12023 - 13528, n=2) | |
| Average of class Gaming (6807 - 18475, n=133, last 2 years) | |
| Asus TUF Gaming A15 FA507UV | |
| HP Omen 17-db0079ng | |
| Tulpar T7 V20.6 | |
| CrossMark / Overall | |
| Acer Predator Helios Neo 16 (2024) | |
| Asus ROG Strix Scar 16 G634JZR | |
| Average of class Gaming (1247 - 2344, n=114, last 2 years) | |
| Asus TUF Gaming A15 FA507UV | |
| Asus TUF Gaming A17 FA707XI-NS94 | |
| Alienware m16 R2 | |
| Tulpar T7 V20.6 | |
| Average AMD Ryzen 7 8845HS, NVIDIA GeForce RTX 4070 Laptop GPU (1531 - 1790, n=2) | |
| HP Omen 17-db0079ng | |
| CrossMark / Productivity | |
| Acer Predator Helios Neo 16 (2024) | |
| Asus ROG Strix Scar 16 G634JZR | |
| Average of class Gaming (1299 - 2204, n=114, last 2 years) | |
| Asus TUF Gaming A15 FA507UV | |
| Asus TUF Gaming A17 FA707XI-NS94 | |
| Tulpar T7 V20.6 | |
| Alienware m16 R2 | |
| Average AMD Ryzen 7 8845HS, NVIDIA GeForce RTX 4070 Laptop GPU (1488 - 1720, n=2) | |
| HP Omen 17-db0079ng | |
| CrossMark / Creativity | |
| Acer Predator Helios Neo 16 (2024) | |
| Asus ROG Strix Scar 16 G634JZR | |
| Average of class Gaming (1275 - 2660, n=114, last 2 years) | |
| Asus TUF Gaming A17 FA707XI-NS94 | |
| Asus TUF Gaming A15 FA507UV | |
| Alienware m16 R2 | |
| Tulpar T7 V20.6 | |
| Average AMD Ryzen 7 8845HS, NVIDIA GeForce RTX 4070 Laptop GPU (1683 - 1932, n=2) | |
| HP Omen 17-db0079ng | |
| CrossMark / Responsiveness | |
| Acer Predator Helios Neo 16 (2024) | |
| Asus ROG Strix Scar 16 G634JZR | |
| Average of class Gaming (1030 - 2330, n=114, last 2 years) | |
| Asus TUF Gaming A15 FA507UV | |
| Alienware m16 R2 | |
| Tulpar T7 V20.6 | |
| Asus TUF Gaming A17 FA707XI-NS94 | |
| Average AMD Ryzen 7 8845HS, NVIDIA GeForce RTX 4070 Laptop GPU (1255 - 1603, n=2) | |
| HP Omen 17-db0079ng | |
| WebXPRT 3 / Overall | |
| Acer Predator Helios Neo 16 (2024) | |
| Asus TUF Gaming A17 FA707XI-NS94 | |
| Asus ROG Strix Scar 16 G634JZR | |
| Asus TUF Gaming A15 FA507UV | |
| Average of class Gaming (215 - 480, n=127, last 2 years) | |
| Alienware m16 R2 | |
| Tulpar T7 V20.6 | |
| Average AMD Ryzen 7 8845HS, NVIDIA GeForce RTX 4070 Laptop GPU (275 - 312, n=2) | |
| HP Omen 17-db0079ng | |
| WebXPRT 4 / Overall | |
| Asus ROG Strix Scar 16 G634JZR | |
| Acer Predator Helios Neo 16 (2024) | |
| Tulpar T7 V20.6 | |
| Asus TUF Gaming A17 FA707XI-NS94 | |
| Average AMD Ryzen 7 8845HS, NVIDIA GeForce RTX 4070 Laptop GPU (n=1) | |
| Average of class Gaming (176.4 - 335, n=115, last 2 years) | |
| Asus TUF Gaming A15 FA507UV | |
| Alienware m16 R2 | |
| Mozilla Kraken 1.1 / Total | |
| HP Omen 17-db0079ng | |
| Alienware m16 R2 | |
| Average AMD Ryzen 7 8845HS, NVIDIA GeForce RTX 4070 Laptop GPU (500 - 564, n=2) | |
| Asus TUF Gaming A15 FA507UV | |
| Average of class Gaming (409 - 674, n=139, last 2 years) | |
| Tulpar T7 V20.6 | |
| Asus TUF Gaming A17 FA707XI-NS94 | |
| Acer Predator Helios Neo 16 (2024) | |
| Asus ROG Strix Scar 16 G634JZR | |
* ... smaller is better
| PCMark 10 Score | 7800 points | |
Help | ||
| AIDA64 / Memory Copy | |
| Asus ROG Strix Scar 16 G634JZR | |
| Acer Predator Helios Neo 16 (2024) | |
| HP Omen 17-db0079ng | |
| Average AMD Ryzen 7 8845HS (61459 - 71873, n=12) | |
| Average of class Gaming (21750 - 97515, n=147, last 2 years) | |
| Alienware m16 R2 | |
| Asus TUF Gaming A15 FA507UV | |
| Asus TUF Gaming A17 FA707XI-NS94 | |
| Tulpar T7 V20.6 | |
| AIDA64 / Memory Read | |
| Asus ROG Strix Scar 16 G634JZR | |
| Acer Predator Helios Neo 16 (2024) | |
| Alienware m16 R2 | |
| Average of class Gaming (22956 - 102937, n=147, last 2 years) | |
| Asus TUF Gaming A15 FA507UV | |
| Asus TUF Gaming A17 FA707XI-NS94 | |
| HP Omen 17-db0079ng | |
| Average AMD Ryzen 7 8845HS (49866 - 61976, n=12) | |
| Tulpar T7 V20.6 | |
| AIDA64 / Memory Write | |
| HP Omen 17-db0079ng | |
| Average AMD Ryzen 7 8845HS (68425 - 93239, n=12) | |
| Asus TUF Gaming A15 FA507UV | |
| Asus ROG Strix Scar 16 G634JZR | |
| Asus TUF Gaming A17 FA707XI-NS94 | |
| Acer Predator Helios Neo 16 (2024) | |
| Average of class Gaming (22297 - 108954, n=147, last 2 years) | |
| Alienware m16 R2 | |
| Tulpar T7 V20.6 | |
| AIDA64 / Memory Latency | |
| Alienware m16 R2 | |
| HP Omen 17-db0079ng | |
| Average AMD Ryzen 7 8845HS (82.5 - 117, n=12) | |
| Average of class Gaming (59.5 - 259, n=147, last 2 years) | |
| Asus TUF Gaming A15 FA507UV | |
| Asus TUF Gaming A17 FA707XI-NS94 | |
| Acer Predator Helios Neo 16 (2024) | |
| Tulpar T7 V20.6 | |
| Asus ROG Strix Scar 16 G634JZR | |
* ... smaller is better
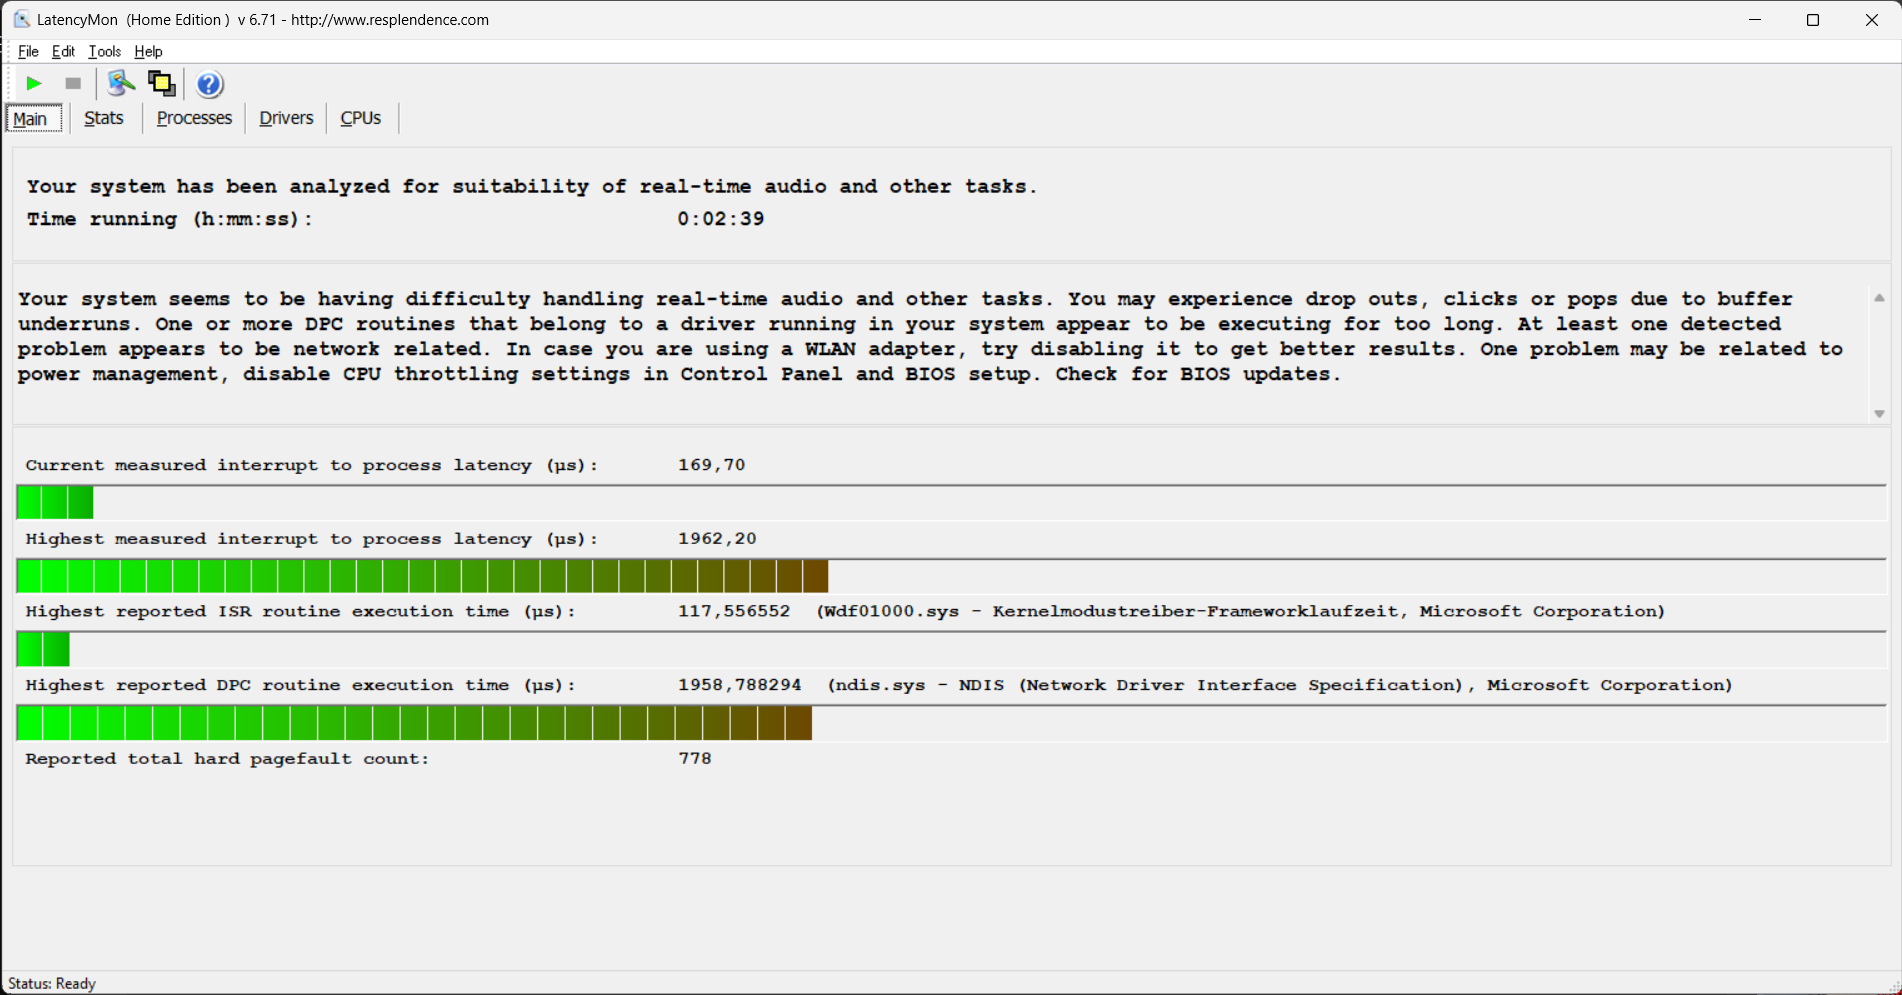
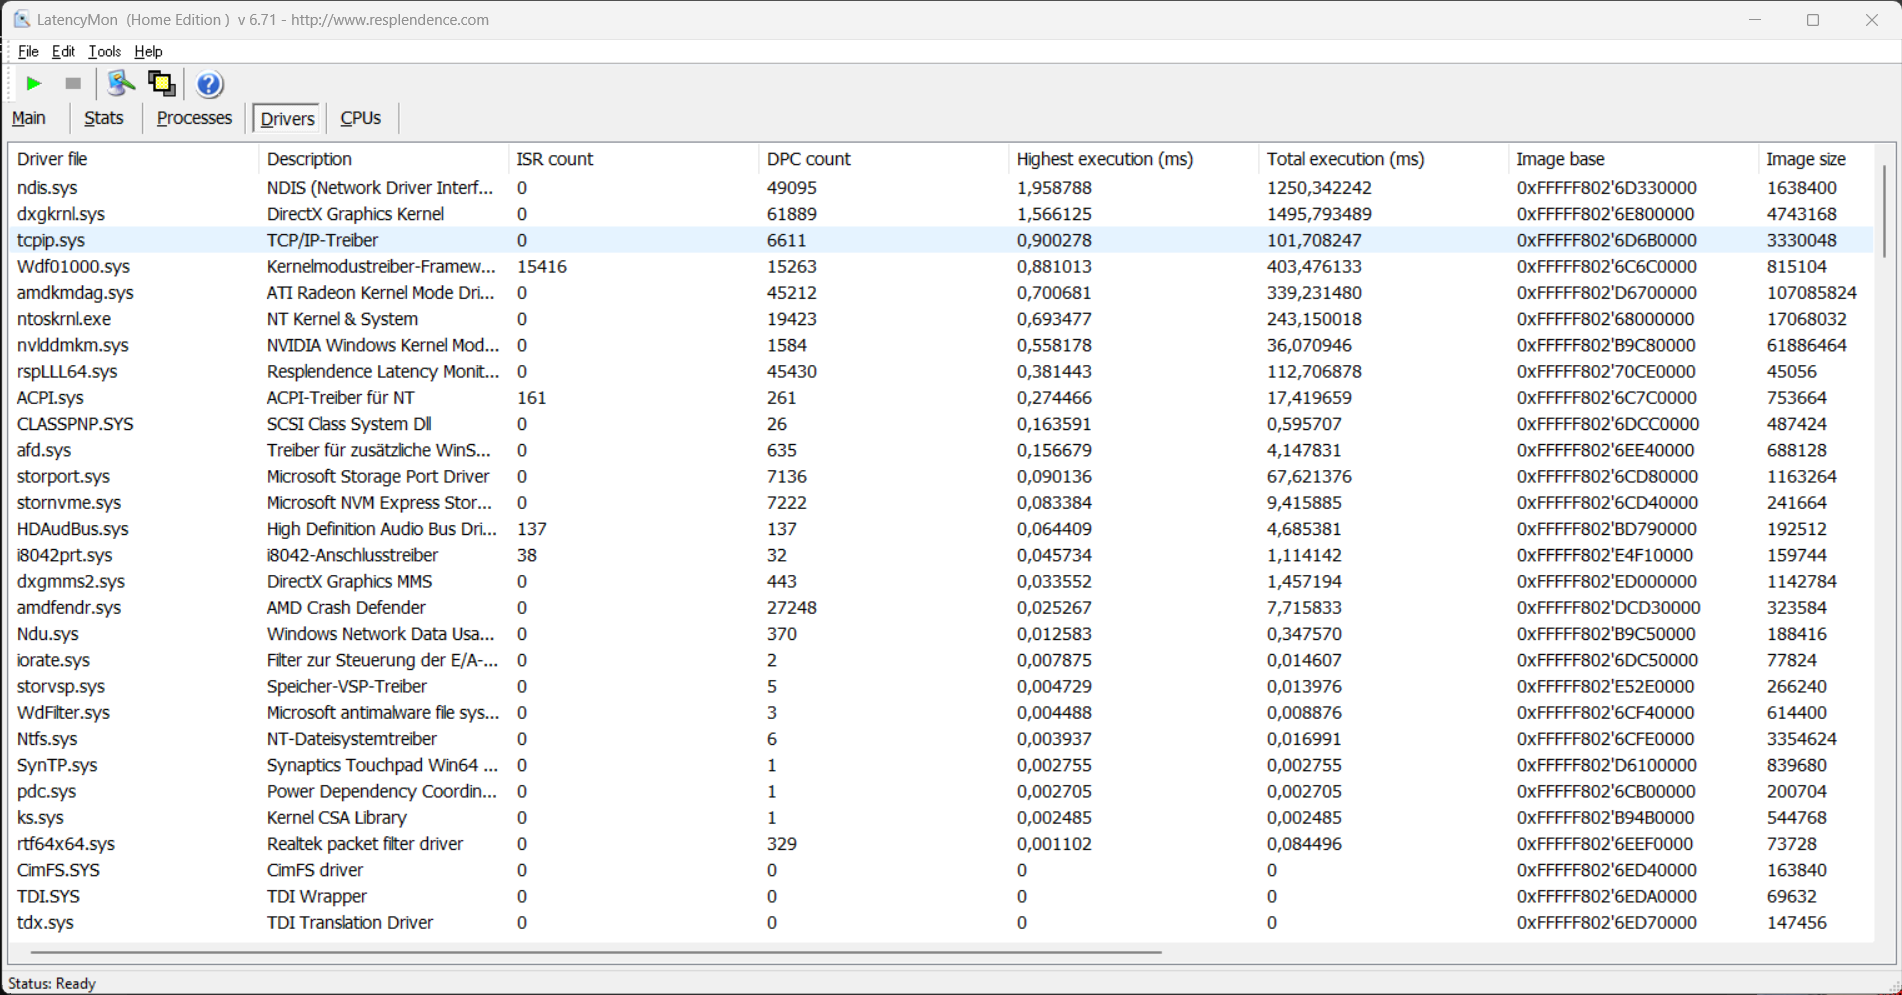
DPC 延迟
我们的测试设备目前的配置不一定适合实时音频和视频处理,因为你不得不期待一些小的卡顿。网络驱动程序和 DirectX 图形内核阻碍了更好的结果。如果更换驱动程序或进行软件更新,这种情况可能会有所改善,甚至更糟。
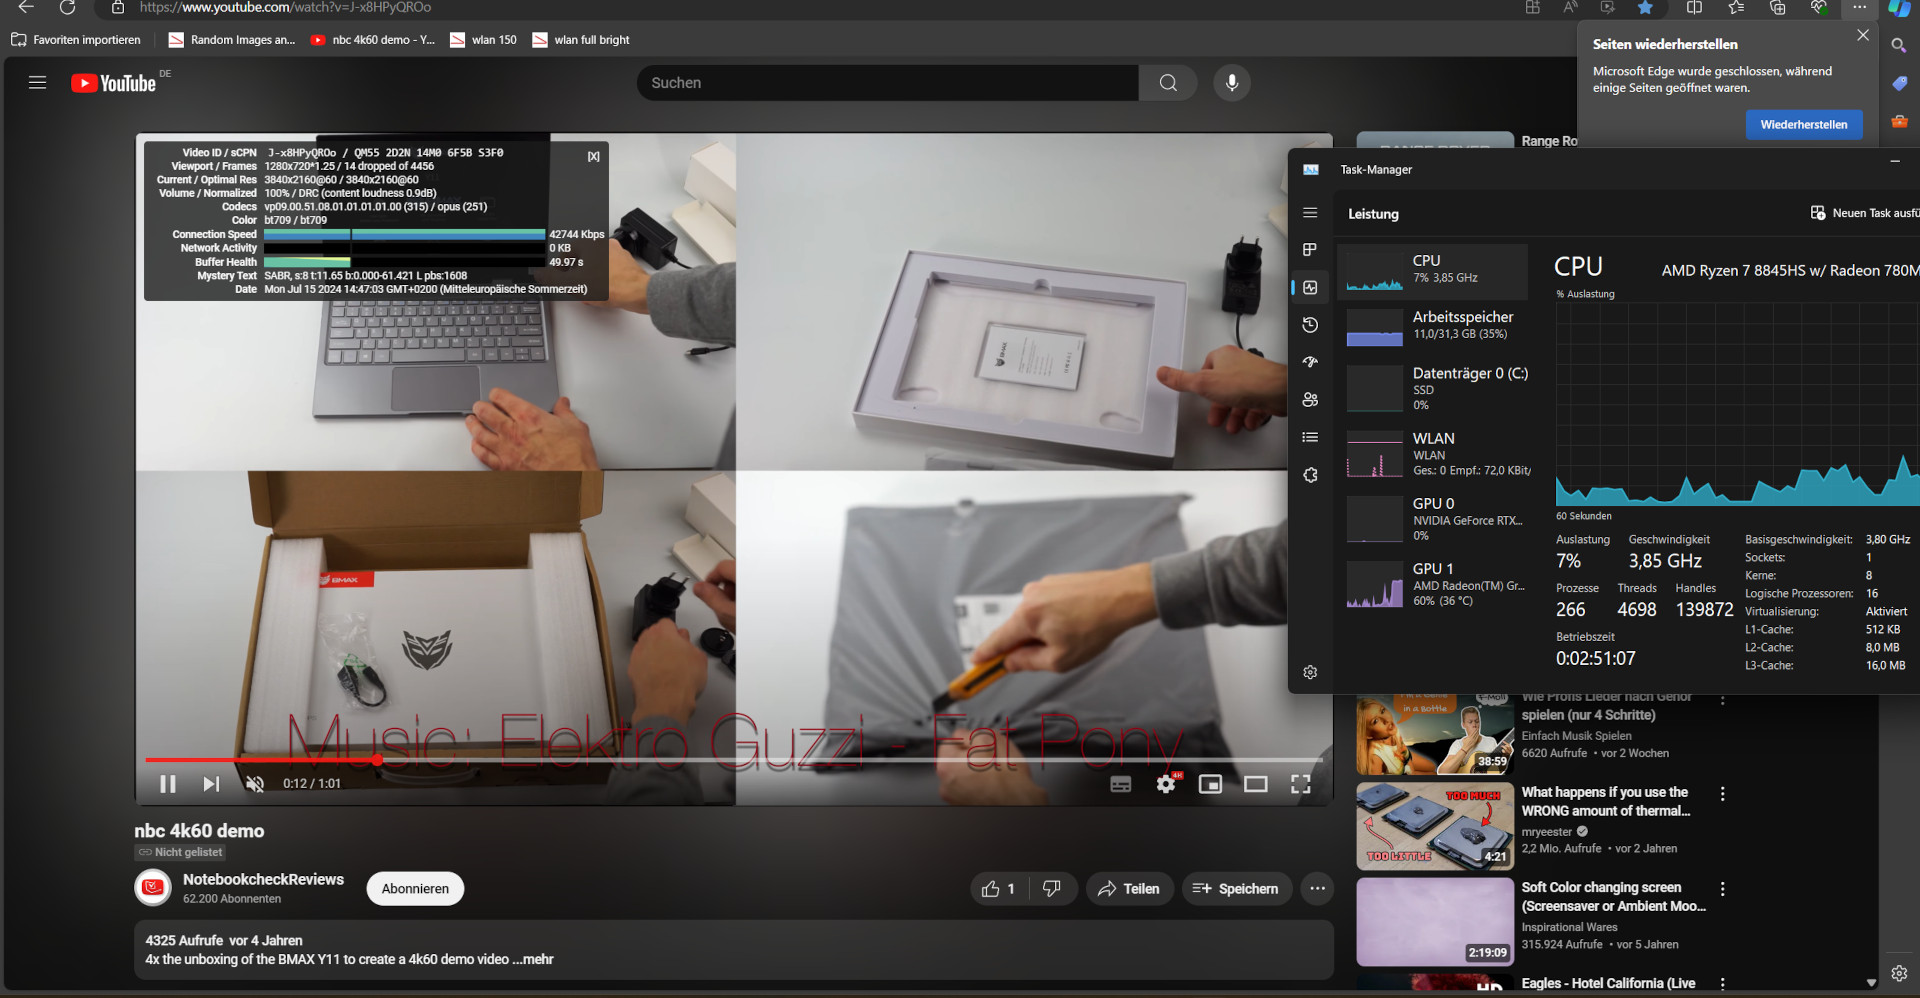
最突出的是,在播放 4K 视频时,iGPU 的利用率很高。虽然 60% 的使用率还可以接受,但这几乎是英特尔集成显卡解决方案的两倍。一分钟内出现 13 次丢帧也不是一个理想的结果。
| DPC Latencies / LatencyMon - interrupt to process latency (max), Web, Youtube, Prime95 | |
| Asus ROG Strix Scar 16 G634JZR | |
| Alienware m16 R2 | |
| HP Omen 17-db0079ng | |
| Asus TUF Gaming A17 FA707XI-NS94 | |
| Acer Predator Helios Neo 16 (2024) | |
| Asus TUF Gaming A15 FA507UV | |
* ... smaller is better
存储解决方案
这里使用的固态硬盘肯定达不到绝对的最高速度。例如 华硕 ROG Strix Scar 16在顺序访问方面的性能要高出 30%。但这对游戏帧率的提升作用微乎其微。我们只能观察到,在执行大量并行访问任务的高强度多任务时,即使有提高,也是微乎其微。
另一方面,Omen 17 展示了固态硬盘良好的散热效果。与包括 ROG Strix Scar 在内的许多结构类似的竞争对手相比,Omen 17 的性能始终保持在不错的水平,即使不是很突出。
第二个 M.2-NVMe 固态硬盘插槽还预装了散热器。因此,如果你愿意,可以在这里添加更快或至少更大的硬盘。

* ... smaller is better
Disk Throttling: DiskSpd Read Loop, Queue Depth 8
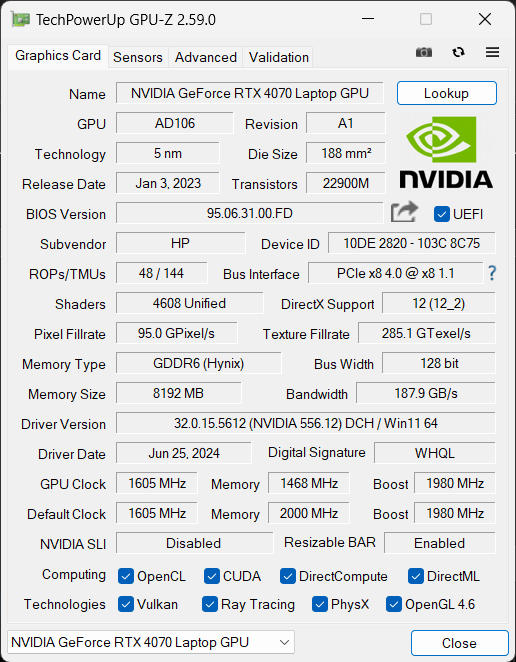
图形卡
惠普预兆 17 使用 英伟达GeForce RTX 4070显卡。此外,您还可以购买配备 RTX 4060.这两款显卡中较大的一款非常适合 QHD 显示屏。在最新的游戏中,如果我们还想获得超过 60 FPS 的帧数,只需放弃最高细节设置即可。
RTX 4070 的最大功耗为 120 瓦,低于其允许的最大值 140 瓦。但这并不十分明显,尤其是在 3DMark 的合成基准测试中,有时我们甚至会观察到相反的情况。例如 华硕 TUF Gaming A17在纸面上配备了 140 瓦的 RTX 4070,但整体性能却落后 9%。不过,在游戏性能方面,两者的差距较小。我们可能看到了惠普 Omen 17 不需要节流的效果。
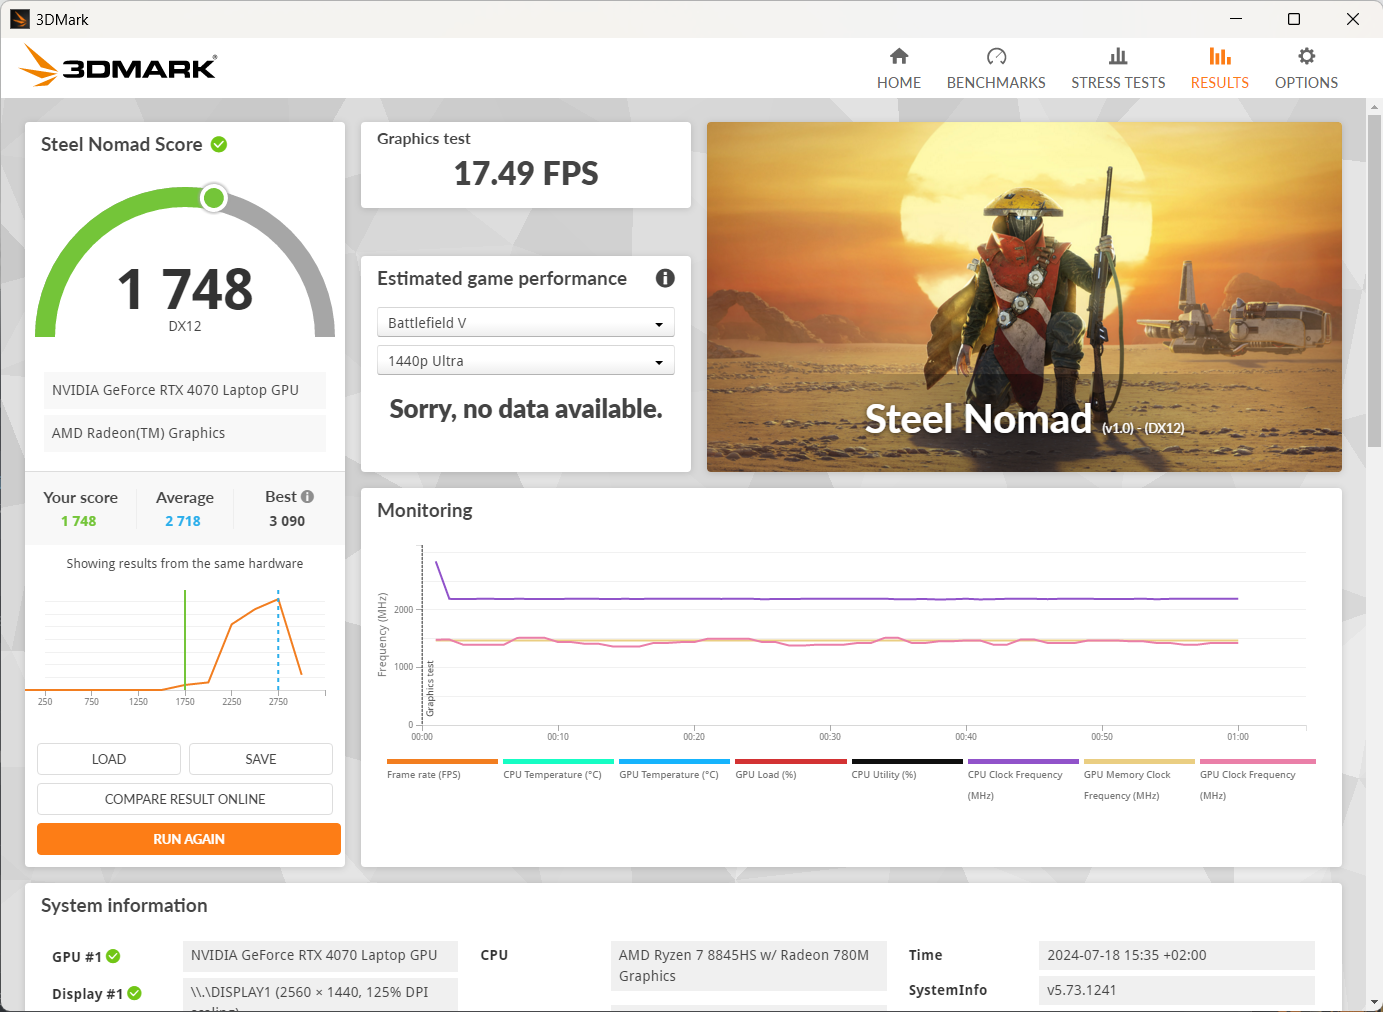
在其他电源模式下,功率值进一步降低。在 "平衡 "模式下,功率仍为 90 瓦,性能最多降低 10%。在 "Eco "模式和电池工作模式下,显卡的功耗仅为 40 瓦,功耗下降更为明显。虽然不那么复杂的游戏仍然可以玩,但帧速率会降低三分之一。
您可以在我们的 GPU 基准列表.
| 3DMark 11 Performance | 35016 points | |
| 3DMark Cloud Gate Standard Score | 65355 points | |
| 3DMark Fire Strike Score | 27594 points | |
| 3DMark Time Spy Score | 12346 points | |
| 3DMark Steel Nomad Score | 2743 points | |
Help | ||
* ... smaller is better
游戏性能
在全高清分辨率下,HP Omen 17 的细节设置仅为高分辨率,而非最高分辨率,就能稳定地超过 100 FPS。这也适用于当前的游戏。在几款游戏中,与其他配备 RTX 4070 的游戏笔记本电脑的差距只有几个百分点。华硕 华硕 TUF Gaming A15的优势仅为 4%。但《赛博朋克 2077 2.1》等对图形要求较高的游戏在 Omen 17 上的可玩性要高得多。不过,较小的 GPU 仍能在目视水平下驾驭较老的游戏。
更安静的 "平衡 "模式与最高性能之间的差距仍然很小。即使在这种情况下,通常也能达到 100 FPS。因此我们可以说,总的来说,降低 TGP 的决定并没有给游戏带来任何值得一提的严重弊端。由于可用计算性能保持稳定,Omen 17 甚至在持续负载的情况下还有优势。


| GTA V - 1920x1080 Highest Settings possible AA:4xMSAA + FX AF:16x | |
| Asus ROG Strix Scar 16 G634JZR | |
| Acer Predator Helios Neo 16 (2024) | |
| Average of class Gaming (12.1 - 168.2, n=132, last 2 years) | |
| HP Omen 16 (2024) | |
| Asus ROG Zephyrus M16 GU603Z | |
| Asus TUF Gaming A15 FA507UV | |
| HP Omen 17-db0079ng | |
| HP Omen 16-b0085ng | |
| Cyberpunk 2077 2.2 Phantom Liberty - 1920x1080 Ultra Preset (FSR off) | |
| Asus ROG Strix Scar 16 G634JZR | |
| HP Omen 17-db0079ng | |
| Average of class Gaming (6.76 - 158, n=90, last 2 years) | |
| Asus TUF Gaming A17 FA707XI-NS94 | |
| HP Omen 16 (2024) | |
| Acer Predator Helios Neo 16 (2024) | |
| Alienware m16 R2 | |
| Asus TUF Gaming A15 FA507UV | |
| F1 23 | |
| 1920x1080 Ultra High Preset AA:T AF:16x | |
| Asus ROG Strix Scar 16 G634JZR | |
| Average of class Gaming (12.9 - 149.2, n=39, last 2 years) | |
| Average NVIDIA GeForce RTX 4070 Laptop GPU (49.5 - 100, n=14) | |
| 2560x1440 Ultra High Preset AA:T AF:16x | |
| Asus ROG Strix Scar 16 G634JZR | |
| Average of class Gaming (17 - 144.6, n=30, last 2 years) | |
| Average NVIDIA GeForce RTX 4070 Laptop GPU (35.2 - 49, n=13) | |
| F1 24 | |
| 1920x1080 Ultra High Preset AA:T AF:16x | |
| Average of class Gaming (54.1 - 148, n=19, last 2 years) | |
| HP Omen 17-db0079ng | |
| Average NVIDIA GeForce RTX 4070 Laptop GPU (58.4 - 78.1, n=9) | |
| Asus TUF Gaming A15 FA507UV | |
| 2560x1440 Ultra High Preset AA:T AF:16x | |
| Average of class Gaming (36.7 - 100, n=16, last 2 years) | |
| HP Omen 17-db0079ng | |
| Average NVIDIA GeForce RTX 4070 Laptop GPU (36.8 - 50.9, n=9) | |
赛博朋克 2077 2.1》的持续负载测试也显示了笔记本电脑性能的稳定性,从开始到结束几乎是一条完美的直线。由于功耗降低,Omen 17 在任何时候都不需要节流。
Cyberpunk 2077 Ultra FPS Chart
| low | med. | high | ultra | QHD | |
|---|---|---|---|---|---|
| GTA V (2015) | 178.9 | 175.5 | 163.1 | 103.9 | 90.2 |
| Dota 2 Reborn (2015) | 152.5 | 138.8 | 137.3 | 126.3 | |
| Final Fantasy XV Benchmark (2018) | 201 | 155.7 | 117.2 | 88.2 | |
| X-Plane 11.11 (2018) | 128.8 | 115.7 | 89.5 | ||
| Far Cry 5 (2018) | 137 | 123 | 115 | 110 | 108 |
| Strange Brigade (2018) | 318 | 276 | 240 | 213 | 138.3 |
| God of War (2022) | 149 | 129 | 105 | 74 | 60 |
| Hogwarts Legacy (2023) | 103 | 92 | 87 | 76 | 52 |
| Cyberpunk 2077 2.2 Phantom Liberty (2023) | 135.3 | 122 | 102.6 | 88.9 | 54.5 |
| F1 24 (2024) | 205 | 210 | 196.6 | 74.1 | 48.4 |
排放 - 不是喷气式飞机
噪音水平
负载情况下的风扇控制显示了成功的冷却效果。即使在性能最高的时刻,噪音也不会令人讨厌,尽管此时噪音清晰可闻。与竞争对手相比,如 Alienware m16 R2在这种情况下,耳机并非绝对必要,但还是建议使用。
在 "平衡 "模式下,Omen 17 的表现更加出色,这只是带来了一些性能上的小限制。只要游戏只是半途而废,你就很难再注意到风扇的噪音。此外,随机附带的软件还能让你轻松地进一步调整风扇转速,以进一步降低噪音水平。
遗憾的是,这款游戏笔记本电脑从未真正保持绝对安静。即使在没有任何负载的情况下,风扇也会时不时地转动起来,虽然不会达到最高转速,但还是非常清晰可闻。Omen 17 远未达到任何临界温度。
Noise Level
| Idle |
| 25 / 29 / 33 dB(A) |
| Load |
| 45 / 52 dB(A) |
 | ||
30 dB silent 40 dB(A) audible 50 dB(A) loud |
||
min: | ||
| HP Omen 17-db0079ng NVIDIA GeForce RTX 4070 Laptop GPU, R7 8845HS, WD PC SN560 SDDPNQE-1T00 | Alienware m16 R2 NVIDIA GeForce RTX 4070 Laptop GPU, Ultra 7 155H, Samsung PM9A1 MZVL21T0HCLR | Asus ROG Strix Scar 16 G634JZR NVIDIA GeForce RTX 4080 Laptop GPU, i9-14900HX, SK hynix PC801 HFS002TEJ9X101N | Acer Predator Helios Neo 16 (2024) NVIDIA GeForce RTX 4070 Laptop GPU, i7-14700HX, Samsung PM9A1a MZVL21T0HDLU | Asus TUF Gaming A17 FA707XI-NS94 NVIDIA GeForce RTX 4070 Laptop GPU, R9 7940HS, WD PC SN560 SDDPNQE-1T00 | Asus TUF Gaming A15 FA507UV NVIDIA GeForce RTX 4060 Laptop GPU, R9 8945H, WD PC SN560 SDDPNQE-1T00 | |
|---|---|---|---|---|---|---|
| Noise | 8% | -5% | -3% | -1% | 5% | |
| off / environment * | 25 | 24.7 1% | 21.07 16% | 25.2 -1% | 27.9 -12% | 25 -0% |
| Idle Minimum * | 25 | 25.3 -1% | 29.75 -19% | 27.8 -11% | 28.5 -14% | 25 -0% |
| Idle Average * | 29 | 25.3 13% | 29.75 -3% | 32 -10% | 29.8 -3% | 27 7% |
| Idle Maximum * | 33 | 25.3 23% | 29.75 10% | 29.6 10% | 29.8 10% | 33 -0% |
| Load Average * | 45 | 31.7 30% | 54.85 -22% | 45.2 -0% | 34.8 23% | 40 11% |
| Cyberpunk 2077 ultra * | 48 | 45 6% | ||||
| Load Maximum * | 52 | 62 -19% | 58 -12% | 55.8 -7% | 57.3 -10% | 46 12% |
| Witcher 3 ultra * | 53.8 | 57.8 | 57.1 |
* ... smaller is better
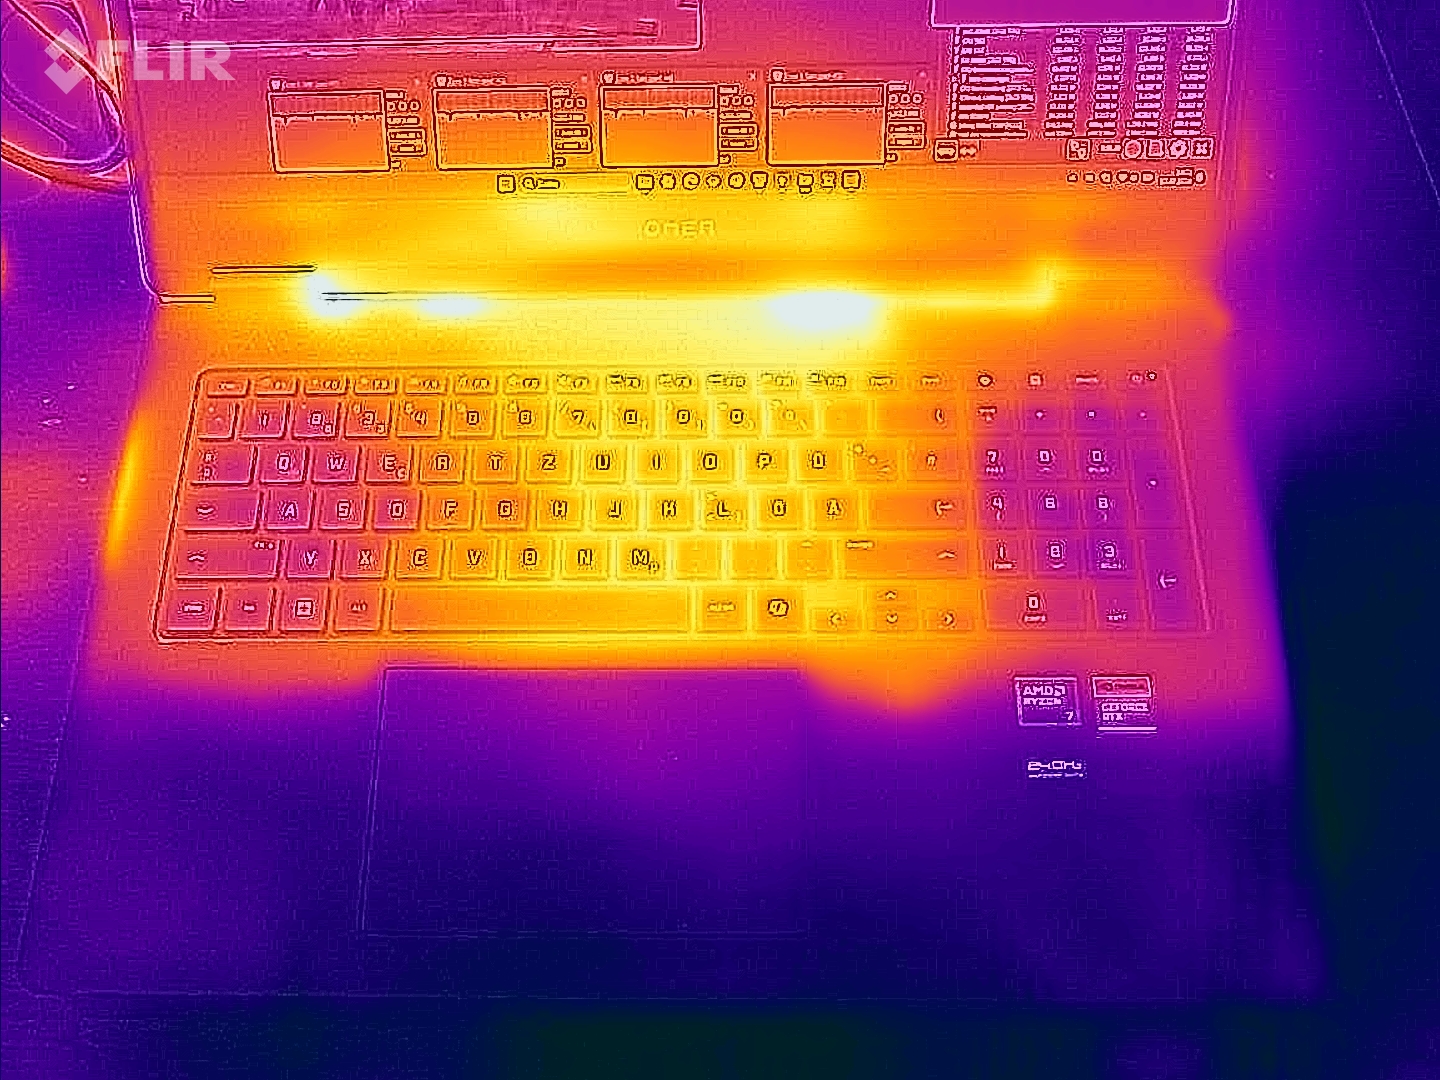
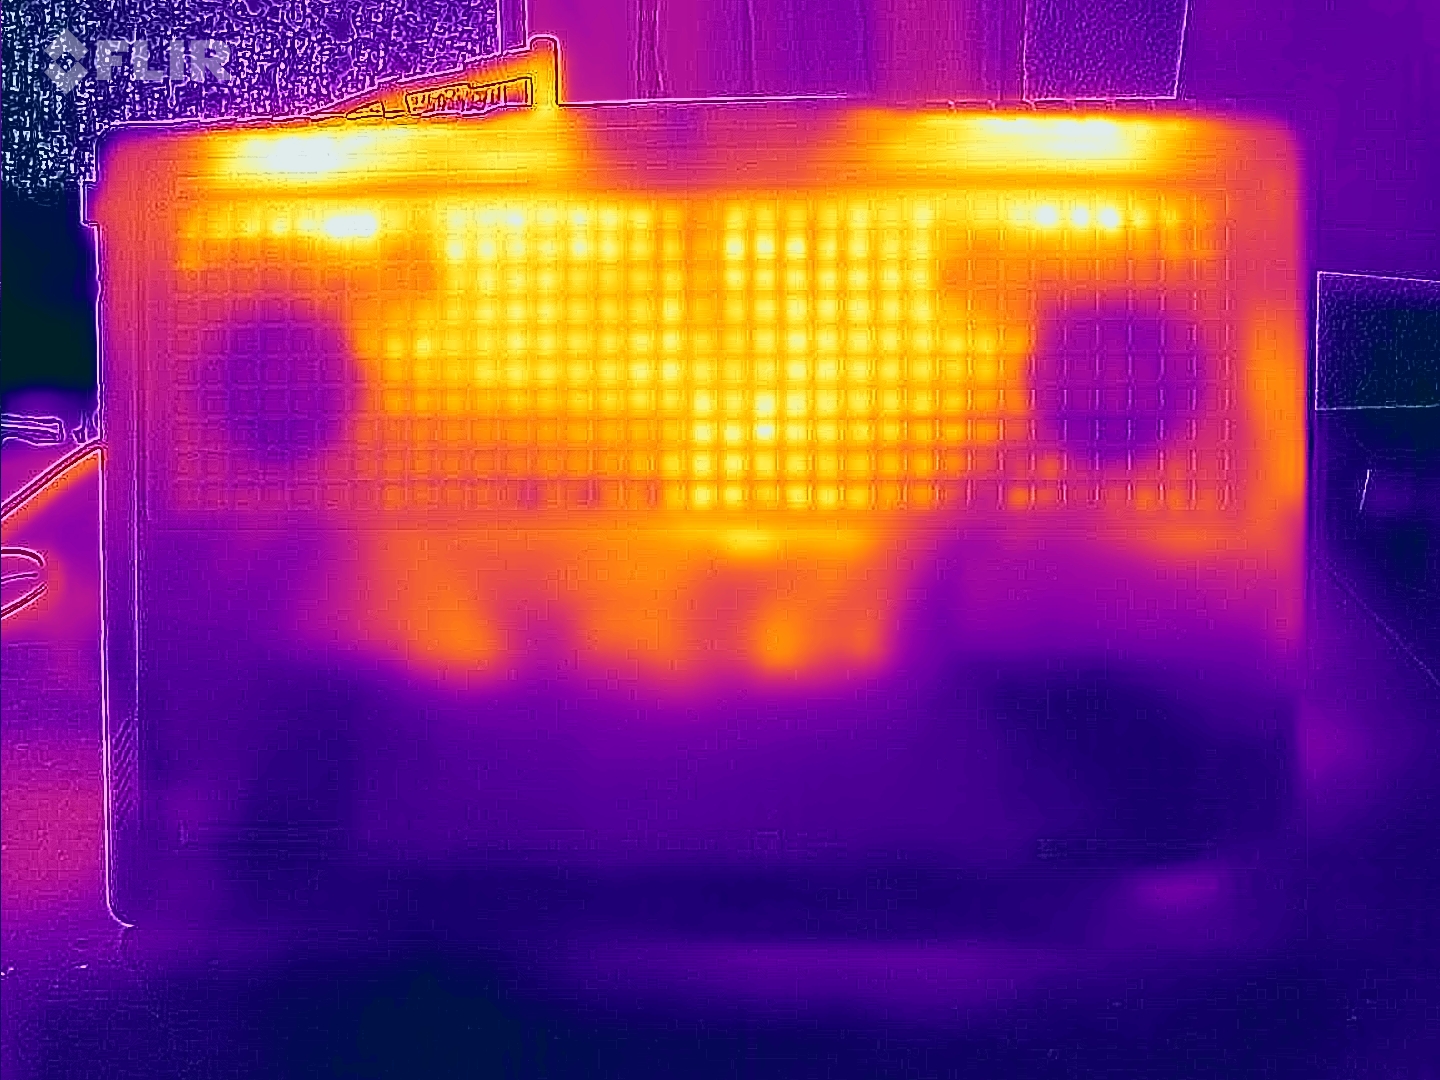
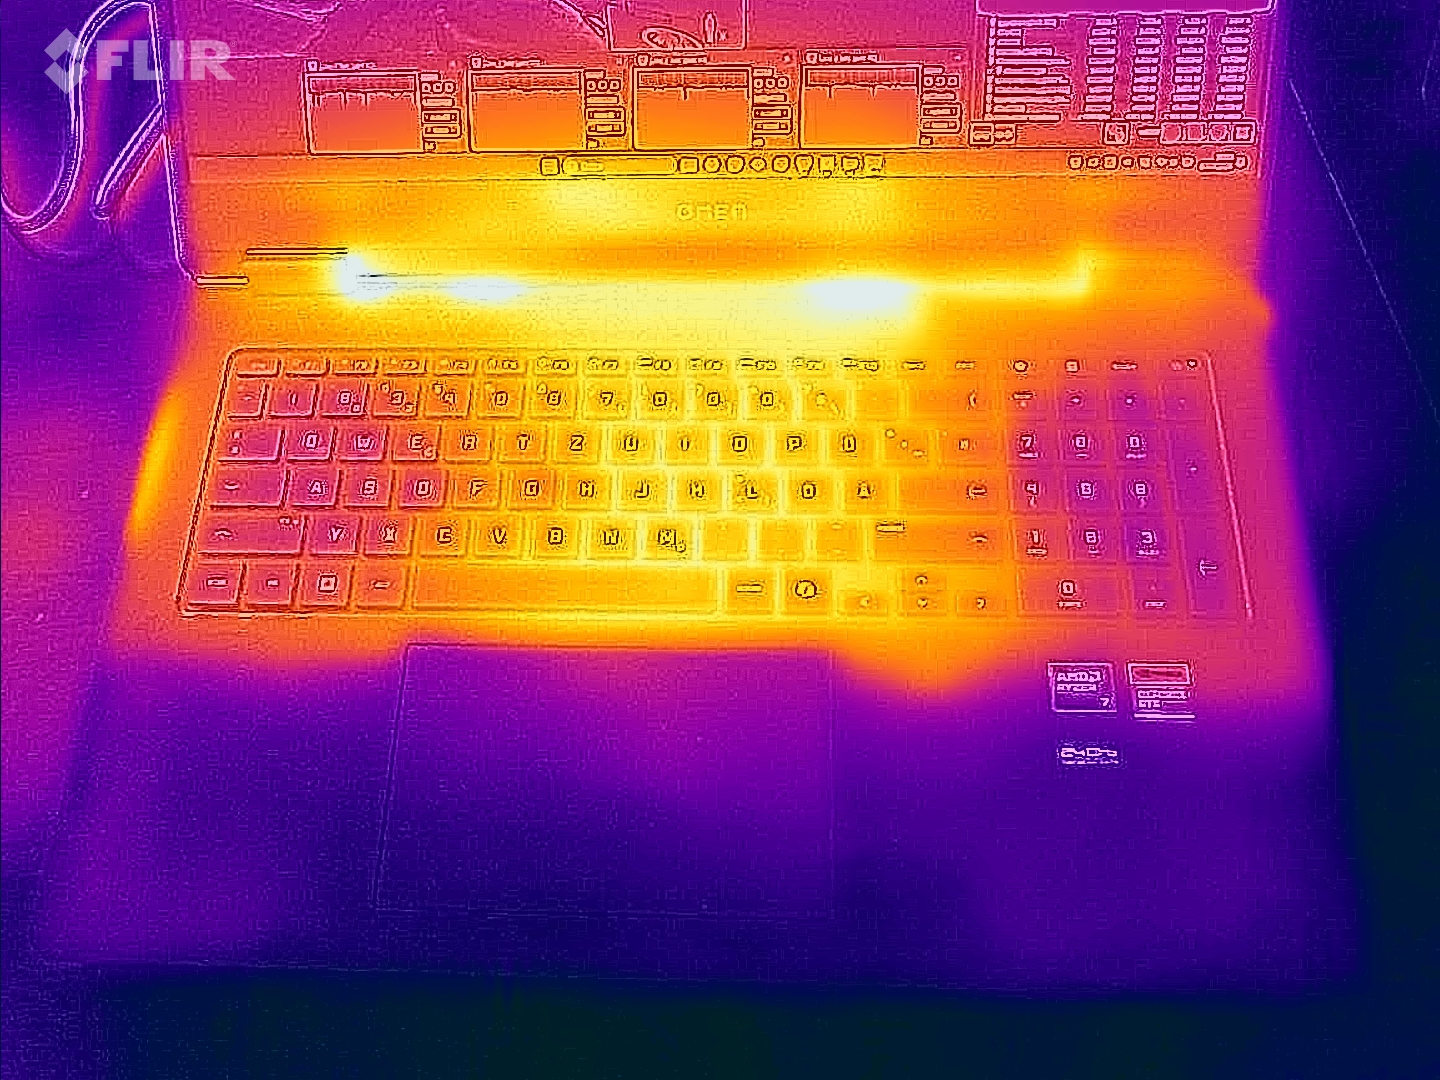
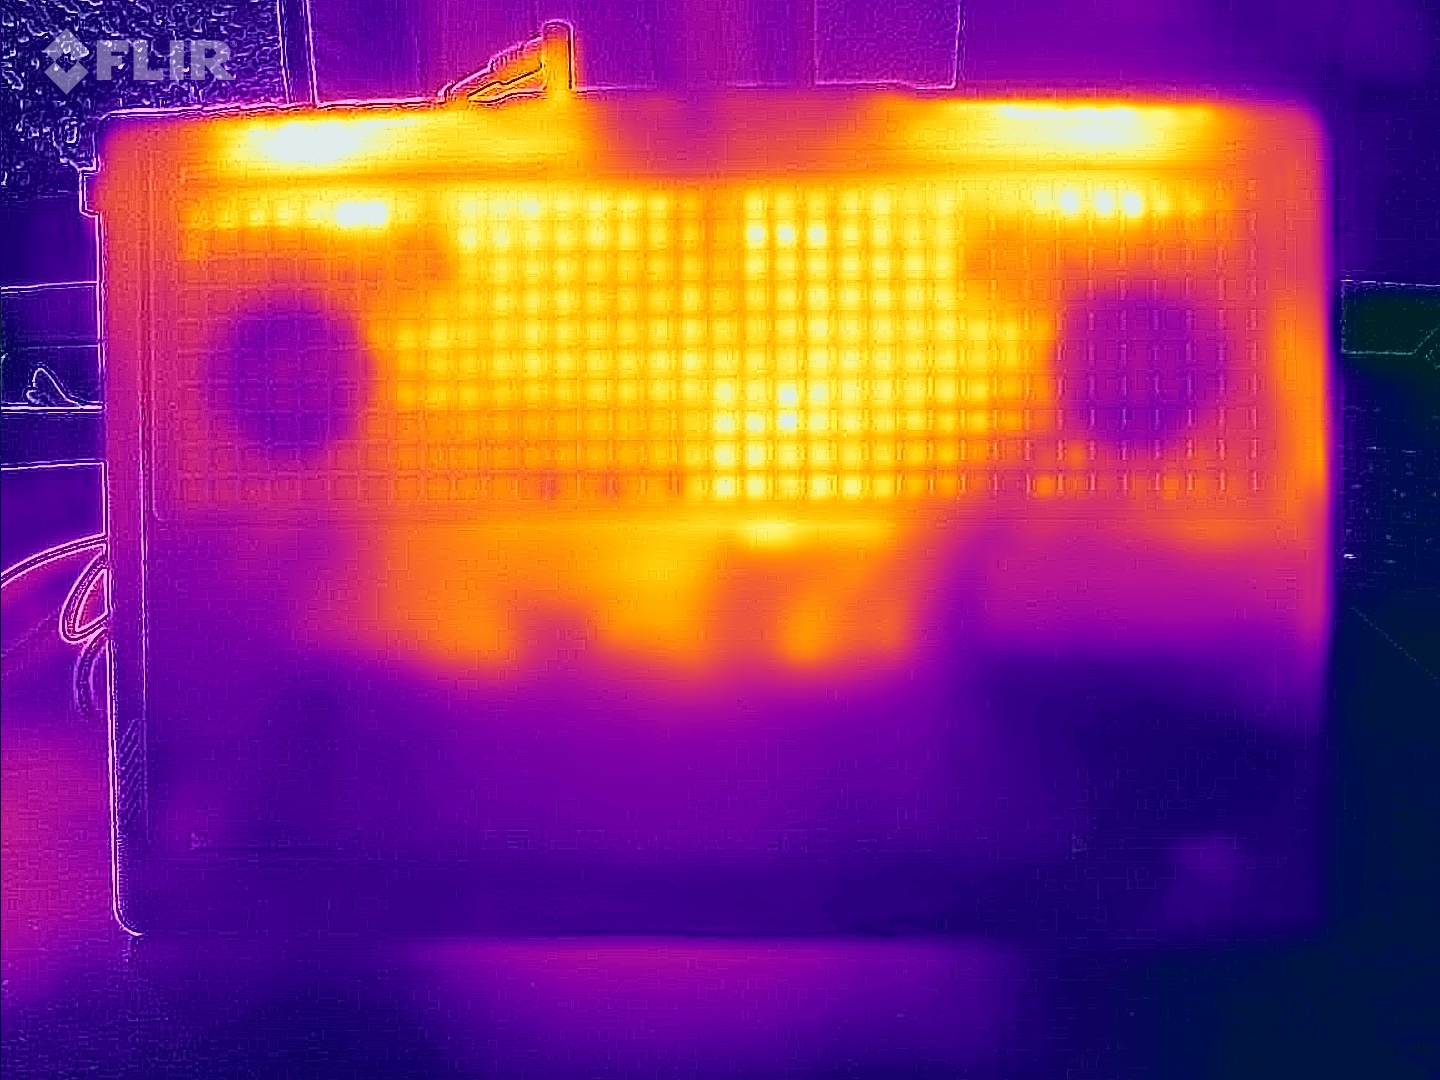
温度
无论是在空闲运行还是在高负载情况下,Omen 17 的温度都比许多同类产品低。特别是掌托几乎不会发热。另一方面,键盘区域的温度在游戏过程中明显升高。在此建议使用外部解决方案,尤其是内置键盘并不令人印象深刻。在上网或办公等简单任务中,整个设备仍然凉爽舒适。您还可以将它舒适地放在腿上使用。
(±) The maximum temperature on the upper side is 44 °C / 111 F, compared to the average of 40.4 °C / 105 F, ranging from 21.2 to 68.8 °C for the class Gaming.
(±) The bottom heats up to a maximum of 45 °C / 113 F, compared to the average of 43.2 °C / 110 F
(+) In idle usage, the average temperature for the upper side is 25.7 °C / 78 F, compared to the device average of 33.9 °C / 93 F.
(±) 3: The average temperature for the upper side is 36.1 °C / 97 F, compared to the average of 33.9 °C / 93 F for the class Gaming.
(+) The palmrests and touchpad are cooler than skin temperature with a maximum of 28 °C / 82.4 F and are therefore cool to the touch.
(±) The average temperature of the palmrest area of similar devices was 28.9 °C / 84 F (+0.9 °C / 1.6 F).
| HP Omen 17-db0079ng AMD Ryzen 7 8845HS, NVIDIA GeForce RTX 4070 Laptop GPU | Alienware m16 R2 Intel Core Ultra 7 155H, NVIDIA GeForce RTX 4070 Laptop GPU | Asus ROG Strix Scar 16 G634JZR Intel Core i9-14900HX, NVIDIA GeForce RTX 4080 Laptop GPU | Acer Predator Helios Neo 16 (2024) Intel Core i7-14700HX, NVIDIA GeForce RTX 4070 Laptop GPU | Asus TUF Gaming A17 FA707XI-NS94 AMD Ryzen 9 7940HS, NVIDIA GeForce RTX 4070 Laptop GPU | Asus TUF Gaming A15 FA507UV AMD Ryzen 9 8945H, NVIDIA GeForce RTX 4060 Laptop GPU | |
|---|---|---|---|---|---|---|
| Heat | -27% | -18% | -23% | 11% | -18% | |
| Maximum Upper Side * | 44 | 44.8 -2% | 47.8 -9% | 58 -32% | 40 9% | 53 -20% |
| Maximum Bottom * | 45 | 48 -7% | 52.2 -16% | 45.2 -0% | 33.6 25% | 46 -2% |
| Idle Upper Side * | 26 | 37.2 -43% | 32.4 -25% | 31.1 -20% | 26.6 -2% | 32 -23% |
| Idle Bottom * | 27 | 42 -56% | 33 -22% | 37.2 -38% | 24.4 10% | 34 -26% |
* ... smaller is better
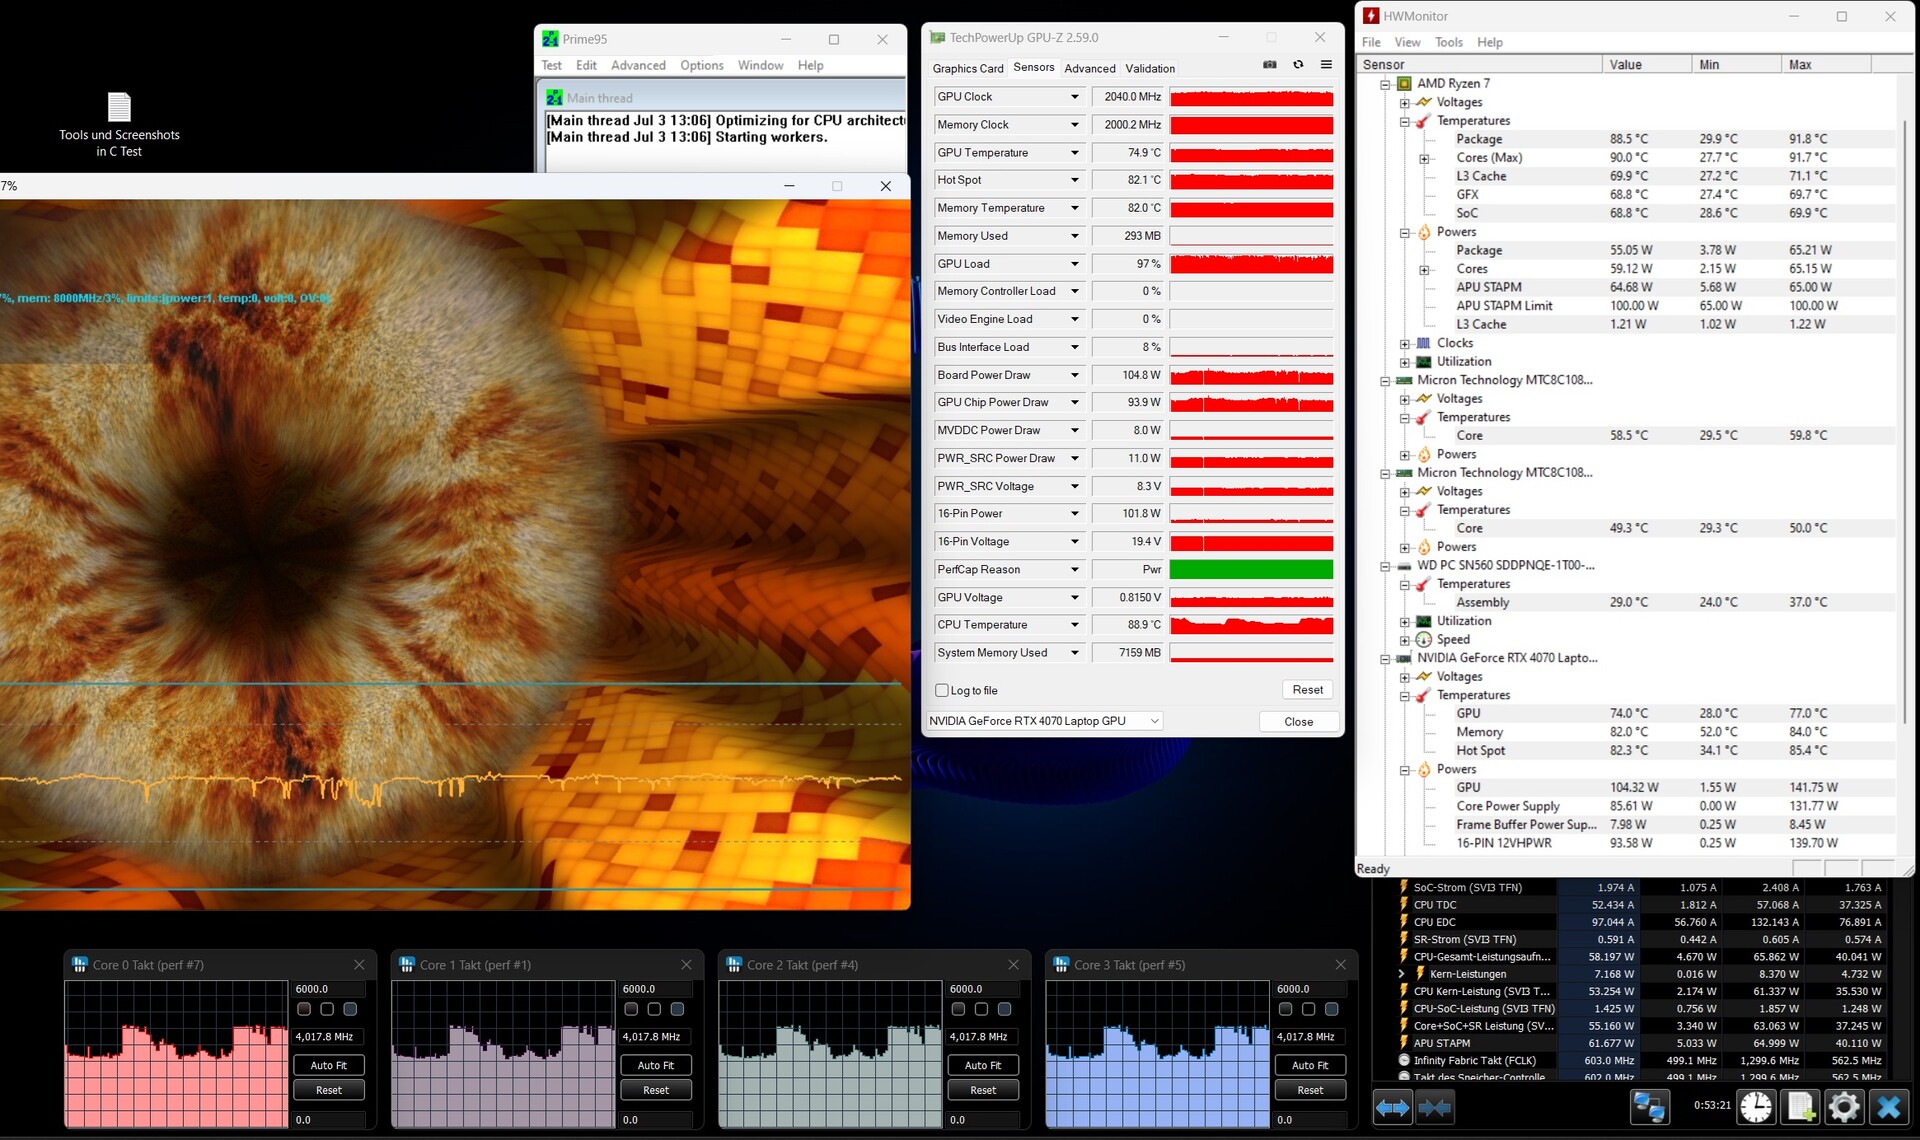
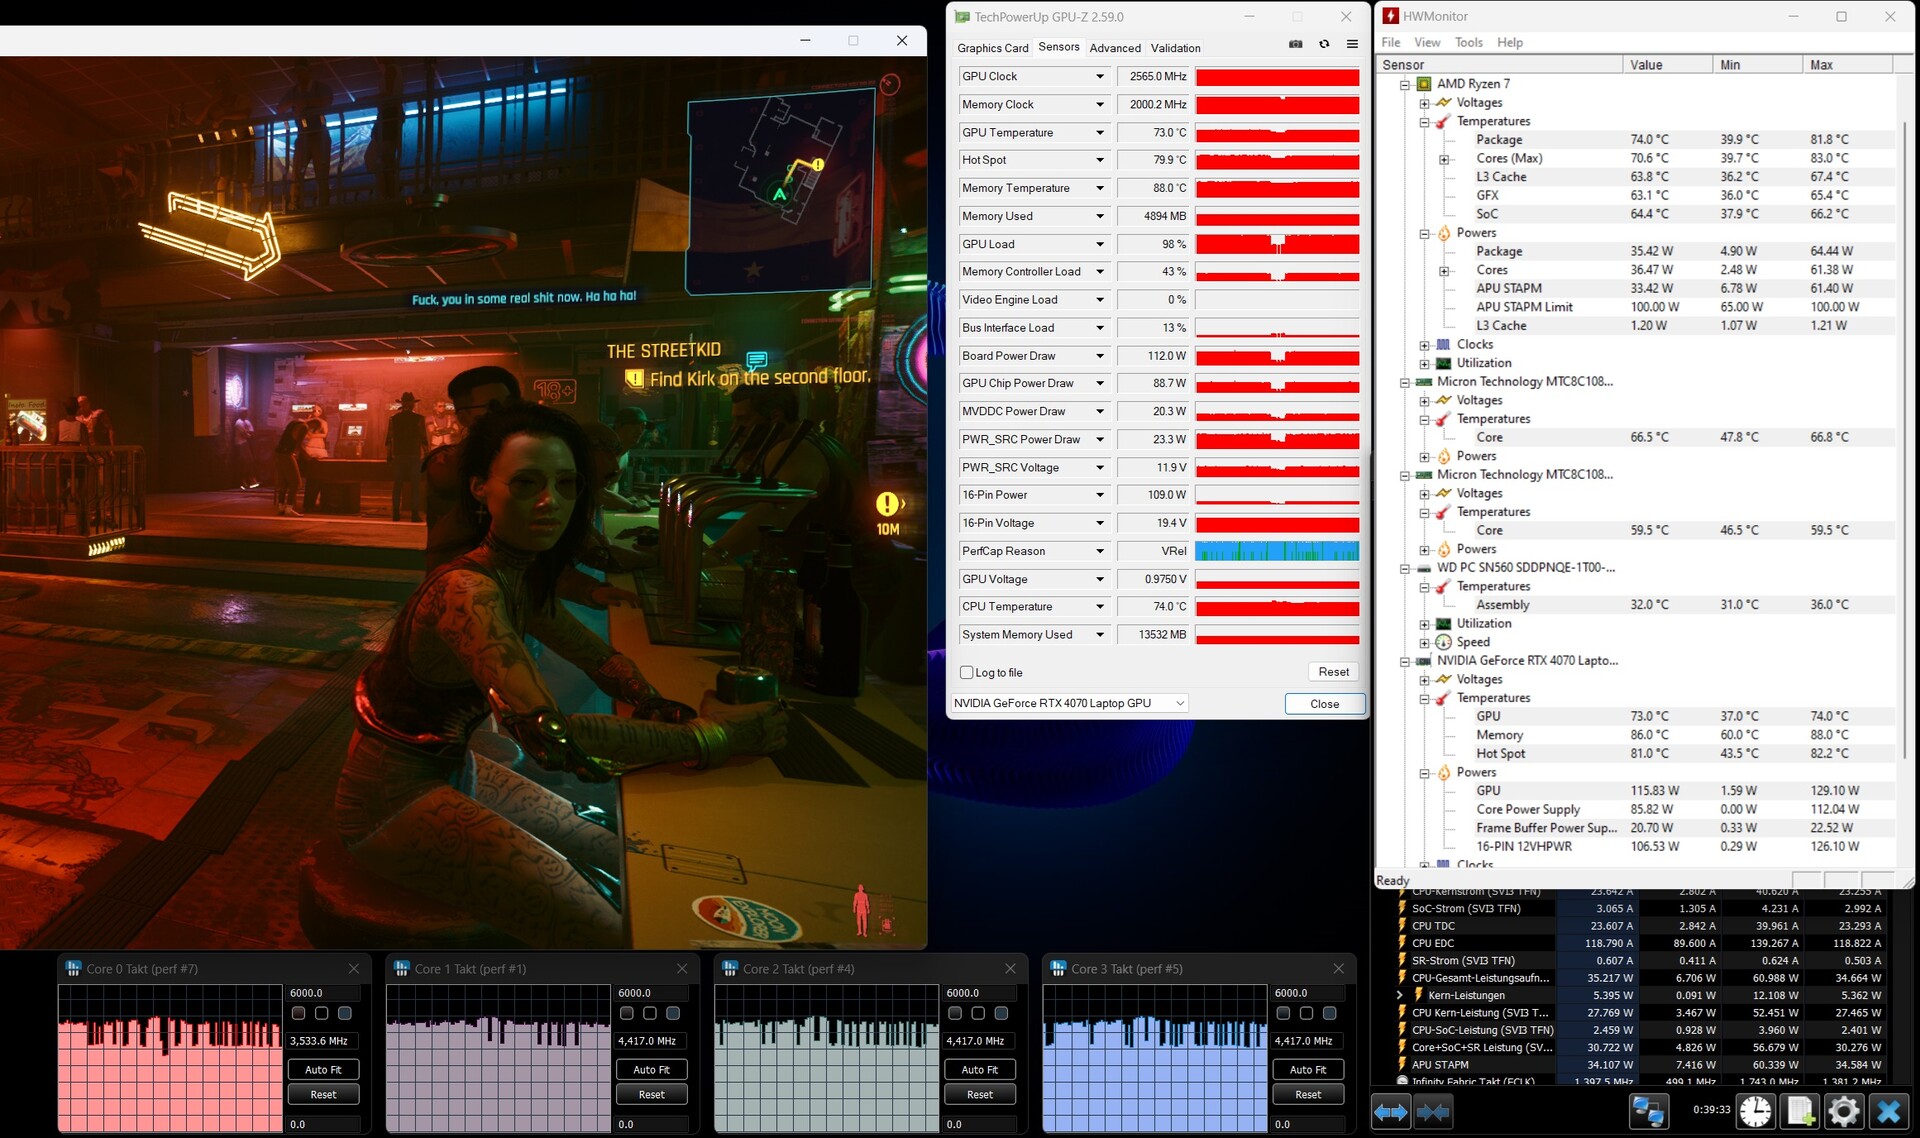
压力测试
当使用 Prime95 对 CPU 进行满负荷运行时,其允许功耗为 65 瓦。虽然这一数值小于某些采用相同 CPU 的竞争对手,但在较长时间内保持不变。核心温度保持在可接受的 80 °C(176 °F)或更低。
只有在显卡负载增加的情况下,惠普 Omen 17 才会达到极限。当两个组件都以最高性能运行时,CPU 的功耗保持在最大值 50 瓦(减去 GPU 的动态提升),显卡的功耗保持在最大值 120 瓦。随后,CPU 的温度将升至近 90 °C(194 °F),GPU 的温度将升至 75 °C(167 °F)。
在压力测试期间,CPU 的时钟频率保持在 4,500 MHz 左右,当加入图形芯片后,时钟频率将降至 4,000 MHz 左右。
发言人
扬声器给人的印象好坏参半。主要用于动作游戏的中低音听起来出人意料地出色和有力。声音听起来也很自然,并具有一定的细节深度。
深沉的低音完全没有出现,而中低音,即吉他或鼓声的音域,则显得很薄弱。同样明显的是,声音很容易被其他噪音掩盖。这款扬声器在玩游戏时尚可,但对于整体表现平平的扬声器来说,无论是视频流还是听音乐都不应该列入推荐的使用场景。
HP Omen 17-db0079ng audio analysis
(±) | speaker loudness is average but good (80 dB)
Bass 100 - 315 Hz
(-) | nearly no bass - on average 19.1% lower than median
(±) | linearity of bass is average (10.3% delta to prev. frequency)
Mids 400 - 2000 Hz
(+) | balanced mids - only 1.9% away from median
(+) | mids are linear (4.4% delta to prev. frequency)
Highs 2 - 16 kHz
(+) | balanced highs - only 3.8% away from median
(±) | linearity of highs is average (7.8% delta to prev. frequency)
Overall 100 - 16.000 Hz
(+) | overall sound is linear (14.3% difference to median)
Compared to same class
» 25% of all tested devices in this class were better, 7% similar, 69% worse
» The best had a delta of 6%, average was 18%, worst was 132%
Compared to all devices tested
» 16% of all tested devices were better, 4% similar, 81% worse
» The best had a delta of 4%, average was 24%, worst was 134%
Apple MacBook Pro 16 2021 M1 Pro audio analysis
(+) | speakers can play relatively loud (84.7 dB)
Bass 100 - 315 Hz
(+) | good bass - only 3.8% away from median
(+) | bass is linear (5.2% delta to prev. frequency)
Mids 400 - 2000 Hz
(+) | balanced mids - only 1.3% away from median
(+) | mids are linear (2.1% delta to prev. frequency)
Highs 2 - 16 kHz
(+) | balanced highs - only 1.9% away from median
(+) | highs are linear (2.7% delta to prev. frequency)
Overall 100 - 16.000 Hz
(+) | overall sound is linear (4.6% difference to median)
Compared to same class
» 0% of all tested devices in this class were better, 0% similar, 100% worse
» The best had a delta of 5%, average was 18%, worst was 45%
Compared to all devices tested
» 0% of all tested devices were better, 0% similar, 100% worse
» The best had a delta of 4%, average was 24%, worst was 134%
电源管理 - 高效的游戏笔记本电脑
耗电量
有限的最大功耗并不令人惊讶,因为 CPU 和 GPU 都略有节流。我们测得的最大值为 230 瓦,比配备该显卡的其他机型的功耗低近 10%。
另一方面,我们对无负载情况下的功耗进行了测量,这才是真正难能可贵的。有时,Omen 17 的耗电量仅为竞争对手的 50%。这也解释了为什么几乎没有发热现象,而且电池续航时间也很短。
| Off / Standby | |
| Idle | |
| Load |
|
Key:
min: | |
| HP Omen 17-db0079ng R7 8845HS, NVIDIA GeForce RTX 4070 Laptop GPU | Alienware m16 R2 Ultra 7 155H, NVIDIA GeForce RTX 4070 Laptop GPU | Asus ROG Strix Scar 16 G634JZR i9-14900HX, NVIDIA GeForce RTX 4080 Laptop GPU | Acer Predator Helios Neo 16 (2024) i7-14700HX, NVIDIA GeForce RTX 4070 Laptop GPU | Asus TUF Gaming A17 FA707XI-NS94 R9 7940HS, NVIDIA GeForce RTX 4070 Laptop GPU | Asus TUF Gaming A15 FA507UV R9 8945H, NVIDIA GeForce RTX 4060 Laptop GPU | Average NVIDIA GeForce RTX 4070 Laptop GPU | Average of class Gaming | |
|---|---|---|---|---|---|---|---|---|
| Power Consumption | -38% | -59% | -122% | -20% | 6% | -46% | -56% | |
| Idle Minimum * | 6 | 8.1 -35% | 10.71 -79% | 26.7 -345% | 6.2 -3% | 7 -17% | 12.8 ? -113% | 13.4 ? -123% |
| Idle Average * | 12 | 13 -8% | 14.75 -23% | 24.4 -103% | 21.8 -82% | 12 -0% | 17.8 ? -48% | 18.9 ? -58% |
| Idle Maximum * | 18 | 40.3 -124% | 30 -67% | 32.7 -82% | 22 -22% | 18 -0% | 24.3 ? -35% | 26.3 ? -46% |
| Load Average * | 71 | 79 -11% | 135 -90% | 122.1 -72% | 59.2 17% | 70 1% | 96.9 ? -36% | 102.7 ? -45% |
| Cyberpunk 2077 ultra * | 197 | 146.8 25% | ||||||
| Cyberpunk 2077 ultra external monitor * | 191.8 | 146.2 24% | ||||||
| Load Maximum * | 228 | 254.9 -12% | 307 -35% | 241 -6% | 247.8 -9% | 206 10% | 221 ? 3% | 244 ? -7% |
| Witcher 3 ultra * | 188.1 | 286 | 190.6 | 189.7 |
* ... smaller is better
Power Consumption Cyberpunk / Stress Test
Power Consumption With External Monitor
电池寿命
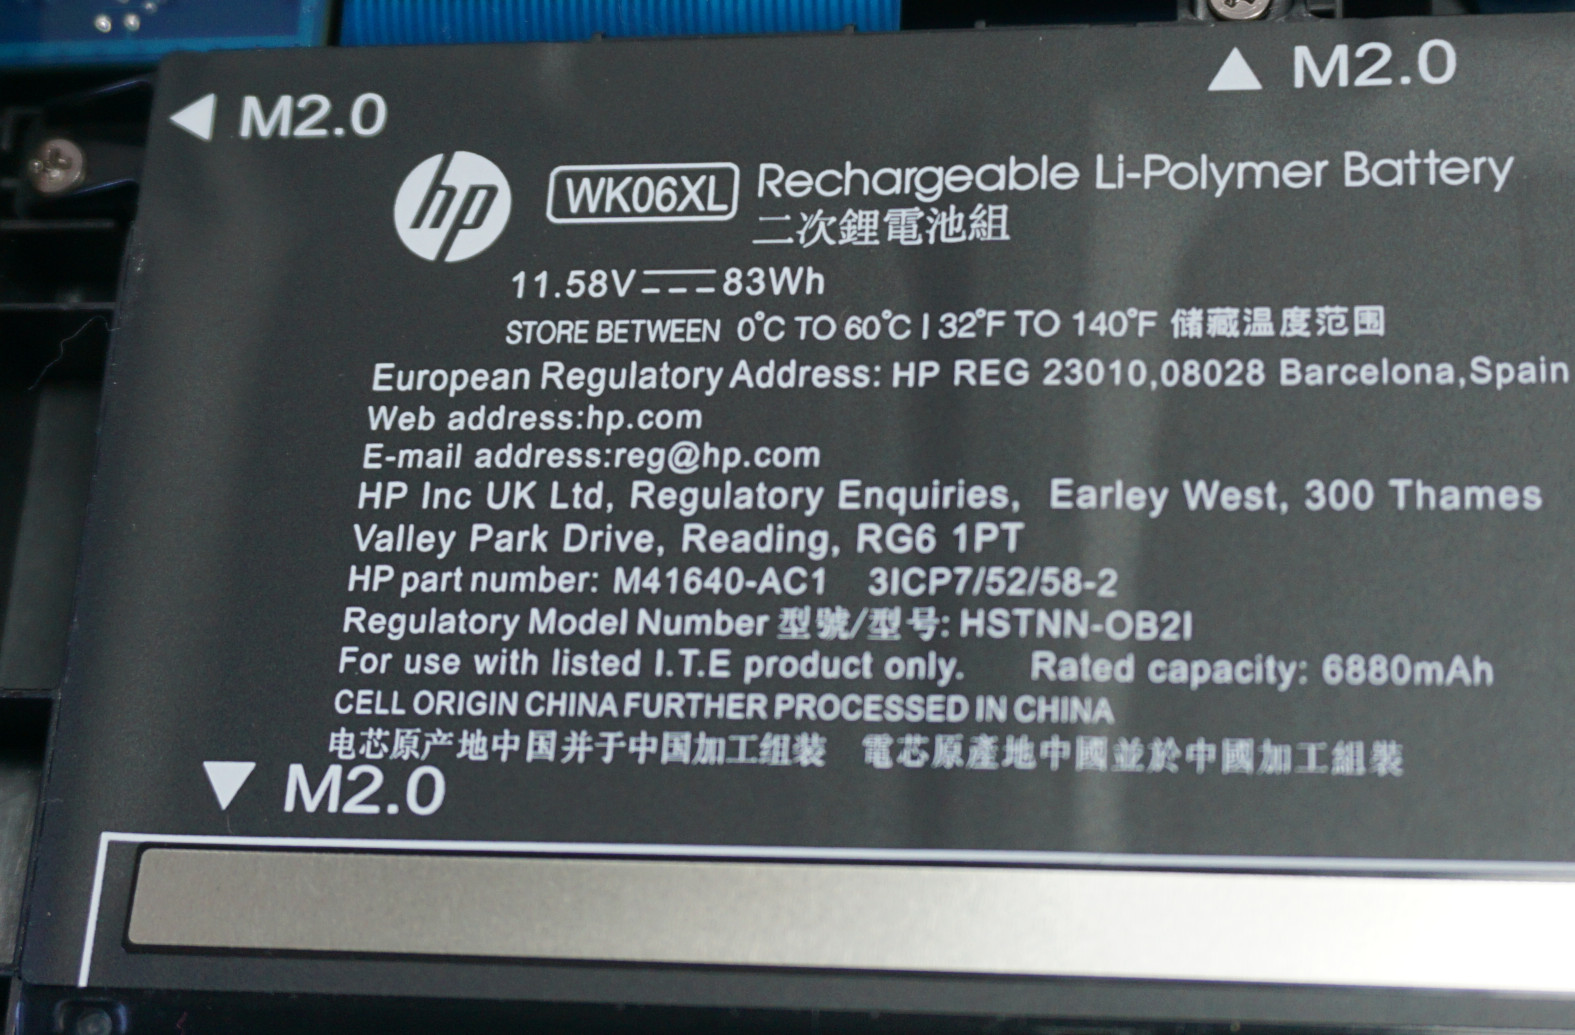
正如我们所预期的那样,考虑到适中的功耗,电池续航时间在计算性能方面处于较高水平。虽然电池容量为 83 瓦时,比其他中端游戏笔记本电脑的电池容量要小,但在我们的网上冲浪测试中,运行时间略微超过了 9 小时。在测试过程中,显示屏亮度降低到 150 cd/m²,这在通常情况下也足以满足桌面办公的需要,一般在晚间进行。
在最大亮度下,Omen 17 的效率并不高。由于显示屏较大,电池续航时间几乎减半,仅为 5 小时。播放视频的效率也较低。在视频流播放过程中,集成显卡的使用也变得相当充分。但至少电池续航时间几乎达到了 8 小时大关。
虽然电池续航时间在整体上可能并不突出,但对于游戏笔记本电脑来说已经达到了不错的水平。
| HP Omen 17-db0079ng R7 8845HS, NVIDIA GeForce RTX 4070 Laptop GPU, 83 Wh | Alienware m16 R2 Ultra 7 155H, NVIDIA GeForce RTX 4070 Laptop GPU, 90 Wh | Asus ROG Strix Scar 16 G634JZR i9-14900HX, NVIDIA GeForce RTX 4080 Laptop GPU, 90 Wh | Acer Predator Helios Neo 16 (2024) i7-14700HX, NVIDIA GeForce RTX 4070 Laptop GPU, 90.61 Wh | Asus TUF Gaming A17 FA707XI-NS94 R9 7940HS, NVIDIA GeForce RTX 4070 Laptop GPU, 90 Wh | Asus TUF Gaming A15 FA507UV R9 8945H, NVIDIA GeForce RTX 4060 Laptop GPU, 90 Wh | Average of class Gaming | |
|---|---|---|---|---|---|---|---|
| Battery Runtime | -11% | -11% | -53% | 1% | 29% | -16% | |
| H.264 | 462 | 451 -2% | 242 -48% | 447 ? -3% | |||
| WiFi v1.3 | 544 | 483 -11% | 434 -20% | 227 -58% | 548 1% | 702 29% | 387 ? -29% |
| Cyberpunk 2077 ultra 150cd | 59 | ||||||
| Witcher 3 ultra | 57 | 74.7 ? |
Pros
Cons
结论 - 专注于游戏需要做出一些妥协
惠普 Omen 17(2024)是一款纯粹的游戏笔记本电脑,在任何地方都不会提供比必要设备更多的配置。因此,它既能为要求苛刻的游戏提供更高的计算性能,又能提供可接受的价格。
第八代 RTX 4070 和 AMD Ryzen 7 与 QHD 显示屏搭配得很好,即使其 240 赫兹的刷新率在当前的游戏中几乎不可能达到。遗憾的是,显示器的其他特性不足以在高水平上处理图像处理等任务。
快速游戏的同时,风扇噪音也很低,但 Omen 17 并没有提供更多。
成功之处还在于冷却系统的实现。惠普将 CPU 和 GPU 配置为低于其最大性能运行,充分利用了 17 英寸笔记本电脑的内部空间。即使在最高负载的情况下,风扇噪音仍然可以承受。在 "平衡 "模式下,风扇噪音甚至消失得无影无踪。
在其余所有方面,都有一些重大的妥协。连接有限,而且可用的连接速度相对较慢。网络摄像头和扬声器最多只能满足最低要求。最后,输入设备只在有限的范围内适用于游戏,因此你不仅要添加常用的游戏鼠标,还要添加合适的键盘。
虽然游戏性能相当的竞争对手往往能提供更好的整体解决方案,但它们的价格也更高。华硕 TUF GAMING AF2 是一款配置不高,甚至显示屏也较弱,但至少提供了坚实键盘的替代产品。 华硕 TUF Gaming A17 F707.华硕 TUF Gaming A17 F707 拥有两个雷电 4 接口和出色的显示屏。 宏碁掠夺者 Helios Neo 16显然是一款更好的笔记本电脑。但如果我们只考虑纯粹的游戏性能,这两款笔记本电脑的速度都没有明显提升,只是声音更大而已。
价格和供应情况
惠普 Omen 17(2024)可直接从惠普购买,999 美元起。您可以配置组件,我们测试的配置为 RTX 4070 和 QHD 显示屏,价格约为 1660 美元。亚马逊提供配备相同处理器但使用 RTX 4050 的机型,售价约为 1500 美元。
请注意,我们最近更新了评级系统,第 8 版的结果已不能与第 7 版相比。您可以在 这里.
HP Omen 17-db0079ng
- 07/22/2024 v8
Mario Petzold
 Total Sustainability Score:
 Transparency
The selection of devices to be reviewed is made by our editorial team. The test sample was provided to the author as a loan by the manufacturer or retailer for the purpose of this review. The lender had no influence on this review, nor did the manufacturer receive a copy of this review before publication. There was no obligation to publish this review. We never accept compensation or payment in return for our reviews. As an independent media company, Notebookcheck is not subjected to the authority of manufacturers, retailers or publishers.
This is how Notebookcheck is testing
Every year, Notebookcheck independently reviews hundreds of laptops and smartphones using standardized procedures to ensure that all results are comparable. We have continuously developed our test methods for around 20 years and set industry standards in the process. In our test labs, high-quality measuring equipment is utilized by experienced technicians and editors. These tests involve a multi-stage validation process. Our complex rating system is based on hundreds of well-founded measurements and benchmarks, which maintains objectivity. Further information on our test methods can be found here.
Price comparison

