

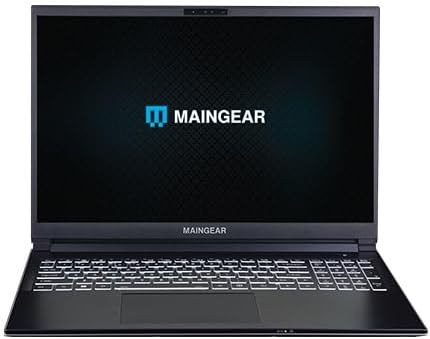
Maingear ML-16 MK2 笔记本电脑评测: GeForce RTX 4070 性能卓越,价格实惠

与 Schenker 或 Eurocom 类似,Maingear 也是高性能白牌笔记本电脑的经销商,旨在吸引游戏玩家和专业人士。与戴尔、联想或惠普等知名 PC 制造商相比,Maingear 的笔记本电脑都是自己设计的。Maingear 的最新机型是 ML-16 MK2,配备了最新的英特尔流星湖 CPU 和 Nvidia GPU。
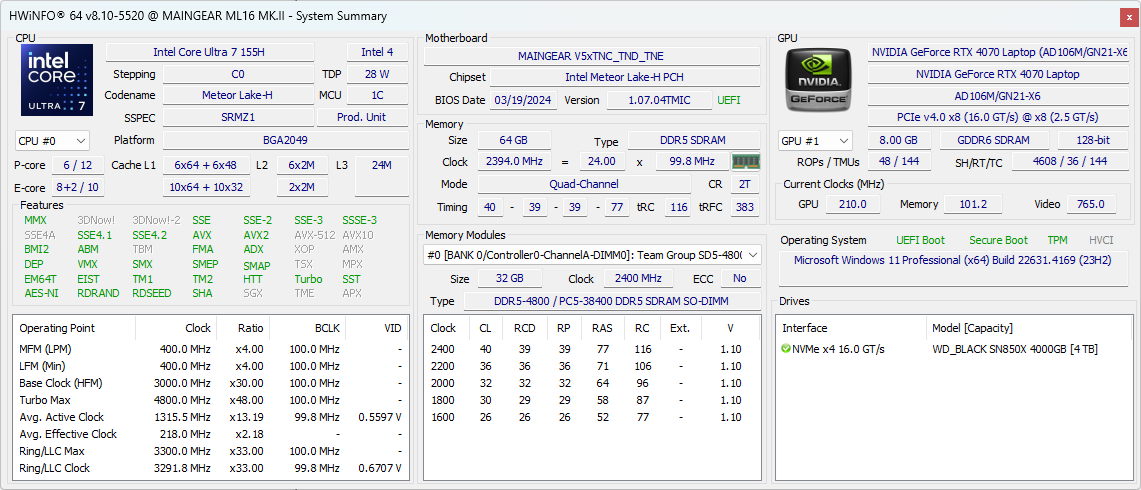
我们的测试机完全配置了酷睿 7 155H、105 WGeForce RTX 4070 和 240 Hz 1600p IPS 显示屏,售价约为 2000 美元。较少的 SKU 则配备了 RTX 4060,但 CPU 和显示器仍然固定。
ML-16 MK2 的竞争对手包括其他超薄 16 英寸游戏笔记本电脑,如 雷蛇刀锋 16, Alienware x16 R2, 华硕 ROG Zephyrus G16或 联想Legion Pro 7 16.
更多 Maingear 评论:
- Vector Pro
- 矢量 15
- Nomad 15
潜在的竞争对手比较
Rating | Version | Date | Model | Weight | Height | Size | Resolution | Price |
|---|---|---|---|---|---|---|---|---|
| 80.9 % | v8 | 09 / 2024 | Maingear ML-16 MK2 Ultra 7 155H, NVIDIA GeForce RTX 4070 Laptop GPU | 2.1 kg | 19.9 mm | 16.00" | 2560x1600 | |
| 85.9 % | v8 | 08 / 2024 | Asus ROG Zephyrus G16 GA605WV Ryzen AI 9 HX 370, NVIDIA GeForce RTX 4060 Laptop GPU | 1.8 kg | 17.2 mm | 16.00" | 2560x1600 | |
| 84.3 % v7 (old) | v7 (old) | 05 / 2024 | HP Victus 16 (2024) i7-14700HX, NVIDIA GeForce RTX 4060 Laptop GPU | 2.4 kg | 23.9 mm | 16.10" | 1920x1080 | |
| 88.4 % v7 (old) | v7 (old) | 05 / 2024 | Alienware x16 R2 P120F Ultra 9 185H, NVIDIA GeForce RTX 4080 Laptop GPU | 2.7 kg | 18.57 mm | 16.00" | 2560x1600 | |
| 89.3 % v7 (old) | v7 (old) | 04 / 2024 | Lenovo Legion Pro 5 16IRX9 i9-14900HX, NVIDIA GeForce RTX 4070 Laptop GPU | 2.5 kg | 26.95 mm | 16.00" | 2560x1600 | |
| 91.1 % v7 (old) | v7 (old) | 02 / 2024 | Razer Blade 16 2024, RTX 4090 i9-14900HX, NVIDIA GeForce RTX 4090 Laptop GPU | 2.5 kg | 22 mm | 16.00" | 2560x1600 |
注:我们最近更新了评级系统,第 8 版的结果与第 7 版的结果不具可比性。更多信息 此处.
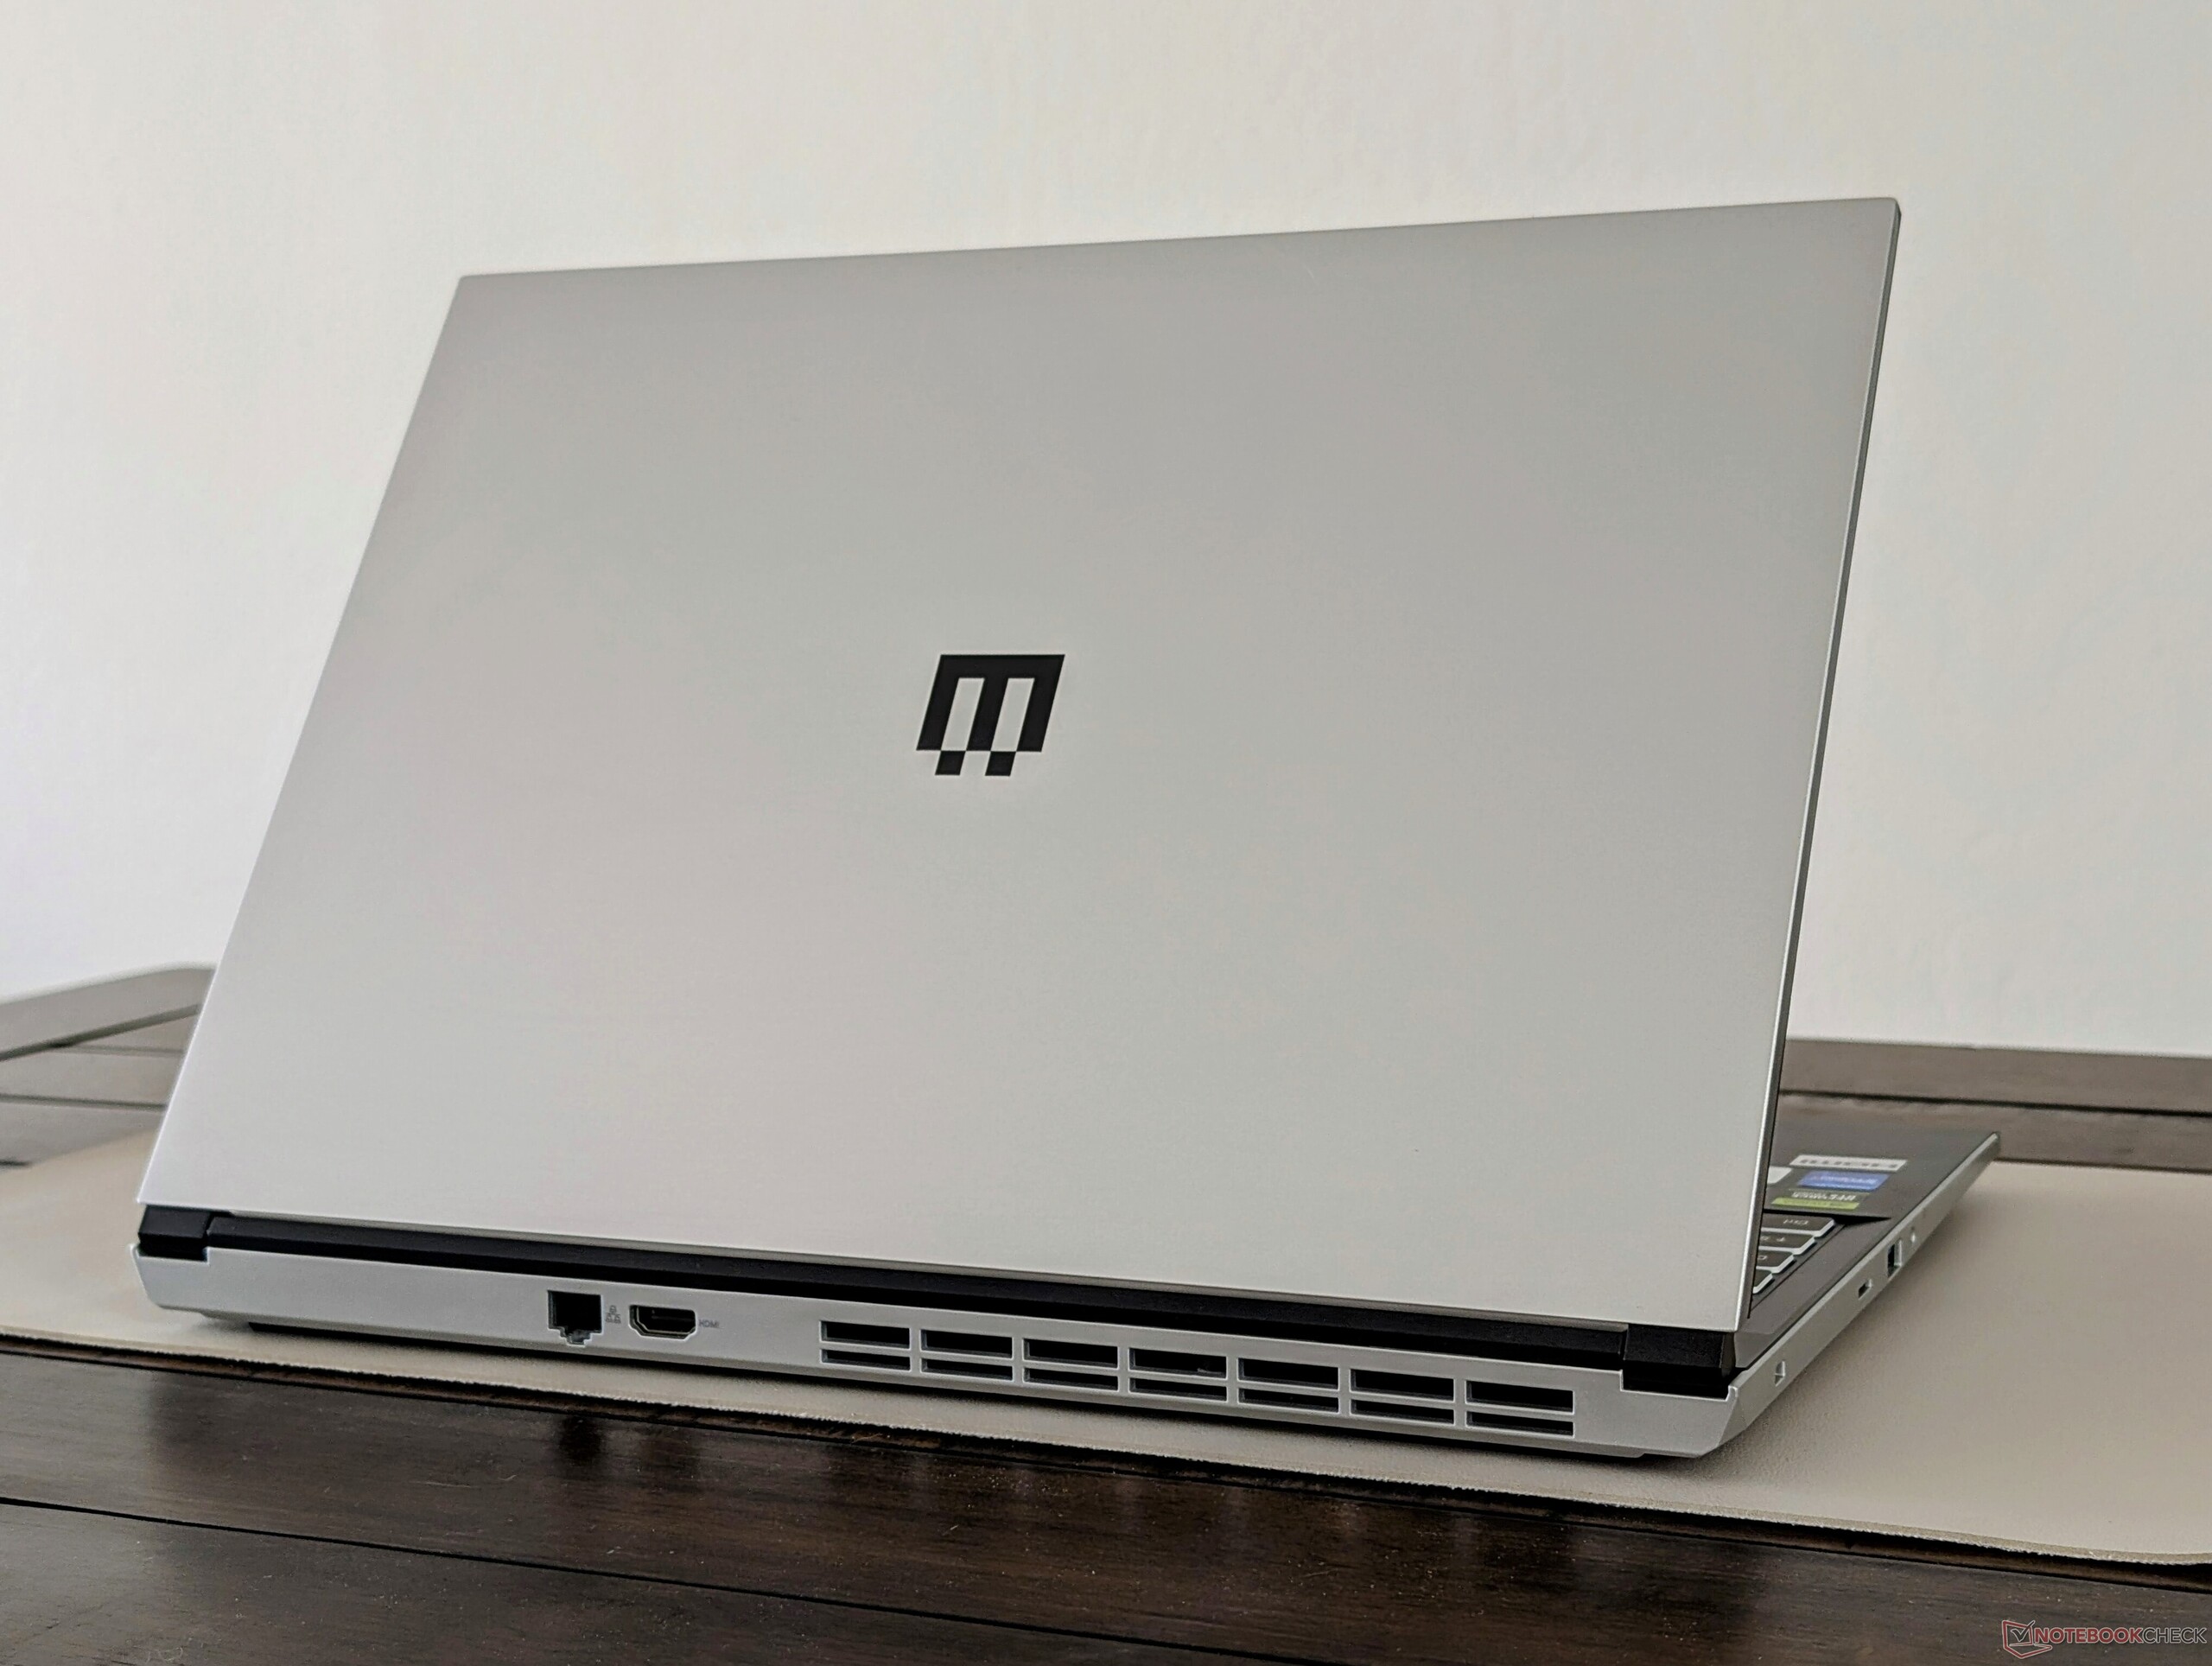
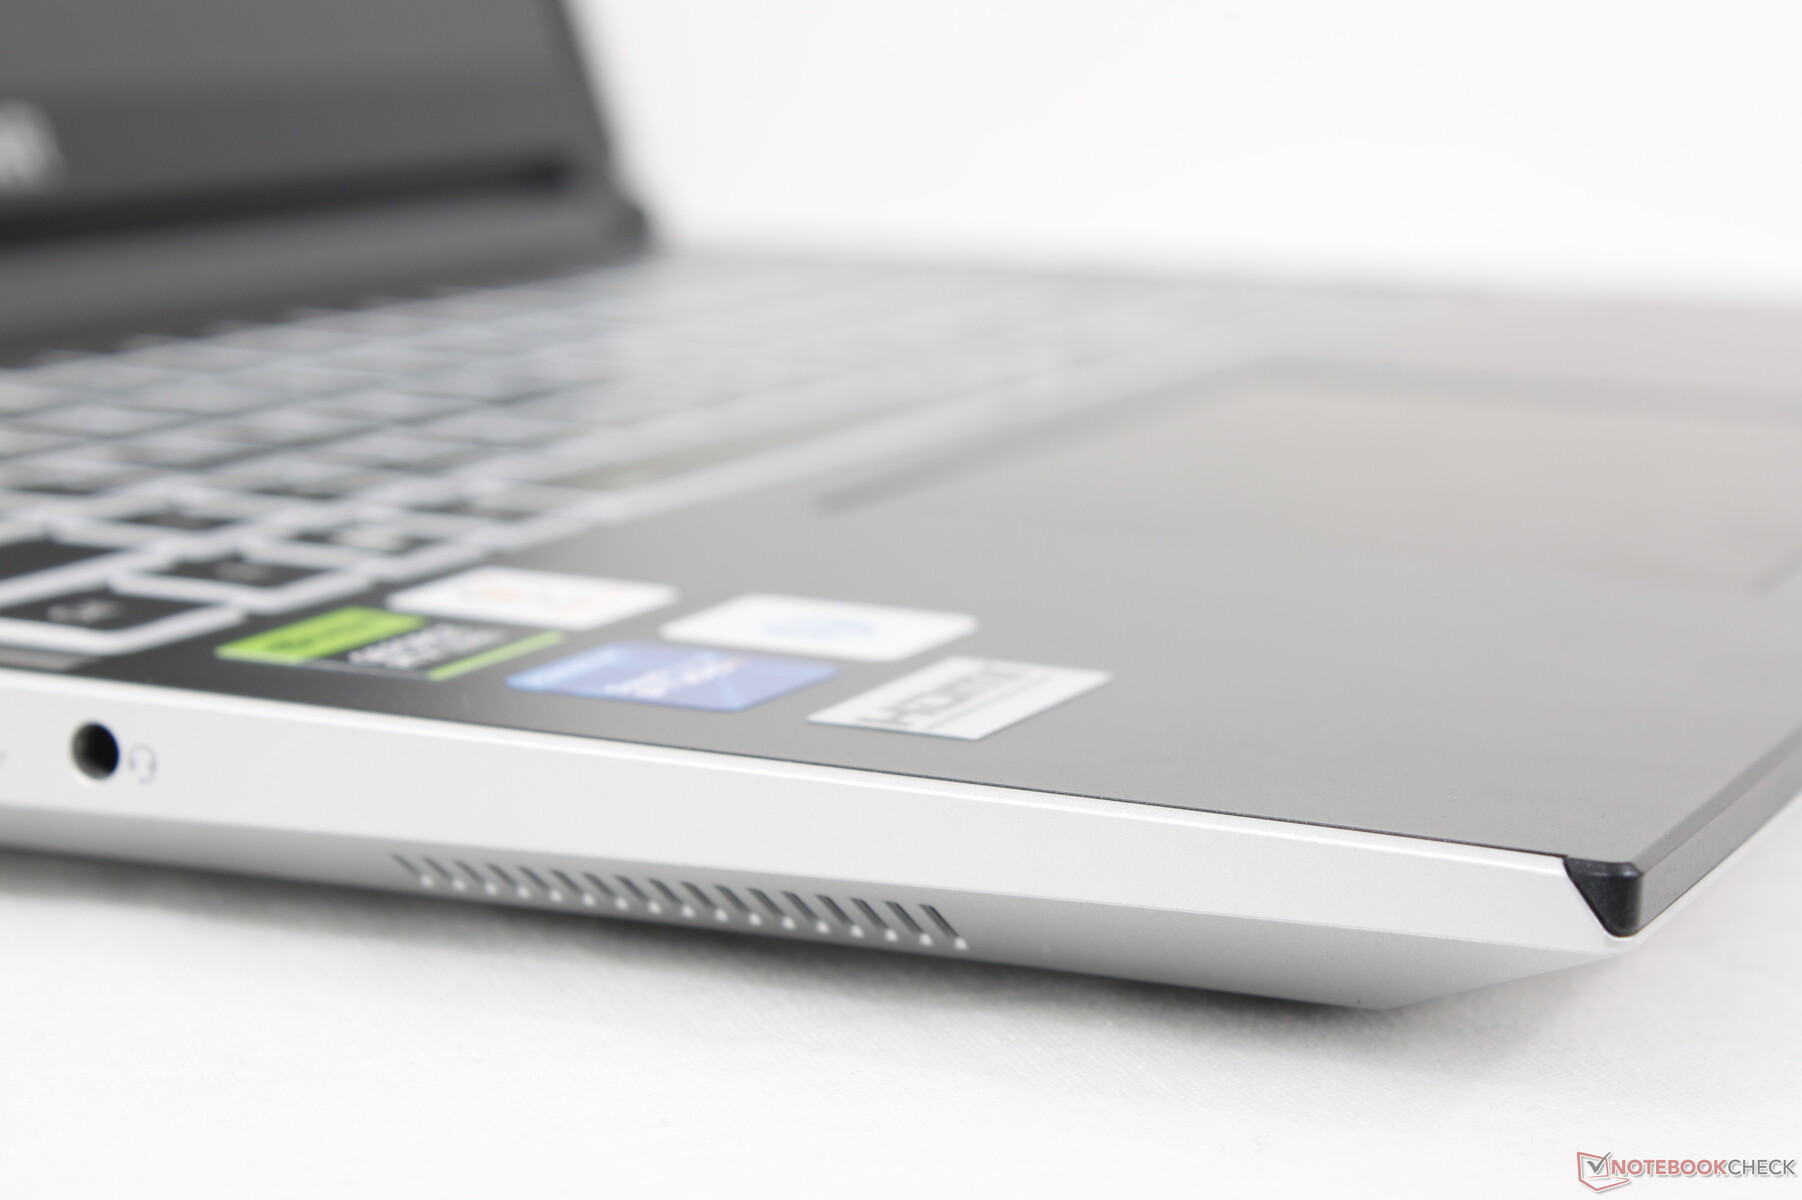
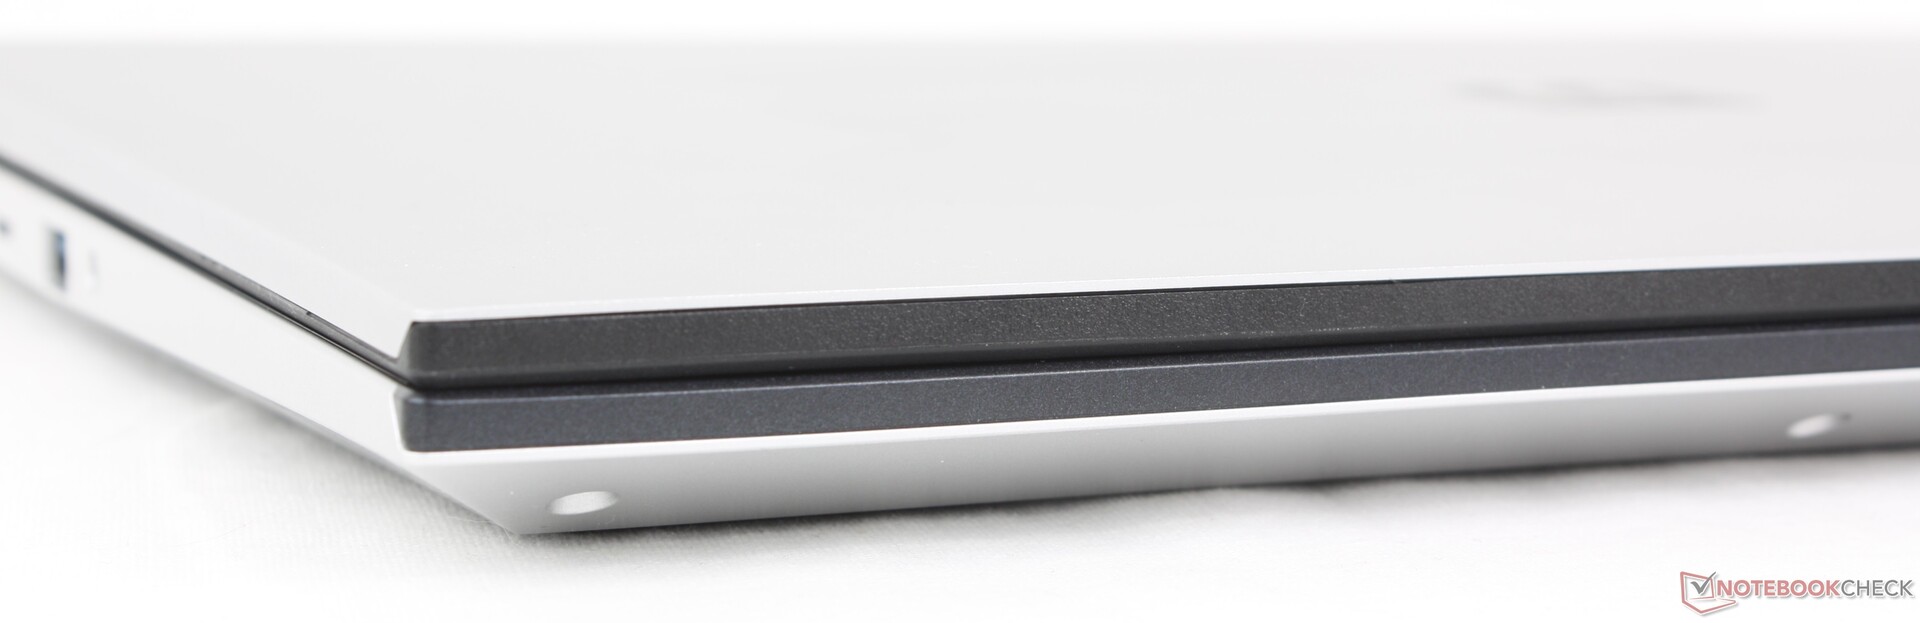
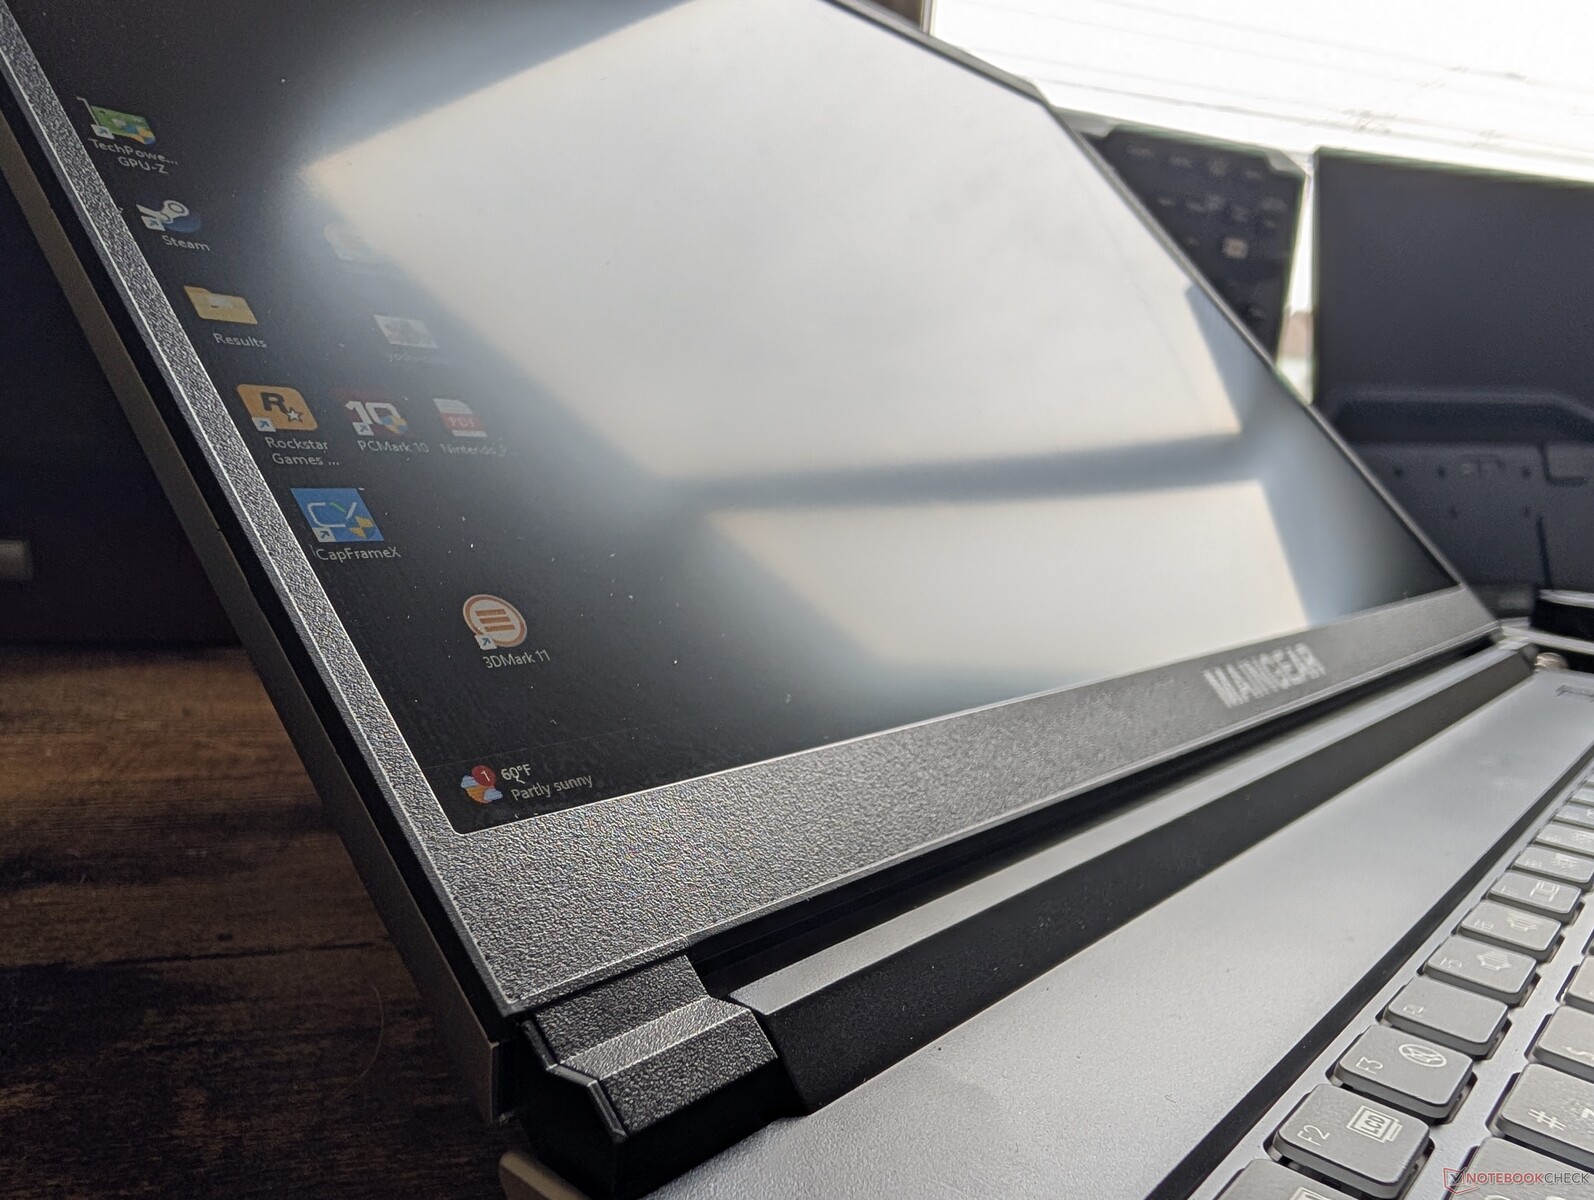
外壳 - 薄而锋利
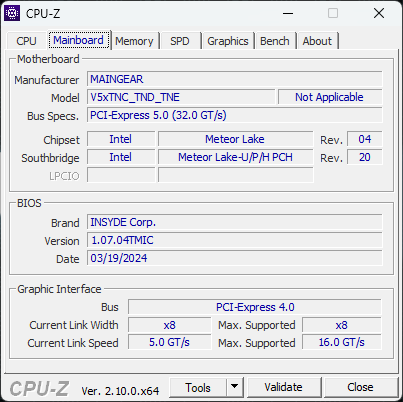
根据原产地制造商可追溯到 Clevo (V560TNE-S)。它的外盖和底部主要由铝金属制成,而黑色的键盘面板则是塑料材质。两种对比鲜明的颜色搭配在一起,有助于在视觉上将该机型与常见的全黑或哑光白色游戏笔记本电脑区分开来。
不过,机箱质量并没有反映出高昂的售价。机身表面更容易翘起,感觉不如竞争对手如 雷蛇刀锋 16或 Alienware x16 R2 等竞争对手。例如,用手指按压键盘中心或外盖,表面会明显凹陷。在调整角度时,键盘盖也更容易摇晃。操作 ML-16 MK2 时要更加小心,否则可能会损坏小铰链。
重量和厚度比主要竞争对手更轻更薄,包括 Blade 16 或 Lenovo Pro 5。 联想Legion Pro 5 16IRX9.华硕 ROG Zephyrus G16 比我们的 Maingear 更薄、更轻,但售价也高出数百美元。
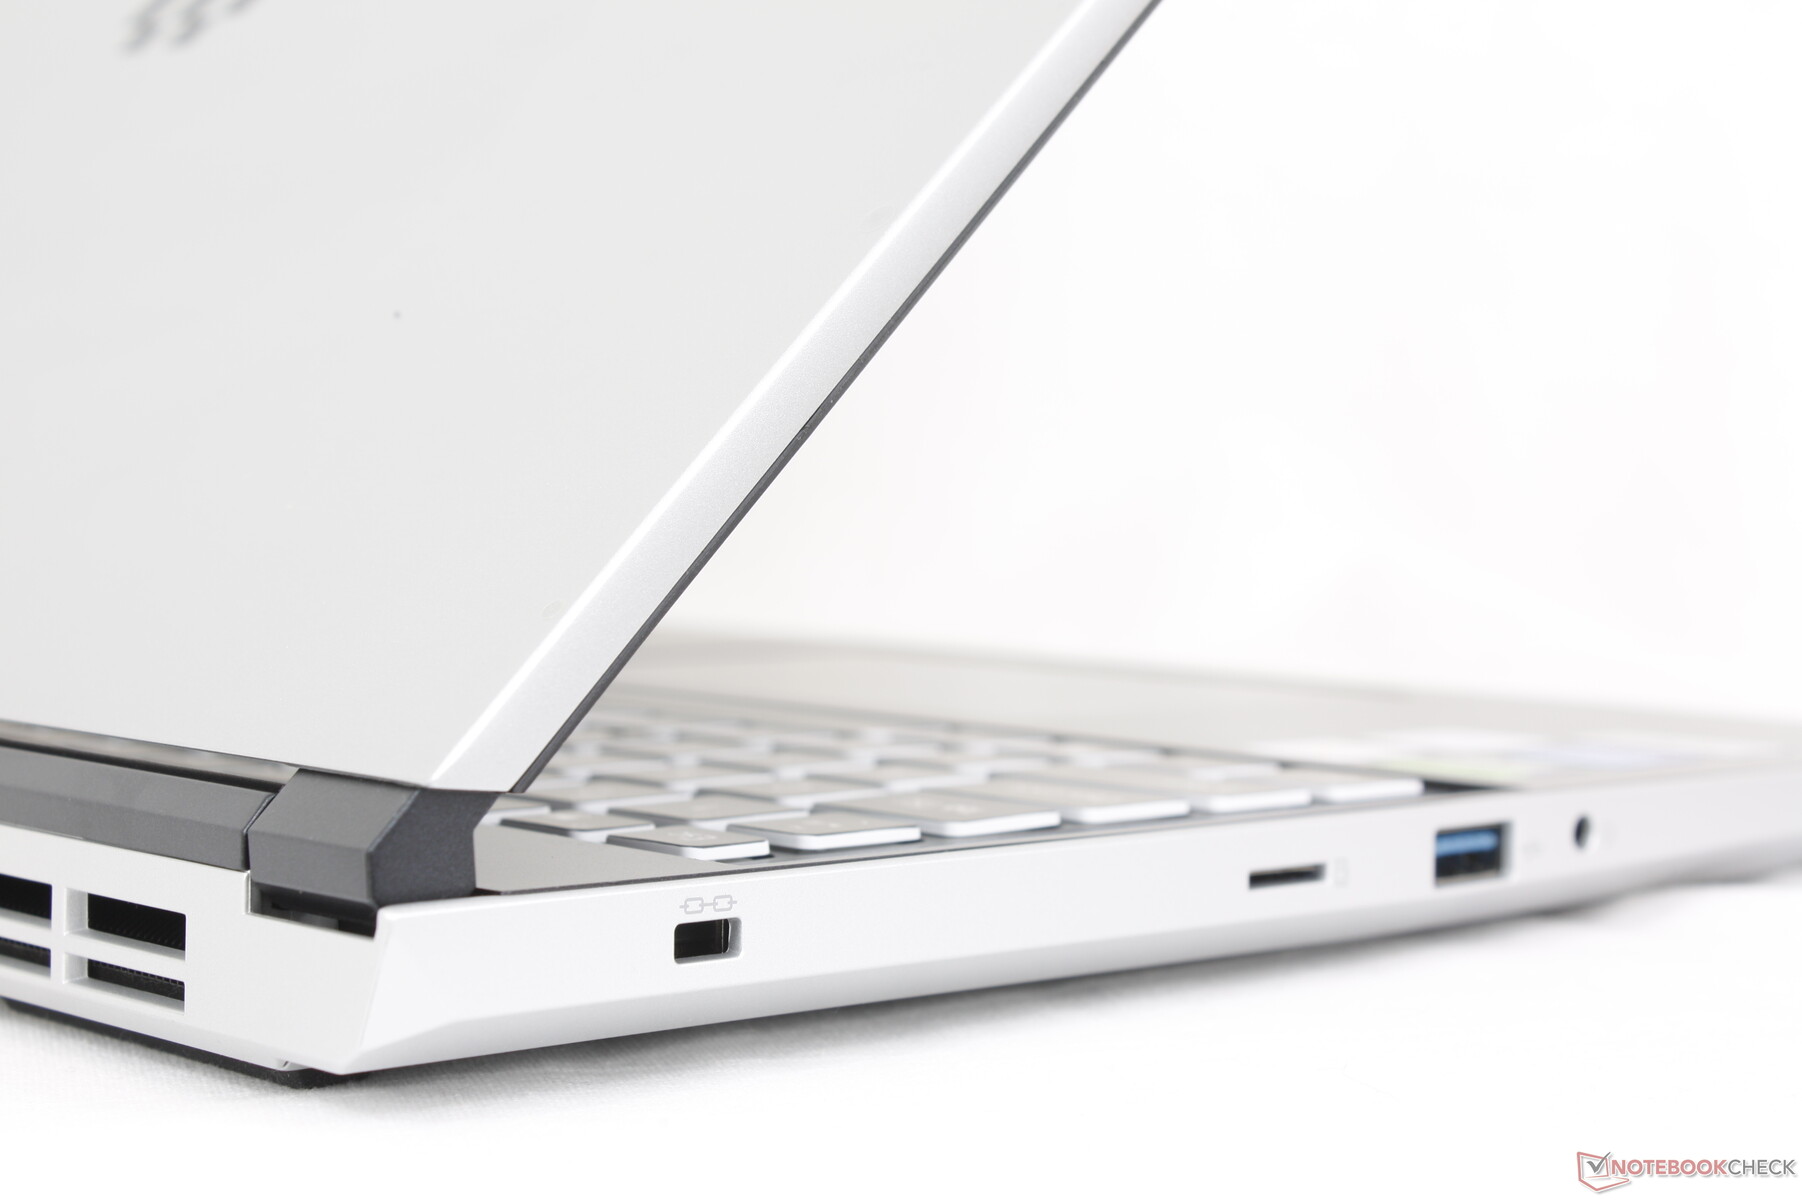
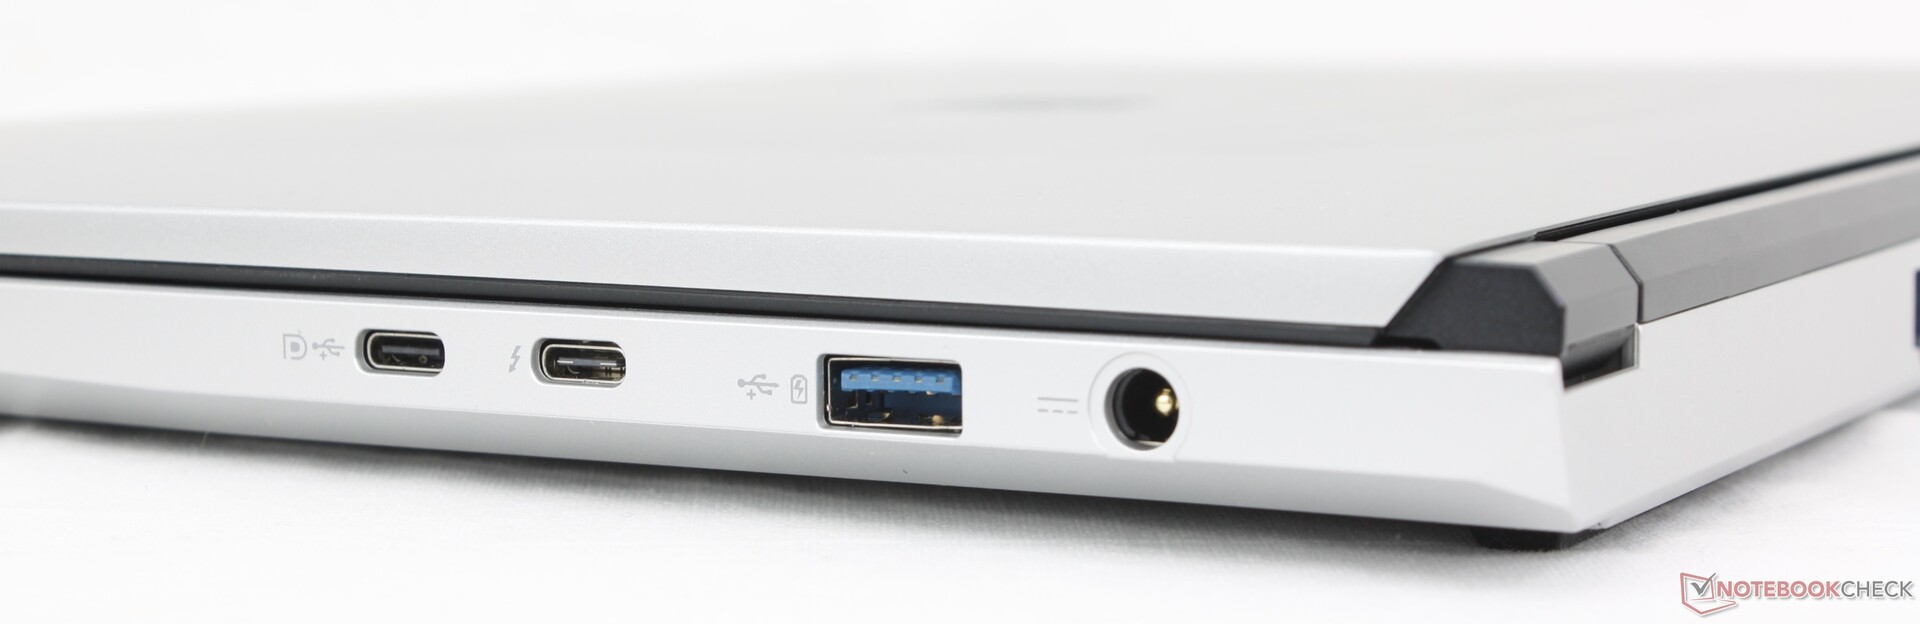
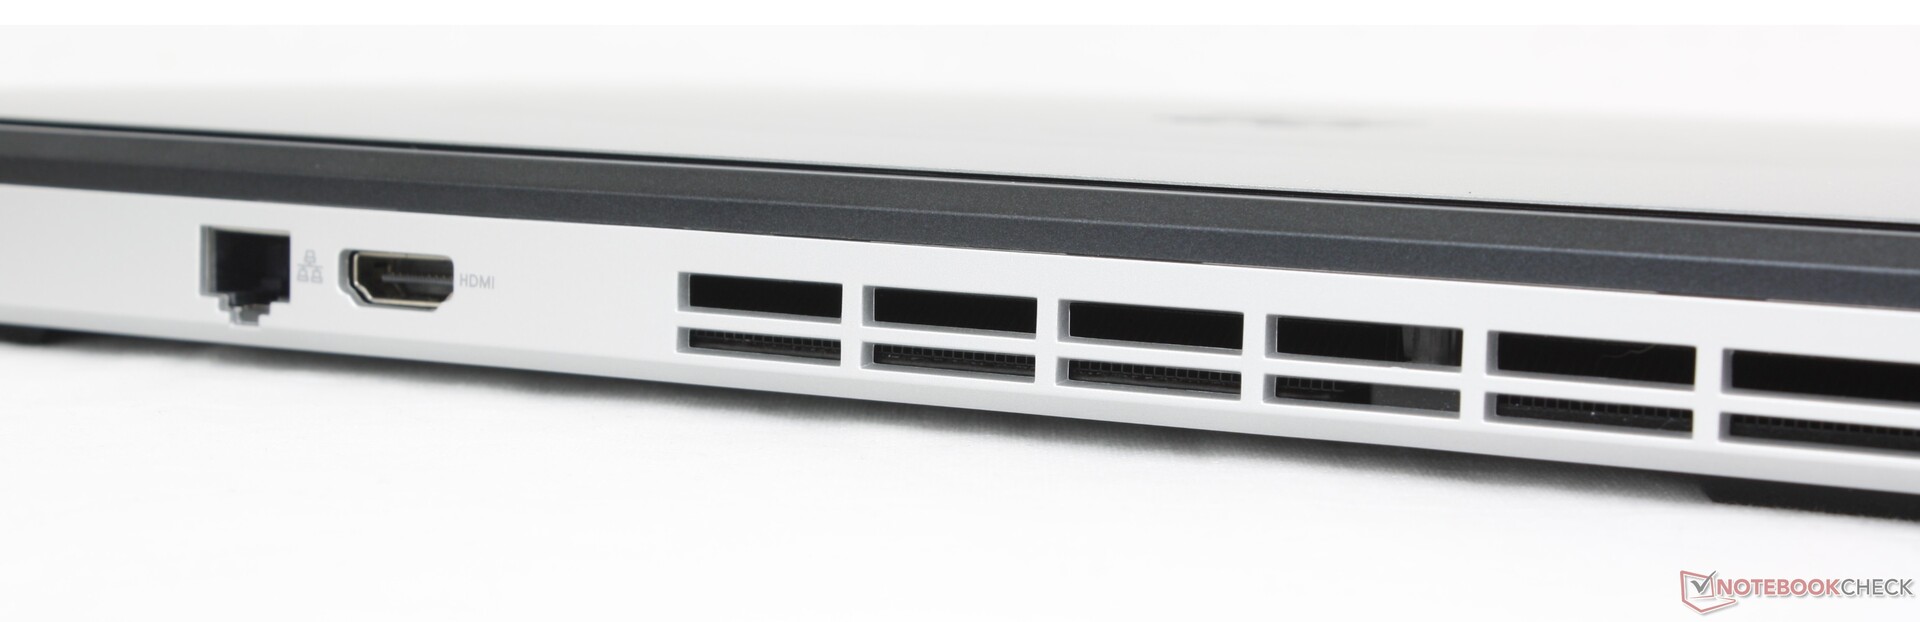
连接性
虽然少了几个端口,但端口还是很丰富的。例如,Blade 16 包含更多 USB-A 端口,而 Alienware x16 R2 则包含一个迷你 DisplayPort。端口位置不错,不像上述 Alienware 系统那样过于拥挤。
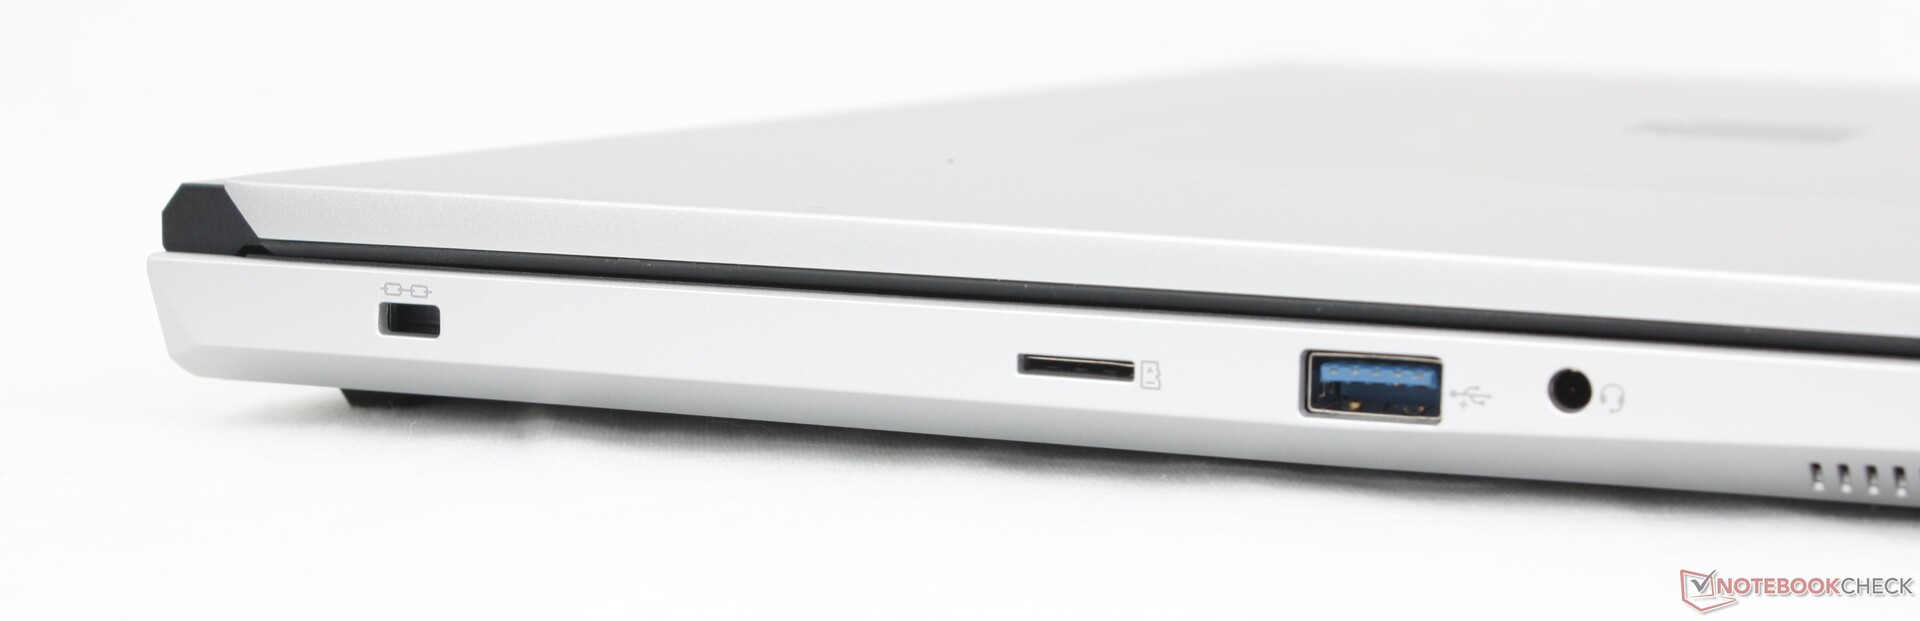
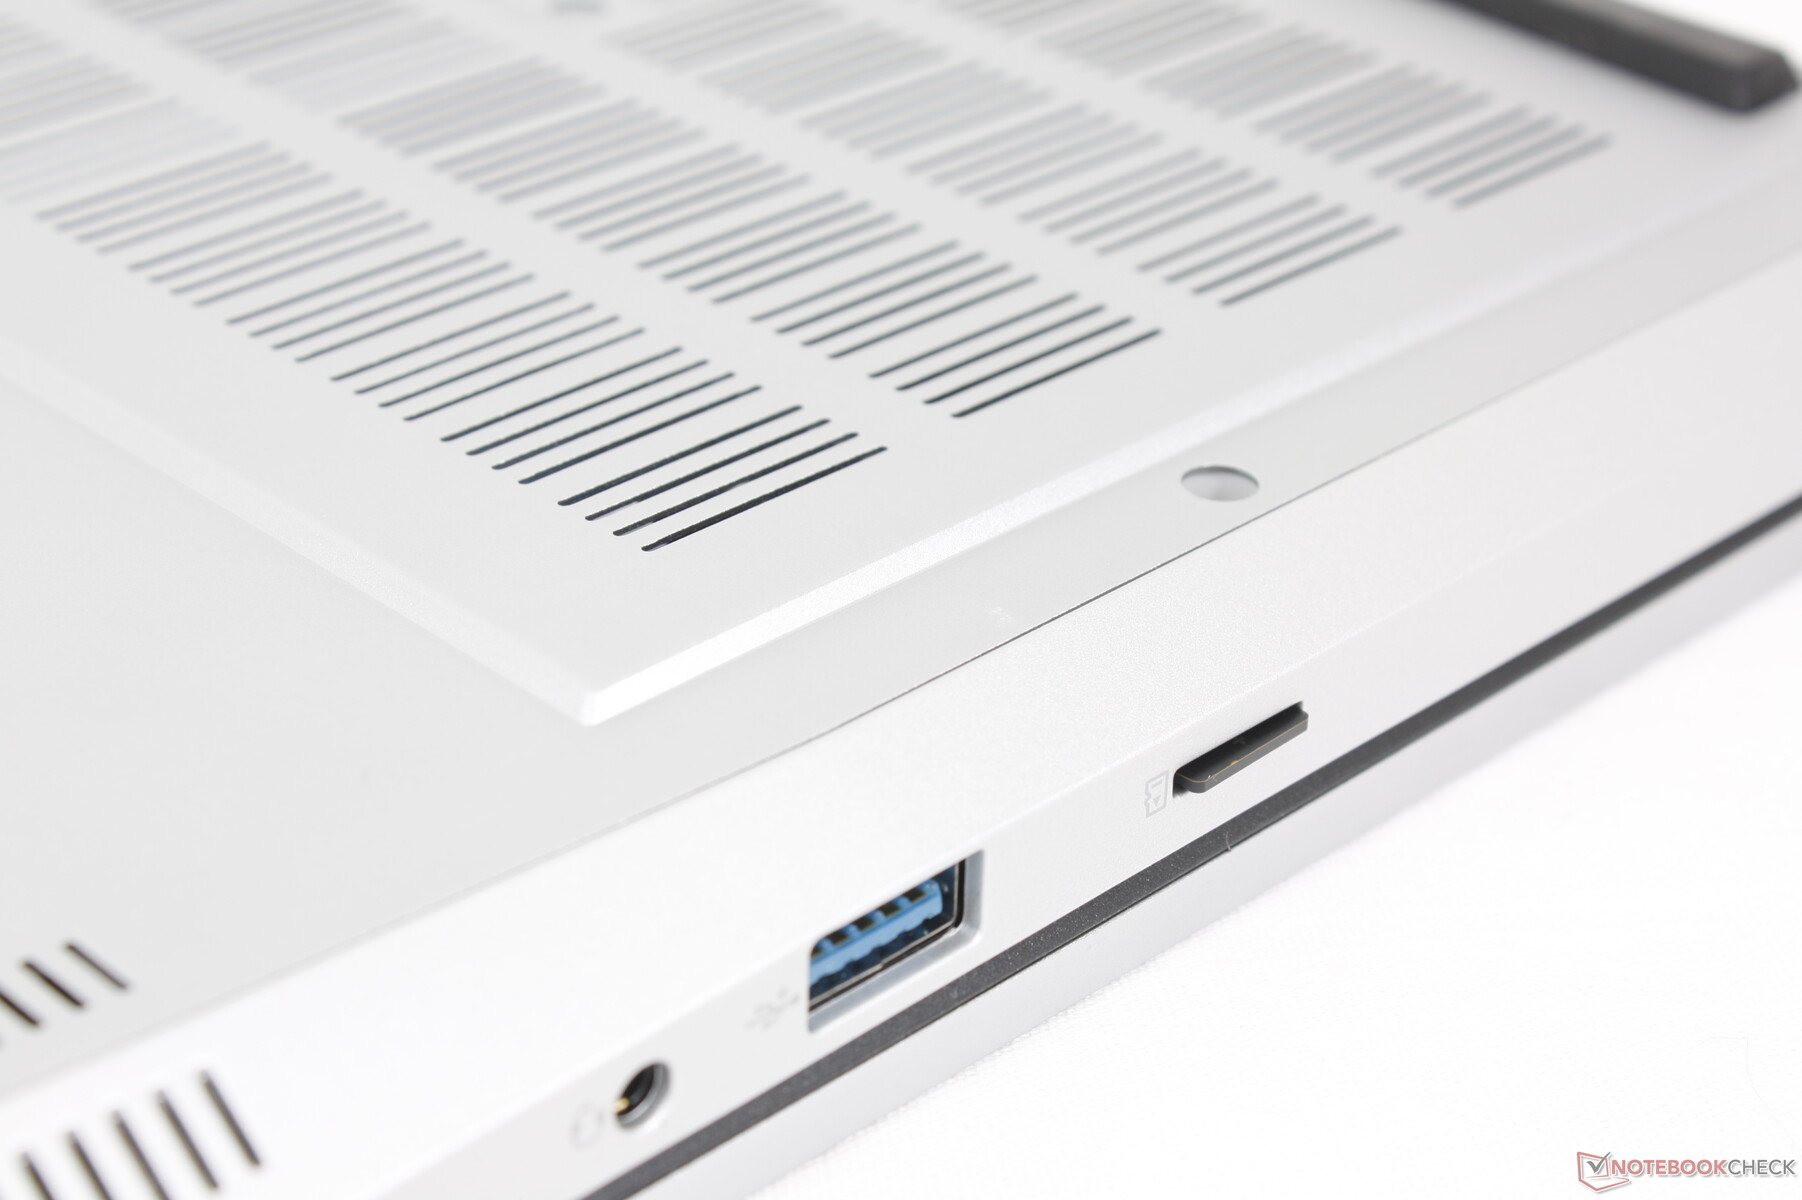
SD 读卡器
虽然我们很高兴能有一个小型的 MicroSD 读卡器,而不是没有 SD 读卡器,但这里的读卡器速度很慢,尤其是对于一款 16 英寸的游戏笔记本电脑来说。从我们的 UHS-II 测试卡中传输 1 GB 的图片需要大约 25 秒,而在刀锋 16 上只需要 6 秒。刀锋 16.
| SD Card Reader | |
| average JPG Copy Test (av. of 3 runs) | |
| Razer Blade 16 2024, RTX 4090 | |
| Alienware x16 R2 P120F (AV PRO microSD 128 GB V60) | |
| Maingear ML-16 MK2 (AV PRO microSD 128 GB V60) | |
| maximum AS SSD Seq Read Test (1GB) | |
| Alienware x16 R2 P120F (AV PRO microSD 128 GB V60) | |
| Razer Blade 16 2024, RTX 4090 | |
| Maingear ML-16 MK2 (AV PRO microSD 128 GB V60) | |
交流
英特尔 AX211 标配 Wi-Fi 6E 和蓝牙 5.3 连接。与 AXE11000 测试路由器配对时,我们体验到了稳定的传输速率,没有出现任何问题。
网络摄像头
标配的 200 万像素网络摄像头带有红外功能和电子快门,可与竞争对手媲美。


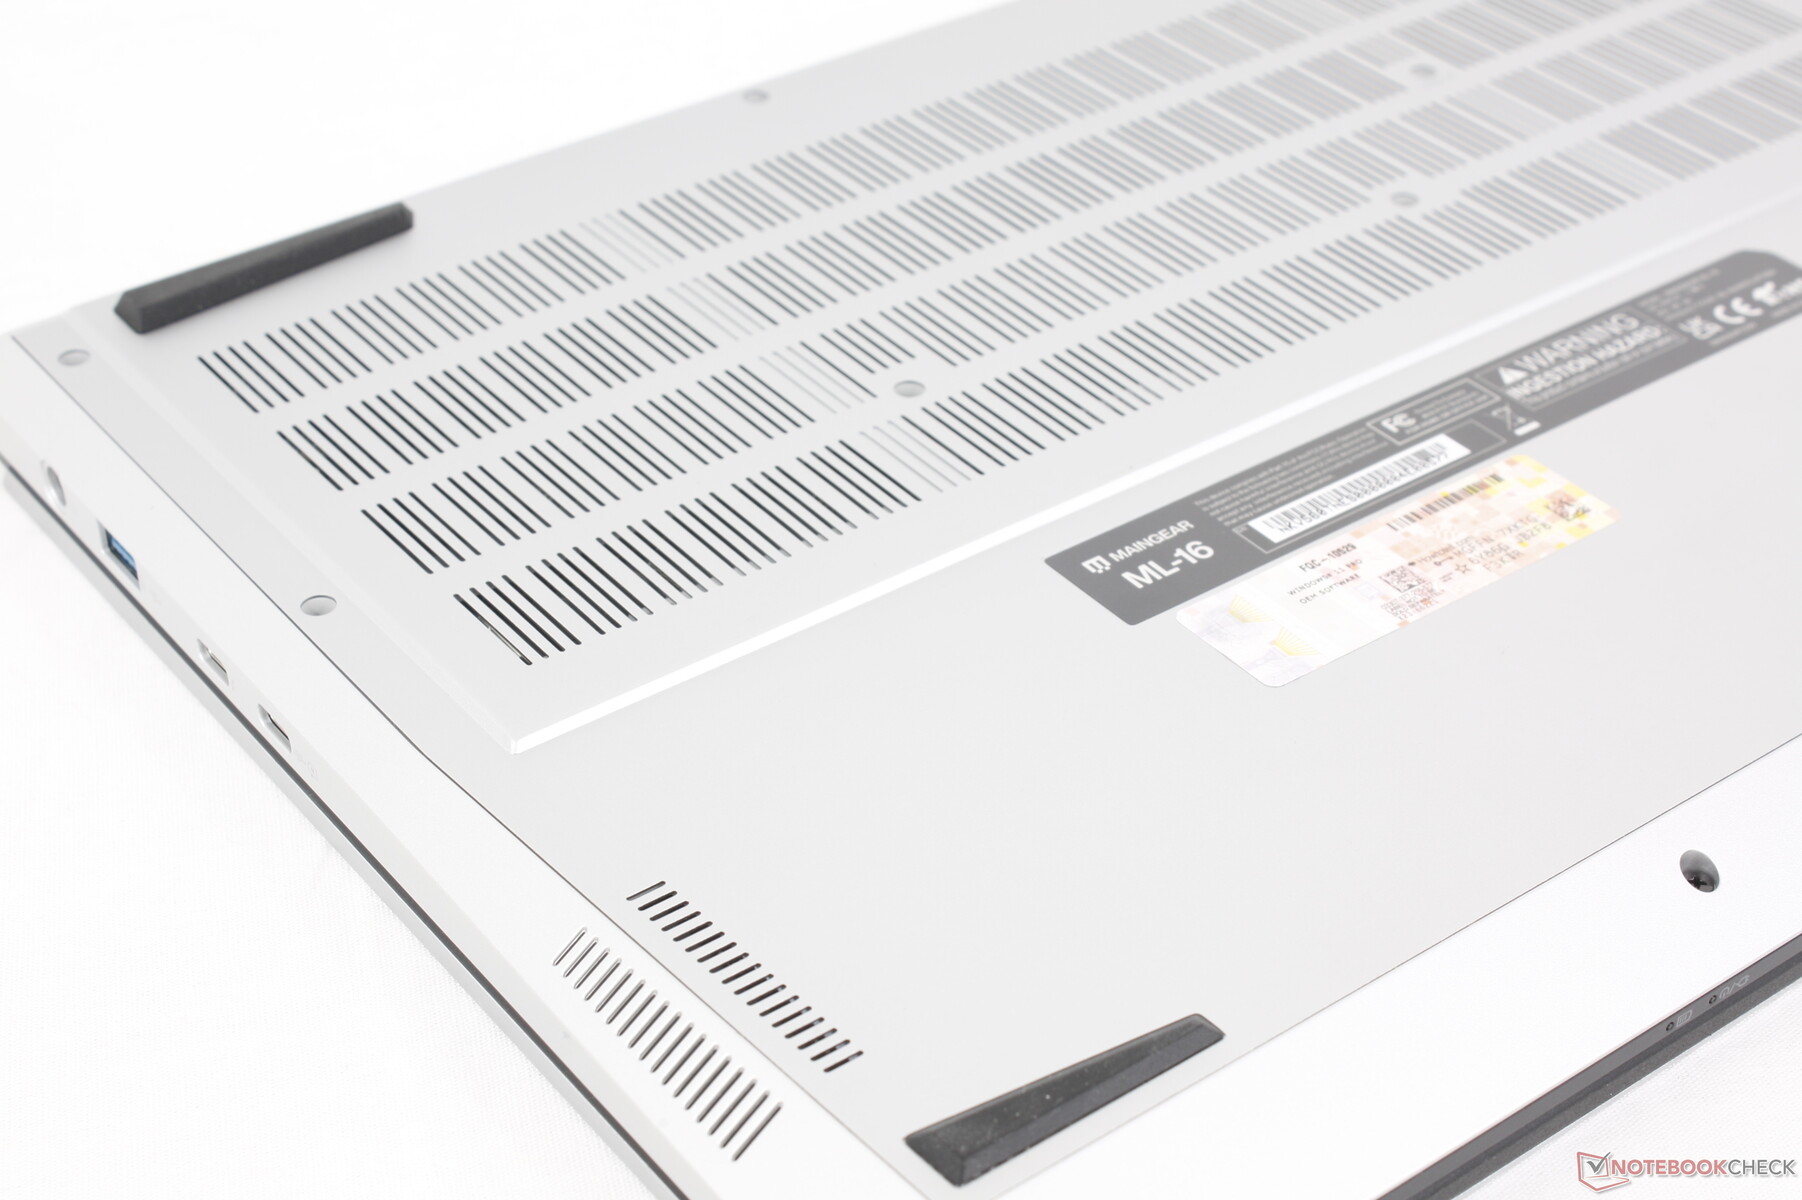
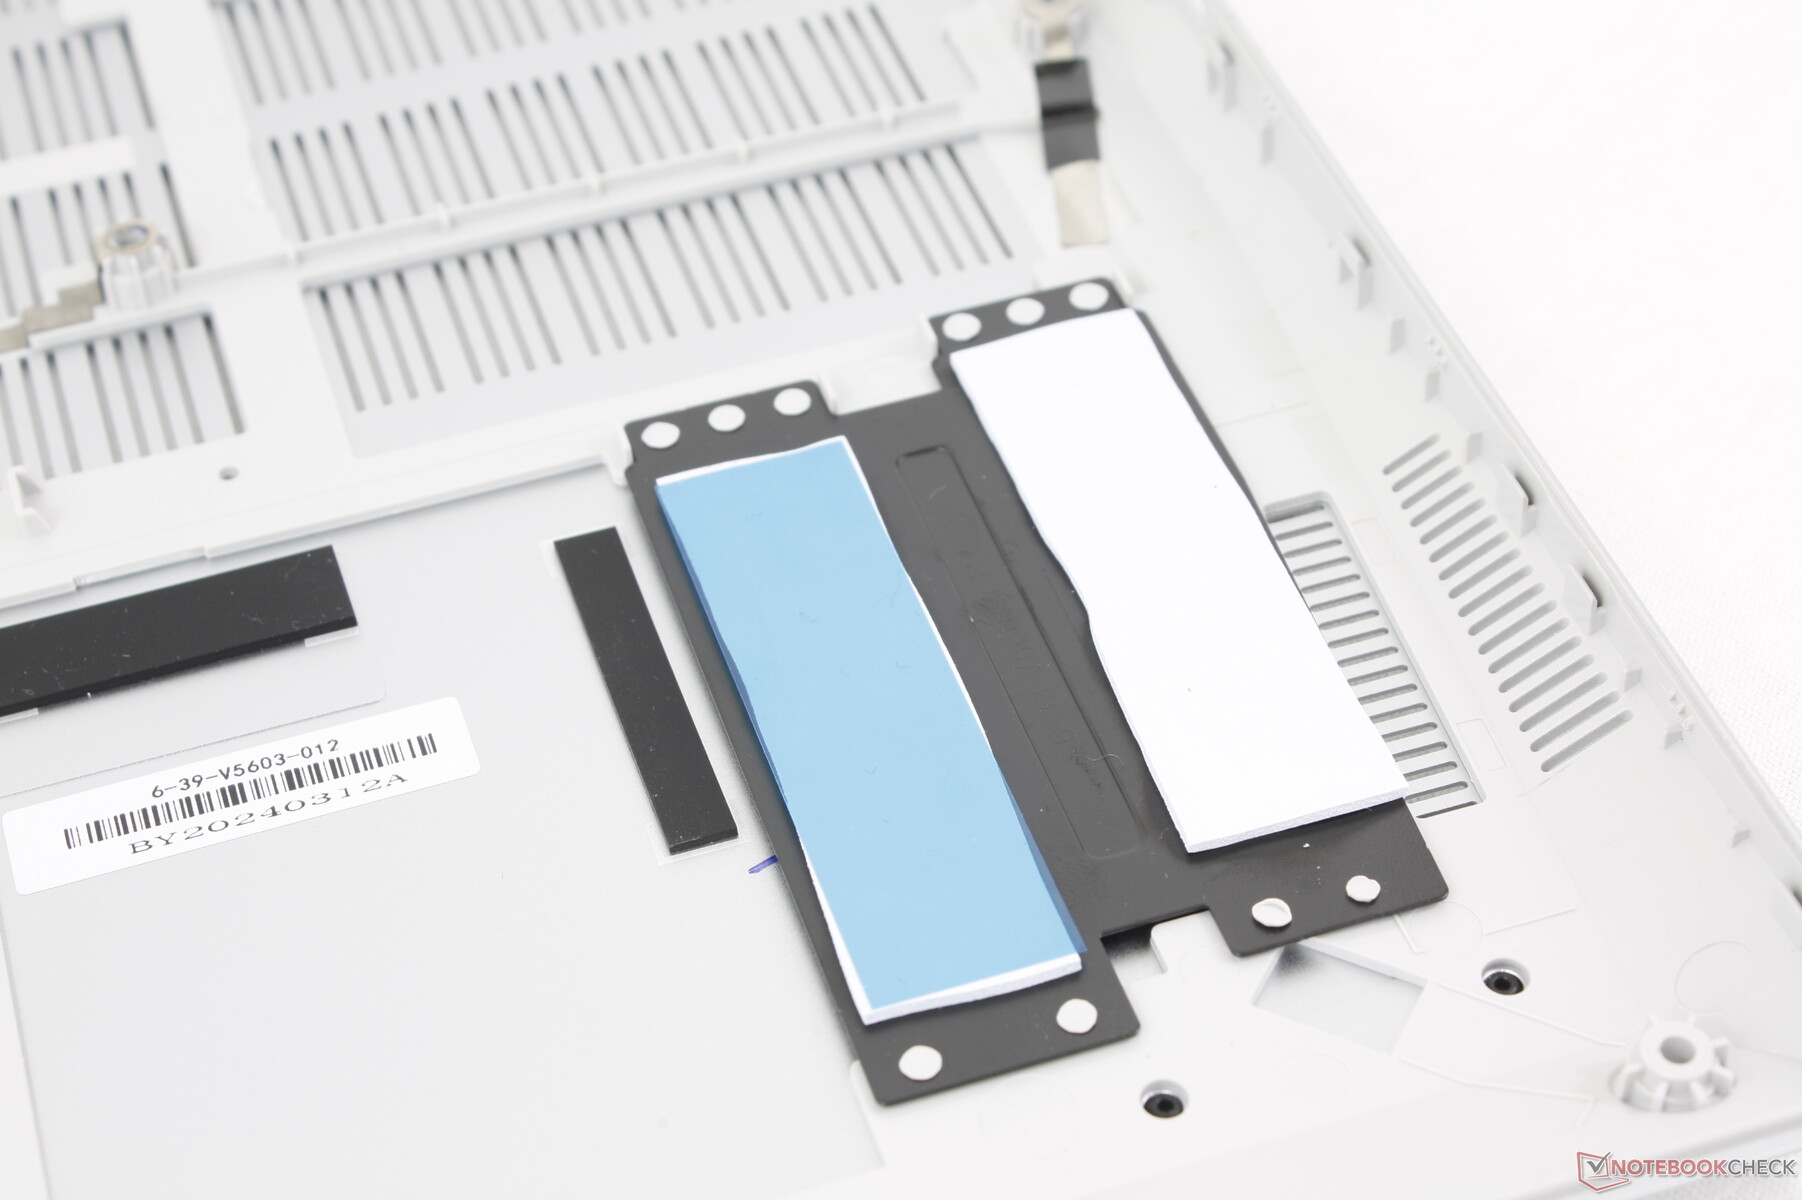
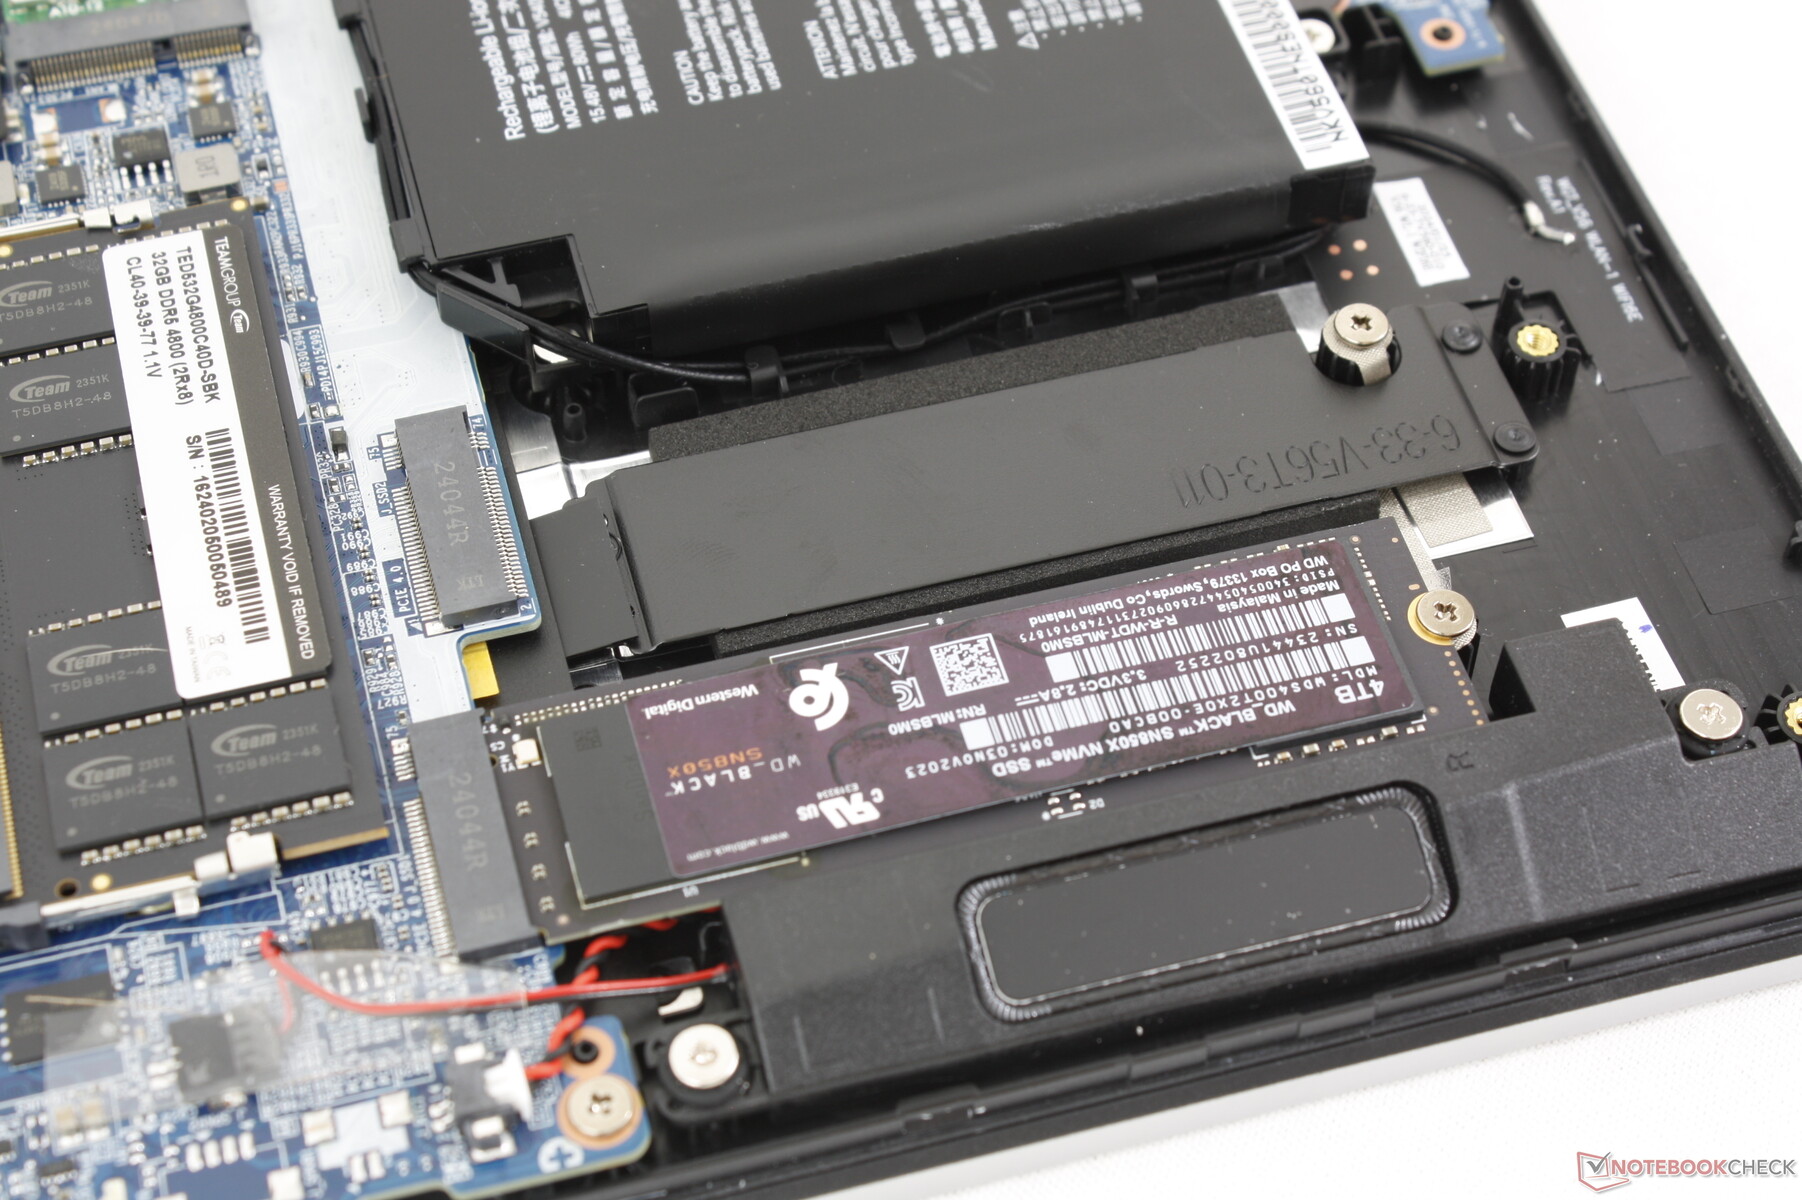
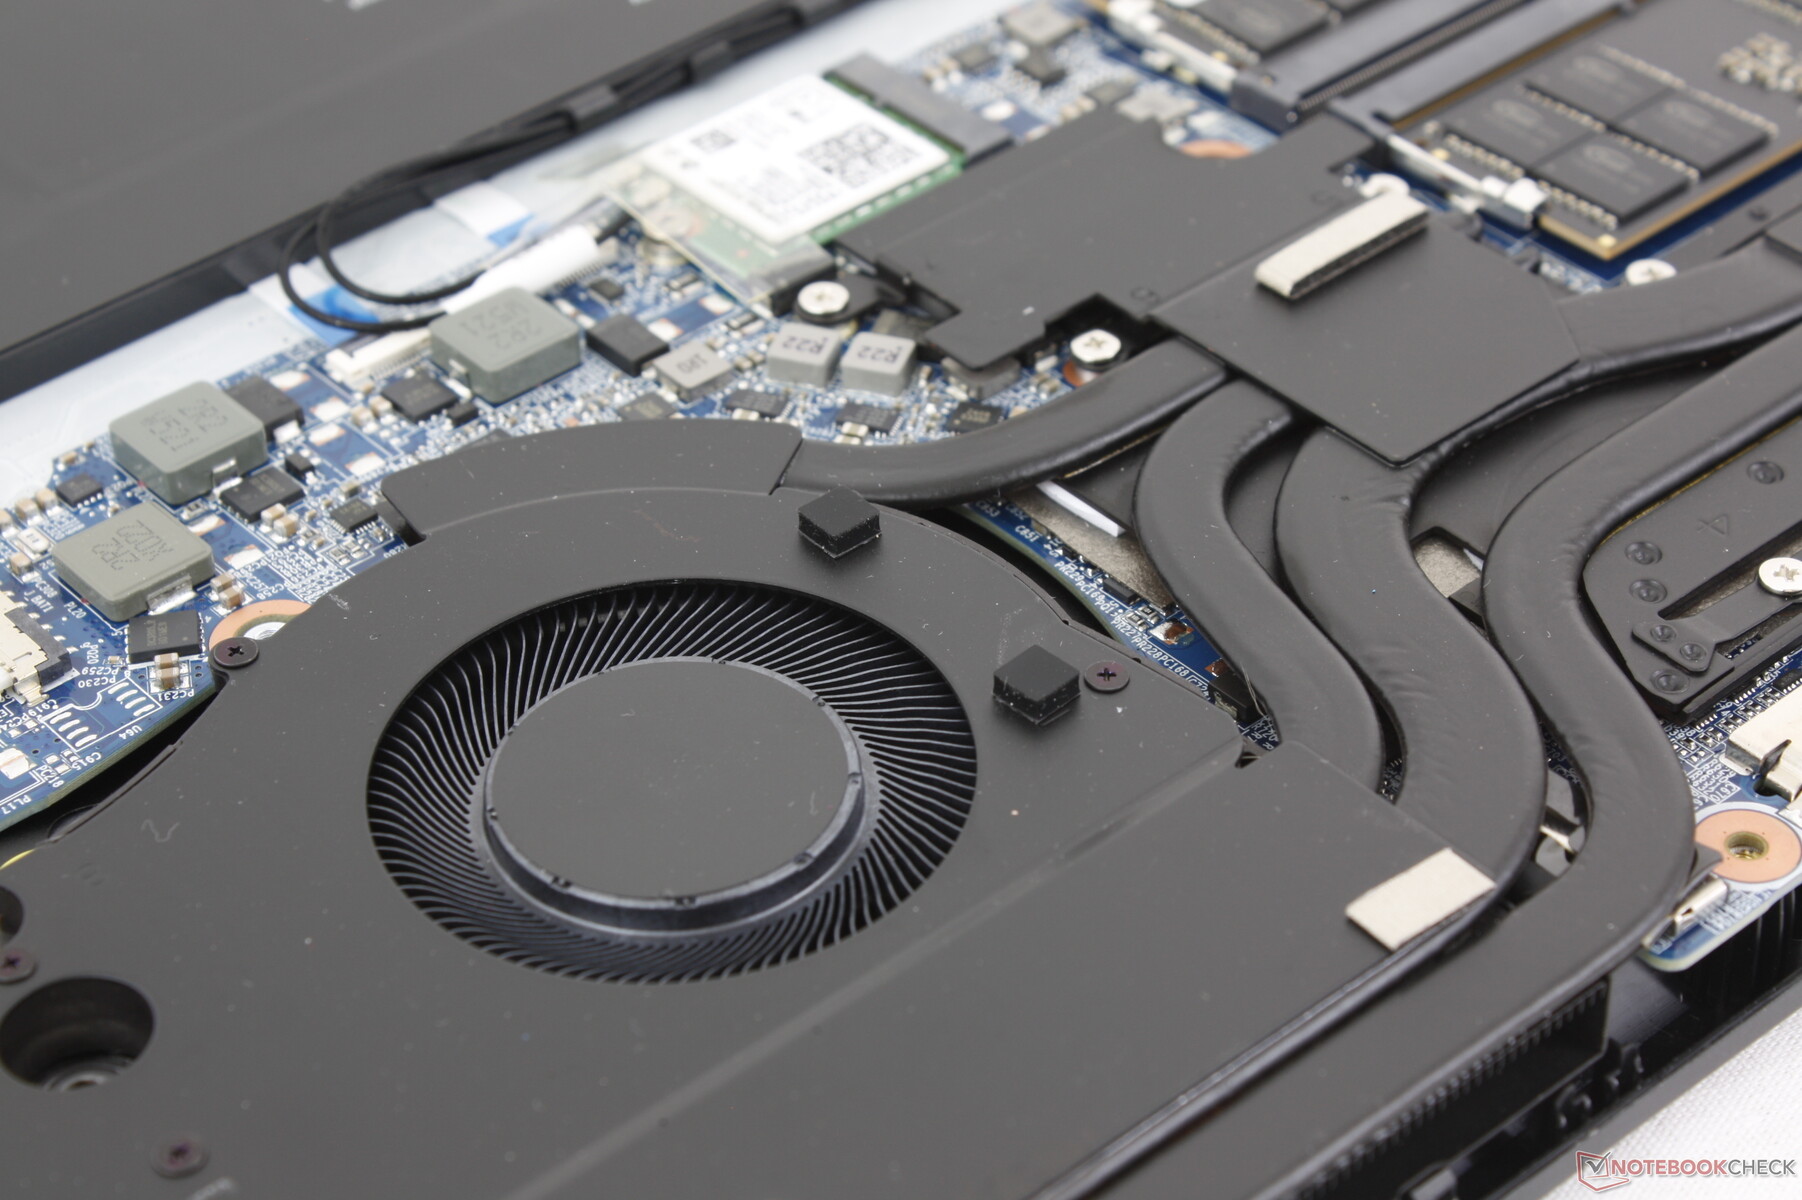
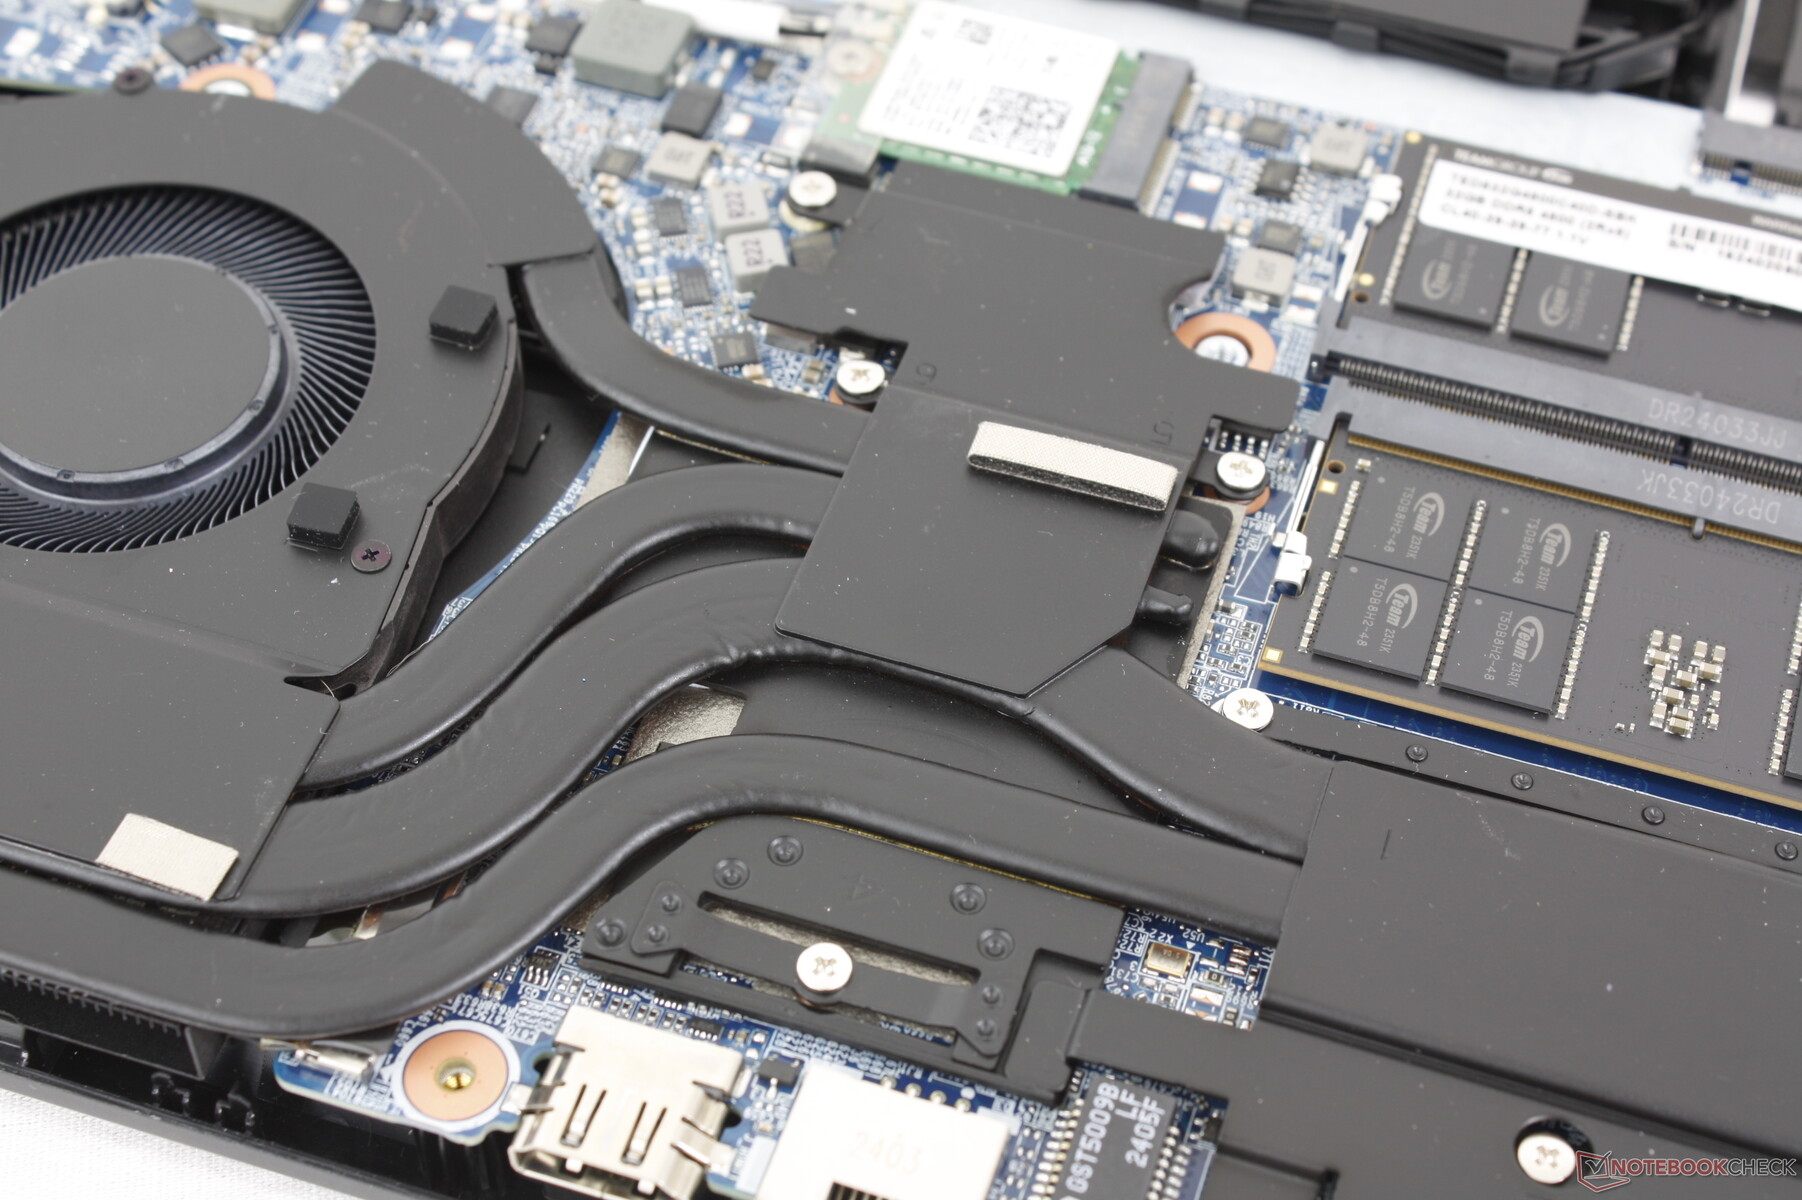
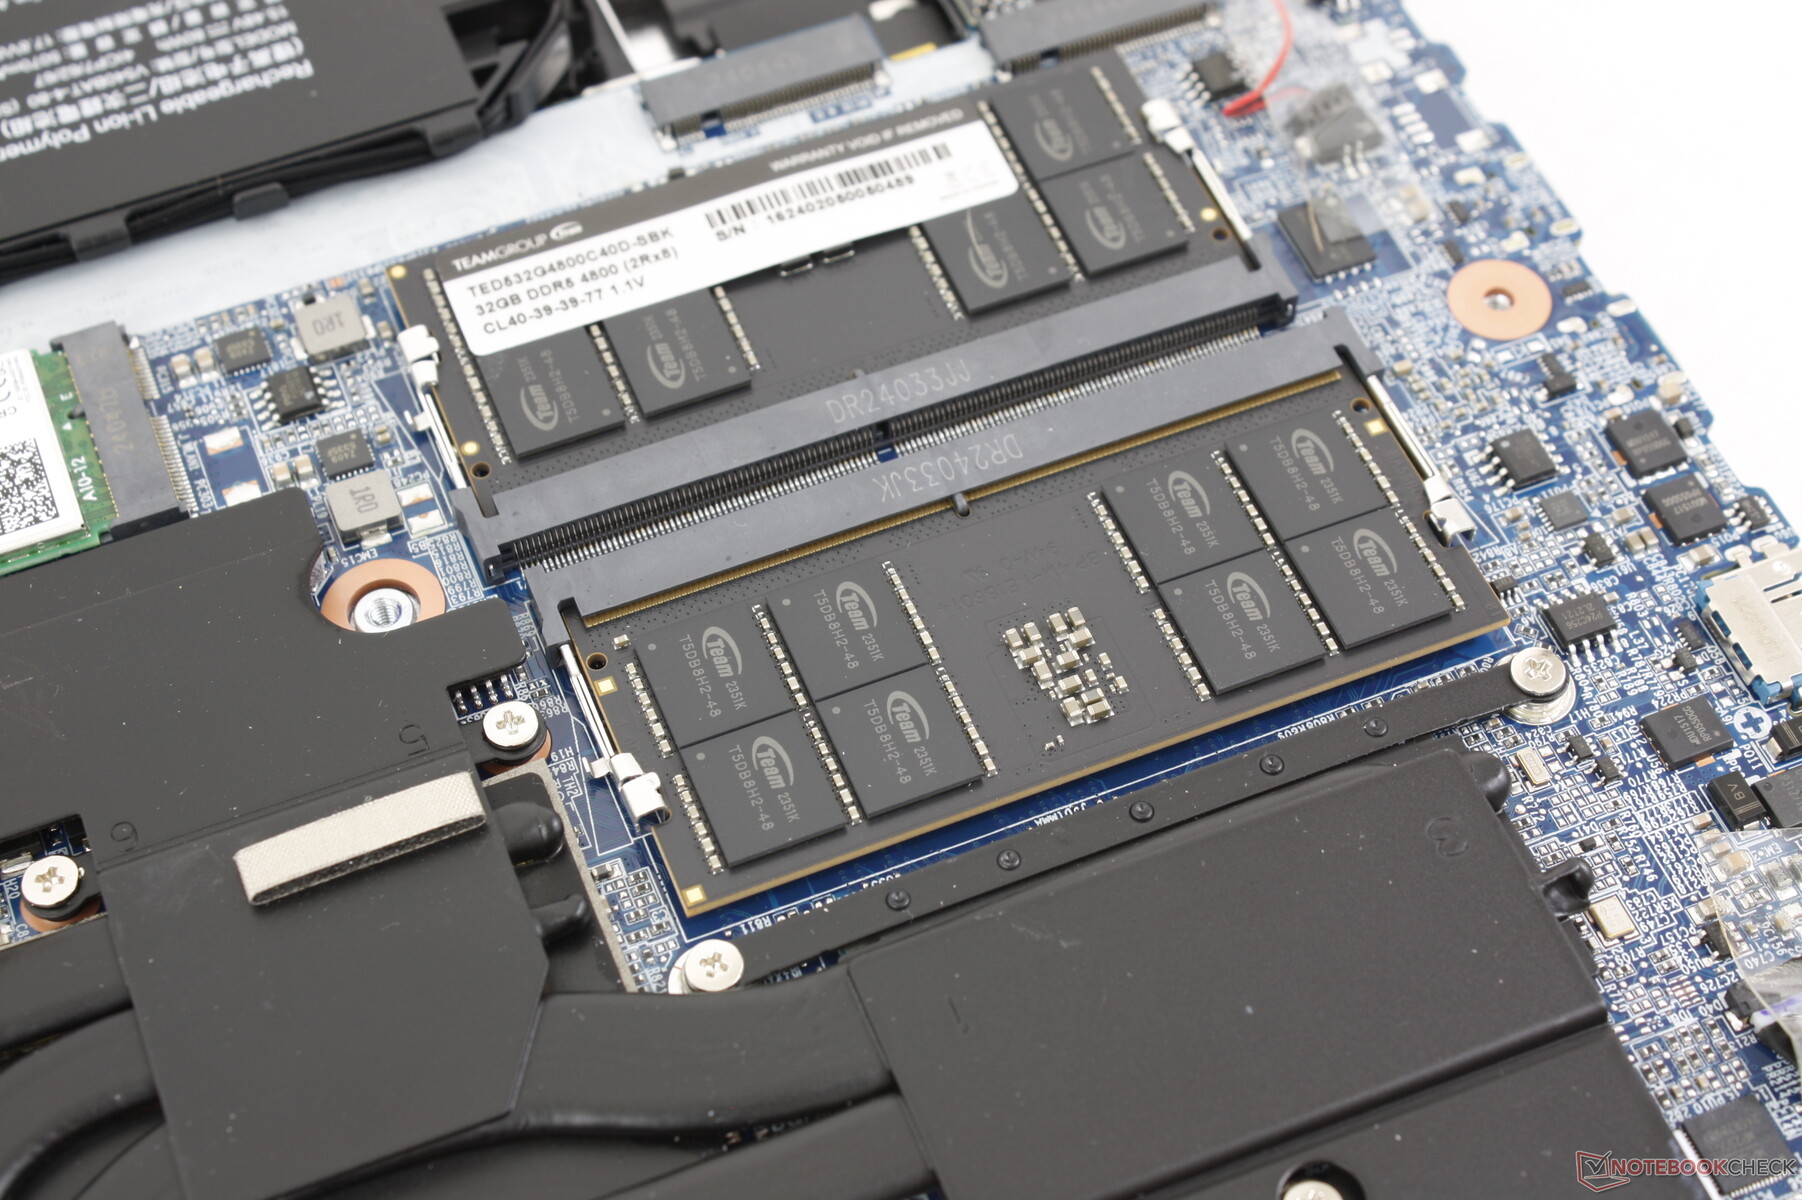
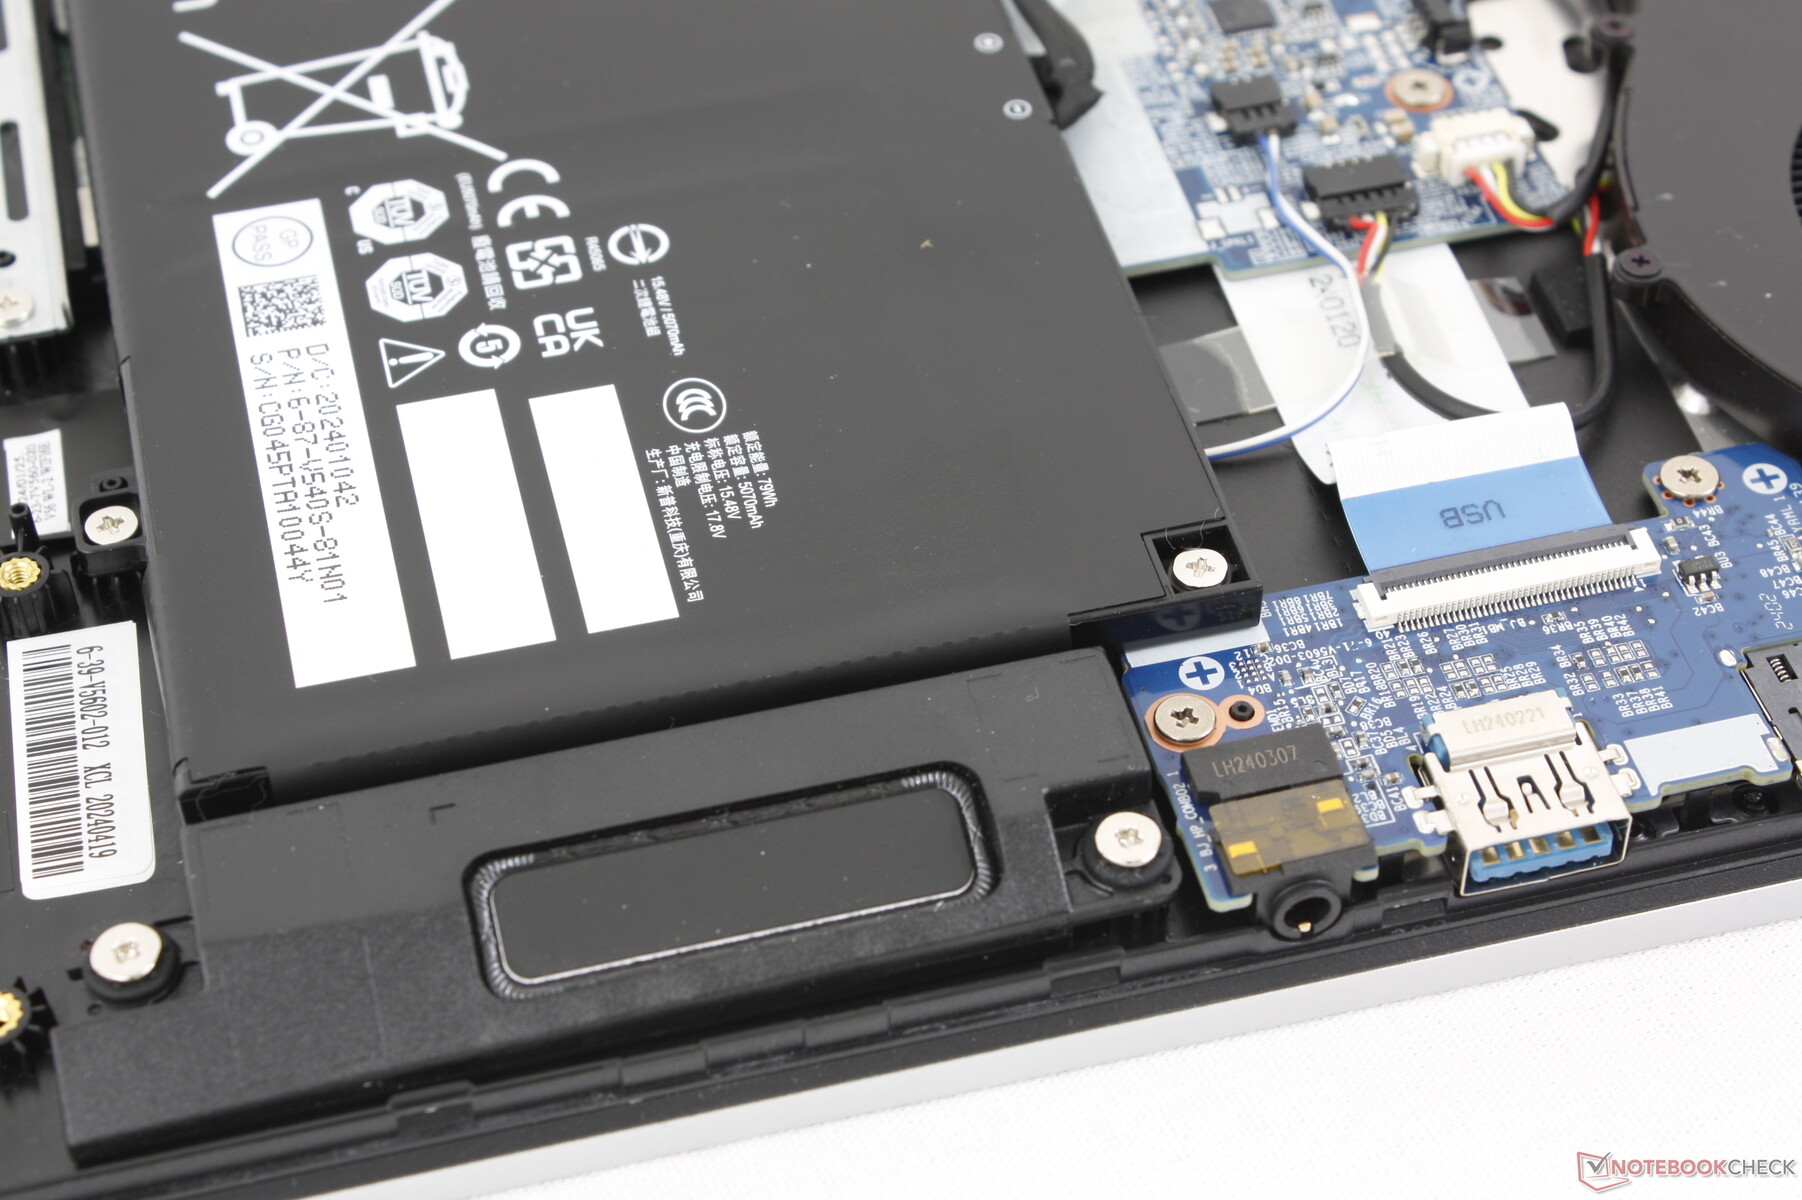
维护
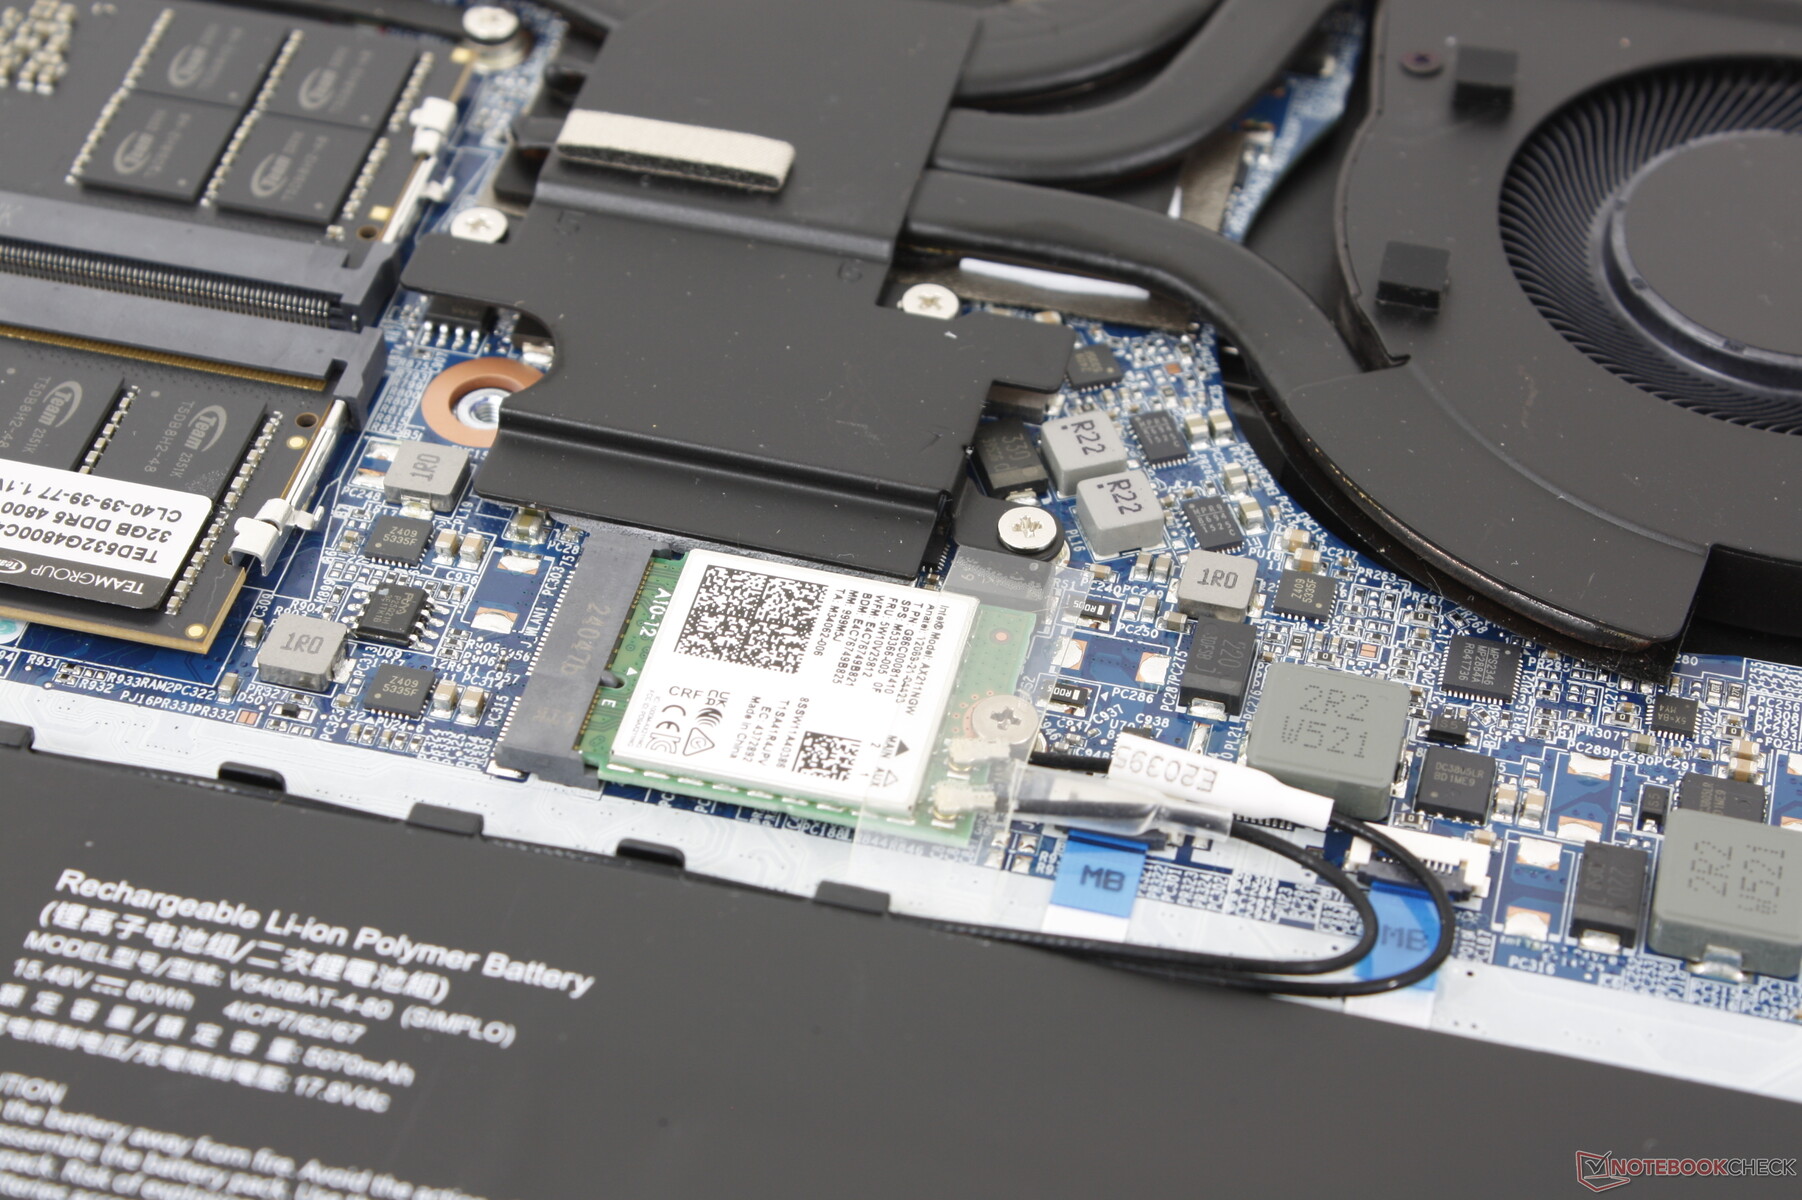
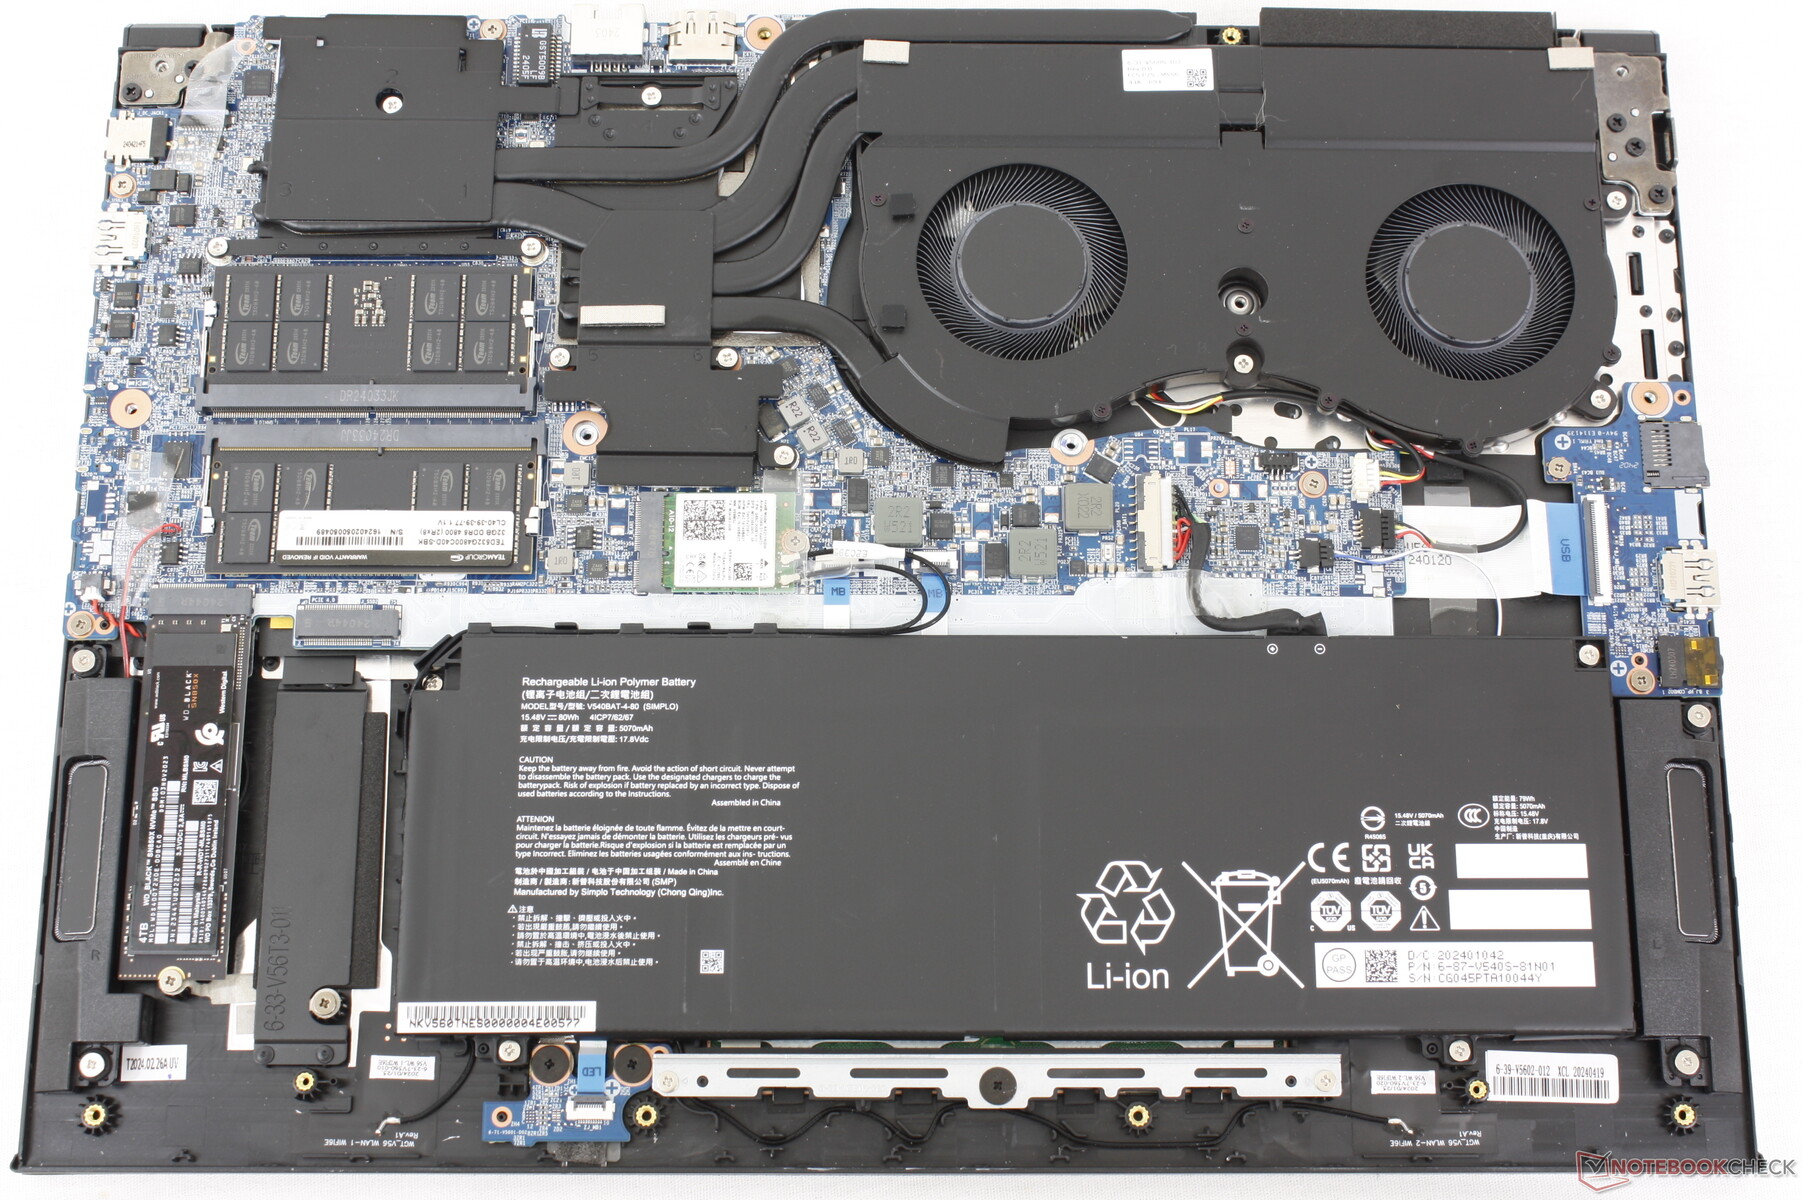
底部面板由 13 颗十字螺丝固定,需要耐心才能取下。不过,它的弹出阻力不大,可以轻松进入两个 M.2 PCIe4 x4 2280 托架、两个 SODIMM 插槽、电池和可拆卸 WLAN 模块。这些选项可与 Razer Blade 16 相媲美,同时优于 Alienware x16 R2后者完全没有用户可升级的内存。
可持续性
Maingear 宣称生产笔记本电脑时未使用回收材料。
包装由纸板、塑料包装和不可回收的低密度聚乙烯组成。
配件和保修
包装盒内除了交流适配器和文件外,没有其他附件。如果在美国购买,制造商通常提供一年有限保修。
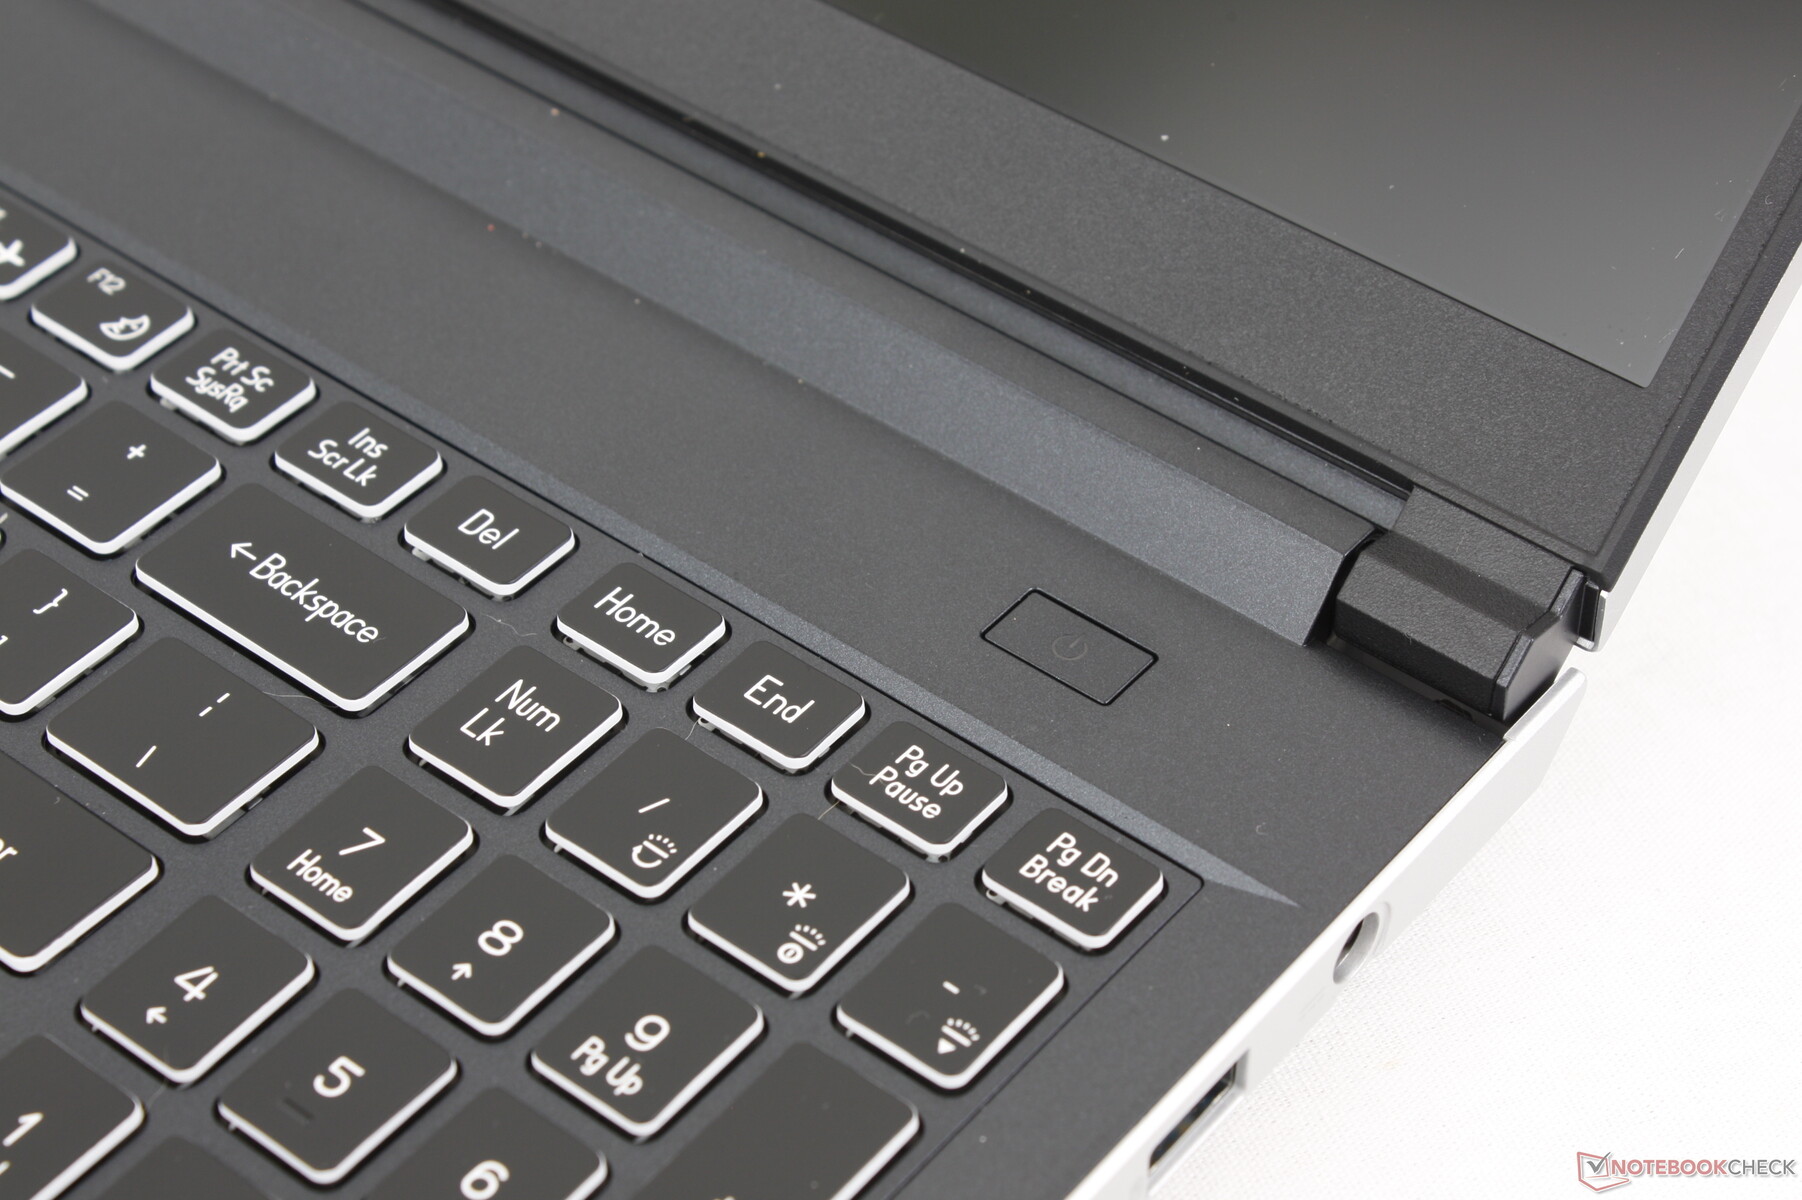
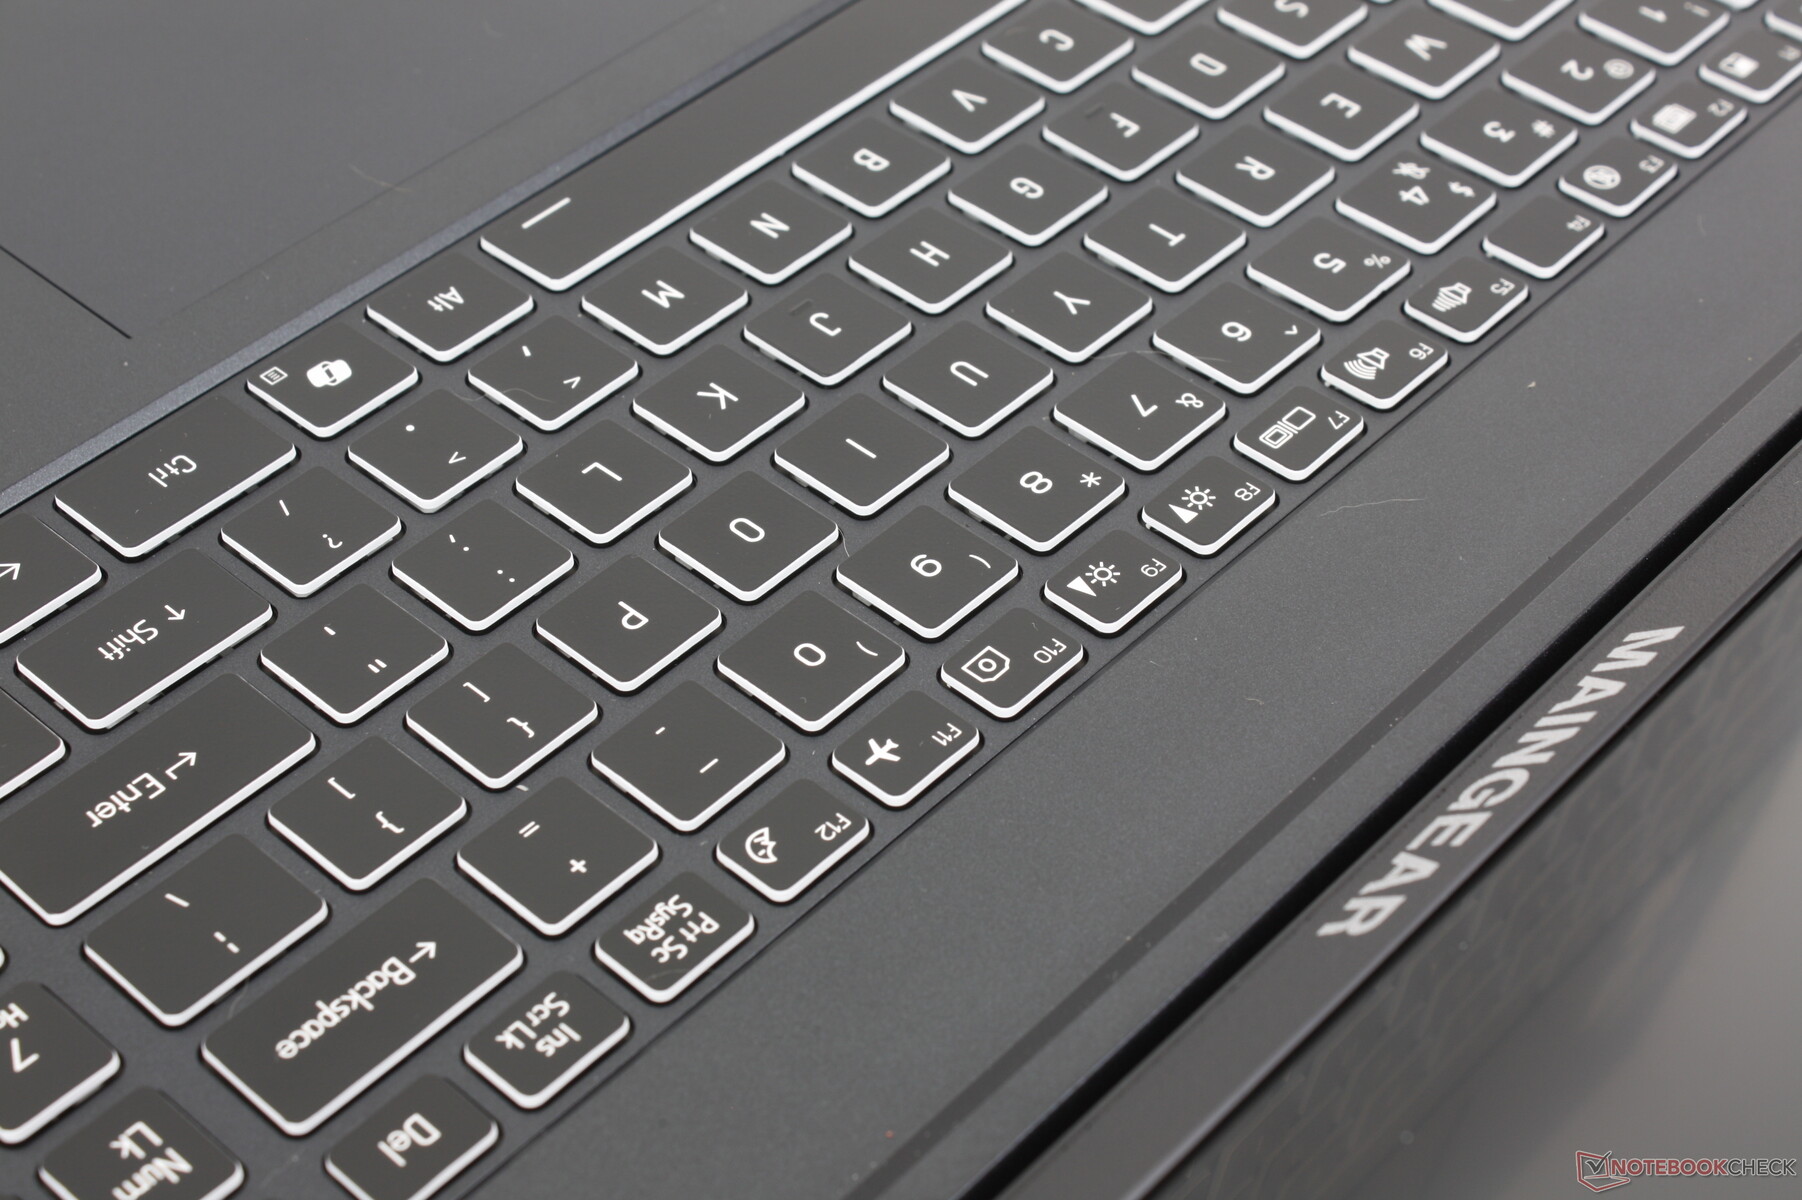
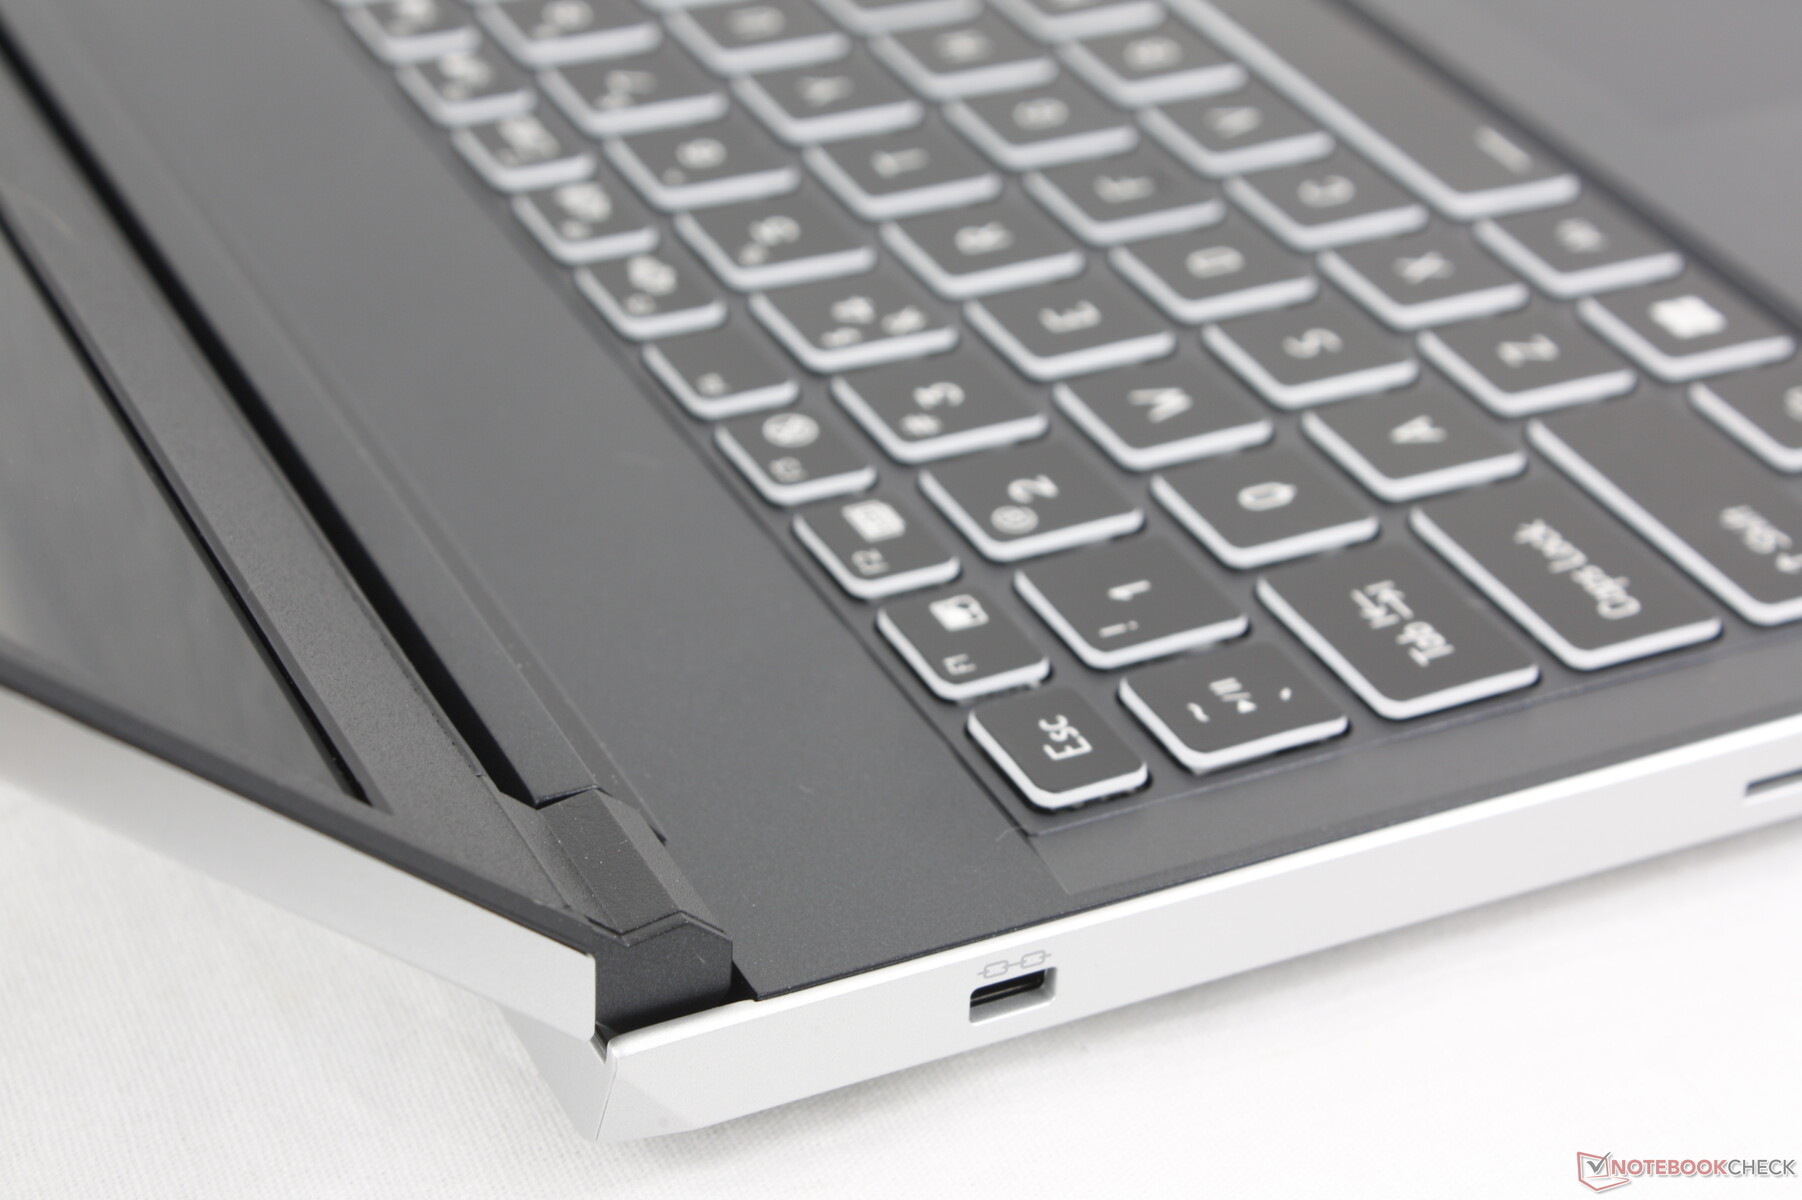
输入设备
键盘
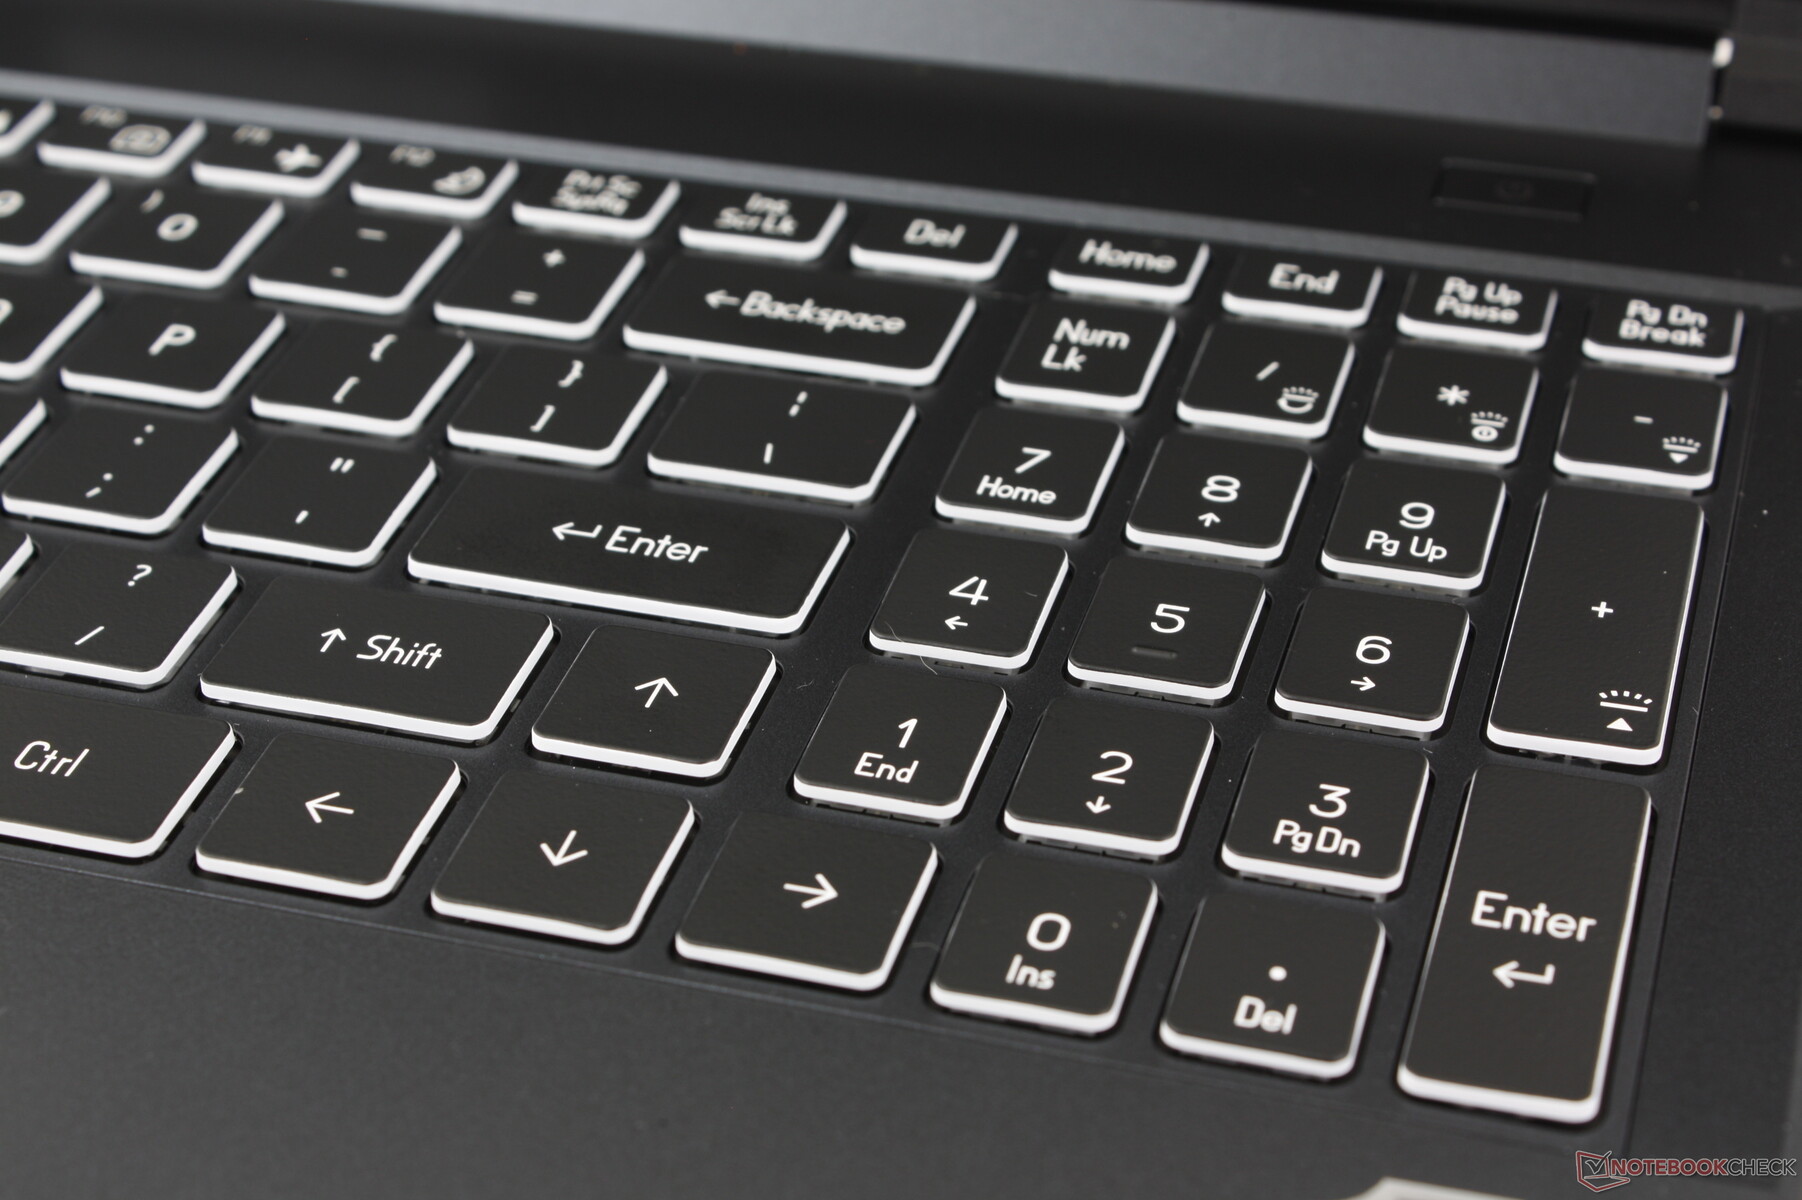
由于 QWERTY 主键的高音咔哒声,打字时的声音比其他大多数笔记本电脑都要大。响亮的撞击声通常意味着更坚定、更令人满意的反馈,但 ML-16 MK2 并非如此,因为键程仍然较浅,而柔和的反馈与尖锐的噪音水平不相称。Legion Pro 5 16 或 Victus 16相比之下,ML-16 MK2 的键盘感觉更熟悉,也更容易上手。
标准配置为单区 RGB 背光,没有按键 RGB 或甚至四区选项。
触摸板
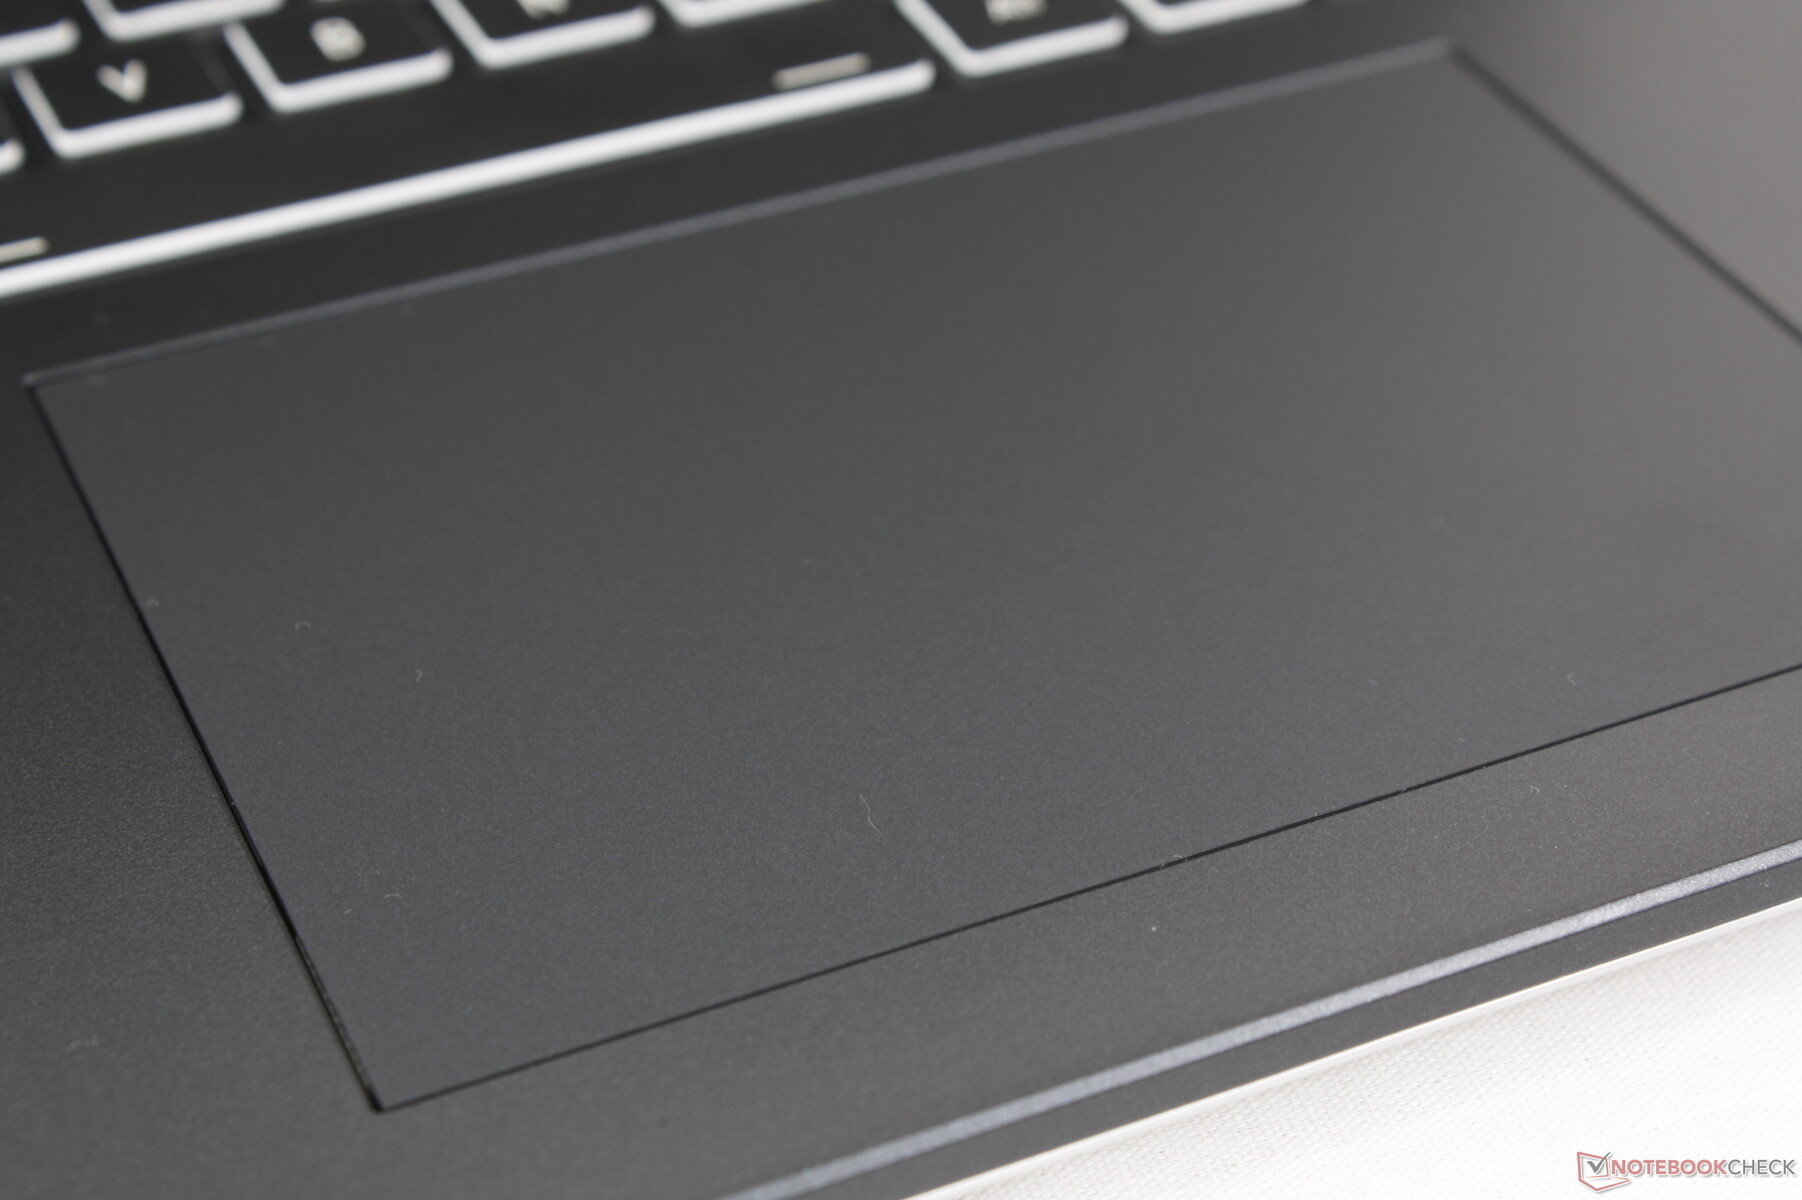
点击板(12.2 x 8.3 厘米)比 Blade 16 上的小。 刀锋 16(17 x 9.7 厘米)小,但比Legion Pro 5 16IRX9 (12 x 7.5 厘米)大。它空间宽敞,按压时反馈坚硬且咔嗒作响。不过,滑动几乎过于顺滑,尤其是在较低的速度下,这使得精确点击或拖放操作更加困难。相比之下,其他大多数笔记本电脑在以较慢的速度移动时,手指往往会被粘住,从而影响精确度。


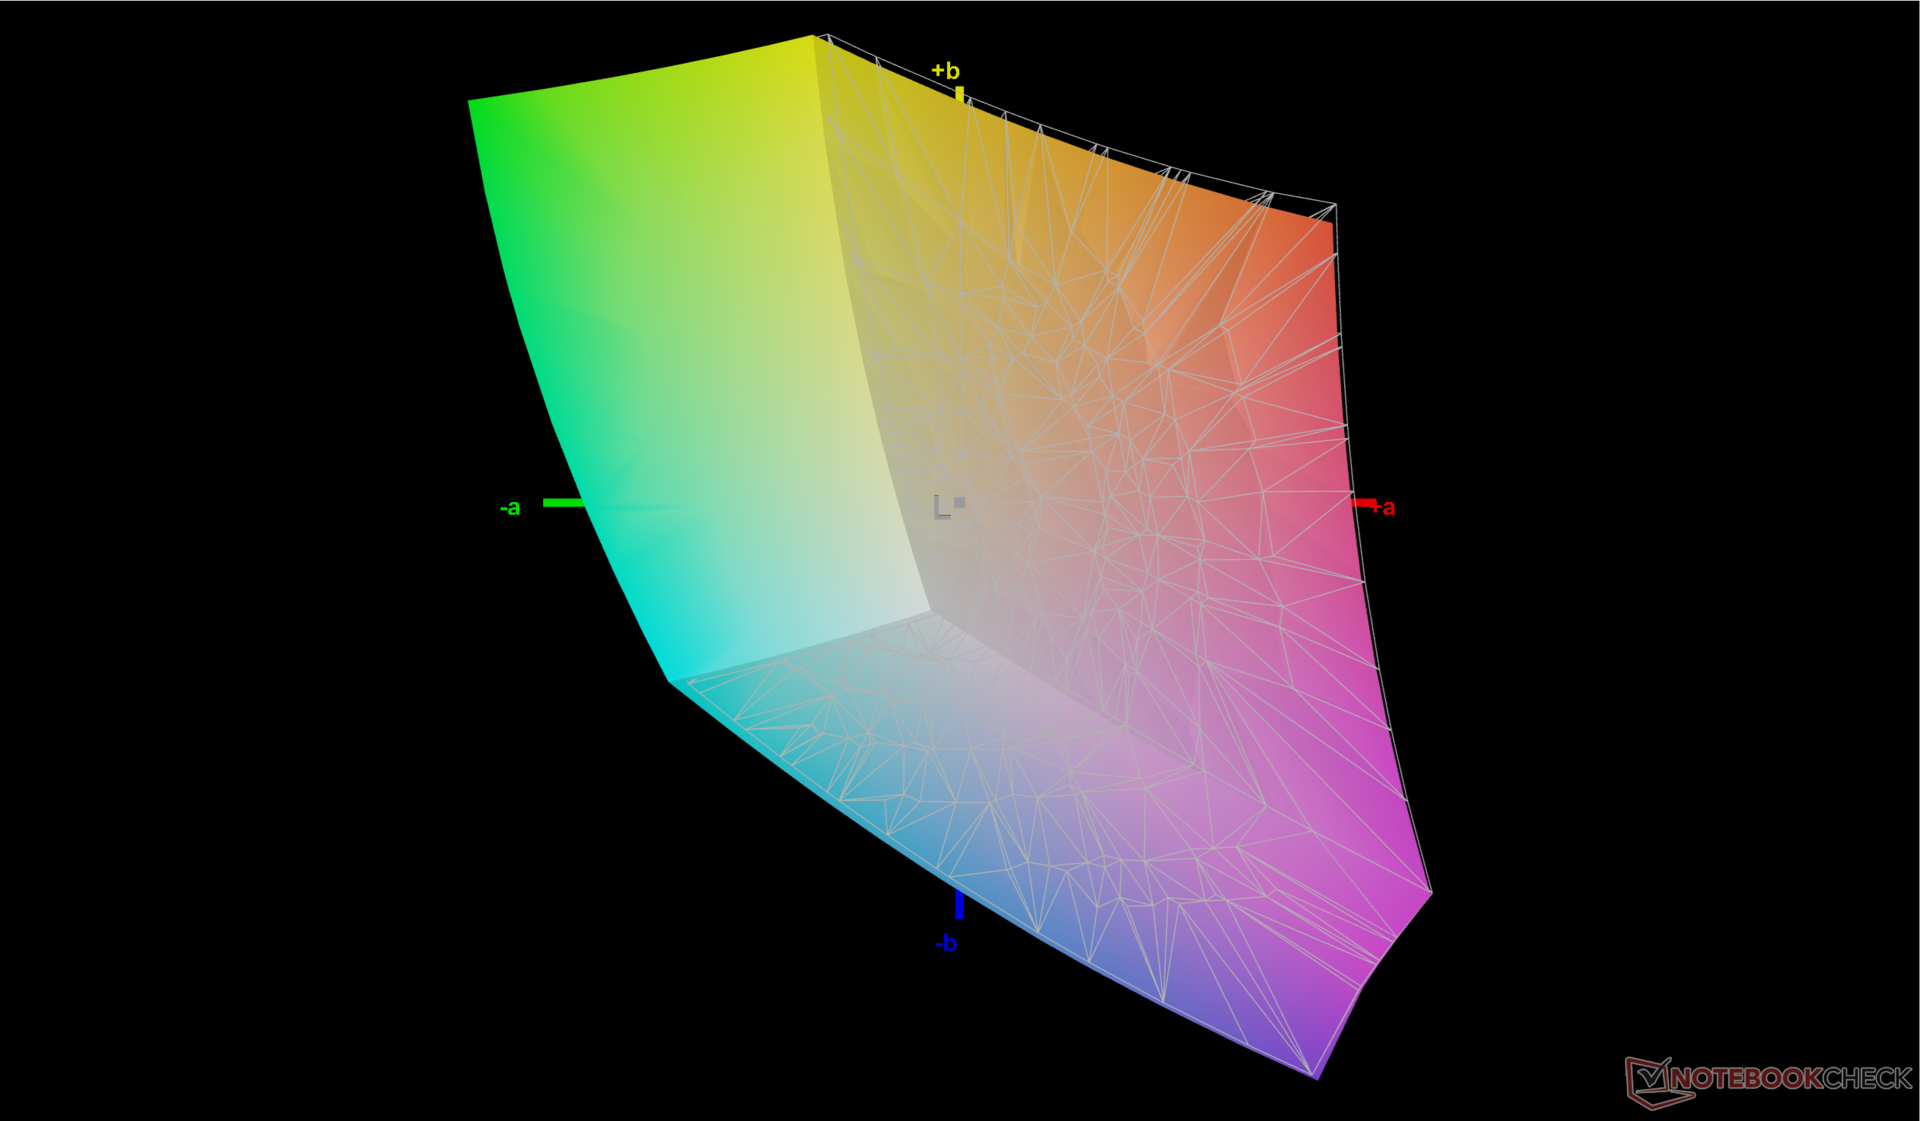
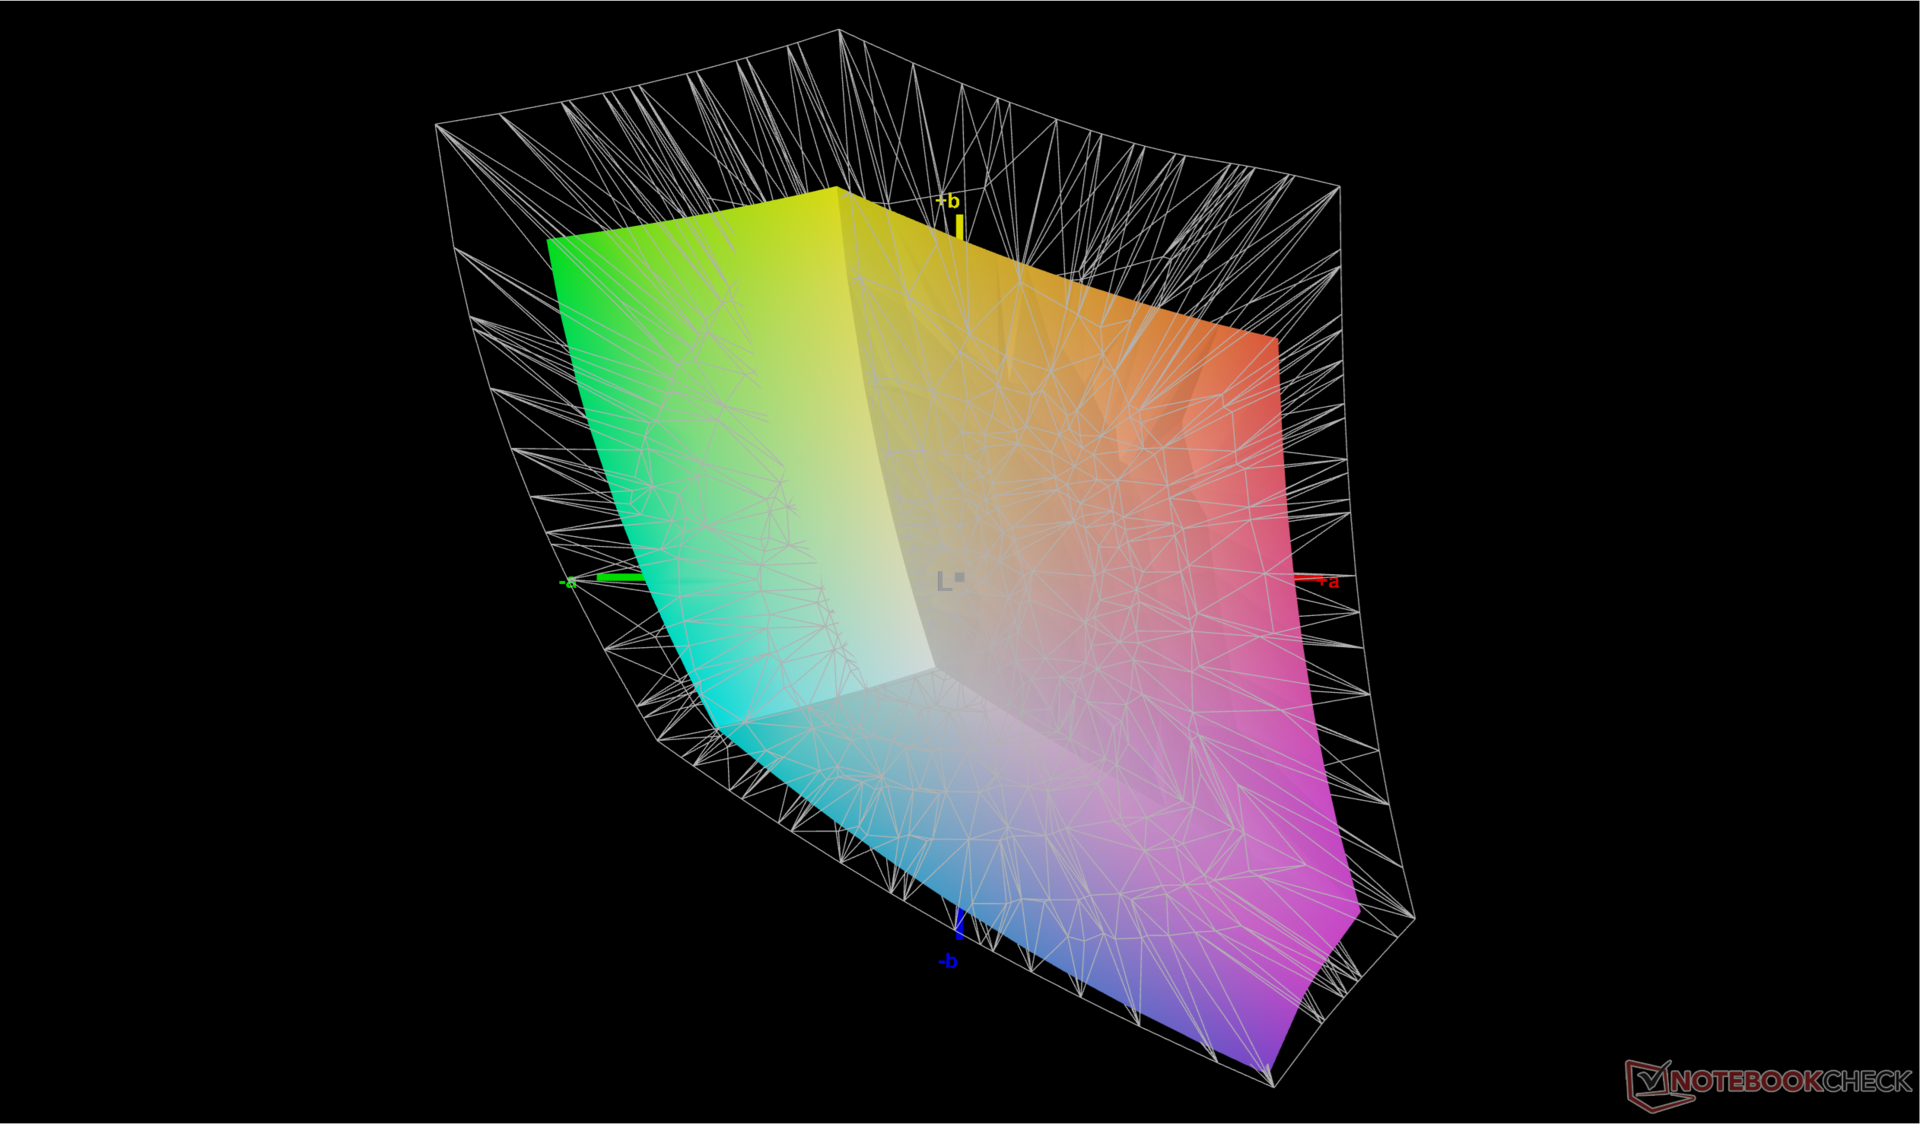
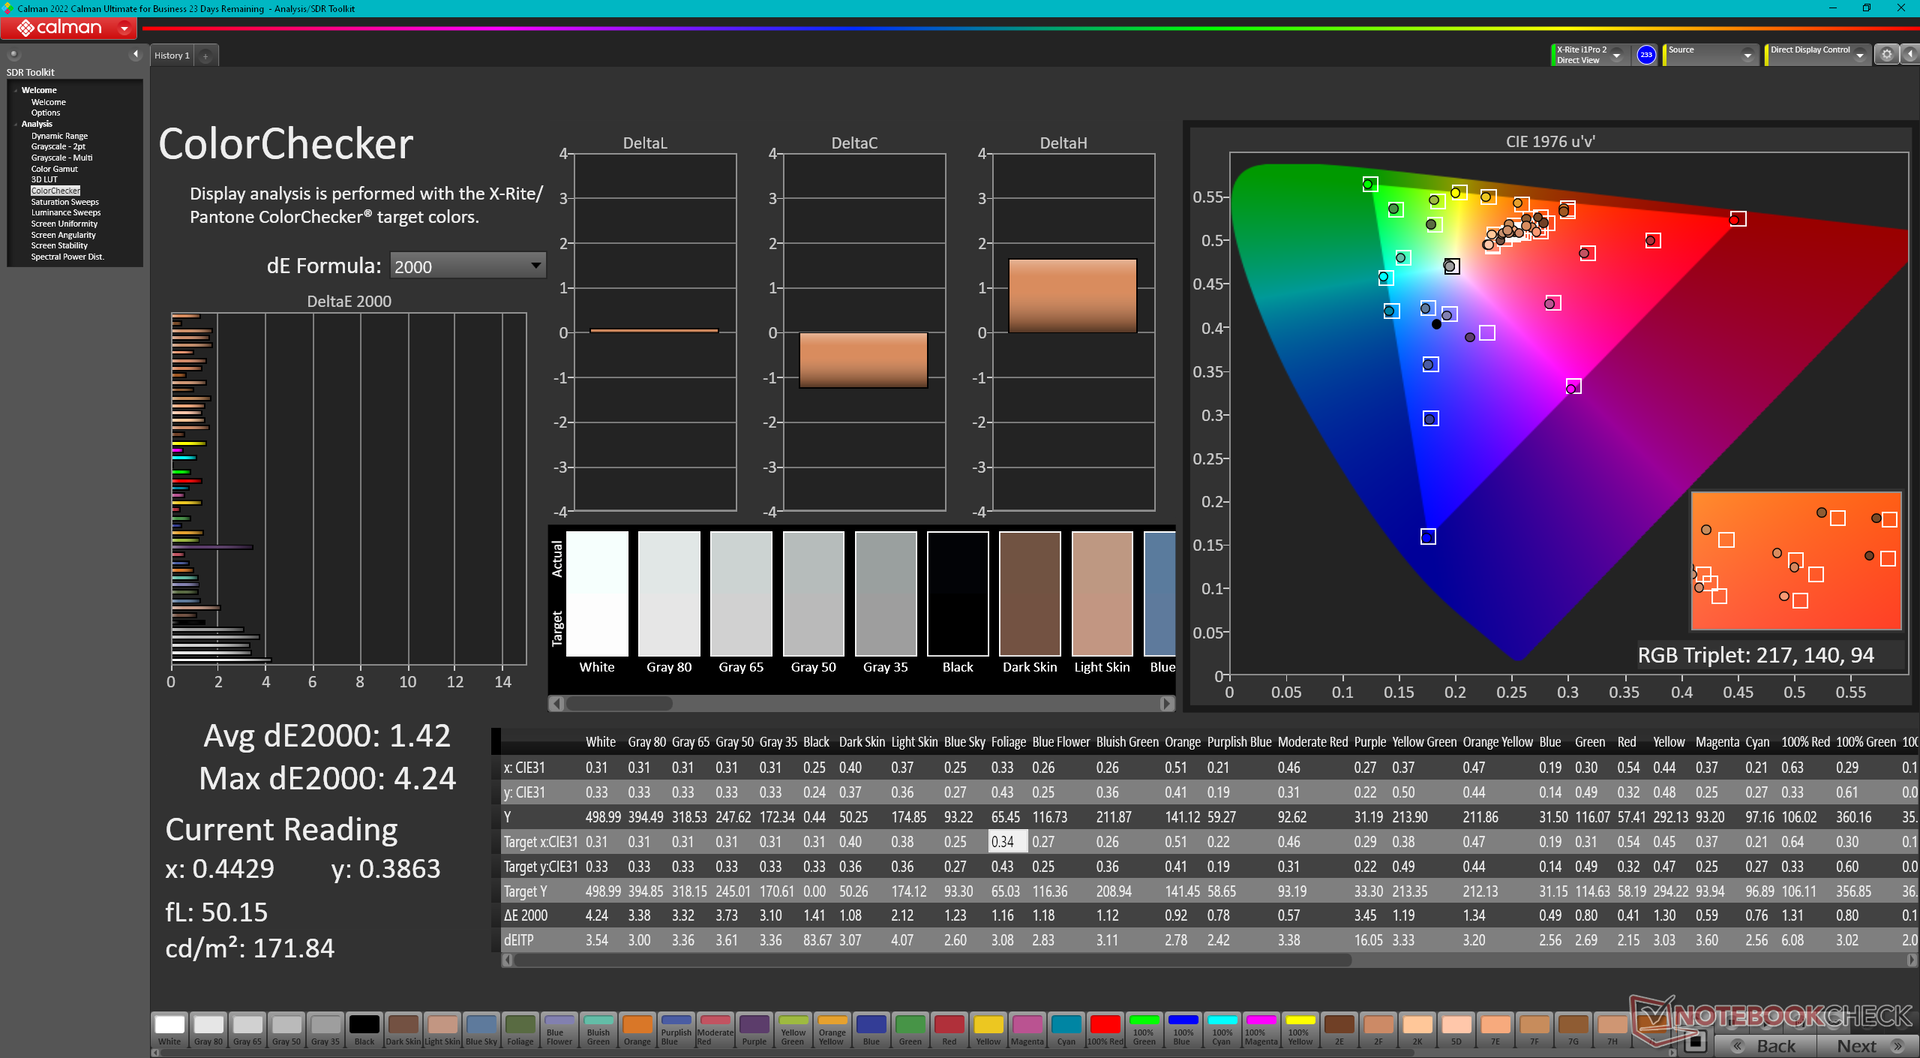
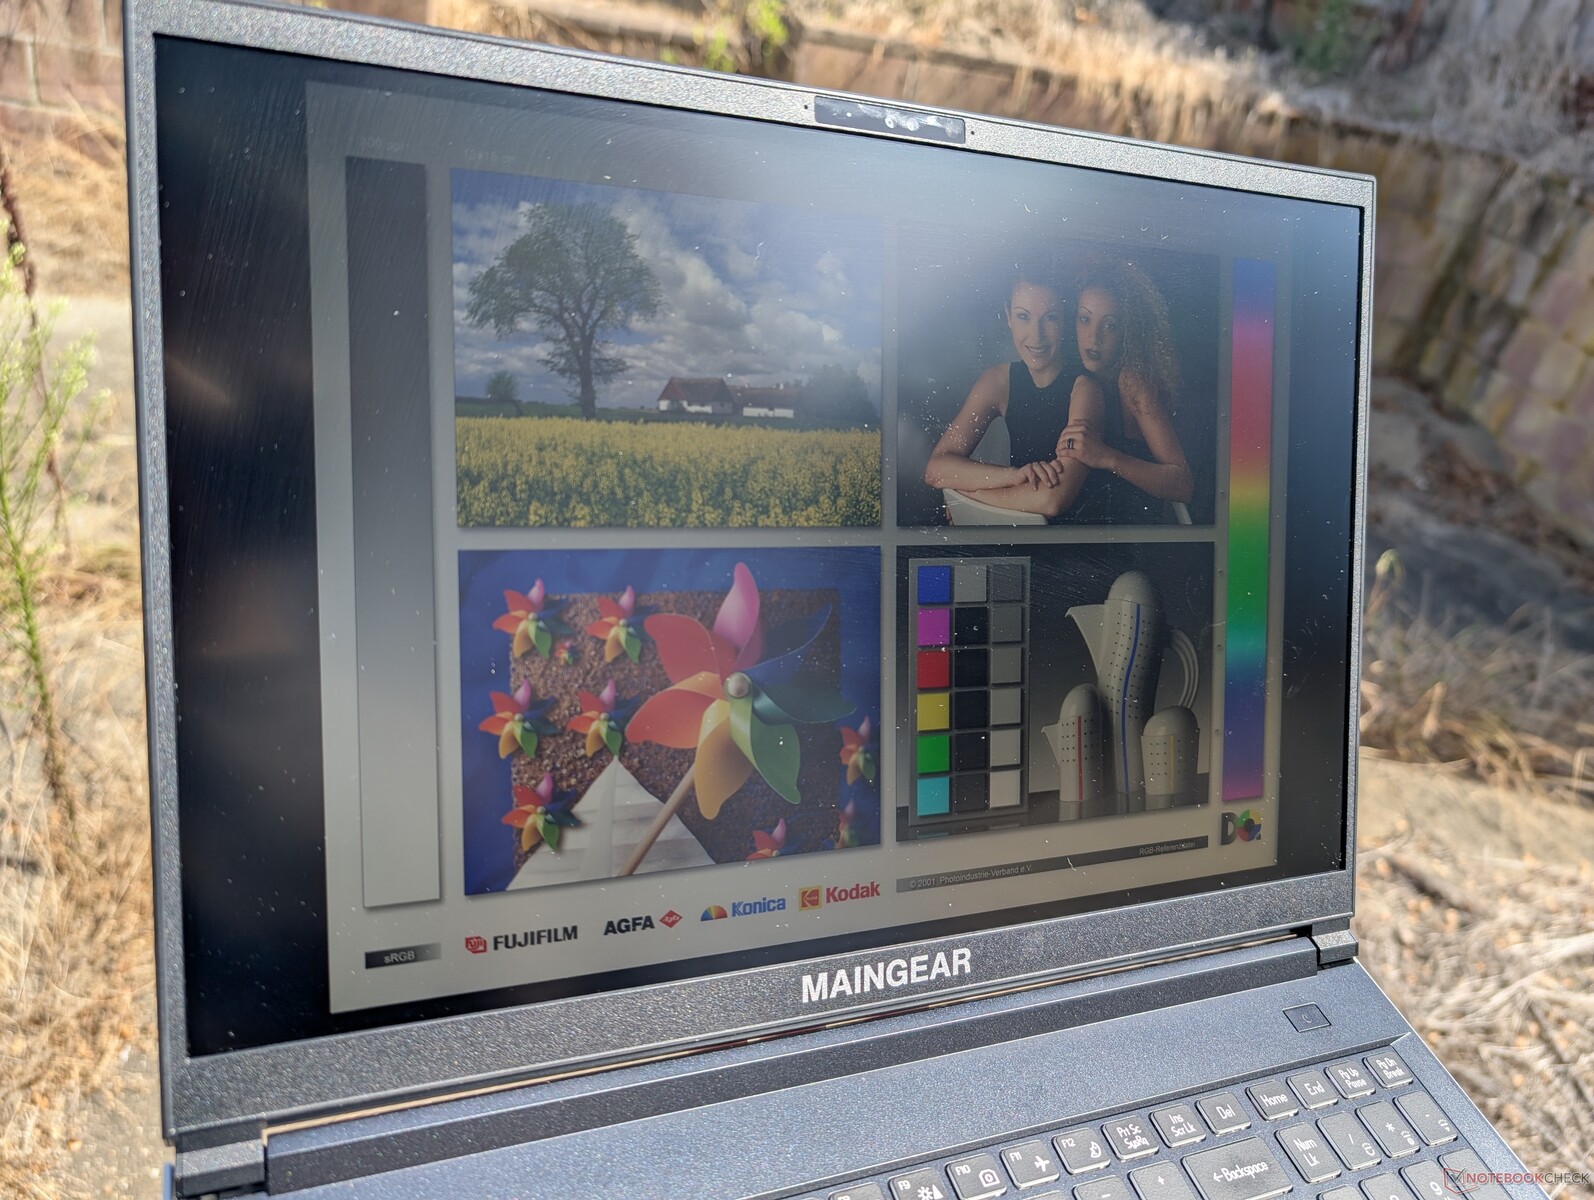
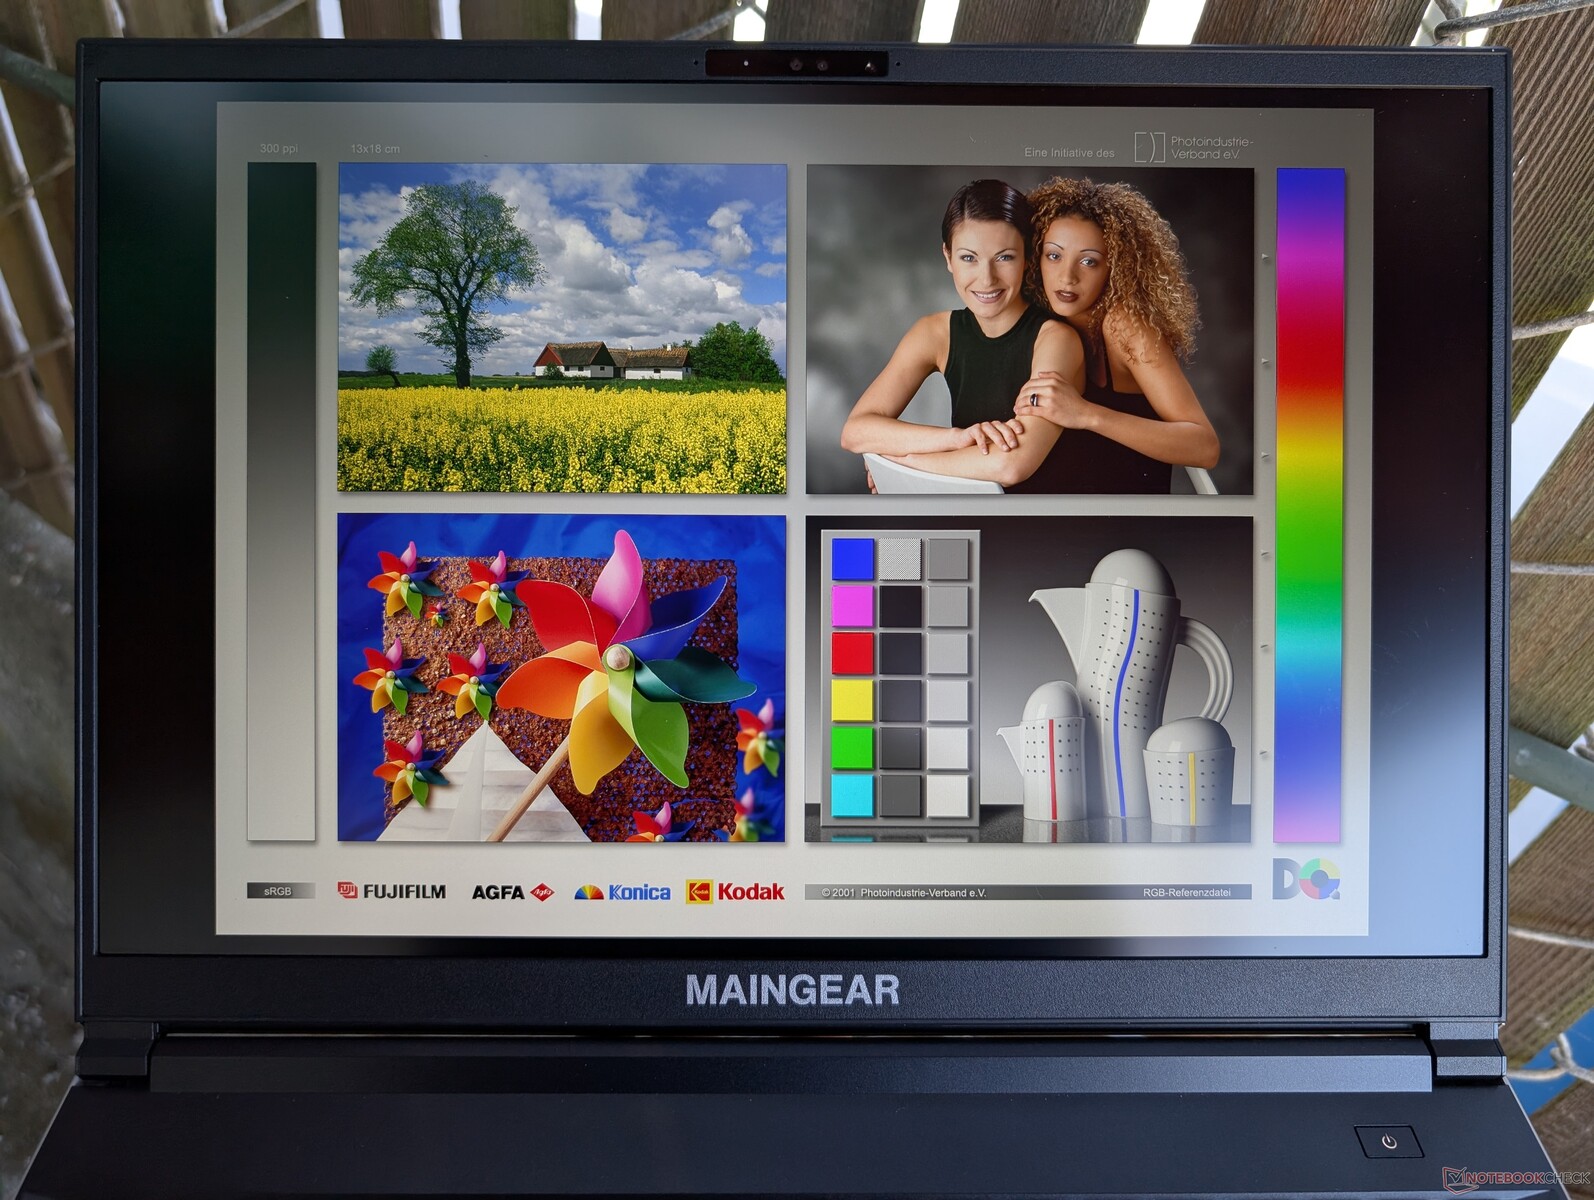
显示屏 - 游戏 IPS
ML-16 MK2 是我们数据库中第一款配备 TL160ADMP11-0 240 Hz IPS 面板的机型。在刷新率、对比度和分辨率方面,它与 Alienware x16 R2 上的京东方 B160QAN 面板相当,但在色彩还原和响应时间方面,它无法与戴尔显示器相媲美。因此,ML-16 MK2 显示器可被视为中端产品,仍然非常适合游戏和大多数业余图形编辑工作。
它不支持 G-Sync 或 HDR 等更高级的功能。


| |||||||||||||||||||||||||
Brightness Distribution: 90 %
Center on Battery: 518.2 cd/m²
Contrast: 1296:1 (Black: 0.4 cd/m²)
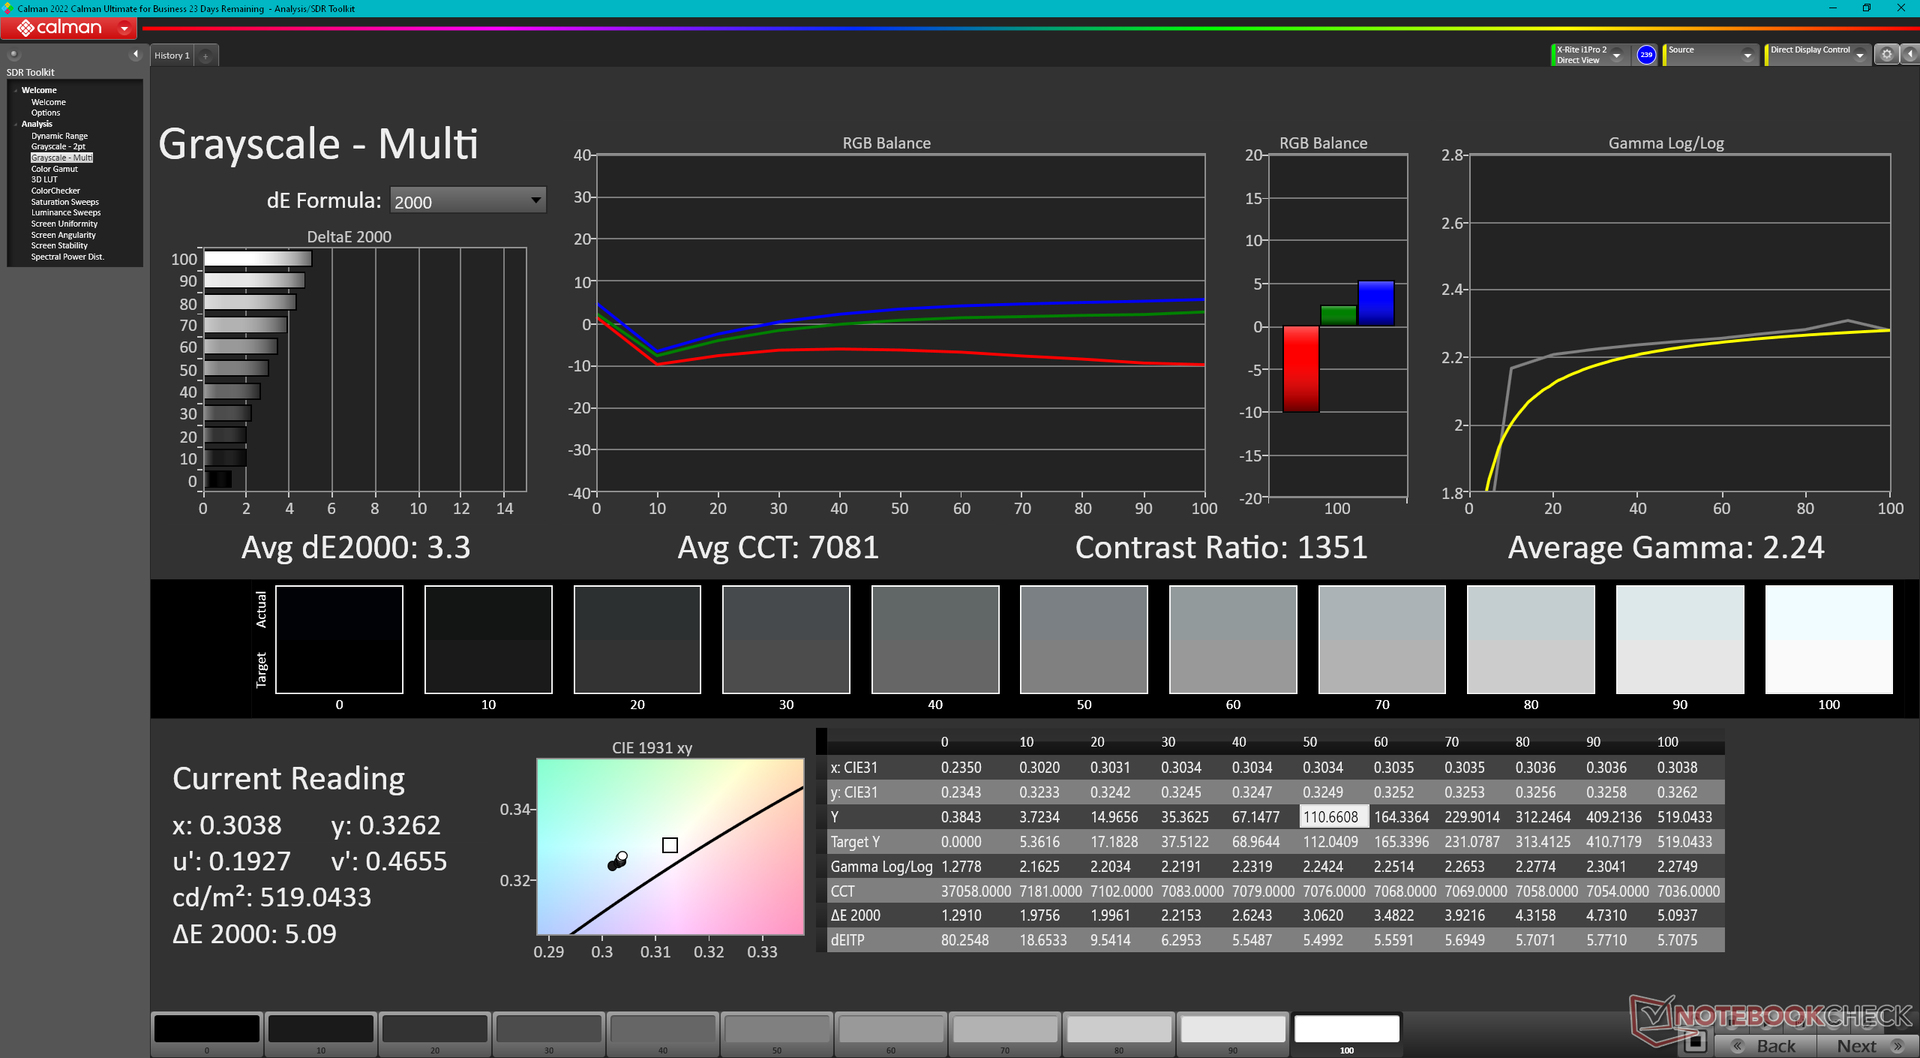
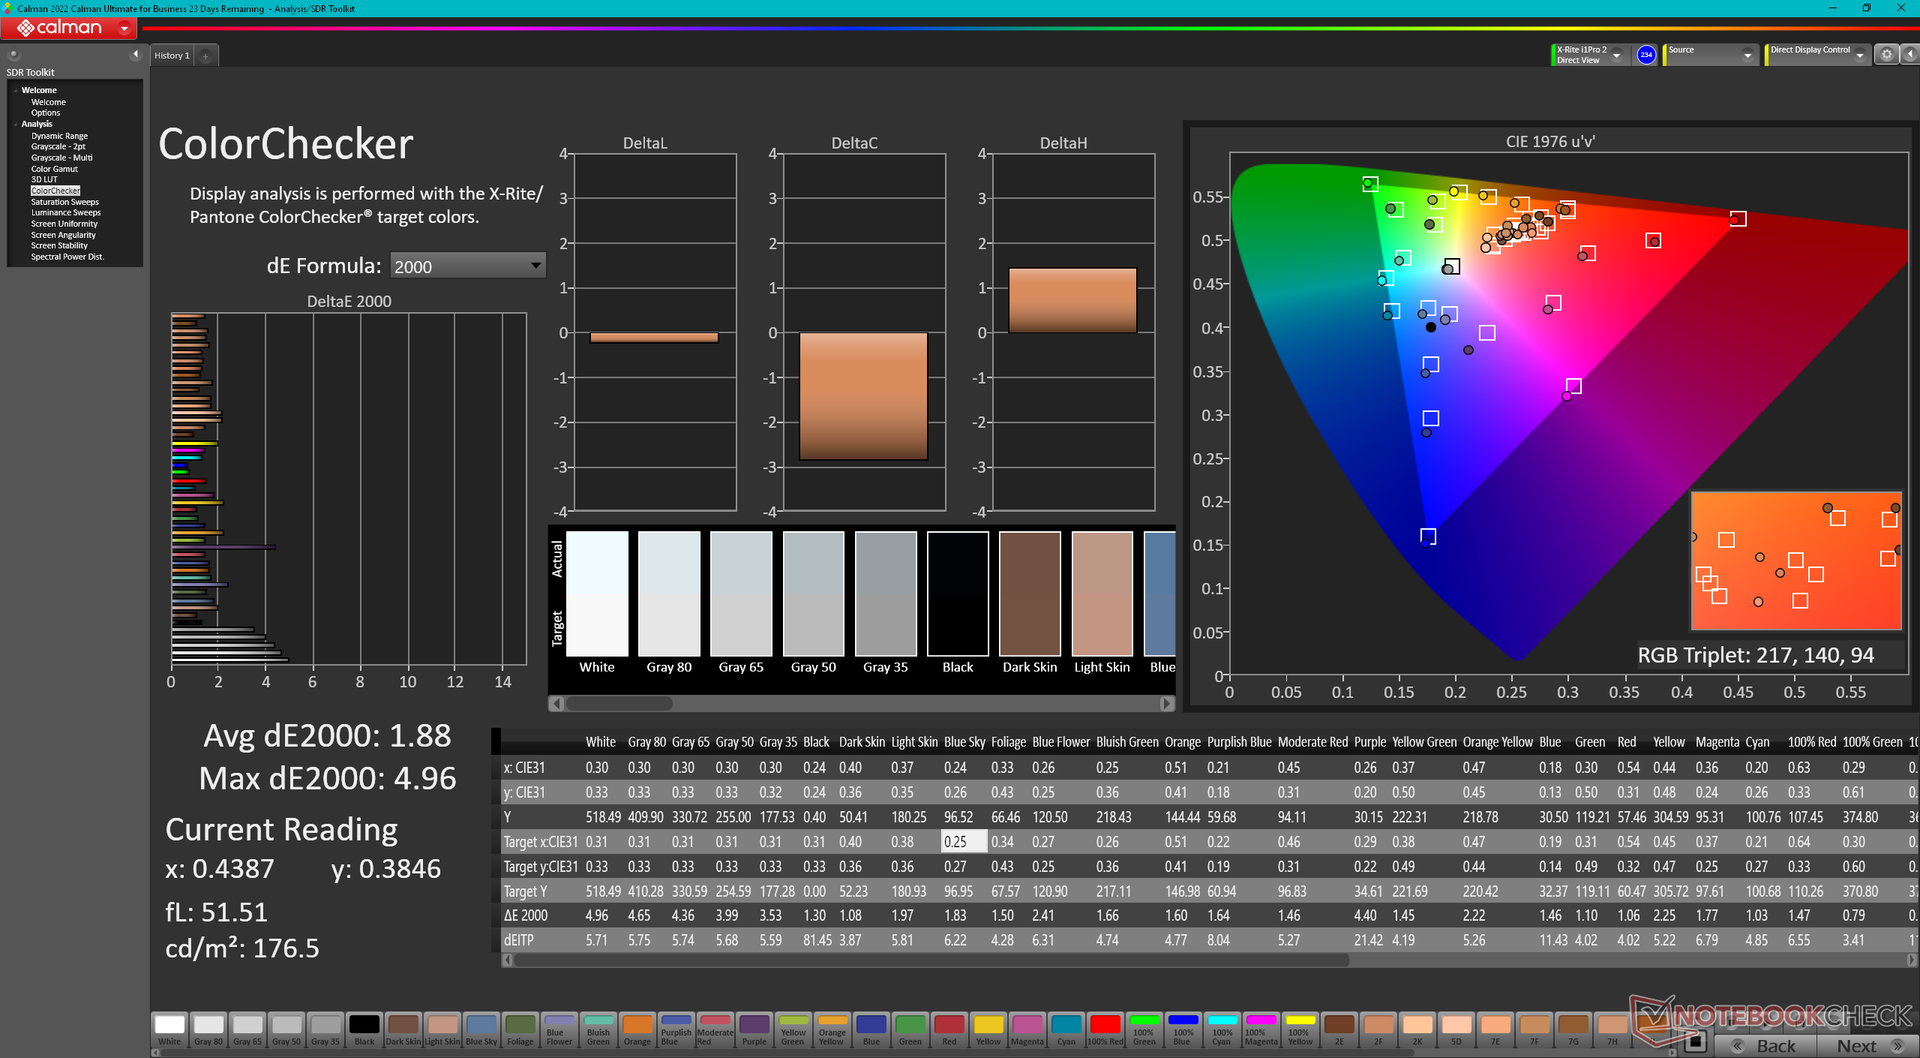
ΔE Color 1.88 | 0.5-29.43 Ø4.87, calibrated: 1.42
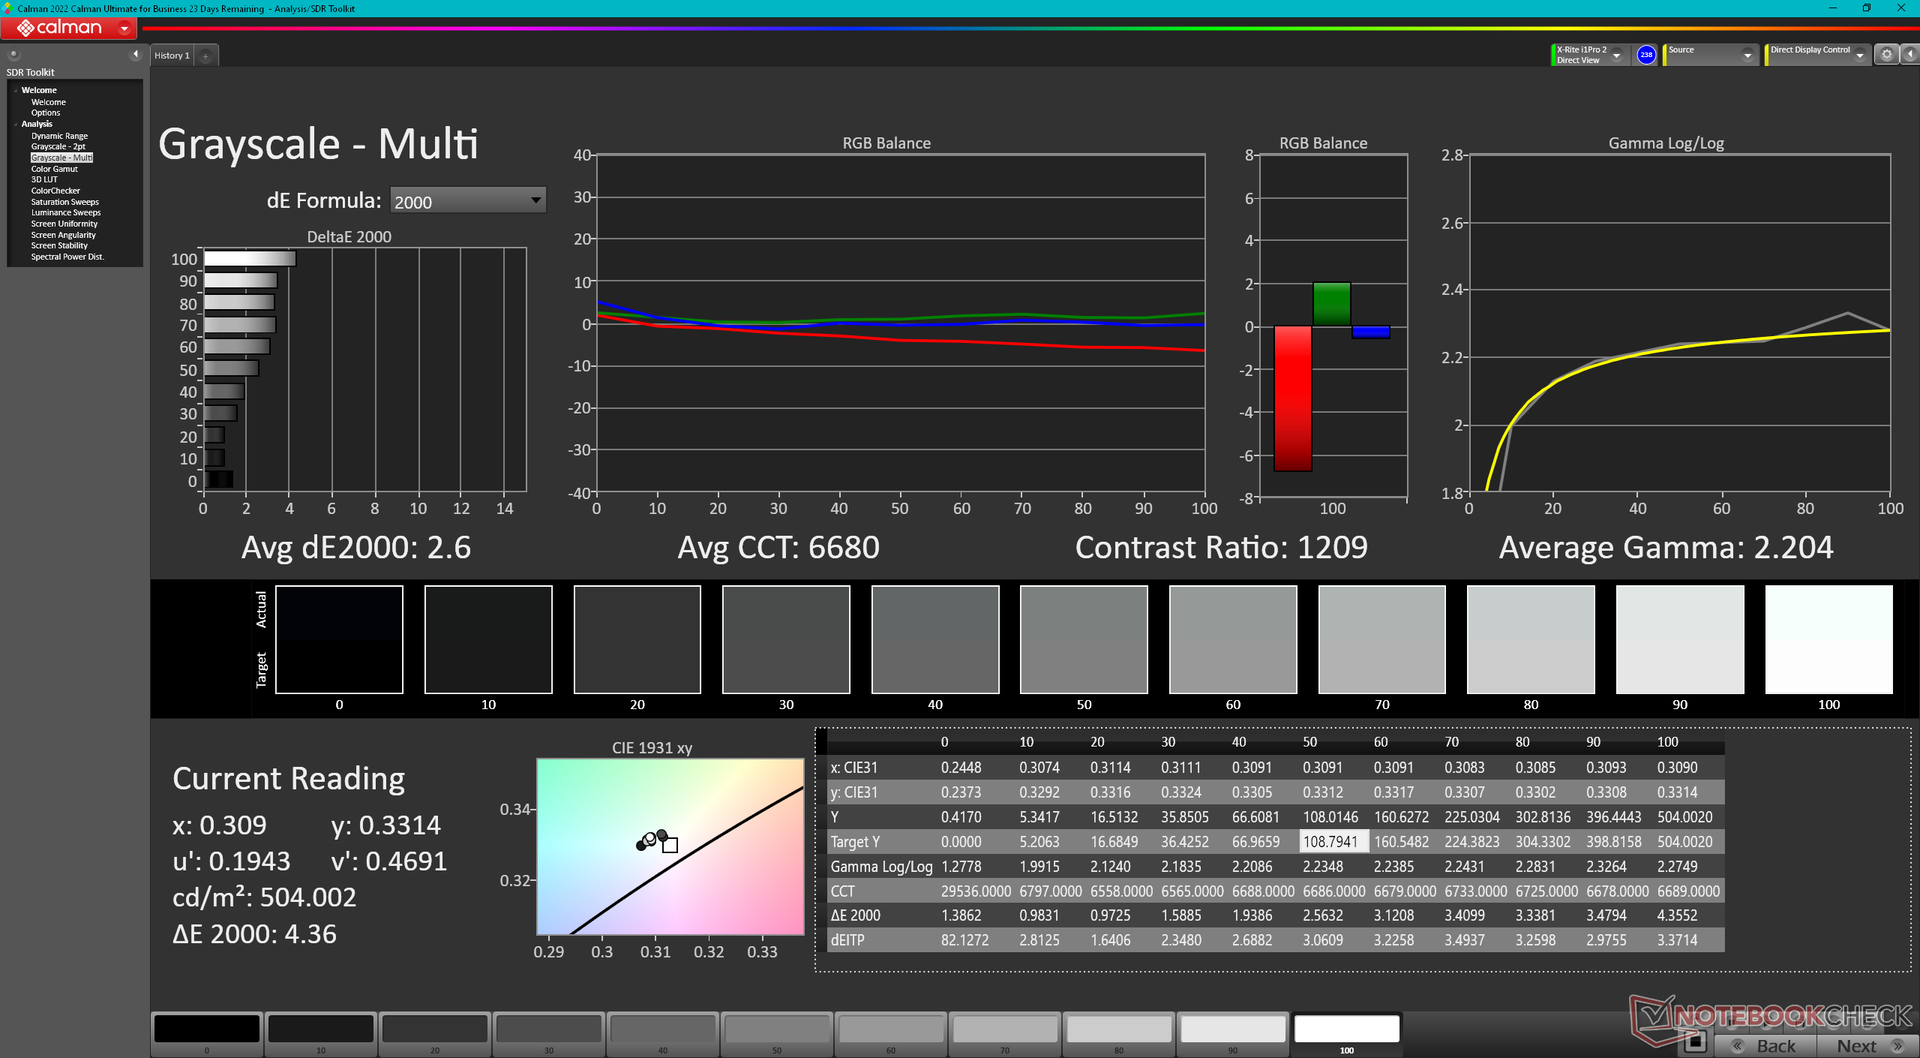
ΔE Greyscale 3.3 | 0.5-98 Ø5.1
69.2% AdobeRGB 1998 (Argyll 2.2.0 3D)
98.2% sRGB (Argyll 2.2.0 3D)
67.3% Display P3 (Argyll 2.2.0 3D)
Gamma: 2.24
| Maingear ML-16 MK2 TL160ADMP11-0, IPS, 2560x1600, 16", 240 Hz | Asus ROG Zephyrus G16 GA605WV ATNA60DL04-0, OLED, 2560x1600, 16", 240 Hz | HP Victus 16 (2024) Chi Mei CMN163E, IPS, 1920x1080, 16.1", 144 Hz | Alienware x16 R2 P120F BOE B160QAN, IPS, 2560x1600, 16", 240 Hz | Lenovo Legion Pro 5 16IRX9 BOE NE160QDM-NYC, IPS, 2560x1600, 16", 165 Hz | Razer Blade 16 2024, RTX 4090 Samsung SDC41AB (ATNA60DL03-0), OLED, 2560x1600, 16", 240 Hz | |
|---|---|---|---|---|---|---|
| Display | 30% | -38% | 25% | 2% | 29% | |
| Display P3 Coverage | 67.3 | 99.9 48% | 41.3 -39% | 98.3 46% | 69.3 3% | 99.1 47% |
| sRGB Coverage | 98.2 | 100 2% | 61.7 -37% | 100 2% | 99.4 1% | 99.9 2% |
| AdobeRGB 1998 Coverage | 69.2 | 96.9 40% | 42.7 -38% | 88.8 28% | 70.1 1% | 95.6 38% |
| Response Times | 98% | -117% | 42% | 4% | 97% | |
| Response Time Grey 50% / Grey 80% * | 12.5 ? | 0.22 ? 98% | 28.6 ? -129% | 3.9 ? 69% | 11.9 ? 5% | 0.24 ? 98% |
| Response Time Black / White * | 9.1 ? | 0.25 ? 97% | 18.7 ? -105% | 7.8 ? 14% | 8.9 ? 2% | 0.4 ? 96% |
| PWM Frequency | 960 | 960 | ||||
| Screen | 11% | -79% | -3% | 14% | 193% | |
| Brightness middle | 518.2 | 416 -20% | 287 -45% | 348.4 -33% | 384 -26% | 418 -19% |
| Brightness | 487 | 418 -14% | 288 -41% | 340 -30% | 366 -25% | 420 -14% |
| Brightness Distribution | 90 | 96 7% | 86 -4% | 90 0% | 91 1% | 98 9% |
| Black Level * | 0.4 | 0.19 52% | 0.33 17% | 0.35 12% | 0.02 95% | |
| Contrast | 1296 | 1511 17% | 1056 -19% | 1097 -15% | 20900 1513% | |
| Colorchecker dE 2000 * | 1.88 | 1.6 15% | 5.46 -190% | 2.68 -43% | 0.97 48% | 1.07 43% |
| Colorchecker dE 2000 max. * | 4.96 | 2.1 58% | 20.36 -310% | 4.14 17% | 3.57 28% | 4.04 19% |
| Colorchecker dE 2000 calibrated * | 1.42 | 3.52 -148% | 0.42 70% | 0.77 46% | 1.07 25% | |
| Greyscale dE 2000 * | 3.3 | 2.7 18% | 4.8 -45% | 3.4 -3% | 1.5 55% | 1.12 66% |
| Gamma | 2.24 98% | 2.16 102% | 2.108 104% | 2.41 91% | 2.24 98% | 2.29 96% |
| CCT | 7081 92% | 6331 103% | 6442 101% | 6083 107% | 6709 97% | 6417 101% |
| Total Average (Program / Settings) | 46% /
32% | -78% /
-76% | 21% /
10% | 7% /
10% | 106% /
144% |
* ... smaller is better
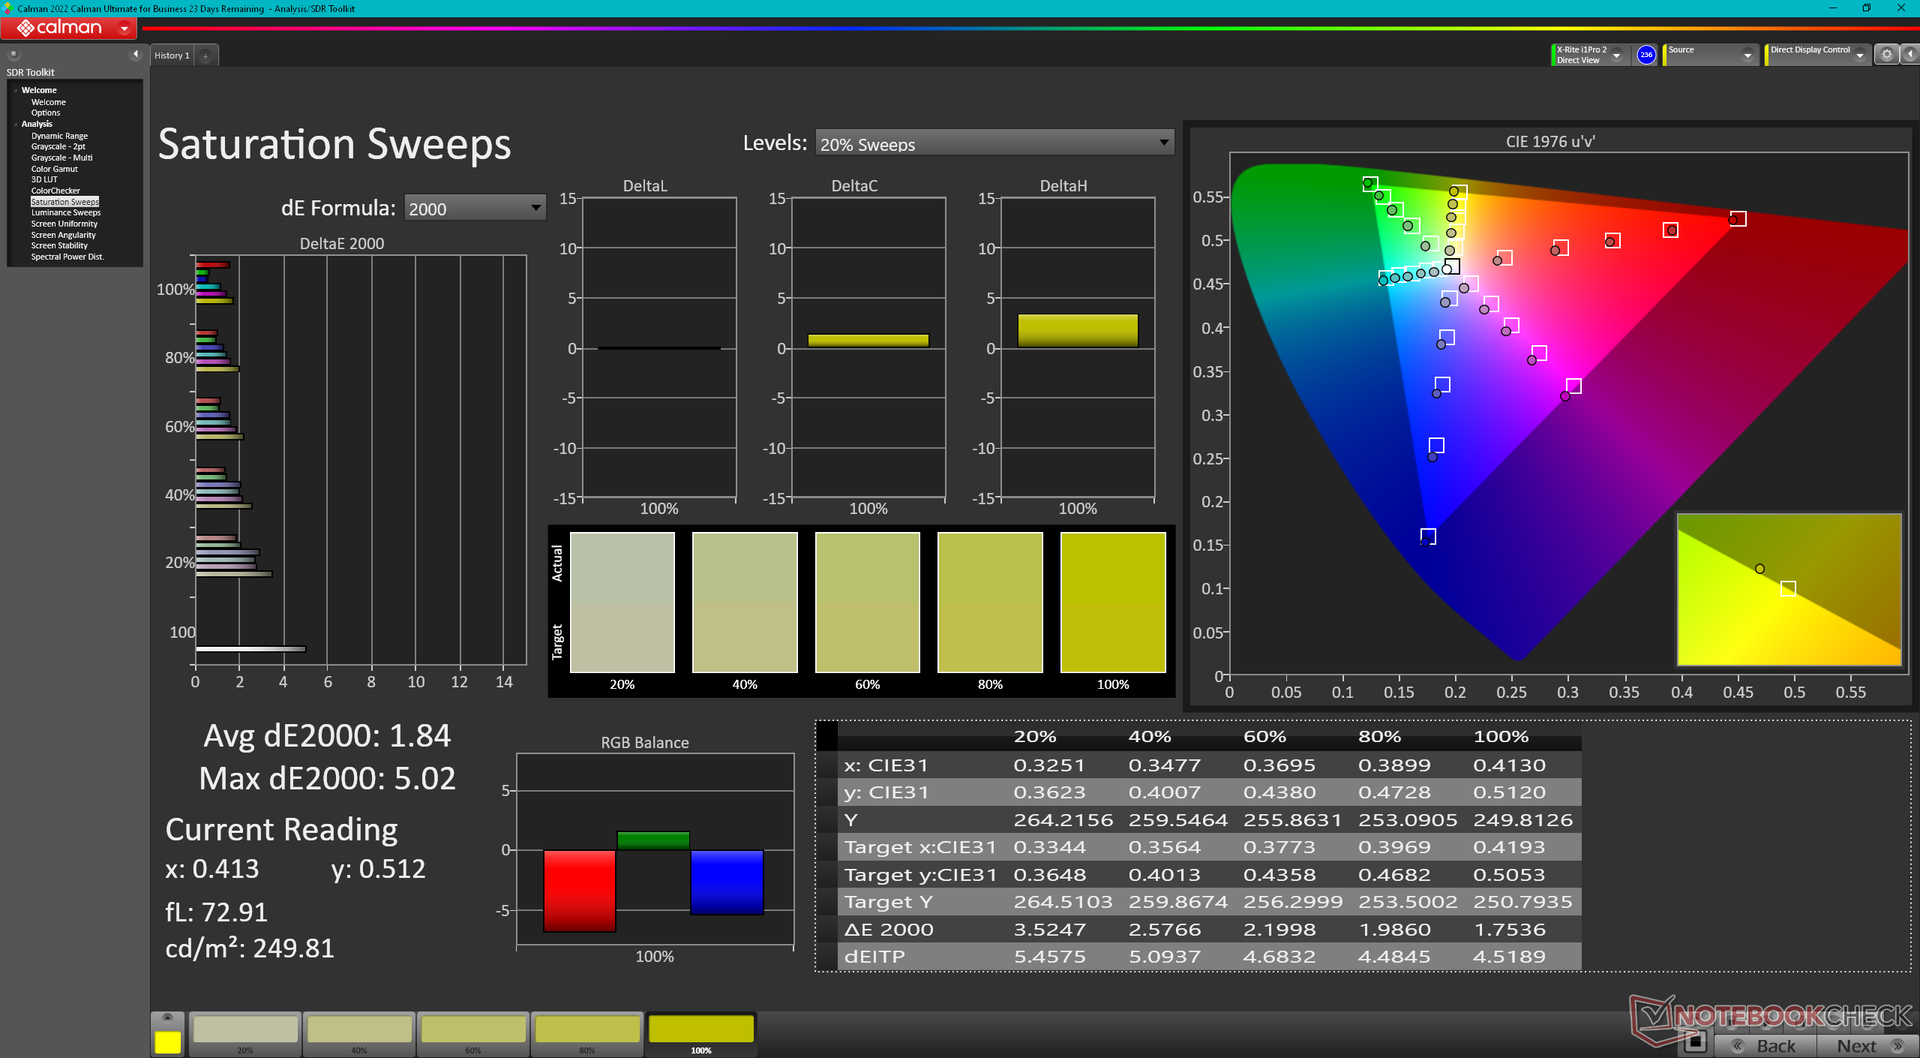
虽然显示器没有经过出厂校准,但平均灰度和彩色 DeltaE 值还是相当不错的,分别为 3.3 和 1.8。色温略微偏冷,接近 7100,但使用我们的 X-Rite 色度计校准后,平均 DeltaE 值略有改善。用户可以免费使用我们上述校准过的 ICM 配置文件。

Display Response Times
| ↔ Response Time Black to White | ||
|---|---|---|
| 9.1 ms ... rise ↗ and fall ↘ combined | ↗ 5 ms rise | 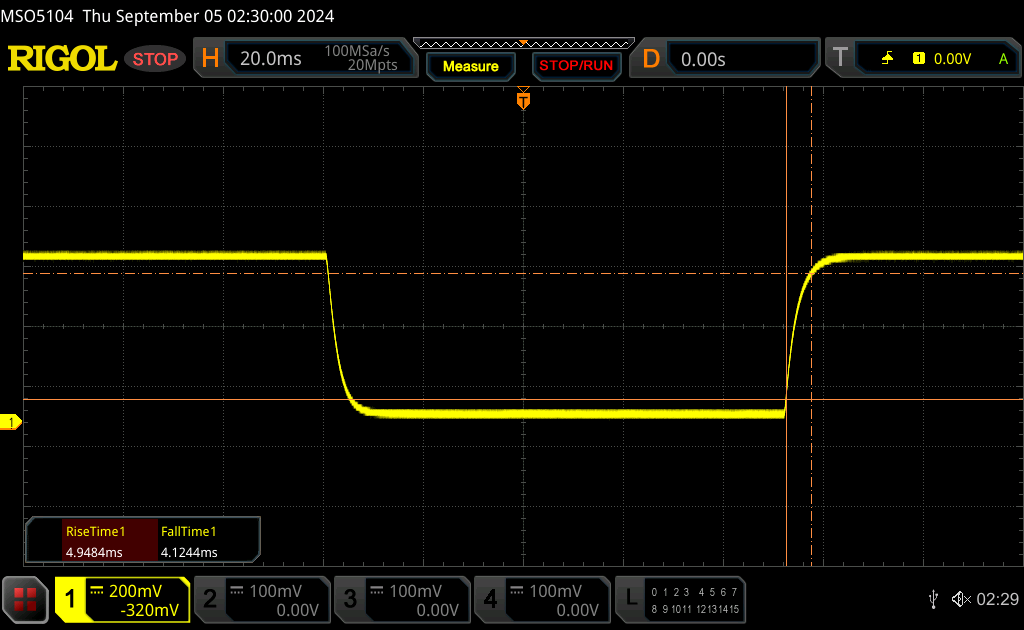 |
| ↘ 4.1 ms fall | ||
| The screen shows fast response rates in our tests and should be suited for gaming. In comparison, all tested devices range from 0.1 (minimum) to 240 (maximum) ms. » 23 % of all devices are better. This means that the measured response time is better than the average of all tested devices (20.8 ms). | ||
| ↔ Response Time 50% Grey to 80% Grey | ||
| 12.5 ms ... rise ↗ and fall ↘ combined | ↗ 5.6 ms rise | 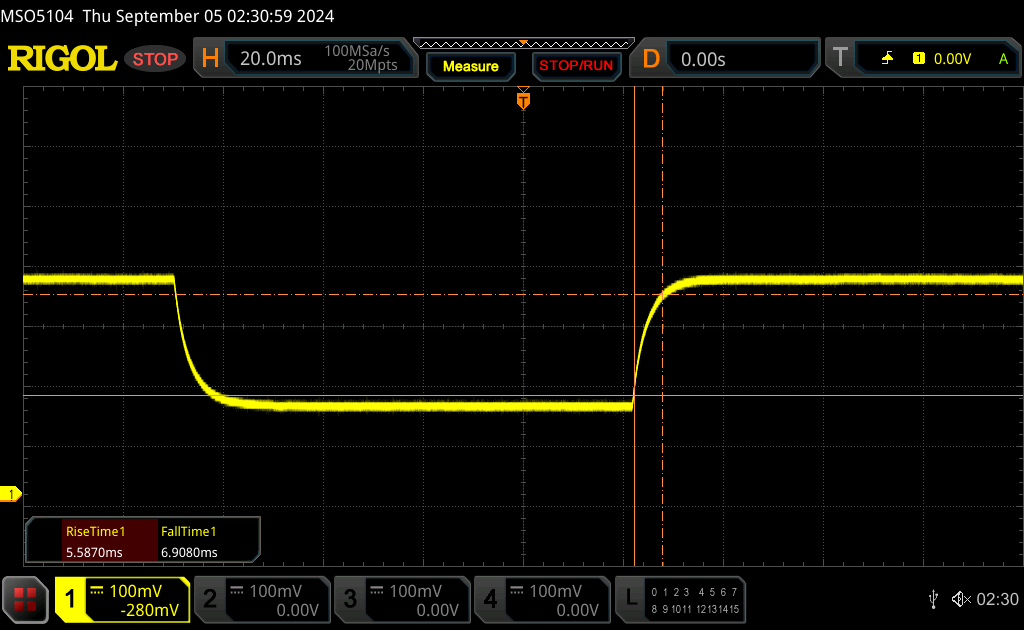 |
| ↘ 6.9 ms fall | ||
| The screen shows good response rates in our tests, but may be too slow for competitive gamers. In comparison, all tested devices range from 0.165 (minimum) to 636 (maximum) ms. » 23 % of all devices are better. This means that the measured response time is better than the average of all tested devices (32.5 ms). | ||
Screen Flickering / PWM (Pulse-Width Modulation)
| Screen flickering / PWM not detected | 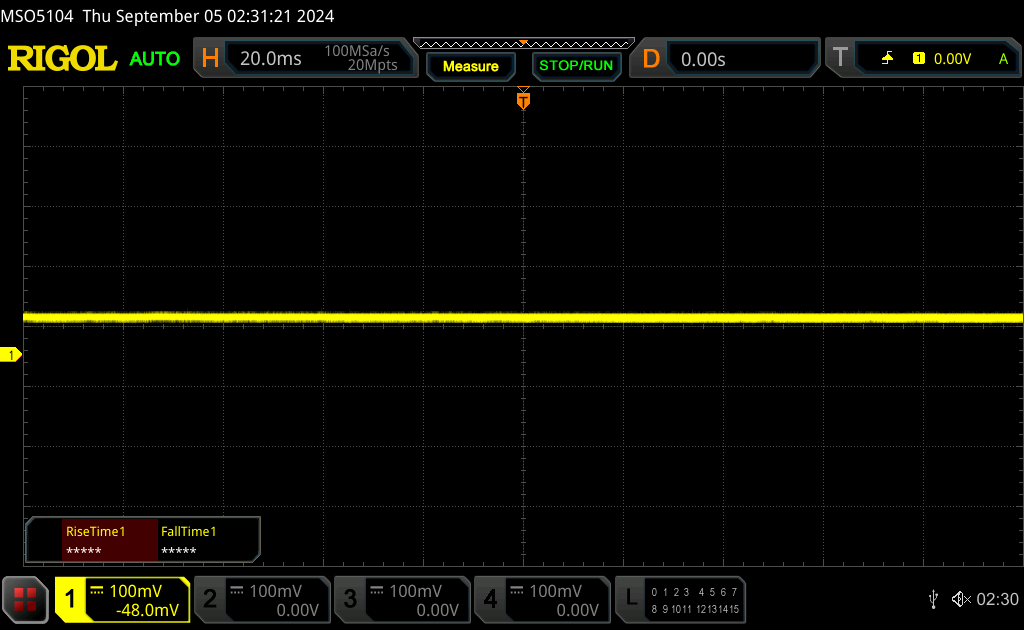 | ||
In comparison: 53 % of all tested devices do not use PWM to dim the display. If PWM was detected, an average of 8516 (minimum: 5 - maximum: 343500) Hz was measured. | |||
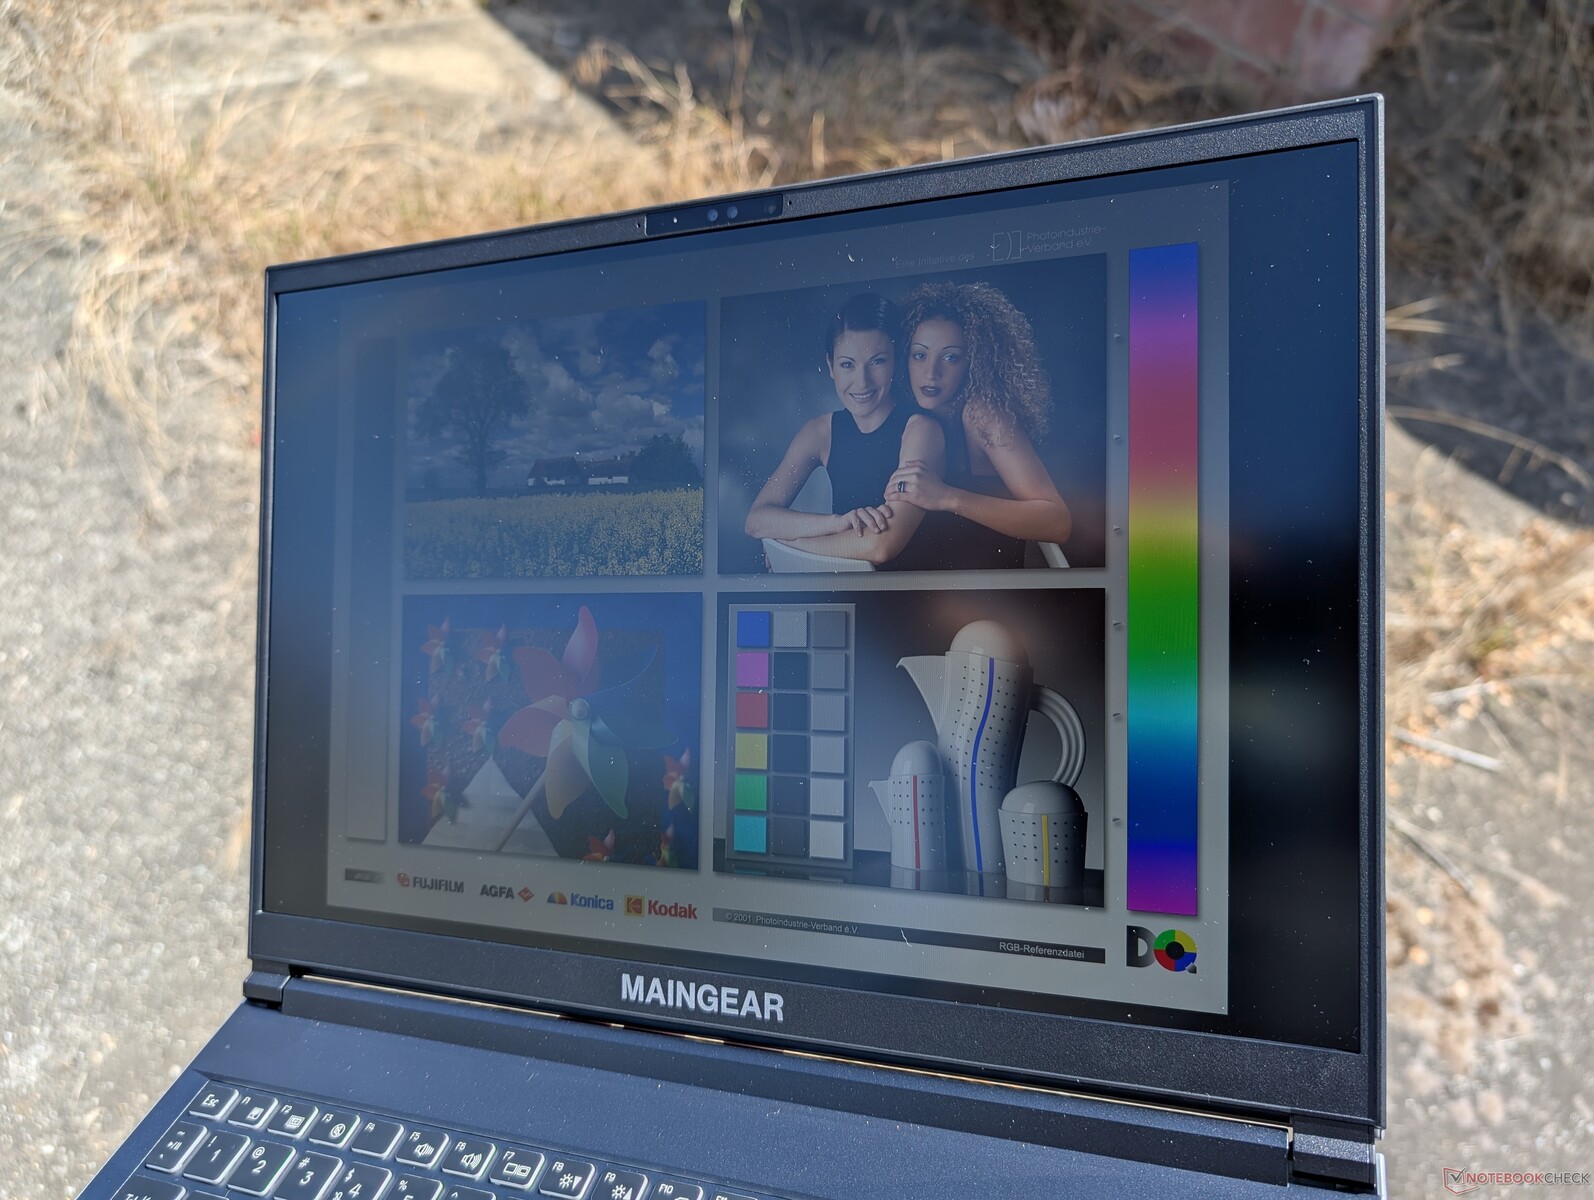
由于采用了相对明亮的 500 nit 背光,室外能见度优于大多数其他 16 英寸游戏笔记本电脑。笔记本 Victus 16、Alienware x16 R2 和 Blade 16 的最高亮度仅为 400 尼特,甚至只有 300 尼特,明显较暗。您还是要尽量避免阳光直射,以保持色彩。

性能 - 流星湖取代猛禽湖刷新
测试条件
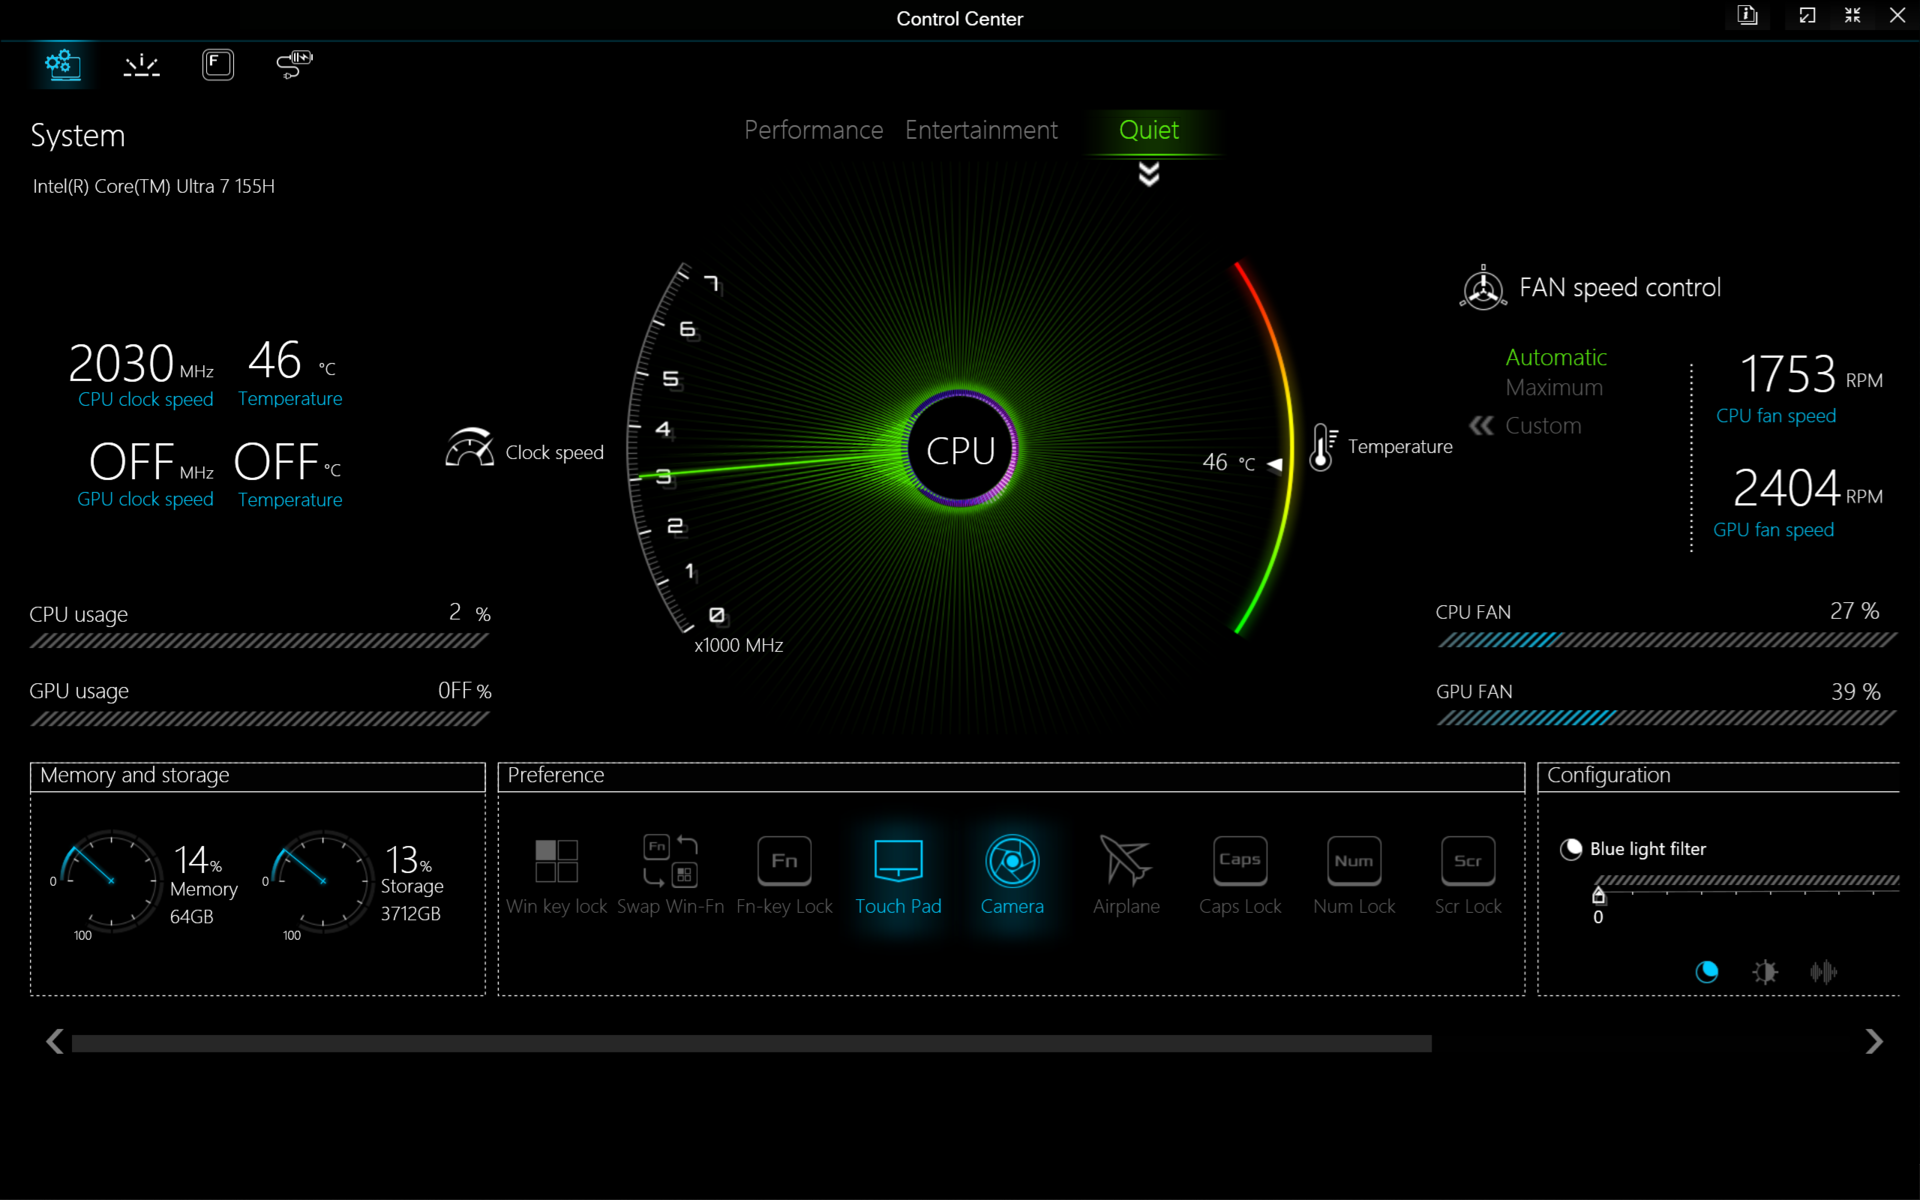
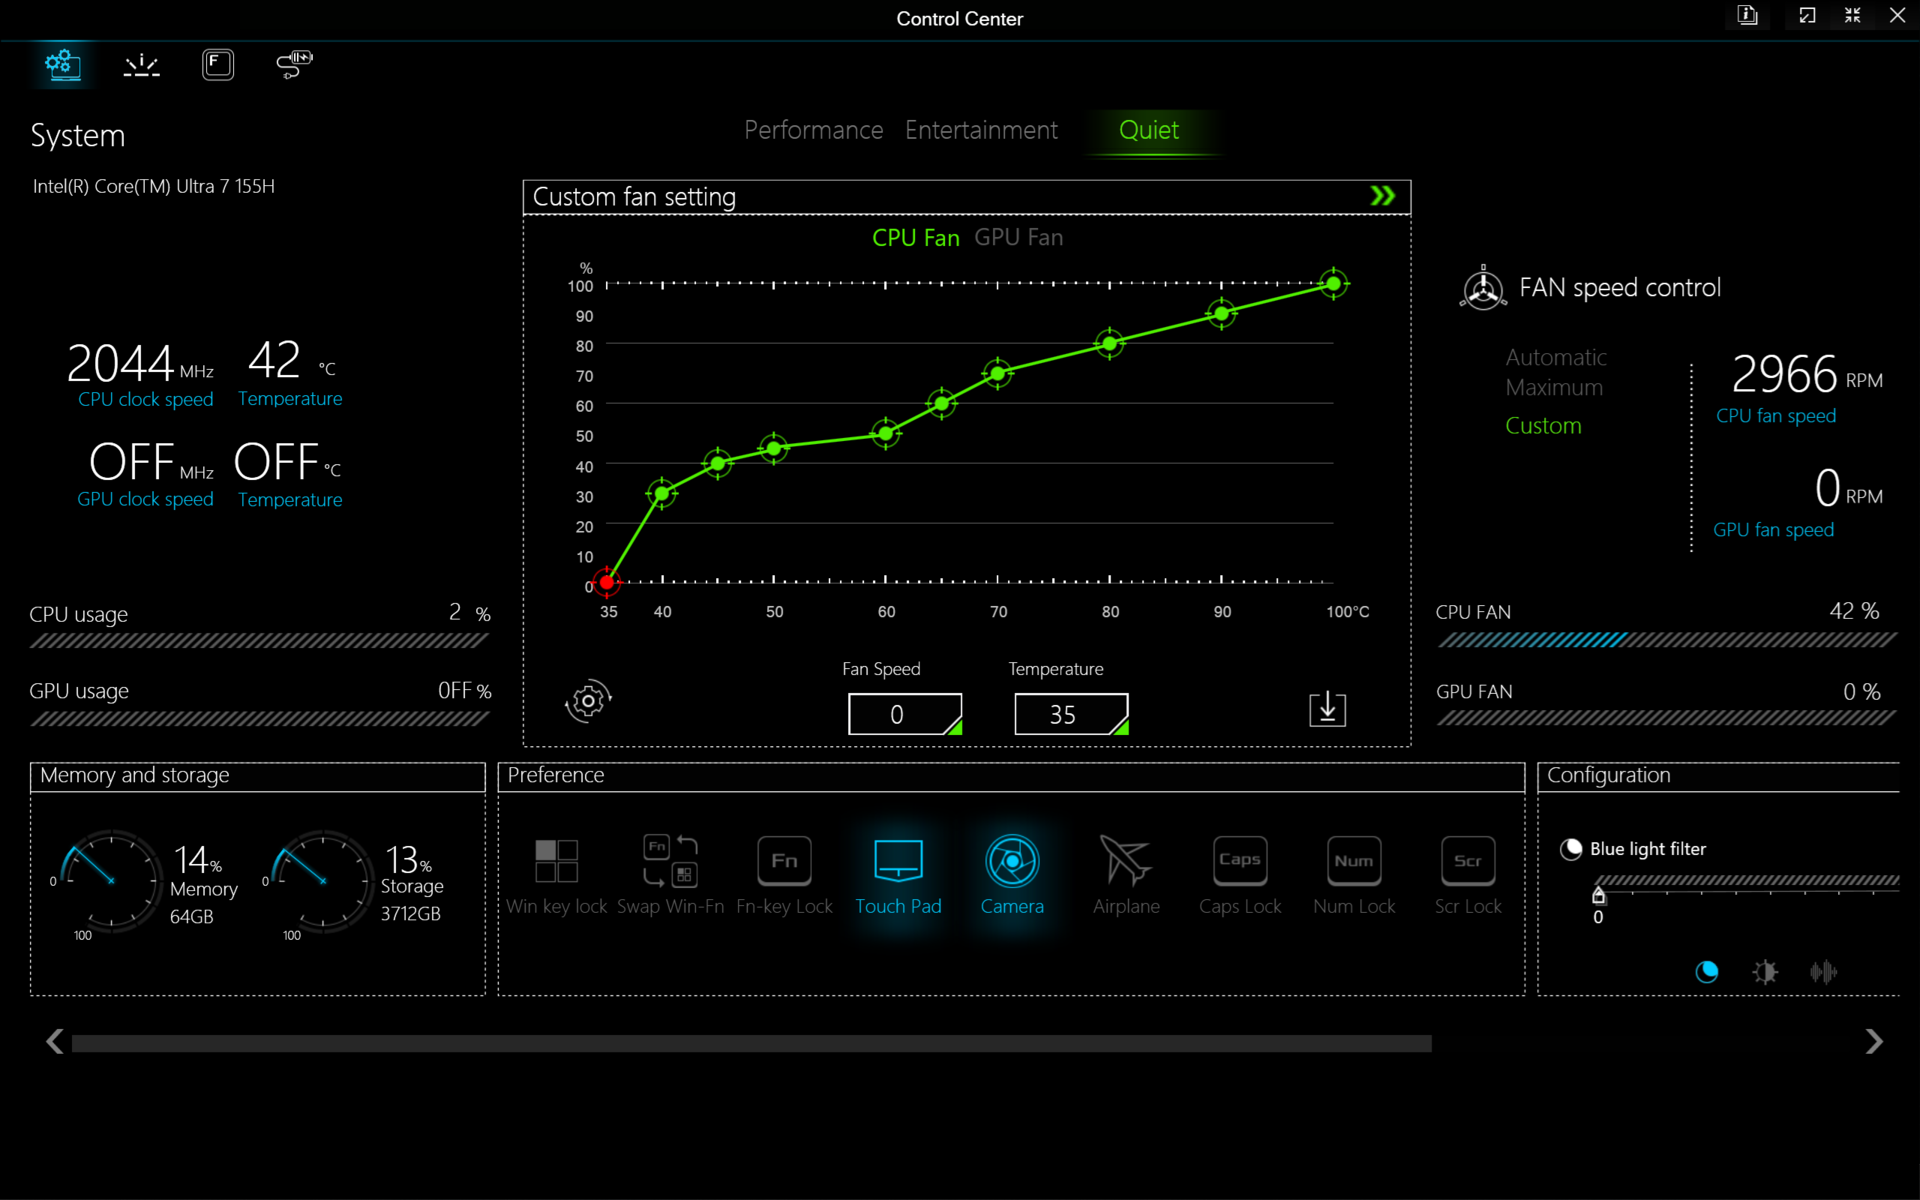
在运行下面的基准测试之前,我们将 Windows 和控制中心设置为性能模式。用户应该熟悉预装的控制中心软件,因为它是调整关键功能的中心,包括风扇行为、电子相机快门、RGB 键和手动 GPU MUX 开关。需要注意的是,后者被隐藏在一个子菜单中,需要额外点击才能进入,令人恼火。
仅支持标准 Optimus 和 MUX,不支持高级 Optimus。因此,在 dGPU 和 MSHybrid 模式之间切换时需要重启。

处理器
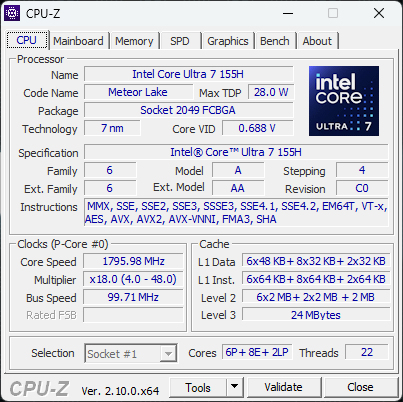
酷睿至尊 7 155H Core Ultra 7 155H继 酷睿 i7-13700H但性能提升相对较小,仅为 5% 至 15%。这是因为新的 Meteor Lake 平台为新的集成 NPU 预留了大量芯片空间,因此原始性能优势在今年退居其次。酷睿 i7-14700HX 酷睿 i7-14700HX会比酷睿至尊 7 155H 更显著地提升原始性能,但它也是一款更耗电的处理器。
遗憾的是,集成 NPU 的作用非常有限,因为它与 Co-Pilot+ 不兼容;微软的这项服务至少需要 Lunar Lake 处理器或 AMD/Qualcomm 的同类产品。大多数游戏也尚未使用 NPU。
Cinebench R15 Multi Loop
Cinebench R23: Multi Core | Single Core
Cinebench R20: CPU (Multi Core) | CPU (Single Core)
Cinebench R15: CPU Multi 64Bit | CPU Single 64Bit
Blender: v2.79 BMW27 CPU
7-Zip 18.03: 7z b 4 | 7z b 4 -mmt1
Geekbench 6.4: Multi-Core | Single-Core
Geekbench 5.5: Multi-Core | Single-Core
HWBOT x265 Benchmark v2.2: 4k Preset
LibreOffice : 20 Documents To PDF
R Benchmark 2.5: Overall mean
| CPU Performance Rating | |
| Razer Blade 16 2024, RTX 4090 | |
| Asus ROG Zephyrus G16 GA605WV | |
| HP Victus 16 (2024) | |
| Asus TUF Gaming A16 FA617XS -2! | |
| MSI Stealth 16 Mercedes-AMG Motorsport A13VG | |
| Lenovo Legion Slim 7 16APH8 | |
| Dell Inspiron 16 Plus 7630 | |
| HP Victus 16-r0076TX -3! | |
| Alienware x16 R2 P120F | |
| Maingear ML-16 MK2 | |
| Average Intel Core Ultra 7 155H | |
| HP Victus 16-r0077ng | |
| CSL GameStar Notebook VenomGamer G16 | |
| HP Omen 16-n0033dx -2! | |
| Acer Nitro 16 AN16-41-R7YE | |
| Cinebench R23 / Multi Core | |
| Razer Blade 16 2024, RTX 4090 | |
| HP Victus 16 (2024) | |
| Asus ROG Zephyrus G16 GA605WV | |
| MSI Stealth 16 Mercedes-AMG Motorsport A13VG | |
| Alienware x16 R2 P120F | |
| HP Victus 16-r0076TX | |
| Maingear ML-16 MK2 | |
| Asus TUF Gaming A16 FA617XS | |
| Lenovo Legion Slim 7 16APH8 | |
| Dell Inspiron 16 Plus 7630 | |
| HP Victus 16-r0077ng | |
| Average Intel Core Ultra 7 155H (9769 - 19007, n=52) | |
| CSL GameStar Notebook VenomGamer G16 | |
| HP Omen 16-n0033dx | |
| Acer Nitro 16 AN16-41-R7YE | |
| Cinebench R23 / Single Core | |
| Razer Blade 16 2024, RTX 4090 | |
| MSI Stealth 16 Mercedes-AMG Motorsport A13VG | |
| Asus ROG Zephyrus G16 GA605WV | |
| Dell Inspiron 16 Plus 7630 | |
| Asus TUF Gaming A16 FA617XS | |
| Lenovo Legion Slim 7 16APH8 | |
| Average Intel Core Ultra 7 155H (1496 - 1815, n=52) | |
| HP Victus 16 (2024) | |
| HP Victus 16-r0076TX | |
| HP Victus 16-r0077ng | |
| Maingear ML-16 MK2 | |
| Alienware x16 R2 P120F | |
| CSL GameStar Notebook VenomGamer G16 | |
| HP Omen 16-n0033dx | |
| Acer Nitro 16 AN16-41-R7YE | |
| Cinebench R20 / CPU (Multi Core) | |
| Razer Blade 16 2024, RTX 4090 | |
| HP Victus 16 (2024) | |
| Asus ROG Zephyrus G16 GA605WV | |
| MSI Stealth 16 Mercedes-AMG Motorsport A13VG | |
| Alienware x16 R2 P120F | |
| HP Victus 16-r0076TX | |
| Maingear ML-16 MK2 | |
| Asus TUF Gaming A16 FA617XS | |
| Lenovo Legion Slim 7 16APH8 | |
| Dell Inspiron 16 Plus 7630 | |
| HP Victus 16-r0077ng | |
| Average Intel Core Ultra 7 155H (3798 - 7409, n=50) | |
| CSL GameStar Notebook VenomGamer G16 | |
| HP Omen 16-n0033dx | |
| Acer Nitro 16 AN16-41-R7YE | |
| Cinebench R20 / CPU (Single Core) | |
| Razer Blade 16 2024, RTX 4090 | |
| Asus ROG Zephyrus G16 GA605WV | |
| MSI Stealth 16 Mercedes-AMG Motorsport A13VG | |
| Dell Inspiron 16 Plus 7630 | |
| Asus TUF Gaming A16 FA617XS | |
| Lenovo Legion Slim 7 16APH8 | |
| Average Intel Core Ultra 7 155H (601 - 696, n=50) | |
| HP Victus 16 (2024) | |
| HP Victus 16-r0077ng | |
| HP Victus 16-r0076TX | |
| Maingear ML-16 MK2 | |
| Alienware x16 R2 P120F | |
| HP Omen 16-n0033dx | |
| CSL GameStar Notebook VenomGamer G16 | |
| Acer Nitro 16 AN16-41-R7YE | |
| Cinebench R15 / CPU Multi 64Bit | |
| Razer Blade 16 2024, RTX 4090 | |
| HP Victus 16 (2024) | |
| Asus ROG Zephyrus G16 GA605WV | |
| MSI Stealth 16 Mercedes-AMG Motorsport A13VG | |
| HP Victus 16-r0076TX | |
| Alienware x16 R2 P120F | |
| Maingear ML-16 MK2 | |
| Asus TUF Gaming A16 FA617XS | |
| Lenovo Legion Slim 7 16APH8 | |
| Average Intel Core Ultra 7 155H (1932 - 2880, n=56) | |
| Dell Inspiron 16 Plus 7630 | |
| HP Victus 16-r0077ng | |
| CSL GameStar Notebook VenomGamer G16 | |
| HP Omen 16-n0033dx | |
| Acer Nitro 16 AN16-41-R7YE | |
| Cinebench R15 / CPU Single 64Bit | |
| Razer Blade 16 2024, RTX 4090 | |
| Asus ROG Zephyrus G16 GA605WV | |
| Asus TUF Gaming A16 FA617XS | |
| MSI Stealth 16 Mercedes-AMG Motorsport A13VG | |
| Lenovo Legion Slim 7 16APH8 | |
| Dell Inspiron 16 Plus 7630 | |
| CSL GameStar Notebook VenomGamer G16 | |
| Average Intel Core Ultra 7 155H (99.6 - 268, n=52) | |
| HP Victus 16-r0077ng | |
| HP Omen 16-n0033dx | |
| HP Victus 16-r0076TX | |
| Maingear ML-16 MK2 | |
| Acer Nitro 16 AN16-41-R7YE | |
| HP Victus 16 (2024) | |
| Alienware x16 R2 P120F | |
| Blender / v2.79 BMW27 CPU | |
| Acer Nitro 16 AN16-41-R7YE | |
| HP Omen 16-n0033dx | |
| Average Intel Core Ultra 7 155H (175 - 381, n=47) | |
| MSI Stealth 16 Mercedes-AMG Motorsport A13VG | |
| Maingear ML-16 MK2 | |
| Dell Inspiron 16 Plus 7630 | |
| HP Victus 16-r0077ng | |
| CSL GameStar Notebook VenomGamer G16 | |
| Lenovo Legion Slim 7 16APH8 | |
| HP Victus 16-r0076TX | |
| Asus TUF Gaming A16 FA617XS | |
| Alienware x16 R2 P120F | |
| HP Victus 16 (2024) | |
| Asus ROG Zephyrus G16 GA605WV | |
| Razer Blade 16 2024, RTX 4090 | |
| 7-Zip 18.03 / 7z b 4 | |
| Razer Blade 16 2024, RTX 4090 | |
| HP Victus 16 (2024) | |
| Asus ROG Zephyrus G16 GA605WV | |
| HP Victus 16-r0076TX | |
| Lenovo Legion Slim 7 16APH8 | |
| Asus TUF Gaming A16 FA617XS | |
| Alienware x16 R2 P120F | |
| HP Victus 16-r0077ng | |
| Maingear ML-16 MK2 | |
| CSL GameStar Notebook VenomGamer G16 | |
| Dell Inspiron 16 Plus 7630 | |
| Average Intel Core Ultra 7 155H (41739 - 70254, n=50) | |
| HP Omen 16-n0033dx | |
| MSI Stealth 16 Mercedes-AMG Motorsport A13VG | |
| Acer Nitro 16 AN16-41-R7YE | |
| 7-Zip 18.03 / 7z b 4 -mmt1 | |
| Razer Blade 16 2024, RTX 4090 | |
| Asus TUF Gaming A16 FA617XS | |
| Lenovo Legion Slim 7 16APH8 | |
| MSI Stealth 16 Mercedes-AMG Motorsport A13VG | |
| Asus ROG Zephyrus G16 GA605WV | |
| CSL GameStar Notebook VenomGamer G16 | |
| Dell Inspiron 16 Plus 7630 | |
| Acer Nitro 16 AN16-41-R7YE | |
| HP Omen 16-n0033dx | |
| HP Victus 16 (2024) | |
| HP Victus 16-r0077ng | |
| HP Victus 16-r0076TX | |
| Average Intel Core Ultra 7 155H (4594 - 5621, n=50) | |
| Maingear ML-16 MK2 | |
| Alienware x16 R2 P120F | |
| Geekbench 6.4 / Multi-Core | |
| Razer Blade 16 2024, RTX 4090 | |
| Asus ROG Zephyrus G16 GA605WV | |
| HP Victus 16 (2024) | |
| Dell Inspiron 16 Plus 7630 | |
| Lenovo Legion Slim 7 16APH8 | |
| Alienware x16 R2 P120F | |
| Average Intel Core Ultra 7 155H (7732 - 13656, n=55) | |
| MSI Stealth 16 Mercedes-AMG Motorsport A13VG | |
| Maingear ML-16 MK2 | |
| HP Victus 16-r0077ng | |
| CSL GameStar Notebook VenomGamer G16 | |
| Acer Nitro 16 AN16-41-R7YE | |
| Geekbench 6.4 / Single-Core | |
| Razer Blade 16 2024, RTX 4090 | |
| Asus ROG Zephyrus G16 GA605WV | |
| MSI Stealth 16 Mercedes-AMG Motorsport A13VG | |
| Dell Inspiron 16 Plus 7630 | |
| Lenovo Legion Slim 7 16APH8 | |
| HP Victus 16-r0077ng | |
| HP Victus 16 (2024) | |
| Average Intel Core Ultra 7 155H (1901 - 2473, n=52) | |
| Maingear ML-16 MK2 | |
| Alienware x16 R2 P120F | |
| CSL GameStar Notebook VenomGamer G16 | |
| Acer Nitro 16 AN16-41-R7YE | |
| Geekbench 5.5 / Multi-Core | |
| Razer Blade 16 2024, RTX 4090 | |
| HP Victus 16 (2024) | |
| Asus ROG Zephyrus G16 GA605WV | |
| Dell Inspiron 16 Plus 7630 | |
| Alienware x16 R2 P120F | |
| HP Victus 16-r0076TX | |
| Maingear ML-16 MK2 | |
| Asus TUF Gaming A16 FA617XS | |
| Average Intel Core Ultra 7 155H (10017 - 13556, n=52) | |
| Lenovo Legion Slim 7 16APH8 | |
| HP Victus 16-r0077ng | |
| MSI Stealth 16 Mercedes-AMG Motorsport A13VG | |
| CSL GameStar Notebook VenomGamer G16 | |
| HP Omen 16-n0033dx | |
| Acer Nitro 16 AN16-41-R7YE | |
| Geekbench 5.5 / Single-Core | |
| Razer Blade 16 2024, RTX 4090 | |
| Asus ROG Zephyrus G16 GA605WV | |
| Asus TUF Gaming A16 FA617XS | |
| MSI Stealth 16 Mercedes-AMG Motorsport A13VG | |
| Lenovo Legion Slim 7 16APH8 | |
| Dell Inspiron 16 Plus 7630 | |
| Average Intel Core Ultra 7 155H (1462 - 1824, n=52) | |
| HP Victus 16 (2024) | |
| Alienware x16 R2 P120F | |
| HP Victus 16-r0076TX | |
| HP Victus 16-r0077ng | |
| Maingear ML-16 MK2 | |
| CSL GameStar Notebook VenomGamer G16 | |
| HP Omen 16-n0033dx | |
| Acer Nitro 16 AN16-41-R7YE | |
| HWBOT x265 Benchmark v2.2 / 4k Preset | |
| Razer Blade 16 2024, RTX 4090 | |
| Asus ROG Zephyrus G16 GA605WV | |
| HP Victus 16 (2024) | |
| Asus TUF Gaming A16 FA617XS | |
| Alienware x16 R2 P120F | |
| HP Victus 16-r0076TX | |
| Lenovo Legion Slim 7 16APH8 | |
| CSL GameStar Notebook VenomGamer G16 | |
| Maingear ML-16 MK2 | |
| HP Victus 16-r0077ng | |
| Average Intel Core Ultra 7 155H (9.93 - 21.2, n=50) | |
| HP Omen 16-n0033dx | |
| Dell Inspiron 16 Plus 7630 | |
| MSI Stealth 16 Mercedes-AMG Motorsport A13VG | |
| Acer Nitro 16 AN16-41-R7YE | |
| LibreOffice / 20 Documents To PDF | |
| Lenovo Legion Slim 7 16APH8 | |
| CSL GameStar Notebook VenomGamer G16 | |
| HP Victus 16-r0077ng | |
| HP Omen 16-n0033dx | |
| MSI Stealth 16 Mercedes-AMG Motorsport A13VG | |
| HP Victus 16 (2024) | |
| Asus ROG Zephyrus G16 GA605WV | |
| Average Intel Core Ultra 7 155H (37.5 - 79.2, n=49) | |
| Razer Blade 16 2024, RTX 4090 | |
| Acer Nitro 16 AN16-41-R7YE | |
| Alienware x16 R2 P120F | |
| Dell Inspiron 16 Plus 7630 | |
| Maingear ML-16 MK2 | |
| Asus TUF Gaming A16 FA617XS | |
| R Benchmark 2.5 / Overall mean | |
| Maingear ML-16 MK2 | |
| HP Victus 16-r0077ng | |
| Acer Nitro 16 AN16-41-R7YE | |
| Alienware x16 R2 P120F | |
| HP Omen 16-n0033dx | |
| HP Victus 16 (2024) | |
| HP Victus 16-r0076TX | |
| CSL GameStar Notebook VenomGamer G16 | |
| Average Intel Core Ultra 7 155H (0.4457 - 0.53, n=49) | |
| Lenovo Legion Slim 7 16APH8 | |
| Dell Inspiron 16 Plus 7630 | |
| MSI Stealth 16 Mercedes-AMG Motorsport A13VG | |
| Asus TUF Gaming A16 FA617XS | |
| Asus ROG Zephyrus G16 GA605WV | |
| Razer Blade 16 2024, RTX 4090 | |
Cinebench R23: Multi Core | Single Core
Cinebench R20: CPU (Multi Core) | CPU (Single Core)
Cinebench R15: CPU Multi 64Bit | CPU Single 64Bit
Blender: v2.79 BMW27 CPU
7-Zip 18.03: 7z b 4 | 7z b 4 -mmt1
Geekbench 6.4: Multi-Core | Single-Core
Geekbench 5.5: Multi-Core | Single-Core
HWBOT x265 Benchmark v2.2: 4k Preset
LibreOffice : 20 Documents To PDF
R Benchmark 2.5: Overall mean
* ... smaller is better
AIDA64: FP32 Ray-Trace | FPU Julia | CPU SHA3 | CPU Queen | FPU SinJulia | FPU Mandel | CPU AES | CPU ZLib | FP64 Ray-Trace | CPU PhotoWorxx
| Performance Rating | |
| Asus ROG Zephyrus G16 GA605WV | |
| Razer Blade 16 2024, RTX 4090 | |
| Lenovo Legion Pro 5 16IRX9 | |
| Alienware x16 R2 P120F | |
| HP Victus 16 (2024) | |
| Maingear ML-16 MK2 | |
| Average Intel Core Ultra 7 155H | |
| AIDA64 / FP32 Ray-Trace | |
| Asus ROG Zephyrus G16 GA605WV | |
| Razer Blade 16 2024, RTX 4090 | |
| Lenovo Legion Pro 5 16IRX9 | |
| Alienware x16 R2 P120F | |
| HP Victus 16 (2024) | |
| Maingear ML-16 MK2 | |
| Average Intel Core Ultra 7 155H (6670 - 18470, n=50) | |
| AIDA64 / FPU Julia | |
| Asus ROG Zephyrus G16 GA605WV | |
| Lenovo Legion Pro 5 16IRX9 | |
| Razer Blade 16 2024, RTX 4090 | |
| Alienware x16 R2 P120F | |
| HP Victus 16 (2024) | |
| Maingear ML-16 MK2 | |
| Average Intel Core Ultra 7 155H (40905 - 93181, n=50) | |
| AIDA64 / CPU SHA3 | |
| Lenovo Legion Pro 5 16IRX9 | |
| Razer Blade 16 2024, RTX 4090 | |
| Asus ROG Zephyrus G16 GA605WV | |
| Alienware x16 R2 P120F | |
| HP Victus 16 (2024) | |
| Maingear ML-16 MK2 | |
| Average Intel Core Ultra 7 155H (1940 - 4436, n=50) | |
| AIDA64 / CPU Queen | |
| Lenovo Legion Pro 5 16IRX9 | |
| Razer Blade 16 2024, RTX 4090 | |
| HP Victus 16 (2024) | |
| Alienware x16 R2 P120F | |
| Asus ROG Zephyrus G16 GA605WV | |
| Maingear ML-16 MK2 | |
| Average Intel Core Ultra 7 155H (64698 - 94181, n=50) | |
| AIDA64 / FPU SinJulia | |
| Asus ROG Zephyrus G16 GA605WV | |
| Razer Blade 16 2024, RTX 4090 | |
| Lenovo Legion Pro 5 16IRX9 | |
| HP Victus 16 (2024) | |
| Alienware x16 R2 P120F | |
| Maingear ML-16 MK2 | |
| Average Intel Core Ultra 7 155H (5639 - 10647, n=50) | |
| AIDA64 / FPU Mandel | |
| Asus ROG Zephyrus G16 GA605WV | |
| Razer Blade 16 2024, RTX 4090 | |
| Lenovo Legion Pro 5 16IRX9 | |
| Alienware x16 R2 P120F | |
| HP Victus 16 (2024) | |
| Maingear ML-16 MK2 | |
| Average Intel Core Ultra 7 155H (18236 - 47685, n=50) | |
| AIDA64 / CPU AES | |
| Maingear ML-16 MK2 | |
| Razer Blade 16 2024, RTX 4090 | |
| Lenovo Legion Pro 5 16IRX9 | |
| Alienware x16 R2 P120F | |
| HP Victus 16 (2024) | |
| Asus ROG Zephyrus G16 GA605WV | |
| Average Intel Core Ultra 7 155H (45713 - 152179, n=50) | |
| AIDA64 / CPU ZLib | |
| Lenovo Legion Pro 5 16IRX9 | |
| Razer Blade 16 2024, RTX 4090 | |
| Asus ROG Zephyrus G16 GA605WV | |
| Alienware x16 R2 P120F | |
| Maingear ML-16 MK2 | |
| HP Victus 16 (2024) | |
| Average Intel Core Ultra 7 155H (557 - 1250, n=50) | |
| AIDA64 / FP64 Ray-Trace | |
| Asus ROG Zephyrus G16 GA605WV | |
| Razer Blade 16 2024, RTX 4090 | |
| Lenovo Legion Pro 5 16IRX9 | |
| Alienware x16 R2 P120F | |
| HP Victus 16 (2024) | |
| Maingear ML-16 MK2 | |
| Average Intel Core Ultra 7 155H (3569 - 9802, n=50) | |
| AIDA64 / CPU PhotoWorxx | |
| Alienware x16 R2 P120F | |
| Lenovo Legion Pro 5 16IRX9 | |
| Razer Blade 16 2024, RTX 4090 | |
| Asus ROG Zephyrus G16 GA605WV | |
| Average Intel Core Ultra 7 155H (32719 - 54223, n=50) | |
| HP Victus 16 (2024) | |
| Maingear ML-16 MK2 | |
压力测试
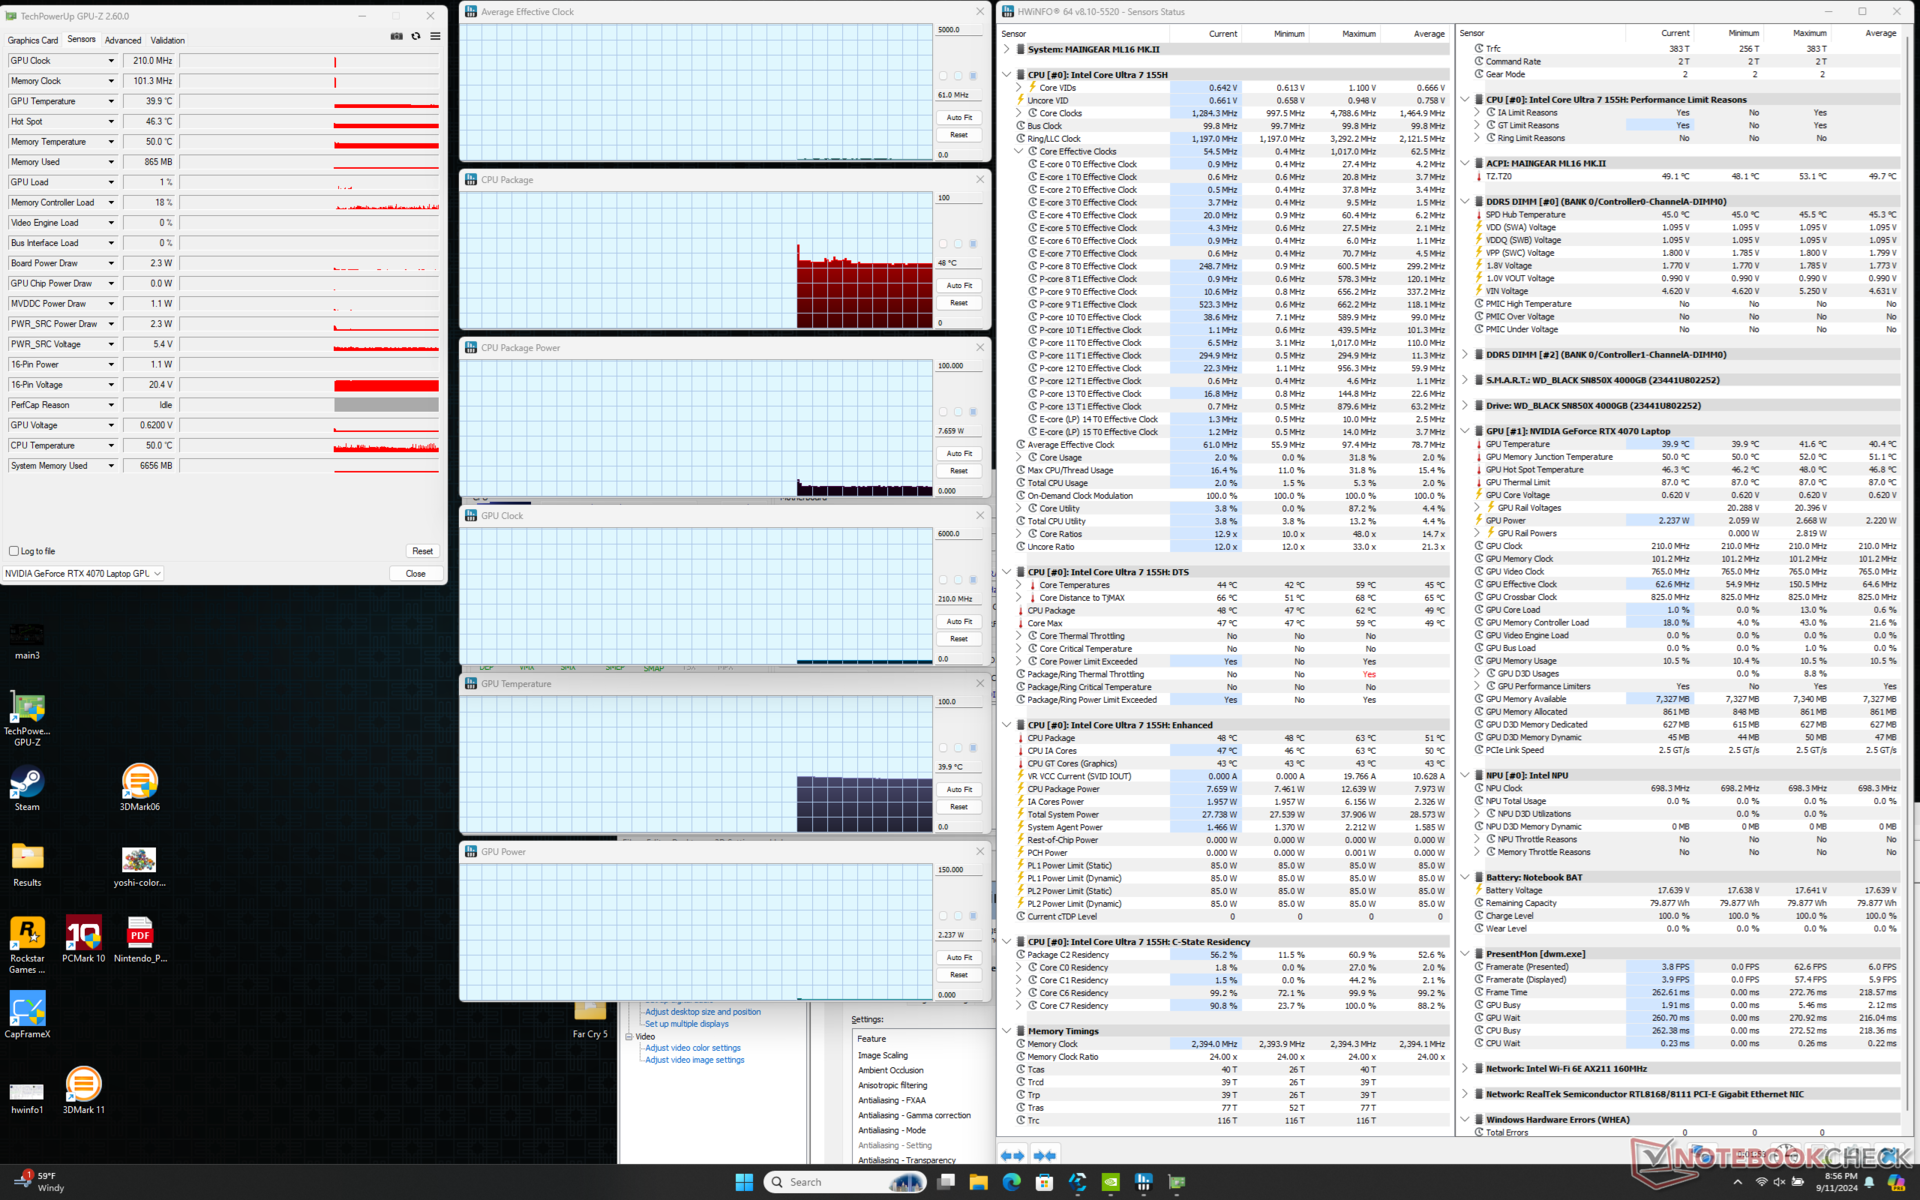
在启动 Prime95 压力测试时,CPU 会升至 3.2 GHz、100 C 和 85 W。然而,几秒钟后,CPU 会降至 2.6 GHz 和 69 W,然后最终稳定在 2.1 GHz 和 57 W。根据 HWiNFO,核心温度在 73 C 和 100 C 之间循环,并检测到热节流。这些较高的核心温度比 雷蛇刀锋 16在类似条件下的温度更高,这也是表面温度非常高的原因。
在性能模式下运行《赛博朋克 2077》时,GPU 会稳定在 2160 MHz、85 C 和 80 W,而在更安静的平衡模式下则为 2010 MHz、80 C 和 74 W。如果您的游戏 CPU 占用率不高,那么在平衡模式下运行可能会更好,因为 GPU 不会受到严重影响。需要注意的是,Nvidia 控制面板列出的 TGP 为 105 W,但根据 GPU-Z,我们在游戏时最高只能达到 80 W。
游戏时的整体核心温度要比 Blade 16 等其他产品高得多。我们的 CPU 和 GPU 温度分别稳定在 101 摄氏度和 85 摄氏度,而 Razer 则分别为 78 摄氏度和 75 摄氏度。启用最大风扇模式只能将核心温度降低几摄氏度,而不会提高性能。
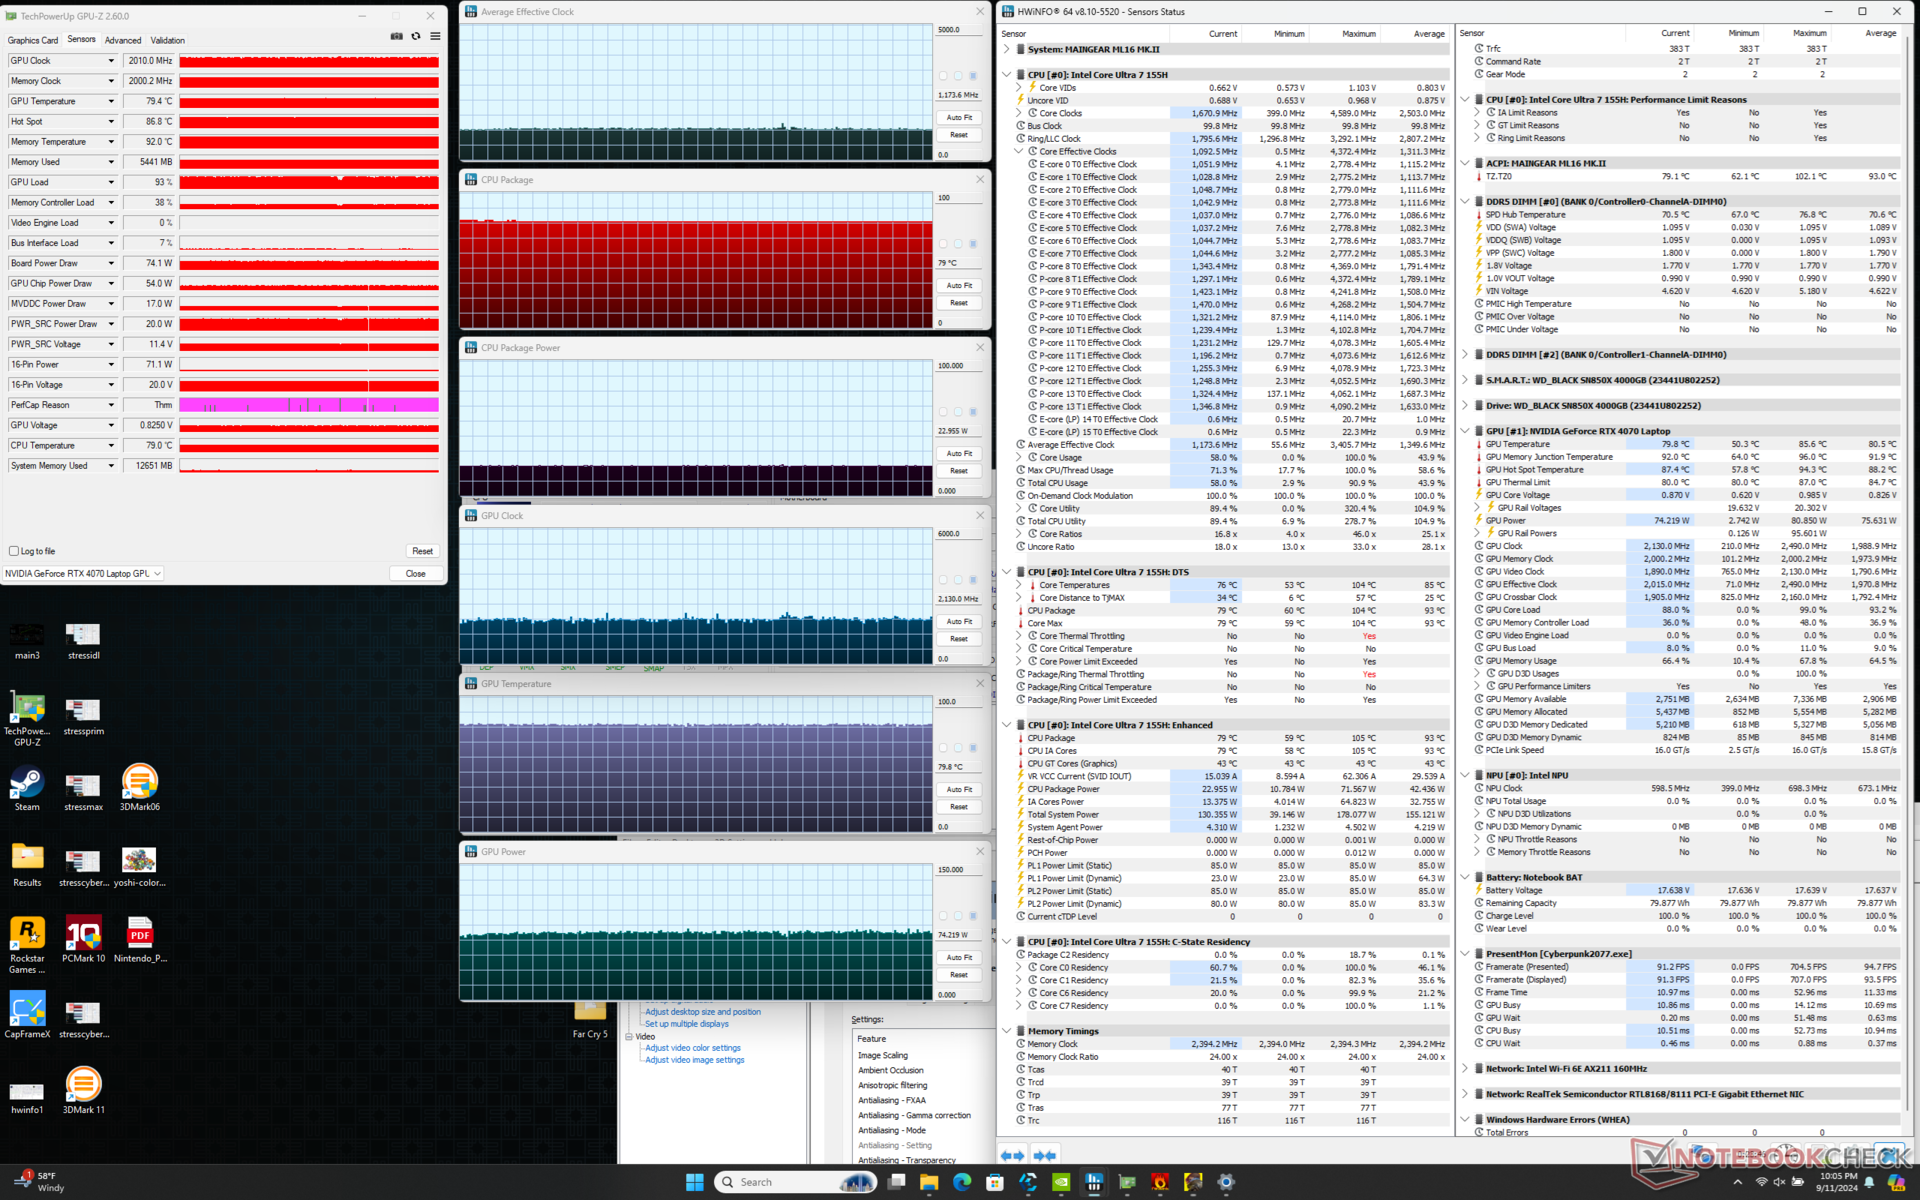
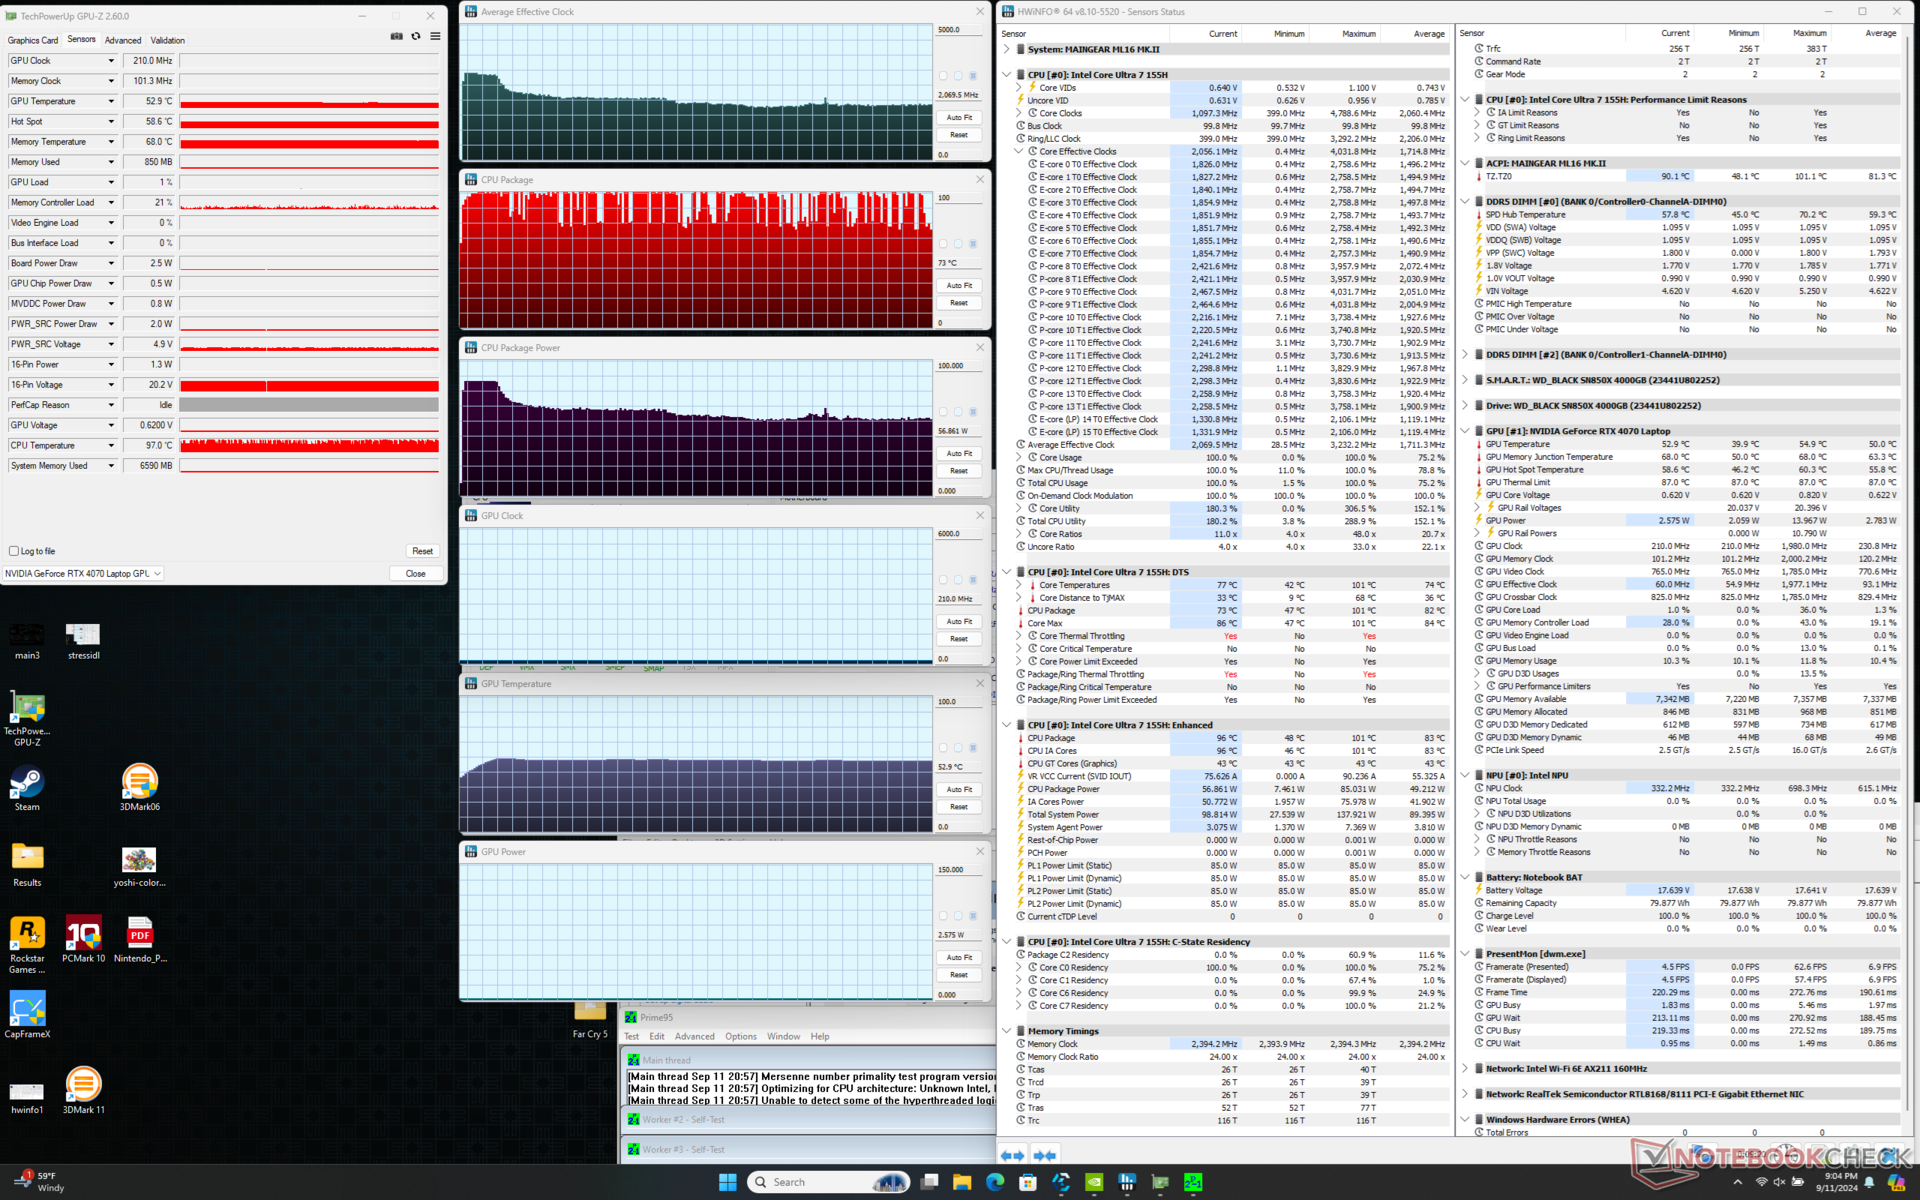

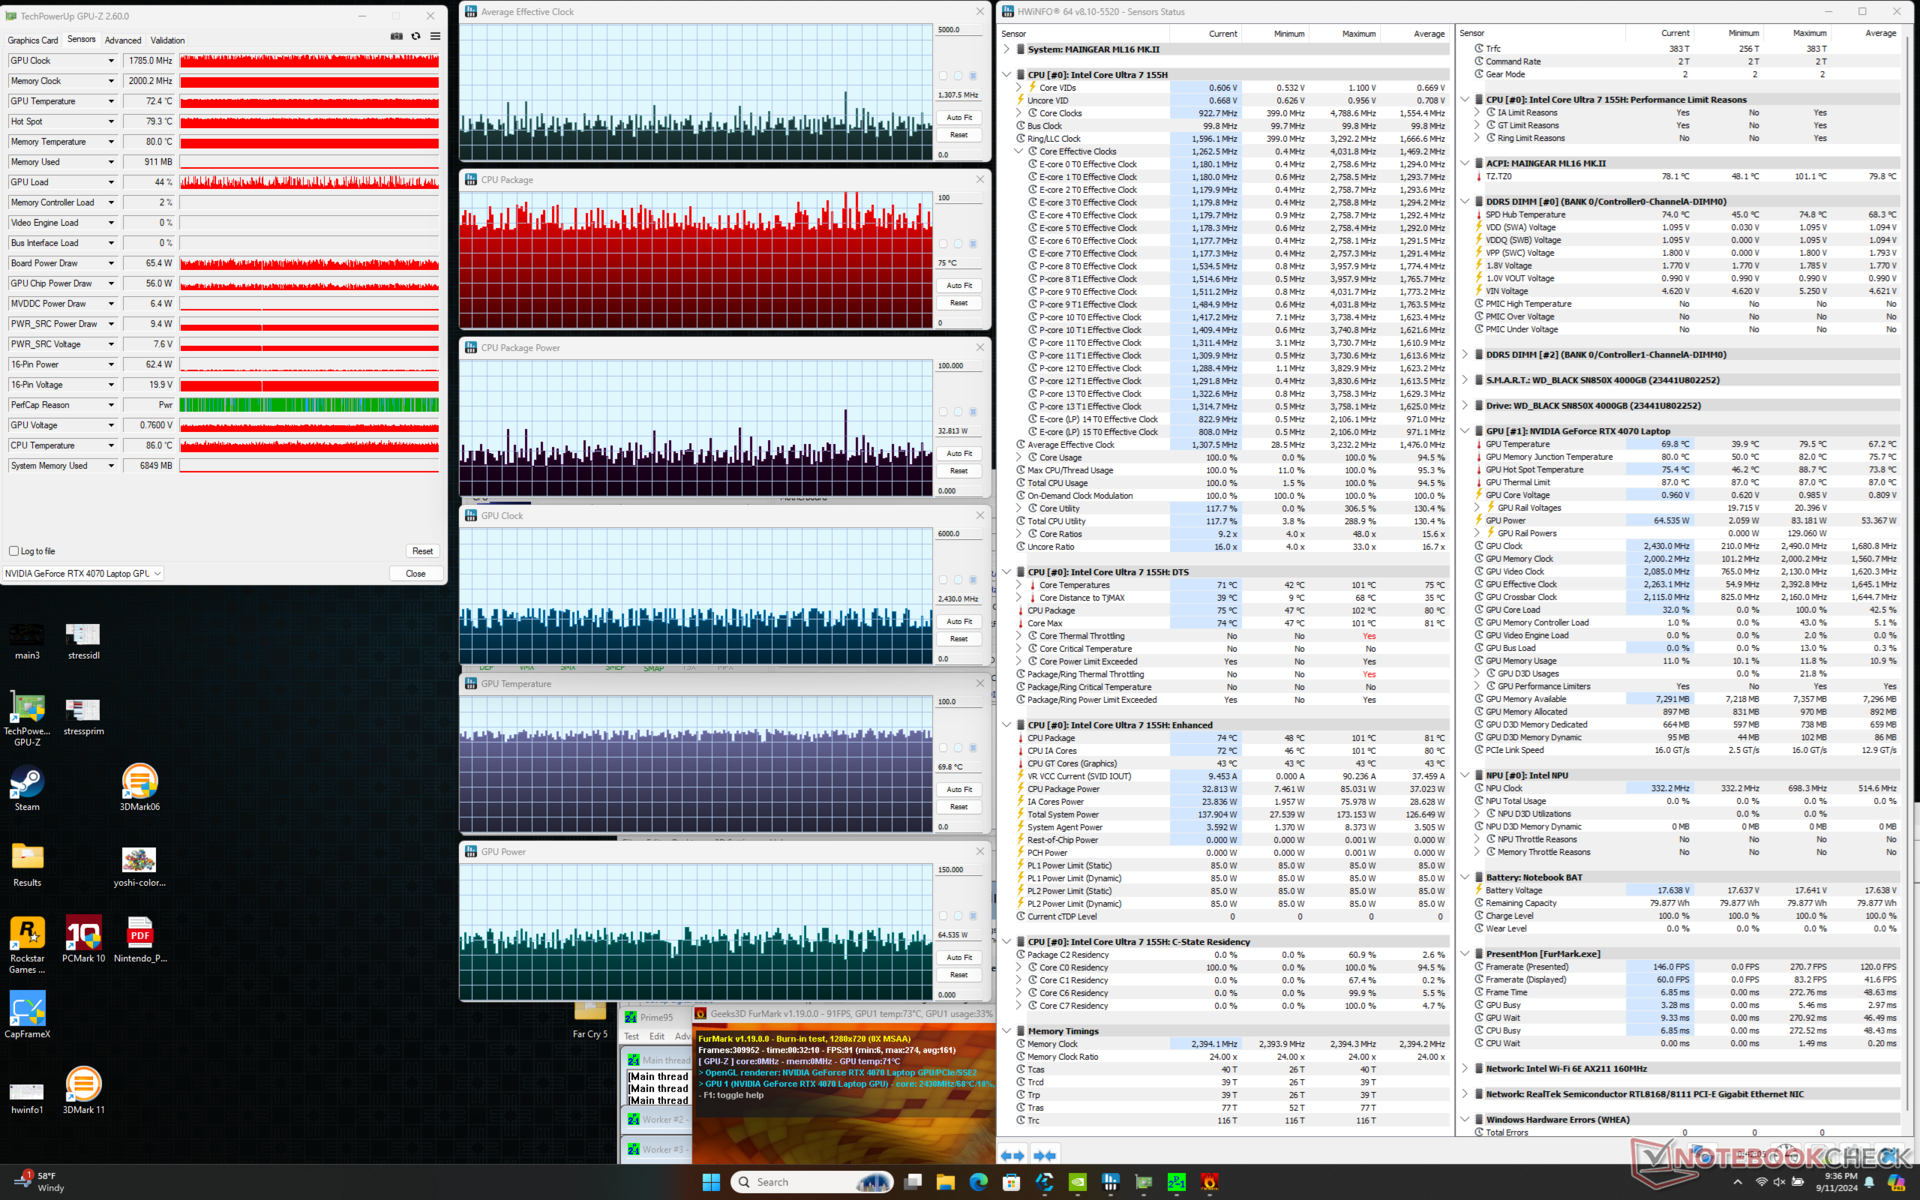
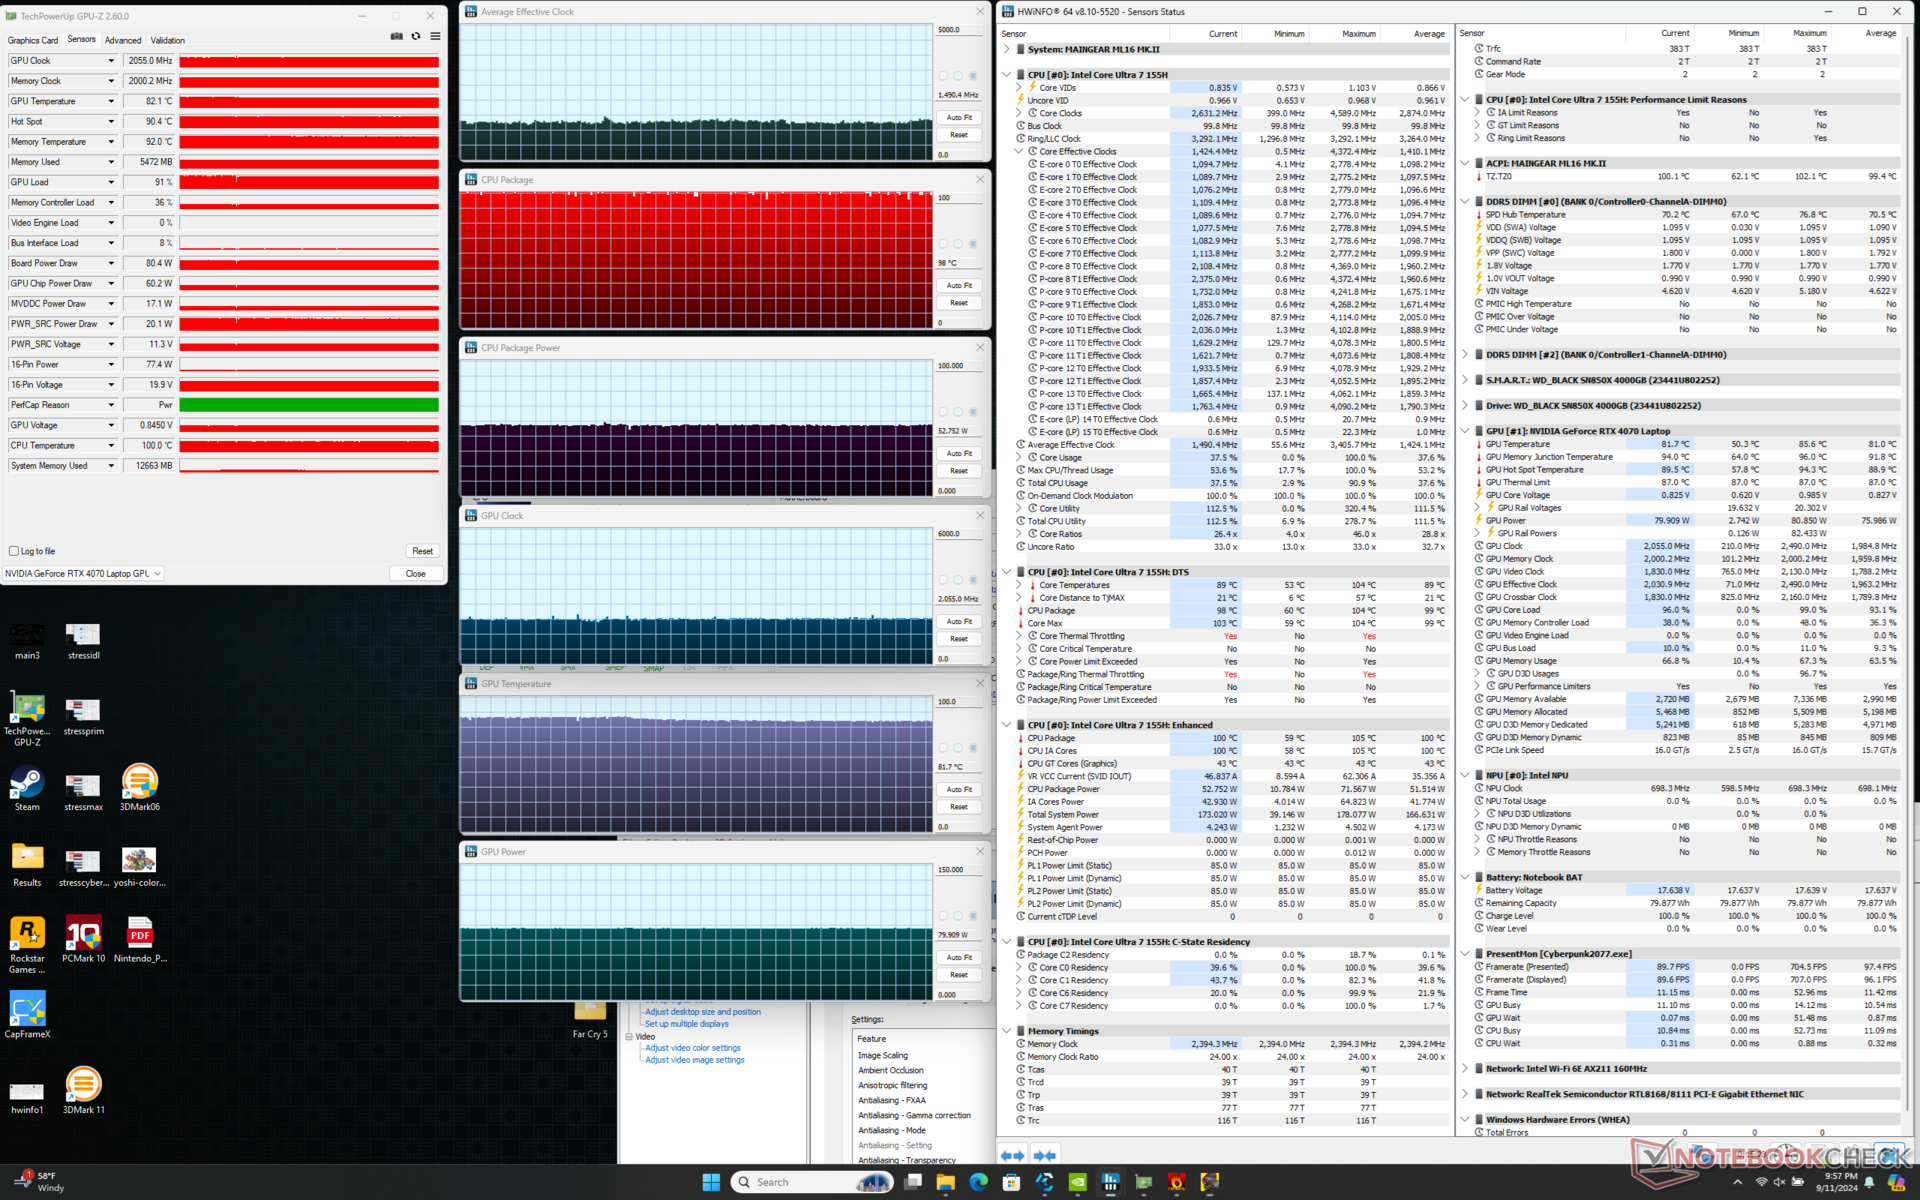
| 平均 CPU 时钟 (GHz) | GPU 时钟 (MHz) | 平均 CPU 温度 (°C) | 平均 GPU 温度(°C) | |
| 系统闲置 | -- | -- | 48 | 40 |
| Prime95 压力 | 2.1 | -- | 73 - 101 | 53 |
| Prime95 + FurMark 压力 | 1.1 - 1.4 | ~1785 | 75 - 95 | ~70 |
| 赛博朋克 2077》压力(平衡模式) | 1.2 | 2010 | 79 | 80 |
| 赛博朋克 2077 胁迫(性能模式,关闭最大风扇) | 1.4 | 2160 | 101 | 85 |
| 赛博朋克2077压力(性能模式,最大风扇开启) | 1.5 | 2055 | 98 | 82 |
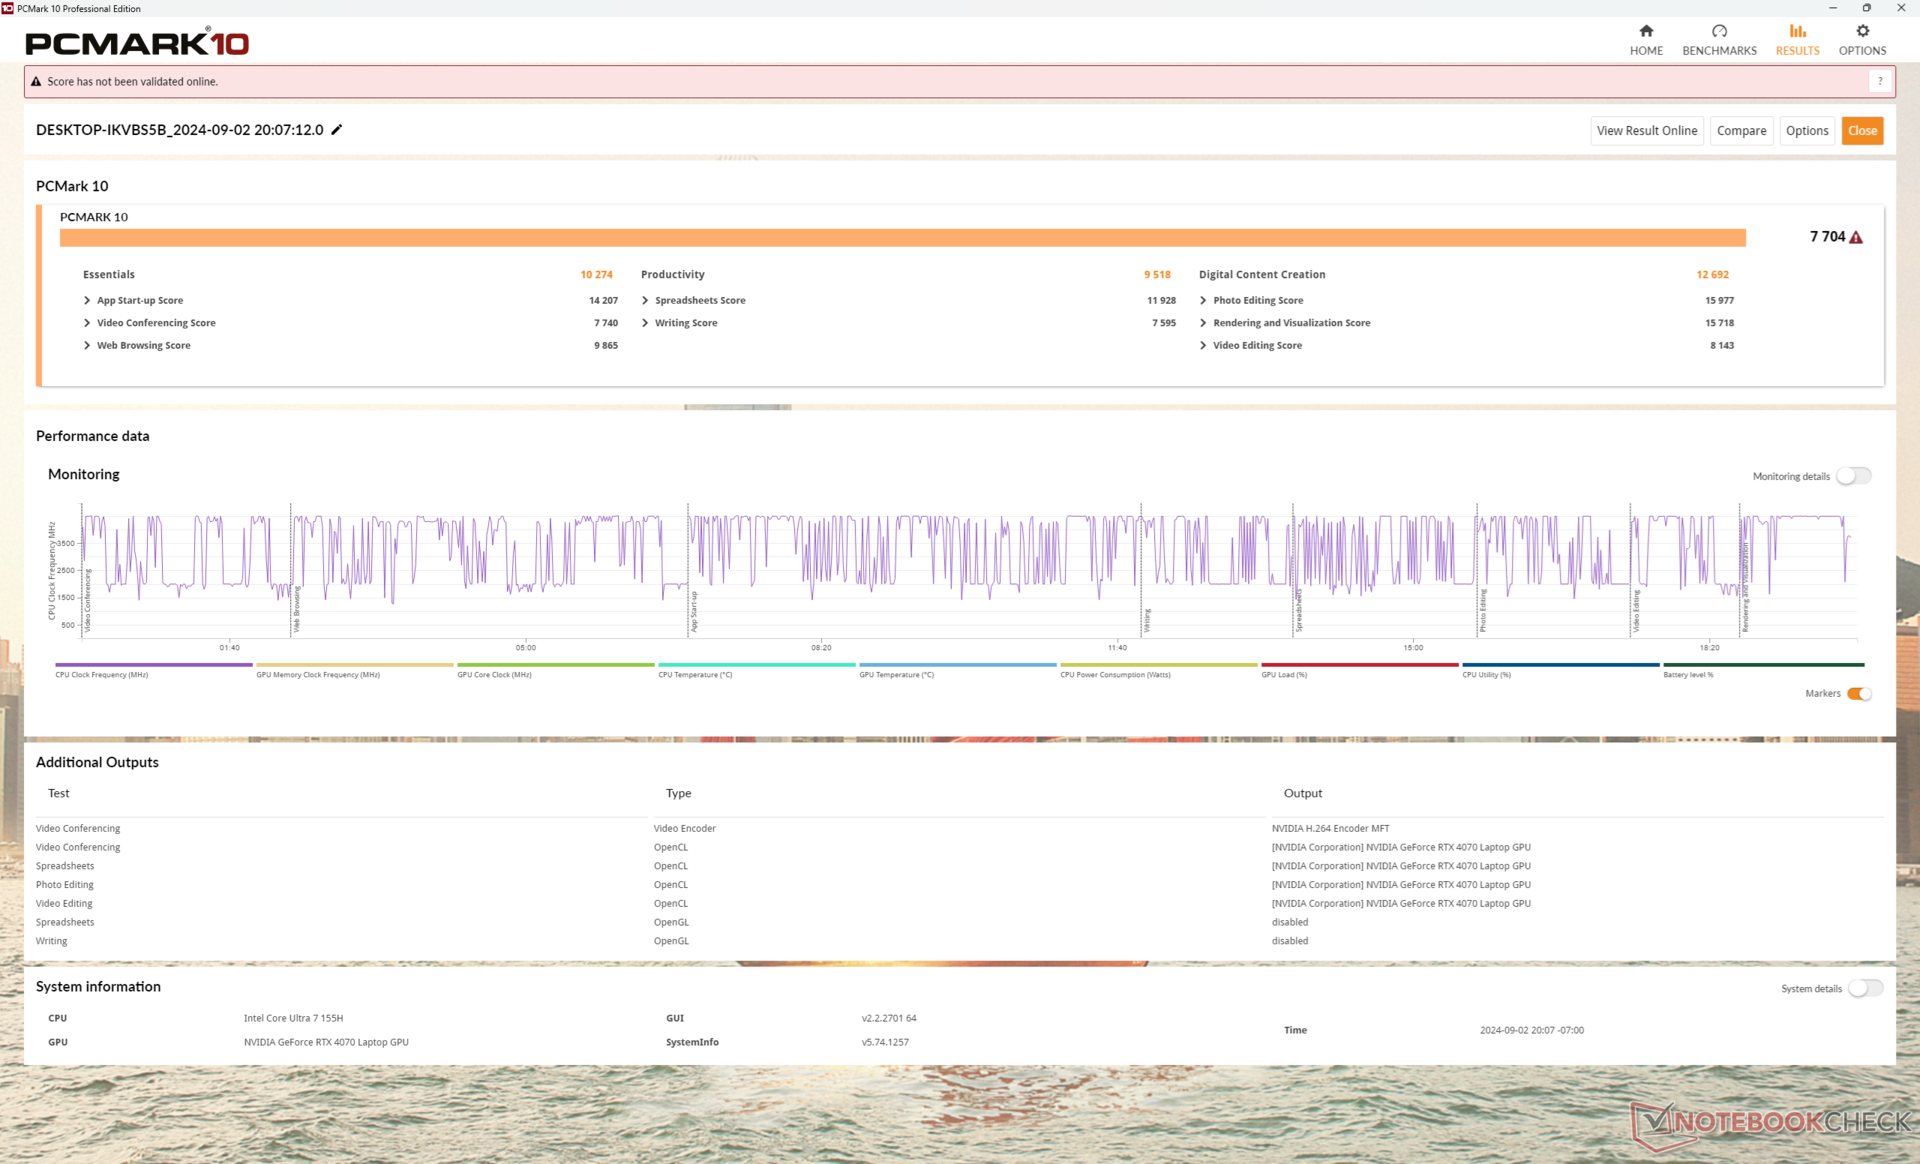
系统性能
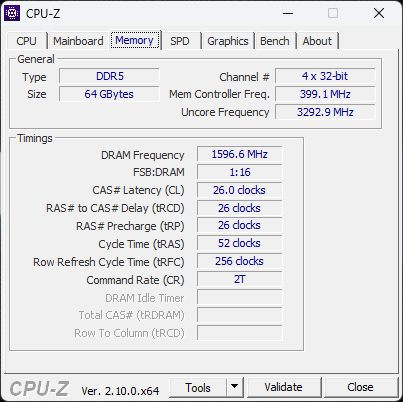
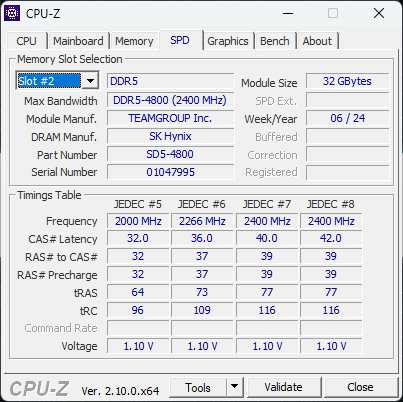
PCMark 分数可与惠普 Victus 16 或 华硕 ROG Zephyrus G16这表明,尽管规格不同,但大多数日常任务在 Maingear 上的运行速度并无明显快慢之分。不过,由于我们的 CPU 原始性能和 DDR5-4800 内存相对较慢,CrossMark 和 AIDA64 内存结果均低于预期。Blade 16 或 Alienware m16 R2 等竞争对手分别配备了更快的 DDR5-5600 或 LPDDR5-7467。
CrossMark: Overall | Productivity | Creativity | Responsiveness
WebXPRT 3: Overall
WebXPRT 4: Overall
Mozilla Kraken 1.1: Total
| PCMark 10 / Score | |
| Lenovo Legion Pro 5 16IRX9 | |
| Razer Blade 16 2024, RTX 4090 | |
| Asus ROG Zephyrus G16 GA605WV | |
| Maingear ML-16 MK2 | |
| HP Victus 16 (2024) | |
| Average Intel Core Ultra 7 155H, NVIDIA GeForce RTX 4070 Laptop GPU (7084 - 7761, n=4) | |
| Alienware x16 R2 P120F | |
| PCMark 10 / Essentials | |
| Lenovo Legion Pro 5 16IRX9 | |
| Razer Blade 16 2024, RTX 4090 | |
| HP Victus 16 (2024) | |
| Maingear ML-16 MK2 | |
| Average Intel Core Ultra 7 155H, NVIDIA GeForce RTX 4070 Laptop GPU (10038 - 10393, n=4) | |
| Asus ROG Zephyrus G16 GA605WV | |
| Alienware x16 R2 P120F | |
| PCMark 10 / Productivity | |
| Razer Blade 16 2024, RTX 4090 | |
| Lenovo Legion Pro 5 16IRX9 | |
| Asus ROG Zephyrus G16 GA605WV | |
| HP Victus 16 (2024) | |
| Maingear ML-16 MK2 | |
| Average Intel Core Ultra 7 155H, NVIDIA GeForce RTX 4070 Laptop GPU (9192 - 9518, n=4) | |
| Alienware x16 R2 P120F | |
| PCMark 10 / Digital Content Creation | |
| Lenovo Legion Pro 5 16IRX9 | |
| Asus ROG Zephyrus G16 GA605WV | |
| Razer Blade 16 2024, RTX 4090 | |
| Alienware x16 R2 P120F | |
| Maingear ML-16 MK2 | |
| Average Intel Core Ultra 7 155H, NVIDIA GeForce RTX 4070 Laptop GPU (10100 - 13035, n=4) | |
| HP Victus 16 (2024) | |
| CrossMark / Overall | |
| Razer Blade 16 2024, RTX 4090 | |
| Lenovo Legion Pro 5 16IRX9 | |
| HP Victus 16 (2024) | |
| Asus ROG Zephyrus G16 GA605WV | |
| Average Intel Core Ultra 7 155H, NVIDIA GeForce RTX 4070 Laptop GPU (1687 - 1848, n=4) | |
| Maingear ML-16 MK2 | |
| Alienware x16 R2 P120F | |
| CrossMark / Productivity | |
| Razer Blade 16 2024, RTX 4090 | |
| Lenovo Legion Pro 5 16IRX9 | |
| HP Victus 16 (2024) | |
| Average Intel Core Ultra 7 155H, NVIDIA GeForce RTX 4070 Laptop GPU (1589 - 1750, n=4) | |
| Asus ROG Zephyrus G16 GA605WV | |
| Maingear ML-16 MK2 | |
| Alienware x16 R2 P120F | |
| CrossMark / Creativity | |
| Razer Blade 16 2024, RTX 4090 | |
| Lenovo Legion Pro 5 16IRX9 | |
| Asus ROG Zephyrus G16 GA605WV | |
| HP Victus 16 (2024) | |
| Average Intel Core Ultra 7 155H, NVIDIA GeForce RTX 4070 Laptop GPU (1860 - 2014, n=4) | |
| Maingear ML-16 MK2 | |
| Alienware x16 R2 P120F | |
| CrossMark / Responsiveness | |
| Razer Blade 16 2024, RTX 4090 | |
| HP Victus 16 (2024) | |
| Lenovo Legion Pro 5 16IRX9 | |
| Alienware x16 R2 P120F | |
| Average Intel Core Ultra 7 155H, NVIDIA GeForce RTX 4070 Laptop GPU (1424 - 1683, n=4) | |
| Maingear ML-16 MK2 | |
| Asus ROG Zephyrus G16 GA605WV | |
| WebXPRT 3 / Overall | |
| Razer Blade 16 2024, RTX 4090 | |
| Lenovo Legion Pro 5 16IRX9 | |
| Average Intel Core Ultra 7 155H, NVIDIA GeForce RTX 4070 Laptop GPU (264 - 294, n=4) | |
| HP Victus 16 (2024) | |
| Maingear ML-16 MK2 | |
| Alienware x16 R2 P120F | |
| WebXPRT 4 / Overall | |
| Lenovo Legion Pro 5 16IRX9 | |
| Asus ROG Zephyrus G16 GA605WV | |
| Average Intel Core Ultra 7 155H, NVIDIA GeForce RTX 4070 Laptop GPU (247 - 257, n=4) | |
| HP Victus 16 (2024) | |
| Maingear ML-16 MK2 | |
| Alienware x16 R2 P120F | |
| Mozilla Kraken 1.1 / Total | |
| Alienware x16 R2 P120F | |
| Maingear ML-16 MK2 | |
| Average Intel Core Ultra 7 155H, NVIDIA GeForce RTX 4070 Laptop GPU (546 - 568, n=3) | |
| HP Victus 16 (2024) | |
| Razer Blade 16 2024, RTX 4090 | |
| Lenovo Legion Pro 5 16IRX9 | |
| Asus ROG Zephyrus G16 GA605WV | |
* ... smaller is better
| PCMark 10 Score | 7704 points | |
Help | ||
| AIDA64 / Memory Copy | |
| Alienware x16 R2 P120F | |
| Asus ROG Zephyrus G16 GA605WV | |
| Average Intel Core Ultra 7 155H (62397 - 96791, n=50) | |
| Lenovo Legion Pro 5 16IRX9 | |
| Razer Blade 16 2024, RTX 4090 | |
| HP Victus 16 (2024) | |
| Maingear ML-16 MK2 | |
| AIDA64 / Memory Read | |
| Asus ROG Zephyrus G16 GA605WV | |
| Razer Blade 16 2024, RTX 4090 | |
| Lenovo Legion Pro 5 16IRX9 | |
| Alienware x16 R2 P120F | |
| HP Victus 16 (2024) | |
| Average Intel Core Ultra 7 155H (60544 - 90647, n=50) | |
| Maingear ML-16 MK2 | |
| AIDA64 / Memory Write | |
| Asus ROG Zephyrus G16 GA605WV | |
| Lenovo Legion Pro 5 16IRX9 | |
| Razer Blade 16 2024, RTX 4090 | |
| Alienware x16 R2 P120F | |
| Average Intel Core Ultra 7 155H (58692 - 93451, n=50) | |
| HP Victus 16 (2024) | |
| Maingear ML-16 MK2 | |
| AIDA64 / Memory Latency | |
| Maingear ML-16 MK2 | |
| Average Intel Core Ultra 7 155H (116.2 - 233, n=50) | |
| Alienware x16 R2 P120F | |
| Asus ROG Zephyrus G16 GA605WV | |
| HP Victus 16 (2024) | |
| Razer Blade 16 2024, RTX 4090 | |
| Lenovo Legion Pro 5 16IRX9 | |
* ... smaller is better
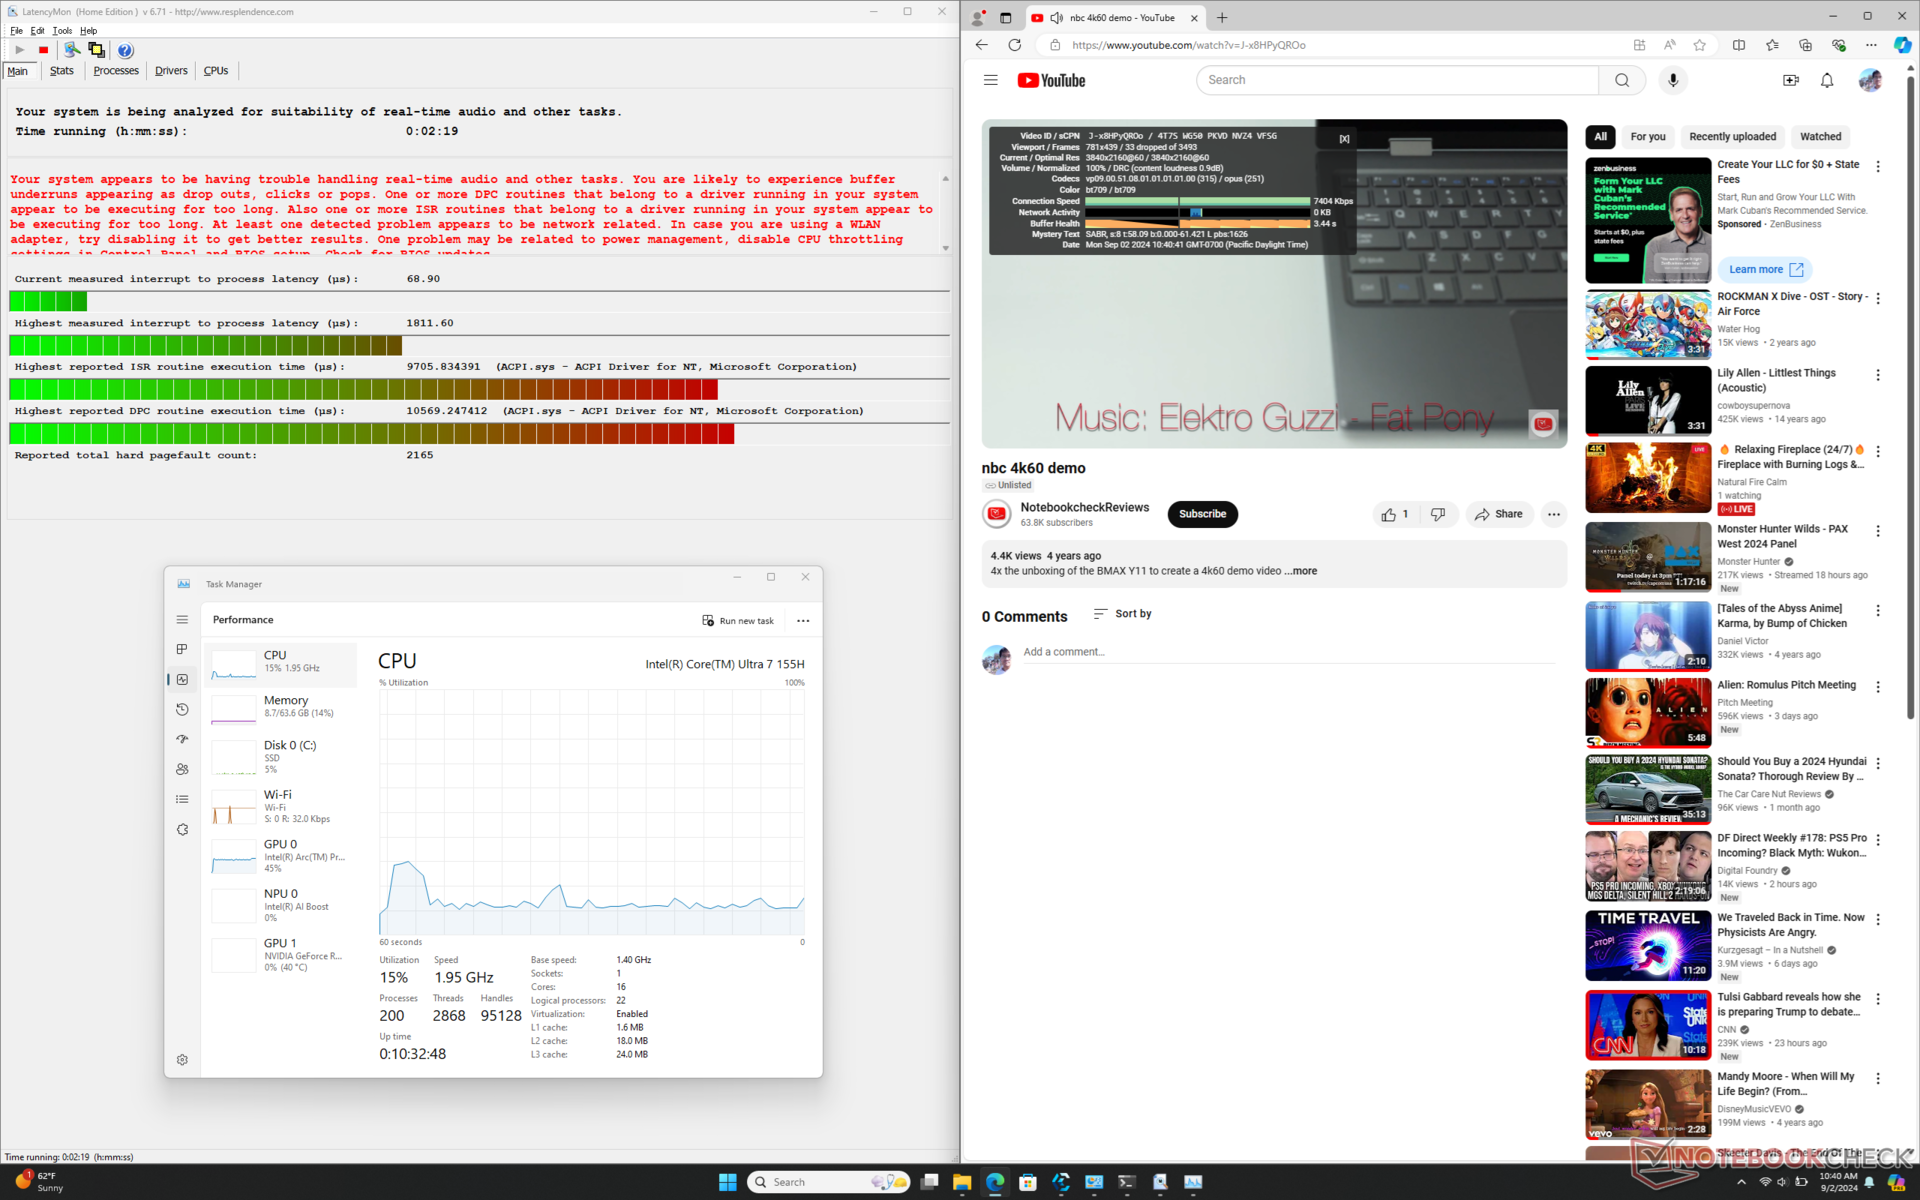
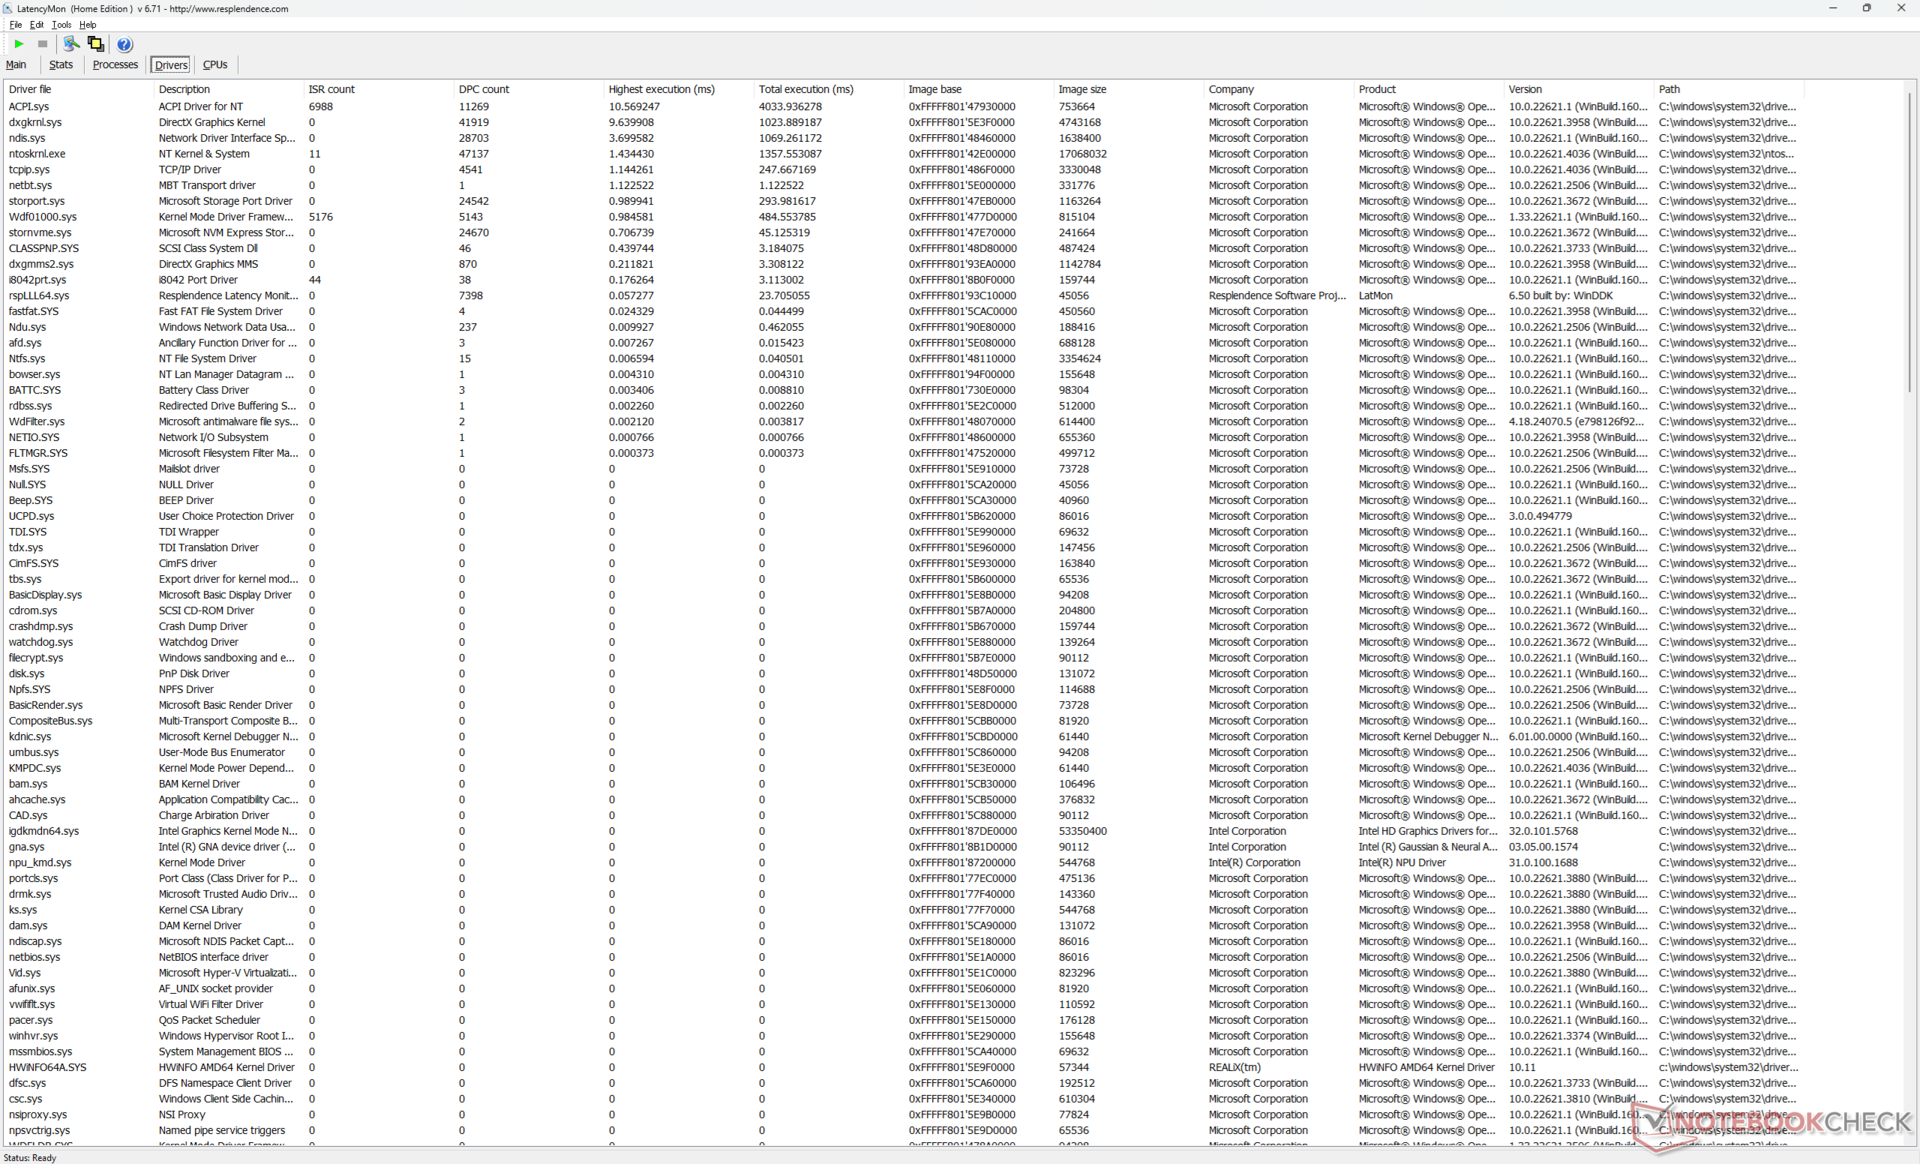
DPC 延迟
LatencyMon 显示,即使在 MSHybrid 模式下,与 ACPI 驱动程序相关的 DPC 问题也比预期的要多。此外,在一段 60 秒的 4K60 测试视频中,我们还记录到 33 个丢帧,而考虑到内置的 Meteor Lake-H CPU,丢帧应该为零。这些掉帧现象在流式传输 4K 视频时表现为卡顿,这表明存在潜在的驱动程序问题或后台活动管理不善,可能会中断主窗口。
| DPC Latencies / LatencyMon - interrupt to process latency (max), Web, Youtube, Prime95 | |
| Alienware x16 R2 P120F | |
| Maingear ML-16 MK2 | |
| Razer Blade 16 2024, RTX 4090 | |
| Lenovo Legion Pro 5 16IRX9 | |
| HP Victus 16 (2024) | |
| Asus ROG Zephyrus G16 GA605WV | |
* ... smaller is better
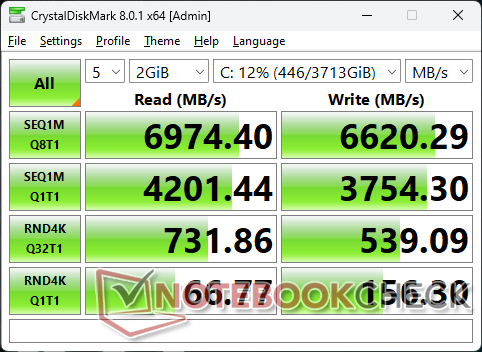
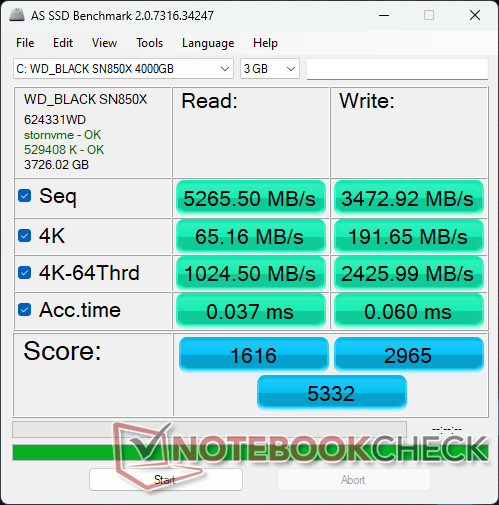
存储设备
Maingear 是为数不多的几款配备以下功能的系统之一 4 TB WD Black SN850XPCIe4 x4 NVMe 选件的系统之一。传输速率非常出色,接近 7000 MB/s,在受压时没有发现节流现象。散热器和导热垫是帮助散热的标准配置,我们对此表示赞赏。

| Drive Performance Rating - Percent | |
| Lenovo Legion Pro 5 16IRX9 | |
| Alienware x16 R2 P120F | |
| Razer Blade 16 2024, RTX 4090 | |
| HP Victus 16 (2024) | |
| Maingear ML-16 MK2 | |
| Asus ROG Zephyrus G16 GA605WV | |
* ... smaller is better
Disk Throttling: DiskSpd Read Loop, Queue Depth 8
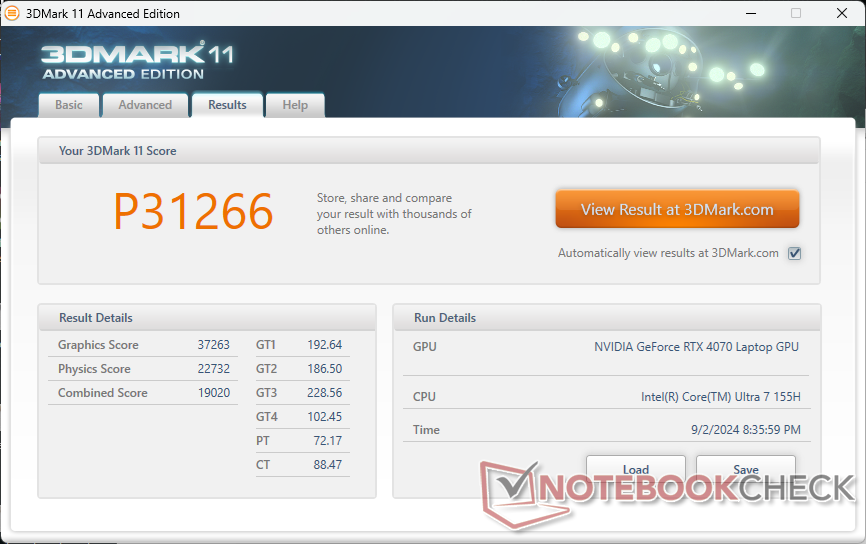
图形处理器性能
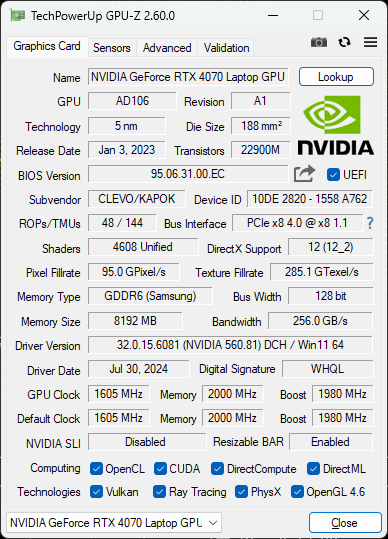
移动GeForce RTX 4070 的性能比我们数据库中的普通笔记本电脑慢几个百分点。 我们数据库中慢几个百分点。整体性能仅比基本的 RTX 4060选项相比,整体性能仅提高 5%至 15%,或比旧款 RTX 3070 Ti.如果将移动 RTX 4070 与 移动 RTX 4080但后者在该机型上无法配置。
请记住,移动 RTX 4070 比其 台式机大约 35% 到 40%。
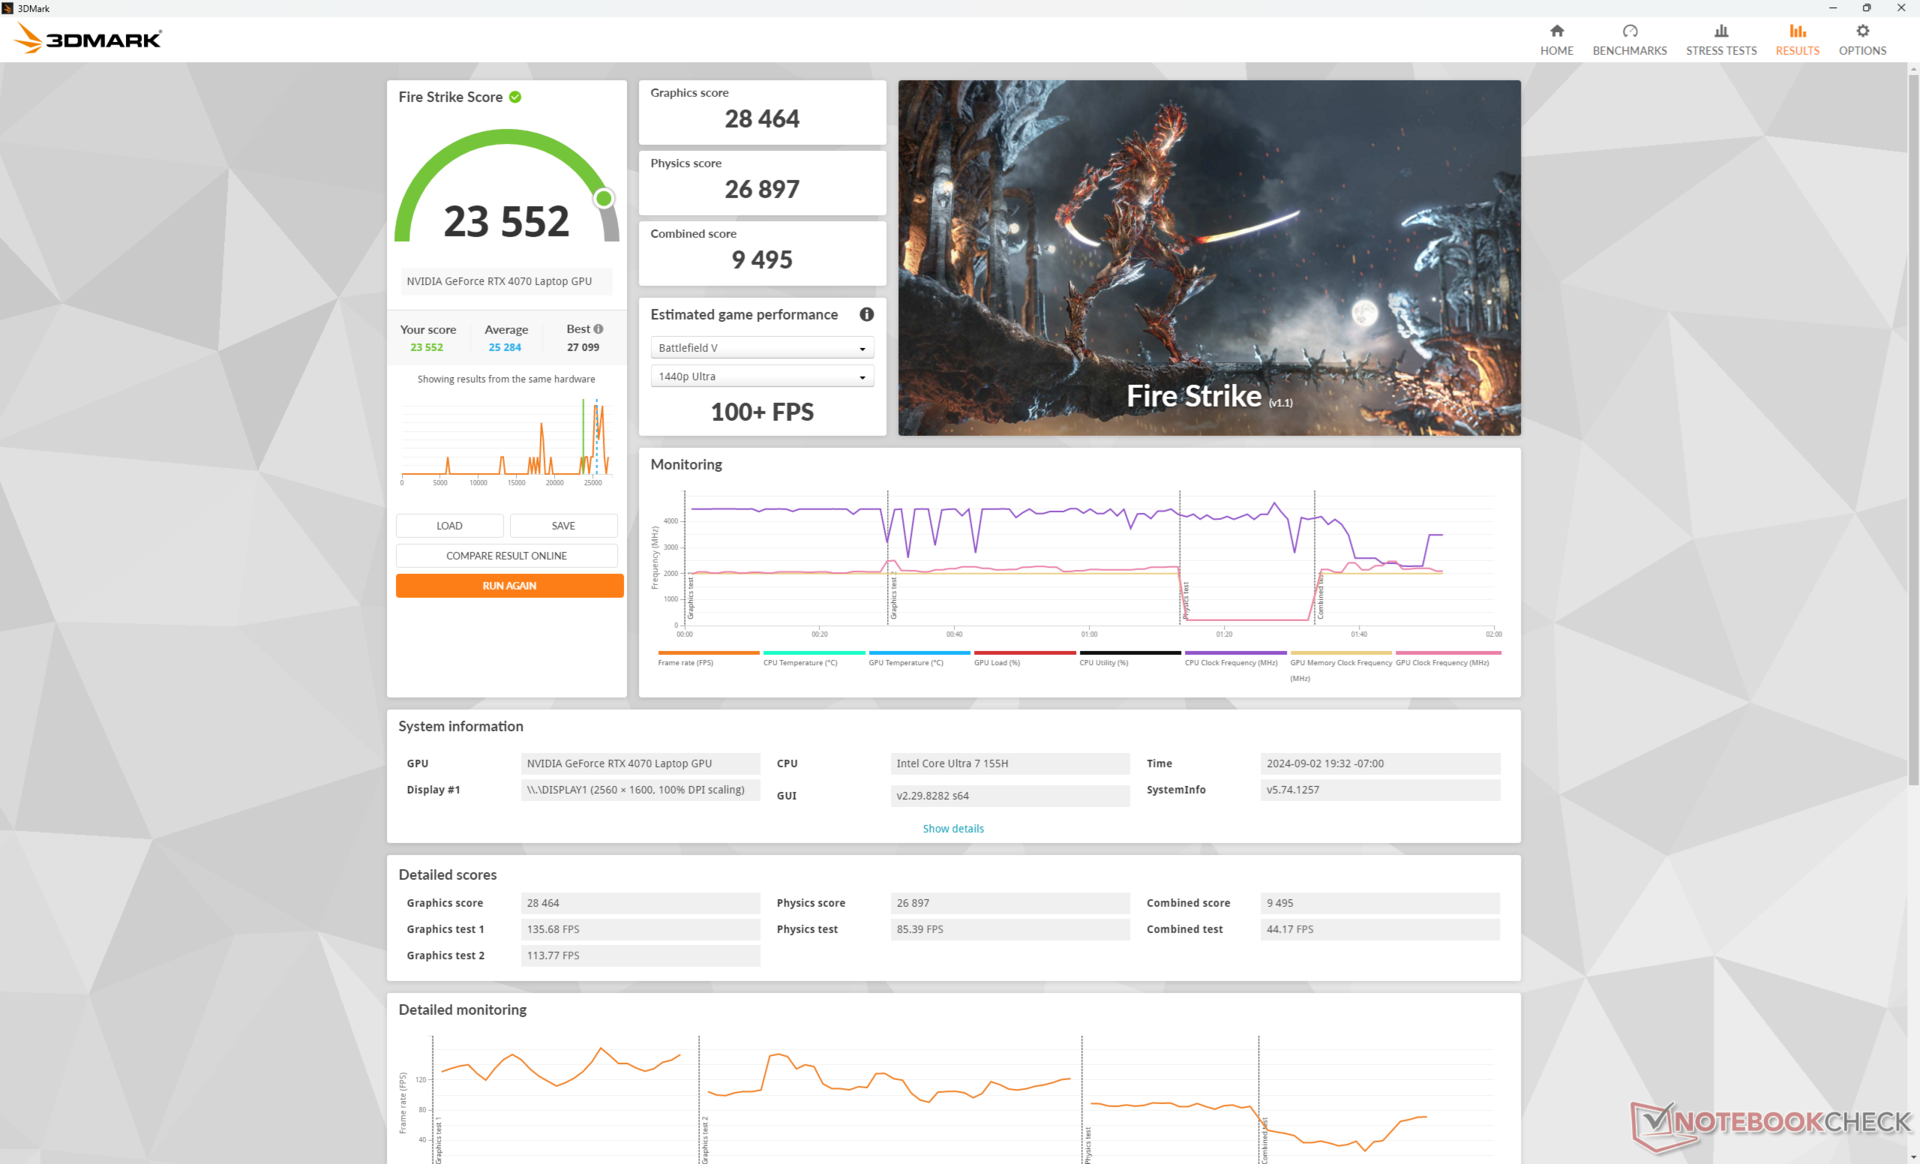
| 电源配置文件 | 图形得分 | 物理得分 | 综合得分 |
| 性能模式 | 28464 | 26897 | 9495 |
| 平衡模式 | 28238 (-0%) | 16060 (-40%) | 8049 (-15%) |
| 电池电量 | 5539 (-81%) | 12186 (-55%) | 1715 (-82%) |
根据Fire Strike 上的结果表,在平衡模式而非性能模式下运行对 CPU 性能影响很大,而图形性能则不受影响。这与我们在上述压力测试部分的观察结果一致。即使设置为 "性能 "模式,使用电池供电也会进一步影响整体性能。
| 3DMark Performance Rating - Percent | |
| Razer Blade 16 2024, RTX 4090 -1! | |
| KFA2 GeForce RTX 4070 EX Gamer | |
| Alienware x16 R2 P120F | |
| Lenovo Yoga Pro 9 16IMH9 -1! | |
| Average NVIDIA GeForce RTX 4070 Laptop GPU | |
| Maingear ML-16 MK2 | |
| HP Victus 16 (2024) -1! | |
| HP Omen 16-b0085ng -1! | |
| CSL GameStar Notebook VenomGamer G16 -1! | |
| Asus ROG Zephyrus M16 GU603Z -1! | |
| Asus TUF Gaming A16 FA617XS | |
| HP Victus 16-r0076TX | |
| HP Omen 16-n0033dx | |
| Acer Nitro 16 AN16-41-R7YE | |
| Lenovo Legion C7 15IMH05 82EH0030GE -1! | |
| 3DMark 11 Performance | 31266 points | |
| 3DMark Cloud Gate Standard Score | 57717 points | |
| 3DMark Fire Strike Score | 23552 points | |
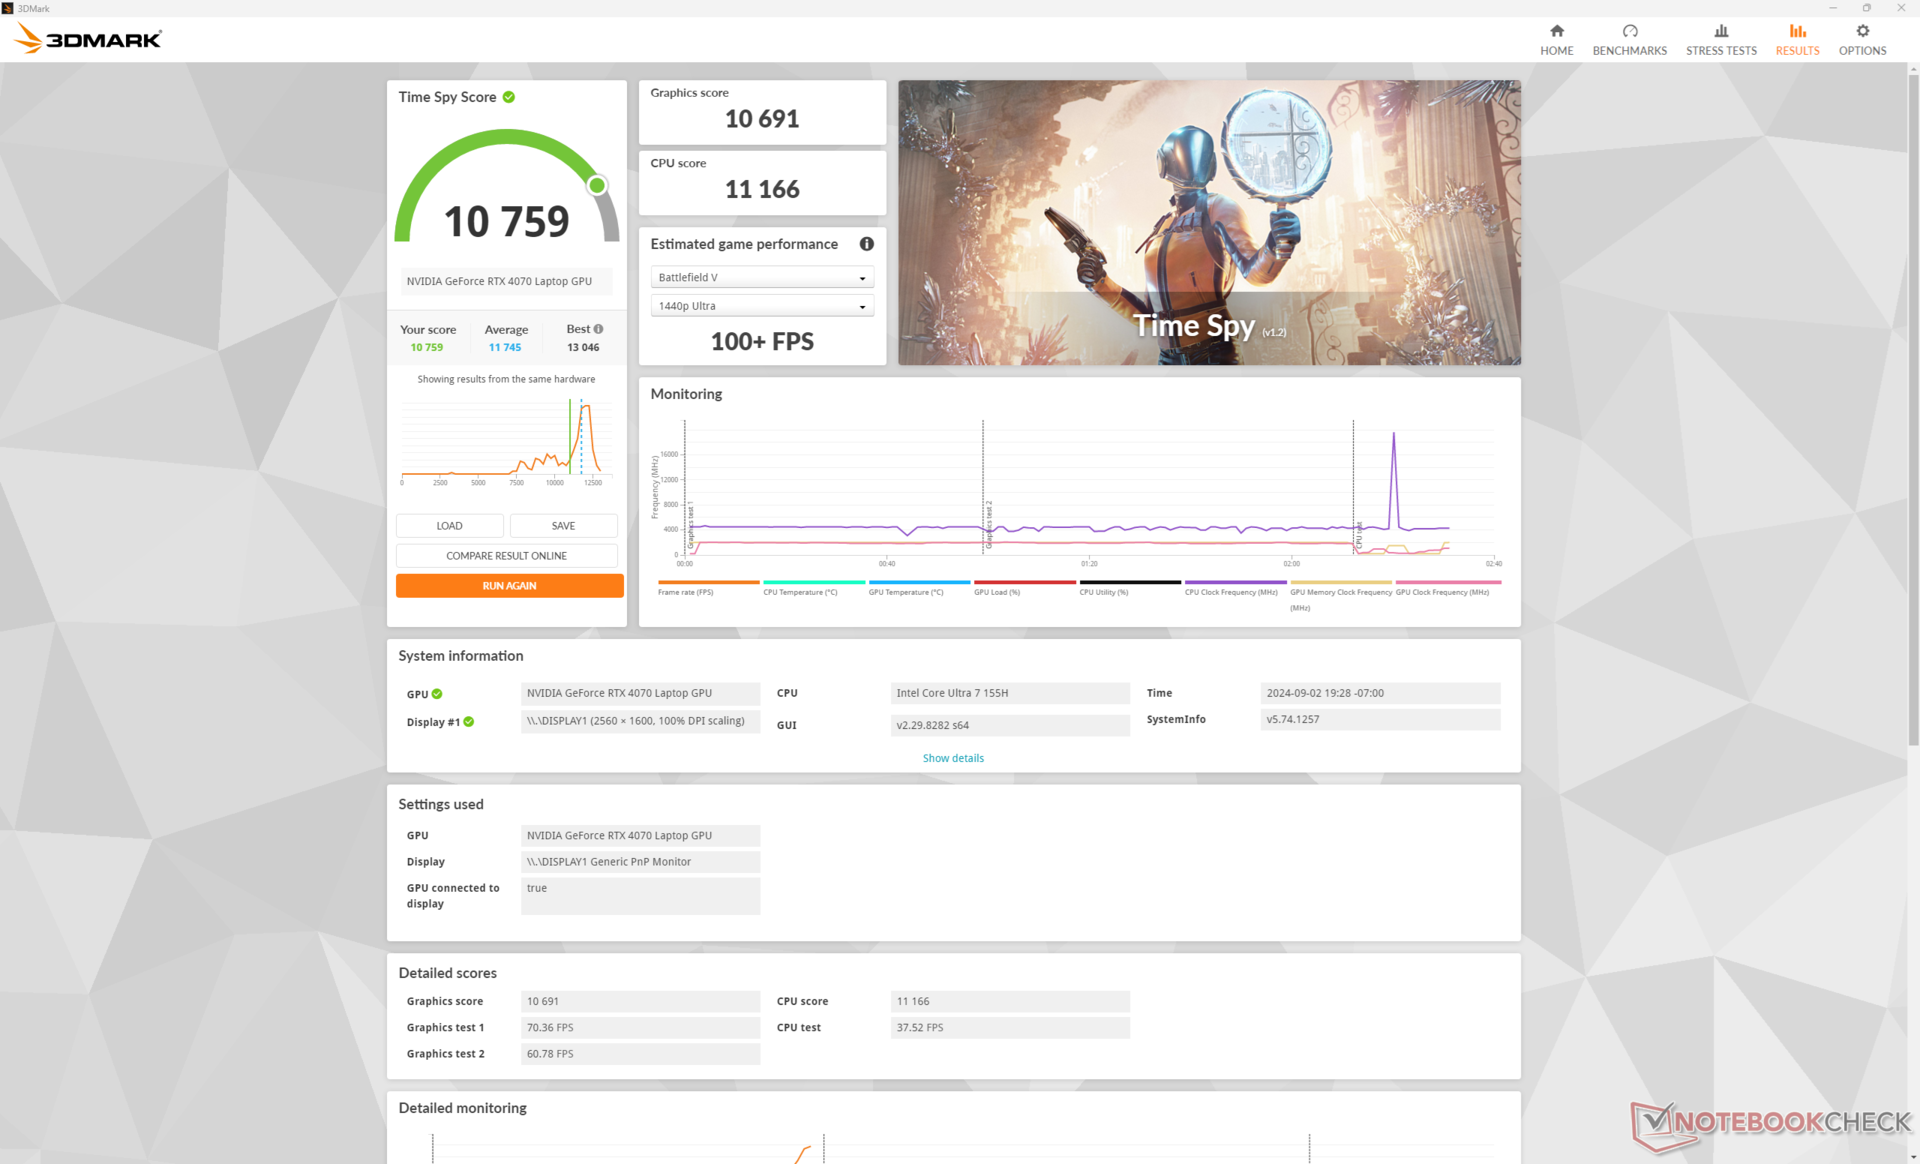
| 3DMark Time Spy Score | 10759 points | |
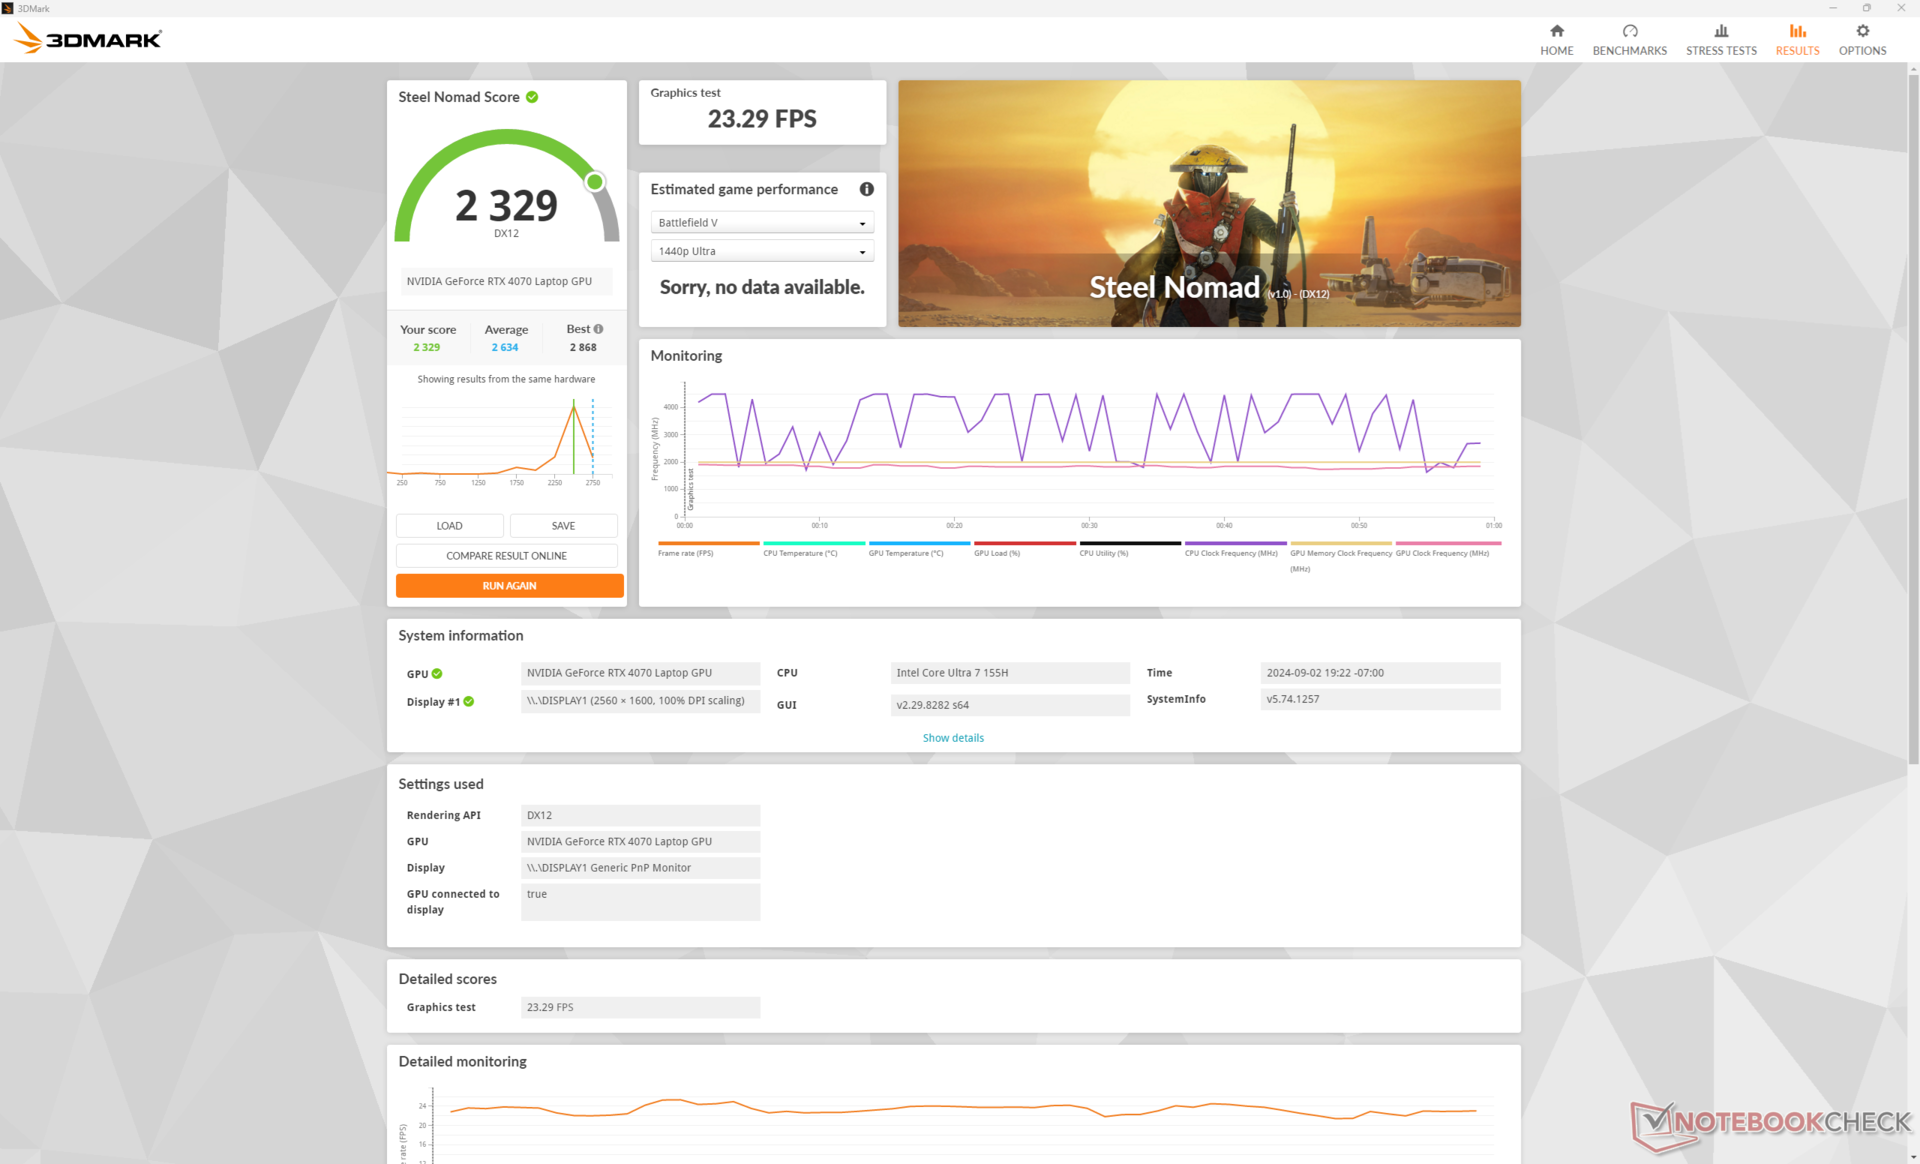
| 3DMark Steel Nomad Score | 2329 points | |
Help | ||
* ... smaller is better
游戏性能
移动 RTX 4070 功能强大,足以在最大设置下以原生 QHD+ 分辨率运行现代游戏。像《赛博朋克 2077》这样要求更高的游戏也可以运行,尽管它需要 DLSS 才能达到 60 FPS 或更高。例如,使用 Ultra RT 设置和原生 1600p 运行游戏内基准,平均帧率仅为 20.2,而启用 DLSS 3 Balanced 后为 63.1。
| Performance Rating - Percent | |
| Razer Blade 16 2024, RTX 4090 | |
| Lenovo Legion Pro 5 16IRX9 | |
| Alienware x16 R2 P120F -1! | |
| Maingear ML-16 MK2 | |
| HP Victus 16 (2024) -1! | |
| Asus ROG Zephyrus G16 GA605WV | |
| GTA V - 1920x1080 Highest Settings possible AA:4xMSAA + FX AF:16x | |
| Razer Blade 16 2024, RTX 4090 | |
| Lenovo Legion Pro 5 16IRX9 | |
| Maingear ML-16 MK2 | |
| HP Victus 16 (2024) | |
| Asus ROG Zephyrus G16 GA605WV | |
| Final Fantasy XV Benchmark - 1920x1080 High Quality | |
| Alienware x16 R2 P120F | |
| Razer Blade 16 2024, RTX 4090 | |
| Lenovo Legion Pro 5 16IRX9 | |
| Maingear ML-16 MK2 | |
| HP Victus 16 (2024) | |
| Asus ROG Zephyrus G16 GA605WV | |
| Strange Brigade - 1920x1080 ultra AA:ultra AF:16 | |
| Razer Blade 16 2024, RTX 4090 | |
| Alienware x16 R2 P120F | |
| Lenovo Legion Pro 5 16IRX9 | |
| Maingear ML-16 MK2 | |
| HP Victus 16 (2024) | |
| Asus ROG Zephyrus G16 GA605WV | |
| Dota 2 Reborn - 1920x1080 ultra (3/3) best looking | |
| Razer Blade 16 2024, RTX 4090 | |
| Lenovo Legion Pro 5 16IRX9 | |
| HP Victus 16 (2024) | |
| Asus ROG Zephyrus G16 GA605WV | |
| Maingear ML-16 MK2 | |
| Alienware x16 R2 P120F | |
| X-Plane 11.11 - 1920x1080 high (fps_test=3) | |
| Razer Blade 16 2024, RTX 4090 | |
| Lenovo Legion Pro 5 16IRX9 | |
| HP Victus 16 (2024) | |
| Maingear ML-16 MK2 | |
| Alienware x16 R2 P120F | |
| Asus ROG Zephyrus G16 GA605WV | |
| Far Cry 5 - 1920x1080 Ultra Preset AA:T | |
| Lenovo Legion Pro 5 16IRX9 | |
| Razer Blade 16 2024, RTX 4090 | |
| Alienware x16 R2 P120F | |
| Maingear ML-16 MK2 | |
| Asus ROG Zephyrus G16 GA605WV | |
| Baldur's Gate 3 | |
| 1920x1080 High Preset | |
| Alienware x16 R2 P120F | |
| Lenovo Yoga Pro 9 16IMH9 | |
| Maingear ML-16 MK2 | |
| Average NVIDIA GeForce RTX 4070 Laptop GPU (72.7 - 129.3, n=26) | |
| CSL GameStar Notebook VenomGamer G16 | |
| 1920x1080 Ultra Preset | |
| Razer Blade 16 2024, RTX 4090 | |
| Alienware x16 R2 P120F | |
| Lenovo Yoga Pro 9 16IMH9 | |
| Maingear ML-16 MK2 | |
| Average NVIDIA GeForce RTX 4070 Laptop GPU (66.7 - 128.5, n=28) | |
| CSL GameStar Notebook VenomGamer G16 | |
| 2560x1440 Ultra Preset | |
| Razer Blade 16 2024, RTX 4090 | |
| Alienware x16 R2 P120F | |
| Lenovo Yoga Pro 9 16IMH9 | |
| Average NVIDIA GeForce RTX 4070 Laptop GPU (54.4 - 89.6, n=23) | |
| Maingear ML-16 MK2 | |
| CSL GameStar Notebook VenomGamer G16 | |
| Tiny Tina's Wonderlands | |
| 1920x1080 High Preset (DX12) | |
| KFA2 GeForce RTX 4070 EX Gamer | |
| Alienware x16 R2 P120F | |
| Average NVIDIA GeForce RTX 4070 Laptop GPU (74.3 - 151.4, n=14) | |
| Maingear ML-16 MK2 | |
| Asus TUF Gaming A16 FA617XS | |
| 1920x1080 Badass Preset (DX12) | |
| KFA2 GeForce RTX 4070 EX Gamer | |
| Alienware x16 R2 P120F | |
| Average NVIDIA GeForce RTX 4070 Laptop GPU (58.6 - 115.9, n=17) | |
| Maingear ML-16 MK2 | |
| Asus TUF Gaming A16 FA617XS | |
| 2560x1440 Badass Preset (DX12) | |
| KFA2 GeForce RTX 4070 EX Gamer | |
| Alienware x16 R2 P120F | |
| Average NVIDIA GeForce RTX 4070 Laptop GPU (49.8 - 79.5, n=16) | |
| Maingear ML-16 MK2 | |
| Cyberpunk 2077 2.2 Phantom Liberty | |
| 1920x1080 Medium Preset (FSR off) | |
| Alienware x16 R2 P120F | |
| Average NVIDIA GeForce RTX 4070 Laptop GPU (81.6 - 124.5, n=29) | |
| Lenovo Yoga Pro 9 16IMH9 | |
| Maingear ML-16 MK2 | |
| HP Victus 16 (2024) | |
| CSL GameStar Notebook VenomGamer G16 | |
| 1920x1080 High Preset (FSR off) | |
| Alienware x16 R2 P120F | |
| Average NVIDIA GeForce RTX 4070 Laptop GPU (74.7 - 103.6, n=30) | |
| Lenovo Yoga Pro 9 16IMH9 | |
| Maingear ML-16 MK2 | |
| HP Victus 16 (2024) | |
| CSL GameStar Notebook VenomGamer G16 | |
| 1920x1080 Ultra Preset (FSR off) | |
| Alienware x16 R2 P120F | |
| Razer Blade 16 2024, RTX 4090 | |
| Average NVIDIA GeForce RTX 4070 Laptop GPU (30.7 - 90.7, n=38) | |
| Lenovo Yoga Pro 9 16IMH9 | |
| Maingear ML-16 MK2 | |
| HP Victus 16 (2024) | |
| CSL GameStar Notebook VenomGamer G16 | |
| 2560x1440 Ultra Preset (FSR off) | |
| Razer Blade 16 2024, RTX 4090 | |
| Alienware x16 R2 P120F | |
| Average NVIDIA GeForce RTX 4070 Laptop GPU (24.8 - 57.1, n=35) | |
| Lenovo Yoga Pro 9 16IMH9 | |
| Maingear ML-16 MK2 | |
| CSL GameStar Notebook VenomGamer G16 | |
Cyberpunk 2077 ultra FPS Chart
| low | med. | high | ultra | QHD | |
|---|---|---|---|---|---|
| GTA V (2015) | 183.3 | 180.4 | 175 | 115.1 | 90.6 |
| Dota 2 Reborn (2015) | 173.4 | 152.8 | 145.3 | 139.2 | |
| Final Fantasy XV Benchmark (2018) | 187.6 | 146.3 | 110.6 | 80 | |
| X-Plane 11.11 (2018) | 139.9 | 124.4 | 89.8 | ||
| Far Cry 5 (2018) | 125 | 125 | 114 | 101 | |
| Strange Brigade (2018) | 477 | 284 | 224 | 192.8 | 127.9 |
| Tiny Tina's Wonderlands (2022) | 218.7 | 180.9 | 119.4 | 92.9 | 62.7 |
| F1 22 (2022) | 252 | 250 | 206 | 69.2 | 42.9 |
| Baldur's Gate 3 (2023) | 152 | 125.9 | 108.2 | 106.8 | 70.6 |
| Cyberpunk 2077 2.2 Phantom Liberty (2023) | 130 | 106.1 | 88.1 | 76.4 | 44.3 |
排放--又热又响
系统噪音
在浏览或视频流媒体时,风扇噪音最高可达 27 dB(A),而静音背景噪音为 23 dB(A),虽然明显,但在静音模式下还是可以忍受的。如果在 "性能 "模式下玩游戏,风扇噪音会变得非常大,略高于 55 dB(A),比 Victus 16 等竞争对手要大、 Alienware x16 R2或Legion Pro 5 16 等竞争对手。启用 "最大风扇噪音 "模式后,风扇噪音将进一步增加到近 58 dB(A)。

Noise Level
| Idle |
| 24.1 / 24.1 / 25.6 dB(A) |
| Load |
| 44.3 / 57.8 dB(A) |
 | ||
30 dB silent 40 dB(A) audible 50 dB(A) loud |
||
min: | ||
| Maingear ML-16 MK2 NVIDIA GeForce RTX 4070 Laptop GPU, Ultra 7 155H | Asus ROG Zephyrus G16 GA605WV NVIDIA GeForce RTX 4060 Laptop GPU, Ryzen AI 9 HX 370, Micron 2400 MTFDKBA1T0QFM | HP Victus 16 (2024) NVIDIA GeForce RTX 4060 Laptop GPU, i7-14700HX, Kioxia XG8 KXG80ZNV512G | Alienware x16 R2 P120F NVIDIA GeForce RTX 4080 Laptop GPU, Ultra 9 185H, WDC PC SN810 1TB | Lenovo Legion Pro 5 16IRX9 NVIDIA GeForce RTX 4070 Laptop GPU, i9-14900HX, Samsung PM9A1 MZVL21T0HCLR | Razer Blade 16 2024, RTX 4090 NVIDIA GeForce RTX 4090 Laptop GPU, i9-14900HX, Samsung PM9A1 MZVL22T0HBLB | |
|---|---|---|---|---|---|---|
| Noise | -4% | -10% | 2% | -3% | 3% | |
| off / environment * | 23 | 24.6 -7% | 25 -9% | 23.4 -2% | 23.9 -4% | 23 -0% |
| Idle Minimum * | 24.1 | 28.6 -19% | 28 -16% | 23.8 1% | 24.3 -1% | 23 5% |
| Idle Average * | 24.1 | 28.6 -19% | 29 -20% | 28.5 -18% | 24.3 -1% | 23 5% |
| Idle Maximum * | 25.6 | 28.6 -12% | 33 -29% | 28.5 -11% | 28.9 -13% | 27.66 -8% |
| Load Average * | 44.3 | 42.8 3% | 45 -2% | 28.8 35% | 45.8 -3% | 43.76 1% |
| Cyberpunk 2077 ultra * | 55.4 | 48.3 13% | ||||
| Load Maximum * | 57.8 | 48.3 16% | 48 17% | 54.2 6% | 56.6 2% | 50.37 13% |
| Witcher 3 ultra * | 43 | 49.5 | 51 | 46.81 |
* ... smaller is better
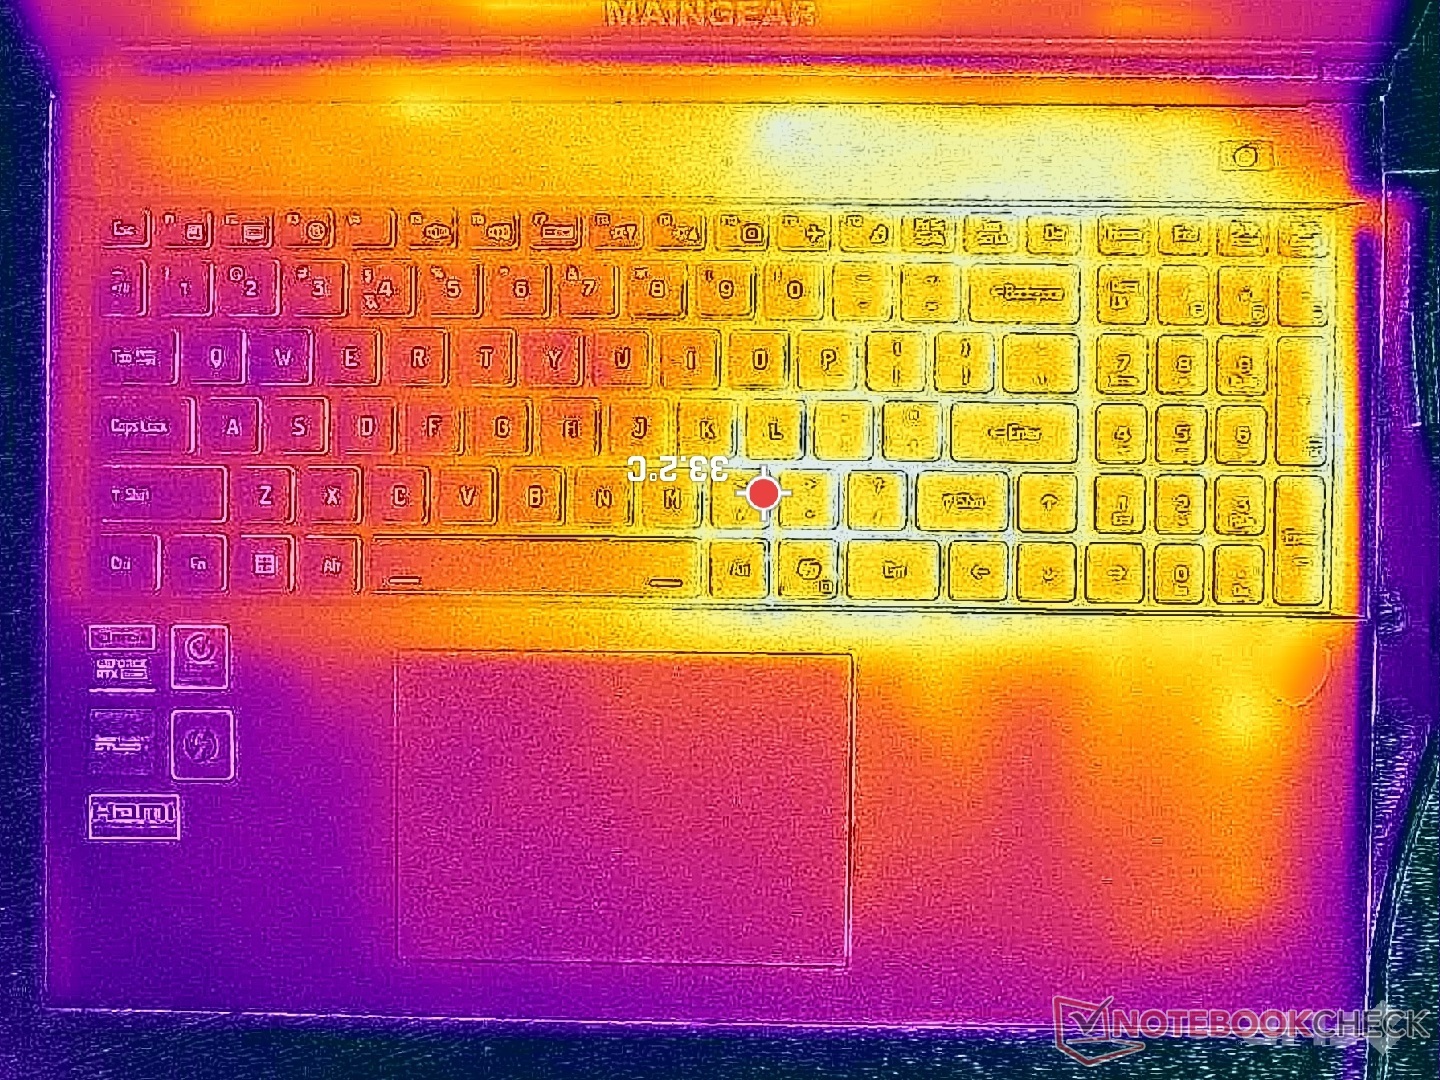
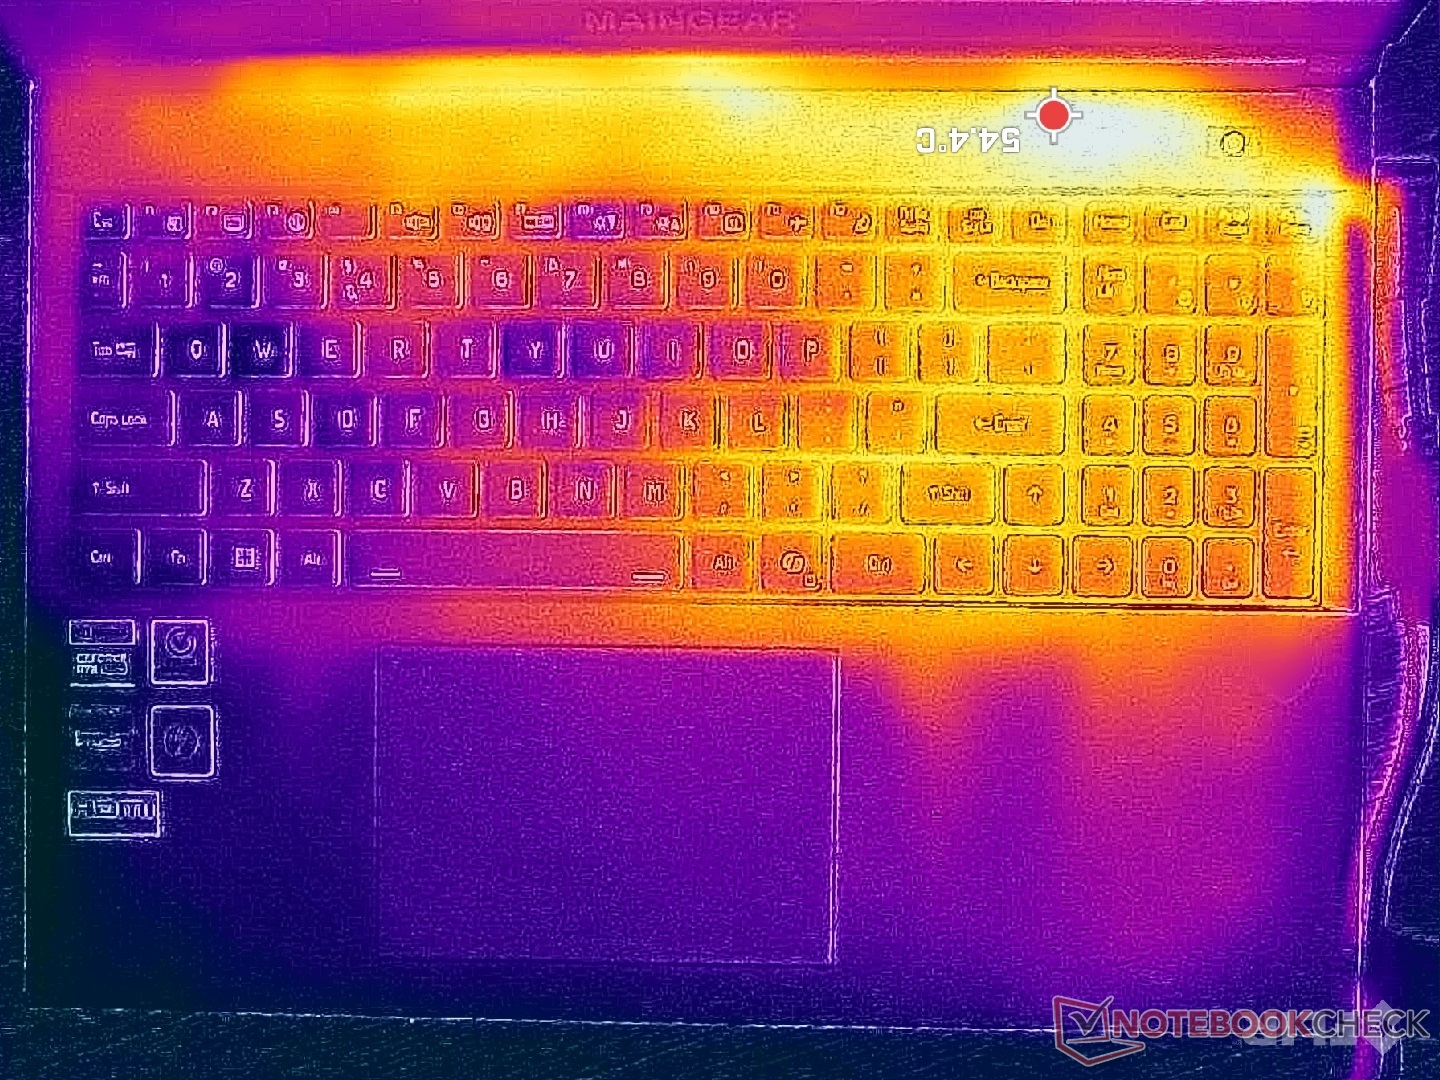
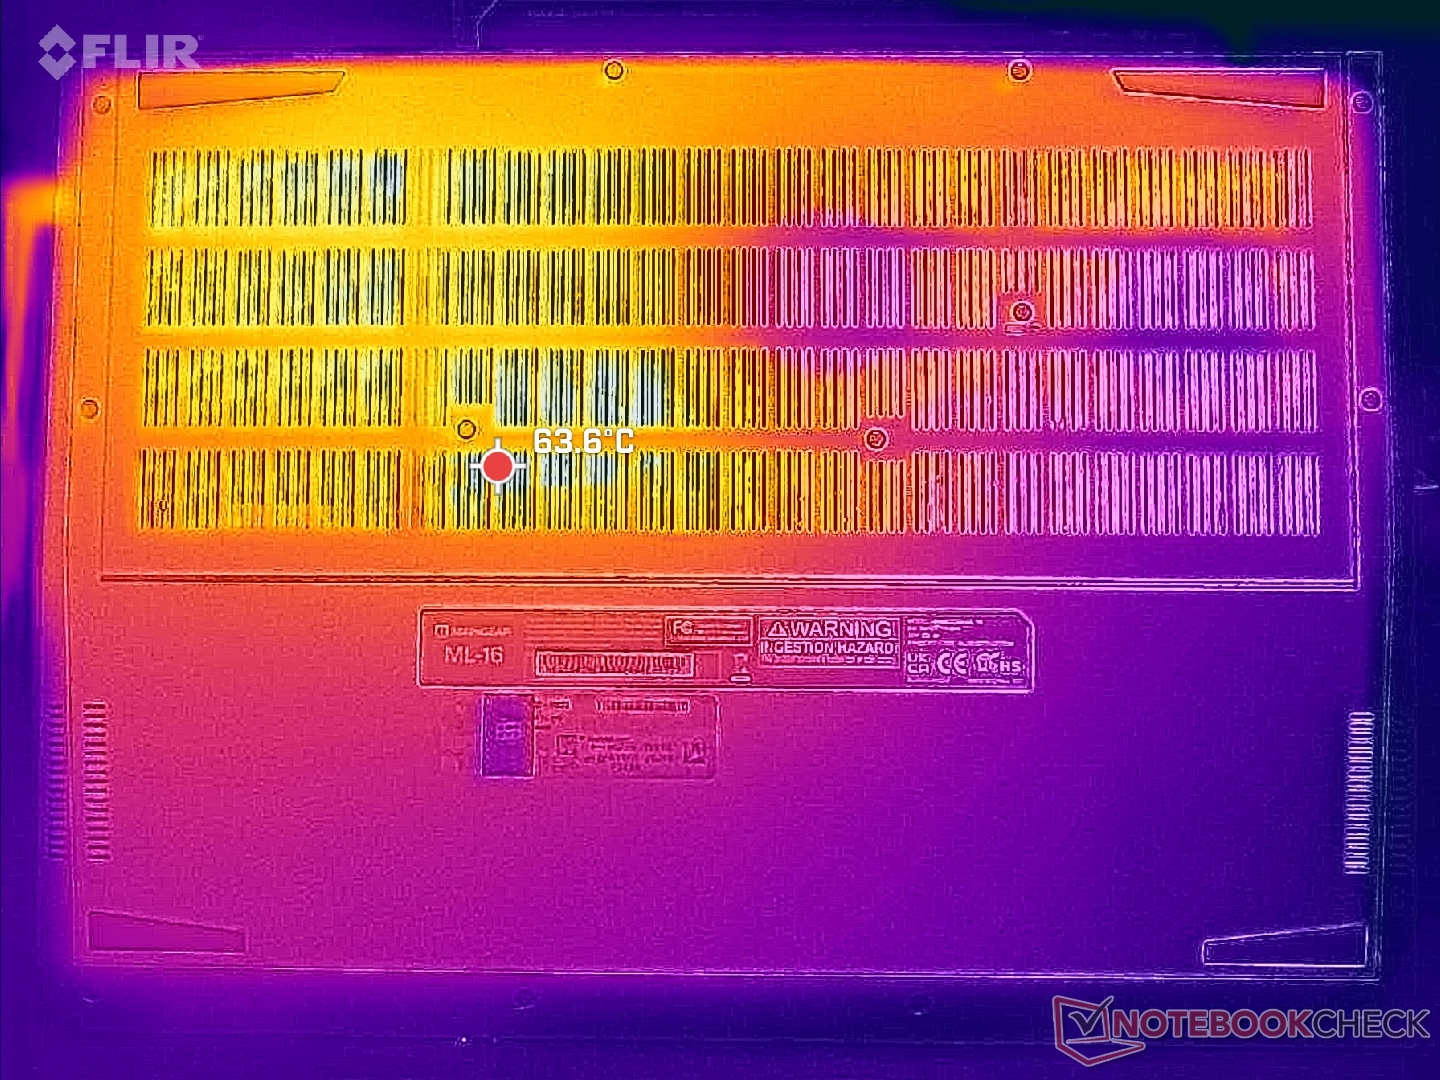
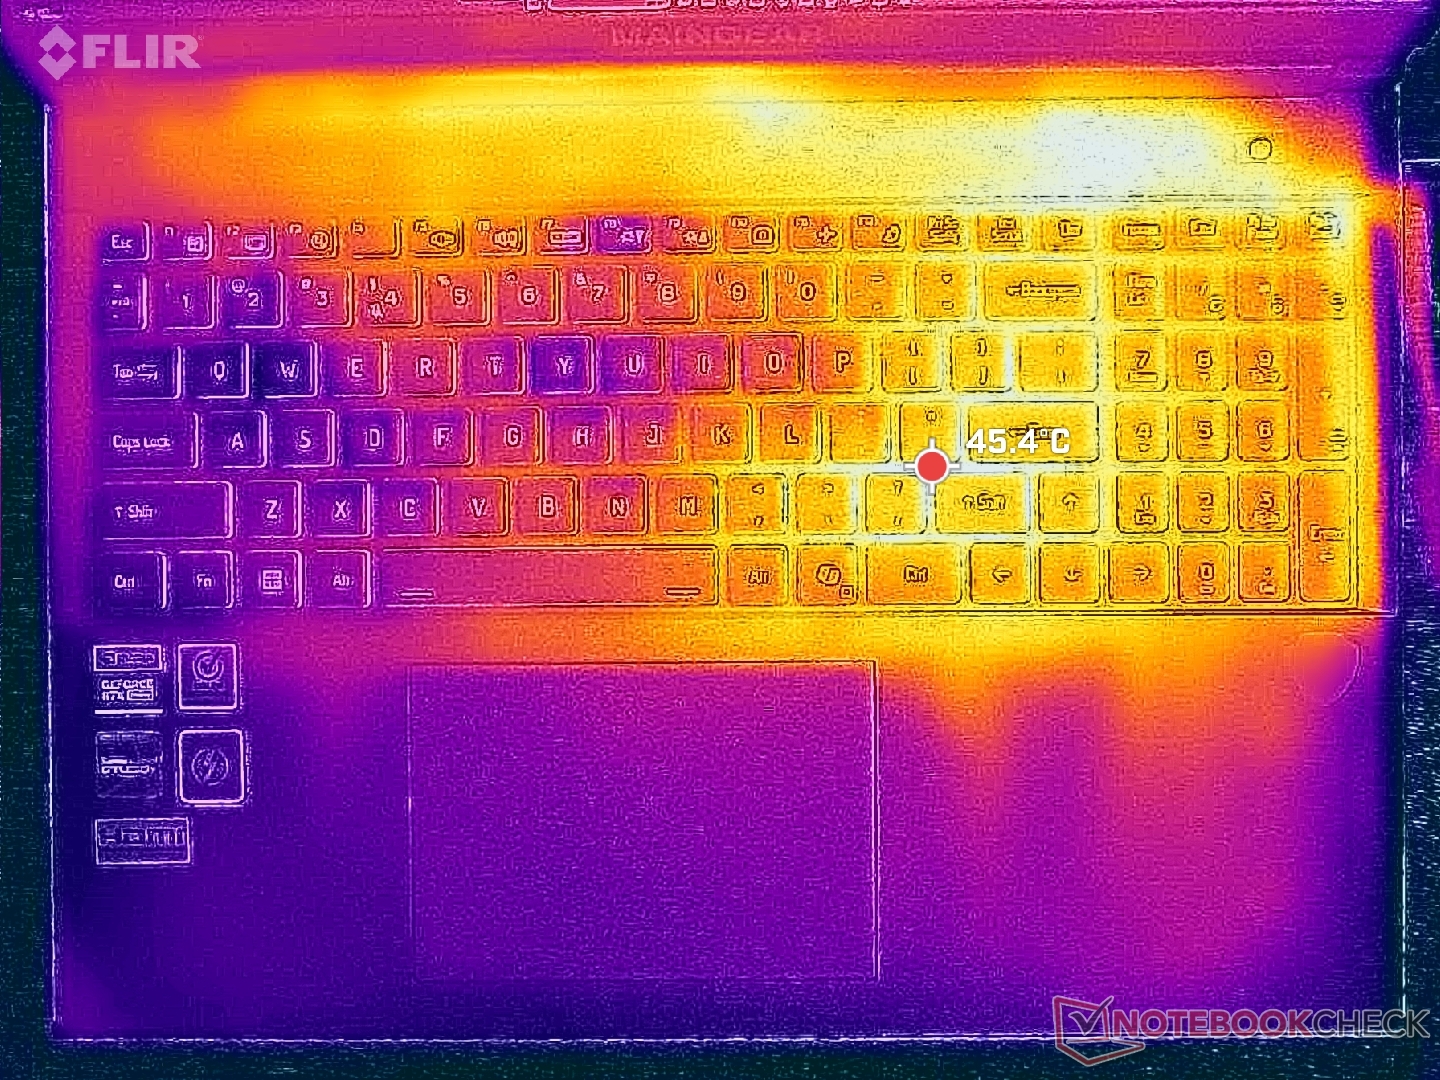
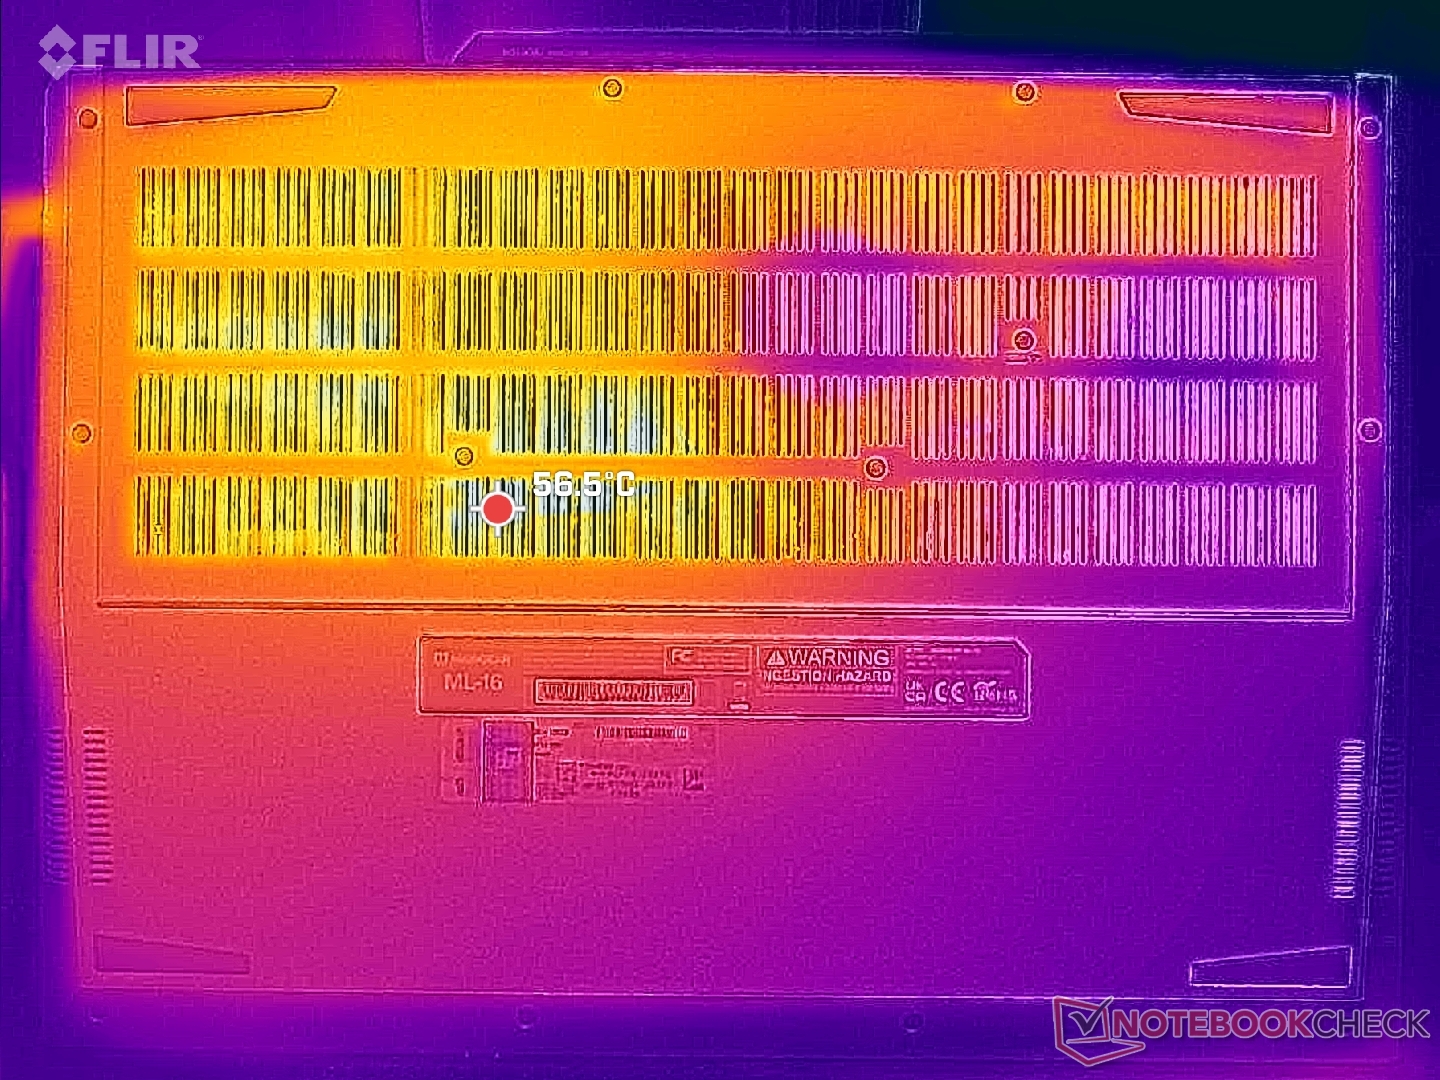
温度
如上所述,极高的运行温度导致表面温度高于平均水平。游戏时,顶部和底部的热点温度可分别达到 54 摄氏度和 56 摄氏度以上,而刀锋 16 仅为 40 摄氏度。刀锋 16或Legion Pro 5 16IRX9 的 47 C。
此外,非对称散热解决方案意味着机箱或键盘的右半部分会比左半部分温度高很多。这与对称散热解决方案常见的大多数其他游戏笔记本电脑形成鲜明对比。这不是一个大问题,因为大多数游戏只使用键盘左半部分的 WASD 键,但如果游戏需要输入数字键盘,你就会感到手心出汗。
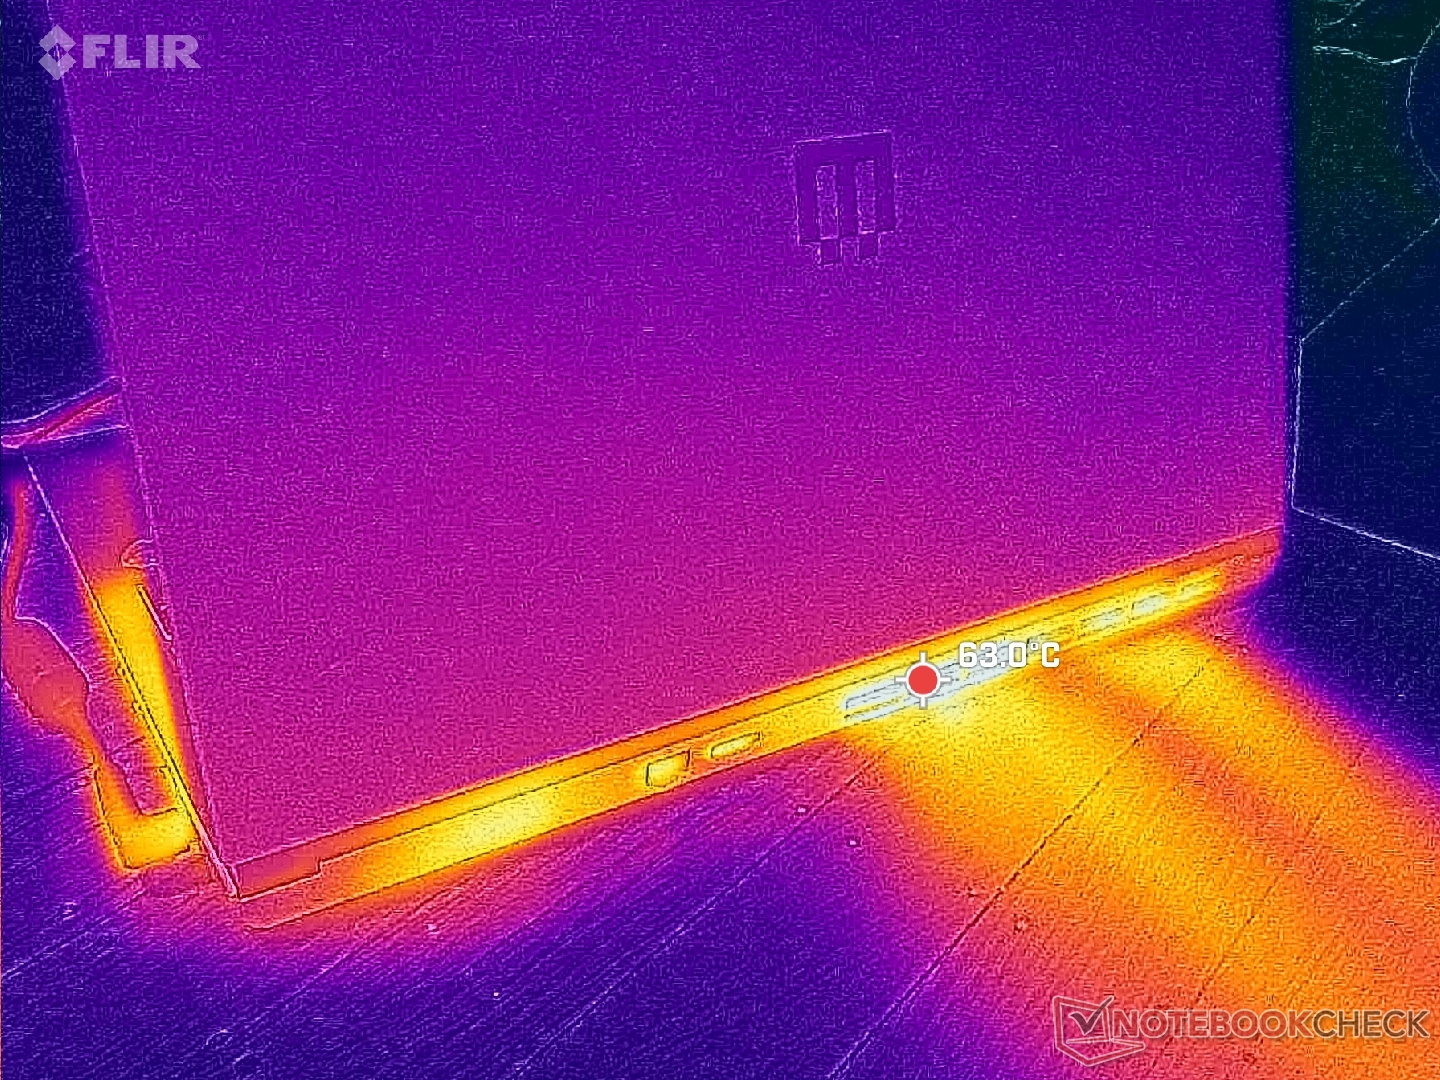
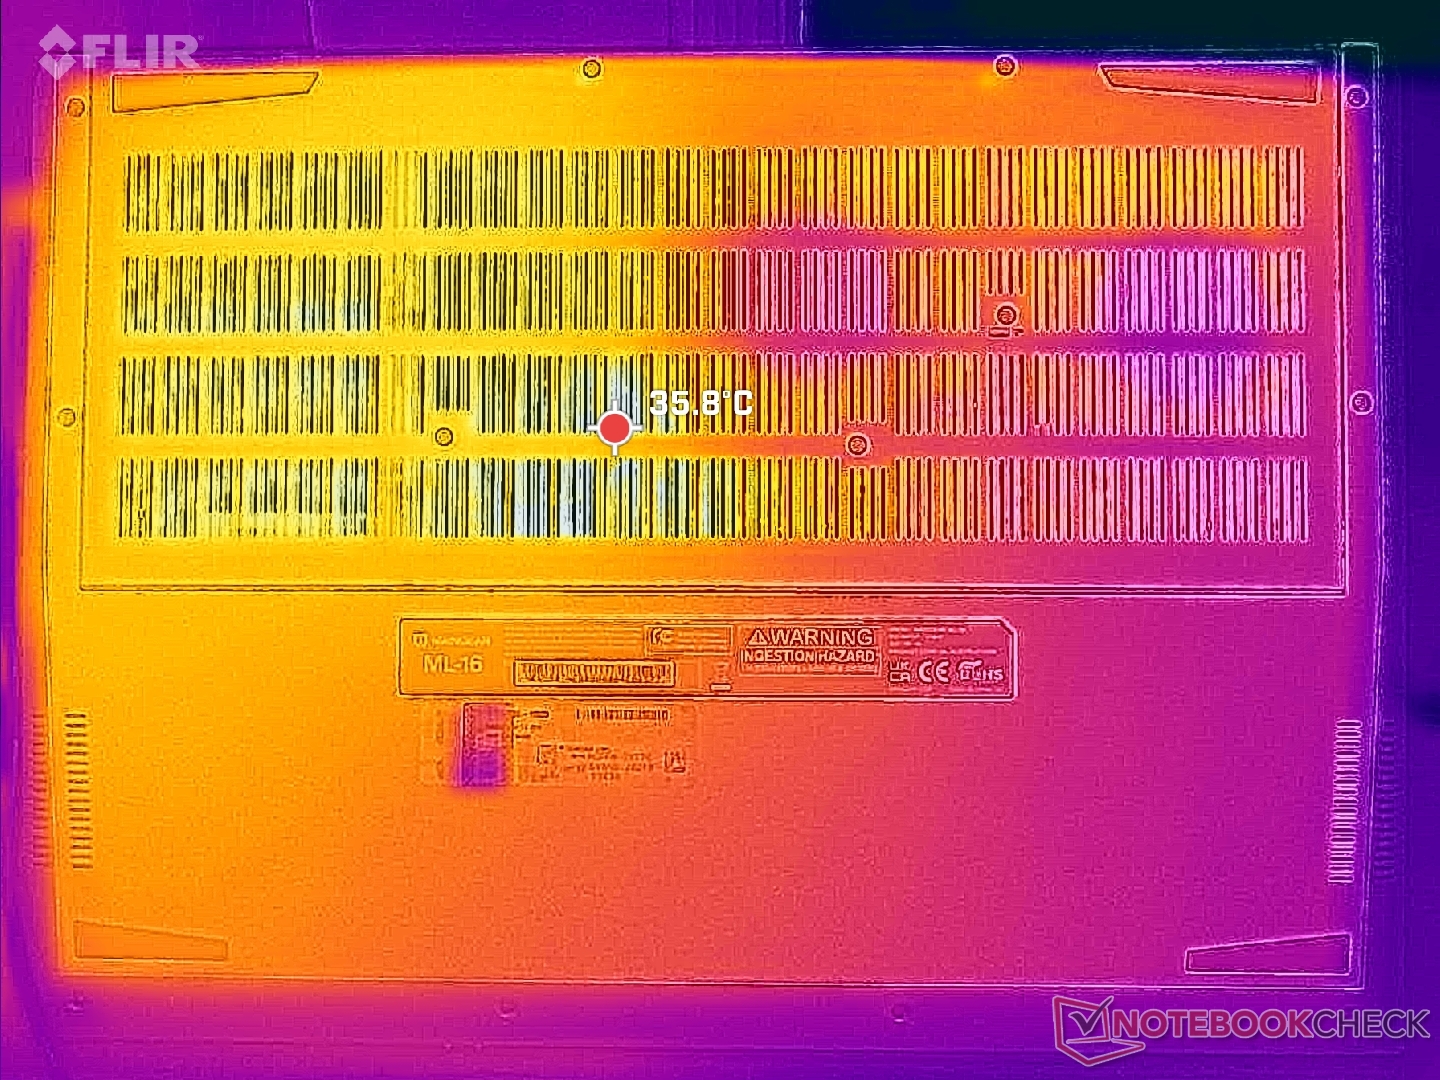
(-) The maximum temperature on the upper side is 45.2 °C / 113 F, compared to the average of 40.4 °C / 105 F, ranging from 21.2 to 68.8 °C for the class Gaming.
(-) The bottom heats up to a maximum of 48.8 °C / 120 F, compared to the average of 43.2 °C / 110 F
(+) In idle usage, the average temperature for the upper side is 31.9 °C / 89 F, compared to the device average of 33.9 °C / 93 F.
(-) 3: The average temperature for the upper side is 40 °C / 104 F, compared to the average of 33.9 °C / 93 F for the class Gaming.
(+) The palmrests and touchpad are reaching skin temperature as a maximum (34.6 °C / 94.3 F) and are therefore not hot.
(-) The average temperature of the palmrest area of similar devices was 28.9 °C / 84 F (-5.7 °C / -10.3 F).
| Maingear ML-16 MK2 Intel Core Ultra 7 155H, NVIDIA GeForce RTX 4070 Laptop GPU | Asus ROG Zephyrus G16 GA605WV AMD Ryzen AI 9 HX 370, NVIDIA GeForce RTX 4060 Laptop GPU | HP Victus 16 (2024) Intel Core i7-14700HX, NVIDIA GeForce RTX 4060 Laptop GPU | Alienware x16 R2 P120F Intel Core Ultra 9 185H, NVIDIA GeForce RTX 4080 Laptop GPU | Lenovo Legion Pro 5 16IRX9 Intel Core i9-14900HX, NVIDIA GeForce RTX 4070 Laptop GPU | Razer Blade 16 2024, RTX 4090 Intel Core i9-14900HX, NVIDIA GeForce RTX 4090 Laptop GPU | |
|---|---|---|---|---|---|---|
| Heat | 8% | 12% | -4% | 0% | 12% | |
| Maximum Upper Side * | 45.2 | 48.2 -7% | 50 -11% | 51 -13% | 43.8 3% | 45 -0% |
| Maximum Bottom * | 48.8 | 51.3 -5% | 50 -2% | 50.8 -4% | 55.4 -14% | 45 8% |
| Idle Upper Side * | 34.8 | 28 20% | 25 28% | 36.6 -5% | 32.8 6% | 29 17% |
| Idle Bottom * | 38.2 | 28.8 25% | 26 32% | 35.2 8% | 36 6% | 30 21% |
* ... smaller is better
发言人
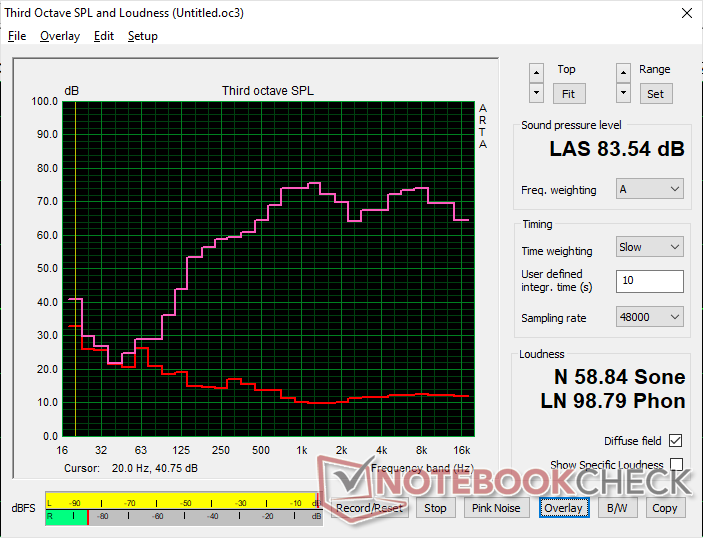
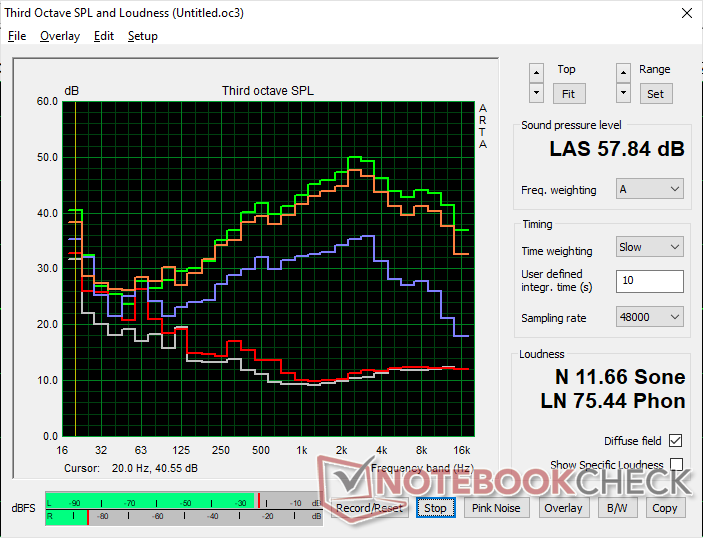
Maingear ML-16 MK2 audio analysis
(+) | speakers can play relatively loud (83.5 dB)
Bass 100 - 315 Hz
(-) | nearly no bass - on average 16.1% lower than median
(±) | linearity of bass is average (9.2% delta to prev. frequency)
Mids 400 - 2000 Hz
(+) | balanced mids - only 4.9% away from median
(+) | mids are linear (4.9% delta to prev. frequency)
Highs 2 - 16 kHz
(+) | balanced highs - only 3.3% away from median
(+) | highs are linear (5.1% delta to prev. frequency)
Overall 100 - 16.000 Hz
(+) | overall sound is linear (13.7% difference to median)
Compared to same class
» 20% of all tested devices in this class were better, 6% similar, 74% worse
» The best had a delta of 6%, average was 18%, worst was 132%
Compared to all devices tested
» 13% of all tested devices were better, 3% similar, 83% worse
» The best had a delta of 4%, average was 24%, worst was 134%
Apple MacBook Pro 16 2021 M1 Pro audio analysis
(+) | speakers can play relatively loud (84.7 dB)
Bass 100 - 315 Hz
(+) | good bass - only 3.8% away from median
(+) | bass is linear (5.2% delta to prev. frequency)
Mids 400 - 2000 Hz
(+) | balanced mids - only 1.3% away from median
(+) | mids are linear (2.1% delta to prev. frequency)
Highs 2 - 16 kHz
(+) | balanced highs - only 1.9% away from median
(+) | highs are linear (2.7% delta to prev. frequency)
Overall 100 - 16.000 Hz
(+) | overall sound is linear (4.6% difference to median)
Compared to same class
» 0% of all tested devices in this class were better, 0% similar, 100% worse
» The best had a delta of 5%, average was 18%, worst was 45%
Compared to all devices tested
» 0% of all tested devices were better, 0% similar, 100% worse
» The best had a delta of 4%, average was 24%, worst was 134%
能源管理
耗电量
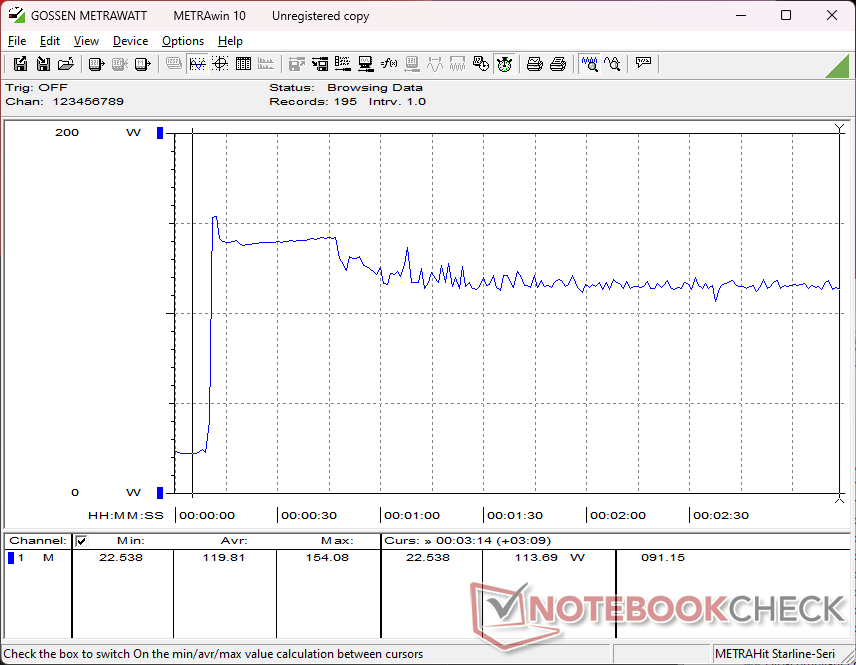
根据 GPU 设置和亮度水平的不同,空闲时的功耗范围在 7 W 到 27 W 之间,与竞争对手相比范围较大。这也解释了下文中电池续航时间相对较短的原因。只需启用 dGPU 模式和最大显示亮度,耗电量就会从 7 W 激增到 23 W,因此如果电池寿命很重要,建议在 MSHybrid 模式下运行。
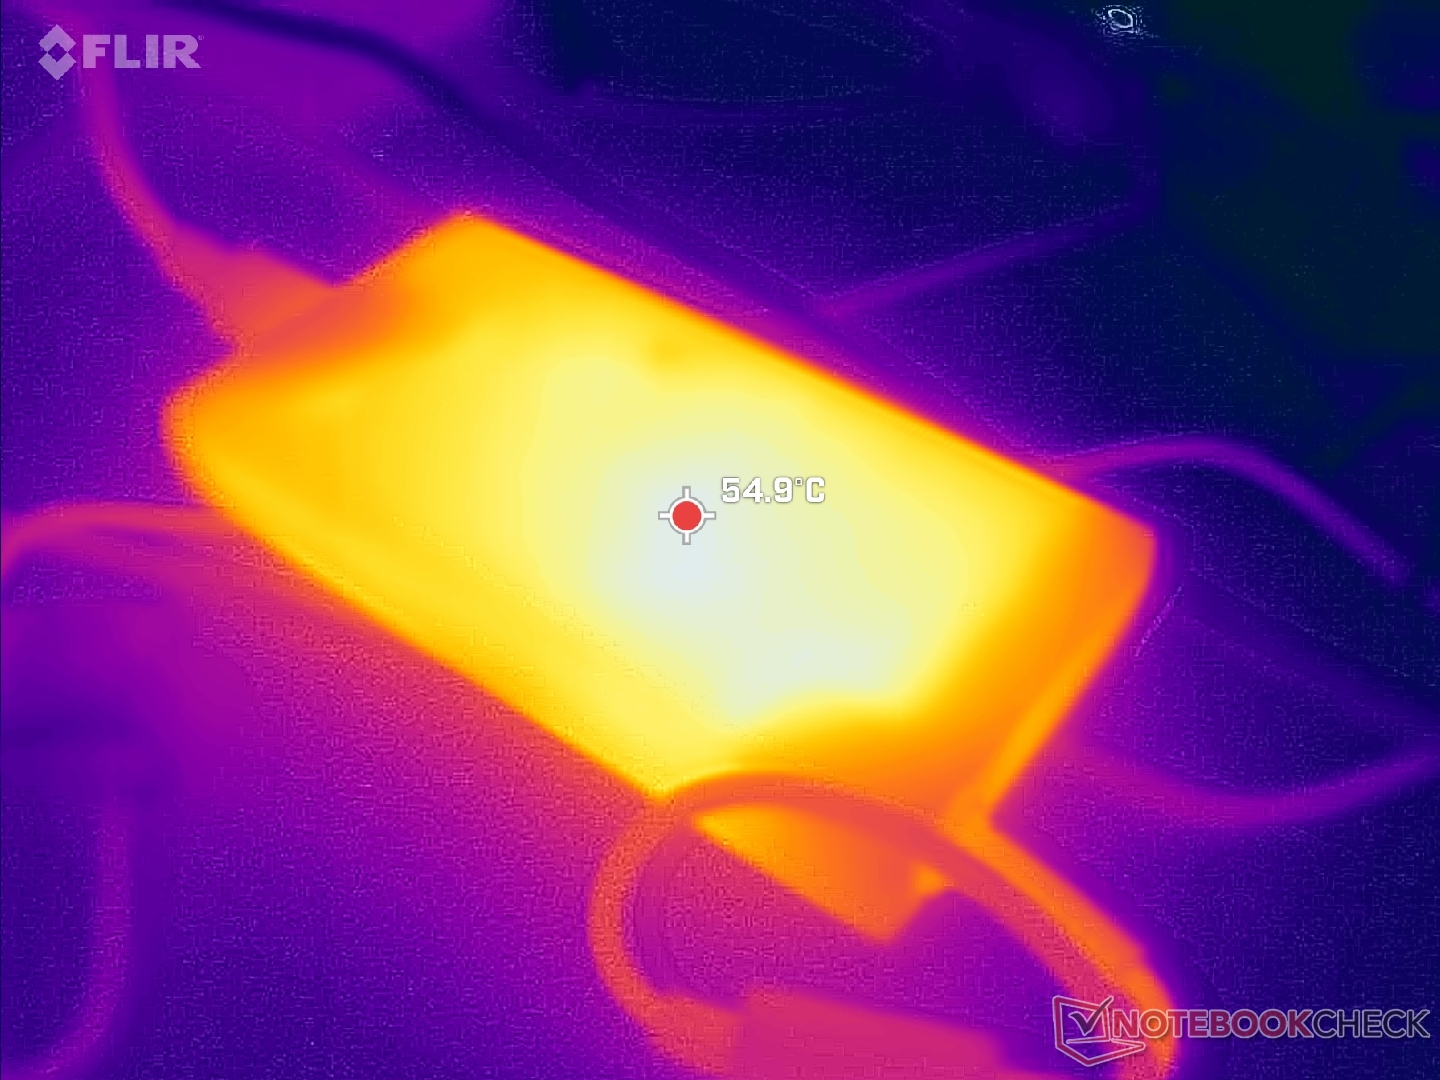
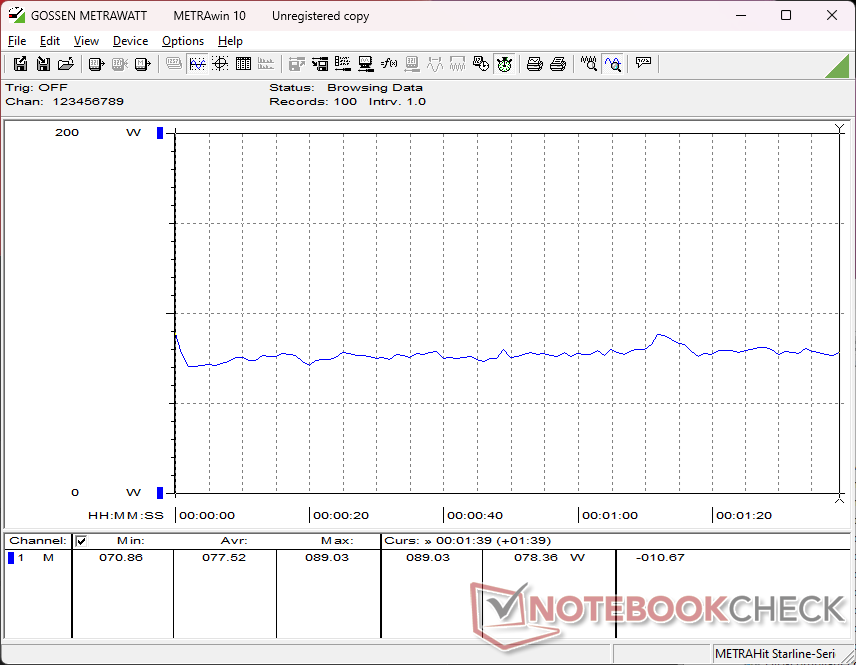
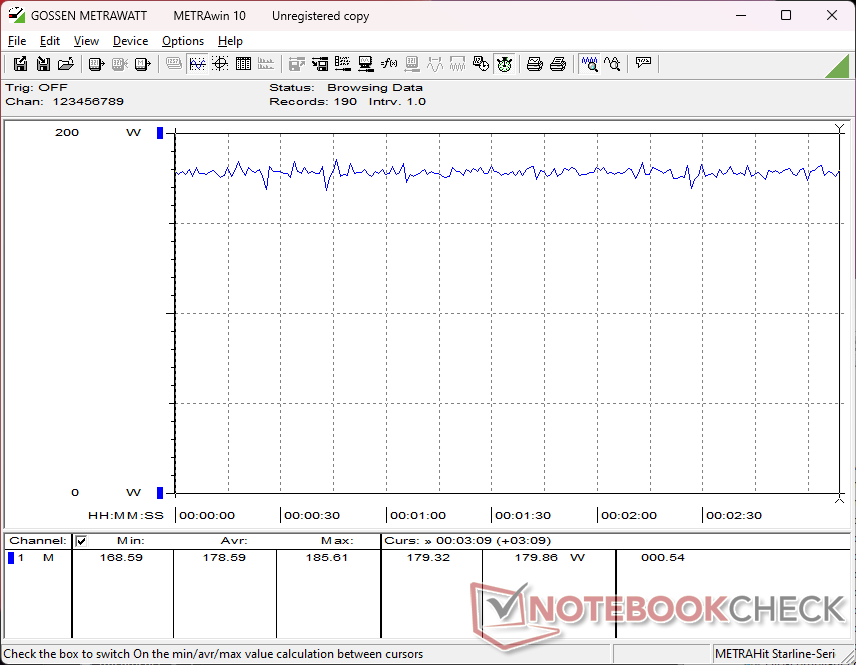
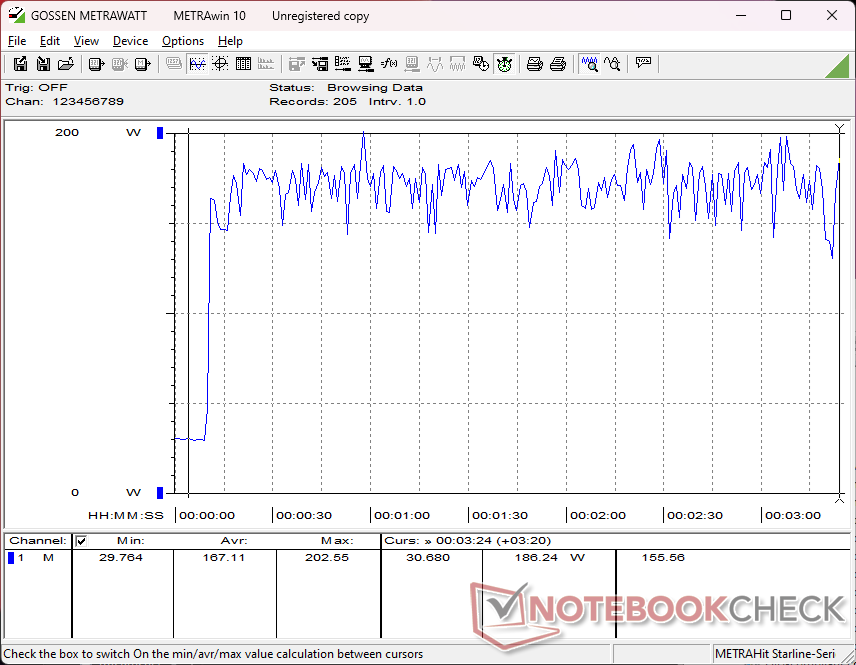
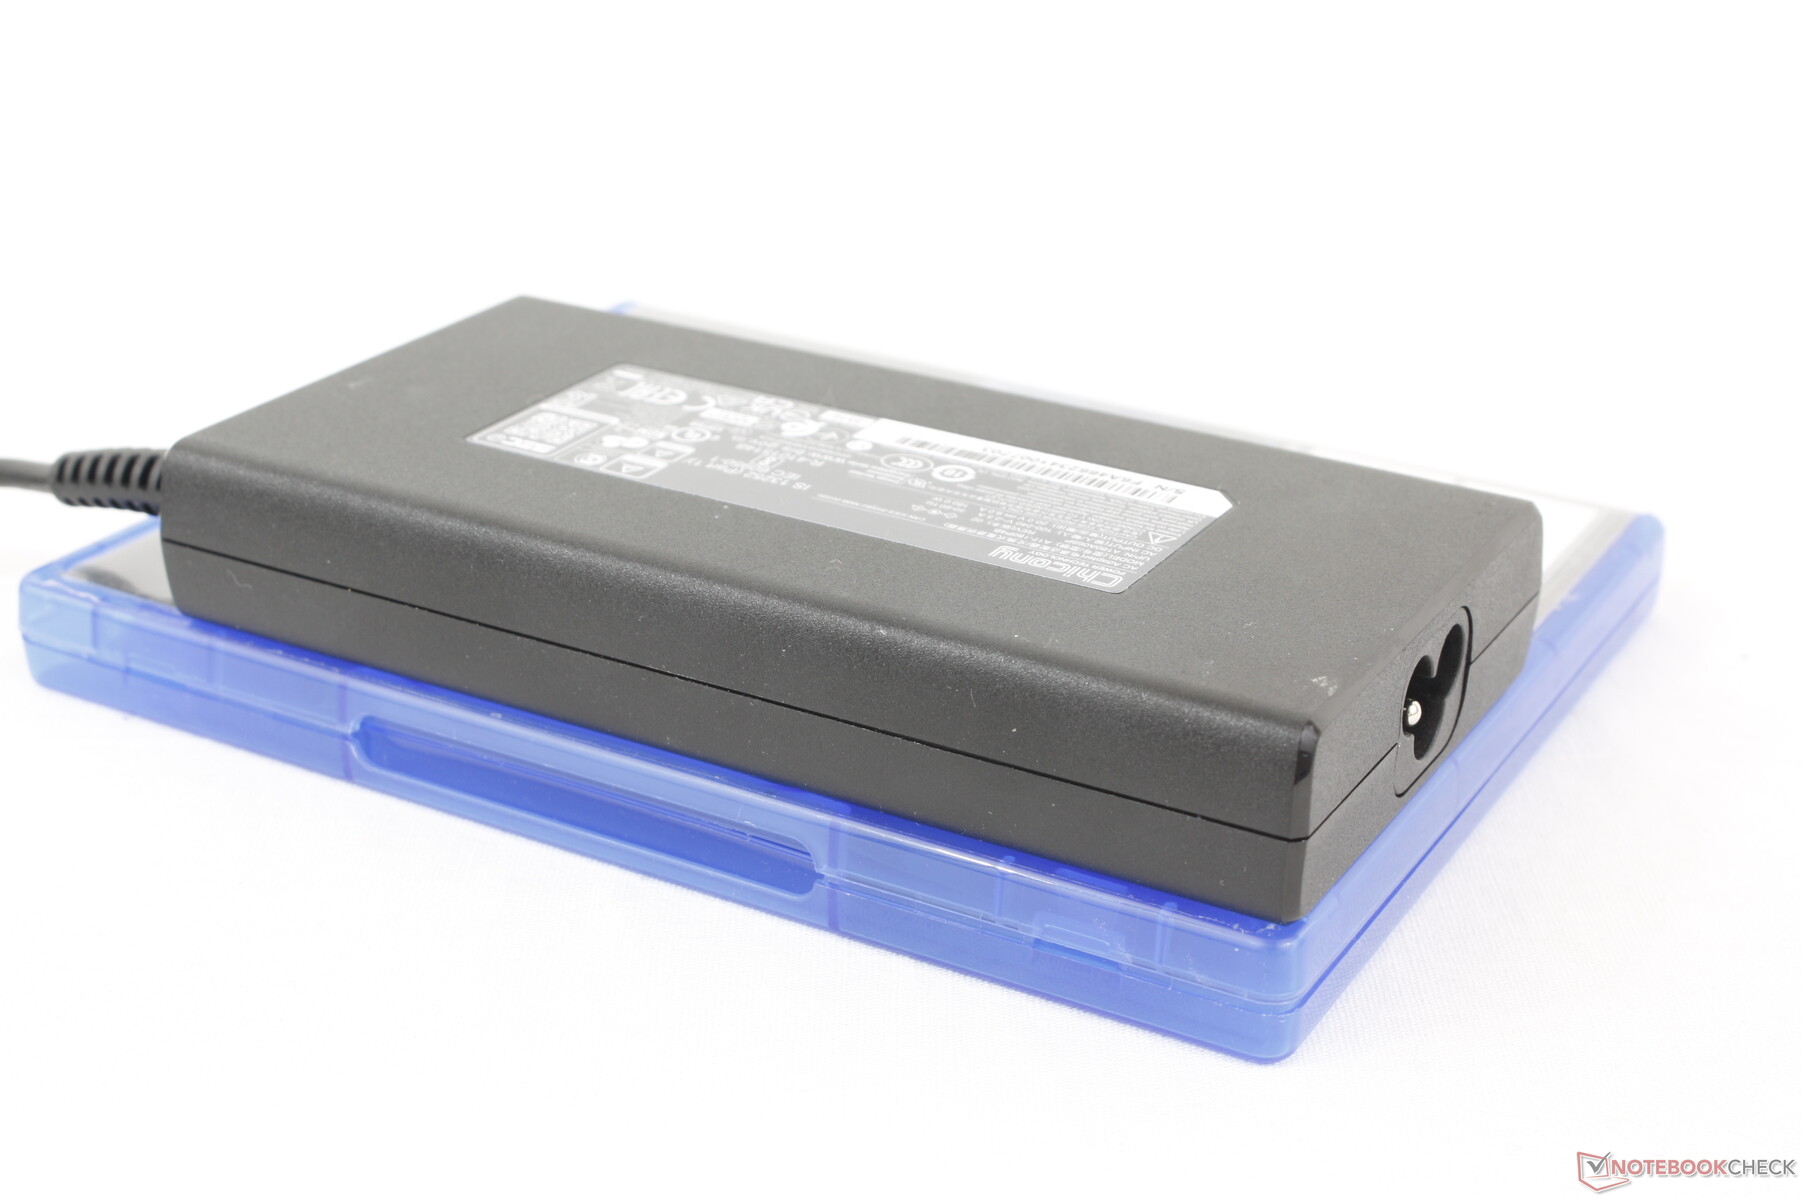
中型(约 14.4 x 7.5 x 2.3 厘米)180 瓦交流适配器的平均游戏功耗约为 179 瓦。这意味着如果同时运行游戏,充电速度会减慢,同时也表明如果该机型配备更大的 230 瓦交流适配器,性能可能会更快。事实上,当 CPU 和 GPU 处于满负荷运行状态时,我们能记录到 203 W 的最大功耗,这证明系统的需求可能超过交流适配器所能安全提供的功率。这与我们在 联想 Yoga Pro 9i 16 G9我们发现其 170 W AC 适配器对于酷睿 Ultra H CPU 和 RTX 4070 GPU 来说太小了。
| Off / Standby | |
| Idle | |
| Load |
|
Key:
min: | |
| Maingear ML-16 MK2 Ultra 7 155H, NVIDIA GeForce RTX 4070 Laptop GPU, , IPS, 2560x1600, 16" | Asus ROG Zephyrus G16 GA605WV Ryzen AI 9 HX 370, NVIDIA GeForce RTX 4060 Laptop GPU, Micron 2400 MTFDKBA1T0QFM, OLED, 2560x1600, 16" | HP Victus 16 (2024) i7-14700HX, NVIDIA GeForce RTX 4060 Laptop GPU, Kioxia XG8 KXG80ZNV512G, IPS, 1920x1080, 16.1" | Alienware x16 R2 P120F Ultra 9 185H, NVIDIA GeForce RTX 4080 Laptop GPU, WDC PC SN810 1TB, IPS, 2560x1600, 16" | Lenovo Legion Pro 5 16IRX9 i9-14900HX, NVIDIA GeForce RTX 4070 Laptop GPU, Samsung PM9A1 MZVL21T0HCLR, IPS, 2560x1600, 16" | Razer Blade 16 2024, RTX 4090 i9-14900HX, NVIDIA GeForce RTX 4090 Laptop GPU, Samsung PM9A1 MZVL22T0HBLB, OLED, 2560x1600, 16" | |
|---|---|---|---|---|---|---|
| Power Consumption | 24% | -9% | -20% | -29% | -39% | |
| Idle Minimum * | 7.7 | 6.9 10% | 9 -17% | 9.9 -29% | 12.5 -62% | 16.9 -119% |
| Idle Average * | 22.9 | 12.6 45% | 15 34% | 14.5 37% | 24.6 -7% | 17.8 22% |
| Idle Maximum * | 26.7 | 13 51% | 23 14% | 33.5 -25% | 24.8 7% | 19.6 27% |
| Load Average * | 77.5 | 84.1 -9% | 123 -59% | 97.5 -26% | 109.6 -41% | 128 -65% |
| Cyberpunk 2077 ultra external monitor * | 178.9 | 124.5 30% | ||||
| Cyberpunk 2077 ultra * | 178.6 | 127.2 29% | ||||
| Load Maximum * | 202.6 | 177.6 12% | 241 -19% | 315.2 -56% | 284.9 -41% | 328 -62% |
| Witcher 3 ultra * | 143.7 | 230 | 218 | 243 |
* ... smaller is better
Power Consumption Cyberpunk / Stress Test
Power Consumption external Monitor
电池寿命
80 Wh 的电池容量对于 16 英寸的屏幕尺寸来说属于平均水平。不过,运行时间低于游戏笔记本电脑的平均水平。即使设置为激活 MSHybrid 的平衡电源配置文件,我们也只能记录略高于 3.5 小时的 WLAN 实际浏览时间,而华硕 Zephyrus G16 的实际浏览时间是它的两倍多。 华硕 ROG Zephyrus G16或 HP Victus 16 的两倍多。
从空电到满电的充电时间相对较短,为 1 至 1.5 小时。该系统还可以通过第三方 USB-C AC 适配器充电,尽管充电速度较慢。请注意,两个 USB-C 端口中只有一个支持充电。
| Maingear ML-16 MK2 Ultra 7 155H, NVIDIA GeForce RTX 4070 Laptop GPU, 80 Wh | Asus ROG Zephyrus G16 GA605WV Ryzen AI 9 HX 370, NVIDIA GeForce RTX 4060 Laptop GPU, 90 Wh | HP Victus 16 (2024) i7-14700HX, NVIDIA GeForce RTX 4060 Laptop GPU, 83 Wh | Alienware x16 R2 P120F Ultra 9 185H, NVIDIA GeForce RTX 4080 Laptop GPU, 90 Wh | Lenovo Legion Pro 5 16IRX9 i9-14900HX, NVIDIA GeForce RTX 4070 Laptop GPU, 80 Wh | Razer Blade 16 2024, RTX 4090 i9-14900HX, NVIDIA GeForce RTX 4090 Laptop GPU, 95.2 Wh | |
|---|---|---|---|---|---|---|
| Battery Runtime | 62% | 134% | -11% | -13% | 16% | |
| Reader / Idle | 651 | 403 -38% | ||||
| WiFi v1.3 | 218 | 478 119% | 511 134% | 193 -11% | 290 33% | 329 51% |
| Load | 98 | 103 5% | 65 -34% | 79 -19% | ||
| H.264 | 824 | 456 |
Pros
Cons
评价--出乎意料的轻,但有点太热了
与大牌竞争对手相比,Maingear ML-16 MK2 有几大优势。最值得注意的是它重量轻、显示屏相对明亮,这对不经常在家玩游戏的用户很有帮助。同时,集成的数字键盘对于某些类型的游戏和电子表格工作非常有用,而易于维修的特性也一直受到发烧友的青睐。
遗憾的是,该机型的缺点较多。首先,它的散热解决方案相对较小,不如同类 16 英寸游戏笔记本电脑那么完善。因此,其核心温度、表面温度和风扇噪音都比其他重型笔记本电脑更高、更大。 雷蛇刀锋 16或 联想Legion Pro.机箱刚性也比竞争对手弱,给人的第一印象较差。这些不足部分归因于机身重量较轻,因此在底盘和散热解决方案上有所删减。换句话说,为了获得更轻、更便携的重量,你需要做出一些关键性的牺牲。
Maingear ML-16 MK2 比我们预期的更轻更亮。不过,它缺少一些高级功能,而温度和风扇噪音可能会更好。
ML-16 MK2 没有 Optimus 2.0、HDR、OLED、按键 RGB 灯光、蒸汽腔冷却和液态金属接口等更多高级功能。对于售价 1500 美元的产品来说,这些功能的缺失也许是可以接受的,但考虑到我们的 RTX 4070 配置要价 2000 美元,我们对它的期望值就更高了。
价格和供应情况
Maingear 现已发货ML-16 Mark 2 搭配GeForce RTX 4060 的售价为 1800 美元,搭配 RTX 4070 的售价为 2000 美元。
注:我们最近更新了评级系统,第 8 版的结果与第 7 版的结果不具可比性。更多信息 此处.
Maingear ML-16 MK2
- 09/17/2024 v8
Allen Ngo
 Total Sustainability Score:
 Transparency
The selection of devices to be reviewed is made by our editorial team. The test sample was provided to the author as a loan by the manufacturer or retailer for the purpose of this review. The lender had no influence on this review, nor did the manufacturer receive a copy of this review before publication. There was no obligation to publish this review. We never accept compensation or payment in return for our reviews. As an independent media company, Notebookcheck is not subjected to the authority of manufacturers, retailers or publishers.
This is how Notebookcheck is testing
Every year, Notebookcheck independently reviews hundreds of laptops and smartphones using standardized procedures to ensure that all results are comparable. We have continuously developed our test methods for around 20 years and set industry standards in the process. In our test labs, high-quality measuring equipment is utilized by experienced technicians and editors. These tests involve a multi-stage validation process. Our complex rating system is based on hundreds of well-founded measurements and benchmarks, which maintains objectivity. Further information on our test methods can be found here.
Price comparison

