

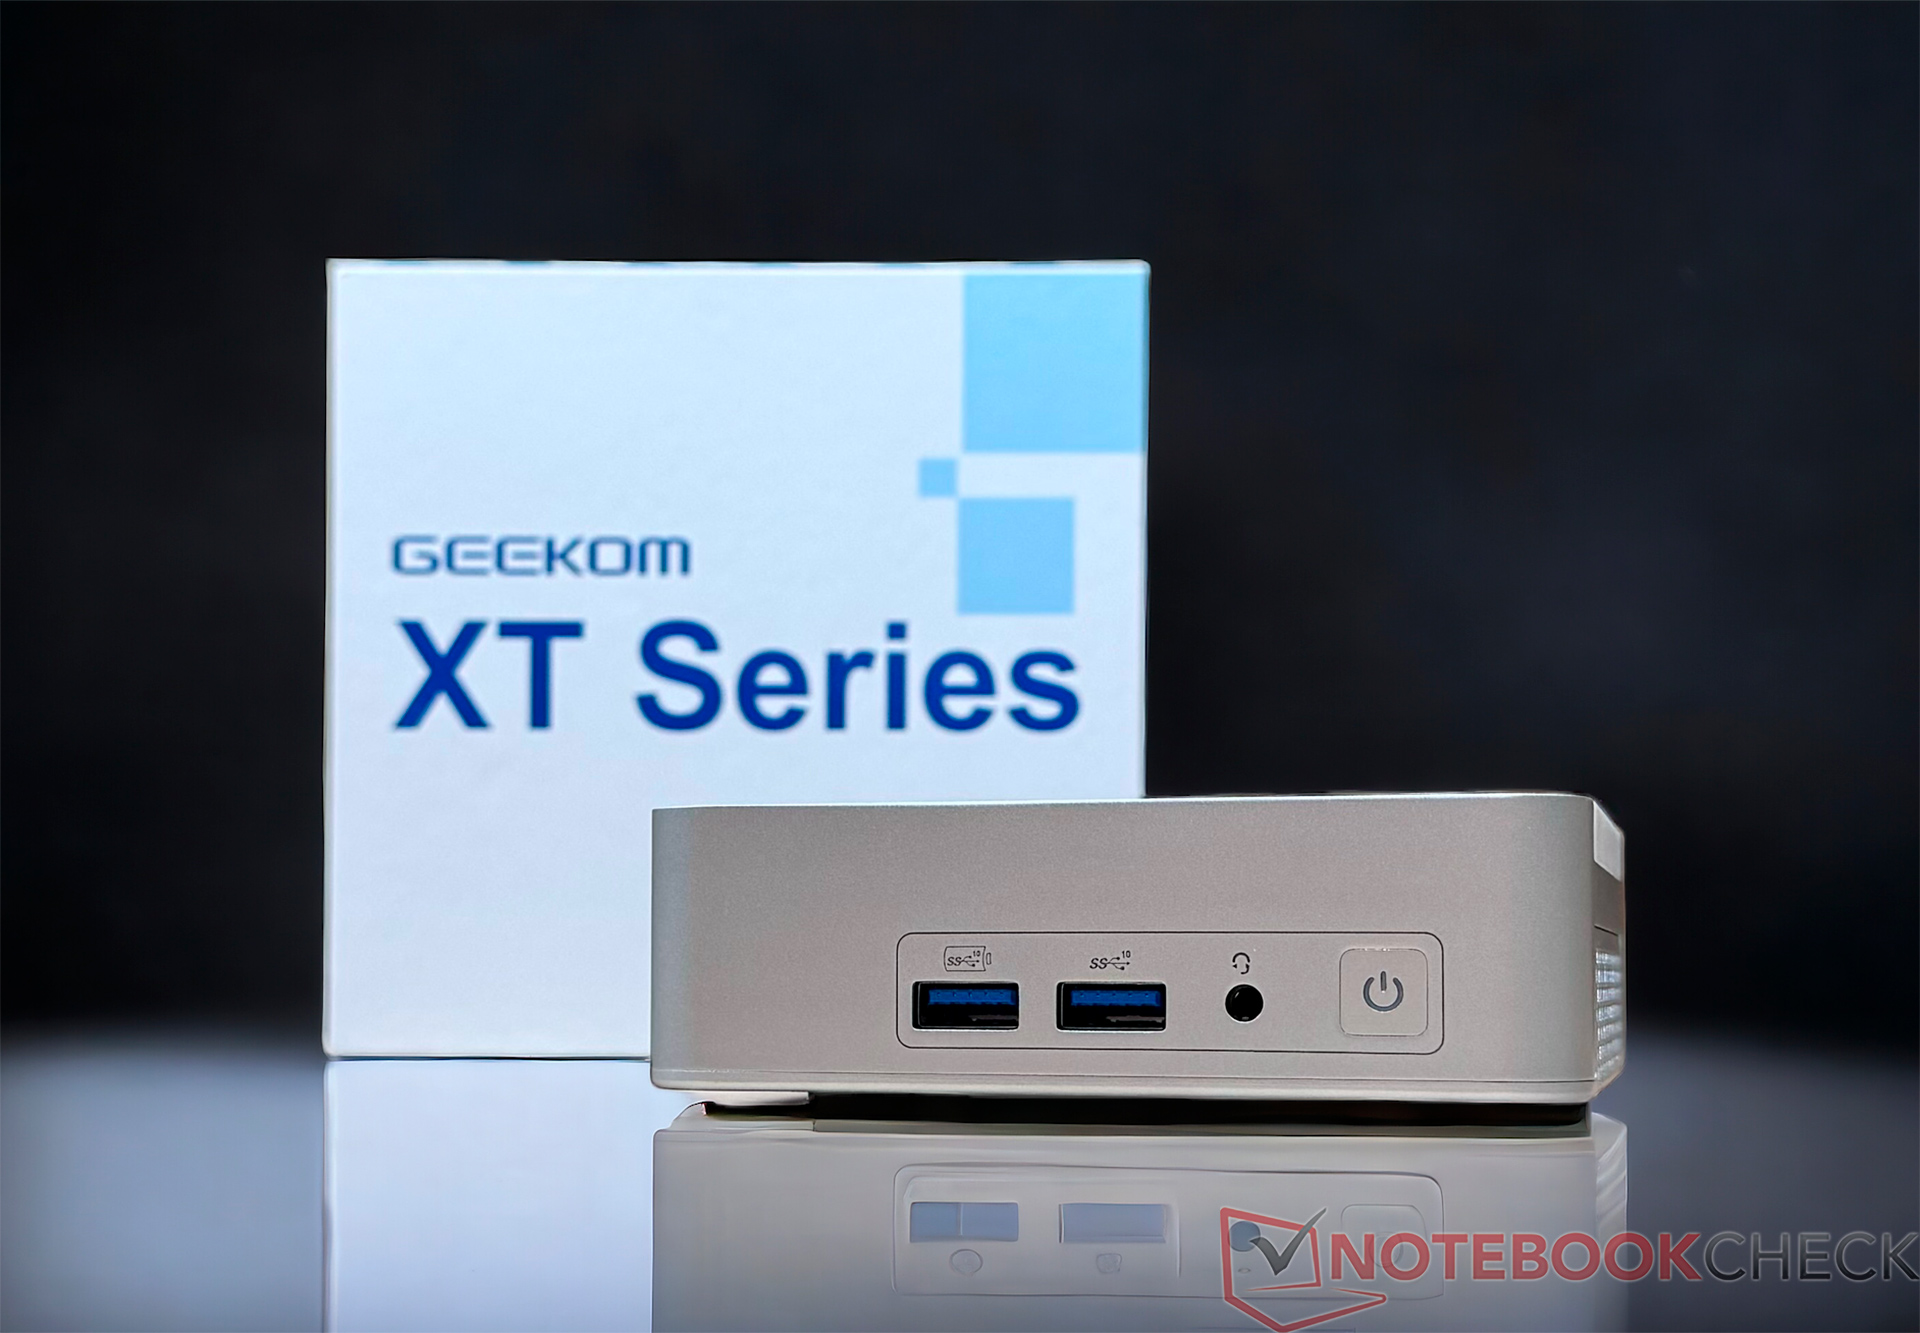
Geekom XT12 Pro 评测:时尚的 NUC 迷你 PC 替代品,配备英特尔酷睿 i9-12900H、32 GB DDR4 内存和 1 TB 固态硬盘

作为 Geekom XT12 Pro,这款迷你电脑应该以出色的性能和良好的效率为其加分。然而,Geekom 只安装了 英特尔酷睿 i9-12900H.不过,这颗 SoC 属于 Alder Lake-H 系列,两年前就已推出。关于这款处理器在当前对决中的表现,稍后会有更多介绍。毕竟,Geekom 在这里使用的是顶级型号,尽管目前还没有其他配置。该设备配备 32 GB 内存和 1 TB 固态硬盘,目前的售价为 749 欧元。这已经包含了折扣,因为制造商的零售价为 899 欧元。这个定价是否合理是个合理的问题,我们将在了解其与竞争对手的性能对比后再作解答。不过,从价格来看,制造商已经为自己设定了很高的标准。
潜在的竞争对手比较
Rating | Date | Model | Memory | Weight | Height |
|---|---|---|---|---|---|
| 84.1 % | 04 / 2024 | Geekom XT12 Pro i9-12900H, Iris Xe G7 96EUs | 32768 MB | 545 g | 37 mm |
| 87.3 % v7 (old) | 12 / 2023 | Minisforum EliteMini UM780 XTX R7 7840HS, Radeon 780M | 32768 MB | 750 g | 52.3 mm |
| 85.1 % v7 (old) | 01 / 2023 | Minisforum Neptune Series NAD9 i9-12900H, Iris Xe G7 96EUs | 16384 MB | 1.2 kg | 66 mm |
| 83.4 % v7 (old) | 04 / 2024 | Acemagic F2A Ultra 7 155H, Arc 8-Core | 32768 MB | 768 g | 57 mm |
| 83.1 % v7 (old) | 08 / 2023 | Intel NUC 13 Pro Desk Edition Kit i7-1360P, Iris Xe G7 96EUs | 32768 MB | 558 g | 37 mm |
| 82.6 % v7 (old) | 03 / 2024 | Geekom A7 R9 7940HS, Radeon 780M | 32768 MB | 417 g | 38 mm |
| 78.8 % v7 (old) | 08 / 2023 | Khadas Mind i7-1360P, Iris Xe G7 96EUs | 32768 MB | 438 g | 20 mm |
Geekom XT12 Pro 的详细信息


外壳 - 金属和塑料完美结合
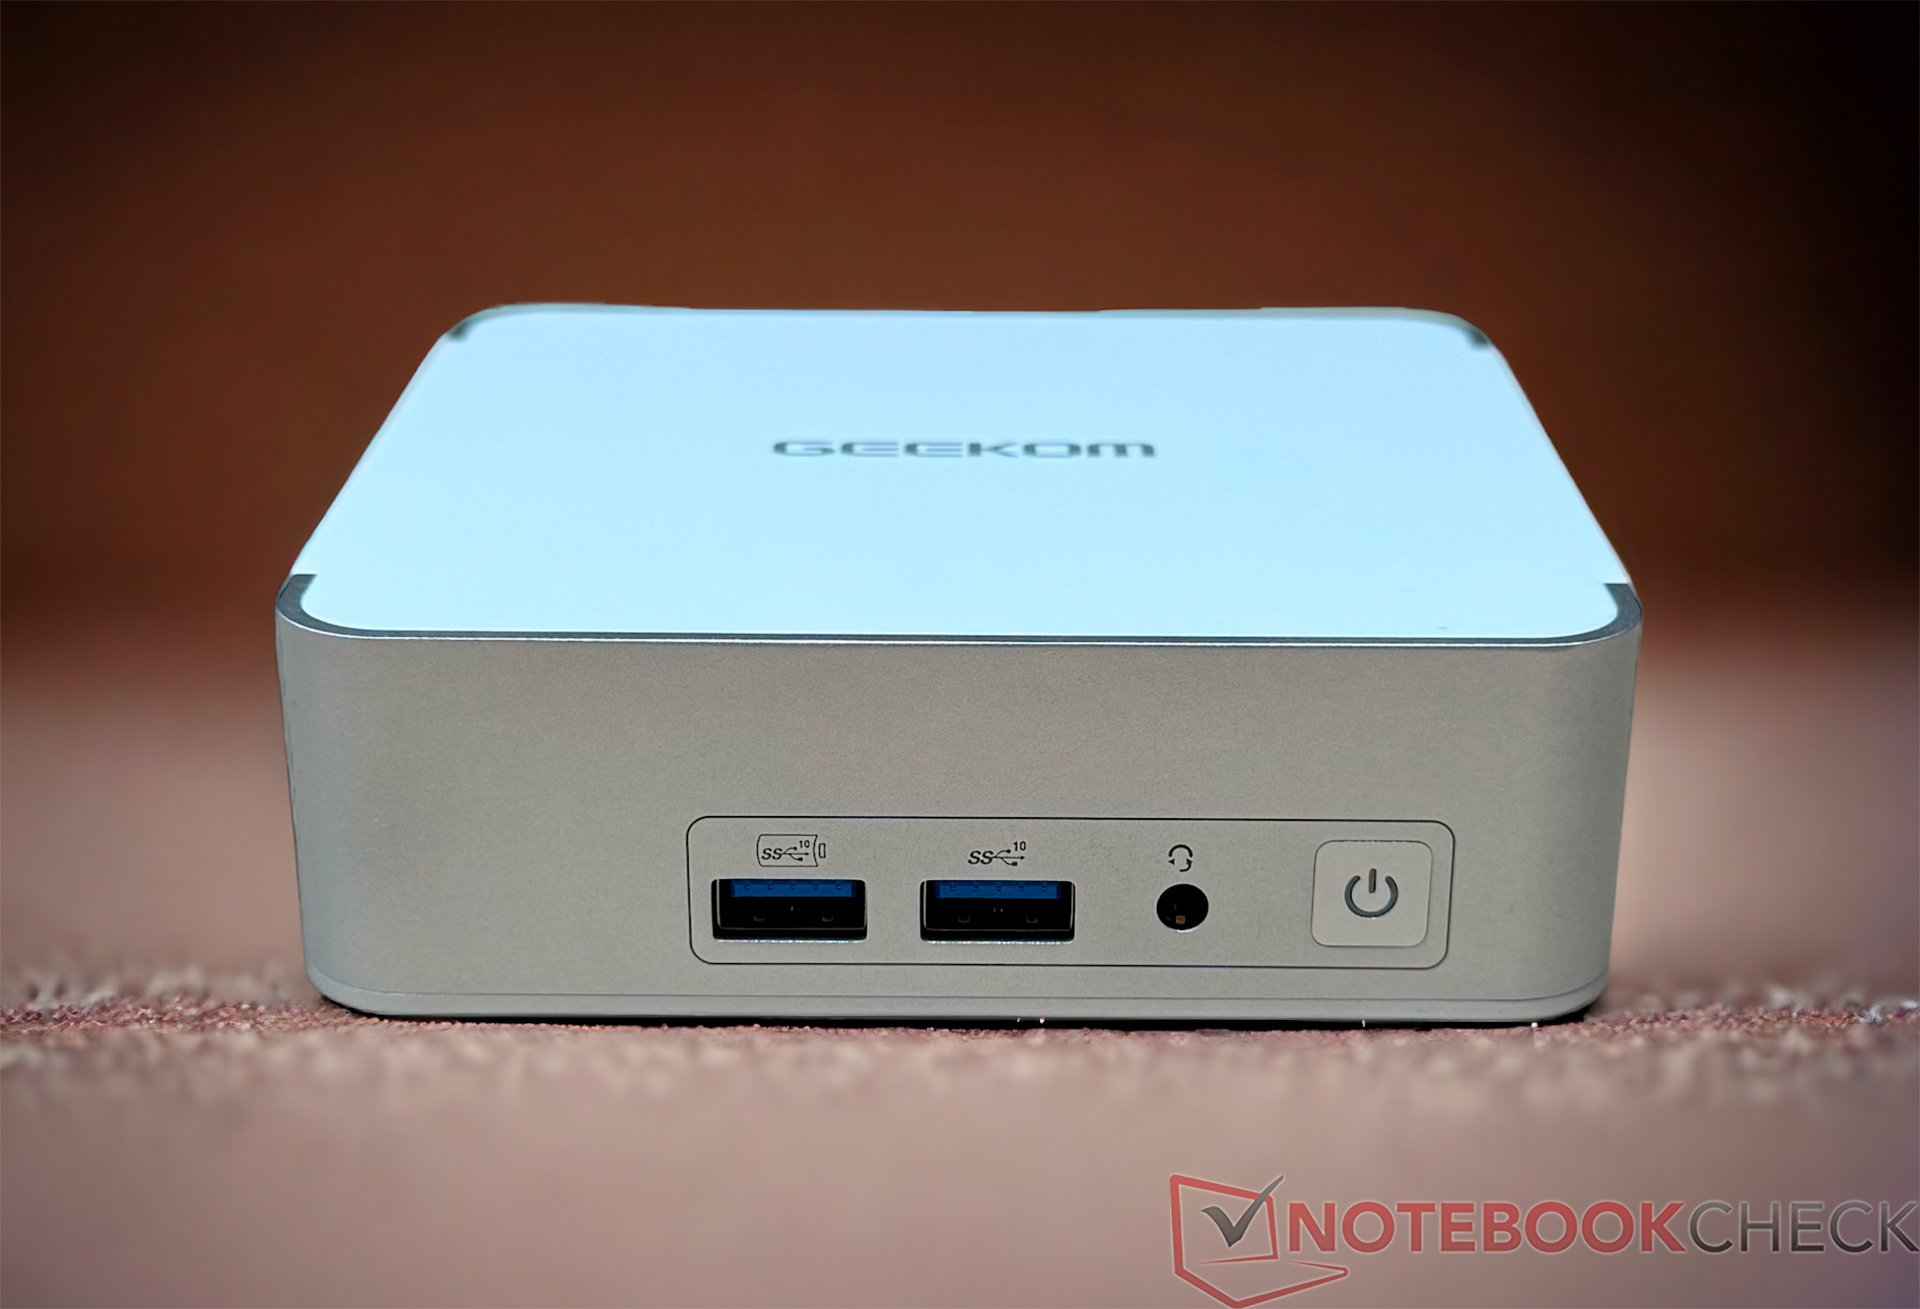
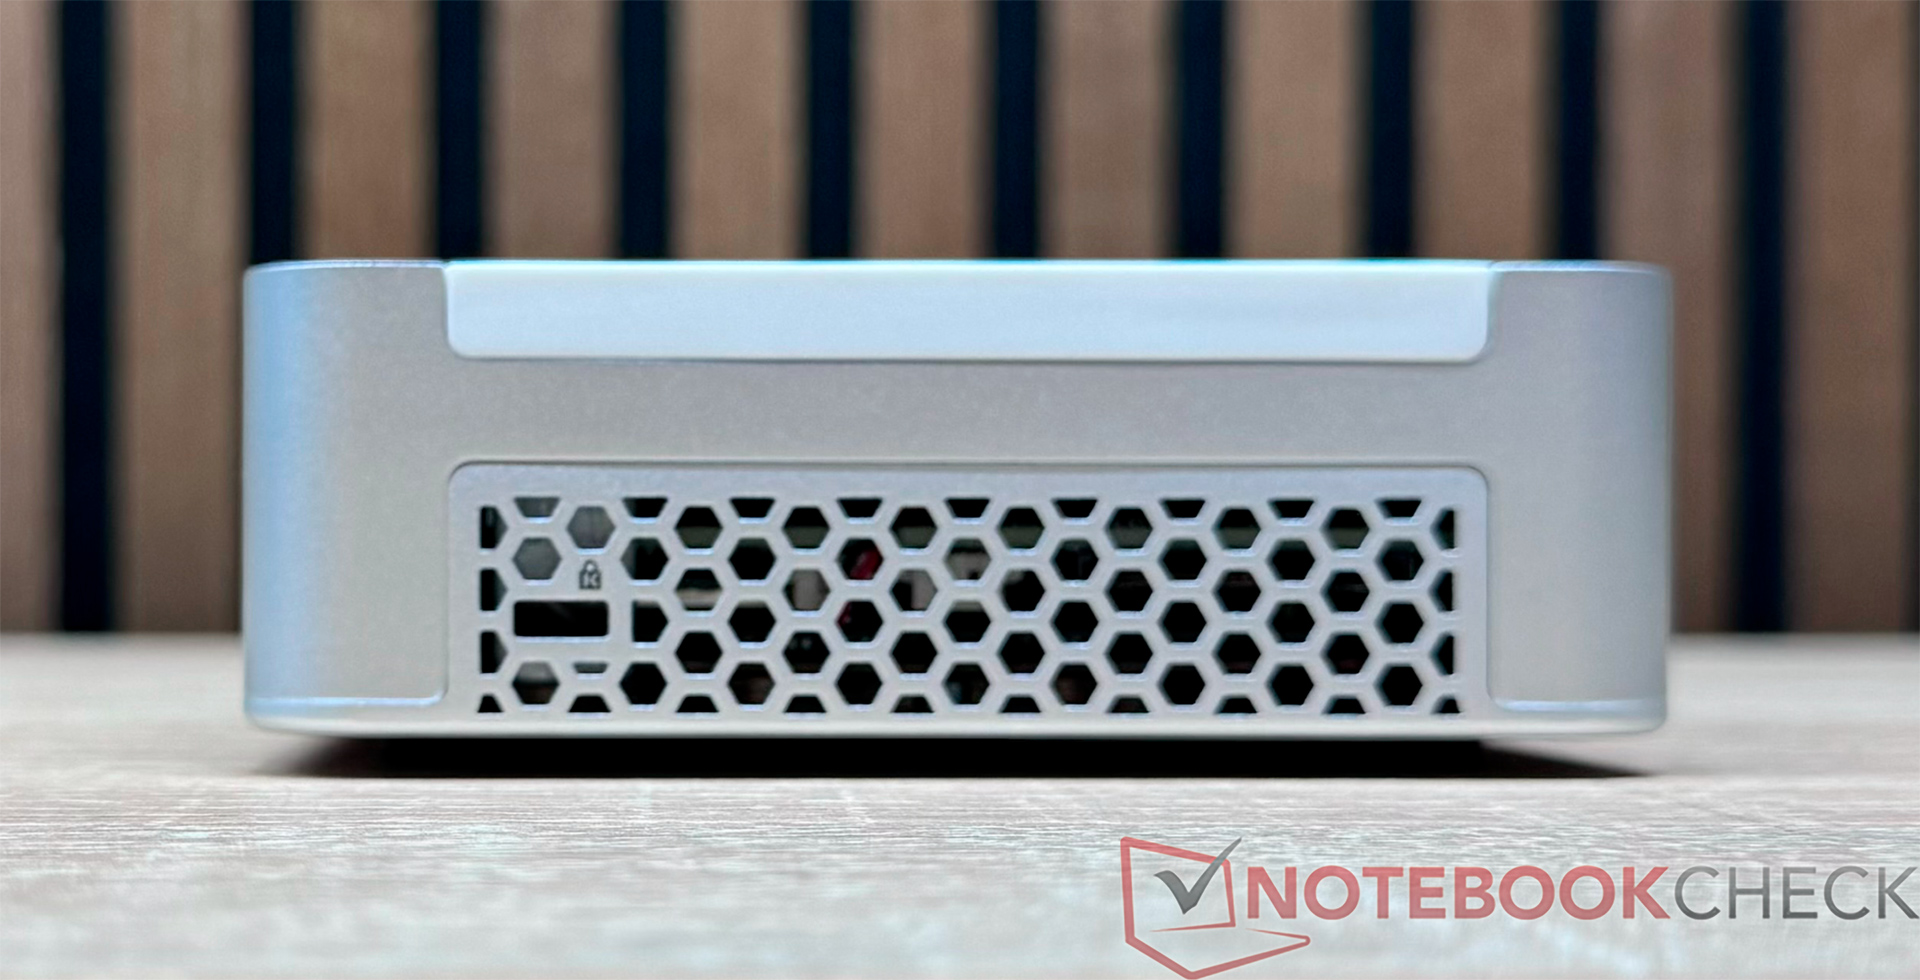
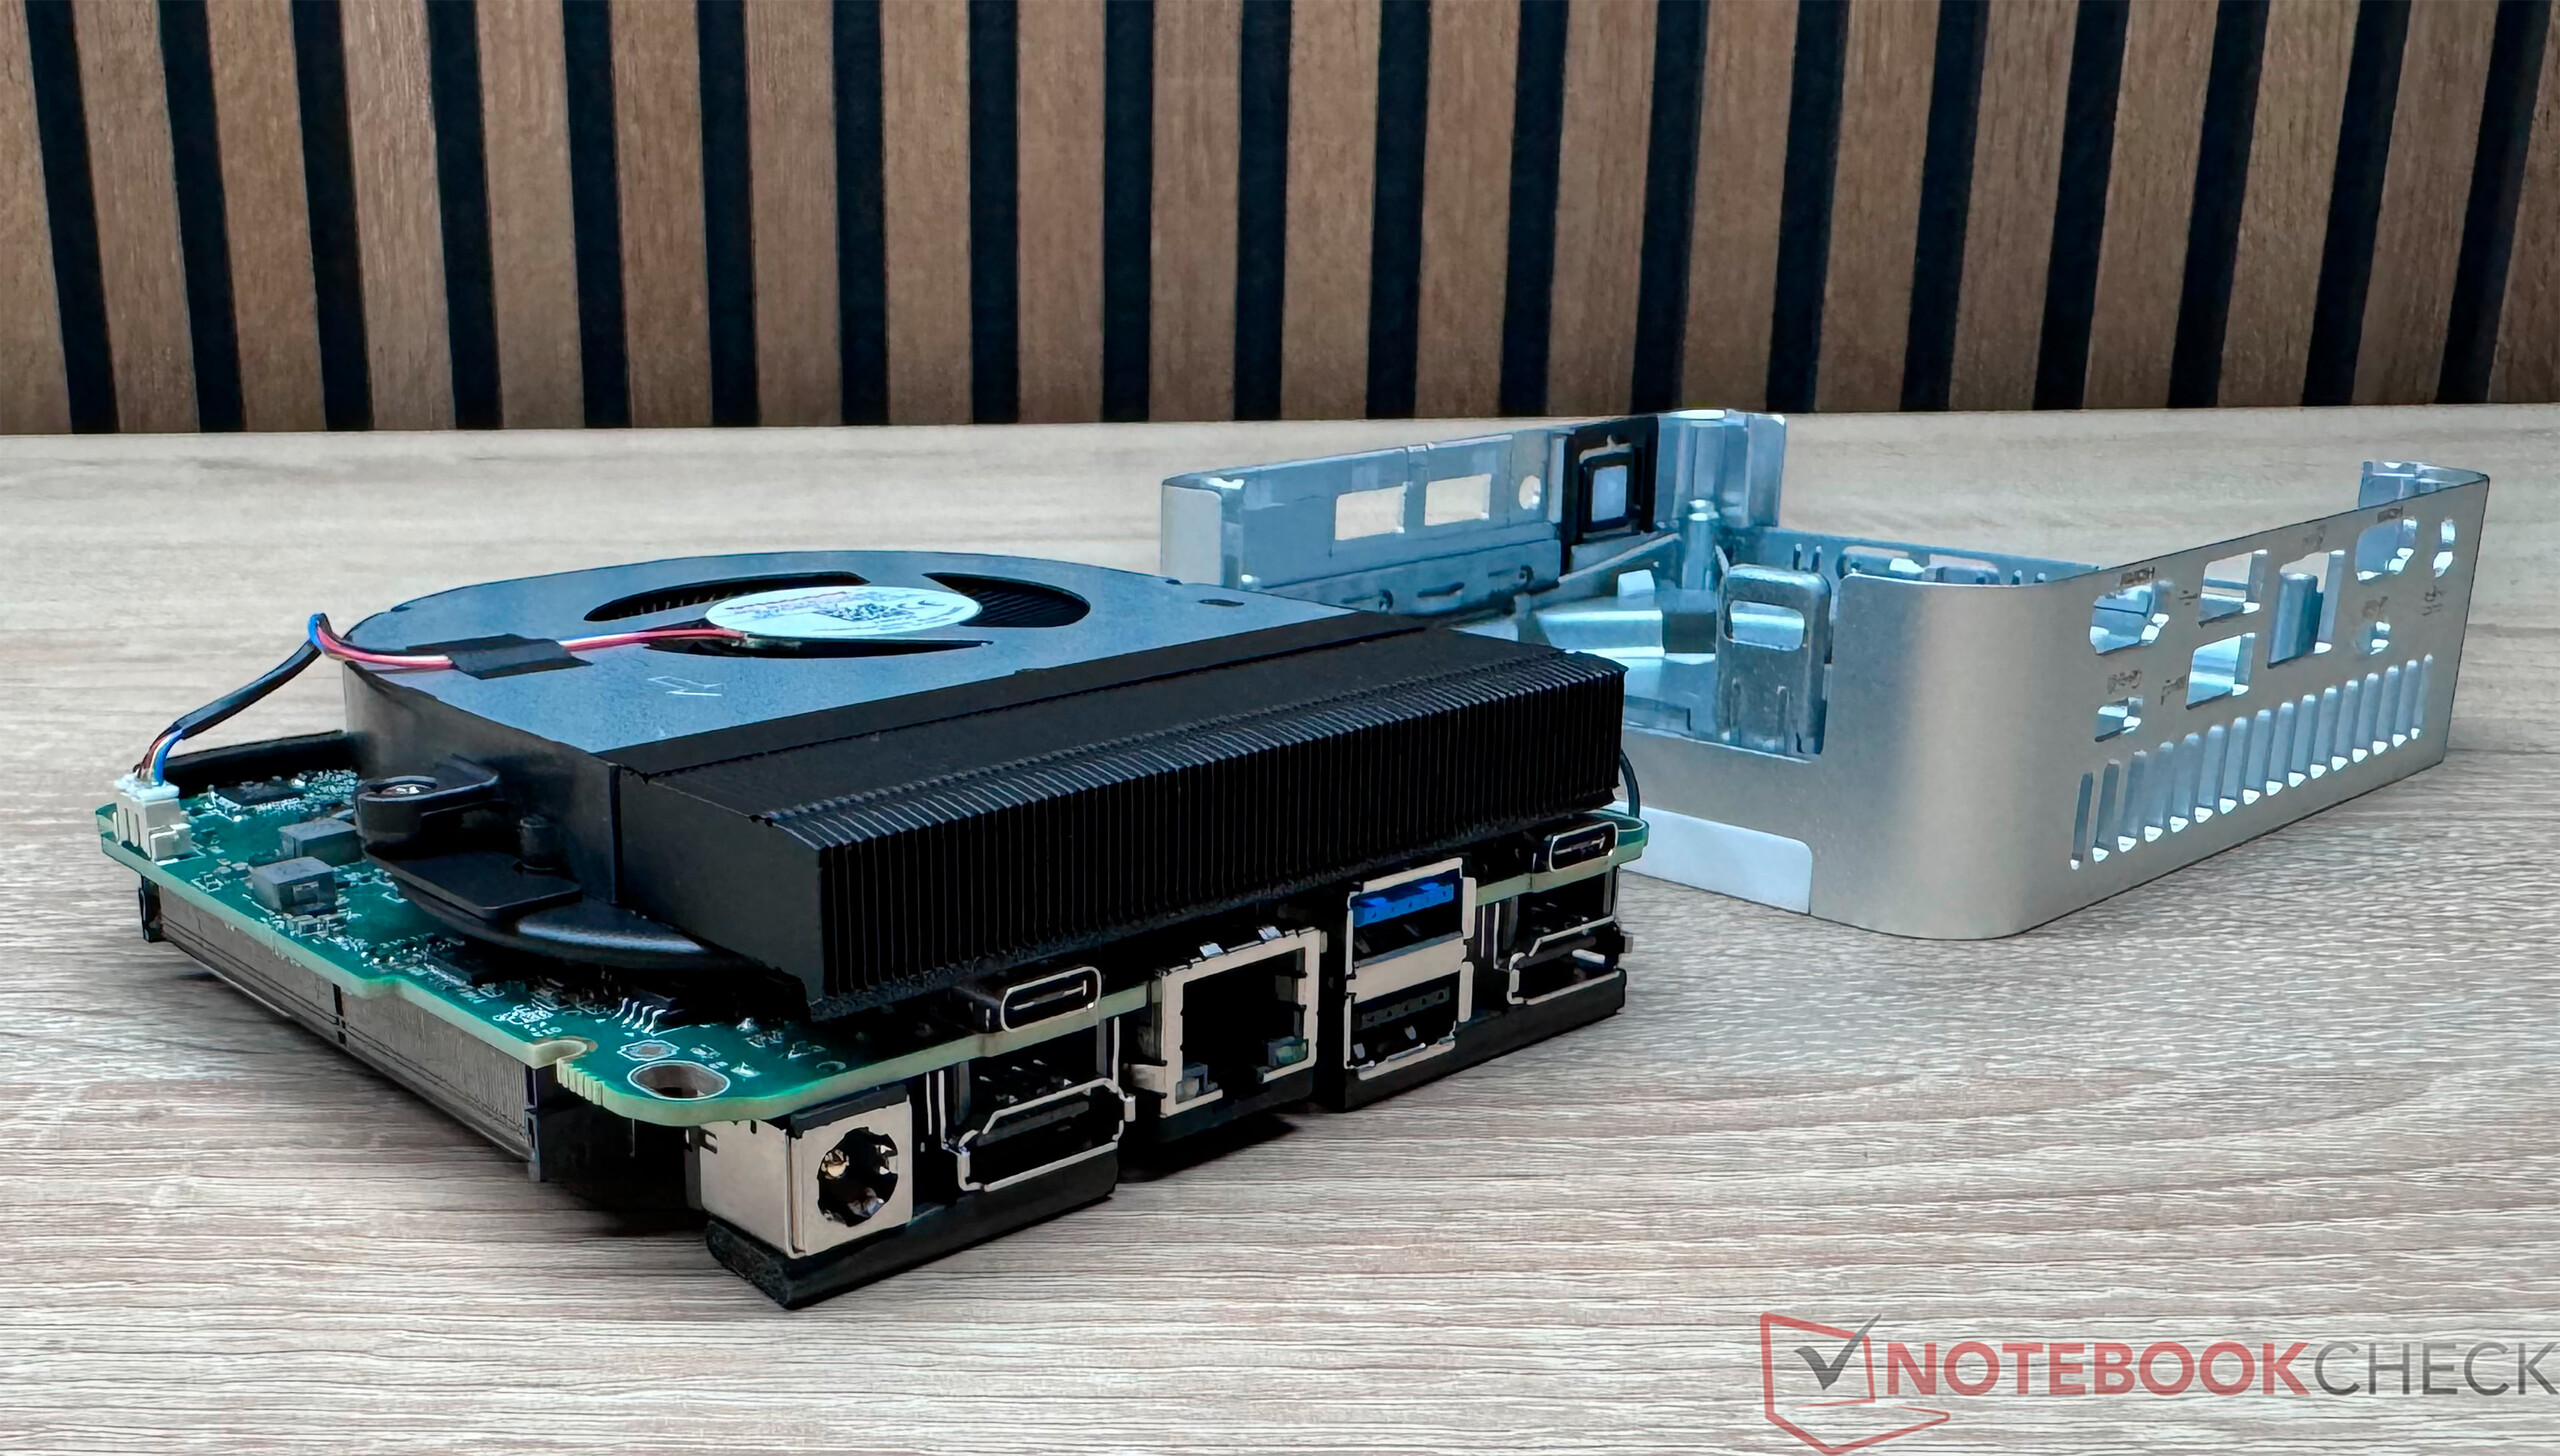
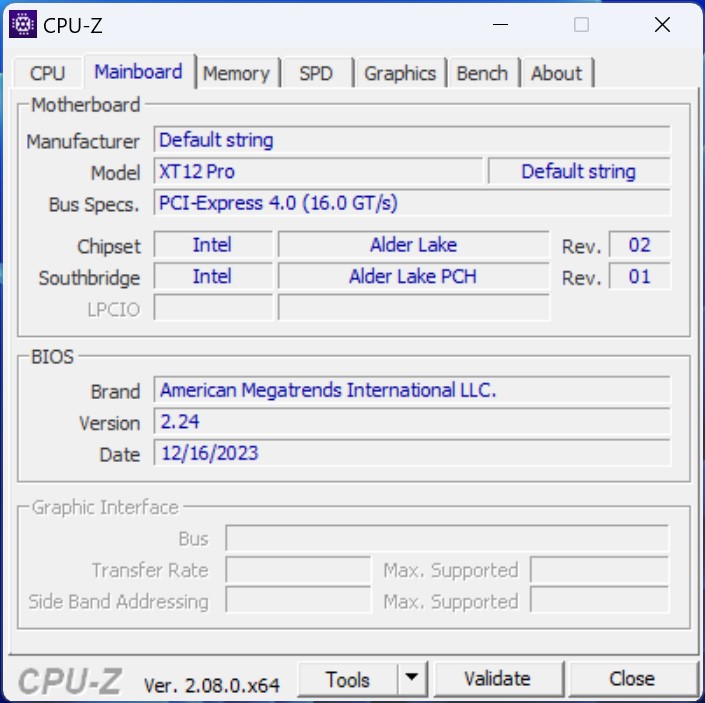
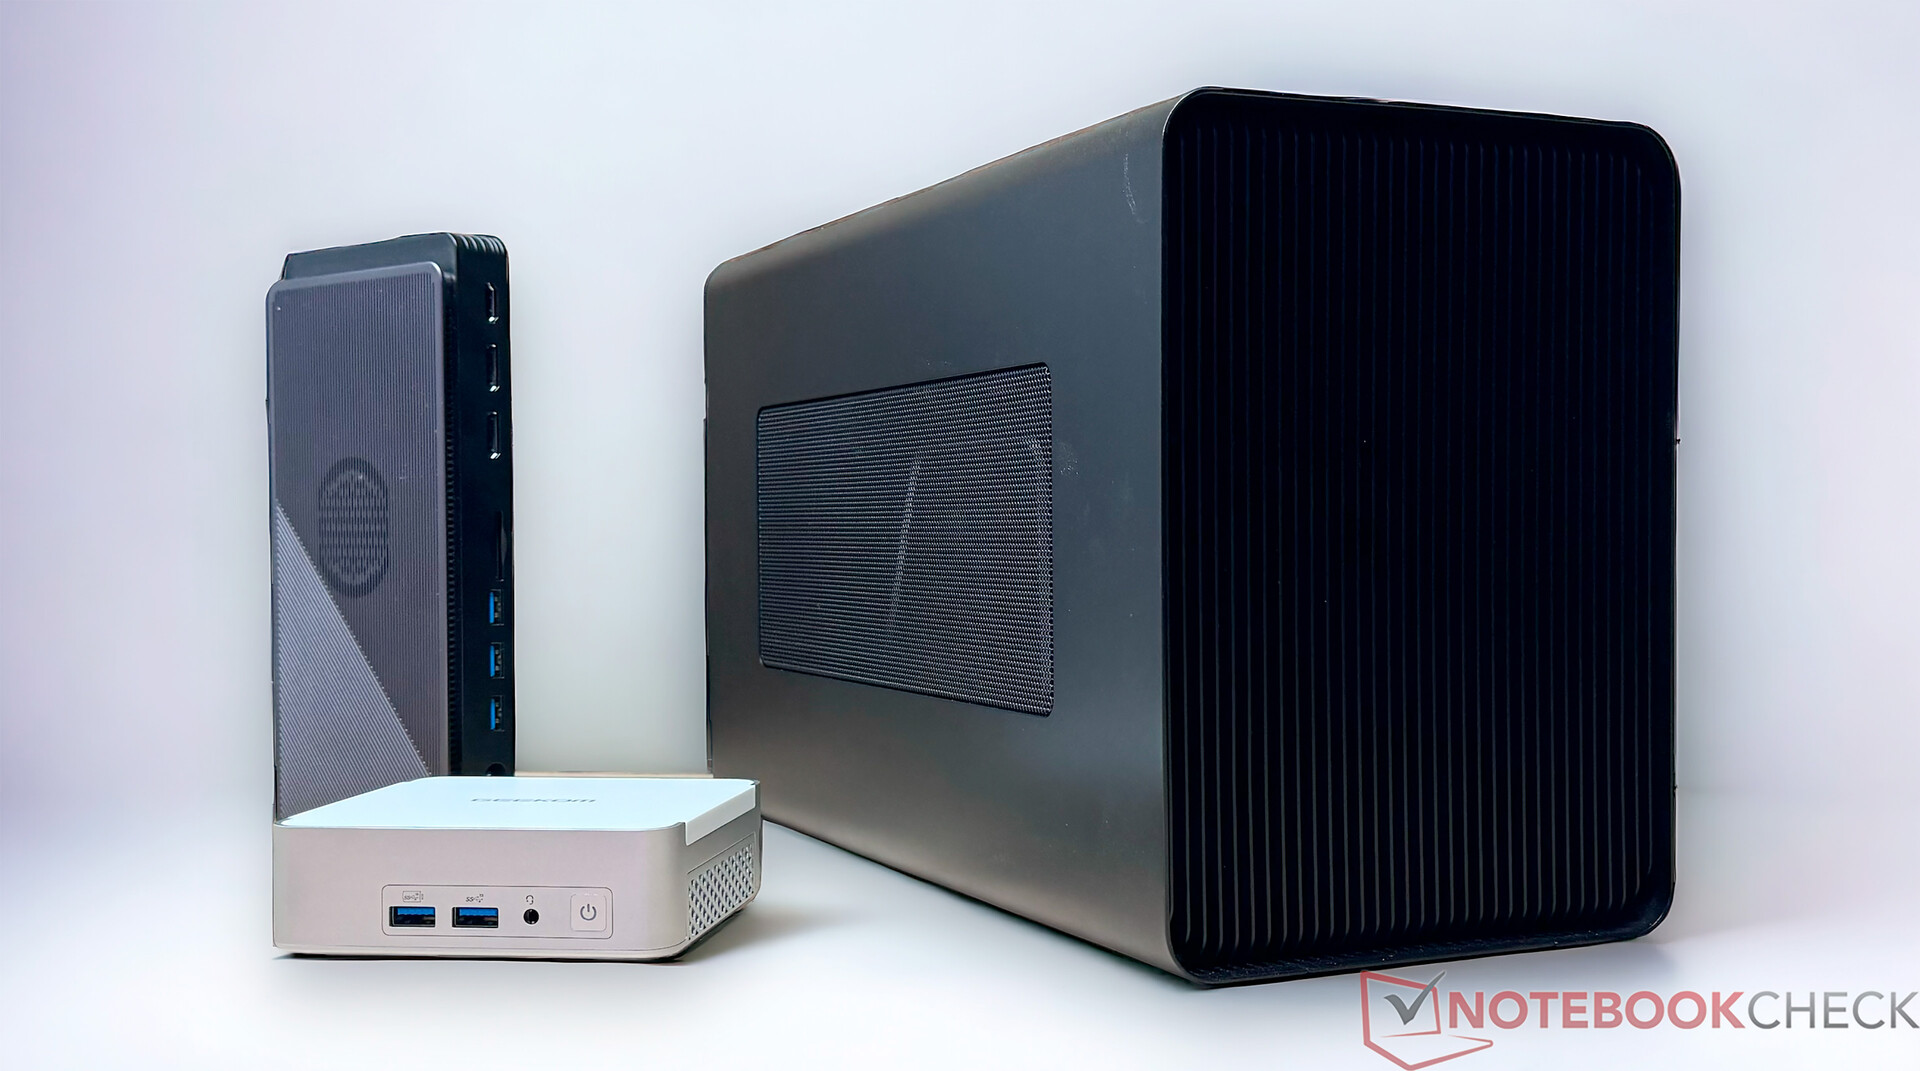
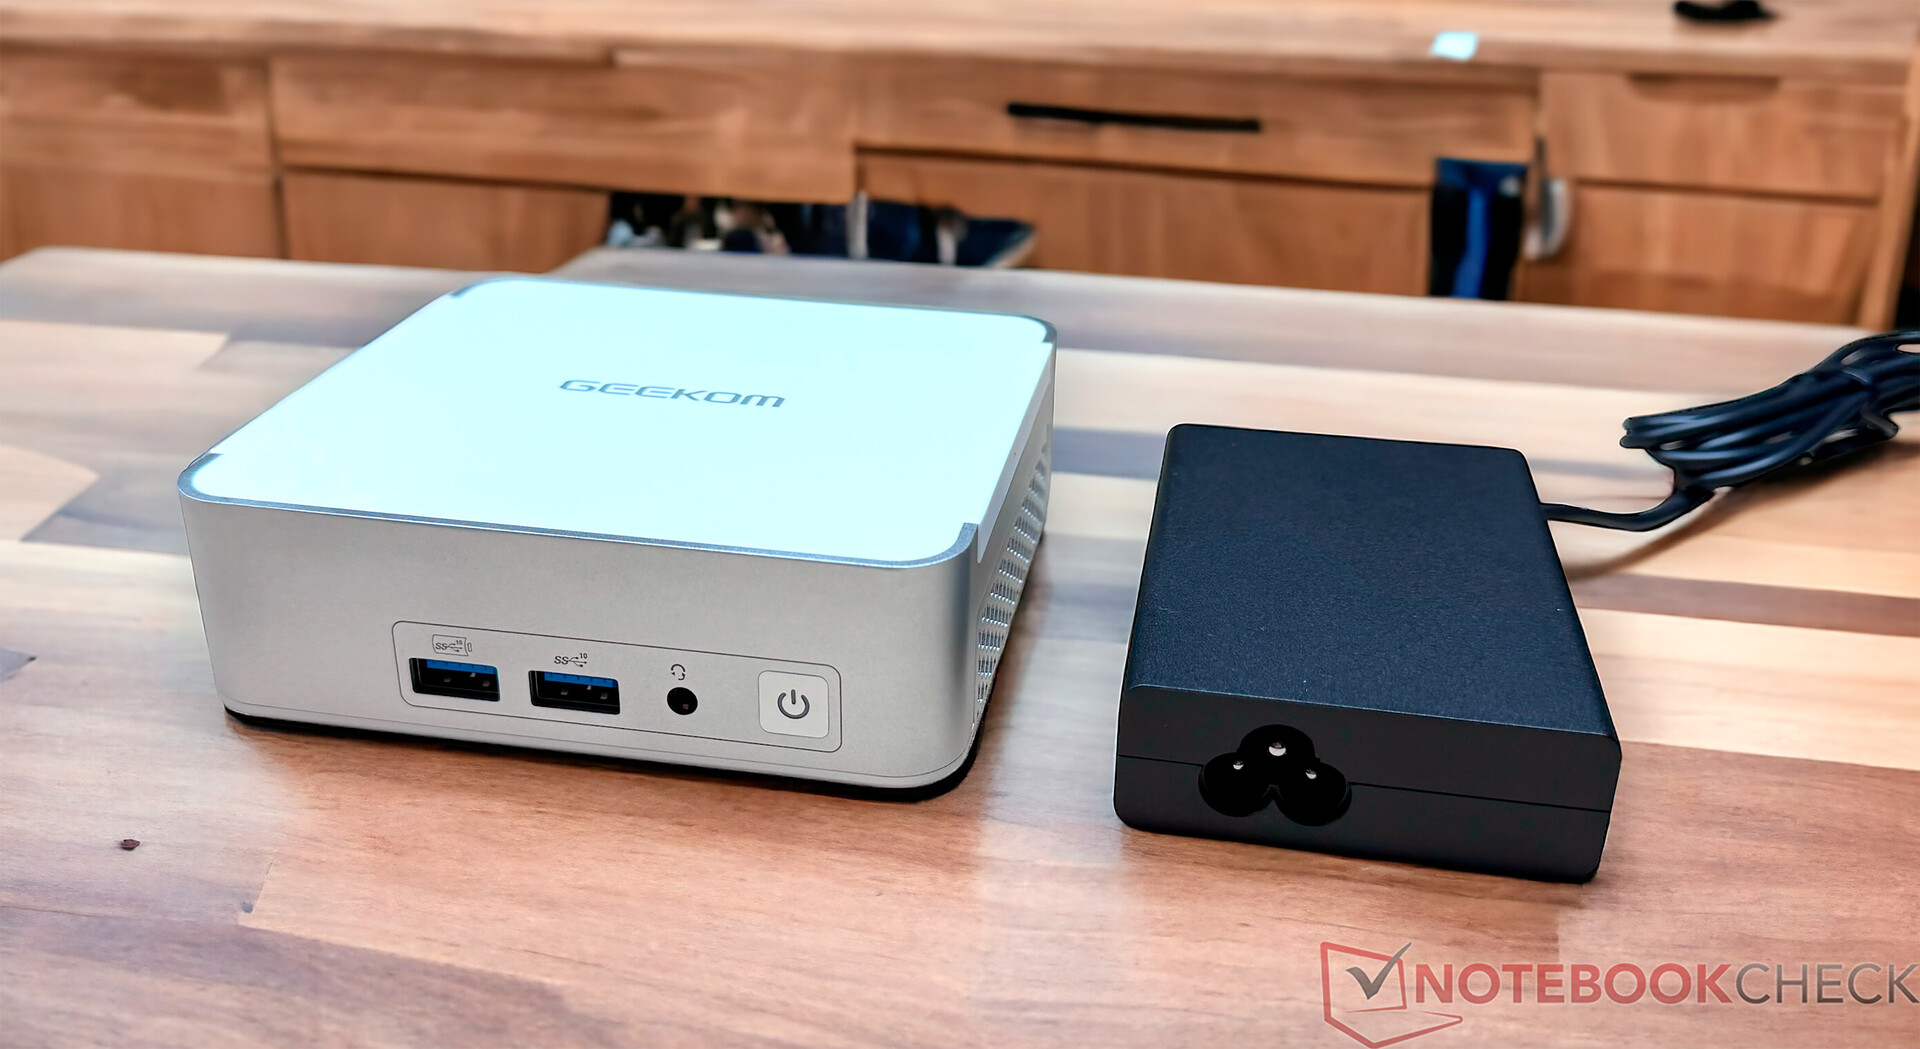
Geekom XT12 Pro 非常小巧,在极小的空间内集成了大量技术。XT12 Pro 放在桌面上仅需 11.7 x 11.2 厘米。XT12 Pro 的材料选用了金属和塑料。盖子使用了塑料,但稳定性并没有因此受到影响。不过,Geekom A7 还是显得更高档一些。金属外壳做工精良,可以从底部打开。Geekom 还用它为大容量存储设备散热。在颜色方面,Geekom XT12 Pro 只有银色和白色两种。制造商不能否认它与 英特尔 NUC 13 Pro 桌面版套件.Geekom 声称,尽管这两款设备看起来几乎一模一样,但它们实际上采用的是内部设计。
Geekom XT12 可以通过附带的 VESA 支架安装到显示器上。
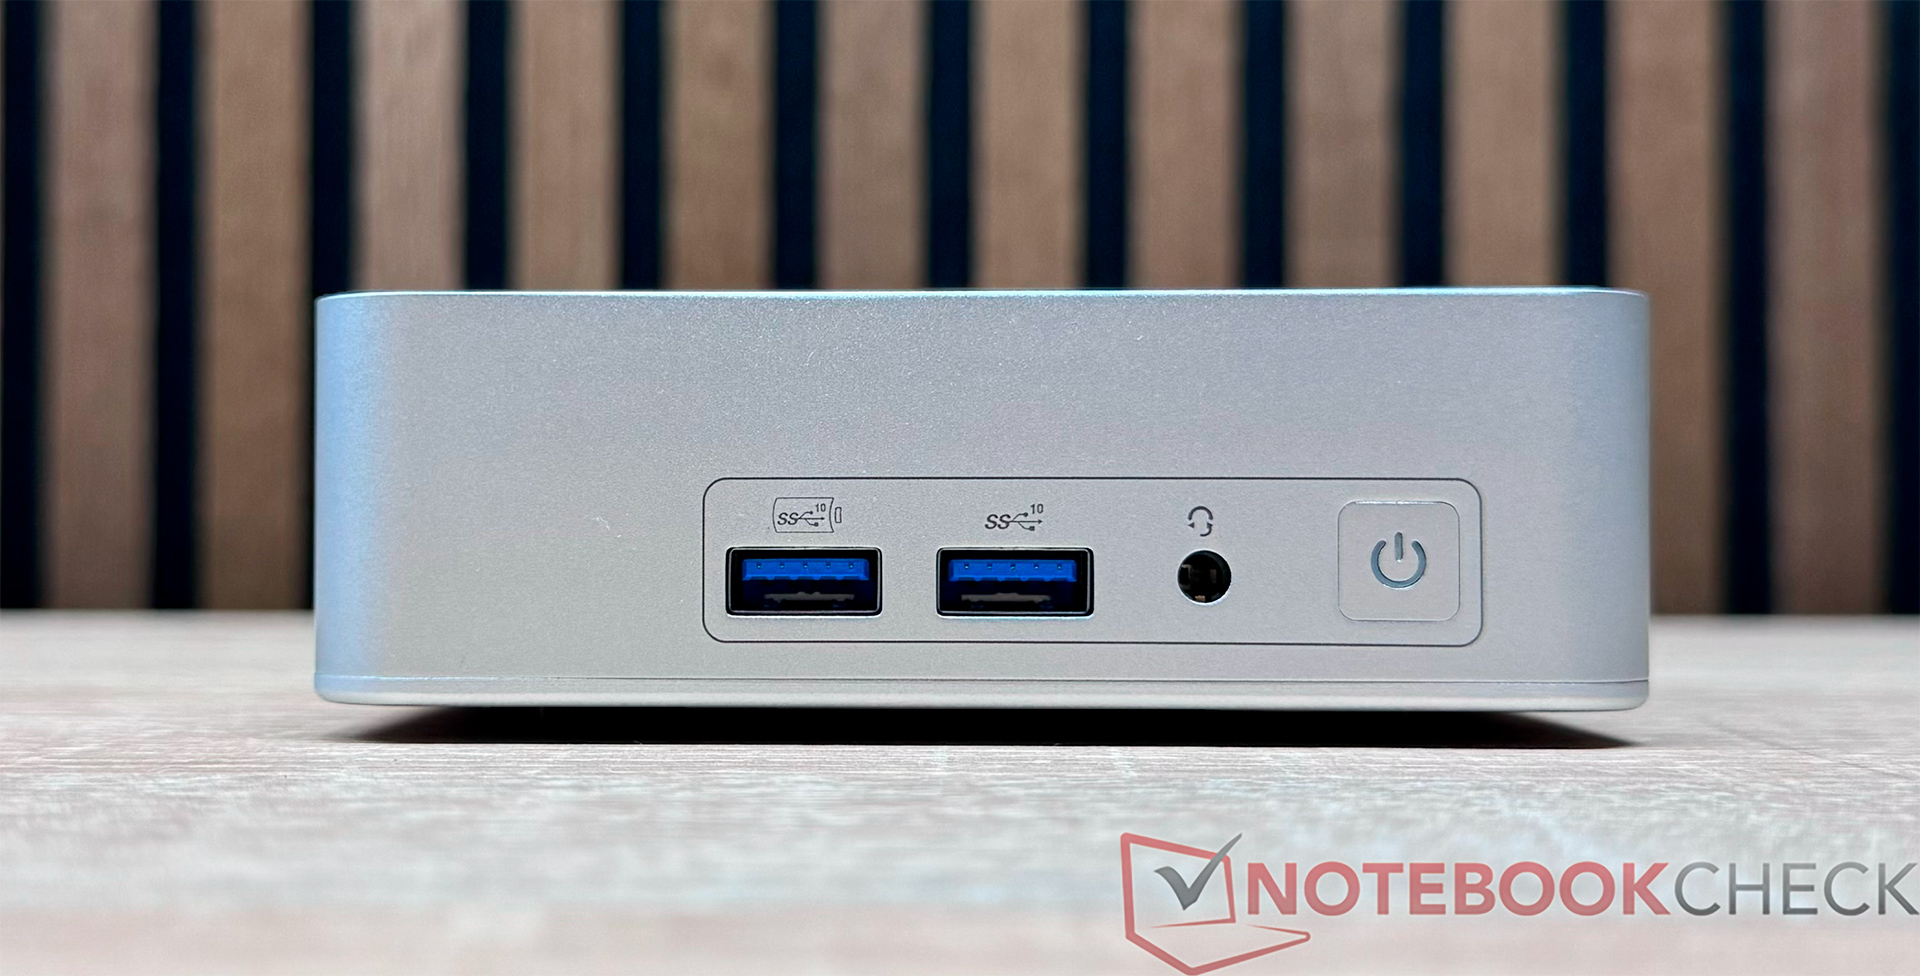
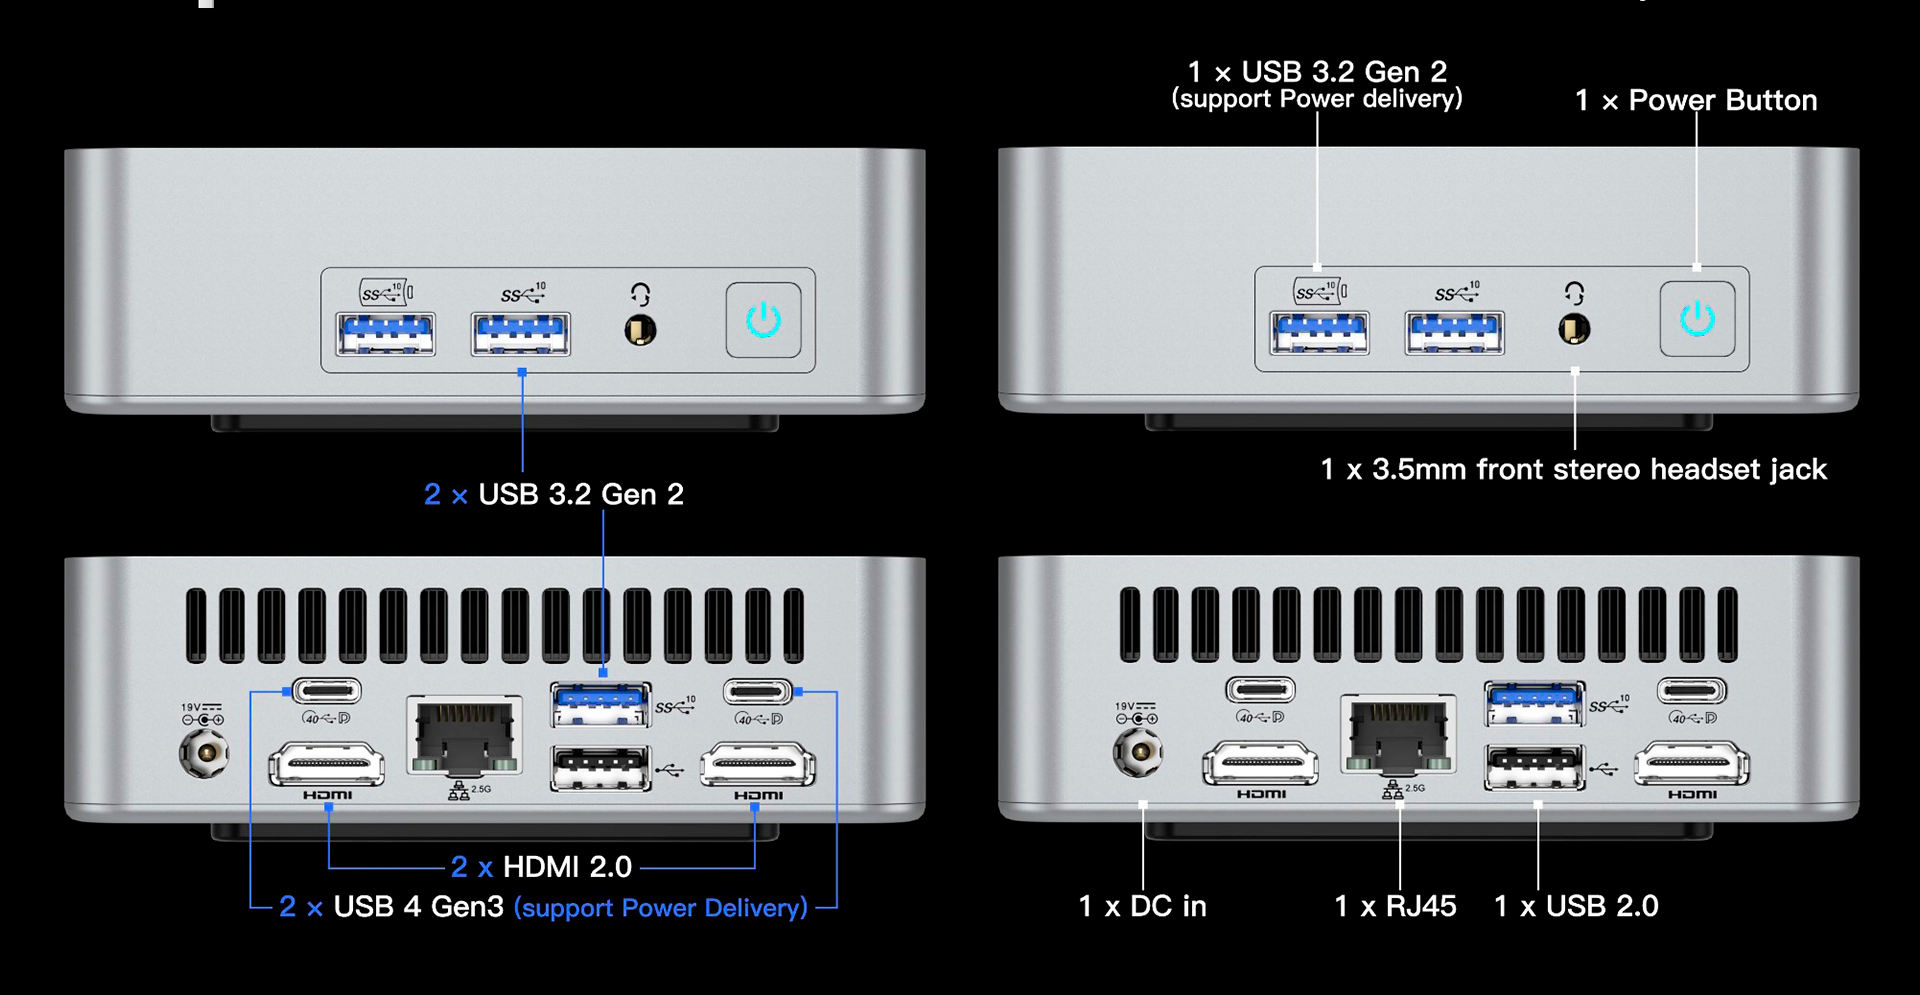
连接性 - 多种选择和 2x USB4
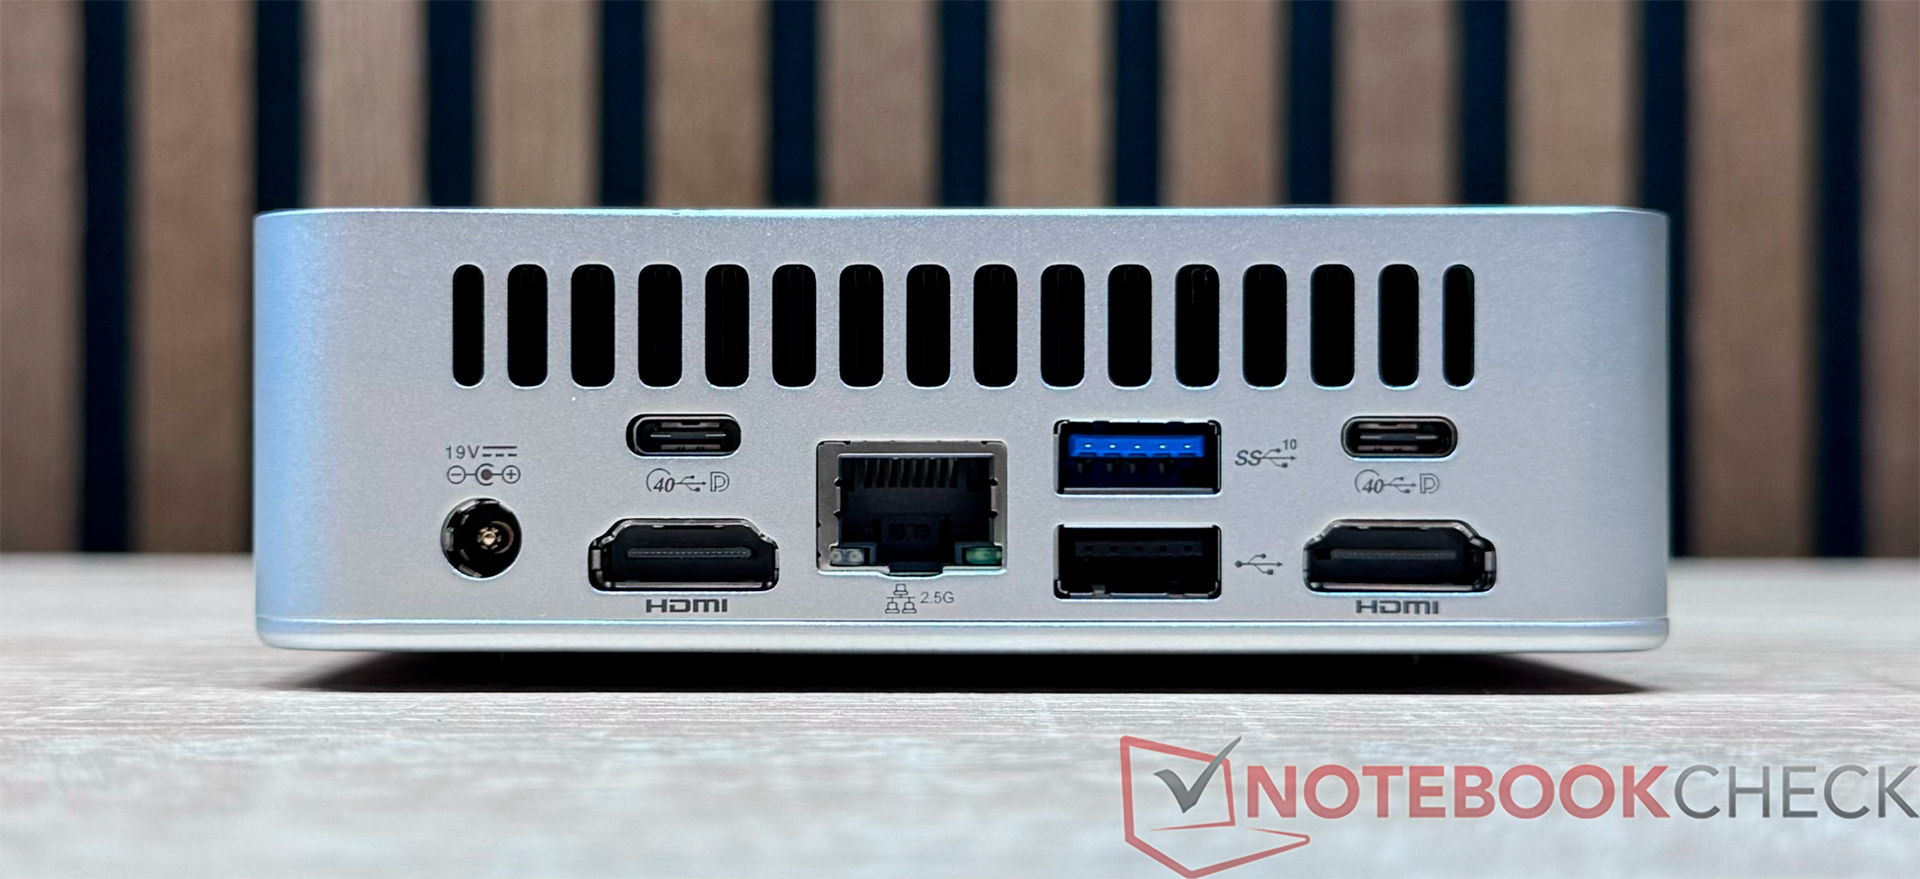
Geekom 为 XT12 Pro 提供了许多有用的外部接口。这些接口分布在前部和后部。四个 USB-A 接口和两个 UBS-C 接口绰绰有余,可以满足所有需求。Type-C 端口还支持 USB4,如果有合适的配件,几乎可以无限扩展 XT12 Pro 的用途。不仅可以通过 HDMI 直接连接屏幕,还可以连接 USB4。这意味着该迷你电脑可同时与四个屏幕连接。此外,还可以进行网络连接。
交流
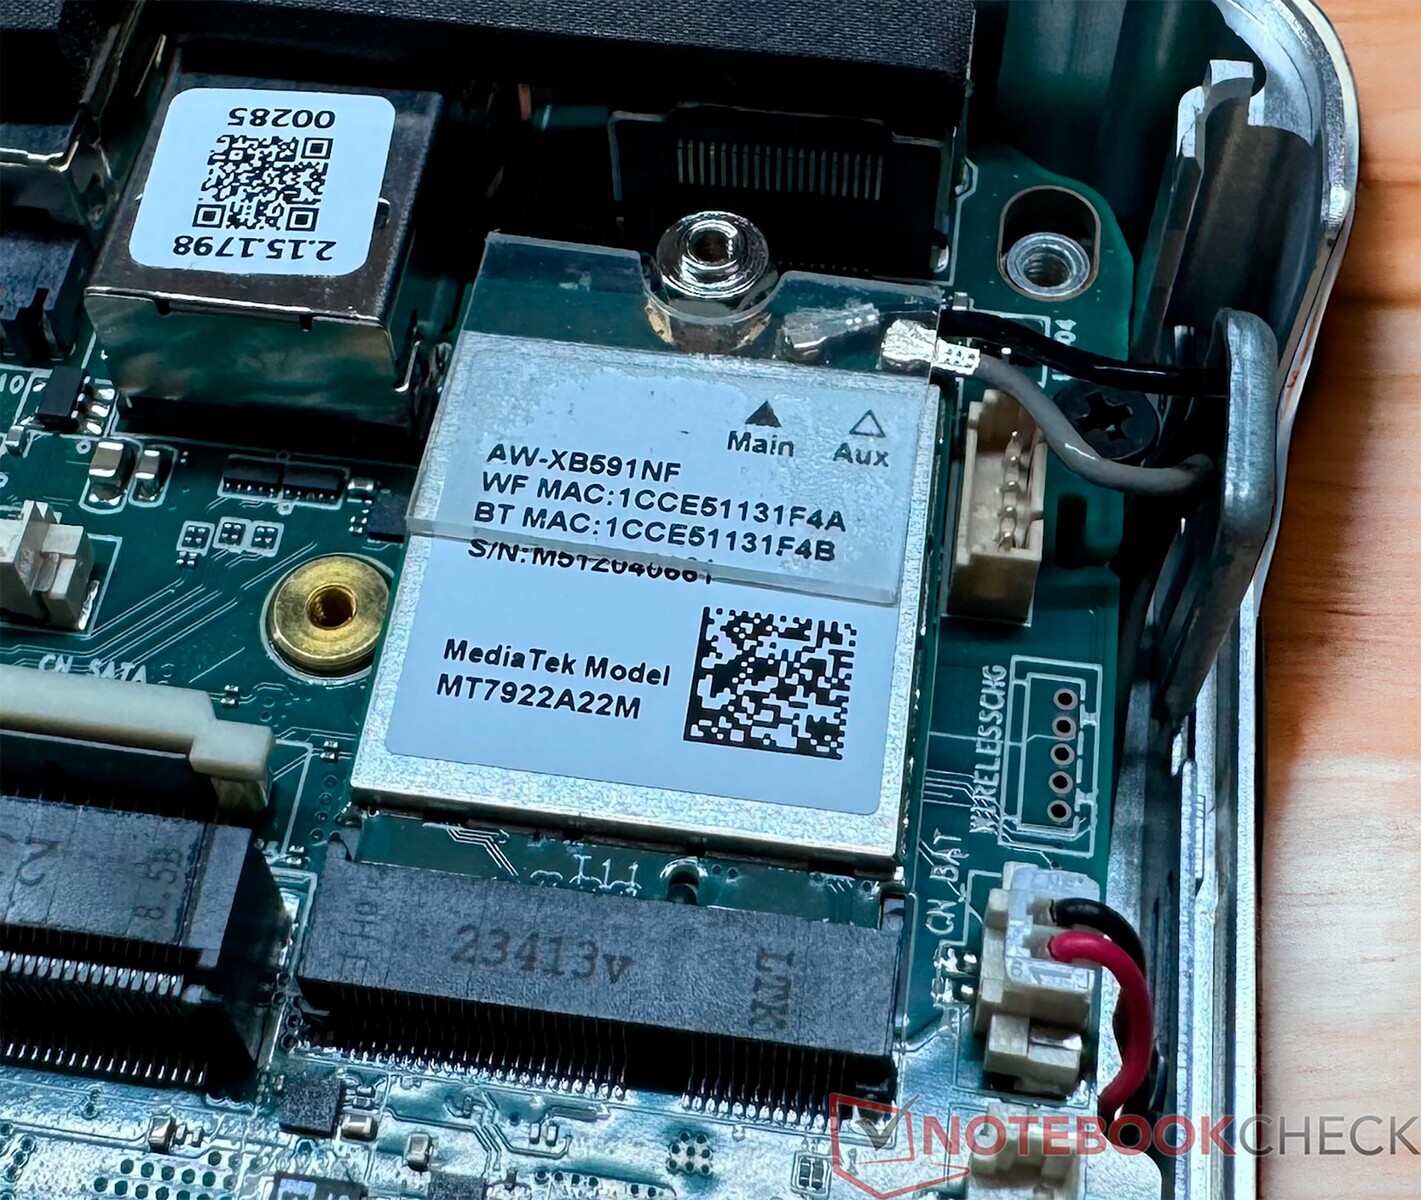
Geekom XT12 Pro 采用与 Geekom A7 相同的无线模块。联发科 Wi-Fi 6E MT7922 无线局域网模块虽然不能达到最佳数值,但足以满足正常使用中的数据传输。如果可能,应主要使用 6 GHz 频率范围。在传输大量数据时,与稍慢的 5 GHz 频率范围相比,性能上的差异已经非常明显。此外,Geekom XT12 Pro 还可以处理有线网络连接。数据传输速率最高可达 2.5 GBit/s。
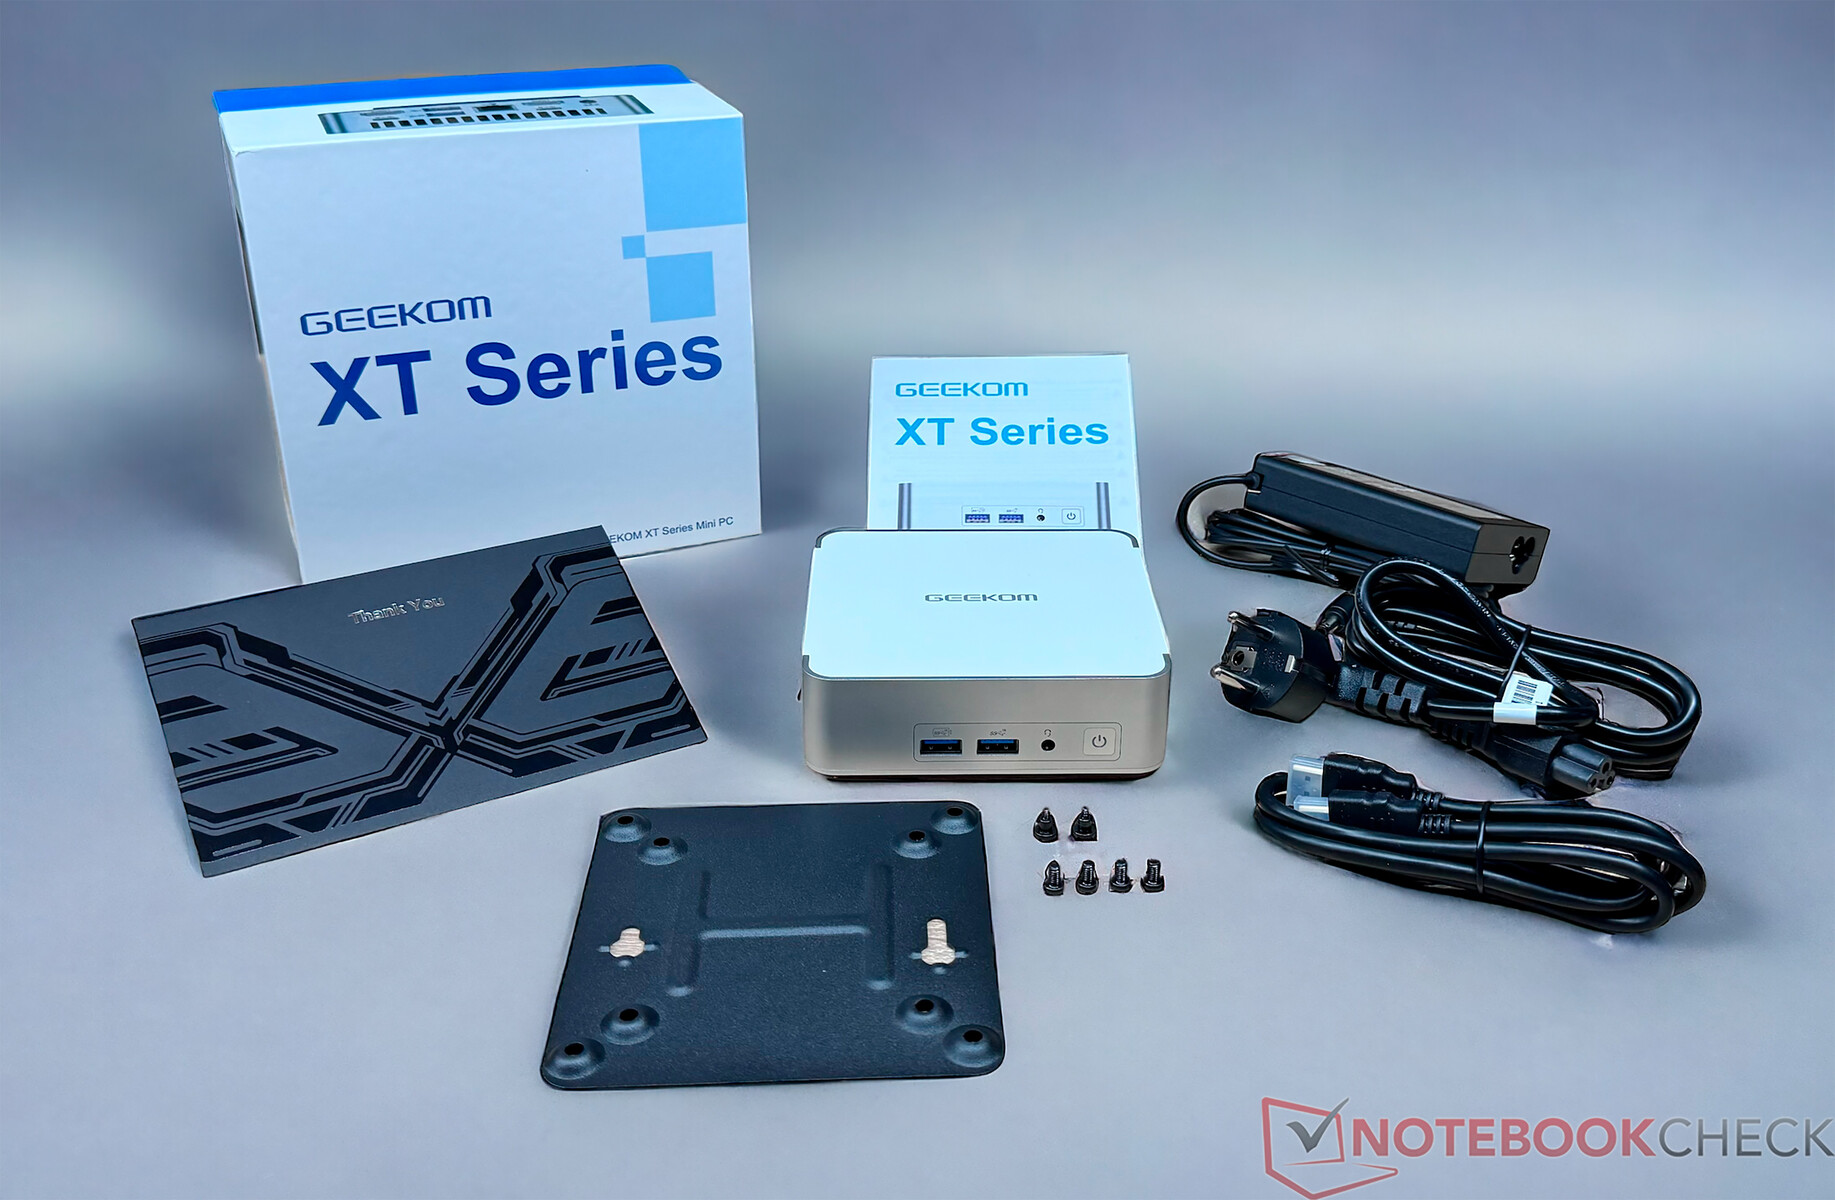
配件
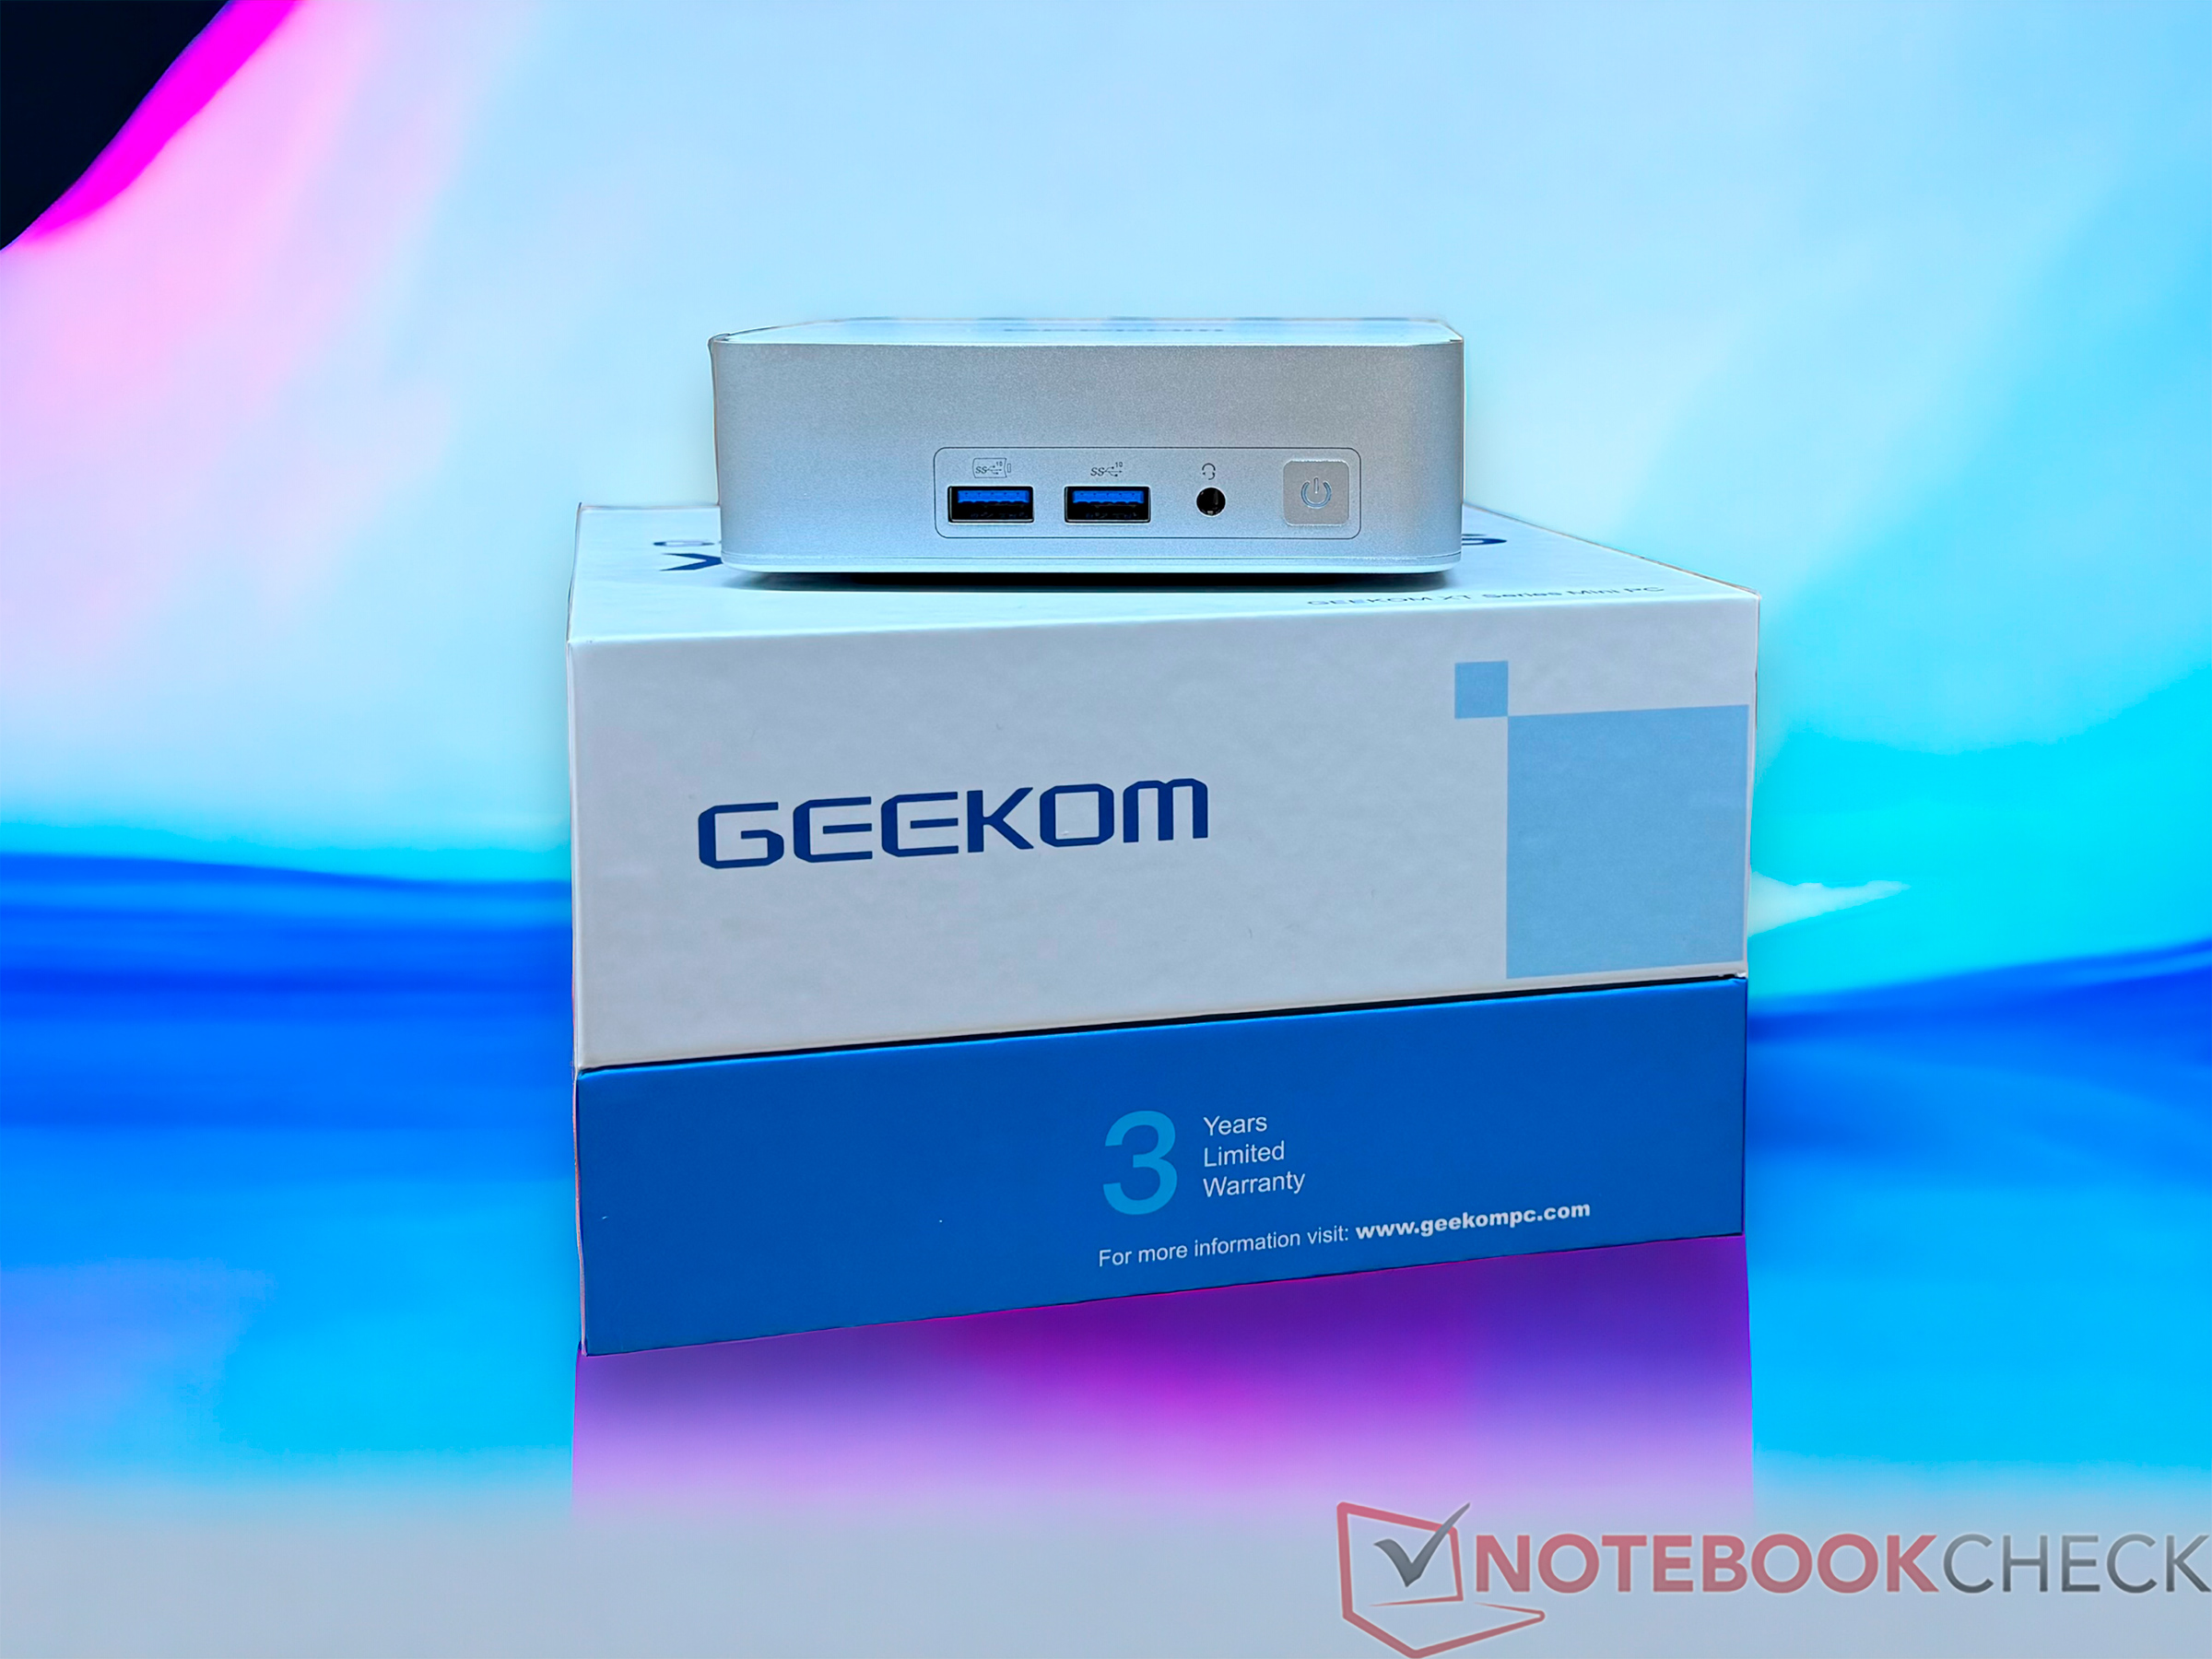
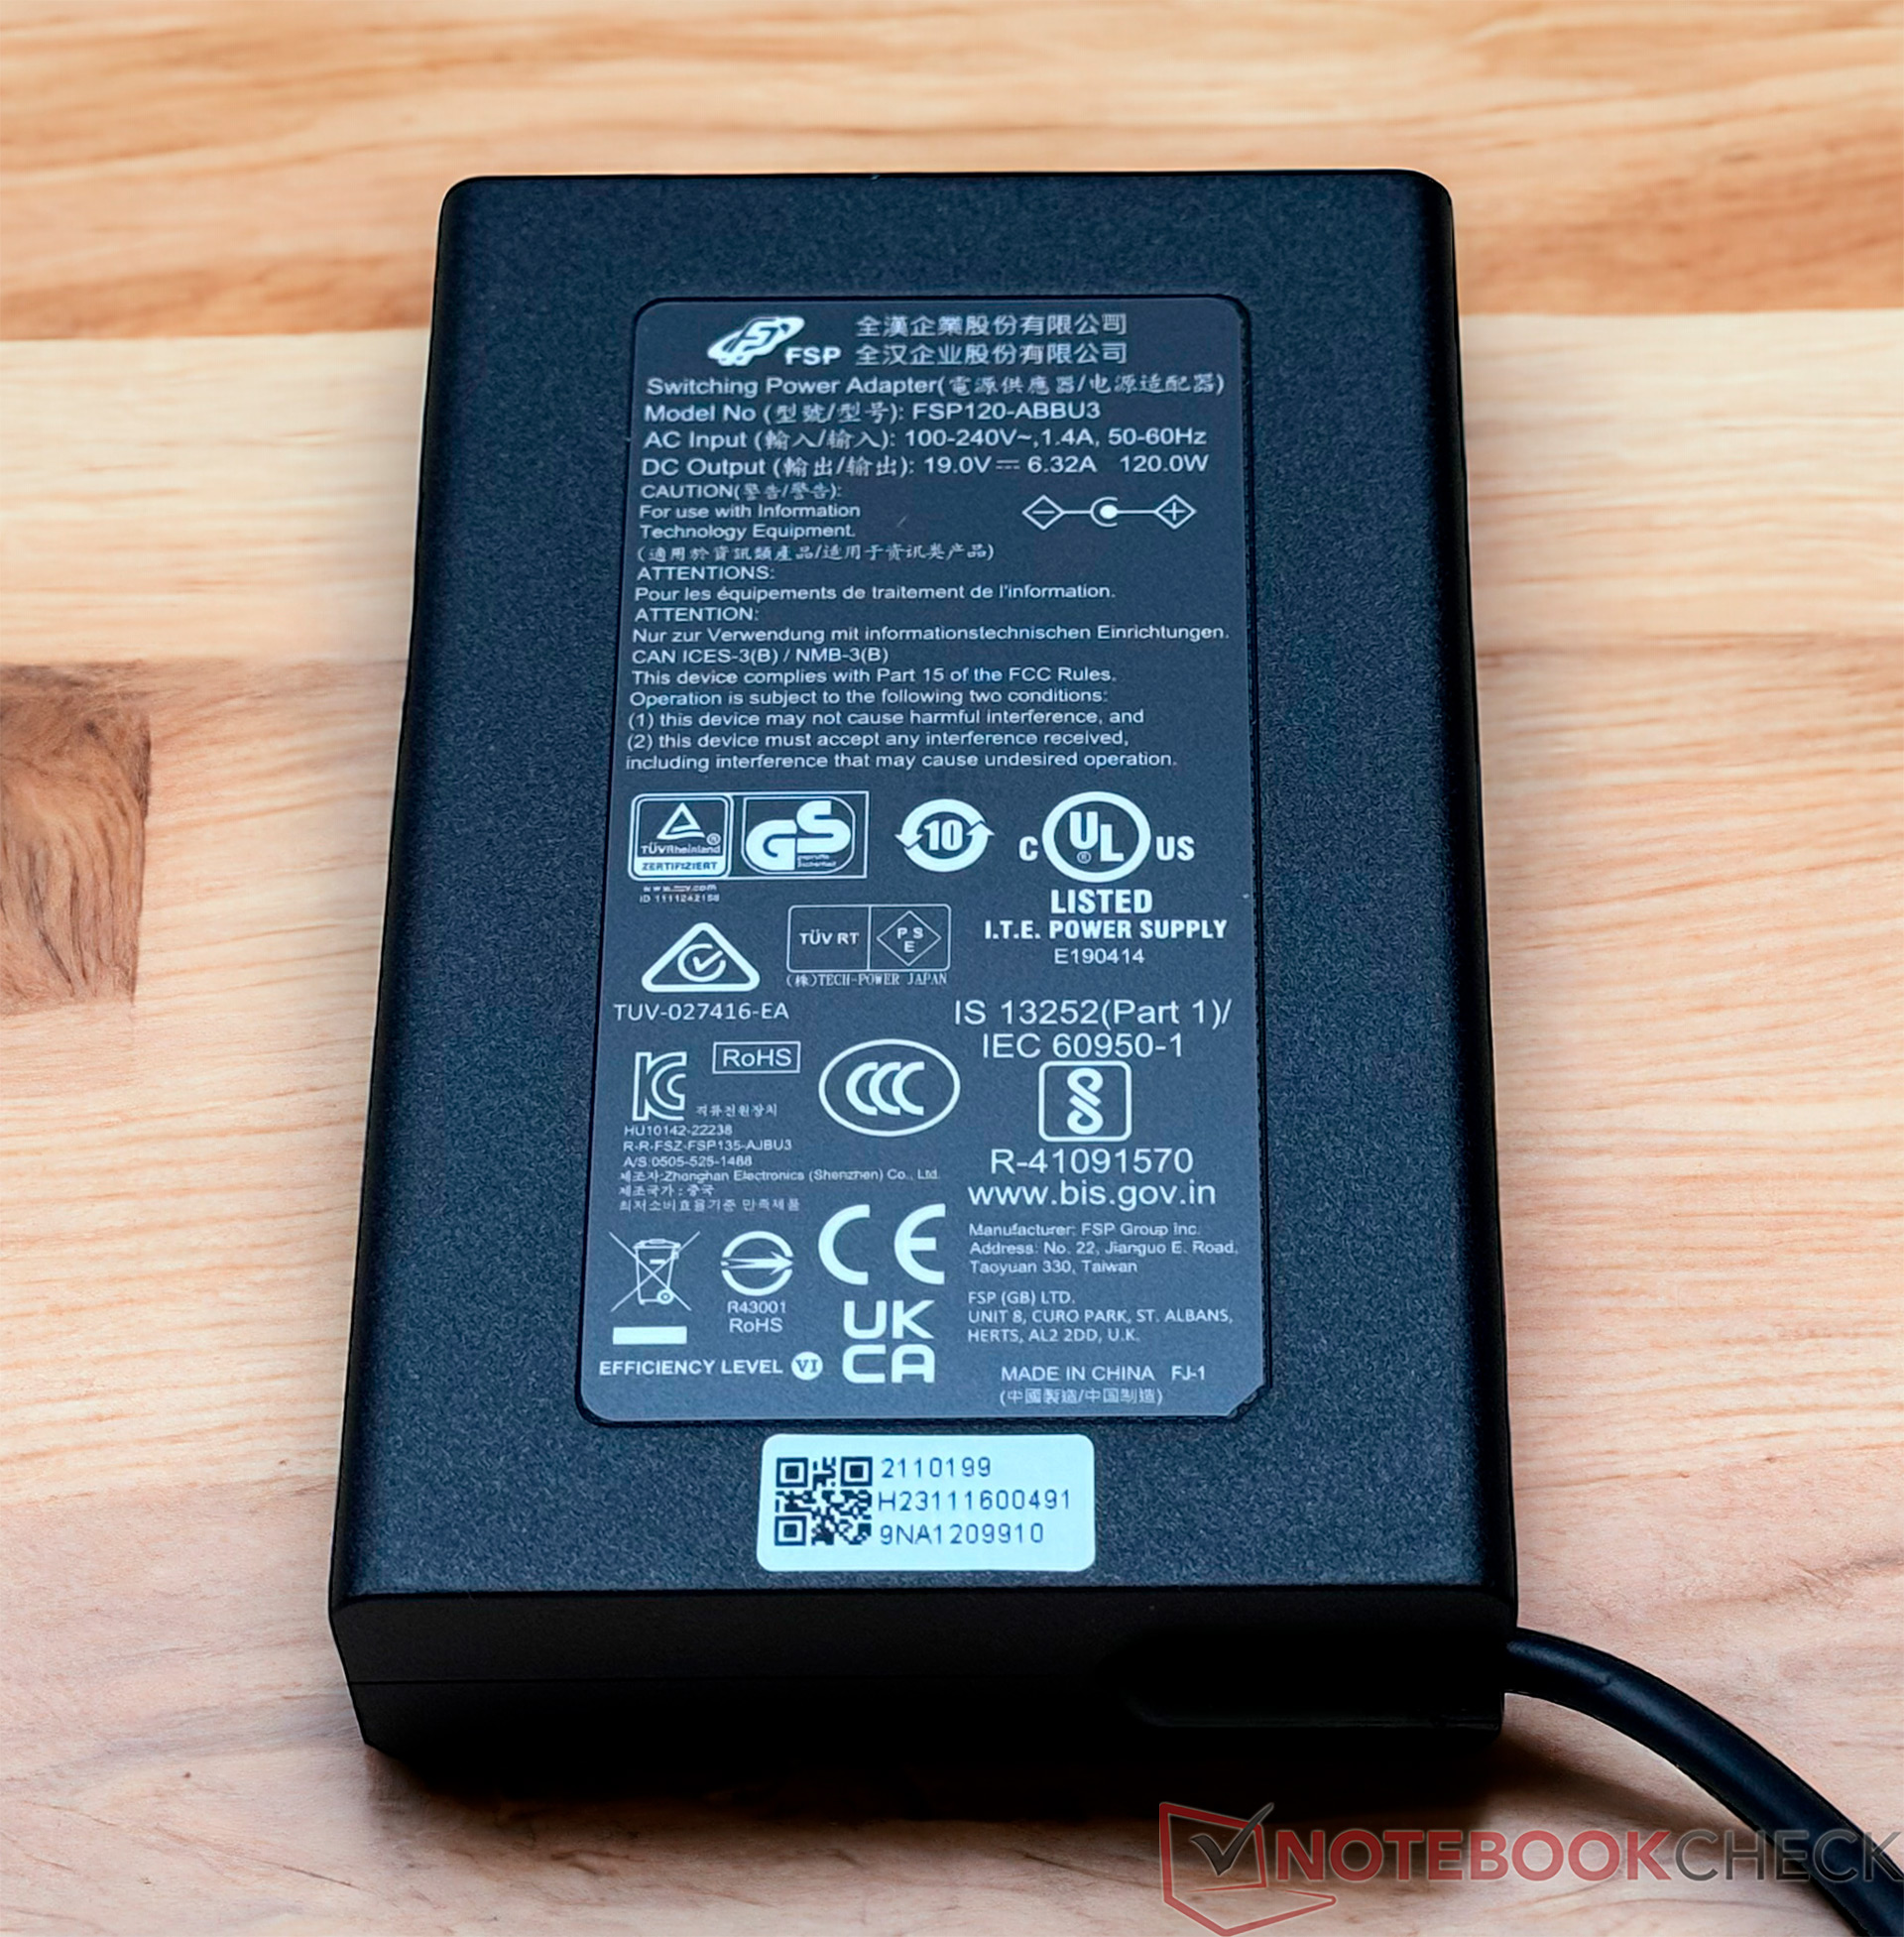
Geekom XT12 Pro 配备了所需的一切。除了 120 瓦的电源装置外,包装盒内还有一个 VESA 支架。此外,还附带了 HDMI 连接线和 Geekom 必备的感谢卡。
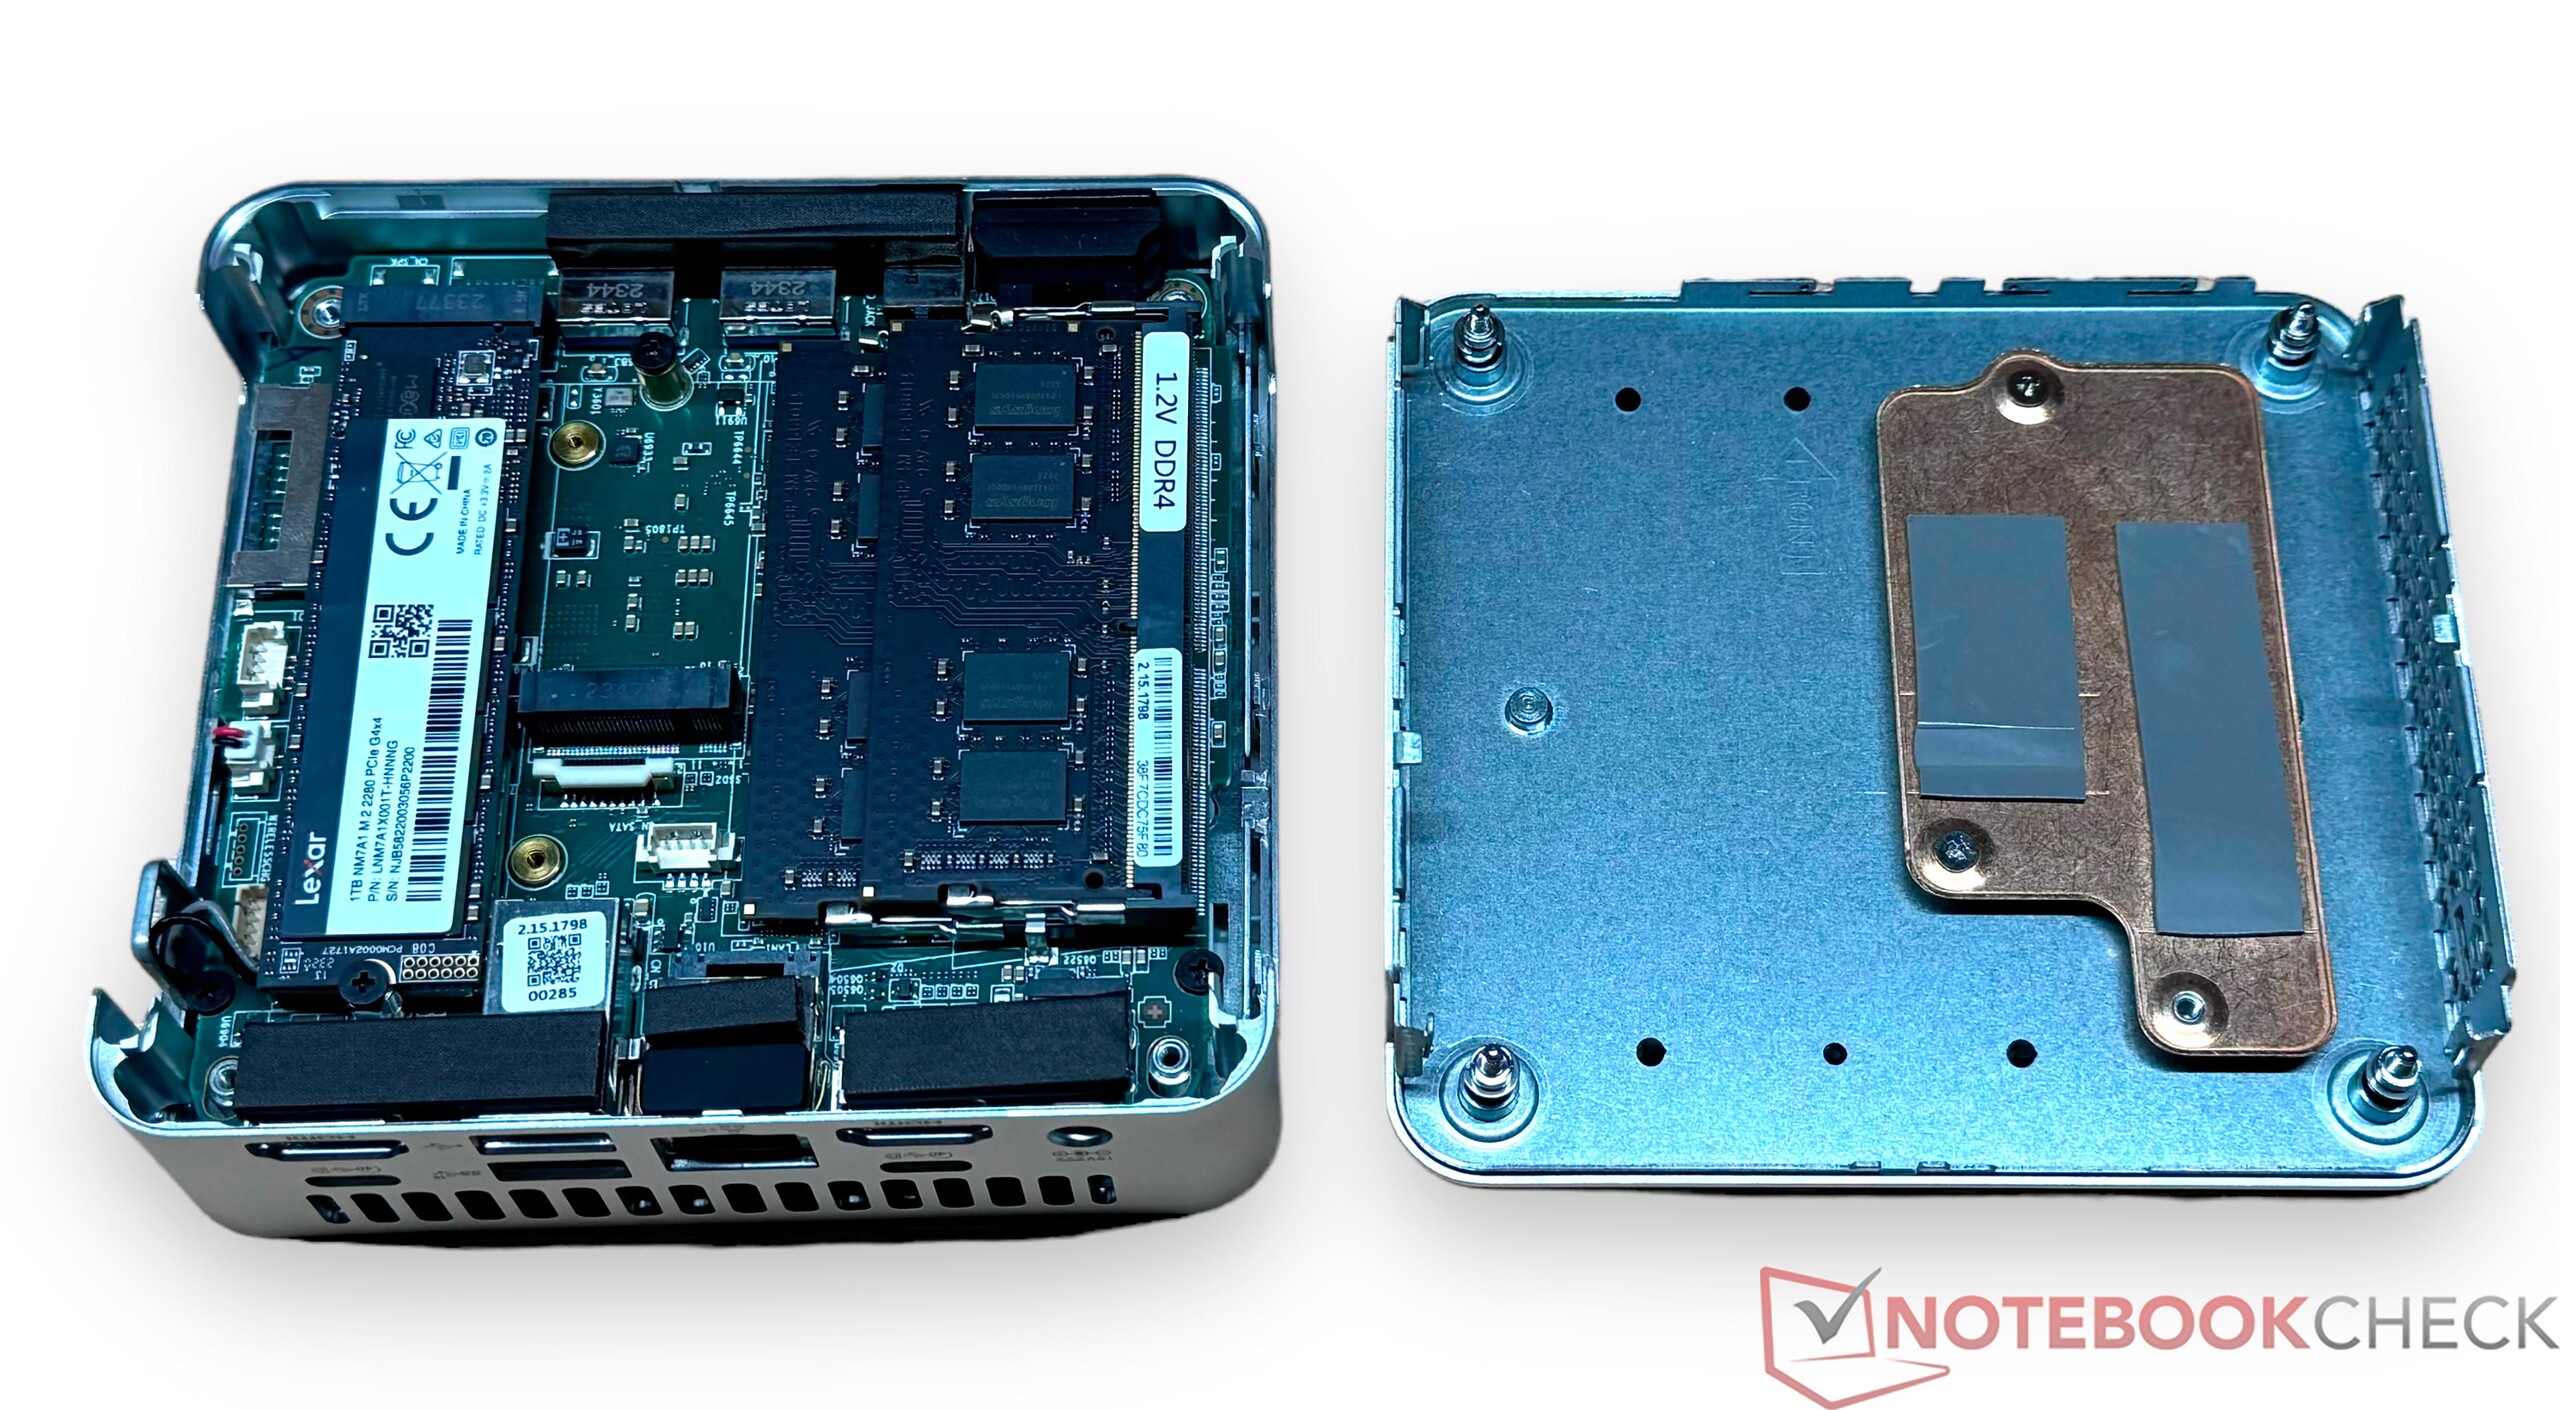
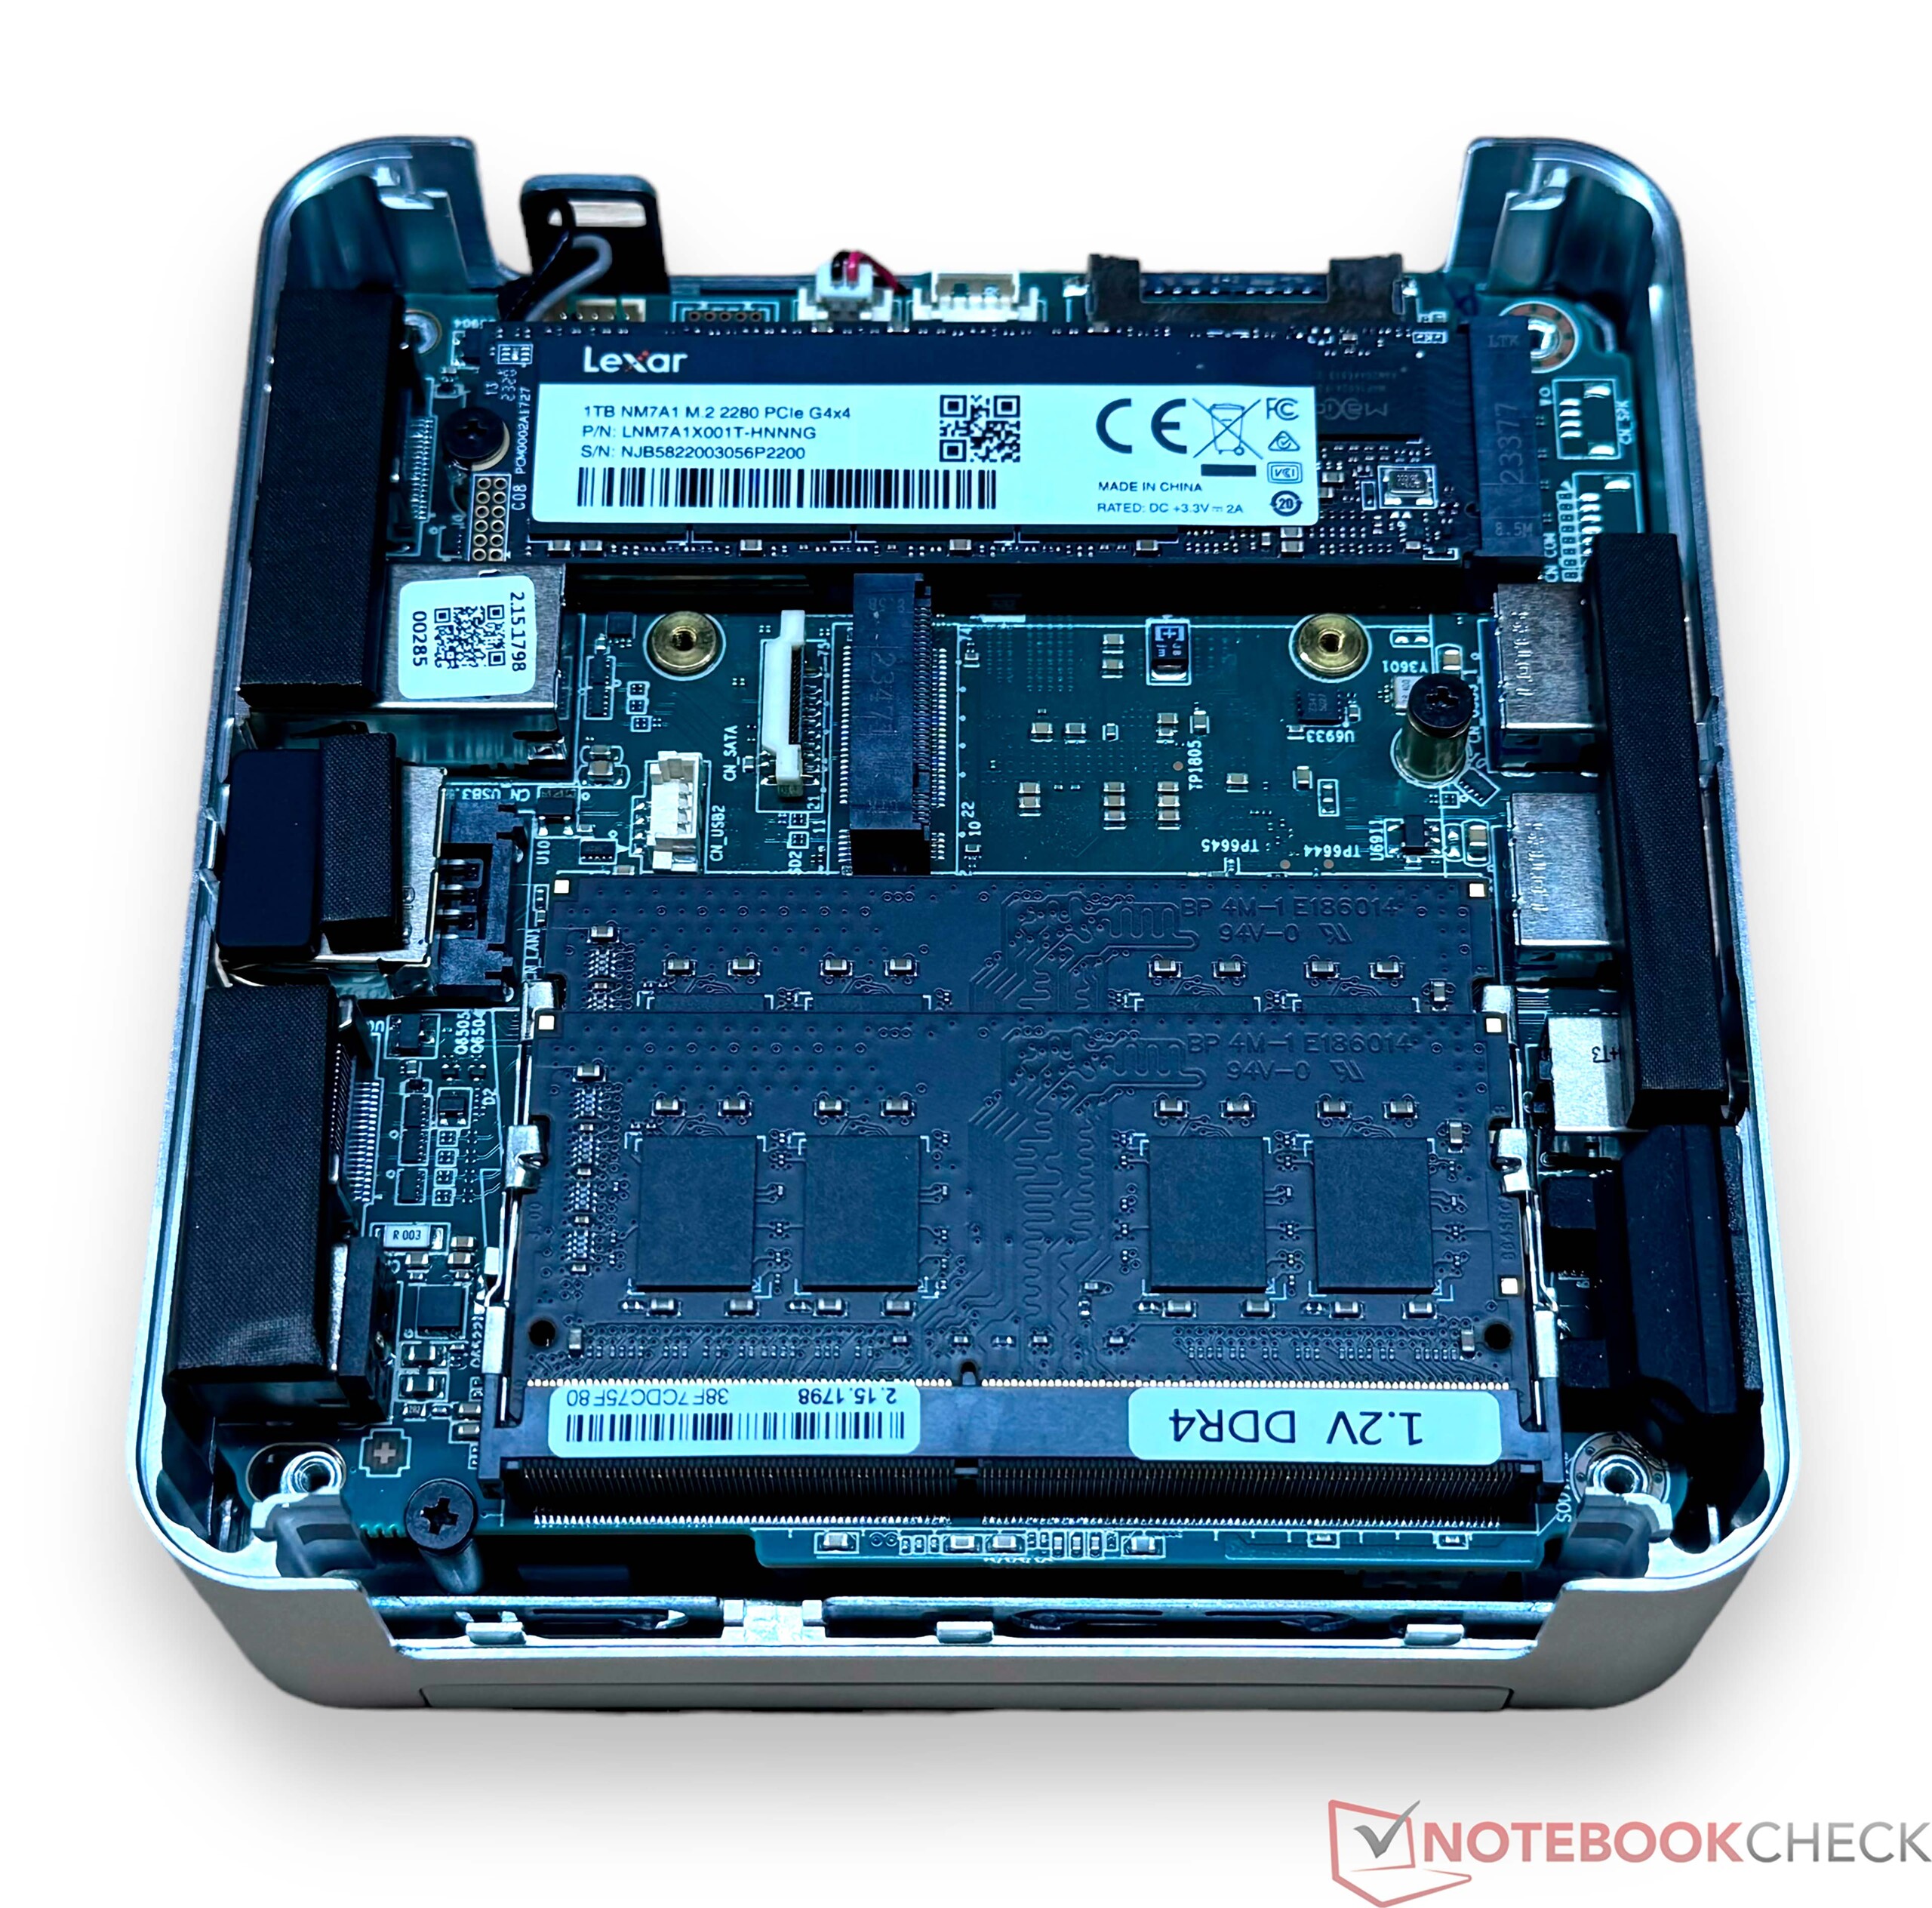
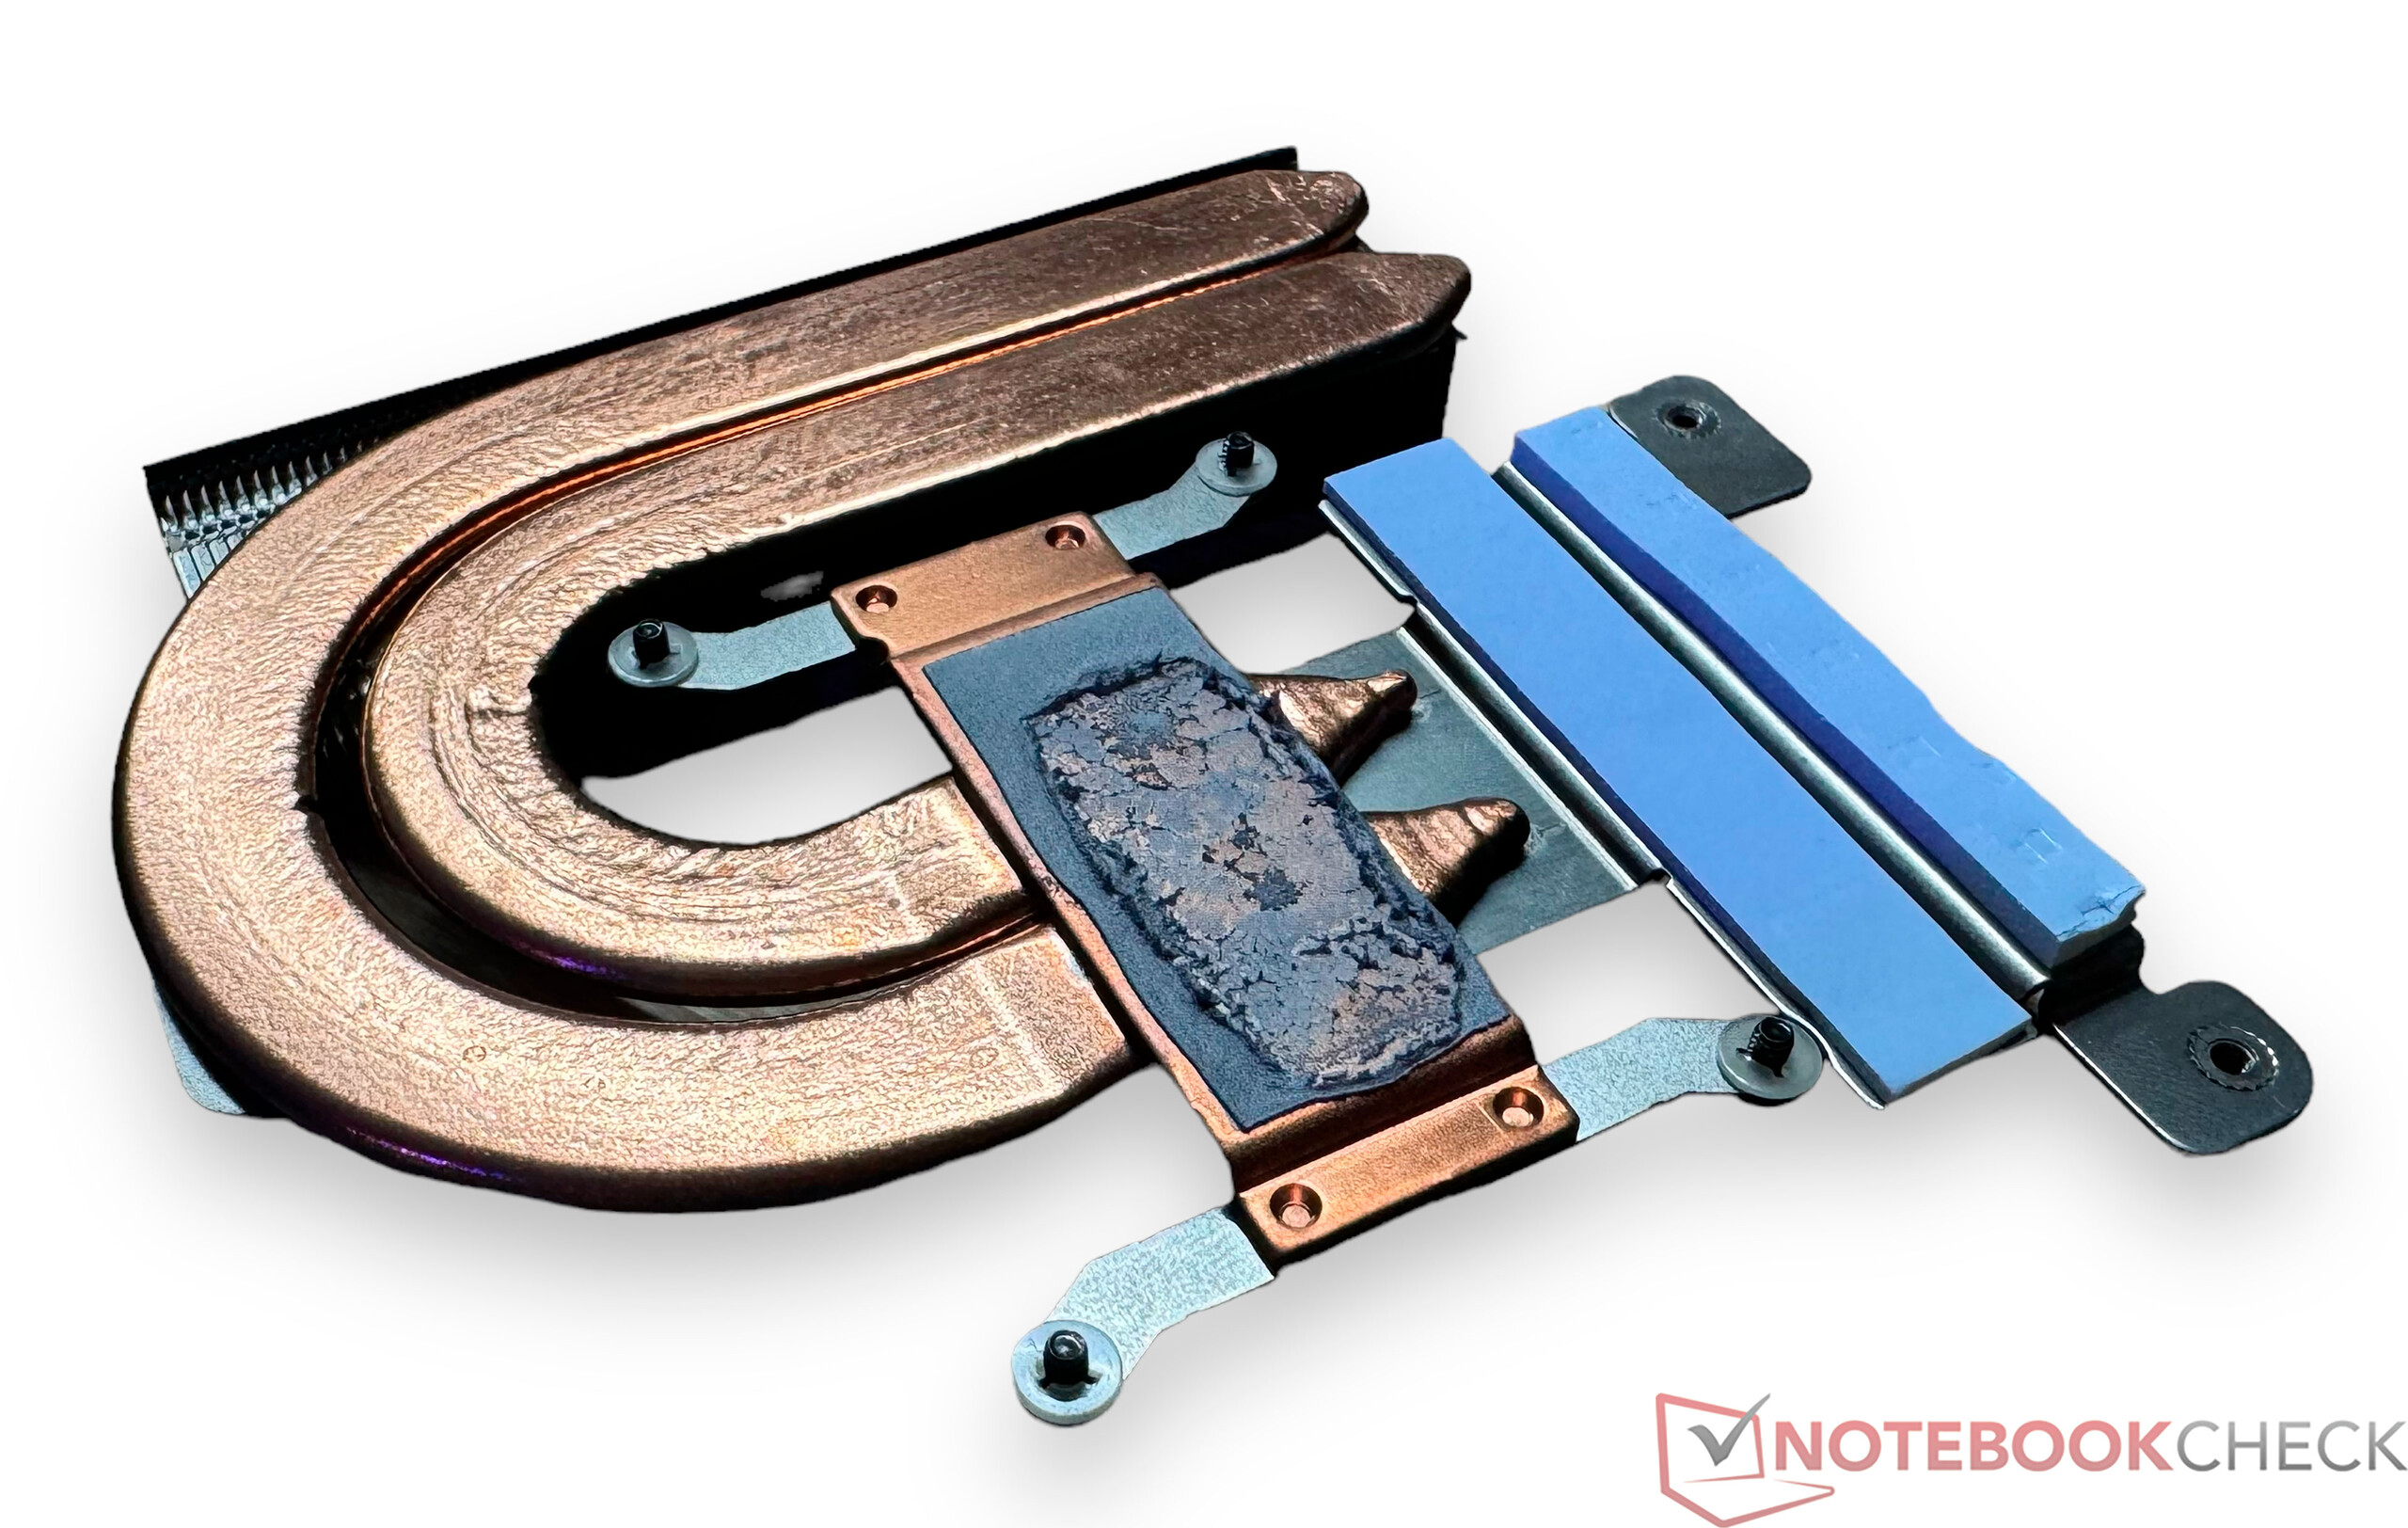
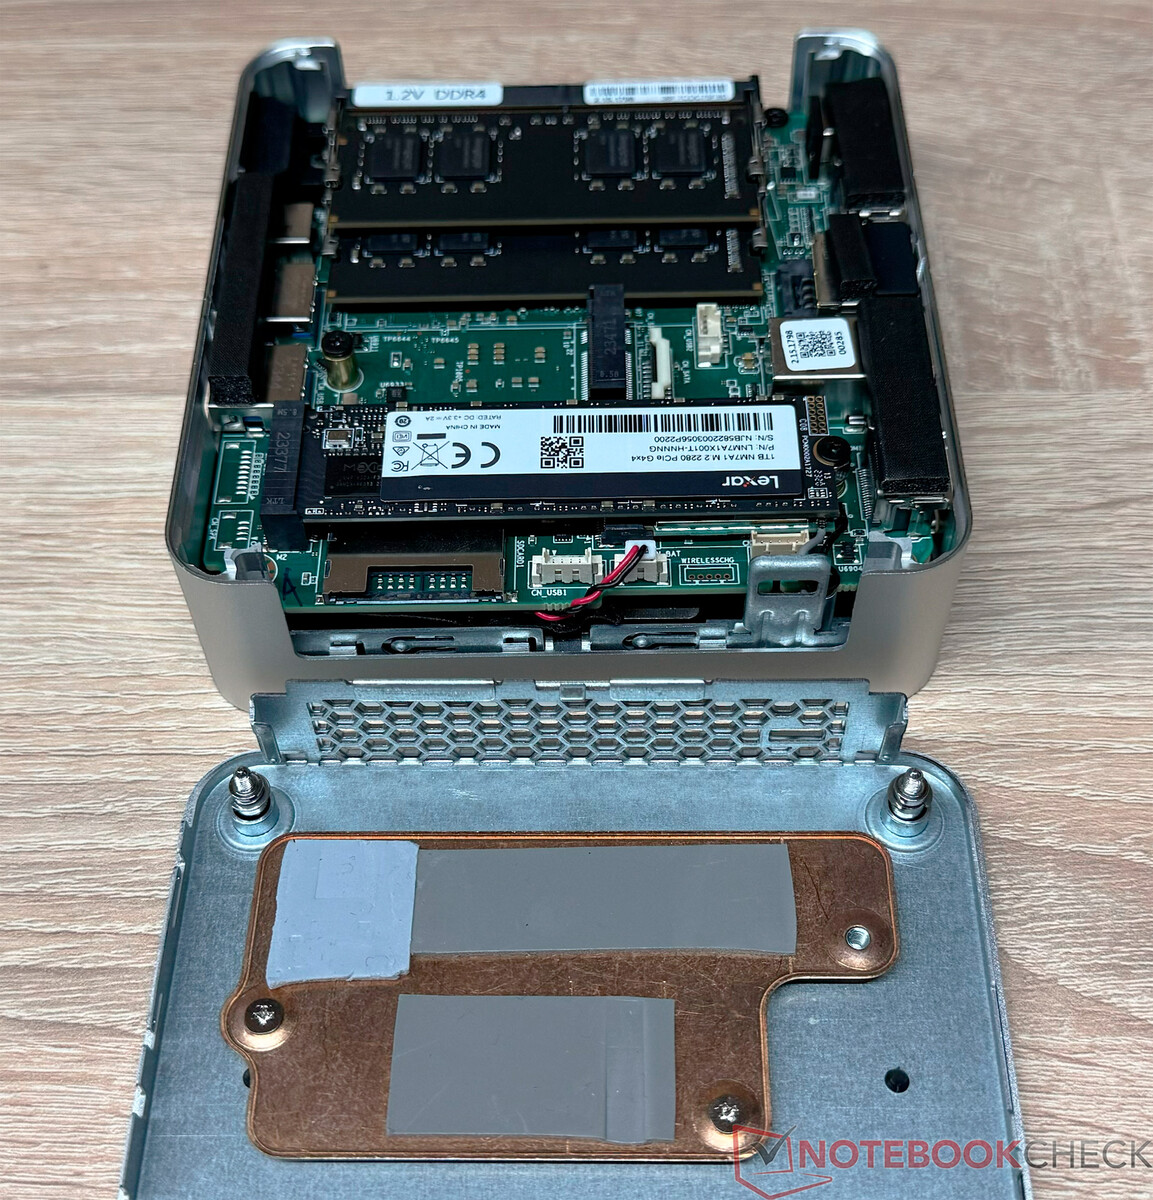
维护
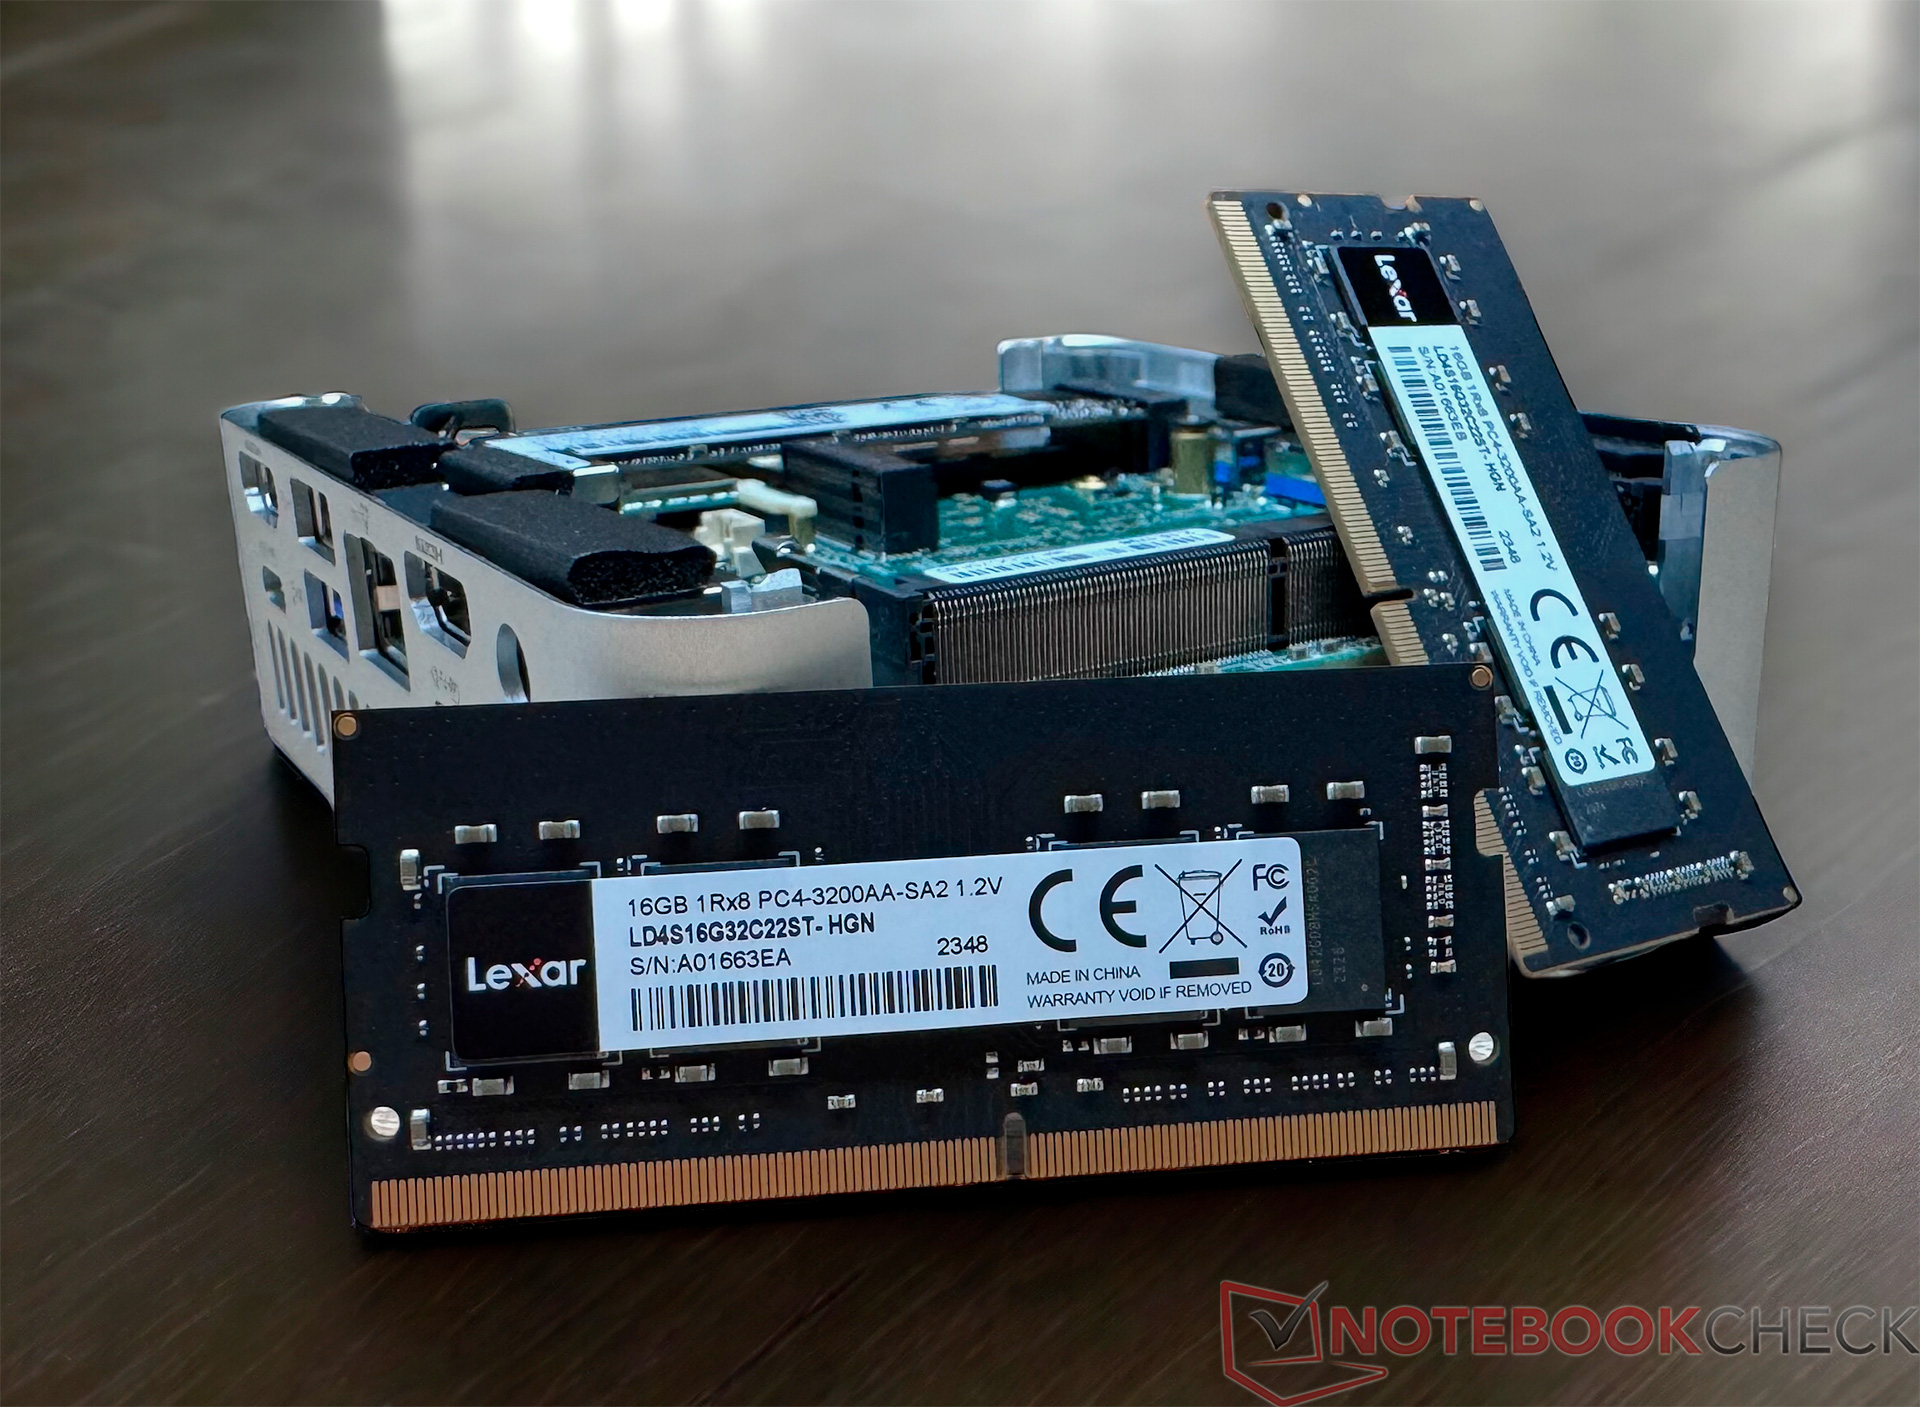
打开 Geekom XT12 Pro 不会有任何大问题:四颗易于触及的螺丝将底板固定在外壳上。松开螺丝后,底板和固态硬盘散热器就可以取下了。由于使用了导热垫,在拆卸时要小心一些。然后就可以轻松访问内存和大容量存储器了。设备本身可以容纳另一个固态硬盘。不过,这里只能安装长度为 42 毫米的 SATA 固态硬盘。

性能 - 英特尔酷睿 i9-12900H 拥有 14 个内核和 20 个线程
Geekom XT12 Pro 仅有我们测试的版本。英特尔酷睿 i9-12900H 提供了非常坚实的基础,即使是对性能要求极高的任务也能轻松胜任。再加上 32 GB 内存和 1 TB 固态硬盘,您就可以轻松应对各种任务了。


测试条件
在 Geekom XT12 Pro 的所有性能测试中,我们都使用了 "最高性能 "电源方案。根据我们的测试标准,只有在功耗和噪音测量中出现偏差。 测试标准.
处理器
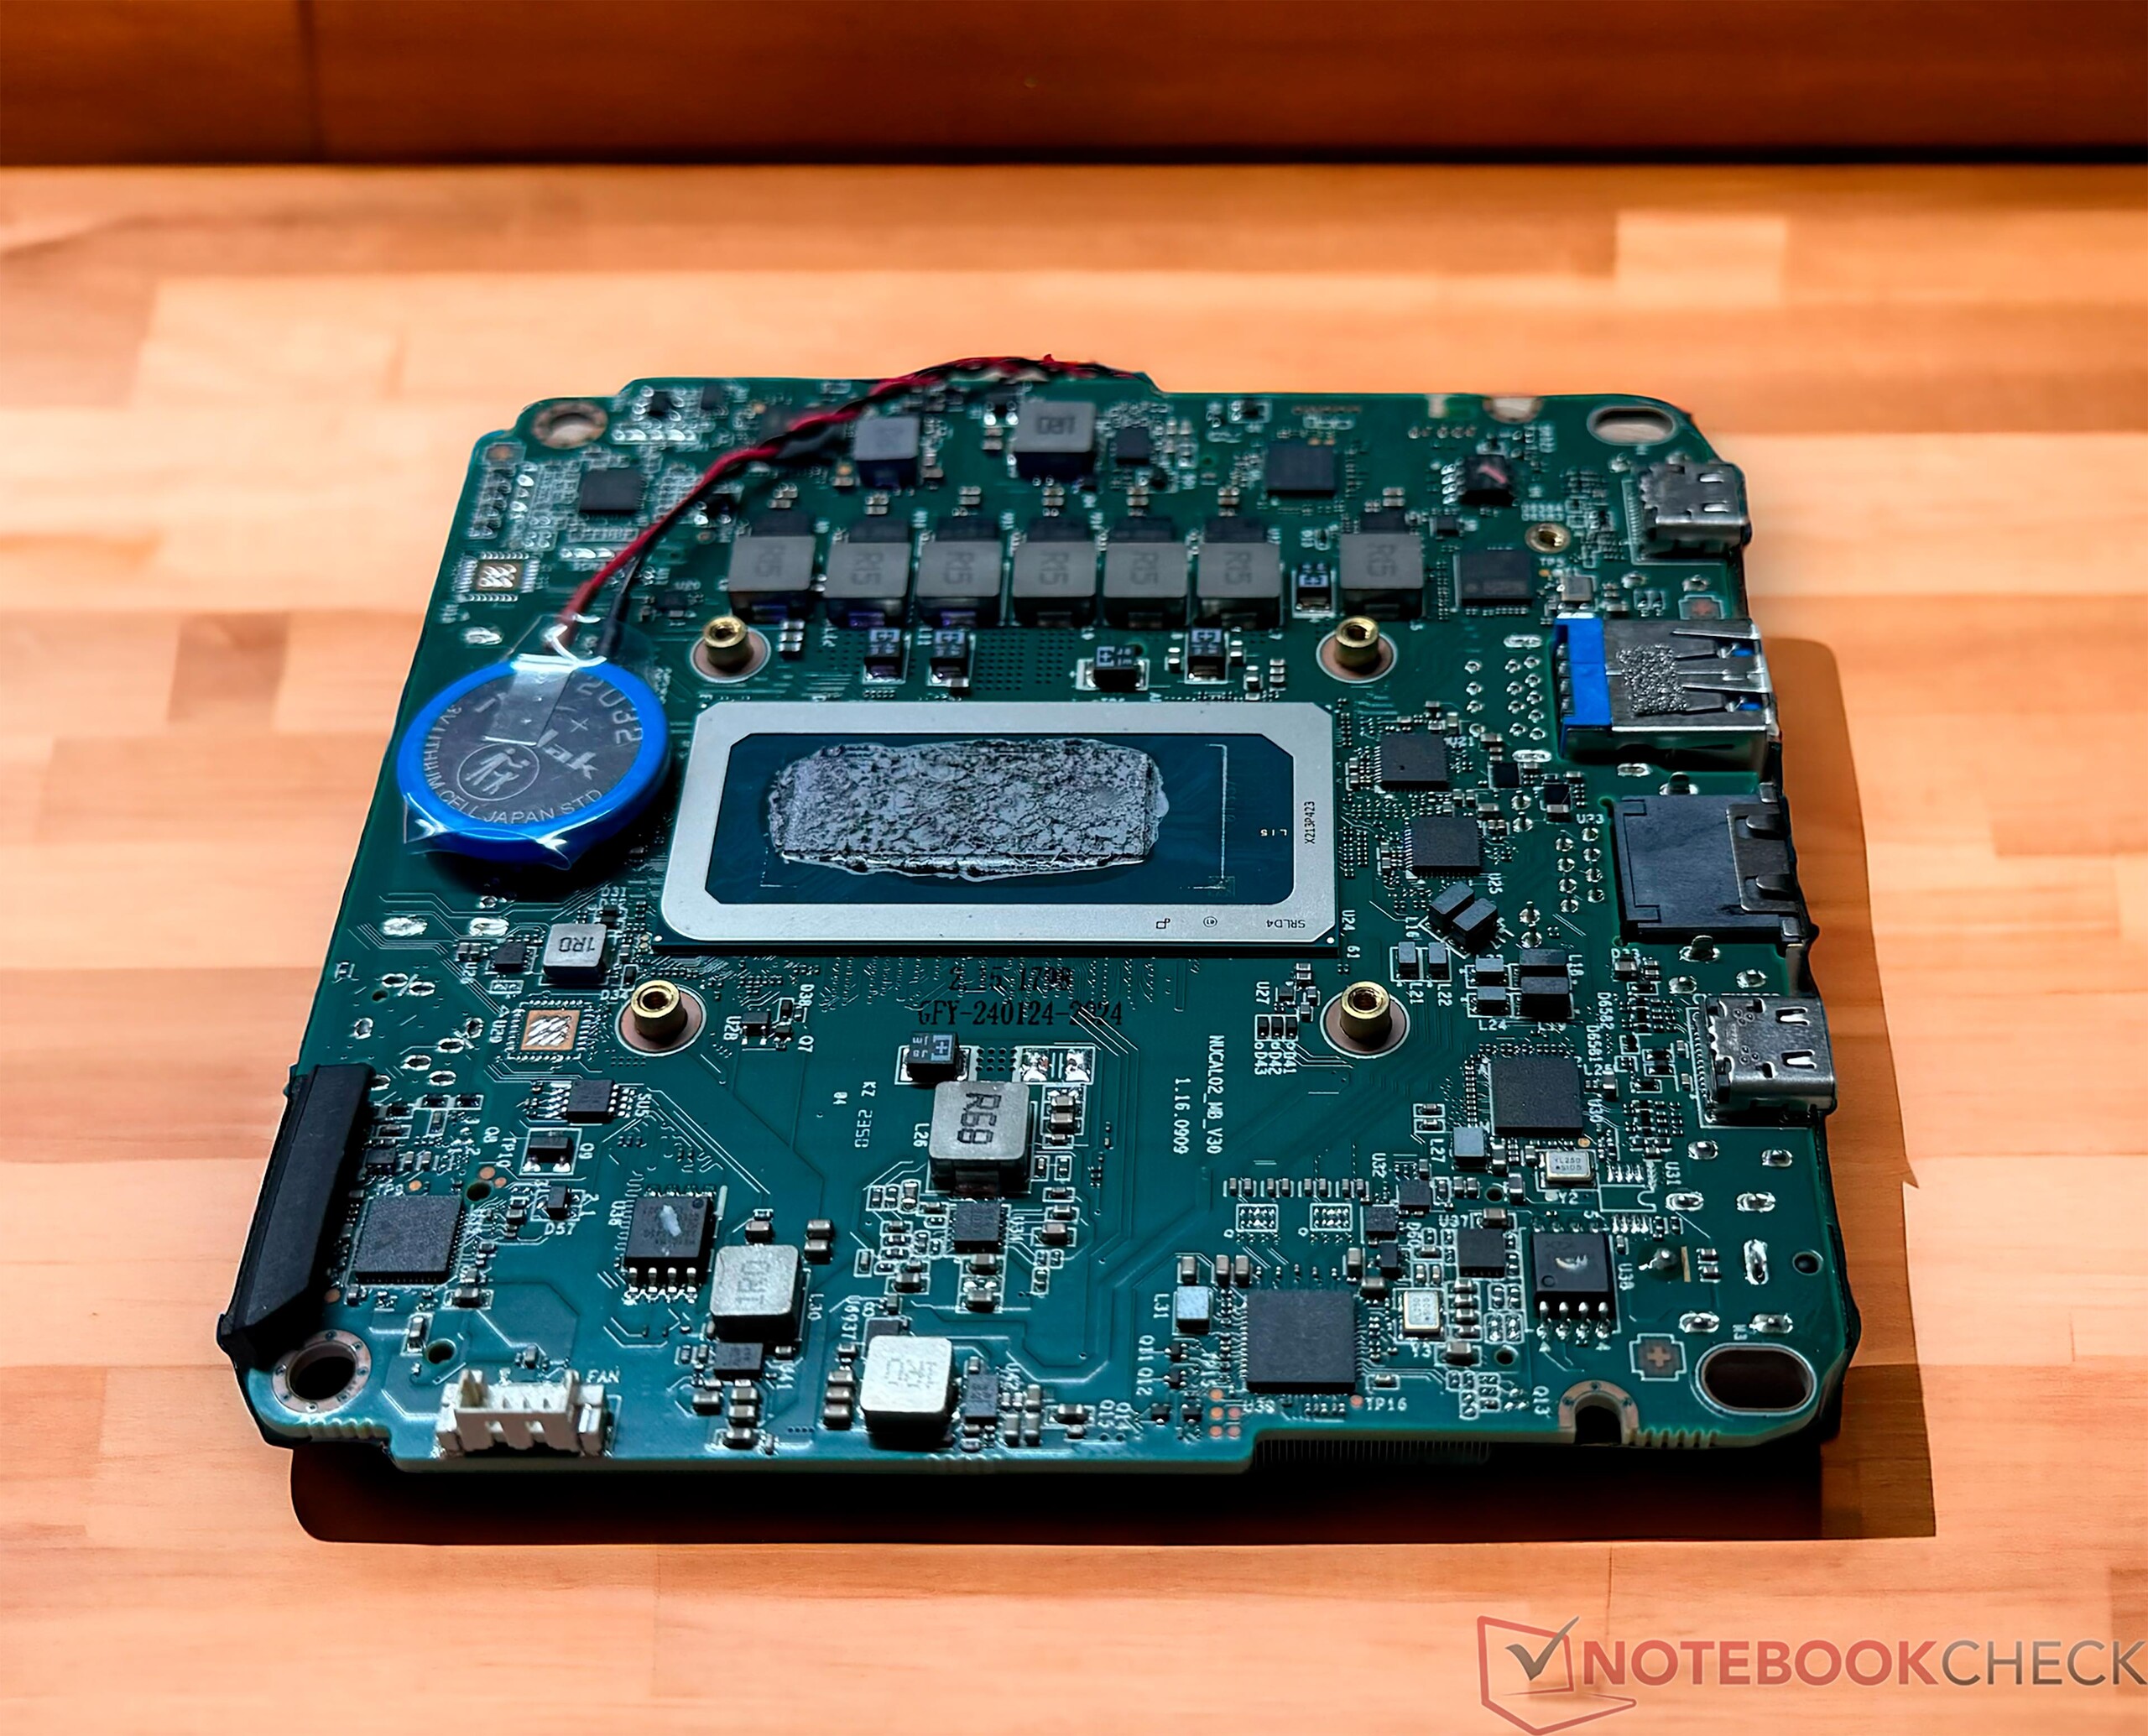
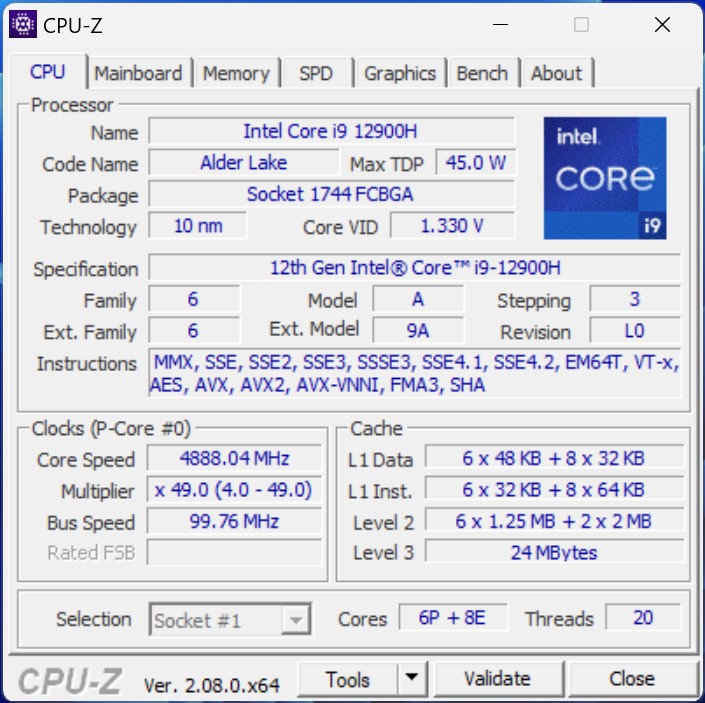
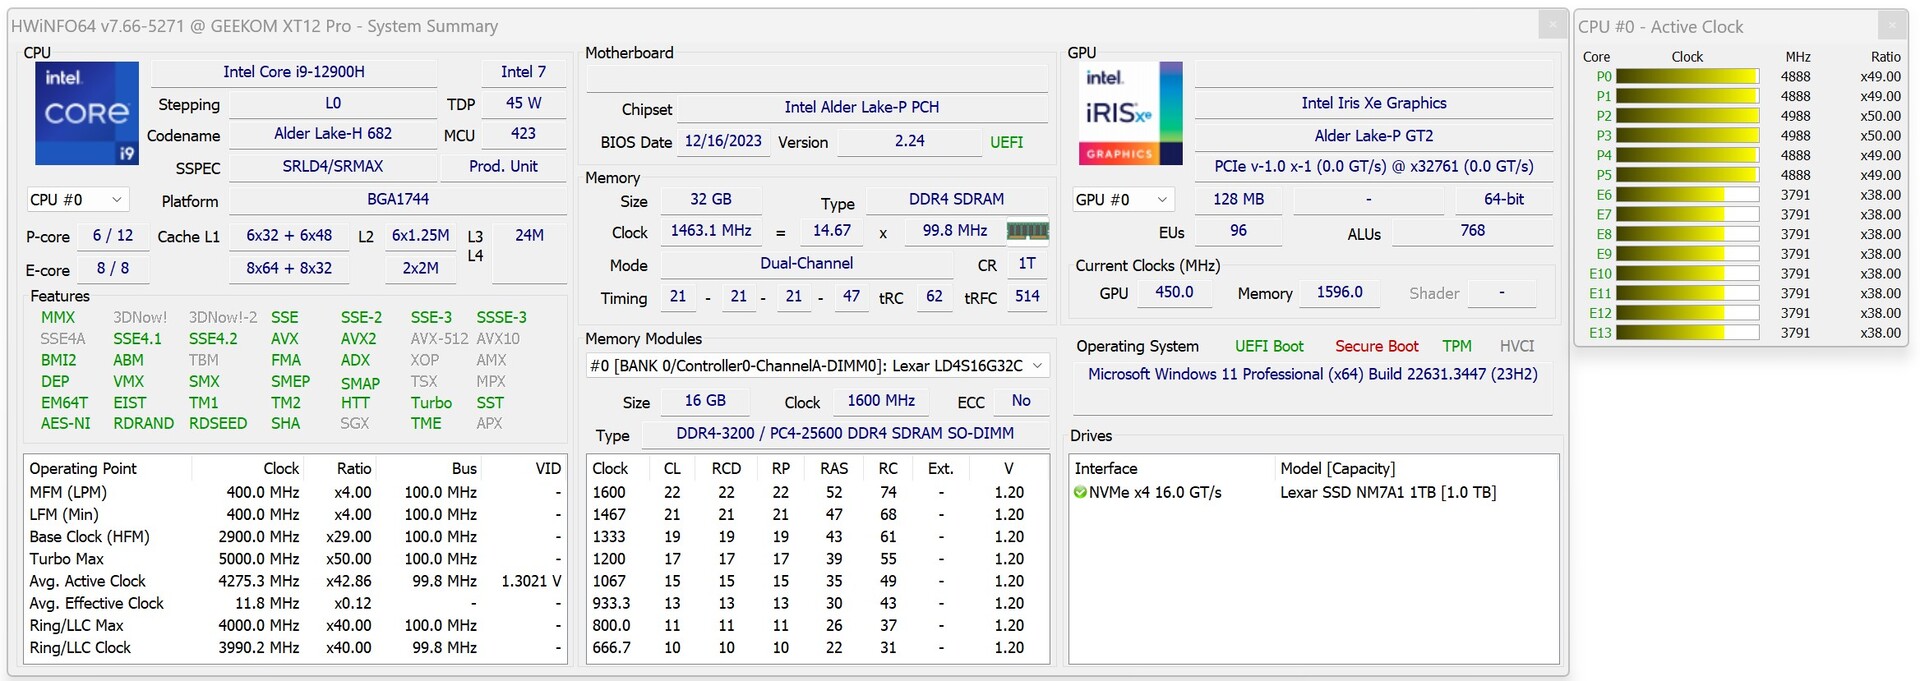
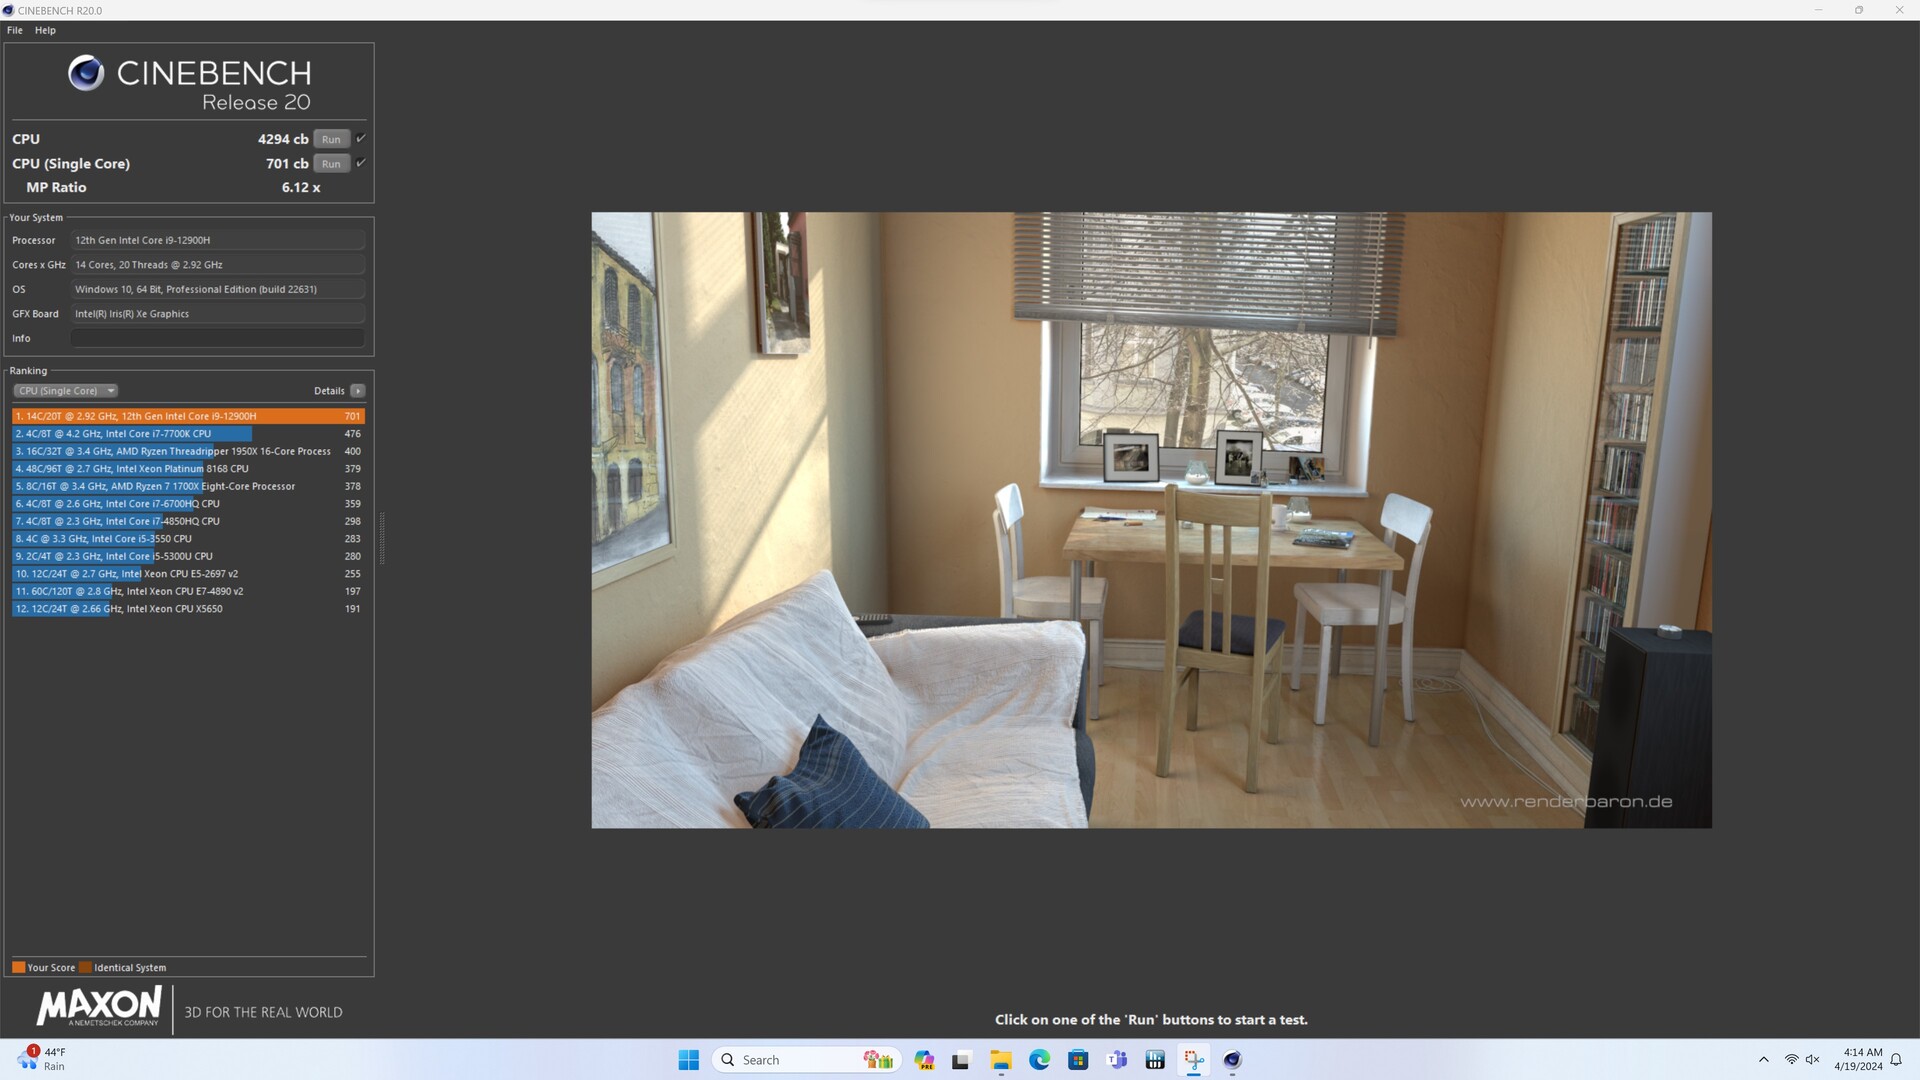
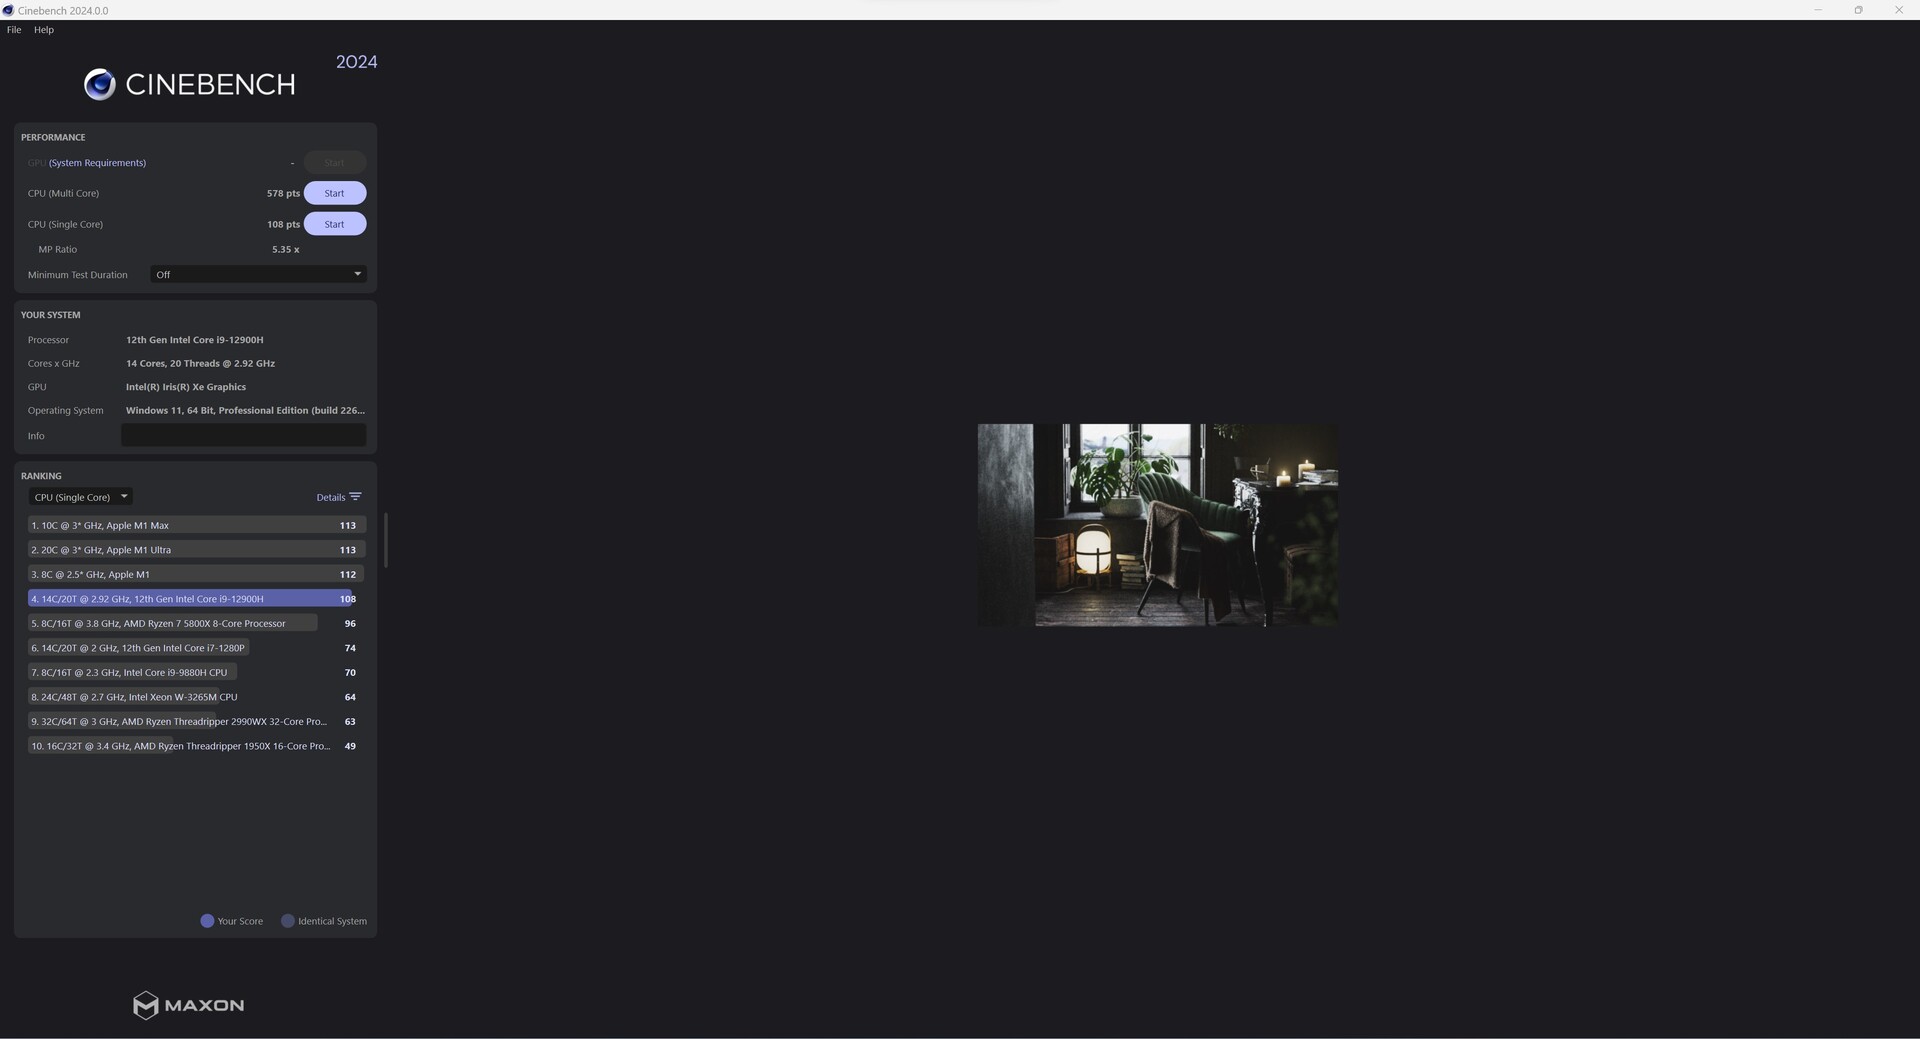
英特尔 英特尔酷睿 i9-12900H基于 Alder Lake 架构,结合了 6P 和 8E 内核。这两个核心可为用户提供 20 个线程。即使经过两年多的时间,这款 SoC 仍然没有过时,相比之下,我们可以看到它与更现代的 AMD Ryzen APU 之间存在合理的差距。
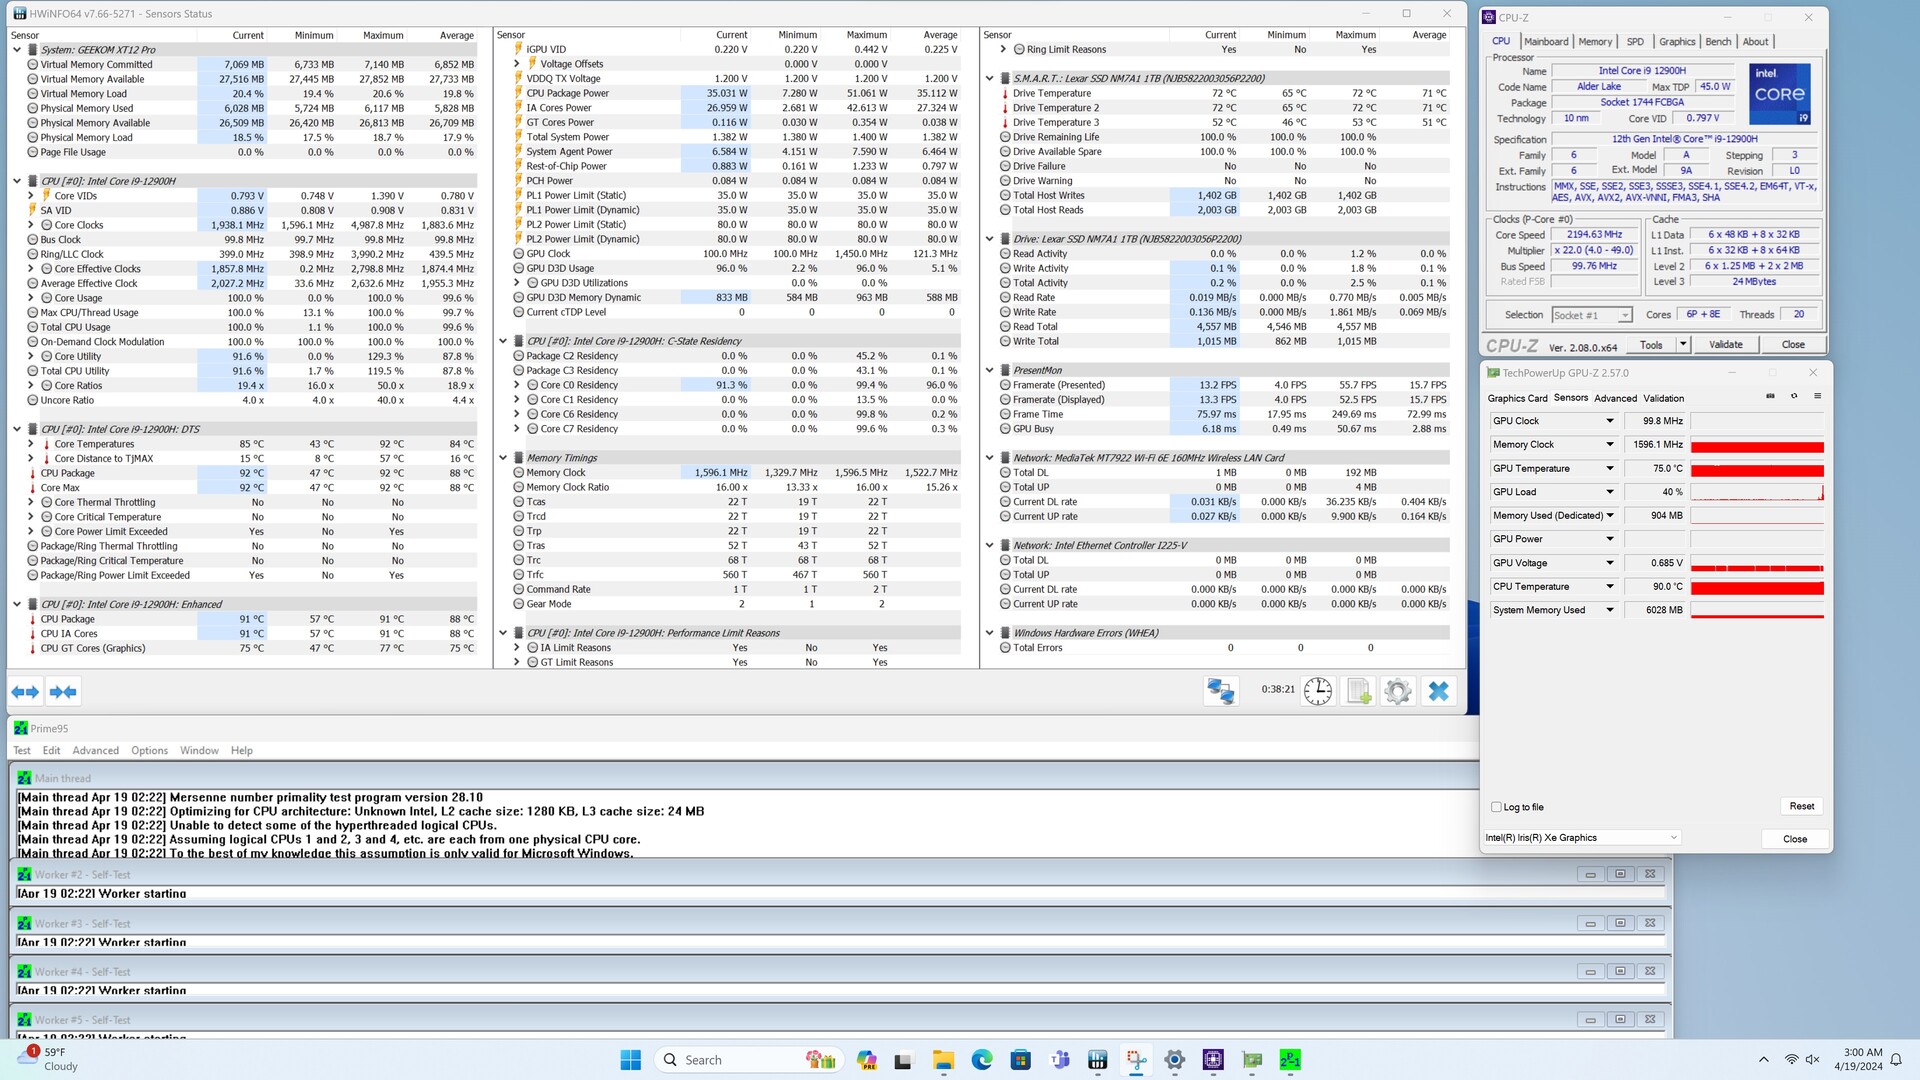
在功耗限制方面,Geekom 将英特尔酷睿 i9-12900H 的最大功耗限制在 80 瓦,尽管有 35 瓦的永久可用功耗。不过,我们在任何时候都没有达到最大值。在这一点上,我们已经可以说明这一点。在测试中,我们经常只能看到 60 瓦左右的功率,这意味着制造商并没有充分挖掘这里的潜力。尽管如此,SoC 的运行还是符合制造商的规格要求,因为它的功率始终保持在 35 瓦。在与竞争对手的对决中,我们的测试样品经常不得不承认失败。在 AIDA64 基准测试中也是如此。老式 DDR4 内存的劣势在这里显露无遗。
您可以在这里找到更多的处理器基准测试结果 这里.


| Performance Rating - Percent | |
| Minisforum EliteMini UM780 XTX | |
| Geekom A7 | |
| Acemagic F2A | |
| Intel NUC 13 Pro Desk Edition Kit | |
| Minisforum Neptune Series NAD9 | |
| Geekom XT12 Pro | |
| Khadas Mind | |
* ... smaller is better
AIDA64: FP32 Ray-Trace | FPU Julia | CPU SHA3 | CPU Queen | FPU SinJulia | FPU Mandel | CPU AES | CPU ZLib | FP64 Ray-Trace | CPU PhotoWorxx
| Performance Rating | |
| Minisforum EliteMini UM780 XTX | |
| Geekom A7 | |
| Acemagic F2A | |
| Average of class Mini PC | |
| Minisforum Neptune Series NAD9 | |
| Intel NUC 13 Pro Desk Edition Kit | |
| Geekom XT12 Pro | |
| Khadas Mind | |
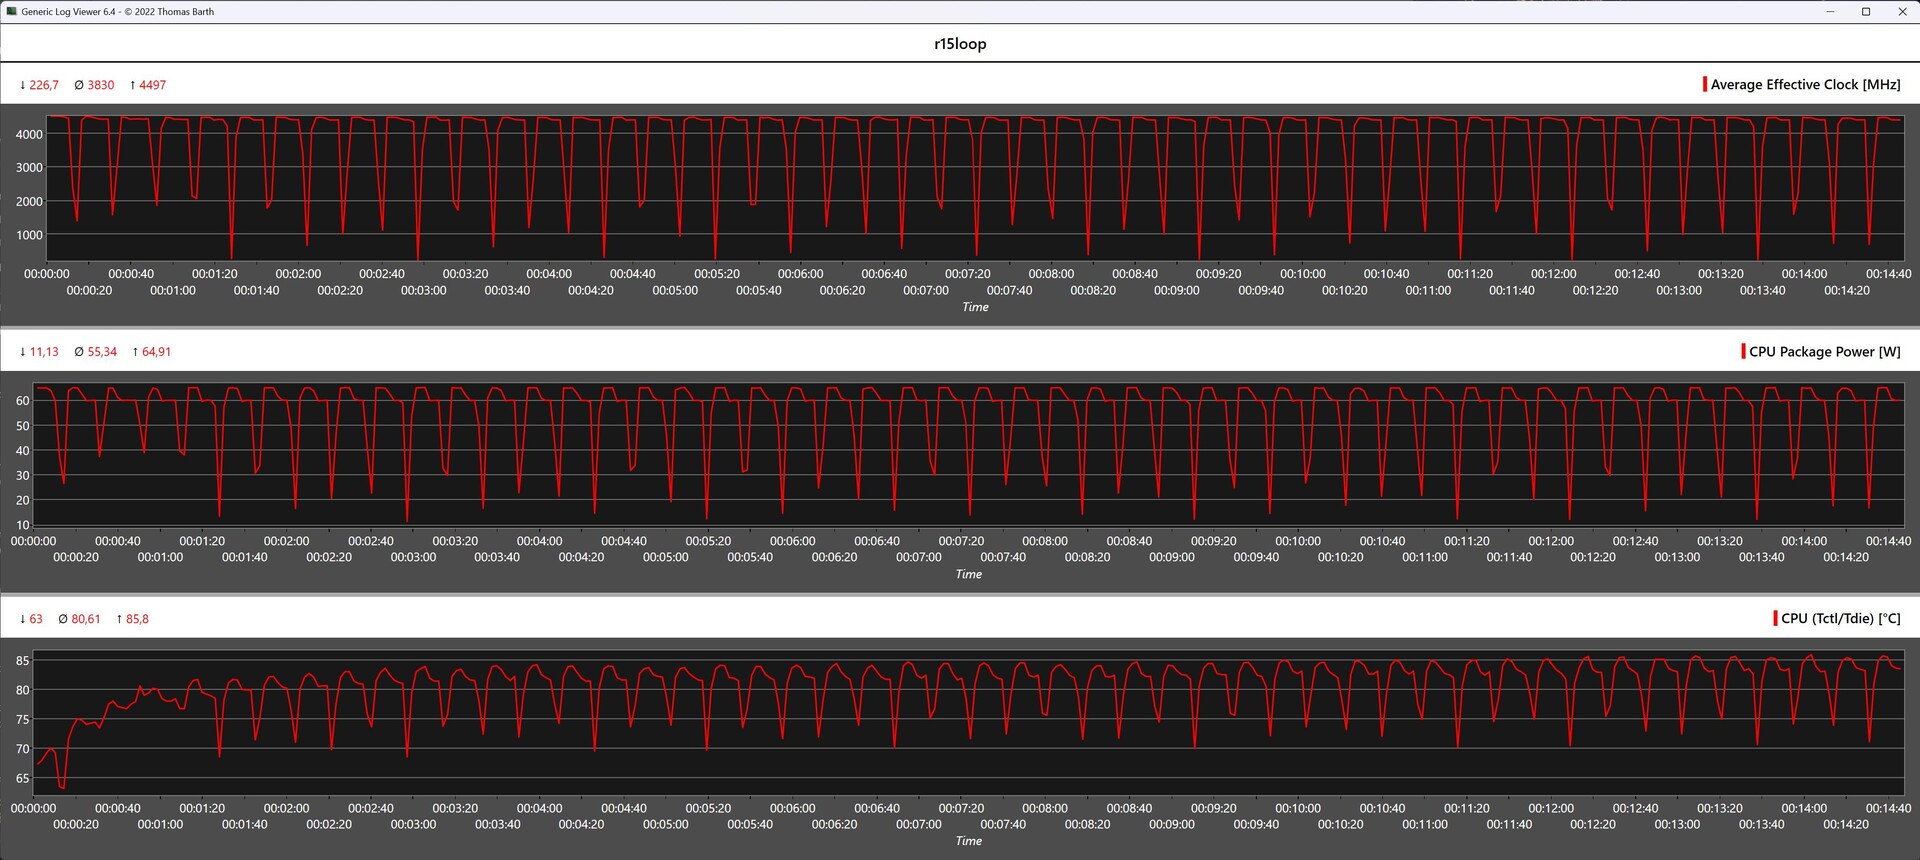
Geekom XT12 Pro 在 Cinebench R15 多环测试中的表现
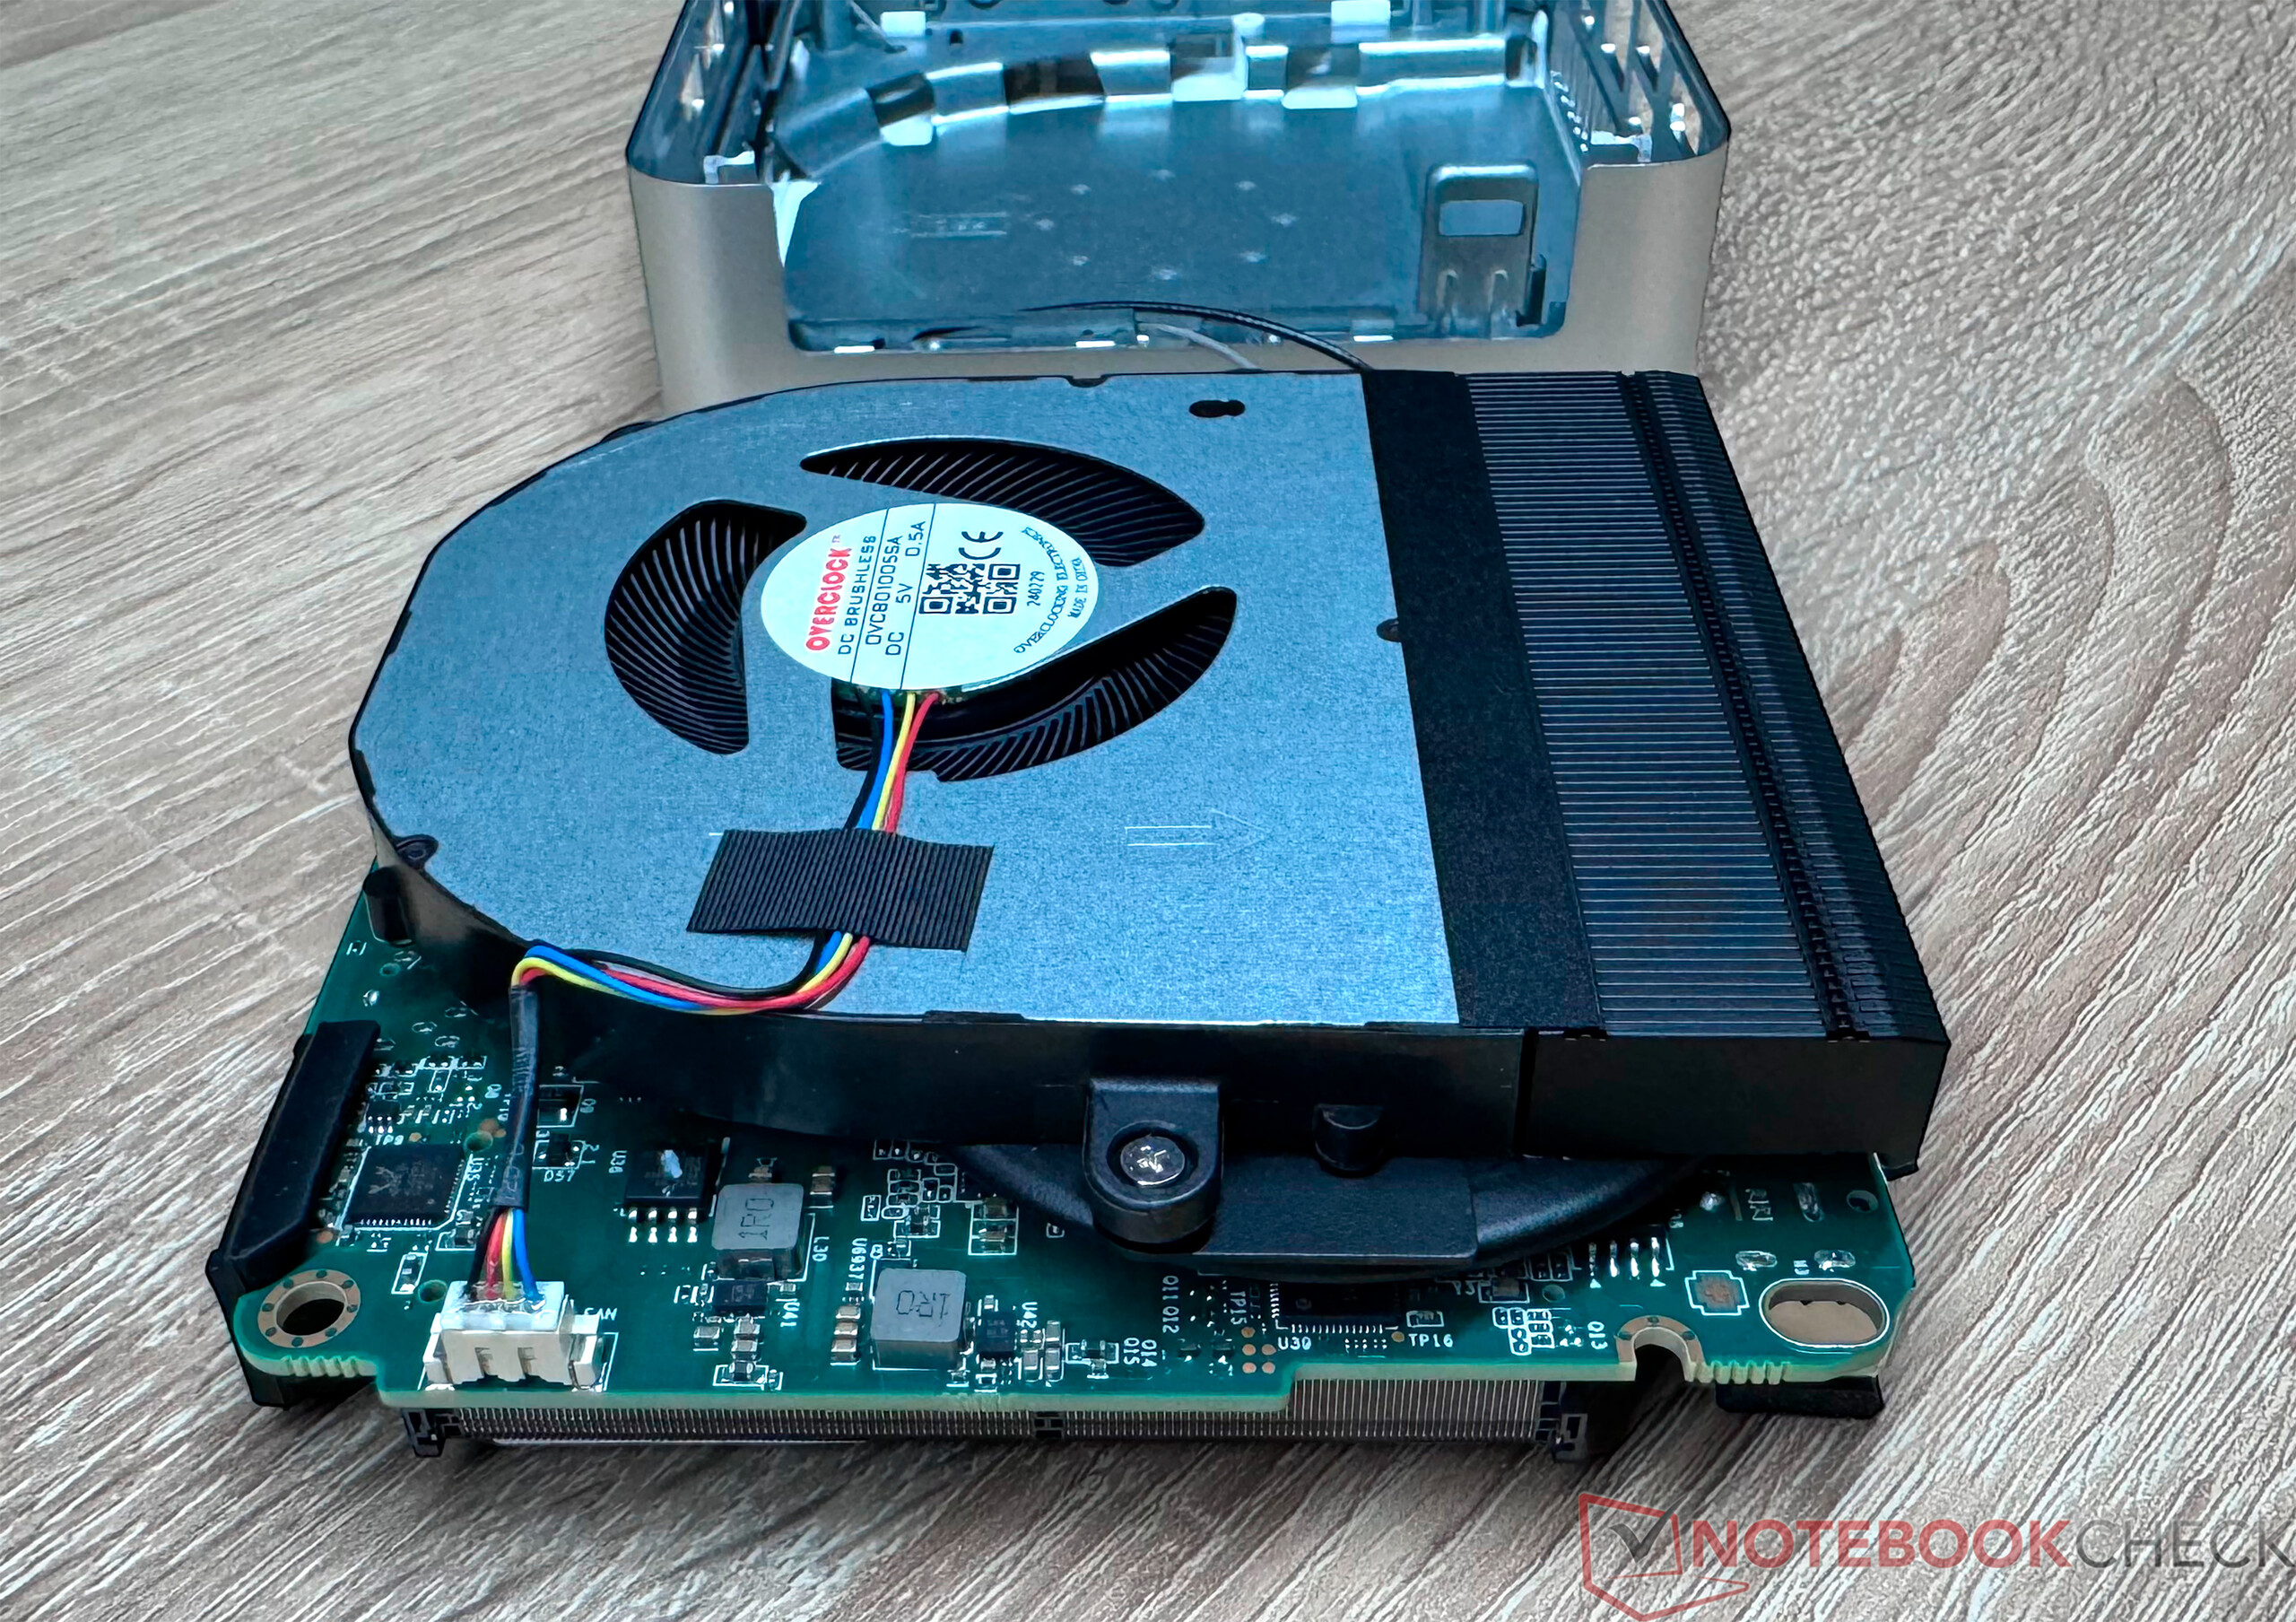
在 Cinebench R15 连续循环中,我们可以看到 Geekom 在这里安装了性能相对较低的散热装置。只有在开始时,英特尔酷睿 i9-12900H 才能提供明显更好的结果。从第二次运行开始,性能明显下降,这意味着我们的测试样品只能排在倒数第二位。
系统性能
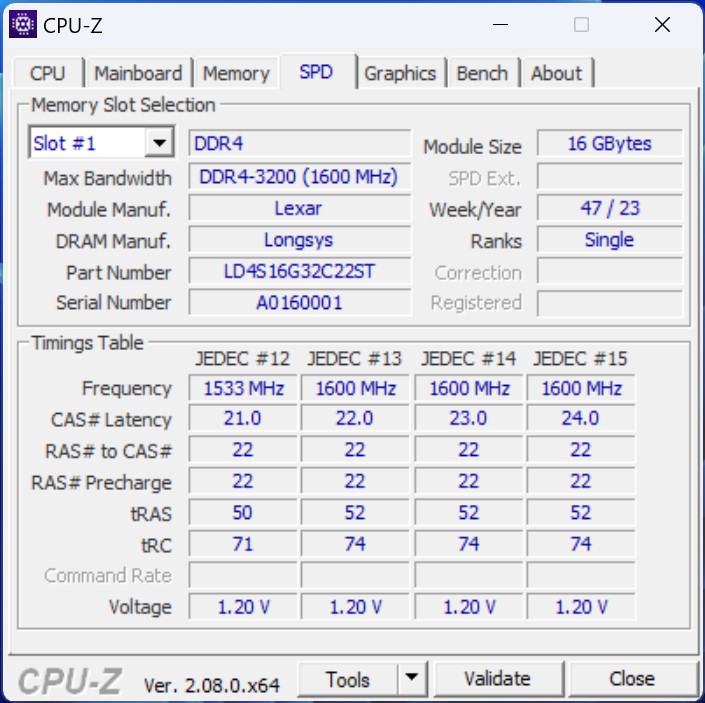
Geekom XT12 Pro 在系统性能测试中表现出色,与单纯的 CPU 测试相比,我们现在甚至可以看到我们的测试样品处于中场位置。不过,这也显示了 DDR4 与 DDR5 相比的劣势:所有基于 DDR4 的系统都以明显的优势紧随速度更快的配备 DDR5 的微型电脑,其中包括 Geekom A7是其中表现最好的。
| AIDA64 / Memory Copy | |
| Geekom A7 | |
| Minisforum EliteMini UM780 XTX | |
| Khadas Mind | |
| Acemagic F2A | |
| Average of class Mini PC (8377 - 89287, n=114, last 2 years) | |
| Minisforum Neptune Series NAD9 | |
| Geekom XT12 Pro | |
| Intel NUC 13 Pro Desk Edition Kit | |
* ... smaller is better
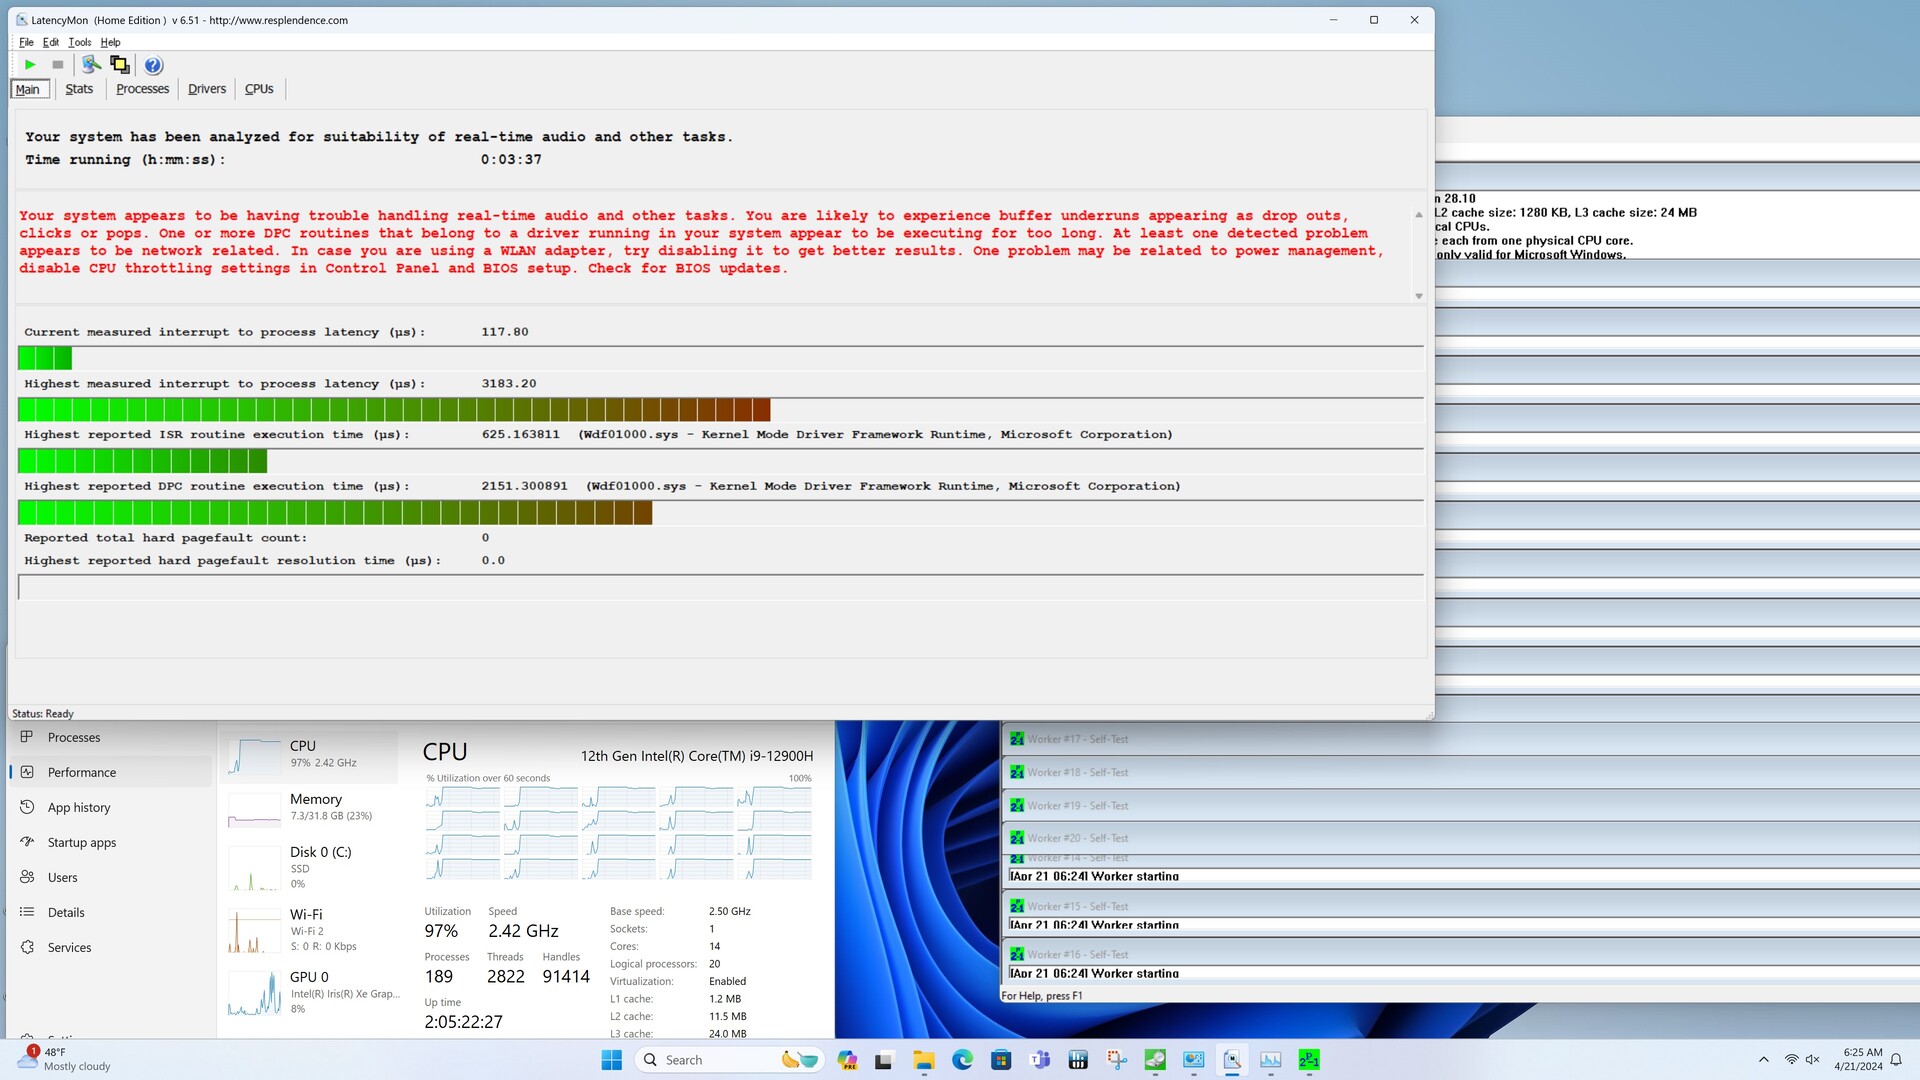
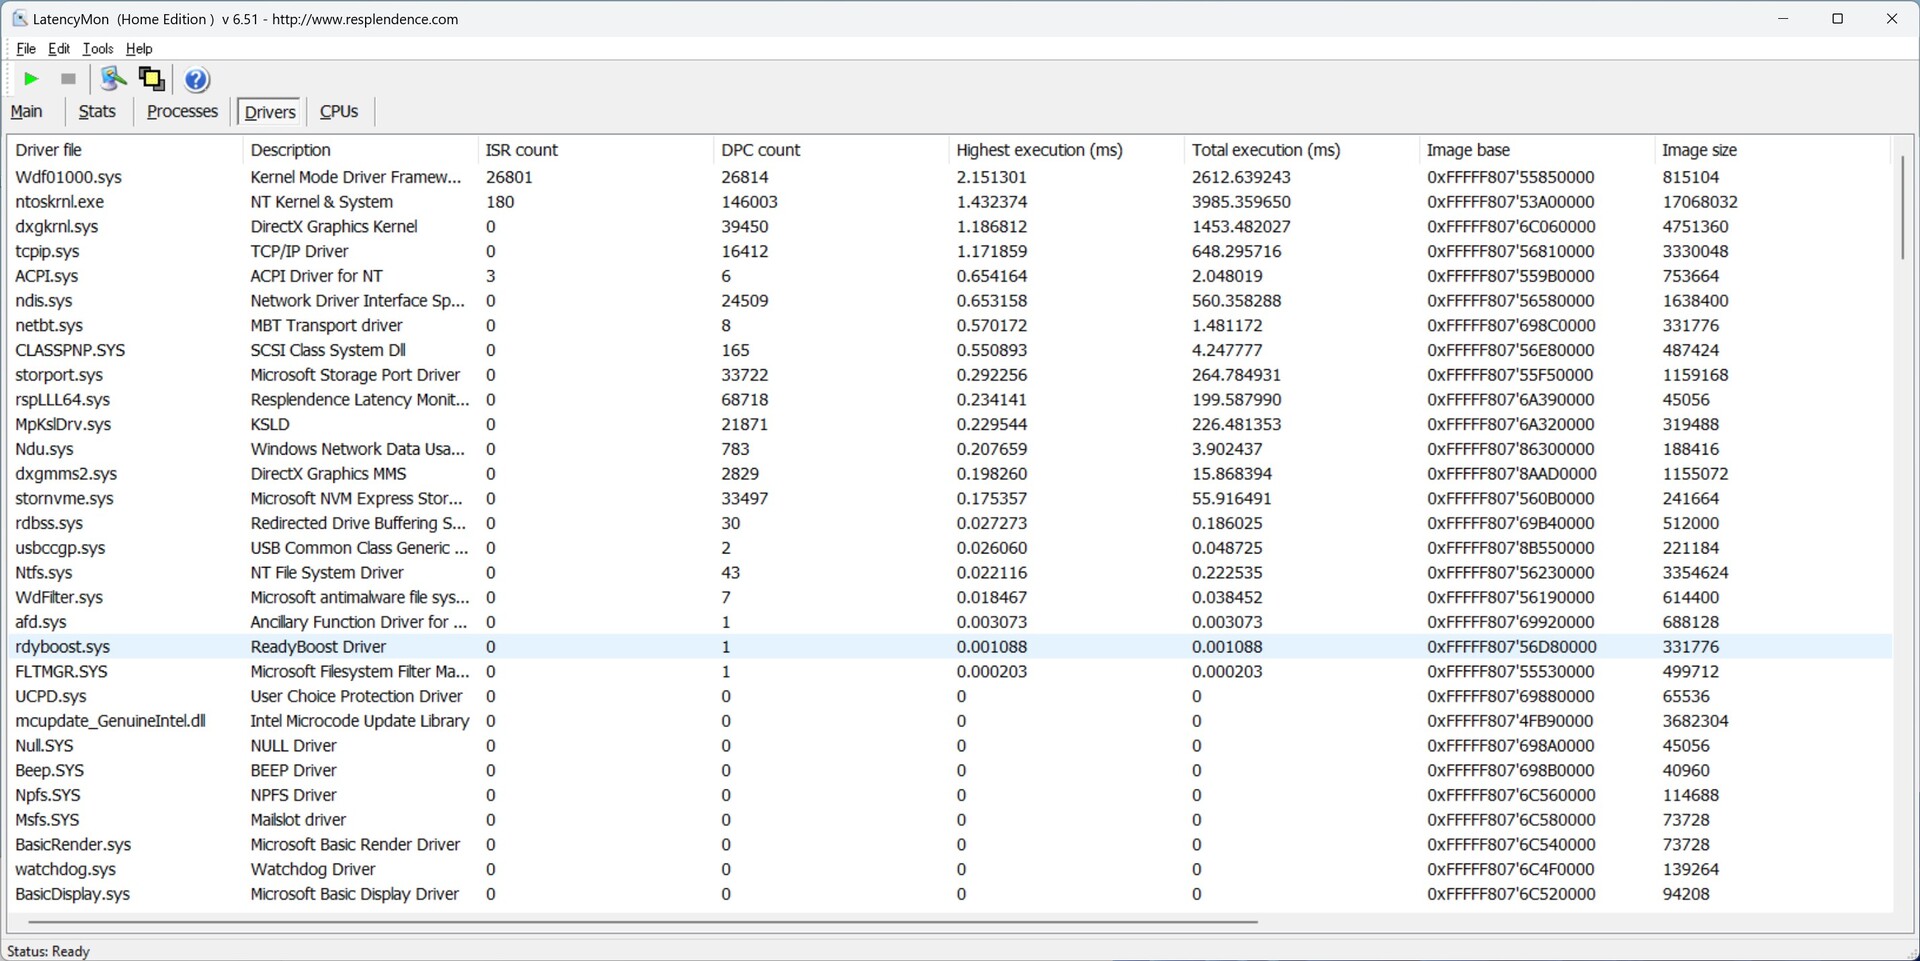
DPC 延迟
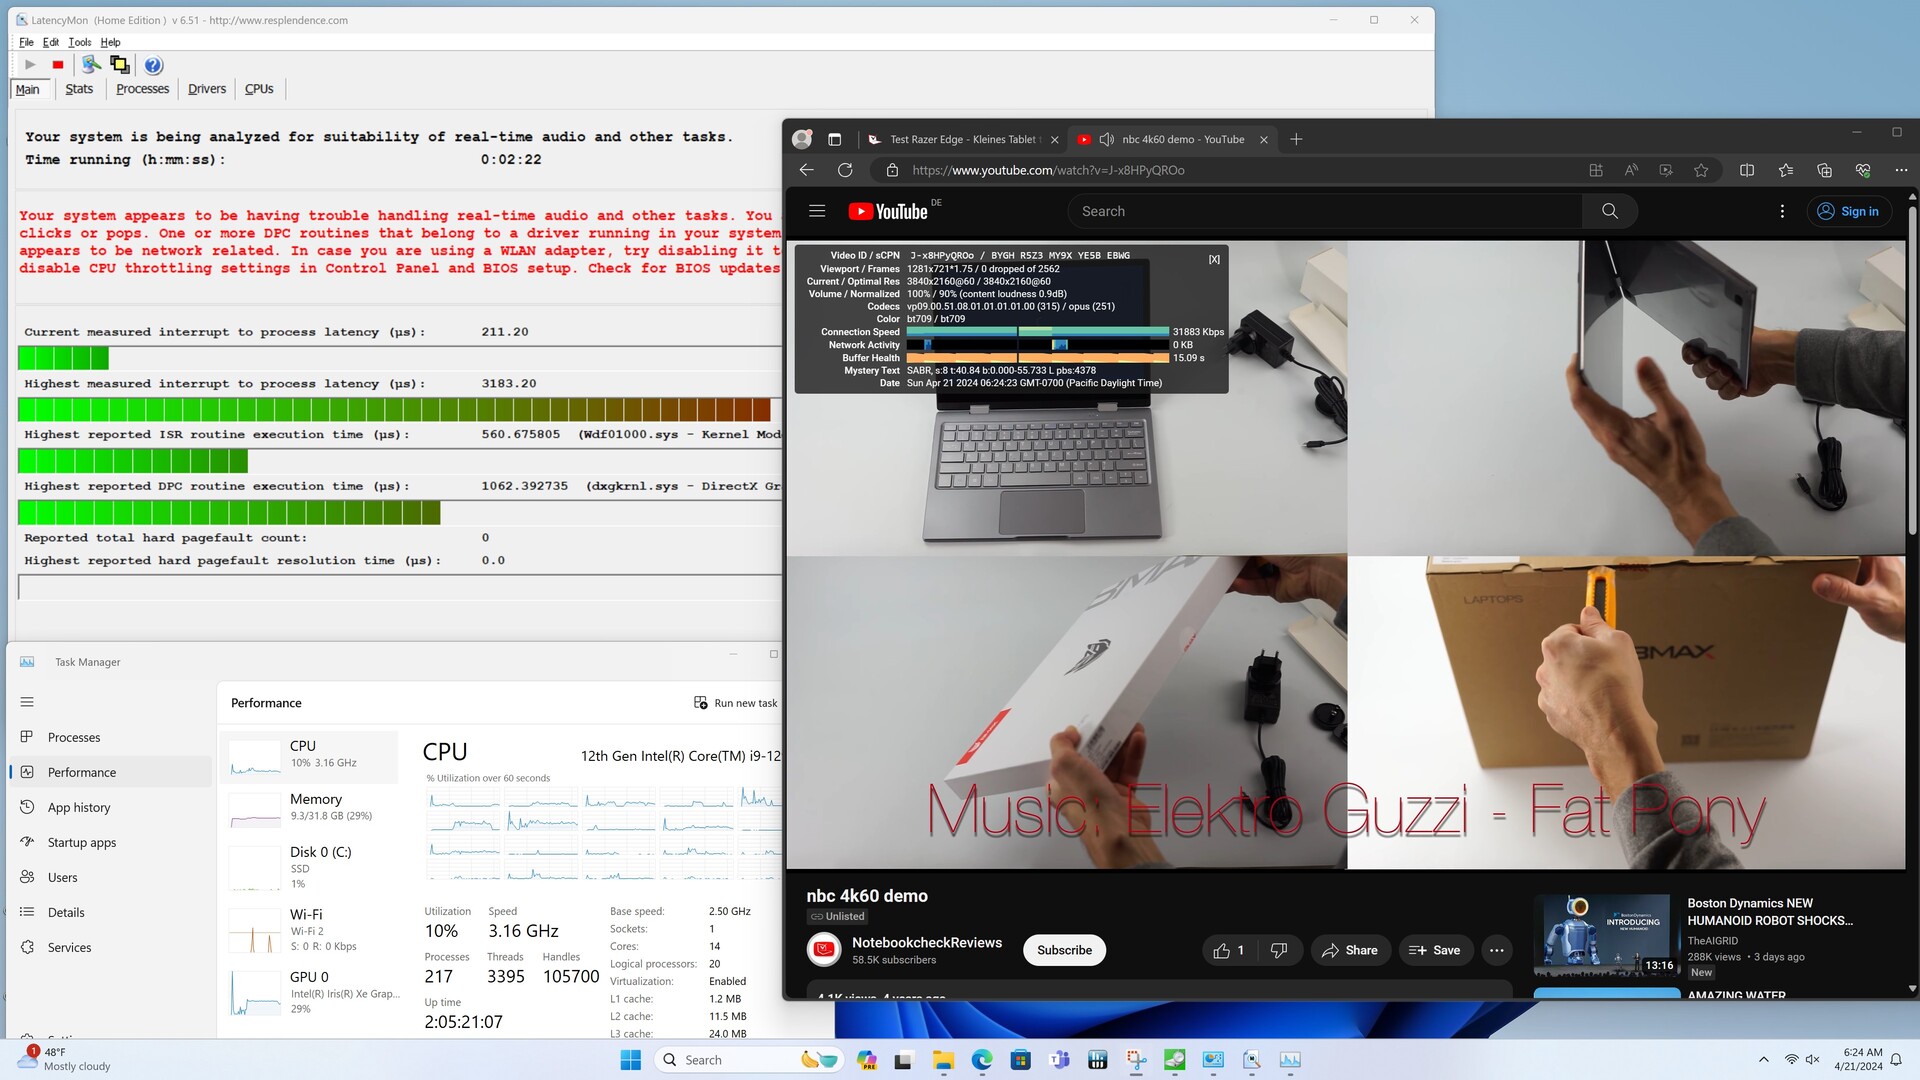
我们无法记录 Geekom XT12 Pro 上网时延迟增加的情况。只有在播放 4K 测试视频时,延迟才会攀升。不过,我们的测试样本只有在使用 Prime95 满负荷运行时才达到最大值。尽管如此,XT12 Pro 仍可用作流媒体客户端,因为在任何时候都不会出现掉帧现象。
| DPC Latencies / LatencyMon - interrupt to process latency (max), Web, Youtube, Prime95 | |
| Acemagic F2A | |
| Geekom XT12 Pro | |
| Geekom A7 | |
| Minisforum EliteMini UM780 XTX | |
| Minisforum Neptune Series NAD9 | |
| Intel NUC 13 Pro Desk Edition Kit | |
| Khadas Mind | |
* ... smaller is better
大容量存储器
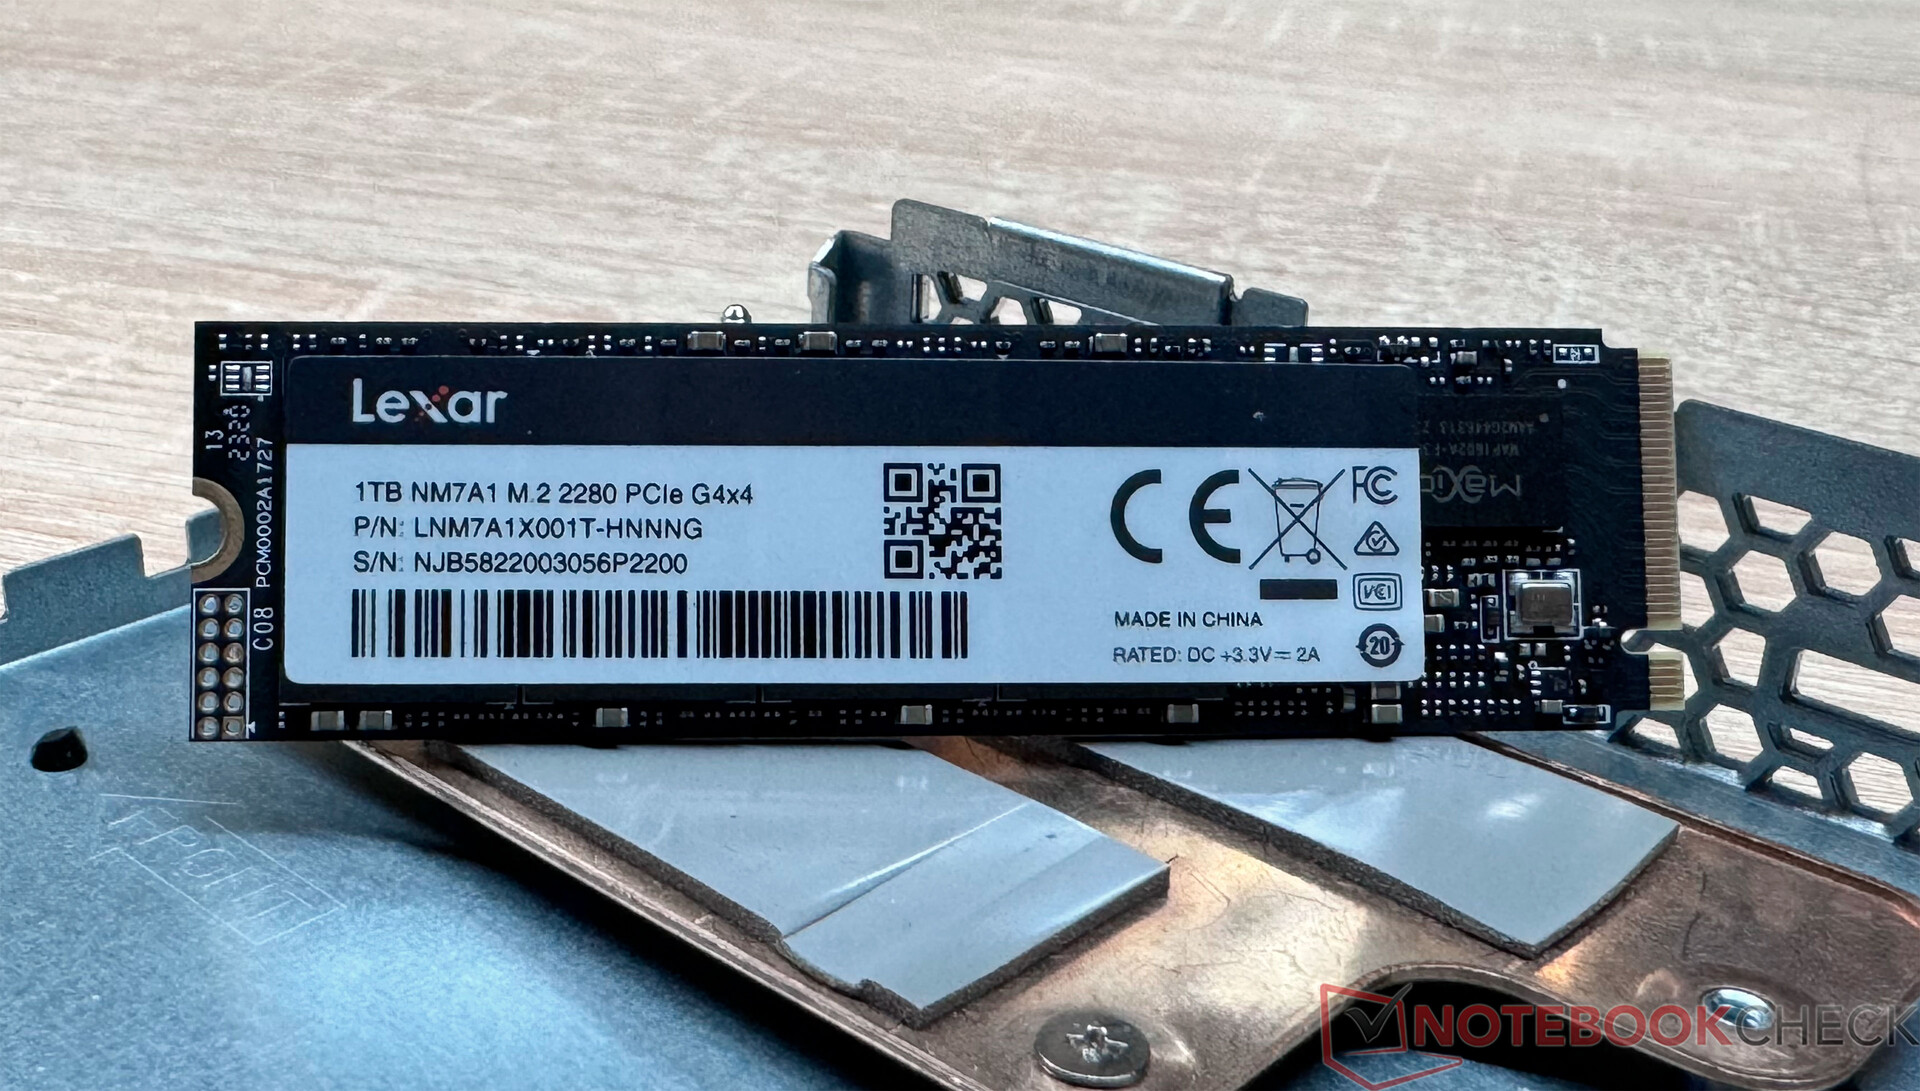
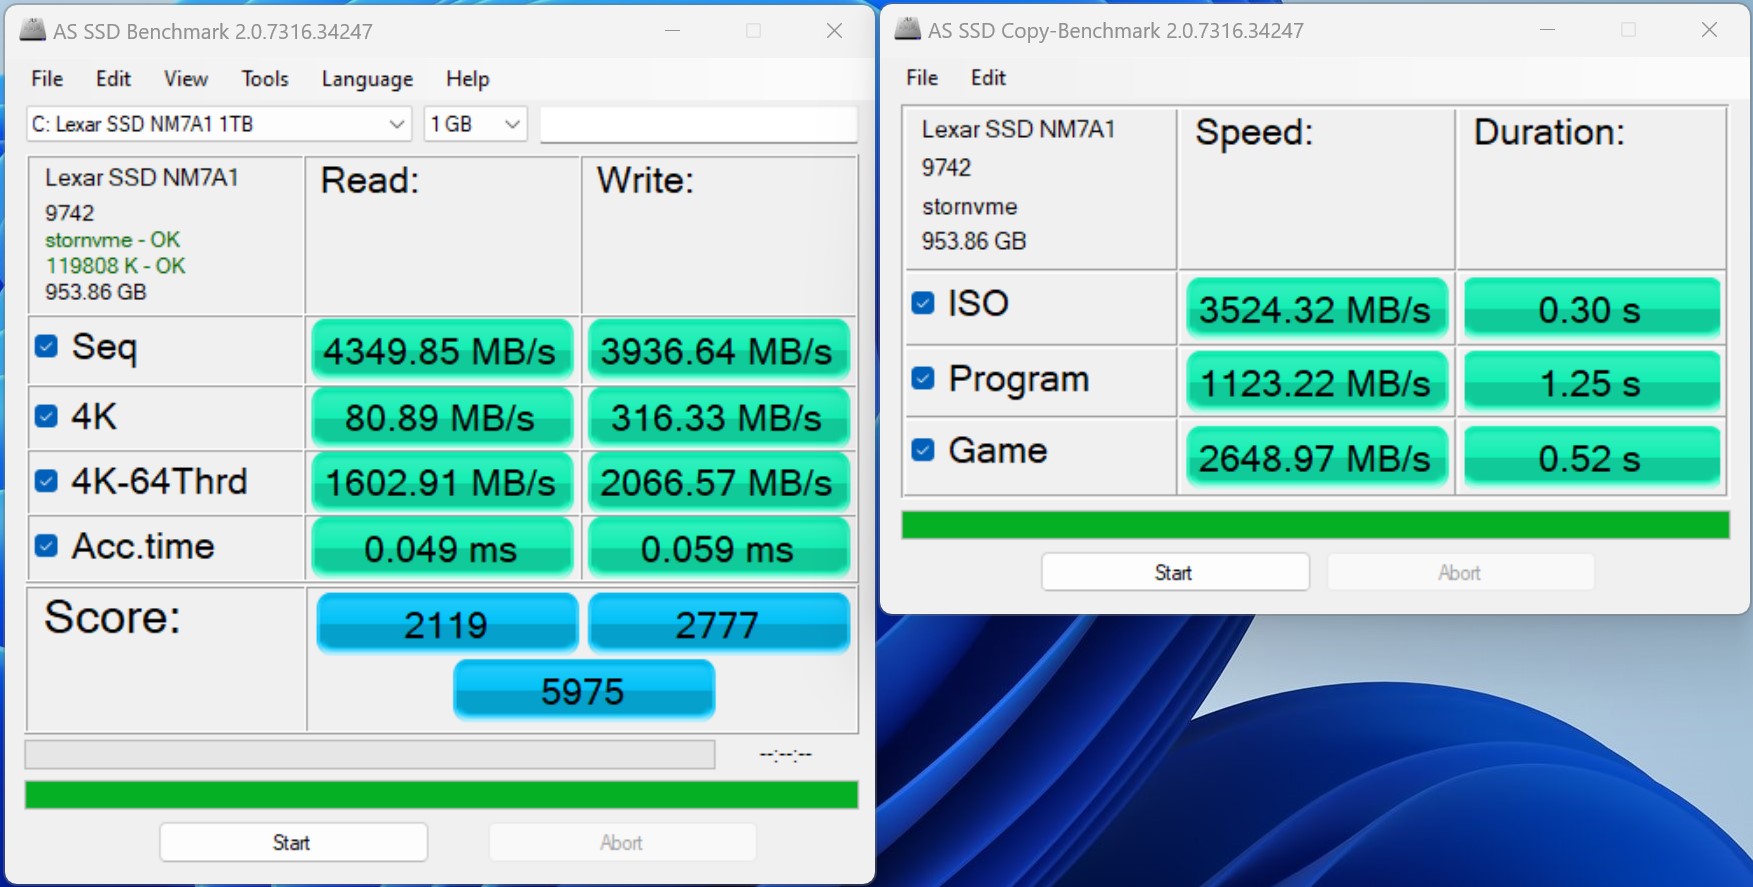
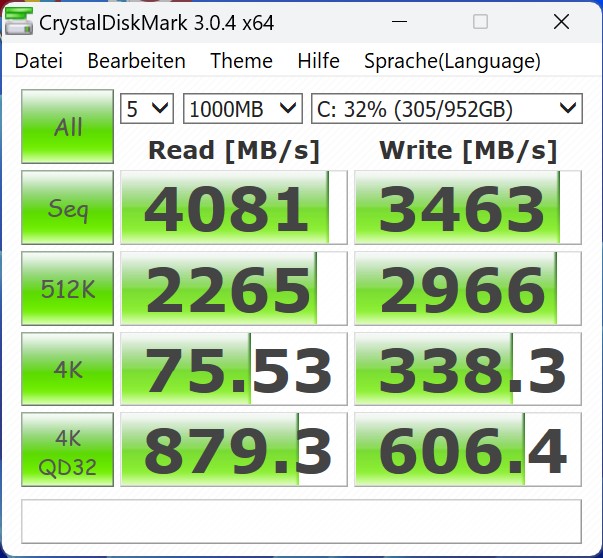
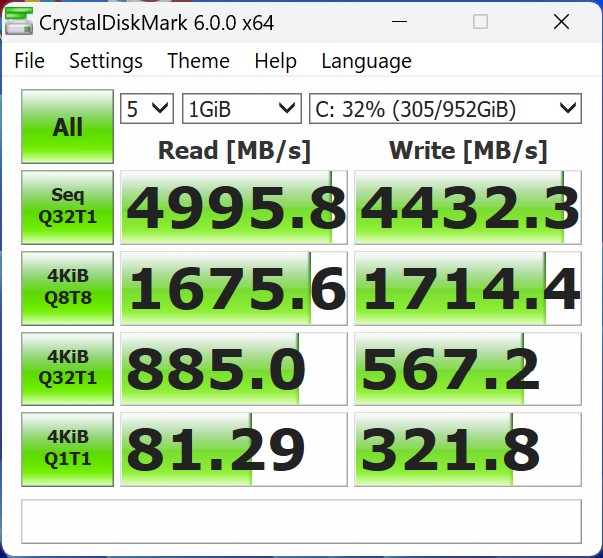
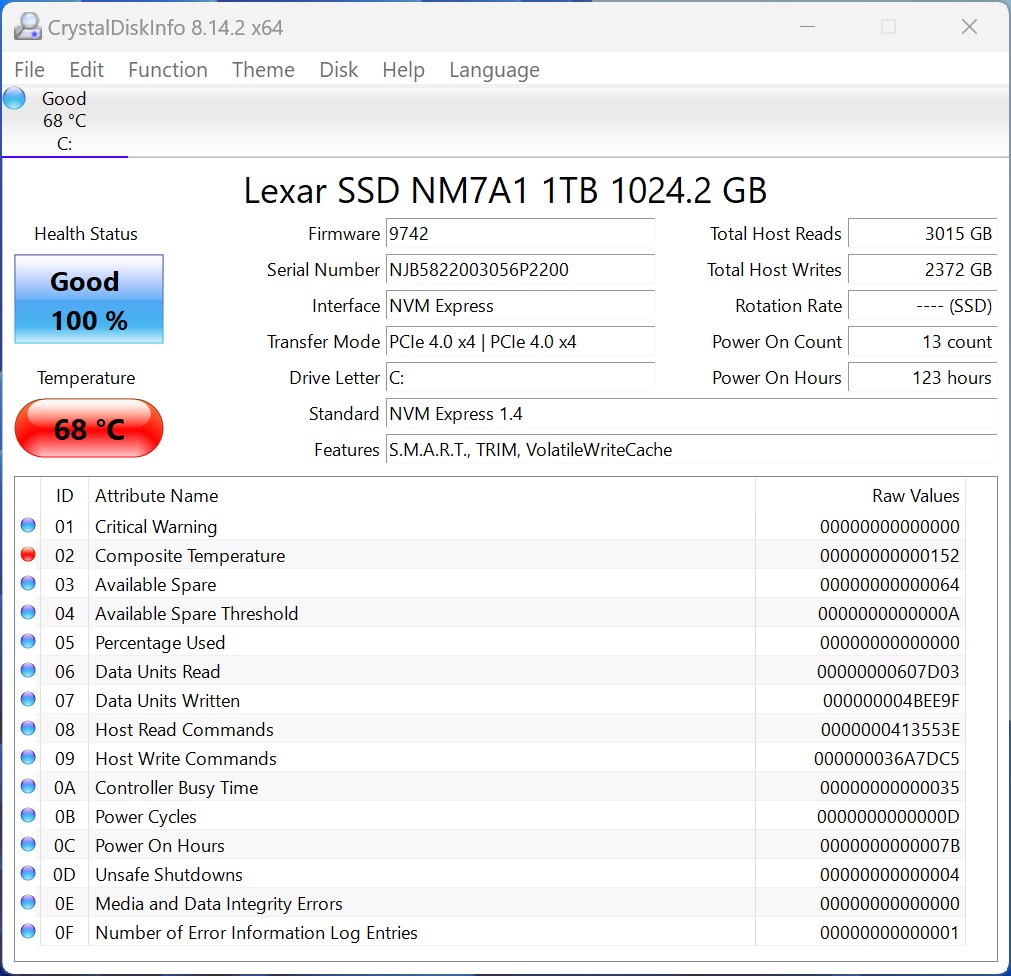
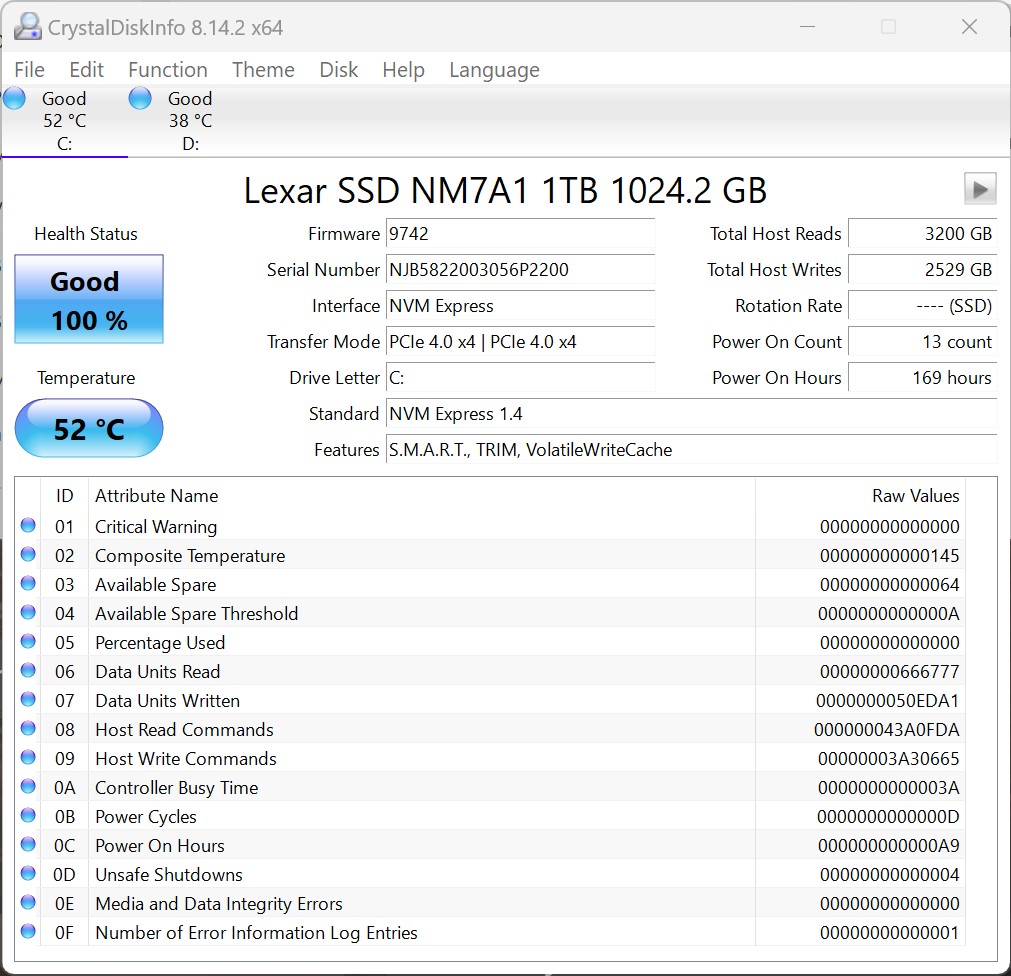
Geekom 在测试样品中安装了一块来自 Lexar 的固态硬盘,存储空间为 1 TB。原则上,只要没有持续的负载,安装的固态硬盘就能充分发挥性能。这就是 Lexar 固态硬盘出现问题的地方,导致性能不得不大幅降低。这里的主要问题是散热垫连接不正确,因为这两个散热垫都不在它们应该在的位置上。我们在缺失的区域安装了相同厚度的散热垫,从而解决了问题。我们已经通知了制造商,以便他们进行纠正。据 Geekom 称,该问题正在得到解决,今后的批次产品应安装正确的导热垫。根据我们的研究,这个问题似乎不仅影响我们的设备。
Geekom XT12 Pro 可以安装两个固态硬盘。不过,这里必须注意外形尺寸,因为第二个 M.2 插槽仅支持长度为 42 毫米的 SATA 固态硬盘。
有关进一步的比较和基准测试,请参阅我们的 比较表.


| Drive Performance Rating - Percent | |
| Minisforum Neptune Series NAD9 | |
| Khadas Mind | |
| Geekom XT12 Pro | |
| Intel NUC 13 Pro Desk Edition Kit | |
| Minisforum EliteMini UM780 XTX | |
| Geekom A7 | |
| Average of class Mini PC | |
| Acemagic F2A | |
* ... smaller is better
Continuous read: DiskSpd Read Loop, Queue Depth 8
图形
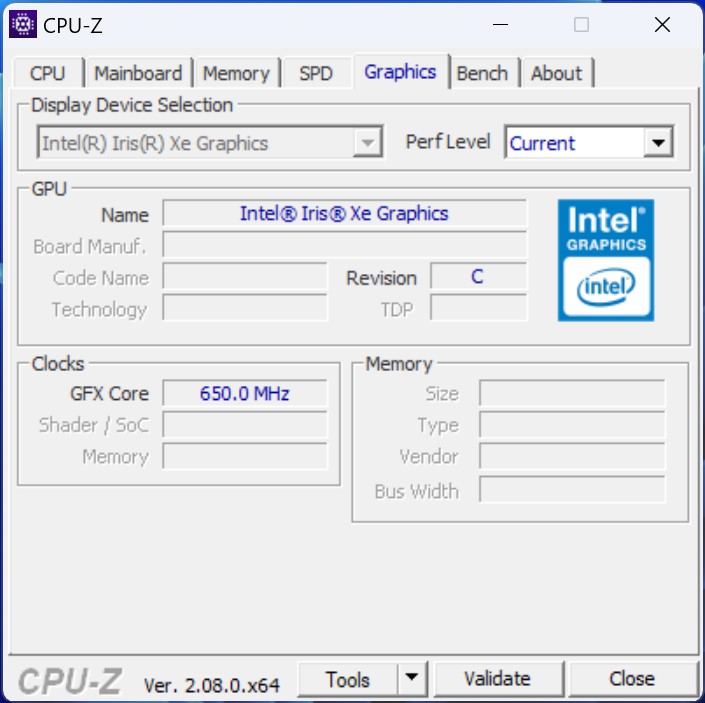
Intel Iris Xe Graphics G7 负责 3D 计算和图像输出。它拥有 96 个 EU,是该系列中速度最快的型号。不过,它现在已经是老型号了,明显不如竞争对手。英特尔只是在新一代流星湖处理器中更新了 iGPU 的架构。举个例子,你可以看看 Acemagic F2A.但即便如此,它也不如 AMD 的强大 iGPU。Geekom 自己提出了 A7 - 是其产品组合中极为小巧的设备,配备了 AMD Radeon 780M性能明显高于 Geekom XT12 Pro。
更多比较和基准测试请参见我们的 GPU 对比表.
| Geekom XT12 Pro, Intel Iris Xe Graphics G7 96EUs i9-12900H | Minisforum EliteMini UM780 XTX, AMD Radeon 780M R7 7840HS | Minisforum Neptune Series NAD9, Intel Iris Xe Graphics G7 96EUs i9-12900H | Acemagic F2A, Intel Arc 8-Core iGPU Ultra 7 155H | Geekom A7, AMD Radeon 780M R9 7940HS | Intel NUC 13 Pro Desk Edition Kit, Intel Iris Xe Graphics G7 96EUs i7-1360P | Khadas Mind, Intel Iris Xe Graphics G7 96EUs i7-1360P | Average of class Mini PC | |
|---|---|---|---|---|---|---|---|---|
| SPECviewperf 12 | 752% | -4% | 32% | 771% | -2% | -4% | 499% | |
| 1900x1060 3ds Max (3dsmax-05) | 40.1 | 85 112% | 40.9 2% | 49.8 24% | 84.7 111% | 41 2% | 37.8 -6% | 75.9 ? 89% |
| 1900x1060 Catia (catia-04) | 37.1 | 89.8 142% | 41.2 11% | 48.2 30% | 89 140% | 35.4 -5% | 39.4 6% | 63.9 ? 72% |
| 1900x1060 Creo (creo-01) | 26.9 | 51.1 90% | 9.64 -64% | 23.1 -14% | 55.4 106% | 27.4 2% | 7.37 -73% | 38.3 ? 42% |
| 1900x1060 Energy (energy-01) | 0.4 | 20.1 4925% | 0.41 3% | 0.91 128% | 20.7 5075% | 0.32 -20% | 0.46 15% | 14 ? 3400% |
| 1900x1060 Maya (maya-04) | 38.3 | 73.4 92% | 39.9 4% | 54.9 43% | 69.7 82% | 39.2 2% | 41.3 8% | 64.5 ? 68% |
| 1900x1060 Medical (medical-01) | 11.8 | 61.7 423% | 12.3 4% | 16.9 43% | 60.5 413% | 11.5 -3% | 12 2% | 29.3 ? 148% |
| 1900x1060 Showcase (showcase-01) | 16.6 | 30.1 81% | 17.9 8% | 18.2 10% | 30.3 83% | 17.7 7% | 21.2 28% | 34.5 ? 108% |
| 1900x1060 Solidworks (sw-03) | 45.3 | 113 149% | 47.2 4% | 42.7 -6% | 116 156% | 46 2% | 41.6 -8% | 73.9 ? 63% |
| SPECviewperf 13 | 202% | 0% | 21% | 190% | -0% | 3% | 123% | |
| 3ds Max (3dsmax-06) | 40.1 | 86.1 115% | 40.5 1% | 46.4 16% | 83.9 109% | 40.5 1% | 39 -3% | 75.2 ? 88% |
| Catia (catia-05) | 51.3 | 132 157% | 59.4 16% | 71.6 40% | 130 153% | 49 -4% | 57.1 11% | 90.4 ? 76% |
| Creo (creo-02) | 41.1 | 93.6 128% | 38.8 -6% | 29.6 -28% | 93.4 127% | 39.5 -4% | 37.5 -9% | 74.7 ? 82% |
| Energy (energy-02) | 4.5 | 25.8 473% | 4.27 -5% | 5.69 26% | 23.8 429% | 4.32 -4% | 4.34 -4% | 19.2 ? 327% |
| Maya (maya-05) | 47.5 | 108 127% | 44.2 -7% | 59.5 25% | 107 125% | 47.2 -1% | 46.3 -3% | 97.3 ? 105% |
| Medical (medical-02) | 14.4 | 79.8 454% | 14.5 1% | 29.7 106% | 77.6 439% | 15.2 6% | 16 11% | 39.4 ? 174% |
| Showcase (showcase-02) | 17.3 | 30 73% | 17.9 3% | 18.2 5% | 25.4 47% | 18.1 5% | 21.4 24% | 34 ? 97% |
| Solidworks (sw-04) | 57.1 | 107 87% | 55.8 -2% | 44.8 -22% | 109 91% | 55.8 -2% | 53.7 -6% | 77.6 ? 36% |
| SPECviewperf 2020 | 295% | -2% | 31% | 286% | -3% | 2% | 206% | |
| 3840x2160 Medical (medical-03) | 3.49 | 12 244% | 2.57 -26% | 5.05 45% | 11.1 218% | 2.66 -24% | 2.67 -23% | 8.21 ? 135% |
| 3840x2160 Energy (energy-03) | 3.05 | 15.4 405% | 3.02 -1% | 4.61 51% | 14.1 362% | 3.03 -1% | 2.97 -3% | 11.8 ? 287% |
| 3840x2160 Creo (creo-03) | 14.8 | 31.4 112% | 15.3 3% | 17.9 21% | 31.4 112% | 15.1 2% | 16.9 14% | 30.8 ? 108% |
| 3840x2160 CATIA (catia-06) | 7.78 | 24.4 214% | 8.2 5% | 10 29% | 24.8 219% | 7.87 1% | 8.82 13% | 18.7 ? 140% |
| 3840x2160 3ds Max (3dsmax-07) | 9.69 | 21 117% | 9.67 0% | 12.9 33% | 20.9 116% | 9.81 1% | 10.1 4% | 22.6 ? 133% |
| 3840x2160 Siemens NX (snx-04) | 6.29 | 61.5 878% | 6.69 6% | 5.7 -9% | 61.4 876% | 6.2 -1% | 6.01 -4% | 37.7 ? 499% |
| 3840x2160 Maya (maya-06) | 23.9 | 47.2 97% | 24 0% | 35.4 48% | 47 97% | 24.7 3% | 27.8 16% | 57.7 ? 141% |
| Total Average (Program / Settings) | 416% /
422% | -2% /
-2% | 28% /
28% | 416% /
421% | -2% /
-2% | 0% /
0% | 276% /
279% |
| 3DMark 05 Standard | 39673 points | |
| 3DMark 06 Standard Score | 30775 points | |
| 3DMark Vantage P Result | 25978 points | |
| 3DMark 11 Performance | 7503 points | |
| 3DMark Ice Storm Standard Score | 136854 points | |
| 3DMark Cloud Gate Standard Score | 24758 points | |
| 3DMark Fire Strike Score | 5036 points | |
| 3DMark Fire Strike Extreme Score | 2405 points | |
| 3DMark Time Spy Score | 1797 points | |
Help | ||
游戏性能
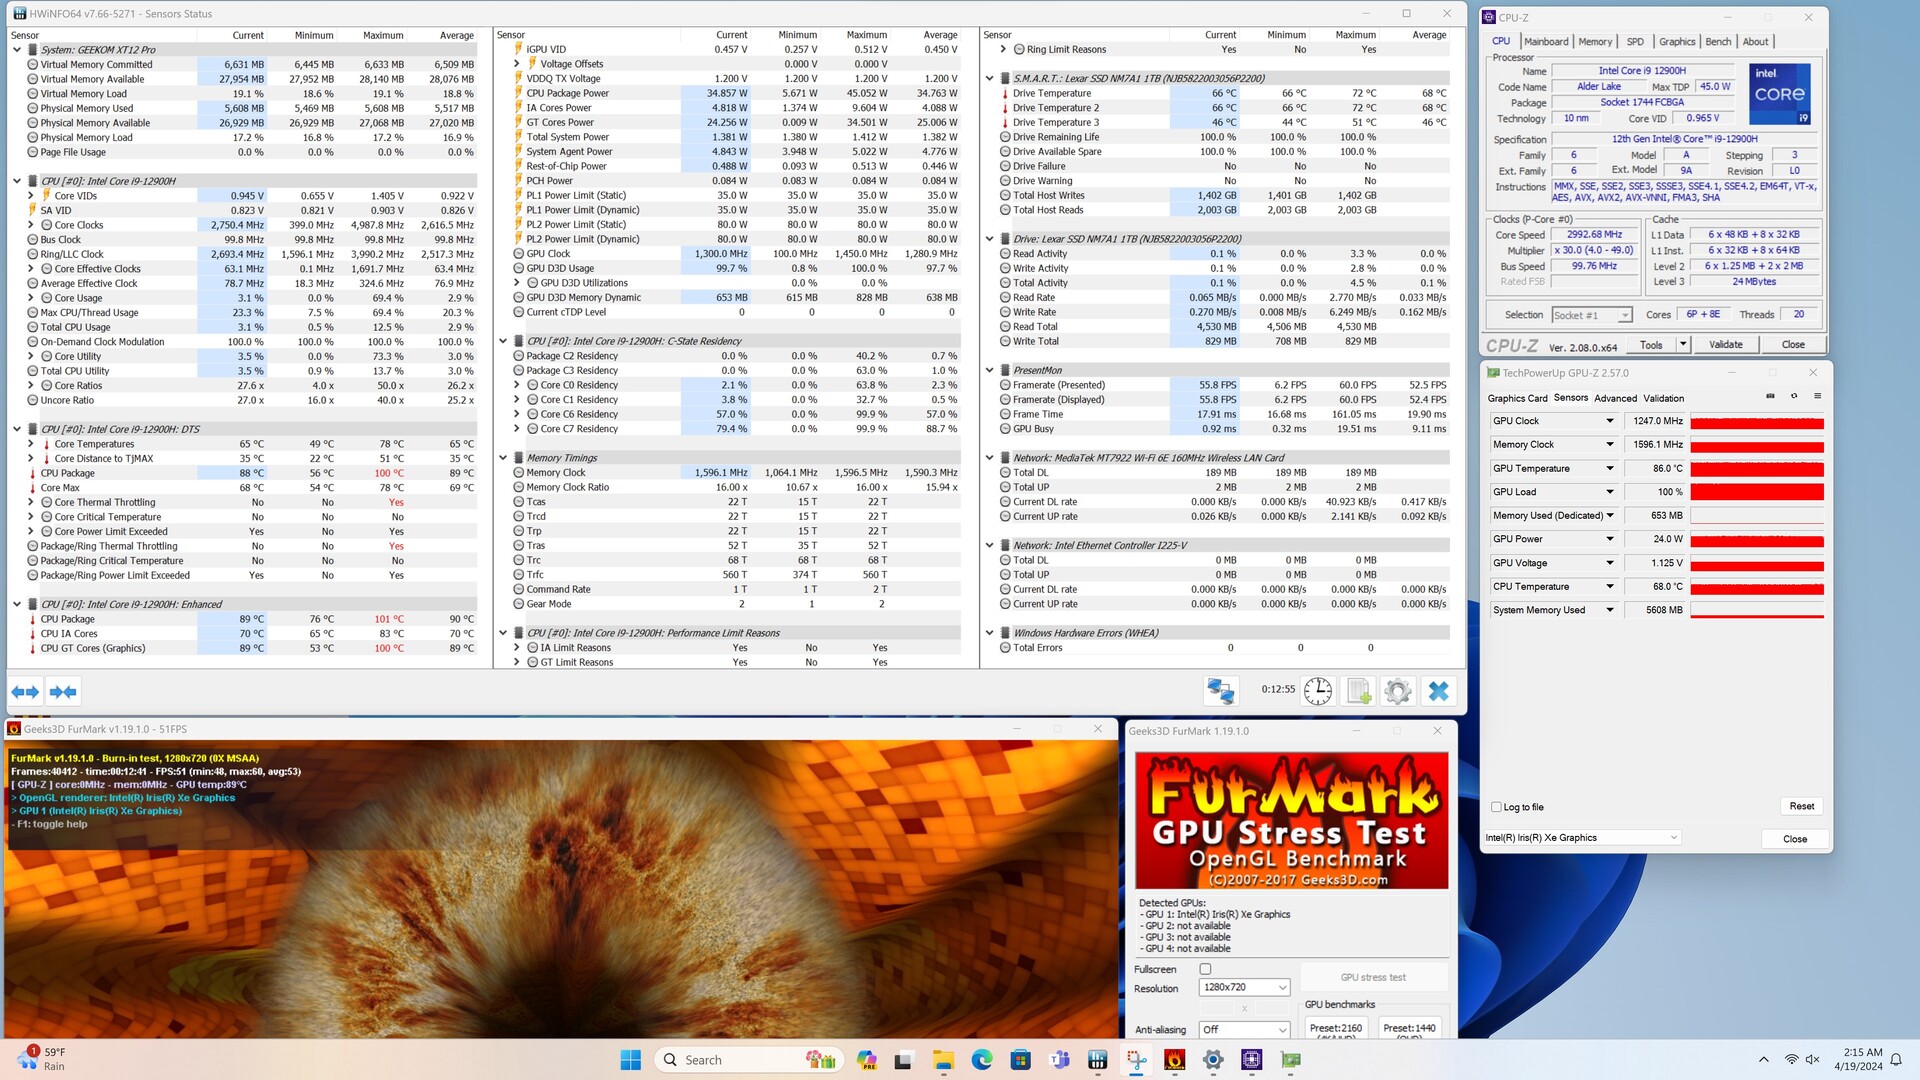
英特尔 Iris Xe iGPU 在大多数游戏中都显得力不从心。Geekom XT12 Pro 通常只能在低分辨率和最低预设值下达到可玩的帧率。在与竞争对手的性能对比中,我们还看到 Geekom XT12 Pro 的 iGPU 性能与 Khadas Mind和 Minisforum NAD9.不过,要想获得更强的 3D 性能,唯一的选择就是使用外置显卡,可以通过 USB4 连接。
| The Witcher 3 | |
| 1024x768 Low Graphics & Postprocessing | |
| Geekom A7 | |
| Minisforum EliteMini UM780 XTX | |
| Acemagic F2A | |
| Intel NUC 13 Pro Desk Edition Kit | |
| Minisforum Neptune Series NAD9 | |
| Geekom XT12 Pro | |
| Khadas Mind | |
| 1920x1080 High Graphics & Postprocessing (Nvidia HairWorks Off) | |
| Geekom A7 | |
| Minisforum EliteMini UM780 XTX | |
| Acemagic F2A | |
| Intel NUC 13 Pro Desk Edition Kit | |
| Khadas Mind | |
| Minisforum Neptune Series NAD9 | |
| Geekom XT12 Pro | |
Witcher 3 FPS chart
| low | med. | high | ultra | |
|---|---|---|---|---|
| The Witcher 3 (2015) | 87.7 | 58.9 | 31.4 | 15.6 |
| Dota 2 Reborn (2015) | 106.3 | 76.3 | 61.3 | 54.2 |
| Final Fantasy XV Benchmark (2018) | 42.2 | 22.7 | 16.4 | |
| X-Plane 11.11 (2018) | 55.5 | 42.2 | 36 | |
| Far Cry 5 (2018) | 50 | 26 | 23 | 22 |
| Strange Brigade (2018) | 81.7 | 37.9 | 30.9 | 24.8 |
| Shadow of the Tomb Raider (2018) | 39.6 | 21.7 | 18.8 | 18 |
| Far Cry New Dawn (2019) | 47 | 25 | 24 | 22 |
| Metro Exodus (2019) | 35.2 | 17.7 | 10.9 | |
| Borderlands 3 (2019) | 49.2 | 23.7 | 14.9 | 11.3 |
| F1 2020 (2020) | 84.5 | 43.7 | 34.2 | 22.5 |
| F1 2021 (2021) | 94.8 | 46.9 | 36.4 | 26.3 |
| Tiny Tina's Wonderlands (2022) | 28.8 | 22 | 14.4 | 11.2 |
| F1 22 (2022) | 42.5 | 38.4 | 28.7 | |
| F1 23 (2023) | 38.7 | 35.1 | 25.2 | |
| Cyberpunk 2077 2.2 Phantom Liberty (2023) | 16.4 | 13.1 | 11.5 | |
| Prince of Persia The Lost Crown (2024) | 120 | 81.3 | 73.1 |
配备两个 eGPU 的 Geekom XT12 Pro 性能测试
如果在 Geekom XT12 Pro 上配备 eGPU,3D 性能将大幅提升。我们仔细观察了 XT12 Pro 与 GPD G1、Razer Core X 和 NvidiaGeForce RTX 3060 Ti 的组合。与竞争对手相比,我们的测试样本显示出相当不错的性能。与 AMD 处理器相比,两个 eGPU 和英特尔处理器的组合始终能提供更好的性能。
这些测试仅代表使用 eGPU 时可能达到的性能。这些结果并不影响本测试的总体评分。
配备 GPD G1 的 Geekom XT12 Pro(AMD Radeon RX 7600M XT)
| Performance Rating - Percent | |
| Geekom XT12 Pro (GPD G1 Radeon RX 7600M XT @USB4) | |
| Geekom A7 (GPD G1 Radeon RX 7600M XT @USB4) | |
| Acemagic AM18 (GPD G1 Radeon RX 7600M XT @USB4) | |
| Aoostar GOD77 (GPD G1 Radeon RX 7600M XT @USB4) | |
| low | med. | high | ultra | QHD | 4K | |
|---|---|---|---|---|---|---|
| GTA V (2015) | 159.3 | 148.4 | 118.5 | 74 | 60.7 | 69.4 |
| The Witcher 3 (2015) | 254 | 184.3 | 125.4 | 70.5 | 55.6 | 47.3 |
| Dota 2 Reborn (2015) | 102.2 | 89.1 | 78.3 | 76.9 | 65 | |
| Final Fantasy XV Benchmark (2018) | 162.9 | 106.4 | 71.2 | 55.4 | 32.9 | |
| X-Plane 11.11 (2018) | 65.1 | 46 | 33.6 | 25.3 | ||
| Far Cry 5 (2018) | 142 | 123 | 115 | 107 | 82 | 45 |
| Strange Brigade (2018) | 204 | 154.6 | 149.6 | 138.5 | 108.1 | 62.1 |
| Shadow of the Tomb Raider (2018) | 125.4 | 89.9 | 86.4 | 79.8 | 61.7 | 34.5 |
| Far Cry New Dawn (2019) | 126 | 110 | 106 | 93 | 84 | 49 |
| Metro Exodus (2019) | 77.1 | 62.6 | 55.2 | 45.4 | 38.4 | 26.1 |
| Borderlands 3 (2019) | 138.5 | 98.6 | 73.8 | 60.5 | 46 | 27.1 |
| F1 2020 (2020) | 255 | 184.1 | 156.8 | 108.3 | 86.7 | 54.9 |
| F1 2021 (2021) | 239 | 203 | 131.8 | 81.5 | 63.3 | 31.4 |
| God of War (2022) | 93.9 | 84.4 | 70 | 52.1 | 43.3 | 30.2 |
| GRID Legends (2022) | 96.5 | 82.3 | 67.3 | 60.2 | 55.7 | 44 |
| Tiny Tina's Wonderlands (2022) | 164.8 | 127.1 | 85.2 | 68.5 | 51.1 | 22.1 |
| F1 22 (2022) | 101.6 | 96.9 | 76.4 | 39.9 | 27.8 | 13.5 |
| F1 23 (2023) | 120.1 | 126.7 | 106.1 | 32.7 | 13.1 | 6.6 |
| Cyberpunk 2077 2.2 Phantom Liberty (2023) | 87.3 | 74.5 | 64.9 | 59.1 | 39.9 | 18.5 |
| Assassin's Creed Mirage (2023) | 75 | 68 | 63 | 46 | 37 | 23 |
| Total War Pharaoh (2023) | 280.6 | 158 | 93.4 | 46.7 | 45.9 | 32.1 |
| Avatar Frontiers of Pandora (2023) | 46 | 44 | 36 | 30 | 20 | 9.5 |
配备 Razer Core X 和 NvidiaGeForce RTX 3060 Ti 的 Geekom XT12 Pro
| Performance Rating - Percent | |
| Geekom A7 (Nvidia GeForce RTX 3060 Ti FE) | |
| Intel NUC 13 Pro Kit NUC13ANK (Nvidia GeForce RTX 3060 Ti FE TB3) | |
| Acemagic AM18 (Nvidia GeForce RTX 3060 Ti FE) | |
| Geekom XT12 Pro (Nvidia GeForce RTX 3060 Ti FE) | |
| Minisforum Venus Series UM790 Pro (Nvidia GeForce RTX 3060 Ti FE TB3) | |
| Ace Magician AM08Pro (Nvidia GeForce RTX 3060 Ti FE TB3) | |
| low | med. | high | ultra | QHD | 4K | |
|---|---|---|---|---|---|---|
| GTA V (2015) | 177.3 | 173.2 | 164.2 | 98.5 | 89.8 | 103.3 |
| The Witcher 3 (2015) | 304 | 208 | 150.6 | 72.9 | 62.5 | 71.8 |
| Dota 2 Reborn (2015) | 153.2 | 134.5 | 121.1 | 109.9 | 70.4 | |
| Final Fantasy XV Benchmark (2018) | 159.7 | 116.9 | 80.2 | 49.3 | 31.6 | |
| X-Plane 11.11 (2018) | 126.2 | 107.4 | 84.1 | 71.3 | ||
| Far Cry 5 (2018) | 154 | 131 | 125 | 119 | 99 | 58 |
| Strange Brigade (2018) | 205 | 155.9 | 153 | 149.1 | 128.3 | 84.1 |
| Shadow of the Tomb Raider (2018) | 150.3 | 103.1 | 99.4 | 94 | 77.2 | 47.8 |
| Far Cry New Dawn (2019) | 130 | 114 | 111 | 99 | 91 | 59 |
| Metro Exodus (2019) | 142.2 | 90.4 | 68.4 | 51.7 | 45.4 | 33.5 |
| Borderlands 3 (2019) | 149.6 | 127 | 101.8 | 83.3 | 64.7 | 38.5 |
| F1 2020 (2020) | 209 | 122.3 | 123.5 | 101.8 | 88.5 | 59.9 |
| F1 2021 (2021) | 141.2 | 108.3 | 68.7 | 51.5 | 48.5 | 40.4 |
| God of War (2022) | 109.9 | 96.4 | 81.2 | 62 | 55.8 | 39.7 |
| GRID Legends (2022) | 115.6 | 98.6 | 82.3 | 70.4 | 63.7 | 50.7 |
| Tiny Tina's Wonderlands (2022) | 171.2 | 136.3 | 101 | 79.7 | 60.9 | 34 |
| F1 22 (2022) | 60 | 55.2 | 42.8 | 27.2 | 26.6 | 19.5 |
| F1 23 (2023) | 66 | 64.2 | 53 | 33.5 | 31.2 | 13.4 |
| Baldur's Gate 3 (2023) | 113.3 | 90.1 | 78.5 | 78.2 | 61.2 | 36.7 |
| Cyberpunk 2077 2.2 Phantom Liberty (2023) | 83.8 | 78.9 | 70.1 | 63.3 | 44.5 | 22 |
| Assassin's Creed Mirage (2023) | 86 | 82 | 77 | 62 | 52 | 37 |
| Total War Pharaoh (2023) | 303.7 | 170.9 | 101.8 | 76.5 | 62.2 | 38.9 |
| Avatar Frontiers of Pandora (2023) | 63 | 62 | 62 | 50 | 43 | 31 |
| F1 24 (2024) | 75 | 74.1 | 60.4 | 41.8 | 36 | 18.6 |
排放 - 不太安静,但相当经济
噪音排放
遗憾的是,Geekom XT12 Pro 并不是最安静的设备之一。该设备只有在空转时才会发出很小的噪音,而且只能听到风扇发出的轻微噪音。但在负载情况下,这种情况就会发生变化,因为这款迷你电脑的噪音明显高达 44.2 dB(A)。在游戏过程中,我们甚至能测出高达 47.2 分贝(A)的噪音。不过,在游戏过程中,我们无法检测到持续的高声压级。结果在 39 到 47.2 dB(A) 之间波动。
Noise Level
| Idle |
| 28 / 28.1 / 28.5 dB(A) |
| Load |
| 39.6 / 44.2 dB(A) |
 | ||
30 dB silent 40 dB(A) audible 50 dB(A) loud |
||
min: | ||
| Geekom XT12 Pro i9-12900H, Iris Xe G7 96EUs | Minisforum EliteMini UM780 XTX R7 7840HS, Radeon 780M | Minisforum Neptune Series NAD9 i9-12900H, Iris Xe G7 96EUs | Acemagic F2A Ultra 7 155H, Arc 8-Core | Geekom A7 R9 7940HS, Radeon 780M | Intel NUC 13 Pro Desk Edition Kit i7-1360P, Iris Xe G7 96EUs | Khadas Mind i7-1360P, Iris Xe G7 96EUs | |
|---|---|---|---|---|---|---|---|
| Noise | 8% | 2% | 0% | -8% | 0% | -14% | |
| off / environment * | 25.4 | 24.8 2% | 30.2 -19% | 24.9 2% | 25.4 -0% | 25.2 1% | 25.2 1% |
| Idle Minimum * | 28 | 28.5 -2% | 30.5 -9% | 25.4 9% | 33.3 -19% | 28.1 -0% | 34.4 -23% |
| Idle Average * | 28.1 | 28.5 -1% | 30.5 -9% | 25.7 9% | 33.6 -20% | 28.2 -0% | 34.4 -22% |
| Idle Maximum * | 28.5 | 28.7 -1% | 30.5 -7% | 25.7 10% | 33.7 -18% | 28.3 1% | 34.5 -21% |
| Load Average * | 39.6 | 32.4 18% | 30.5 23% | 47.8 -21% | 43.3 -9% | 42 -6% | 44.7 -13% |
| Witcher 3 ultra * | 47.2 | 32.7 31% | 45.23 4% | 43.2 8% | 49 -4% | ||
| Load Maximum * | 44.2 | 39.6 10% | 30.5 31% | 49 -11% | 43.3 2% | 42.1 5% | 50.4 -14% |
* ... smaller is better
温度
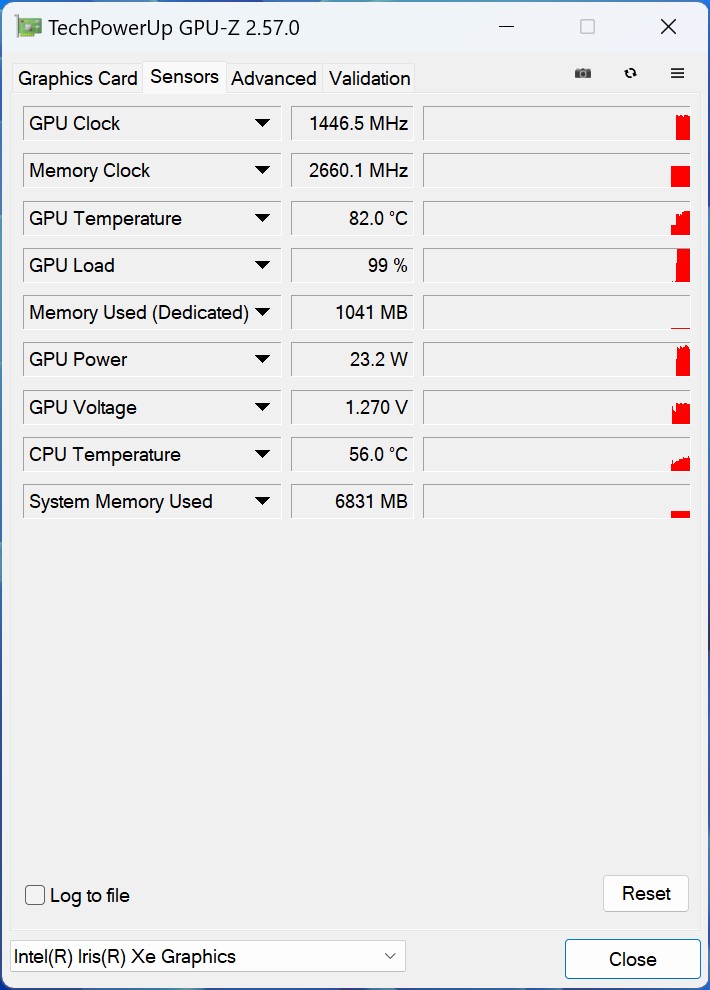
Geekom XT12 Pro 在负载情况下发热明显。微型电脑顶部的发热明显高于底部。记录的温度都在合理范围内,无需担心。英特尔酷睿 i9-12900H 本身就有些不同。不过,XT12 Pro 只在短时间内达到这些高值。在持续负载的情况下,SoC 的功耗降至 35 瓦,导致处理器的平均温度略高于 80 °C。这意味着,尽管由于散热装置较小,Turbo 利用率非常低,但 SoC 的运行仍符合英特尔的规格要求。
为了弄清温度过高的原因,我们在测试后拆卸了一次散热器,以排除导热膏的问题。实际上,我们并没有找到问题所在,即使是新的导热膏也无法确保在负载情况下降低热点温度。

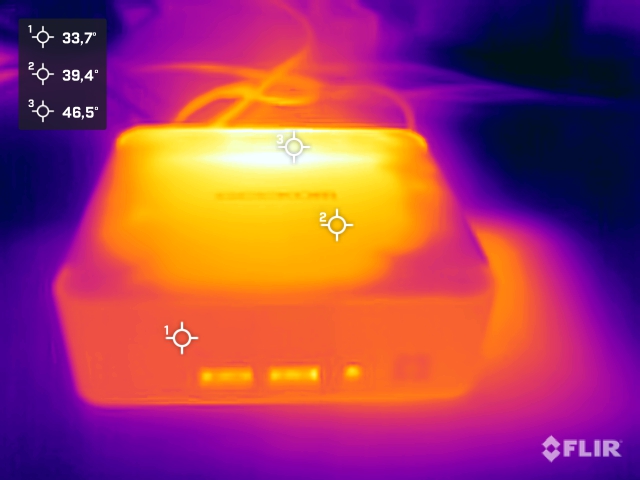
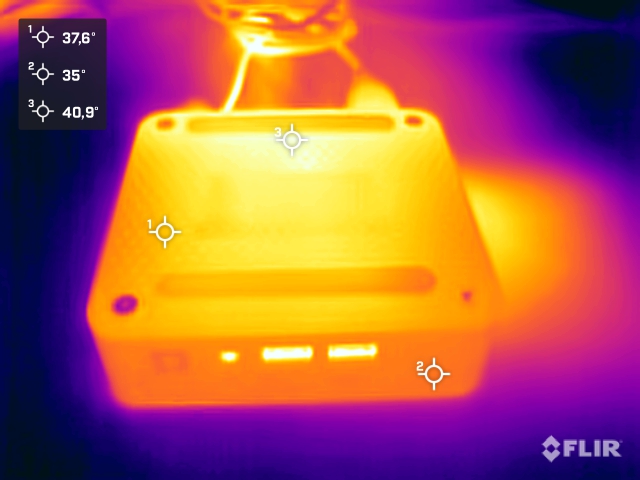
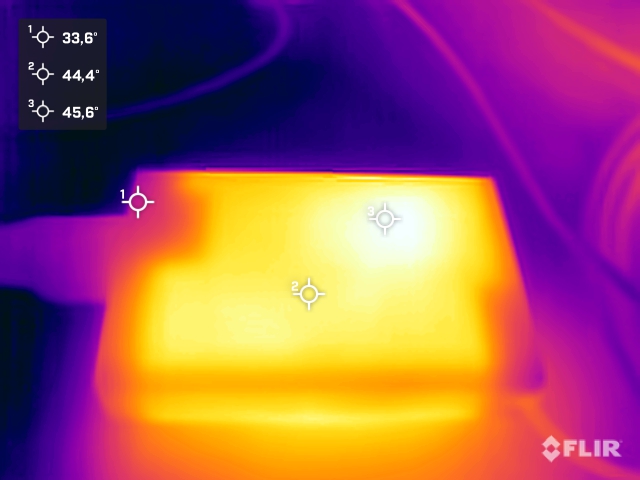
(-) The maximum temperature on the upper side is 47.5 °C / 118 F, compared to the average of 35.7 °C / 96 F, ranging from 21.6 to 69.5 °C for the class Mini PC.
(+) The bottom heats up to a maximum of 39.9 °C / 104 F, compared to the average of 36.1 °C / 97 F
(+) In idle usage, the average temperature for the upper side is 30.7 °C / 87 F, compared to the device average of 32.3 °C / 90 F.
耗电量
Geekom 本身将 XT12 Pro 描述为一款非常高效、经济的微型电脑。尽管闲置模式下的能耗与论文中的描述不尽相符,但我们在很大程度上同意这一说法。英特尔 NUC 13 也达到了几乎相同的数值。 英特尔 NUC 13在我们的测试中也达到了几乎相同的数值。另一方面,Geekom 显示,与 A7 相比,情况可能有所不同。 A7在这里。不过,在峰值时,我们只看到了 87.8 瓦的节制功率,这使得我们的测试样品相当经济。在平均负载情况下,能耗需求降至约 53 瓦,这也是一个不错的结果。电源由一个 120 瓦的小型电源装置提供。电源装置的功率有些过大,如果是 90 瓦的电源装置就足够了。

| Off / Standby | |
| Idle | |
| Load |
|
Key:
min: | |
| Geekom XT12 Pro i9-12900H, Iris Xe G7 96EUs | Minisforum EliteMini UM780 XTX R7 7840HS, Radeon 780M | Minisforum Neptune Series NAD9 i9-12900H, Iris Xe G7 96EUs | Acemagic F2A Ultra 7 155H, Arc 8-Core | Geekom A7 R9 7940HS, Radeon 780M | Intel NUC 13 Pro Desk Edition Kit i7-1360P, Iris Xe G7 96EUs | Khadas Mind i7-1360P, Iris Xe G7 96EUs | Average Intel Iris Xe Graphics G7 96EUs | Average of class Mini PC | |
|---|---|---|---|---|---|---|---|---|---|
| Power Consumption | -15% | -44% | -17% | 20% | 3% | 3% | 17% | -21% | |
| Idle Minimum * | 5.7 | 8.5 -49% | 12.1 -112% | 9.1 -60% | 3.8 33% | 7 -23% | 7.8 -37% | 5.41 ? 5% | 9.54 ? -67% |
| Idle Average * | 9.5 | 10.5 -11% | 13 -37% | 10.3 -8% | 4.8 49% | 9.2 3% | 10.9 -15% | 8.6 ? 9% | 11.7 ? -23% |
| Idle Maximum * | 16.5 | 12.9 22% | 18.2 -10% | 14.4 13% | 6.5 61% | 11.8 28% | 11.8 28% | 10.9 ? 34% | 15 ? 9% |
| Load Average * | 53.3 | 67.2 -26% | 70.6 -32% | 54.9 -3% | 71.9 -35% | 45 16% | 39.2 26% | 45.4 ? 15% | 59.1 ? -11% |
| Load Maximum * | 87.8 | 97.2 -11% | 113 -29% | 110.4 -26% | 94.7 -8% | 97.2 -11% | 76.4 13% | 67.6 ? 23% | 100.1 ? -14% |
* ... smaller is better
Power consumtion with the external monitor
Power consumtion with the external monitor
Pros
Cons
结论:价格高昂,但性能稳定

Geekom XT12 Pro 无疑是一款功能强大的迷你电脑。它搭载了 英特尔酷睿 i9-12900H虽然它已不再是最新的 CPU,但在 CPU 性能方面仍可与更先进的竞争对手媲美。Geekom XT12 Pro 目前最大的劣势是 3D 性能。由于改进了 iGPU,基于 Meteor Lake 系列的新机型可以提供明显更好的性能。同样的情况也适用于 AMD 的 Radeon 780M.不依赖于此的用户很容易忽略这一点。Geekom 的做工非常出色。在选材方面也没有什么可抱怨的。
Geekom XT12 Pro 是一款功能强大的迷你电脑,其强大的功能给人留下了深刻的印象。不过,性价比并不是 Geekom XT12 Pro 的强项。
Geekom XT12 Pro 在外部接口的选择上尤其令人印象深刻。两个 USB4 接口比大多数竞争对手提供的都要多。毕竟,有了合适的配件,低 3D 性能就能得到明显提升。其余配置包括 32 GB DDR4 内存和 1 TB 固态硬盘,这些配置都很不错,很好地完善了整体方案。说到能效,可能会出现意见分歧,因为在我们的测试样本中,空闲模式下的能效值相对较高,这在一定程度上影响了整体效果。毕竟,制造商在这里宣传的是一款特别高效的设备。我们并不想完全否认 Geekom XT12 Pro 的这一点,因为在负载情况下,这台迷你电脑显示出了它的经济性。至于是有意为之,还是因为散热装置太小的缘故,我们暂且不论。
最后,我们再来看看购买价格:Geekom 为 XT12 Pro 报出的零售价为 899 欧元,但实际情况往往并非如此,因为总会有特价。这意味着,在我们的测试配置中,您目前需要支付 749 欧元购买 Geekom XT12 Pro。与其他迷你电脑相比,目前的购买价格相当高。同样的价格,你也可以买到搭载AMD Ryzen 7 7840HS 的 Geekom A7,它的性能肯定比本次评测的 XT12 Pro 更好。这也是 Geekom 有点自不量力,让 XT12 Pro 失去吸引力的地方。因此,与 Geekom A7 相比,Geekom XT12 Pro 的价格应该便宜得多,这样才能引起人们的兴趣。
价格和供应情况
Geekom XT12 Pro 目前只有我们的测试配置,可从Geekom或亚马逊订购。售价为 749 欧元。目前使用代码 - Geekom-Shop 可享受 5% 的折扣: ntcpr5
亚马逊 ntcpr5XT12
Geekom XT12 Pro
- 07/30/2024 v8
Sebastian Bade
Transparency
The selection of devices to be reviewed is made by our editorial team. The test sample was given to the author by the manufacturer free of charge for the purposes of review. There was no third-party influence on this review, nor did the manufacturer receive a copy of this review before publication. There was no obligation to publish this review. We never accept compensation or payment in return for our reviews. As an independent media company, Notebookcheck is not subjected to the authority of manufacturers, retailers or publishers.
This is how Notebookcheck is testing
Every year, Notebookcheck independently reviews hundreds of laptops and smartphones using standardized procedures to ensure that all results are comparable. We have continuously developed our test methods for around 20 years and set industry standards in the process. In our test labs, high-quality measuring equipment is utilized by experienced technicians and editors. These tests involve a multi-stage validation process. Our complex rating system is based on hundreds of well-founded measurements and benchmarks, which maintains objectivity. Further information on our test methods can be found here.
