

敞篷车内的 Lunar Lake 与 Snapdragon - Microsoft Surface Pro OLED for Business 评测
ARM 上的 Windows 遭受又一次打击?
微软现在也推出了配备英特尔 Lunar Lake 处理器的 Surface Pro 可转换机型,但专门面向企业客户。我们测试了 OLED 版本,并调查了私人客户是否会错过更好的机型。Andreas Osthoff, 👁 Andreas Osthoff (translated by DeepL / Ninh Duy) Published 🇺🇸 🇩🇪 ...
结论:英特尔和高通公司在 Surface Pro 上的合作更加紧密
虽然我们对 笔记本电脑 15的结论仍然是英特尔机型更胜一筹,但说到可转换的 Surface Pro OLED,情况就有些复杂了。从原理上讲,Lunar Lake 版本自然具有兼容性更好、GPU 性能更高的优势。它还支持 Thunderbolt 4,而且令人惊讶的是,它的风扇行为也与众不同。在日常使用中,即使使用最佳性能模式,你可能也听不到英特尔变体的风扇声。
另一方面,骁龙处理器的多核性能明显更高,CPU 效率也普遍更高。此外,ARM 型号在电池续航时间方面也有一些优势,而且微软只为 ARM 版本提供 5G 模块,这可能是一个巨大的优势,尤其是对于 Surface Pro 这样的移动设备来说。
总而言之,我们必须再次批评微软的产品政策。似乎企业客户不想要 ARM 设备,但私人客户却几乎被迫购买高通机型。虽然作为个人用户也可以购买 Surface for Business 产品,但高昂的价格(如果大量购买,企业客户一般不会支付高昂的价格)让英特尔机型对个人用户毫无吸引力。以我们的测试设备为例,不含键盘盖的价格超过 2400 美元,而相应的 ARM 型号售价约为 2100 美元。微软真应该让用户在高通和英特尔之间做出选择。
Pros
Cons

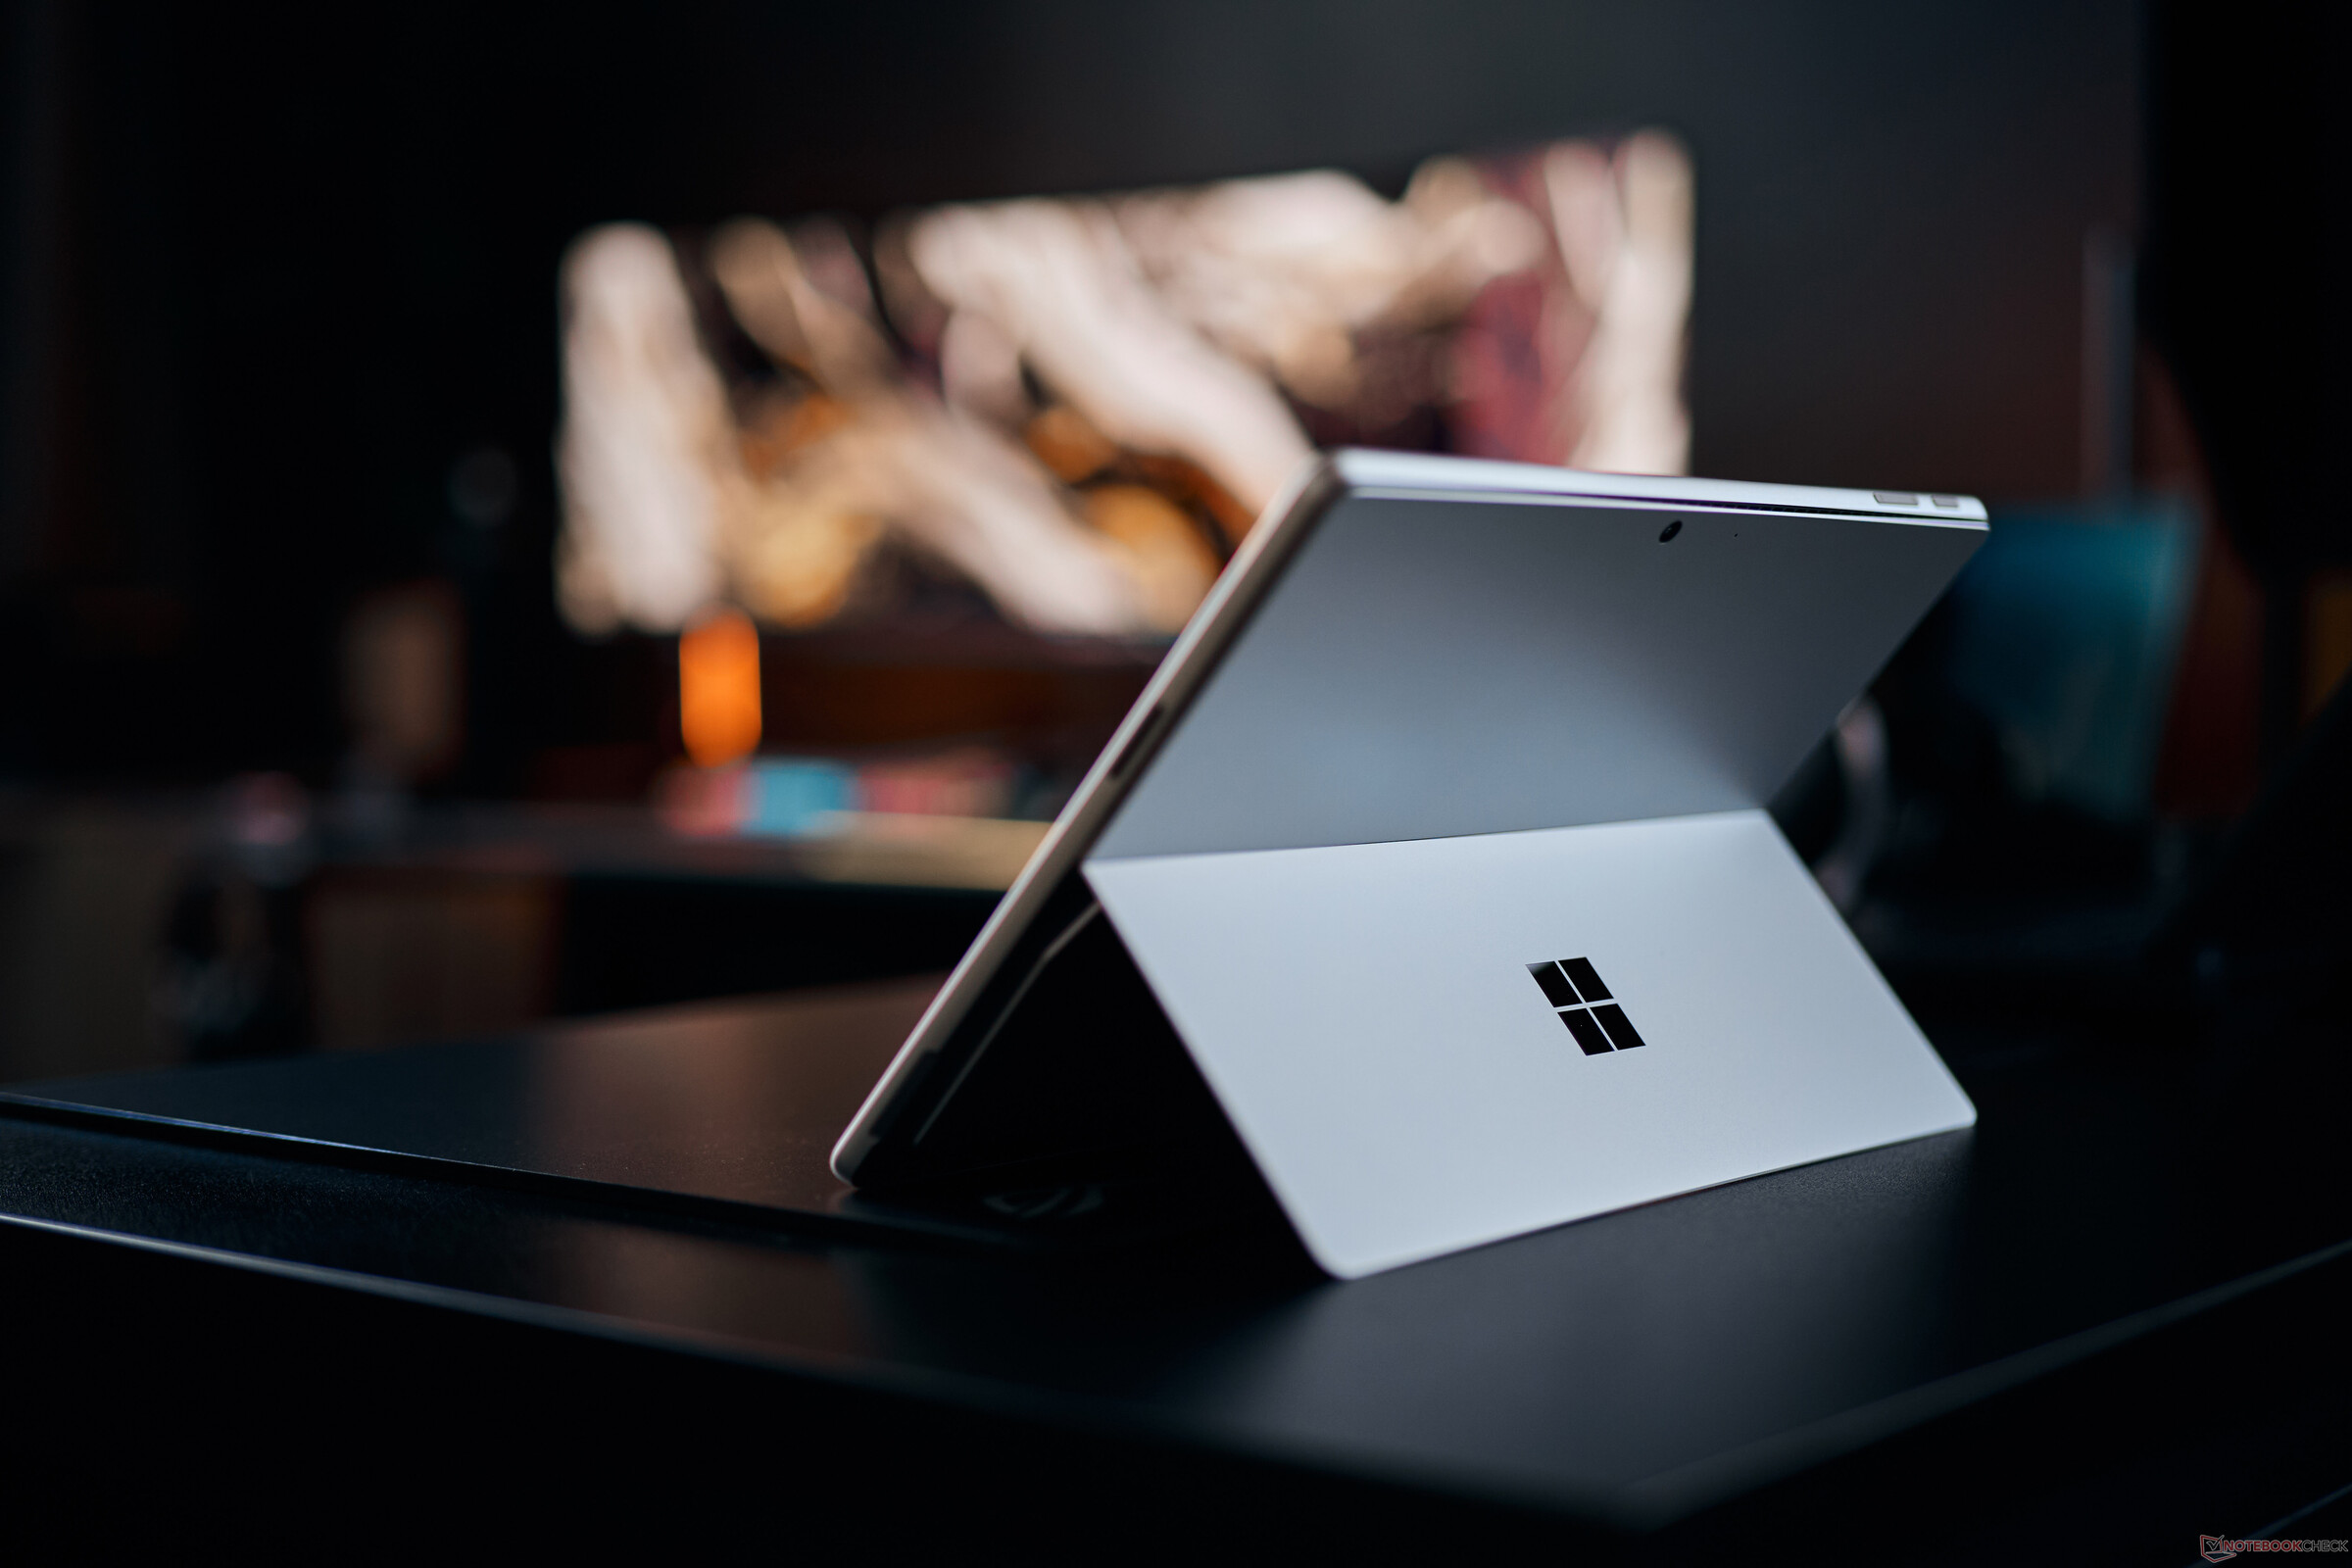
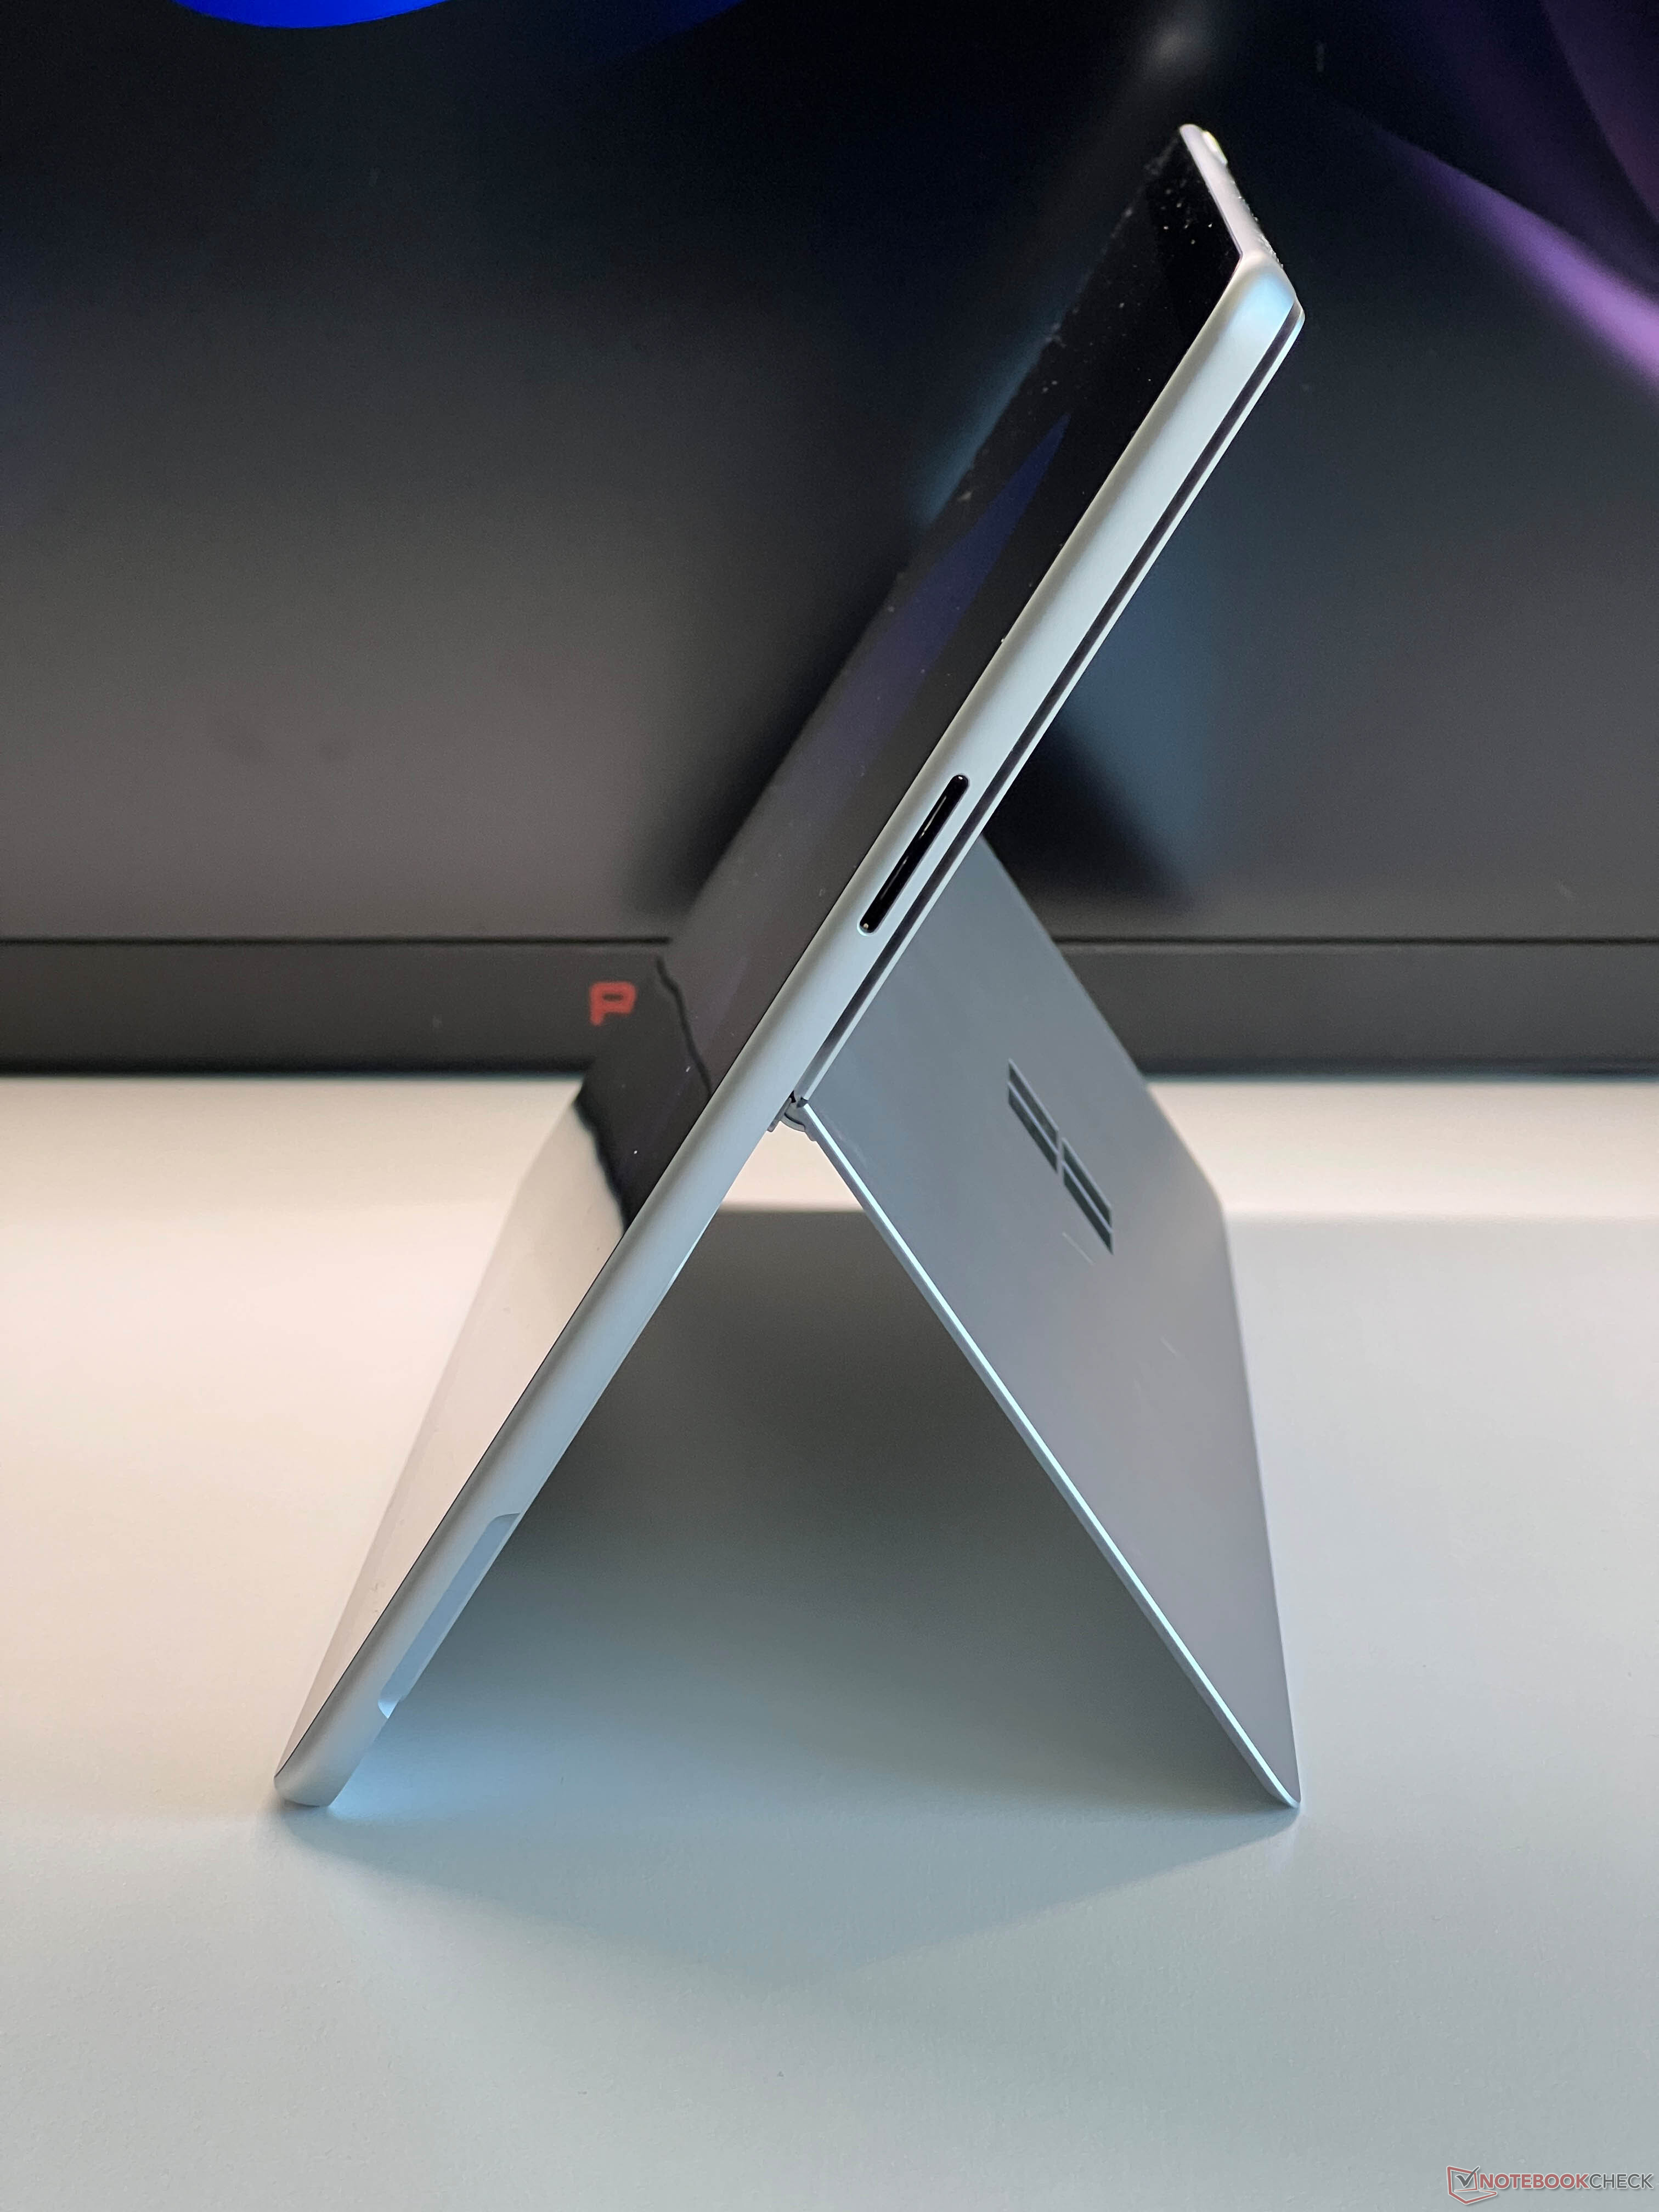
去年,Surface Pro OLED 独家采用了高通公司的新型骁龙处理器。不过,与 Surface Laptop 一样,今年 2 月又发布了搭载英特尔 Lunar Lake 处理器的机型,专门面向企业客户,但私人客户也可以购买。我们测试的是配备 酷睿至尊 7 268V、32 GB 内存、1 TB 固态硬盘和 120 Hz OLED 屏幕的版本,MRSP 为 2499.99 美元。在下面的评测中,我们将主要介绍与 ARM 机型相比的不同之处。有关其外壳和 OLED 显示屏的更多详细信息,请参阅我们对 ARM 版的详细评测:
规格
与配备骁龙 SoC 的 Surface Pro 相比的差异
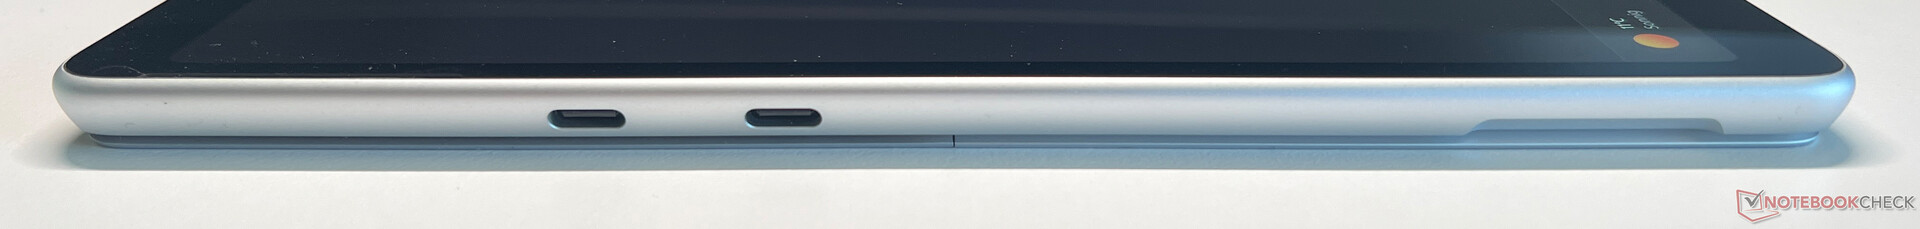
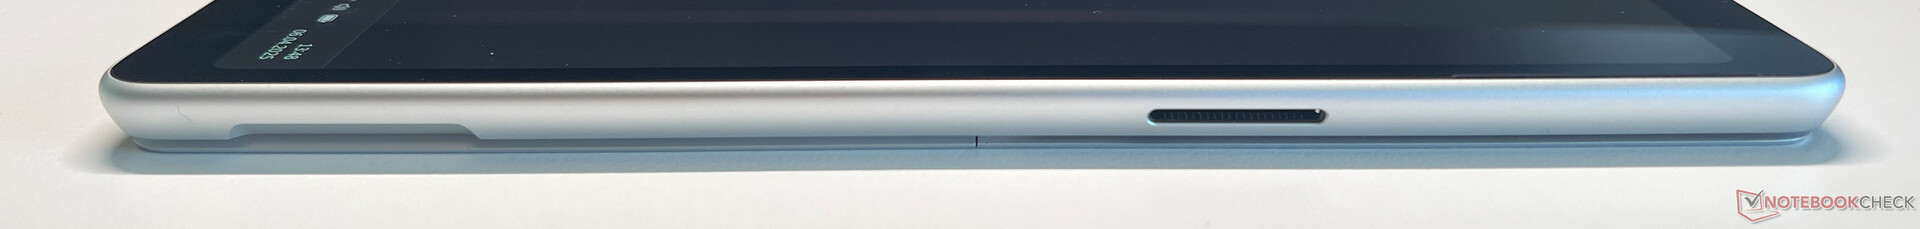
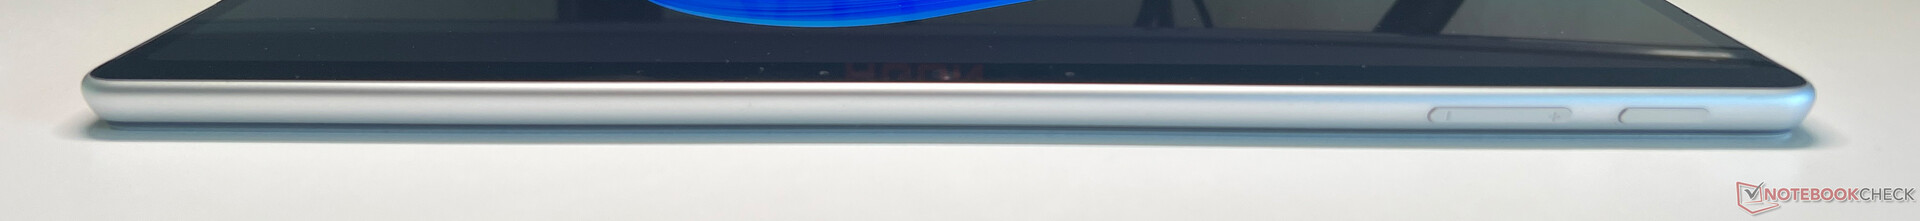
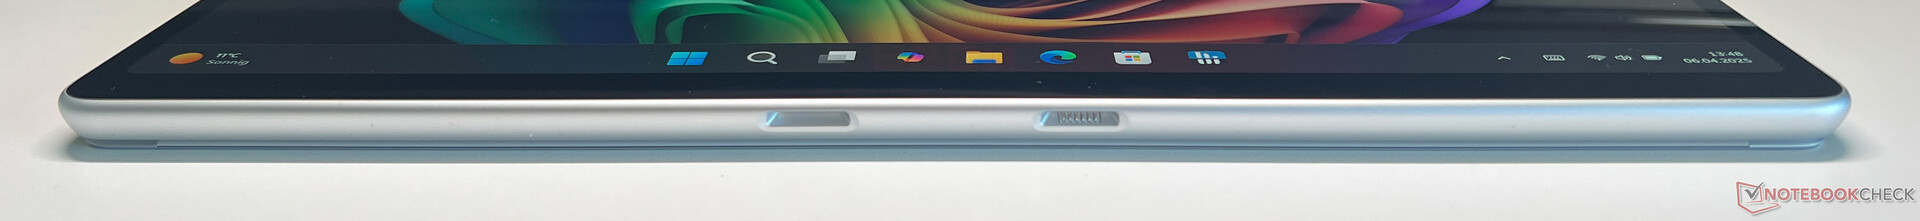
与 骁龙机型在笔记本电脑外壳方面没有区别。英特尔版本支持 Thunderbolt 4,但在其他方面,包括 Wi-Fi 7 和高分辨率摄像头在内的功能完全相同。两款产品都获得了 Copilot+ 认证,这意味着它们都支持先进的 Windows AI 功能。骁龙机型现在可选配 5G 模块,而英特尔机型则没有。


| Networking | |
| Microsoft Surface Pro OLED Lunar Lake | |
| iperf3 transmit AXE11000 | |
| iperf3 receive AXE11000 | |
| Microsoft Surface Pro OLED Copilot+ | |
| iperf3 transmit AXE11000 | |
| iperf3 receive AXE11000 | |
| Dell Latitude 7350 Detachable | |
| iperf3 transmit AXE11000 | |
| iperf3 receive AXE11000 | |
| iperf3 transmit AXE11000 6GHz | |
| iperf3 receive AXE11000 6GHz | |
| Asus ProArt PZ13 HT5306 | |
| iperf3 transmit AXE11000 | |
| iperf3 receive AXE11000 | |
| Minisforum V3 | |
| iperf3 transmit AXE11000 | |
| iperf3 receive AXE11000 | |
| iperf3 transmit AXE11000 6GHz | |
| iperf3 receive AXE11000 6GHz | |


可持续性
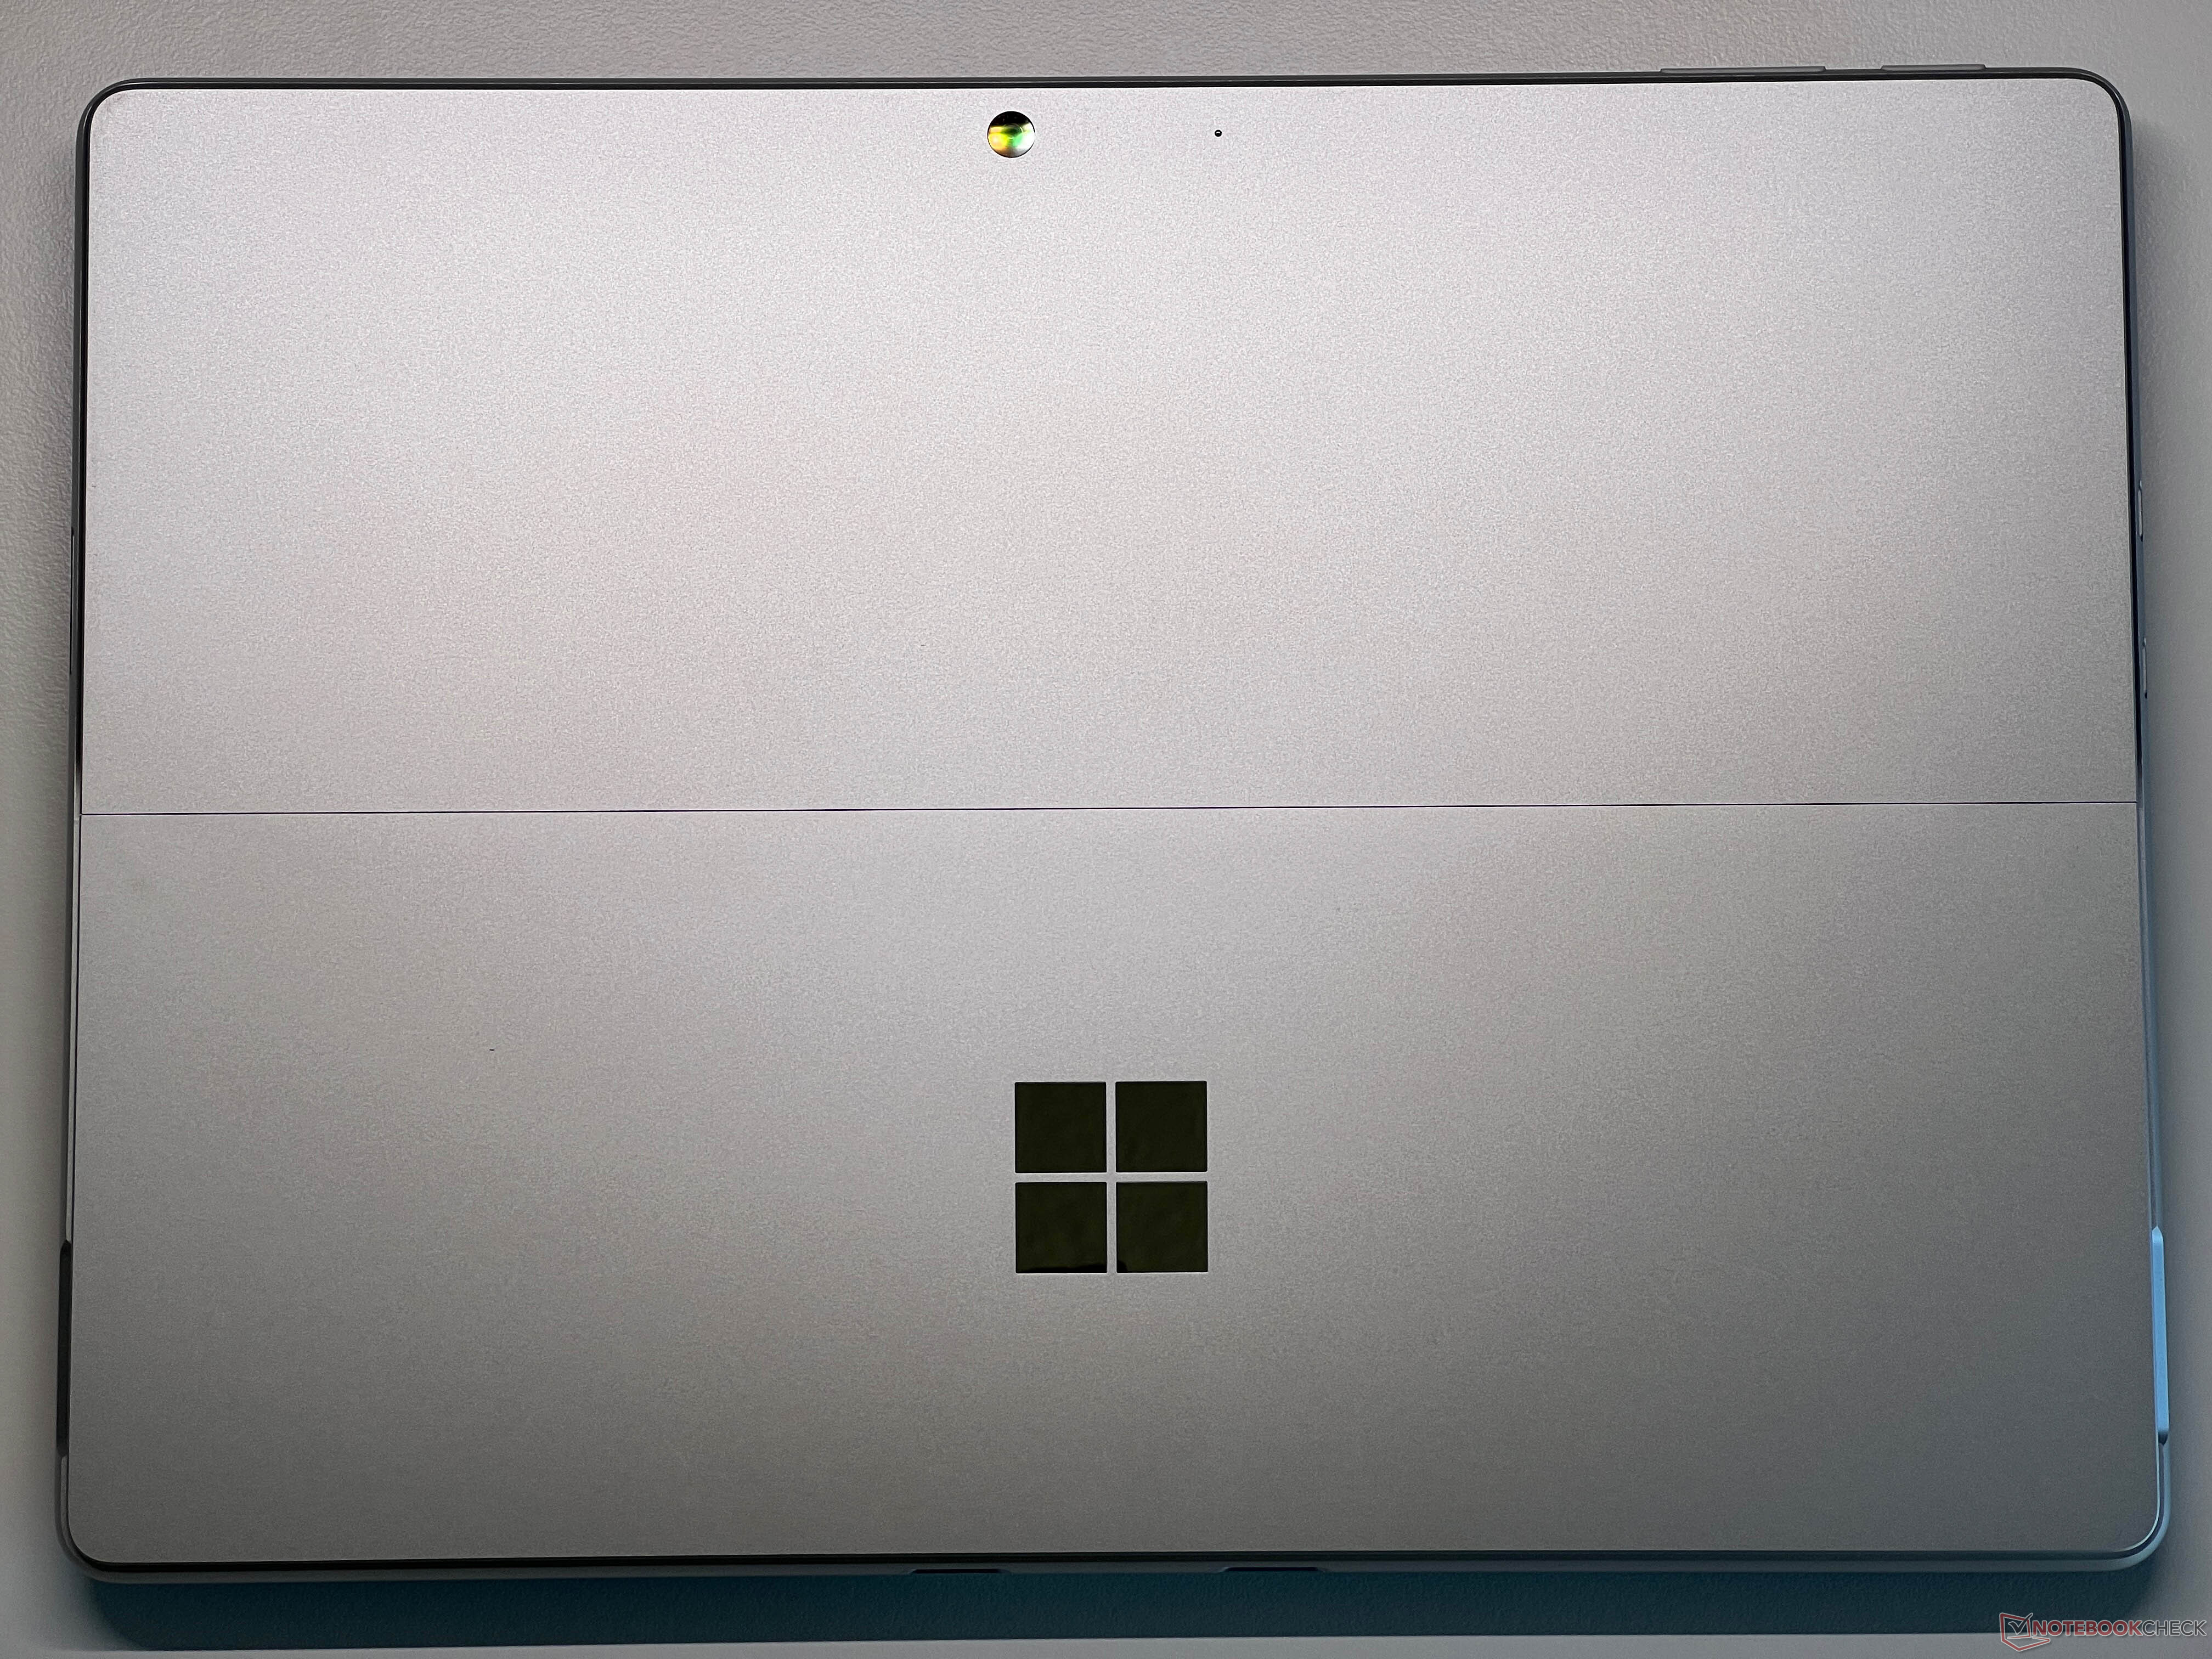
Surface Pro 通过了 "能源之星 "认证,微软在其网站上提供了大量关于该设备及其包装使用可回收材料的信息(例如,外壳由 89.1% 的可回收材料制成)。其包装完全由纸张和纸板制成。
显示屏 - OLED,120 赫兹
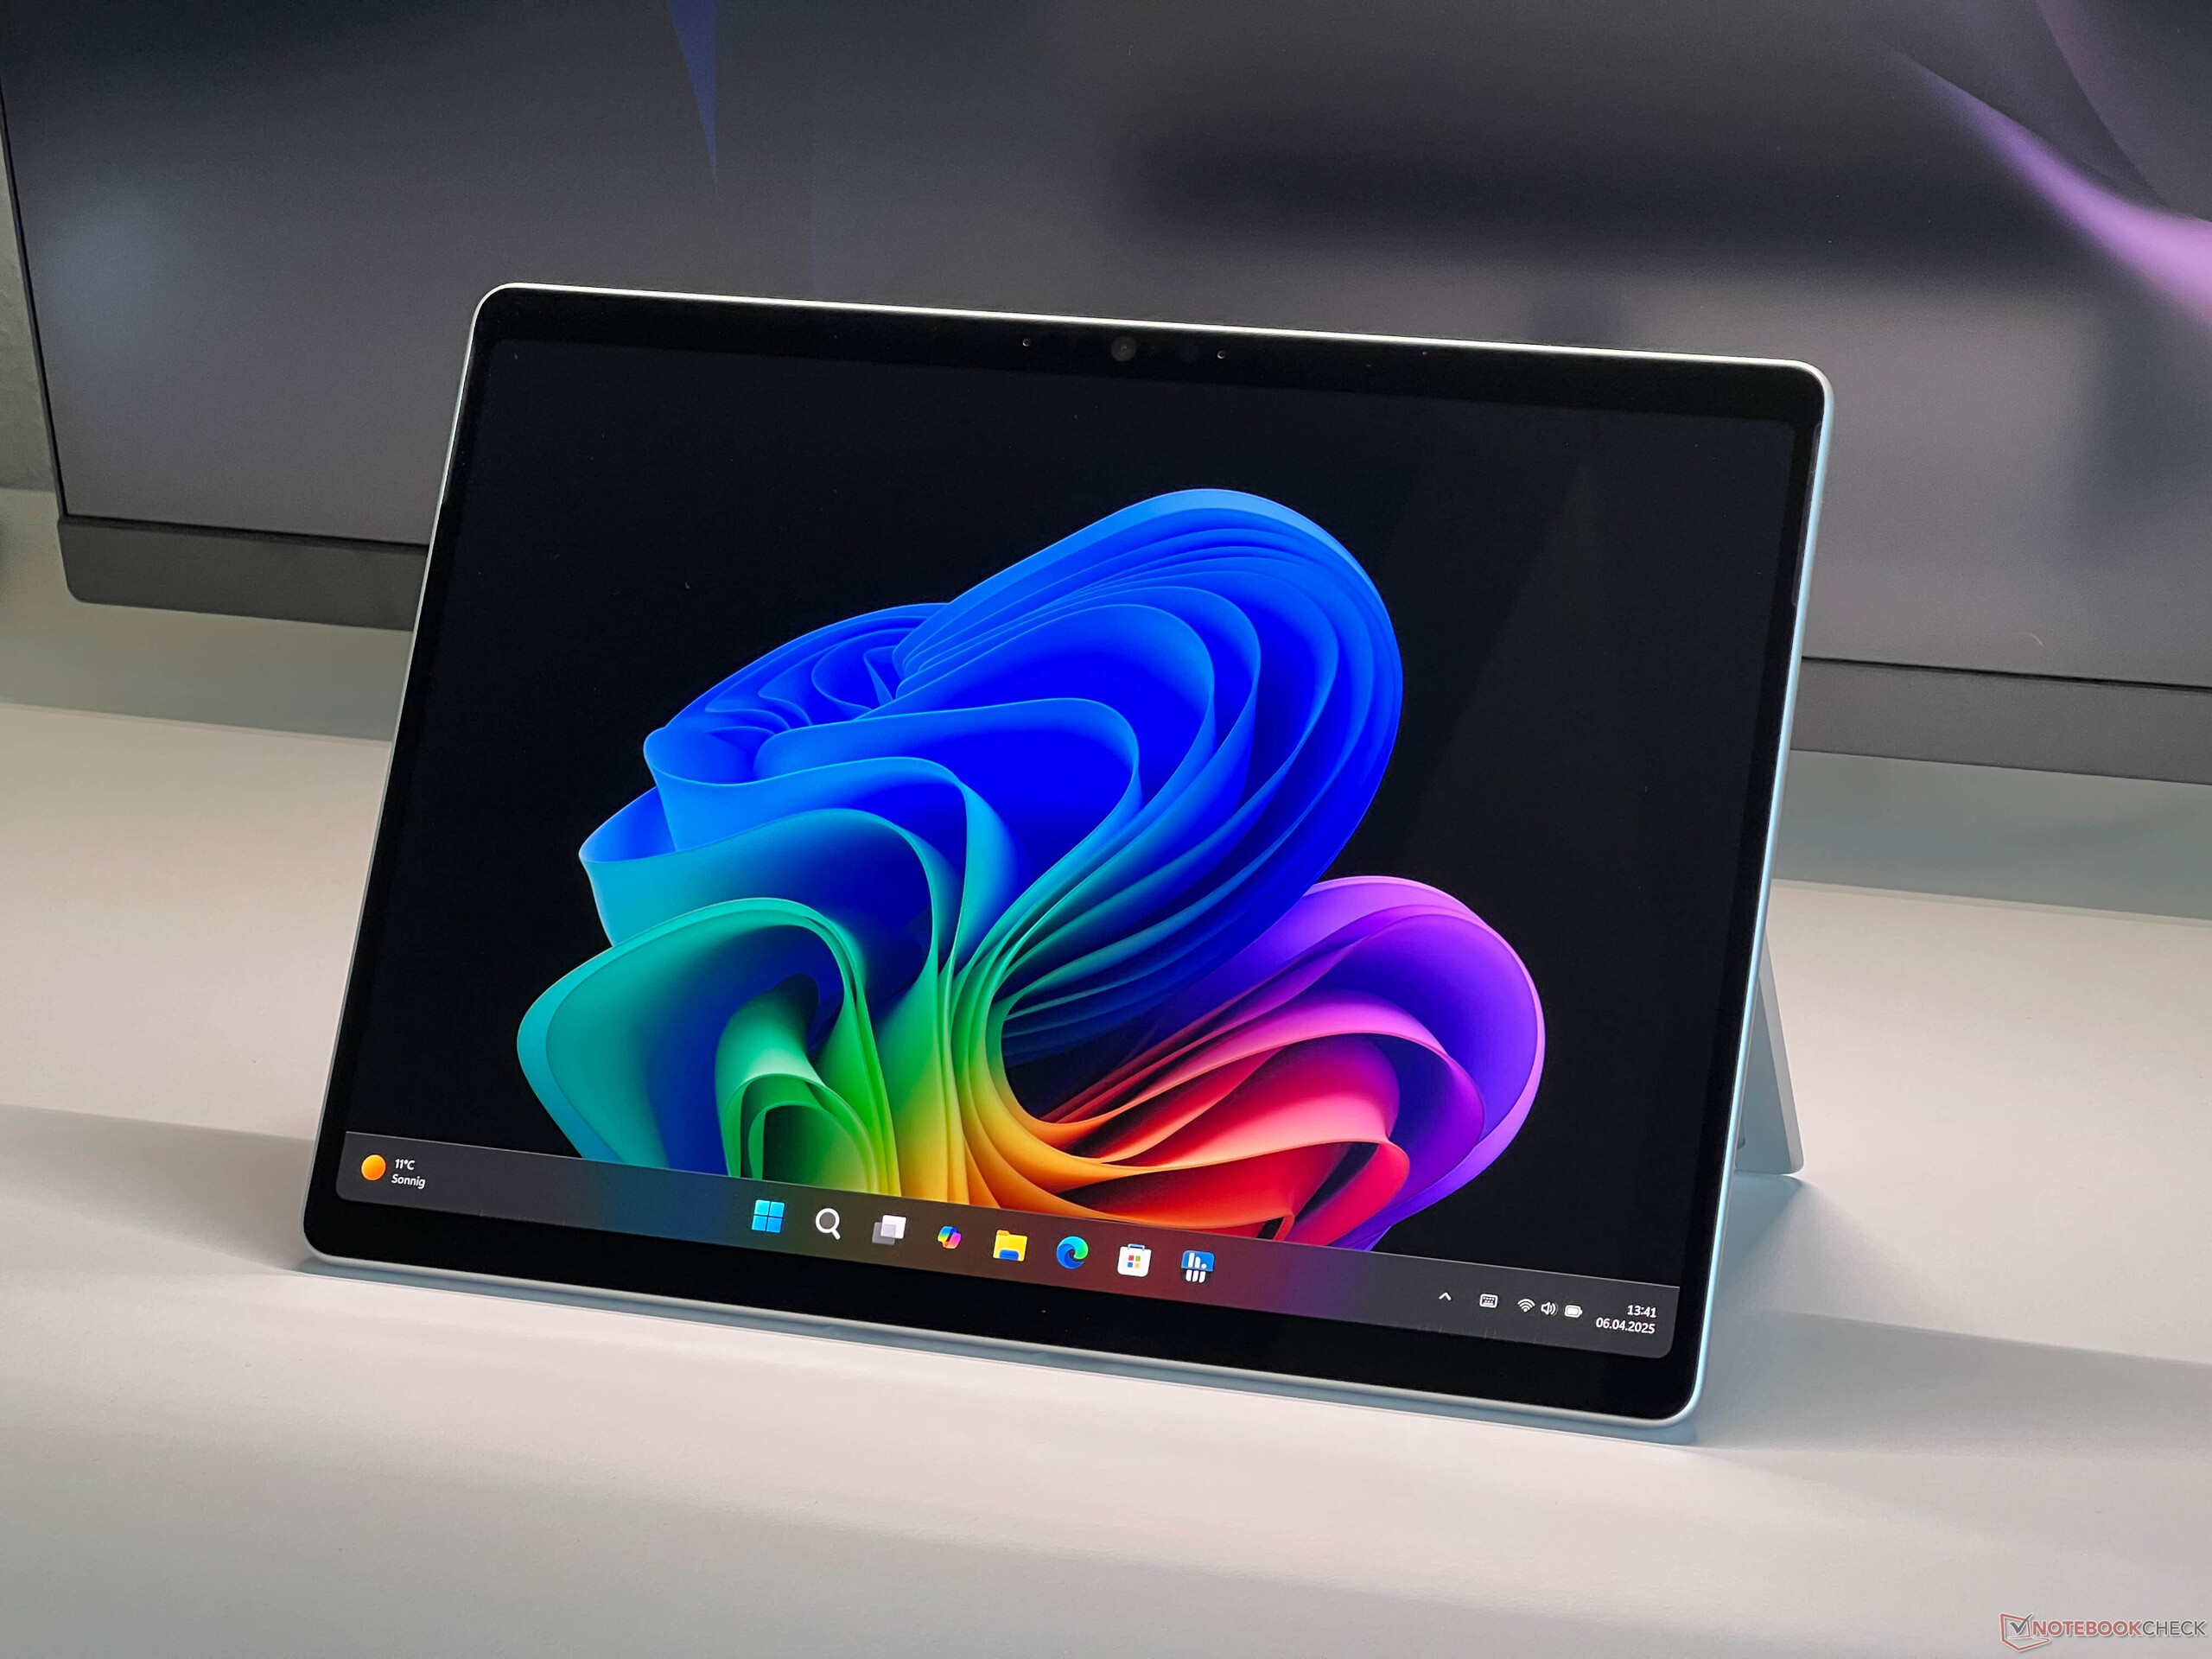
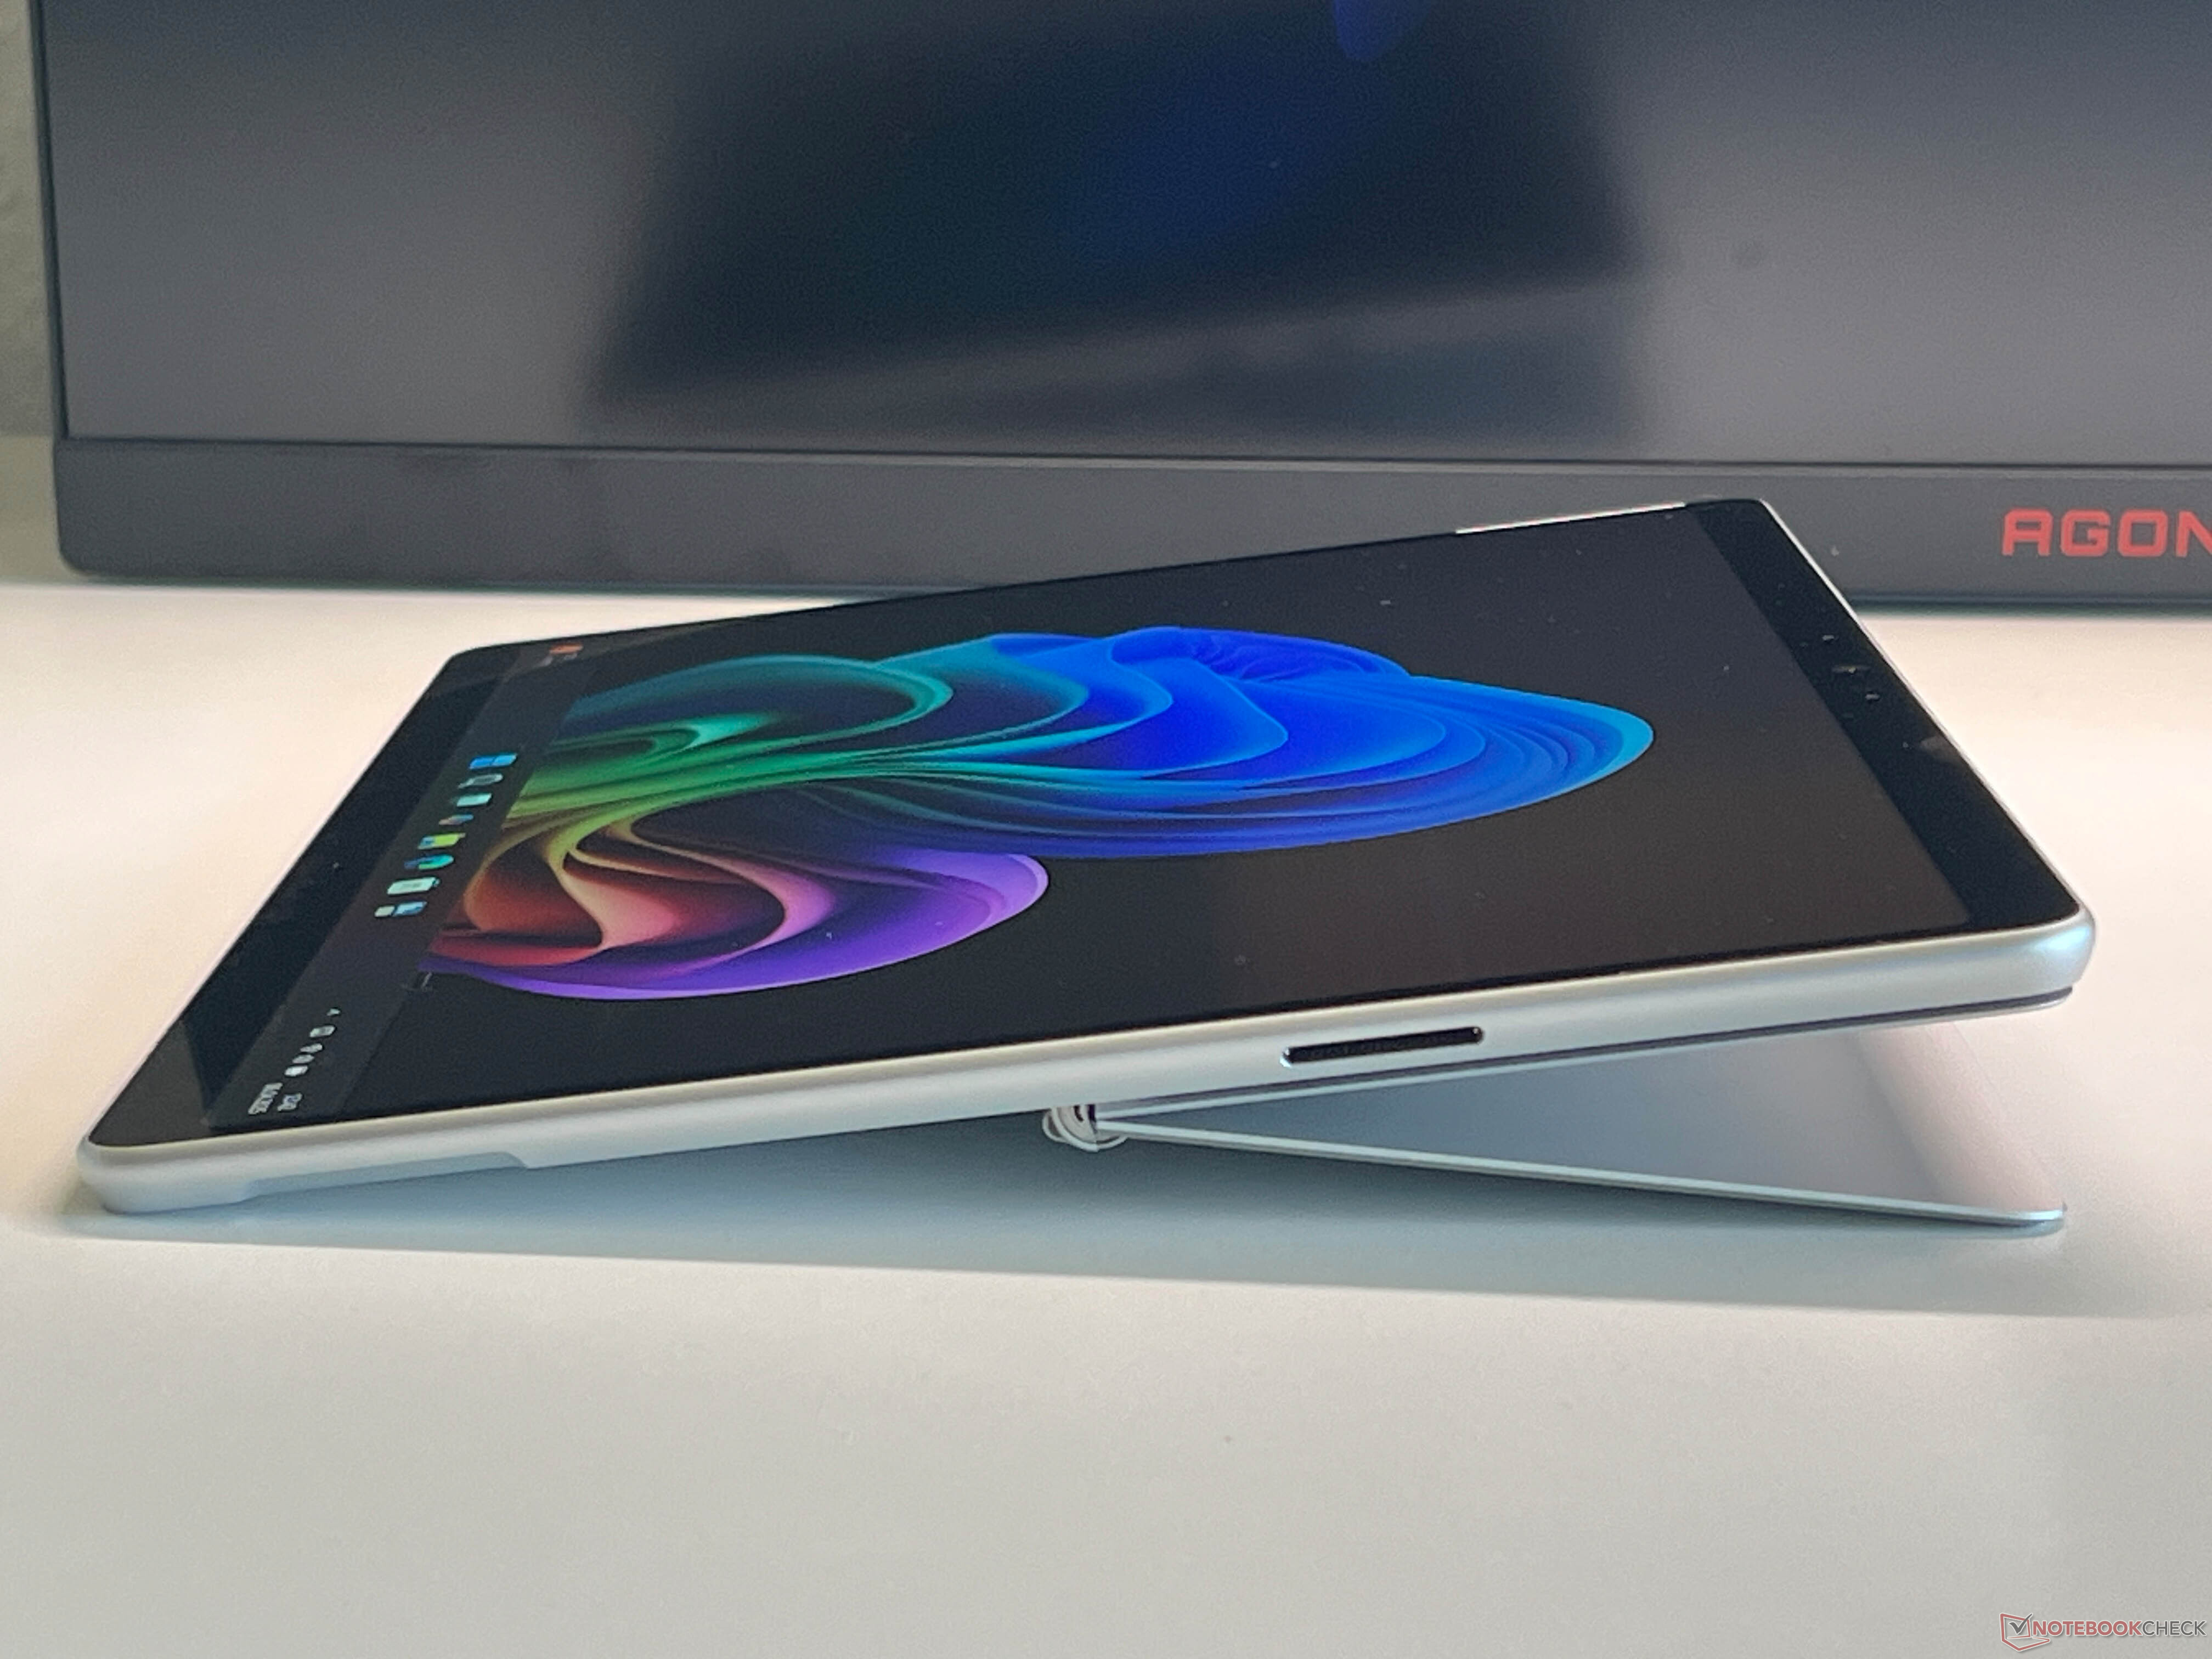
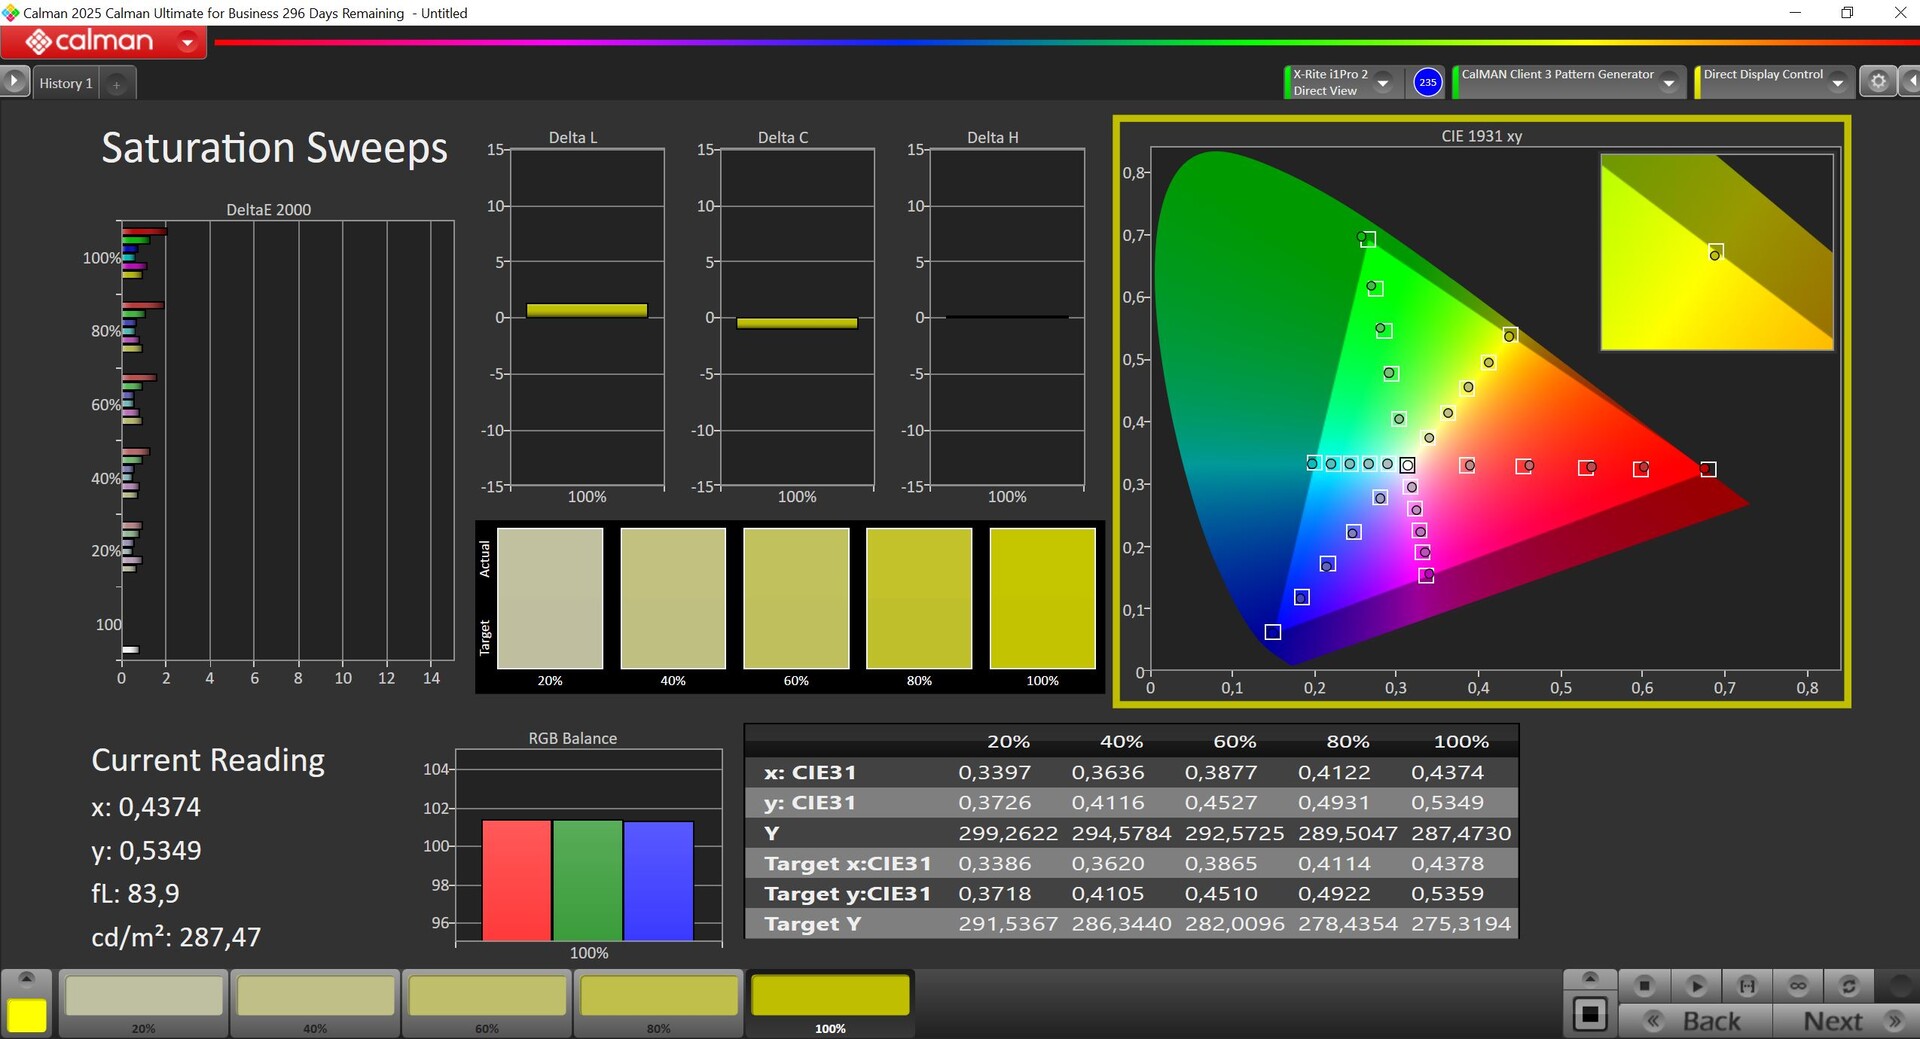
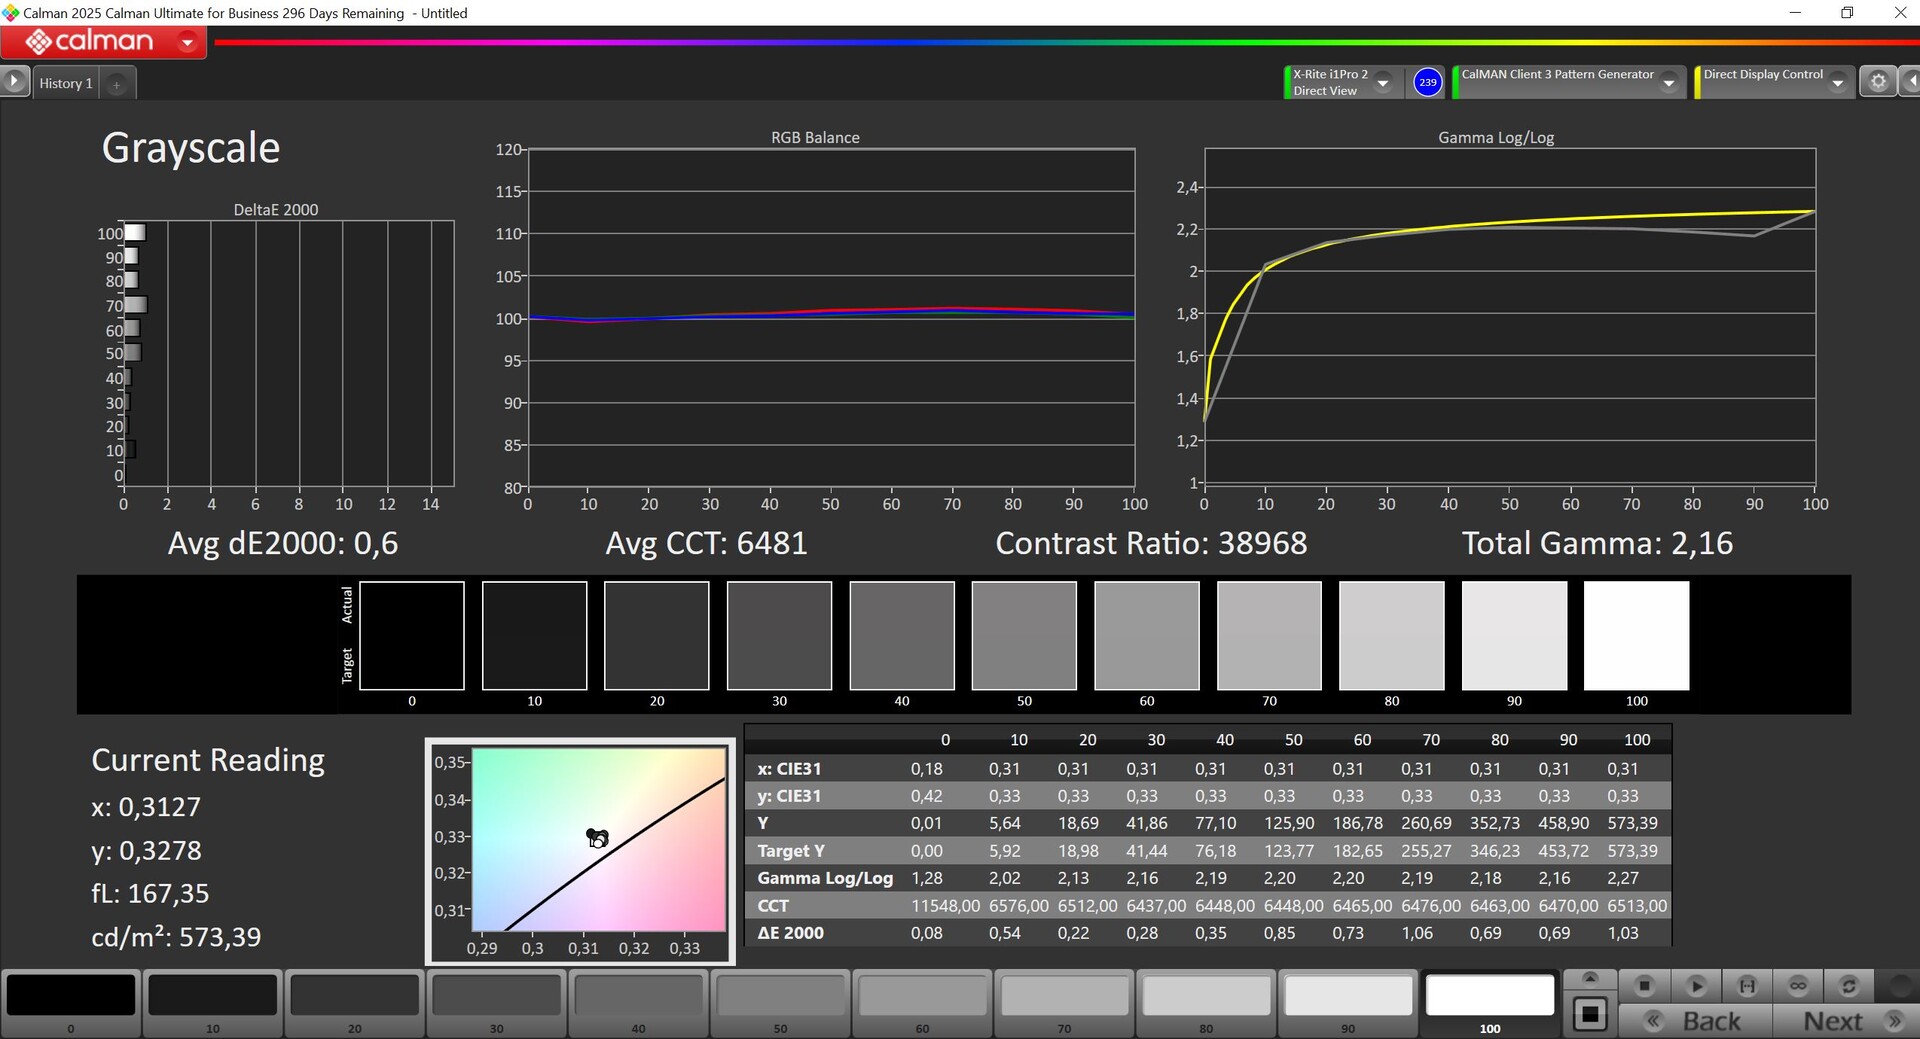
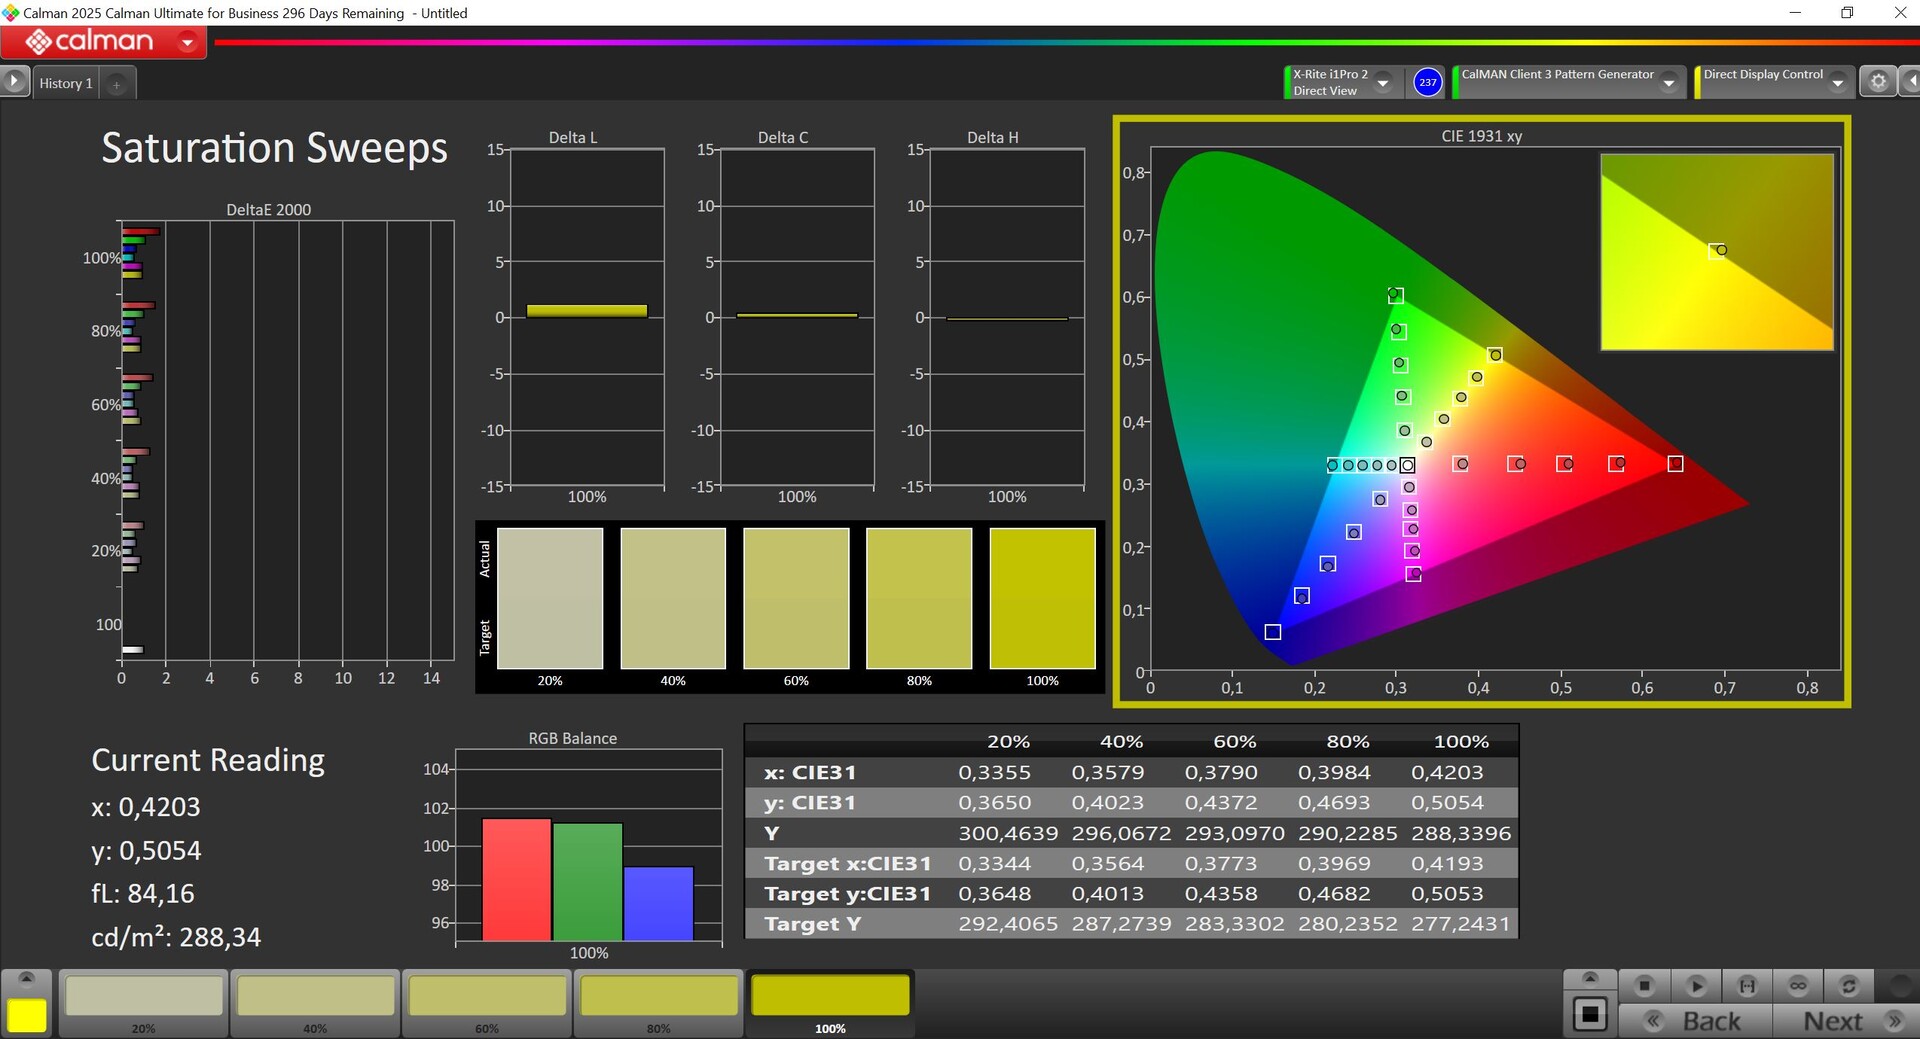
英特尔版本的 OLED 屏幕面板 ID 与骁龙型号略有不同,但在我们的测量中结果相当。这意味着用户可以获得高亮度(略低于 600 cd/m² SDR,最大 942 cd/m² HDR)和良好的主观画质,尽管我们仍然注意到在光线表面有轻微的光栅效应。Vivid (P3) 和 sRGB 两种配置文件也非常准确,开箱即可使用,因此可以轻松编辑图像/视频。
| |||||||||||||||||||||||||
Brightness Distribution: 99 %
Center on Battery: 574 cd/m²
Contrast: ∞:1 (Black: 0 cd/m²)
ΔE Color 0.9 | 0.5-29.43 Ø4.87
ΔE Greyscale 0.6 | 0.5-98 Ø5.1
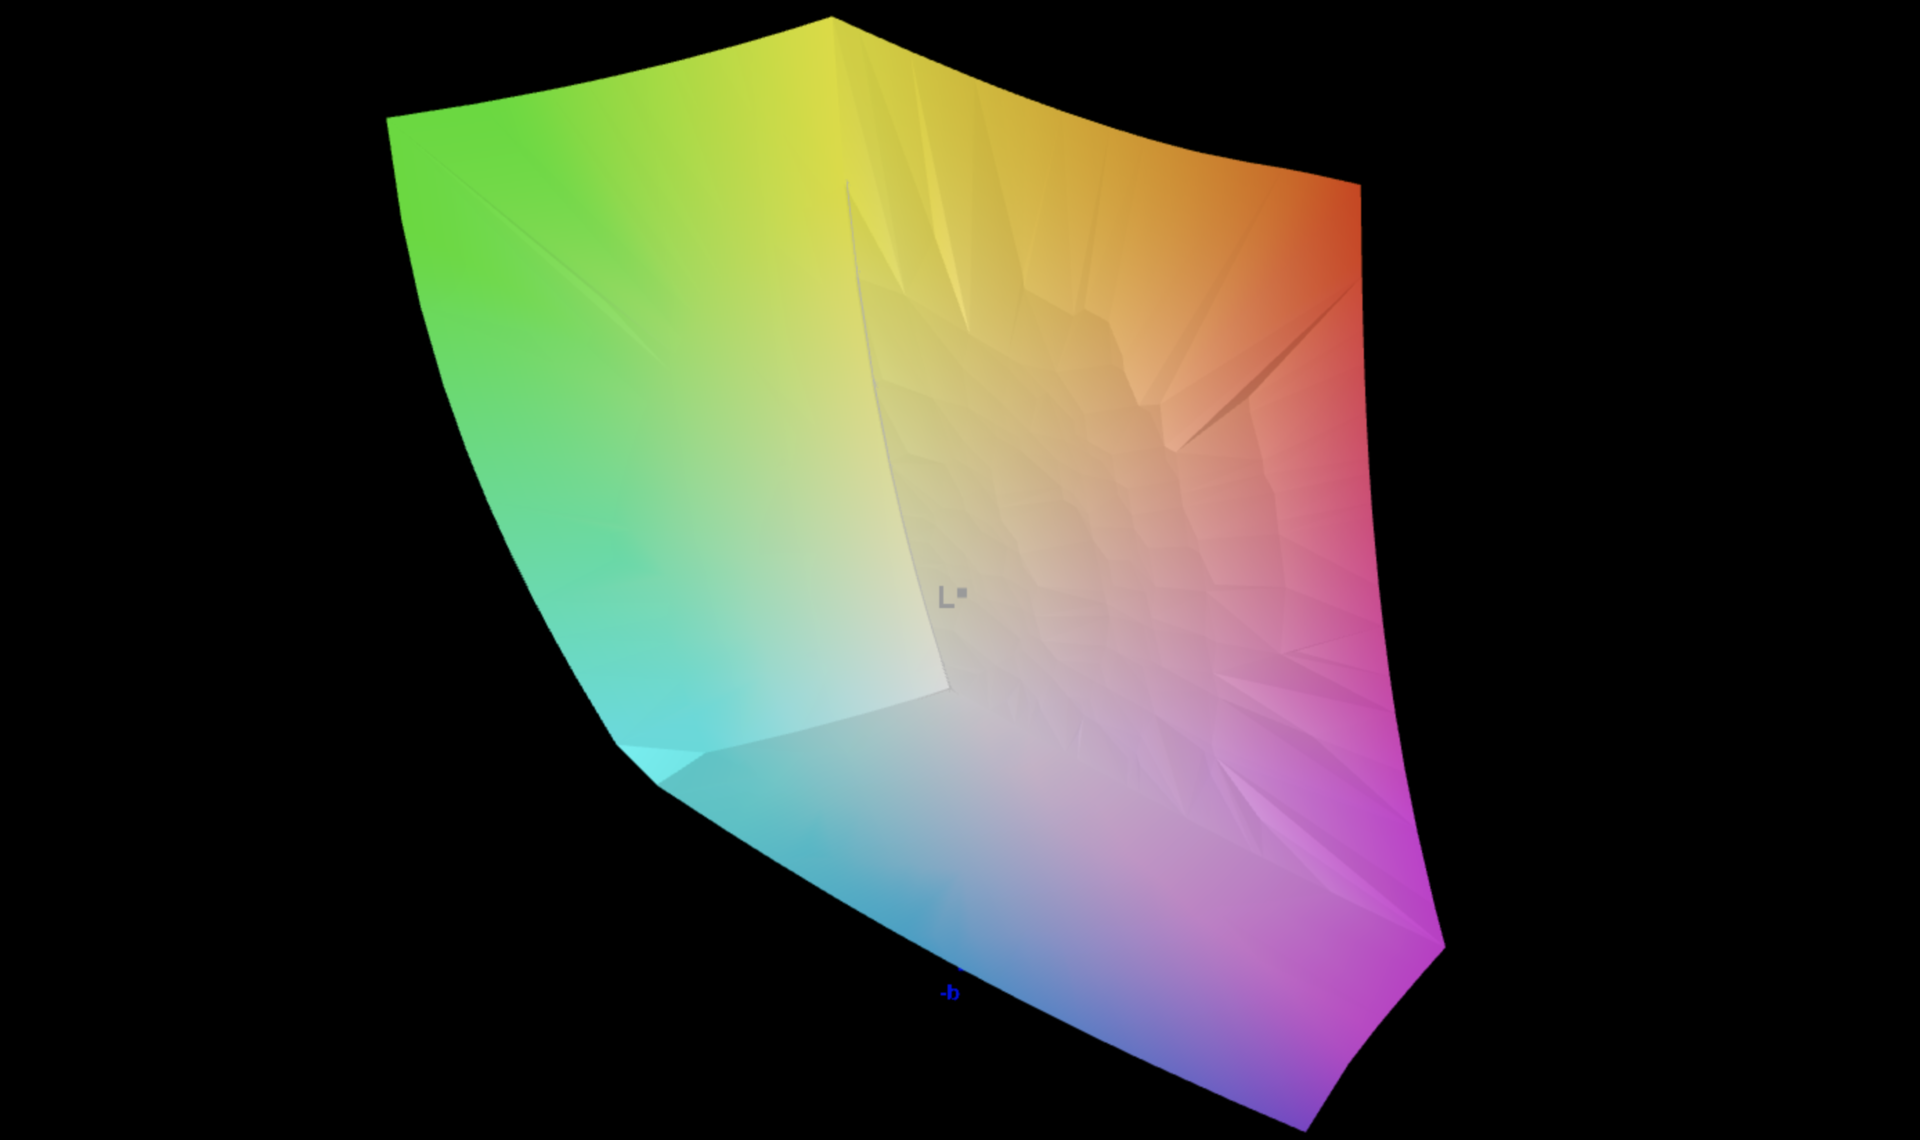
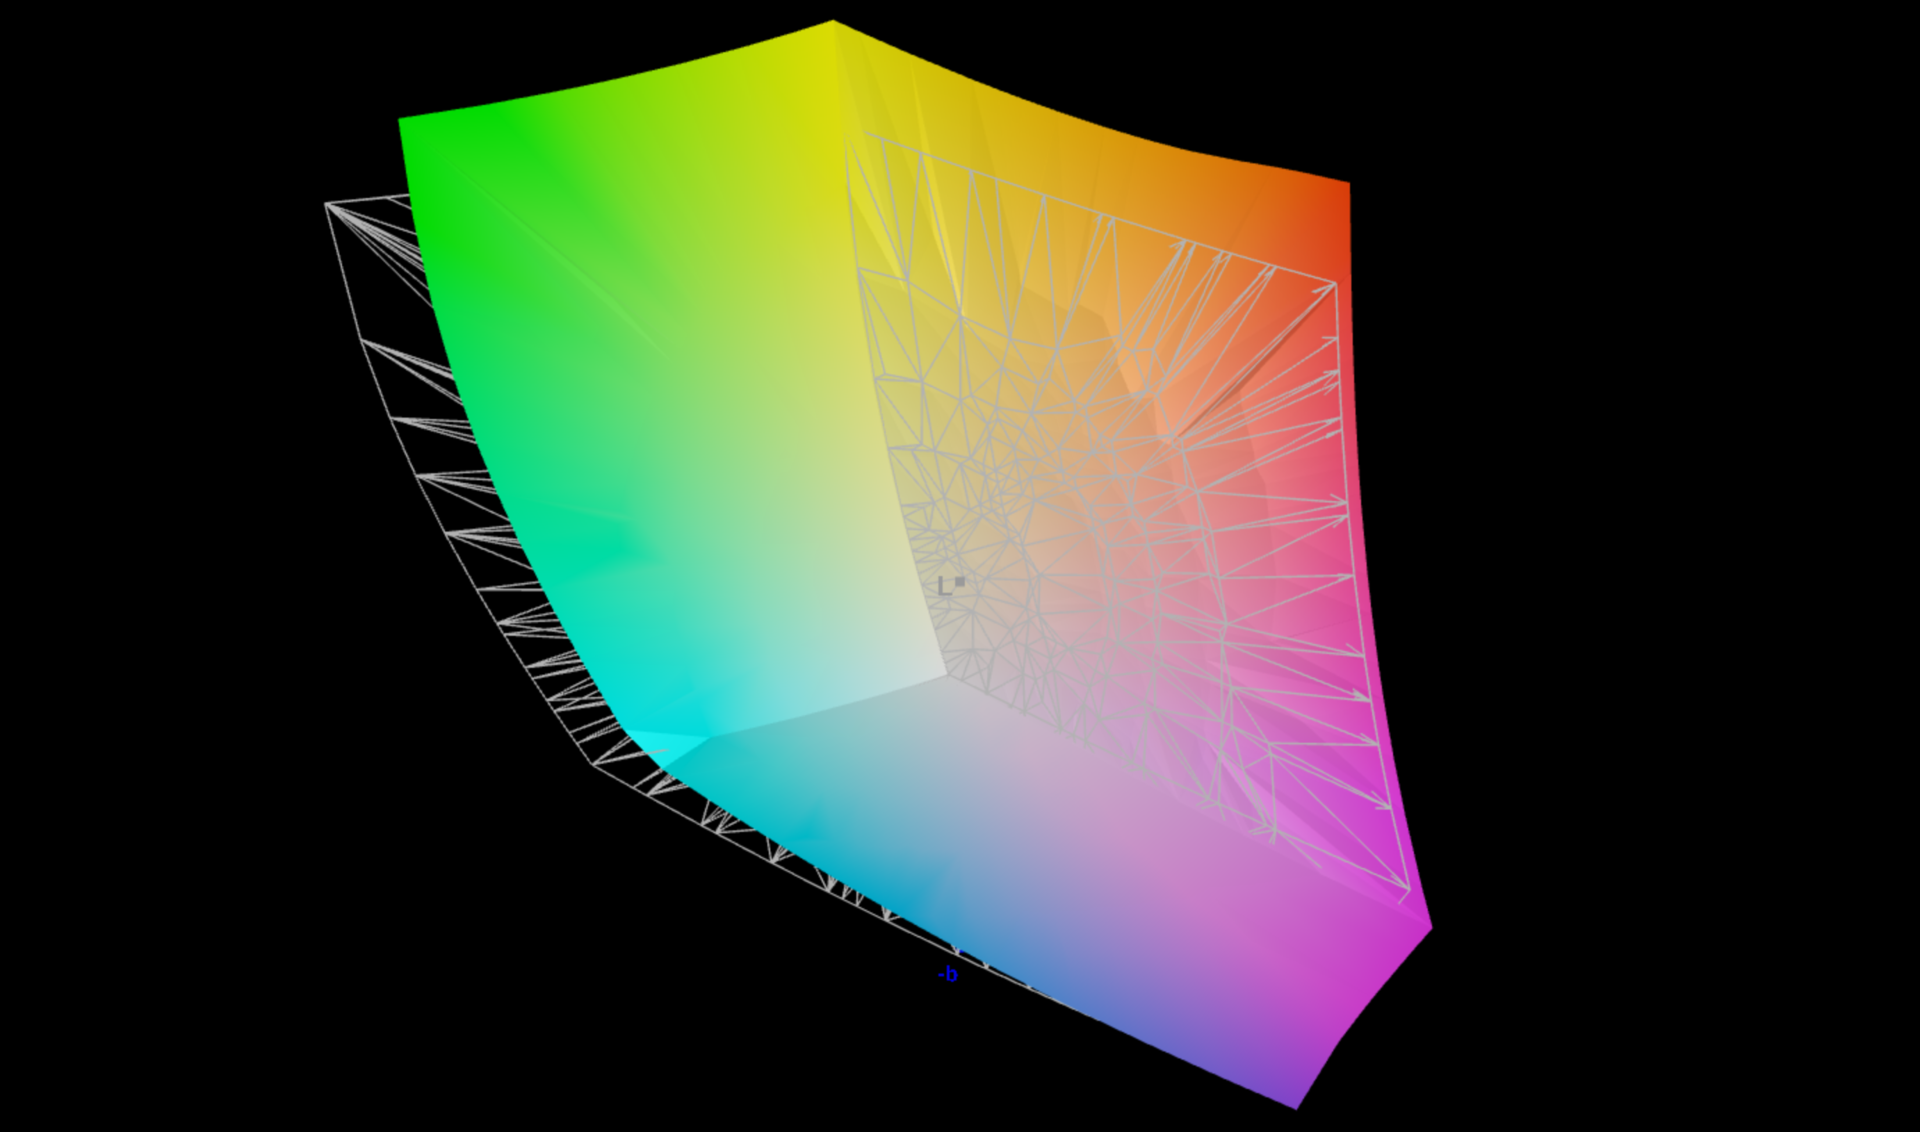
89.7% AdobeRGB 1998 (Argyll 2.2.0 3D)
100% sRGB (Argyll 2.2.0 3D)
99.5% Display P3 (Argyll 2.2.0 3D)
Gamma: 2.16
| Microsoft Surface Pro OLED Lunar Lake ATNA30DW02-0, OLED, 2880x1920, 13", 120 Hz | Microsoft Surface Pro OLED Copilot+ ATNA30DW01-1, OLED, 2880x1920, 13", 120 Hz | Dell Latitude 7350 Detachable BOE NE13A1M, IPS, 2880x1920, 13", 60 Hz | Asus ProArt PZ13 HT5306 ATNA33AA08-0, OLED, 2880x1800, 13.3", 60 Hz | Minisforum V3 BOE, NE140QDM-NY1, IPS, 2560x1600, 14", 165 Hz | |
|---|---|---|---|---|---|
| Display | -1% | -17% | 0% | -2% | |
| Display P3 Coverage | 99.5 | 98.9 -1% | 70.2 -29% | 99.5 0% | 97.7 -2% |
| sRGB Coverage | 100 | 99.4 -1% | 98.9 -1% | 99.6 0% | 99.8 0% |
| AdobeRGB 1998 Coverage | 89.7 | 89.5 0% | 72.1 -20% | 89.9 0% | 85.4 -5% |
| Response Times | 6% | -7225% | -156% | -1804% | |
| Response Time Grey 50% / Grey 80% * | 0.43 ? | 0.32 ? 26% | 43.8 ? -10086% | 1.54 ? -258% | 10 ? -2226% |
| Response Time Black / White * | 0.54 ? | 0.58 ? -7% | 24.1 ? -4363% | 1.41 ? -161% | 8 ? -1381% |
| PWM Frequency | 480 ? | 480 ? 0% | 240 ? -50% | ||
| Screen | 6% | -190% | -57% | -204% | |
| Brightness middle | 574 | 580 1% | 508.5 -11% | 362 -37% | 512 -11% |
| Brightness | 578 | 581 1% | 507 -12% | 364 -37% | 495 -14% |
| Brightness Distribution | 99 | 99 0% | 87 -12% | 99 0% | 91 -8% |
| Black Level * | 0.04 | 0.24 | 0.01 | 0.48 | |
| Colorchecker dE 2000 * | 0.9 | 0.7 22% | 3 -233% | 1.5 -67% | 4.32 -380% |
| Colorchecker dE 2000 max. * | 2.3 | 2.1 9% | 7.03 -206% | 3.1 -35% | 7.04 -206% |
| Greyscale dE 2000 * | 0.6 | 0.6 -0% | 4.6 -667% | 1.6 -167% | 4.22 -603% |
| Gamma | 2.16 102% | 2.16 102% | 2.17 101% | 2.12 104% | 2.31 95% |
| CCT | 6482 100% | 6484 100% | 6929 94% | 6514 100% | 6770 96% |
| Contrast | 14500 | 2119 | 36200 | 1067 | |
| Colorchecker dE 2000 calibrated * | 1.28 | 4.17 | |||
| Total Average (Program / Settings) | 4% /
4% | -2477% /
-1422% | -71% /
-68% | -670% /
-440% |
* ... smaller is better


Display Response Times
| ↔ Response Time Black to White | ||
|---|---|---|
| 0.54 ms ... rise ↗ and fall ↘ combined | ↗ 0.29 ms rise | 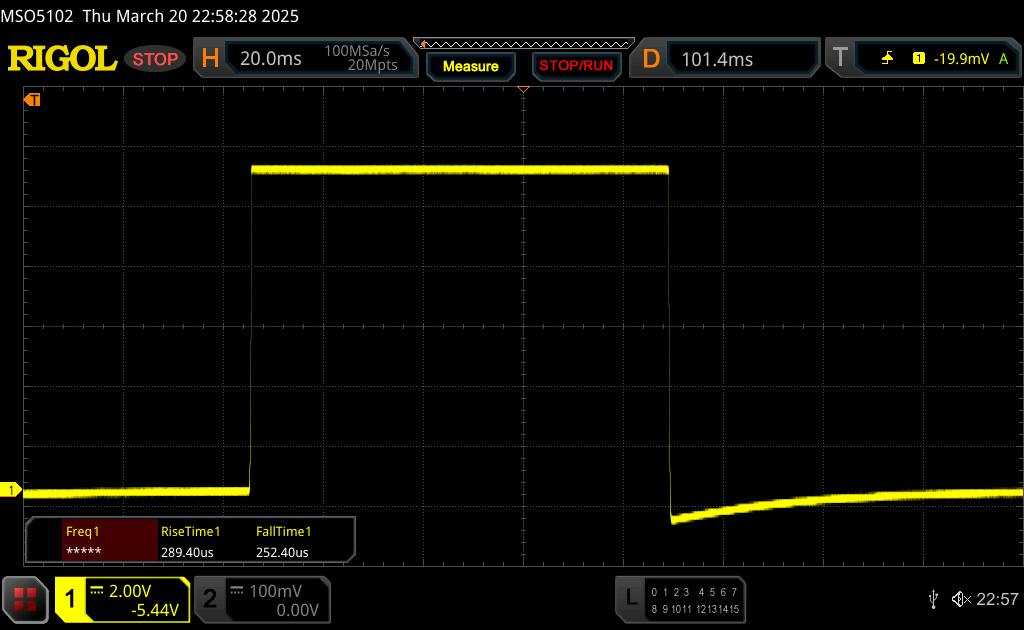 |
| ↘ 0.25 ms fall | ||
| The screen shows very fast response rates in our tests and should be very well suited for fast-paced gaming. In comparison, all tested devices range from 0.1 (minimum) to 240 (maximum) ms. » 0 % of all devices are better. This means that the measured response time is better than the average of all tested devices (20.8 ms). | ||
| ↔ Response Time 50% Grey to 80% Grey | ||
| 0.43 ms ... rise ↗ and fall ↘ combined | ↗ 0.26 ms rise | 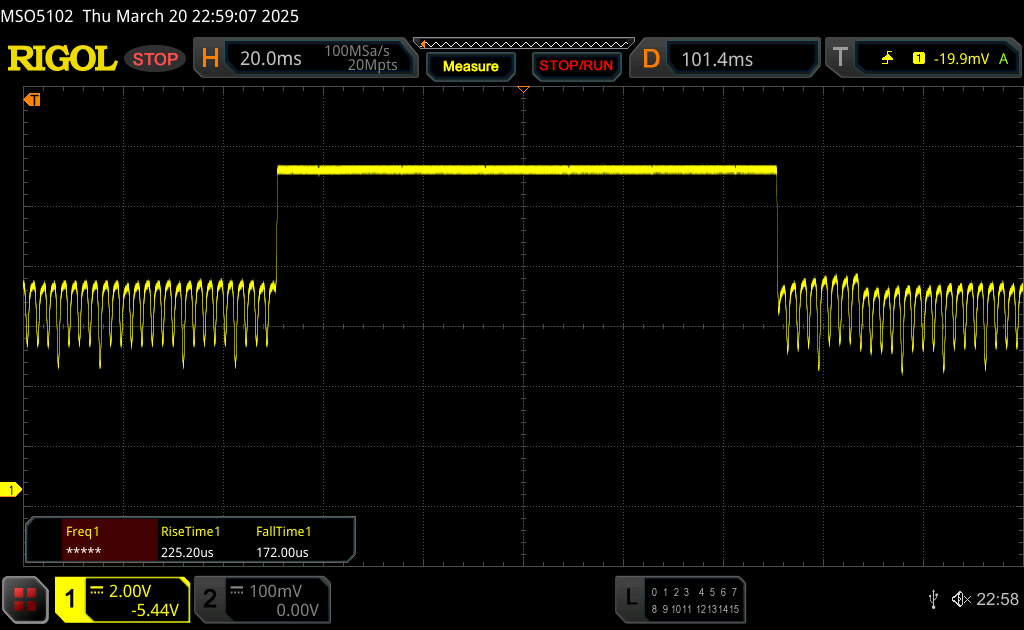 |
| ↘ 0.17 ms fall | ||
| The screen shows very fast response rates in our tests and should be very well suited for fast-paced gaming. In comparison, all tested devices range from 0.165 (minimum) to 636 (maximum) ms. » 0 % of all devices are better. This means that the measured response time is better than the average of all tested devices (32.5 ms). | ||
Screen Flickering / PWM (Pulse-Width Modulation)
| Screen flickering / PWM detected | 480 Hz Amplitude: 25 % | ≤ 69 % brightness setting |  |
The display backlight flickers at 480 Hz (worst case, e.g., utilizing PWM) Flickering detected at a brightness setting of 69 % and below. There should be no flickering or PWM above this brightness setting. The frequency of 480 Hz is relatively high, so most users sensitive to PWM should not notice any flickering. However, there are reports that some users are still sensitive to PWM at 500 Hz and above, so be aware. In comparison: 53 % of all tested devices do not use PWM to dim the display. If PWM was detected, an average of 8516 (minimum: 5 - maximum: 343500) Hz was measured. | |||


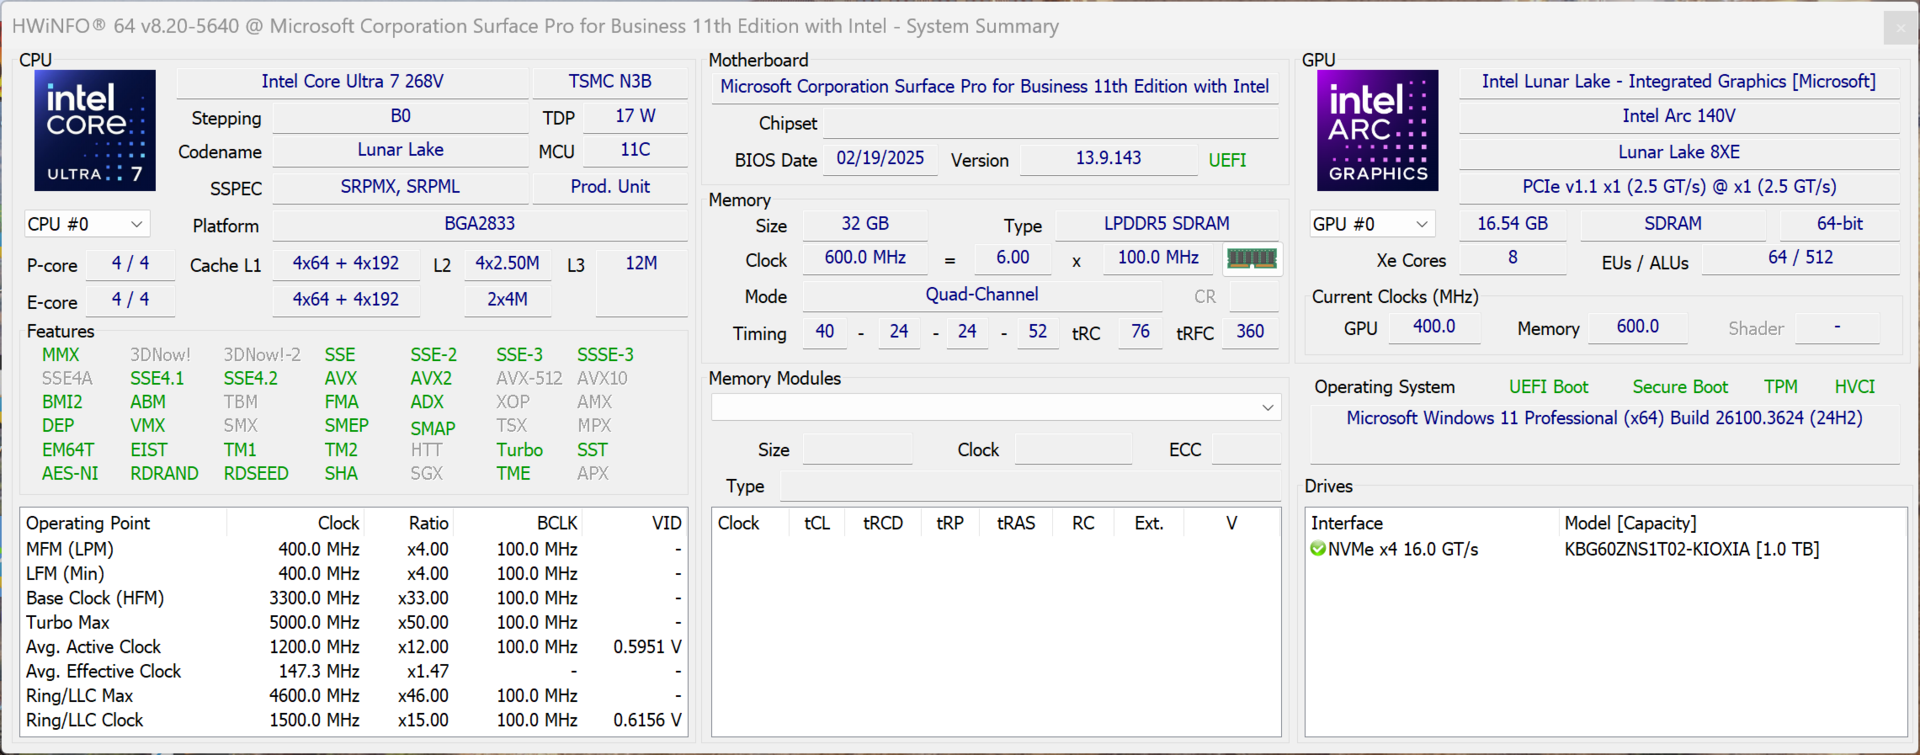
性能 - 配备 16 或 32 GB 内存的 Lunar Lake 处理器
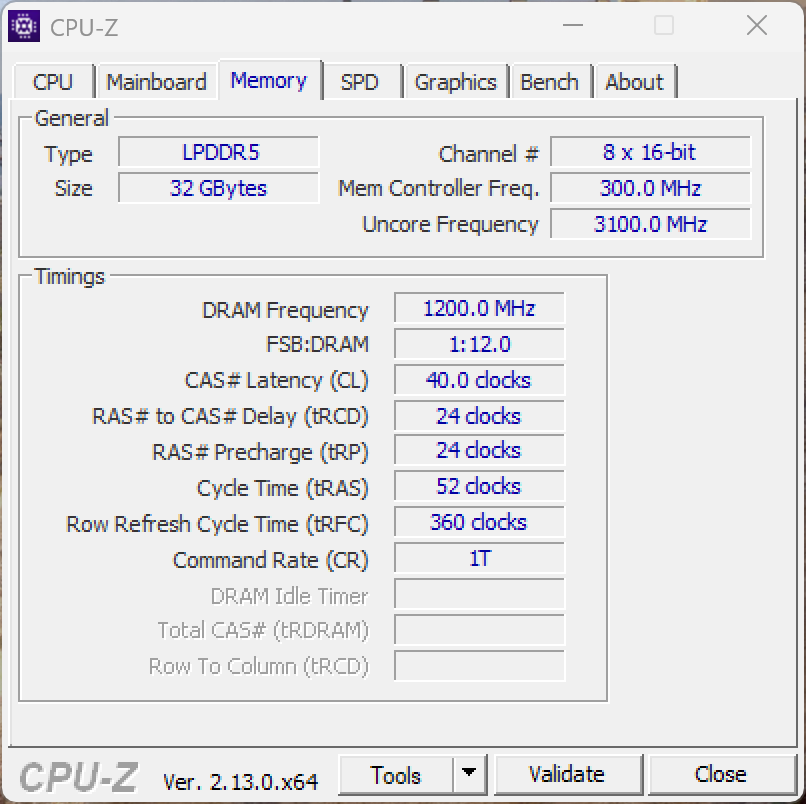
微软再次独家采用英特尔处理器(Core Ultra 5 或 7)和 vPro,并配备 16 或 32 GB 内存(LPDDR5x-8533)。笔记本电脑对 vPro 的支持再次证明了它对企业客户的重视。

测试条件
微软没有提供任何额外的能源配置文件。与 Surface Laptop for Business 一样,微软调整了 Windows 能源配置文件的名称,现在默认使用这些名称。我们以最佳性能模式运行基准测试。
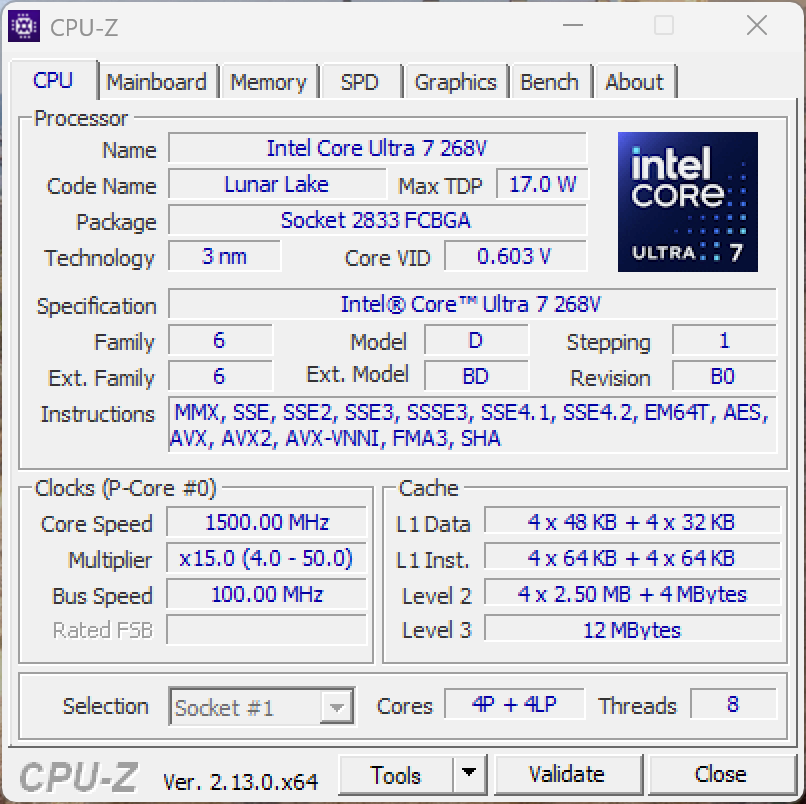
处理器 - Core Ultra 7 268V
我们的测试设备配备了 Core Ultra 7 268V,其短时功耗为 37 瓦,连续功耗为 30 瓦。为了与 Snapdragon 机型进行最公平的比较,我们重点测试了最新版本的 Cinebench 和 Geekbench,它们也可在 ARM 版本上运行。结果显示 骁龙 X 精英版的多核性能明显更高,但在单核测试中,两者几乎不相上下(英特尔机型的优势微乎其微)。由于多核性能高,骁龙设备在模拟测试中也经常占据优势。此外,在效率测试中,ARM 型号也显示出了优势。在电池模式下,我们测试设备的 CPU 性能保持稳定,而在连续负载情况下,其多核性能下降了约 15%。
Cinebench 2024: CPU Multi Core | CPU Single Core
Geekbench 6.4: Multi-Core | Single-Core
| CPU Performance Rating | |
| Microsoft Surface Pro OLED Copilot+ | |
| Microsoft Surface Pro OLED Lunar Lake | |
| Average Intel Core Ultra 7 268V | |
| Minisforum V3 | |
| Asus ProArt PZ13 HT5306 | |
| Dell Latitude 7350 Detachable | |
| Average of class Tablet | |
| Cinebench 2024 / CPU Multi Core | |
| Microsoft Surface Pro OLED Copilot+ | |
| Average of class Tablet (619 - 893, n=3, last 2 years) | |
| Minisforum V3 | |
| Microsoft Surface Pro OLED Lunar Lake | |
| Average Intel Core Ultra 7 268V (600 - 619, n=2) | |
| Asus ProArt PZ13 HT5306 | |
| Dell Latitude 7350 Detachable | |
| Cinebench 2024 / CPU Single Core | |
| Microsoft Surface Pro OLED Lunar Lake | |
| Average Intel Core Ultra 7 268V (123.3 - 124.9, n=2) | |
| Microsoft Surface Pro OLED Copilot+ | |
| Average of class Tablet (109 - 124.9, n=3, last 2 years) | |
| Asus ProArt PZ13 HT5306 | |
| Minisforum V3 | |
| Dell Latitude 7350 Detachable | |
| Geekbench 6.4 / Multi-Core | |
| Microsoft Surface Pro OLED Copilot+ | |
| Microsoft Surface Pro OLED Lunar Lake | |
| Minisforum V3 | |
| Average Intel Core Ultra 7 268V (10589 - 11388, n=4) | |
| Asus ProArt PZ13 HT5306 | |
| Dell Latitude 7350 Detachable | |
| Average of class Tablet (493 - 14690, n=82, last 2 years) | |
| Geekbench 6.4 / Single-Core | |
| Microsoft Surface Pro OLED Lunar Lake | |
| Microsoft Surface Pro OLED Copilot+ | |
| Average Intel Core Ultra 7 268V (2583 - 2871, n=4) | |
| Minisforum V3 | |
| Asus ProArt PZ13 HT5306 | |
| Dell Latitude 7350 Detachable | |
| Average of class Tablet (185 - 3715, n=82, last 2 years) | |
| Power Consumption | |
| Cinebench 2024 Single Power Efficiency - external Monitor | |
| Asus ProArt PZ13 HT5306 | |
| Microsoft Surface Pro OLED Copilot+ | |
| Microsoft Surface Pro OLED Lunar Lake | |
| Cinebench 2024 Multi Power Efficiency - external Monitor | |
| Microsoft Surface Pro OLED Copilot+ | |
| Asus ProArt PZ13 HT5306 | |
| Microsoft Surface Pro OLED Lunar Lake | |
Cinebench R15 Multi continuous test
Cinebench R23: Multi Core | Single Core
Cinebench R20: CPU (Multi Core) | CPU (Single Core)
Cinebench R15: CPU Multi 64Bit | CPU Single 64Bit
Blender: v2.79 BMW27 CPU
7-Zip 18.03: 7z b 4 | 7z b 4 -mmt1
Geekbench 6.4: Multi-Core | Single-Core
Geekbench 5.5: Multi-Core | Single-Core
HWBOT x265 Benchmark v2.2: 4k Preset
LibreOffice : 20 Documents To PDF
R Benchmark 2.5: Overall mean
| CPU Performance Rating | |
| Minisforum V3 | |
| Microsoft Surface Pro OLED Lunar Lake | |
| Average Intel Core Ultra 7 268V | |
| Microsoft Surface Pro OLED Copilot+ -2! | |
| Dell Latitude 7350 Detachable | |
| Asus ProArt PZ13 HT5306 -2! | |
| Average of class Tablet | |
| Cinebench R23 / Multi Core | |
| Minisforum V3 | |
| Microsoft Surface Pro OLED Lunar Lake | |
| Average Intel Core Ultra 7 268V (9835 - 10868, n=3) | |
| Microsoft Surface Pro OLED Copilot+ | |
| Dell Latitude 7350 Detachable | |
| Average of class Tablet (3066 - 10868, n=5, last 2 years) | |
| Asus ProArt PZ13 HT5306 | |
| Cinebench R23 / Single Core | |
| Average Intel Core Ultra 7 268V (1910 - 1985, n=3) | |
| Microsoft Surface Pro OLED Lunar Lake | |
| Minisforum V3 | |
| Dell Latitude 7350 Detachable | |
| Microsoft Surface Pro OLED Copilot+ | |
| Average of class Tablet (559 - 1921, n=5, last 2 years) | |
| Asus ProArt PZ13 HT5306 | |
| Cinebench R20 / CPU (Multi Core) | |
| Minisforum V3 | |
| Microsoft Surface Pro OLED Lunar Lake | |
| Average Intel Core Ultra 7 268V (3811 - 4255, n=3) | |
| Microsoft Surface Pro OLED Copilot+ | |
| Dell Latitude 7350 Detachable | |
| Average of class Tablet (1175 - 4255, n=5, last 2 years) | |
| Asus ProArt PZ13 HT5306 | |
| Cinebench R20 / CPU (Single Core) | |
| Average Intel Core Ultra 7 268V (736 - 764, n=3) | |
| Microsoft Surface Pro OLED Lunar Lake | |
| Minisforum V3 | |
| Dell Latitude 7350 Detachable | |
| Microsoft Surface Pro OLED Copilot+ | |
| Average of class Tablet (205 - 739, n=5, last 2 years) | |
| Asus ProArt PZ13 HT5306 | |
| Cinebench R15 / CPU Multi 64Bit | |
| Microsoft Surface Pro OLED Copilot+ | |
| Minisforum V3 | |
| Microsoft Surface Pro OLED Lunar Lake | |
| Average Intel Core Ultra 7 268V (1601 - 1651, n=3) | |
| Asus ProArt PZ13 HT5306 | |
| Average of class Tablet (433 - 2249, n=5, last 2 years) | |
| Dell Latitude 7350 Detachable | |
| Cinebench R15 / CPU Single 64Bit | |
| Microsoft Surface Pro OLED Lunar Lake | |
| Average Intel Core Ultra 7 268V (287 - 302, n=3) | |
| Minisforum V3 | |
| Microsoft Surface Pro OLED Copilot+ | |
| Dell Latitude 7350 Detachable | |
| Asus ProArt PZ13 HT5306 | |
| Average of class Tablet (119 - 299, n=5, last 2 years) | |
| Blender / v2.79 BMW27 CPU | |
| Average of class Tablet (337 - 1080, n=5, last 2 years) | |
| Asus ProArt PZ13 HT5306 | |
| Dell Latitude 7350 Detachable | |
| Average Intel Core Ultra 7 268V (337 - 410, n=3) | |
| Microsoft Surface Pro OLED Copilot+ | |
| Microsoft Surface Pro OLED Lunar Lake | |
| Minisforum V3 | |
| 7-Zip 18.03 / 7z b 4 | |
| Minisforum V3 | |
| Microsoft Surface Pro OLED Copilot+ | |
| Microsoft Surface Pro OLED Lunar Lake | |
| Average Intel Core Ultra 7 268V (32797 - 36610, n=3) | |
| Asus ProArt PZ13 HT5306 | |
| Average of class Tablet (12470 - 44404, n=5, last 2 years) | |
| Dell Latitude 7350 Detachable | |
| 7-Zip 18.03 / 7z b 4 -mmt1 | |
| Microsoft Surface Pro OLED Lunar Lake | |
| Average Intel Core Ultra 7 268V (5884 - 6021, n=3) | |
| Minisforum V3 | |
| Microsoft Surface Pro OLED Copilot+ | |
| Average of class Tablet (3915 - 5991, n=5, last 2 years) | |
| Dell Latitude 7350 Detachable | |
| Asus ProArt PZ13 HT5306 | |
| Geekbench 6.4 / Multi-Core | |
| Microsoft Surface Pro OLED Copilot+ | |
| Microsoft Surface Pro OLED Lunar Lake | |
| Minisforum V3 | |
| Average Intel Core Ultra 7 268V (10589 - 11388, n=4) | |
| Asus ProArt PZ13 HT5306 | |
| Dell Latitude 7350 Detachable | |
| Average of class Tablet (493 - 14690, n=82, last 2 years) | |
| Geekbench 6.4 / Single-Core | |
| Microsoft Surface Pro OLED Lunar Lake | |
| Microsoft Surface Pro OLED Copilot+ | |
| Average Intel Core Ultra 7 268V (2583 - 2871, n=4) | |
| Minisforum V3 | |
| Asus ProArt PZ13 HT5306 | |
| Dell Latitude 7350 Detachable | |
| Average of class Tablet (185 - 3715, n=82, last 2 years) | |
| Geekbench 5.5 / Multi-Core | |
| Minisforum V3 | |
| Microsoft Surface Pro OLED Lunar Lake | |
| Average Intel Core Ultra 7 268V (9491 - 9855, n=4) | |
| Dell Latitude 7350 Detachable | |
| Average of class Tablet (303 - 10522, n=73, last 2 years) | |
| Geekbench 5.5 / Single-Core | |
| Microsoft Surface Pro OLED Lunar Lake | |
| Average Intel Core Ultra 7 268V (2008 - 2097, n=4) | |
| Minisforum V3 | |
| Dell Latitude 7350 Detachable | |
| Average of class Tablet (103 - 2224, n=73, last 2 years) | |
| HWBOT x265 Benchmark v2.2 / 4k Preset | |
| Minisforum V3 | |
| Microsoft Surface Pro OLED Lunar Lake | |
| Average Intel Core Ultra 7 268V (10.4 - 12.9, n=3) | |
| Dell Latitude 7350 Detachable | |
| Microsoft Surface Pro OLED Copilot+ | |
| Average of class Tablet (2.68 - 12.9, n=5, last 2 years) | |
| Asus ProArt PZ13 HT5306 | |
| LibreOffice / 20 Documents To PDF | |
| Average of class Tablet (48.3 - 117.6, n=5, last 2 years) | |
| Asus ProArt PZ13 HT5306 | |
| Minisforum V3 | |
| Average Intel Core Ultra 7 268V (48 - 60.8, n=3) | |
| Microsoft Surface Pro OLED Copilot+ | |
| Microsoft Surface Pro OLED Lunar Lake | |
| Dell Latitude 7350 Detachable | |
| R Benchmark 2.5 / Overall mean | |
| Asus ProArt PZ13 HT5306 | |
| Average of class Tablet (0.4361 - 1.012, n=5, last 2 years) | |
| Microsoft Surface Pro OLED Copilot+ | |
| Dell Latitude 7350 Detachable | |
| Minisforum V3 | |
| Average Intel Core Ultra 7 268V (0.4344 - 0.4565, n=3) | |
| Microsoft Surface Pro OLED Lunar Lake | |
* ... smaller is better
AIDA64: FP32 Ray-Trace | FPU Julia | CPU SHA3 | CPU Queen | FPU SinJulia | FPU Mandel | CPU AES | CPU ZLib | FP64 Ray-Trace | CPU PhotoWorxx
| Performance Rating | |
| Minisforum V3 | |
| Microsoft Surface Pro OLED Lunar Lake | |
| Average Intel Core Ultra 7 268V | |
| Microsoft Surface Pro OLED Copilot+ | |
| Dell Latitude 7350 Detachable | |
| Average of class Tablet | |
| Asus ProArt PZ13 HT5306 | |
| AIDA64 / FP32 Ray-Trace | |
| Minisforum V3 | |
| Microsoft Surface Pro OLED Lunar Lake | |
| Average Intel Core Ultra 7 268V (10556 - 12759, n=3) | |
| Dell Latitude 7350 Detachable | |
| Average of class Tablet (2184 - 12759, n=5, last 2 years) | |
| Asus ProArt PZ13 HT5306 | |
| Microsoft Surface Pro OLED Copilot+ | |
| AIDA64 / FPU Julia | |
| Minisforum V3 | |
| Microsoft Surface Pro OLED Lunar Lake | |
| Average Intel Core Ultra 7 268V (47659 - 62102, n=3) | |
| Dell Latitude 7350 Detachable | |
| Average of class Tablet (5315 - 62102, n=5, last 2 years) | |
| Asus ProArt PZ13 HT5306 | |
| Microsoft Surface Pro OLED Copilot+ | |
| AIDA64 / CPU SHA3 | |
| Minisforum V3 | |
| Microsoft Surface Pro OLED Lunar Lake | |
| Microsoft Surface Pro OLED Copilot+ | |
| Average Intel Core Ultra 7 268V (2117 - 2784, n=3) | |
| Asus ProArt PZ13 HT5306 | |
| Average of class Tablet (785 - 2784, n=5, last 2 years) | |
| Dell Latitude 7350 Detachable | |
| AIDA64 / CPU Queen | |
| Minisforum V3 | |
| Microsoft Surface Pro OLED Copilot+ | |
| Average Intel Core Ultra 7 268V (49630 - 49759, n=3) | |
| Microsoft Surface Pro OLED Lunar Lake | |
| Average of class Tablet (27210 - 69762, n=5, last 2 years) | |
| Asus ProArt PZ13 HT5306 | |
| Dell Latitude 7350 Detachable | |
| AIDA64 / FPU SinJulia | |
| Minisforum V3 | |
| Microsoft Surface Pro OLED Lunar Lake | |
| Average Intel Core Ultra 7 268V (4353 - 4429, n=3) | |
| Dell Latitude 7350 Detachable | |
| Average of class Tablet (1161 - 4429, n=5, last 2 years) | |
| Microsoft Surface Pro OLED Copilot+ | |
| Asus ProArt PZ13 HT5306 | |
| AIDA64 / FPU Mandel | |
| Minisforum V3 | |
| Microsoft Surface Pro OLED Lunar Lake | |
| Average Intel Core Ultra 7 268V (25929 - 31836, n=3) | |
| Microsoft Surface Pro OLED Copilot+ | |
| Dell Latitude 7350 Detachable | |
| Average of class Tablet (6842 - 31836, n=5, last 2 years) | |
| Asus ProArt PZ13 HT5306 | |
| AIDA64 / CPU AES | |
| Microsoft Surface Pro OLED Copilot+ | |
| Minisforum V3 | |
| Average of class Tablet (1275 - 71089, n=5, last 2 years) | |
| Microsoft Surface Pro OLED Lunar Lake | |
| Asus ProArt PZ13 HT5306 | |
| Average Intel Core Ultra 7 268V (33196 - 38941, n=3) | |
| Dell Latitude 7350 Detachable | |
| AIDA64 / CPU ZLib | |
| Minisforum V3 | |
| Microsoft Surface Pro OLED Copilot+ | |
| Microsoft Surface Pro OLED Lunar Lake | |
| Average Intel Core Ultra 7 268V (441 - 631, n=3) | |
| Average of class Tablet (229 - 802, n=5, last 2 years) | |
| Asus ProArt PZ13 HT5306 | |
| Dell Latitude 7350 Detachable | |
| AIDA64 / FP64 Ray-Trace | |
| Minisforum V3 | |
| Microsoft Surface Pro OLED Lunar Lake | |
| Average Intel Core Ultra 7 268V (5938 - 6803, n=3) | |
| Microsoft Surface Pro OLED Copilot+ | |
| Average of class Tablet (1127 - 6803, n=5, last 2 years) | |
| Dell Latitude 7350 Detachable | |
| Asus ProArt PZ13 HT5306 | |
| AIDA64 / CPU PhotoWorxx | |
| Microsoft Surface Pro OLED Lunar Lake | |
| Average Intel Core Ultra 7 268V (46733 - 54886, n=3) | |
| Dell Latitude 7350 Detachable | |
| Microsoft Surface Pro OLED Copilot+ | |
| Minisforum V3 | |
| Average of class Tablet (14660 - 54886, n=5, last 2 years) | |
| Asus ProArt PZ13 HT5306 | |
系统性能
不出所料,英特尔版 Surface Pro 响应速度超快,在跨系统 CrossMark 测试中也击败了 ARM 版。另一方面,骁龙机型在浏览器测试中占有优势。
CrossMark: Overall | Productivity | Creativity | Responsiveness
WebXPRT 3: Overall
WebXPRT 4: Overall
Mozilla Kraken 1.1: Total
| PCMark 10 / Score | |
| Minisforum V3 | |
| Average Intel Core Ultra 7 268V, Intel Arc Graphics 140V (6729 - 7236, n=3) | |
| Microsoft Surface Pro OLED Lunar Lake | |
| Dell Latitude 7350 Detachable | |
| Average of class Tablet (4001 - 6924, n=2, last 2 years) | |
| PCMark 10 / Essentials | |
| Minisforum V3 | |
| Dell Latitude 7350 Detachable | |
| Average Intel Core Ultra 7 268V, Intel Arc Graphics 140V (10007 - 10701, n=3) | |
| Microsoft Surface Pro OLED Lunar Lake | |
| Average of class Tablet (8348 - 10351, n=2, last 2 years) | |
| PCMark 10 / Productivity | |
| Minisforum V3 | |
| Average Intel Core Ultra 7 268V, Intel Arc Graphics 140V (8766 - 9217, n=3) | |
| Dell Latitude 7350 Detachable | |
| Microsoft Surface Pro OLED Lunar Lake | |
| Average of class Tablet (5735 - 8823, n=2, last 2 years) | |
| PCMark 10 / Digital Content Creation | |
| Average Intel Core Ultra 7 268V, Intel Arc Graphics 140V (9425 - 10427, n=3) | |
| Microsoft Surface Pro OLED Lunar Lake | |
| Minisforum V3 | |
| Average of class Tablet (3632 - 9863, n=2, last 2 years) | |
| Dell Latitude 7350 Detachable | |
| CrossMark / Overall | |
| Microsoft Surface Pro OLED Lunar Lake | |
| Average Intel Core Ultra 7 268V, Intel Arc Graphics 140V (1643 - 1763, n=3) | |
| Minisforum V3 | |
| Microsoft Surface Pro OLED Copilot+ | |
| Dell Latitude 7350 Detachable | |
| Asus ProArt PZ13 HT5306 | |
| Average of class Tablet (172 - 1944, n=63, last 2 years) | |
| CrossMark / Productivity | |
| Microsoft Surface Pro OLED Lunar Lake | |
| Average Intel Core Ultra 7 268V, Intel Arc Graphics 140V (1577 - 1696, n=3) | |
| Minisforum V3 | |
| Microsoft Surface Pro OLED Copilot+ | |
| Dell Latitude 7350 Detachable | |
| Asus ProArt PZ13 HT5306 | |
| Average of class Tablet (185 - 1797, n=63, last 2 years) | |
| CrossMark / Creativity | |
| Microsoft Surface Pro OLED Lunar Lake | |
| Average Intel Core Ultra 7 268V, Intel Arc Graphics 140V (1866 - 2021, n=3) | |
| Minisforum V3 | |
| Microsoft Surface Pro OLED Copilot+ | |
| Dell Latitude 7350 Detachable | |
| Asus ProArt PZ13 HT5306 | |
| Average of class Tablet (151 - 2350, n=63, last 2 years) | |
| CrossMark / Responsiveness | |
| Microsoft Surface Pro OLED Copilot+ | |
| Microsoft Surface Pro OLED Lunar Lake | |
| Average Intel Core Ultra 7 268V, Intel Arc Graphics 140V (1267 - 1313, n=3) | |
| Minisforum V3 | |
| Dell Latitude 7350 Detachable | |
| Asus ProArt PZ13 HT5306 | |
| Average of class Tablet (205 - 1462, n=63, last 2 years) | |
| WebXPRT 3 / Overall | |
| Microsoft Surface Pro OLED Copilot+ | |
| Asus ProArt PZ13 HT5306 | |
| Minisforum V3 | |
| Microsoft Surface Pro OLED Lunar Lake | |
| Average Intel Core Ultra 7 268V, Intel Arc Graphics 140V (266 - 310, n=3) | |
| Dell Latitude 7350 Detachable | |
| Average of class Tablet (36 - 435, n=40, last 2 years) | |
| WebXPRT 4 / Overall | |
| Microsoft Surface Pro OLED Copilot+ | |
| Asus ProArt PZ13 HT5306 | |
| Microsoft Surface Pro OLED Lunar Lake | |
| Average Intel Core Ultra 7 268V, Intel Arc Graphics 140V (245 - 287, n=3) | |
| Minisforum V3 | |
| Dell Latitude 7350 Detachable | |
| Average of class Tablet (21 - 315, n=68, last 2 years) | |
| Mozilla Kraken 1.1 / Total | |
| Average of class Tablet (319 - 34733, n=77, last 2 years) | |
| Dell Latitude 7350 Detachable | |
| Minisforum V3 | |
| Average Intel Core Ultra 7 268V, Intel Arc Graphics 140V (468 - 476, n=3) | |
| Microsoft Surface Pro OLED Lunar Lake | |
| Asus ProArt PZ13 HT5306 | |
| Microsoft Surface Pro OLED Copilot+ | |
* ... smaller is better
| PCMark 10 Score | 6924 points | |
Help | ||
| AIDA64 / Memory Copy | |
| Microsoft Surface Pro OLED Lunar Lake | |
| Average Intel Core Ultra 7 268V (100445 - 108317, n=3) | |
| Dell Latitude 7350 Detachable | |
| Minisforum V3 | |
| Microsoft Surface Pro OLED Copilot+ | |
| Average of class Tablet (32539 - 108317, n=5, last 2 years) | |
| Asus ProArt PZ13 HT5306 | |
| AIDA64 / Memory Read | |
| Asus ProArt PZ13 HT5306 | |
| Microsoft Surface Pro OLED Copilot+ | |
| Microsoft Surface Pro OLED Lunar Lake | |
| Average Intel Core Ultra 7 268V (82511 - 88341, n=3) | |
| Average of class Tablet (31342 - 124555, n=5, last 2 years) | |
| Dell Latitude 7350 Detachable | |
| Minisforum V3 | |
| AIDA64 / Memory Write | |
| Microsoft Surface Pro OLED Lunar Lake | |
| Average Intel Core Ultra 7 268V (115959 - 117888, n=3) | |
| Minisforum V3 | |
| Average of class Tablet (33224 - 117859, n=5, last 2 years) | |
| Dell Latitude 7350 Detachable | |
| Asus ProArt PZ13 HT5306 | |
| Microsoft Surface Pro OLED Copilot+ | |
| AIDA64 / Memory Latency | |
| Dell Latitude 7350 Detachable | |
| Minisforum V3 | |
| Average Intel Core Ultra 7 268V (94.4 - 101.2, n=3) | |
| Microsoft Surface Pro OLED Lunar Lake | |
| Average of class Tablet (7.5 - 105.3, n=4, last 2 years) | |
* ... smaller is better
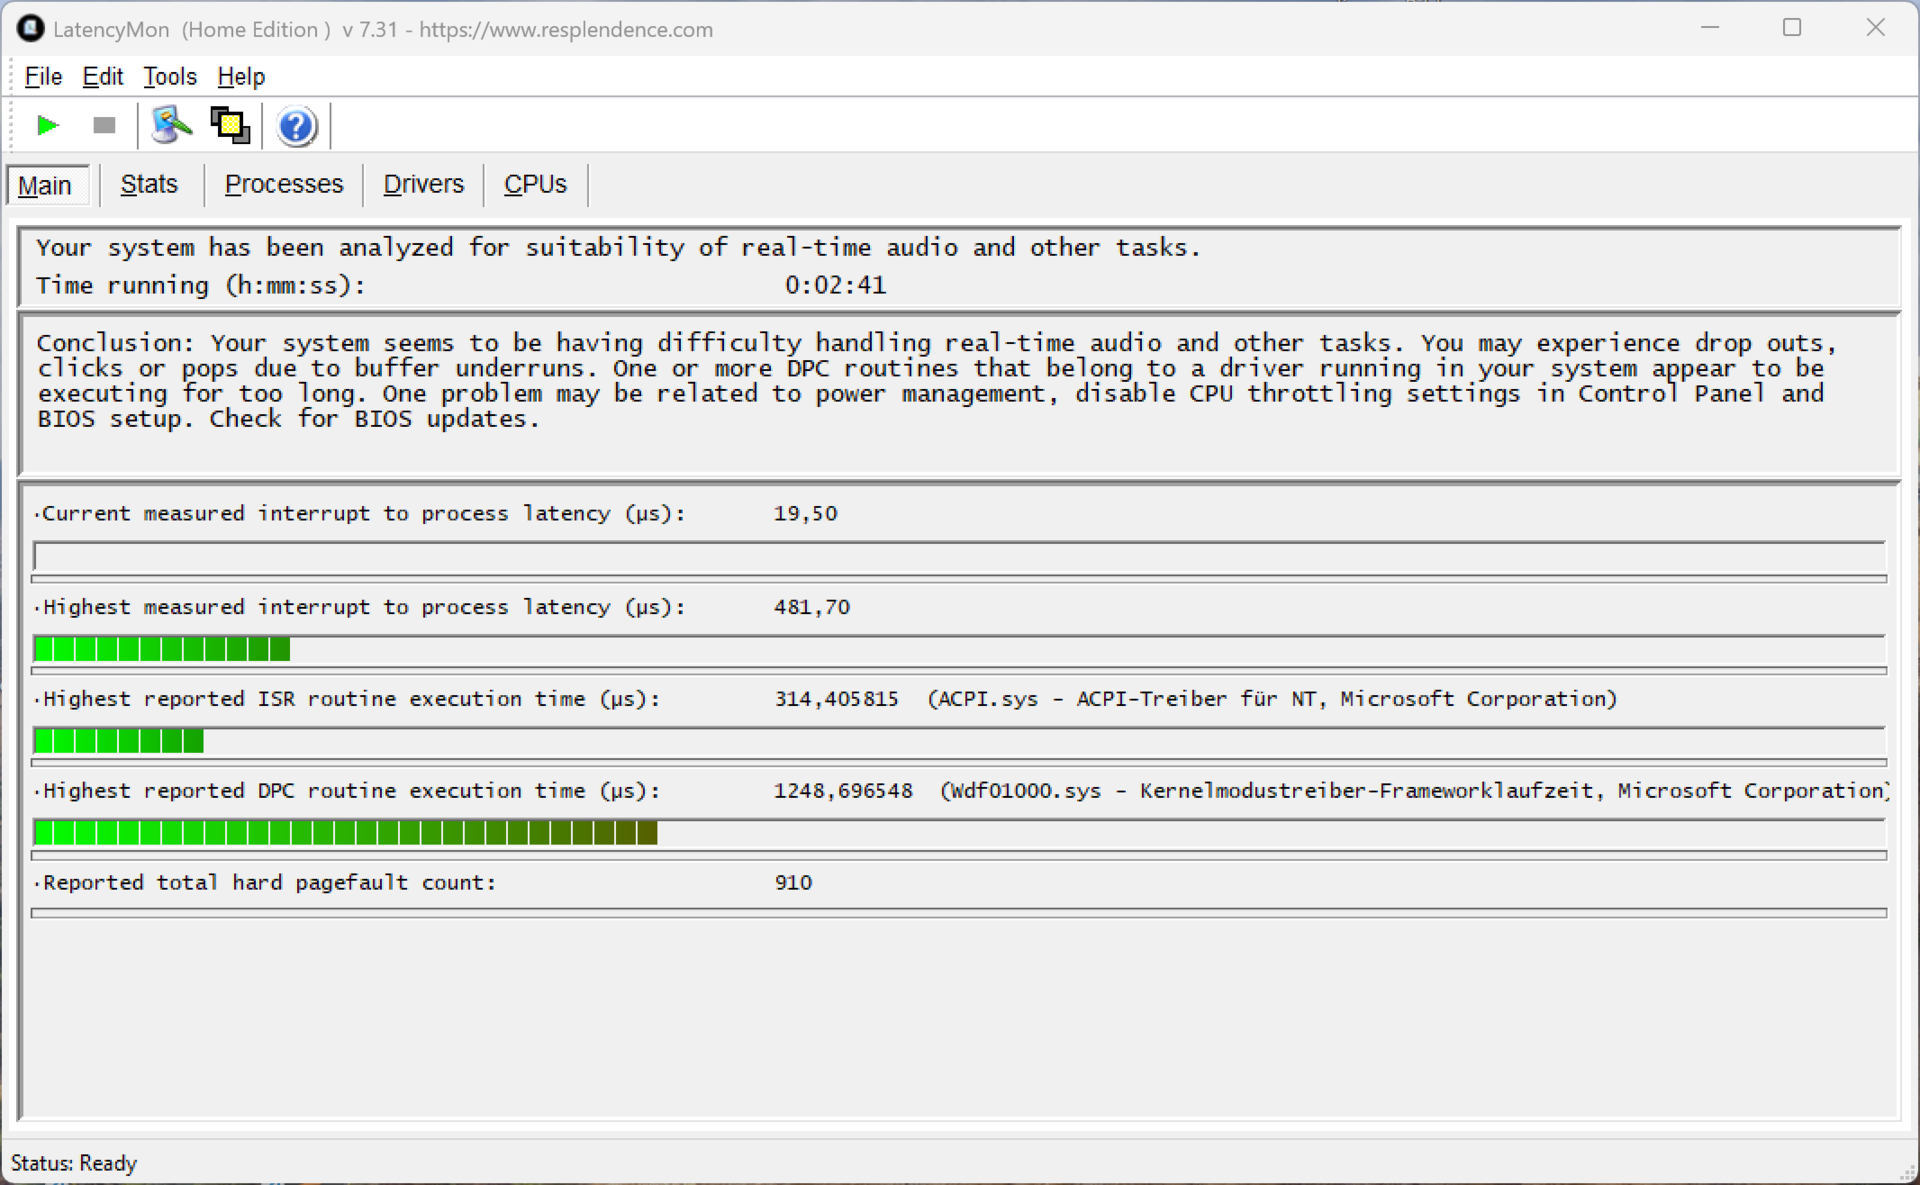
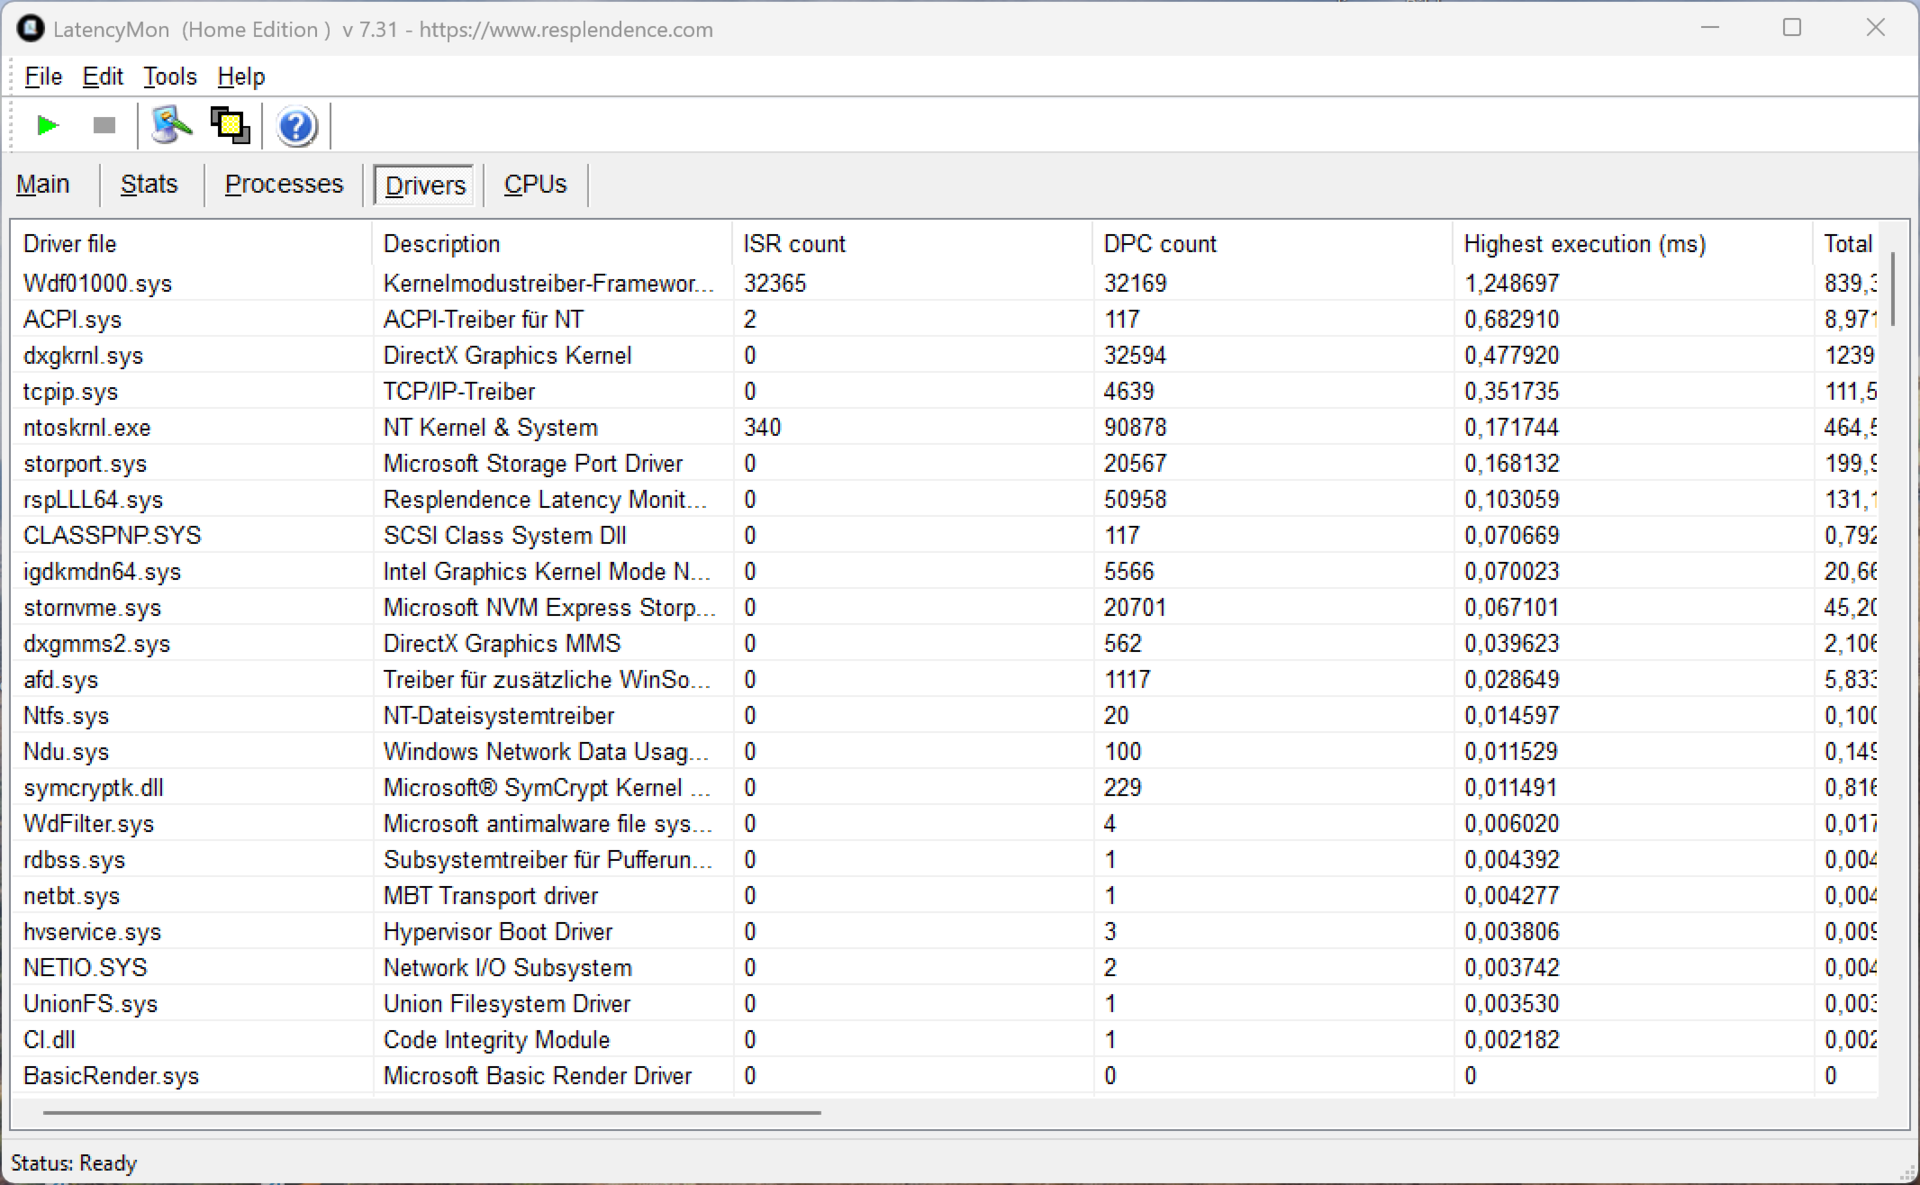
DPC 延迟
在我们的标准延迟测试中(上网、4K YouTube 播放、CPU 负载),我们的测试设备在当前 BIOS 版本下没有显示任何限制。虽然有一个驱动程序出现了轻微故障,但重要的 "中断到进程延迟 "值非常低。
| DPC Latencies / LatencyMon - interrupt to process latency (max), Web, Youtube, Prime95 | |
| Dell Latitude 7350 Detachable | |
| Minisforum V3 | |
| Microsoft Surface Pro OLED Lunar Lake | |
* ... smaller is better
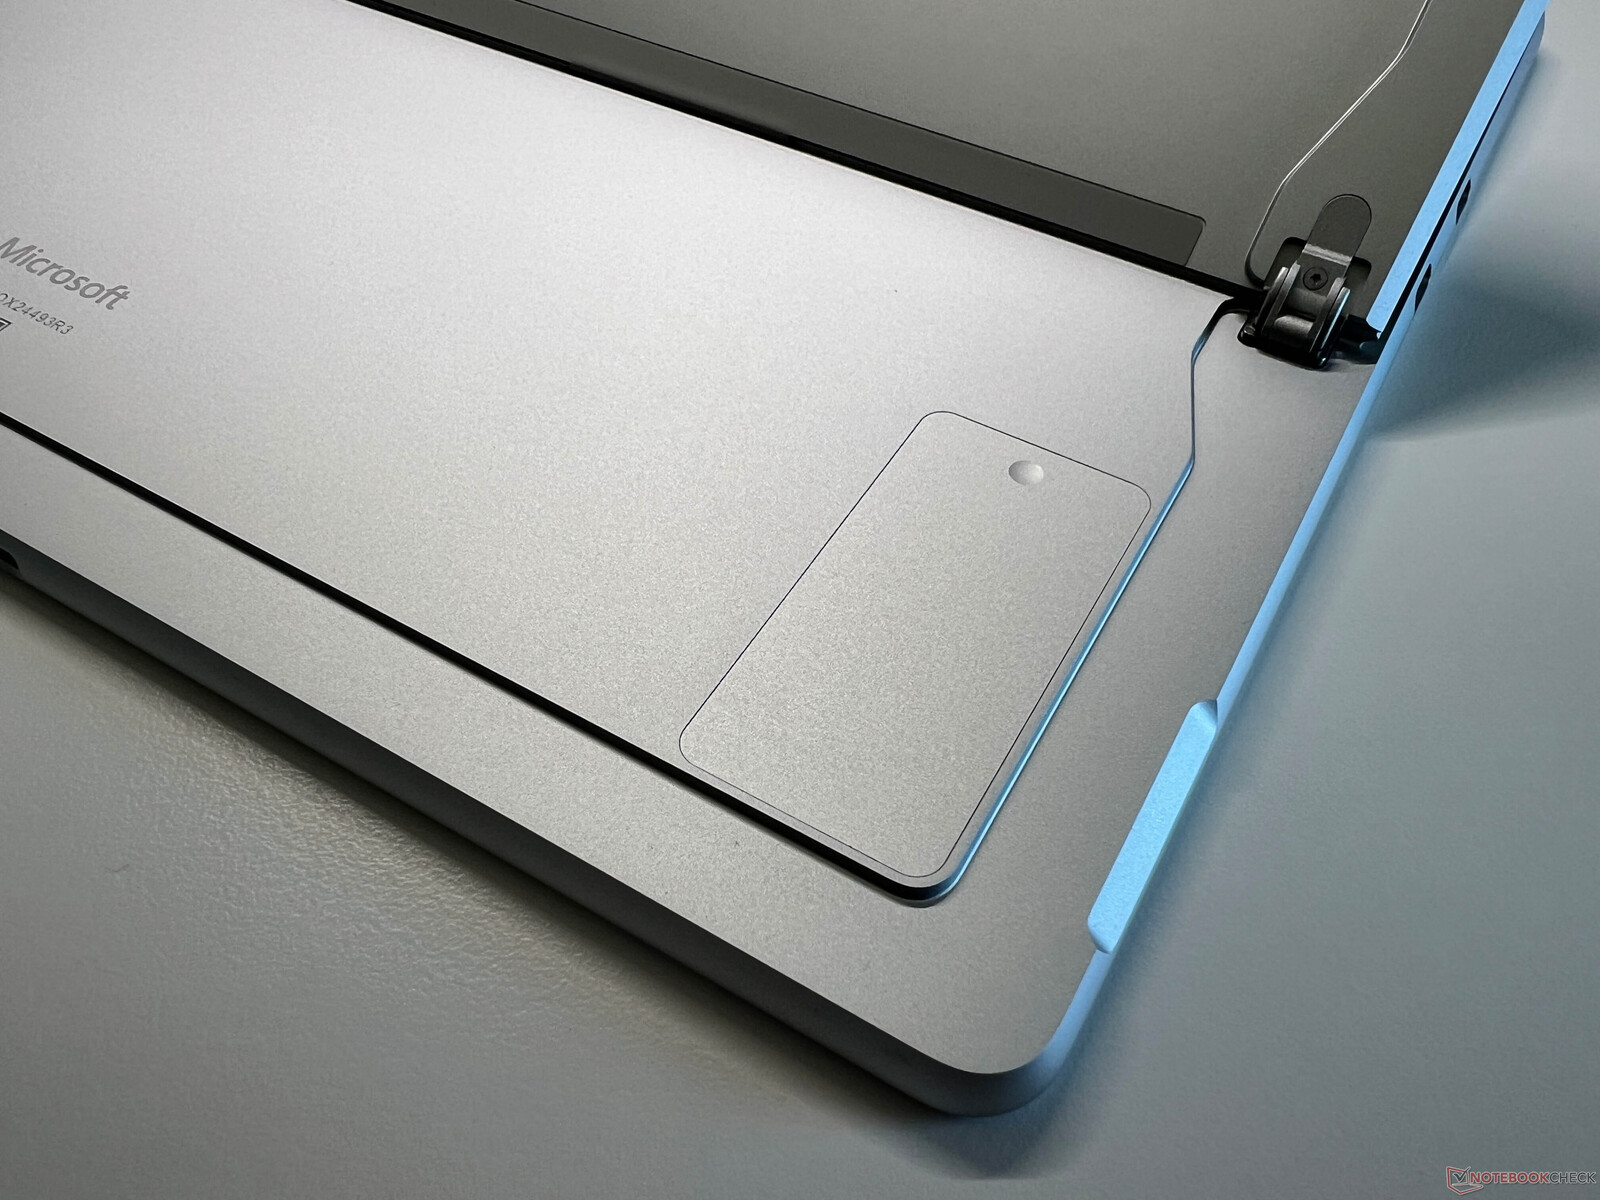
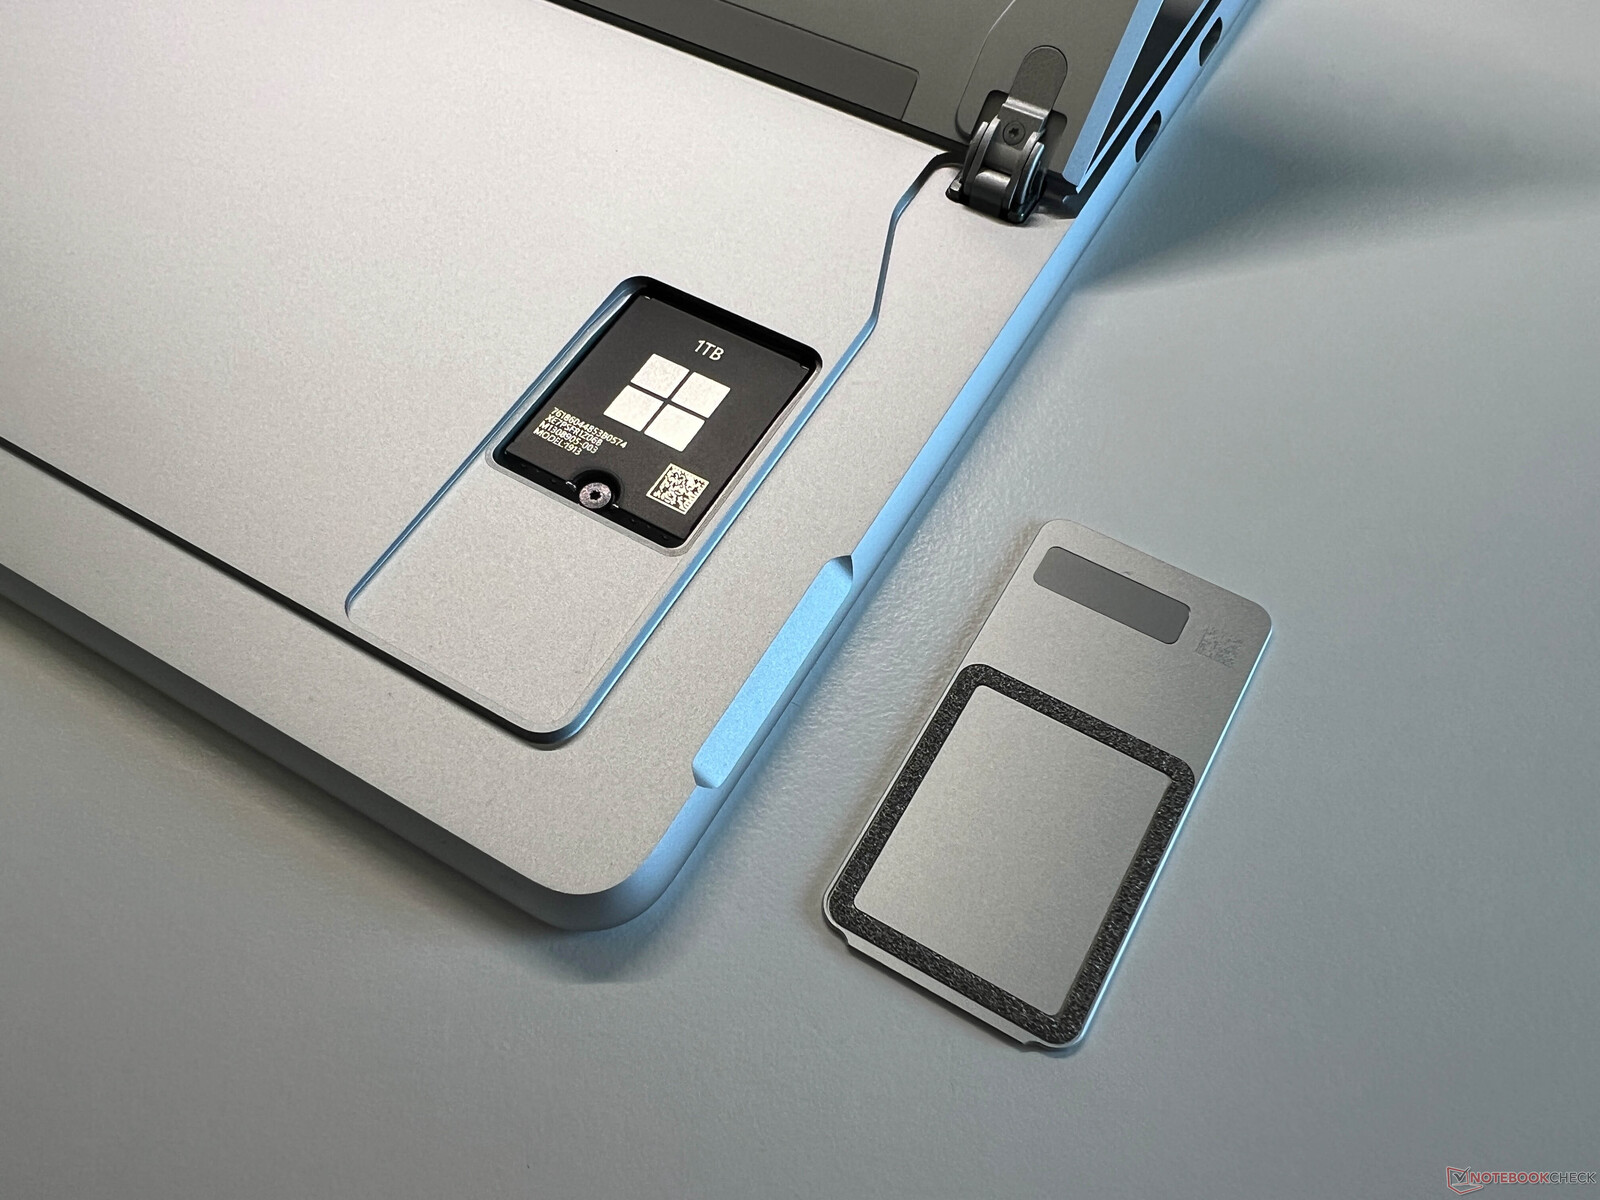
存储设备
Surface Pro 配备了来自 Kioxia 的 1 TB SSD(首次启动设备后有 898 GB 的可用空间),其传输速率非常高。此外,即使在长时间负载的情况下,其性能也能保持完全稳定。小巧的 M.2-2230 固态硬盘更换起来非常方便。

* ... smaller is better
Reading continuous performance: DiskSpd Read Loop, Queue Depth 8
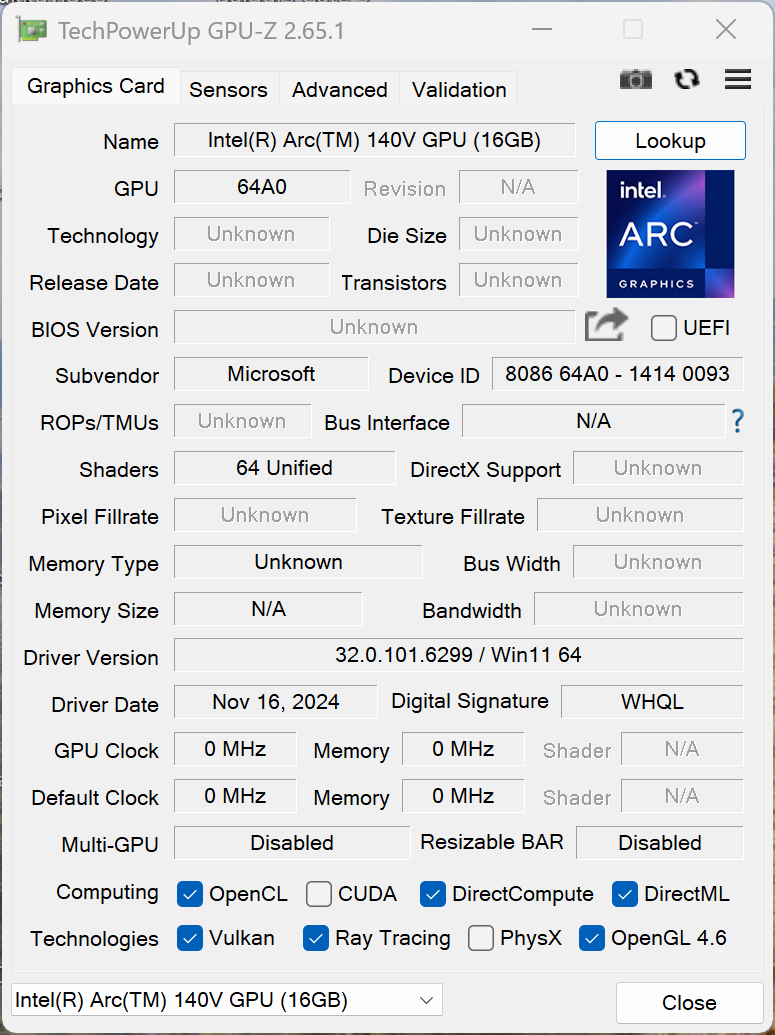
图形卡
在图形性能方面 英特尔弧显卡 140V比 Adreno X1-85在我们的测试中优势明显。除了纯粹的 GPU 性能外,其游戏性能也同样出色,当然,兼容性也是 x86 版本的一大优势。当然,游戏并不是 Surface Pro 这类设备的主攻方向,但英特尔机型在这方面的局限性并不明显,即使是要求更高的游戏,如《赛博朋克》(Cyberpunk),也能在 1080p 分辨率和中低细节下流畅运行。在持续负载和电池模式下,其 GPU 性能保持完全稳定。
| 3DMark 11 Performance | 11898 points | |
| 3DMark Fire Strike Score | 9008 points | |
| 3DMark Time Spy Score | 4532 points | |
| 3DMark Steel Nomad Score | 828 points | |
| 3DMark Steel Nomad Light Score | 3323 points | |
| 3DMark Steel Nomad Light Unlimited Score | 3318 points | |
Help | ||
* ... smaller is better
| Performance Rating - Percent | |
| Microsoft Surface Pro OLED Lunar Lake | |
| Minisforum V3 -1! | |
| Average of class Tablet | |
| Microsoft Surface Pro OLED Copilot+ -2! | |
| Dell Latitude 7350 Detachable | |
| Asus ProArt PZ13 HT5306 -3! | |
| Cyberpunk 2077 2.2 Phantom Liberty - 1920x1080 Ultra Preset (FSR off) | |
| Microsoft Surface Pro OLED Lunar Lake | |
| Minisforum V3 | |
| Average of class Tablet (13.2 - 28.7, n=3, last 2 years) | |
| Microsoft Surface Pro OLED Copilot+ | |
| Dell Latitude 7350 Detachable | |
| Asus ProArt PZ13 HT5306 | |
| Baldur's Gate 3 - 1920x1080 Ultra Preset | |
| Microsoft Surface Pro OLED Lunar Lake | |
| Average of class Tablet (16.3 - 28.3, n=3, last 2 years) | |
| Microsoft Surface Pro OLED Copilot+ | |
| Dell Latitude 7350 Detachable | |
| GTA V - 1920x1080 Highest Settings possible AA:4xMSAA + FX AF:16x | |
| Microsoft Surface Pro OLED Lunar Lake | |
| Minisforum V3 | |
| Average of class Tablet (20.8 - 27.8, n=2, last 2 years) | |
| Asus ProArt PZ13 HT5306 | |
| Dell Latitude 7350 Detachable | |
| Final Fantasy XV Benchmark - 1920x1080 High Quality | |
| Microsoft Surface Pro OLED Lunar Lake | |
| Minisforum V3 | |
| Average of class Tablet (7.29 - 34.4, n=4, last 2 years) | |
| Microsoft Surface Pro OLED Copilot+ | |
| Dell Latitude 7350 Detachable | |
| Asus ProArt PZ13 HT5306 | |
| Strange Brigade - 1920x1080 ultra AA:ultra AF:16 | |
| Microsoft Surface Pro OLED Lunar Lake | |
| Minisforum V3 | |
| Average of class Tablet (37 - 58, n=3, last 2 years) | |
| Microsoft Surface Pro OLED Copilot+ | |
| Dell Latitude 7350 Detachable | |
| Dota 2 Reborn - 1920x1080 ultra (3/3) best looking | |
| Microsoft Surface Pro OLED Lunar Lake | |
| Minisforum V3 | |
| Microsoft Surface Pro OLED Copilot+ | |
| Dell Latitude 7350 Detachable | |
| Asus ProArt PZ13 HT5306 | |
| Average of class Tablet (13.2 - 84.5, n=5, last 2 years) | |
| X-Plane 11.11 - 1920x1080 high (fps_test=3) | |
| Minisforum V3 | |
| Microsoft Surface Pro OLED Lunar Lake | |
| Dell Latitude 7350 Detachable | |
| Average of class Tablet (16.1 - 29.4, n=3, last 2 years) | |
Cyberpunk 2077 ultra FPS diagram
| low | med. | high | ultra | |
|---|---|---|---|---|
| GTA V (2015) | 151.1 | 124.7 | 68.9 | 27.8 |
| Dota 2 Reborn (2015) | 103.5 | 82.5 | 56.6 | 84.5 |
| Final Fantasy XV Benchmark (2018) | 86.9 | 47.9 | 34.4 | |
| X-Plane 11.11 (2018) | 41 | 37.6 | 29.4 | |
| Strange Brigade (2018) | 212 | 79.9 | 67 | 58 |
| Baldur's Gate 3 (2023) | 41 | 32.4 | 28.9 | 28.3 |
| Cyberpunk 2077 2.2 Phantom Liberty (2023) | 47.6 | 37.5 | 32.7 | 28.7 |
排放与能源
噪音排放
英特尔机型最大的惊喜无疑是它的风扇性能,因为即使在满载情况下,也要花上整整一分钟才能听到风扇的声音,即使在最佳性能模式下也是如此。之后,风扇转速会持续增加--无论是在游戏中还是在压力测试中,我们都测得了 44.9 分贝(A)的高噪音,与骁龙机型相同。 骁龙机型的最大值相同。不过,大约 8 分钟后才达到这一水平。在我们的平均负载测试中,即 3DMark 06 的第一个场景,英特尔机型的风扇完全没有启动。这样的表现非常出色,在日常工作中几乎听不到风扇的声音。我们的测试设备上也没有其他电子噪音。
Noise Level
| Idle |
| 23.6 / 23.6 / 23.6 dB(A) |
| Load |
| 23.6 / 44.9 dB(A) |
 | ||
30 dB silent 40 dB(A) audible 50 dB(A) loud |
||
min: | ||
| Microsoft Surface Pro OLED Lunar Lake Arc 140V, Core Ultra 7 268V, Kioxia BG6 KBG60ZNS1T02 | Microsoft Surface Pro OLED Copilot+ Adreno X1-85 3.8 TFLOPS, SD X Elite X1E-80-100, Samsung PM9B1 1024GB MZVL41T0HBLB | Dell Latitude 7350 Detachable Graphics 4-Core, Ultra 7 164U, Micron 2550 1TB | Asus ProArt PZ13 HT5306 Adreno X1-45 1.7 TFLOPS, SD X Plus X1P-42-100, WD PC SN740 SDDPTQD-1T00 | Minisforum V3 Radeon 780M, R7 8840U, Kingston OM8PGP41024Q-A0 | |
|---|---|---|---|---|---|
| Noise | -8% | -4% | 3% | -18% | |
| off / environment * | 23.6 | 23.6 -0% | 22.9 3% | 23.7 -0% | 25.4 -8% |
| Idle Minimum * | 23.6 | 23.6 -0% | 22.9 3% | 23.7 -0% | 26.7 -13% |
| Idle Average * | 23.6 | 23.6 -0% | 22.9 3% | 23.7 -0% | 31.6 -34% |
| Idle Maximum * | 23.6 | 25.2 -7% | 24.4 -3% | 23.7 -0% | 32.5 -38% |
| Load Average * | 23.6 | 39 -65% | 29.7 -26% | 26.7 -13% | 32.7 -39% |
| Cyberpunk 2077 ultra * | 44.9 | 39 13% | 47.2 -5% | 35.1 22% | |
| Load Maximum * | 44.9 | 44.8 -0% | 47.2 -5% | 40 11% | 34 24% |
| Witcher 3 ultra * | 33.2 |
* ... smaller is better
温度
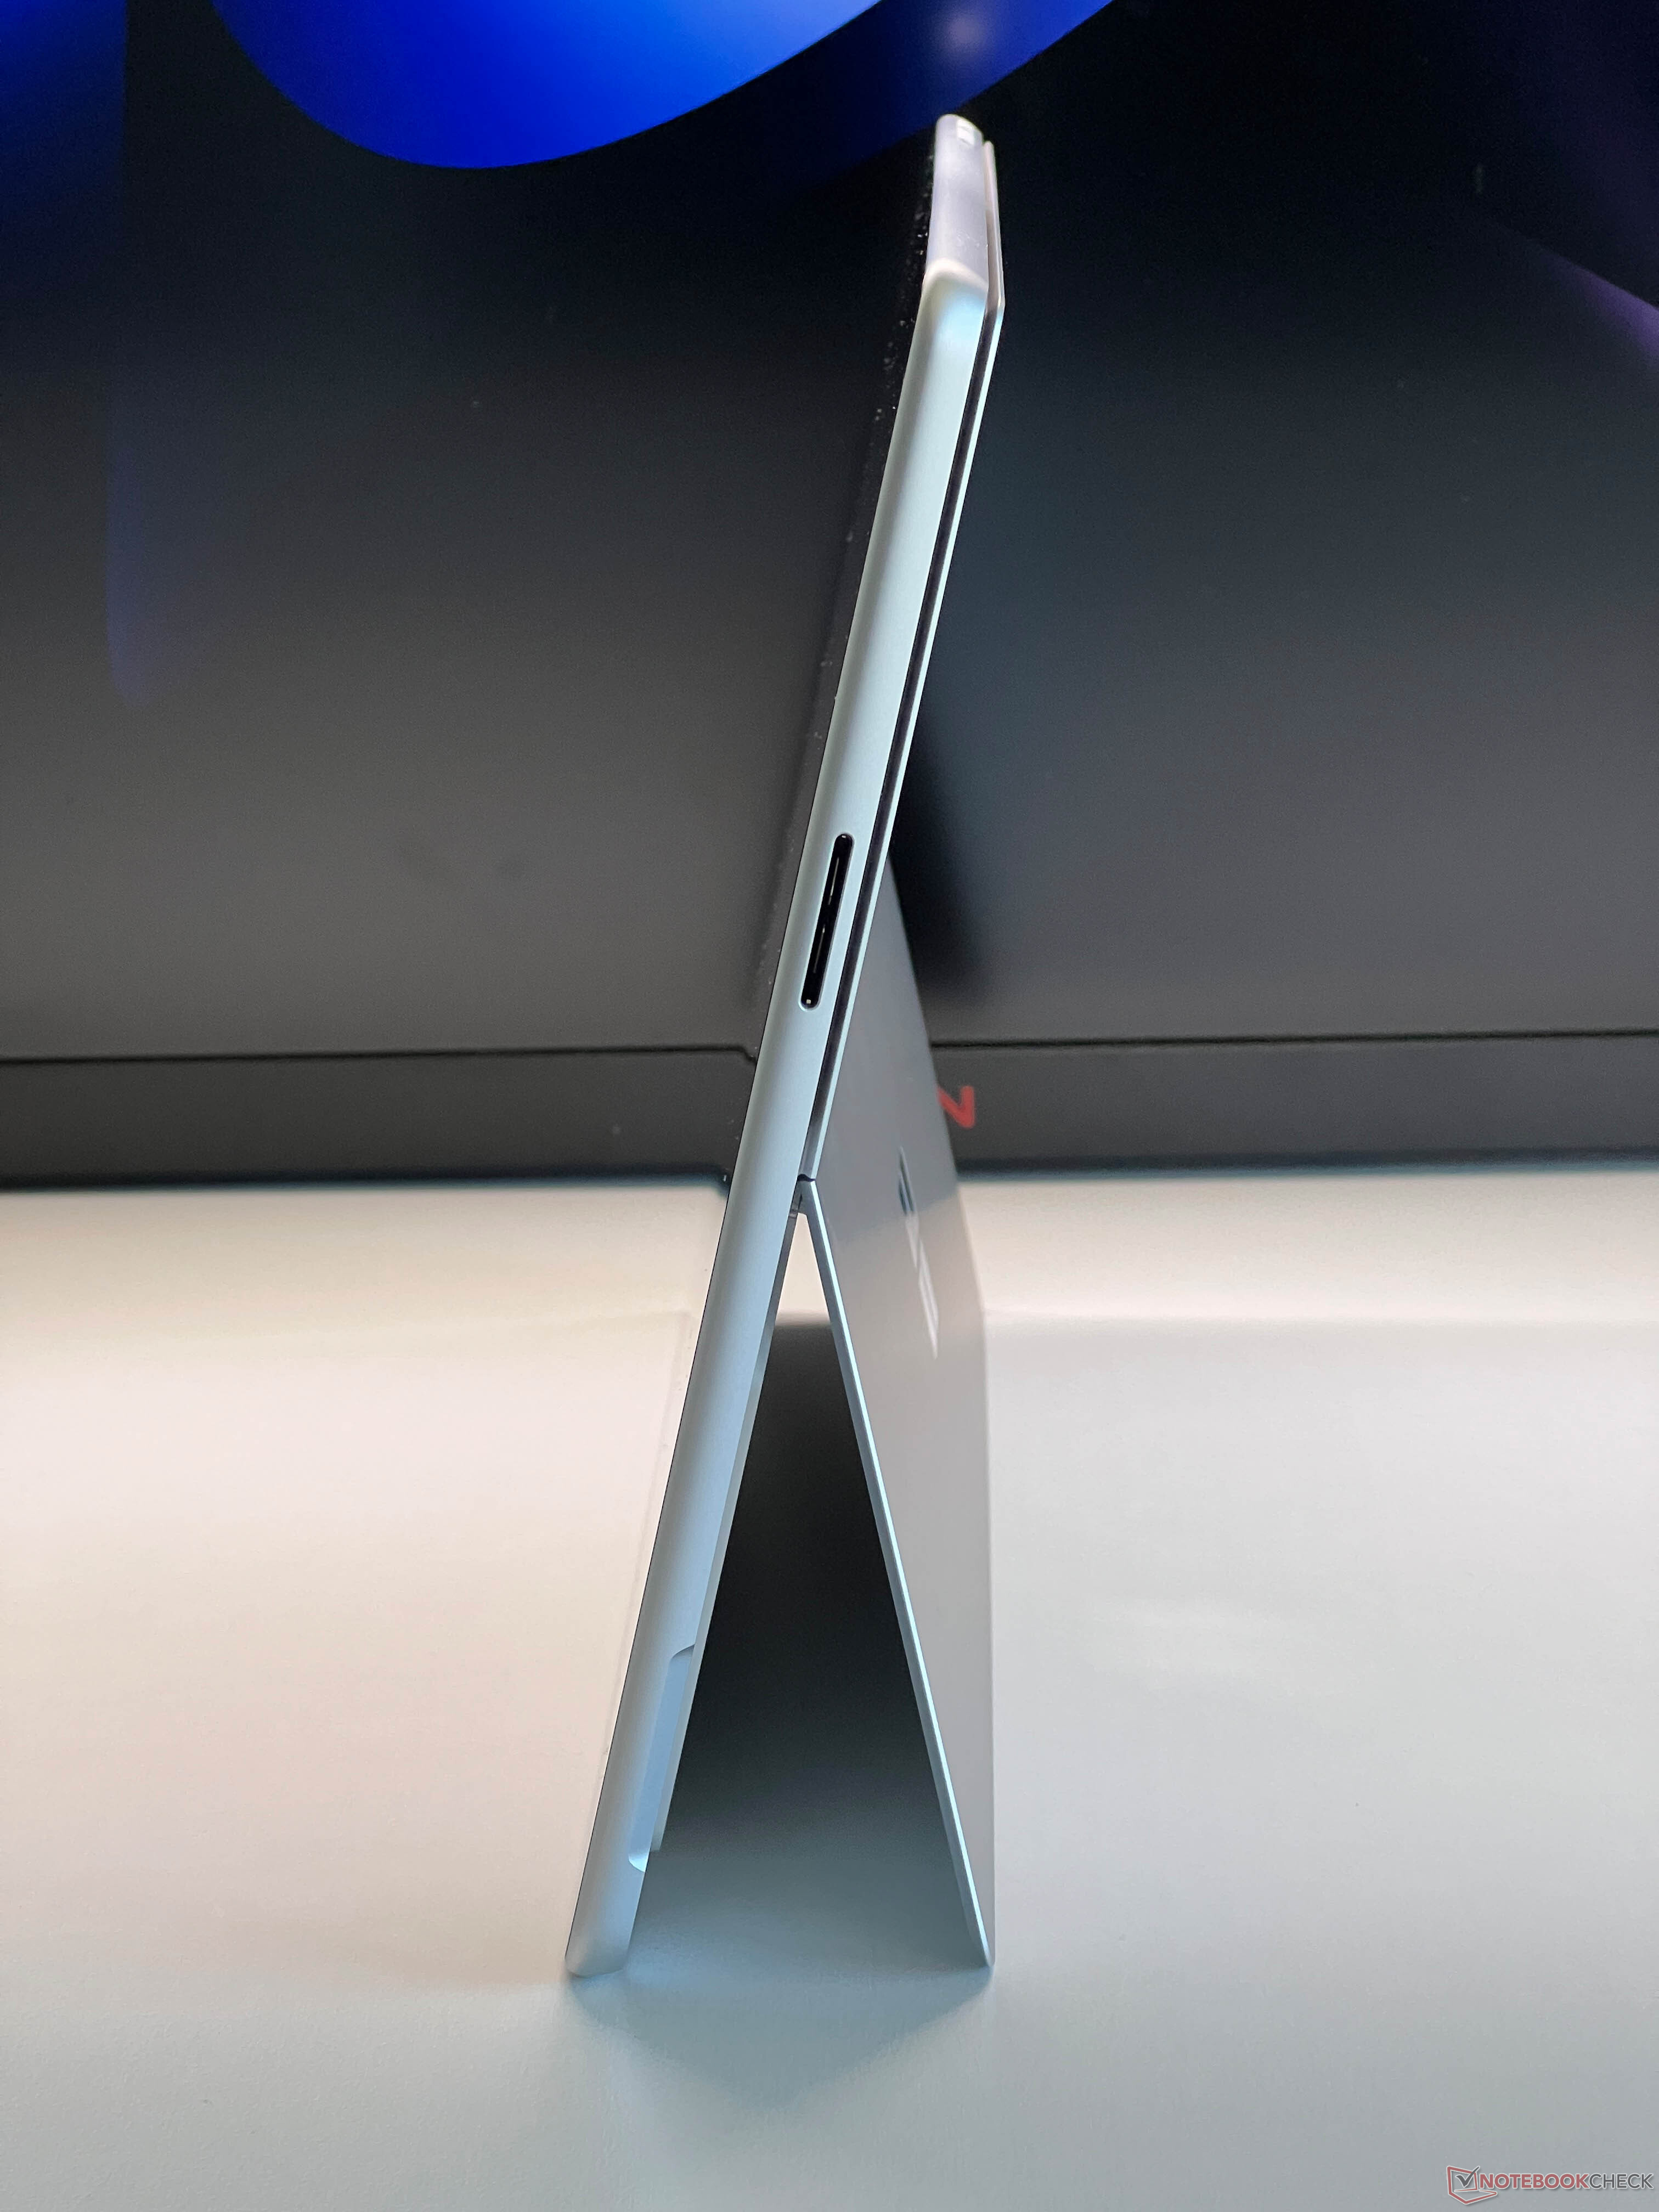
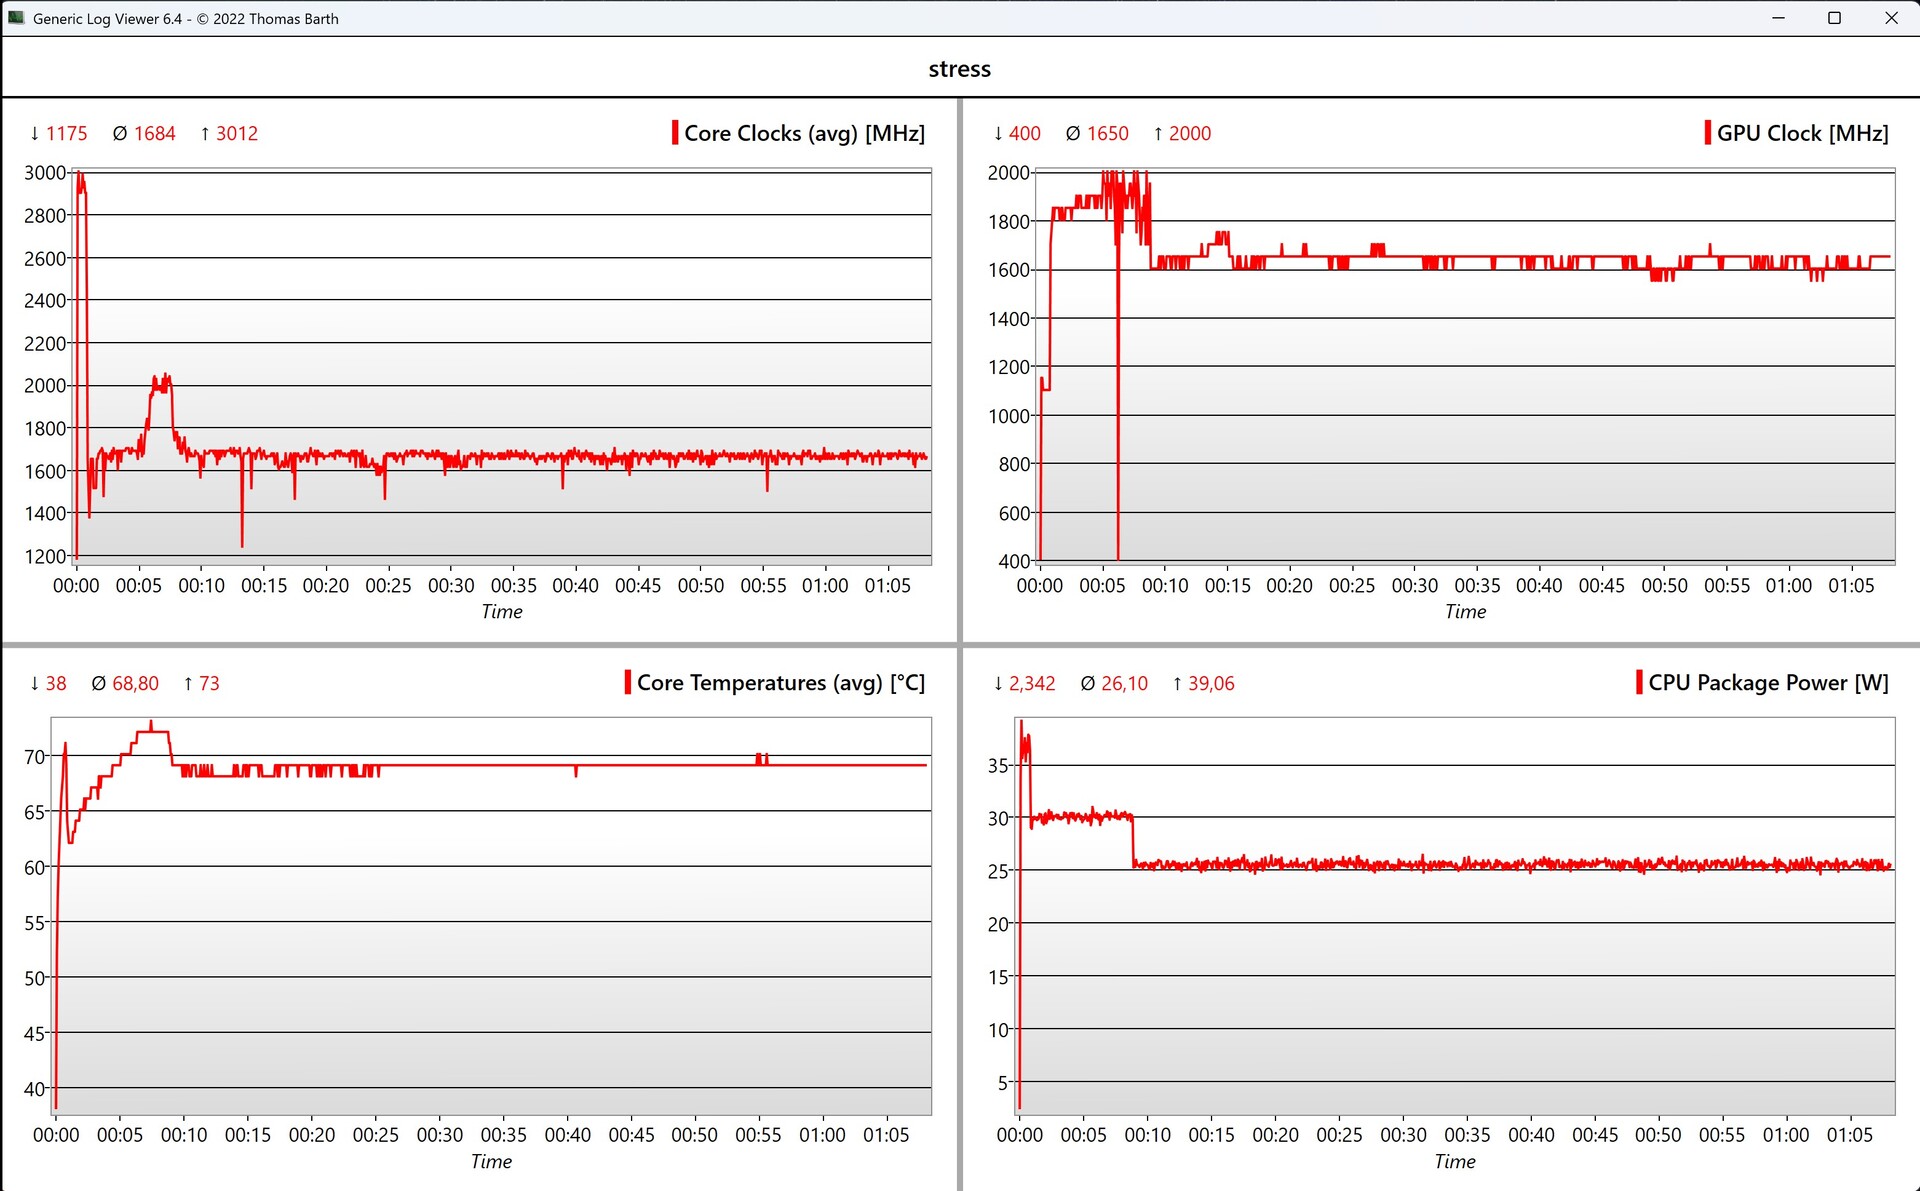
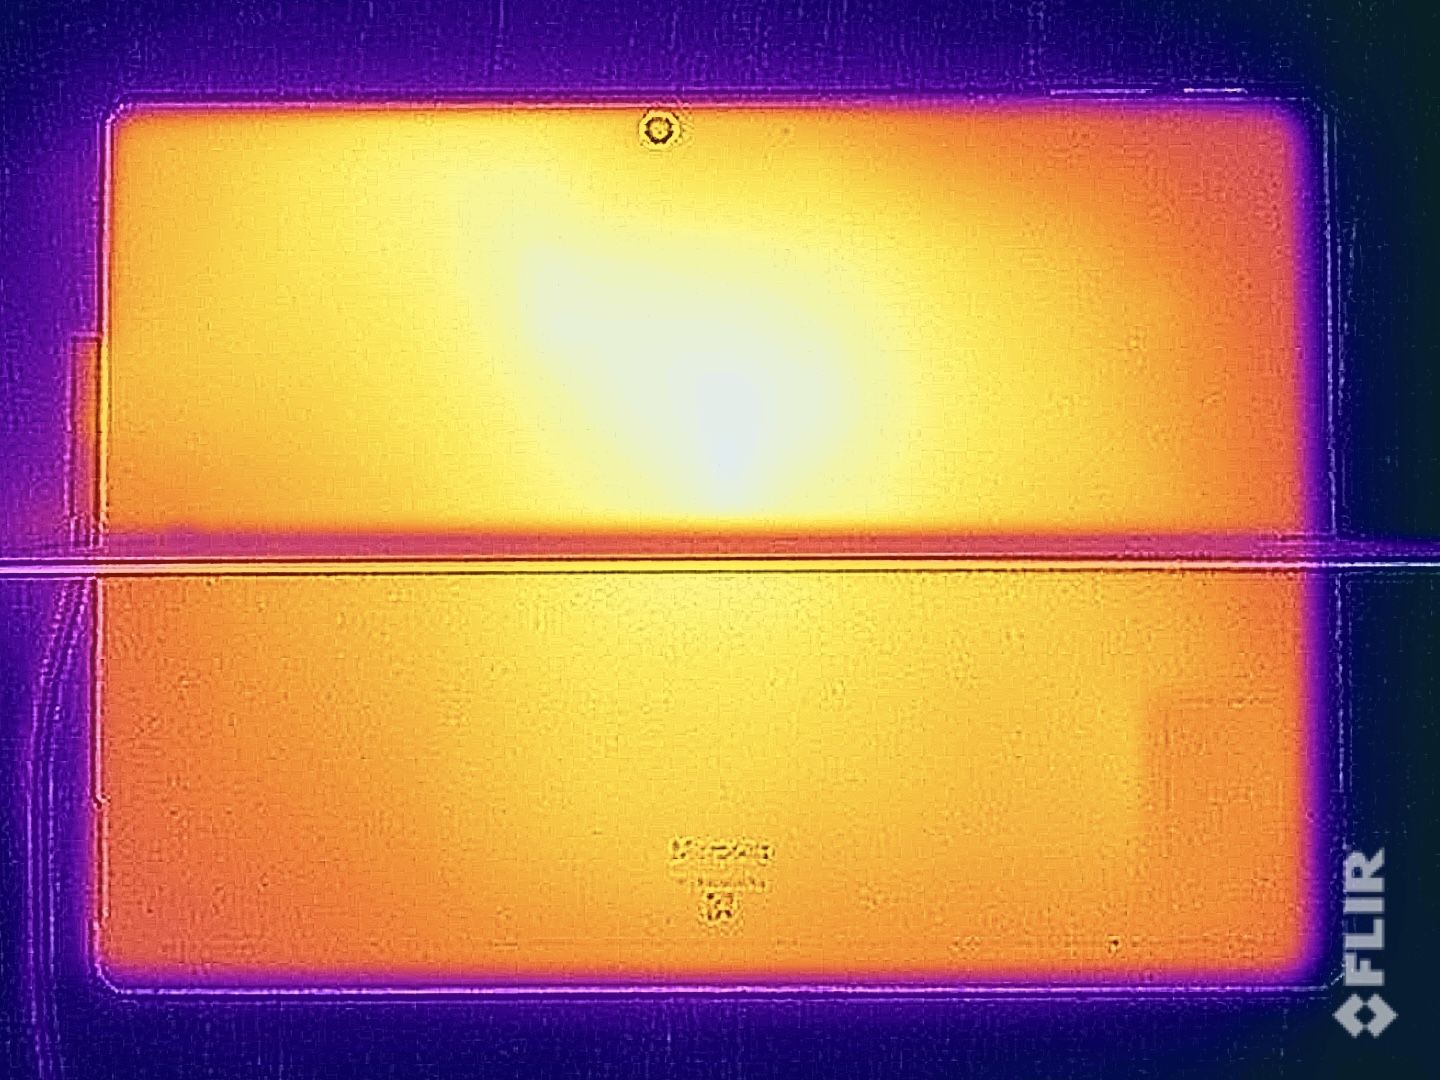
在执行简单任务时,笔记本电脑的铝制外壳可以保持良好的散热,但在高负载情况下会明显发热,在这方面,英特尔/ARM 变体之间的数值相当高。不过,得益于其设计,只要不是手持设备,这并不一定是个问题。在压力测试中,处理器以 30 瓦的功率运行了约 8 分钟,然后稳定在 25 瓦。
(±) The maximum temperature on the upper side is 43.9 °C / 111 F, compared to the average of 33.7 °C / 93 F, ranging from 20.7 to 53.2 °C for the class Tablet.
(-) The bottom heats up to a maximum of 45.3 °C / 114 F, compared to the average of 33.2 °C / 92 F
(+) In idle usage, the average temperature for the upper side is 26.5 °C / 80 F, compared to the device average of 30 °C / 86 F.
(-) 3: The average temperature for the upper side is 43.2 °C / 110 F, compared to the average of 30 °C / 86 F for the class Tablet.

| Microsoft Surface Pro OLED Lunar Lake Intel Core Ultra 7 268V, Intel Arc Graphics 140V | Microsoft Surface Pro OLED Copilot+ Qualcomm Snapdragon X Elite X1E-80-100, Qualcomm SD X Adreno X1-85 3.8 TFLOPS | Dell Latitude 7350 Detachable Intel Core Ultra 7 164U, Intel Graphics 4-Core iGPU (Arc) | Asus ProArt PZ13 HT5306 Qualcomm Snapdragon X Plus X1P-42-100, Qualcomm SD X Adreno X1-45 1.7 TFLOPS | Minisforum V3 AMD Ryzen 7 8840U, AMD Radeon 780M | |
|---|---|---|---|---|---|
| Heat | 1% | 4% | -3% | -24% | |
| Maximum Upper Side * | 43.9 | 43.1 2% | 38.4 13% | 43.7 -0% | 50.5 -15% |
| Maximum Bottom * | 45.3 | 46.3 -2% | 40.6 10% | 43.9 3% | 54.8 -21% |
| Idle Upper Side * | 29.5 | 27.5 7% | 28.2 4% | 31.9 -8% | 34.9 -18% |
| Idle Bottom * | 25.7 | 26.8 -4% | 28.6 -11% | 27.6 -7% | 36.3 -41% |
* ... smaller is better
发言人
根据我们的分析,英特尔版扬声器的表现略好于 ARM 版,总体而言,它们能提供非常好的音质。
Microsoft Surface Pro OLED Lunar Lake audio analysis
(+) | speakers can play relatively loud (83.1 dB)
Bass 100 - 315 Hz
(±) | reduced bass - on average 11.3% lower than median
(±) | linearity of bass is average (8.7% delta to prev. frequency)
Mids 400 - 2000 Hz
(+) | balanced mids - only 3.6% away from median
(+) | mids are linear (3.4% delta to prev. frequency)
Highs 2 - 16 kHz
(+) | balanced highs - only 2.2% away from median
(+) | highs are linear (3.2% delta to prev. frequency)
Overall 100 - 16.000 Hz
(+) | overall sound is linear (11.1% difference to median)
Compared to same class
» 9% of all tested devices in this class were better, 4% similar, 87% worse
» The best had a delta of 7%, average was 21%, worst was 129%
Compared to all devices tested
» 6% of all tested devices were better, 2% similar, 93% worse
» The best had a delta of 4%, average was 24%, worst was 134%
Microsoft Surface Pro OLED Copilot+ audio analysis
(+) | speakers can play relatively loud (82.4 dB)
Bass 100 - 315 Hz
(±) | reduced bass - on average 8.9% lower than median
(±) | linearity of bass is average (9.3% delta to prev. frequency)
Mids 400 - 2000 Hz
(±) | higher mids - on average 6.4% higher than median
(+) | mids are linear (3.3% delta to prev. frequency)
Highs 2 - 16 kHz
(+) | balanced highs - only 3.9% away from median
(+) | highs are linear (3.2% delta to prev. frequency)
Overall 100 - 16.000 Hz
(+) | overall sound is linear (13.5% difference to median)
Compared to same class
» 23% of all tested devices in this class were better, 4% similar, 73% worse
» The best had a delta of 7%, average was 21%, worst was 129%
Compared to all devices tested
» 13% of all tested devices were better, 4% similar, 84% worse
» The best had a delta of 4%, average was 24%, worst was 134%
Dell Latitude 7350 Detachable audio analysis
(+) | speakers can play relatively loud (84.5 dB)
Bass 100 - 315 Hz
(-) | nearly no bass - on average 19.7% lower than median
(±) | linearity of bass is average (11.8% delta to prev. frequency)
Mids 400 - 2000 Hz
(+) | balanced mids - only 3.9% away from median
(+) | mids are linear (5.2% delta to prev. frequency)
Highs 2 - 16 kHz
(+) | balanced highs - only 4.8% away from median
(+) | highs are linear (3% delta to prev. frequency)
Overall 100 - 16.000 Hz
(±) | linearity of overall sound is average (16.2% difference to median)
Compared to same class
» 27% of all tested devices in this class were better, 3% similar, 70% worse
» The best had a delta of 6%, average was 20%, worst was 57%
Compared to all devices tested
» 24% of all tested devices were better, 5% similar, 71% worse
» The best had a delta of 4%, average was 24%, worst was 134%
Asus ProArt PZ13 HT5306 audio analysis
(±) | speaker loudness is average but good (79.7 dB)
Bass 100 - 315 Hz
(±) | reduced bass - on average 13% lower than median
(±) | linearity of bass is average (11% delta to prev. frequency)
Mids 400 - 2000 Hz
(+) | balanced mids - only 4.1% away from median
(+) | mids are linear (5.3% delta to prev. frequency)
Highs 2 - 16 kHz
(+) | balanced highs - only 3.1% away from median
(+) | highs are linear (5.1% delta to prev. frequency)
Overall 100 - 16.000 Hz
(±) | linearity of overall sound is average (15.6% difference to median)
Compared to same class
» 25% of all tested devices in this class were better, 3% similar, 72% worse
» The best had a delta of 6%, average was 20%, worst was 57%
Compared to all devices tested
» 21% of all tested devices were better, 4% similar, 74% worse
» The best had a delta of 4%, average was 24%, worst was 134%
Minisforum V3 audio analysis
(±) | speaker loudness is average but good (74.8 dB)
Bass 100 - 315 Hz
(±) | reduced bass - on average 13.5% lower than median
(±) | linearity of bass is average (10.2% delta to prev. frequency)
Mids 400 - 2000 Hz
(+) | balanced mids - only 3.2% away from median
(±) | linearity of mids is average (8.2% delta to prev. frequency)
Highs 2 - 16 kHz
(+) | balanced highs - only 4.6% away from median
(±) | linearity of highs is average (7.8% delta to prev. frequency)
Overall 100 - 16.000 Hz
(±) | linearity of overall sound is average (21.3% difference to median)
Compared to same class
» 55% of all tested devices in this class were better, 12% similar, 33% worse
» The best had a delta of 6%, average was 20%, worst was 57%
Compared to all devices tested
» 57% of all tested devices were better, 7% similar, 36% worse
» The best had a delta of 4%, average was 24%, worst was 134%
耗电量
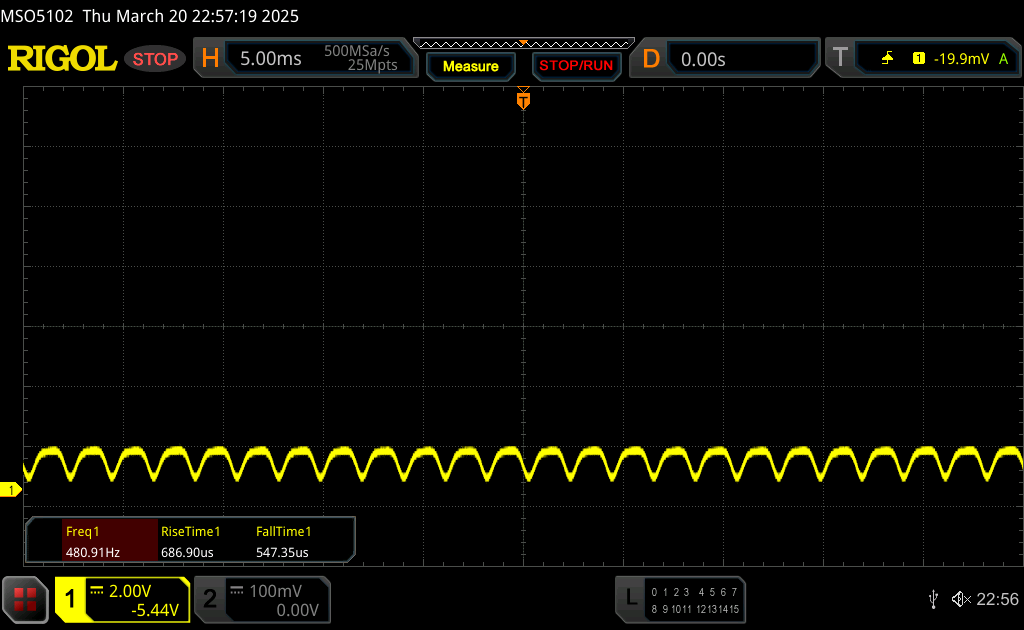
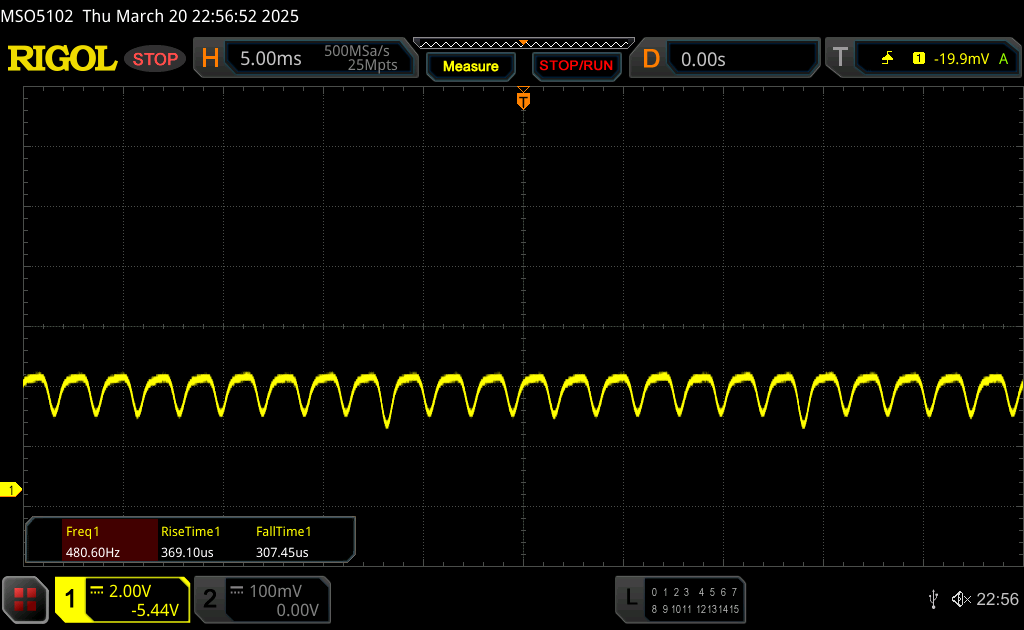
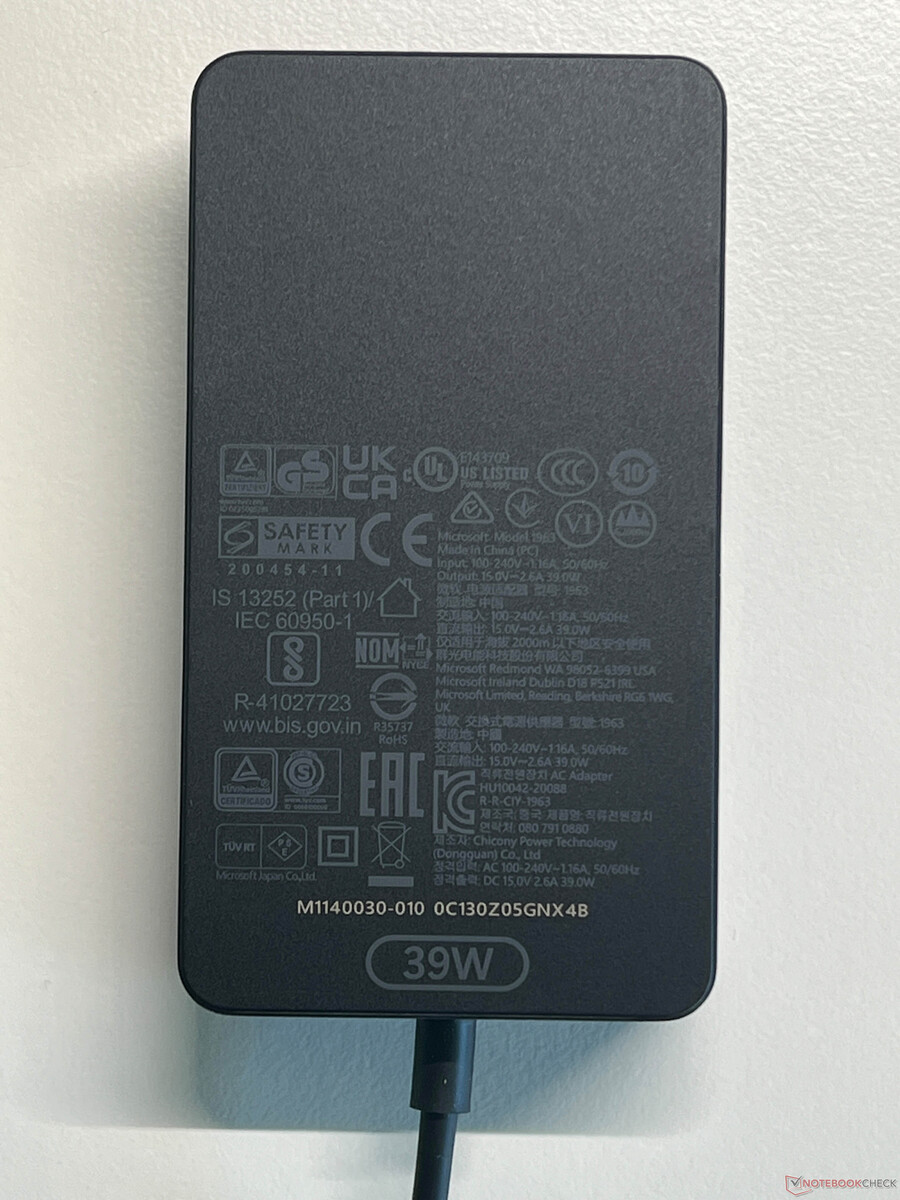
在空闲模式下,英特尔机型比 ARM 机型需要更多的电量,但在负载模式下,两者的电量值基本相同。正如我们已经看到的,骁龙版处理器在 CPU 效率方面具有明显优势,但由于其性能较低,在 GPU 效率方面则没有优势。当处理器使用 37 瓦的最大 TDP 时,39 瓦的电源成为限制因素,电池不得不短时间使用,这显然并不理想。
| Off / Standby | |
| Idle | |
| Load |
|
Key:
min: | |
| Microsoft Surface Pro OLED Lunar Lake Core Ultra 7 268V, Arc 140V, Kioxia BG6 KBG60ZNS1T02, OLED, 2880x1920, 13" | Microsoft Surface Pro OLED Copilot+ SD X Elite X1E-80-100, Adreno X1-85 3.8 TFLOPS, Samsung PM9B1 1024GB MZVL41T0HBLB, OLED, 2880x1920, 13" | Dell Latitude 7350 Detachable Ultra 7 164U, Graphics 4-Core, Micron 2550 1TB, IPS, 2880x1920, 13" | Asus ProArt PZ13 HT5306 SD X Plus X1P-42-100, Adreno X1-45 1.7 TFLOPS, WD PC SN740 SDDPTQD-1T00, OLED, 2880x1800, 13.3" | Minisforum V3 R7 8840U, Radeon 780M, Kingston OM8PGP41024Q-A0, IPS, 2560x1600, 14" | |
|---|---|---|---|---|---|
| Power Consumption | 17% | 2% | 20% | -122% | |
| Idle Minimum * | 4.5 | 2.8 38% | 3.6 20% | 3.5 22% | 10.1 -124% |
| Idle Average * | 6 | 3.9 35% | 6.1 -2% | 5.3 12% | 16.9 -182% |
| Idle Maximum * | 6.7 | 4.9 27% | 6.7 -0% | 6.1 9% | 20.6 -207% |
| Load Average * | 34.9 | 34.3 2% | 33.7 3% | 14.9 57% | 51.7 -48% |
| Cyberpunk 2077 ultra * | 39.4 | 35.8 9% | 37 6% | 23.1 41% | |
| Cyberpunk 2077 ultra external monitor * | 39 | 36 8% | 31.8 18% | 23.5 40% | |
| Load Maximum * | 41.6 | 41.2 1% | 55.1 -32% | 59.9 -44% | 61.2 -47% |
| Witcher 3 ultra * | 55.4 |
* ... smaller is better
Power consumption Cyberpunk / stress test
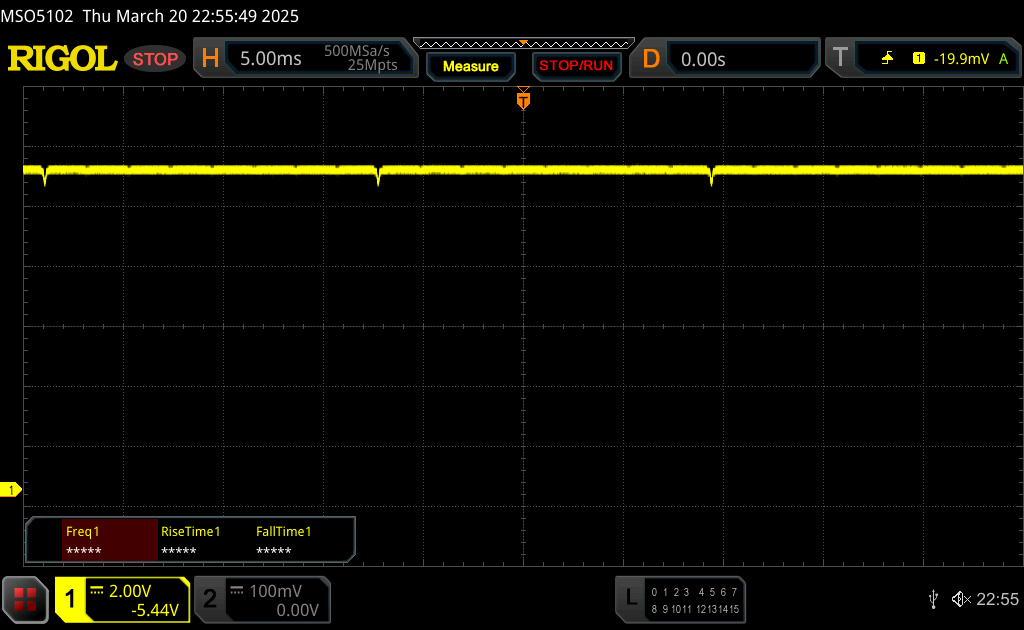
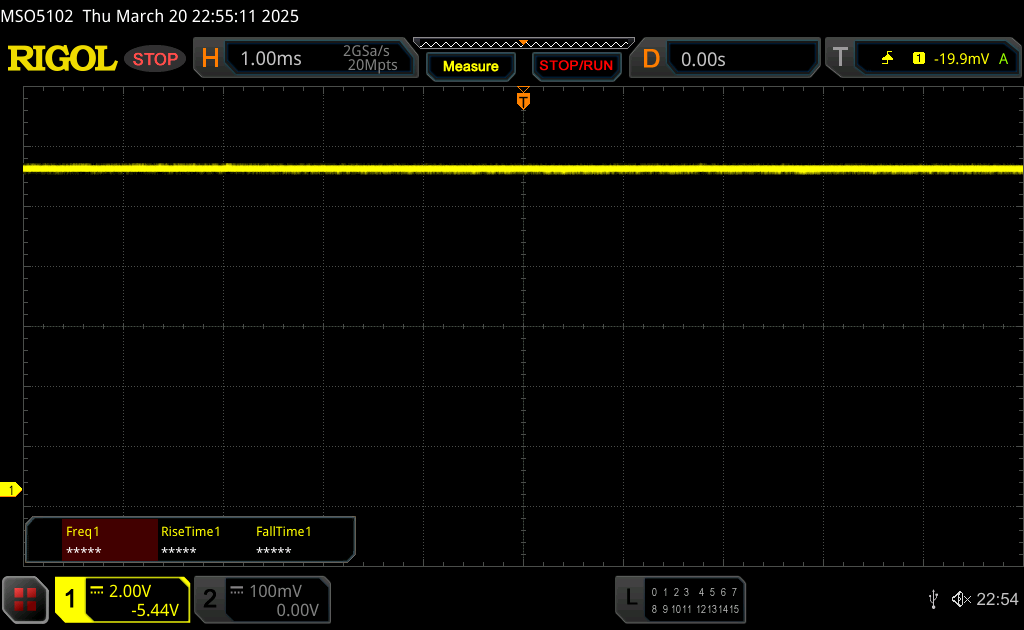
Power consumption with external monitor
运行时间
在电池续航时间方面,英特尔机型在我们的测试中以微弱优势落后于 ARM 机型。在 150 cd/m² 下的 Wi-Fi 测试中,两者几乎不相上下,但 Snapdragon 版本在全亮度(+30 分钟)和视频测试(+1.5 小时)中更具优势。
| Microsoft Surface Pro OLED Lunar Lake Core Ultra 7 268V, Arc 140V, 53 Wh | Microsoft Surface Pro OLED Copilot+ SD X Elite X1E-80-100, Adreno X1-85 3.8 TFLOPS, 53 Wh | Dell Latitude 7350 Detachable Ultra 7 164U, Graphics 4-Core, 46.5 Wh | Asus ProArt PZ13 HT5306 SD X Plus X1P-42-100, Adreno X1-45 1.7 TFLOPS, 70 Wh | Minisforum V3 R7 8840U, Radeon 780M, 50.82 Wh | Average of class Tablet | |
|---|---|---|---|---|---|---|
| Battery Runtime | 5% | -7% | 27% | -47% | 16% | |
| H.264 | 875 | 953 9% | 1105 26% | 929 ? 6% | ||
| WiFi v1.3 | 667 | 665 0% | 619 -7% | 851 28% | 352 -47% | 833 ? 25% |
Notebookcheck 总评分
Microsoft Surface Pro OLED Lunar Lake
- 04/14/2025 v8
Andreas Osthoff
 Total Sustainability Score:
 Possible alternatives compared
Image | Model / Review | Price | Weight | Height | Display |
|---|---|---|---|---|---|
1. 84.2% 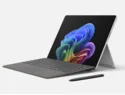 | Microsoft Surface Pro OLED Lunar Lake Intel Core Ultra 7 268V ⎘ Intel Arc Graphics 140V ⎘ 32 GB Memory, 512 GB SSD | Amazon: 1. $1,699.99 Microsoft Surface Pro 2-in-1... List Price: 2640€ | 882 g | 9.3 mm | 13.00" 2880x1920 266 PPI OLED |
2. 82.5% 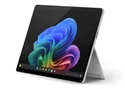 | Microsoft Surface Pro OLED Copilot+ Qualcomm Snapdragon X Elite X1E-80-100 ⎘ Qualcomm SD X Adreno X1-85 3.8 TFLOPS ⎘ 16 GB Memory, 1024 GB SSD | Amazon: $950.18 List Price: 1999€ | 870 g | 9.3 mm | 13.00" 2880x1920 266 PPI OLED |
3. 83.3%  | Dell Latitude 7350 Detachable Intel Core Ultra 7 164U ⎘ Intel Graphics 4-Core iGPU (Arc) ⎘ 32 GB Memory, 1024 GB SSD | Amazon: List Price: 2390 USD | 865 g | 8.9 mm | 13.00" 2880x1920 266 PPI IPS |
4. 85.3%  | Asus ProArt PZ13 HT5306 Qualcomm Snapdragon X Plus X1P-42-100 ⎘ Qualcomm SD X Adreno X1-45 1.7 TFLOPS ⎘ 16 GB Memory, 1024 GB SSD | Amazon: 1. $39.99 Smatree Hard EVA Protective ... 2. $16.99 Vaxson 3-Pack Screen Protect... 3. $89.99 20V 10A 200W Laptop Charger ... List Price: 1599€ | 874 g | 9 mm | 13.30" 2880x1800 255 PPI OLED |
5. 85.7% v7 (old)  | Minisforum V3 AMD Ryzen 7 8840U ⎘ AMD Radeon 780M ⎘ 32 GB Memory, 1024 GB SSD | Amazon: 1. $639.99 MINISFORUM V3 SE Tablet PC 1... 2. $899.00 MINISFORUM V3 SE Tablet PC w... 3. $1,049.90 MINISFORUM MS-01 Mini Workst... List Price: 1699 EUR | 928 g | 9.8 mm | 14.00" 2560x1600 IPS |
Transparency
The selection of devices to be reviewed is made by our editorial team. The test sample was provided to the author as a loan by the manufacturer or retailer for the purpose of this review. The lender had no influence on this review, nor did the manufacturer receive a copy of this review before publication. There was no obligation to publish this review. We never accept compensation or payment in return for our reviews. As an independent media company, Notebookcheck is not subjected to the authority of manufacturers, retailers or publishers.
This is how Notebookcheck is testing
Every year, Notebookcheck independently reviews hundreds of laptops and smartphones using standardized procedures to ensure that all results are comparable. We have continuously developed our test methods for around 20 years and set industry standards in the process. In our test labs, high-quality measuring equipment is utilized by experienced technicians and editors. These tests involve a multi-stage validation process. Our complex rating system is based on hundreds of well-founded measurements and benchmarks, which maintains objectivity. Further information on our test methods can be found here.

