

微星Prestige 16 AI Evo评测--配备高速Arrow Lake CPU、运行速度惊人的多媒体笔记本电脑
Core Ultra 9 285H 首次亮相。
微星的 Prestige 16 AI Evo 是一款轻薄的 16 英寸笔记本电脑,搭载英特尔全新的箭湖处理器 Core Ultra 9 285H。此外,其 99 瓦时的电池可确保极佳的运行时间。Andreas Osthoff, 👁 Andreas Osthoff (translated by DeepL / Ninh Duy) Published 🇺🇸 🇩🇪 ...
结论--微星Prestige 16 Evo潜力巨大,但在执行方面存在弱点
微星 Prestige 16 AI Evo 是一款 16 英寸多媒体笔记本电脑,拥有高品质而轻巧的金属外壳、舒适的输入设备和超长的电池续航时间。全新箭湖一代 英特尔酷睿至尊 9 285H与旧版流星湖芯片相比,性能提升了约 20%,但高功耗限制问题依然存在。这一点在散热方面也很明显,因为微星只决定安装一个风扇。这对于较为节俭的 Lunar Lake 配置来说已经足够,但 Arrow Lake 型号则需要更强大的散热系统。微星错失了打造一款安静的多媒体笔记本电脑的良机。
它的显示屏质量不错,但 60 Hz 的低频、高反射表面和响应时间慢都是其缺点。我们还不清楚在德国(本次测试的所在地)推出的 Prestige 将采用哪种面板;例如,Lunar Lake 版本采用 4K IPS 面板,也有 4K OLED 版本,但频率始终是 60 赫兹。
此外,在我们的测试中,其端口的分布被证明并不理想,因为所有的 USB 端口都位于设备的背面,这根本不切实际。其他的缺点还包括内置内存、1080p 网络摄像头(相同的 Lunar Lake 机型已经配备了 500 万像素传感器)以及 100 瓦的电源装置,这不足以满足处理器在峰值负载时的电力需求。总而言之,Prestige 16 AI Evo 有潜力成为一款出色的多媒体笔记本电脑,但一些不必要的设计决定阻碍了它的实现。
Pros
Cons
价格和供应情况
搭载全新 Arrow Lake 处理器的微星 Prestige 16 AI 尚未在商店发售。
可能的替代品比较
Image | Model / Review | Price | Weight | Height | Display |
|---|---|---|---|---|---|
1. 82.8%  | MSI Prestige 16 AI Evo B2HMG Intel Core Ultra 9 285H ⎘ Intel Arc Graphics 140T ⎘ 32 GB Memory, 1024 GB SSD | Amazon: 1. $18.99 Vaxson 2-Pack Protector Film... 2. $1,599.99 MSI Prestige 16 AI EVO Busin... 3. $1,299.99 MSI Prestige 16 AI Studio B1... | 1.6 kg | 18.95 mm | 16.00" 2560x1600 189 PPI IPS |
2. 86.6%  | Lenovo ThinkBook 16 G7+ AMD AMD Ryzen AI 9 365 ⎘ AMD Radeon 880M ⎘ 32 GB Memory, 1024 GB SSD | Amazon: 1. $784.28 Lenovo ThinkBook 16 G7 ARP 2... 2. $899.00 Lenovo ThinkBook 16 G7 ARP 2... 3. $616.11 Lenovo ThinkBook 16 G7 ARP 2... List Price: 1399€ | 1.9 kg | 16.9 mm | 16.00" 3200x2000 236 PPI IPS |
3. 81.9%  | MSI Prestige A16 AI+ A3HMG-036 AMD Ryzen AI 9 365 ⎘ AMD Radeon 880M ⎘ 32 GB Memory, 1024 GB SSD | List Price: 1599 Euro | 2 kg | 17.35 mm | 16.00" 2560x1600 189 PPI IPS |
4. 93%  | Apple MacBook Pro 16 2024 M4 Pro Apple M4 Pro (14 cores) ⎘ Apple M4 Pro 20-Core GPU ⎘ 48 GB Memory, 2048 GB SSD | Amazon: $2,723.00 List Price: 4219€ | 2.1 kg | 16.8 mm | 16.20" 3456x2234 254 PPI Mini-LED |
5. 84.7%  | Asus Zenbook S 16 UM5606-RK333W AMD Ryzen AI 9 HX 370 ⎘ AMD Radeon 890M ⎘ 32 GB Memory, 1024 GB SSD | Amazon: 1. $1,649.99 ASUS Zenbook S 16 Laptop, AM... 2. $1,859.00 HIDevolution [2024] ASUS Zen... 3. $1,079.00 ASUS Vivobook S 16 OLED Lapt... List Price: 2100€ | 1.5 kg | 12.9 mm | 16.00" 2880x1800 212 PPI OLED |
6. 88.9% v7 (old)  | Samsung Galaxy Book4 Pro 16 Intel Core Ultra 7 155H ⎘ Intel Arc 8-Core iGPU ⎘ 16 GB Memory, 512 GB SSD | Amazon: $1,719.00 List Price: 1999€ | 1.5 kg | 12.5 mm | 16.00" 2880x1800 212 PPI OLED |
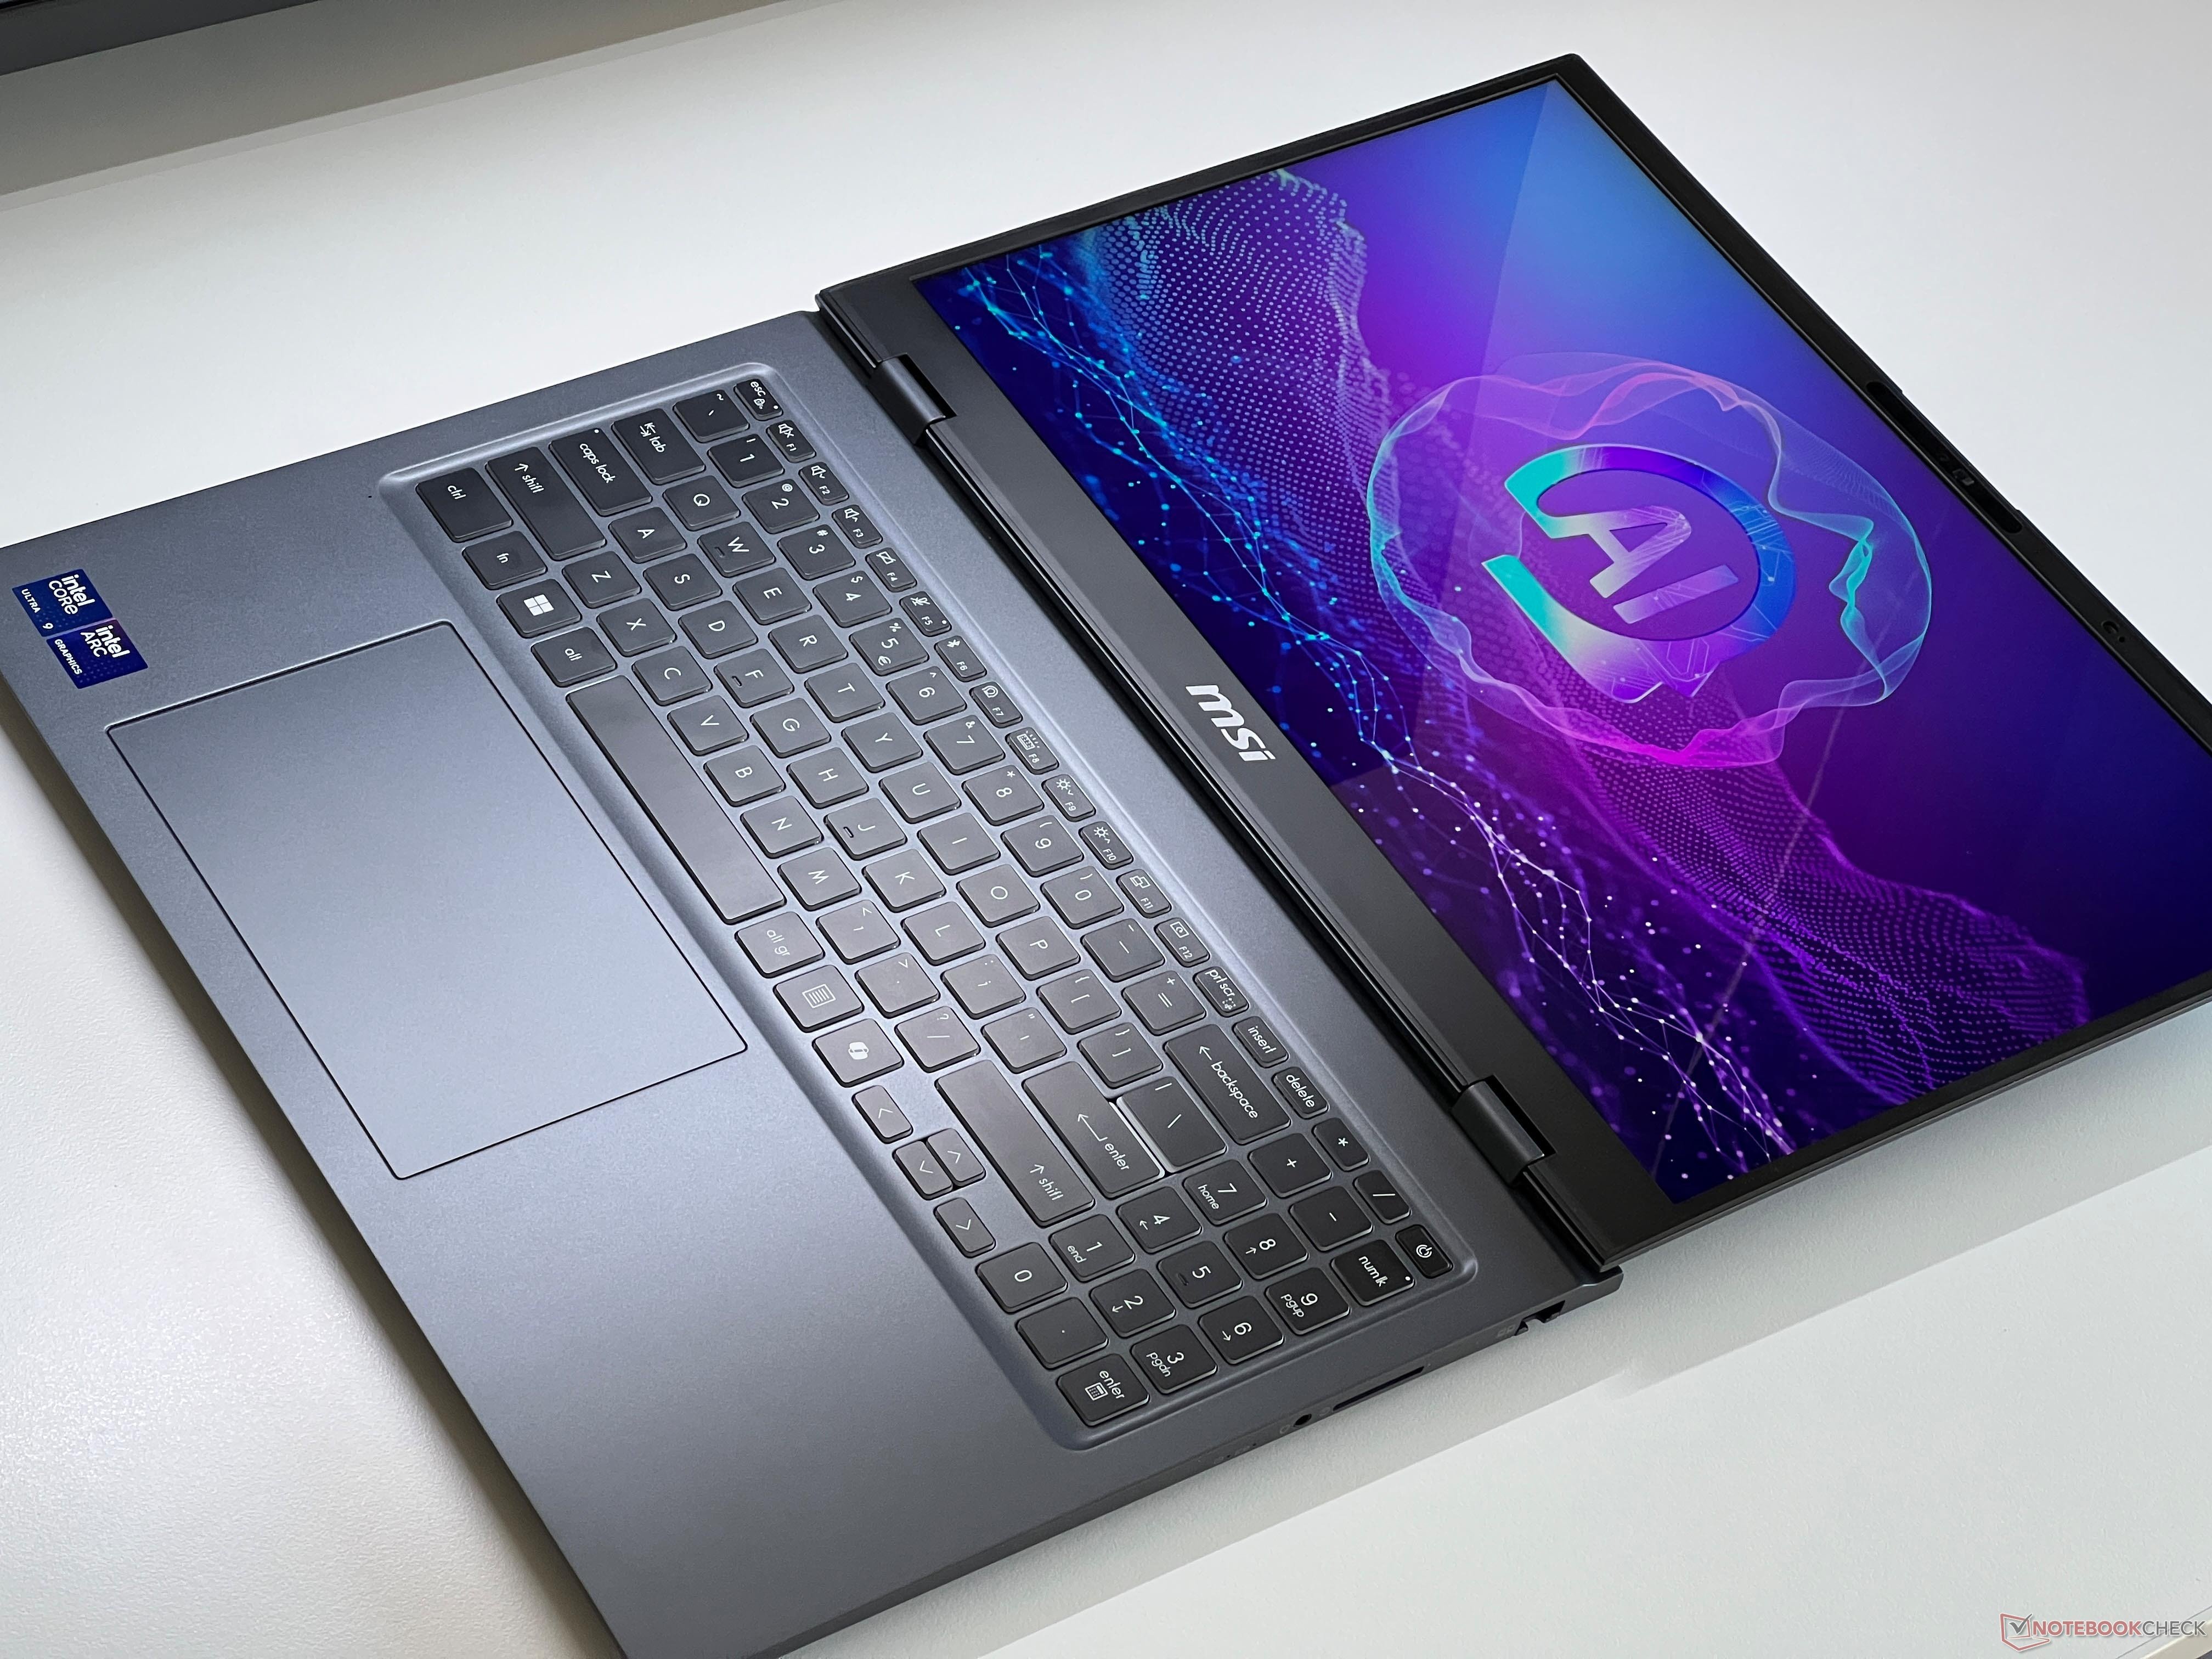
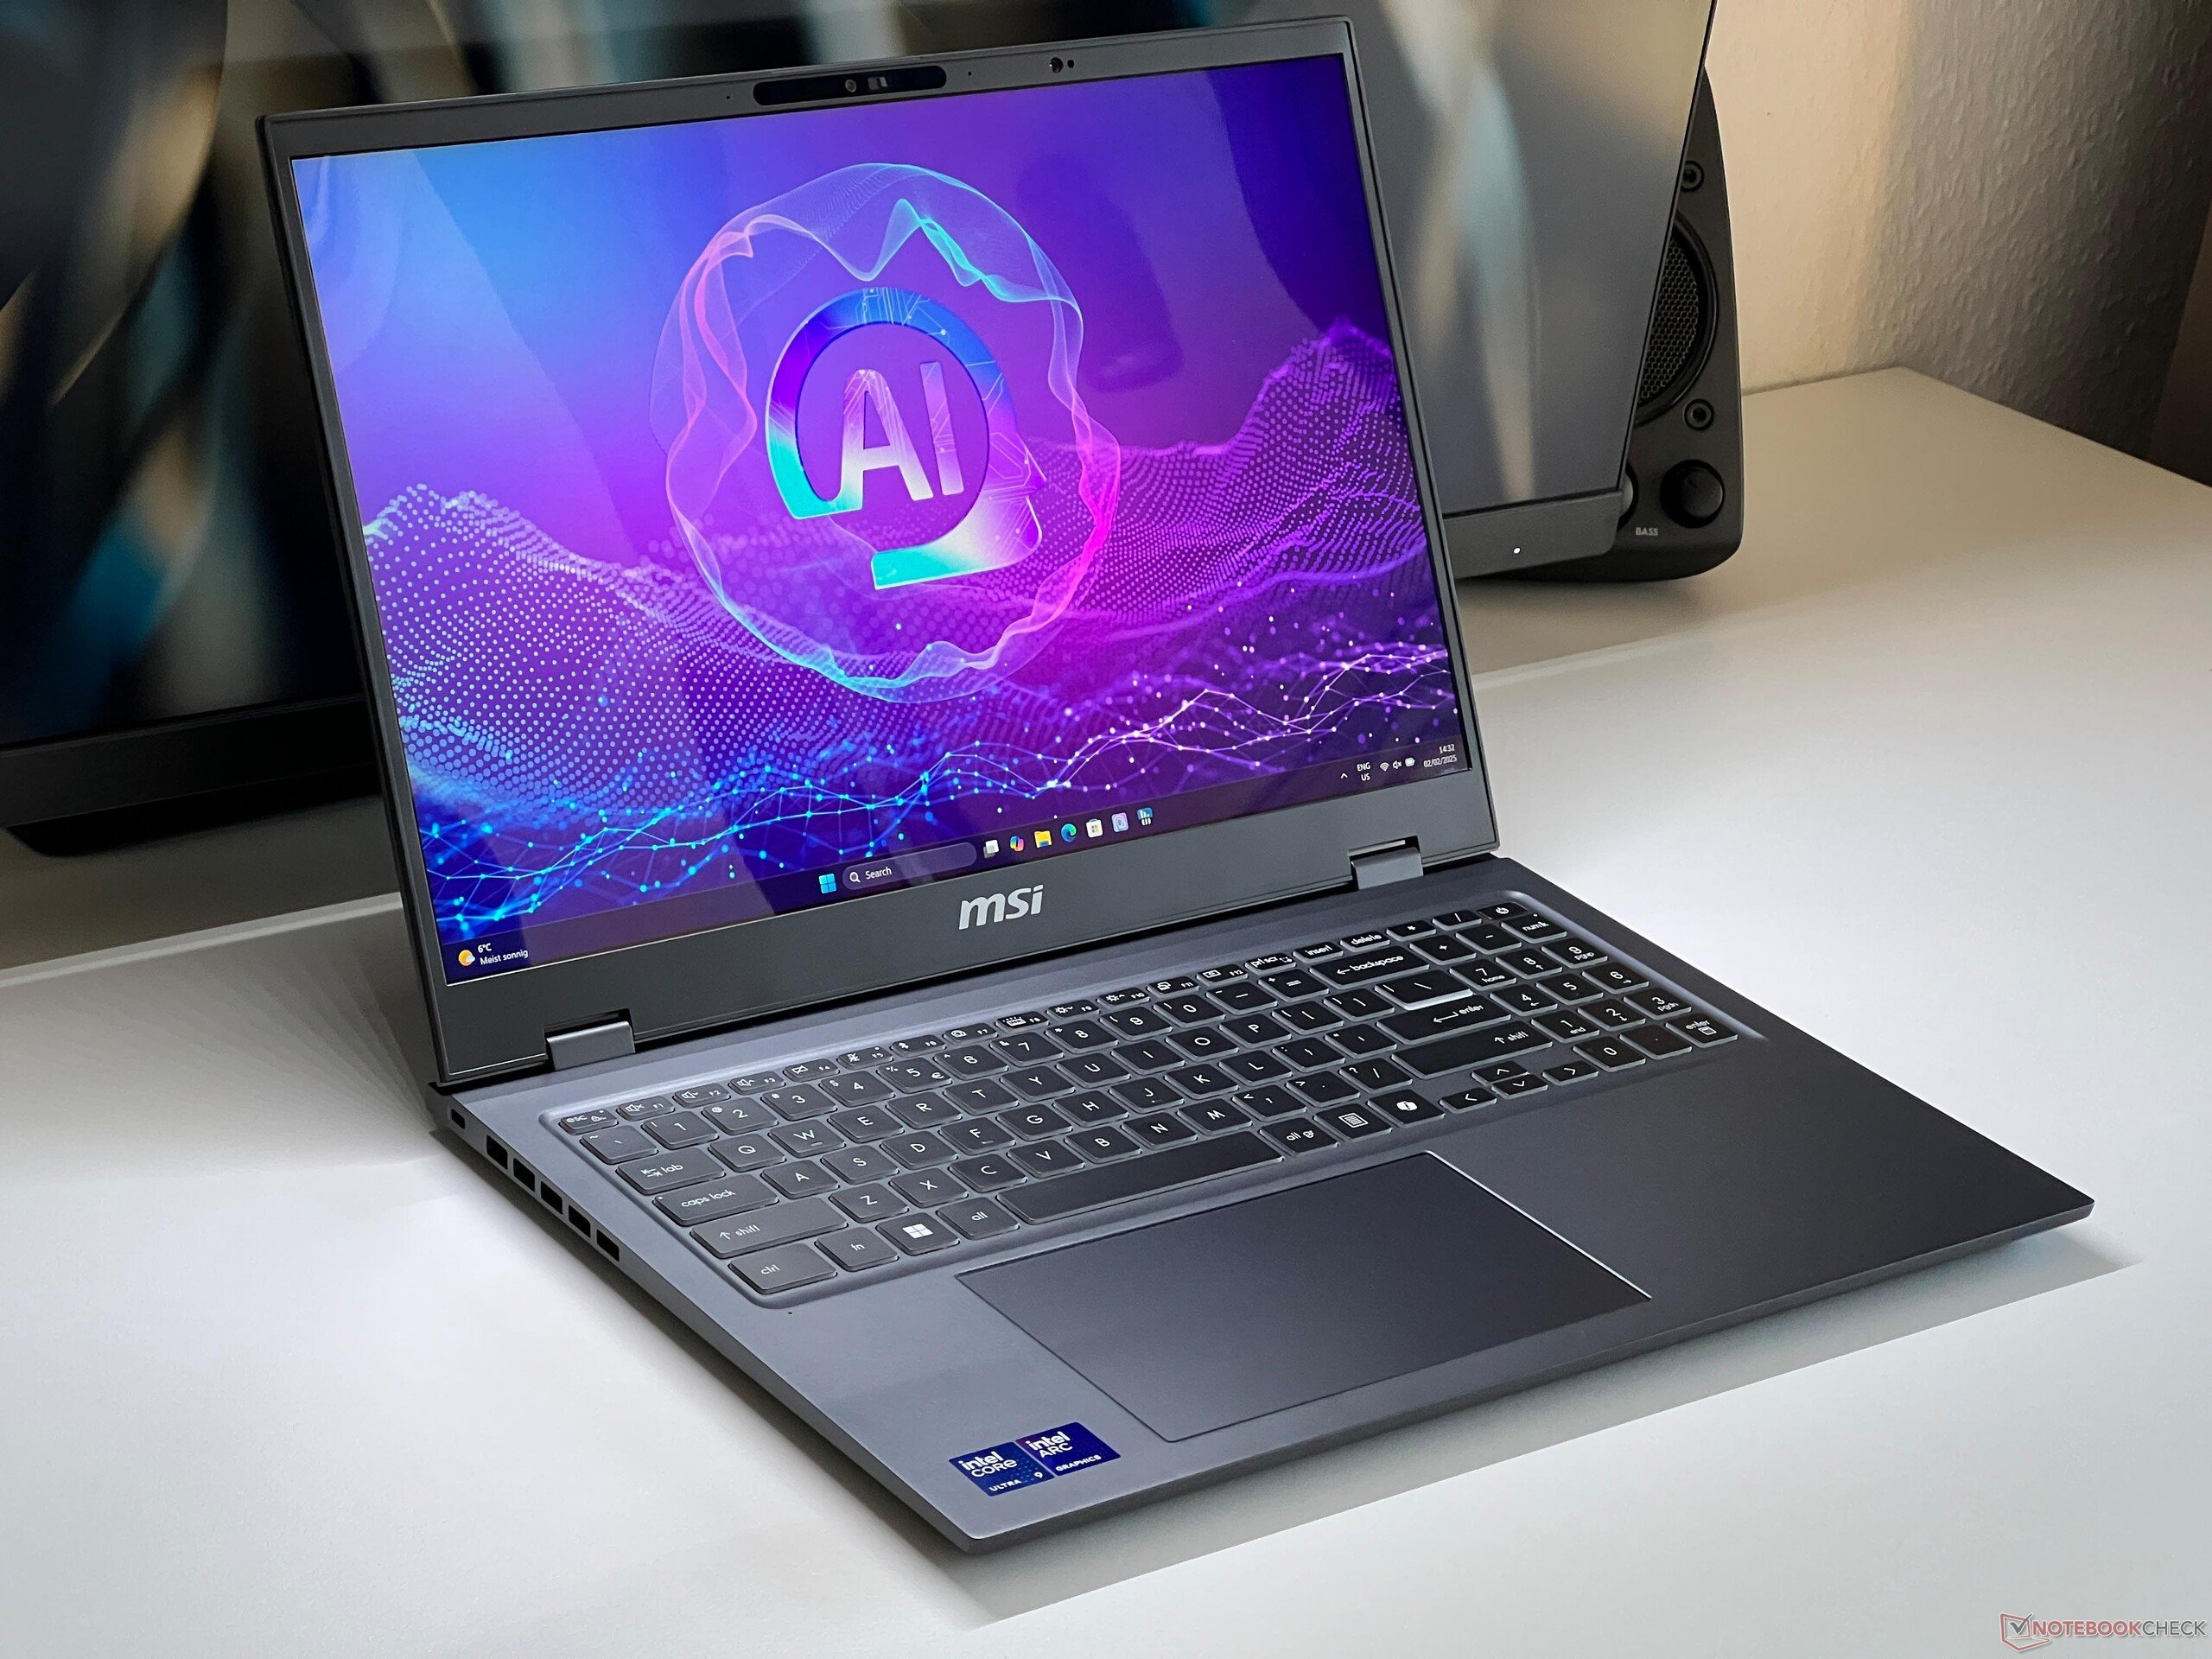
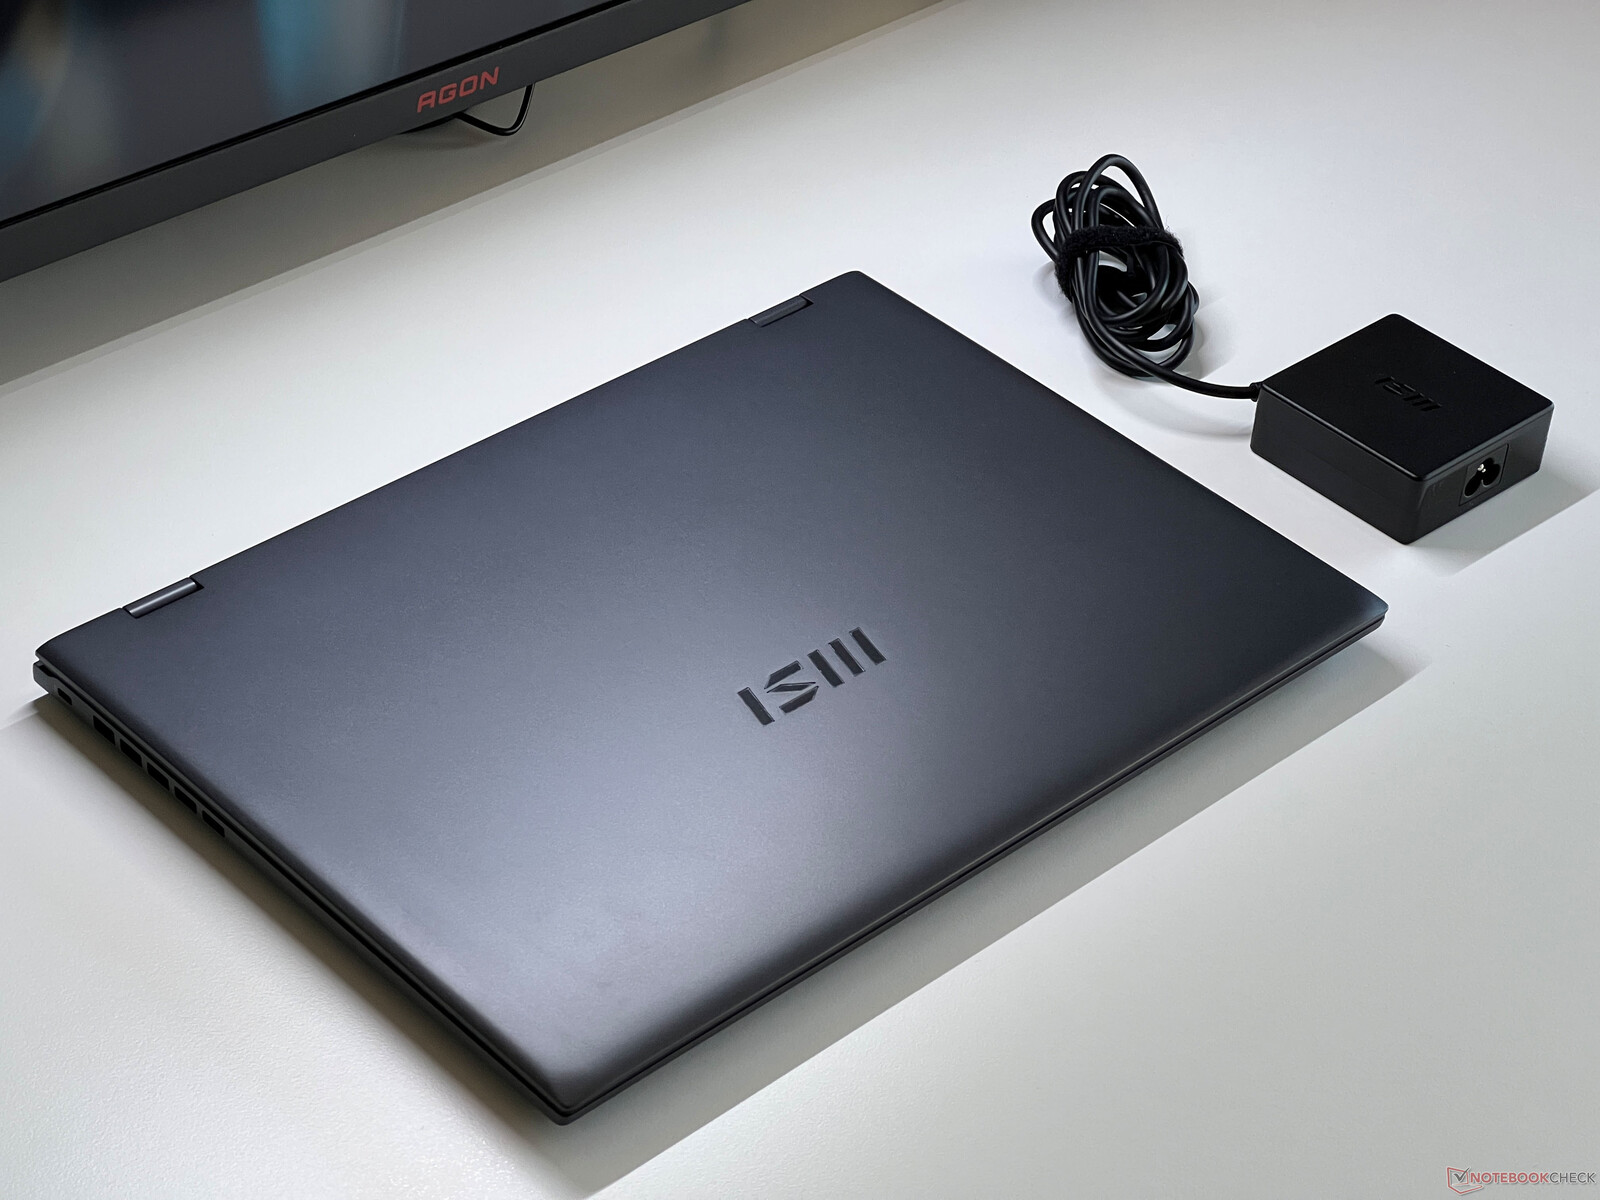
微星 Prestige 16 AI Evo 是一款轻薄的 16 英寸多媒体笔记本电脑,采用镁合金外壳,搭载全新的 Arrow Lake 移动处理器--英特尔酷睿 Ultra 9 285H。 英特尔酷睿至尊9 285H.我们的测试设备配备了分辨率为 2,560 x 1,600 像素的 IPS 显示屏。Arrow Lake 机型尚未在商店销售,目前只有相同的配备 4K IPS 显示屏的 Lunar Lake 机型有售。我们目前假定其售价略高于 2000 美元。
Specifications
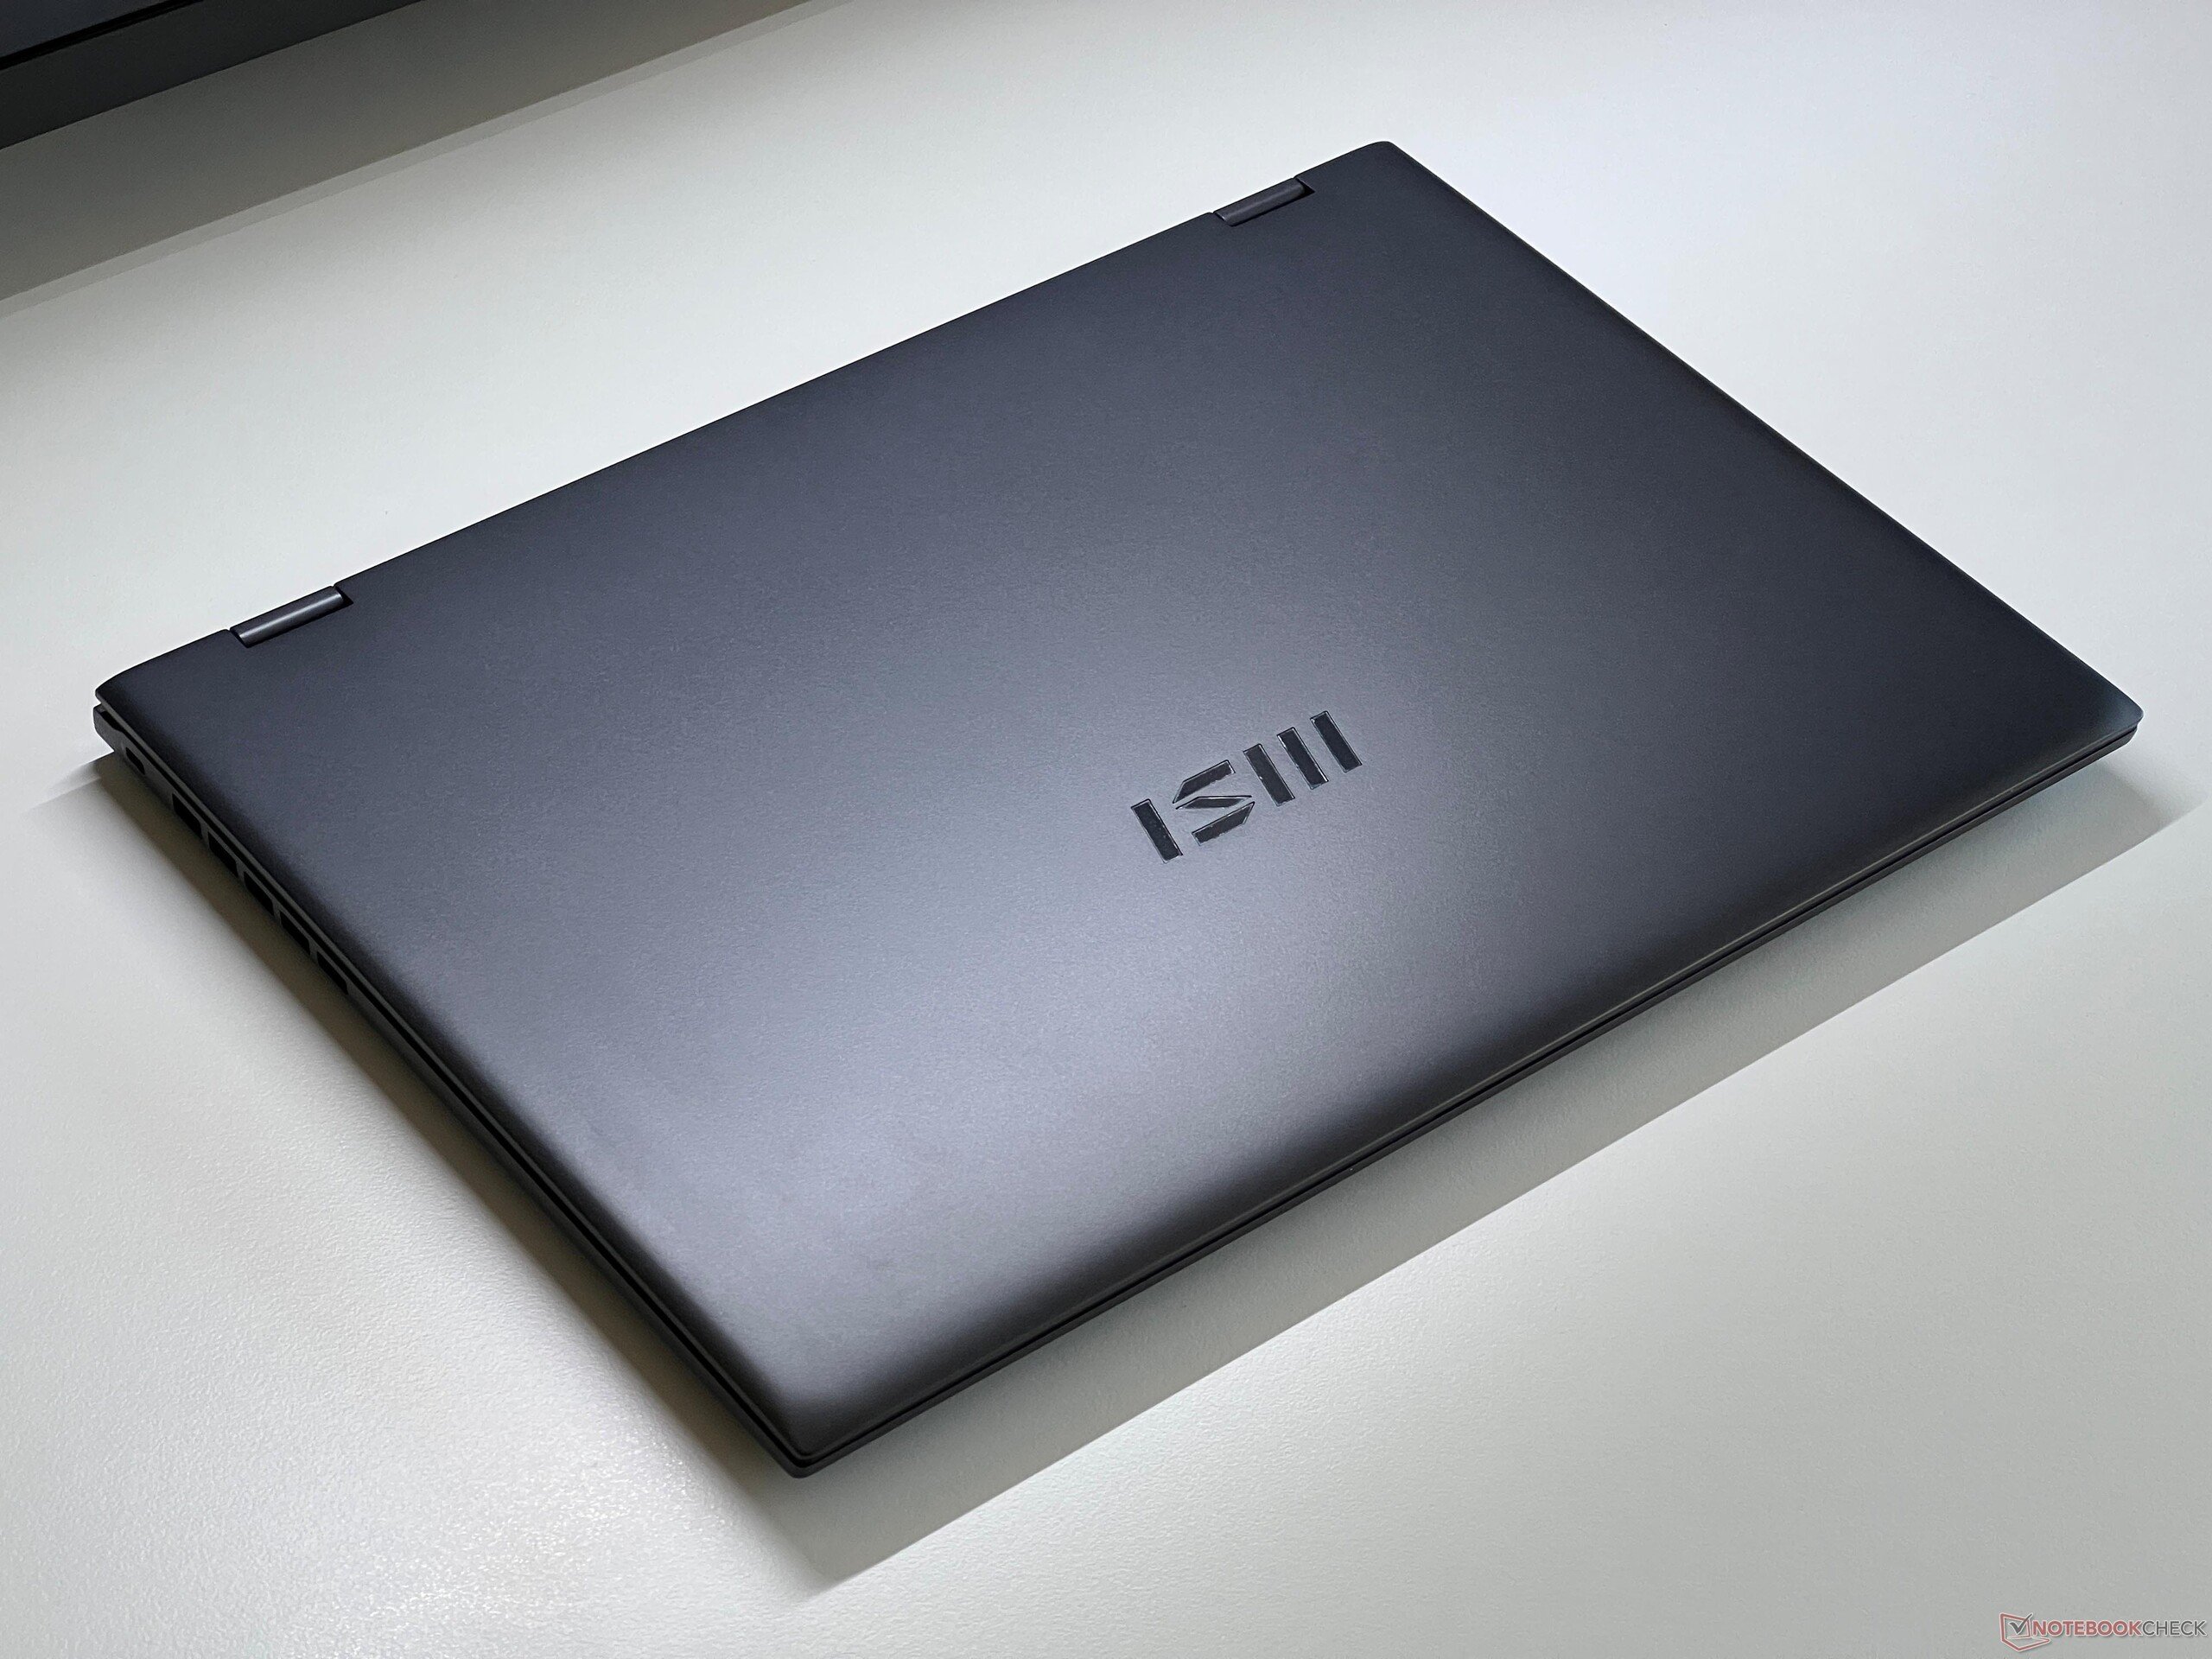
外壳 - 镁铝合金
在 Prestige 16 AI Evo 的外壳上,微星采用了深灰色(星空灰)镁铝合金一体成型设计。其表面处理和制造质量似乎都很不错,机箱的稳定性也令人印象深刻。底座几乎无法压入或扭转,我们在测试过程中也没有听到任何吱吱嘎嘎的声音。它的表面也不容易留下指纹痕迹。
此外,屏幕盖也同样稳定,我们在选择性按压时也不会产生任何图像错误。铰链非常紧密,但调整角度时屏幕盖仍会轻微晃动。

我们的测试设备重 1.561 千克,因此是比较组中较轻的机型之一(可与 Zenbook S 16& Galaxy Book4 Pro 16),而其他机型则重得多,约为 2 千克。微星的机身厚度不到 17-19 毫米,是最厚的机型。含电源线的 100 瓦电源重 365 克。
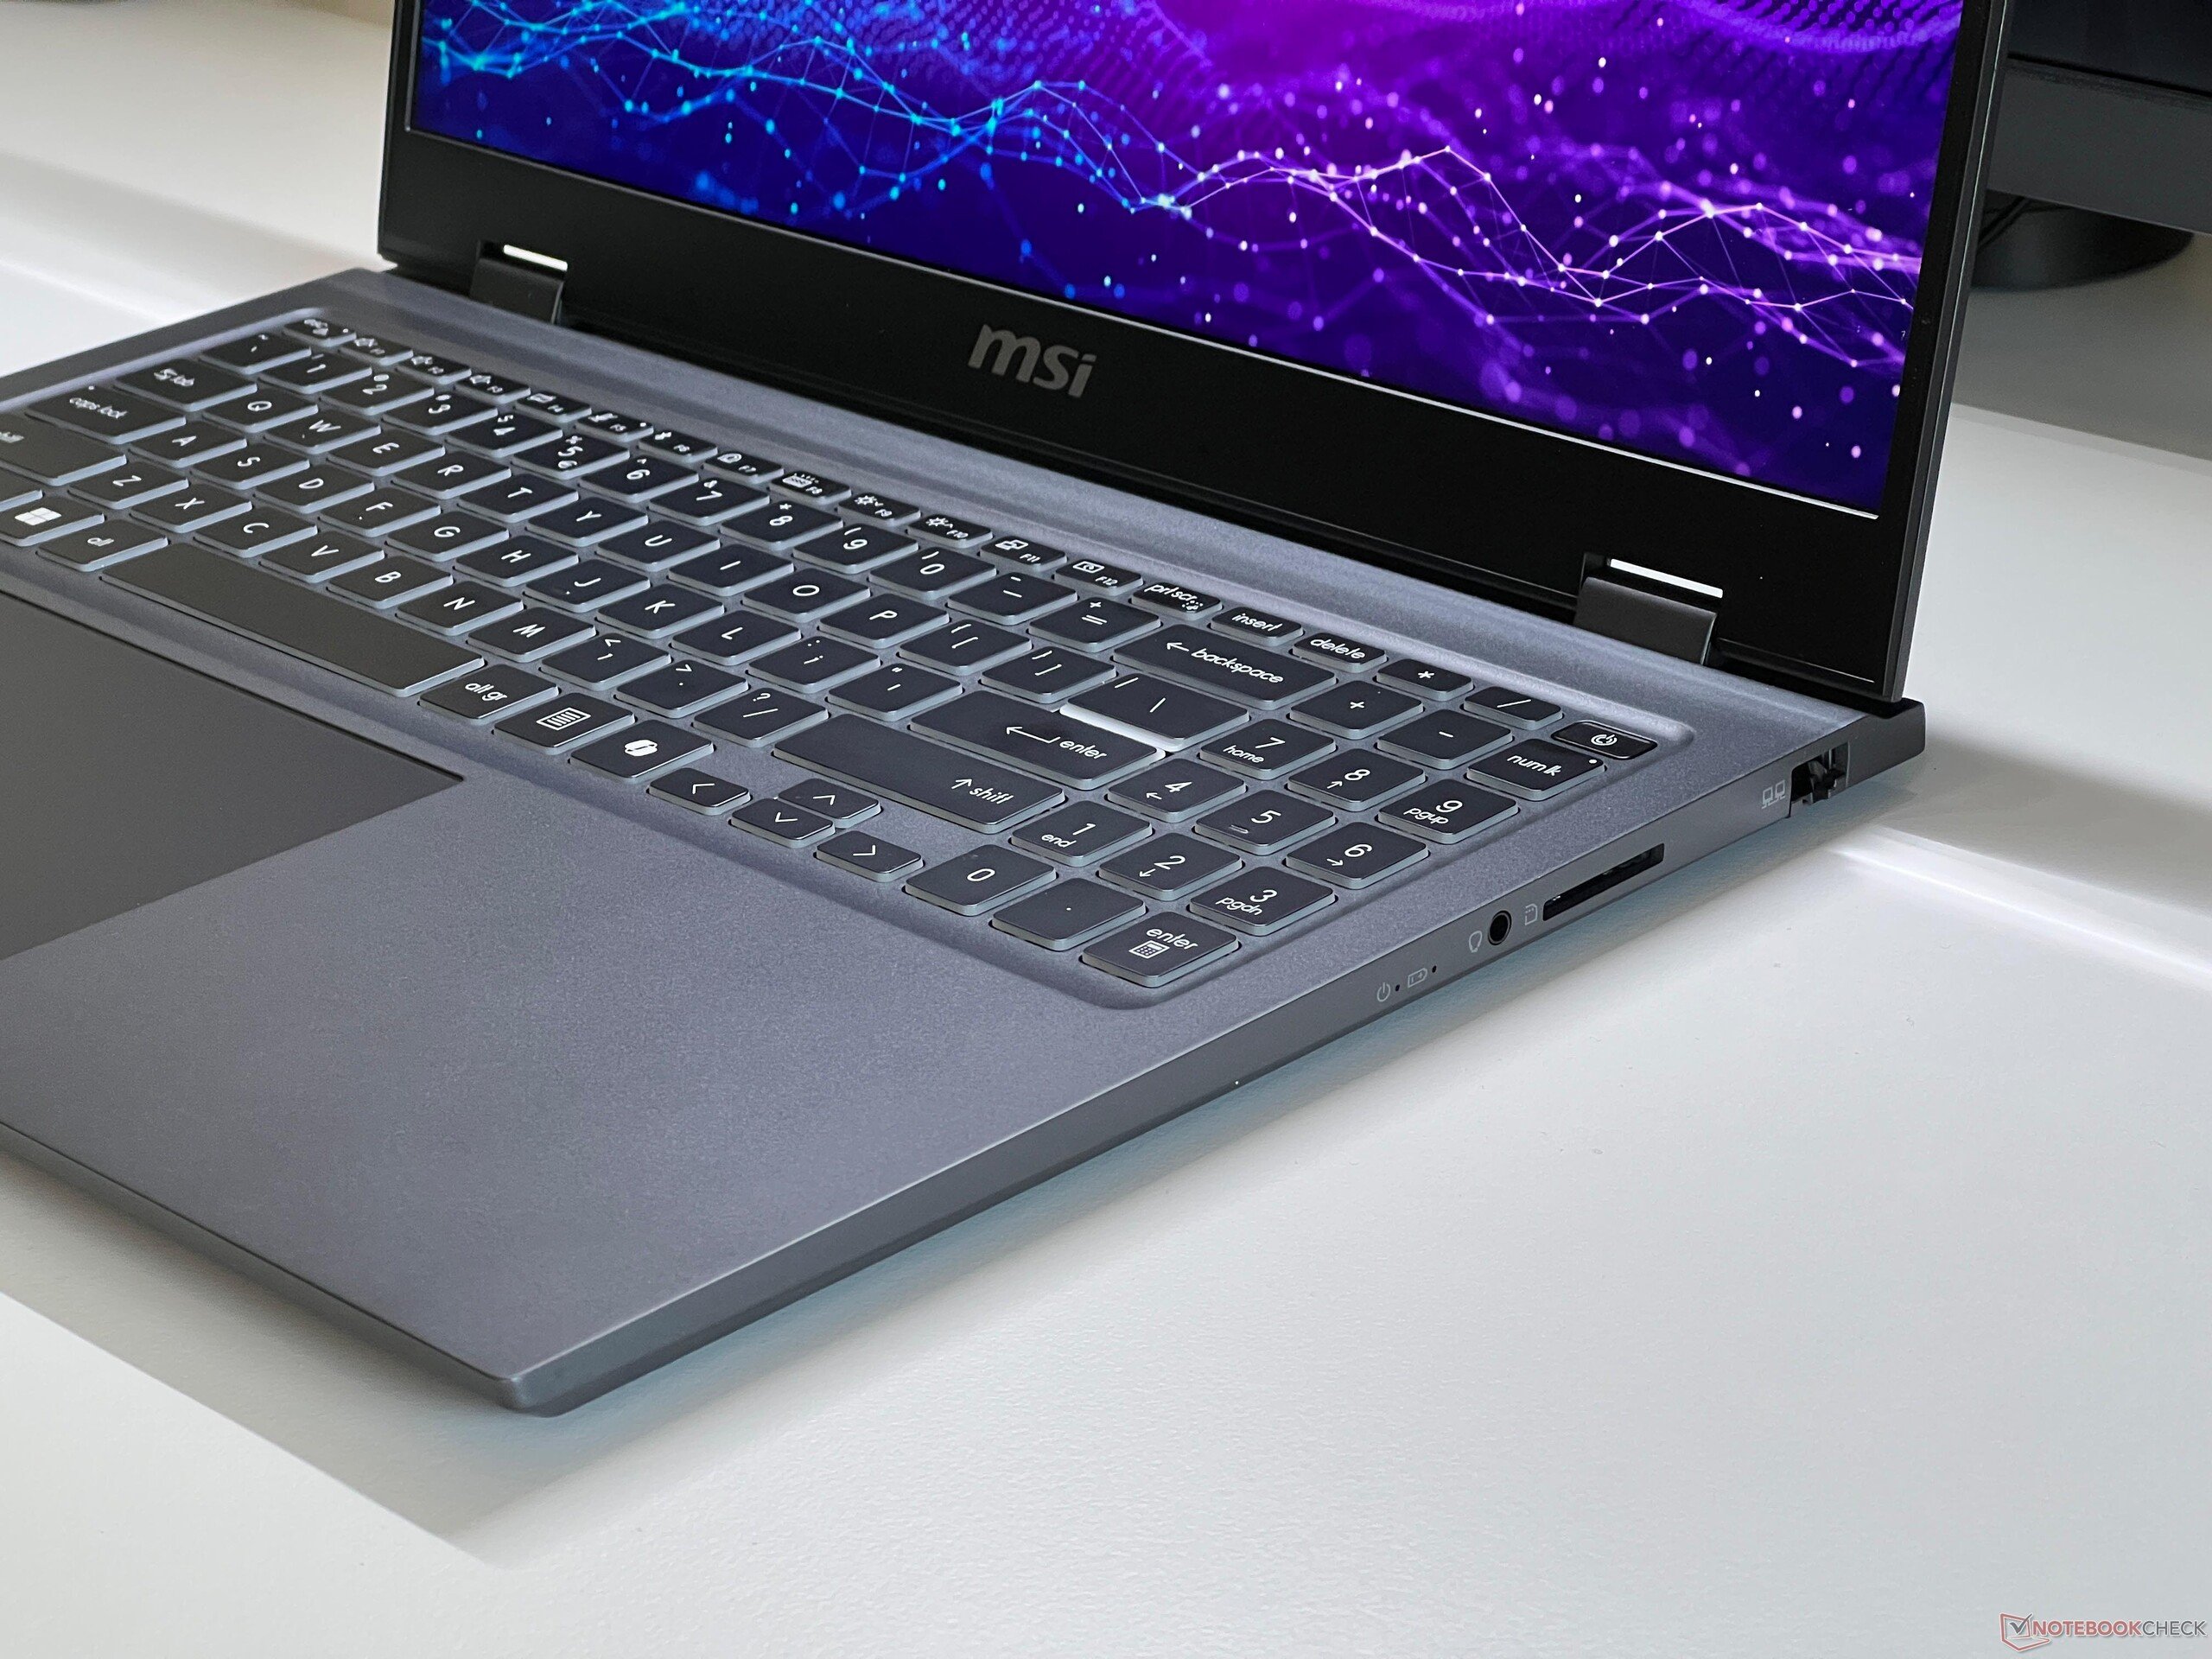
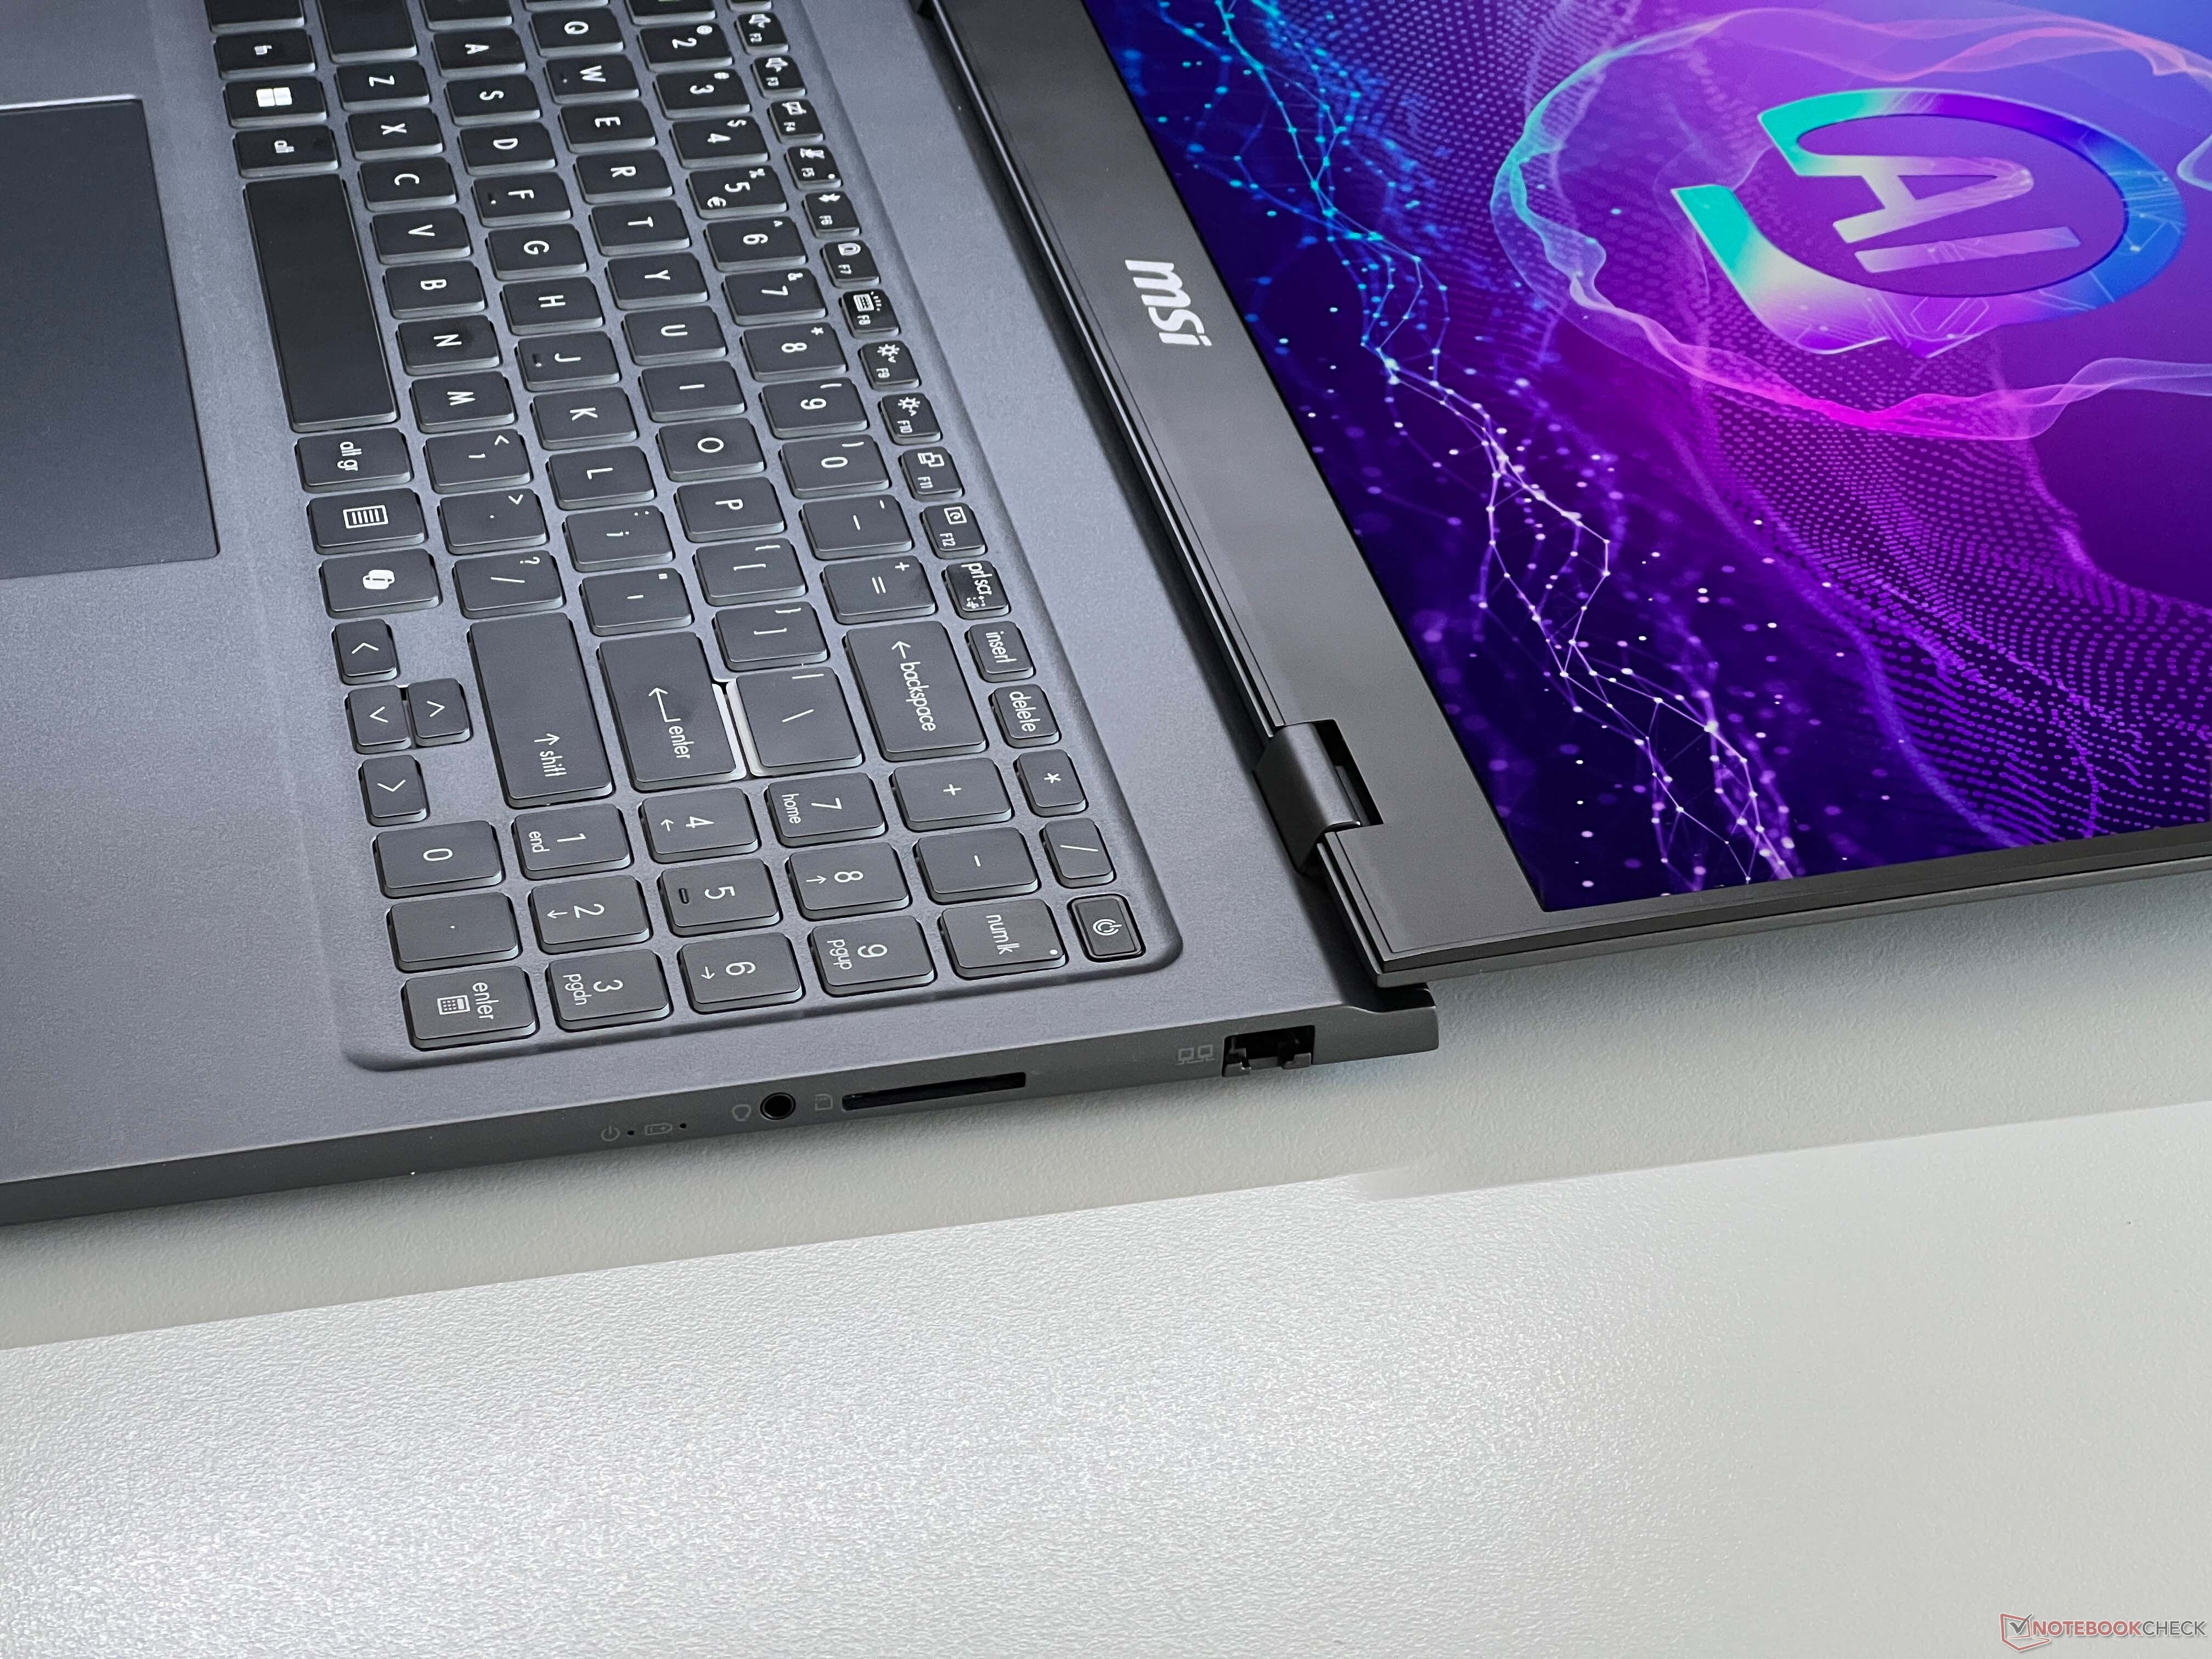
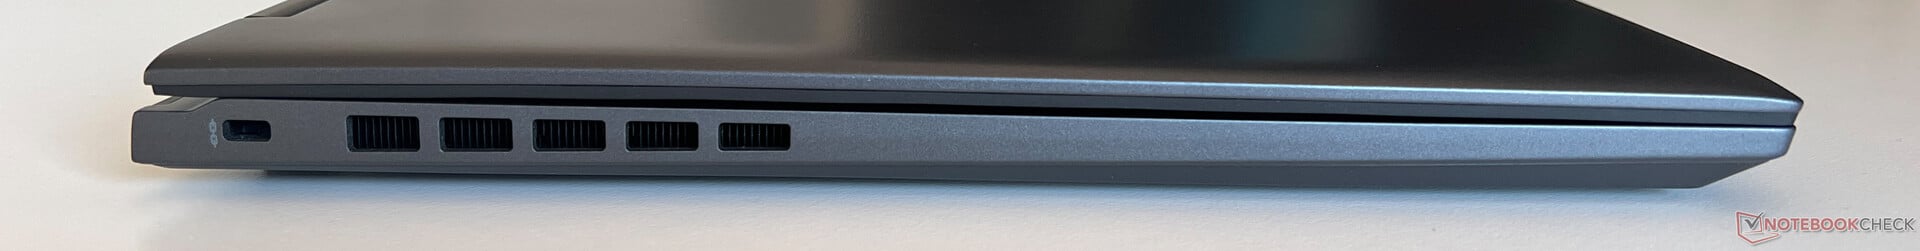
连接性 - Thunderbolt 和 Wi-Fi 7
总的来说,Prestige 配备了所有最重要的端口,包括 USB-C、USB-A、千兆以太网和 SD 读卡器。不过,我们对这些端口的分布并不满意,因为所有的 USB 端口都位于设备的背面。左侧没有一个端口,这是由于笔记本电脑的内部布置造成的。这在日常使用中简直太不实用了,我们完全无法理解这一决定。新款 Arrow Lake 处理器的 NPU 不符合 Copilot+ PC 的最低要求,但仍支持 Studio Effects 或实时字幕等功能。
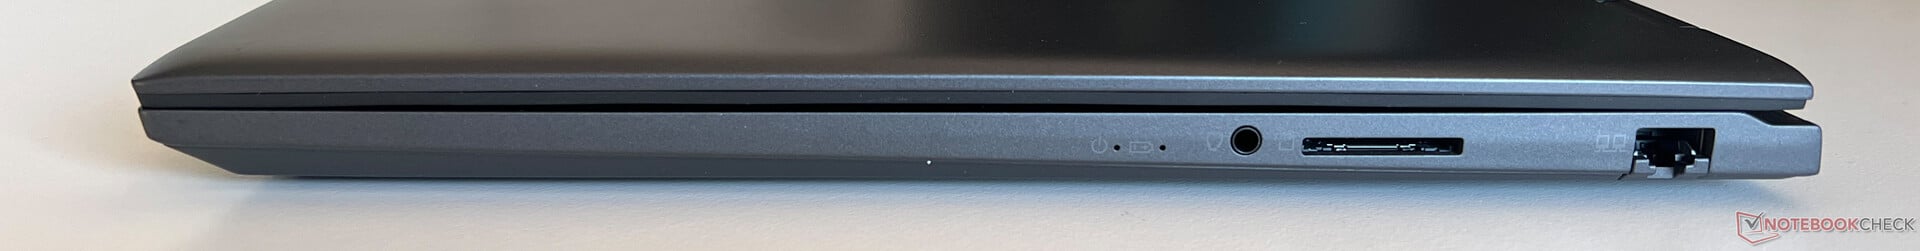

SD 读卡器
笔记本电脑右侧有一个带弹簧装置的全功能读卡器。插入的读卡器仅从机壳中微微伸出。结合我们的参考卡(Angelbird AV Pro V60),我们测得的传输速率在 80-90 MB/s 之间。这些结果尚可,但许多对比设备的表现更好。
| SD Card Reader | |
| average JPG Copy Test (av. of 3 runs) | |
| Apple MacBook Pro 16 2024 M4 Pro (Angelbird AV Pro V60) | |
| Asus Zenbook S 16 UM5606-RK333W (Angelbird AV Pro V60) | |
| MSI Prestige A16 AI+ A3HMG-036 | |
| Average of class Multimedia (18.4 - 201, n=57, last 2 years) | |
| Lenovo ThinkBook 16 G7+ AMD (Angelbird AV Pro V60) | |
| MSI Prestige 16 AI Evo B2HMG (Angelbird AV Pro V60) | |
| Samsung Galaxy Book4 Pro 16 (Angelbird AV Pro V60) | |
| maximum AS SSD Seq Read Test (1GB) | |
| Asus Zenbook S 16 UM5606-RK333W (Angelbird AV Pro V60) | |
| Apple MacBook Pro 16 2024 M4 Pro (Angelbird AV Pro V60) | |
| MSI Prestige A16 AI+ A3HMG-036 | |
| Average of class Multimedia (25.8 - 266, n=57, last 2 years) | |
| Samsung Galaxy Book4 Pro 16 (Angelbird AV Pro V60) | |
| Lenovo ThinkBook 16 G7+ AMD (Angelbird AV Pro V60) | |
| MSI Prestige 16 AI Evo B2HMG (Angelbird AV Pro V60) | |
交流

Prestige 的右侧有一个千兆以太网端口。当然,还安装了 WLAN 模块,即现代的 Intel Killer BE1750 Wi-Fi 7 模块。与华硕的参考路由器配合使用,我们记录到了非常出色和稳定的传输速率。该模块还支持蓝牙 5.4。
| Networking | |
| MSI Prestige 16 AI Evo B2HMG | |
| iperf3 transmit AXE11000 | |
| iperf3 receive AXE11000 | |
| Lenovo ThinkBook 16 G7+ AMD | |
| iperf3 transmit AXE11000 | |
| iperf3 receive AXE11000 | |
| MSI Prestige A16 AI+ A3HMG-036 | |
| iperf3 transmit AXE11000 | |
| iperf3 receive AXE11000 | |
| iperf3 transmit AXE11000 6GHz | |
| iperf3 receive AXE11000 6GHz | |
| Apple MacBook Pro 16 2024 M4 Pro | |
| iperf3 transmit AXE11000 | |
| iperf3 receive AXE11000 | |
| Asus Zenbook S 16 UM5606-RK333W | |
| iperf3 transmit AXE11000 | |
| iperf3 receive AXE11000 | |
| Samsung Galaxy Book4 Pro 16 | |
| iperf3 transmit AXE11000 | |
| iperf3 receive AXE11000 | |
网络摄像头
设备的显示屏上边框内置了一个带机械光圈的 FHD 网络摄像头。它支持 Windows 先进的 Studio Effects,整体成像质量尚可,但 Lunar Lake 机型配备了更好的 500 万像素摄像头。它还配备了一个红外摄像头,可通过 Windows Hello 进行面部识别。


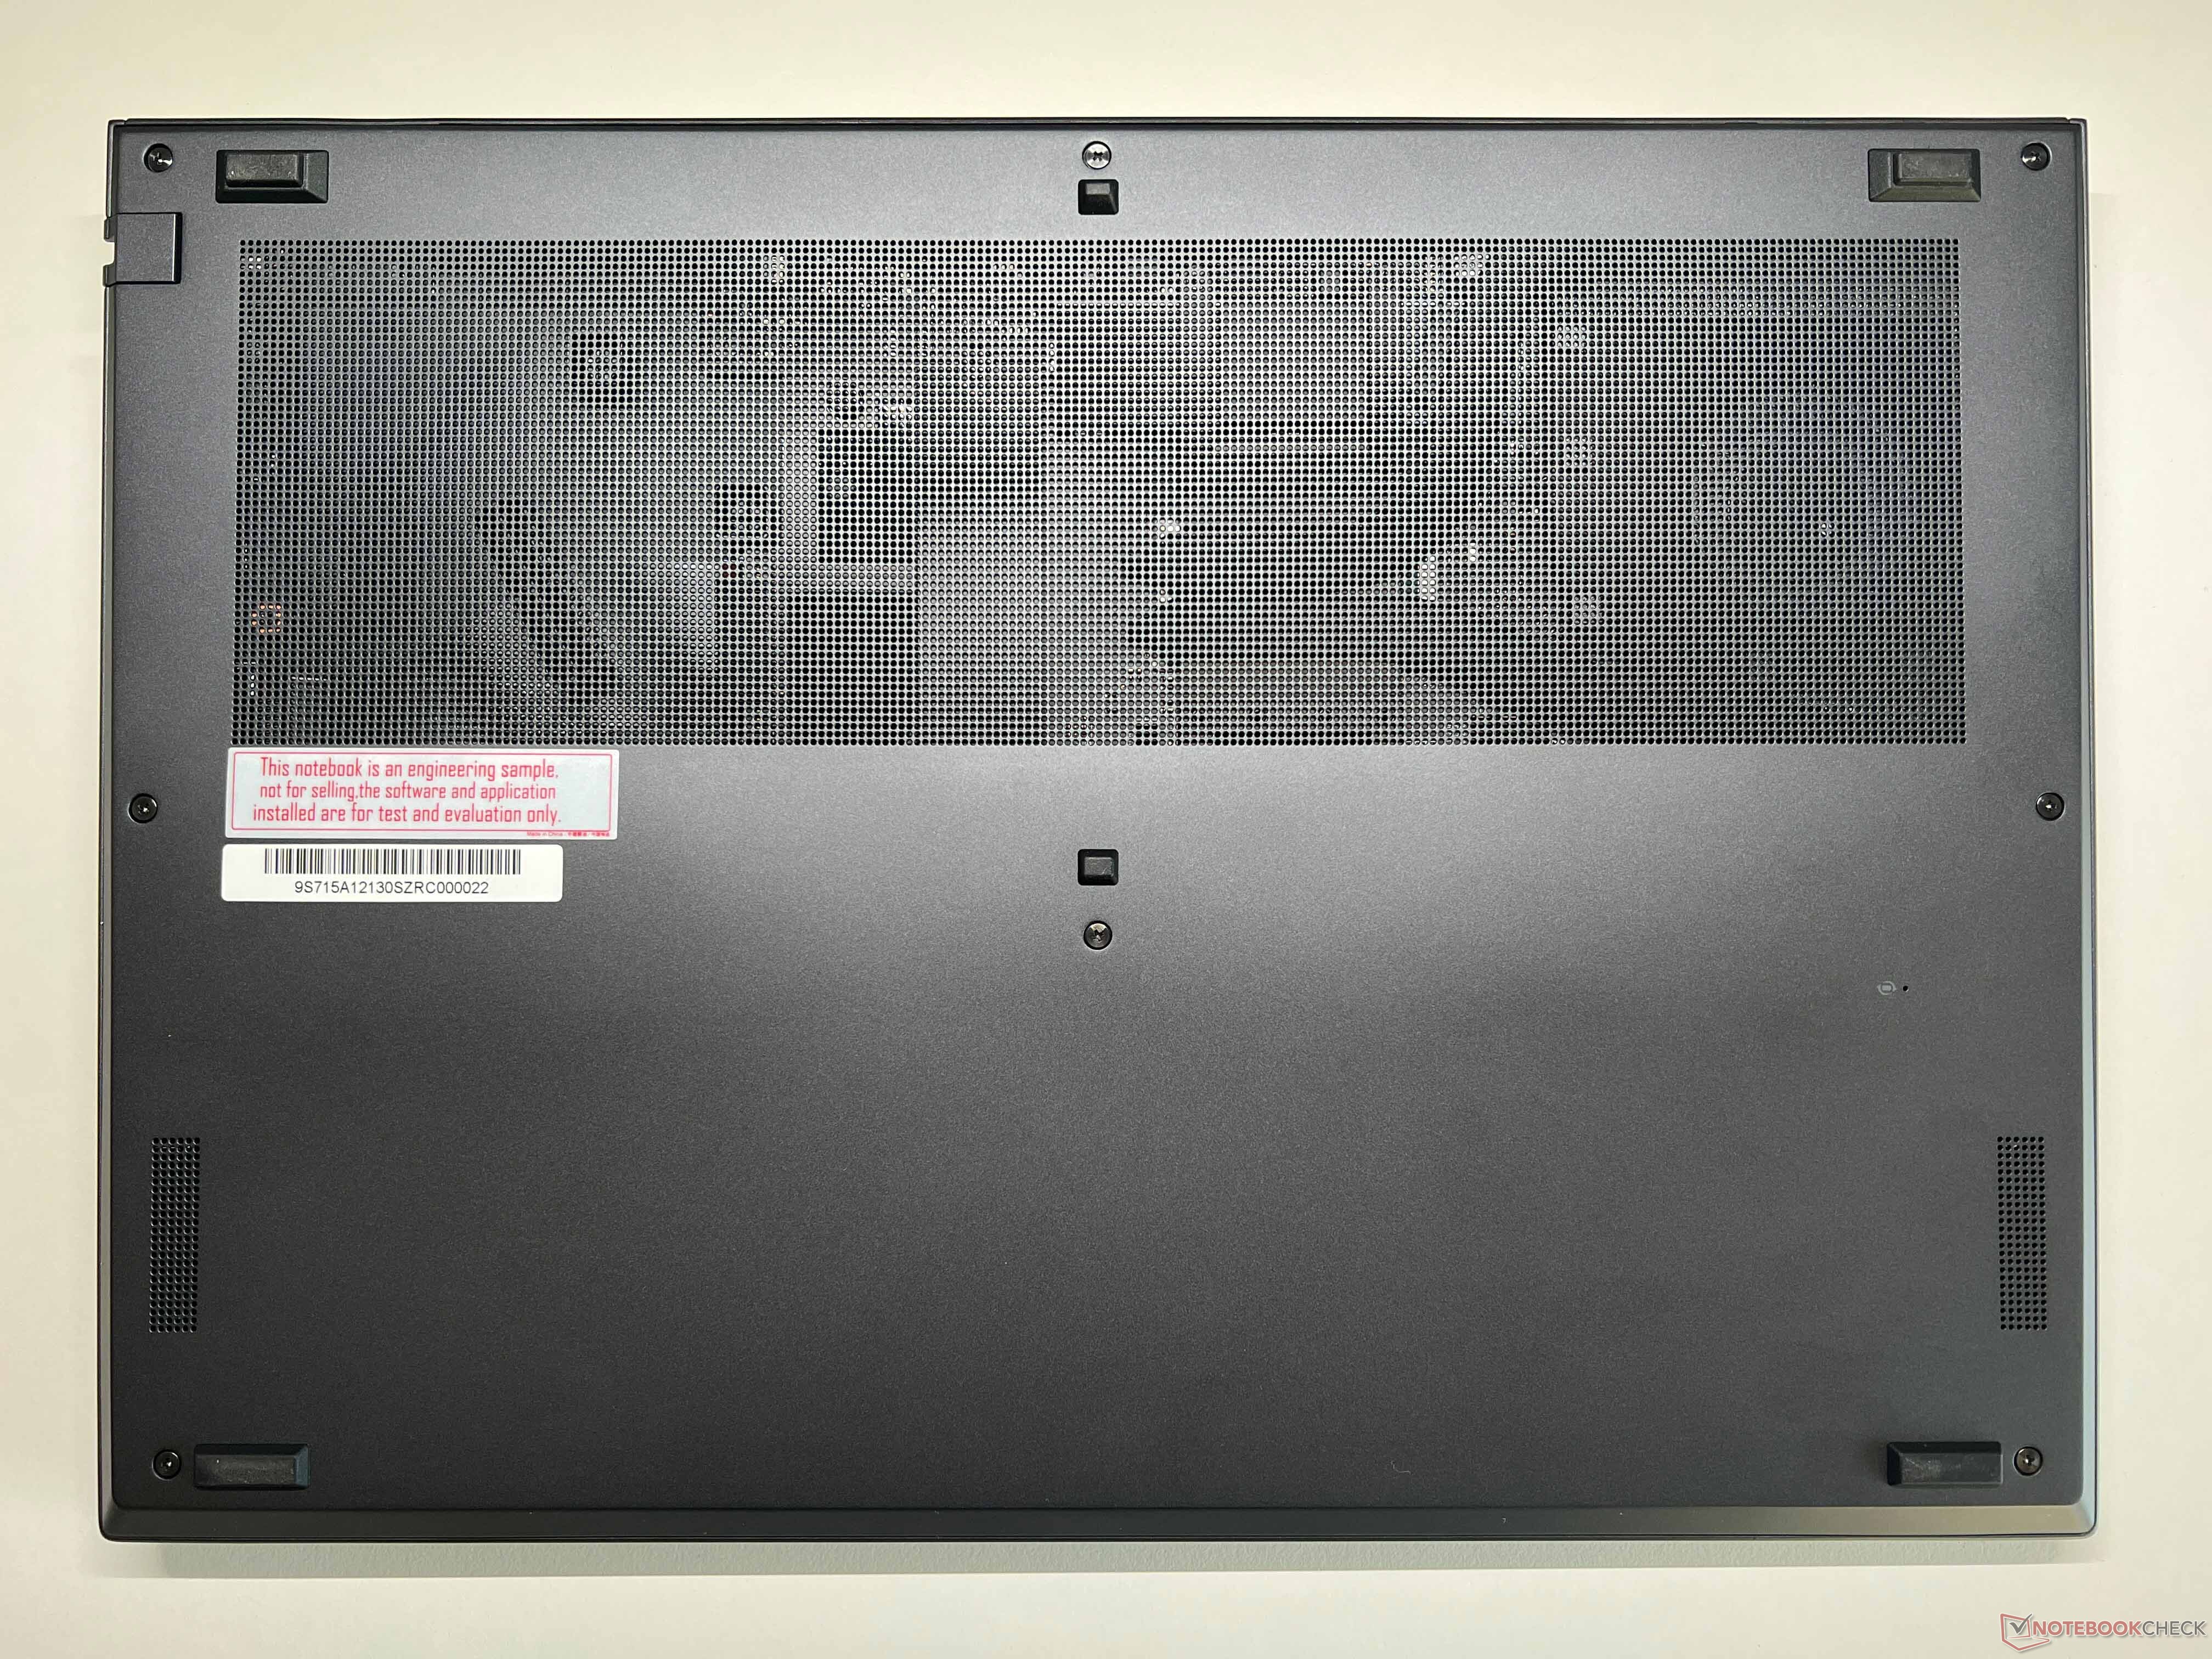
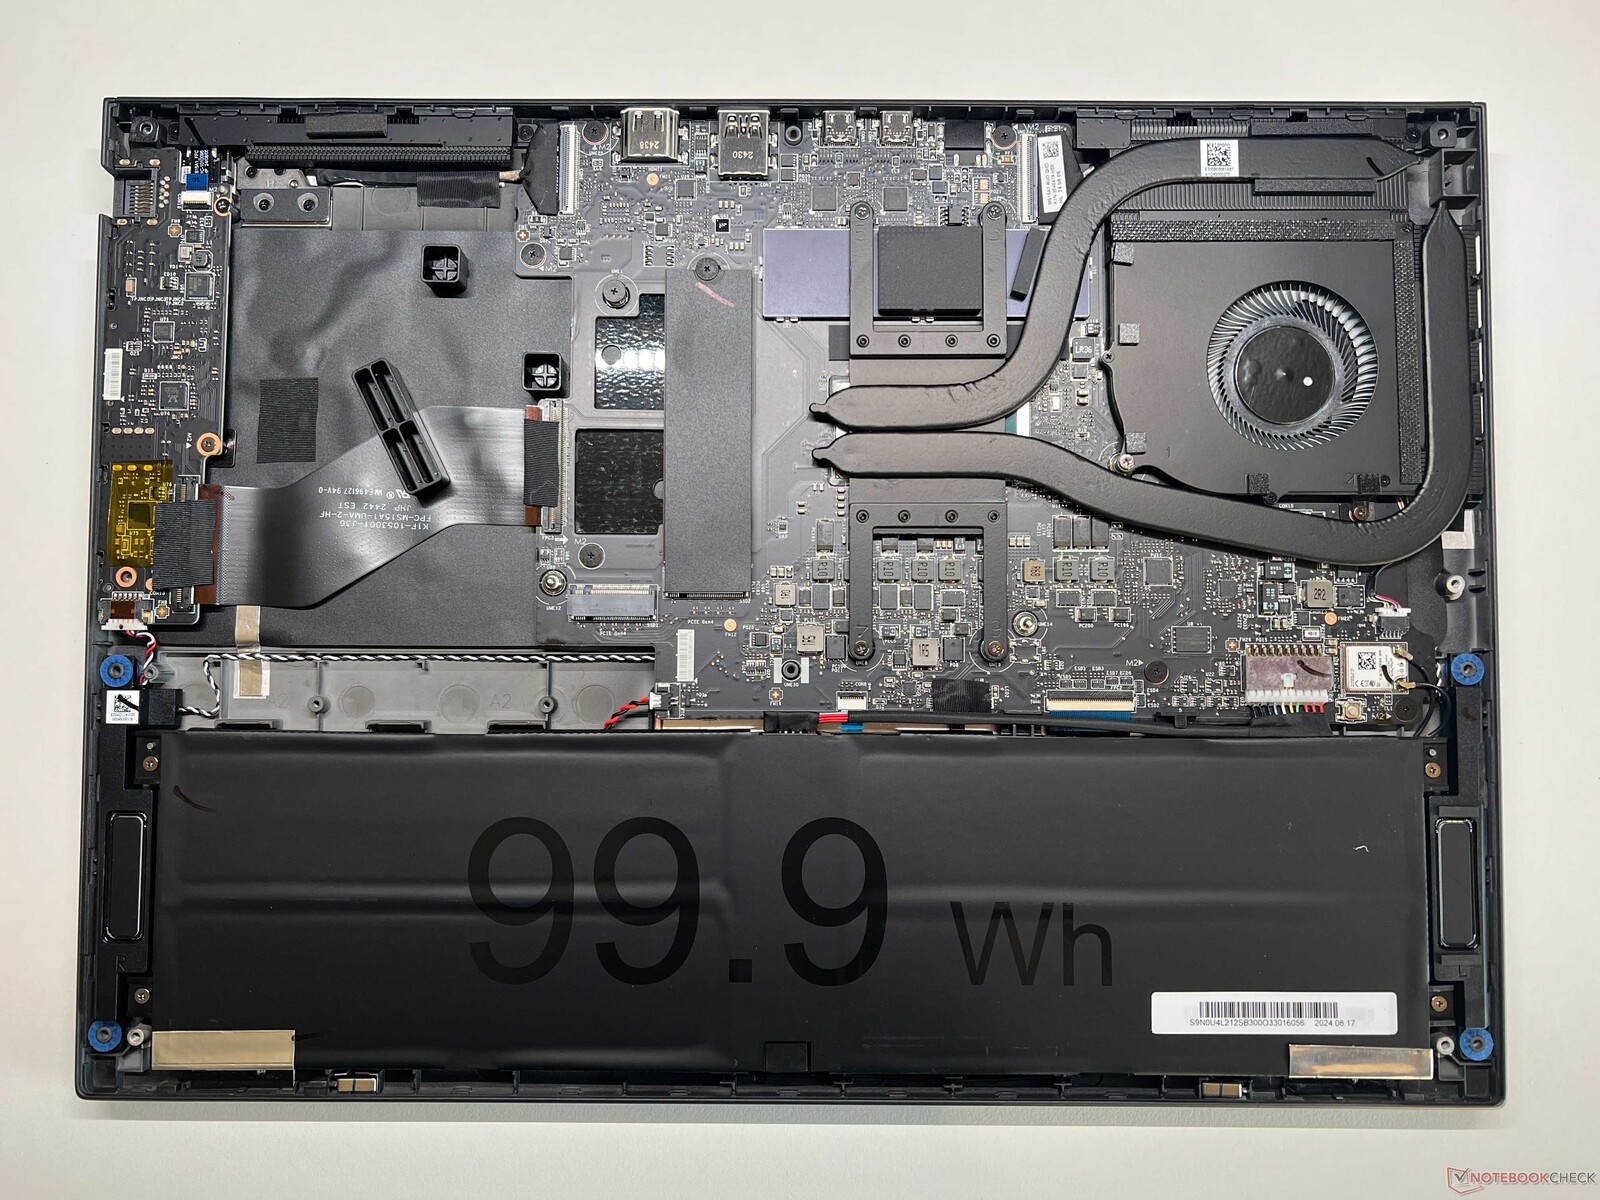
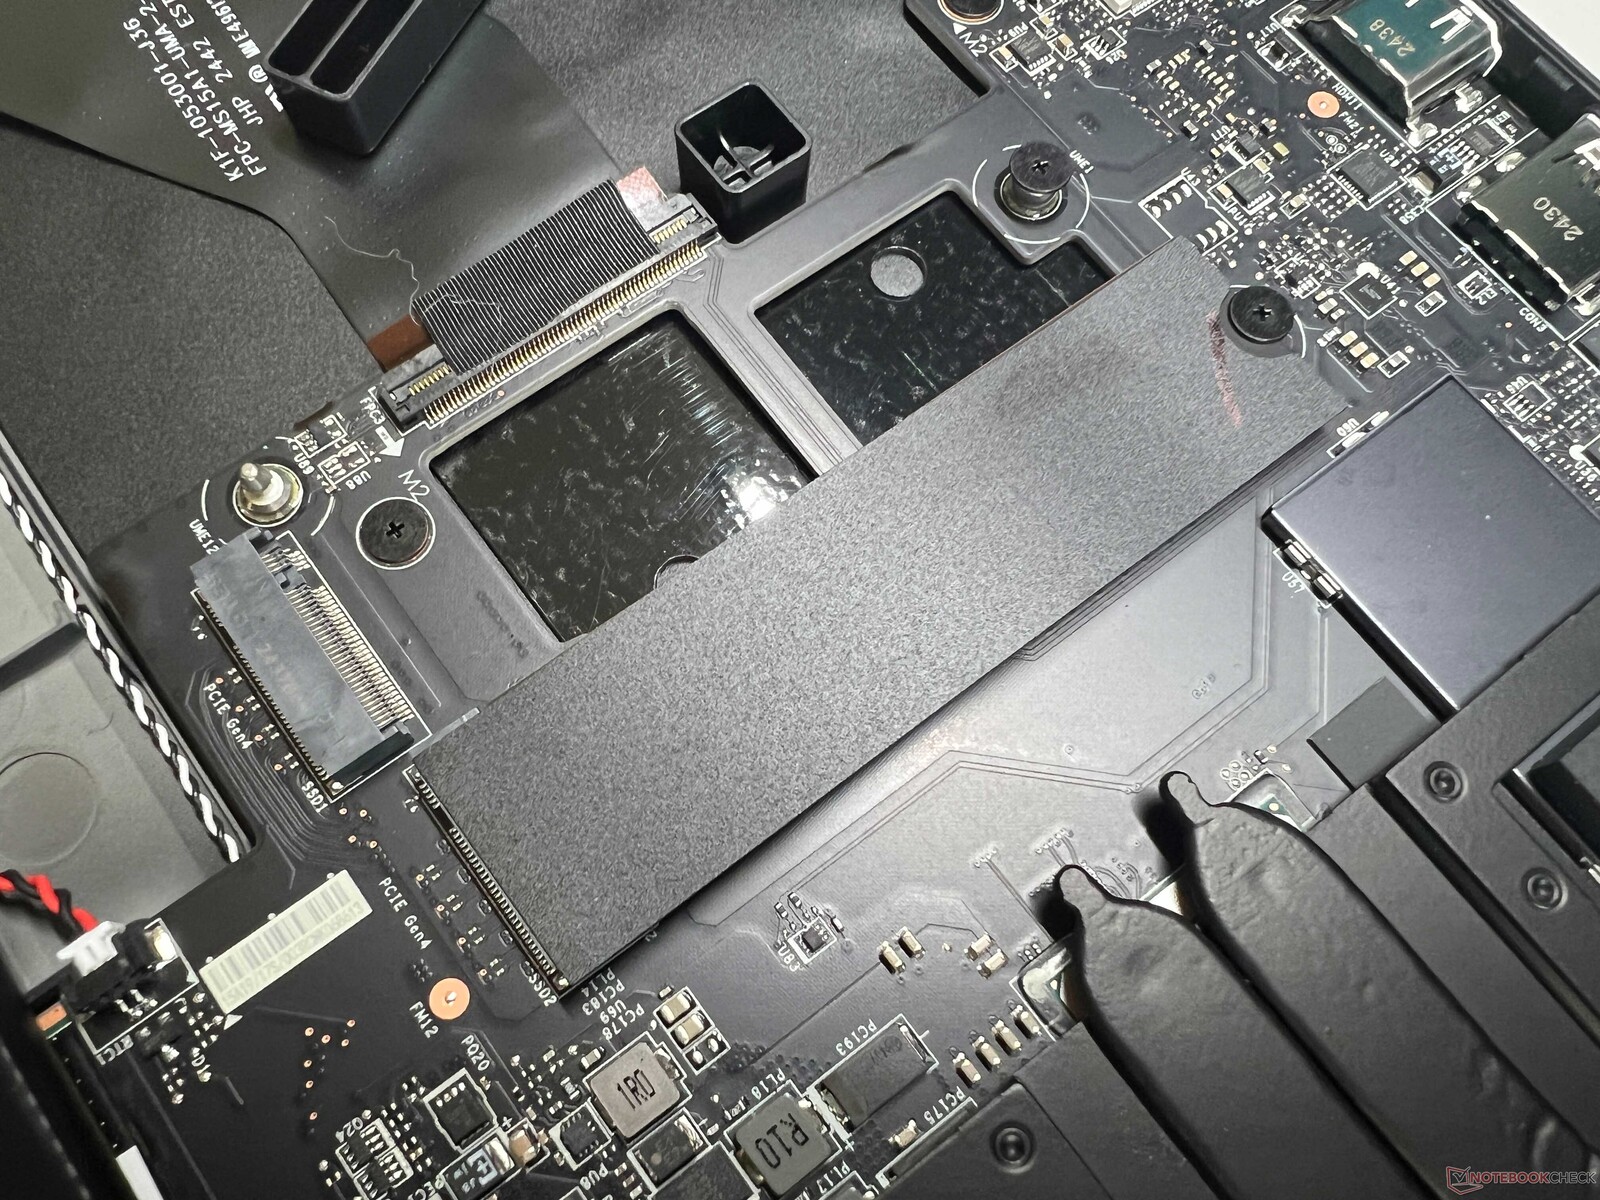
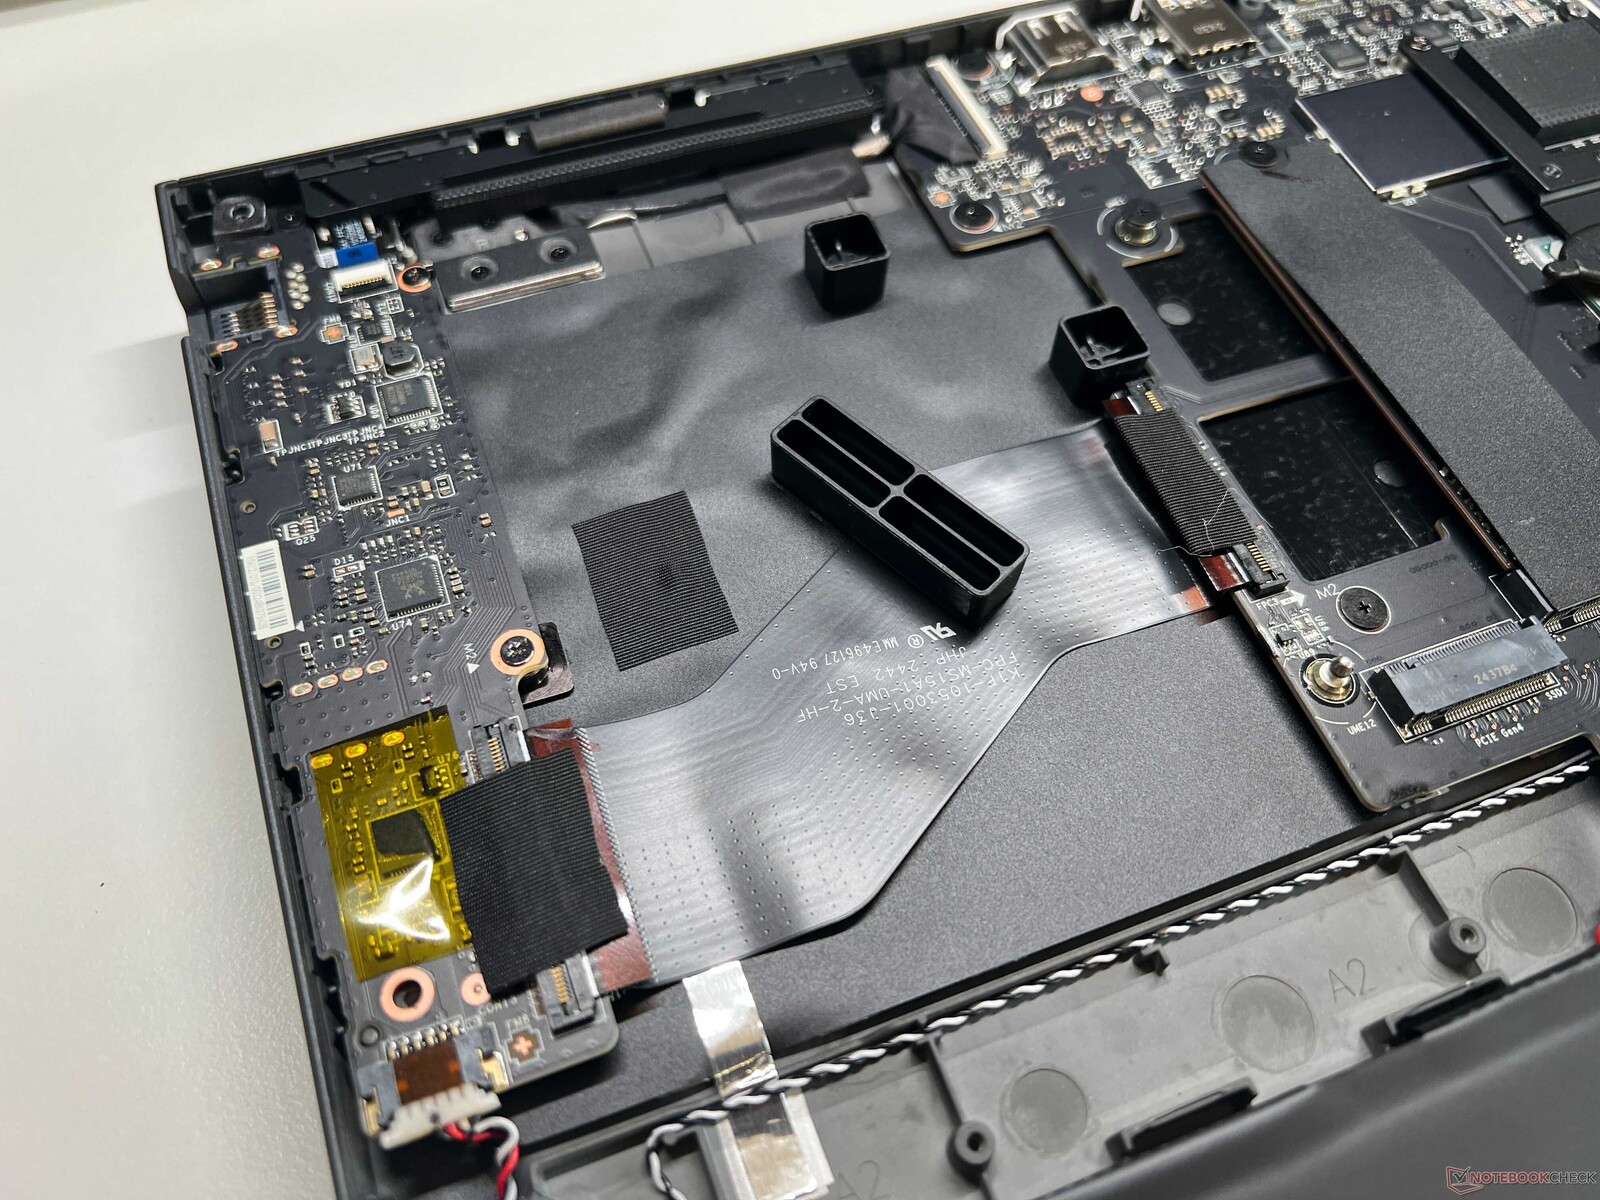
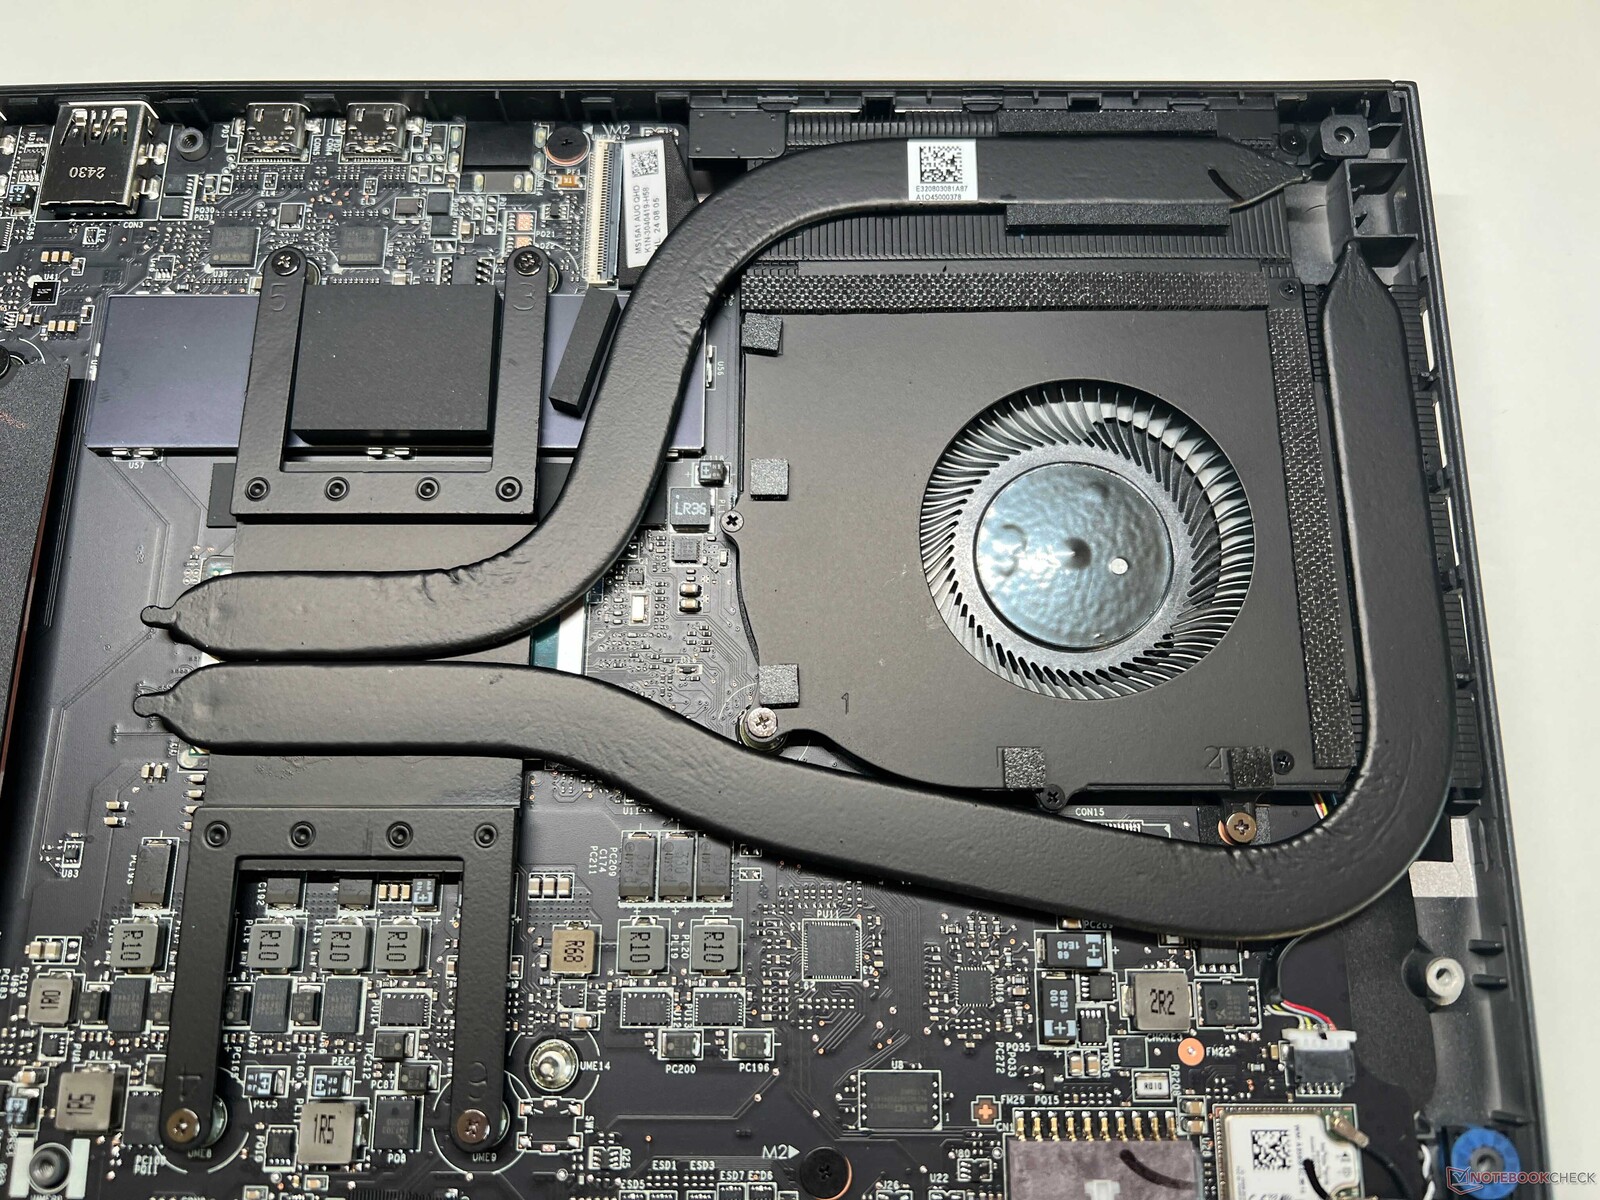
维护
机箱底盖用螺钉固定,可以轻松取下。在机箱内部,你可以看到风扇、电池和两个 M.2 2280 固态硬盘,但其余组件都是焊接上去的。除了大容量电池(99.9 Wh)外,机箱右侧的未使用区域也很显眼。
可持续性
制造商没有提供任何关于笔记本电脑生产过程中产生的二氧化碳排放量或使用可回收材料比例的信息。不过,它的包装主要由纸张制成。没有维修指南。
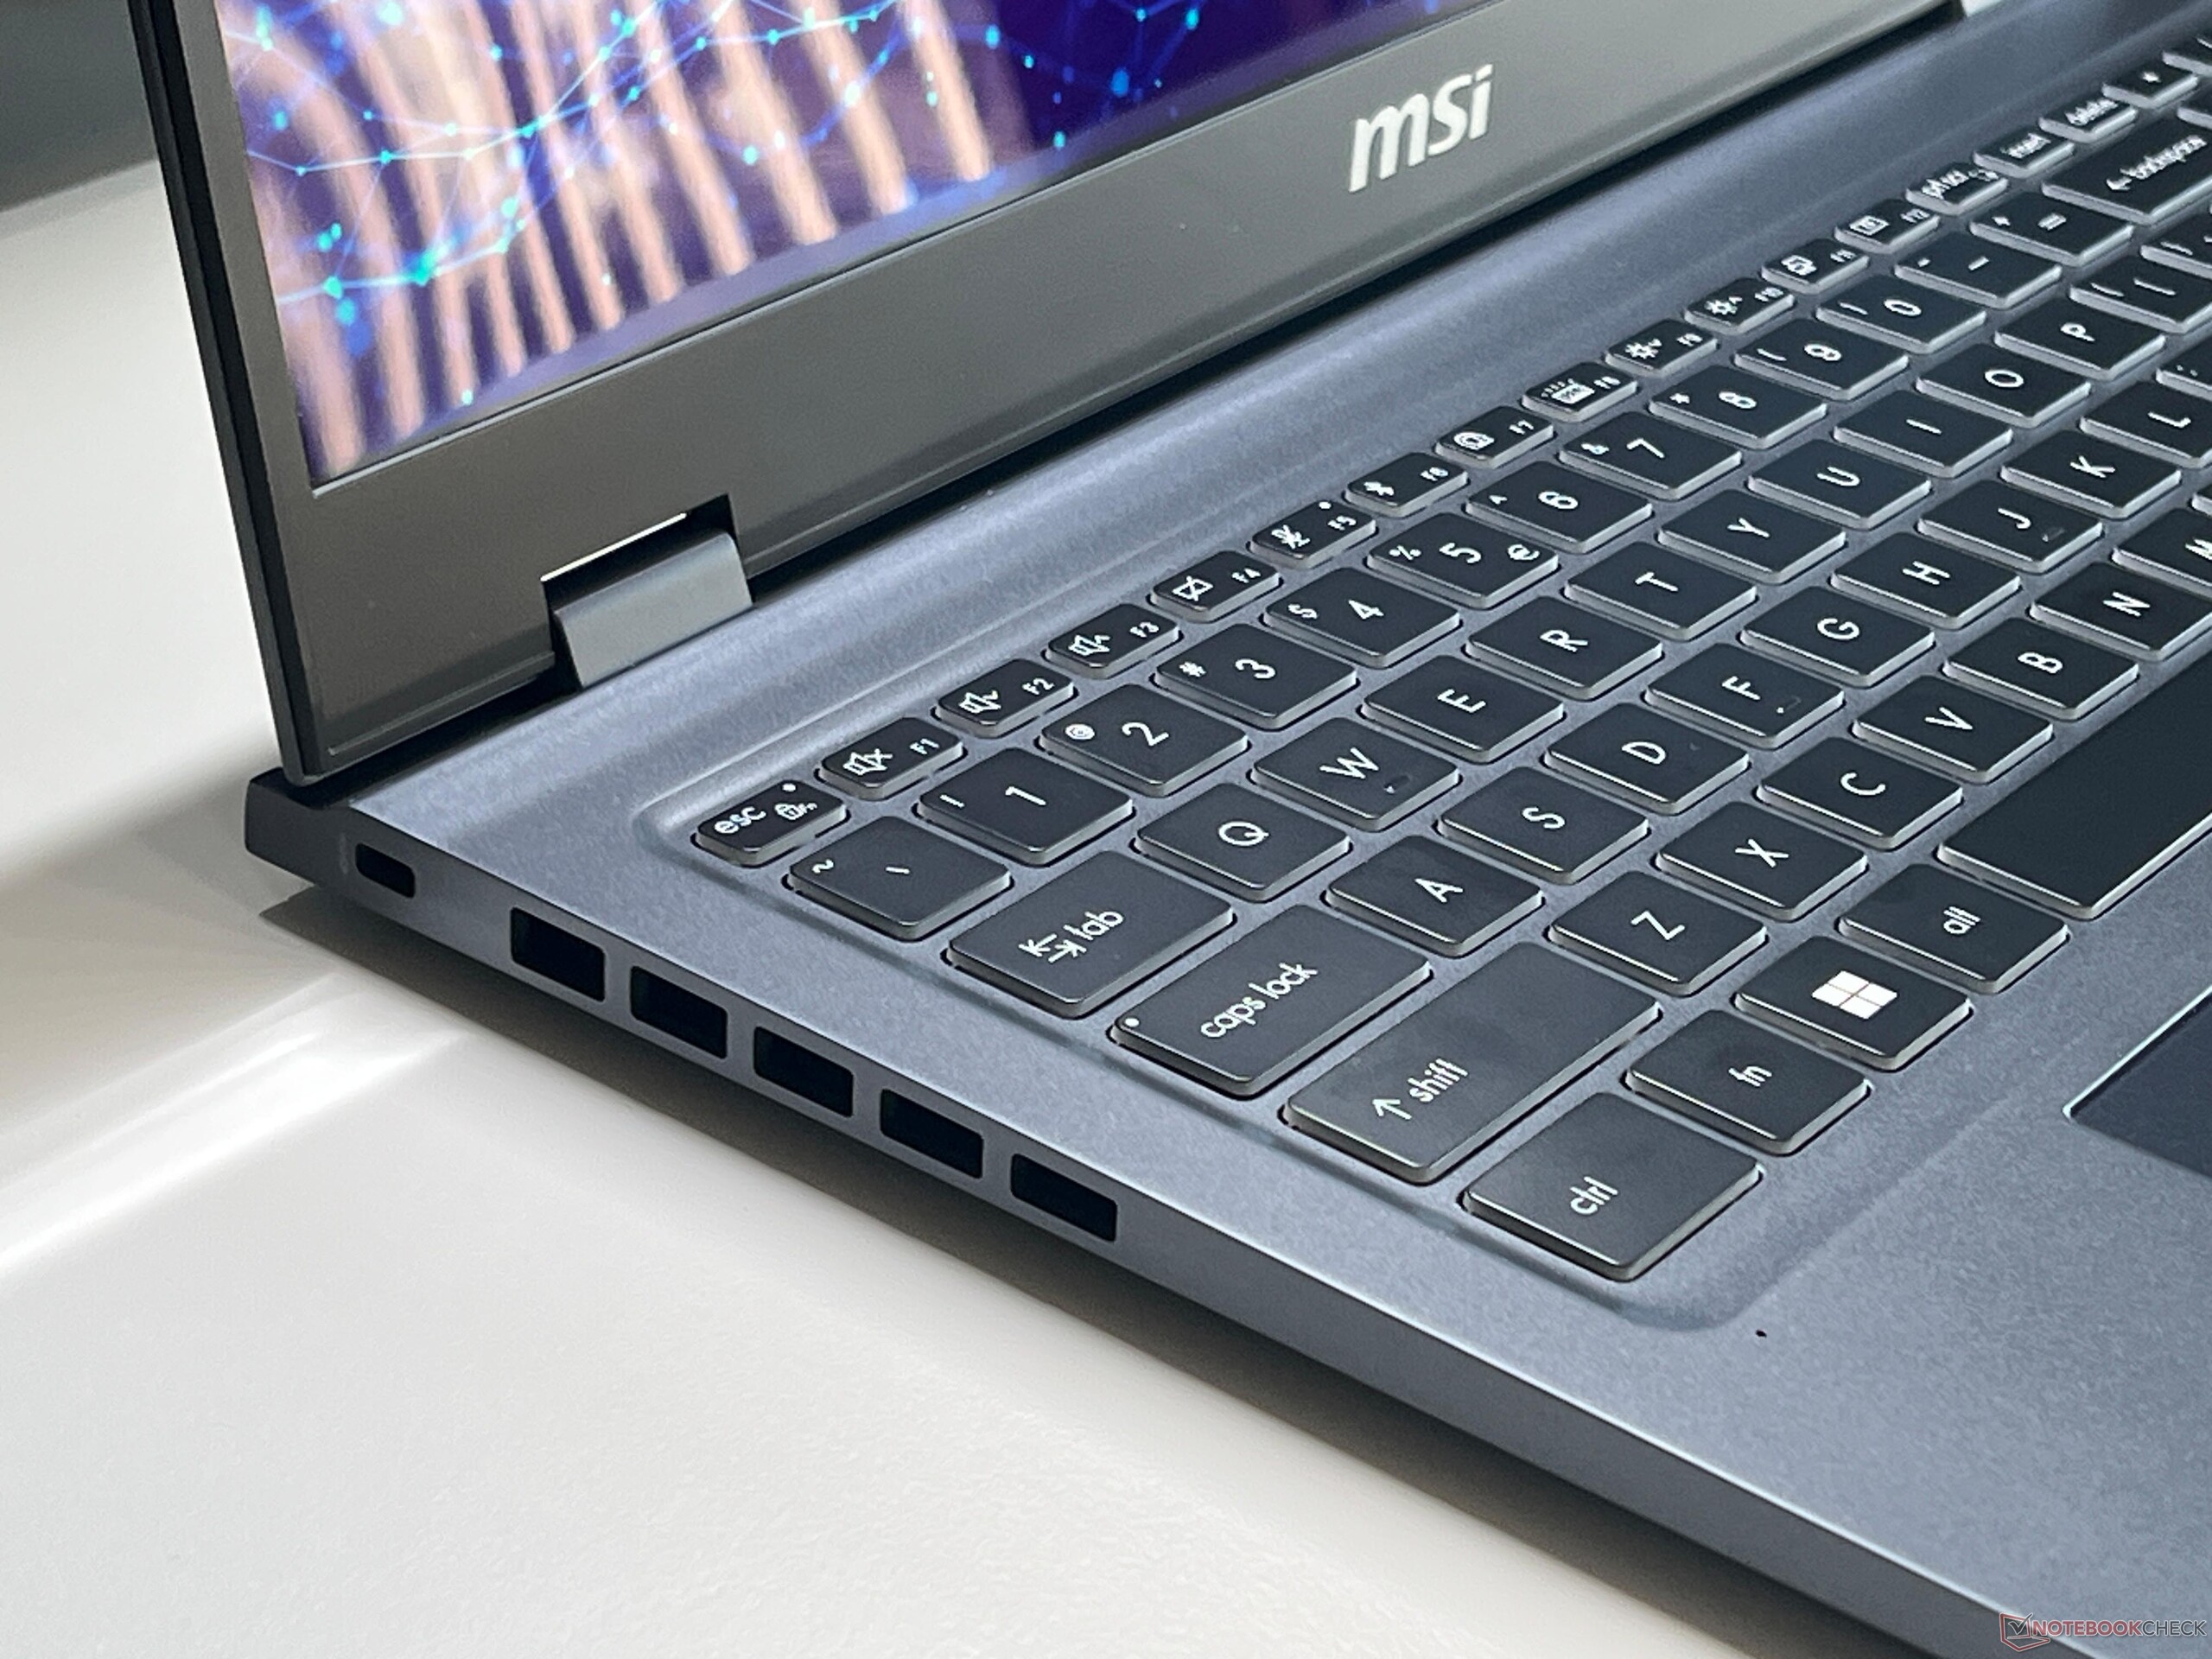
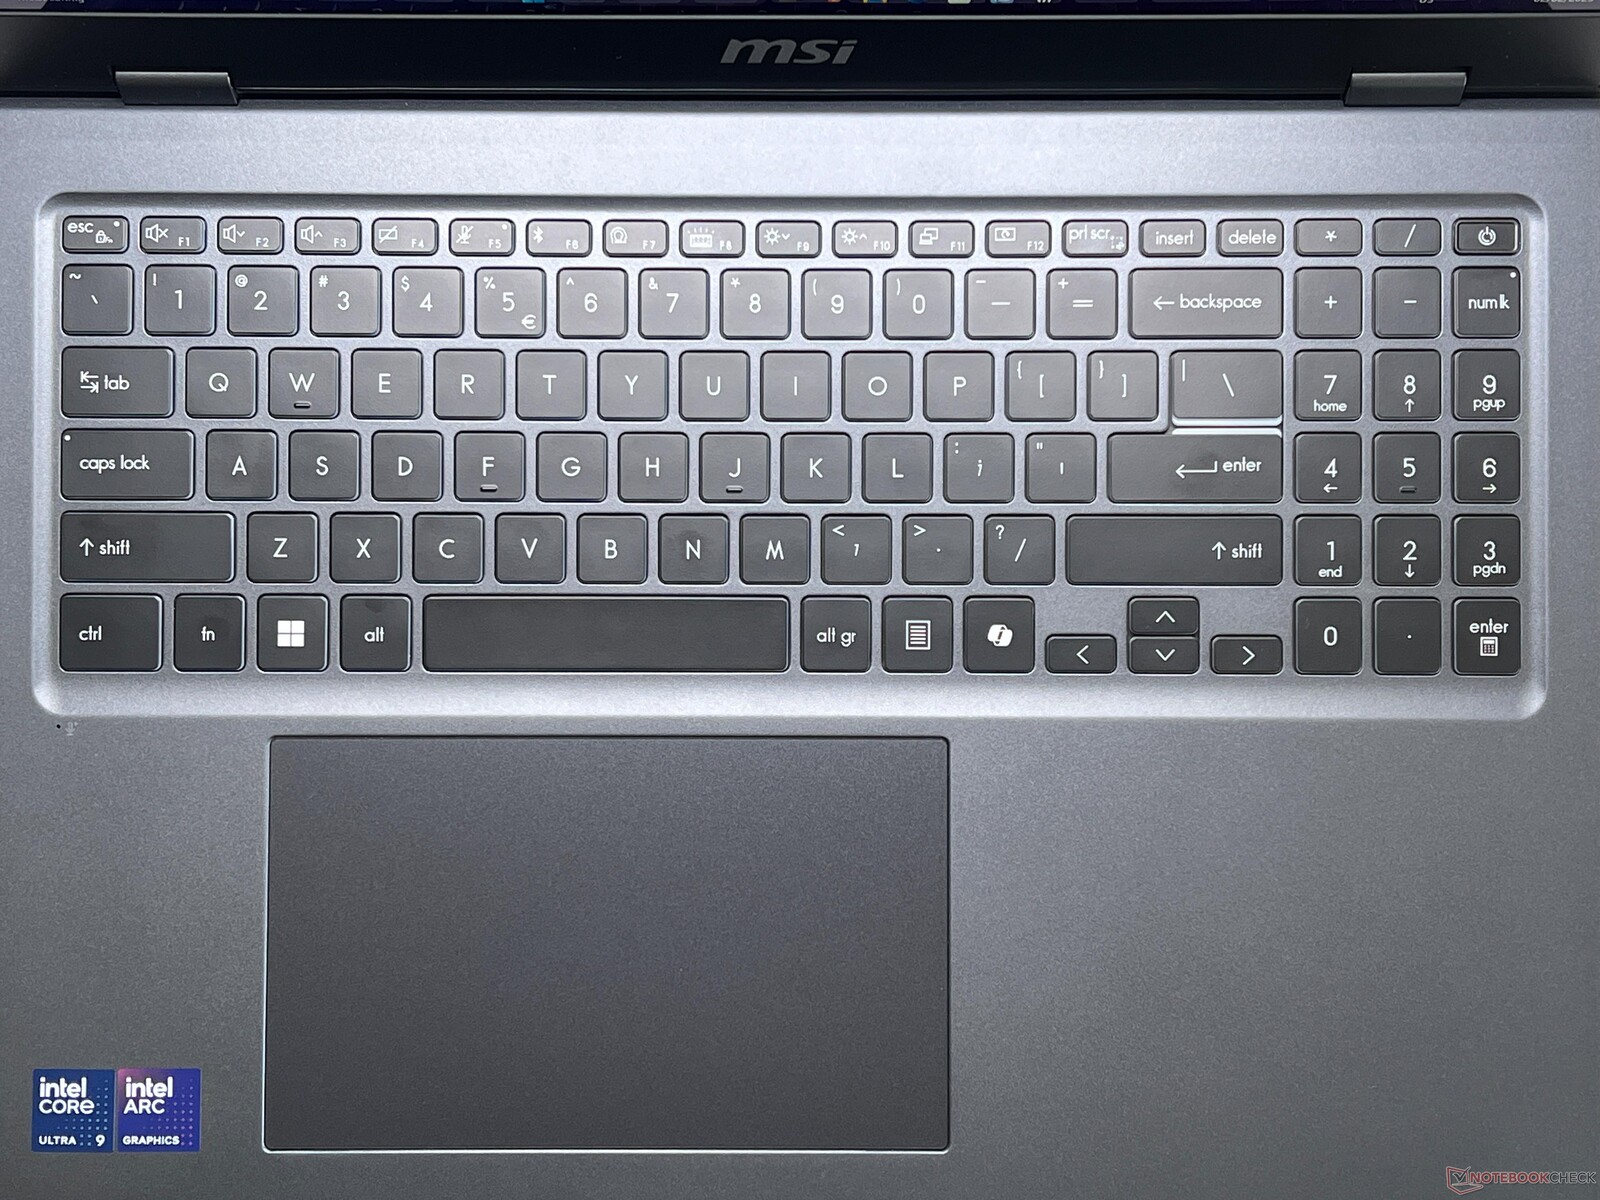
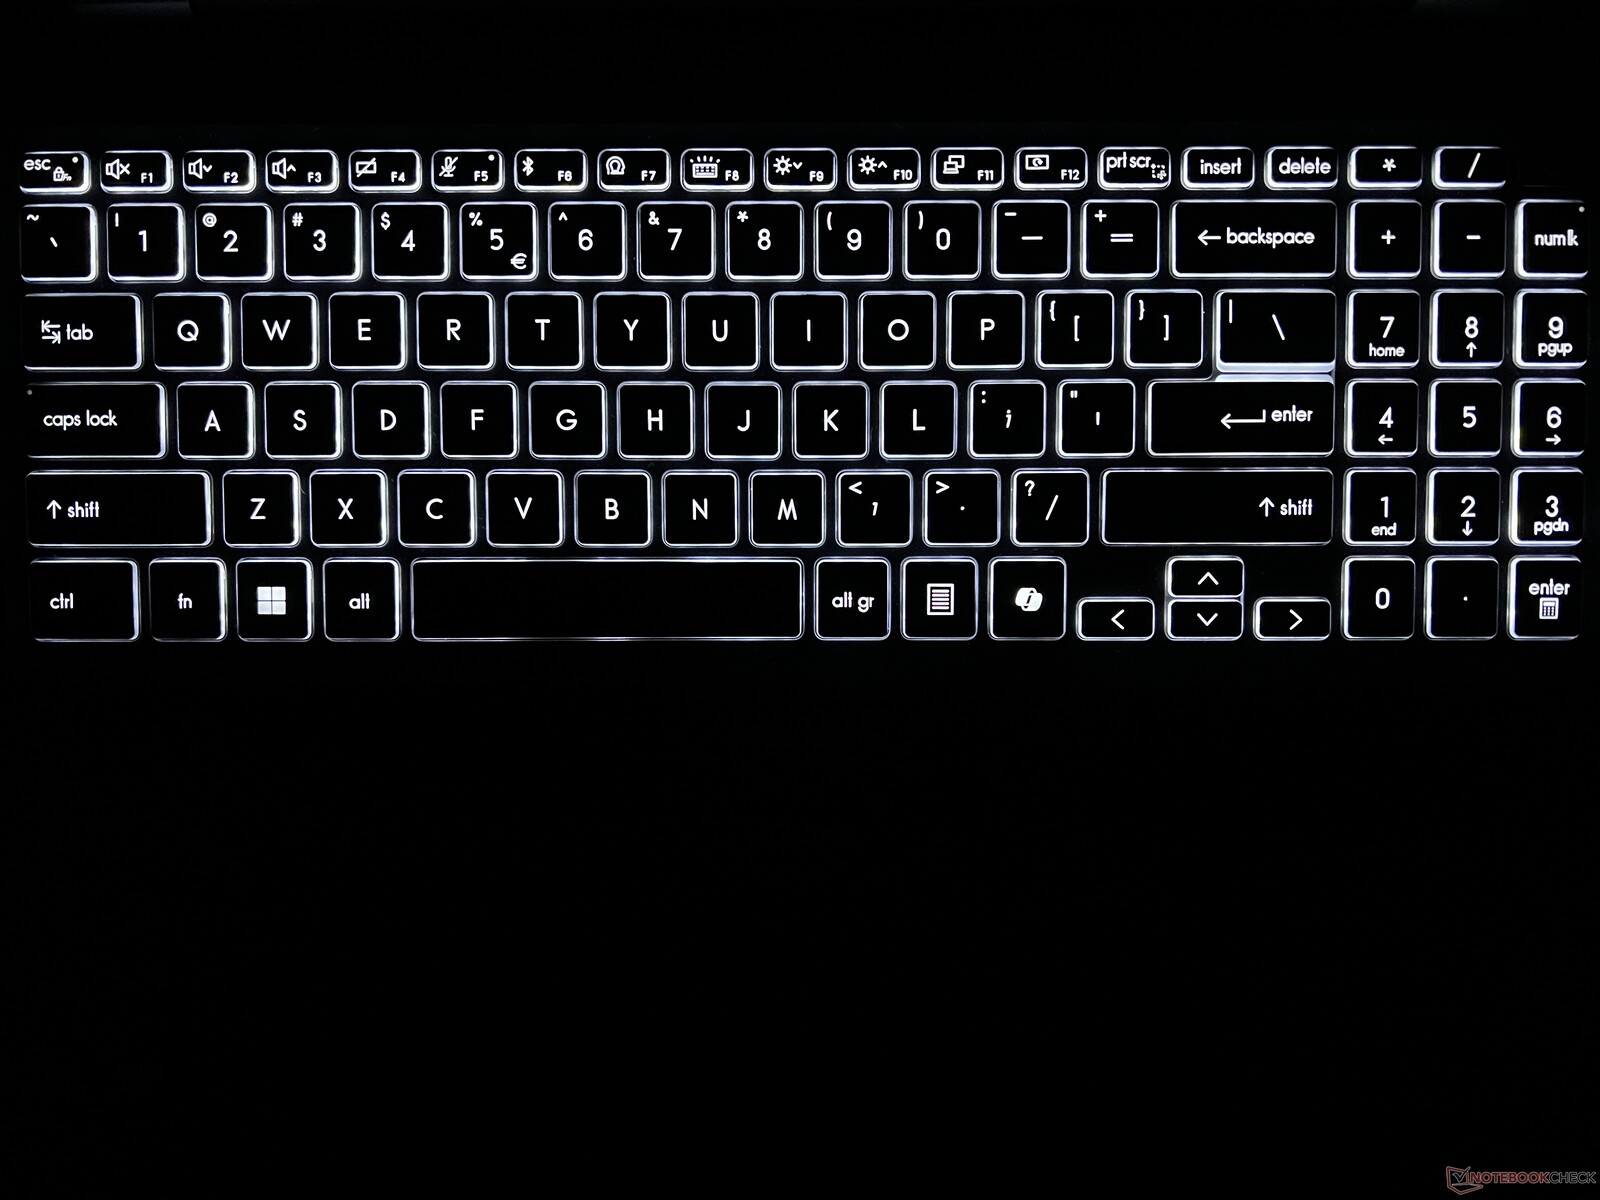
输入设备 - 舒适的键盘
Prestige 配备了舒适的键盘,白色背光可通过传感器自动激活。键盘键程充足,按键声音也不大。您可以毫无问题地书写较长的文字,键盘甚至还配备了专用数字键盘。右上角的电源按钮还可用作指纹扫描仪。
ClickPad 运行流畅,手指在其表面滑动也很顺畅。它的尺寸为 15 x 9 厘米,非常大,有足够的空间来做手势。手写板的下部区域可以向下按压,但会发出响亮的咔嗒声。整个 ClickPad 并没有位于底座的中心,而是偏向左侧。
显示屏 - WQHD IPS,60 赫兹
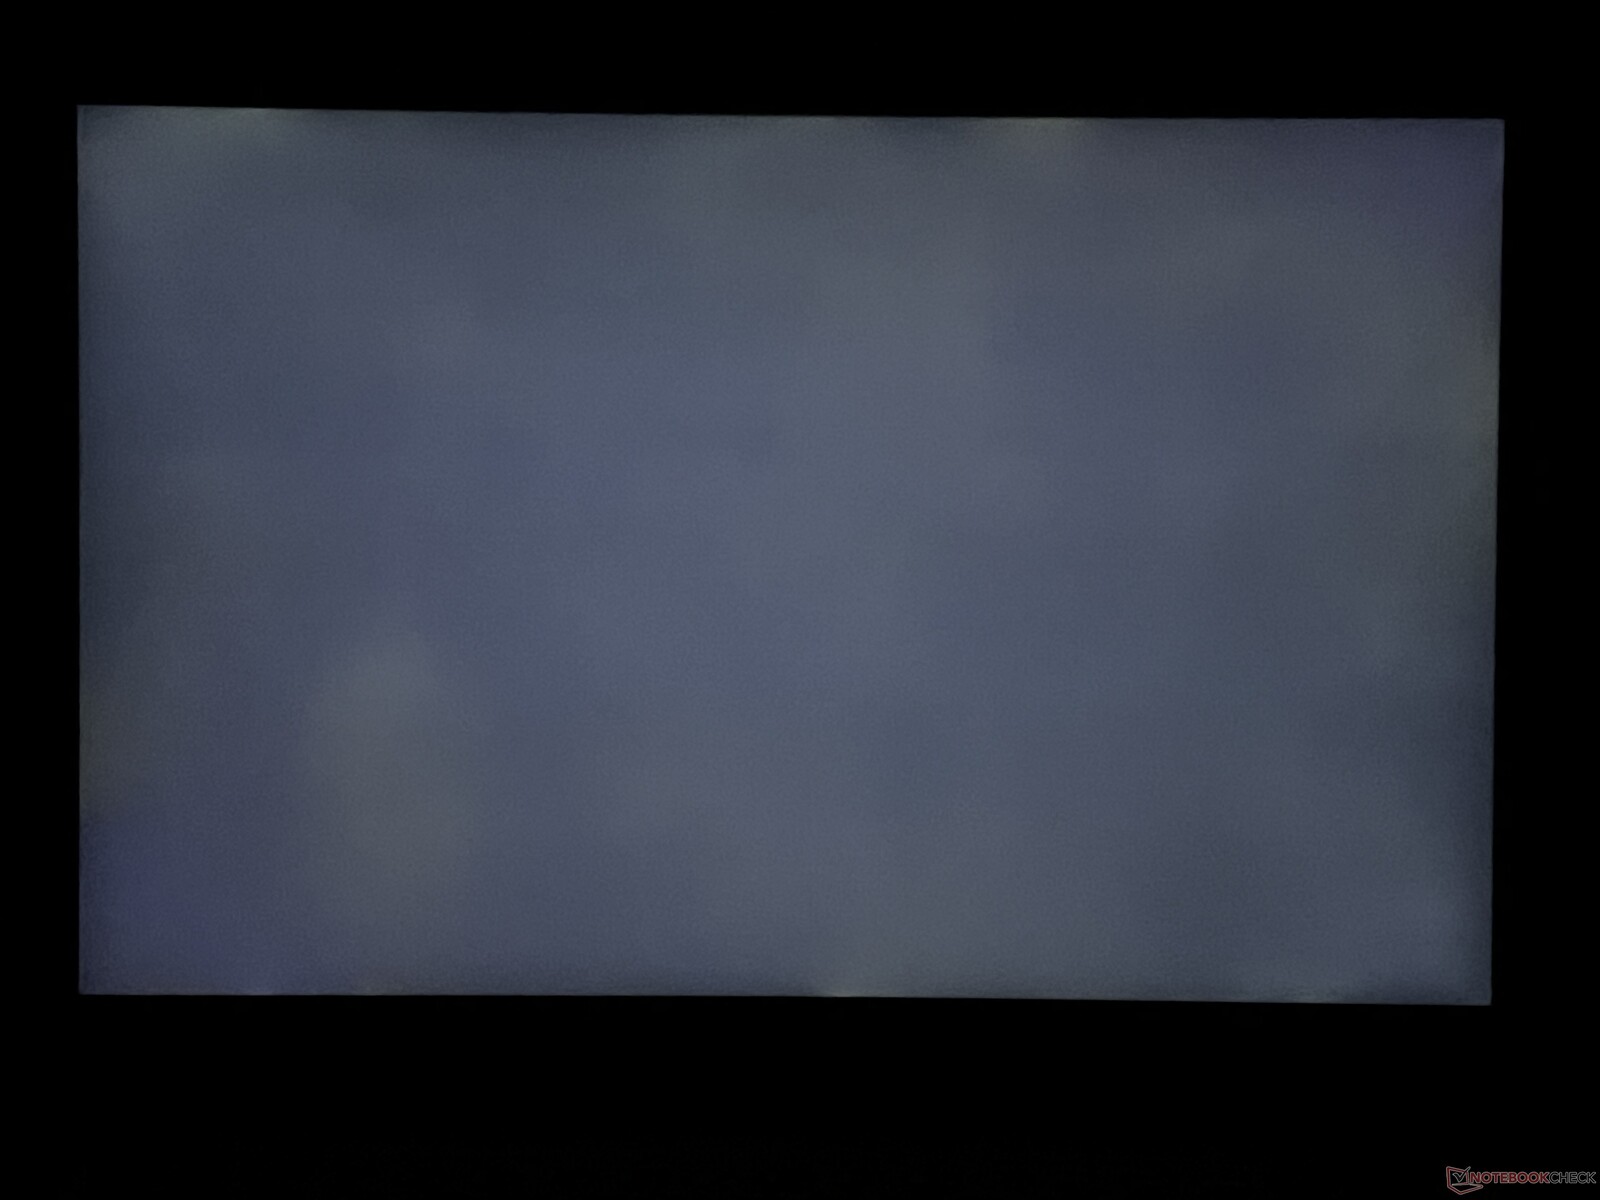
我们的测试设备配备了一块 16 英寸 IPS 显示屏,分辨率为 2,560 x 1,600 像素,宽高比为 16:10,频率为 60 Hz。主观而言,反射式面板的画质不错,所有内容看起来都很清晰,色彩也很鲜艳。它不使用 PWM 闪烁,但响应时间相当慢,而且有明显的重影效果。不过,背光出血似乎并不是该设备的主要问题,只有在高亮度和暗背景下才会出现。亮度可以自动调节,但色温不能。
它的最大亮度平均约为 450 cd/m²,加上 0.2 cd/m² 的低黑电平,最大对比度非常高,超过 2,000:1。
| |||||||||||||||||||||||||
Brightness Distribution: 92 %
Center on Battery: 471 cd/m²
Contrast: 2355:1 (Black: 0.2 cd/m²)
ΔE Color 5.8 | 0.5-29.43 Ø4.87, calibrated: 1.9
ΔE Greyscale 7.8 | 0.5-98 Ø5.1
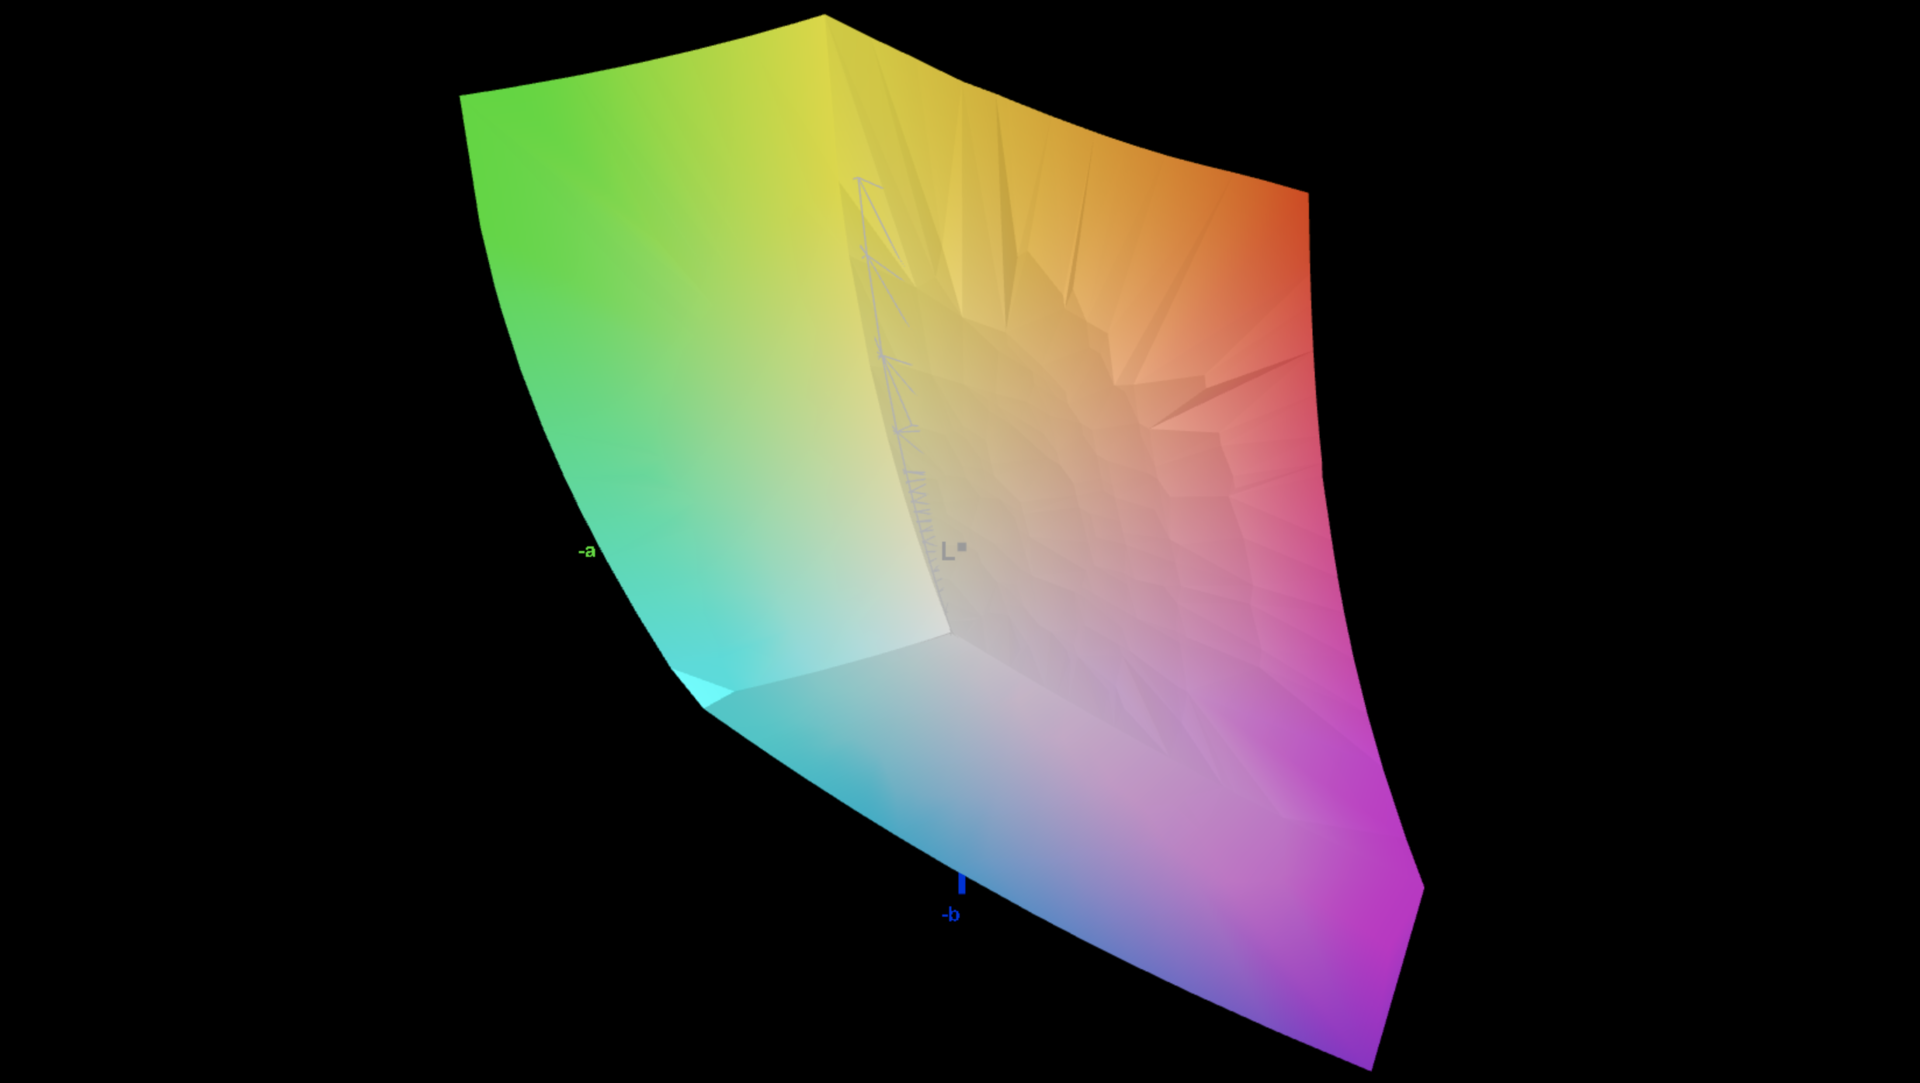
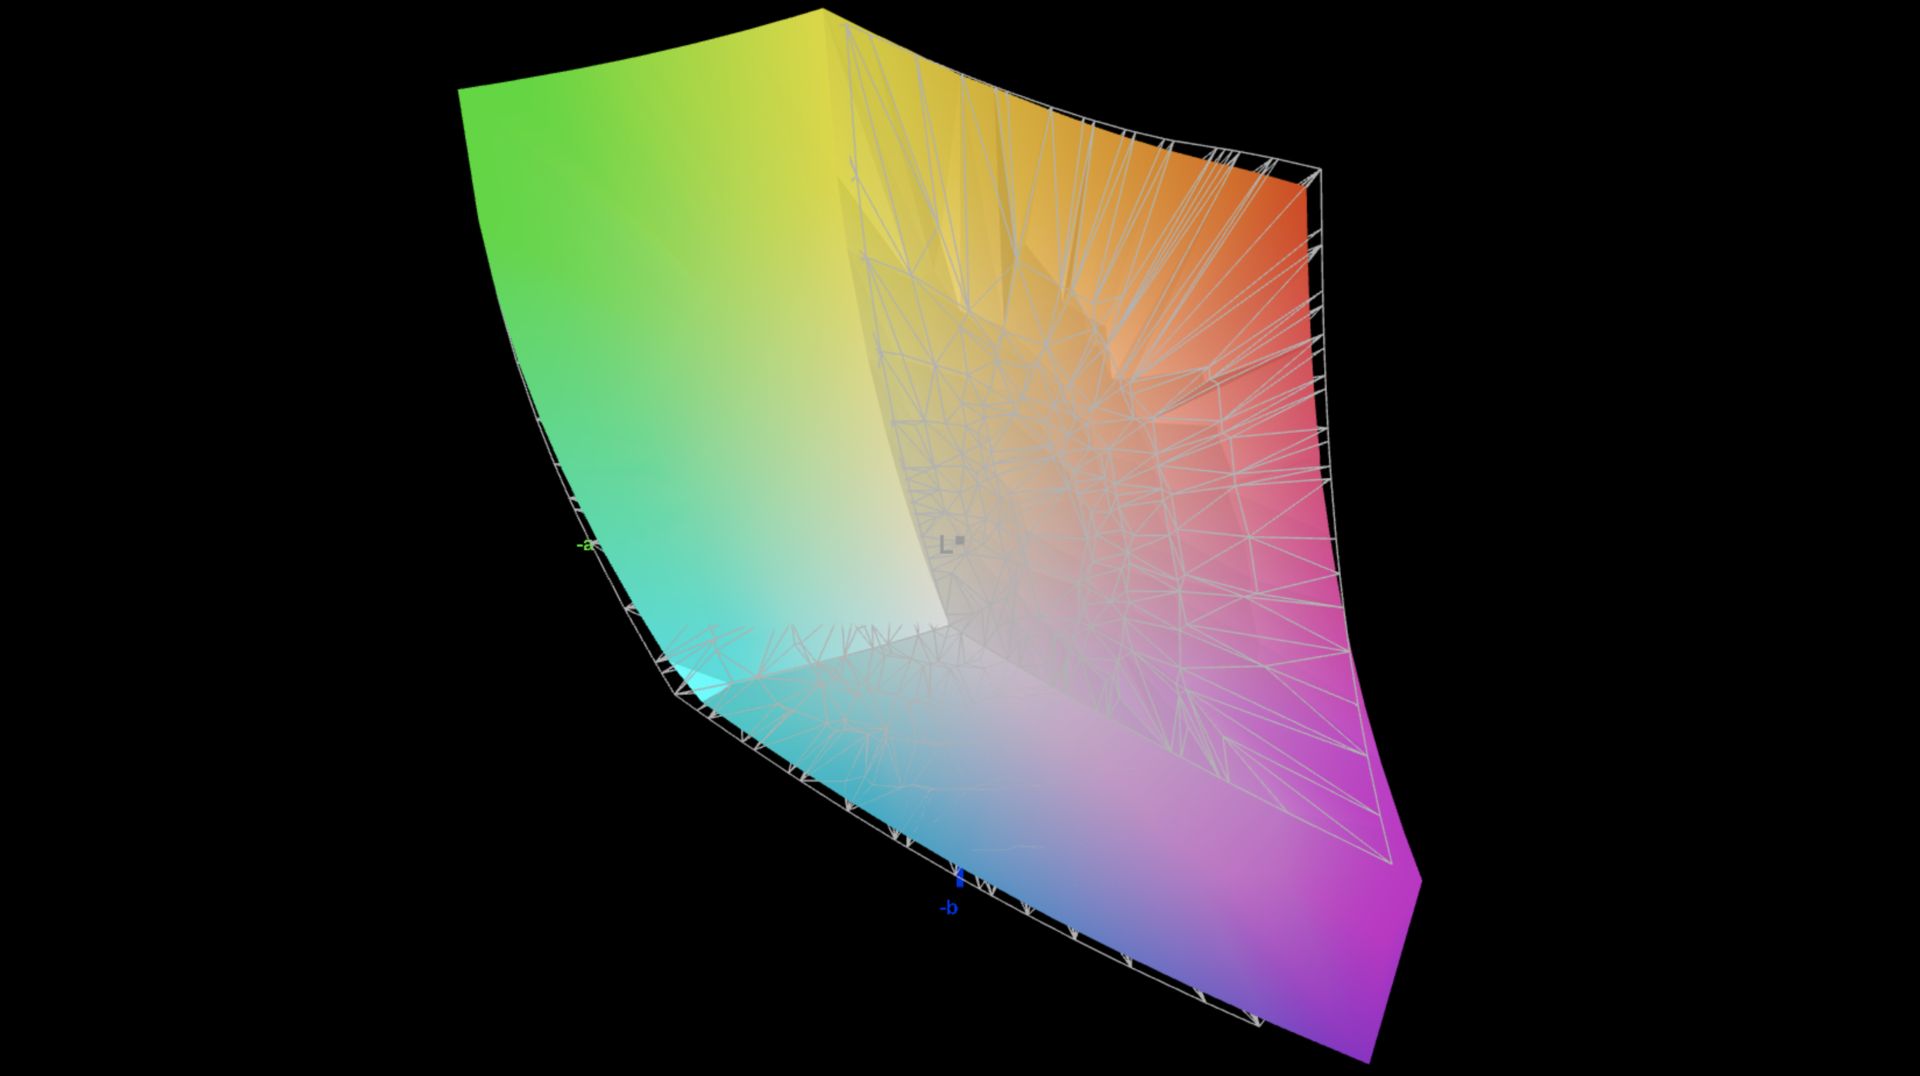
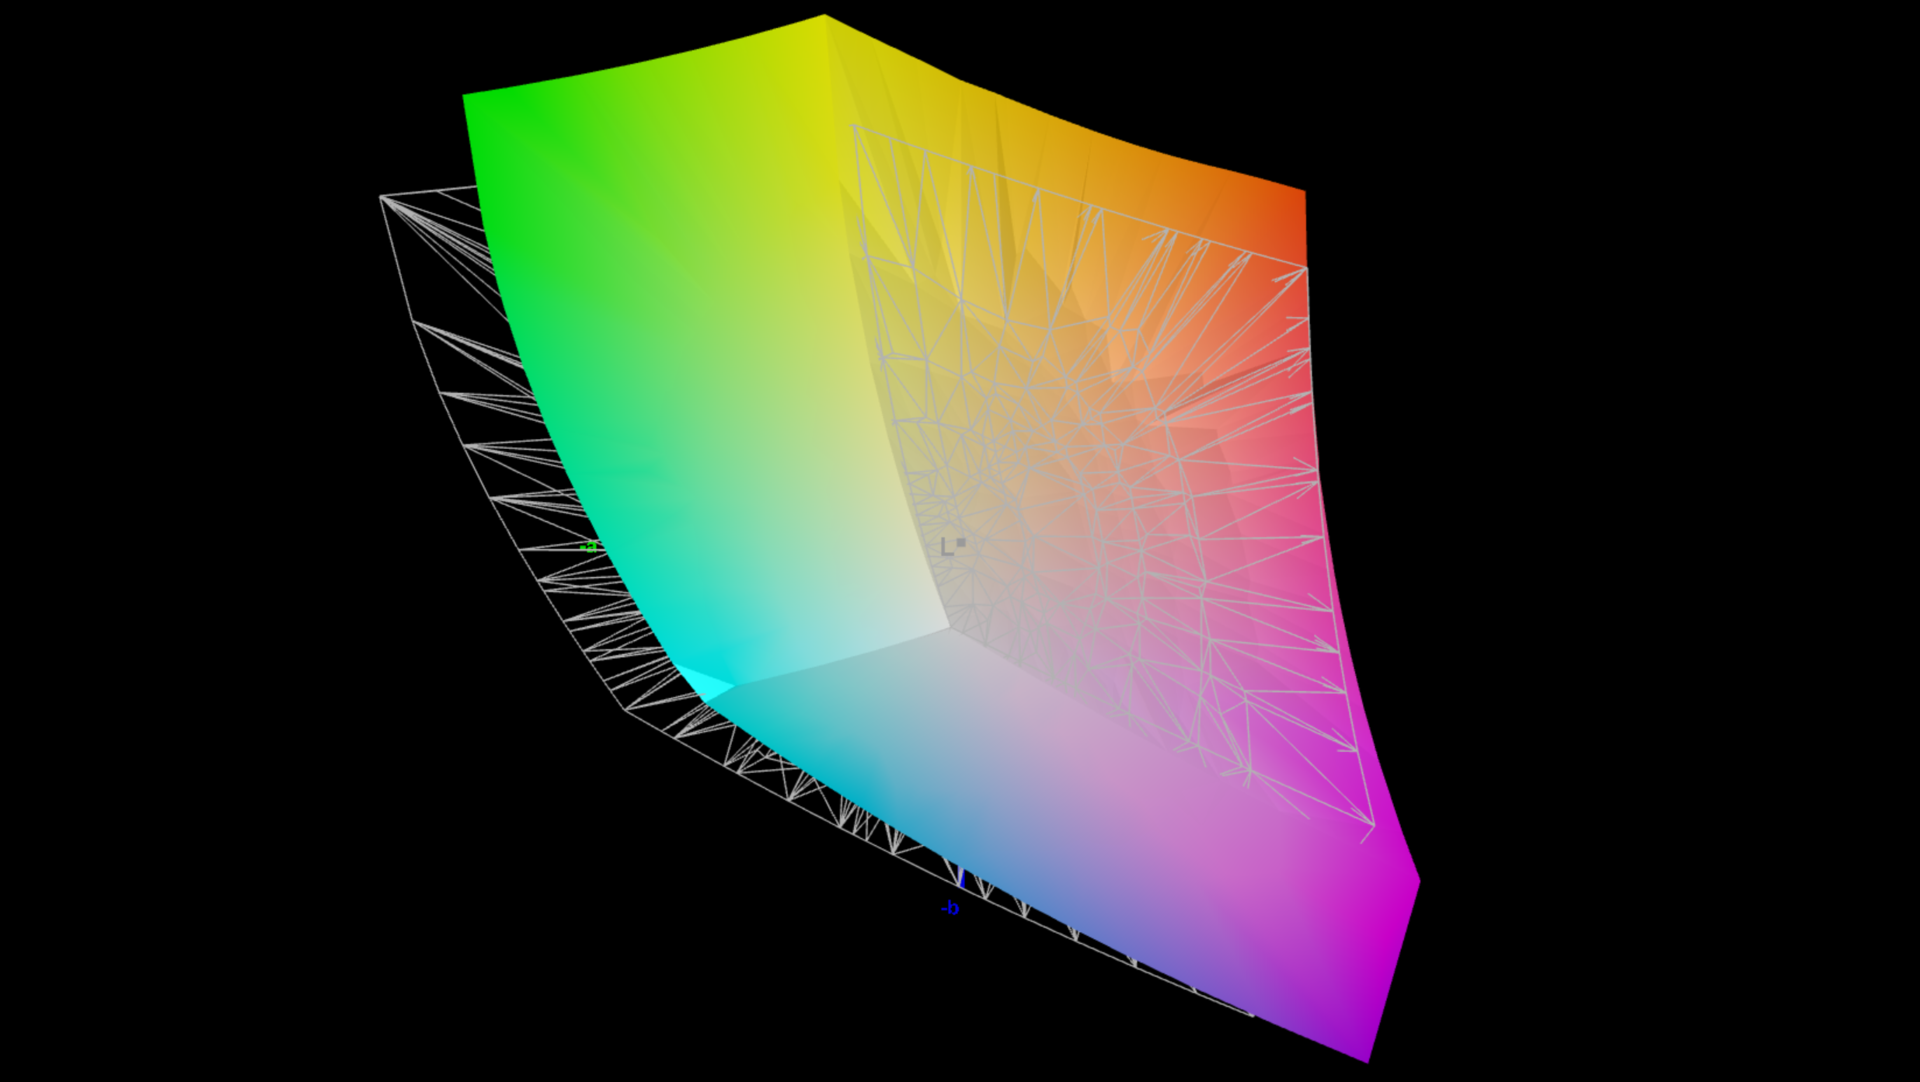
84.3% AdobeRGB 1998 (Argyll 2.2.0 3D)
99.7% sRGB (Argyll 2.2.0 3D)
96.4% Display P3 (Argyll 2.2.0 3D)
Gamma: 2.07
| MSI Prestige 16 AI Evo B2HMG B160QAN03_R, IPS, 2560x1600, 16", 60 Hz | Lenovo ThinkBook 16 G7+ AMD LEN160-3.2K, IPS, 3200x2000, 16", 165 Hz | MSI Prestige A16 AI+ A3HMG-036 AUO28B2 (B160QAN02.N), IPS, 2560x1600, 16", 165 Hz | Apple MacBook Pro 16 2024 M4 Pro Mini-LED, 3456x2234, 16.2", 120 Hz | Asus Zenbook S 16 UM5606-RK333W ATNA60CL10-0, OLED, 2880x1800, 16", 120 Hz | Samsung Galaxy Book4 Pro 16 ATNA60CL07-0, OLED, 2880x1800, 16", 120 Hz | |
|---|---|---|---|---|---|---|
| Display | 1% | -1% | 3% | 6% | 6% | |
| Display P3 Coverage | 96.4 | 96.3 0% | 94.6 -2% | 99.7 3% | 99.9 4% | 99.5 3% |
| sRGB Coverage | 99.7 | 100 0% | 99.7 0% | 100 0% | 100 0% | 100 0% |
| AdobeRGB 1998 Coverage | 84.3 | 86.9 3% | 83.4 -1% | 88.8 5% | 95.6 13% | 97.5 16% |
| Response Times | 74% | 72% | -27% | 98% | 98% | |
| Response Time Grey 50% / Grey 80% * | 51.5 ? | 13.9 ? 73% | 5.6 ? 89% | 43 ? 17% | 0.56 ? 99% | 0.64 ? 99% |
| Response Time Black / White * | 24.3 ? | 6.3 ? 74% | 11.2 ? 54% | 41.2 ? -70% | 0.65 ? 97% | 0.68 ? 97% |
| PWM Frequency | 14880 | 480 | 240 ? | |||
| Screen | 18% | 3% | 57% | 138% | 37% | |
| Brightness middle | 471 | 422 -10% | 488 4% | 632 34% | 407 -14% | 385 -18% |
| Brightness | 455 | 403 -11% | 444 -2% | 616 35% | 405 -11% | 391 -14% |
| Brightness Distribution | 92 | 93 1% | 86 -7% | 95 3% | 97 5% | 97 5% |
| Black Level * | 0.2 | 0.3 -50% | 0.36 -80% | 0.02 90% | ||
| Contrast | 2355 | 1407 -40% | 1356 -42% | 20350 764% | ||
| Colorchecker dE 2000 * | 5.8 | 1.7 71% | 3.45 41% | 0.6 90% | 0.6 90% | 1.1 81% |
| Colorchecker dE 2000 max. * | 10.8 | 3.4 69% | 6.77 37% | 1.2 89% | 1.2 89% | 1.8 83% |
| Colorchecker dE 2000 calibrated * | 1.9 | 0.7 63% | 1.35 29% | |||
| Greyscale dE 2000 * | 7.8 | 2.4 69% | 4.16 47% | 0.8 90% | 0.5 94% | 1.4 82% |
| Gamma | 2.07 106% | 2.19 100% | 2.52 87% | 2.21 100% | 2.2 100% | 2.24 98% |
| CCT | 7262 90% | 6989 93% | 6832 95% | 6450 101% | 6453 101% | 6444 101% |
| Total Average (Program / Settings) | 31% /
22% | 25% /
12% | 11% /
27% | 81% /
102% | 47% /
39% |
* ... smaller is better

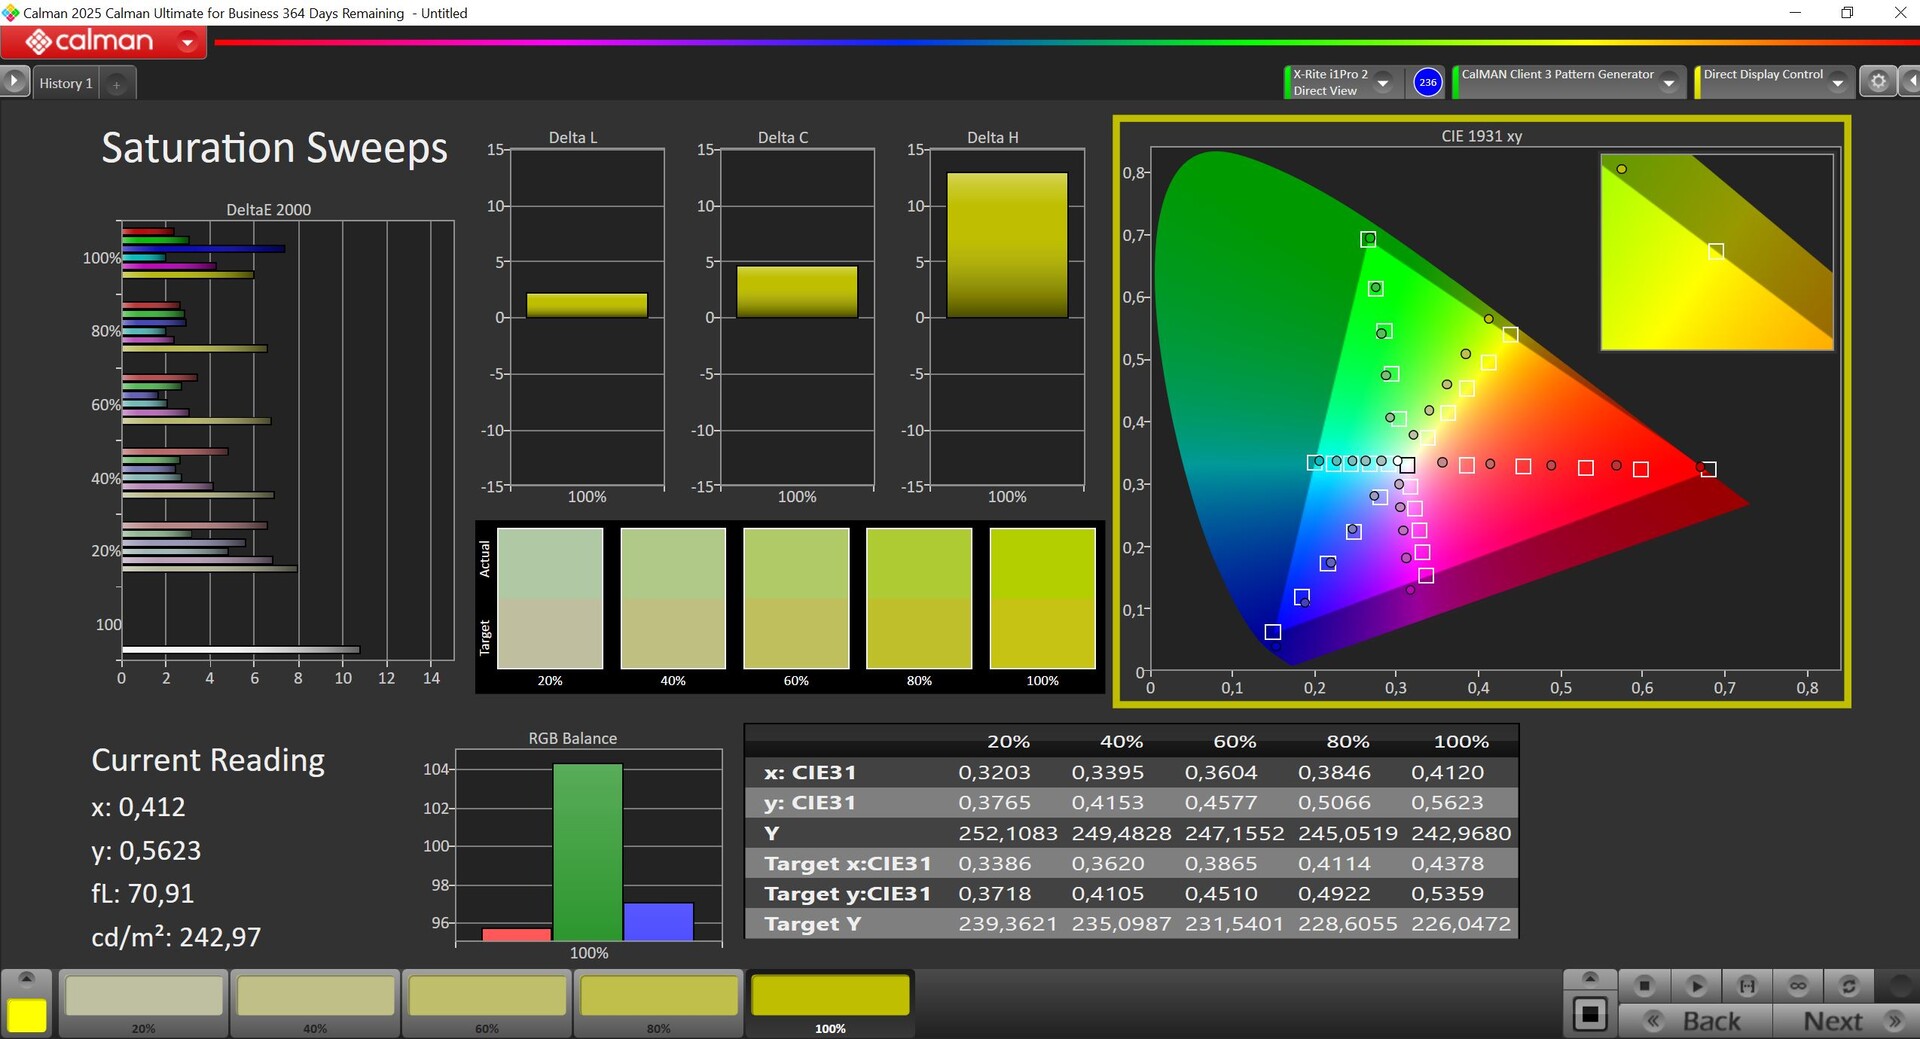


我们使用专业的 CalMAN 软件测试了该显示器,其出厂配置文件并不特别准确;我们注意到有明显的偏蓝现象,而且色温过低。不过,设备交付时可能会配备优化的配置文件,因为我们通过自己的校准大大改善了显示效果。即便如此,仍有一些色彩异常值。P3 色彩空间几乎完全覆盖。
Display Response Times
| ↔ Response Time Black to White | ||
|---|---|---|
| 24.3 ms ... rise ↗ and fall ↘ combined | ↗ 8.7 ms rise | 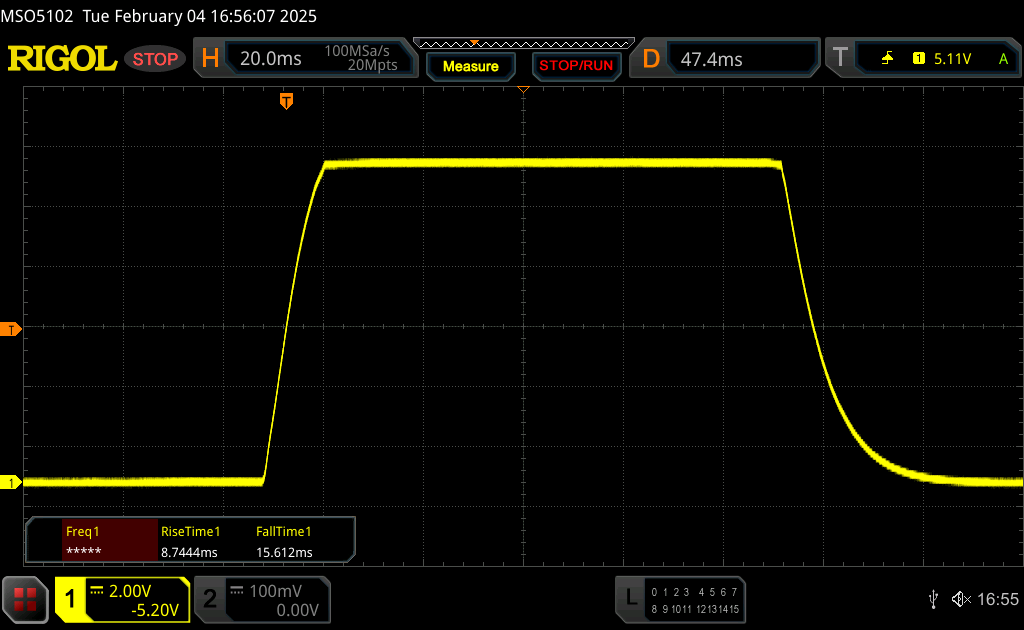 |
| ↘ 15.6 ms fall | ||
| The screen shows good response rates in our tests, but may be too slow for competitive gamers. In comparison, all tested devices range from 0.1 (minimum) to 240 (maximum) ms. » 54 % of all devices are better. This means that the measured response time is worse than the average of all tested devices (20.8 ms). | ||
| ↔ Response Time 50% Grey to 80% Grey | ||
| 51.5 ms ... rise ↗ and fall ↘ combined | ↗ 23.1 ms rise | 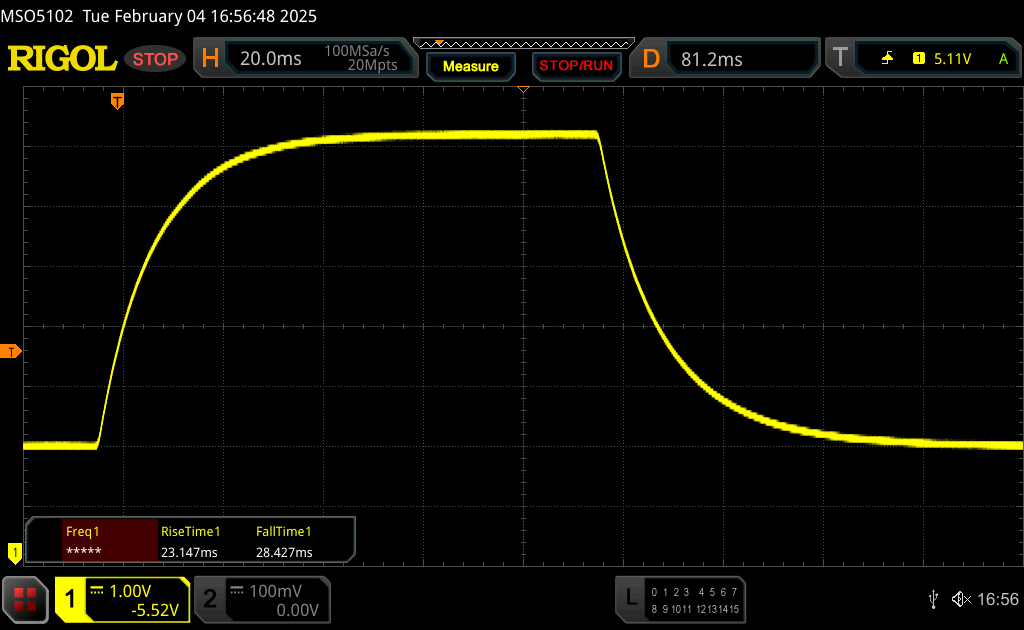 |
| ↘ 28.4 ms fall | ||
| The screen shows slow response rates in our tests and will be unsatisfactory for gamers. In comparison, all tested devices range from 0.165 (minimum) to 636 (maximum) ms. » 87 % of all devices are better. This means that the measured response time is worse than the average of all tested devices (32.5 ms). | ||
Screen Flickering / PWM (Pulse-Width Modulation)
| Screen flickering / PWM not detected |  | ||
In comparison: 53 % of all tested devices do not use PWM to dim the display. If PWM was detected, an average of 8519 (minimum: 5 - maximum: 343500) Hz was measured. | |||


在室外,高反光显示屏成为一个问题;只有坐在阴凉处,才能合理地工作。而在明亮的环境中,反光则会非常强烈。IPS 面板的视角稳定性不错。

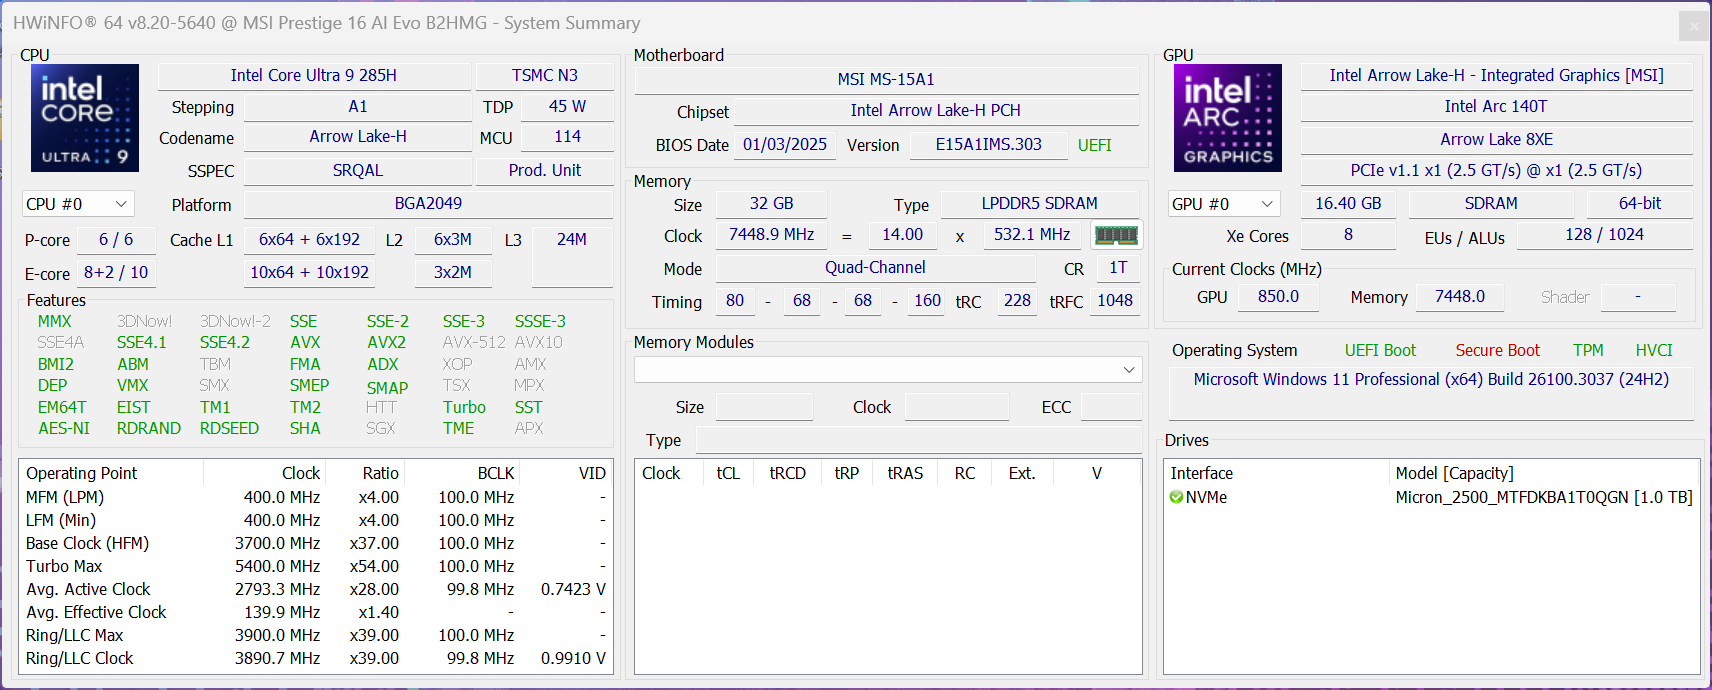
性能 - 绿箭湖-H,功率 115 瓦
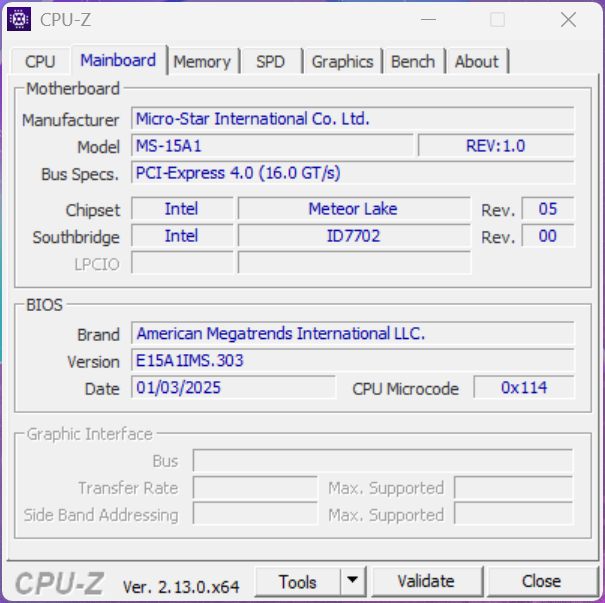
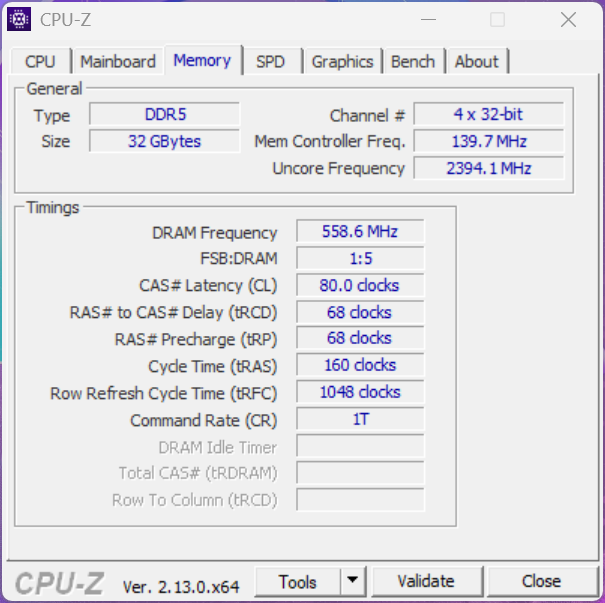
微星 Prestige 16 AI Evo 配备了全新的 Arrow Lake H 移动处理器(Core Ultra 200)。我们的测试设备配备 32 GB 内存(LPDDR5x-7500),无法升级。微星不提供专用显卡。
测试条件
预装的微星中心提供多种能源配置文件(Eco Silent、Balanced 和 Extreme Performance)供用户选择。此外,还有一个 AI 模式,但产生的结果不稳定。我们关闭了 AI 引擎,并使用默认激活的平衡模式进行了以下基准测试和测量。
| 能源概况 | CPU TDP | Cinebench 2024 Multi | Time Spy 图形 | 最大风扇噪音排放 |
|---|---|---|---|---|
| Eco Silent | 20/15 瓦 | 449 分 | 2,595 分 | 31 分贝(A) |
| 平衡型 | 115/45 瓦 | 991 分 | 4,194 分 | 42.1 分贝(A) |
| 极端性能 | 115/55 瓦 | 1,075 分 | 4,094 分 | 46.4 分贝(A) |
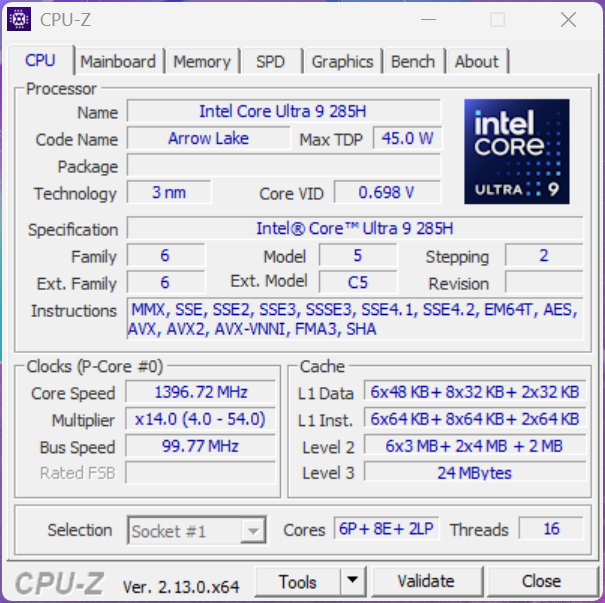
处理器 - Core Ultra 9 285H
酷睿 Ultra 9 285H 酷睿至尊 9 285H是英特尔箭湖 H 系列(Core Ultra 200)的全新顶级型号,也是流星湖一代的直接继承者。它共有 16 个 CPU 内核(22 个线程),其中 6 个高性能内核(包括超线程)的时钟频率最高可达 5.4 GHz。更多技术细节和效率比较请参见 我们的分析文章.
在 Prestige 16 内部,处理器的最大功耗在短时间内达到 115 瓦,但在连续负载情况下功耗缓慢下降,然后在我们的测试中稳定在 45 瓦。处理器的多核性能自然也因此受益,尤其是在短时间的负载阶段,但在连续负载情况下,其性能下降了 30%。不过,总体而言,测试设备仍能领先于竞争对手的 Core Ultra 9 185H在多核测试中,尽管功耗限制较高,但测试设备仍然领先于使用酷睿 Ultra 9 185H 的竞争对手。在单核测试中,它的性能提高了 12-14%,但酷睿至尊 9 285H 无法接近Apple 当前的 M4 芯片。该处理器在电池模式下的最大功耗为 42 瓦。更多基准测试请参见 我们的技术部分。
Cinebench R15 Multi continuous test
Cinebench R23: Multi Core | Single Core
Cinebench R20: CPU (Multi Core) | CPU (Single Core)
Cinebench R15: CPU Multi 64Bit | CPU Single 64Bit
Blender: v2.79 BMW27 CPU
7-Zip 18.03: 7z b 4 | 7z b 4 -mmt1
Geekbench 6.4: Multi-Core | Single-Core
Geekbench 5.5: Multi-Core | Single-Core
HWBOT x265 Benchmark v2.2: 4k Preset
LibreOffice : 20 Documents To PDF
R Benchmark 2.5: Overall mean
| CPU Performance Rating | |
| Apple MacBook Pro 16 2024 M4 Pro -12! | |
| MSI Prestige 16 AI Evo B2HMG | |
| Average Intel Core Ultra 9 285H | |
| Lenovo Yoga Pro 9 16IMH9 | |
| Lenovo ThinkBook 16 G7+ AMD | |
| Dell Precision 5690 | |
| MSI Prestige A16 AI+ A3HMG-036 | |
| Asus Zenbook S 16 UM5606-RK333W | |
| Average of class Multimedia | |
| Samsung Galaxy Book4 Pro 16 | |
| Cinebench R23 / Multi Core | |
| Apple MacBook Pro 16 2024 M4 Pro | |
| MSI Prestige 16 AI Evo B2HMG | |
| Lenovo Yoga Pro 9 16IMH9 | |
| Average Intel Core Ultra 9 285H (16632 - 22080, n=3) | |
| Dell Precision 5690 | |
| MSI Prestige A16 AI+ A3HMG-036 | |
| Lenovo ThinkBook 16 G7+ AMD | |
| Asus Zenbook S 16 UM5606-RK333W | |
| Average of class Multimedia (4861 - 30789, n=100, last 2 years) | |
| Samsung Galaxy Book4 Pro 16 | |
| Cinebench R23 / Single Core | |
| Apple MacBook Pro 16 2024 M4 Pro | |
| Average Intel Core Ultra 9 285H (2126 - 2163, n=3) | |
| MSI Prestige 16 AI Evo B2HMG | |
| Lenovo ThinkBook 16 G7+ AMD | |
| MSI Prestige A16 AI+ A3HMG-036 | |
| Asus Zenbook S 16 UM5606-RK333W | |
| Lenovo Yoga Pro 9 16IMH9 | |
| Dell Precision 5690 | |
| Average of class Multimedia (878 - 2290, n=91, last 2 years) | |
| Samsung Galaxy Book4 Pro 16 | |
| Cinebench R20 / CPU (Multi Core) | |
| MSI Prestige 16 AI Evo B2HMG | |
| Lenovo Yoga Pro 9 16IMH9 | |
| Average Intel Core Ultra 9 285H (6517 - 8251, n=3) | |
| Dell Precision 5690 | |
| Lenovo ThinkBook 16 G7+ AMD | |
| MSI Prestige A16 AI+ A3HMG-036 | |
| Asus Zenbook S 16 UM5606-RK333W | |
| Average of class Multimedia (1887 - 11924, n=84, last 2 years) | |
| Samsung Galaxy Book4 Pro 16 | |
| Cinebench R20 / CPU (Single Core) | |
| Average Intel Core Ultra 9 285H (810 - 827, n=3) | |
| MSI Prestige 16 AI Evo B2HMG | |
| Lenovo ThinkBook 16 G7+ AMD | |
| MSI Prestige A16 AI+ A3HMG-036 | |
| Asus Zenbook S 16 UM5606-RK333W | |
| Lenovo Yoga Pro 9 16IMH9 | |
| Dell Precision 5690 | |
| Samsung Galaxy Book4 Pro 16 | |
| Average of class Multimedia (341 - 853, n=84, last 2 years) | |
| Cinebench R15 / CPU Multi 64Bit | |
| MSI Prestige 16 AI Evo B2HMG | |
| Dell Precision 5690 | |
| Average Intel Core Ultra 9 285H (2797 - 3333, n=3) | |
| Lenovo Yoga Pro 9 16IMH9 | |
| Lenovo ThinkBook 16 G7+ AMD | |
| MSI Prestige A16 AI+ A3HMG-036 | |
| Samsung Galaxy Book4 Pro 16 | |
| Average of class Multimedia (856 - 5224, n=91, last 2 years) | |
| Asus Zenbook S 16 UM5606-RK333W | |
| Cinebench R15 / CPU Single 64Bit | |
| Average Intel Core Ultra 9 285H (313 - 318, n=3) | |
| MSI Prestige 16 AI Evo B2HMG | |
| Lenovo ThinkBook 16 G7+ AMD | |
| MSI Prestige A16 AI+ A3HMG-036 | |
| Asus Zenbook S 16 UM5606-RK333W | |
| Lenovo Yoga Pro 9 16IMH9 | |
| Dell Precision 5690 | |
| Average of class Multimedia (99.6 - 323, n=86, last 2 years) | |
| Samsung Galaxy Book4 Pro 16 | |
| Blender / v2.79 BMW27 CPU | |
| Average of class Multimedia (100 - 557, n=84, last 2 years) | |
| Samsung Galaxy Book4 Pro 16 | |
| Dell Precision 5690 | |
| MSI Prestige A16 AI+ A3HMG-036 | |
| MSI Prestige 16 AI Evo B2HMG | |
| Average Intel Core Ultra 9 285H (159 - 235, n=3) | |
| Asus Zenbook S 16 UM5606-RK333W | |
| Lenovo ThinkBook 16 G7+ AMD | |
| Lenovo Yoga Pro 9 16IMH9 | |
| 7-Zip 18.03 / 7z b 4 | |
| Lenovo Yoga Pro 9 16IMH9 | |
| Dell Precision 5690 | |
| Lenovo ThinkBook 16 G7+ AMD | |
| Asus Zenbook S 16 UM5606-RK333W | |
| Average of class Multimedia (29095 - 130368, n=79, last 2 years) | |
| Average Intel Core Ultra 9 285H (53335 - 69676, n=3) | |
| Samsung Galaxy Book4 Pro 16 | |
| MSI Prestige 16 AI Evo B2HMG | |
| MSI Prestige A16 AI+ A3HMG-036 | |
| 7-Zip 18.03 / 7z b 4 -mmt1 | |
| Average Intel Core Ultra 9 285H (5999 - 6138, n=3) | |
| Asus Zenbook S 16 UM5606-RK333W | |
| MSI Prestige A16 AI+ A3HMG-036 | |
| Lenovo ThinkBook 16 G7+ AMD | |
| MSI Prestige 16 AI Evo B2HMG | |
| Lenovo Yoga Pro 9 16IMH9 | |
| Average of class Multimedia (3398 - 7545, n=79, last 2 years) | |
| Samsung Galaxy Book4 Pro 16 | |
| Dell Precision 5690 | |
| Geekbench 6.4 / Multi-Core | |
| Apple MacBook Pro 16 2024 M4 Pro | |
| MSI Prestige 16 AI Evo B2HMG | |
| Average Intel Core Ultra 9 285H (15330 - 17992, n=5) | |
| Lenovo ThinkBook 16 G7+ AMD | |
| MSI Prestige A16 AI+ A3HMG-036 | |
| Dell Precision 5690 | |
| Lenovo Yoga Pro 9 16IMH9 | |
| Asus Zenbook S 16 UM5606-RK333W | |
| Average of class Multimedia (4983 - 25760, n=77, last 2 years) | |
| Samsung Galaxy Book4 Pro 16 | |
| Geekbench 6.4 / Single-Core | |
| Apple MacBook Pro 16 2024 M4 Pro | |
| MSI Prestige 16 AI Evo B2HMG | |
| Average Intel Core Ultra 9 285H (2665 - 3110, n=5) | |
| MSI Prestige A16 AI+ A3HMG-036 | |
| Asus Zenbook S 16 UM5606-RK333W | |
| Lenovo ThinkBook 16 G7+ AMD | |
| Average of class Multimedia (1534 - 3927, n=73, last 2 years) | |
| Lenovo Yoga Pro 9 16IMH9 | |
| Dell Precision 5690 | |
| Samsung Galaxy Book4 Pro 16 | |
| Geekbench 5.5 / Multi-Core | |
| MSI Prestige 16 AI Evo B2HMG | |
| Average Intel Core Ultra 9 285H (14243 - 16626, n=3) | |
| Dell Precision 5690 | |
| Lenovo Yoga Pro 9 16IMH9 | |
| Lenovo ThinkBook 16 G7+ AMD | |
| MSI Prestige A16 AI+ A3HMG-036 | |
| Asus Zenbook S 16 UM5606-RK333W | |
| Average of class Multimedia (4652 - 23059, n=83, last 2 years) | |
| Samsung Galaxy Book4 Pro 16 | |
| Geekbench 5.5 / Single-Core | |
| MSI Prestige 16 AI Evo B2HMG | |
| Asus Zenbook S 16 UM5606-RK333W | |
| Lenovo ThinkBook 16 G7+ AMD | |
| MSI Prestige A16 AI+ A3HMG-036 | |
| Average Intel Core Ultra 9 285H (1982 - 2108, n=3) | |
| Lenovo Yoga Pro 9 16IMH9 | |
| Dell Precision 5690 | |
| Average of class Multimedia (891 - 2555, n=83, last 2 years) | |
| Samsung Galaxy Book4 Pro 16 | |
| HWBOT x265 Benchmark v2.2 / 4k Preset | |
| MSI Prestige 16 AI Evo B2HMG | |
| Average Intel Core Ultra 9 285H (18.8 - 25.9, n=3) | |
| Lenovo Yoga Pro 9 16IMH9 | |
| Lenovo ThinkBook 16 G7+ AMD | |
| Dell Precision 5690 | |
| Asus Zenbook S 16 UM5606-RK333W | |
| MSI Prestige A16 AI+ A3HMG-036 | |
| Average of class Multimedia (5.26 - 34.3, n=78, last 2 years) | |
| Samsung Galaxy Book4 Pro 16 | |
| LibreOffice / 20 Documents To PDF | |
| MSI Prestige A16 AI+ A3HMG-036 | |
| Lenovo ThinkBook 16 G7+ AMD | |
| Average of class Multimedia (23.9 - 146.7, n=80, last 2 years) | |
| Asus Zenbook S 16 UM5606-RK333W | |
| Average Intel Core Ultra 9 285H (42.8 - 52.1, n=3) | |
| MSI Prestige 16 AI Evo B2HMG | |
| Dell Precision 5690 | |
| Samsung Galaxy Book4 Pro 16 | |
| Lenovo Yoga Pro 9 16IMH9 | |
| R Benchmark 2.5 / Overall mean | |
| Average of class Multimedia (0.3604 - 0.947, n=78, last 2 years) | |
| Samsung Galaxy Book4 Pro 16 | |
| Dell Precision 5690 | |
| Lenovo Yoga Pro 9 16IMH9 | |
| MSI Prestige 16 AI Evo B2HMG | |
| Average Intel Core Ultra 9 285H (0.427 - 0.4343, n=3) | |
| Asus Zenbook S 16 UM5606-RK333W | |
| Lenovo ThinkBook 16 G7+ AMD | |
| MSI Prestige A16 AI+ A3HMG-036 | |
* ... smaller is better
AIDA64: FP32 Ray-Trace | FPU Julia | CPU SHA3 | CPU Queen | FPU SinJulia | FPU Mandel | CPU AES | CPU ZLib | FP64 Ray-Trace | CPU PhotoWorxx
| Performance Rating | |
| Lenovo ThinkBook 16 G7+ AMD | |
| MSI Prestige A16 AI+ A3HMG-036 | |
| Asus Zenbook S 16 UM5606-RK333W | |
| Average Intel Core Ultra 9 285H | |
| MSI Prestige 16 AI Evo B2HMG | |
| Average of class Multimedia | |
| Samsung Galaxy Book4 Pro 16 | |
| AIDA64 / FP32 Ray-Trace | |
| Lenovo ThinkBook 16 G7+ AMD | |
| MSI Prestige A16 AI+ A3HMG-036 | |
| Asus Zenbook S 16 UM5606-RK333W | |
| Average Intel Core Ultra 9 285H (15160 - 23492, n=3) | |
| MSI Prestige 16 AI Evo B2HMG | |
| Average of class Multimedia (5121 - 50388, n=77, last 2 years) | |
| Samsung Galaxy Book4 Pro 16 | |
| AIDA64 / FPU Julia | |
| Lenovo ThinkBook 16 G7+ AMD | |
| MSI Prestige A16 AI+ A3HMG-036 | |
| Asus Zenbook S 16 UM5606-RK333W | |
| Average Intel Core Ultra 9 285H (78572 - 116017, n=3) | |
| MSI Prestige 16 AI Evo B2HMG | |
| Average of class Multimedia (14528 - 201874, n=78, last 2 years) | |
| Samsung Galaxy Book4 Pro 16 | |
| AIDA64 / CPU SHA3 | |
| Lenovo ThinkBook 16 G7+ AMD | |
| MSI Prestige A16 AI+ A3HMG-036 | |
| Asus Zenbook S 16 UM5606-RK333W | |
| Average Intel Core Ultra 9 285H (3695 - 5206, n=3) | |
| MSI Prestige 16 AI Evo B2HMG | |
| Average of class Multimedia (1188 - 8623, n=78, last 2 years) | |
| Samsung Galaxy Book4 Pro 16 | |
| AIDA64 / CPU Queen | |
| Average of class Multimedia (21547 - 181505, n=78, last 2 years) | |
| MSI Prestige A16 AI+ A3HMG-036 | |
| Lenovo ThinkBook 16 G7+ AMD | |
| Asus Zenbook S 16 UM5606-RK333W | |
| Samsung Galaxy Book4 Pro 16 | |
| MSI Prestige 16 AI Evo B2HMG | |
| Average Intel Core Ultra 9 285H (61461 - 66818, n=3) | |
| AIDA64 / FPU SinJulia | |
| Asus Zenbook S 16 UM5606-RK333W | |
| Lenovo ThinkBook 16 G7+ AMD | |
| MSI Prestige A16 AI+ A3HMG-036 | |
| Average of class Multimedia (1240 - 28794, n=78, last 2 years) | |
| Samsung Galaxy Book4 Pro 16 | |
| Average Intel Core Ultra 9 285H (7275 - 9089, n=3) | |
| MSI Prestige 16 AI Evo B2HMG | |
| AIDA64 / FPU Mandel | |
| Lenovo ThinkBook 16 G7+ AMD | |
| MSI Prestige A16 AI+ A3HMG-036 | |
| Asus Zenbook S 16 UM5606-RK333W | |
| Average Intel Core Ultra 9 285H (40946 - 61884, n=3) | |
| MSI Prestige 16 AI Evo B2HMG | |
| Average of class Multimedia (9903 - 105740, n=77, last 2 years) | |
| Samsung Galaxy Book4 Pro 16 | |
| AIDA64 / CPU AES | |
| Average of class Multimedia (26066 - 169946, n=78, last 2 years) | |
| Samsung Galaxy Book4 Pro 16 | |
| Average Intel Core Ultra 9 285H (58110 - 79949, n=3) | |
| Lenovo ThinkBook 16 G7+ AMD | |
| Asus Zenbook S 16 UM5606-RK333W | |
| MSI Prestige 16 AI Evo B2HMG | |
| MSI Prestige A16 AI+ A3HMG-036 | |
| AIDA64 / CPU ZLib | |
| Lenovo ThinkBook 16 G7+ AMD | |
| MSI Prestige A16 AI+ A3HMG-036 | |
| Asus Zenbook S 16 UM5606-RK333W | |
| Average Intel Core Ultra 9 285H (886 - 1233, n=3) | |
| MSI Prestige 16 AI Evo B2HMG | |
| Samsung Galaxy Book4 Pro 16 | |
| Average of class Multimedia (440 - 2022, n=78, last 2 years) | |
| AIDA64 / FP64 Ray-Trace | |
| Lenovo ThinkBook 16 G7+ AMD | |
| MSI Prestige A16 AI+ A3HMG-036 | |
| Asus Zenbook S 16 UM5606-RK333W | |
| Average Intel Core Ultra 9 285H (7741 - 12887, n=3) | |
| MSI Prestige 16 AI Evo B2HMG | |
| Average of class Multimedia (2759 - 26875, n=78, last 2 years) | |
| Samsung Galaxy Book4 Pro 16 | |
| AIDA64 / CPU PhotoWorxx | |
| MSI Prestige 16 AI Evo B2HMG | |
| Average Intel Core Ultra 9 285H (58622 - 58848, n=3) | |
| Samsung Galaxy Book4 Pro 16 | |
| MSI Prestige A16 AI+ A3HMG-036 | |
| Lenovo ThinkBook 16 G7+ AMD | |
| Asus Zenbook S 16 UM5606-RK333W | |
| Average of class Multimedia (12860 - 58844, n=78, last 2 years) | |
系统性能
我们的测试设备在系统基准测试中表现出色,被证明是一款反应非常灵敏的笔记本电脑,但这同样适用于其他对比设备。
CrossMark: Overall | Productivity | Creativity | Responsiveness
WebXPRT 3: Overall
WebXPRT 4: Overall
Mozilla Kraken 1.1: Total
| PCMark 10 / Score | |
| MSI Prestige 16 AI Evo B2HMG | |
| Average Intel Core Ultra 9 285H, Intel Arc Graphics 140T (7514 - 7838, n=2) | |
| MSI Prestige A16 AI+ A3HMG-036 | |
| Lenovo ThinkBook 16 G7+ AMD | |
| Asus Zenbook S 16 UM5606-RK333W | |
| Average of class Multimedia (4325 - 8670, n=72, last 2 years) | |
| Samsung Galaxy Book4 Pro 16 | |
| PCMark 10 / Essentials | |
| MSI Prestige 16 AI Evo B2HMG | |
| Samsung Galaxy Book4 Pro 16 | |
| Average Intel Core Ultra 9 285H, Intel Arc Graphics 140T (10931 - 11171, n=2) | |
| MSI Prestige A16 AI+ A3HMG-036 | |
| Asus Zenbook S 16 UM5606-RK333W | |
| Lenovo ThinkBook 16 G7+ AMD | |
| Average of class Multimedia (8025 - 12420, n=72, last 2 years) | |
| PCMark 10 / Productivity | |
| Asus Zenbook S 16 UM5606-RK333W | |
| MSI Prestige A16 AI+ A3HMG-036 | |
| Lenovo ThinkBook 16 G7+ AMD | |
| MSI Prestige 16 AI Evo B2HMG | |
| Average Intel Core Ultra 9 285H, Intel Arc Graphics 140T (8818 - 9594, n=2) | |
| Average of class Multimedia (6089 - 10615, n=72, last 2 years) | |
| Samsung Galaxy Book4 Pro 16 | |
| PCMark 10 / Digital Content Creation | |
| MSI Prestige 16 AI Evo B2HMG | |
| Average Intel Core Ultra 9 285H, Intel Arc Graphics 140T (11948 - 12193, n=2) | |
| Lenovo ThinkBook 16 G7+ AMD | |
| MSI Prestige A16 AI+ A3HMG-036 | |
| Asus Zenbook S 16 UM5606-RK333W | |
| Average of class Multimedia (3651 - 13548, n=72, last 2 years) | |
| Samsung Galaxy Book4 Pro 16 | |
| CrossMark / Overall | |
| MSI Prestige 16 AI Evo B2HMG | |
| Apple MacBook Pro 16 2024 M4 Pro | |
| Average Intel Core Ultra 9 285H, Intel Arc Graphics 140T (1812 - 2173, n=2) | |
| Samsung Galaxy Book4 Pro 16 | |
| Asus Zenbook S 16 UM5606-RK333W | |
| Lenovo ThinkBook 16 G7+ AMD | |
| MSI Prestige A16 AI+ A3HMG-036 | |
| Average of class Multimedia (866 - 2255, n=85, last 2 years) | |
| CrossMark / Productivity | |
| MSI Prestige 16 AI Evo B2HMG | |
| Apple MacBook Pro 16 2024 M4 Pro | |
| Average Intel Core Ultra 9 285H, Intel Arc Graphics 140T (1693 - 2050, n=2) | |
| Samsung Galaxy Book4 Pro 16 | |
| Average of class Multimedia (913 - 2050, n=85, last 2 years) | |
| Asus Zenbook S 16 UM5606-RK333W | |
| Lenovo ThinkBook 16 G7+ AMD | |
| MSI Prestige A16 AI+ A3HMG-036 | |
| CrossMark / Creativity | |
| Apple MacBook Pro 16 2024 M4 Pro | |
| MSI Prestige 16 AI Evo B2HMG | |
| Average Intel Core Ultra 9 285H, Intel Arc Graphics 140T (2125 - 2377, n=2) | |
| MSI Prestige A16 AI+ A3HMG-036 | |
| Lenovo ThinkBook 16 G7+ AMD | |
| Asus Zenbook S 16 UM5606-RK333W | |
| Average of class Multimedia (907 - 2795, n=85, last 2 years) | |
| Samsung Galaxy Book4 Pro 16 | |
| CrossMark / Responsiveness | |
| MSI Prestige 16 AI Evo B2HMG | |
| Average Intel Core Ultra 9 285H, Intel Arc Graphics 140T (1375 - 1981, n=2) | |
| Apple MacBook Pro 16 2024 M4 Pro | |
| Samsung Galaxy Book4 Pro 16 | |
| Average of class Multimedia (605 - 2094, n=85, last 2 years) | |
| Asus Zenbook S 16 UM5606-RK333W | |
| Lenovo ThinkBook 16 G7+ AMD | |
| MSI Prestige A16 AI+ A3HMG-036 | |
| WebXPRT 3 / Overall | |
| Apple MacBook Pro 16 2024 M4 Pro | |
| MSI Prestige 16 AI Evo B2HMG | |
| Asus Zenbook S 16 UM5606-RK333W | |
| Average of class Multimedia (136.4 - 545, n=83, last 2 years) | |
| Average Intel Core Ultra 9 285H, Intel Arc Graphics 140T (280 - 358, n=2) | |
| Lenovo ThinkBook 16 G7+ AMD | |
| MSI Prestige A16 AI+ A3HMG-036 | |
| Samsung Galaxy Book4 Pro 16 | |
| WebXPRT 4 / Overall | |
| Apple MacBook Pro 16 2024 M4 Pro | |
| MSI Prestige A16 AI+ A3HMG-036 | |
| MSI Prestige 16 AI Evo B2HMG | |
| Average Intel Core Ultra 9 285H, Intel Arc Graphics 140T (254 - 324, n=2) | |
| Average of class Multimedia (133.2 - 353, n=77, last 2 years) | |
| Asus Zenbook S 16 UM5606-RK333W | |
| Samsung Galaxy Book4 Pro 16 | |
| Lenovo ThinkBook 16 G7+ AMD | |
| Mozilla Kraken 1.1 / Total | |
| Samsung Galaxy Book4 Pro 16 | |
| Average of class Multimedia (254 - 1016, n=88, last 2 years) | |
| Average Intel Core Ultra 9 285H, Intel Arc Graphics 140T (422 - 464, n=2) | |
| Asus Zenbook S 16 UM5606-RK333W | |
| MSI Prestige A16 AI+ A3HMG-036 | |
| Lenovo ThinkBook 16 G7+ AMD | |
| MSI Prestige 16 AI Evo B2HMG | |
| Apple MacBook Pro 16 2024 M4 Pro | |
* ... smaller is better
| PCMark 10 Score | 7838 points | |
Help | ||
| AIDA64 / Memory Copy | |
| MSI Prestige 16 AI Evo B2HMG | |
| Average Intel Core Ultra 9 285H (88278 - 97612, n=3) | |
| Samsung Galaxy Book4 Pro 16 | |
| Asus Zenbook S 16 UM5606-RK333W | |
| MSI Prestige A16 AI+ A3HMG-036 | |
| Lenovo ThinkBook 16 G7+ AMD | |
| Average of class Multimedia (21158 - 104459, n=78, last 2 years) | |
| AIDA64 / Memory Read | |
| Asus Zenbook S 16 UM5606-RK333W | |
| Lenovo ThinkBook 16 G7+ AMD | |
| MSI Prestige A16 AI+ A3HMG-036 | |
| Samsung Galaxy Book4 Pro 16 | |
| MSI Prestige 16 AI Evo B2HMG | |
| Average Intel Core Ultra 9 285H (78309 - 80277, n=3) | |
| Average of class Multimedia (24312 - 125604, n=78, last 2 years) | |
| AIDA64 / Memory Write | |
| Asus Zenbook S 16 UM5606-RK333W | |
| Lenovo ThinkBook 16 G7+ AMD | |
| MSI Prestige A16 AI+ A3HMG-036 | |
| Samsung Galaxy Book4 Pro 16 | |
| Average of class Multimedia (23679 - 117933, n=78, last 2 years) | |
| Average Intel Core Ultra 9 285H (62446 - 75619, n=3) | |
| MSI Prestige 16 AI Evo B2HMG | |
| AIDA64 / Memory Latency | |
| MSI Prestige 16 AI Evo B2HMG | |
| Average Intel Core Ultra 9 285H (128.7 - 133.1, n=3) | |
| MSI Prestige A16 AI+ A3HMG-036 | |
| Samsung Galaxy Book4 Pro 16 | |
| Lenovo ThinkBook 16 G7+ AMD | |
| Asus Zenbook S 16 UM5606-RK333W | |
| Average of class Multimedia (7 - 346, n=78, last 2 years) | |
* ... smaller is better
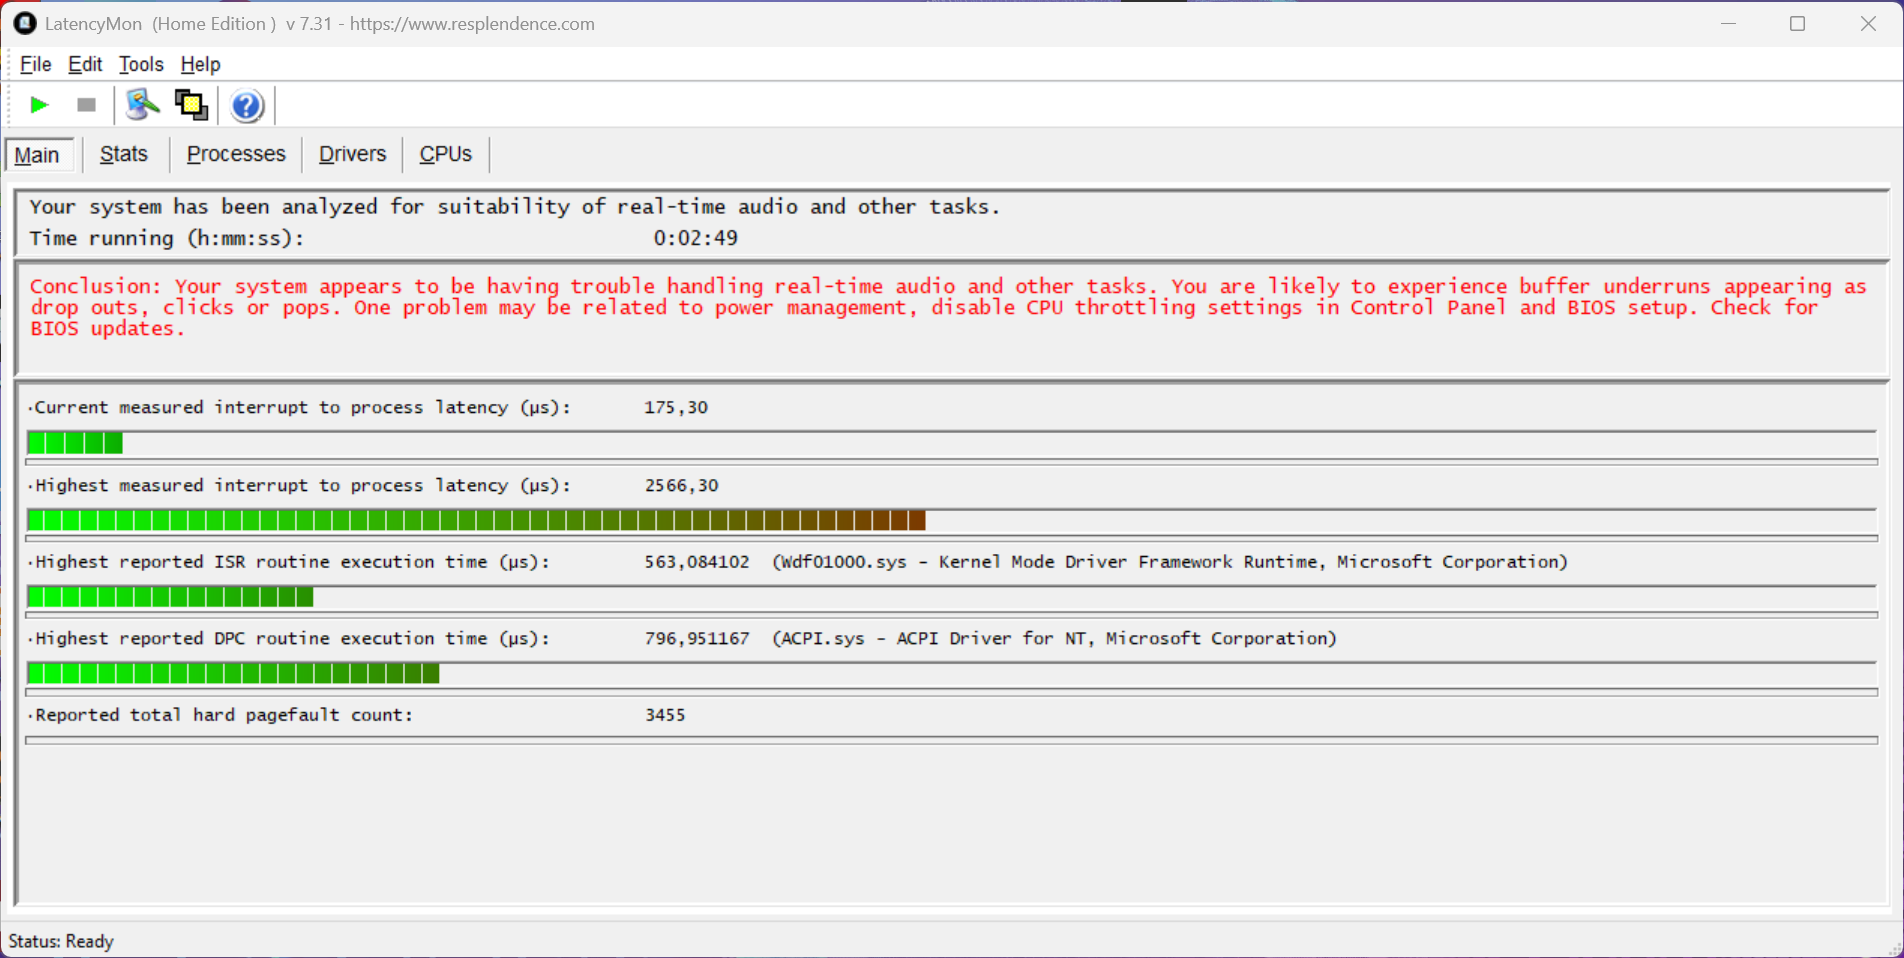
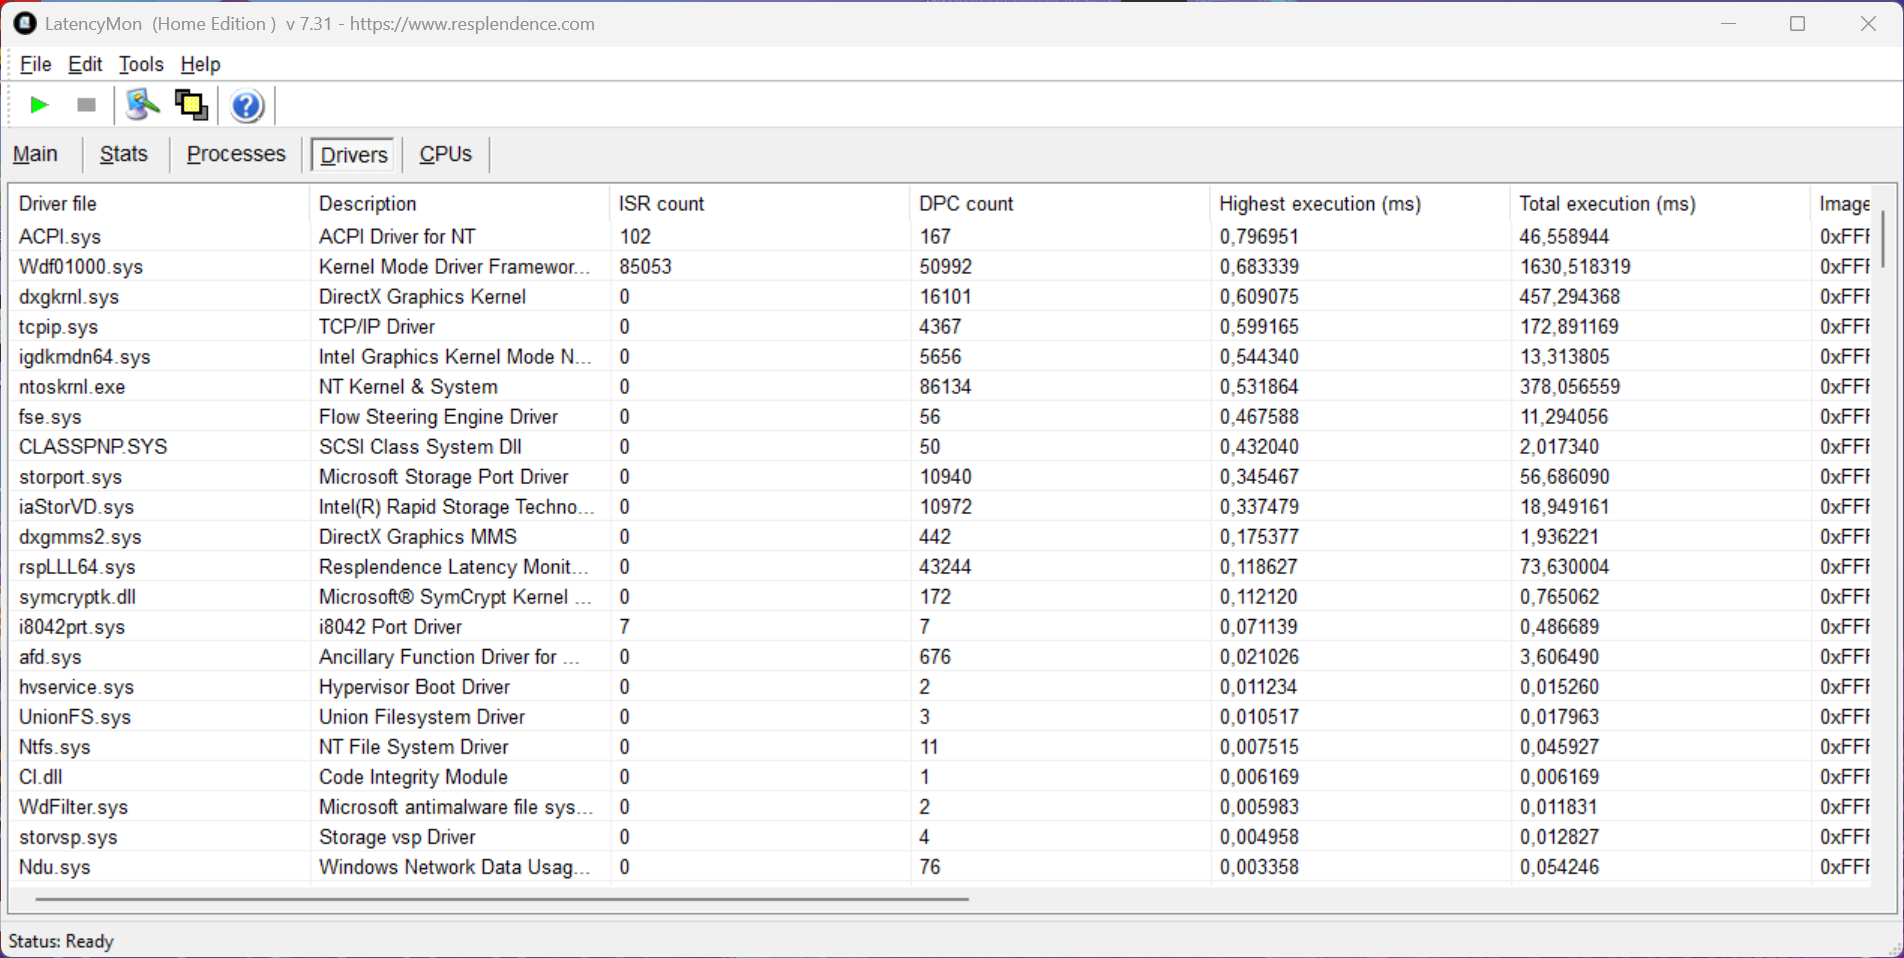
DPC 延迟
在我们的标准化延迟测试(网上冲浪、4K YouTube 播放、CPU 负载)中,使用当前 BIOS 版本的测试设备在使用实时音频应用程序时表现出了局限性。
| DPC Latencies / LatencyMon - interrupt to process latency (max), Web, Youtube, Prime95 | |
| MSI Prestige 16 AI Evo B2HMG | |
| Samsung Galaxy Book4 Pro 16 | |
| Lenovo ThinkBook 16 G7+ AMD | |
| MSI Prestige A16 AI+ A3HMG-036 | |
* ... smaller is better
存储设备
微星笔记本电脑配备了两个完整的 M.2 2280 固态硬盘插槽,我们的测试设备安装了美光 2500 的 1 TB 版本。首次启动设备后,用户可以使用 884 GB 的容量。在我们的测试中,PCIe 4.0 固态硬盘的性能非常出色,即使在持续负载的情况下也能保持完全稳定。更多固态硬盘基准测试结果请点击 这里.

* ... smaller is better
Reading continuous performance: DiskSpd Read Loop, Queue Depth 8
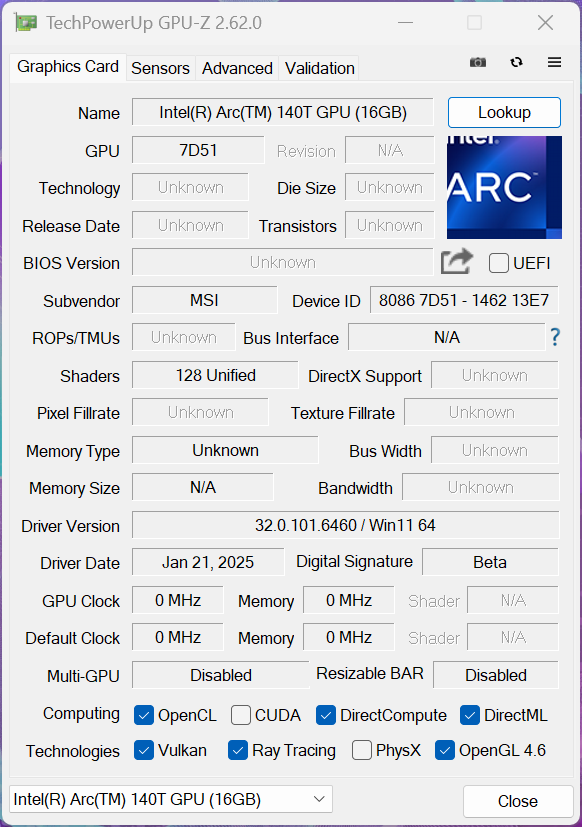
图形卡
新 Core Ultra 9 285H配备了 Arc Graphics 140T与 弧形图形 140V的本质区别。140V 使用的是第二代 Xe 内核,而 140T 则是第一代 Arc Graphics 的改进版,拥有 8 个 Xe 内核,曾用于 Meteor Lake 芯片。Lunar Lake 芯片的工作功耗限制明显降低,但如果从最快的变体来看,140T/140V 之间的性能并无重大差异。其 GPU 性能在连续负载下保持稳定,在电池模式下性能仅有极小的下降(约 5%)。
驱动程序似乎也还没有完全开发出来,因为我们注意到不同的基准测试会有明显的差异。在某些情况下,新的 140T 几乎比旧的 Arc Graphics 快不了多少,但在某些测试中,新的 140T 比旧的 Arc Graphics 快了 20% 以上。这也适用于与当前 AMD Radeon 880M/890MiGPU 进行比较。在我们的标准游戏测试中,这种情况再次出现,平均性能提高了约 20%。除了我们熟悉的 XeSS 升频外,新 GPU 现在还支持特定游戏中的帧生成功能。我们在运行《F1 2024》时尝试了这一功能,并记录了性能的大幅提升,我们将其记录在下表中。值得注意的是,"帧生成 "技术也可以在没有 XeSS 升频的情况下使用。有关其技术和效率的更多详情,请参阅 我们的分析文章.
| 原生 | 帧生成 | XeSS 质量 | XeSS 质量 + 帧生成 | |
|---|---|---|---|---|
| F1 24 1080p 高分辨率 | 59 FPS | 87 FPS | 73 FPS | 105 FPS |
| F1 24 1080p 超 | 20 FPS | 36 FPS | 32 FPS | 56 FPS |
| 3DMark 11 - 1280x720 Performance GPU | |
| Average of class Multimedia (3765 - 60250, n=78, last 2 years) | |
| Lenovo ThinkBook 16 G7+ AMD | |
| MSI Prestige A16 AI+ A3HMG-036 | |
| Asus Zenbook S 16 UM5606-RK333W | |
| Average Intel Arc Graphics 140T (12445 - 14932, n=3) | |
| MSI Prestige 16 AI Evo B2HMG | |
| Samsung Galaxy Book4 Pro 16 | |
| Asus Zenbook S 14 UX5406 Core Ultra 9 | |
| 3DMark | |
| 1920x1080 Fire Strike Graphics | |
| Average of class Multimedia (2328 - 46022, n=81, last 2 years) | |
| Asus Zenbook S 14 UX5406 Core Ultra 9 | |
| Lenovo ThinkBook 16 G7+ AMD | |
| Average Intel Arc Graphics 140T (9173 - 10299, n=3) | |
| MSI Prestige A16 AI+ A3HMG-036 | |
| MSI Prestige 16 AI Evo B2HMG | |
| Samsung Galaxy Book4 Pro 16 | |
| Asus Zenbook S 16 UM5606-RK333W | |
| 2560x1440 Time Spy Graphics | |
| Average of class Multimedia (696 - 17620, n=82, last 2 years) | |
| Asus Zenbook S 14 UX5406 Core Ultra 9 | |
| MSI Prestige 16 AI Evo B2HMG | |
| Average Intel Arc Graphics 140T (4074 - 4212, n=3) | |
| MSI Prestige A16 AI+ A3HMG-036 | |
| Lenovo ThinkBook 16 G7+ AMD | |
| Samsung Galaxy Book4 Pro 16 | |
| Asus Zenbook S 16 UM5606-RK333W | |
| Steel Nomad Light Score | |
| Apple MacBook Pro 16 2024 M4 Pro | |
| Average of class Multimedia (1147 - 13989, n=30, last 2 years) | |
| MSI Prestige 16 AI Evo B2HMG | |
| Average Intel Arc Graphics 140T (3620 - 3692, n=3) | |
| Asus Zenbook S 14 UX5406 Core Ultra 9 | |
| Lenovo ThinkBook 16 G7+ AMD | |
| Asus Zenbook S 16 UM5606-RK333W | |
| 3DMark 06 Standard Score | 48766 points | |
| 3DMark Vantage P Result | 58039 points | |
| 3DMark 11 Performance | 13286 points | |
| 3DMark Ice Storm Standard Score | 227616 points | |
| 3DMark Cloud Gate Standard Score | 40950 points | |
| 3DMark Fire Strike Score | 8721 points | |
| 3DMark Time Spy Score | 4639 points | |
| 3DMark Steel Nomad Score | 919 points | |
| 3DMark Steel Nomad Light Score | 3692 points | |
Help | ||
| Blender / v3.3 Classroom CPU | |
| Average of class Multimedia (160 - 1042, n=84, last 2 years) | |
| Samsung Galaxy Book4 Pro 16 | |
| Average Intel Arc Graphics 140T (295 - 417, n=3) | |
| MSI Prestige 16 AI Evo B2HMG | |
| MSI Prestige A16 AI+ A3HMG-036 | |
| Asus Zenbook S 16 UM5606-RK333W | |
| Lenovo ThinkBook 16 G7+ AMD | |
* ... smaller is better
| Performance Rating - Percent | |
| Average of class Multimedia | |
| Lenovo ThinkBook 16 G7+ AMD | |
| Asus Zenbook S 14 UX5406 Core Ultra 9 | |
| MSI Prestige 16 AI Evo B2HMG | |
| MSI Prestige A16 AI+ A3HMG-036 | |
| Asus Zenbook S 16 UM5606-RK333W | |
| Samsung Galaxy Book4 Pro 16 -1! | |
| Cyberpunk 2077 2.2 Phantom Liberty - 1920x1080 Ultra Preset (FSR off) | |
| Average of class Multimedia (8.26 - 86, n=63, last 2 years) | |
| Asus Zenbook S 14 UX5406 Core Ultra 9 | |
| MSI Prestige 16 AI Evo B2HMG | |
| Lenovo ThinkBook 16 G7+ AMD | |
| MSI Prestige A16 AI+ A3HMG-036 | |
| Asus Zenbook S 16 UM5606-RK333W | |
| Samsung Galaxy Book4 Pro 16 | |
| Baldur's Gate 3 - 1920x1080 Ultra Preset | |
| Average of class Multimedia (9.1 - 117.7, n=51, last 2 years) | |
| Lenovo ThinkBook 16 G7+ AMD | |
| Asus Zenbook S 14 UX5406 Core Ultra 9 | |
| MSI Prestige A16 AI+ A3HMG-036 | |
| MSI Prestige 16 AI Evo B2HMG | |
| Asus Zenbook S 16 UM5606-RK333W | |
| GTA V - 1920x1080 Highest Settings possible AA:4xMSAA + FX AF:16x | |
| Average of class Multimedia (9.38 - 141.6, n=81, last 2 years) | |
| Lenovo ThinkBook 16 G7+ AMD | |
| MSI Prestige A16 AI+ A3HMG-036 | |
| Asus Zenbook S 16 UM5606-RK333W | |
| Asus Zenbook S 14 UX5406 Core Ultra 9 | |
| MSI Prestige 16 AI Evo B2HMG | |
| Samsung Galaxy Book4 Pro 16 | |
| Final Fantasy XV Benchmark - 1920x1080 High Quality | |
| Average of class Multimedia (7.61 - 141.8, n=82, last 2 years) | |
| Asus Zenbook S 14 UX5406 Core Ultra 9 | |
| Lenovo ThinkBook 16 G7+ AMD | |
| MSI Prestige 16 AI Evo B2HMG | |
| MSI Prestige A16 AI+ A3HMG-036 | |
| Asus Zenbook S 16 UM5606-RK333W | |
| Samsung Galaxy Book4 Pro 16 | |
| Strange Brigade - 1920x1080 ultra AA:ultra AF:16 | |
| Average of class Multimedia (13.3 - 233, n=81, last 2 years) | |
| MSI Prestige 16 AI Evo B2HMG | |
| Asus Zenbook S 14 UX5406 Core Ultra 9 | |
| Lenovo ThinkBook 16 G7+ AMD | |
| MSI Prestige A16 AI+ A3HMG-036 | |
| Asus Zenbook S 16 UM5606-RK333W | |
| Samsung Galaxy Book4 Pro 16 | |
| Dota 2 Reborn - 1920x1080 ultra (3/3) best looking | |
| Average of class Multimedia (29 - 179.9, n=83, last 2 years) | |
| Lenovo ThinkBook 16 G7+ AMD | |
| MSI Prestige 16 AI Evo B2HMG | |
| Asus Zenbook S 14 UX5406 Core Ultra 9 | |
| Samsung Galaxy Book4 Pro 16 | |
| MSI Prestige A16 AI+ A3HMG-036 | |
| Asus Zenbook S 16 UM5606-RK333W | |
| X-Plane 11.11 - 1920x1080 high (fps_test=3) | |
| Average of class Multimedia (16.9 - 141.1, n=80, last 2 years) | |
| Lenovo ThinkBook 16 G7+ AMD | |
| Asus Zenbook S 16 UM5606-RK333W | |
| MSI Prestige A16 AI+ A3HMG-036 | |
| MSI Prestige 16 AI Evo B2HMG | |
| Asus Zenbook S 14 UX5406 Core Ultra 9 | |
| Samsung Galaxy Book4 Pro 16 | |
Cyberpunk 2077 ultra FPS diagram
| low | med. | high | ultra | |
|---|---|---|---|---|
| GTA V (2015) | 156.4 | 152.3 | 43.2 | 17 |
| Dota 2 Reborn (2015) | 107.7 | 84.7 | 76.8 | 83.8 |
| Final Fantasy XV Benchmark (2018) | 90.1 | 47.9 | 30.6 | |
| X-Plane 11.11 (2018) | 55.7 | 45.1 | 38.4 | |
| Far Cry 5 (2018) | 87 | 48 | 44 | 42 |
| Strange Brigade (2018) | 216 | 90.9 | 75.1 | 61.6 |
| Baldur's Gate 3 (2023) | 40.9 | 31.4 | 26.9 | 26.4 |
| Cyberpunk 2077 2.2 Phantom Liberty (2023) | 41.7 | 34.7 | 29.7 | 27.3 |
| F1 24 (2024) | 82.3 | 74.1 | 58.9 | 19.9 |
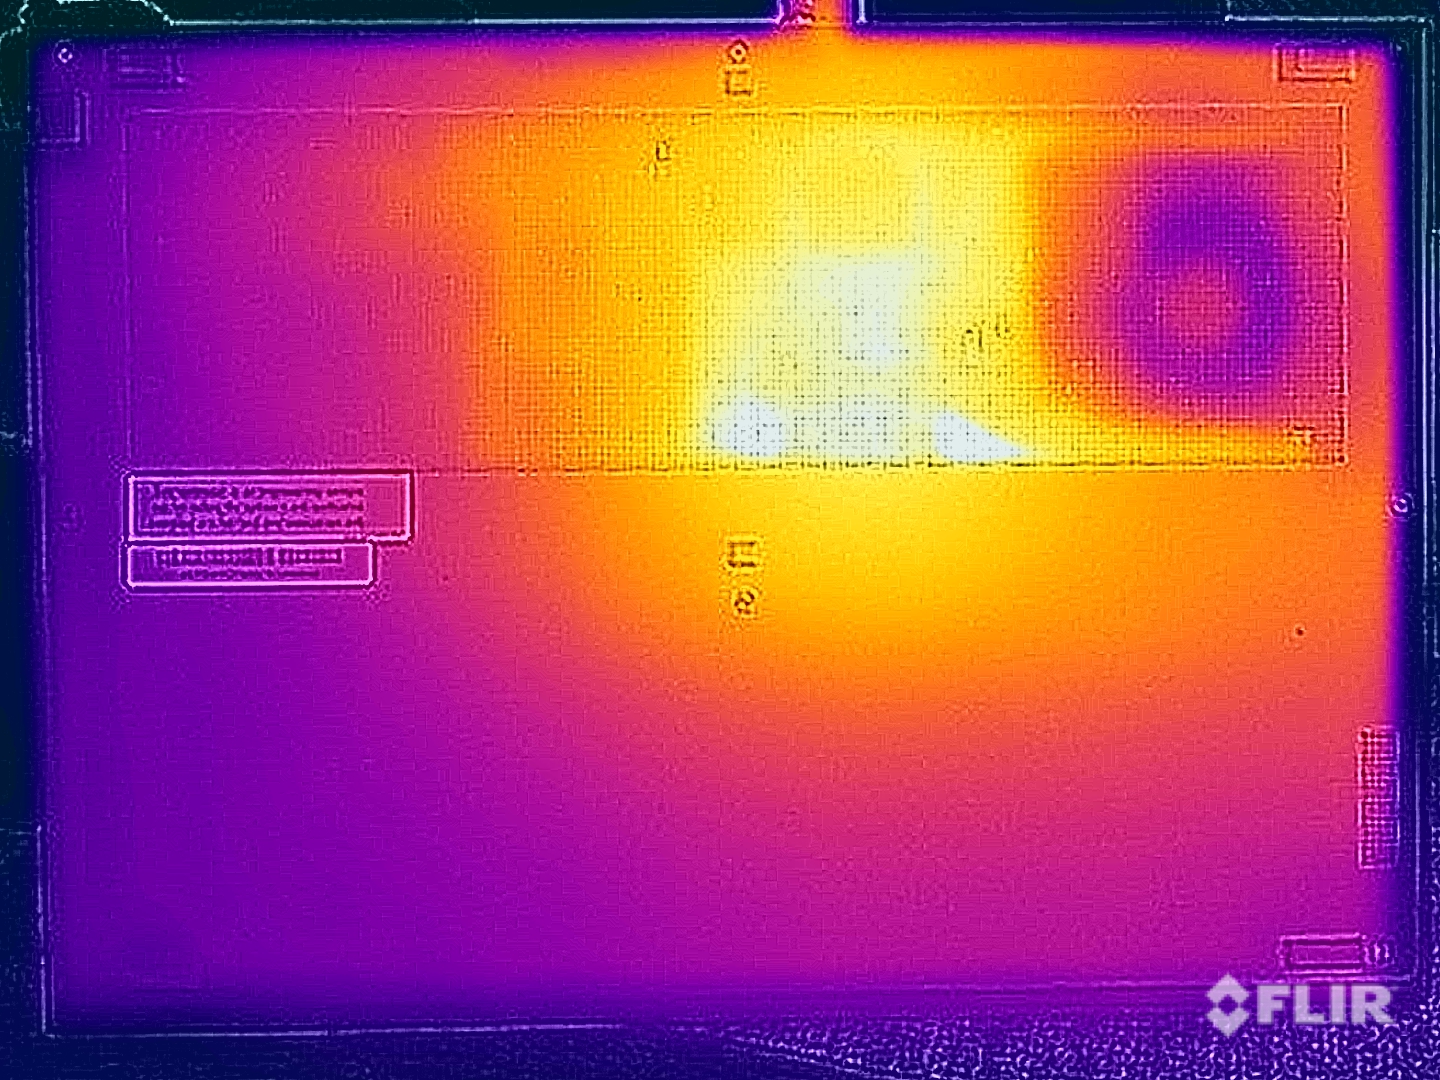
排放 - 只有一个风扇的微星Prestige
噪音排放
Prestige 只配备了一个风扇,鉴于其功率限制较高,这当然并不理想。在日常使用中,风扇的启动速度相对较快,但在平衡模式下执行简单任务时却相当安静。在较高负载下,我们仅测得 42 dB(A)。在 "极致性能 "模式下,我们测得的噪音高达 46 分贝(A),由于转速较高,噪音明显比平衡模式下更大。在生态静音模式下,我们测得的最大值为 31 dB(A),但其性能也明显较低。我们的测试设备上没有其他电子噪音。
Lunar Lake 机型的风扇由于功率限制较低,性能应该会好得多,但我们认为,微星在 Arrow Lake 机型中安装第二个风扇,错过了提供更安静设备的机会。
Noise Level
| Idle |
| 23.6 / 23.6 / 26.2 dB(A) |
| Load |
| 37.1 / 42.1 dB(A) |
 | ||
30 dB silent 40 dB(A) audible 50 dB(A) loud |
||
min: | ||
| MSI Prestige 16 AI Evo B2HMG Arc 140T, Ultra 9 285H, Micron 2500 1TB MTFDKBA1T0QGN | Lenovo ThinkBook 16 G7+ AMD Radeon 880M, Ryzen AI 9 365, Samsung PM9C1a MZAL81T0HDLB | MSI Prestige A16 AI+ A3HMG-036 Radeon 880M, Ryzen AI 9 365, Samsung PM9C1 MZVL81T0HELB-00BTW | Apple MacBook Pro 16 2024 M4 Pro M4 Pro 20-Core GPU, M4 Pro (14 cores), Apple SSD AP2048Z | Asus Zenbook S 16 UM5606-RK333W Radeon 890M, Ryzen AI 9 HX 370, Micron 2400 MTFDKBA1T0QFM | Samsung Galaxy Book4 Pro 16 Arc 8-Core, Ultra 7 155H, Samsung PM9B1 512GB MZVL4512HBLU | |
|---|---|---|---|---|---|---|
| Noise | 0% | 1% | 8% | 2% | -3% | |
| off / environment * | 23.6 | 24.5 -4% | 23 3% | 24 -2% | 24.7 -5% | 24.6 -4% |
| Idle Minimum * | 23.6 | 24.5 -4% | 23 3% | 24 -2% | 24.7 -5% | 24.6 -4% |
| Idle Average * | 23.6 | 24.5 -4% | 23 3% | 24 -2% | 24.7 -5% | 24.6 -4% |
| Idle Maximum * | 26.2 | 25.9 1% | 25.02 5% | 24 8% | 26.4 -1% | 26.4 -1% |
| Load Average * | 37.1 | 36.2 2% | 41.88 -13% | 25.3 32% | 35.7 4% | 40 -8% |
| Cyberpunk 2077 ultra * | 42.1 | 40.1 5% | 39.79 5% | 33.9 19% | 36.8 13% | |
| Load Maximum * | 42.1 | 40.1 5% | 41.88 1% | 42.3 -0% | 36.8 13% | 40 5% |
| Witcher 3 ultra * | 40 |
* ... smaller is better
温度
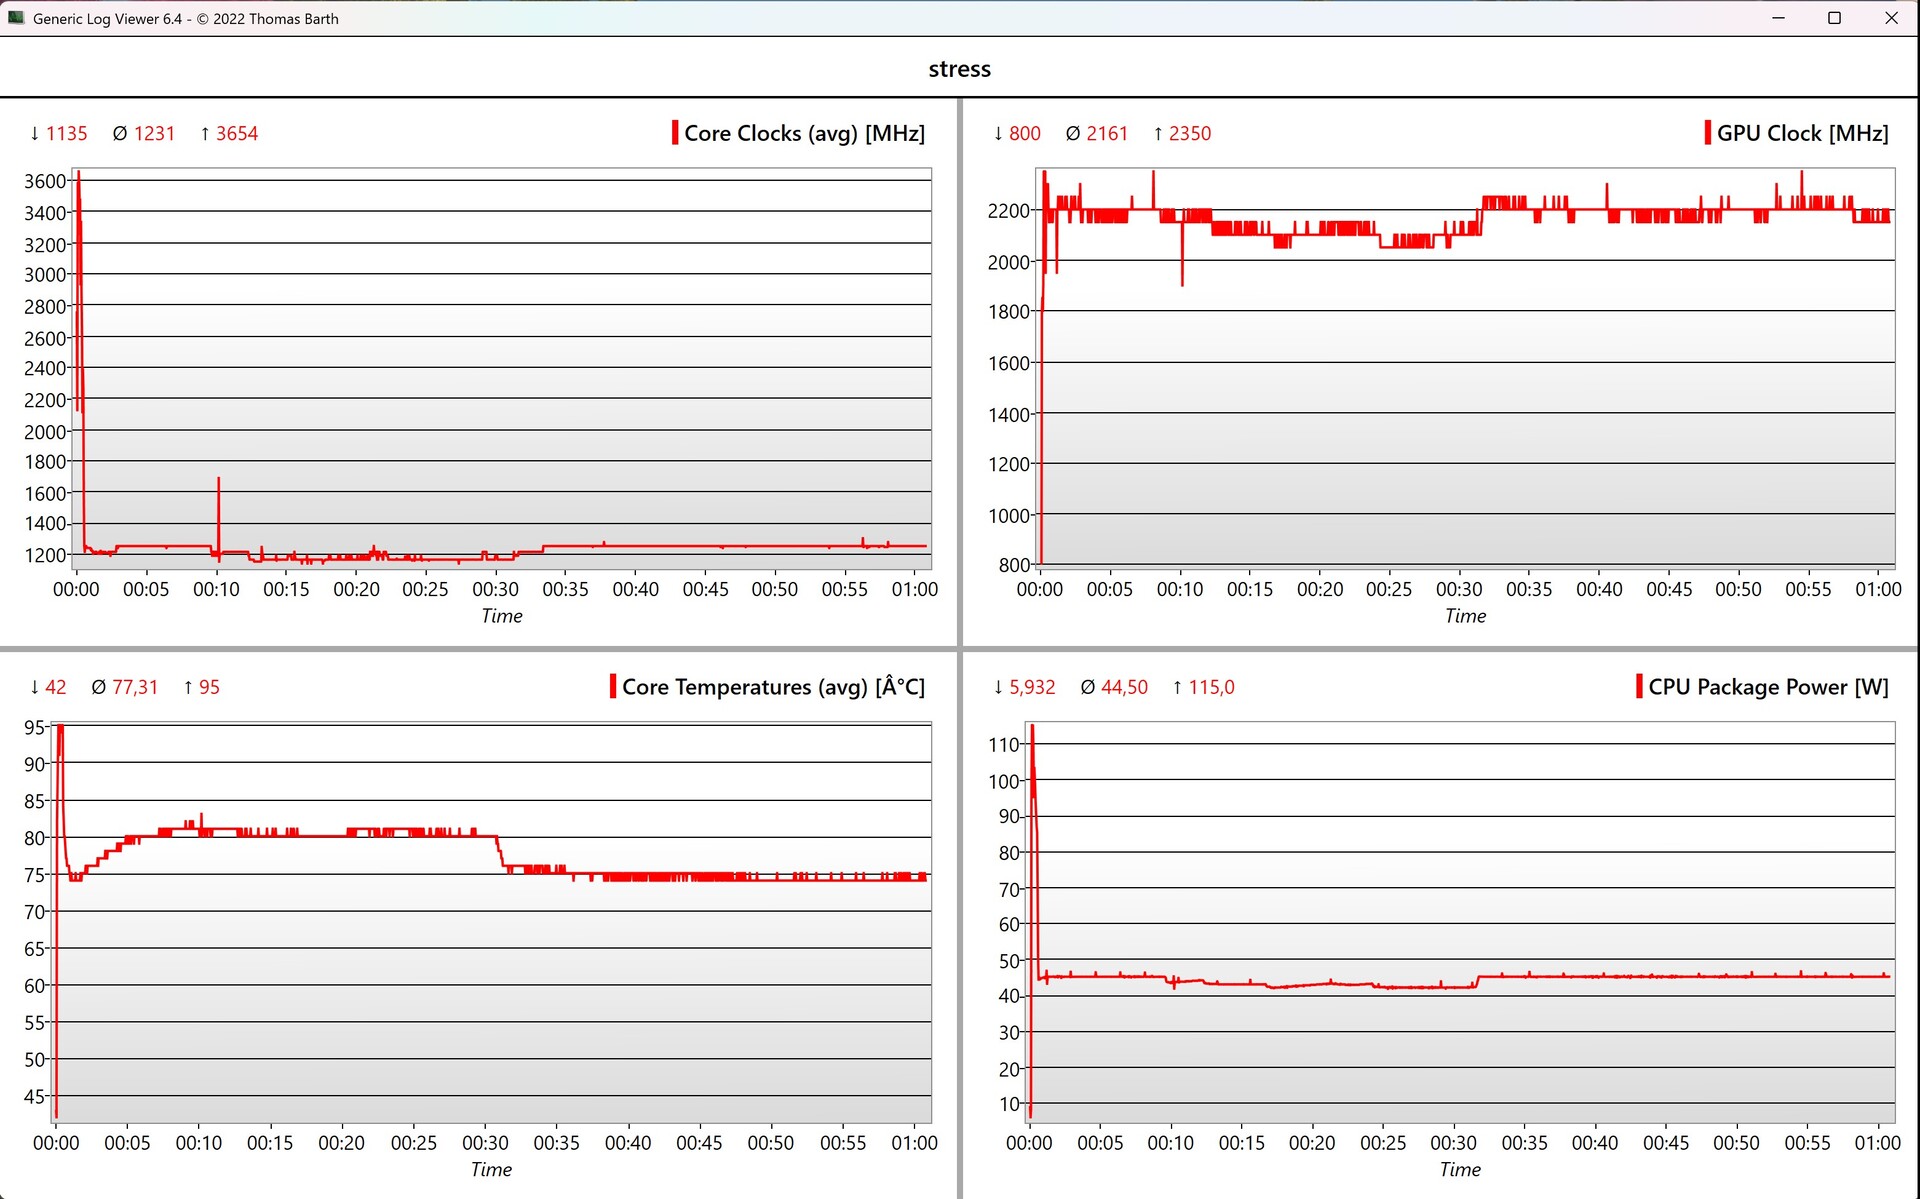
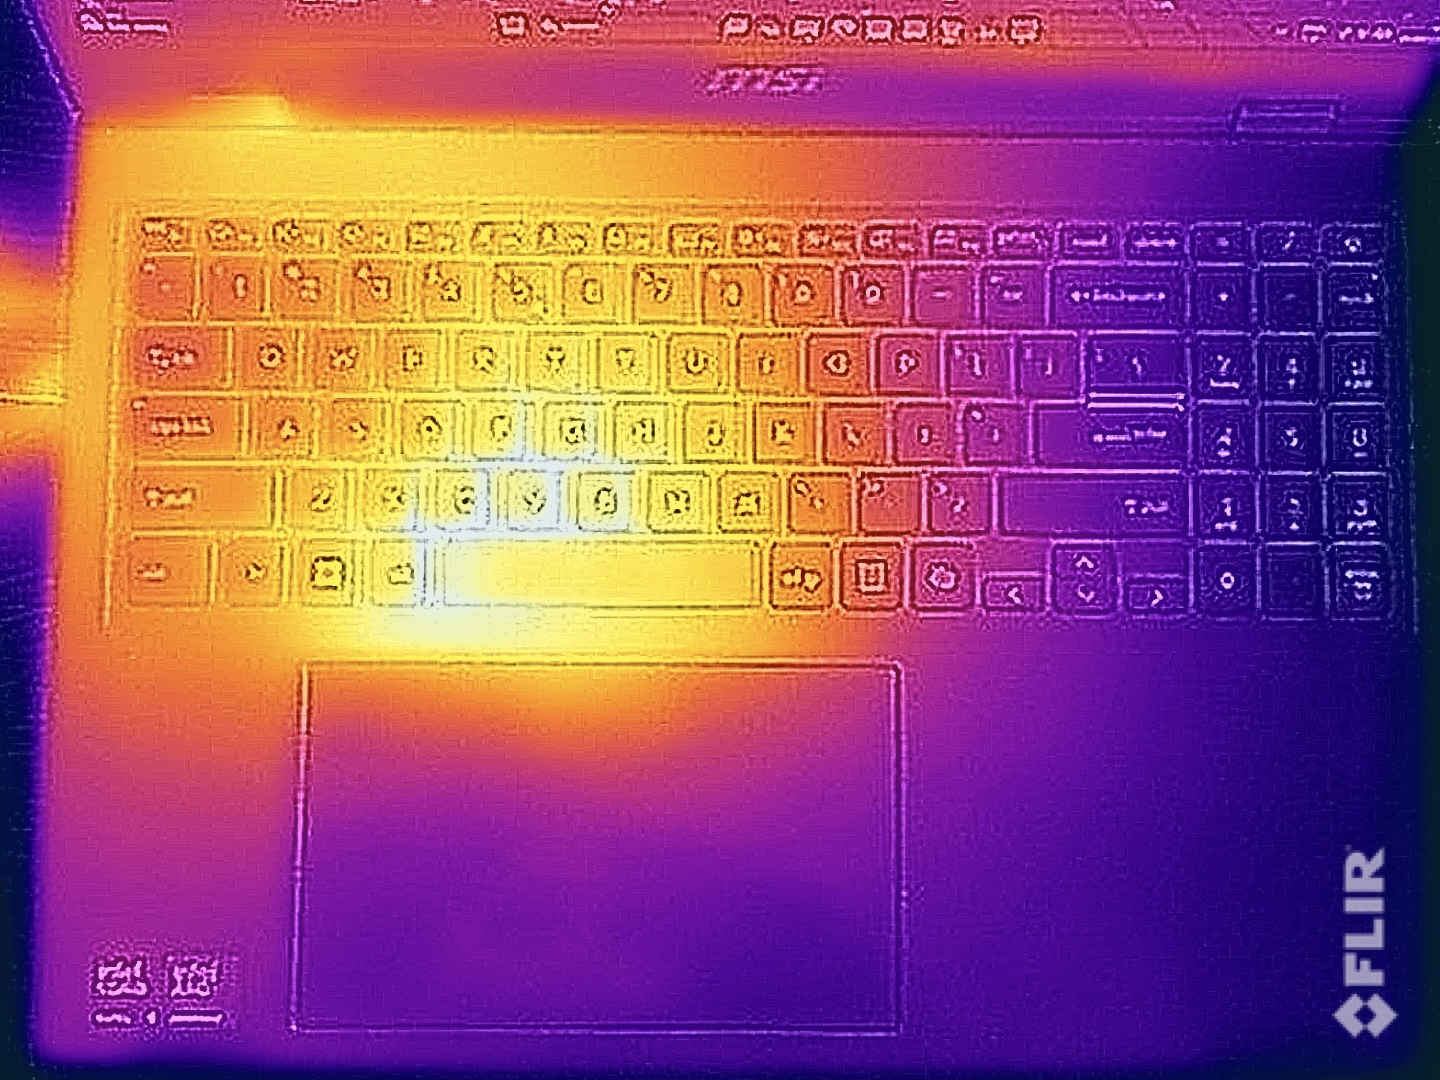
在空闲模式和执行简单任务时,笔记本电脑的机箱保持非常凉爽,但在负载情况下,单侧散热就变得非常明显。只有左半部分发热,上半部分高达 48 °C,下半部分甚至高达 51 °C。这导致打字时手指非常热,在这种情况下,你不应该把电脑放在大腿上。这也说明单风扇在使用 Arrow Lake 芯片时遇到了一些困难。在压力测试中,115 瓦的功率只出现了很短的时间,但与纯 CPU 负载相比,这一数值随后迅速降至 45 瓦,并保持在这一水平。
(-) The maximum temperature on the upper side is 48.1 °C / 119 F, compared to the average of 36.9 °C / 98 F, ranging from 21.1 to 71 °C for the class Multimedia.
(-) The bottom heats up to a maximum of 51.6 °C / 125 F, compared to the average of 39.2 °C / 103 F
(+) In idle usage, the average temperature for the upper side is 24.3 °C / 76 F, compared to the device average of 31.3 °C / 88 F.
(±) 3: The average temperature for the upper side is 37.1 °C / 99 F, compared to the average of 31.3 °C / 88 F for the class Multimedia.
(+) The palmrests and touchpad are reaching skin temperature as a maximum (33.1 °C / 91.6 F) and are therefore not hot.
(-) The average temperature of the palmrest area of similar devices was 28.8 °C / 83.8 F (-4.3 °C / -7.8 F).
| MSI Prestige 16 AI Evo B2HMG Intel Core Ultra 9 285H, Intel Arc Graphics 140T | Lenovo ThinkBook 16 G7+ AMD AMD Ryzen AI 9 365, AMD Radeon 880M | MSI Prestige A16 AI+ A3HMG-036 AMD Ryzen AI 9 365, AMD Radeon 880M | Apple MacBook Pro 16 2024 M4 Pro Apple M4 Pro (14 cores), Apple M4 Pro 20-Core GPU | Asus Zenbook S 16 UM5606-RK333W AMD Ryzen AI 9 HX 370, AMD Radeon 890M | Samsung Galaxy Book4 Pro 16 Intel Core Ultra 7 155H, Intel Arc 8-Core iGPU | |
|---|---|---|---|---|---|---|
| Heat | 12% | -3% | 15% | -9% | 10% | |
| Maximum Upper Side * | 48.1 | 38.2 21% | 52 -8% | 42.7 11% | 46.9 2% | 40.9 15% |
| Maximum Bottom * | 51.6 | 37.9 27% | 44 15% | 43.1 16% | 53.5 -4% | 42.6 17% |
| Idle Upper Side * | 25.9 | 25.4 2% | 28 -8% | 21.5 17% | 29.5 -14% | 24.5 5% |
| Idle Bottom * | 25.2 | 25.7 -2% | 28 -11% | 21.5 15% | 30.2 -20% | 24.8 2% |
* ... smaller is better
发言人
Prestige 16 的两个立体声扬声器音量很大,但整体音效略显不足。播放声音时,清晰的高音让人受益匪浅,但播放音乐或电影时,就显得有些力不从心了。
MSI Prestige 16 AI Evo B2HMG audio analysis
(+) | speakers can play relatively loud (86.6 dB)
Bass 100 - 315 Hz
(-) | nearly no bass - on average 18.4% lower than median
(±) | linearity of bass is average (7.9% delta to prev. frequency)
Mids 400 - 2000 Hz
(+) | balanced mids - only 4.3% away from median
(+) | mids are linear (4.6% delta to prev. frequency)
Highs 2 - 16 kHz
(+) | balanced highs - only 3.8% away from median
(+) | highs are linear (3% delta to prev. frequency)
Overall 100 - 16.000 Hz
(+) | overall sound is linear (13% difference to median)
Compared to same class
» 22% of all tested devices in this class were better, 5% similar, 74% worse
» The best had a delta of 5%, average was 18%, worst was 45%
Compared to all devices tested
» 11% of all tested devices were better, 2% similar, 86% worse
» The best had a delta of 4%, average was 24%, worst was 134%
Lenovo ThinkBook 16 G7+ AMD audio analysis
(±) | speaker loudness is average but good (74.8 dB)
Bass 100 - 315 Hz
(-) | nearly no bass - on average 16.5% lower than median
(±) | linearity of bass is average (13.1% delta to prev. frequency)
Mids 400 - 2000 Hz
(+) | balanced mids - only 3.5% away from median
(+) | mids are linear (5.9% delta to prev. frequency)
Highs 2 - 16 kHz
(+) | balanced highs - only 1.6% away from median
(+) | highs are linear (5% delta to prev. frequency)
Overall 100 - 16.000 Hz
(±) | linearity of overall sound is average (16% difference to median)
Compared to same class
» 37% of all tested devices in this class were better, 6% similar, 57% worse
» The best had a delta of 5%, average was 18%, worst was 45%
Compared to all devices tested
» 23% of all tested devices were better, 5% similar, 72% worse
» The best had a delta of 4%, average was 24%, worst was 134%
MSI Prestige A16 AI+ A3HMG-036 audio analysis
(+) | speakers can play relatively loud (82.02 dB)
Bass 100 - 315 Hz
(-) | nearly no bass - on average 23.7% lower than median
(±) | linearity of bass is average (12.3% delta to prev. frequency)
Mids 400 - 2000 Hz
(±) | higher mids - on average 6.2% higher than median
(±) | linearity of mids is average (7.5% delta to prev. frequency)
Highs 2 - 16 kHz
(±) | higher highs - on average 5.6% higher than median
(+) | highs are linear (5.1% delta to prev. frequency)
Overall 100 - 16.000 Hz
(±) | linearity of overall sound is average (21.7% difference to median)
Compared to same class
» 75% of all tested devices in this class were better, 4% similar, 20% worse
» The best had a delta of 5%, average was 18%, worst was 45%
Compared to all devices tested
» 59% of all tested devices were better, 7% similar, 34% worse
» The best had a delta of 4%, average was 24%, worst was 134%
Apple MacBook Pro 16 2024 M4 Pro audio analysis
(+) | speakers can play relatively loud (84.6 dB)
Bass 100 - 315 Hz
(±) | reduced bass - on average 5.1% lower than median
(+) | bass is linear (5.6% delta to prev. frequency)
Mids 400 - 2000 Hz
(+) | balanced mids - only 1.4% away from median
(+) | mids are linear (2.4% delta to prev. frequency)
Highs 2 - 16 kHz
(+) | balanced highs - only 1.7% away from median
(+) | highs are linear (3% delta to prev. frequency)
Overall 100 - 16.000 Hz
(+) | overall sound is linear (4.8% difference to median)
Compared to same class
» 0% of all tested devices in this class were better, 1% similar, 99% worse
» The best had a delta of 5%, average was 18%, worst was 45%
Compared to all devices tested
» 0% of all tested devices were better, 0% similar, 100% worse
» The best had a delta of 4%, average was 24%, worst was 134%
Asus Zenbook S 16 UM5606-RK333W audio analysis
(±) | speaker loudness is average but good (79.7 dB)
Bass 100 - 315 Hz
(±) | reduced bass - on average 9.7% lower than median
(±) | linearity of bass is average (8.3% delta to prev. frequency)
Mids 400 - 2000 Hz
(+) | balanced mids - only 2.7% away from median
(+) | mids are linear (4.8% delta to prev. frequency)
Highs 2 - 16 kHz
(+) | balanced highs - only 3.7% away from median
(+) | highs are linear (4.6% delta to prev. frequency)
Overall 100 - 16.000 Hz
(+) | overall sound is linear (12.2% difference to median)
Compared to same class
» 18% of all tested devices in this class were better, 4% similar, 79% worse
» The best had a delta of 5%, average was 18%, worst was 45%
Compared to all devices tested
» 8% of all tested devices were better, 2% similar, 89% worse
» The best had a delta of 4%, average was 24%, worst was 134%
Samsung Galaxy Book4 Pro 16 audio analysis
(+) | speakers can play relatively loud (83.4 dB)
Bass 100 - 315 Hz
(±) | reduced bass - on average 12.4% lower than median
(±) | linearity of bass is average (11.4% delta to prev. frequency)
Mids 400 - 2000 Hz
(+) | balanced mids - only 4.7% away from median
(+) | mids are linear (4.7% delta to prev. frequency)
Highs 2 - 16 kHz
(+) | balanced highs - only 3.1% away from median
(+) | highs are linear (5.4% delta to prev. frequency)
Overall 100 - 16.000 Hz
(+) | overall sound is linear (12.5% difference to median)
Compared to same class
» 19% of all tested devices in this class were better, 3% similar, 77% worse
» The best had a delta of 5%, average was 18%, worst was 45%
Compared to all devices tested
» 9% of all tested devices were better, 2% similar, 88% worse
» The best had a delta of 4%, average was 24%, worst was 134%
电源管理 - 出色的电池续航时间
耗电量
对于一款 16 英寸笔记本电脑来说,它的空闲测量值非常低,这当然部分归功于它的 60 赫兹显示屏。不过,在负载情况下,它的高功率限制似乎存在问题,因为在多核负载情况下,仅处理器的功耗就高达 115 瓦,100 瓦的电源供应不足也就不足为奇了。这意味着电池必须在短时间内使用才能满足耗电需求,而这对电池来说无疑是最理想的。大约 20 秒后,其功耗降至 88 瓦,然后又降至 70 瓦左右。
| Off / Standby | |
| Idle | |
| Load |
|
Key:
min: | |
| MSI Prestige 16 AI Evo B2HMG Ultra 9 285H, Arc 140T, Micron 2500 1TB MTFDKBA1T0QGN, IPS, 2560x1600, 16" | Lenovo ThinkBook 16 G7+ AMD Ryzen AI 9 365, Radeon 880M, Samsung PM9C1a MZAL81T0HDLB, IPS, 3200x2000, 16" | MSI Prestige A16 AI+ A3HMG-036 Ryzen AI 9 365, Radeon 880M, Samsung PM9C1 MZVL81T0HELB-00BTW, IPS, 2560x1600, 16" | Apple MacBook Pro 16 2024 M4 Pro M4 Pro (14 cores), M4 Pro 20-Core GPU, Apple SSD AP2048Z, Mini-LED, 3456x2234, 16.2" | Asus Zenbook S 16 UM5606-RK333W Ryzen AI 9 HX 370, Radeon 890M, Micron 2400 MTFDKBA1T0QFM, OLED, 2880x1800, 16" | Samsung Galaxy Book4 Pro 16 Ultra 7 155H, Arc 8-Core, Samsung PM9B1 512GB MZVL4512HBLU, OLED, 2880x1800, 16" | Average Intel Arc Graphics 140T | Average of class Multimedia | |
|---|---|---|---|---|---|---|---|---|
| Power Consumption | -29% | -19% | -36% | 11% | 30% | 4% | -28% | |
| Idle Minimum * | 4.4 | 6.4 -45% | 6.9 -57% | 4.6 -5% | 5.4 -23% | 3.6 18% | 4.57 ? -4% | 6.83 ? -55% |
| Idle Average * | 9.2 | 14.1 -53% | 12 -30% | 16.8 -83% | 10.5 -14% | 5.7 38% | 8.9 ? 3% | 11.5 ? -25% |
| Idle Maximum * | 9.5 | 14.3 -51% | 12.5 -32% | 17.1 -80% | 10.9 -15% | 6.1 36% | 9.5 ? -0% | 13.4 ? -41% |
| Load Average * | 66.9 | 83.4 -25% | 79.8 -19% | 76.4 -14% | 47.8 29% | 52.5 22% | 60 ? 10% | 71.4 ? -7% |
| Cyberpunk 2077 ultra * | 68.8 | 79.8 -16% | 62.5 9% | 83.4 -21% | 49.2 28% | |||
| Cyberpunk 2077 ultra external monitor * | 67.4 | 77.5 -15% | 74.5 -11% | 79.3 -18% | 46.7 31% | |||
| Load Maximum * | 102.9 | 102.9 -0% | 96 7% | 138.1 -34% | 58.6 43% | 64.7 37% | 89.9 ? 13% | 116.7 ? -13% |
| Witcher 3 ultra * | 46.6 |
* ... smaller is better
Power consumption Cyberpunk / stress test
Power consumption with external monitor
运行时间
微星为 Prestige 16 安装了 99.9 Wh 的最大电池。加上相当低的消耗率,我们测得的电池续航时间非常出色。在亮度为 150 cd/m²(相当于测试设备最大亮度的 32%)的 WLAN 测试中,我们测得了令人印象深刻的 16.5 小时,而在全亮度下则超过了 11.5 小时。视频测试甚至持续了近 21 个小时。这一成绩超越了 Windows 对比设备;只有 MacBook Pro 16的电池续航时间更长。在设备开启的情况下,充满电大约需要两小时,大约一小时后可恢复 80% 的电量。
| MSI Prestige 16 AI Evo B2HMG Ultra 9 285H, Arc 140T, 99.9 Wh | Lenovo ThinkBook 16 G7+ AMD Ryzen AI 9 365, Radeon 880M, 85 Wh | MSI Prestige A16 AI+ A3HMG-036 Ryzen AI 9 365, Radeon 880M, 82 Wh | Apple MacBook Pro 16 2024 M4 Pro M4 Pro (14 cores), M4 Pro 20-Core GPU, 99.6 Wh | Asus Zenbook S 16 UM5606-RK333W Ryzen AI 9 HX 370, Radeon 890M, 78 Wh | Samsung Galaxy Book4 Pro 16 Ultra 7 155H, Arc 8-Core, 76 Wh | Average of class Multimedia | |
|---|---|---|---|---|---|---|---|
| Battery Runtime | -34% | -31% | 19% | -22% | -25% | -33% | |
| H.264 | 1250 | 832 -33% | 609 -51% | 1474 18% | 1204 -4% | 1144 -8% | 863 ? -31% |
| WiFi v1.3 | 992 | 649 -35% | 683 -31% | 1178 19% | 640 -35% | 644 -35% | 644 ? -35% |
| Load | 145 | 127 -12% | 107 -26% | 100 -31% | 99.1 ? -32% |
Notebookcheck 总评分
微星 Prestige 16 AI Evo 是一款轻便、高品质的 16 英寸笔记本电脑,配备快速的 Arrow Lake 处理器、舒适的键盘和超长的电池续航时间。然而,该设备在某些方面存在缺陷,例如散热(第二个风扇会有所帮助),而且端口的分布在日常使用中也不实用。它的显示屏也可以做得更好(只有 60 赫兹,响应时间慢),而且反光很厉害。
MSI Prestige 16 AI Evo B2HMG
- 02/09/2025 v8
Andreas Osthoff
 Total Sustainability Score:
 Transparency
The selection of devices to be reviewed is made by our editorial team. The test sample was provided to the author as a loan by the manufacturer or retailer for the purpose of this review. The lender had no influence on this review, nor did the manufacturer receive a copy of this review before publication. There was no obligation to publish this review. We never accept compensation or payment in return for our reviews. As an independent media company, Notebookcheck is not subjected to the authority of manufacturers, retailers or publishers.
This is how Notebookcheck is testing
Every year, Notebookcheck independently reviews hundreds of laptops and smartphones using standardized procedures to ensure that all results are comparable. We have continuously developed our test methods for around 20 years and set industry standards in the process. In our test labs, high-quality measuring equipment is utilized by experienced technicians and editors. These tests involve a multi-stage validation process. Our complex rating system is based on hundreds of well-founded measurements and benchmarks, which maintains objectivity. Further information on our test methods can be found here.

