

华硕 ROG Zephyrus G16 笔记本电脑评测--搭载 RTX 4090 的超薄游戏本,潜力尚未发挥
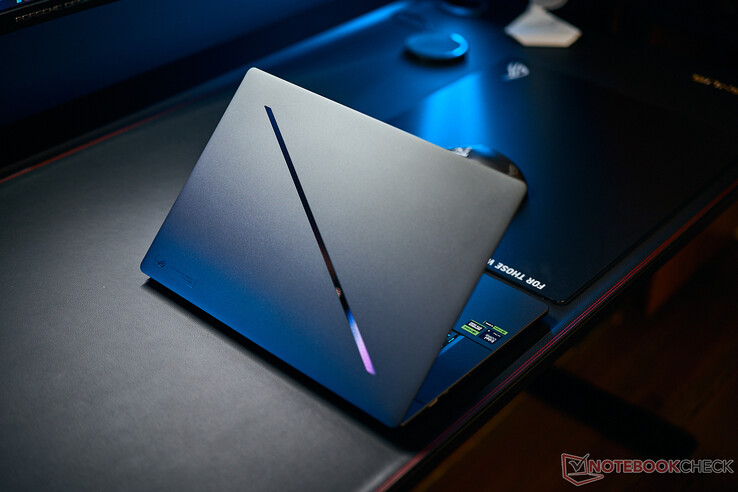
ROG Zephyrus G16 是目前华硕游戏笔记本电脑中最薄的流星。 几个月前,我们评测了配备酷睿至尊 7 155H 和 NvidiaGeForce RTX 4070 的机型。现在我们来看看配备酷睿至尊 9 185H 和 GeForce RTX 4090 笔记本电脑.除了更强大的组件外,我们还需要处理不同的散热问题。虽然 RTX 4070 笔记本电脑以下的配置使用的是由三个风扇和热管组成的传统散热装置,但高端机型(RTX 4080/4090 笔记本电脑)使用的是蒸汽腔散热。当然,我们想知道新的散热方式对性能和排放有何影响。
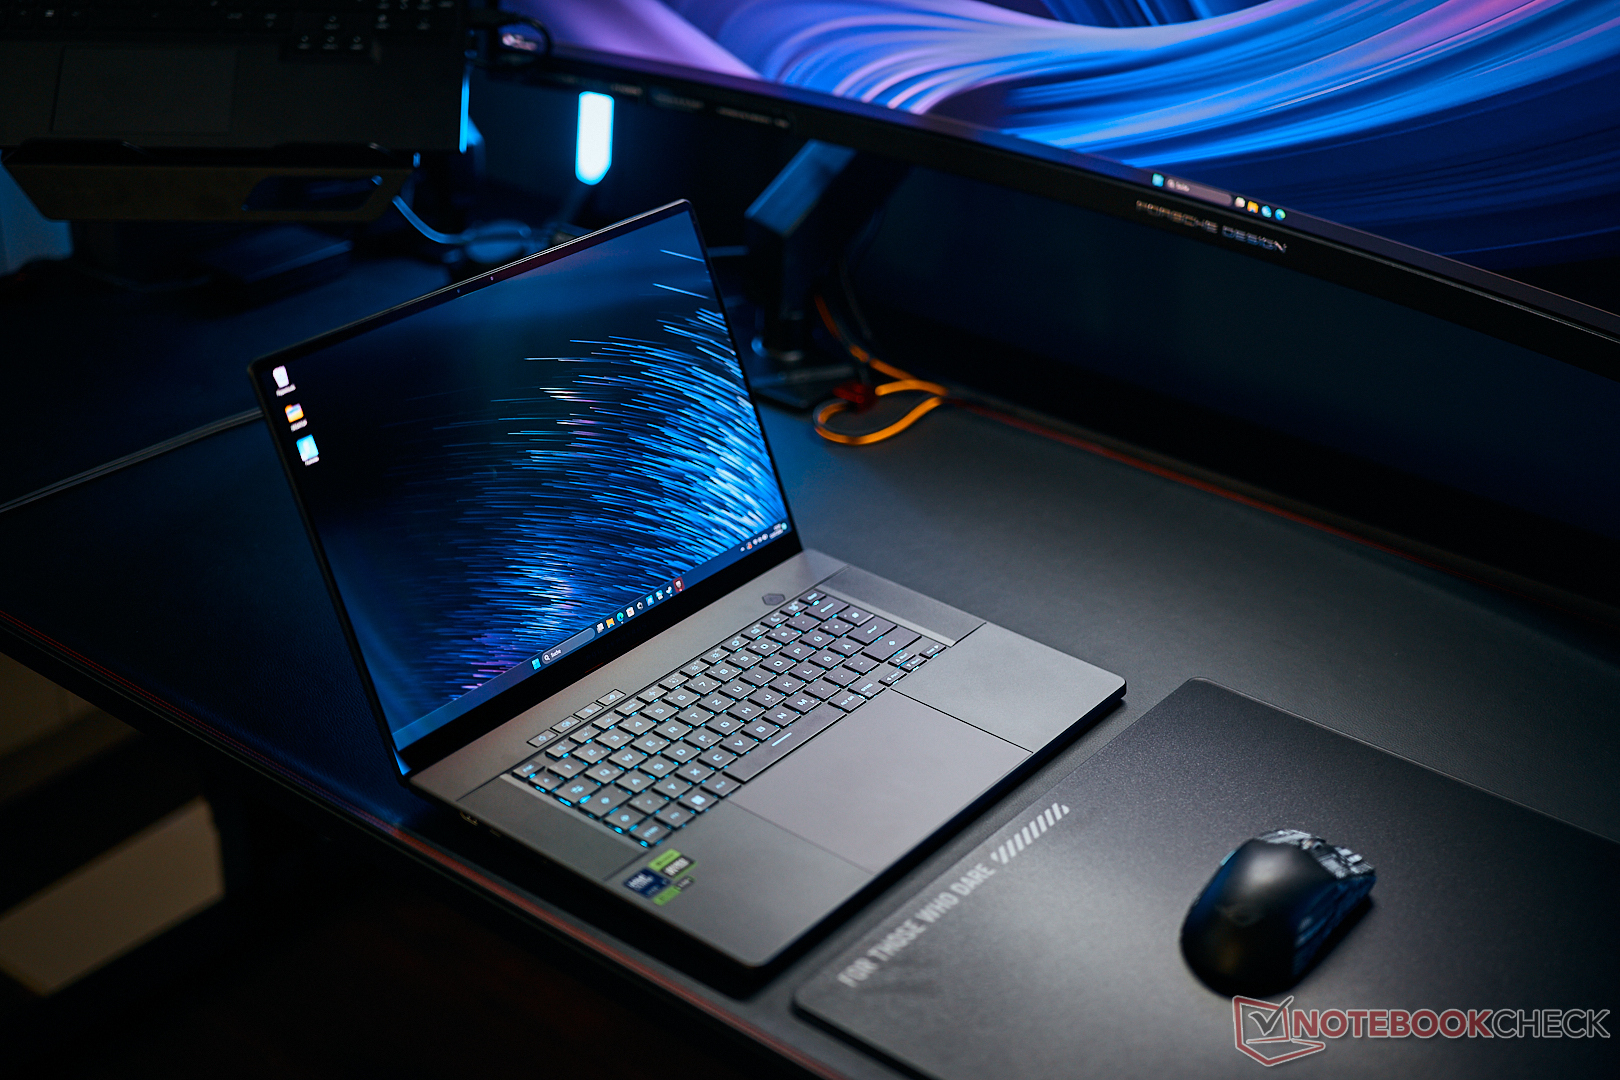
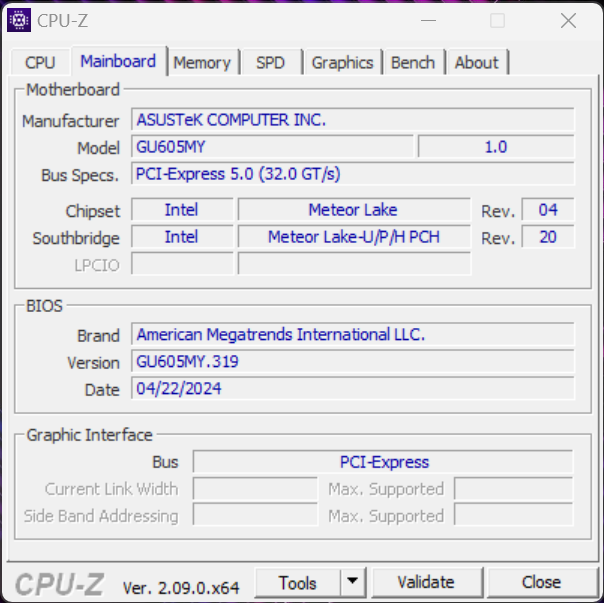
我们的评测设备编号为 GU605MY,售价 3649 元,除了酷睿超 9 185H 和GeForce RTX 4090 笔记本电脑外,还配备了 32 GB 内存和大家已经熟悉的 240 Hz OLED 屏幕。在本次评测中,我们将特别关注 RTX 4070 笔记本电脑配置和性能以及高端变体排放之间的差异。有关机箱、输入设备、显示器和扬声器的所有其他信息,请参阅我们对配备 RTX 4070 笔记本电脑的 ROG Zephyrus G16 的评测。
华硕将很快推出搭载 AMD 全新 Strix Point 处理器(Zen5)的更新机型,不过,这些机型将仅配备 GeForce RTX 4070 笔记本电脑.
潜在的竞争对手比较
Rating | Version | Date | Model | Weight | Height | Size | Resolution | Price |
|---|---|---|---|---|---|---|---|---|
| 86.1 % | v8 | 07 / 2024 | Asus ROG Zephyrus G16 GU605MY Ultra 9 185H, NVIDIA GeForce RTX 4090 Laptop GPU | 1.9 kg | 16.4 mm | 16.00" | 2560x1600 | |
| 85.5 % | v8 | 06 / 2024 | SCHENKER XMG Neo 16 (Early 24) i9-14900HX, NVIDIA GeForce RTX 4090 Laptop GPU | 2.5 kg | 26.6 mm | 16.00" | 2560x1600 | |
| 83.9 % | v8 | 06 / 2024 | Lenovo Legion 9 16IRX9, RTX 4090 i9-14900HX, NVIDIA GeForce RTX 4090 Laptop GPU | 2.5 kg | 22.7 mm | 16.00" | 3200x2000 | |
| 88.4 % v7 (old) | v7 (old) | 05 / 2024 | Alienware x16 R2 P120F Ultra 9 185H, NVIDIA GeForce RTX 4080 Laptop GPU | 2.7 kg | 18.57 mm | 16.00" | 2560x1600 | |
| 91.1 % v7 (old) | v7 (old) | 02 / 2024 | Razer Blade 16 2024, RTX 4090 i9-14900HX, NVIDIA GeForce RTX 4090 Laptop GPU | 2.5 kg | 22 mm | 16.00" | 2560x1600 |
注:我们最近更新了评级系统,第 8 版的结果与第 7 版的结果不具可比性。更多信息 此处.
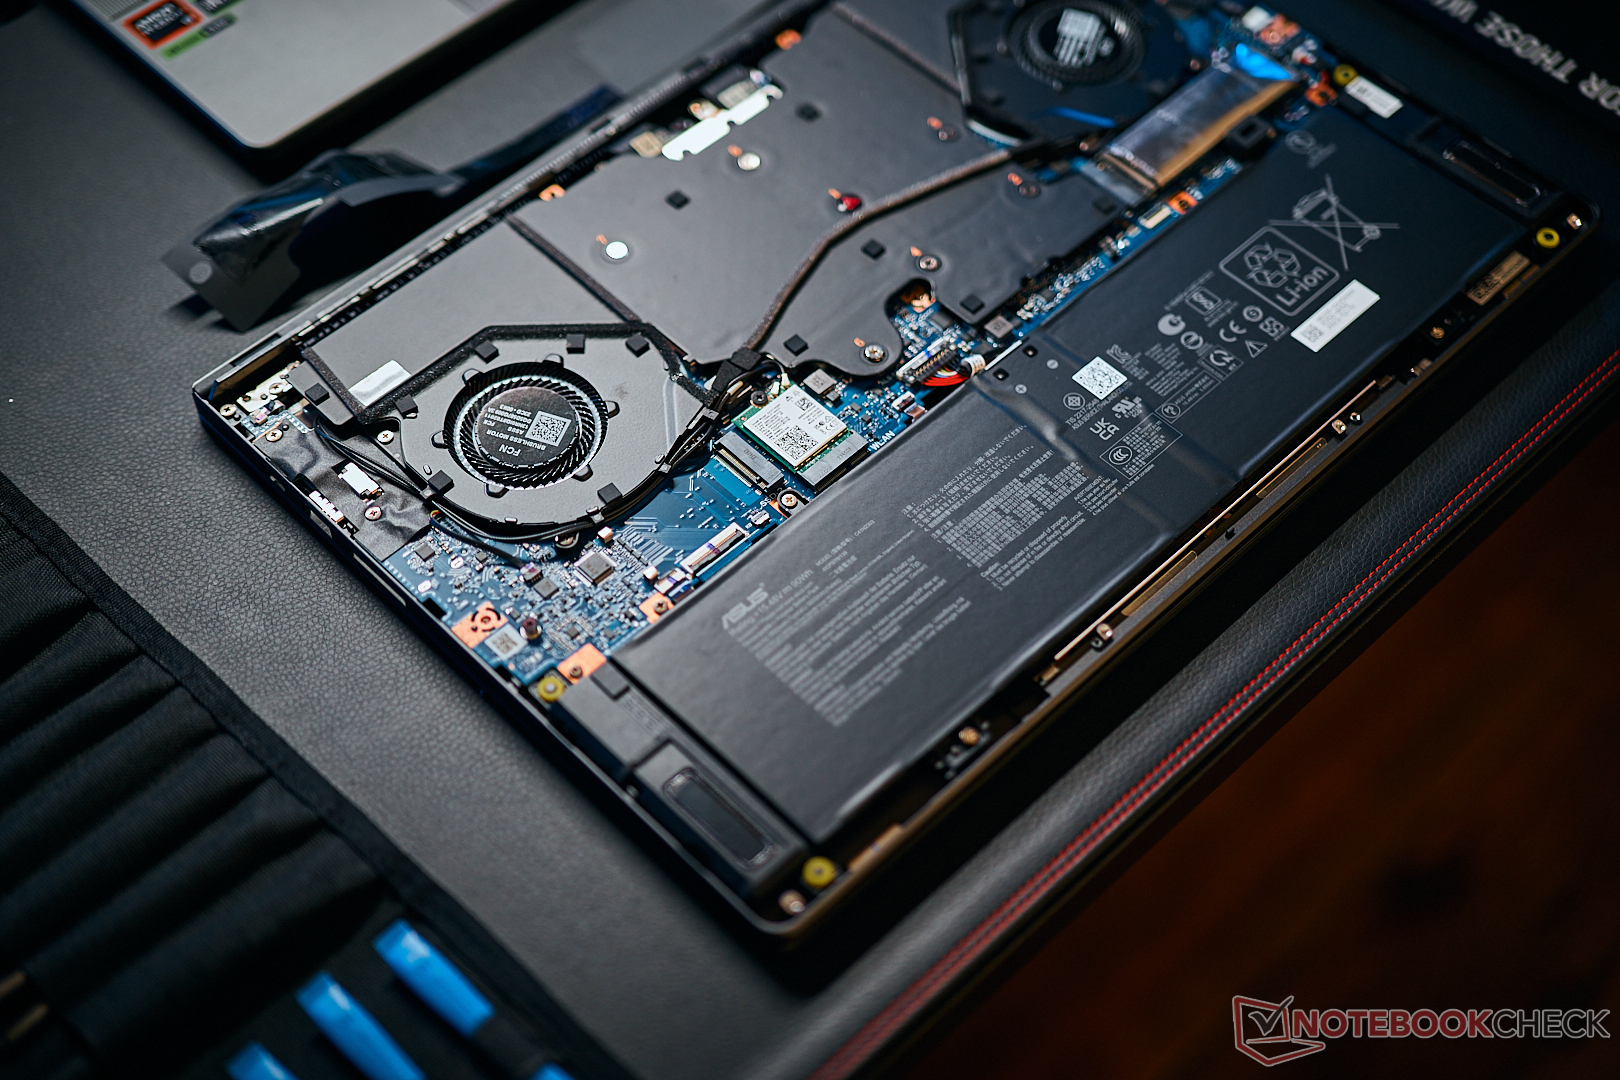
与配备 RTX 4070 的 G16 笔记本电脑的区别
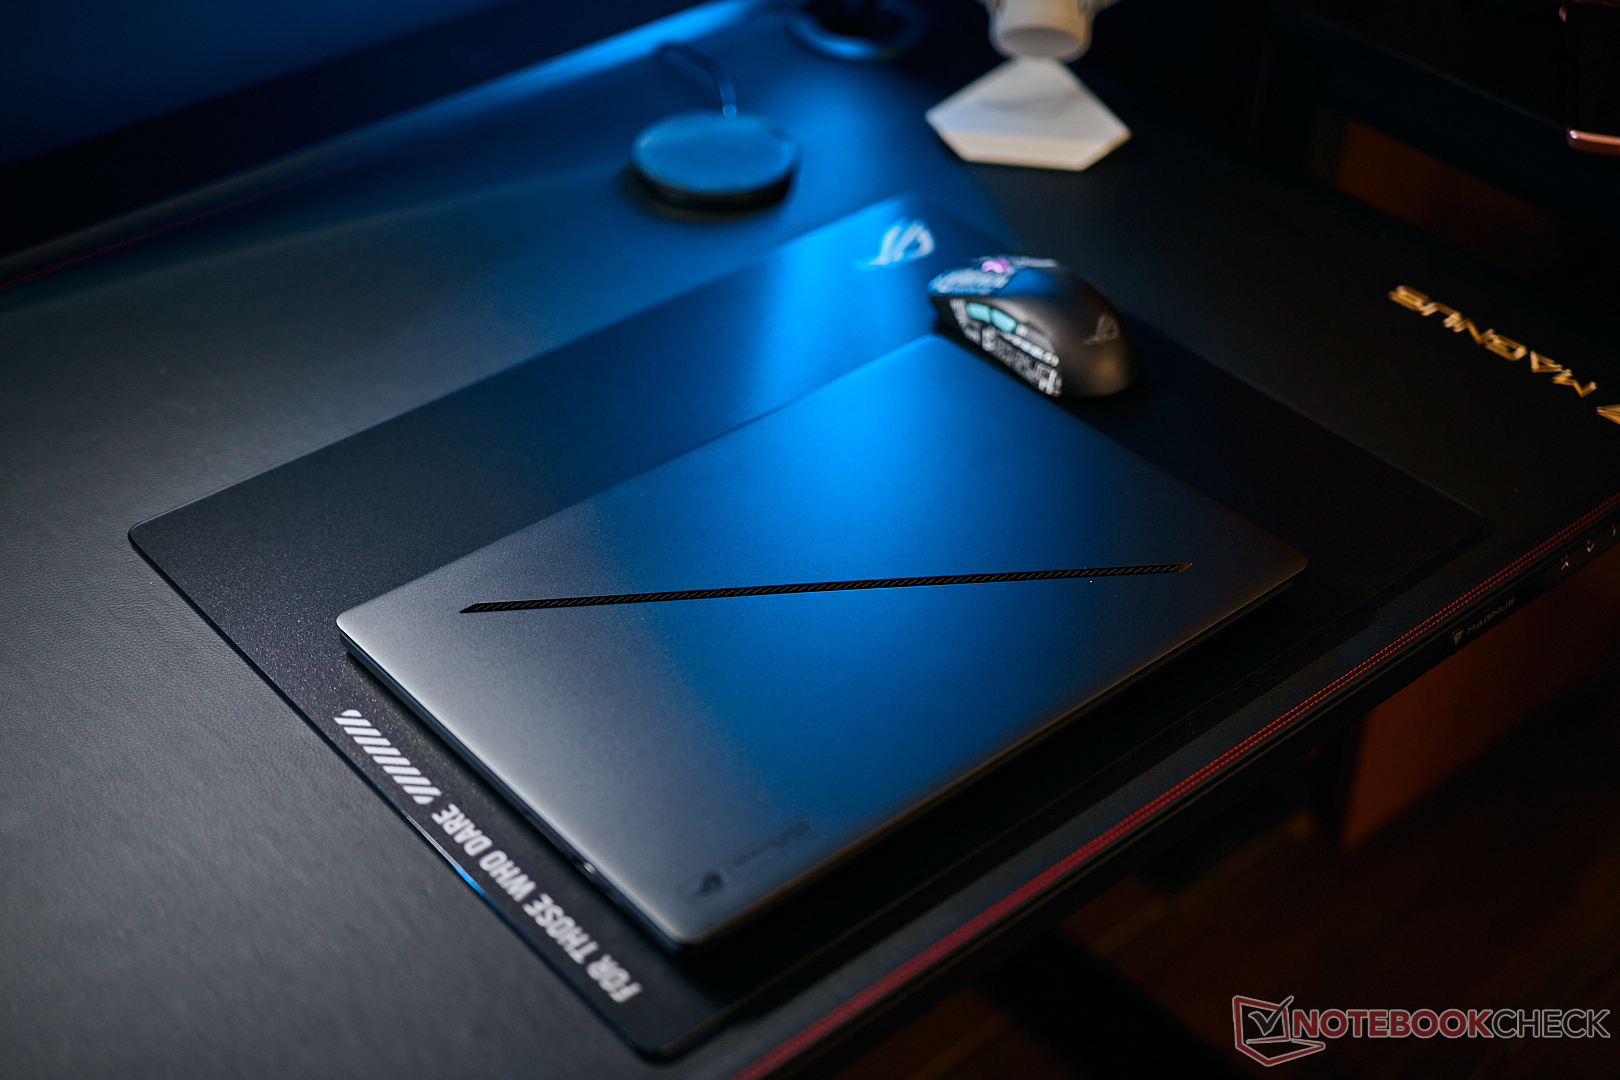


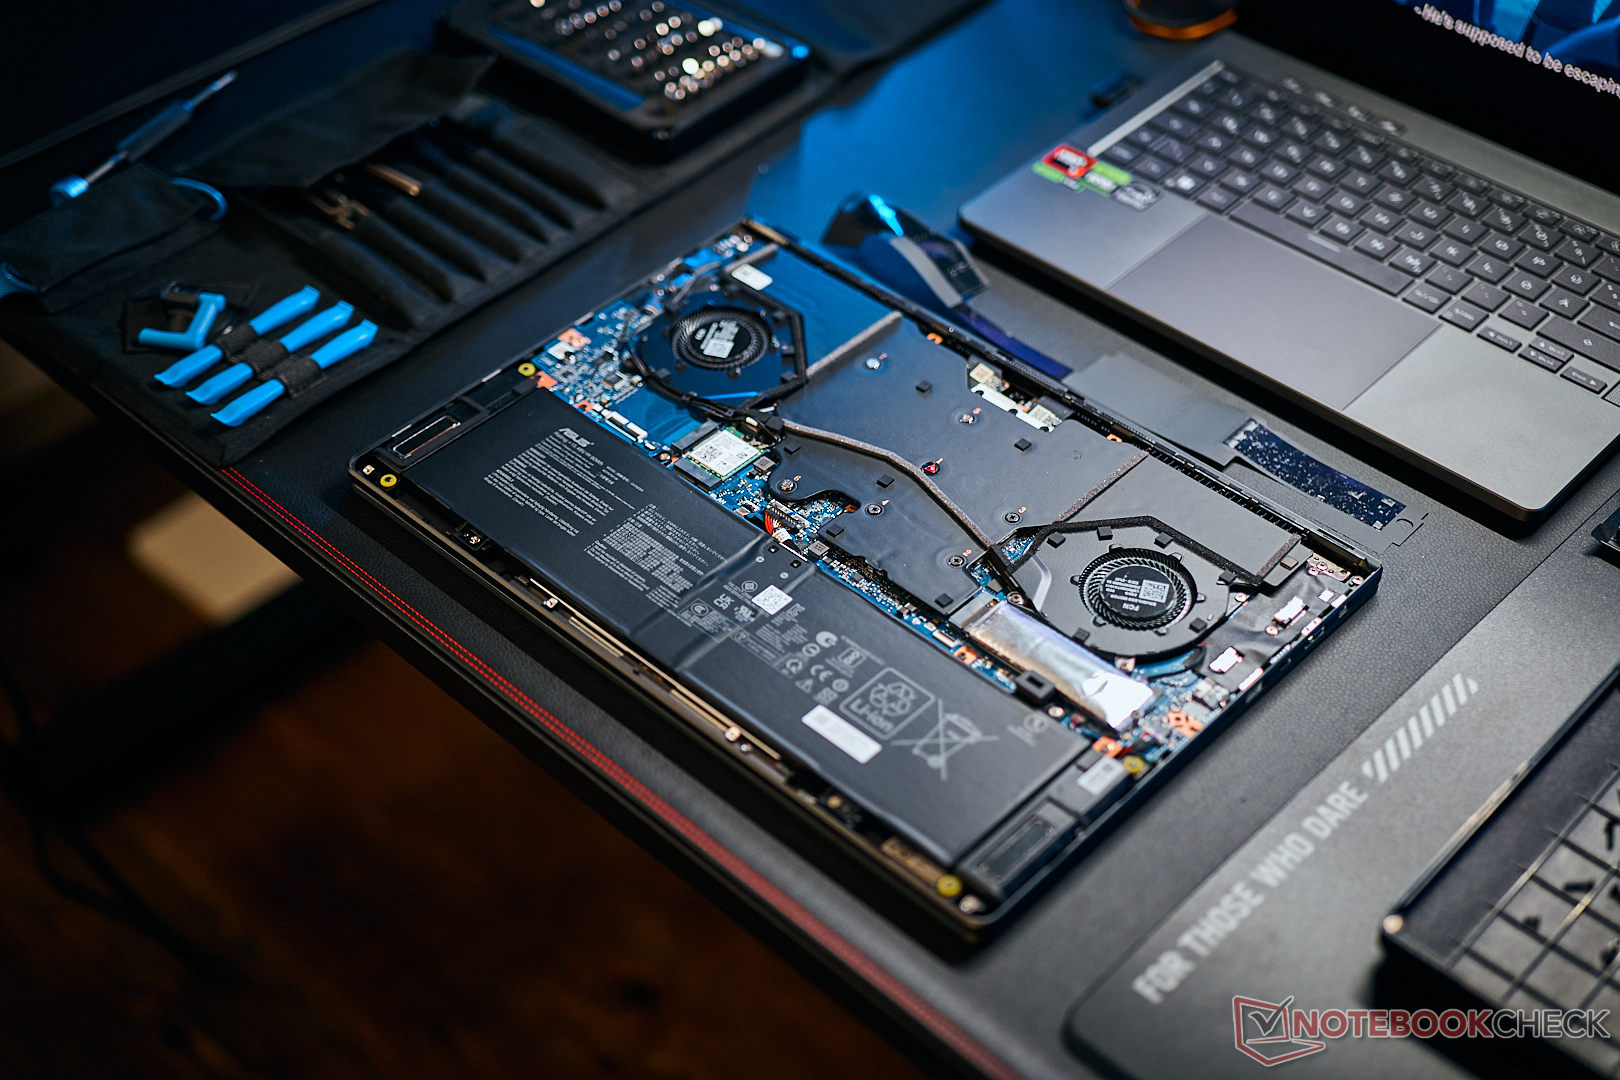

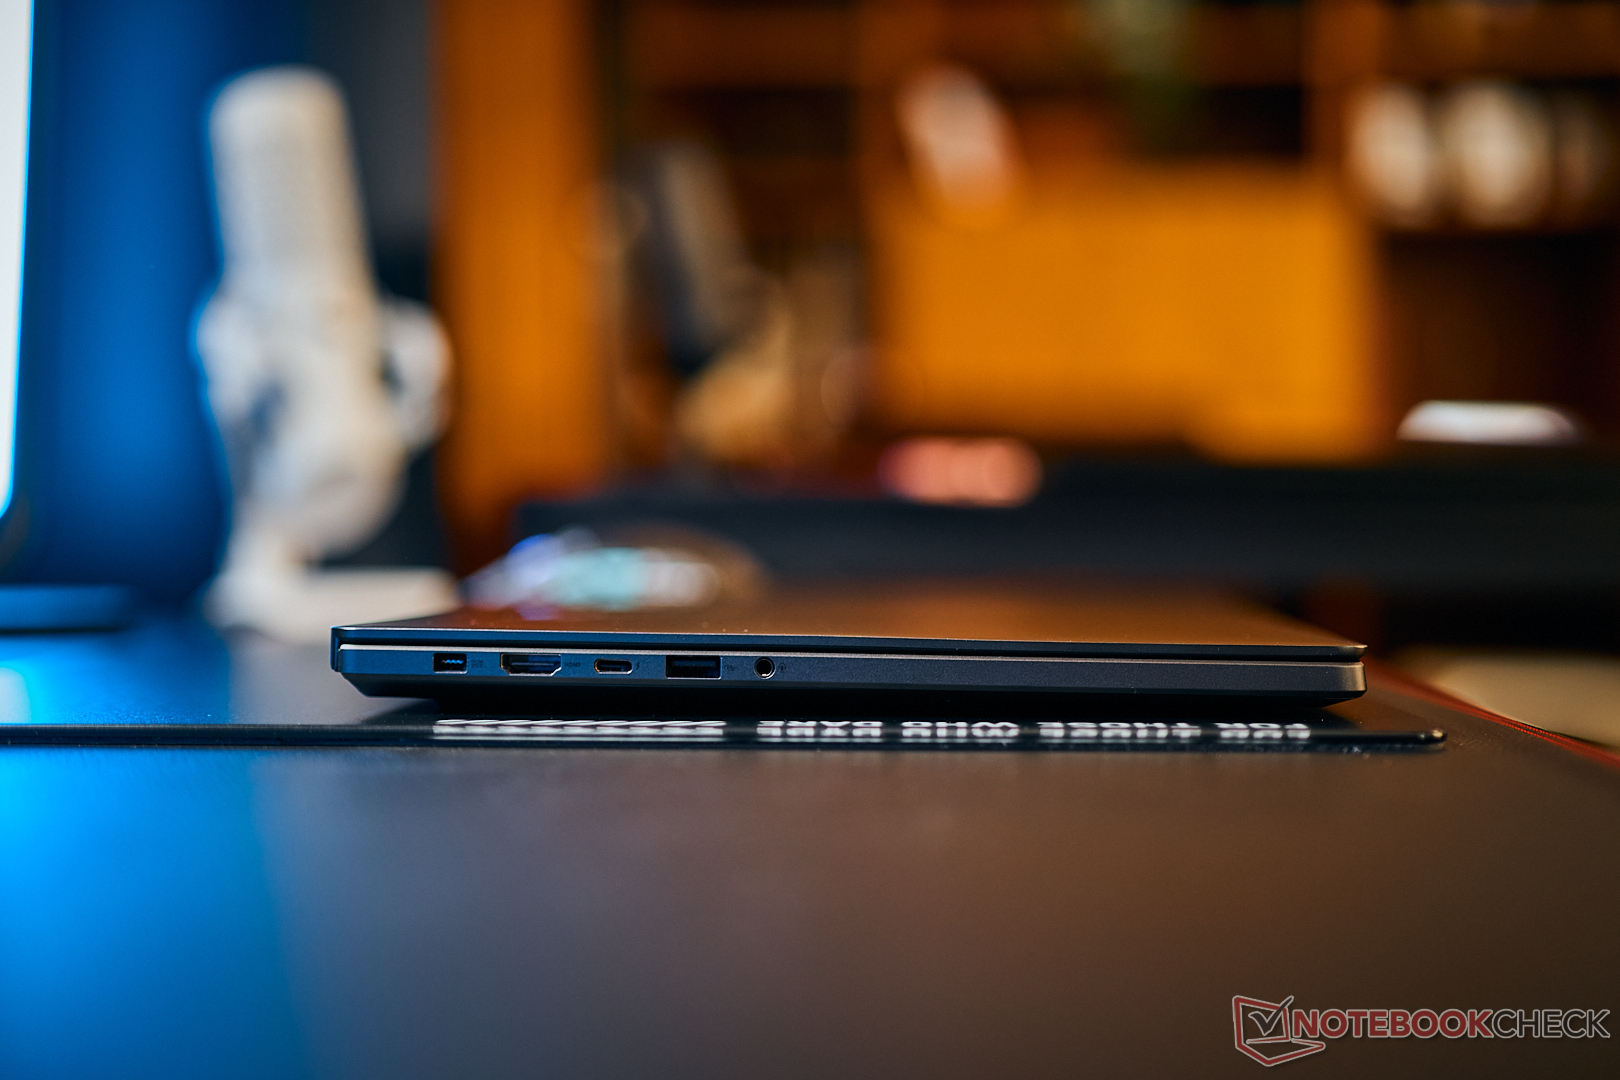
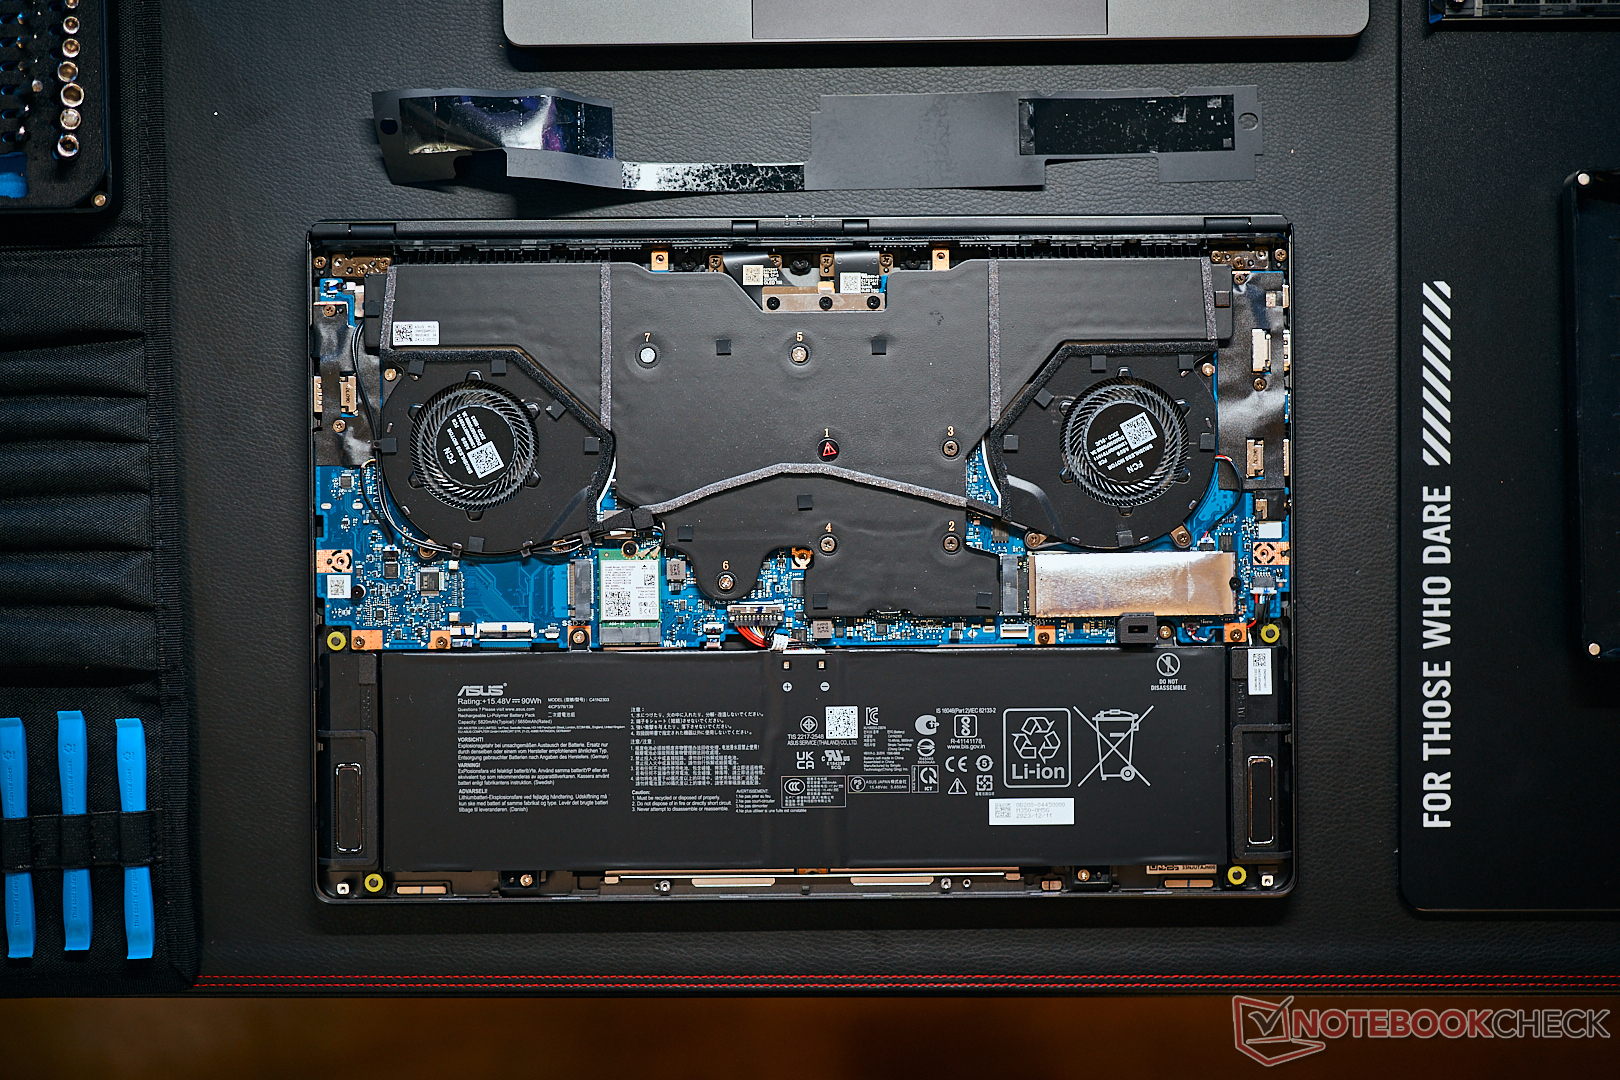
ROG Zephyrus G16 的高端型号与配备 RTX 4070/4060 笔记本电脑的较弱型号在外观上没有区别。不过,内部散热系统的差异就显而易见了。较弱的型号总共使用了三个风扇和普通热管,而华硕为其较昂贵的型号配备了两个风扇的蒸汽腔冷却系统。
散热系统将重量从 1.817 千克增加到 1.908 千克,这与 16 英寸领域的其他 RTX 4090 笔记本电脑相比仍然很轻,因为对比设备至少重了半公斤。除此之外,Zephyrus 还是最薄、最紧凑的机型之一。RTX 4070 及以下配置的笔记本电脑配备了 200 瓦的 PSU(583 克),而从 RTX 4080 笔记本电脑开始,则配备了功率更大的 240 瓦 PSU(745 克)。

性能--Meteor Lake 和 RTX 4090 笔记本电脑
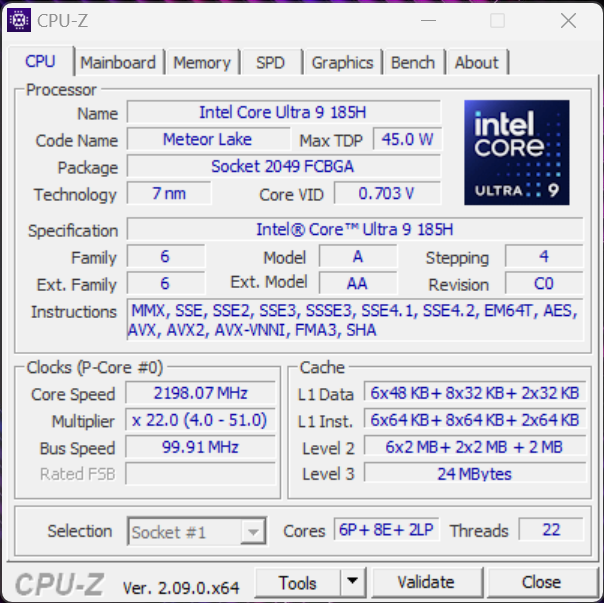
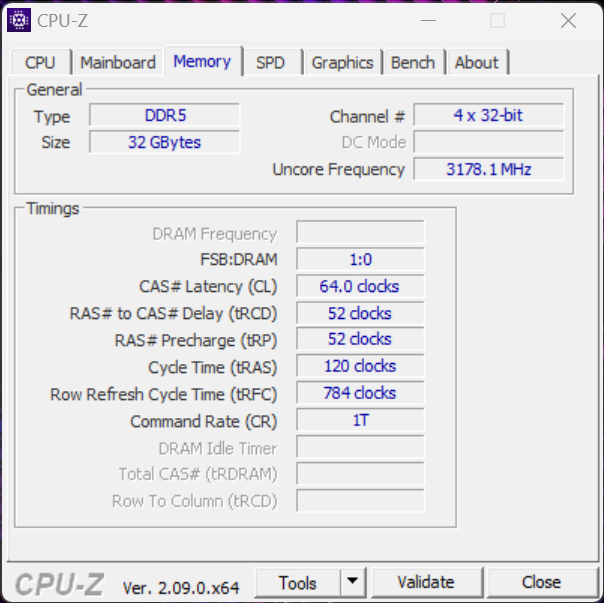
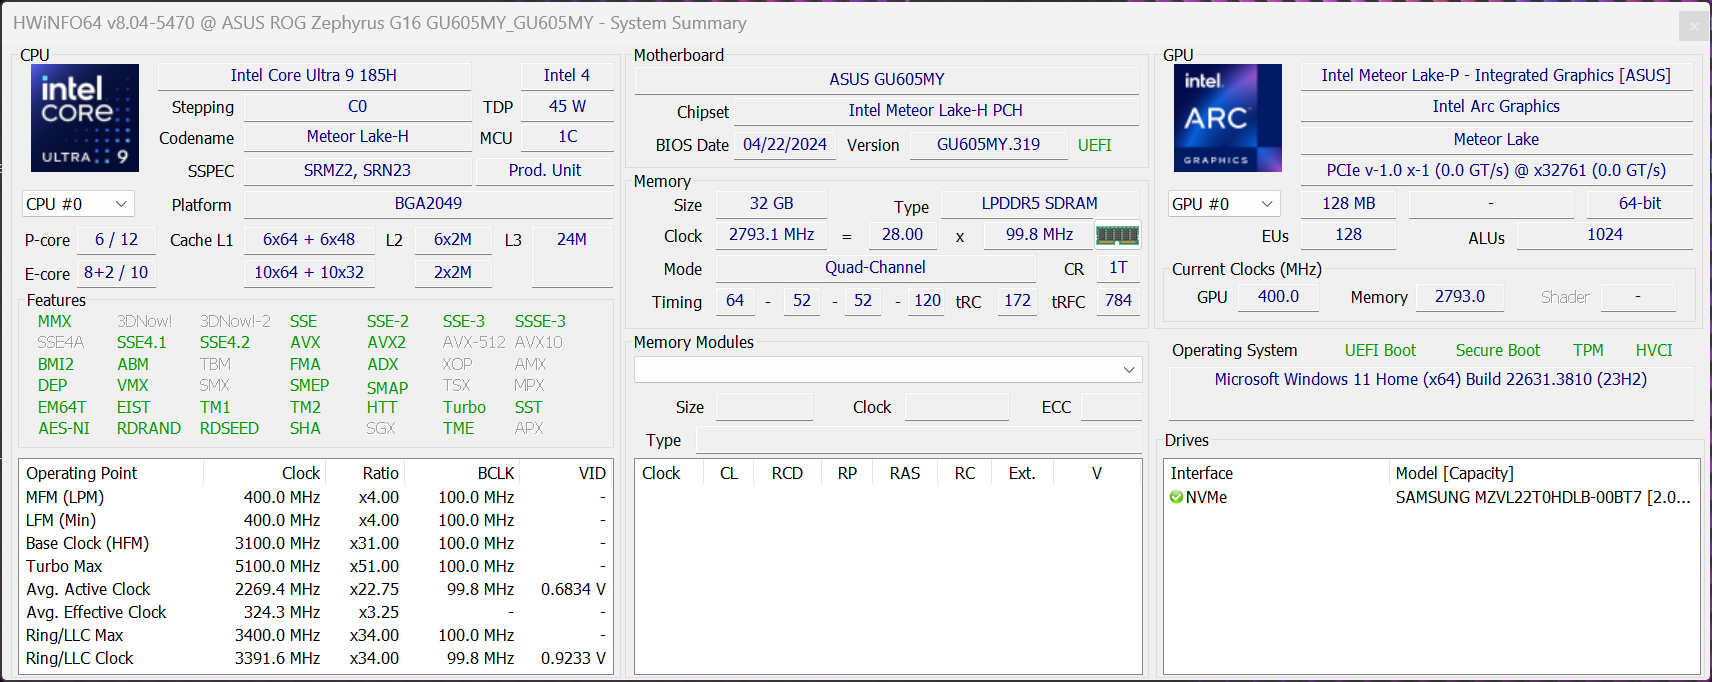
Zephyrus 的高端型号目前配备了最快的流星湖处理器,即酷睿 Ultra 9 185H。在 CPU 性能方面,它落后于英特尔的 HX CPU。在这里找到的 115 瓦版本中,Nvidia GeForce RTX 4090 笔记本电脑离最高性能还有一定距离。安装的内存为 32 GB(LPDDR5x 7467),但由于价格和缺乏可升级性,我们更倾向于 64 GB。
测试条件
基本的能耗曲线保持一致,配备 RTX 4090 笔记本电脑的更强大机型还提供静音、高性能和涡轮增压三种能耗曲线。在下表中,我们列出了相应的 TDP/TGP 值以及对性能的影响。在下表中,我们还添加了 Zephyrus G16 的 RTX 4070 型号的数值,以便进行直接对比。原则上,采用更强大的蒸汽腔冷却系统的机型允许消耗更多的电能,但差异相当小,尤其是在处理器方面。在"静音"和 "性能"两个配置文件中,蒸发室冷却系统的噪音甚至比性能较弱的 RTX 4070 变体.按照标准,我们使用涡轮增压模式进行了基准测试和测量。
| 能源概况 | CPU 负载 | CB R23 Multi | GPU 负载 | Time Spy 图形 | 赛博朋克 2077 QHD Ultra | 最大风扇容量 |
|---|---|---|---|---|---|---|
| 静音 | 60 瓦 | 15,750 分 | 55 瓦 | 9,731 分 | 40.2fps | 41.4 dB(A) |
| 性能 | 100->70 瓦 | 17,452 分 | 90 瓦 | 15,205 分 | 60.2fps | 48.1 dB(A) |
| 涡轮 | 110->80 瓦 | 19,109 点 | 115 瓦 | 19,109 点 | 68.1fps | 52.3 dB(A) |
| 能源概况 | CPU 负载 | CB R23 Multi | GPU 负载 | Time Spy 图形 | 赛博朋克 2077 QHD Ultra | 最大风扇容量 |
|---|---|---|---|---|---|---|
| 静音 | 60->45 瓦 | 15,869 分 | 65 瓦 | 9,042 分 | 32.6fps | 41.5 dB(A) |
| 性能 | 70->50 瓦 | 17,133 分 | 80 瓦 | 10,989 分 | 43.7fps | 46.4 dB(A) |
| 涡轮 | 95->70 瓦 | 18,372 分 | 105 瓦 | 12,312 分 | 48.7fps | 52.4 dB(A) |
处理器 - Intel Core Ultra 9 185H
核心 酷睿至强 9 185H酷睿至尊 9 185H 是英特尔 "流星湖 "一代中速度最快的移动处理器,但其性能明显落后于 HX 处理器("猛禽湖 "更新版)。正如我们刚才在对比表中观察到的,酷睿至尊 9 和酷睿至尊 7 在 Zephyrus G16 2024 和 Alienware x16 R2.后者也配备了 Core Ultra 9 185H。
不过,其他采用酷睿 i9 14900HX 的 RTX 4090 竞争对手的 CPU 性能明显更高,尤其是在多核测试中。ROG Zephyrus G16 的多核性能并不总能保持完全稳定,不过在持续负载情况下,10% 左右的不足可以说是相当小的。在电池模式下,处理器的最大功耗为 75 瓦,但这对多核性能几乎没有任何影响(约 8%)。其他 CPU 基准测试 这里.
Cinebench R15 Multi Continuous Test
Cinebench R23: Multi Core | Single Core
Cinebench R20: CPU (Multi Core) | CPU (Single Core)
Cinebench R15: CPU Multi 64Bit | CPU Single 64Bit
Blender: v2.79 BMW27 CPU
7-Zip 18.03: 7z b 4 | 7z b 4 -mmt1
Geekbench 6.4: Multi-Core | Single-Core
Geekbench 5.5: Multi-Core | Single-Core
HWBOT x265 Benchmark v2.2: 4k Preset
LibreOffice : 20 Documents To PDF
R Benchmark 2.5: Overall mean
| CPU Performance Rating | |
| SCHENKER XMG Neo 16 (Early 24) | |
| Razer Blade 16 2024, RTX 4090 | |
| Lenovo Legion 9 16IRX9, RTX 4090 | |
| Average of class Gaming | |
| Asus ROG Zephyrus G16 GU605MY | |
| Average Intel Core Ultra 9 185H | |
| Asus ROG Zephyrus G16 2024 GU605M | |
| Alienware x16 R2 P120F | |
| Cinebench R23 / Multi Core | |
| SCHENKER XMG Neo 16 (Early 24) | |
| Lenovo Legion 9 16IRX9, RTX 4090 | |
| Razer Blade 16 2024, RTX 4090 | |
| Average of class Gaming (5668 - 39652, n=151, last 2 years) | |
| Asus ROG Zephyrus G16 GU605MY | |
| Alienware x16 R2 P120F | |
| Average Intel Core Ultra 9 185H (12688 - 19851, n=19) | |
| Asus ROG Zephyrus G16 2024 GU605M | |
| Cinebench R23 / Single Core | |
| SCHENKER XMG Neo 16 (Early 24) | |
| Razer Blade 16 2024, RTX 4090 | |
| Average of class Gaming (1136 - 2252, n=151, last 2 years) | |
| Asus ROG Zephyrus G16 GU605MY | |
| Average Intel Core Ultra 9 185H (1166 - 1912, n=19) | |
| Lenovo Legion 9 16IRX9, RTX 4090 | |
| Asus ROG Zephyrus G16 2024 GU605M | |
| Alienware x16 R2 P120F | |
| Cinebench R20 / CPU (Multi Core) | |
| SCHENKER XMG Neo 16 (Early 24) | |
| Lenovo Legion 9 16IRX9, RTX 4090 | |
| Razer Blade 16 2024, RTX 4090 | |
| Average of class Gaming (2179 - 15517, n=151, last 2 years) | |
| Asus ROG Zephyrus G16 GU605MY | |
| Alienware x16 R2 P120F | |
| Average Intel Core Ultra 9 185H (4843 - 7651, n=19) | |
| Asus ROG Zephyrus G16 2024 GU605M | |
| Cinebench R20 / CPU (Single Core) | |
| SCHENKER XMG Neo 16 (Early 24) | |
| Razer Blade 16 2024, RTX 4090 | |
| Average of class Gaming (439 - 866, n=151, last 2 years) | |
| Asus ROG Zephyrus G16 GU605MY | |
| Asus ROG Zephyrus G16 2024 GU605M | |
| Average Intel Core Ultra 9 185H (442 - 735, n=19) | |
| Lenovo Legion 9 16IRX9, RTX 4090 | |
| Alienware x16 R2 P120F | |
| Cinebench R15 / CPU Multi 64Bit | |
| SCHENKER XMG Neo 16 (Early 24) | |
| Lenovo Legion 9 16IRX9, RTX 4090 | |
| Razer Blade 16 2024, RTX 4090 | |
| Average of class Gaming (905 - 6074, n=154, last 2 years) | |
| Asus ROG Zephyrus G16 GU605MY | |
| Alienware x16 R2 P120F | |
| Average Intel Core Ultra 9 185H (1582 - 3165, n=21) | |
| Asus ROG Zephyrus G16 2024 GU605M | |
| Cinebench R15 / CPU Single 64Bit | |
| Razer Blade 16 2024, RTX 4090 | |
| SCHENKER XMG Neo 16 (Early 24) | |
| Average of class Gaming (191.9 - 343, n=151, last 2 years) | |
| Asus ROG Zephyrus G16 GU605MY | |
| Asus ROG Zephyrus G16 2024 GU605M | |
| Average Intel Core Ultra 9 185H (191.9 - 281, n=19) | |
| Lenovo Legion 9 16IRX9, RTX 4090 | |
| Alienware x16 R2 P120F | |
| Blender / v2.79 BMW27 CPU | |
| Asus ROG Zephyrus G16 2024 GU605M | |
| Average Intel Core Ultra 9 185H (163 - 285, n=19) | |
| Alienware x16 R2 P120F | |
| Asus ROG Zephyrus G16 GU605MY | |
| Average of class Gaming (81 - 555, n=144, last 2 years) | |
| Razer Blade 16 2024, RTX 4090 | |
| Lenovo Legion 9 16IRX9, RTX 4090 | |
| SCHENKER XMG Neo 16 (Early 24) | |
| 7-Zip 18.03 / 7z b 4 | |
| SCHENKER XMG Neo 16 (Early 24) | |
| Lenovo Legion 9 16IRX9, RTX 4090 | |
| Razer Blade 16 2024, RTX 4090 | |
| Average of class Gaming (23795 - 144064, n=149, last 2 years) | |
| Asus ROG Zephyrus G16 GU605MY | |
| Average Intel Core Ultra 9 185H (51738 - 76331, n=19) | |
| Asus ROG Zephyrus G16 2024 GU605M | |
| Alienware x16 R2 P120F | |
| 7-Zip 18.03 / 7z b 4 -mmt1 | |
| SCHENKER XMG Neo 16 (Early 24) | |
| Razer Blade 16 2024, RTX 4090 | |
| Average of class Gaming (4199 - 7573, n=149, last 2 years) | |
| Asus ROG Zephyrus G16 GU605MY | |
| Lenovo Legion 9 16IRX9, RTX 4090 | |
| Asus ROG Zephyrus G16 2024 GU605M | |
| Average Intel Core Ultra 9 185H (4199 - 5781, n=19) | |
| Alienware x16 R2 P120F | |
| Geekbench 6.4 / Multi-Core | |
| SCHENKER XMG Neo 16 (Early 24) | |
| Razer Blade 16 2024, RTX 4090 | |
| Lenovo Legion 9 16IRX9, RTX 4090 | |
| Asus ROG Zephyrus G16 GU605MY | |
| Average of class Gaming (5340 - 21668, n=119, last 2 years) | |
| Average Intel Core Ultra 9 185H (9140 - 14540, n=19) | |
| Asus ROG Zephyrus G16 2024 GU605M | |
| Alienware x16 R2 P120F | |
| Geekbench 6.4 / Single-Core | |
| SCHENKER XMG Neo 16 (Early 24) | |
| Razer Blade 16 2024, RTX 4090 | |
| Average of class Gaming (1490 - 3219, n=119, last 2 years) | |
| Asus ROG Zephyrus G16 GU605MY | |
| Average Intel Core Ultra 9 185H (1490 - 2573, n=19) | |
| Lenovo Legion 9 16IRX9, RTX 4090 | |
| Asus ROG Zephyrus G16 2024 GU605M | |
| Alienware x16 R2 P120F | |
| Geekbench 5.5 / Multi-Core | |
| SCHENKER XMG Neo 16 (Early 24) | |
| Lenovo Legion 9 16IRX9, RTX 4090 | |
| Razer Blade 16 2024, RTX 4090 | |
| Average of class Gaming (4557 - 25855, n=148, last 2 years) | |
| Asus ROG Zephyrus G16 GU605MY | |
| Average Intel Core Ultra 9 185H (9330 - 14230, n=19) | |
| Asus ROG Zephyrus G16 2024 GU605M | |
| Alienware x16 R2 P120F | |
| Geekbench 5.5 / Single-Core | |
| SCHENKER XMG Neo 16 (Early 24) | |
| Razer Blade 16 2024, RTX 4090 | |
| Average of class Gaming (986 - 2423, n=148, last 2 years) | |
| Asus ROG Zephyrus G16 GU605MY | |
| Average Intel Core Ultra 9 185H (986 - 1902, n=19) | |
| Asus ROG Zephyrus G16 2024 GU605M | |
| Lenovo Legion 9 16IRX9, RTX 4090 | |
| Alienware x16 R2 P120F | |
| HWBOT x265 Benchmark v2.2 / 4k Preset | |
| SCHENKER XMG Neo 16 (Early 24) | |
| Lenovo Legion 9 16IRX9, RTX 4090 | |
| Razer Blade 16 2024, RTX 4090 | |
| Average of class Gaming (6.72 - 42.9, n=148, last 2 years) | |
| Asus ROG Zephyrus G16 GU605MY | |
| Alienware x16 R2 P120F | |
| Asus ROG Zephyrus G16 2024 GU605M | |
| Average Intel Core Ultra 9 185H (14.1 - 22.7, n=19) | |
| LibreOffice / 20 Documents To PDF | |
| Lenovo Legion 9 16IRX9, RTX 4090 | |
| Asus ROG Zephyrus G16 2024 GU605M | |
| Average of class Gaming (19 - 96.6, n=147, last 2 years) | |
| Razer Blade 16 2024, RTX 4090 | |
| Average Intel Core Ultra 9 185H (34.5 - 73.5, n=19) | |
| Alienware x16 R2 P120F | |
| Asus ROG Zephyrus G16 GU605MY | |
| SCHENKER XMG Neo 16 (Early 24) | |
| R Benchmark 2.5 / Overall mean | |
| Alienware x16 R2 P120F | |
| Lenovo Legion 9 16IRX9, RTX 4090 | |
| Average Intel Core Ultra 9 185H (0.4313 - 0.759, n=20) | |
| Asus ROG Zephyrus G16 2024 GU605M | |
| Average of class Gaming (0.3609 - 0.759, n=150, last 2 years) | |
| Asus ROG Zephyrus G16 GU605MY | |
| Razer Blade 16 2024, RTX 4090 | |
| SCHENKER XMG Neo 16 (Early 24) | |
* ... smaller is better
AIDA64: FP32 Ray-Trace | FPU Julia | CPU SHA3 | CPU Queen | FPU SinJulia | FPU Mandel | CPU AES | CPU ZLib | FP64 Ray-Trace | CPU PhotoWorxx
| Performance Rating | |
| SCHENKER XMG Neo 16 (Early 24) | |
| Lenovo Legion 9 16IRX9, RTX 4090 | |
| Razer Blade 16 2024, RTX 4090 | |
| Average of class Gaming | |
| Alienware x16 R2 P120F | |
| Asus ROG Zephyrus G16 GU605MY | |
| Average Intel Core Ultra 9 185H | |
| Asus ROG Zephyrus G16 2024 GU605M | |
| AIDA64 / FP32 Ray-Trace | |
| SCHENKER XMG Neo 16 (Early 24) | |
| Lenovo Legion 9 16IRX9, RTX 4090 | |
| Razer Blade 16 2024, RTX 4090 | |
| Average of class Gaming (4986 - 81639, n=147, last 2 years) | |
| Alienware x16 R2 P120F | |
| Asus ROG Zephyrus G16 GU605MY | |
| Asus ROG Zephyrus G16 2024 GU605M | |
| Average Intel Core Ultra 9 185H (9220 - 18676, n=19) | |
| AIDA64 / FPU Julia | |
| SCHENKER XMG Neo 16 (Early 24) | |
| Lenovo Legion 9 16IRX9, RTX 4090 | |
| Razer Blade 16 2024, RTX 4090 | |
| Average of class Gaming (25360 - 252486, n=147, last 2 years) | |
| Alienware x16 R2 P120F | |
| Asus ROG Zephyrus G16 GU605MY | |
| Asus ROG Zephyrus G16 2024 GU605M | |
| Average Intel Core Ultra 9 185H (48865 - 96463, n=19) | |
| AIDA64 / CPU SHA3 | |
| SCHENKER XMG Neo 16 (Early 24) | |
| Lenovo Legion 9 16IRX9, RTX 4090 | |
| Razer Blade 16 2024, RTX 4090 | |
| Average of class Gaming (1339 - 10389, n=147, last 2 years) | |
| Alienware x16 R2 P120F | |
| Asus ROG Zephyrus G16 GU605MY | |
| Average Intel Core Ultra 9 185H (2394 - 4534, n=19) | |
| Asus ROG Zephyrus G16 2024 GU605M | |
| AIDA64 / CPU Queen | |
| SCHENKER XMG Neo 16 (Early 24) | |
| Razer Blade 16 2024, RTX 4090 | |
| Lenovo Legion 9 16IRX9, RTX 4090 | |
| Average of class Gaming (50699 - 200651, n=147, last 2 years) | |
| Alienware x16 R2 P120F | |
| Asus ROG Zephyrus G16 GU605MY | |
| Asus ROG Zephyrus G16 2024 GU605M | |
| Average Intel Core Ultra 9 185H (66785 - 95241, n=19) | |
| AIDA64 / FPU SinJulia | |
| SCHENKER XMG Neo 16 (Early 24) | |
| Lenovo Legion 9 16IRX9, RTX 4090 | |
| Razer Blade 16 2024, RTX 4090 | |
| Average of class Gaming (4800 - 32988, n=147, last 2 years) | |
| Alienware x16 R2 P120F | |
| Asus ROG Zephyrus G16 GU605MY | |
| Asus ROG Zephyrus G16 2024 GU605M | |
| Average Intel Core Ultra 9 185H (7255 - 11392, n=19) | |
| AIDA64 / FPU Mandel | |
| SCHENKER XMG Neo 16 (Early 24) | |
| Lenovo Legion 9 16IRX9, RTX 4090 | |
| Razer Blade 16 2024, RTX 4090 | |
| Average of class Gaming (12321 - 134044, n=147, last 2 years) | |
| Alienware x16 R2 P120F | |
| Asus ROG Zephyrus G16 GU605MY | |
| Asus ROG Zephyrus G16 2024 GU605M | |
| Average Intel Core Ultra 9 185H (24004 - 48020, n=19) | |
| AIDA64 / CPU AES | |
| SCHENKER XMG Neo 16 (Early 24) | |
| Lenovo Legion 9 16IRX9, RTX 4090 | |
| Razer Blade 16 2024, RTX 4090 | |
| Average of class Gaming (19065 - 328679, n=147, last 2 years) | |
| Average Intel Core Ultra 9 185H (53116 - 154066, n=19) | |
| Alienware x16 R2 P120F | |
| Asus ROG Zephyrus G16 GU605MY | |
| Asus ROG Zephyrus G16 2024 GU605M | |
| AIDA64 / CPU ZLib | |
| SCHENKER XMG Neo 16 (Early 24) | |
| Lenovo Legion 9 16IRX9, RTX 4090 | |
| Razer Blade 16 2024, RTX 4090 | |
| Average of class Gaming (373 - 2531, n=147, last 2 years) | |
| Alienware x16 R2 P120F | |
| Asus ROG Zephyrus G16 GU605MY | |
| Average Intel Core Ultra 9 185H (678 - 1341, n=19) | |
| Asus ROG Zephyrus G16 2024 GU605M | |
| AIDA64 / FP64 Ray-Trace | |
| SCHENKER XMG Neo 16 (Early 24) | |
| Lenovo Legion 9 16IRX9, RTX 4090 | |
| Razer Blade 16 2024, RTX 4090 | |
| Average of class Gaming (2540 - 43430, n=147, last 2 years) | |
| Alienware x16 R2 P120F | |
| Asus ROG Zephyrus G16 GU605MY | |
| Average Intel Core Ultra 9 185H (4428 - 10078, n=19) | |
| Asus ROG Zephyrus G16 2024 GU605M | |
| AIDA64 / CPU PhotoWorxx | |
| Lenovo Legion 9 16IRX9, RTX 4090 | |
| Alienware x16 R2 P120F | |
| Asus ROG Zephyrus G16 GU605MY | |
| Razer Blade 16 2024, RTX 4090 | |
| SCHENKER XMG Neo 16 (Early 24) | |
| Asus ROG Zephyrus G16 2024 GU605M | |
| Average Intel Core Ultra 9 185H (44547 - 53918, n=19) | |
| Average of class Gaming (10805 - 60161, n=147, last 2 years) | |
系统性能
令人稍感意外的是,Zephyrus G16 的高端版本是一款反应非常灵敏的笔记本电脑。虽然基准测试结果也不错,但搭载 HX 处理器的竞争对手还是表现得更好。不过,这在日常情况下并不明显。 由于采用了高级 Optimus 图形切换技术,当系统切换到 dGPU 时,启动游戏时偶尔会出现短暂的卡顿,不过这完全正常。
CrossMark: Overall | Productivity | Creativity | Responsiveness
WebXPRT 3: Overall
WebXPRT 4: Overall
Mozilla Kraken 1.1: Total
| PCMark 10 / Score | |
| SCHENKER XMG Neo 16 (Early 24) | |
| Razer Blade 16 2024, RTX 4090 | |
| Lenovo Legion 9 16IRX9, RTX 4090 | |
| Asus ROG Zephyrus G16 GU605MY | |
| Average Intel Core Ultra 9 185H, NVIDIA GeForce RTX 4090 Laptop GPU (n=1) | |
| Average of class Gaming (5776 - 9852, n=133, last 2 years) | |
| Alienware x16 R2 P120F | |
| Asus ROG Zephyrus G16 2024 GU605M | |
| PCMark 10 / Essentials | |
| SCHENKER XMG Neo 16 (Early 24) | |
| Lenovo Legion 9 16IRX9, RTX 4090 | |
| Razer Blade 16 2024, RTX 4090 | |
| Asus ROG Zephyrus G16 GU605MY | |
| Average Intel Core Ultra 9 185H, NVIDIA GeForce RTX 4090 Laptop GPU (n=1) | |
| Average of class Gaming (9057 - 12600, n=133, last 2 years) | |
| Asus ROG Zephyrus G16 2024 GU605M | |
| Alienware x16 R2 P120F | |
| PCMark 10 / Productivity | |
| SCHENKER XMG Neo 16 (Early 24) | |
| Razer Blade 16 2024, RTX 4090 | |
| Lenovo Legion 9 16IRX9, RTX 4090 | |
| Asus ROG Zephyrus G16 GU605MY | |
| Average Intel Core Ultra 9 185H, NVIDIA GeForce RTX 4090 Laptop GPU (n=1) | |
| Average of class Gaming (6662 - 14612, n=133, last 2 years) | |
| Asus ROG Zephyrus G16 2024 GU605M | |
| Alienware x16 R2 P120F | |
| PCMark 10 / Digital Content Creation | |
| SCHENKER XMG Neo 16 (Early 24) | |
| Lenovo Legion 9 16IRX9, RTX 4090 | |
| Razer Blade 16 2024, RTX 4090 | |
| Alienware x16 R2 P120F | |
| Asus ROG Zephyrus G16 GU605MY | |
| Average Intel Core Ultra 9 185H, NVIDIA GeForce RTX 4090 Laptop GPU (n=1) | |
| Average of class Gaming (6807 - 18475, n=133, last 2 years) | |
| Asus ROG Zephyrus G16 2024 GU605M | |
| CrossMark / Overall | |
| SCHENKER XMG Neo 16 (Early 24) | |
| Razer Blade 16 2024, RTX 4090 | |
| Lenovo Legion 9 16IRX9, RTX 4090 | |
| Average of class Gaming (1247 - 2344, n=114, last 2 years) | |
| Asus ROG Zephyrus G16 GU605MY | |
| Average Intel Core Ultra 9 185H, NVIDIA GeForce RTX 4090 Laptop GPU (n=1) | |
| Asus ROG Zephyrus G16 2024 GU605M | |
| Alienware x16 R2 P120F | |
| CrossMark / Productivity | |
| SCHENKER XMG Neo 16 (Early 24) | |
| Razer Blade 16 2024, RTX 4090 | |
| Average of class Gaming (1299 - 2204, n=114, last 2 years) | |
| Lenovo Legion 9 16IRX9, RTX 4090 | |
| Asus ROG Zephyrus G16 GU605MY | |
| Average Intel Core Ultra 9 185H, NVIDIA GeForce RTX 4090 Laptop GPU (n=1) | |
| Asus ROG Zephyrus G16 2024 GU605M | |
| Alienware x16 R2 P120F | |
| CrossMark / Creativity | |
| SCHENKER XMG Neo 16 (Early 24) | |
| Razer Blade 16 2024, RTX 4090 | |
| Lenovo Legion 9 16IRX9, RTX 4090 | |
| Average of class Gaming (1275 - 2660, n=114, last 2 years) | |
| Asus ROG Zephyrus G16 GU605MY | |
| Average Intel Core Ultra 9 185H, NVIDIA GeForce RTX 4090 Laptop GPU (n=1) | |
| Asus ROG Zephyrus G16 2024 GU605M | |
| Alienware x16 R2 P120F | |
| CrossMark / Responsiveness | |
| SCHENKER XMG Neo 16 (Early 24) | |
| Razer Blade 16 2024, RTX 4090 | |
| Lenovo Legion 9 16IRX9, RTX 4090 | |
| Average of class Gaming (1030 - 2330, n=114, last 2 years) | |
| Alienware x16 R2 P120F | |
| Asus ROG Zephyrus G16 GU605MY | |
| Average Intel Core Ultra 9 185H, NVIDIA GeForce RTX 4090 Laptop GPU (n=1) | |
| Asus ROG Zephyrus G16 2024 GU605M | |
| WebXPRT 3 / Overall | |
| SCHENKER XMG Neo 16 (Early 24) | |
| Razer Blade 16 2024, RTX 4090 | |
| Average of class Gaming (215 - 480, n=127, last 2 years) | |
| Asus ROG Zephyrus G16 2024 GU605M | |
| Asus ROG Zephyrus G16 GU605MY | |
| Average Intel Core Ultra 9 185H, NVIDIA GeForce RTX 4090 Laptop GPU (n=1) | |
| Lenovo Legion 9 16IRX9, RTX 4090 | |
| Alienware x16 R2 P120F | |
| WebXPRT 4 / Overall | |
| SCHENKER XMG Neo 16 (Early 24) | |
| Asus ROG Zephyrus G16 GU605MY | |
| Average Intel Core Ultra 9 185H, NVIDIA GeForce RTX 4090 Laptop GPU (n=1) | |
| Average of class Gaming (176.4 - 335, n=115, last 2 years) | |
| Asus ROG Zephyrus G16 2024 GU605M | |
| Lenovo Legion 9 16IRX9, RTX 4090 | |
| Alienware x16 R2 P120F | |
| Mozilla Kraken 1.1 / Total | |
| Alienware x16 R2 P120F | |
| Asus ROG Zephyrus G16 2024 GU605M | |
| Lenovo Legion 9 16IRX9, RTX 4090 | |
| Asus ROG Zephyrus G16 GU605MY | |
| Average Intel Core Ultra 9 185H, NVIDIA GeForce RTX 4090 Laptop GPU (n=1) | |
| Average of class Gaming (409 - 674, n=139, last 2 years) | |
| Razer Blade 16 2024, RTX 4090 | |
| SCHENKER XMG Neo 16 (Early 24) | |
* ... smaller is better
| PCMark 10 Score | 7993 points | |
Help | ||
| AIDA64 / Memory Copy | |
| Asus ROG Zephyrus G16 GU605MY | |
| Alienware x16 R2 P120F | |
| Asus ROG Zephyrus G16 2024 GU605M | |
| Average Intel Core Ultra 9 185H (69929 - 95718, n=19) | |
| Lenovo Legion 9 16IRX9, RTX 4090 | |
| SCHENKER XMG Neo 16 (Early 24) | |
| Razer Blade 16 2024, RTX 4090 | |
| Average of class Gaming (21750 - 97515, n=147, last 2 years) | |
| AIDA64 / Memory Read | |
| SCHENKER XMG Neo 16 (Early 24) | |
| Asus ROG Zephyrus G16 2024 GU605M | |
| Razer Blade 16 2024, RTX 4090 | |
| Asus ROG Zephyrus G16 GU605MY | |
| Alienware x16 R2 P120F | |
| Lenovo Legion 9 16IRX9, RTX 4090 | |
| Average Intel Core Ultra 9 185H (64619 - 87768, n=19) | |
| Average of class Gaming (22956 - 102937, n=147, last 2 years) | |
| AIDA64 / Memory Write | |
| Lenovo Legion 9 16IRX9, RTX 4090 | |
| SCHENKER XMG Neo 16 (Early 24) | |
| Asus ROG Zephyrus G16 GU605MY | |
| Razer Blade 16 2024, RTX 4090 | |
| Asus ROG Zephyrus G16 2024 GU605M | |
| Alienware x16 R2 P120F | |
| Average Intel Core Ultra 9 185H (51114 - 93871, n=19) | |
| Average of class Gaming (22297 - 108954, n=147, last 2 years) | |
| AIDA64 / Memory Latency | |
| Average Intel Core Ultra 9 185H (121.4 - 259, n=19) | |
| Alienware x16 R2 P120F | |
| Asus ROG Zephyrus G16 2024 GU605M | |
| Asus ROG Zephyrus G16 GU605MY | |
| Average of class Gaming (59.5 - 259, n=147, last 2 years) | |
| Lenovo Legion 9 16IRX9, RTX 4090 | |
| Razer Blade 16 2024, RTX 4090 | |
| SCHENKER XMG Neo 16 (Early 24) | |
* ... smaller is better
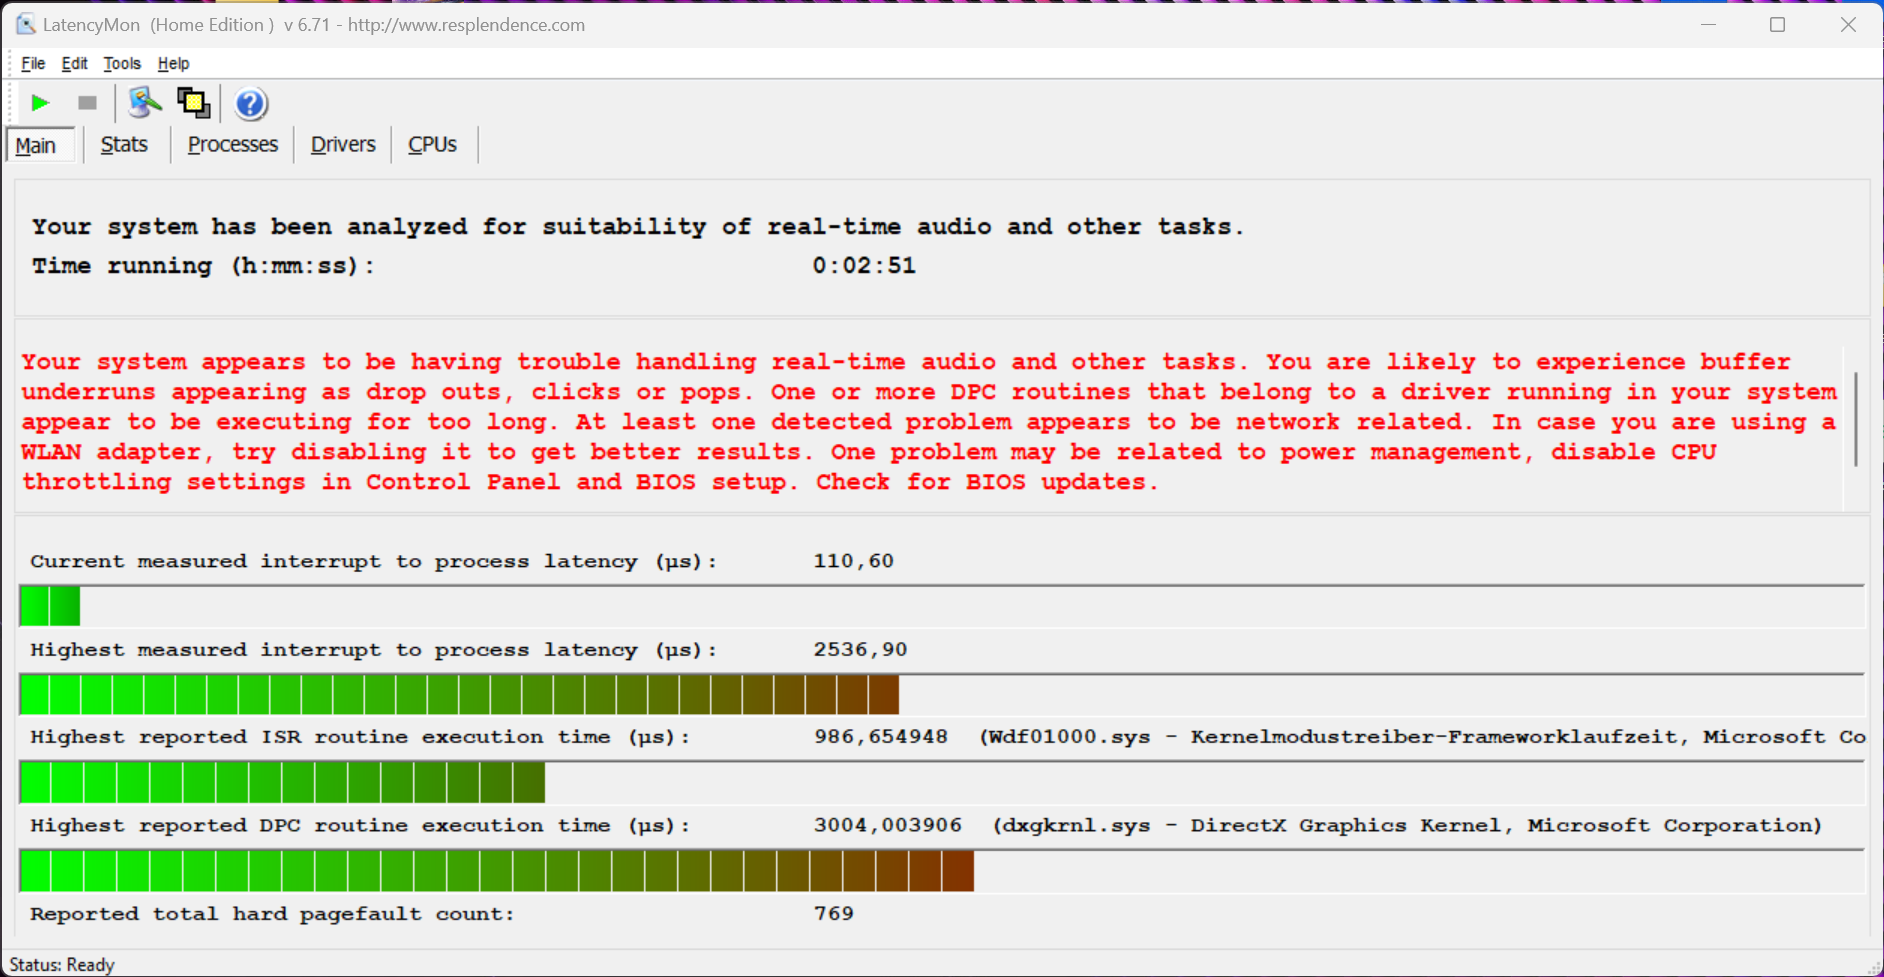
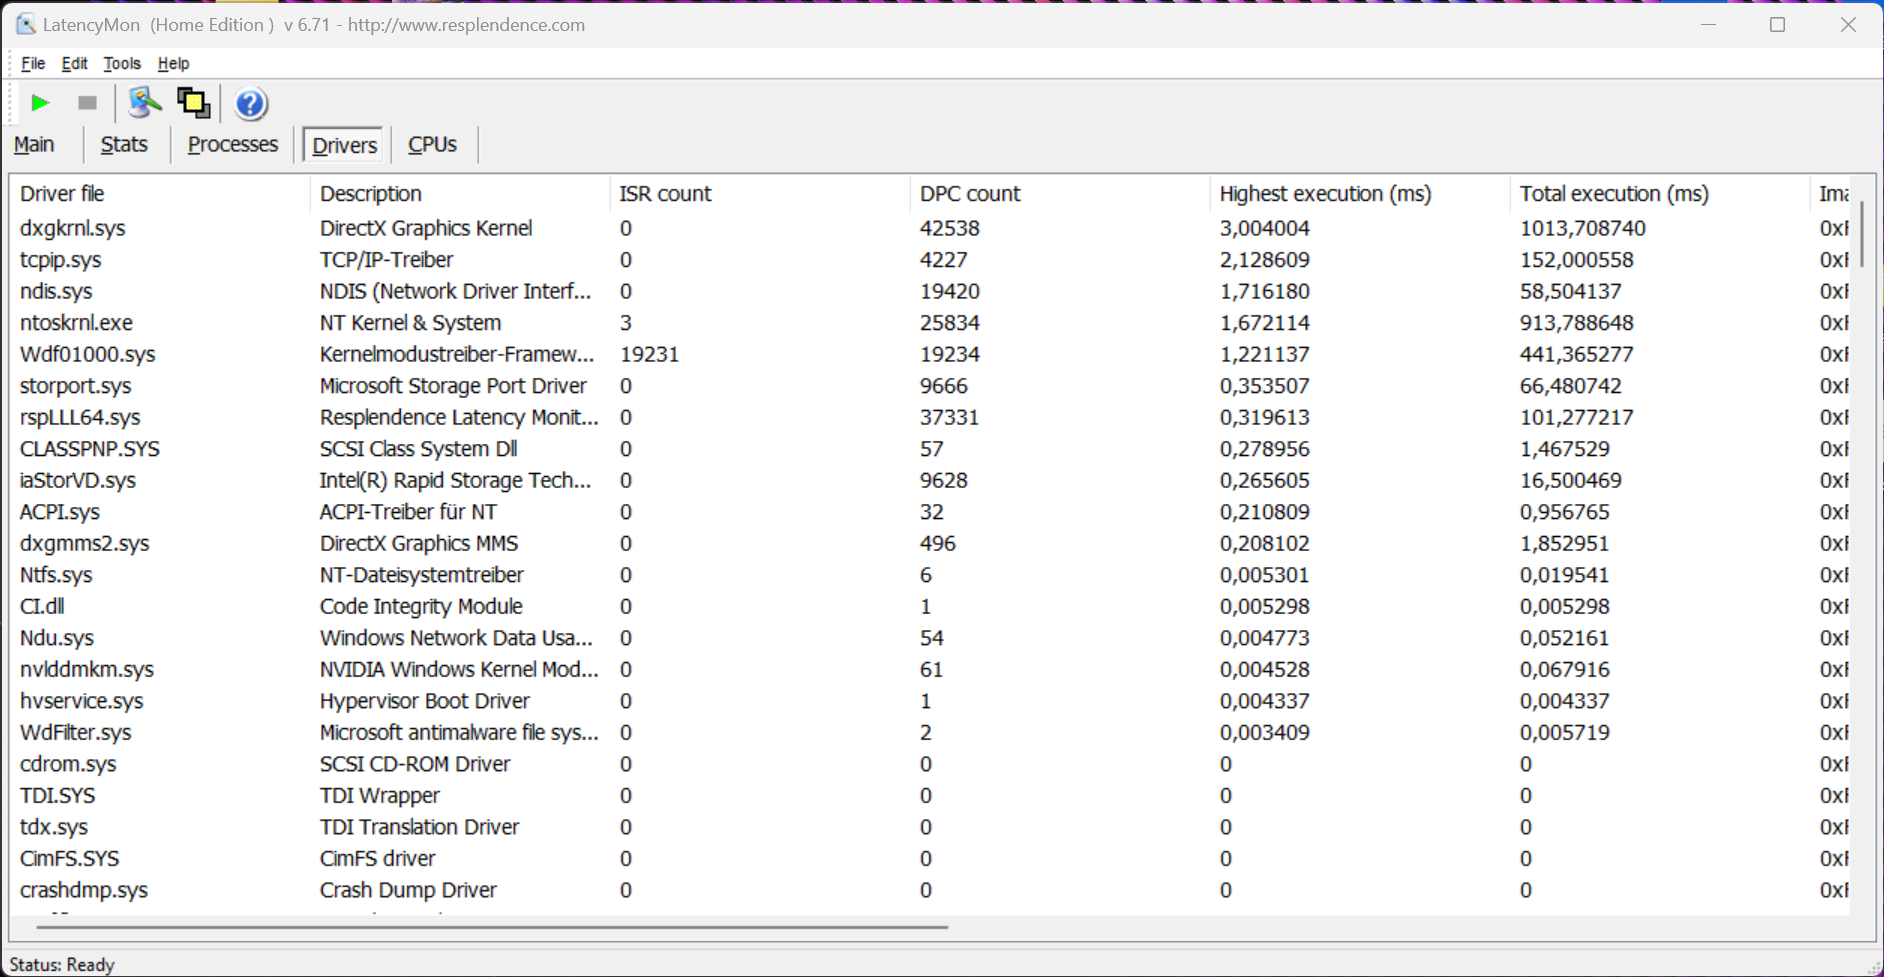
DPC 延迟
在我们的标准化延迟测试(上网、4K YouTube 播放、CPU 负载)中,在当前 BIOS 下,评测设备在使用实时音频应用程序时显示出了局限性。不过,在 RTX 4070 型号.
| DPC Latencies / LatencyMon - interrupt to process latency (max), Web, Youtube, Prime95 | |
| Alienware x16 R2 P120F | |
| Asus ROG Zephyrus G16 GU605MY | |
| Asus ROG Zephyrus G16 2024 GU605M | |
| SCHENKER XMG Neo 16 (Early 24) | |
| Lenovo Legion 9 16IRX9, RTX 4090 | |
| Razer Blade 16 2024, RTX 4090 | |
* ... smaller is better
大容量存储器
Zephyrus G16 为 M.2 2280 固态硬盘提供了两个快速 PCIe 4.0 插槽,这意味着存储容量可以快速、经济地升级。我们的评测设备配备了 2 TB 的三星 PM9A1a 固态硬盘,不过首次安装后用户还可使用 1.76 TB。在合成测试中,固态硬盘并没有完全达到我们的预期,但我们使用的仍然是一款速度非常快的存储硬盘,即使在持续负载的情况下,传输速度也能保持完全一致。其他固态硬盘基准测试可在 这里.

* ... smaller is better
Continuous Performance Read: DiskSpd Read Loop, Queue Depth 8
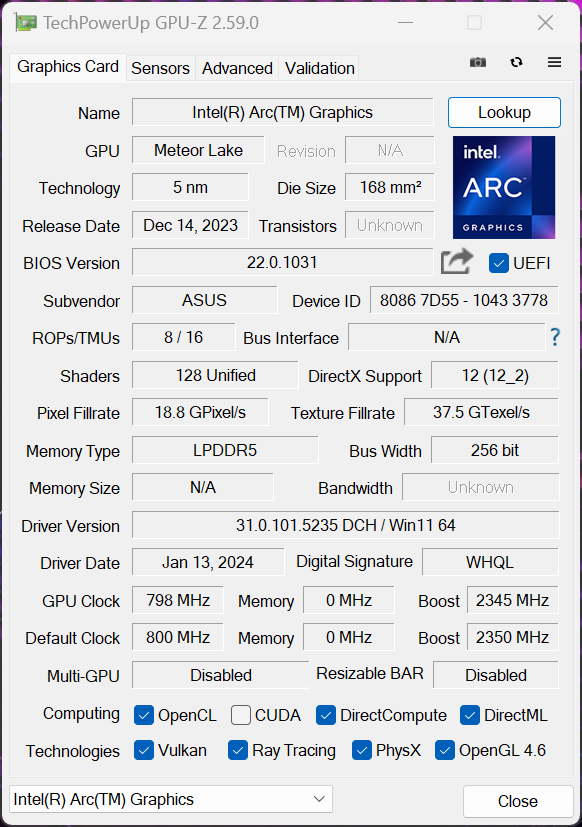
显卡 -GeForce RTX 4090 笔记本电脑
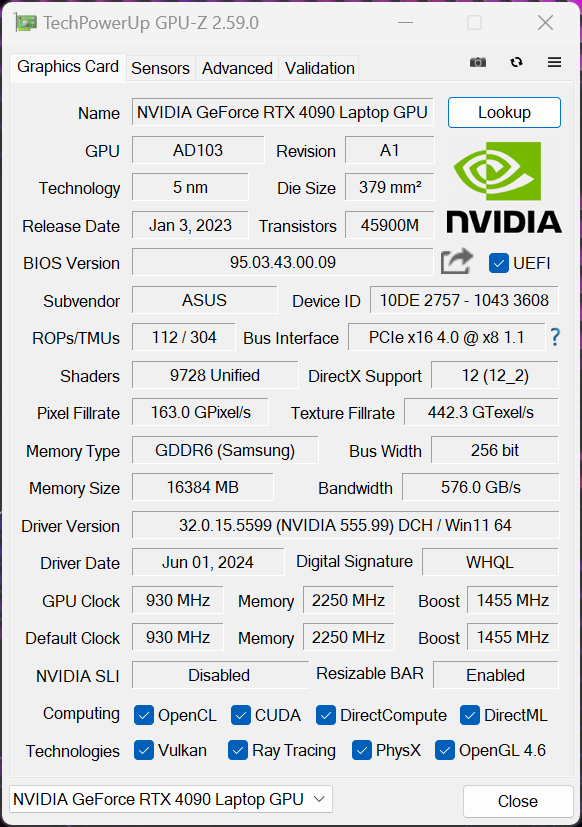
Zephyrus G16 可用于当前GeForce RTX 笔记本电脑的全系列型号(4050-4090),不过,其轻薄设计在快速型号中表现得淋漓尽致。在涡轮增压模式下 GeForce RTX 4090 笔记本电脑在涡轮增压模式下,RTX 4090 笔记本电脑的 TGP 只有 95 瓦+20 瓦动态增压,这意味着它与 175 瓦的最大配置(150 TGP + 25 瓦动态增压)相差甚远。潜在买家应该了解这一点,以免日后失望。在 GPU 基准测试中,我们可以清楚地看到与其他 RTX 4090 笔记本电脑型号相比的劣势,后者的速度在 15-26% 之间。即使是 RTX 4080 笔记本电脑中的 Alienware x16 R2(175W) 也比 Zephyrus G16 中的 RTX 4090 快一些。
与 配备 RTX 4070 的 Zephyrus G16 笔记本电脑相比相比,Zephyrus G16 与 RTX 4070 笔记本电脑的优势为 50%,当然,这仍然是巨大的优势,尤其是考虑到其紧凑的机箱。基本上,RTX 4070 笔记本电脑(以及较弱的版本)与 Zephyrus G16 搭配使用时,可以更好地发挥其潜力。根据不同的使用情况,更大的显存容量(16 GB)可以带来额外的优势,例如在编辑视频时。
在持续负载情况下,GPU 性能保持稳定,但在电池模式下,GPU 允许消耗的最大功率为 55 瓦,这就是 GPU 性能大幅下降(-52%)的原因。其他 GPU 基准测试见 这里.
| 3DMark 11 Performance | 38012 points | |
| 3DMark Fire Strike Score | 30964 points | |
| 3DMark Time Spy Score | 15660 points | |
| 3DMark Steel Nomad Score | 3915 points | |
Help | ||
| Blender / v3.3 Classroom OPTIX/RTX | |
| Asus ROG Zephyrus G16 2024 GU605M | |
| Average of class Gaming (10 - 95, n=143, last 2 years) | |
| Alienware x16 R2 P120F | |
| Asus ROG Zephyrus G16 GU605MY | |
| Lenovo Legion 9 16IRX9, RTX 4090 | |
| SCHENKER XMG Neo 16 (Early 24) | |
| Average NVIDIA GeForce RTX 4090 Laptop GPU (9 - 19, n=39) | |
| Razer Blade 16 2024, RTX 4090 | |
| Blender / v3.3 Classroom CUDA | |
| Average of class Gaming (16 - 175, n=145, last 2 years) | |
| Asus ROG Zephyrus G16 2024 GU605M | |
| Alienware x16 R2 P120F | |
| Asus ROG Zephyrus G16 GU605MY | |
| Average NVIDIA GeForce RTX 4090 Laptop GPU (16 - 24, n=39) | |
| Razer Blade 16 2024, RTX 4090 | |
| Lenovo Legion 9 16IRX9, RTX 4090 | |
| SCHENKER XMG Neo 16 (Early 24) | |
| Blender / v3.3 Classroom CPU | |
| Asus ROG Zephyrus G16 2024 GU605M | |
| Asus ROG Zephyrus G16 GU605MY | |
| Alienware x16 R2 P120F | |
| Average of class Gaming (123 - 962, n=150, last 2 years) | |
| Razer Blade 16 2024, RTX 4090 | |
| Average NVIDIA GeForce RTX 4090 Laptop GPU (144 - 305, n=39) | |
| Lenovo Legion 9 16IRX9, RTX 4090 | |
| SCHENKER XMG Neo 16 (Early 24) | |
* ... smaller is better
游戏性能
GPU 测试中的情况在游戏基准测试中也得到了延续,因为 Zephyrus G16 中的 RTX 4090 笔记本电脑与 Core Ultra 185H 相结合,明显落后于配备 HX CPU 和 RTX 4090 笔记本电脑的竞争对手。笔记本电脑 Alienware x16 R2搭配酷睿 Ultra 9 和 RTX 4080 笔记本电脑的游戏性能也略胜一筹。此外,配备 Zephyrus G16 搭配 RTX 4070 笔记本电脑被全面击败,尤其是在 QHD 测试中。
总而言之,配备 RTX 4090 的 Zephyrus G16 笔记本电脑和快速 OLED 面板非常适合游戏。在原生 QHD 分辨率下,你可以毫不犹豫地以最高细节流畅地玩所有当前的游戏。不过,我们的《赛博朋克 2077》 循环测试表明,在运行要求较高的游戏时,游戏性能并不完全稳定,会出现小幅性能下降。更多游戏基准测试可在 这里.
| GTA V - 1920x1080 Highest Settings possible AA:4xMSAA + FX AF:16x | |
| SCHENKER XMG Neo 16 (Early 24) | |
| Razer Blade 16 2024, RTX 4090 | |
| Lenovo Legion 9 16IRX9, RTX 4090 | |
| Average of class Gaming (12.1 - 168.2, n=132, last 2 years) | |
| Asus ROG Zephyrus G16 GU605MY | |
| Asus ROG Zephyrus G16 2024 GU605M | |
| Cyberpunk 2077 2.2 Phantom Liberty - 1920x1080 Ultra Preset (FSR off) | |
| SCHENKER XMG Neo 16 (Early 24) | |
| Lenovo Legion 9 16IRX9, RTX 4090 | |
| Alienware x16 R2 P120F | |
| Razer Blade 16 2024, RTX 4090 | |
| Asus ROG Zephyrus G16 GU605MY | |
| Average of class Gaming (6.76 - 158, n=90, last 2 years) | |
| Asus ROG Zephyrus G16 2024 GU605M | |
| Horizon Forbidden West | |
| 1920x1080 Very High Preset AA:T | |
| SCHENKER XMG Neo 16 (Early 24) | |
| Average NVIDIA GeForce RTX 4090 Laptop GPU (81 - 125.2, n=3) | |
| Asus ROG Zephyrus G16 GU605MY | |
| Average of class Gaming (14.7 - 125.2, n=10, last 2 years) | |
| 2560x1440 Very High Preset AA:T | |
| SCHENKER XMG Neo 16 (Early 24) | |
| Average NVIDIA GeForce RTX 4090 Laptop GPU (66 - 98, n=3) | |
| Asus ROG Zephyrus G16 GU605MY | |
| Average of class Gaming (24.1 - 98, n=9, last 2 years) | |
Cyberpunk 2077 ultra FPS diagram
| low | med. | high | ultra | QHD DLSS | QHD | 4K DLSS | 4K | |
|---|---|---|---|---|---|---|---|---|
| GTA V (2015) | 172.6 | 107.1 | 103.4 | 139.9 | ||||
| Dota 2 Reborn (2015) | 172.2 | 150.8 | 150.3 | 138.7 | 135.8 | |||
| Final Fantasy XV Benchmark (2018) | 183.5 | 168.4 | 138 | 113.3 | 68.9 | |||
| X-Plane 11.11 (2018) | 138.3 | 111.7 | 90 | 75.7 | ||||
| Far Cry 5 (2018) | 138 | 128 | 117 | 115 | 80 | |||
| Strange Brigade (2018) | 431 | 340 | 314 | 288 | 225 | 120 | ||
| Star Wars Jedi Survivor (2023) | 173 | 166 | 154 | 148 | 114 | 59 | ||
| F1 23 (2023) | 215 | 217 | 211 | 86.2 | 58 | 50.1 | 30.2 | |
| Baldur's Gate 3 (2023) | 144 | 126 | 123 | 118 | 99 | 57 | ||
| Cyberpunk 2077 2.2 Phantom Liberty (2023) | 119.8 | 106.6 | 109.6 | 93.1 | 68.1 | 32.9 | ||
| Call of Duty Modern Warfare 3 2023 (2023) | 204 | 189 | 155 | 148 | 113 | 73 | ||
| Horizon Forbidden West (2024) | 117 | 110 | 89 | 81 | 66 | 42.5 | ||
| F1 24 (2024) | 230 | 232 | 216 | 88 | 58.5 | 49.8 | 30.3 | |
| Black Myth: Wukong (2024) | 67 | 40 | 44 | 39 |
排放 - 蒸汽腔通常噪音较大
噪音排放
风扇的风量主要取决于所选的能耗曲线。在空闲和低负载状态下,Zephyrus G16 仍然非常安静,即使在速度较快的配置文件中也是如此。在游戏中同时使用 "静音"和 "性能"模式时,蒸汽腔冷却的声音会比 RTX 4070 型号稍大一些,而且在没有耳机的情况下,只有使用 "静音 "模式才能真正正常游戏。在涡轮增压模式下,噪音达到 52.3 dB(A),这是 RTX 4070 变体的最大风扇音量。然而,竞争产品的噪音甚至略高于此,唯一的例外是 Blade 16,不过你也不能把 50 分贝(A)称作安静。我们的评测设备没有发出任何其他电子噪音。根据华硕的说法,我们在评测 RTX 4070 变体时遇到的第三个风扇的问题现在应该已经通过 BIOS 更新解决了。
| 能耗曲线 | 3DMark 06 | 赛博朋克 2077 | 压力测试 |
|---|---|---|---|
| 静音 | 30.9 dB(A) | 41.4 dB(A) | 41.4 dB(A) |
| 性能 | 36.1 dB(A) | 48.1 dB(A) | 48.1 dB(A) |
| 涡轮 | 49.2 dB(A) | 52.3 dB(A) | 52.3 dB(A) |
| 能耗曲线 | 3DMark 06 | 赛博朋克 2077 | 压力测试 |
|---|---|---|---|
| 静音 | 30.4 dB(A) | 41.5 dB(A) | 41.5 dB(A) |
| 性能 | 34.2 dB(A) | 46.4 dB(A) | 46.4 dB(A) |
| 涡轮 | 41.5 dB(A) | 52.4 dB(A) | 52.4 dB(A) |
Noise Level
| Idle |
| 24.6 / 27.8 / 31.9 dB(A) |
| Load |
| 49.2 / 52.3 dB(A) |
 | ||
30 dB silent 40 dB(A) audible 50 dB(A) loud |
||
min: | ||
| Asus ROG Zephyrus G16 GU605MY NVIDIA GeForce RTX 4090 Laptop GPU, Ultra 9 185H, Samsung PM9A1a MZVL22T0HDLB | SCHENKER XMG Neo 16 (Early 24) NVIDIA GeForce RTX 4090 Laptop GPU, i9-14900HX, Samsung 990 Pro 1 TB | Lenovo Legion 9 16IRX9, RTX 4090 NVIDIA GeForce RTX 4090 Laptop GPU, i9-14900HX, Micron 3400 2TB MTFDKBA2T0TFH | Alienware x16 R2 P120F NVIDIA GeForce RTX 4080 Laptop GPU, Ultra 9 185H, WDC PC SN810 1TB | Razer Blade 16 2024, RTX 4090 NVIDIA GeForce RTX 4090 Laptop GPU, i9-14900HX, Samsung PM9A1 MZVL22T0HBLB | Asus ROG Zephyrus G16 2024 GU605M NVIDIA GeForce RTX 4070 Laptop GPU, Ultra 7 155H, WD PC SN560 SDDPNQE-1T00 | |
|---|---|---|---|---|---|---|
| Noise | -5% | 12% | 9% | 10% | 9% | |
| off / environment * | 24.6 | 26 -6% | 23 7% | 23.4 5% | 23 7% | 23.9 3% |
| Idle Minimum * | 24.6 | 28 -14% | 23 7% | 23.8 3% | 23 7% | 23.9 3% |
| Idle Average * | 27.8 | 29 -4% | 23 17% | 28.5 -3% | 23 17% | 27.8 -0% |
| Idle Maximum * | 31.9 | 31 3% | 23 28% | 28.5 11% | 27.66 13% | 30.1 6% |
| Load Average * | 49.2 | 51 -4% | 39 21% | 28.8 41% | 43.76 11% | 34.2 30% |
| Cyberpunk 2077 ultra * | 52.3 | |||||
| Load Maximum * | 52.3 | 56 -7% | 55.56 -6% | 54.2 -4% | 50.37 4% | 46.4 11% |
| Witcher 3 ultra * | 54 | 55.32 | 49.5 | 46.81 | 46.4 |
* ... smaller is better
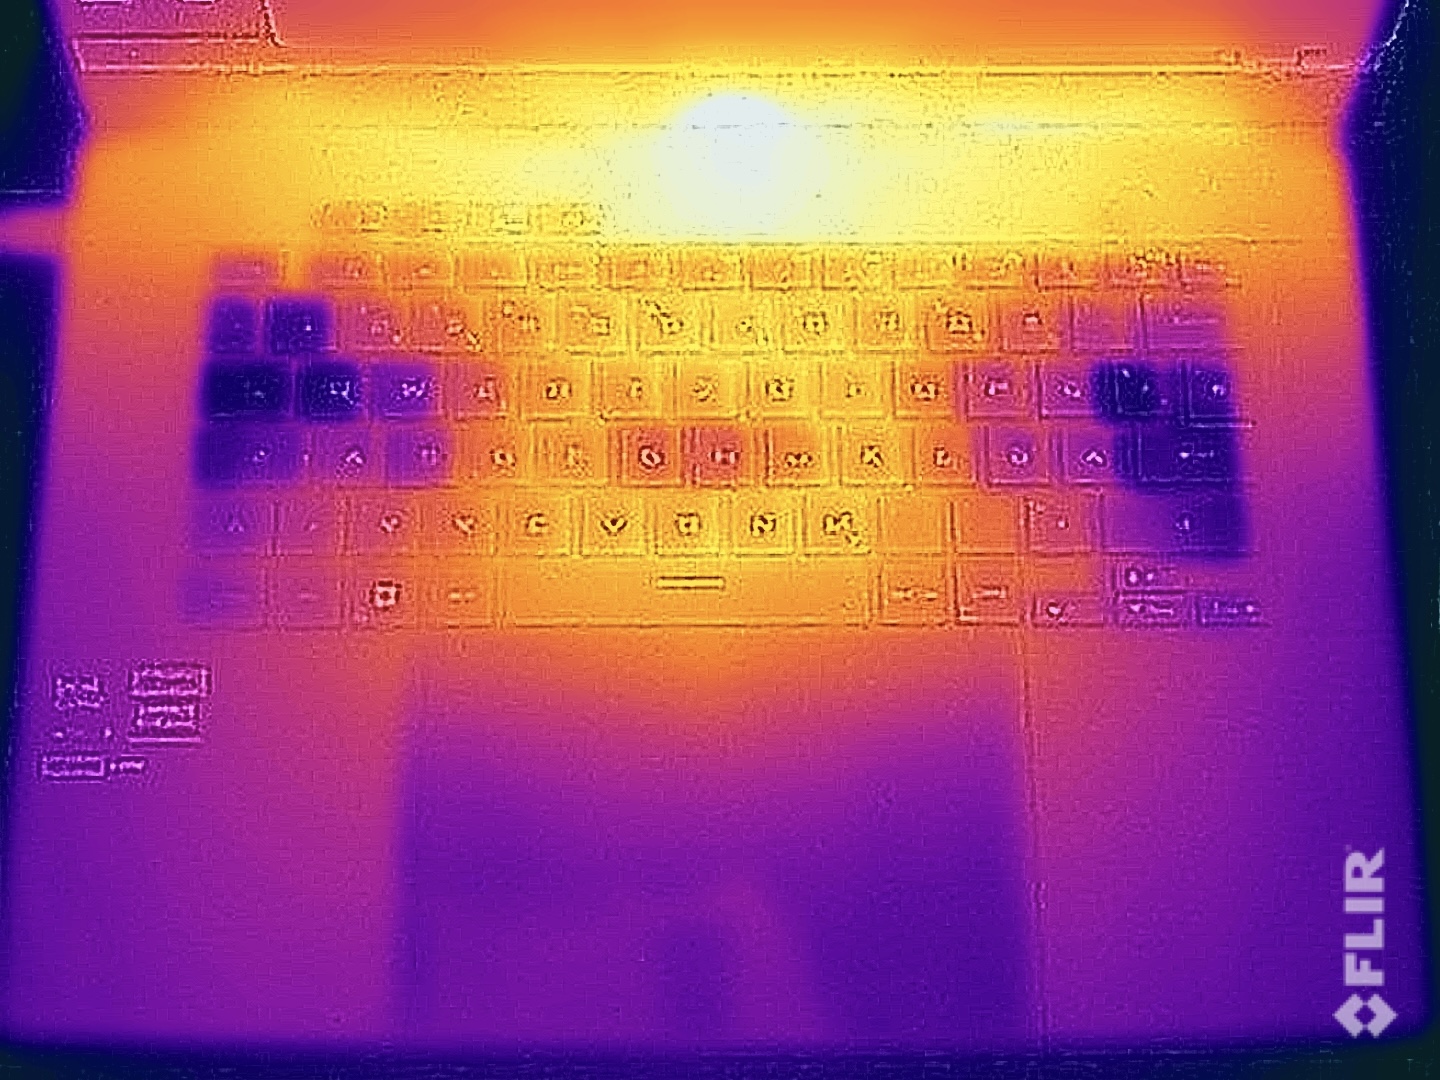
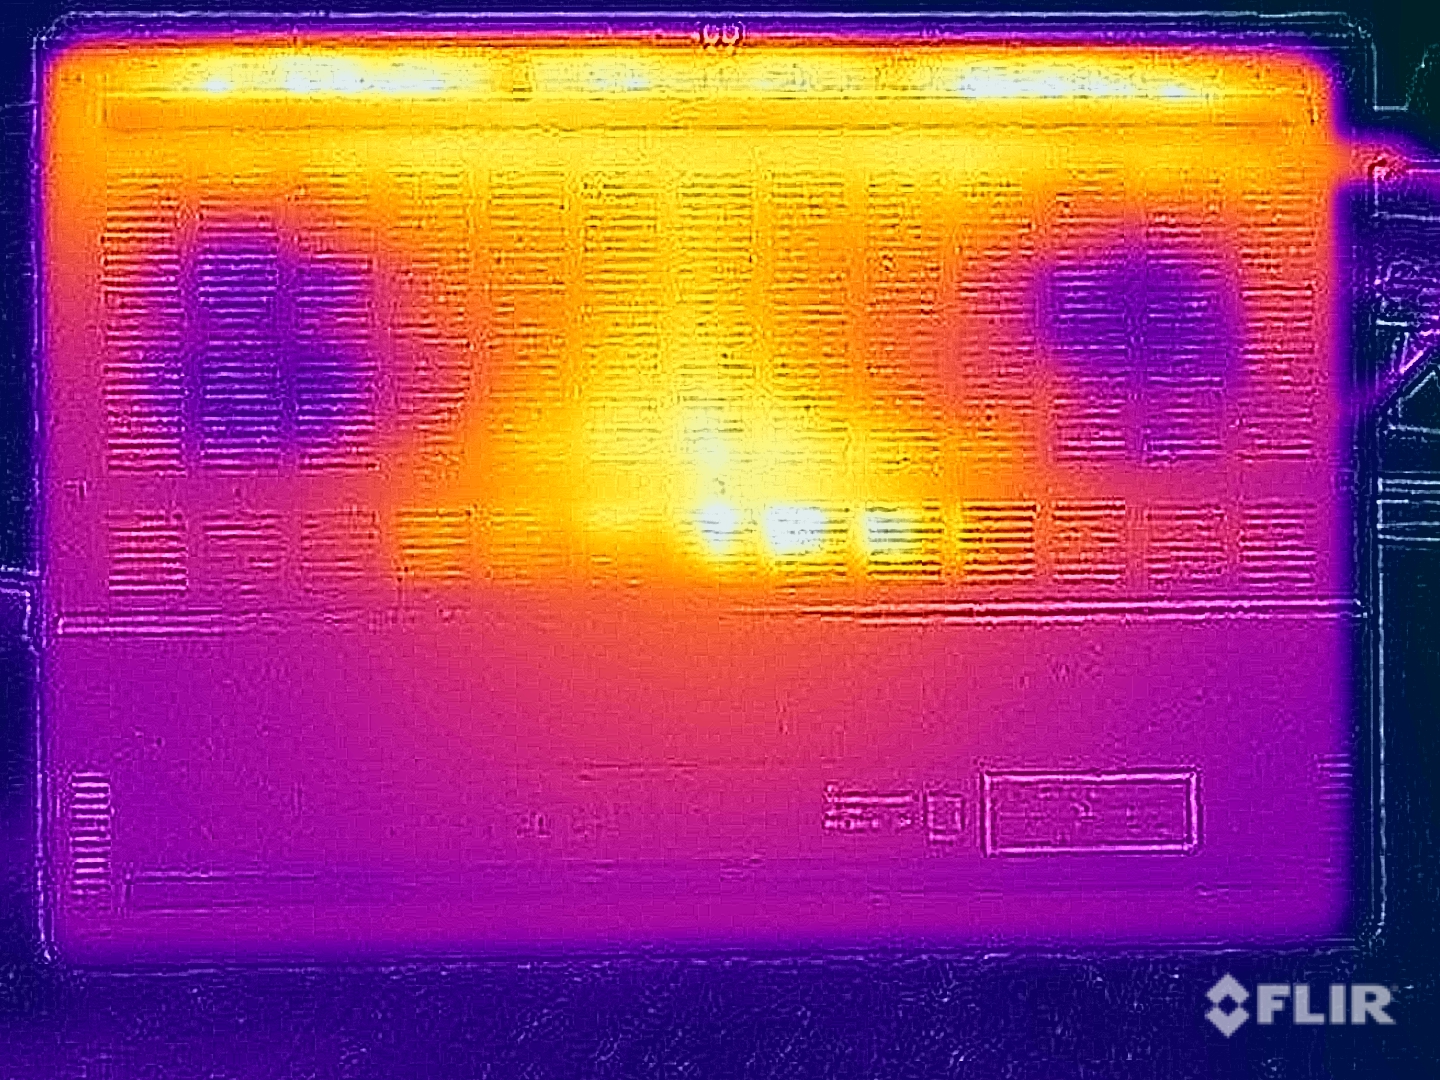
温度
在理想使用和执行简单任务时,机箱的金属表面依然非常凉爽,你可以毫不犹豫地将设备放在膝盖上。在玩游戏和压力测试时,我们测得后部中间区域的底座温度高达 47 °C。这并不值得担心,但在这种情况下,你不应该把设备放在膝盖上使用。在底座的上侧,键盘上方的中间区域容易发热,但键盘本身的温度明显较低,中间最高温度为 40 °C,两侧约为 36 °C。这意味着打字和游戏都不会出现任何问题。
(-) The maximum temperature on the upper side is 45.9 °C / 115 F, compared to the average of 40.4 °C / 105 F, ranging from 21.2 to 68.8 °C for the class Gaming.
(-) The bottom heats up to a maximum of 47.5 °C / 118 F, compared to the average of 43.2 °C / 110 F
(+) In idle usage, the average temperature for the upper side is 25.3 °C / 78 F, compared to the device average of 33.9 °C / 93 F.
(±) 3: The average temperature for the upper side is 36.7 °C / 98 F, compared to the average of 33.9 °C / 93 F for the class Gaming.
(+) The palmrests and touchpad are cooler than skin temperature with a maximum of 30.8 °C / 87.4 F and are therefore cool to the touch.
(±) The average temperature of the palmrest area of similar devices was 28.9 °C / 84 F (-1.9 °C / -3.4 F).
| Asus ROG Zephyrus G16 GU605MY Intel Core Ultra 9 185H, NVIDIA GeForce RTX 4090 Laptop GPU | SCHENKER XMG Neo 16 (Early 24) Intel Core i9-14900HX, NVIDIA GeForce RTX 4090 Laptop GPU | Lenovo Legion 9 16IRX9, RTX 4090 Intel Core i9-14900HX, NVIDIA GeForce RTX 4090 Laptop GPU | Alienware x16 R2 P120F Intel Core Ultra 9 185H, NVIDIA GeForce RTX 4080 Laptop GPU | Razer Blade 16 2024, RTX 4090 Intel Core i9-14900HX, NVIDIA GeForce RTX 4090 Laptop GPU | Asus ROG Zephyrus G16 2024 GU605M Intel Core Ultra 7 155H, NVIDIA GeForce RTX 4070 Laptop GPU | |
|---|---|---|---|---|---|---|
| Heat | -6% | -32% | -23% | -4% | -8% | |
| Maximum Upper Side * | 45.9 | 47 -2% | 56 -22% | 51 -11% | 45 2% | 50.3 -10% |
| Maximum Bottom * | 47.5 | 56 -18% | 53 -12% | 50.8 -7% | 45 5% | 48 -1% |
| Idle Upper Side * | 26.1 | 27 -3% | 38 -46% | 36.6 -40% | 29 -11% | 28.8 -10% |
| Idle Bottom * | 26.6 | 27 -2% | 39 -47% | 35.2 -32% | 30 -13% | 29.8 -12% |
* ... smaller is better
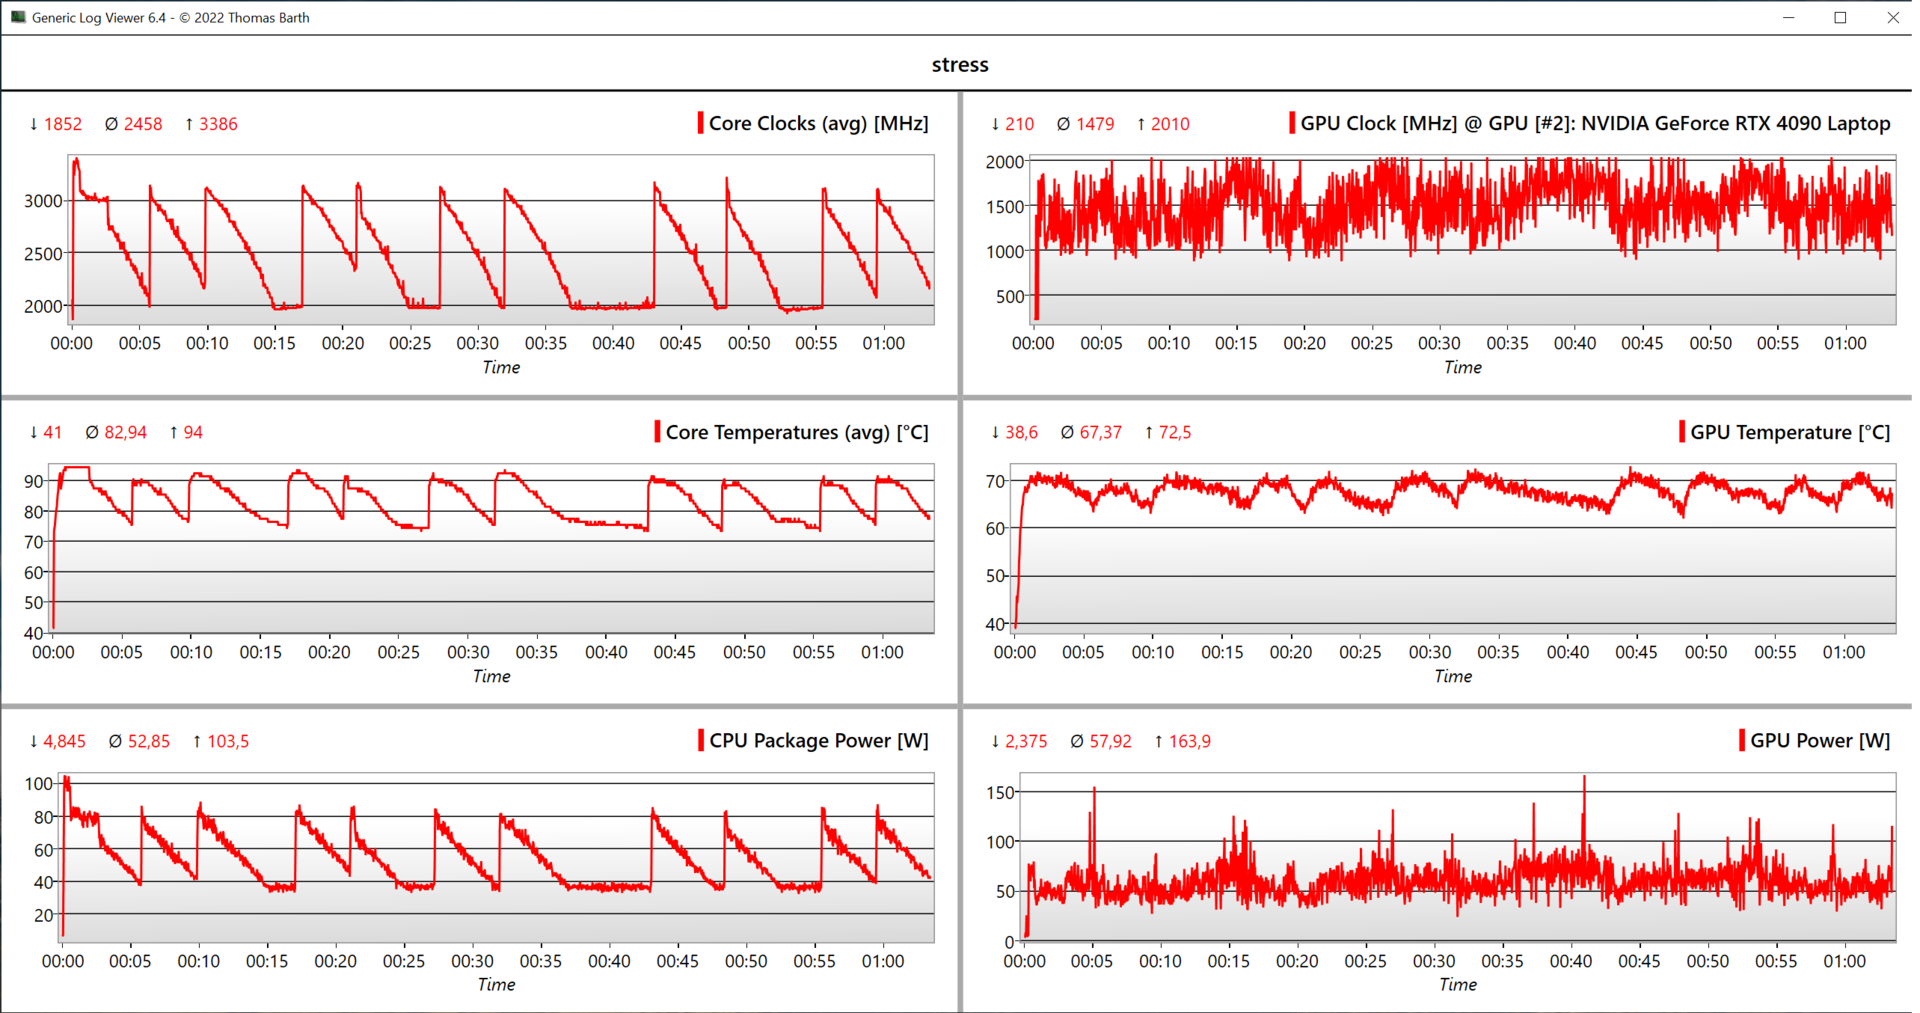
压力测试
在 CPU/GPU 综合负载的压力测试中,Zephyrus 顶级机型无法稳定运行。CPU 功耗周期性地在 40-80 瓦之间波动,一小时后,平均功耗为 53 瓦。显卡的功耗没有如此大的波动,但仍然 "只有 "58 瓦左右。根据华硕的说法,在这种情况下,处理器的功耗应为 35 瓦,显卡的功耗应为 95 瓦,但我们无法再现这些数值。
发言人
Asus ROG Zephyrus G16 GU605MY audio analysis
(+) | speakers can play relatively loud (83 dB)
Bass 100 - 315 Hz
(+) | good bass - only 3.3% away from median
(±) | linearity of bass is average (7.6% delta to prev. frequency)
Mids 400 - 2000 Hz
(+) | balanced mids - only 3.4% away from median
(+) | mids are linear (3.1% delta to prev. frequency)
Highs 2 - 16 kHz
(+) | balanced highs - only 1.7% away from median
(+) | highs are linear (4.6% delta to prev. frequency)
Overall 100 - 16.000 Hz
(+) | overall sound is linear (6.5% difference to median)
Compared to same class
» 0% of all tested devices in this class were better, 0% similar, 100% worse
» The best had a delta of 6%, average was 18%, worst was 132%
Compared to all devices tested
» 1% of all tested devices were better, 0% similar, 99% worse
» The best had a delta of 4%, average was 24%, worst was 134%
SCHENKER XMG Neo 16 (Early 24) audio analysis
(+) | speakers can play relatively loud (86 dB)
Bass 100 - 315 Hz
(-) | nearly no bass - on average 16.3% lower than median
(±) | linearity of bass is average (8.6% delta to prev. frequency)
Mids 400 - 2000 Hz
(+) | balanced mids - only 3% away from median
(+) | mids are linear (3.6% delta to prev. frequency)
Highs 2 - 16 kHz
(+) | balanced highs - only 2.5% away from median
(+) | highs are linear (4.9% delta to prev. frequency)
Overall 100 - 16.000 Hz
(+) | overall sound is linear (12.4% difference to median)
Compared to same class
» 14% of all tested devices in this class were better, 3% similar, 83% worse
» The best had a delta of 6%, average was 18%, worst was 132%
Compared to all devices tested
» 9% of all tested devices were better, 2% similar, 89% worse
» The best had a delta of 4%, average was 24%, worst was 134%
Lenovo Legion 9 16IRX9, RTX 4090 audio analysis
(±) | speaker loudness is average but good (78.96 dB)
Bass 100 - 315 Hz
(±) | reduced bass - on average 13.2% lower than median
(±) | linearity of bass is average (8.9% delta to prev. frequency)
Mids 400 - 2000 Hz
(+) | balanced mids - only 3.2% away from median
(+) | mids are linear (3.4% delta to prev. frequency)
Highs 2 - 16 kHz
(+) | balanced highs - only 1.8% away from median
(+) | highs are linear (4% delta to prev. frequency)
Overall 100 - 16.000 Hz
(+) | overall sound is linear (11.3% difference to median)
Compared to same class
» 8% of all tested devices in this class were better, 3% similar, 89% worse
» The best had a delta of 6%, average was 18%, worst was 132%
Compared to all devices tested
» 6% of all tested devices were better, 2% similar, 92% worse
» The best had a delta of 4%, average was 24%, worst was 134%
Alienware x16 R2 P120F audio analysis
(+) | speakers can play relatively loud (89.9 dB)
Bass 100 - 315 Hz
(±) | reduced bass - on average 7.4% lower than median
(±) | linearity of bass is average (7.6% delta to prev. frequency)
Mids 400 - 2000 Hz
(+) | balanced mids - only 2.6% away from median
(+) | mids are linear (3.6% delta to prev. frequency)
Highs 2 - 16 kHz
(+) | balanced highs - only 3.4% away from median
(+) | highs are linear (2.8% delta to prev. frequency)
Overall 100 - 16.000 Hz
(+) | overall sound is linear (8.2% difference to median)
Compared to same class
» 1% of all tested devices in this class were better, 1% similar, 98% worse
» The best had a delta of 6%, average was 18%, worst was 132%
Compared to all devices tested
» 1% of all tested devices were better, 1% similar, 98% worse
» The best had a delta of 4%, average was 24%, worst was 134%
Razer Blade 16 2024, RTX 4090 audio analysis
(±) | speaker loudness is average but good (81.16 dB)
Bass 100 - 315 Hz
(±) | reduced bass - on average 8.2% lower than median
(±) | linearity of bass is average (7.4% delta to prev. frequency)
Mids 400 - 2000 Hz
(+) | balanced mids - only 3.3% away from median
(+) | mids are linear (5.9% delta to prev. frequency)
Highs 2 - 16 kHz
(+) | balanced highs - only 1.6% away from median
(+) | highs are linear (3.1% delta to prev. frequency)
Overall 100 - 16.000 Hz
(+) | overall sound is linear (9.2% difference to median)
Compared to same class
» 3% of all tested devices in this class were better, 1% similar, 96% worse
» The best had a delta of 6%, average was 18%, worst was 132%
Compared to all devices tested
» 3% of all tested devices were better, 1% similar, 97% worse
» The best had a delta of 4%, average was 24%, worst was 134%
能量管理 - 比竞争对手更有耐力
耗电量
空闲运行时,消耗值代表了 ROG Zephyrus G16 较弱的变体,考虑到相同的 OLED 面板,这也不足为奇。游戏时,Zephyrus G16 的功耗约为 170 瓦,比 RTX 4090 的功耗高出很多,后者在游戏时的功耗至少为 230 瓦。在压力测试中,我们曾短暂观察到 232 瓦的最大功耗,随后很快稳定在 160 瓦左右。这意味着所提供的 240 瓦电源适配器大小合适。
| Off / Standby | |
| Idle | |
| Load |
|
Key:
min: | |
| Asus ROG Zephyrus G16 GU605MY Ultra 9 185H, NVIDIA GeForce RTX 4090 Laptop GPU, Samsung PM9A1a MZVL22T0HDLB, OLED, 2560x1600, 16" | SCHENKER XMG Neo 16 (Early 24) i9-14900HX, NVIDIA GeForce RTX 4090 Laptop GPU, Samsung 990 Pro 1 TB, IPS, 2560x1600, 16" | Lenovo Legion 9 16IRX9, RTX 4090 i9-14900HX, NVIDIA GeForce RTX 4090 Laptop GPU, Micron 3400 2TB MTFDKBA2T0TFH, MiniLED, 3200x2000, 16" | Alienware x16 R2 P120F Ultra 9 185H, NVIDIA GeForce RTX 4080 Laptop GPU, WDC PC SN810 1TB, IPS, 2560x1600, 16" | Razer Blade 16 2024, RTX 4090 i9-14900HX, NVIDIA GeForce RTX 4090 Laptop GPU, Samsung PM9A1 MZVL22T0HBLB, OLED, 2560x1600, 16" | Asus ROG Zephyrus G16 2024 GU605M Ultra 7 155H, NVIDIA GeForce RTX 4070 Laptop GPU, WD PC SN560 SDDPNQE-1T00, OLED, 2560x1600, 16" | Average NVIDIA GeForce RTX 4090 Laptop GPU | Average of class Gaming | |
|---|---|---|---|---|---|---|---|---|
| Power Consumption | -51% | -108% | -57% | -64% | 5% | -97% | -56% | |
| Idle Minimum * | 7.8 | 6 23% | 20.5 -163% | 9.9 -27% | 16.9 -117% | 8.3 -6% | 16.2 ? -108% | 13.4 ? -72% |
| Idle Average * | 10.9 | 16 -47% | 27.7 -154% | 14.5 -33% | 17.8 -63% | 12.5 -15% | 23.1 ? -112% | 18.9 ? -73% |
| Idle Maximum * | 11.6 | 28 -141% | 32.1 -177% | 33.5 -189% | 19.6 -69% | 12.8 -10% | 34.2 ? -195% | 26.3 ? -127% |
| Load Average * | 98.7 | 130 -32% | 105 -6% | 97.5 1% | 128 -30% | 71.3 28% | 130.5 ? -32% | 102.7 ? -4% |
| Cyberpunk 2077 ultra * | 157.3 | |||||||
| Cyberpunk 2077 ultra external monitor * | 165.5 | |||||||
| Load Maximum * | 232 | 361 -56% | 323 -39% | 315.2 -36% | 328 -41% | 169.1 27% | 324 ? -40% | 244 ? -5% |
| Witcher 3 ultra * | 302 | 246 | 230 | 243 | 127.5 |
* ... smaller is better
Power consumption Cyberpunk / stress test
Power consumption with an external monitor
电池寿命
每个版本的 Zephyrus G16 2024 都配备了 90 瓦时的电池,但在 Wi-Fi 测试中,电池运行时间比 RTX 4070 版本短了约 30 分钟。在与 RTX 4090 笔记本电脑的直接游戏竞争中,Zephyrus G16 2024 的表现仍然优于 RTX 4090。在 150 cd/m² 和 60 Hz 的 Wi-Fi 测试中,全亮度下可使用 6.5 小时(120 Hz 时为 5.5 小时),60 Hz 时为 5 小时(120 Hz 时为 4.5 小时)。在设备开启的情况下,一个完整的充电周期需要 104 分钟;47 分钟后可获得 80% 的电量。
Pros
Cons
结论:RTX 4090 笔记本电脑未能发挥其潜力
华硕 Zephyrus G16 2024 是一款轻薄的游戏笔记本电脑,同时也适合内容创作者和多媒体用户等其他目标群体。采用 RTX 4090 笔记本电脑当然意味着图形性能是重点,但这也正是问题所在。从原则上讲,华硕提供最快的 GPU 型号是件好事,但尽管改进了蒸汽腔散热,薄薄的机箱还是需要做出妥协。在涡轮增 压模式下,RTX 4090 笔记本电脑的最大功耗为 115 瓦,根本无法发挥其潜力,普遍落后于竞争对手 20-25 %(即使是 Alienware x16 中的 RTX 4080 笔记本电脑也略快一些)。尽管如此,RTX 4090 笔记本电脑的售价还是不菲。这只是为了更紧凑的机身而不得不接受的妥协,但潜在买家应该注意到这一点。
与传统散热方式(RTX 4070 以下笔记本电脑型号)相比,蒸发腔的重量增加了约 100 克,而且在静音和高性能能耗配置文件中,蒸发腔的噪音都要大一些。只有在涡轮增压模式下,这两种配置才没有区别。实际上,这意味着你在游戏时应该戴上耳机。
通过 ROG Zephyrus G16,华硕提供了一款非常紧凑的 16 英寸笔记本电脑,配备GeForce RTX 4090 笔记本电脑。然而,良好的移动性要求在性能方面做出妥协,而其他 RTX 4090 型号在游戏性能方面具有优势。
Zephyrus G16 的其他优缺点同样适用于高端配置,包括出色的扬声器和绚丽的 240 Hz OLED 面板。但是,一个很大的缺点是焊接内存,在 3649 元的高端版本中甚至没有 64GB 内存。
ROG Zephyrus G16 是一款小巧的 16 英寸笔记本电脑,适合追求最高图形处理性能的用户。不过,你不应该指望它能与更重/更大的竞争对手提供同样的性能。如果您只想获得纯粹的游戏性能,那么诸如 XMG Neo 16或 Alienware x16 R2只需提供更强的动力。
价格和供应情况
ROG Zephyrus G16 配备英特尔酷睿超 9 185H 和 NvidiaGeForce RTX 4090 笔记本电脑,零售价为 3649 美元,目前可在亚马逊上购买。
注:我们最近更新了评级系统,第 8 版的结果与第 7 版的结果不具可比性。更多信息 此处.
Asus ROG Zephyrus G16 GU605MY
- 07/12/2024 v8
Andreas Osthoff
 Total Sustainability Score:
 Transparency
The selection of devices to be reviewed is made by our editorial team. The test sample was provided to the author as a loan by the manufacturer or retailer for the purpose of this review. The lender had no influence on this review, nor did the manufacturer receive a copy of this review before publication. There was no obligation to publish this review. We never accept compensation or payment in return for our reviews. As an independent media company, Notebookcheck is not subjected to the authority of manufacturers, retailers or publishers.
This is how Notebookcheck is testing
Every year, Notebookcheck independently reviews hundreds of laptops and smartphones using standardized procedures to ensure that all results are comparable. We have continuously developed our test methods for around 20 years and set industry standards in the process. In our test labs, high-quality measuring equipment is utilized by experienced technicians and editors. These tests involve a multi-stage validation process. Our complex rating system is based on hundreds of well-founded measurements and benchmarks, which maintains objectivity. Further information on our test methods can be found here.
Price comparison

