

RedMagic Titan 16 Pro 评测:智能手机制造商制造的游戏笔记本电脑
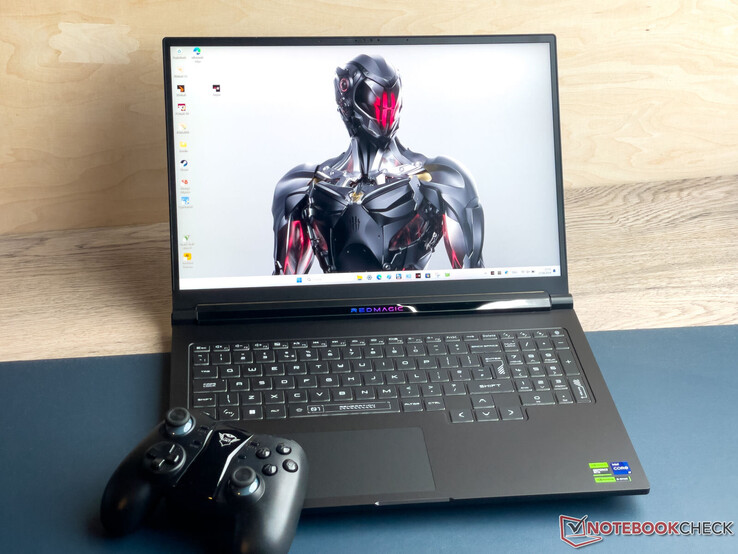
经常访问本网站的用户可能已经熟悉游戏智能手机领域的 "RedMagic "品牌(例如 努比亚红魔 9 Pro).RedMagic Titan 16 Pro 是努比亚首次涉足游戏笔记本电脑领域。它的数据表没有任何惊喜:A 酷睿 i9-14900HX搭配 GeForce RTX 4060.此外,还配备了 16:10 宽高比的 16 英寸屏幕、Thunderbolt 4、DDR5 内存和 2 个固态硬盘插槽。
努比亚能否在已经确立的竞争中立于不败之地还有待观察。Titan 的竞争对手包括以下设备:LenovoLegion Pro 5 16IRX9,HP Victus 16 (2024),Acer Predator Helios Neo 16 (2024),XMG Pro 16 Studio (Mid 24) 和Gigabyte G6X 9KG (2024) 。
潜在的竞争对手比较
Rating | Version | Date | Model | Weight | Height | Size | Resolution | Price |
|---|---|---|---|---|---|---|---|---|
| 81.2 % | v8 | 08 / 2024 | Nubia RedMagic Titan 16 Pro i9-14900HX, NVIDIA GeForce RTX 4060 Laptop GPU | 2.4 kg | 23.9 mm | 16.00" | 2560x1600 | |
| 82.3 % | v8 | 07 / 2024 | Lenovo Legion Pro 5 16IRX9 G9 i7-14700HX, NVIDIA GeForce RTX 4060 Laptop GPU | 2.5 kg | 26.55 mm | 16.00" | 2560x1600 | |
| 84.3 % v7 (old) | v7 (old) | 05 / 2024 | HP Victus 16 (2024) i7-14700HX, NVIDIA GeForce RTX 4060 Laptop GPU | 2.4 kg | 23.9 mm | 16.10" | 1920x1080 | |
| 86.8 % v7 (old) | v7 (old) | 05 / 2024 | Acer Predator Helios Neo 16 (2024) i7-14700HX, NVIDIA GeForce RTX 4070 Laptop GPU | 2.6 kg | 25.95 mm | 16.00" | 2560x1600 | |
| 81.2 % | v8 | 07 / 2024 | SCHENKER XMG Pro 16 Studio (Mid 24) i9-14900HX, NVIDIA GeForce RTX 4070 Laptop GPU | 2.3 kg | 19.9 mm | 16.00" | 2560x1600 | |
| 83.2 % v7 (old) | v7 (old) | 03 / 2024 | Gigabyte G6X 9KG (2024) i7-13650HX, NVIDIA GeForce RTX 4060 Laptop GPU | 2.6 kg | 25.1 mm | 16.00" | 1920x1200 |
请注意:我们最近更新了评级系统,第 8 版的结果无法与第 7 版的结果进行比较。更多信息 请点击此处.
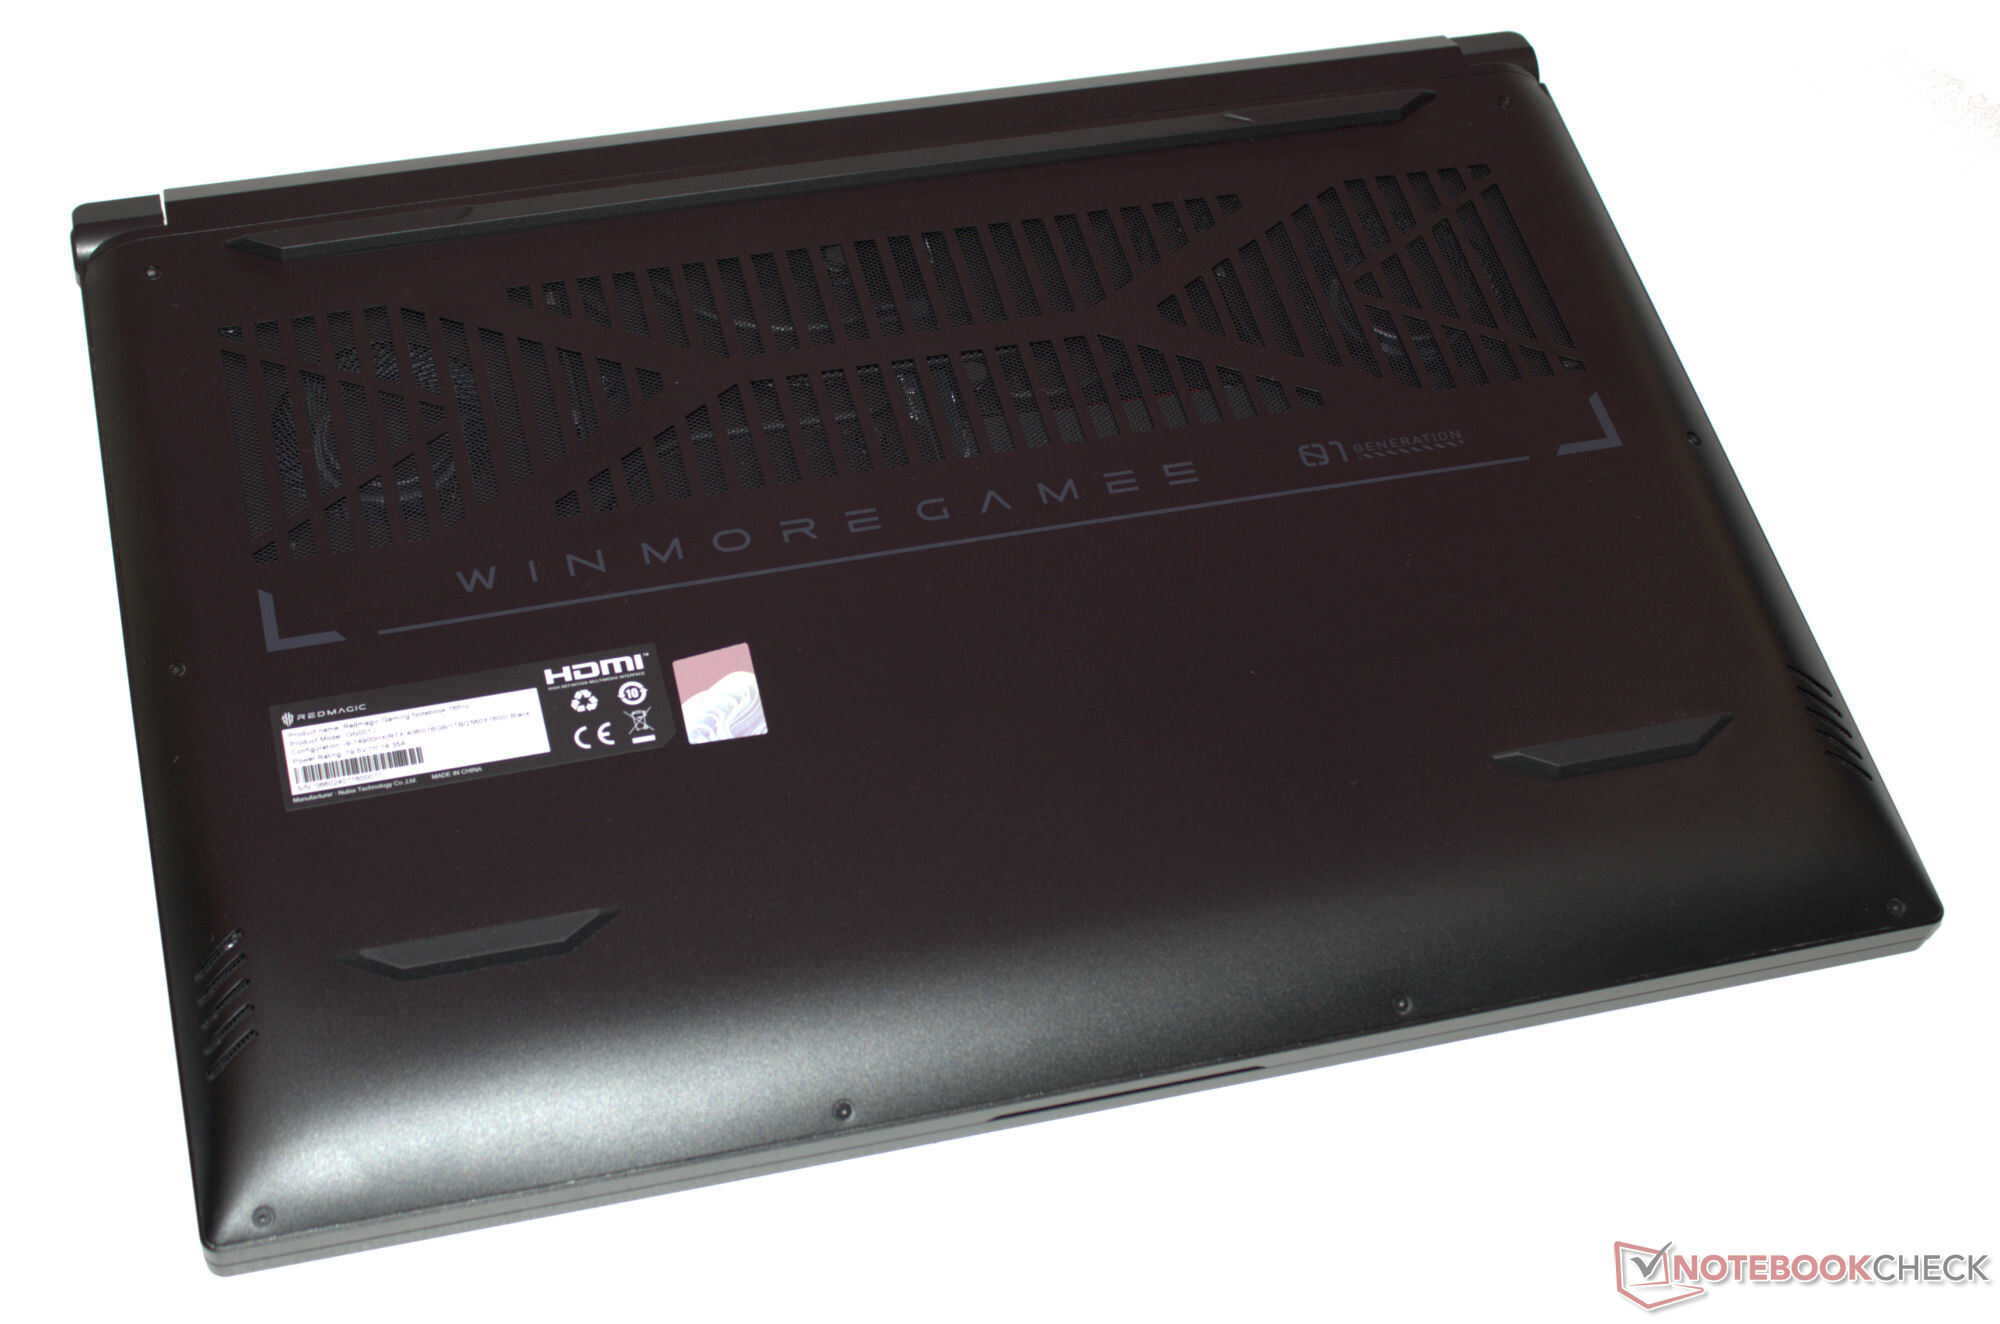
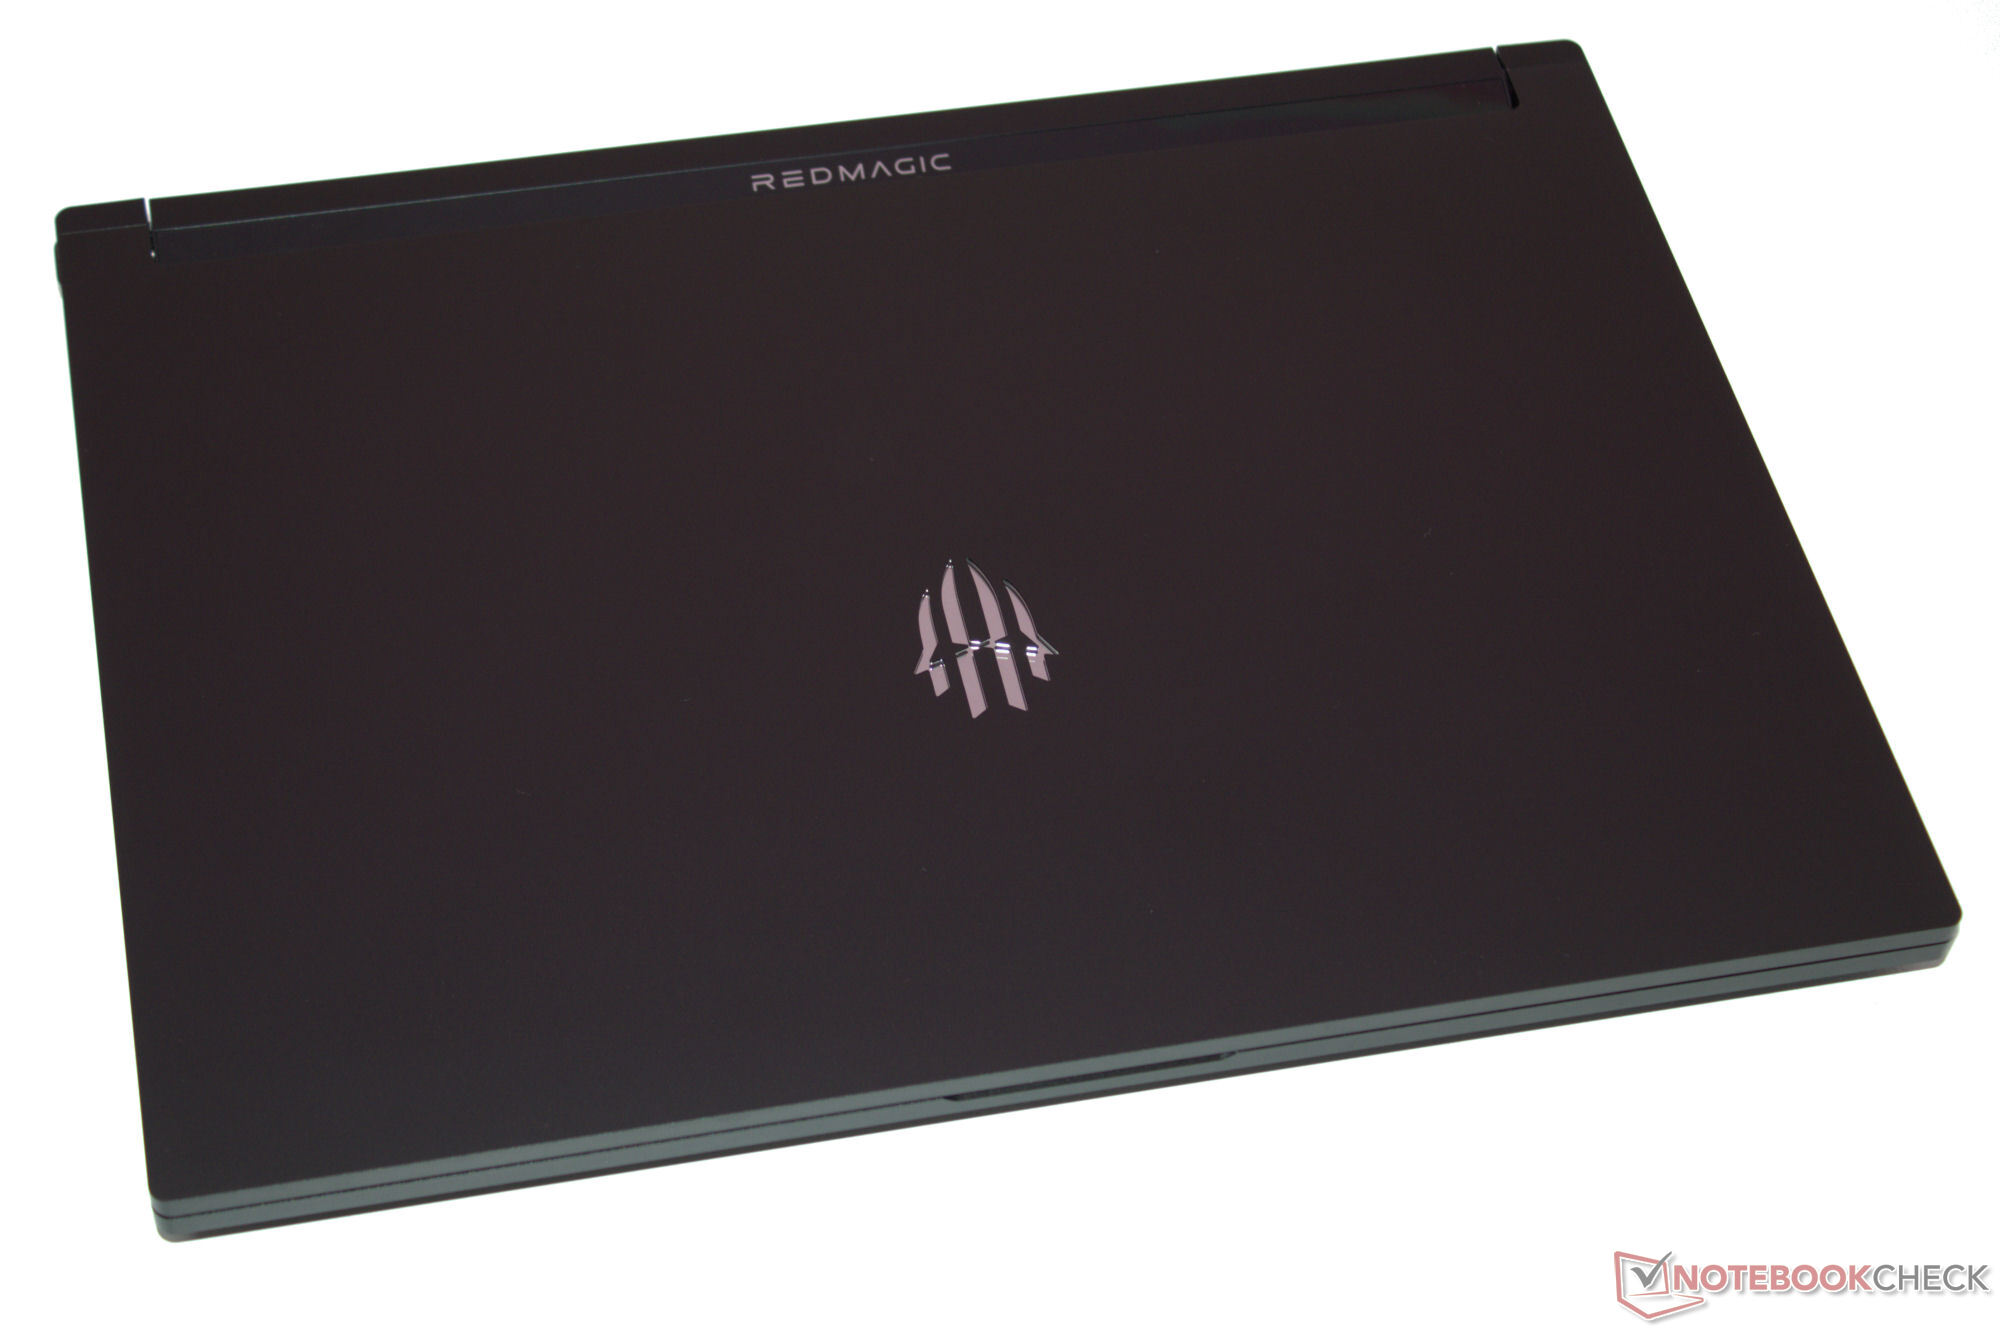
外壳 - 努比亚采用铝制外壳
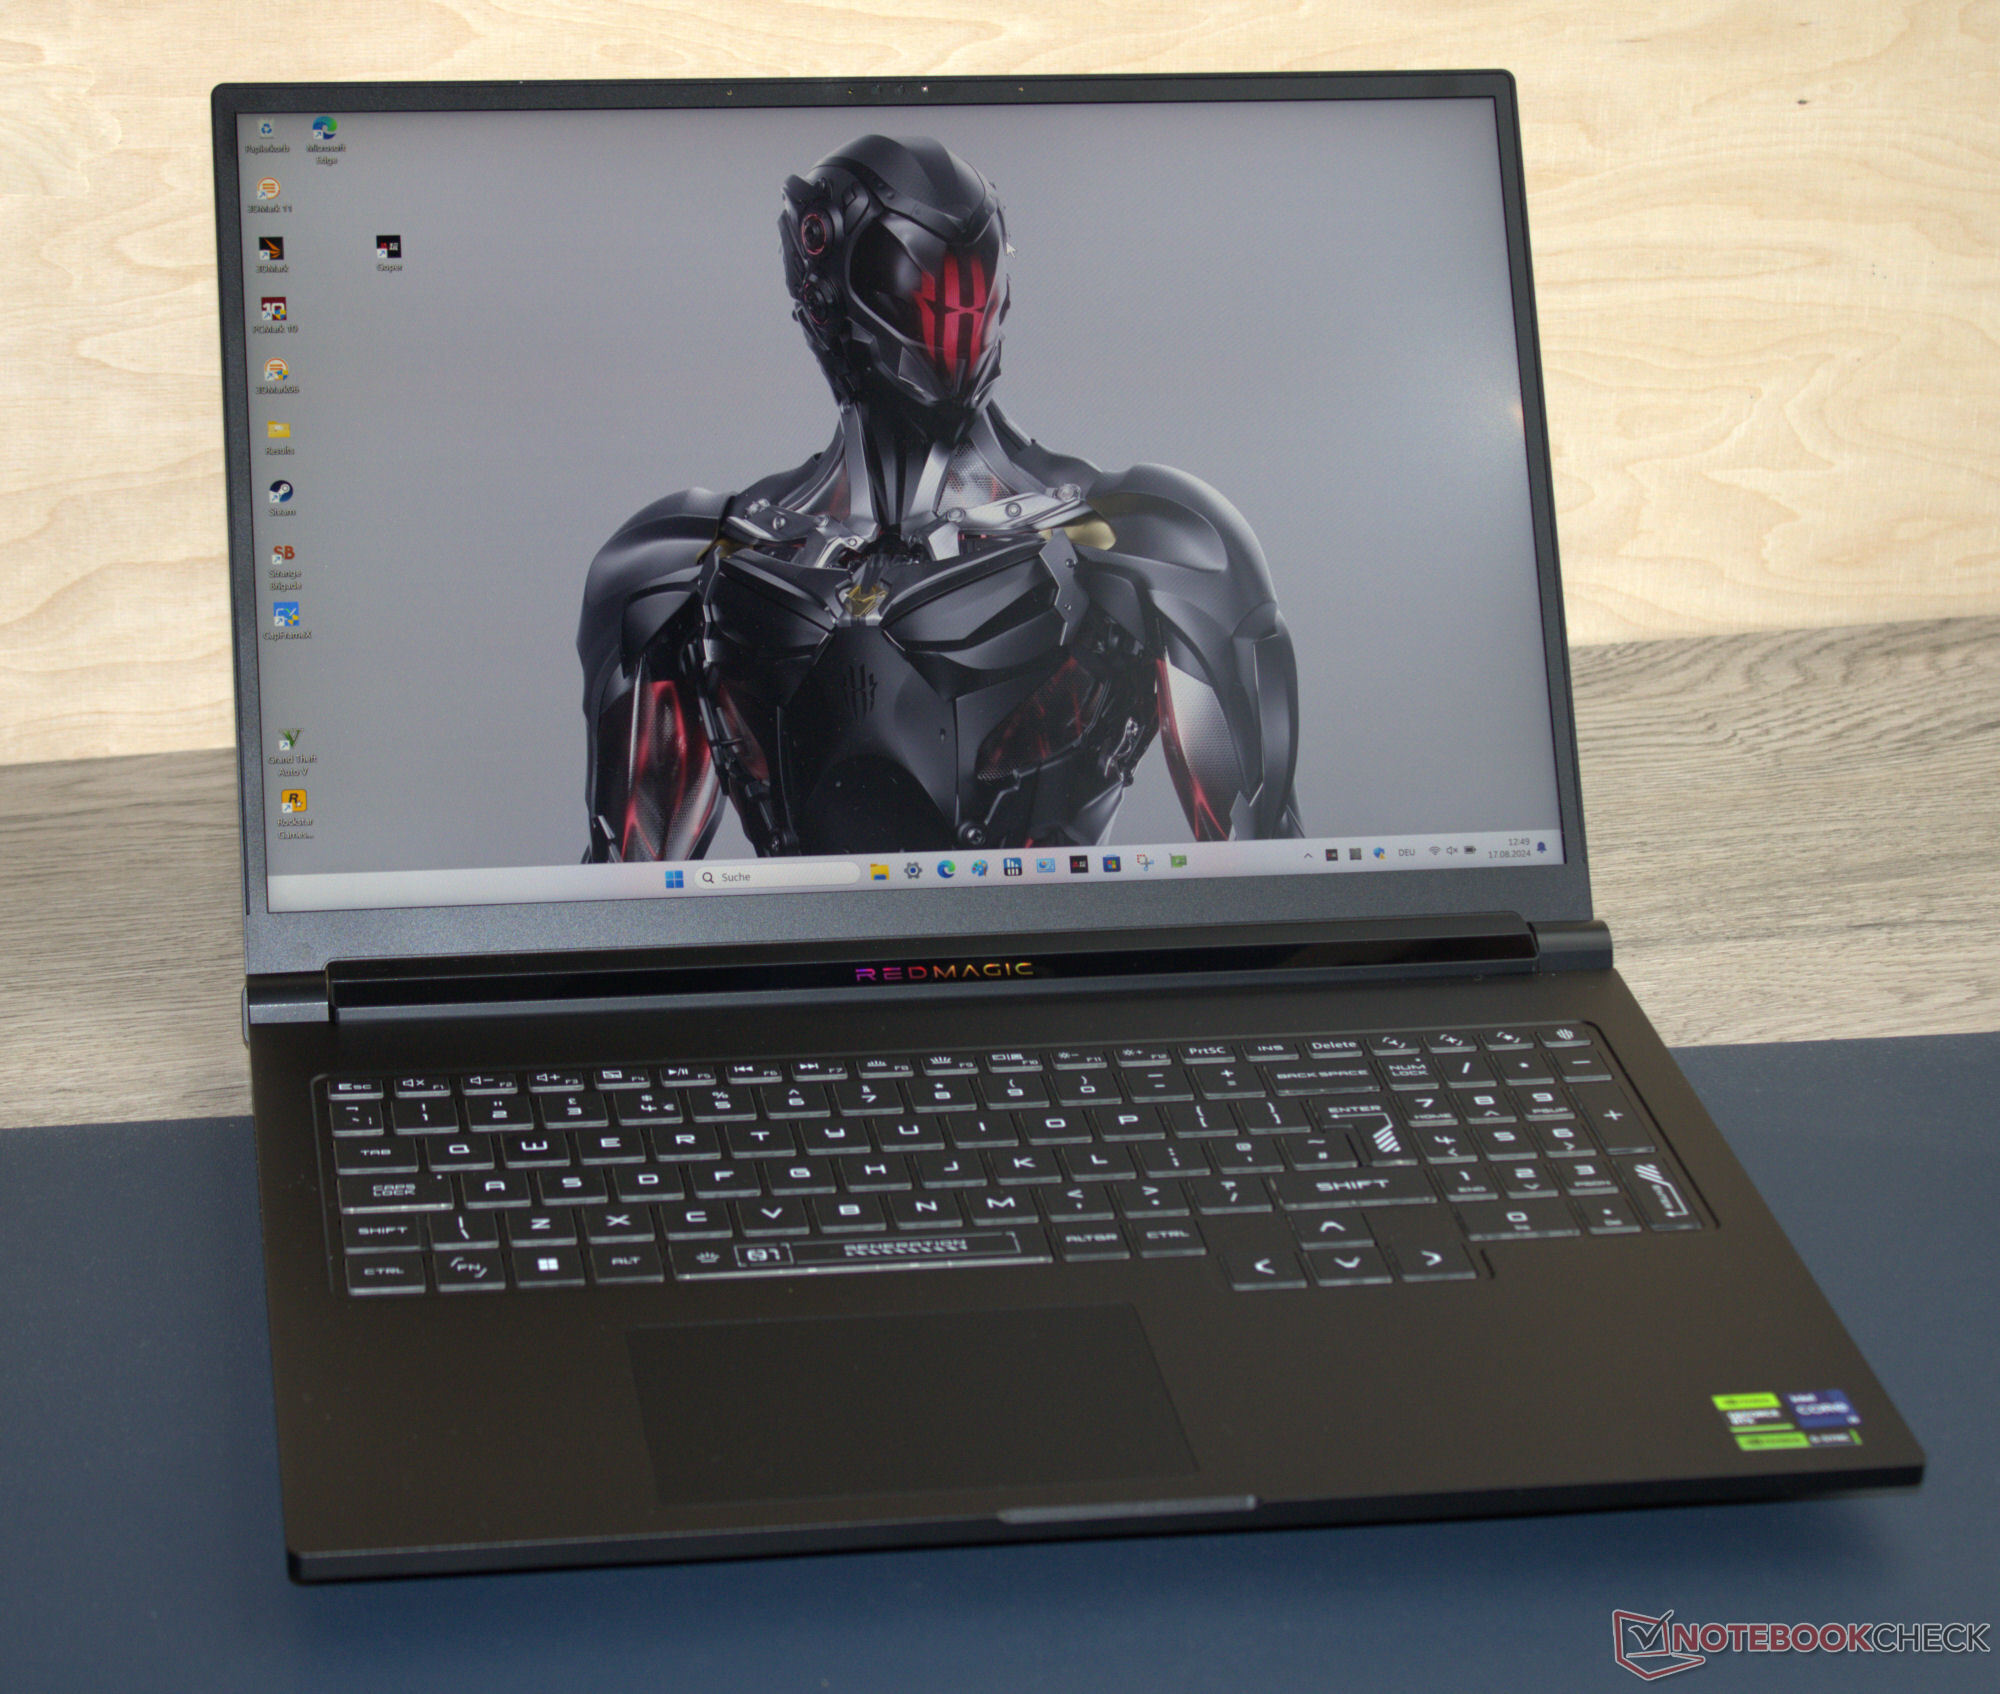
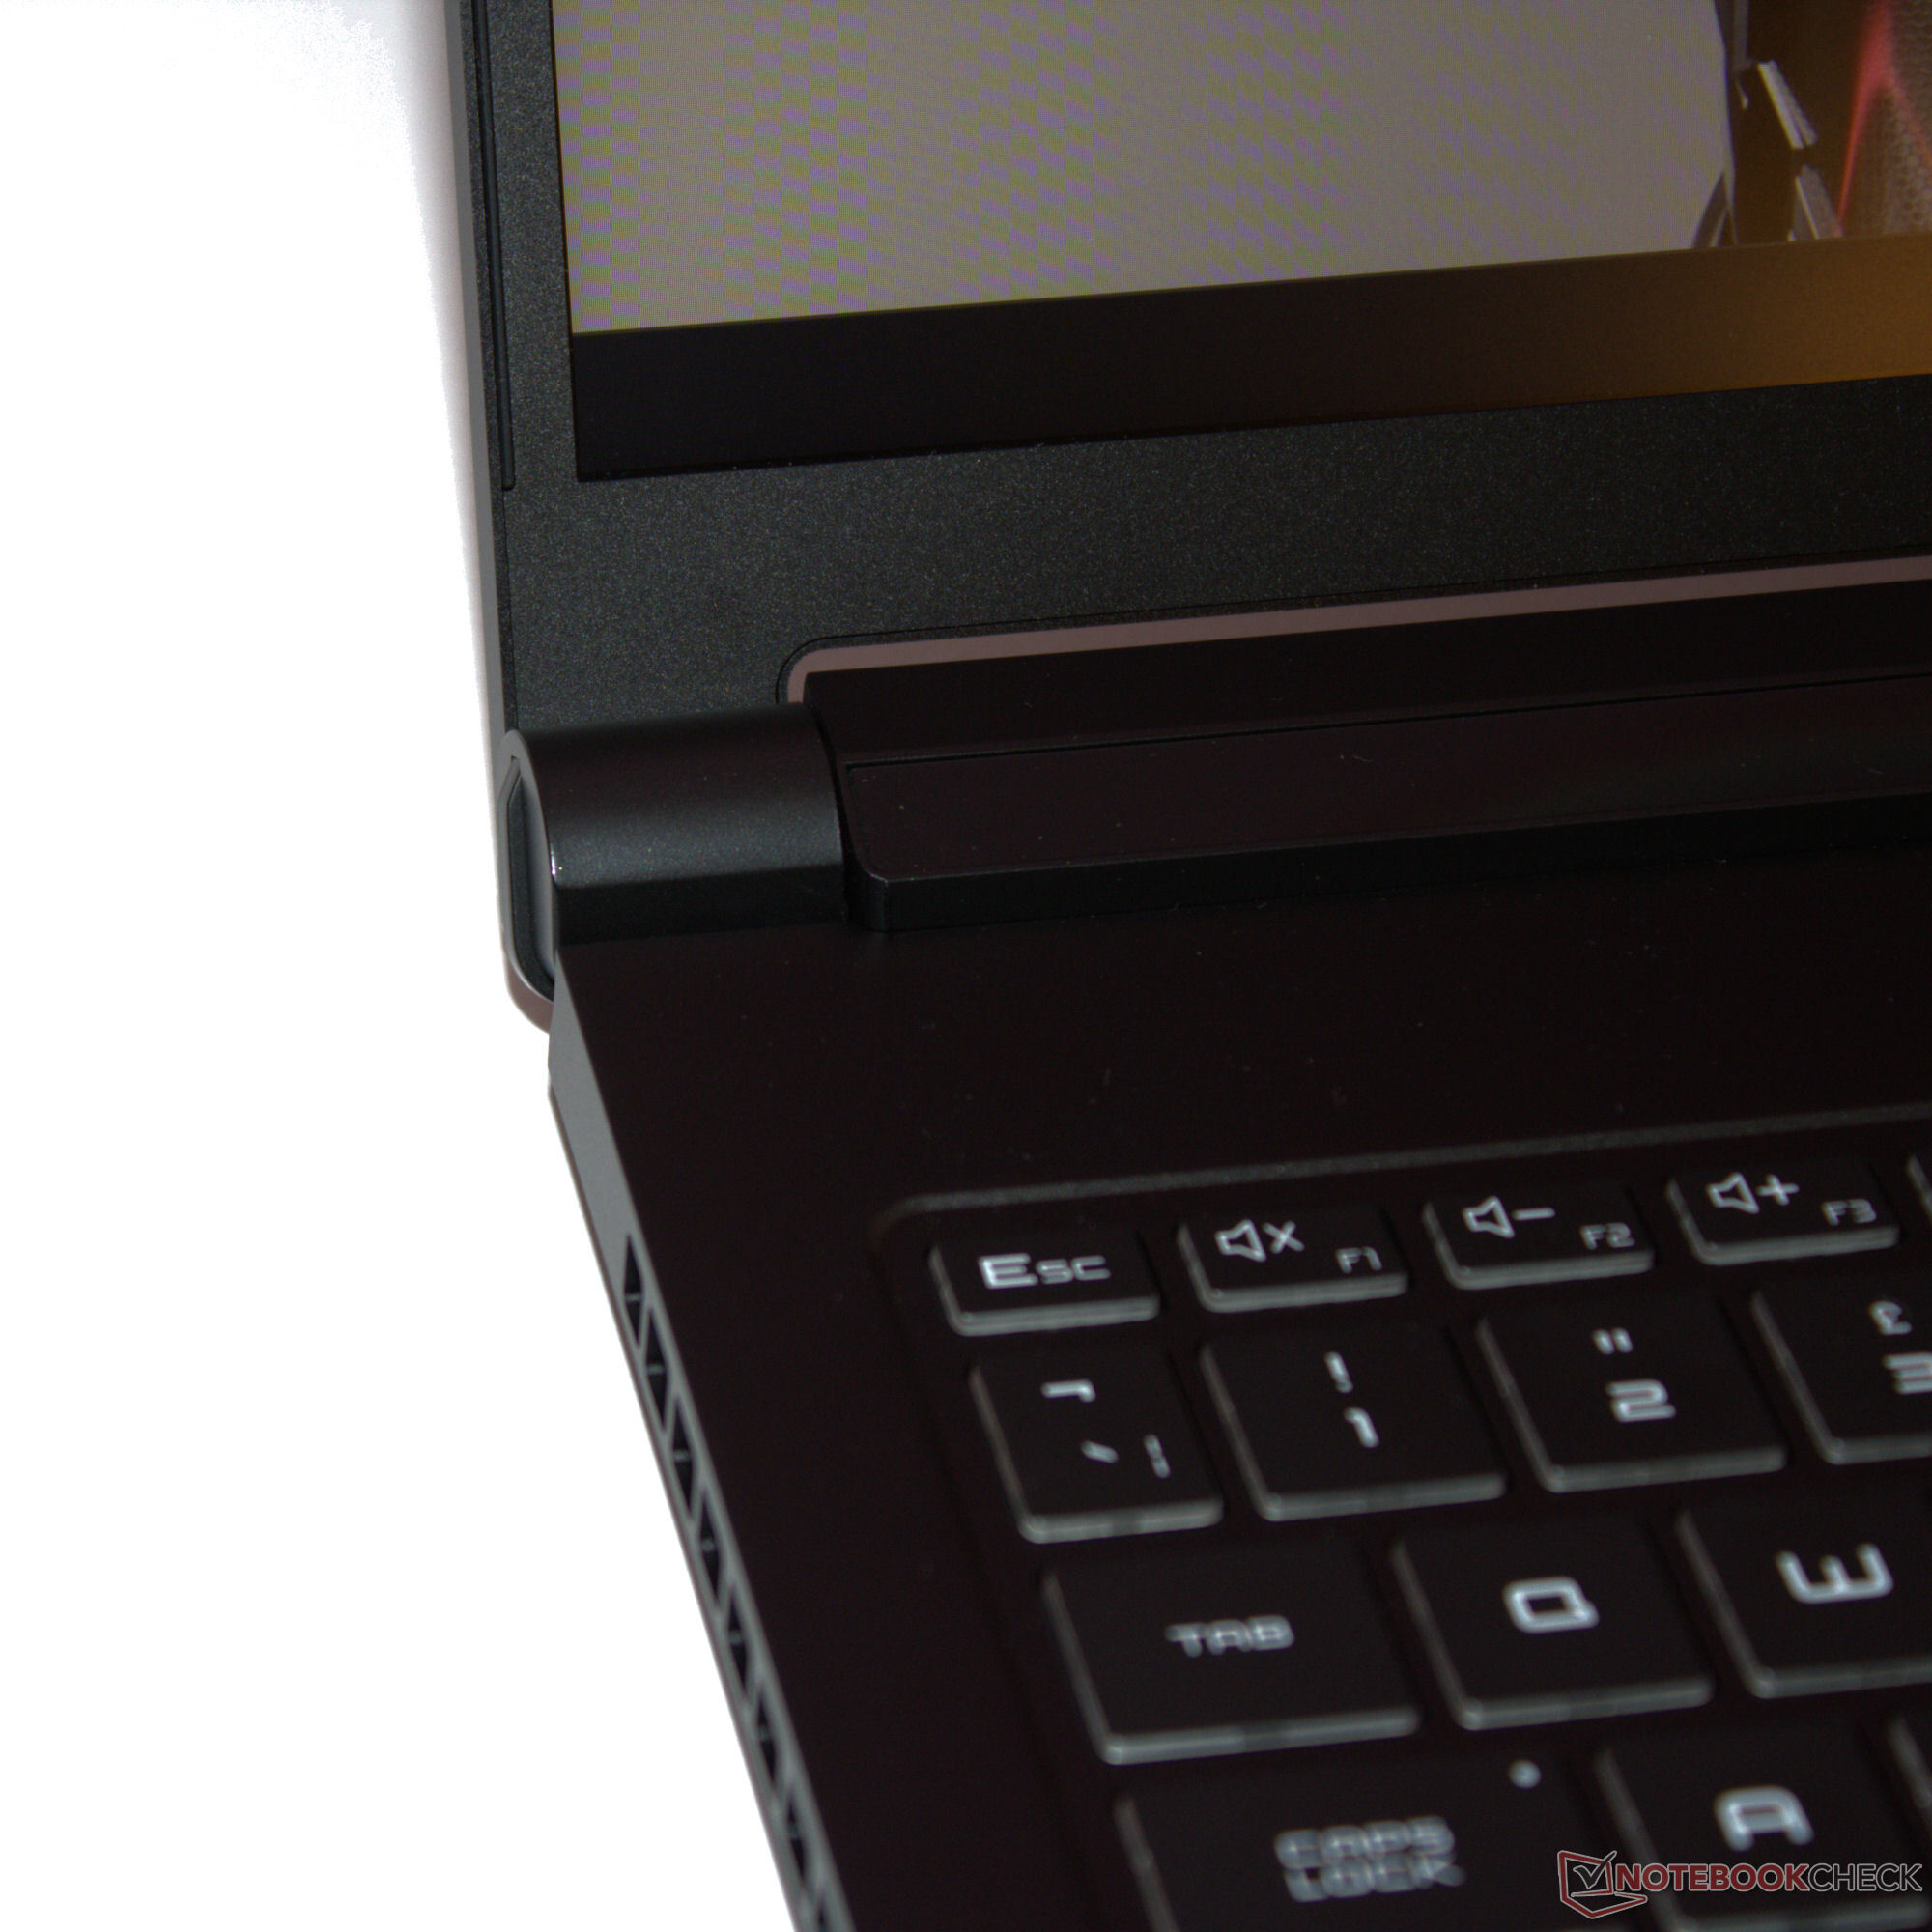
您应该随时准备一块清洁布:哑光黑色的机壳表面对指纹痕迹非常敏感。铝制机壳的底座和盖子只能轻微扭动,我们没有遇到任何制造误差。向盖子背面施压也不会导致任何图像变化。非常紧密的铰链将盖子牢牢地固定在位置上,只有很小的晃动。其最大开启角度为 130 度,单手即可打开。
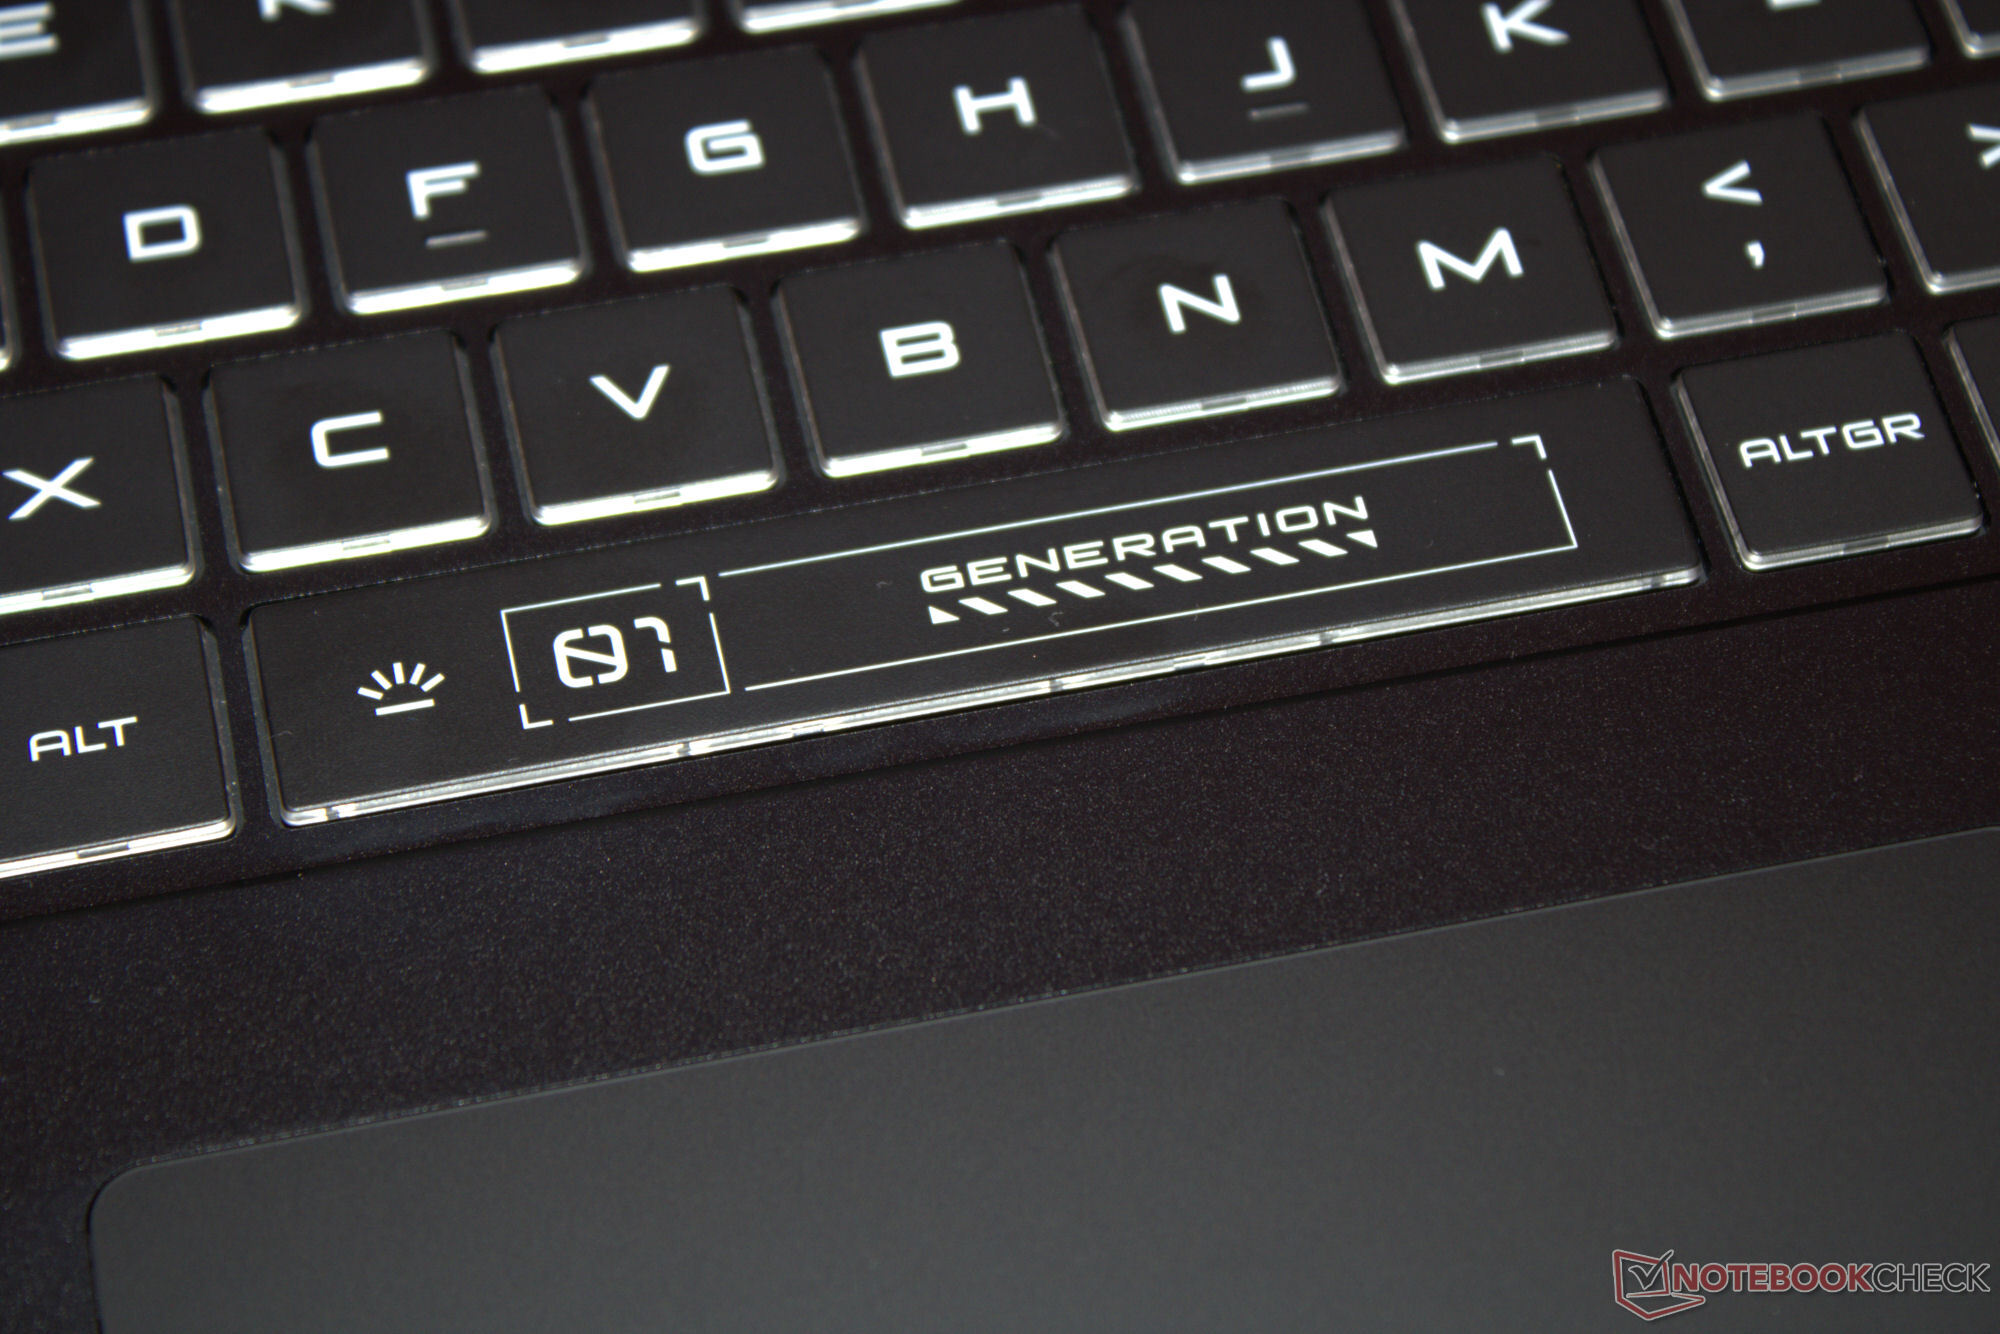
除了笔记本的背光键盘外,两个 LED 元件也为笔记本增添了一些色彩:铰链盖上的 RedMagic 字样和盖子上的徽标闪耀着彩虹般的色彩。所有元素均可单独控制。字母还可用作电池指示灯:红灯闪烁表示电量不足。
事实证明,在同类产品中,Titan 是最小巧、最轻便的设备之一。即便如此,与竞争对手相比,差距还是非常小。
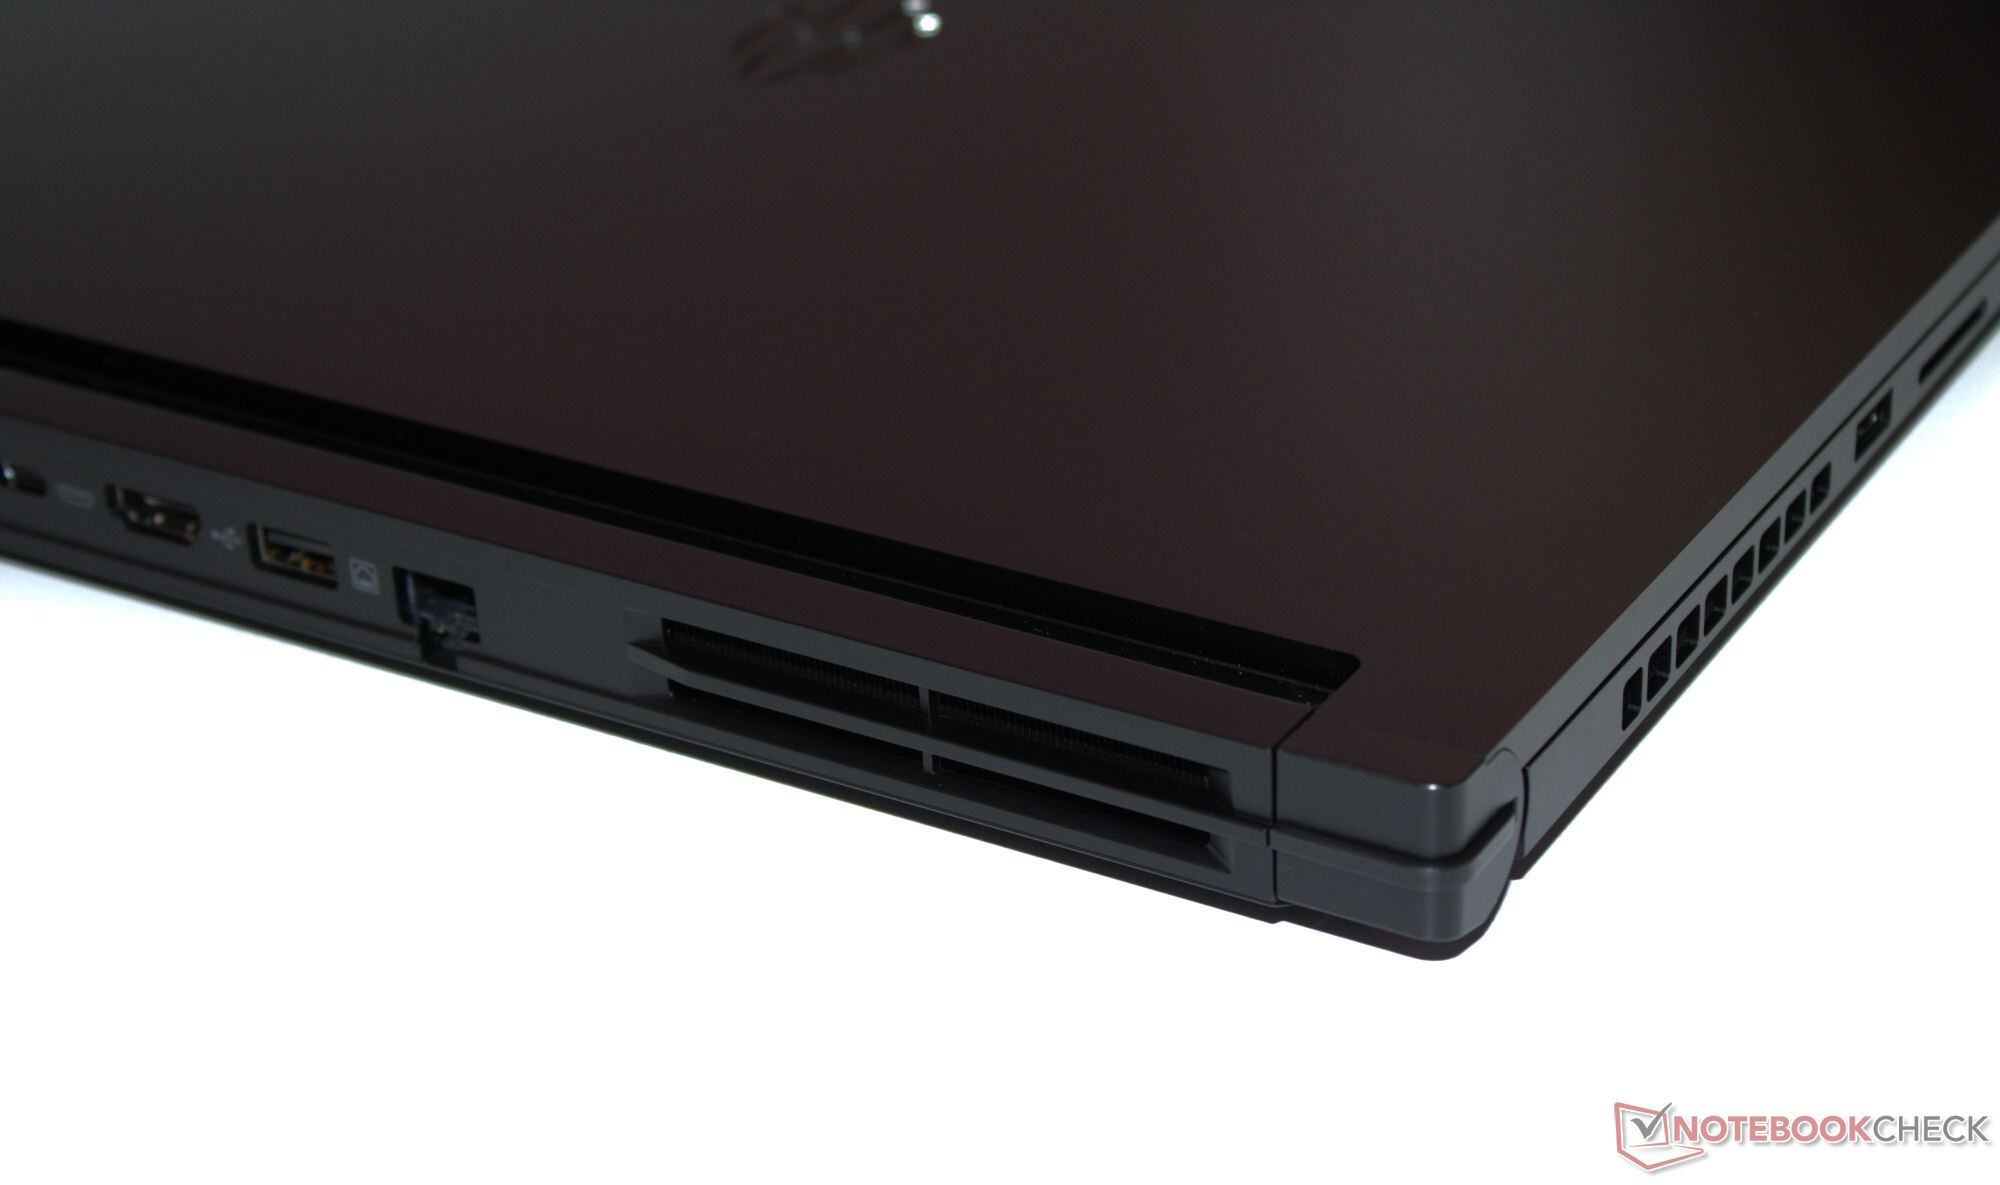
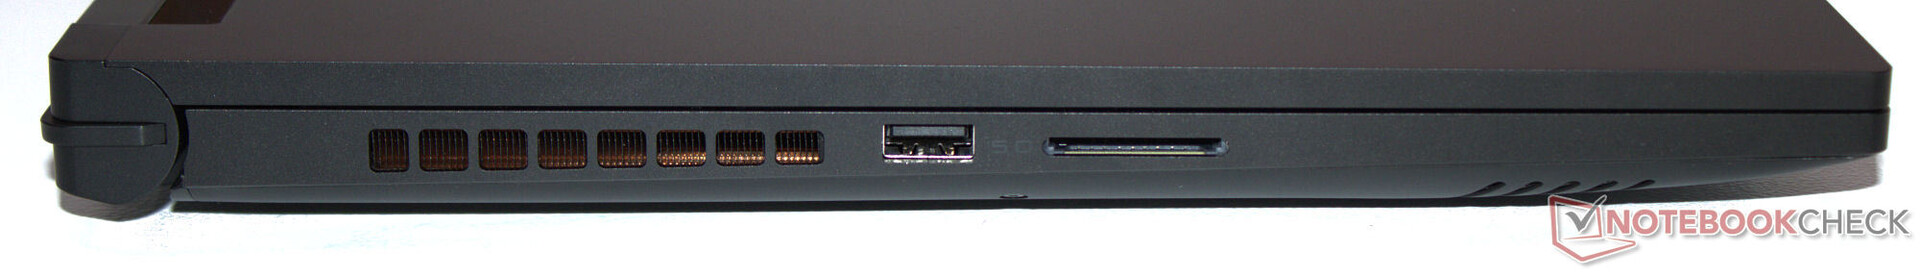
连接性 - 泰坦配备雷电 4
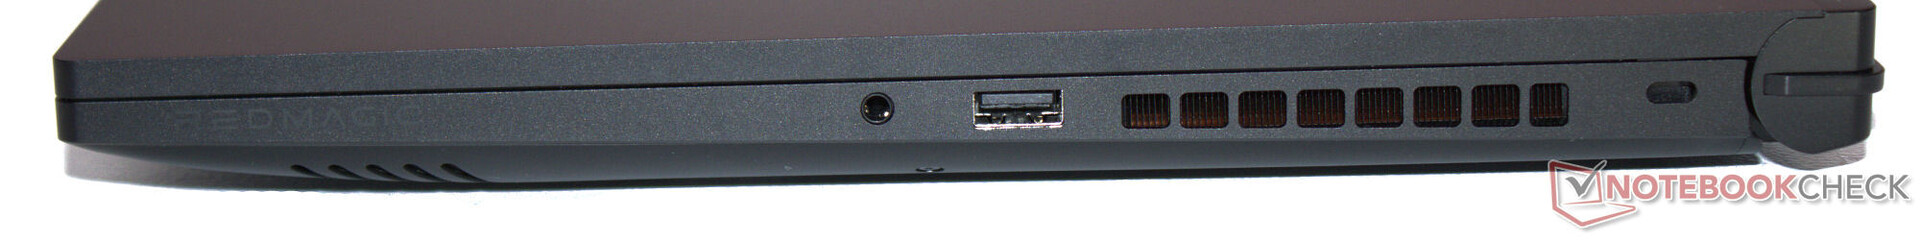
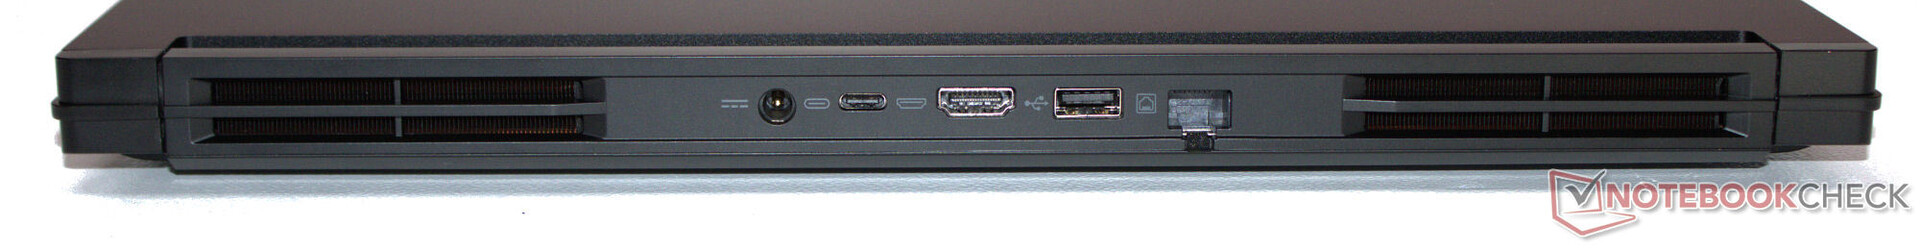
Titan 配备了三个 USB-A 端口(2 个 USB 3.2 Gen 2、1 个 USB 3.2 Gen 1)和一个 USB-C 端口(Thunderbolt 4)。后者支持 Power Delivery 和 DP Alt 模式。它共有两个视频输出接口(1 个 HDMI 接口,1 个 DP 接口)。一个音频插孔和一个以太网端口(1 GBit/s)使其完整无缺。
视频输出、网络接口和电源接口都位于设备背面,因此相应的线缆在使用过程中不会碍事。值得称赞的是,笔记本电脑的左右两侧各有一个 USB-A 端口。
SD 读卡器
SD 读卡器(参考卡:AV PRO microSD 128 GB V60)不是同类产品中速度最快的,但它的数据传输率在中等速度范围内非常稳定。与 刀锋 16 (2024)证明可以实现更高的传输速率。
| SD Card Reader | |
| average JPG Copy Test (av. of 3 runs) | |
| Razer Blade 16 2024, RTX 4090 | |
| Average of class Gaming (19 - 197.3, n=68, last 2 years) | |
| SCHENKER XMG Pro 16 Studio (Mid 24) (AV PRO microSD 128 GB V60) | |
| Nubia RedMagic Titan 16 Pro (AV PRO microSD 128 GB V60) | |
| Acer Predator Helios Neo 16 (2024) (AV PRO microSD 128 GB V60) | |
| maximum AS SSD Seq Read Test (1GB) | |
| Razer Blade 16 2024, RTX 4090 | |
| Average of class Gaming (25.8 - 263, n=67, last 2 years) | |
| SCHENKER XMG Pro 16 Studio (Mid 24) (AV PRO microSD 128 GB V60) | |
| Nubia RedMagic Titan 16 Pro (AV PRO microSD 128 GB V60) | |
| Acer Predator Helios Neo 16 (2024) (AV PRO microSD 128 GB V60) | |
交流
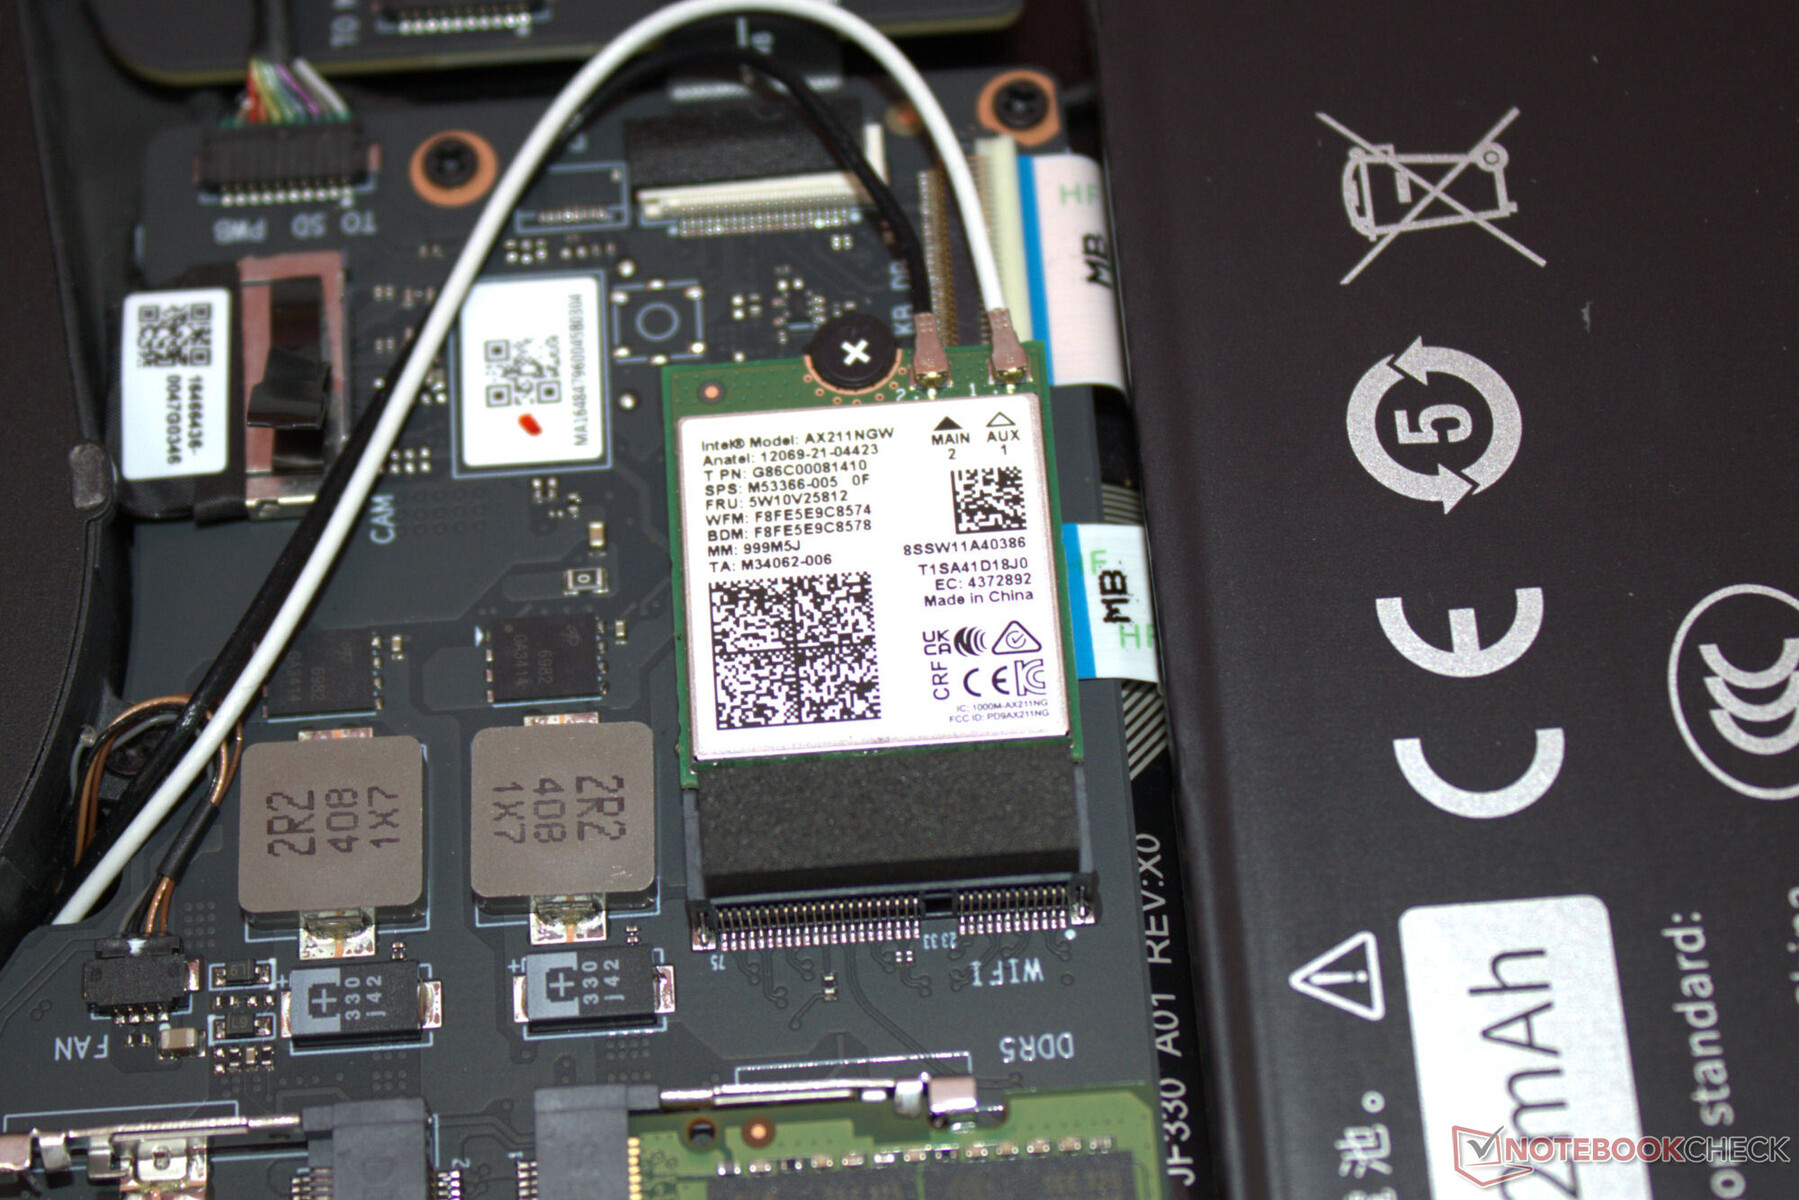
在网络选项方面,没有任何惊喜:有线连接由 Realtek 成熟的千兆以太网控制器(RTL8168/8111,1 GBit/s)处理。英特尔的 WiFi 6E 芯片(AX211)在最佳条件下(附近没有 WiFi 设备,笔记本电脑和服务器之间距离较短)可提供良好甚至非常好的数据传输速率。
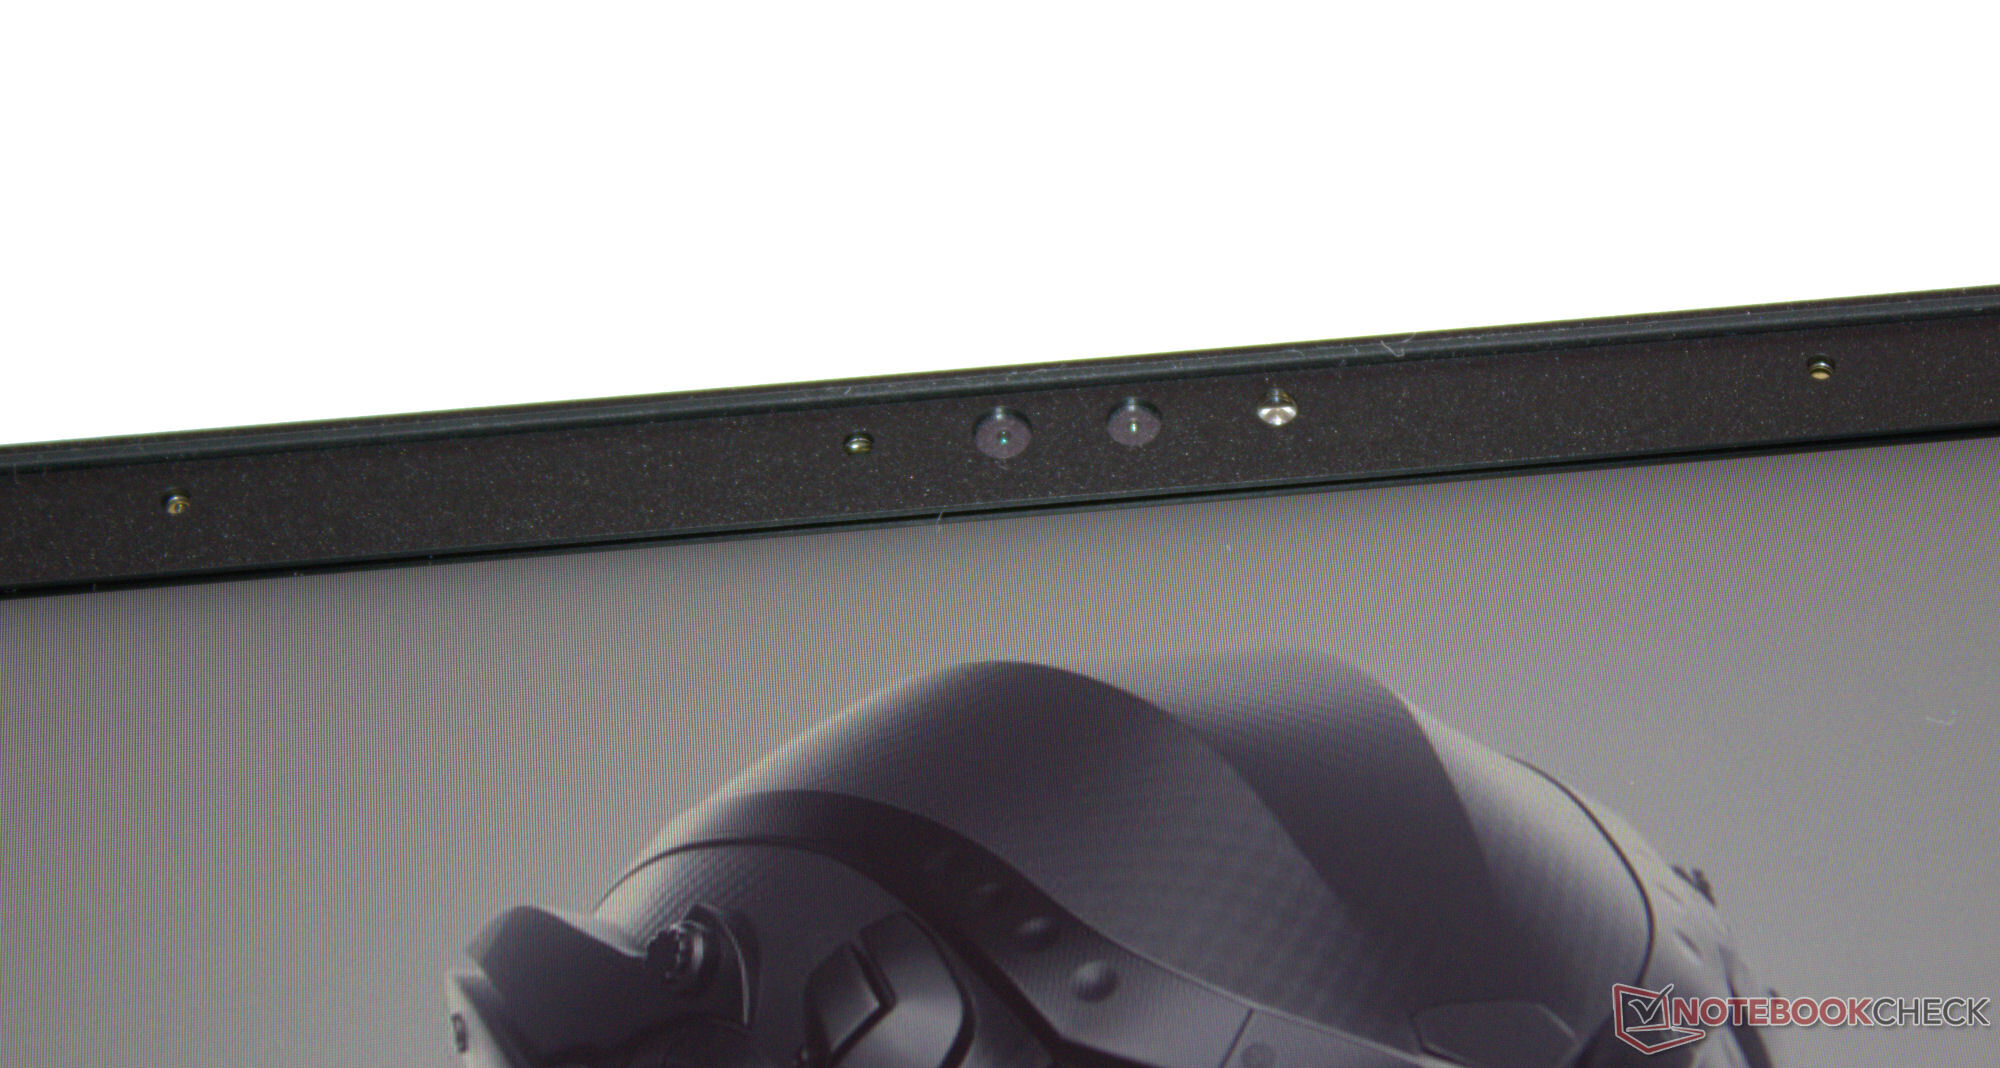
网络摄像头
网络摄像头(210 万像素)是标准配置,支持 Windows Hello。摄像头没有机械盖或物理开关。


配件
除了常规文件(快速入门指南和保修信息)外,笔记本电脑没有附带其他配件。
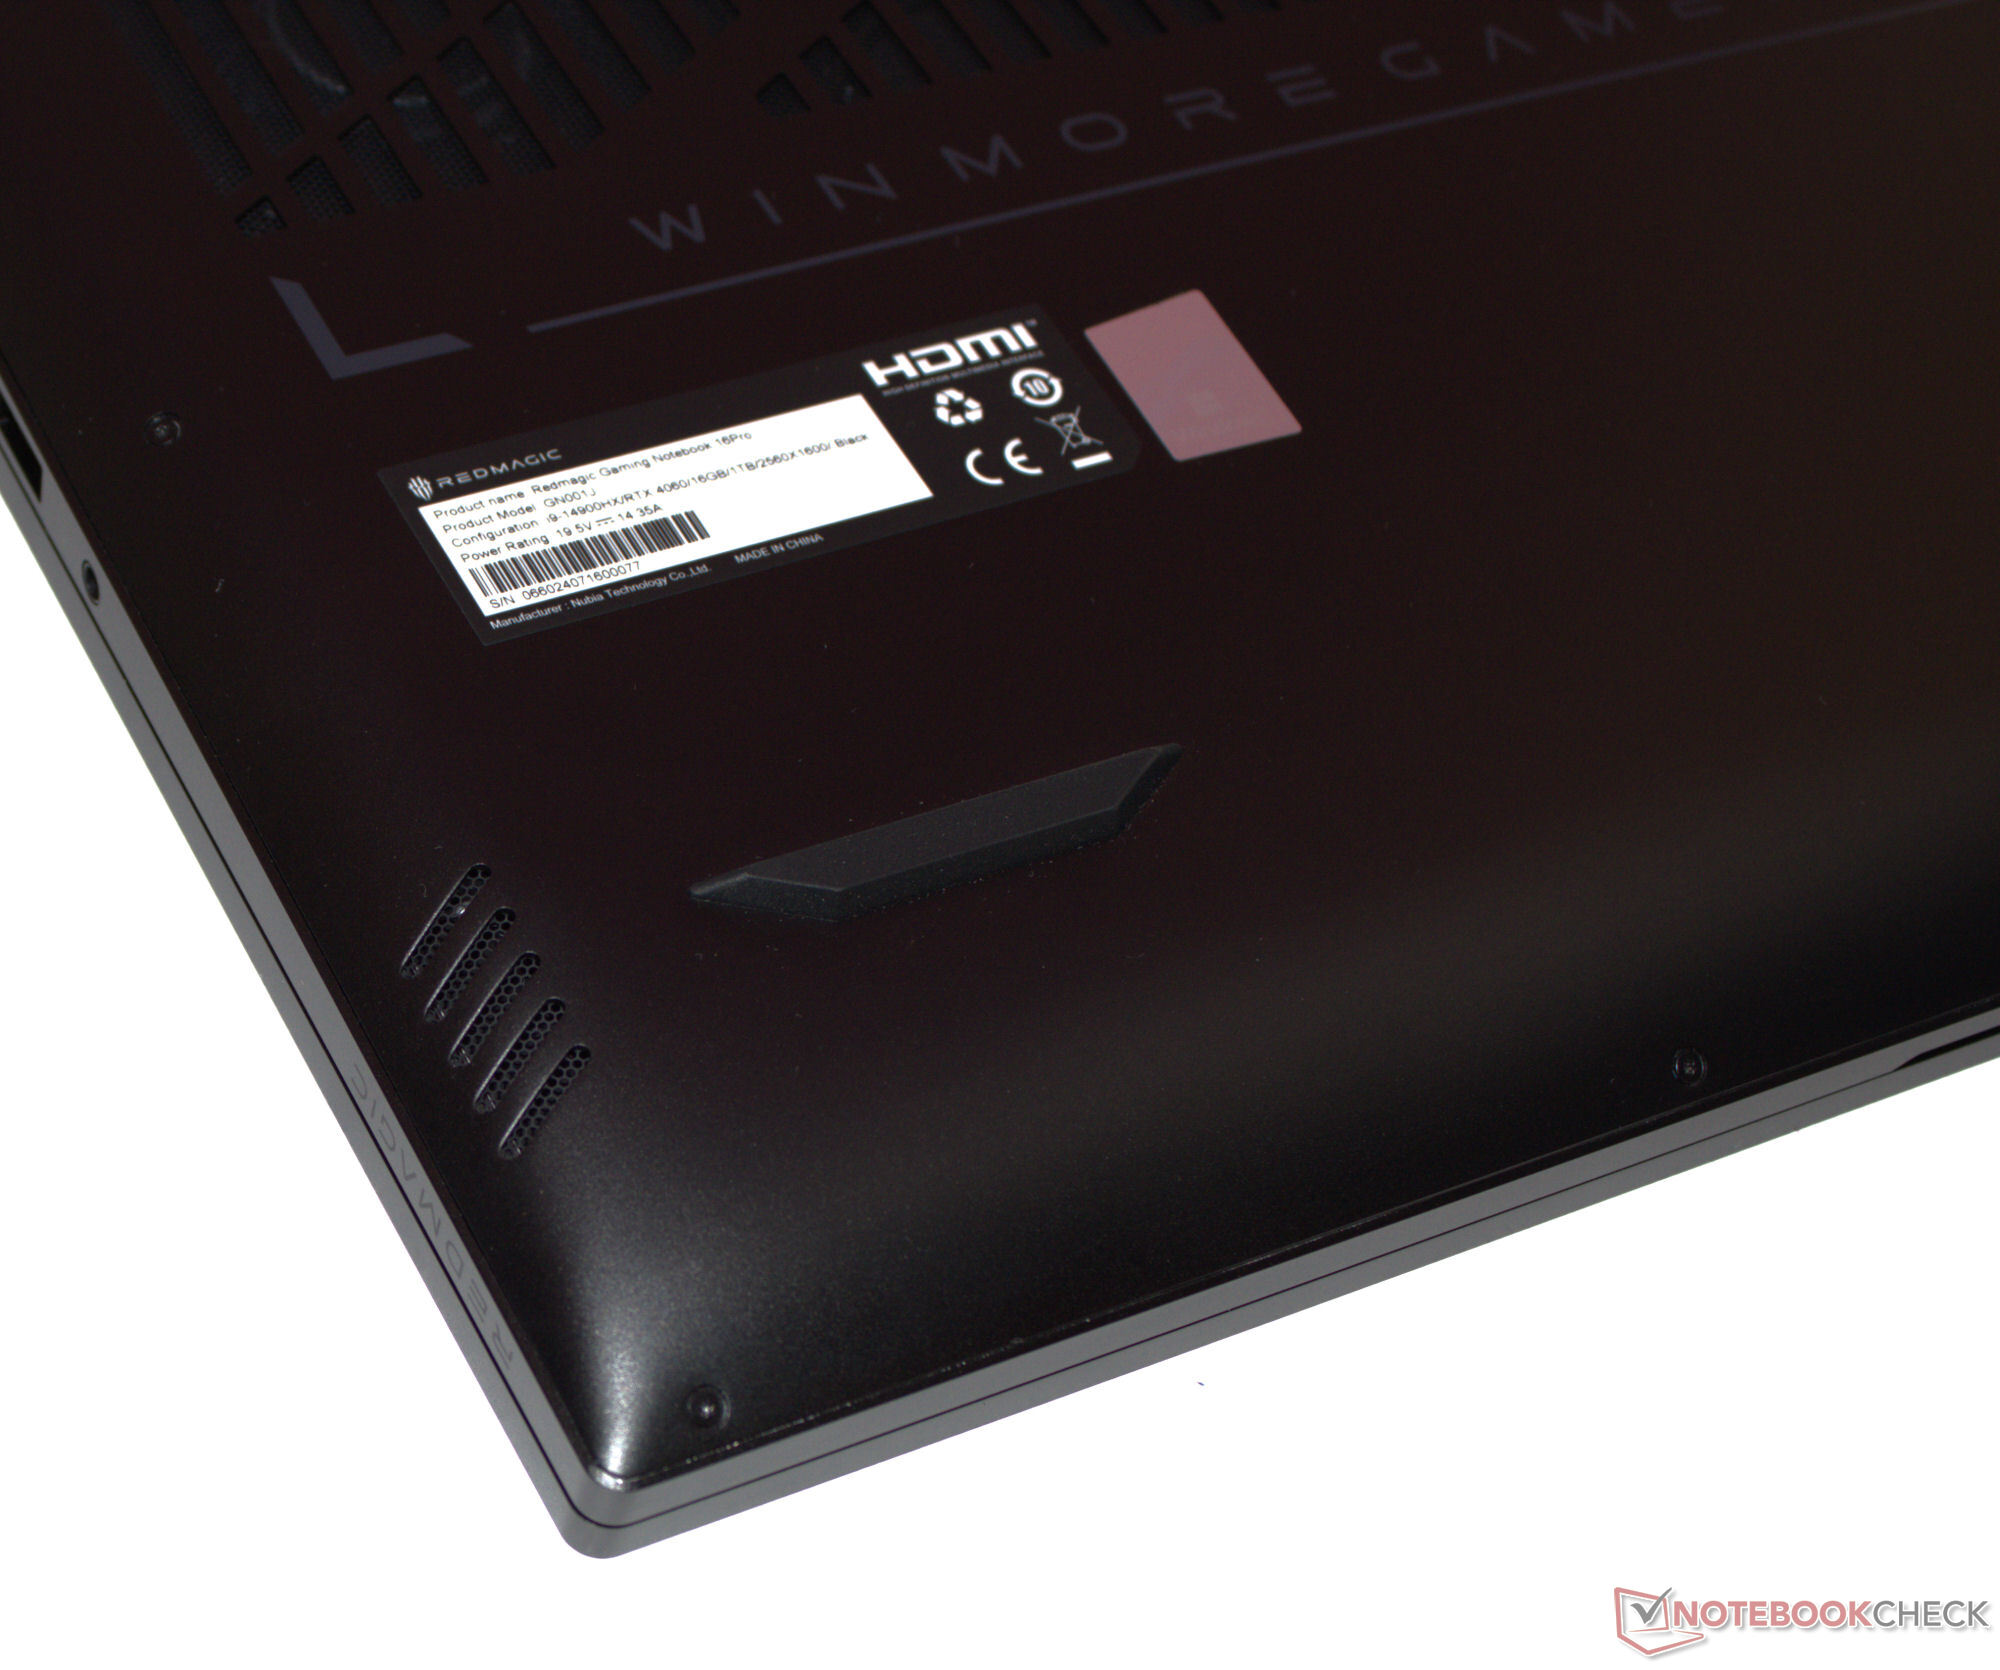
维护
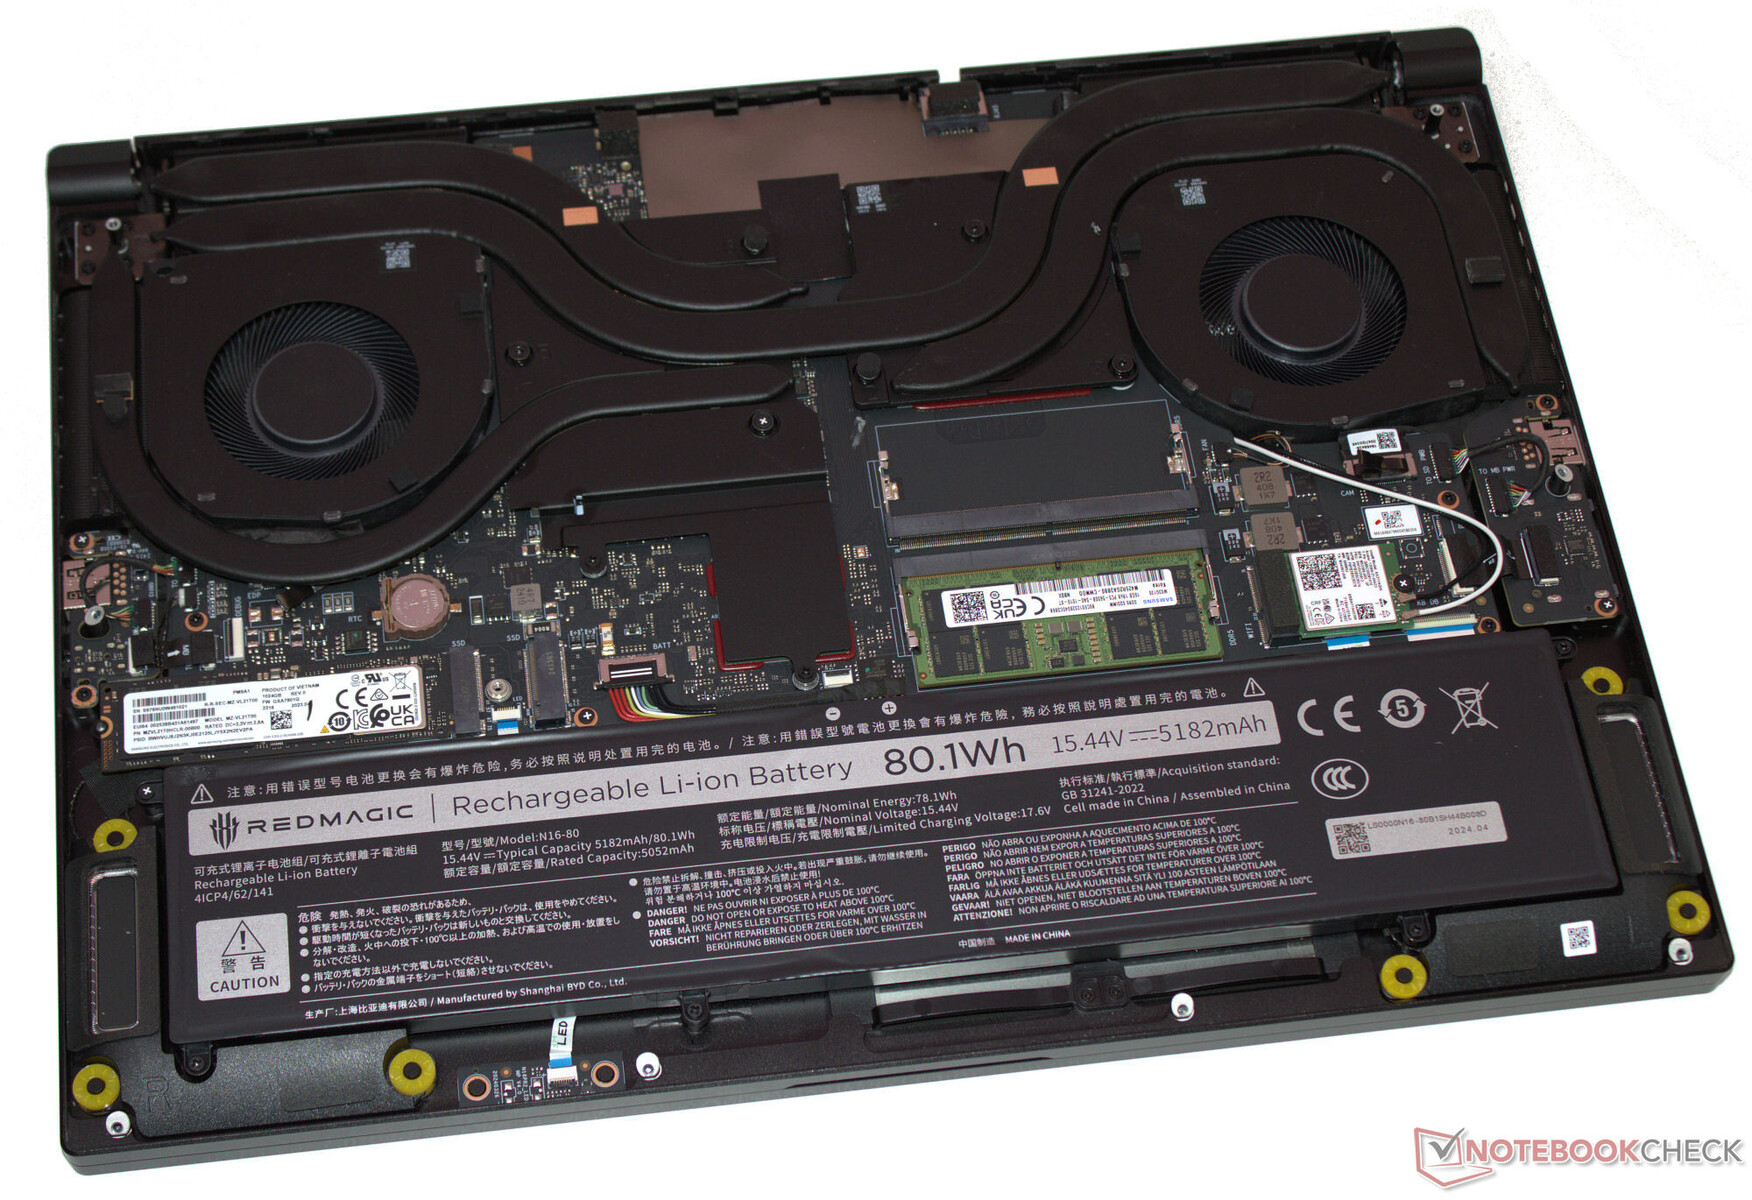
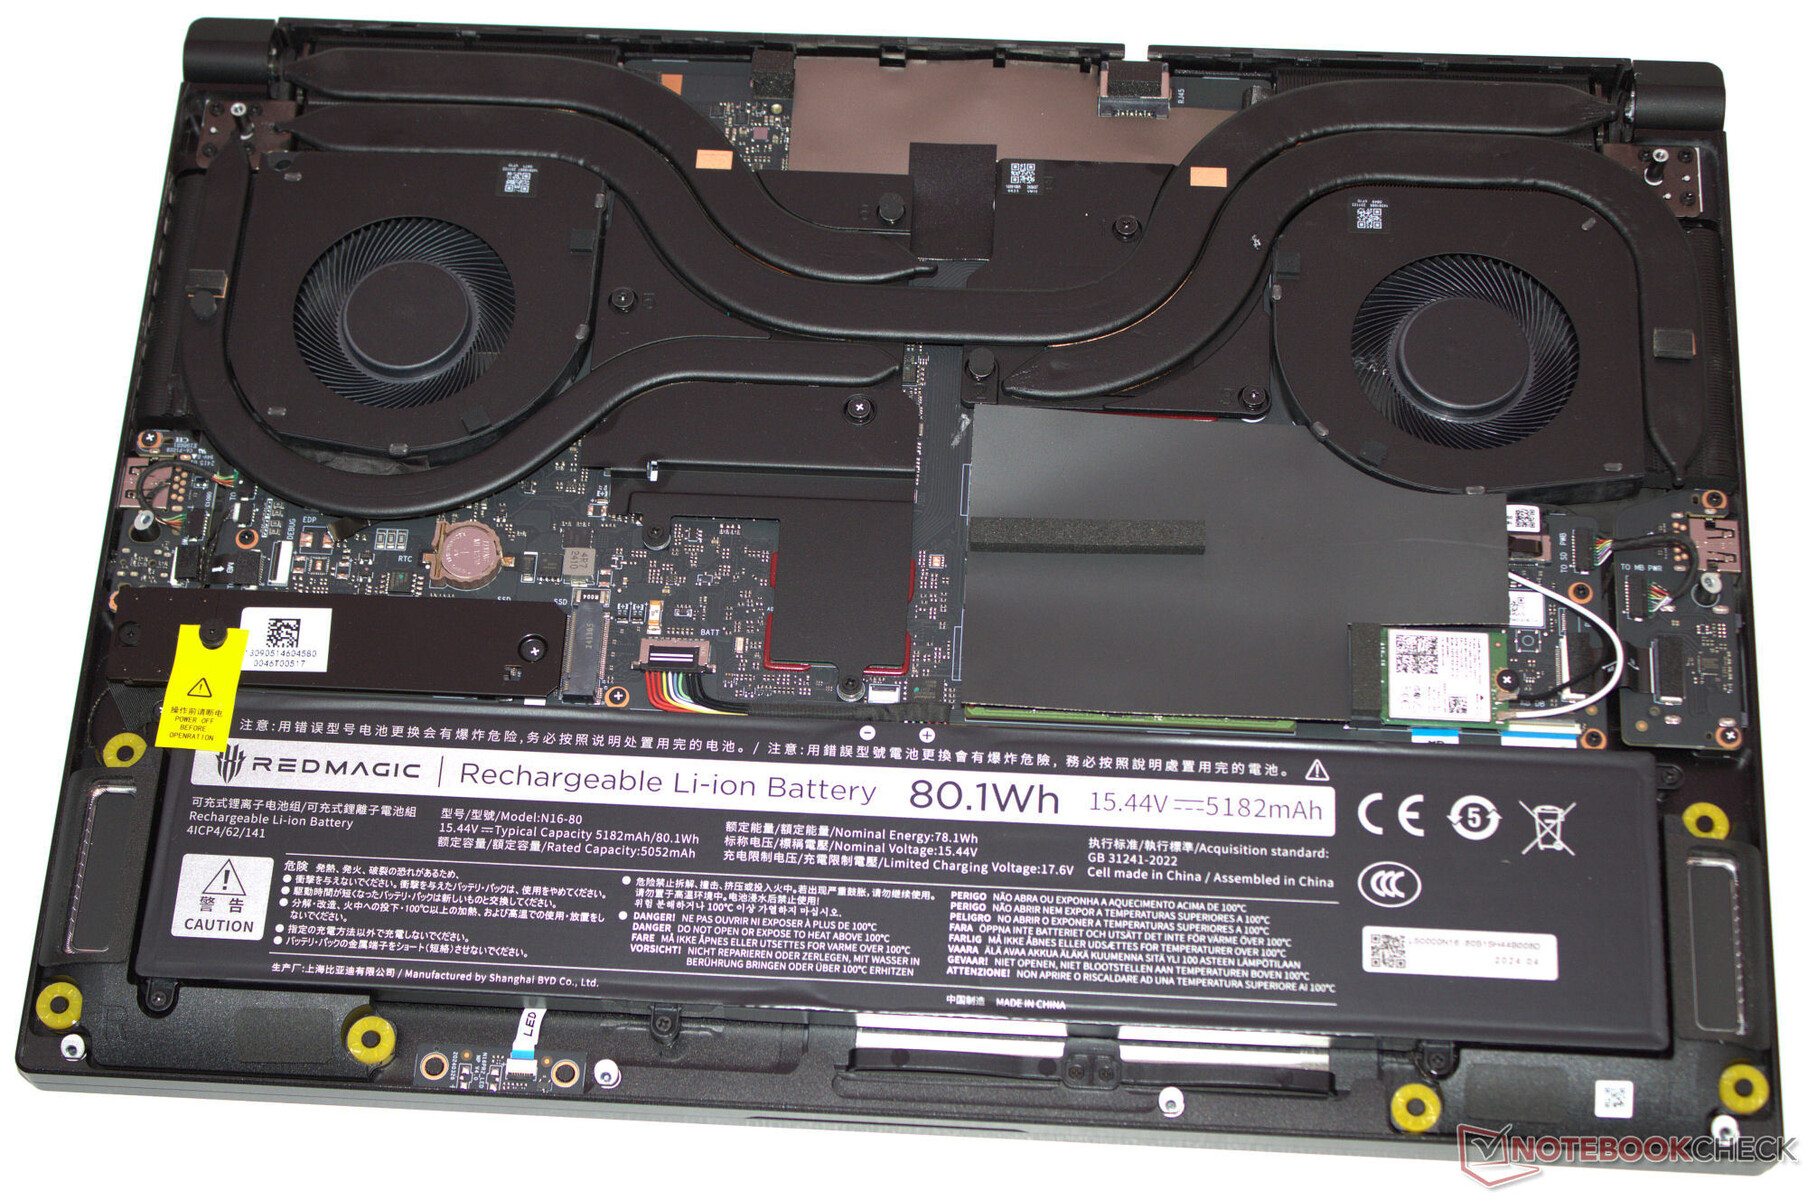
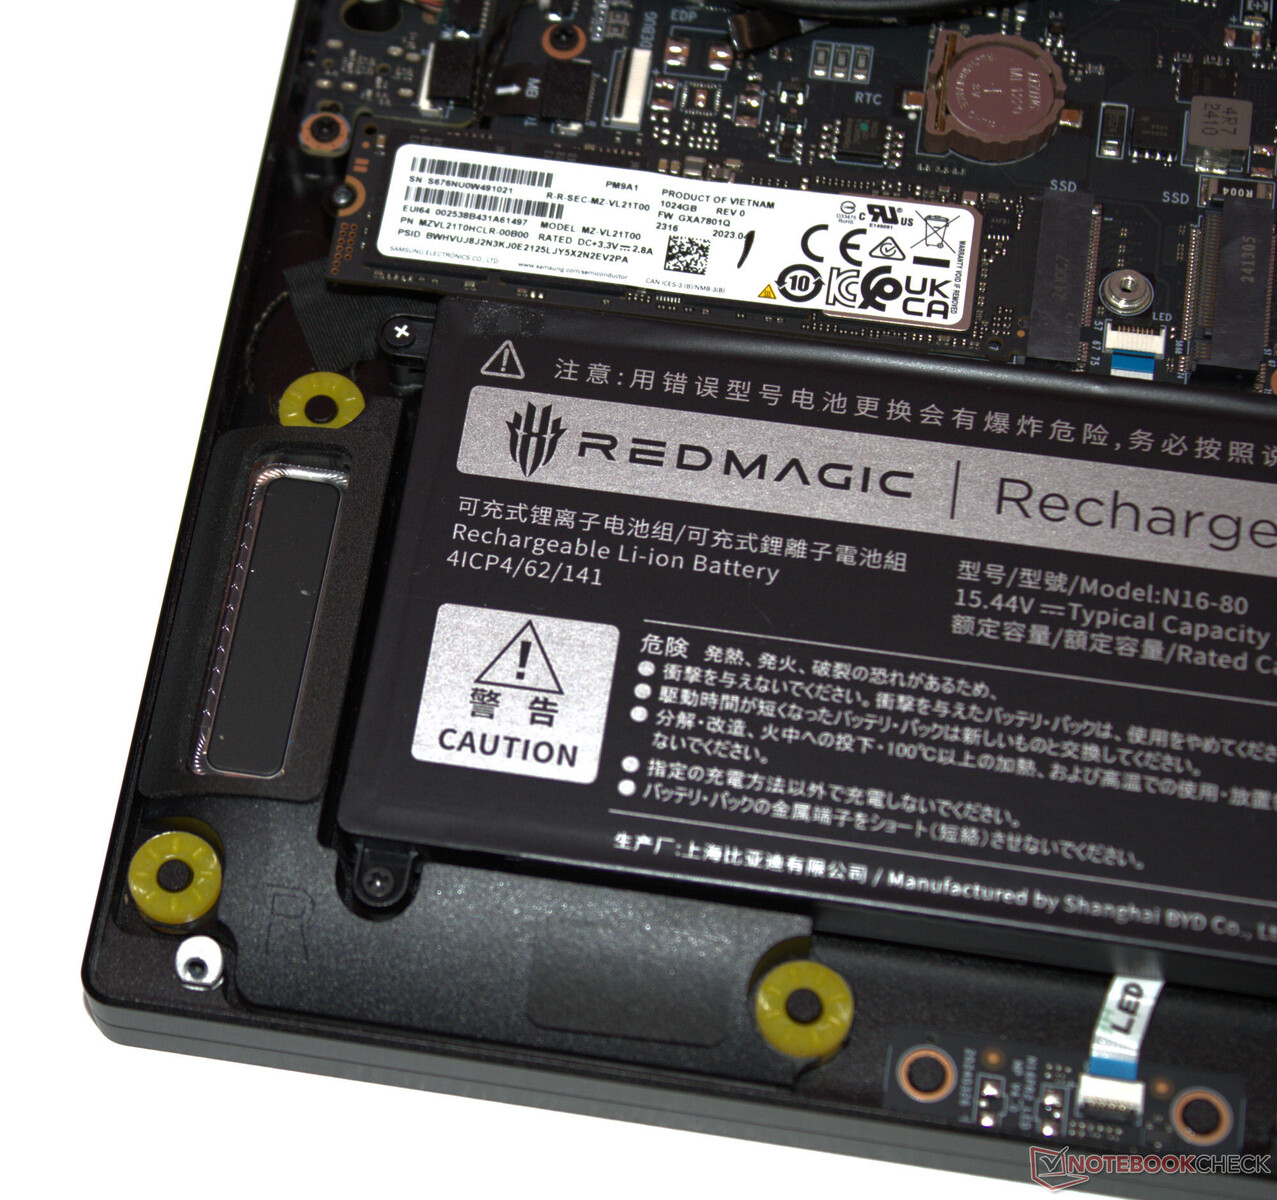
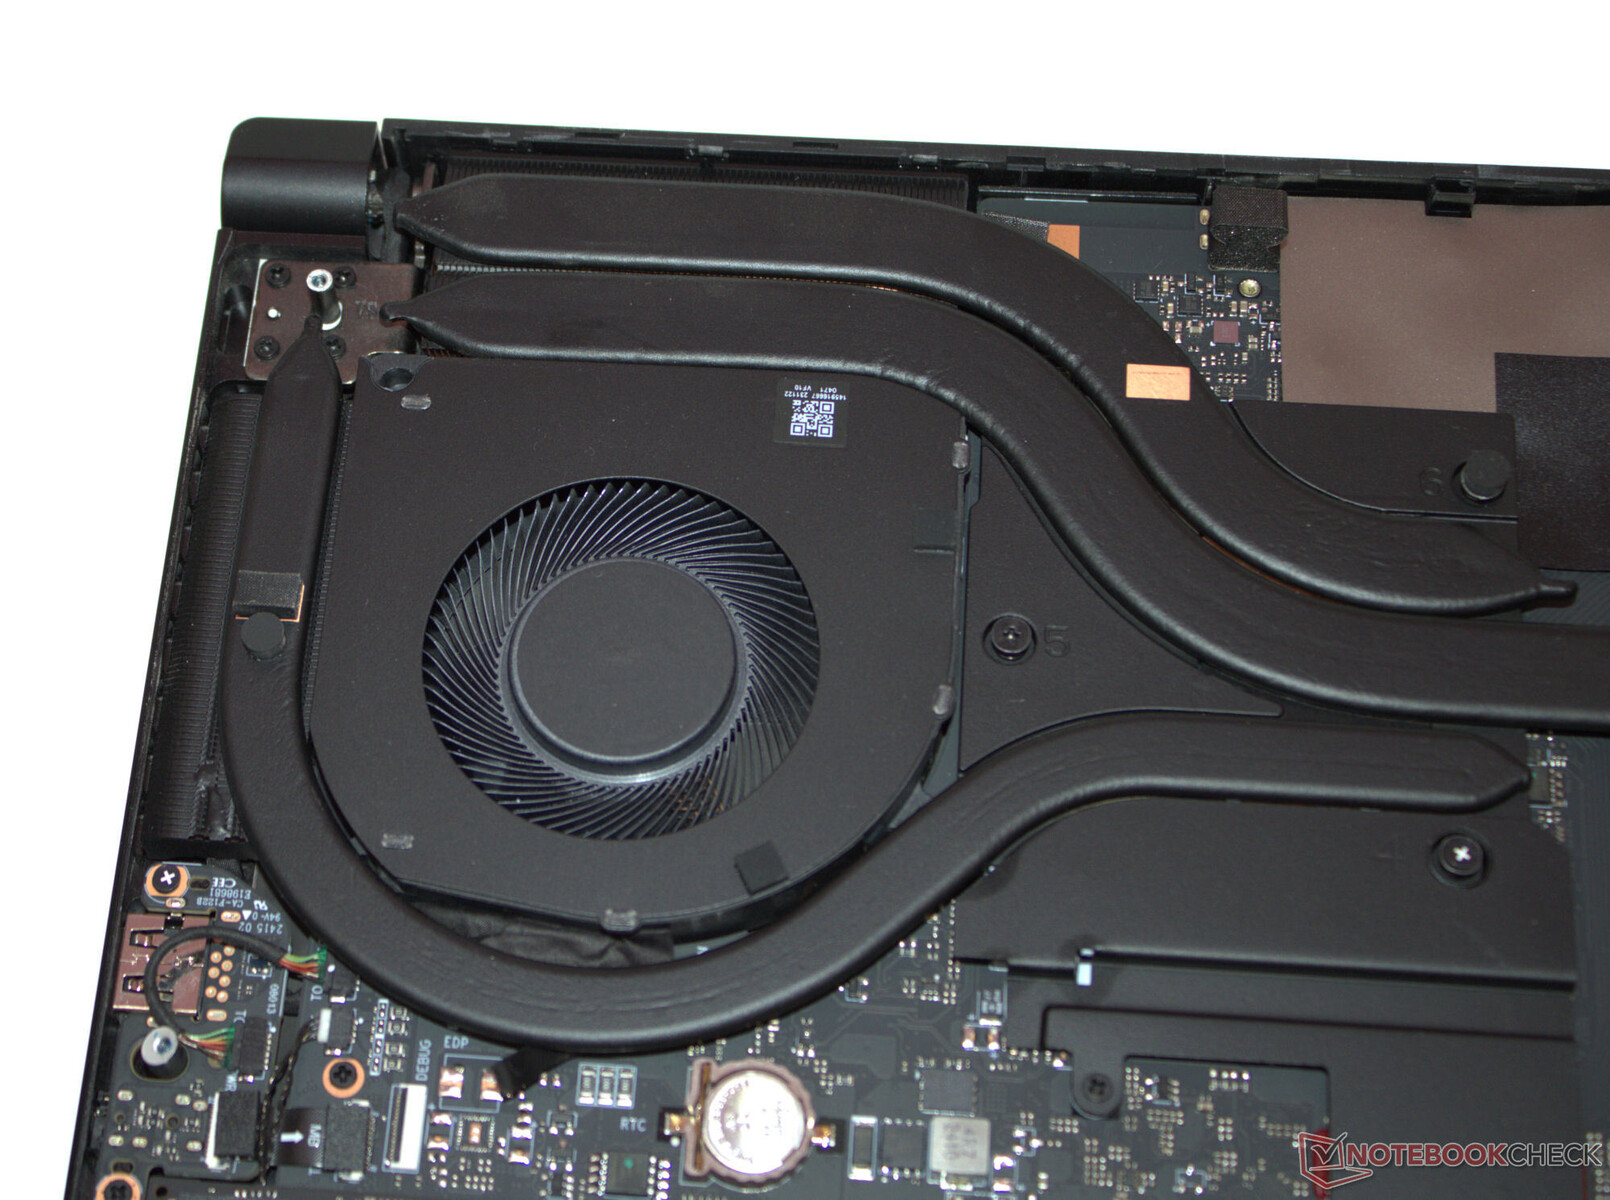
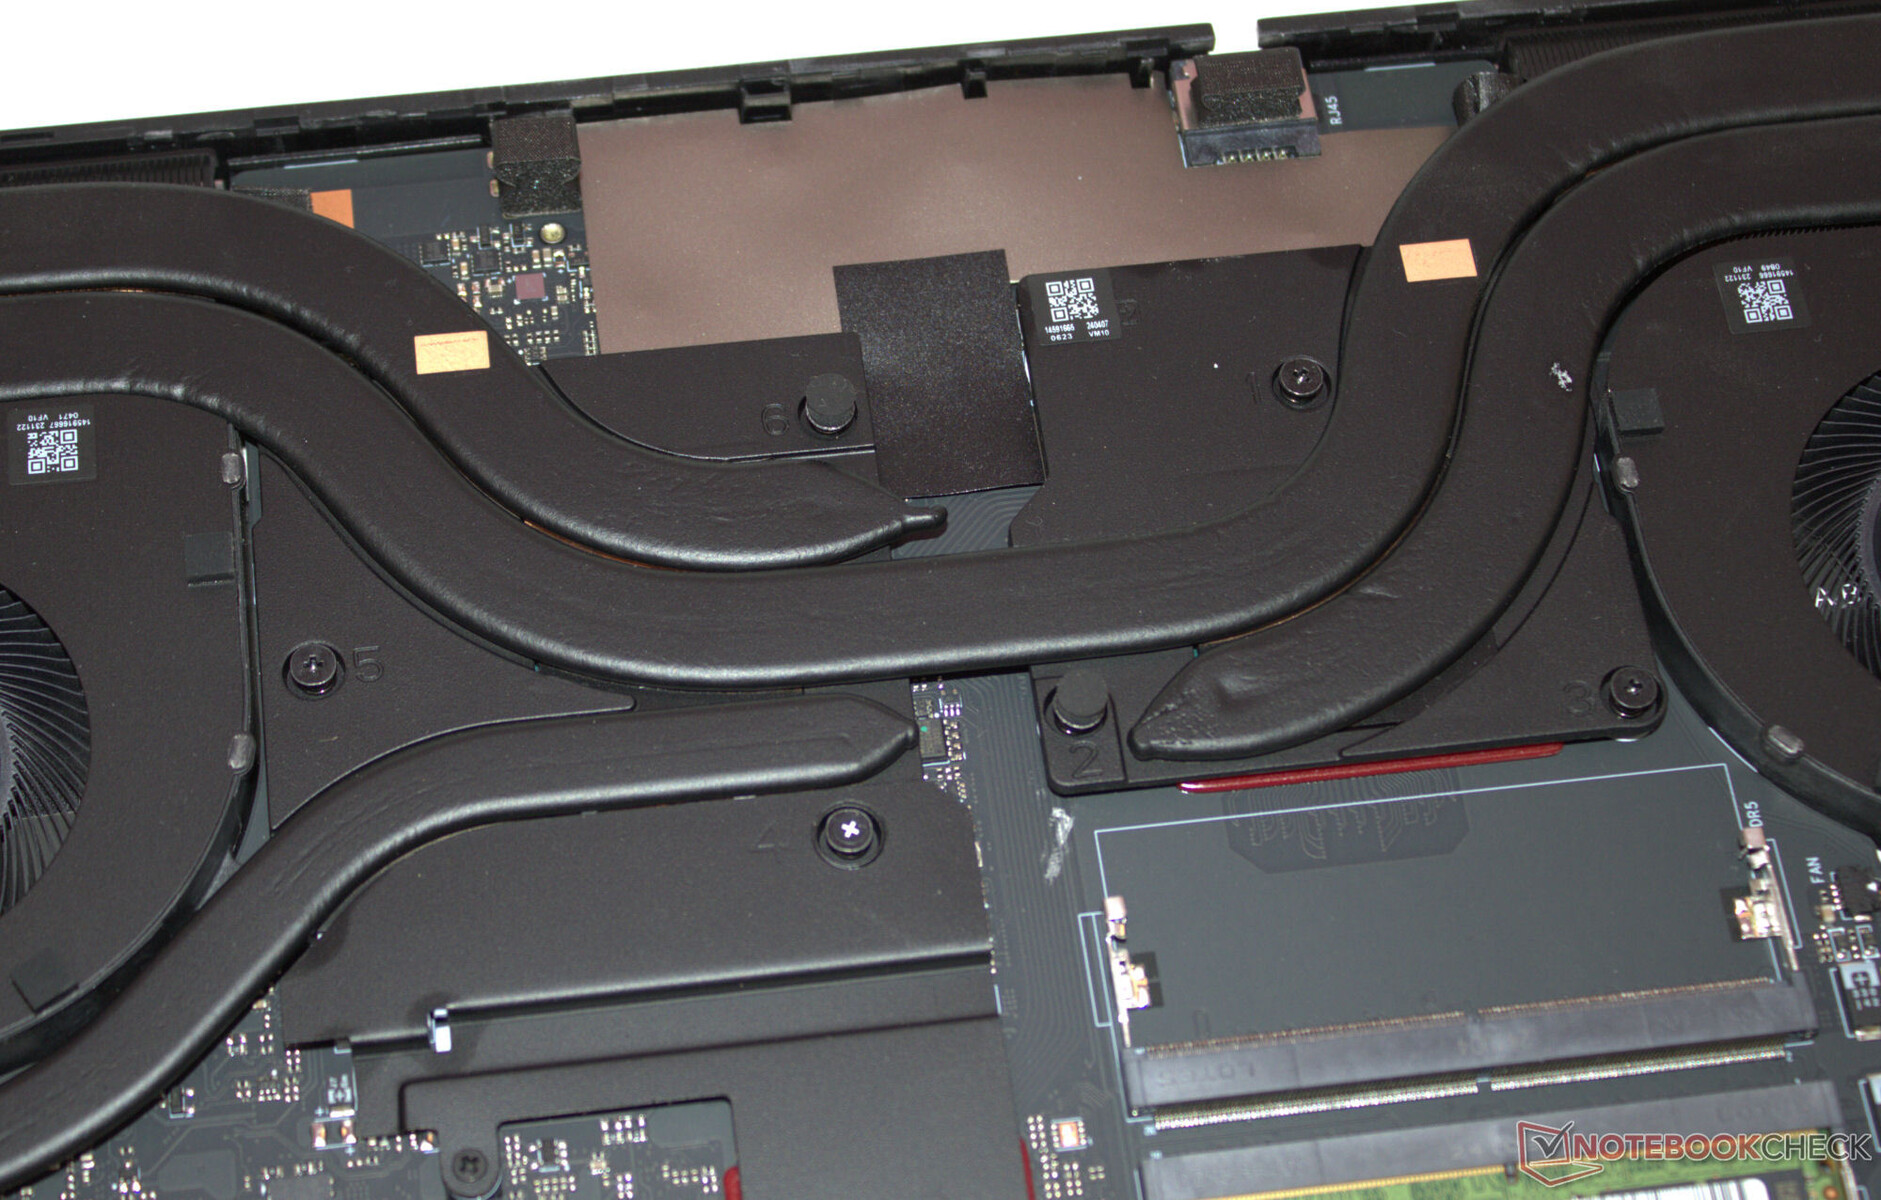
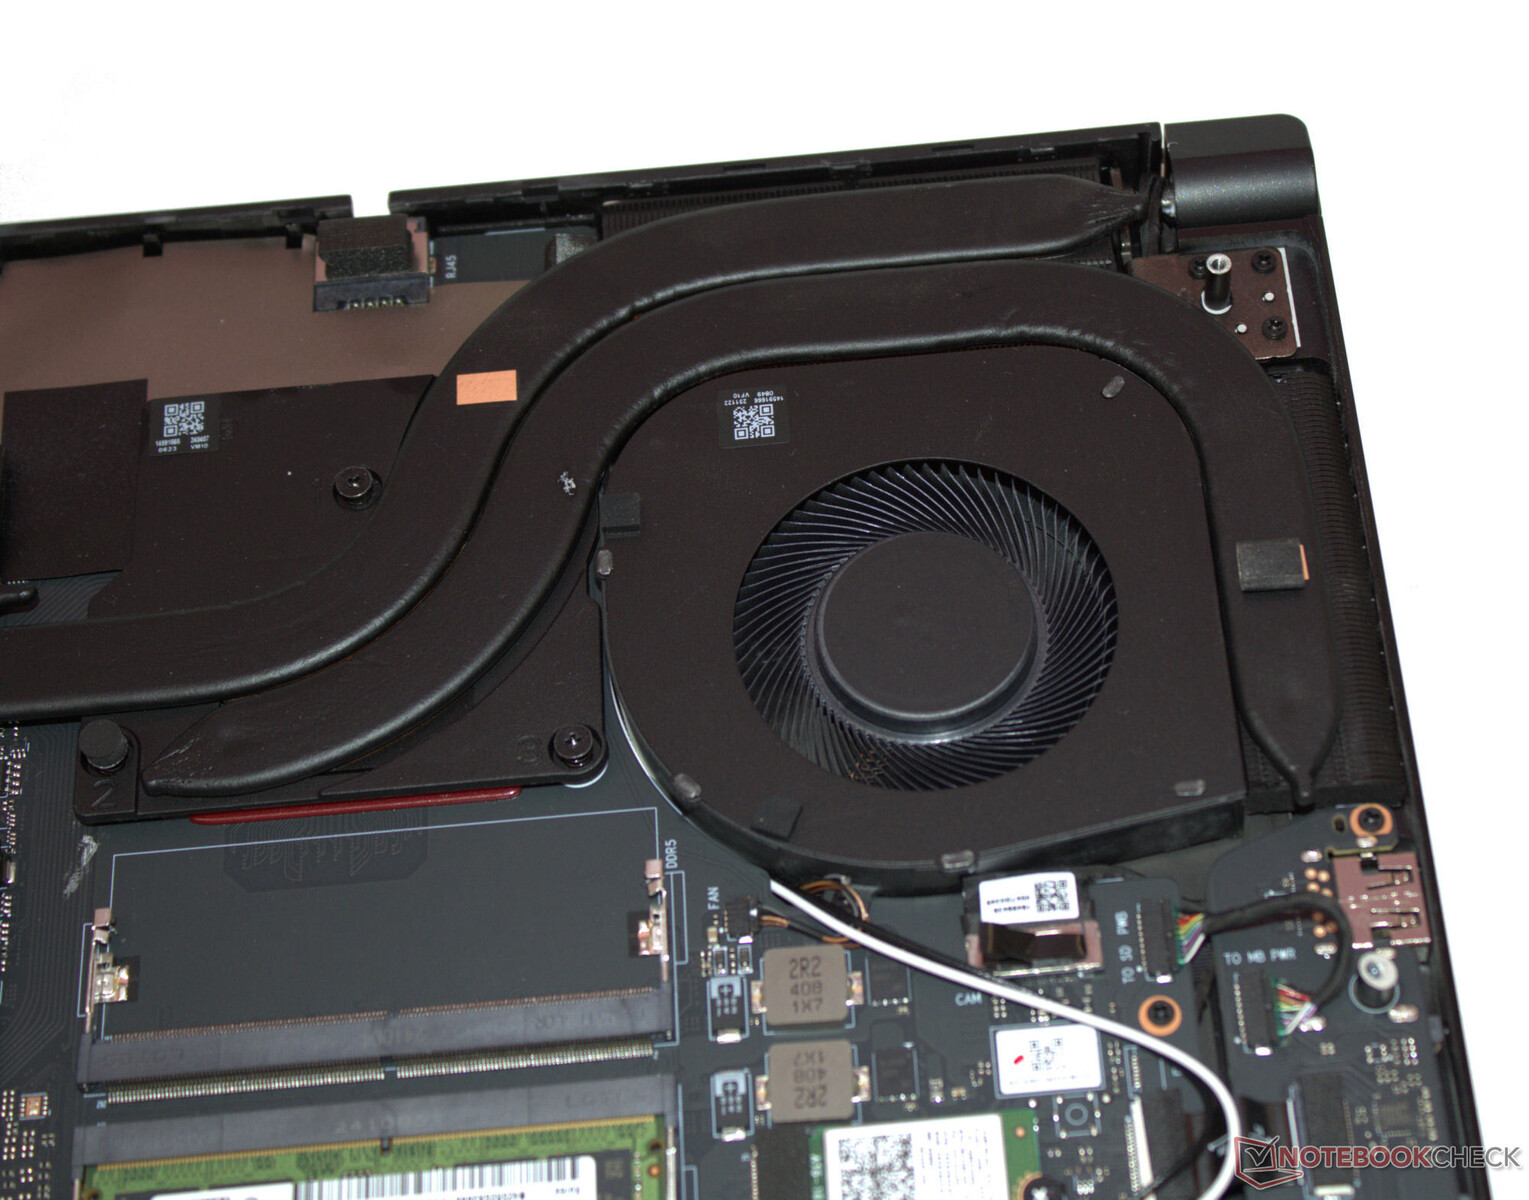
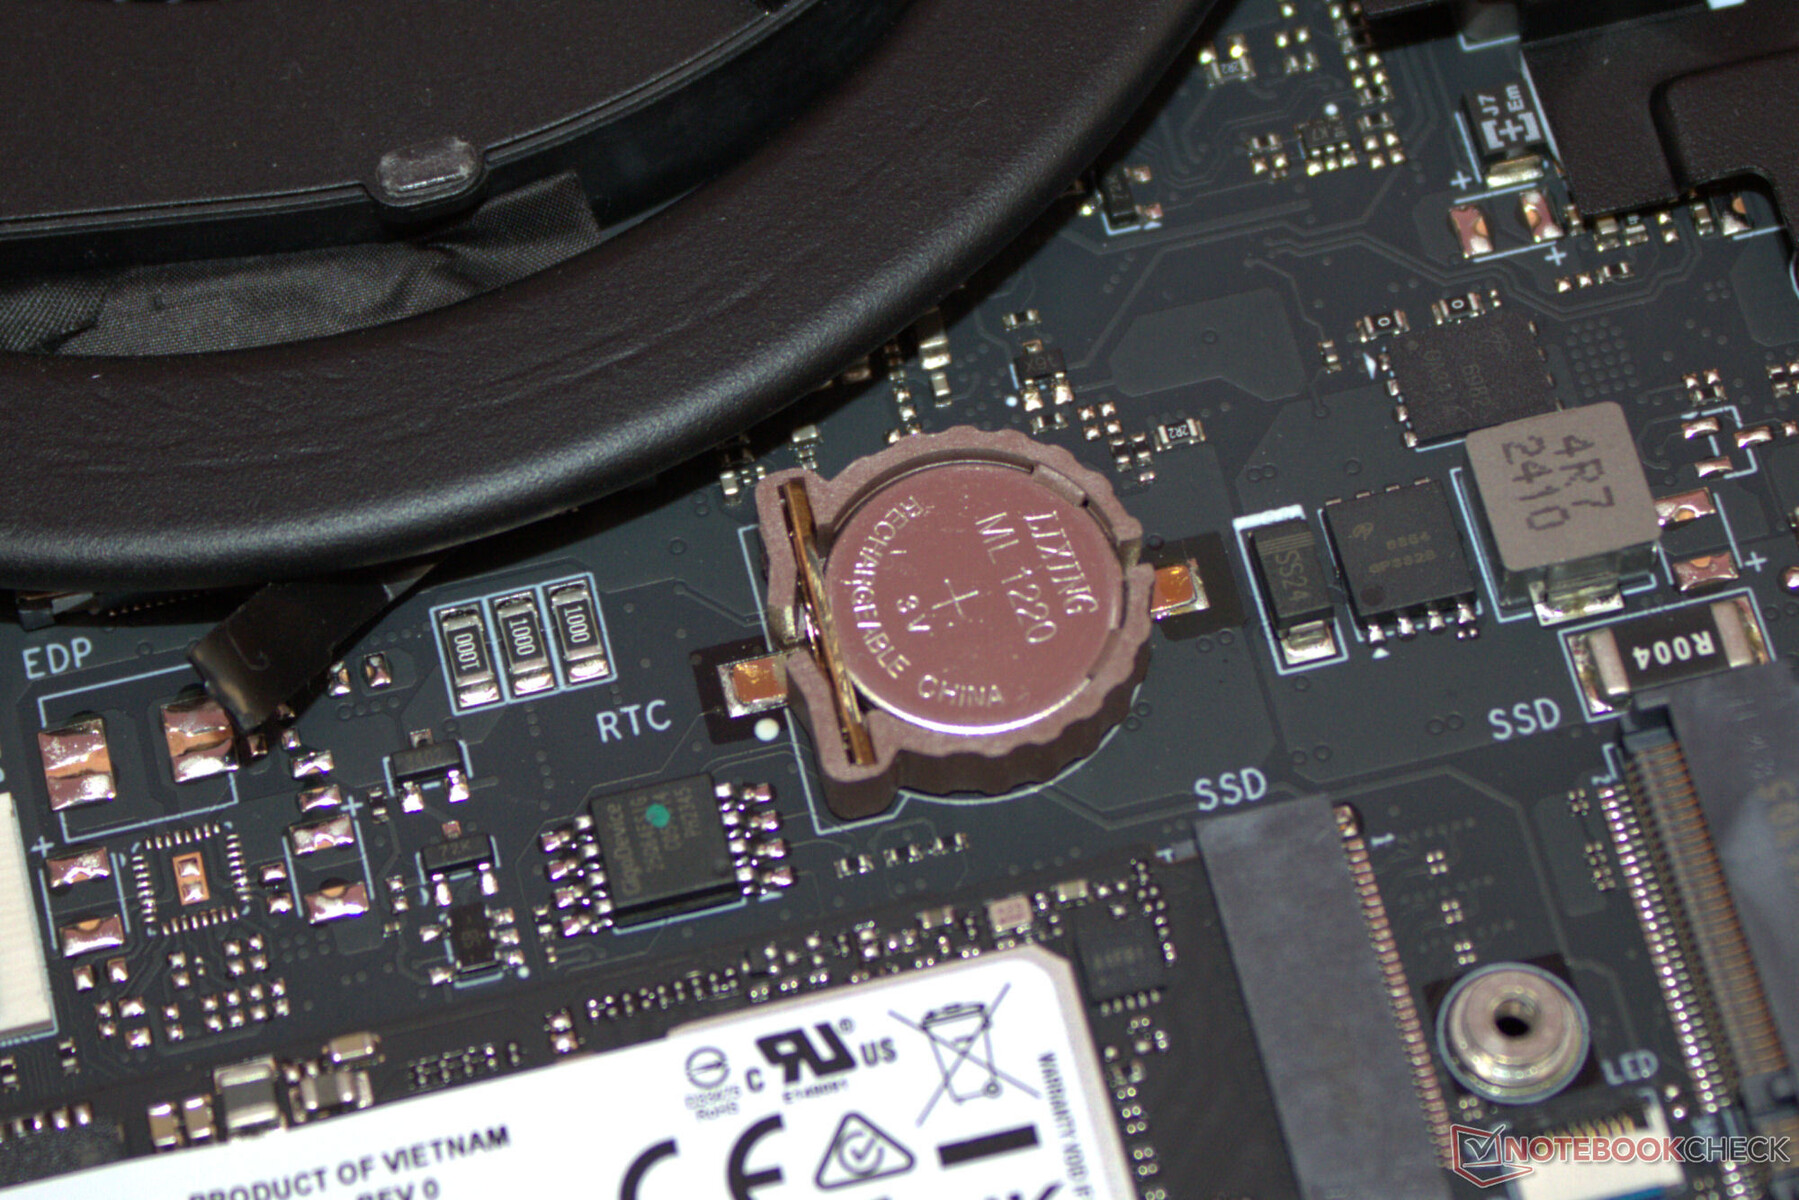
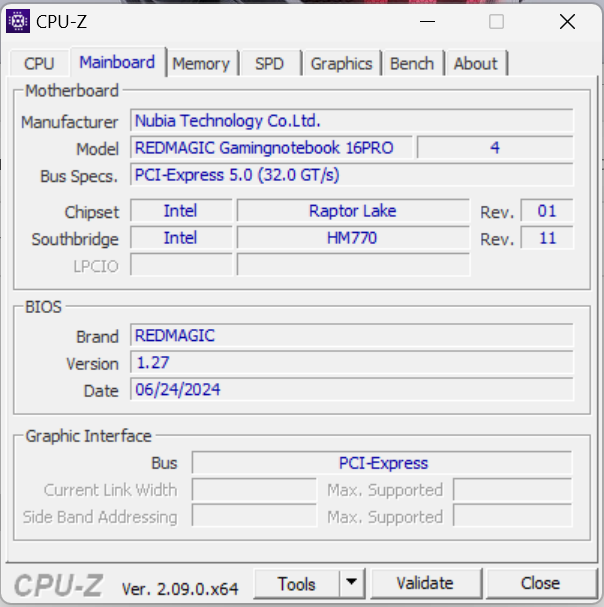
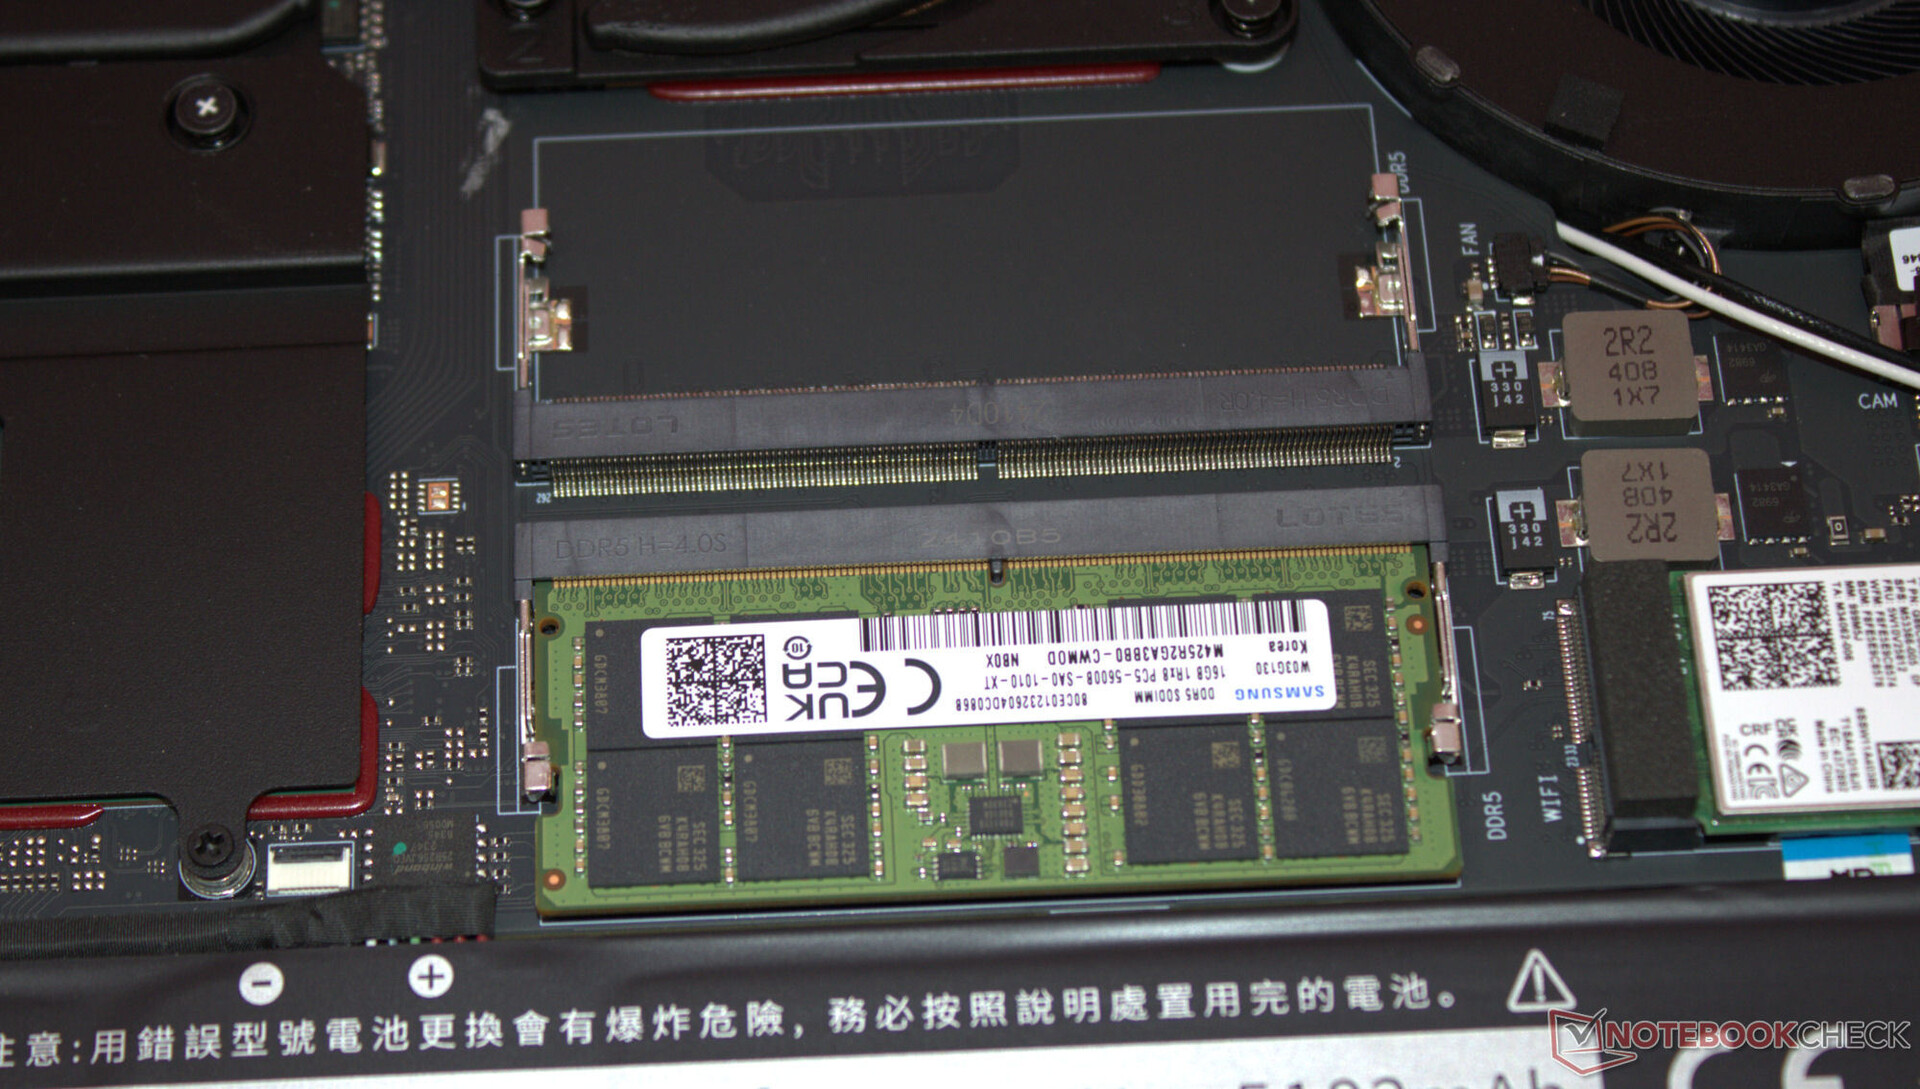
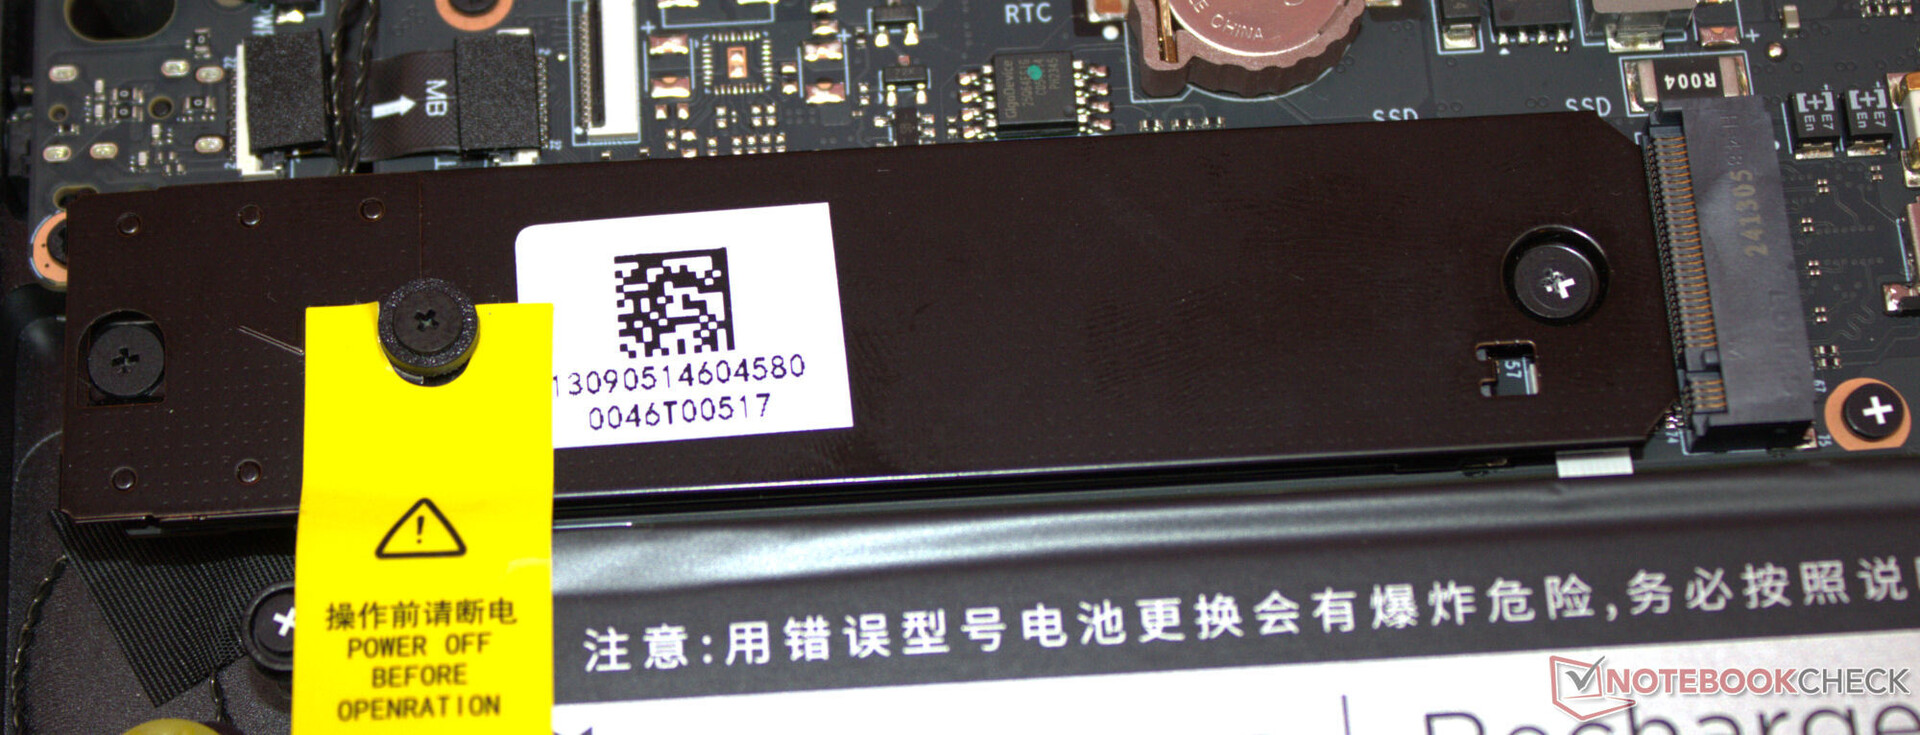
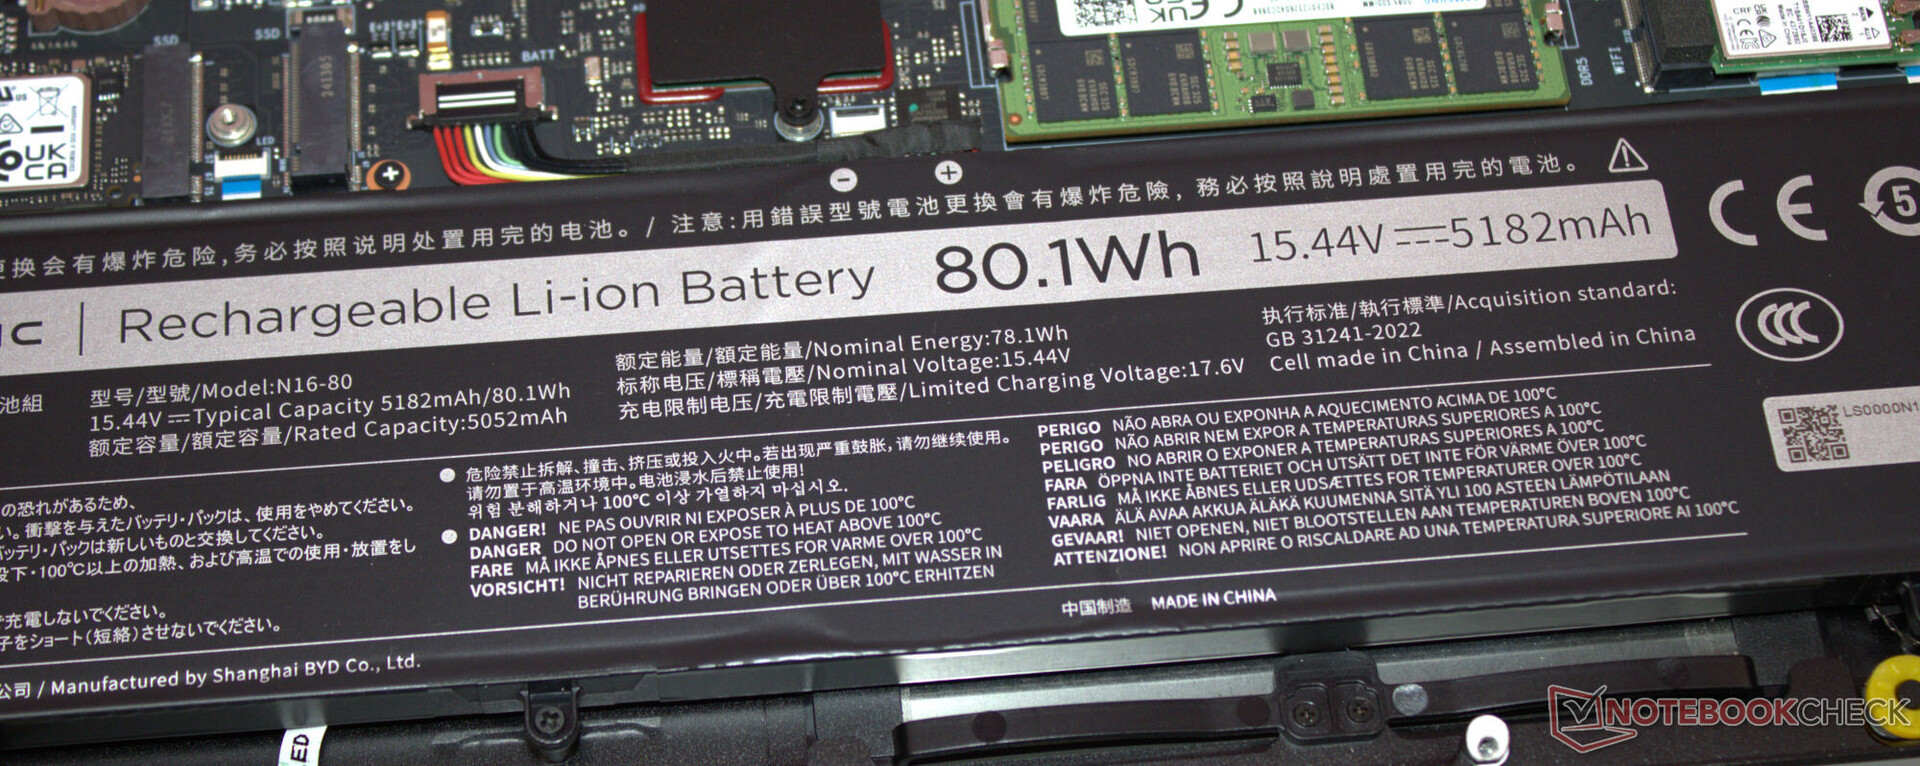
卸下机箱底部的所有螺丝后,可借助拨子弹或扁平刮刀卸下机箱底部。然后就可以访问内存库(其中一个已被占用)、固态硬盘(PCIe 4,M.2-2280)、第二个固态硬盘插槽(PCIe 4,M.2-2280)、WLAN 模块、BIOS 电池、风扇和电池。
可持续性
纸板多,塑料少:笔记本电脑被包裹在一层薄膜中,而薄薄的泡沫垫则保护着设备的顶部。印刷版快速入门指南装在一个塑料袋里。可拆卸的底板使笔记本电脑的维修成为可能--整个硬件都可以触及。软件更新在未来几年应该不成问题,毕竟它使用的是 Windows 11 操作系统。
努比亚将如何处理备件供应和对自家软件的支持还有待观察。截至测试之时,努比亚网站上仍没有 Titan 的下载区。
保修
我们无法提供有关笔记本电脑保修的任何信息--保修期可能在 12 个月左右,这在美国是标准保修期。我们认为延长保修期的可能性不大。
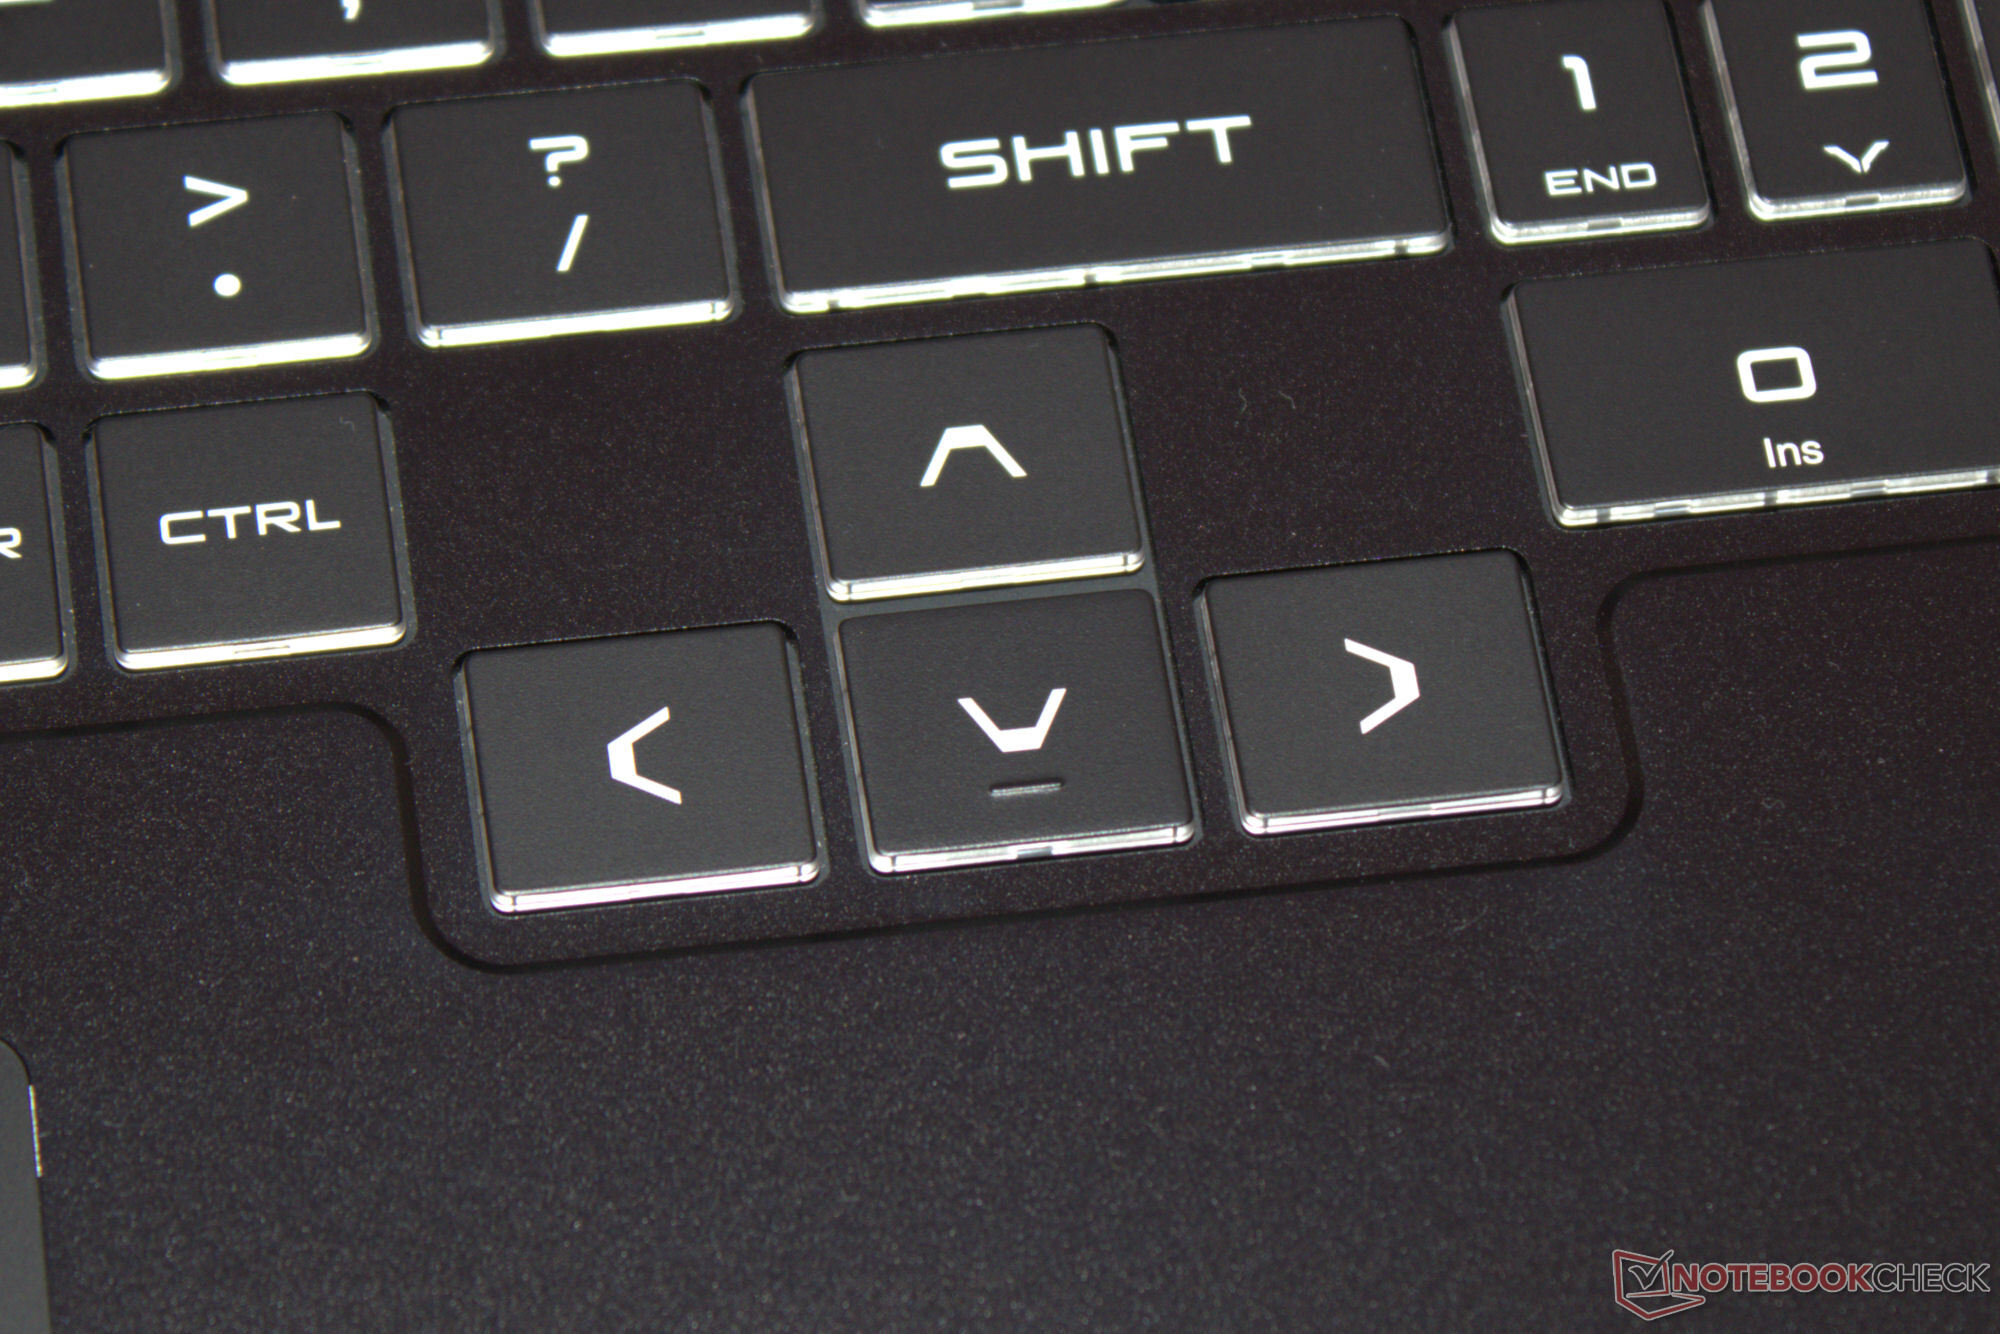
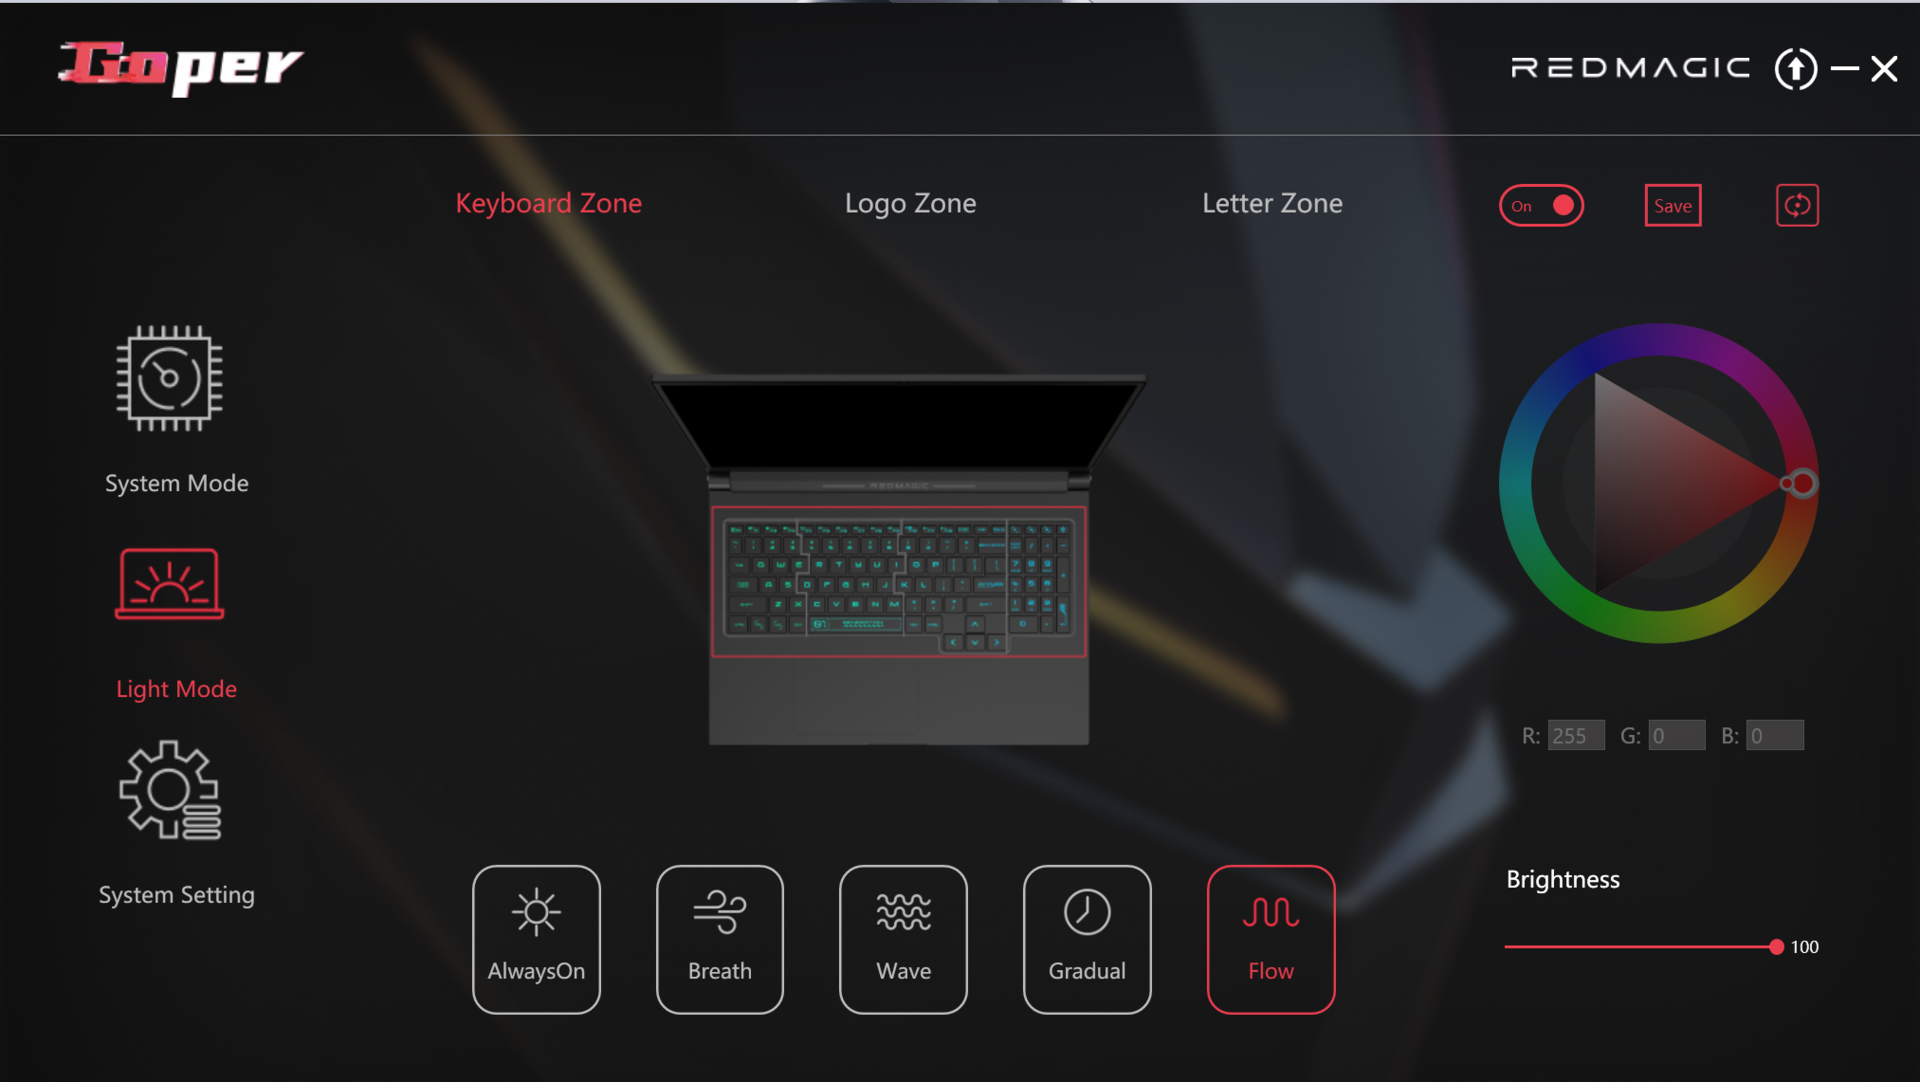
输入设备 - 配备 RGB 灯光的 RedMagic 笔记本电脑
键盘
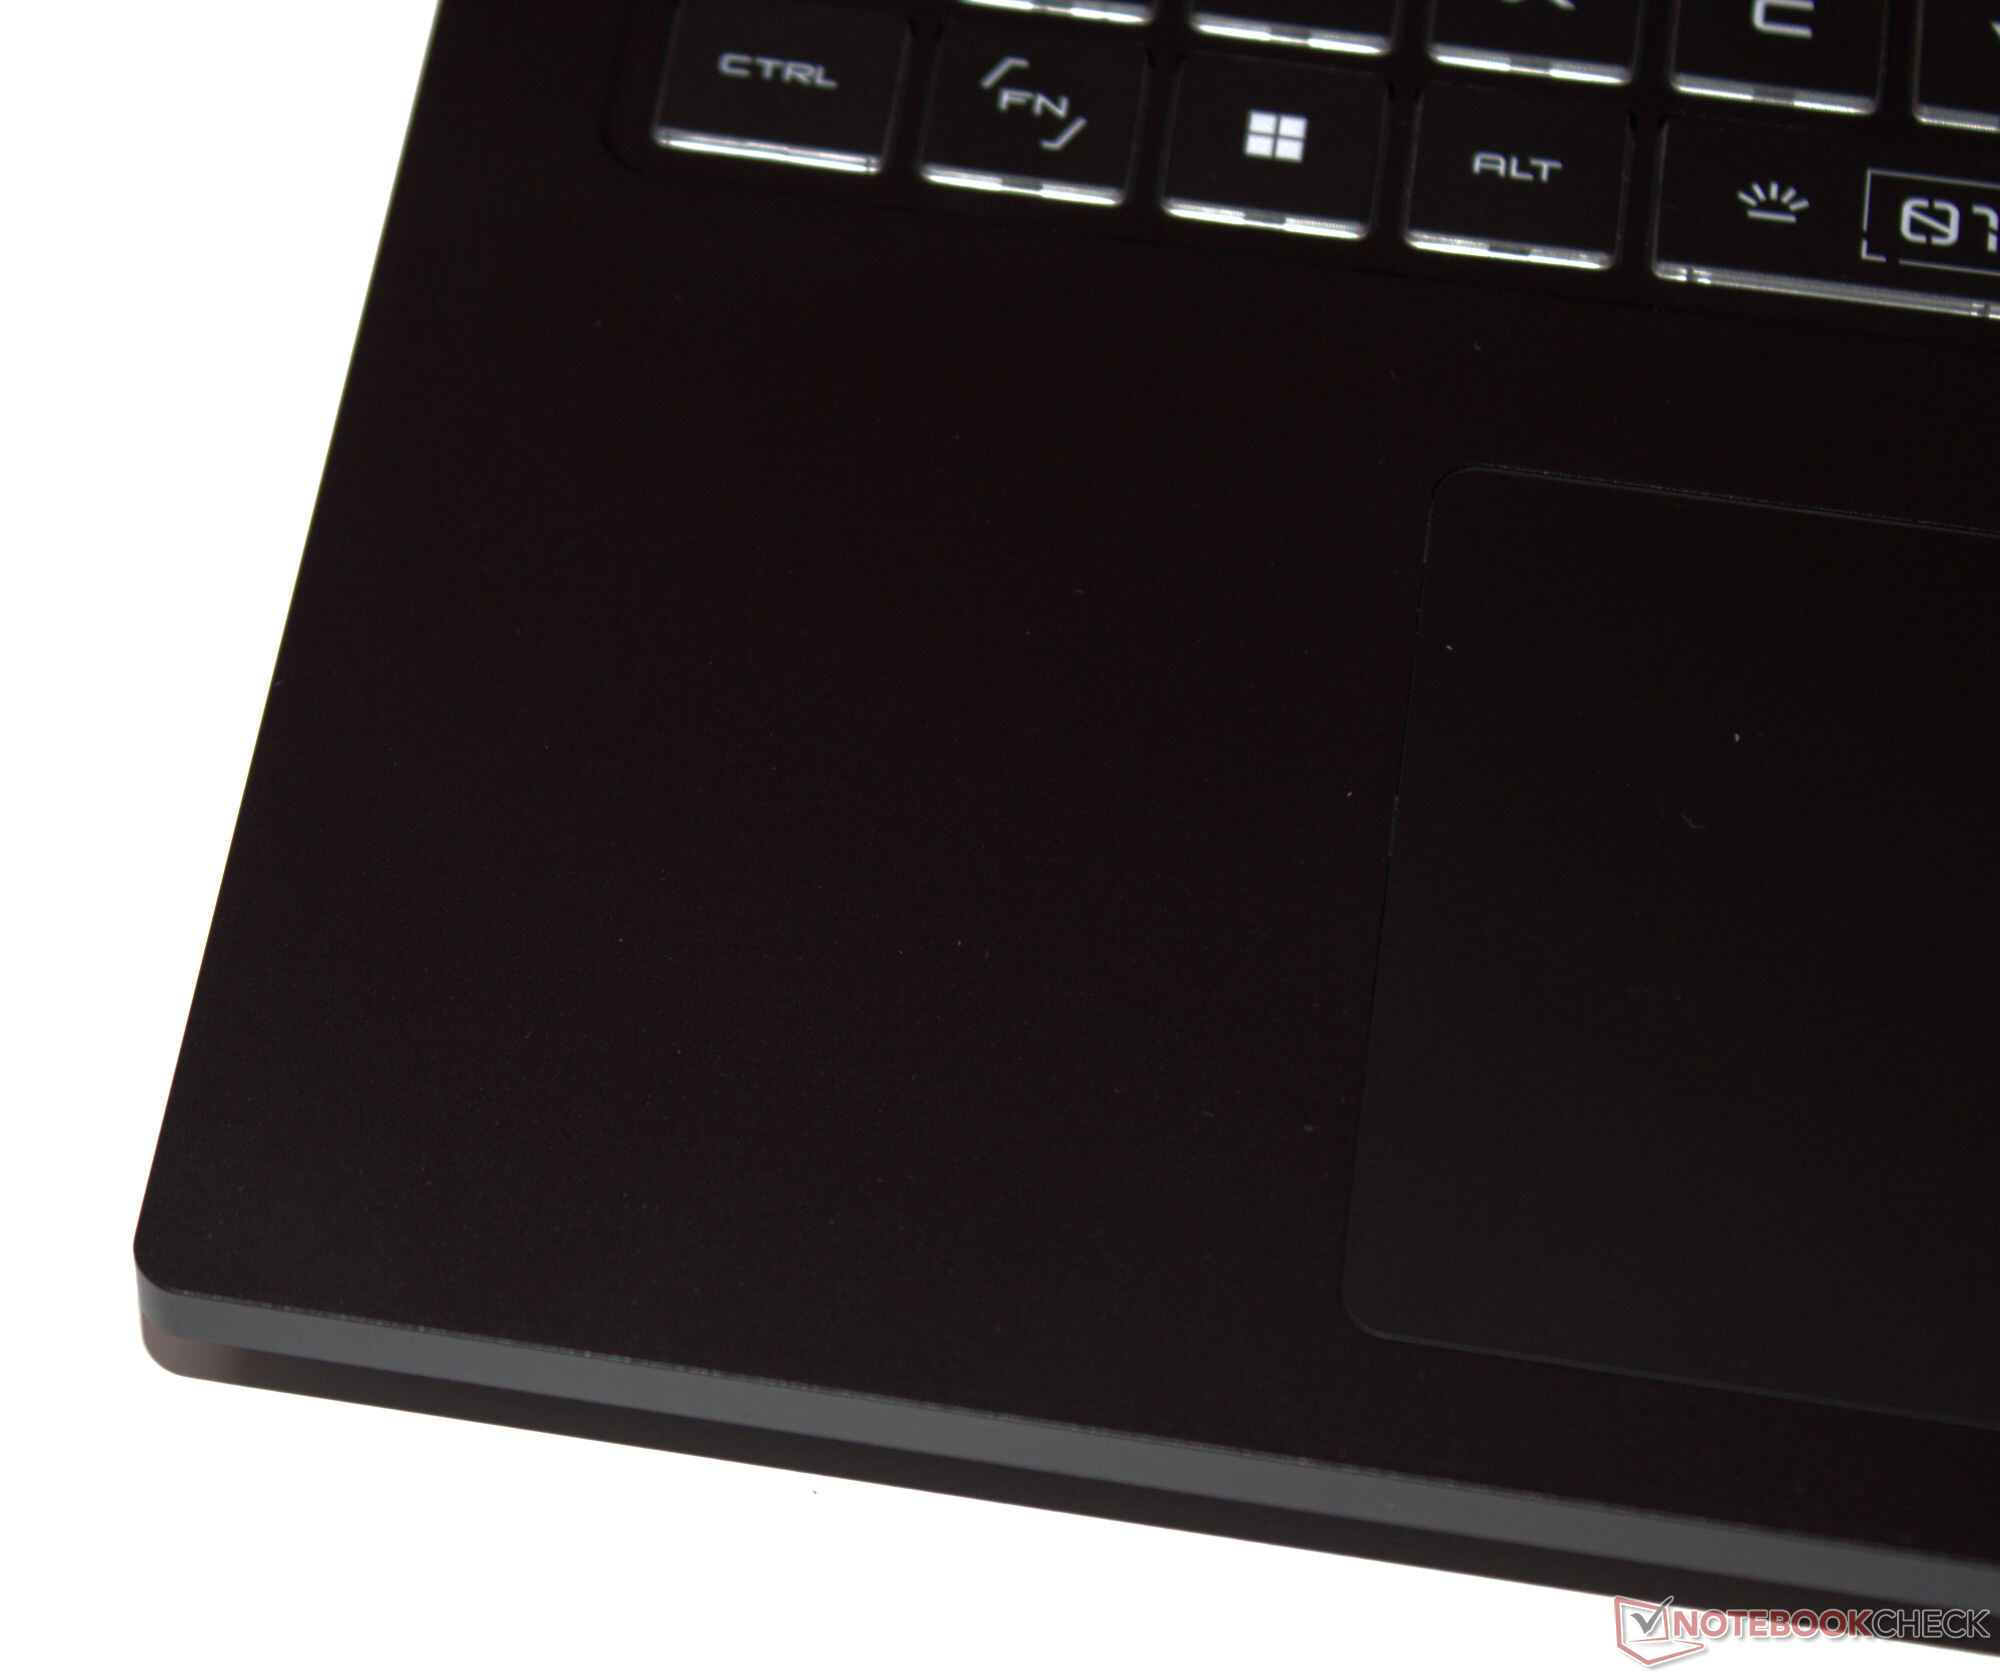
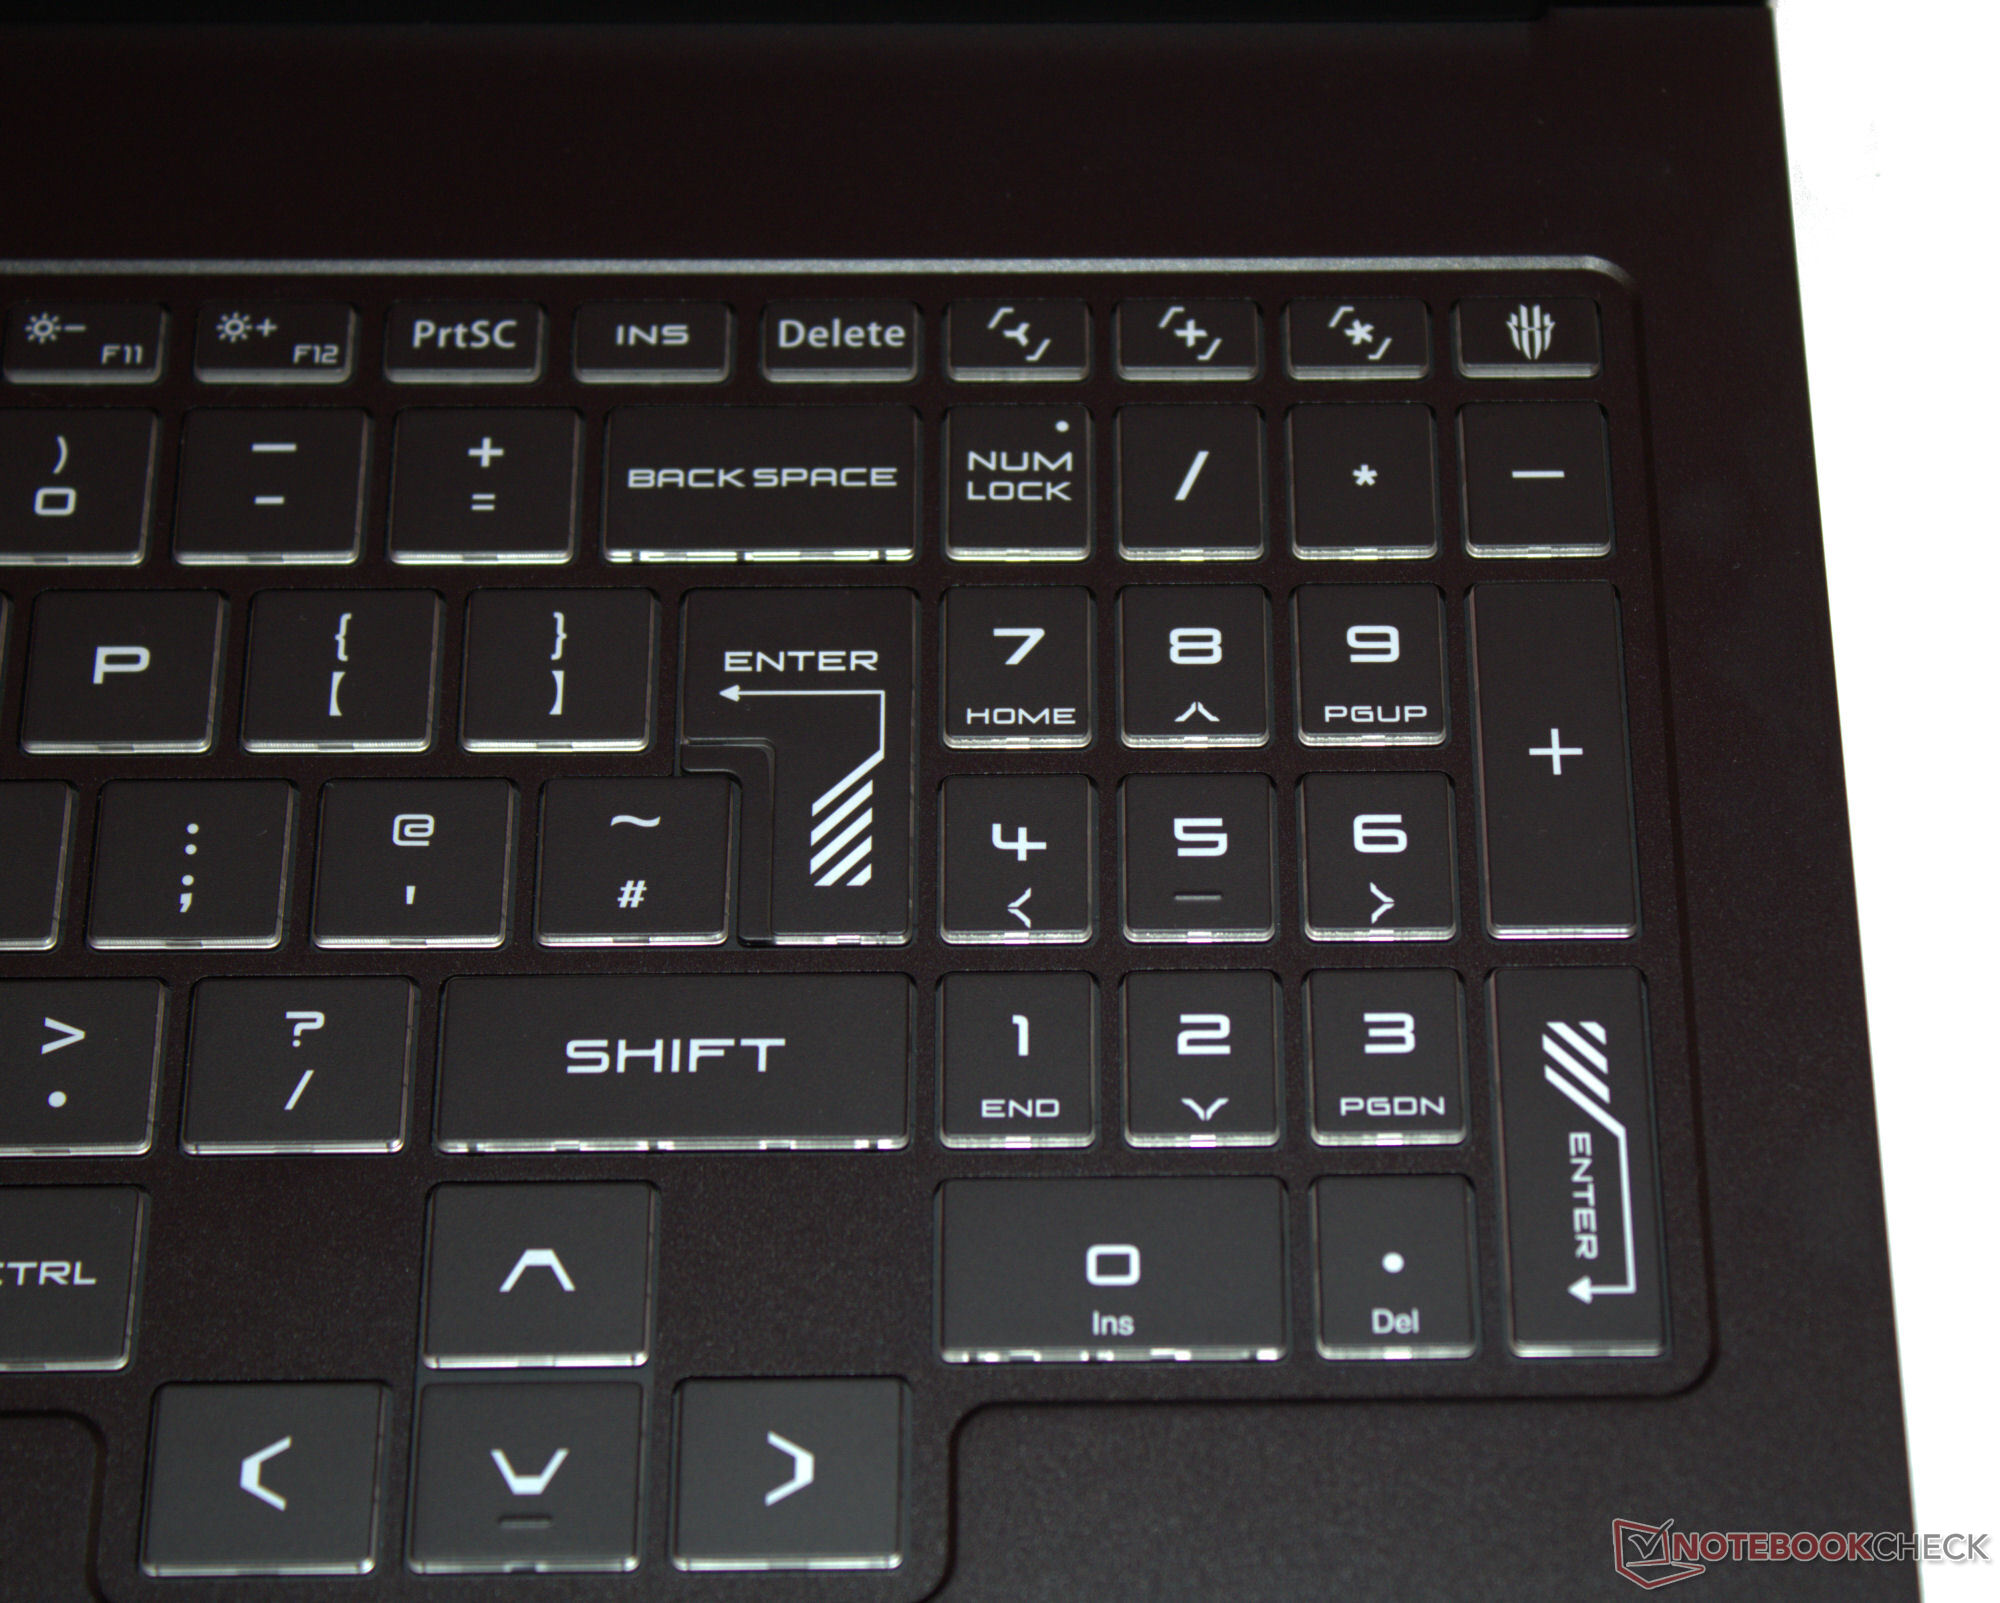
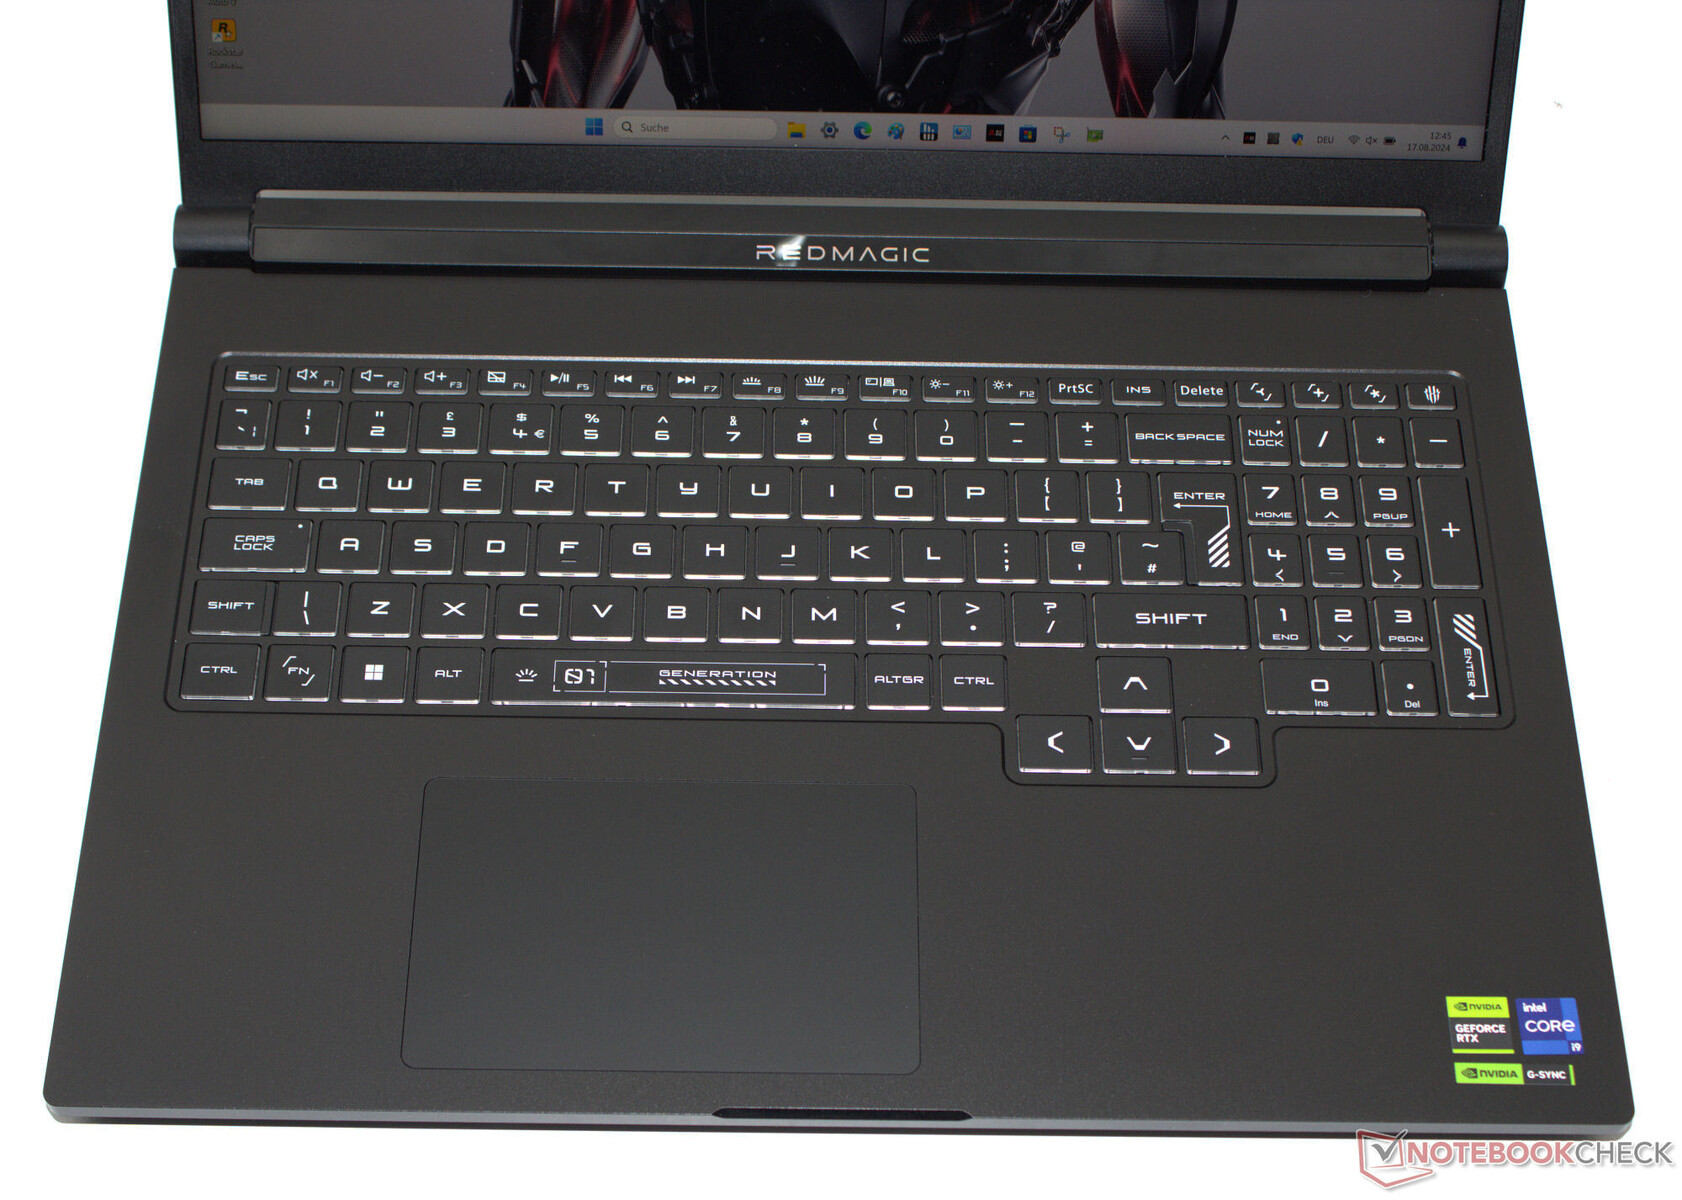
努比亚采用了包括数字键盘在内的 Chiclet 键盘。按键亮度均匀,键程较短,按压点清晰。在键盘上打字时,键盘不会屈服。一个积极的方面是它的偏置方向键是全尺寸的。它的 RGB 背光分为四个区域,我们的测试设备采用 QWERTY 键盘布局。我们不知道制造商是否提供本地化布局。
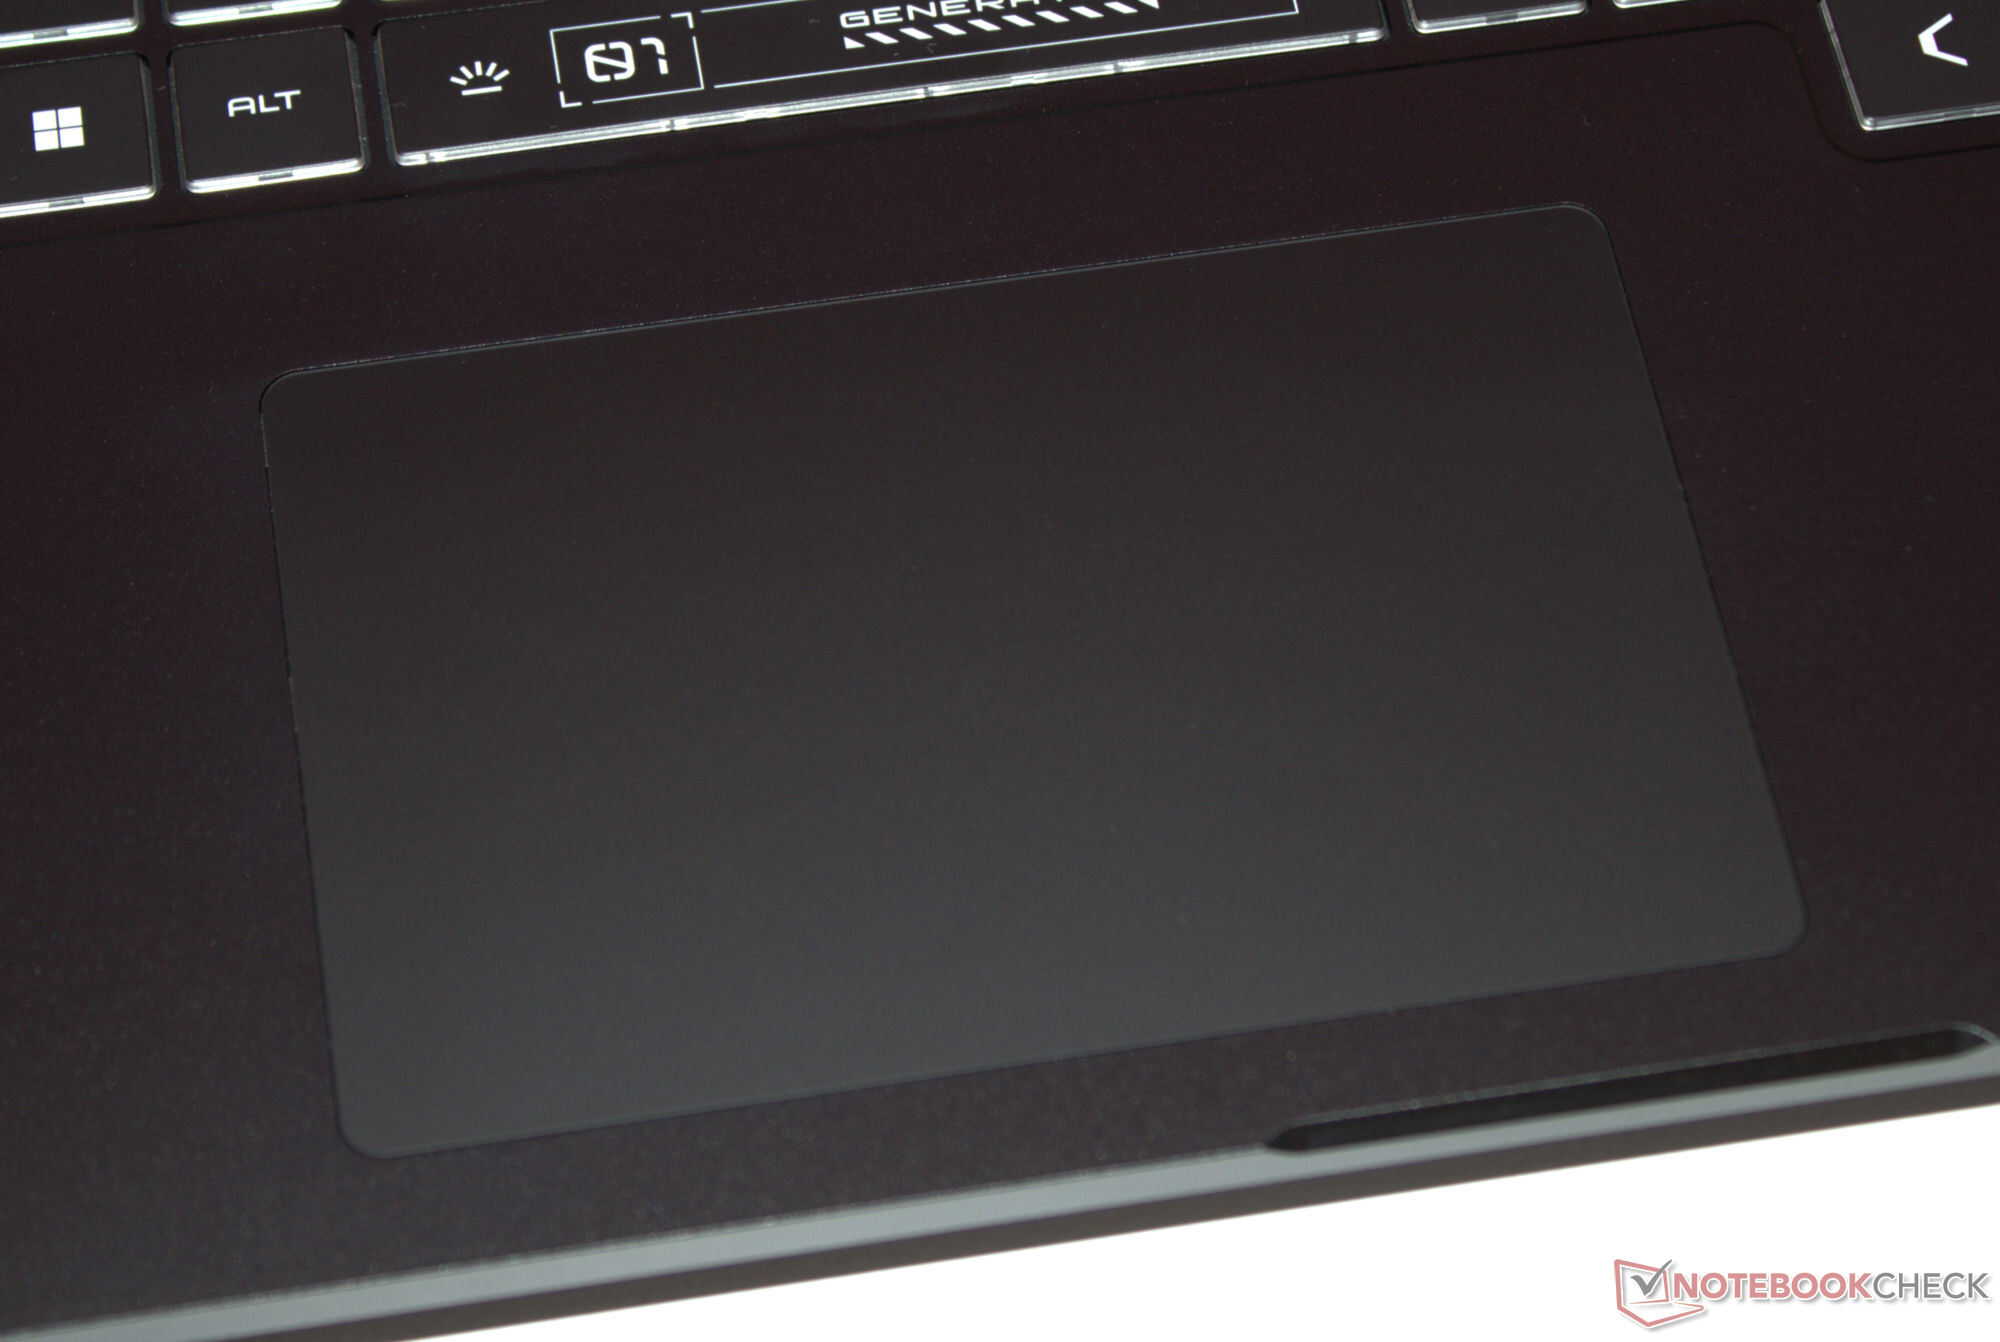
触摸板
带玻璃表面的多点触摸点击板(约 11.7 x 7.5 厘米)可替代鼠标。它的行程短,压力点清晰。如有需要,可将触摸板停用。
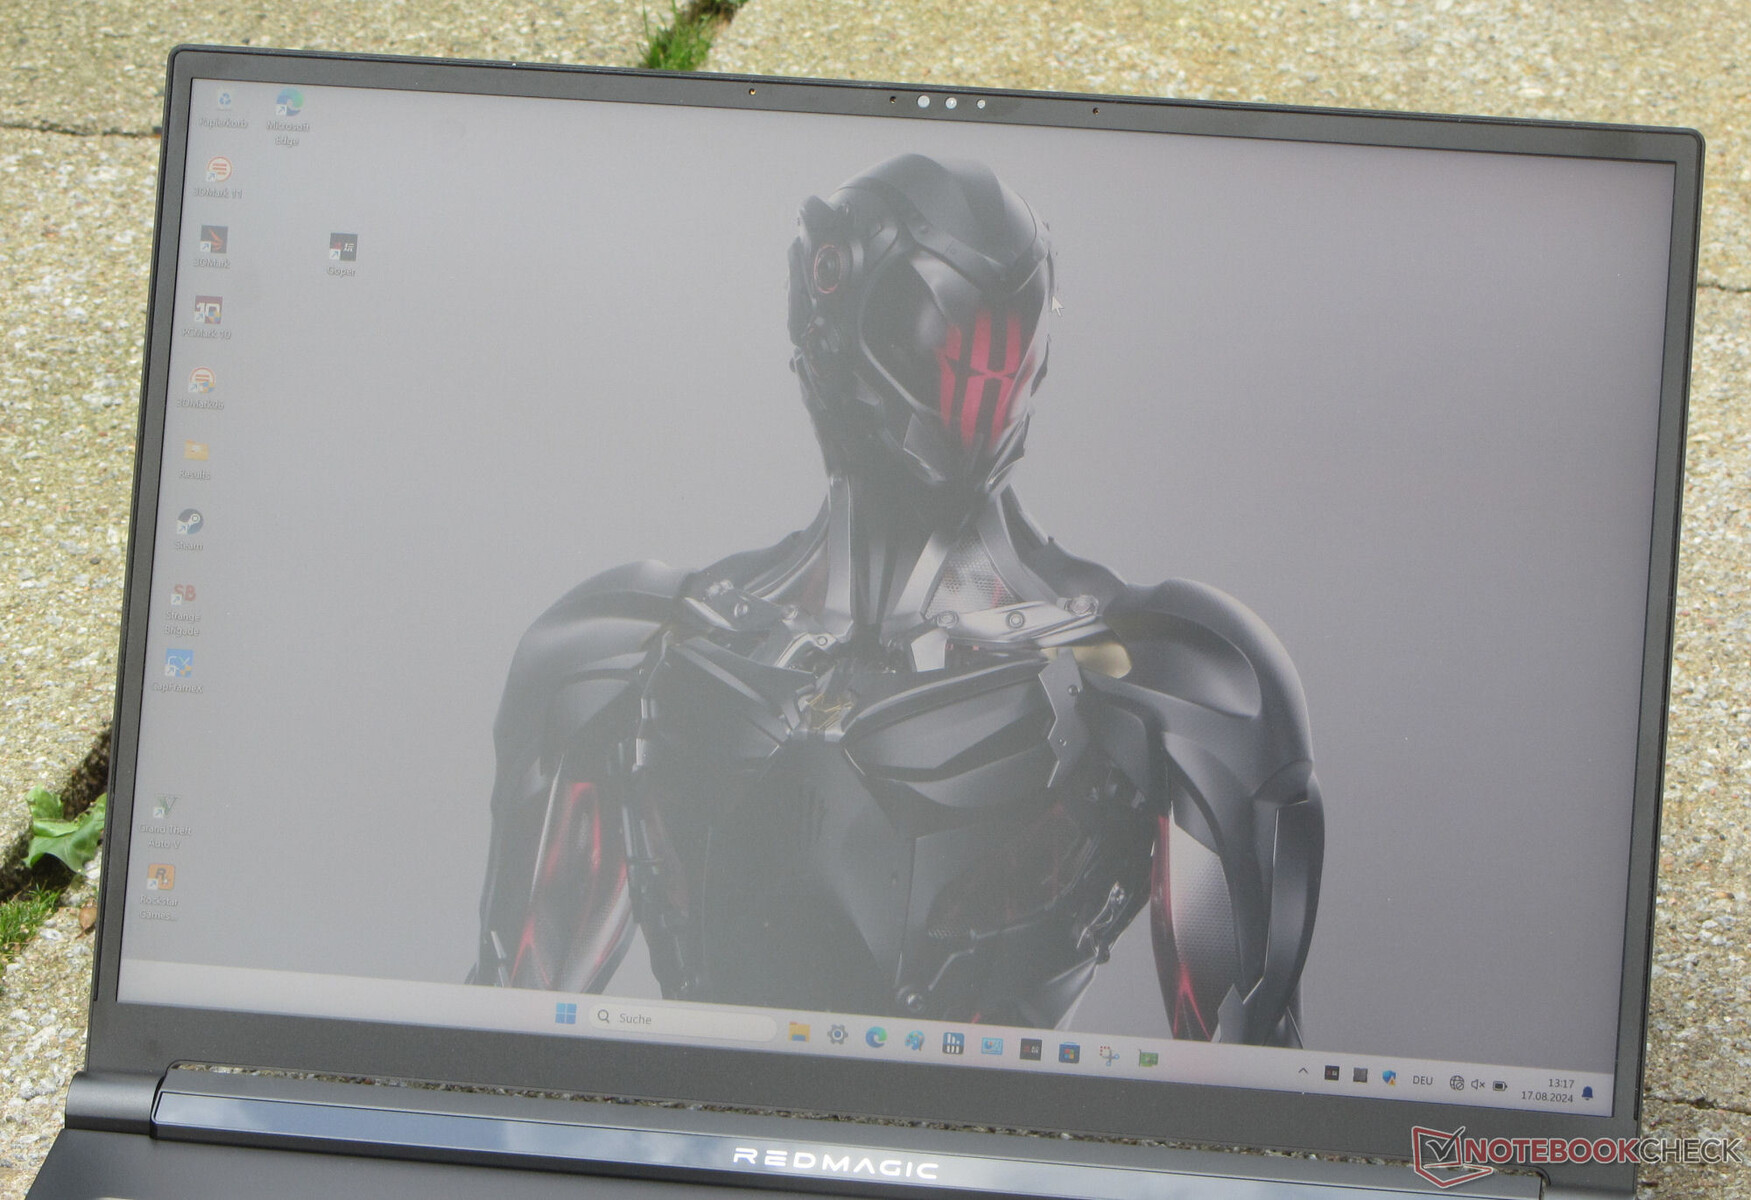
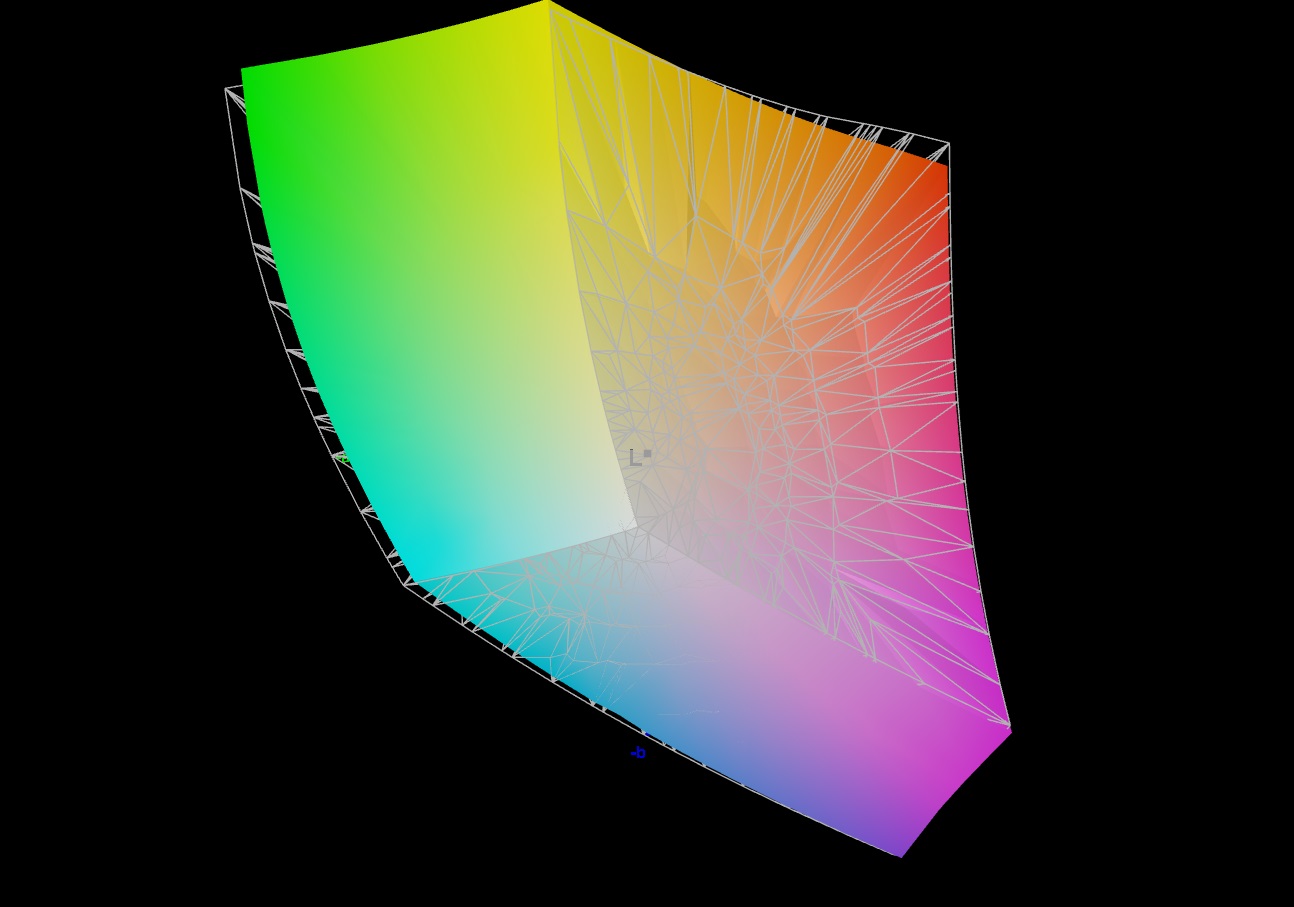
显示屏 - 覆盖 DCI-P3 的 IPS 面板
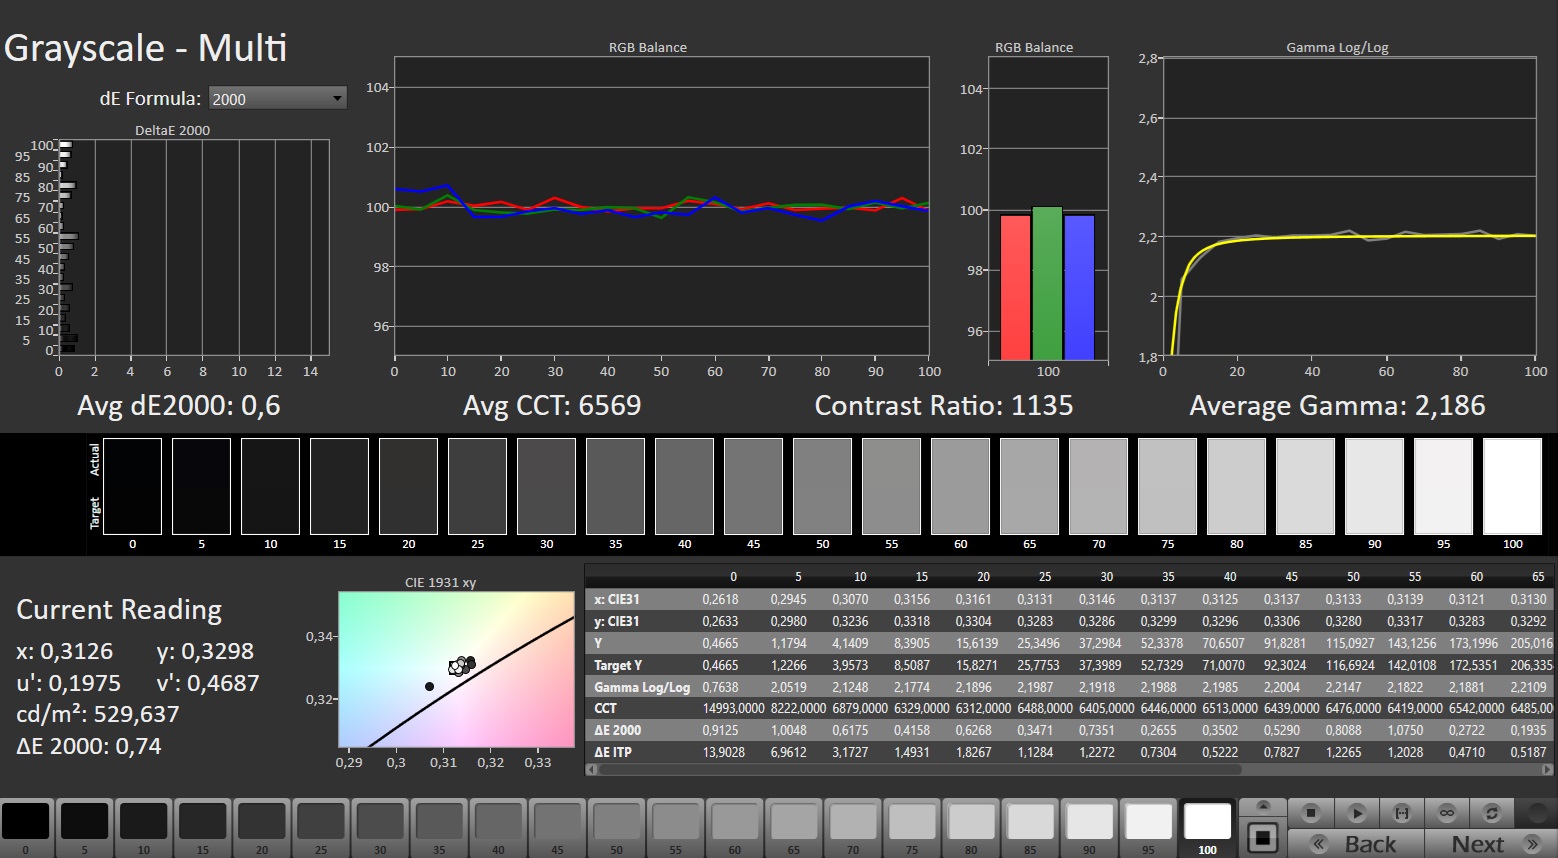
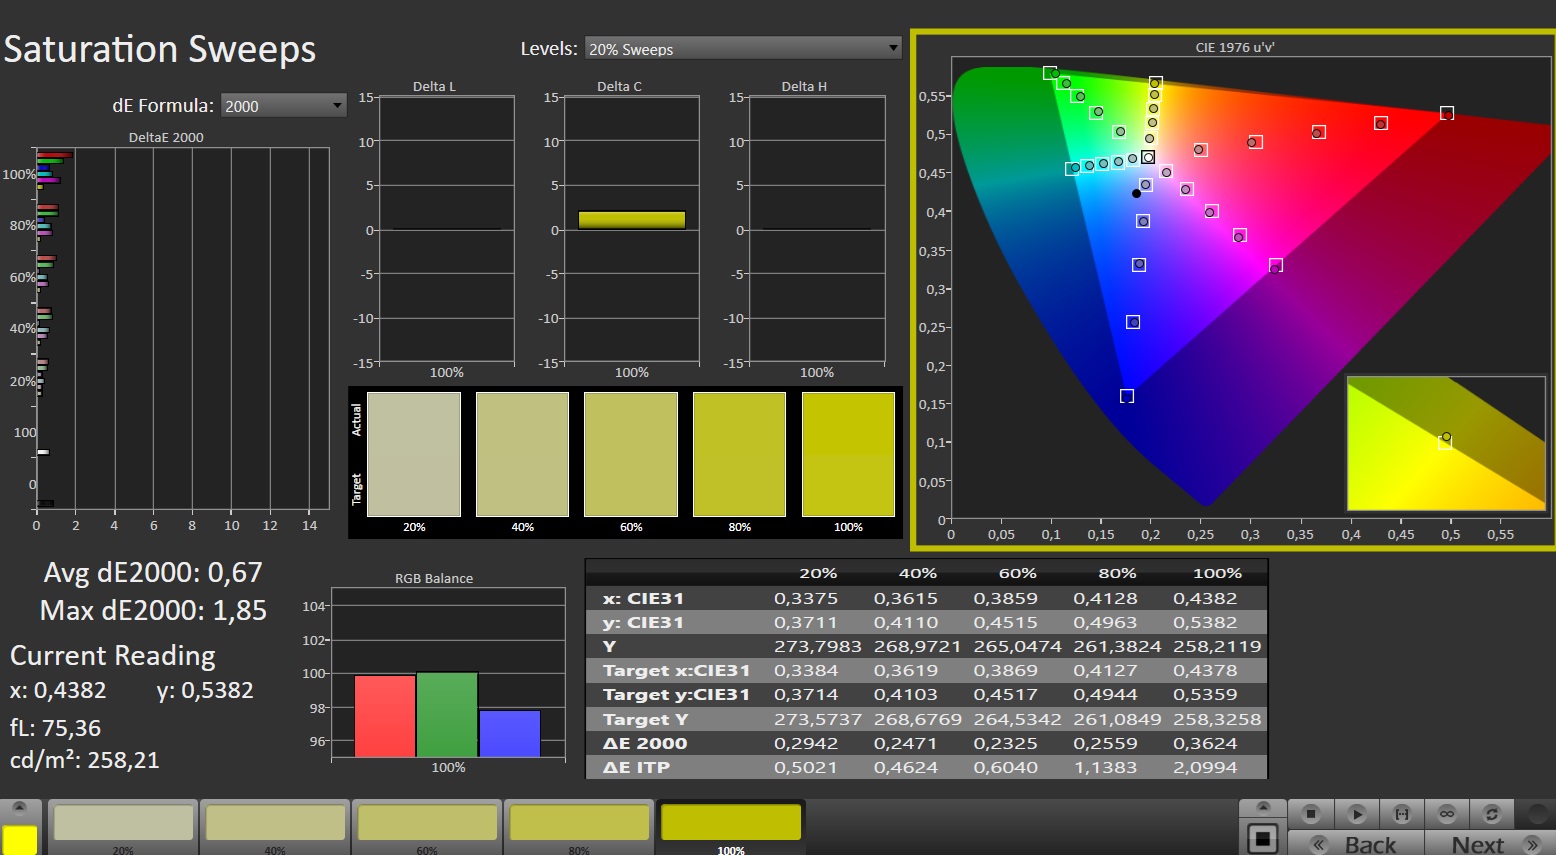
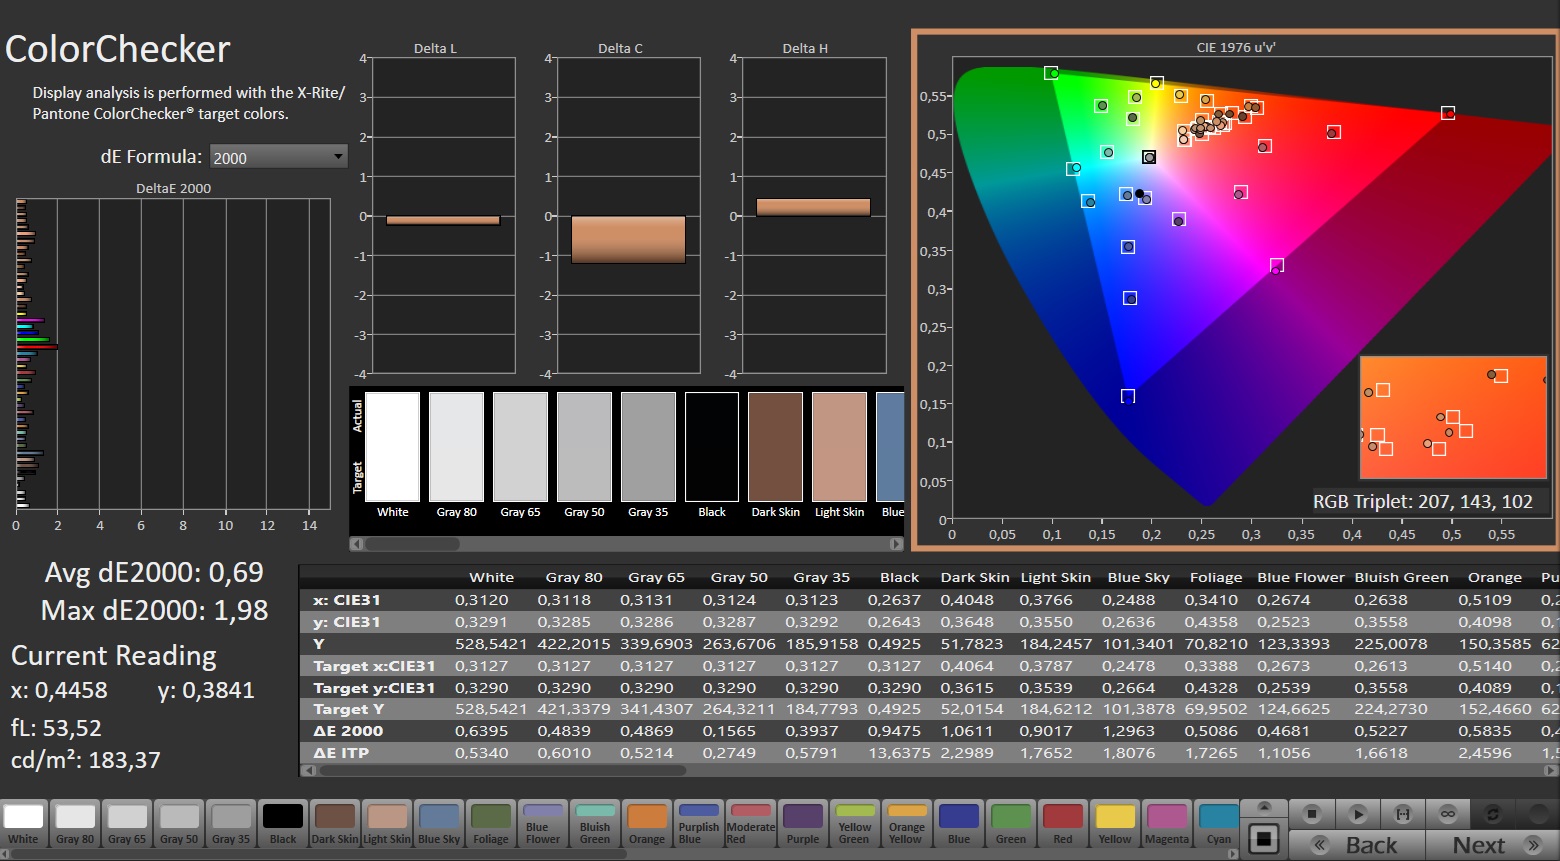
看来,适合工作的 16:10 长宽比已经确立了自己的地位,因为在对比领域,大多数笔记本电脑的屏幕都采用了这种长宽比--包括 Titan。努比亚为其笔记本电脑配备了一块对角线为 16 英寸的哑光、视角稳定的 IPS 显示屏(2560 x 1600 像素)。面板亮度极高,对比度也达到了目标值。在户外完全可以阅读屏幕内容。一个积极的方面是,240 赫兹的面板没有 PWM 闪烁的迹象,并且支持 G-Sync。没有替代显示器。

| |||||||||||||||||||||||||
Brightness Distribution: 86 %
Center on Battery: 543 cd/m²
Contrast: 1065:1 (Black: 0.51 cd/m²)
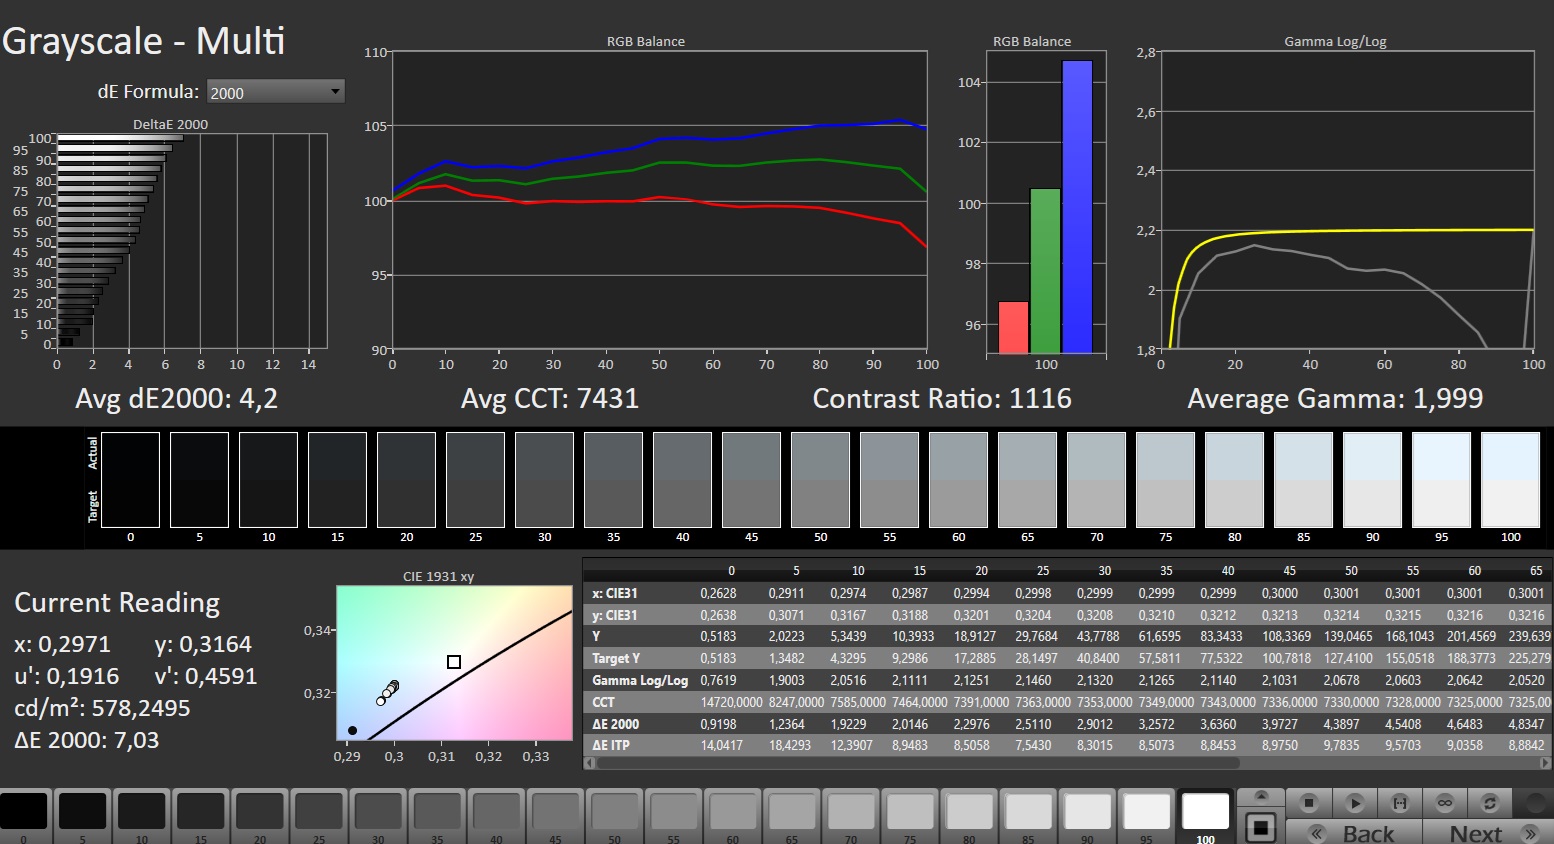
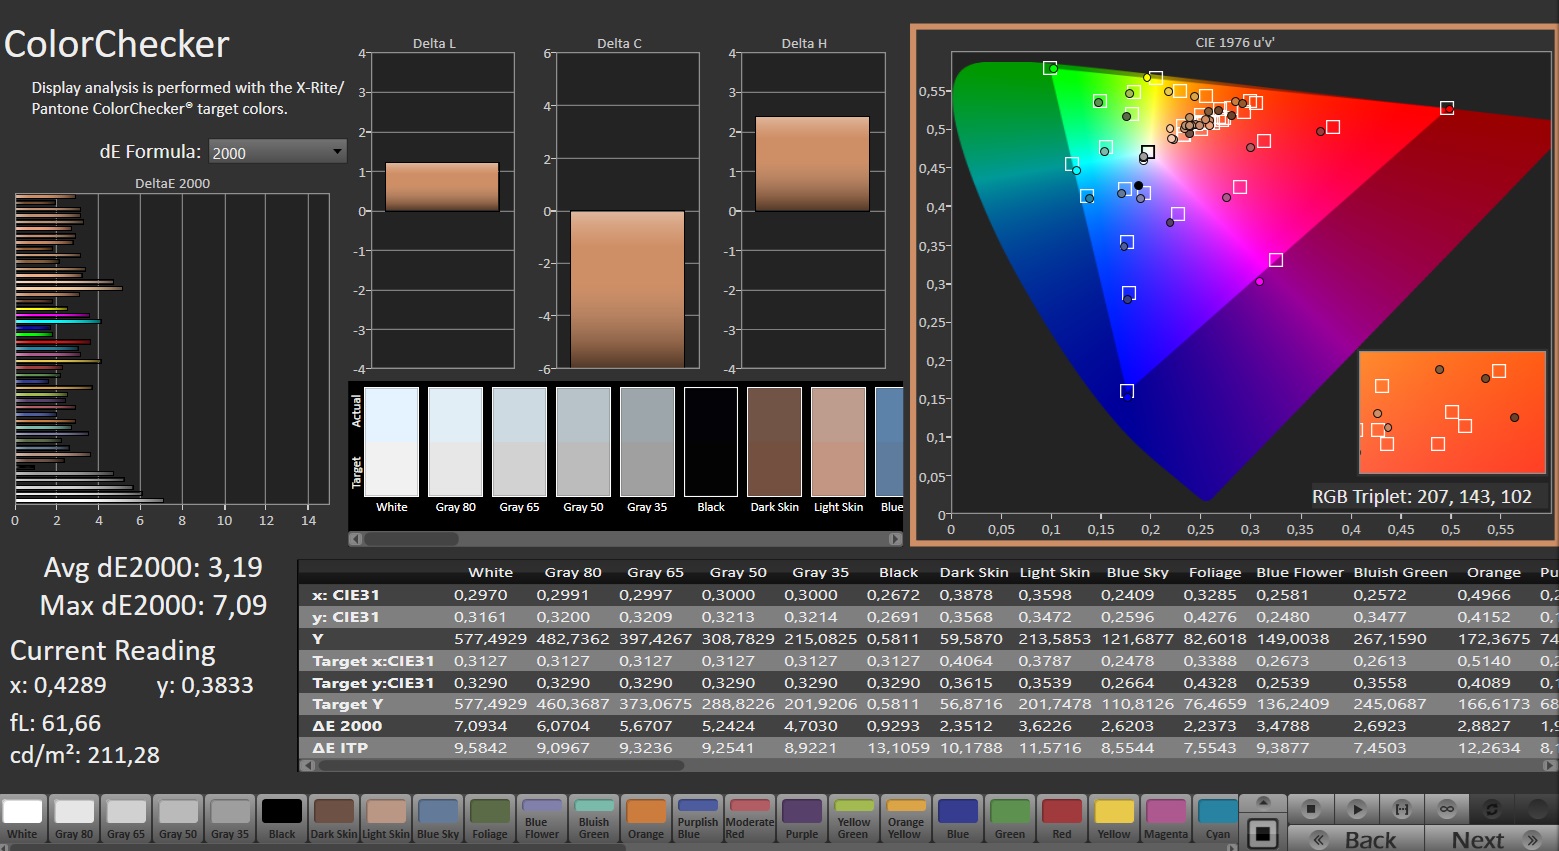
ΔE Color 3.19 | 0.5-29.43 Ø4.87, calibrated: 0.69
ΔE Greyscale 4.2 | 0.5-98 Ø5.1
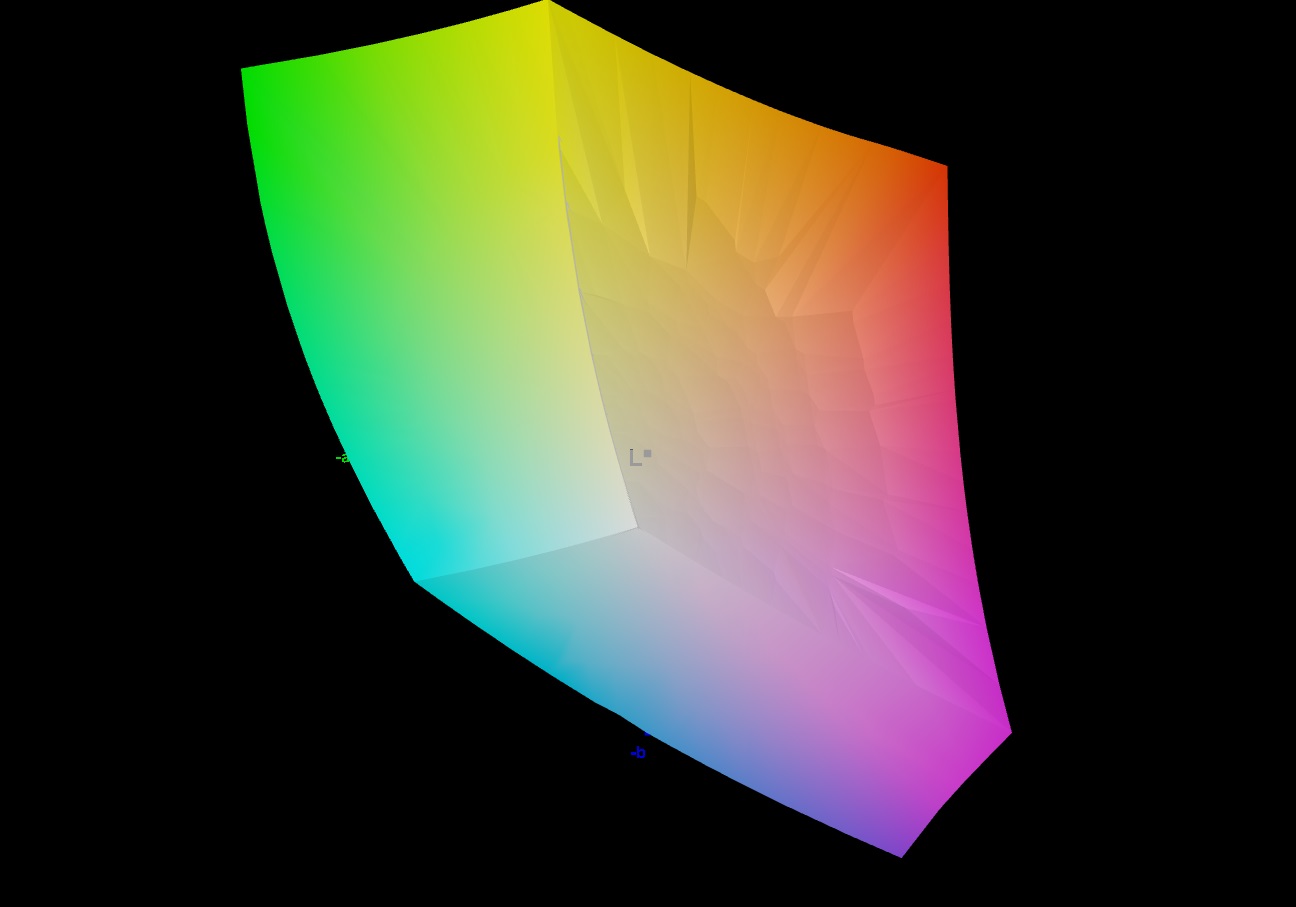
84.1% AdobeRGB 1998 (Argyll 2.2.0 3D)
100% sRGB (Argyll 2.2.0 3D)
96.3% Display P3 (Argyll 2.2.0 3D)
Gamma: 1.999
| Nubia RedMagic Titan 16 Pro BOE CQ NE160QDM-NZ2, IPS, 2560x1600, 16", 240 Hz | Lenovo Legion Pro 5 16IRX9 G9 BOE NE160QDM-NZB, IPS, 2560x1600, 16", 240 Hz | HP Victus 16 (2024) Chi Mei CMN163E, IPS, 1920x1080, 16.1", 144 Hz | Acer Predator Helios Neo 16 (2024) Chi Mei N160GME-GTB, LED, 2560x1600, 16", 240 Hz | SCHENKER XMG Pro 16 Studio (Mid 24) BOE CQ NE160QDM-NZ1, IPS, 2560x1600, 16", 240 Hz | Gigabyte G6X 9KG (2024) BOE NE160WUM-NX6, IPS, 1920x1200, 16", 165 Hz | |
|---|---|---|---|---|---|---|
| Display | 2% | -48% | 1% | -15% | -48% | |
| Display P3 Coverage | 96.3 | 99.22 3% | 41.3 -57% | 95.9 0% | 68.8 -29% | 41.8 -57% |
| sRGB Coverage | 100 | 99.93 0% | 61.7 -38% | 99.8 0% | 99.5 0% | 62.4 -38% |
| AdobeRGB 1998 Coverage | 84.1 | 87.81 4% | 42.7 -49% | 86.4 3% | 70.8 -16% | 43.3 -49% |
| Response Times | -54% | -454% | -52% | -126% | -635% | |
| Response Time Grey 50% / Grey 80% * | 3.9 ? | 4.8 ? -23% | 28.6 ? -633% | 5 ? -28% | 12.7 ? -226% | 40.5 ? -938% |
| Response Time Black / White * | 5 ? | 9.2 ? -84% | 18.7 ? -274% | 8.8 ? -76% | 6.3 ? -26% | 21.6 ? -332% |
| PWM Frequency | ||||||
| Screen | 4% | -74% | 18% | -2% | -68% | |
| Brightness middle | 543 | 518 -5% | 287 -47% | 521 -4% | 416 -23% | 353 -35% |
| Brightness | 516 | 491 -5% | 288 -44% | 506 -2% | 392 -24% | 318 -38% |
| Brightness Distribution | 86 | 90 5% | 86 0% | 85 -1% | 86 0% | 81 -6% |
| Black Level * | 0.51 | 0.36 29% | 0.19 63% | 0.44 14% | 0.38 25% | 0.21 59% |
| Contrast | 1065 | 1439 35% | 1511 42% | 1184 11% | 1095 3% | 1681 58% |
| Colorchecker dE 2000 * | 3.19 | 4.32 -35% | 5.46 -71% | 1.74 45% | 2.33 27% | 5.21 -63% |
| Colorchecker dE 2000 max. * | 7.09 | 6.37 10% | 20.36 -187% | 3.88 45% | 6.07 14% | 19.95 -181% |
| Colorchecker dE 2000 calibrated * | 0.69 | 0.75 -9% | 3.52 -410% | 0.52 25% | 1.02 -48% | 3.61 -423% |
| Greyscale dE 2000 * | 4.2 | 3.66 13% | 4.8 -14% | 3 29% | 3.7 12% | 3.6 14% |
| Gamma | 1.999 110% | 2.19 100% | 2.108 104% | 2.164 102% | 2.161 102% | 2.367 93% |
| CCT | 7431 87% | 6841 95% | 6442 101% | 6816 95% | 7102 92% | 7138 91% |
| Total Average (Program / Settings) | -16% /
-4% | -192% /
-123% | -11% /
4% | -48% /
-22% | -250% /
-145% |
* ... smaller is better
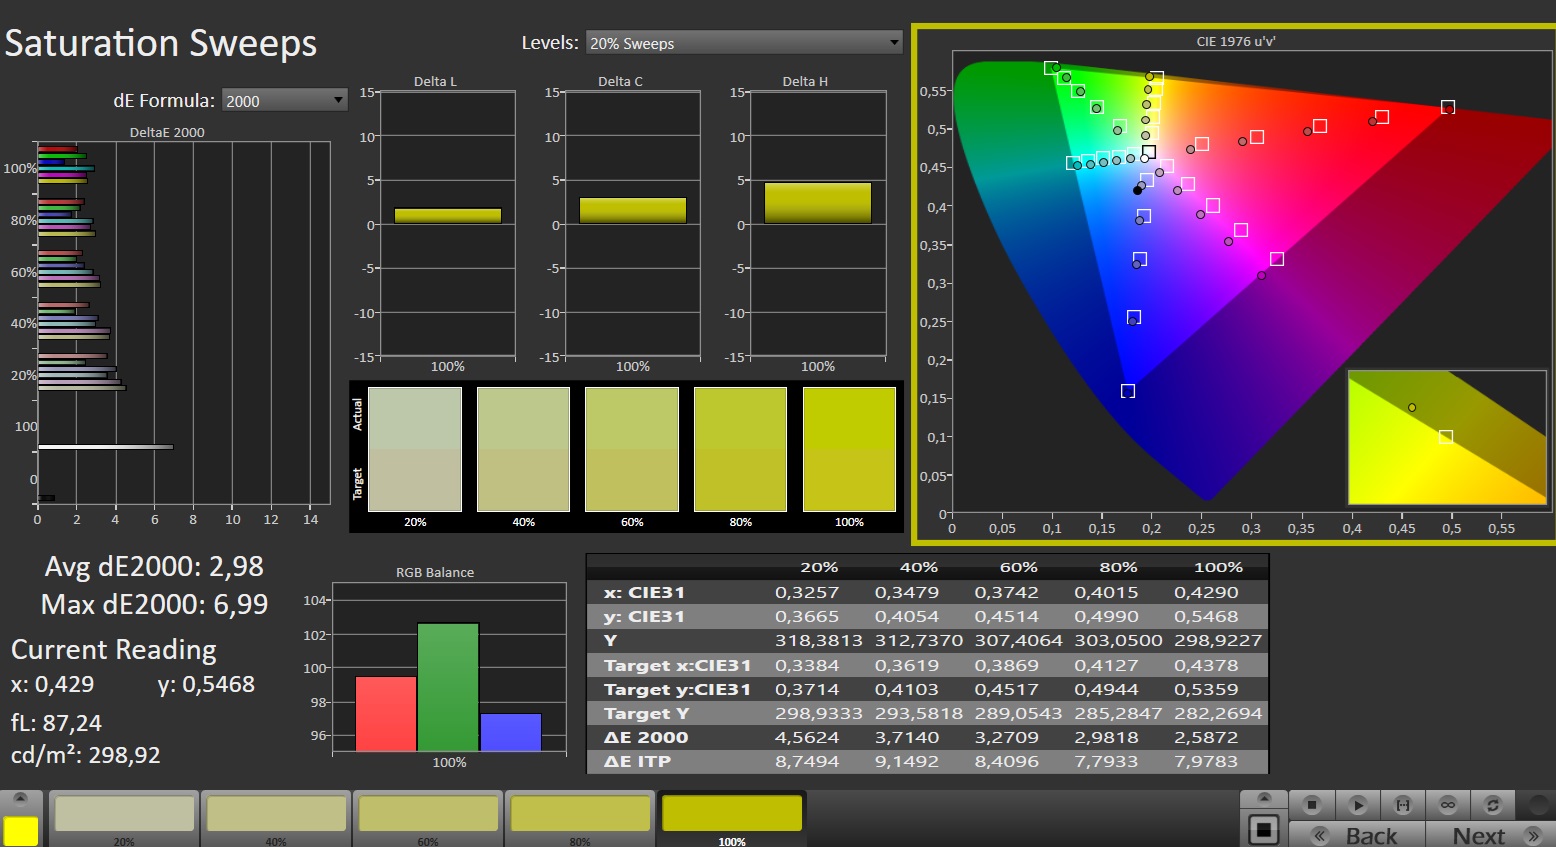
该面板完全或几乎完全覆盖了 sRGB 和 DCI-P3 色彩空间,但没有覆盖 AdobeRGB 空间--这与大多数竞争对手的屏幕类似。通过校准,它的色彩还原能力可以直接达到很好的水平:这样,它的色彩偏差就会从 3.19 降至 0.69(目标:DeltaE < 3)。同时,其灰度描绘看起来也更加平衡。
我们的色彩配置文件可以免费下载和使用。可在显示屏的信息框中找到链接。

Display Response Times
| ↔ Response Time Black to White | ||
|---|---|---|
| 5 ms ... rise ↗ and fall ↘ combined | ↗ 1.2 ms rise | 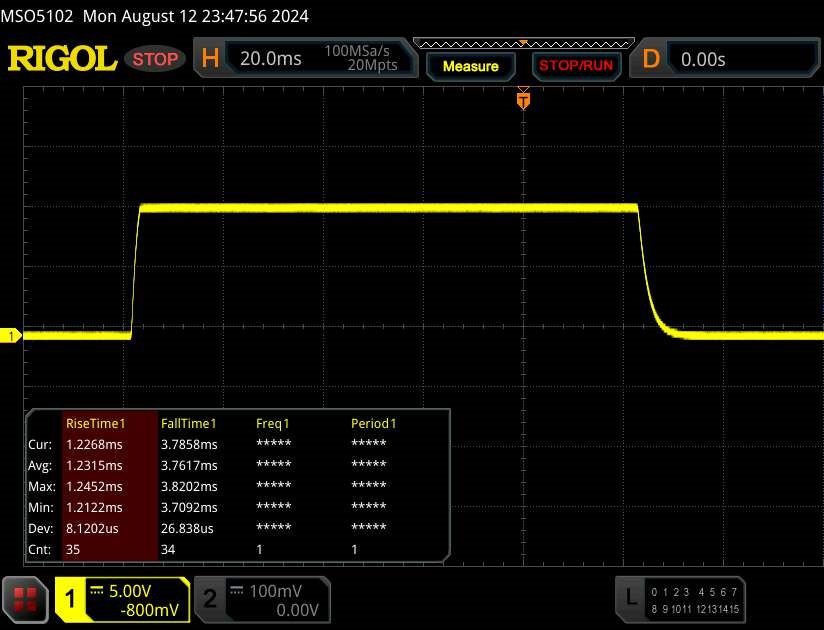 |
| ↘ 3.8 ms fall | ||
| The screen shows very fast response rates in our tests and should be very well suited for fast-paced gaming. In comparison, all tested devices range from 0.1 (minimum) to 240 (maximum) ms. » 15 % of all devices are better. This means that the measured response time is better than the average of all tested devices (20.8 ms). | ||
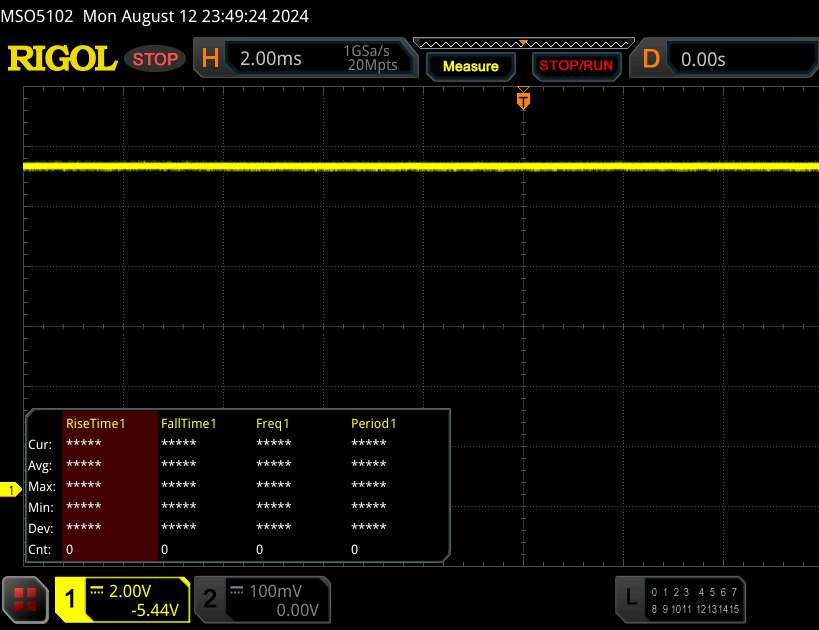
| ↔ Response Time 50% Grey to 80% Grey | ||
| 3.9 ms ... rise ↗ and fall ↘ combined | ↗ 1.7 ms rise |  |
| ↘ 2.2 ms fall | ||
| The screen shows very fast response rates in our tests and should be very well suited for fast-paced gaming. In comparison, all tested devices range from 0.165 (minimum) to 636 (maximum) ms. » 12 % of all devices are better. This means that the measured response time is better than the average of all tested devices (32.5 ms). | ||
Screen Flickering / PWM (Pulse-Width Modulation)
| Screen flickering / PWM not detected | 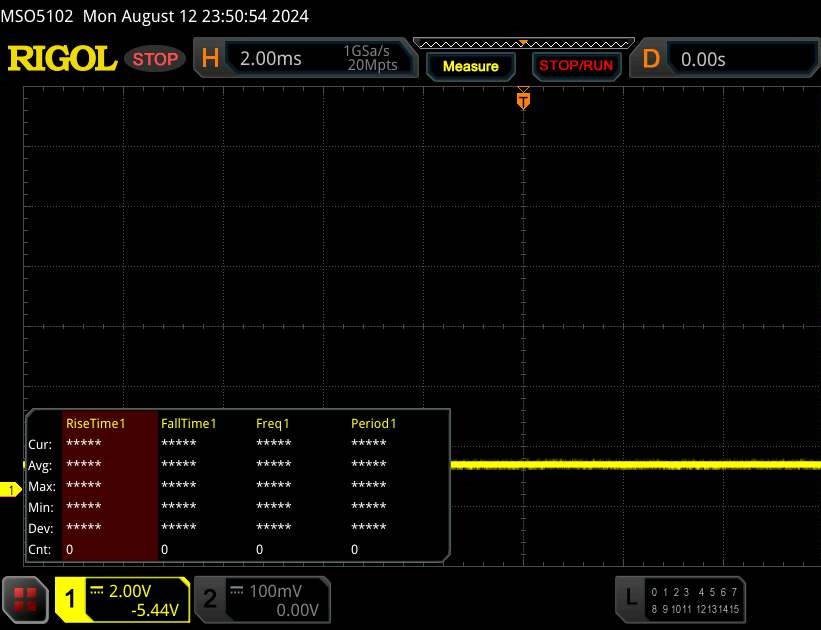 | ||
In comparison: 53 % of all tested devices do not use PWM to dim the display. If PWM was detected, an average of 8516 (minimum: 5 - maximum: 343500) Hz was measured. | |||
性能 - Raptor Lake 和 Ada Lovelace 为笔记本电脑提供动力
Titan 16 Pro 面向游戏玩家和创作者,其重点可能在于前者。A 酷睿 i9-14900HX和 GeForce RTX 4060为这款笔记本提供动力。其最高售价为 1,699 美元。努比亚还提供该设备的其他变体,但目前还无法在全球找到。
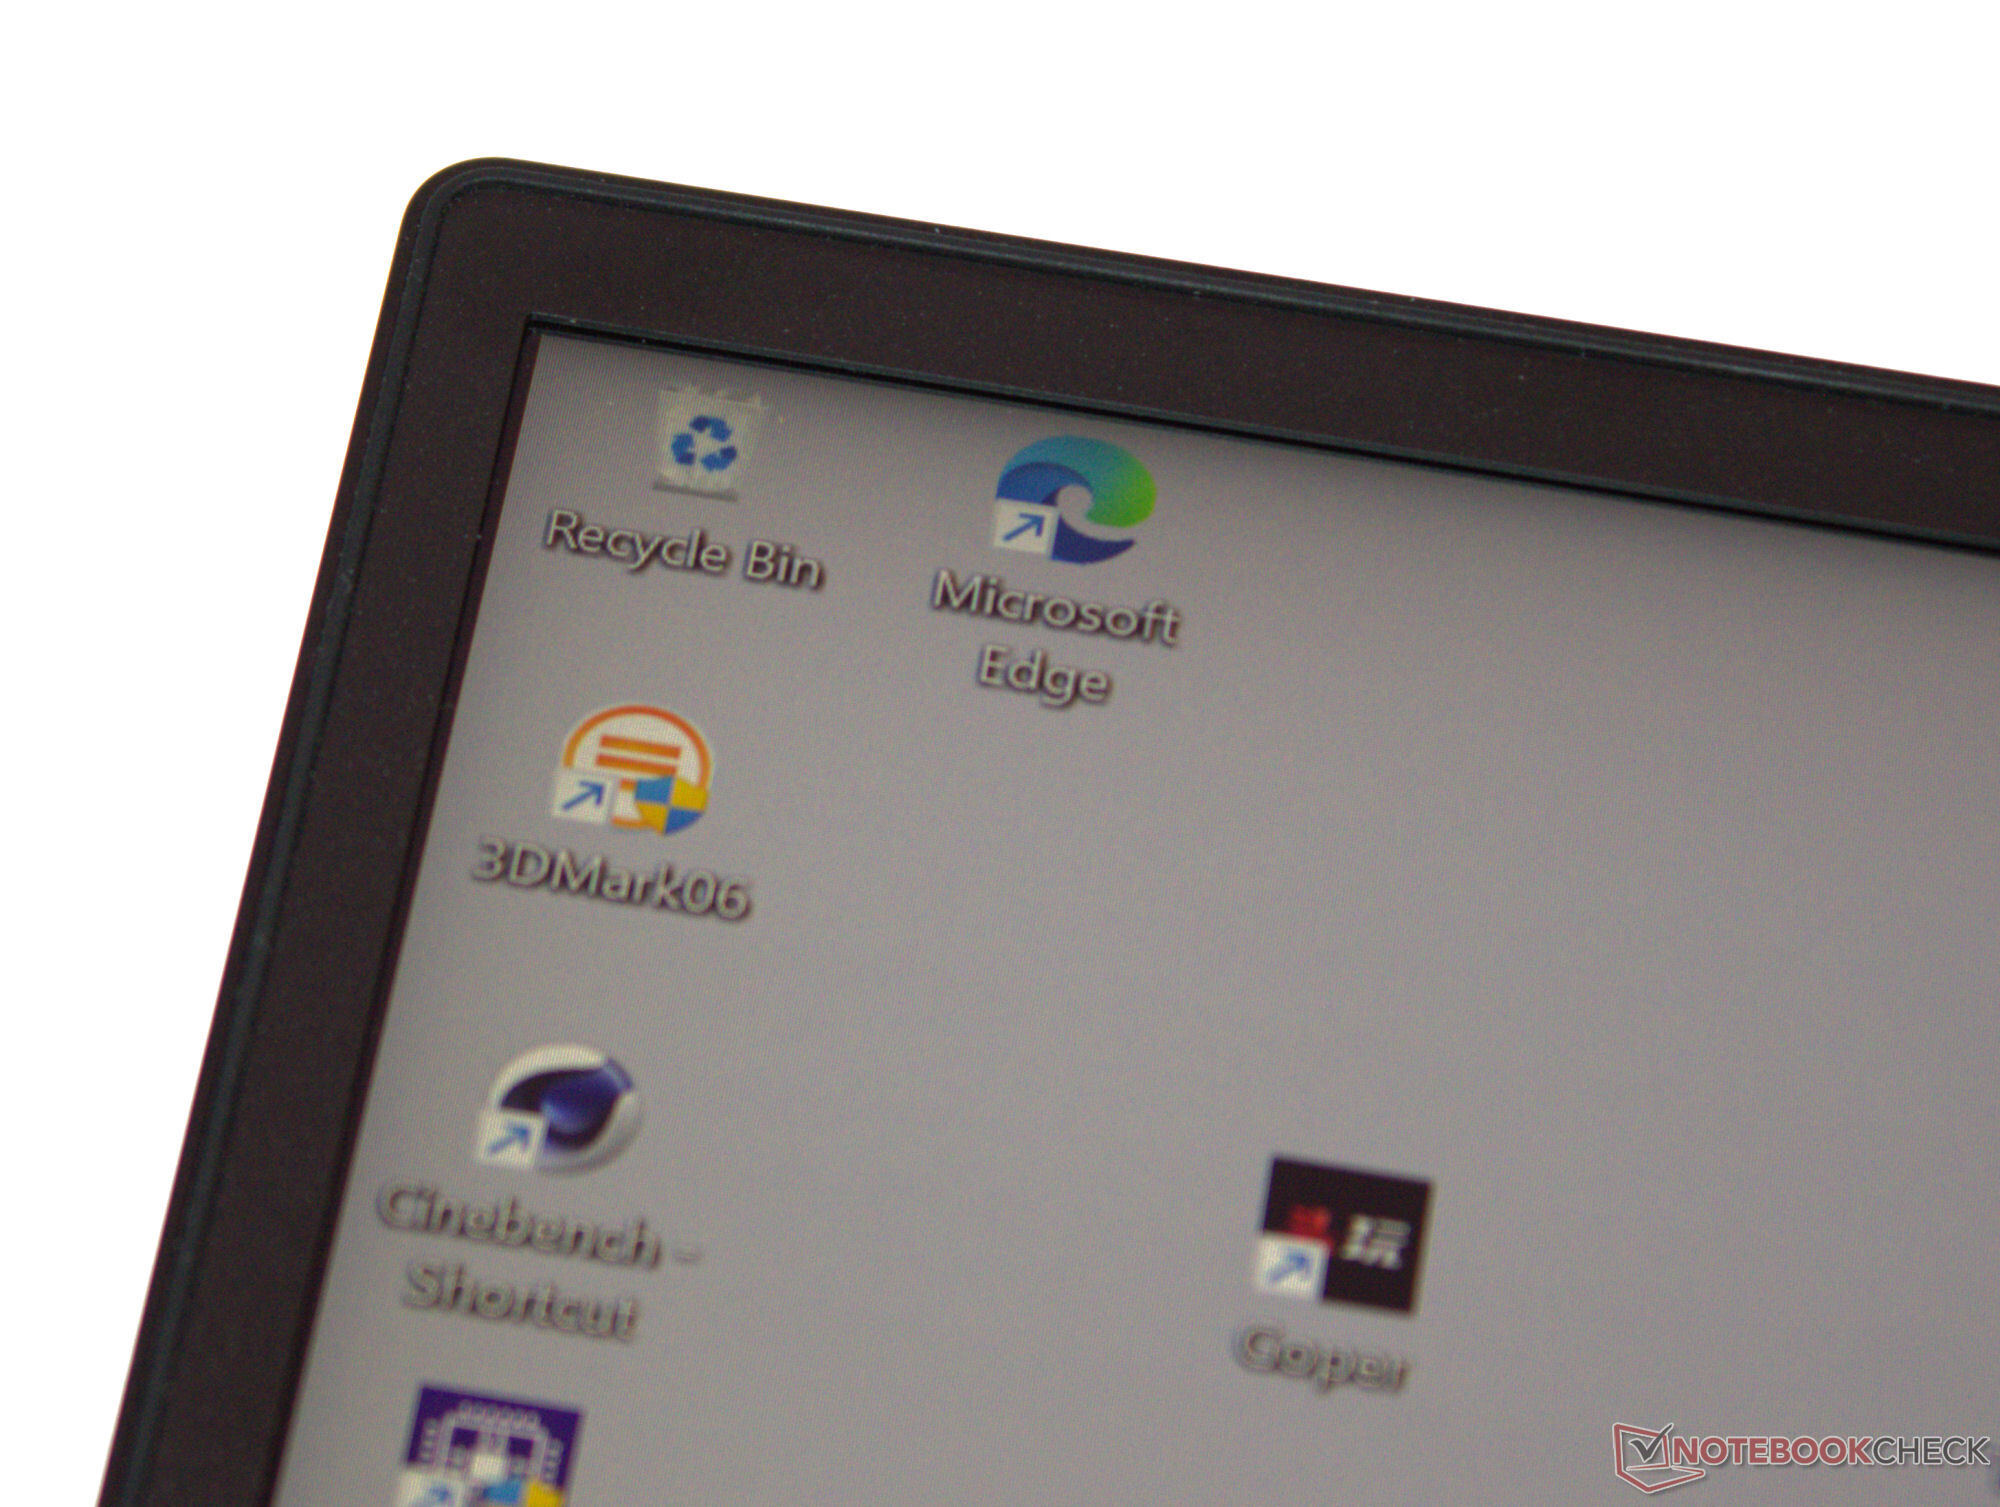
测试条件
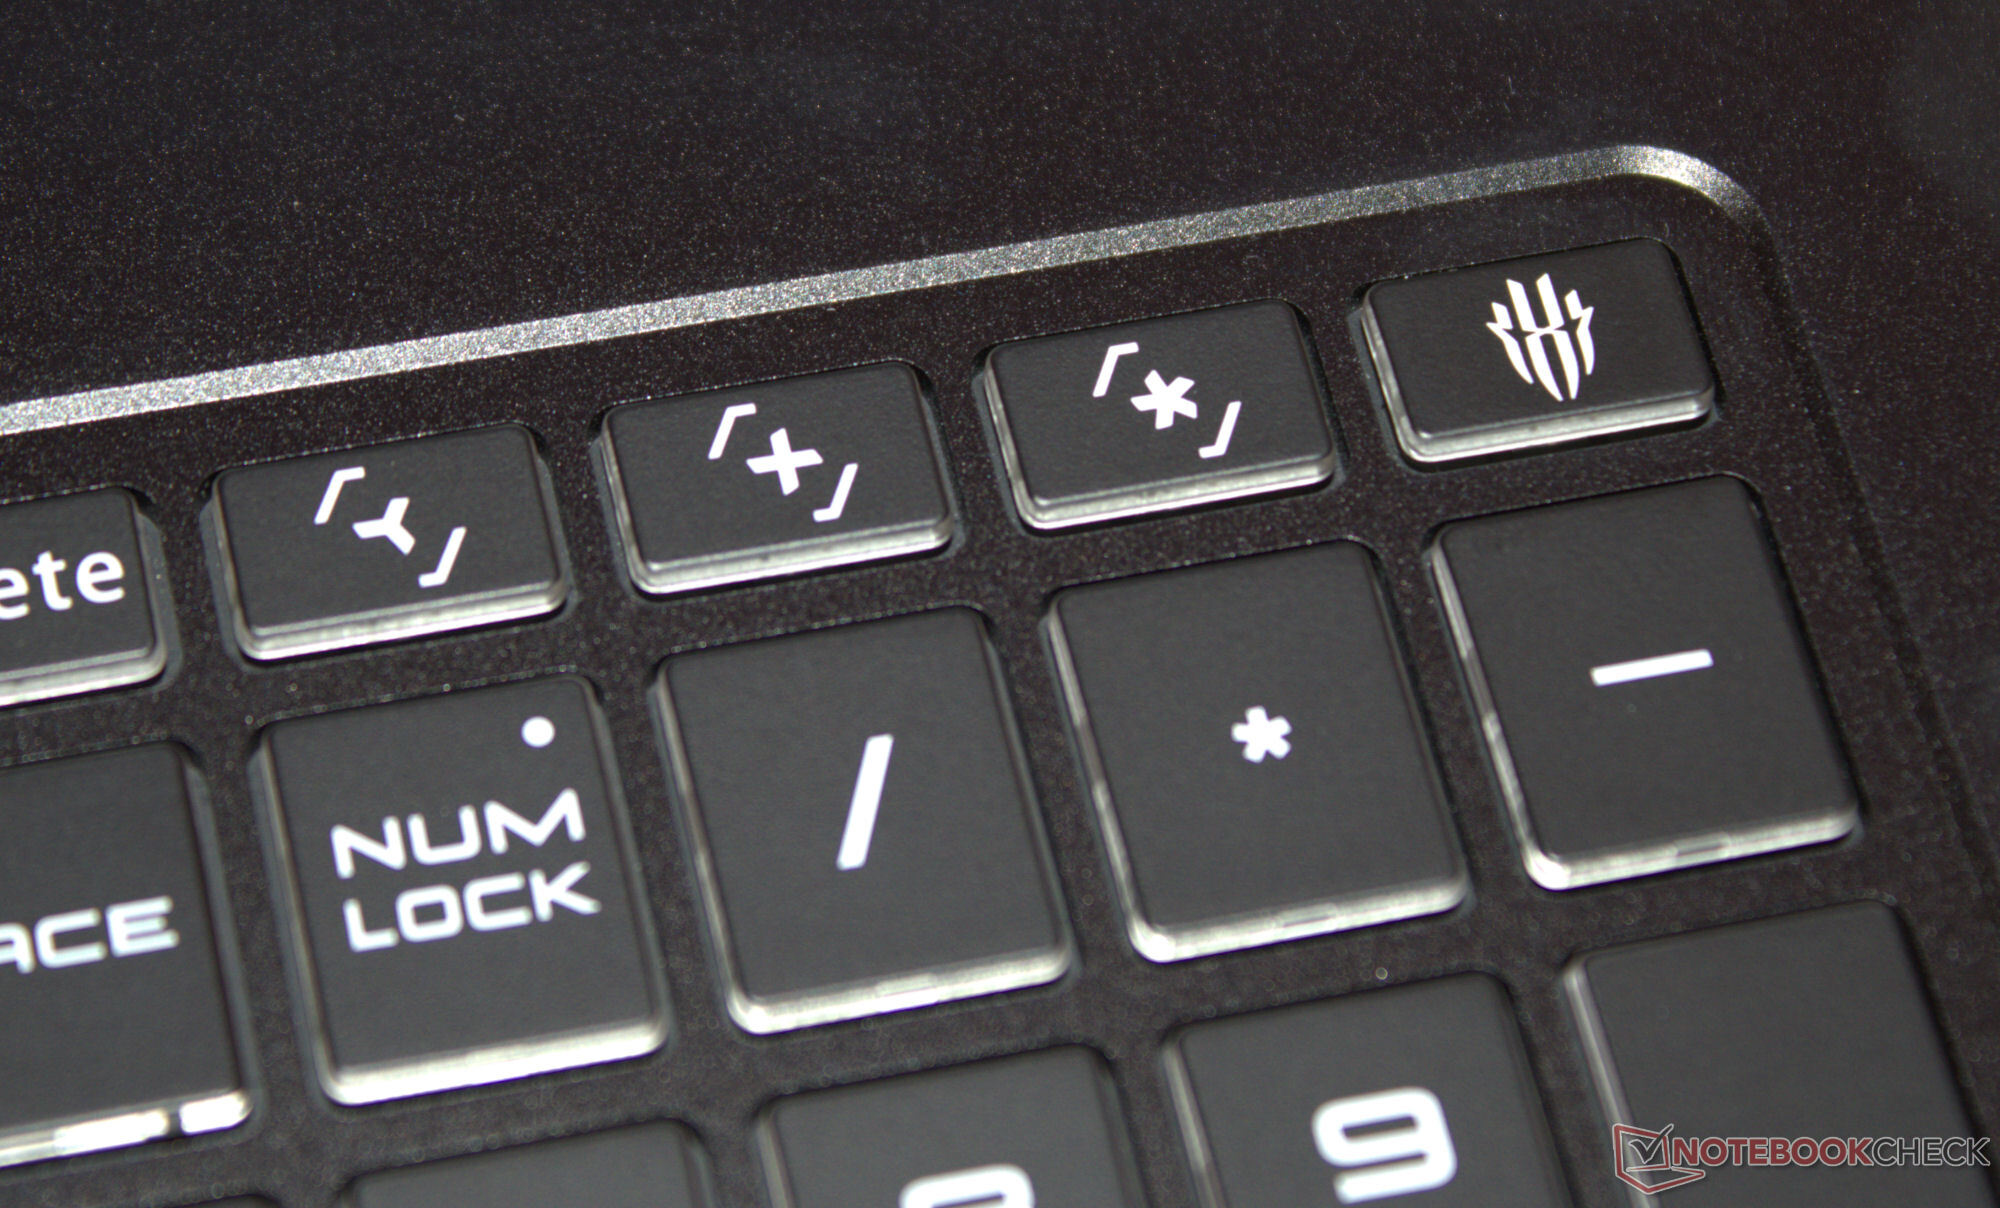
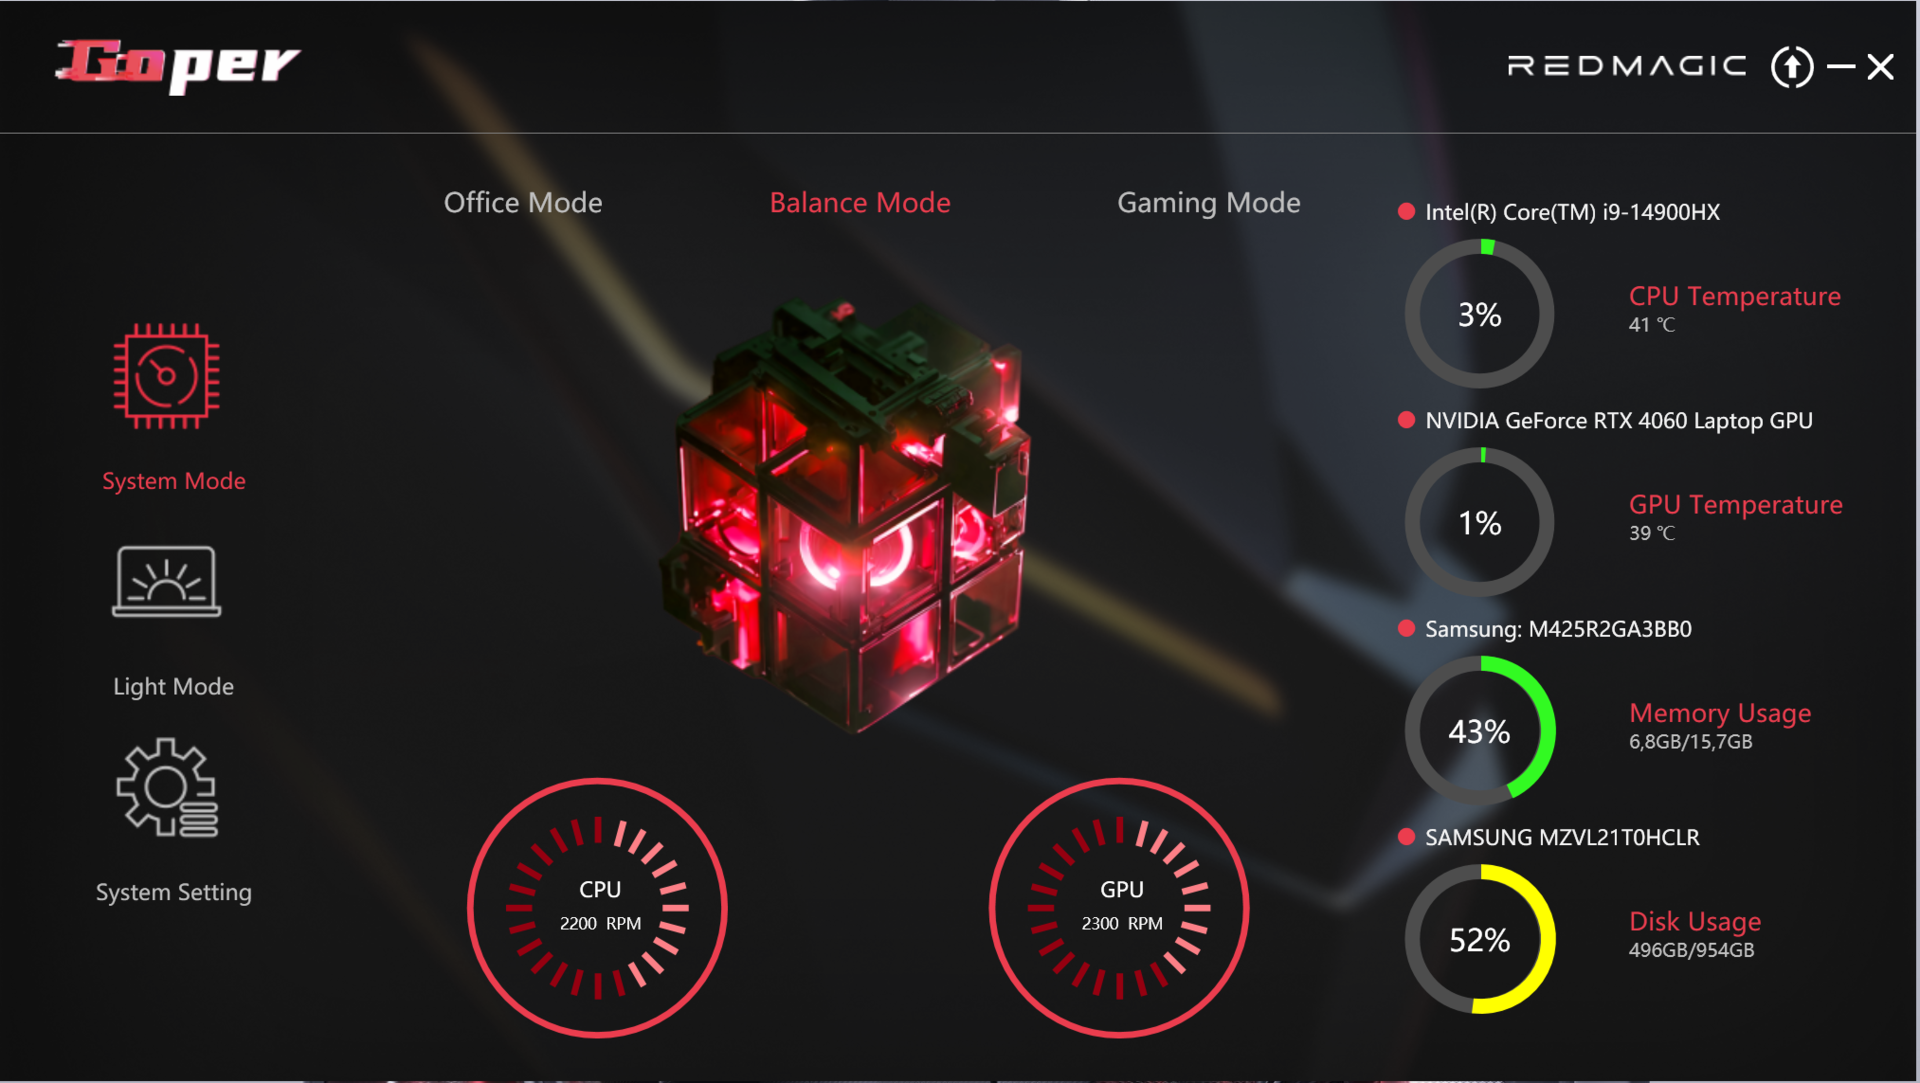
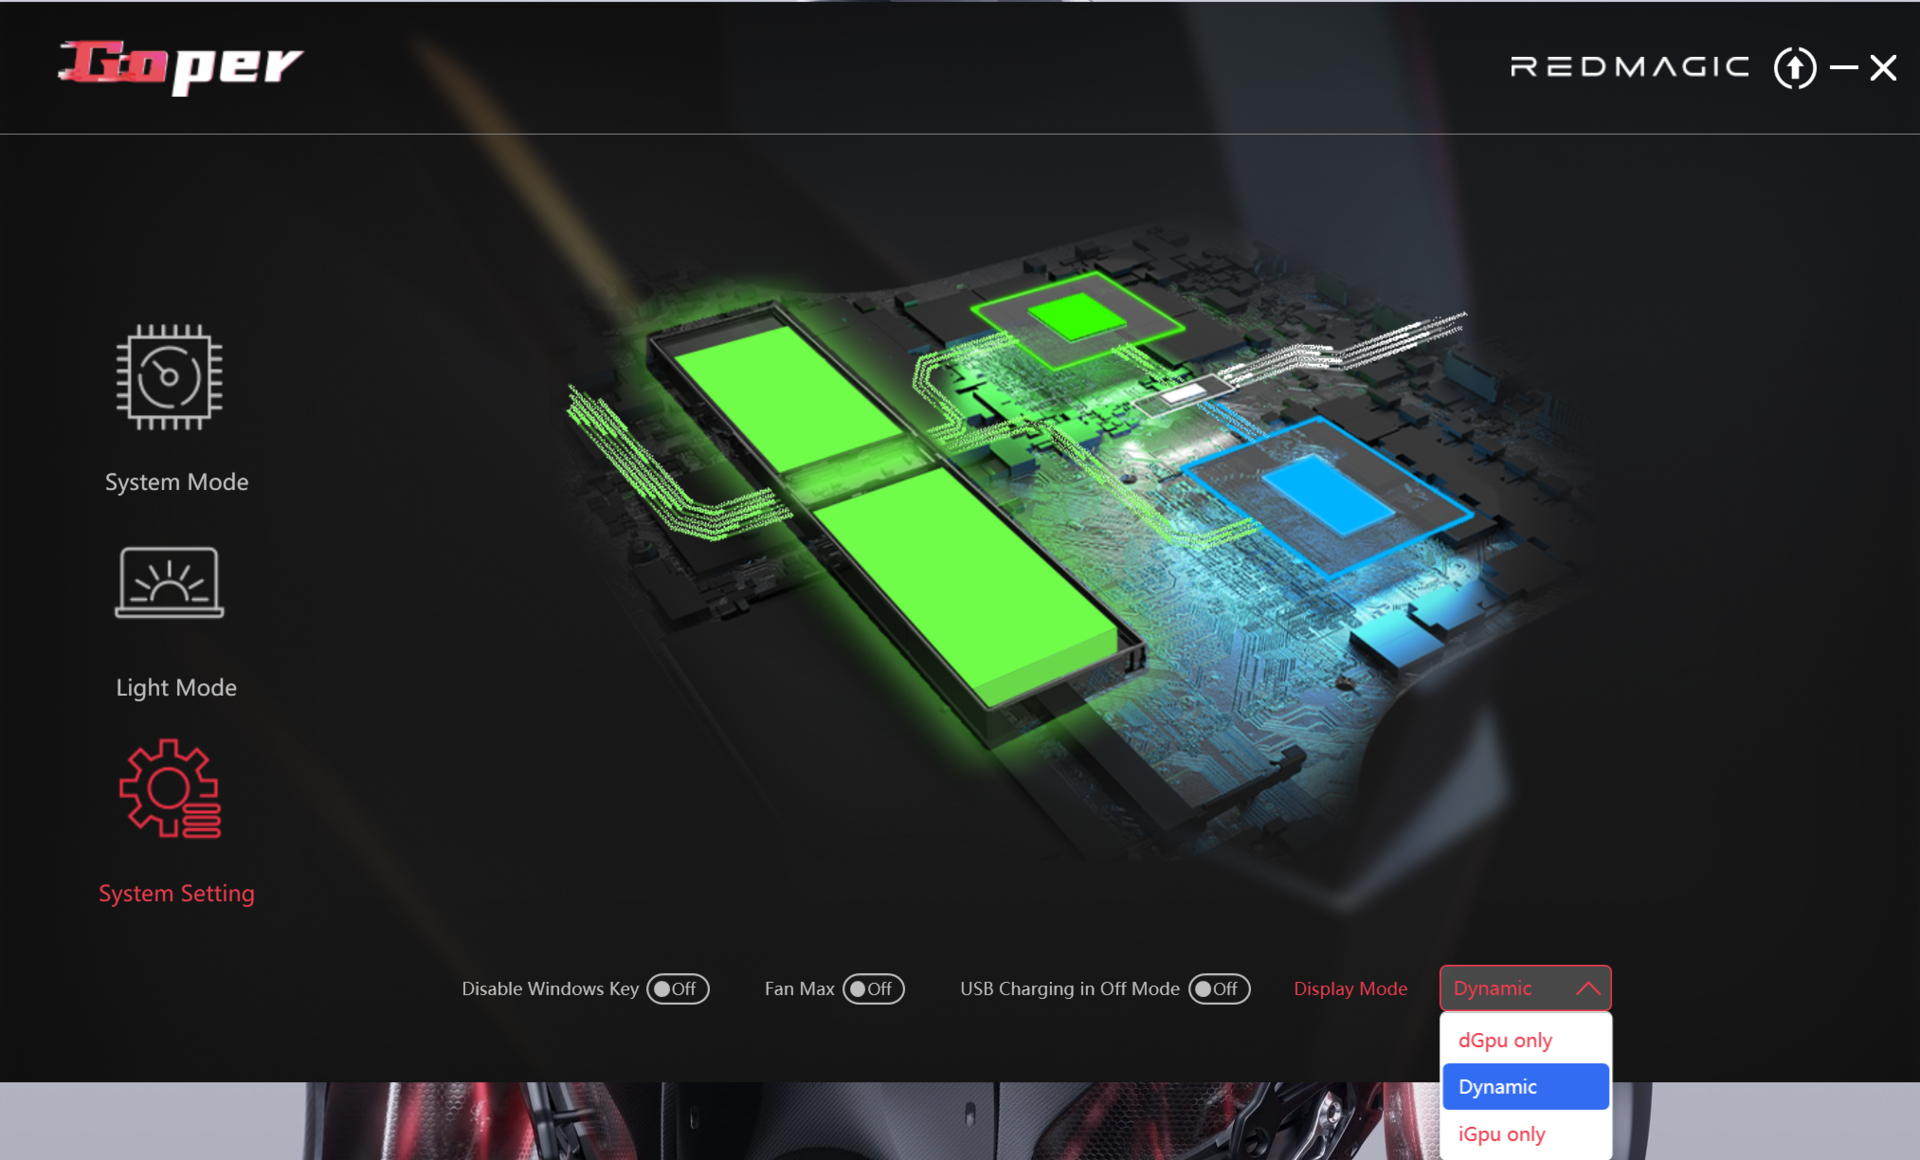
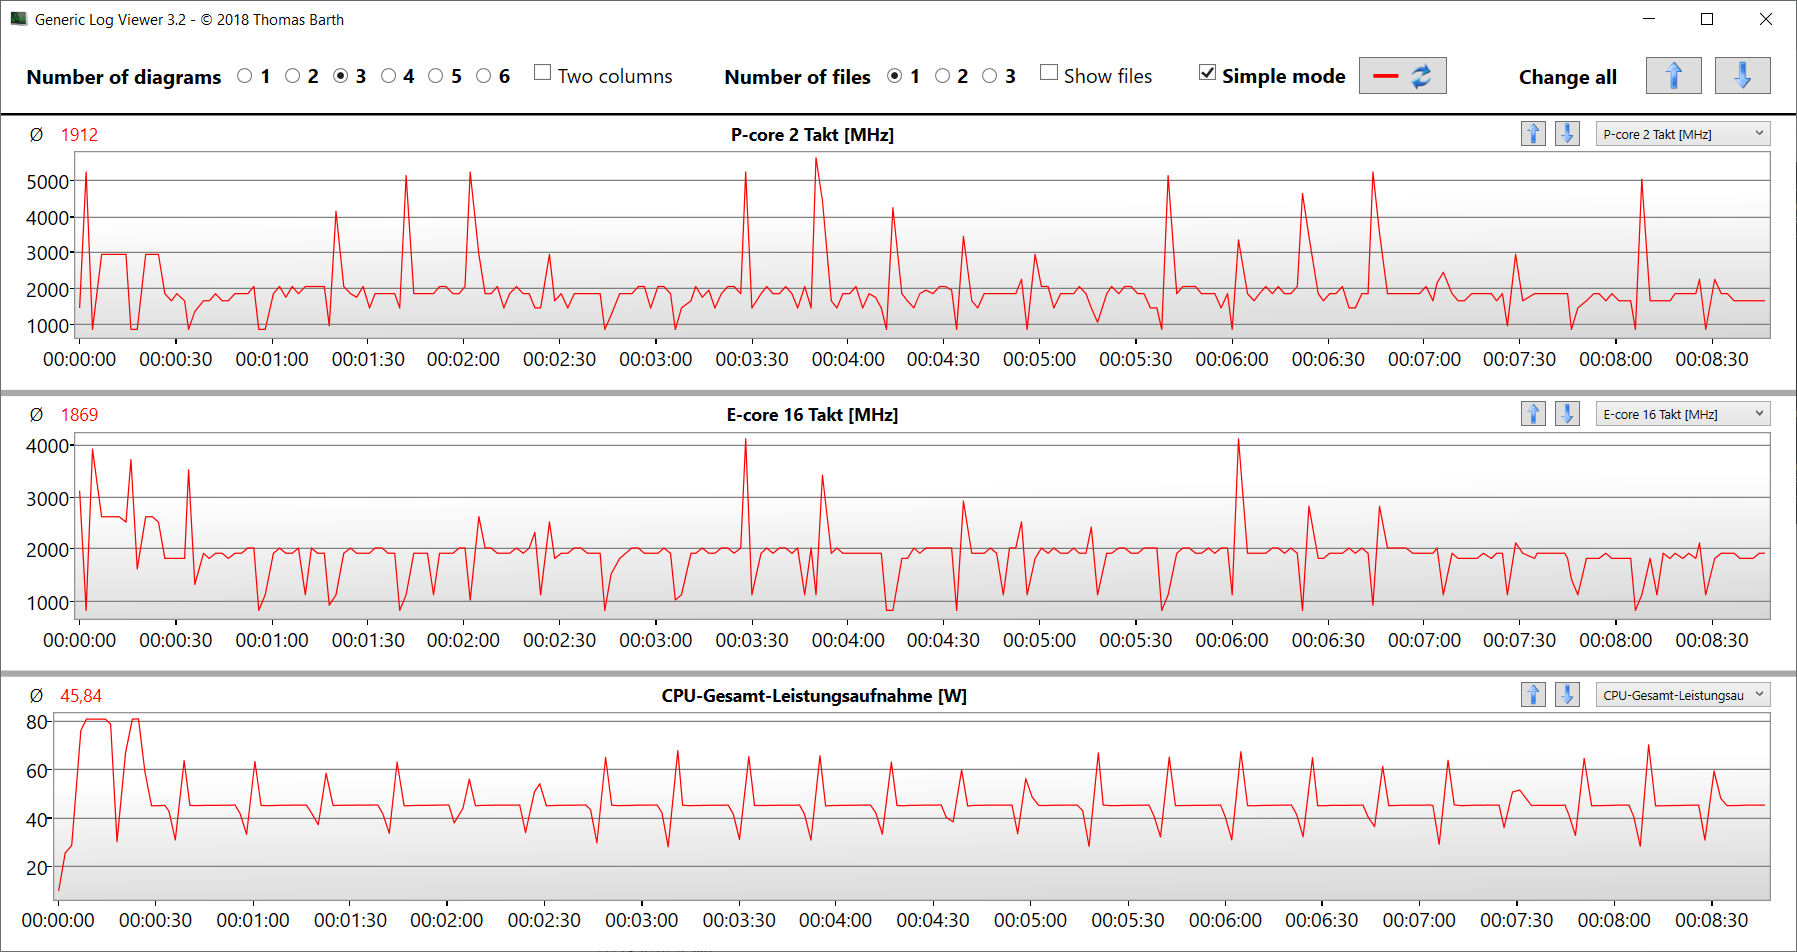
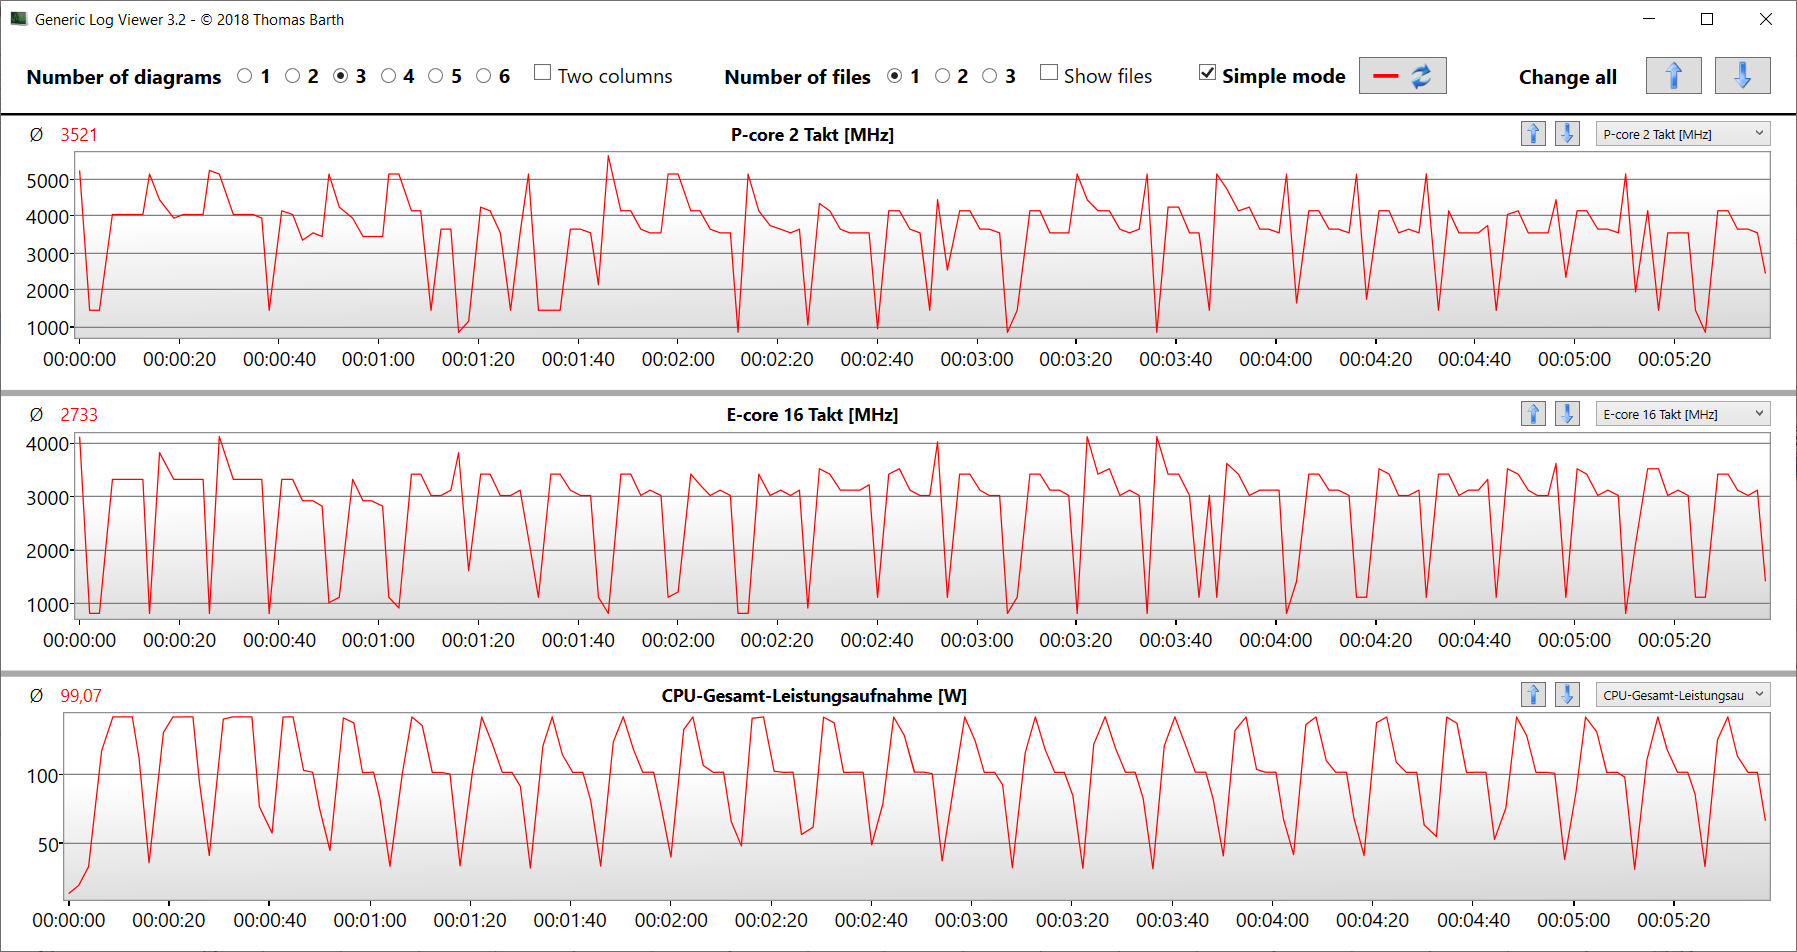
有三种制造商特定的性能配置文件(见表)可供选择。我们在测试中使用了平衡模式(基准测试)和办公模式(电池测试)。GPU 模式设置为动态(= Optimus)。每个配置文件都可以通过数字键盘顶排的单独按键直接调用。此外,还可以通过Goper应用程序(笔记本电脑的控制中心)进行更改。

| 平衡模式 | 游戏模式 | 办公模式 | |
|---|---|---|---|
| 功率限制 1 (HWInfo) | 45 瓦 | 100 瓦 | 35 瓦 |
| 功率限制 2 (HWInfo) | 140 瓦 | 140 瓦 | 140 瓦 |
| 噪音(赛博朋克 2077) | 50 dB(A) | 53 dB(A) | 47 dB(A) |
| 性能(赛博朋克 2077) | 66 fps | 66 fps | 60 fps |
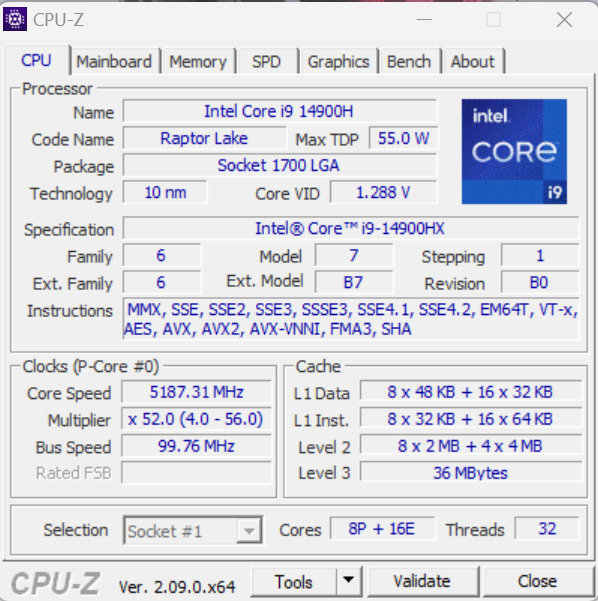
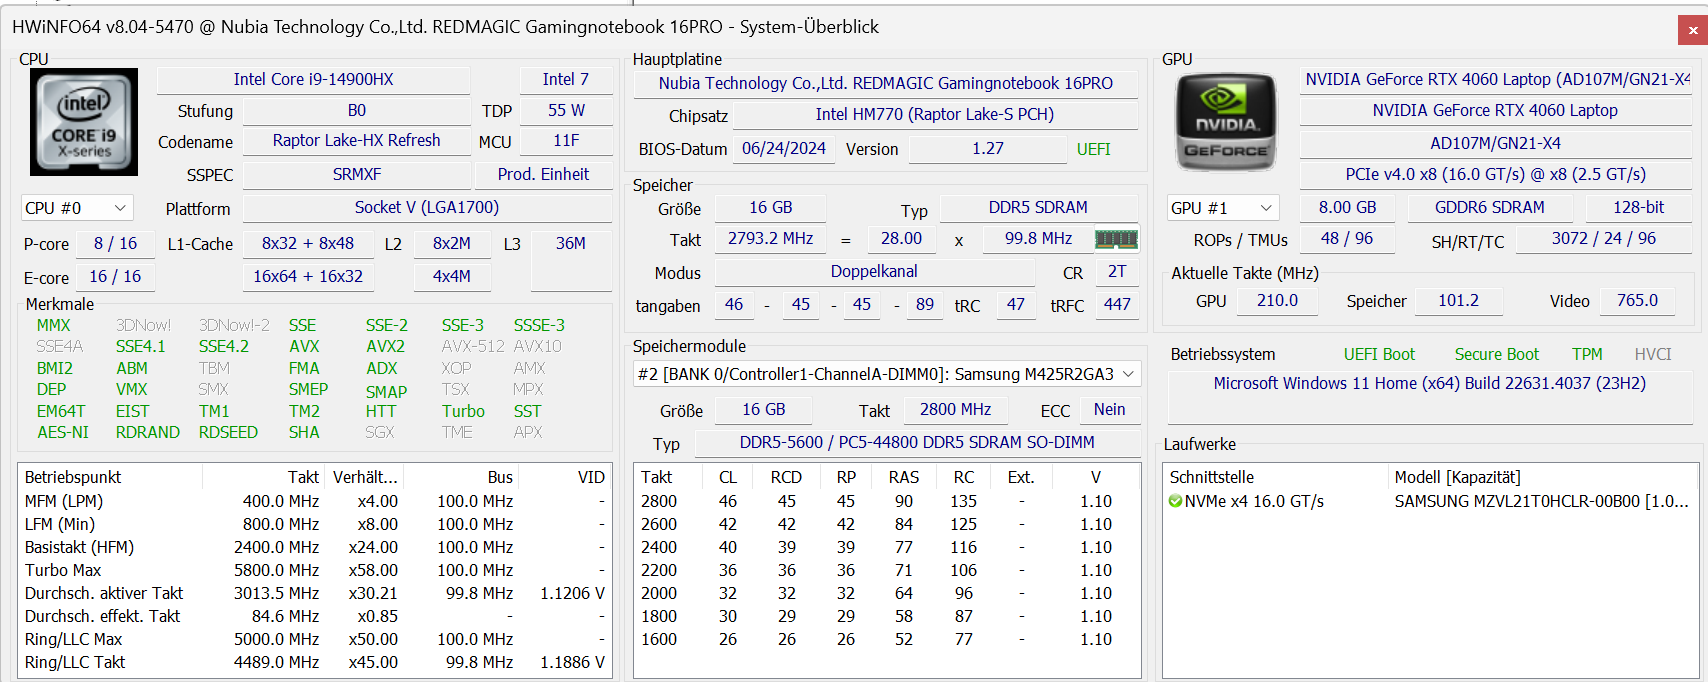
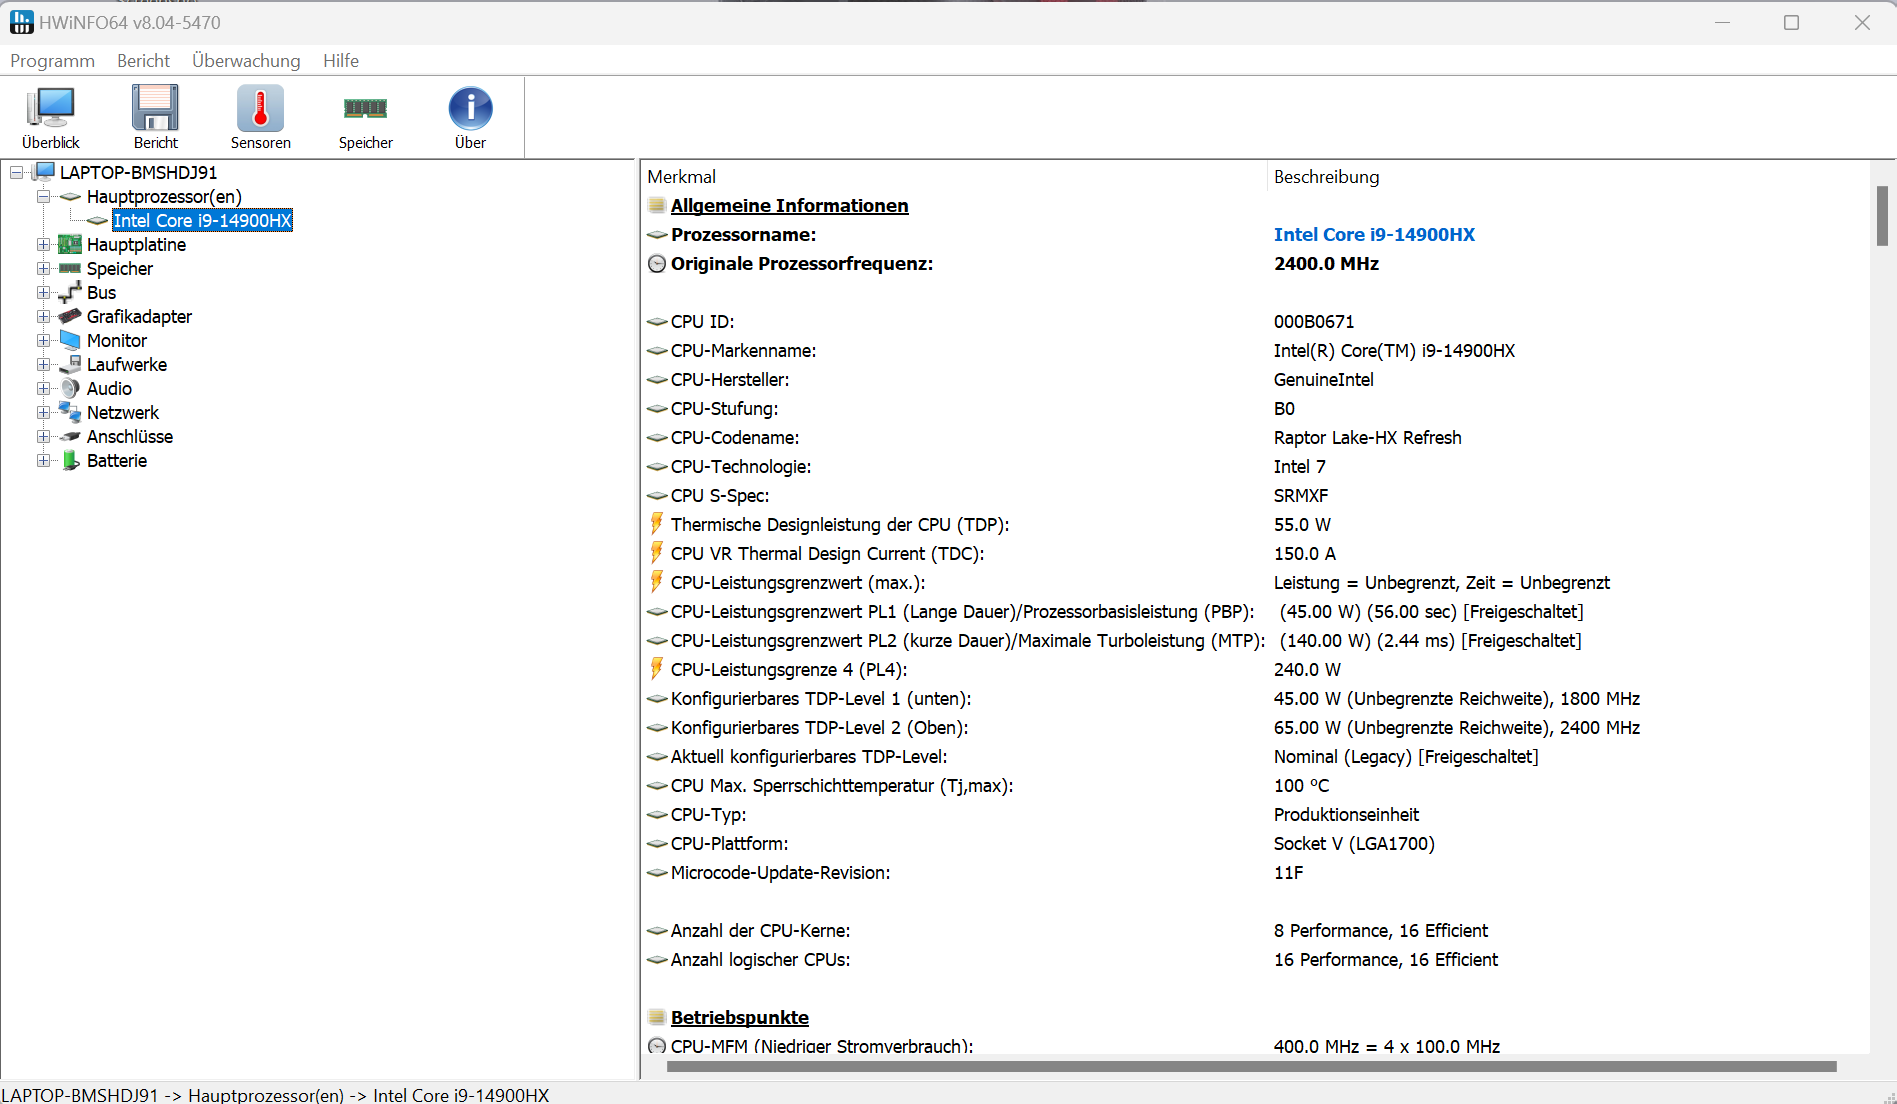
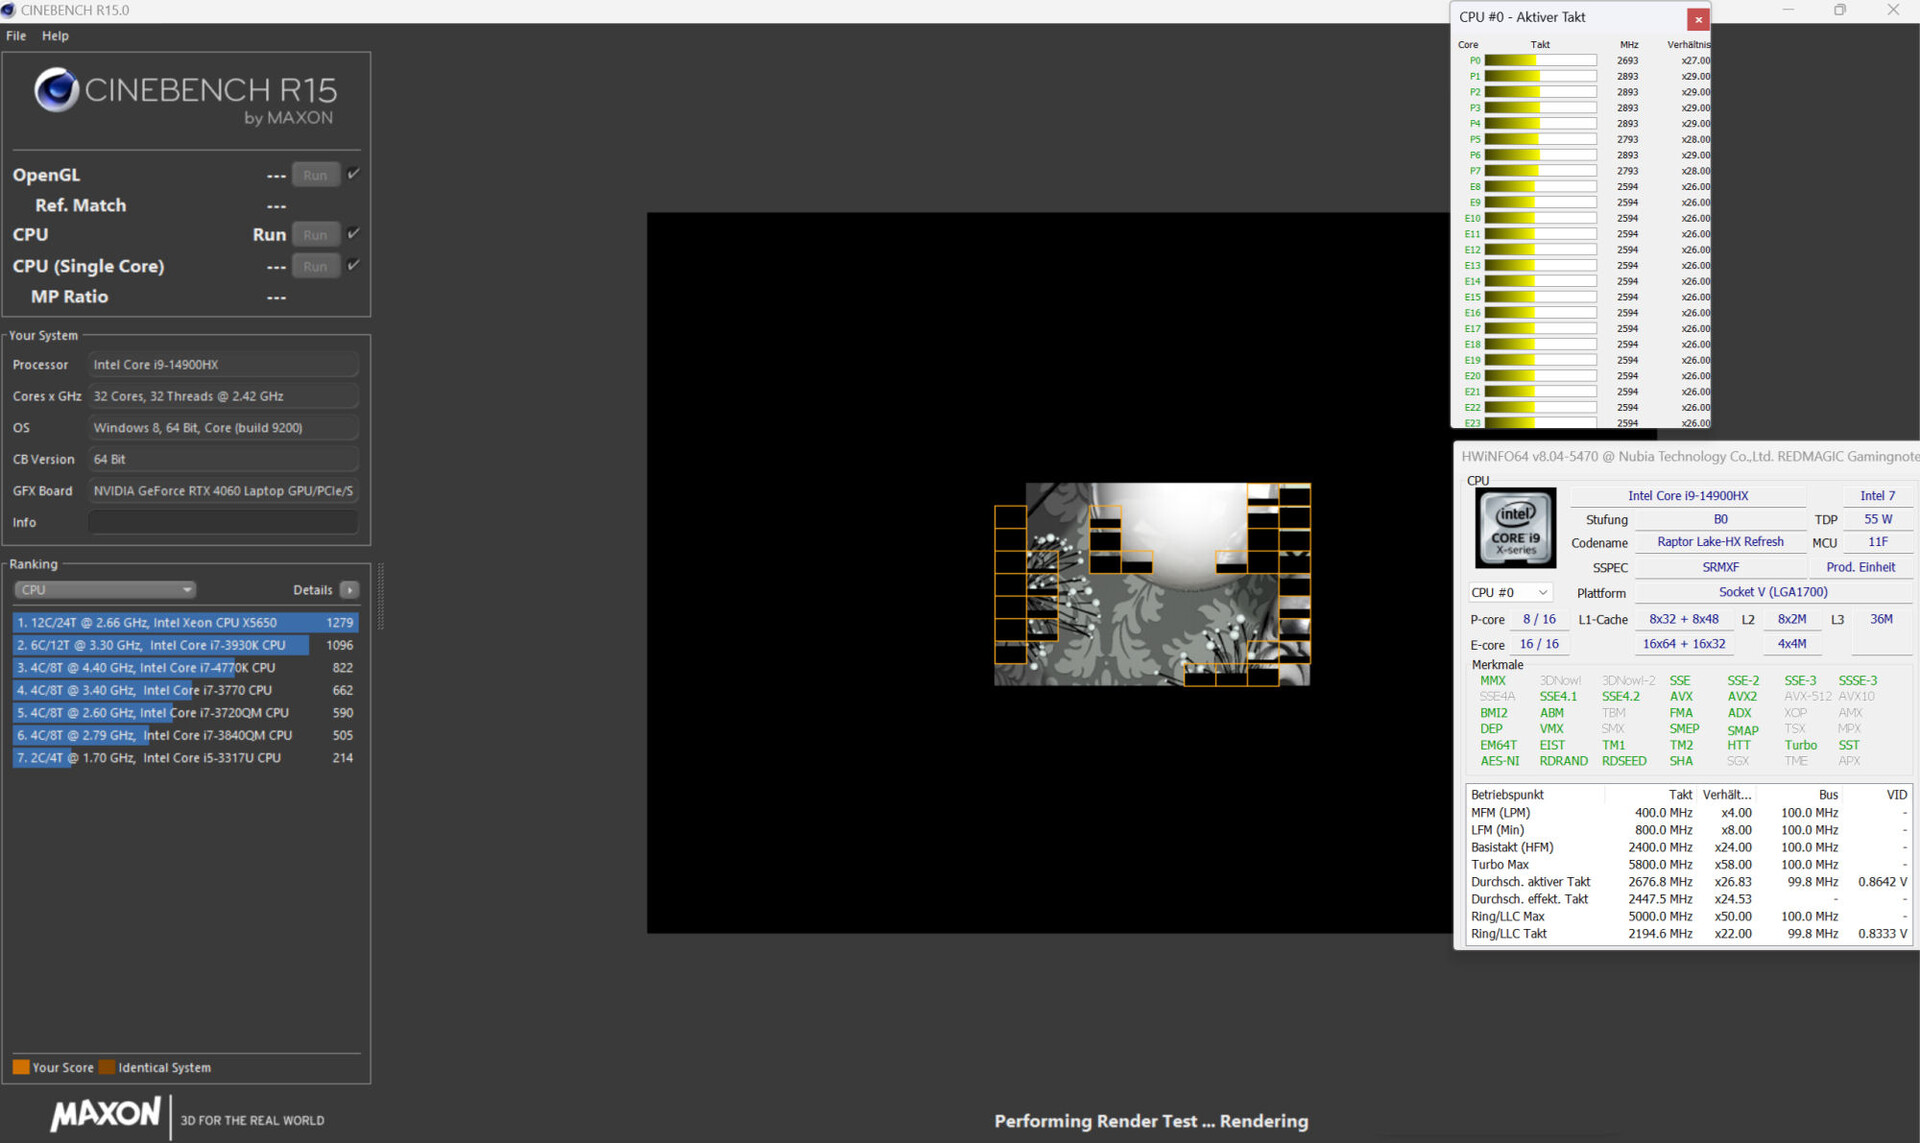
处理器
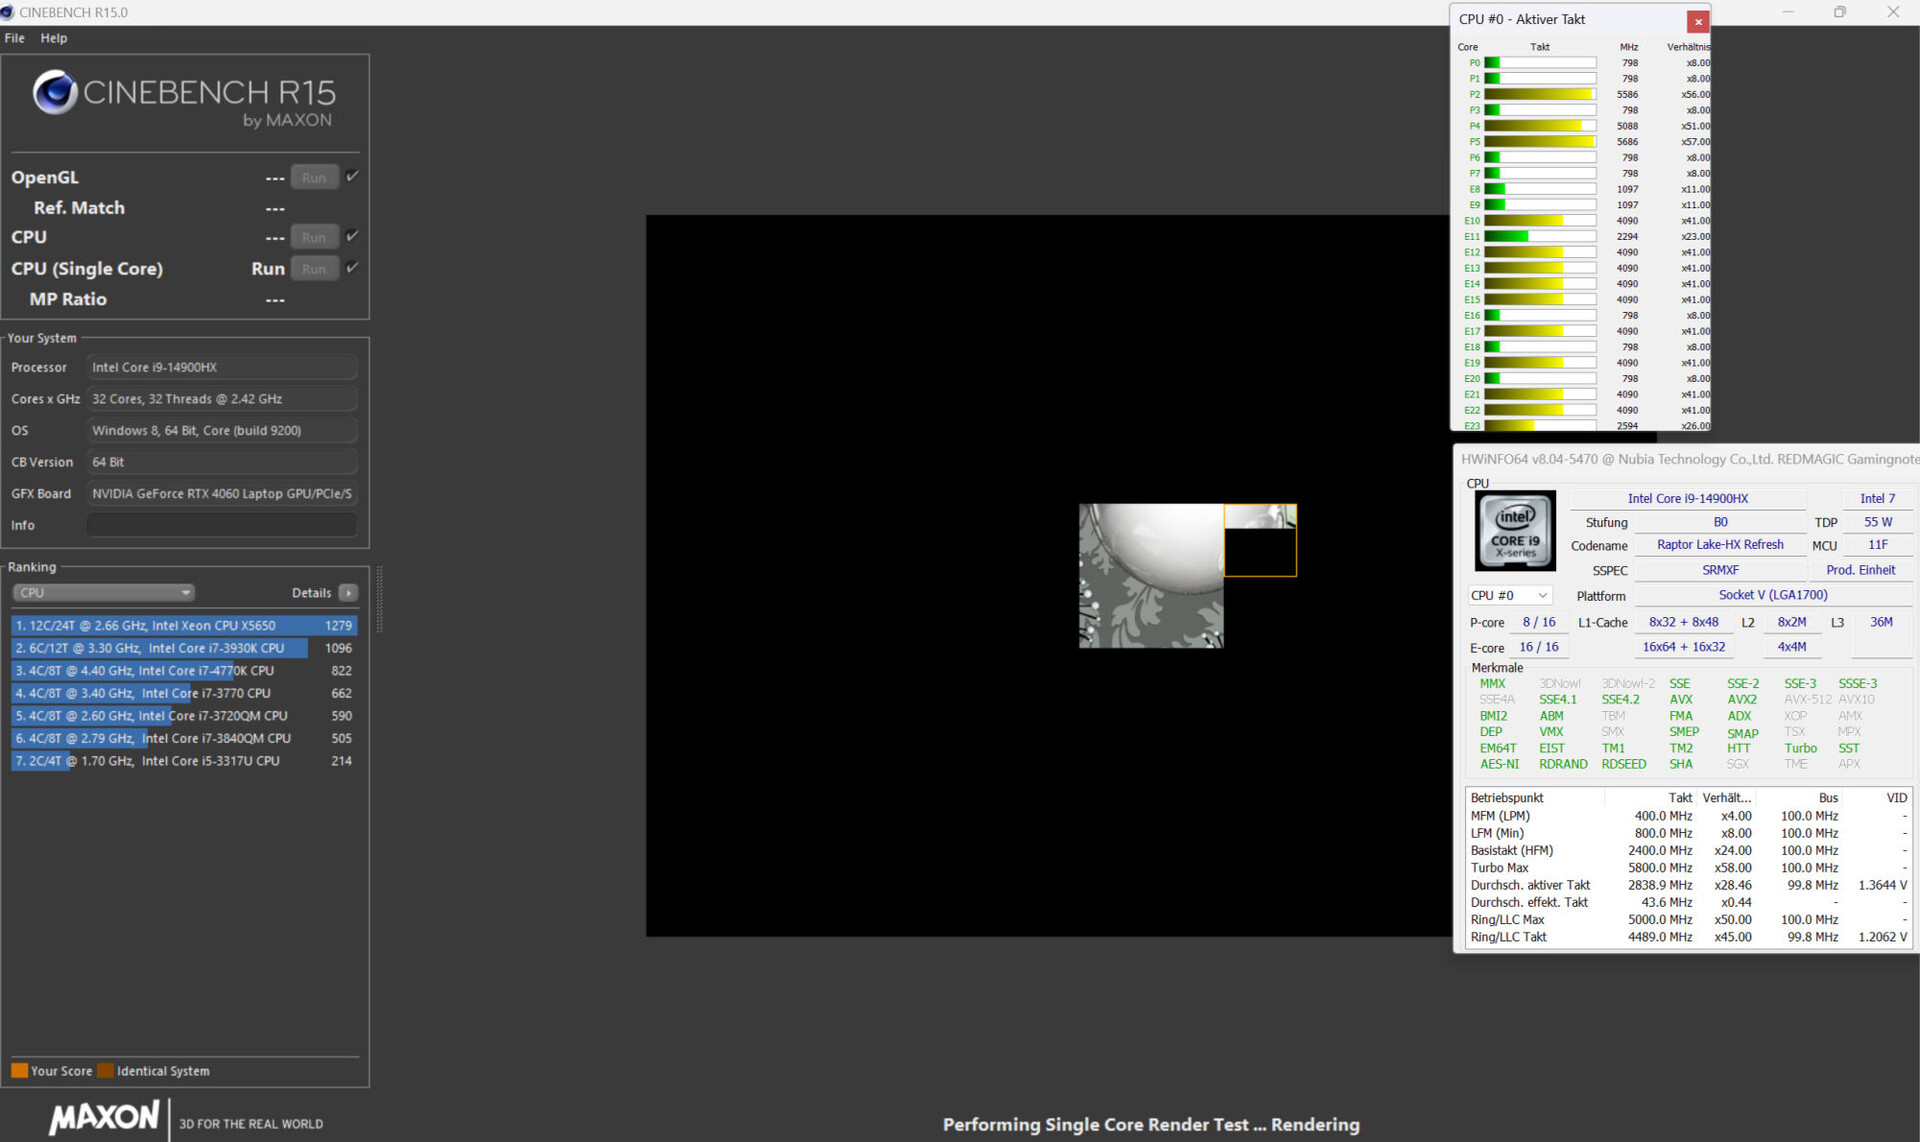
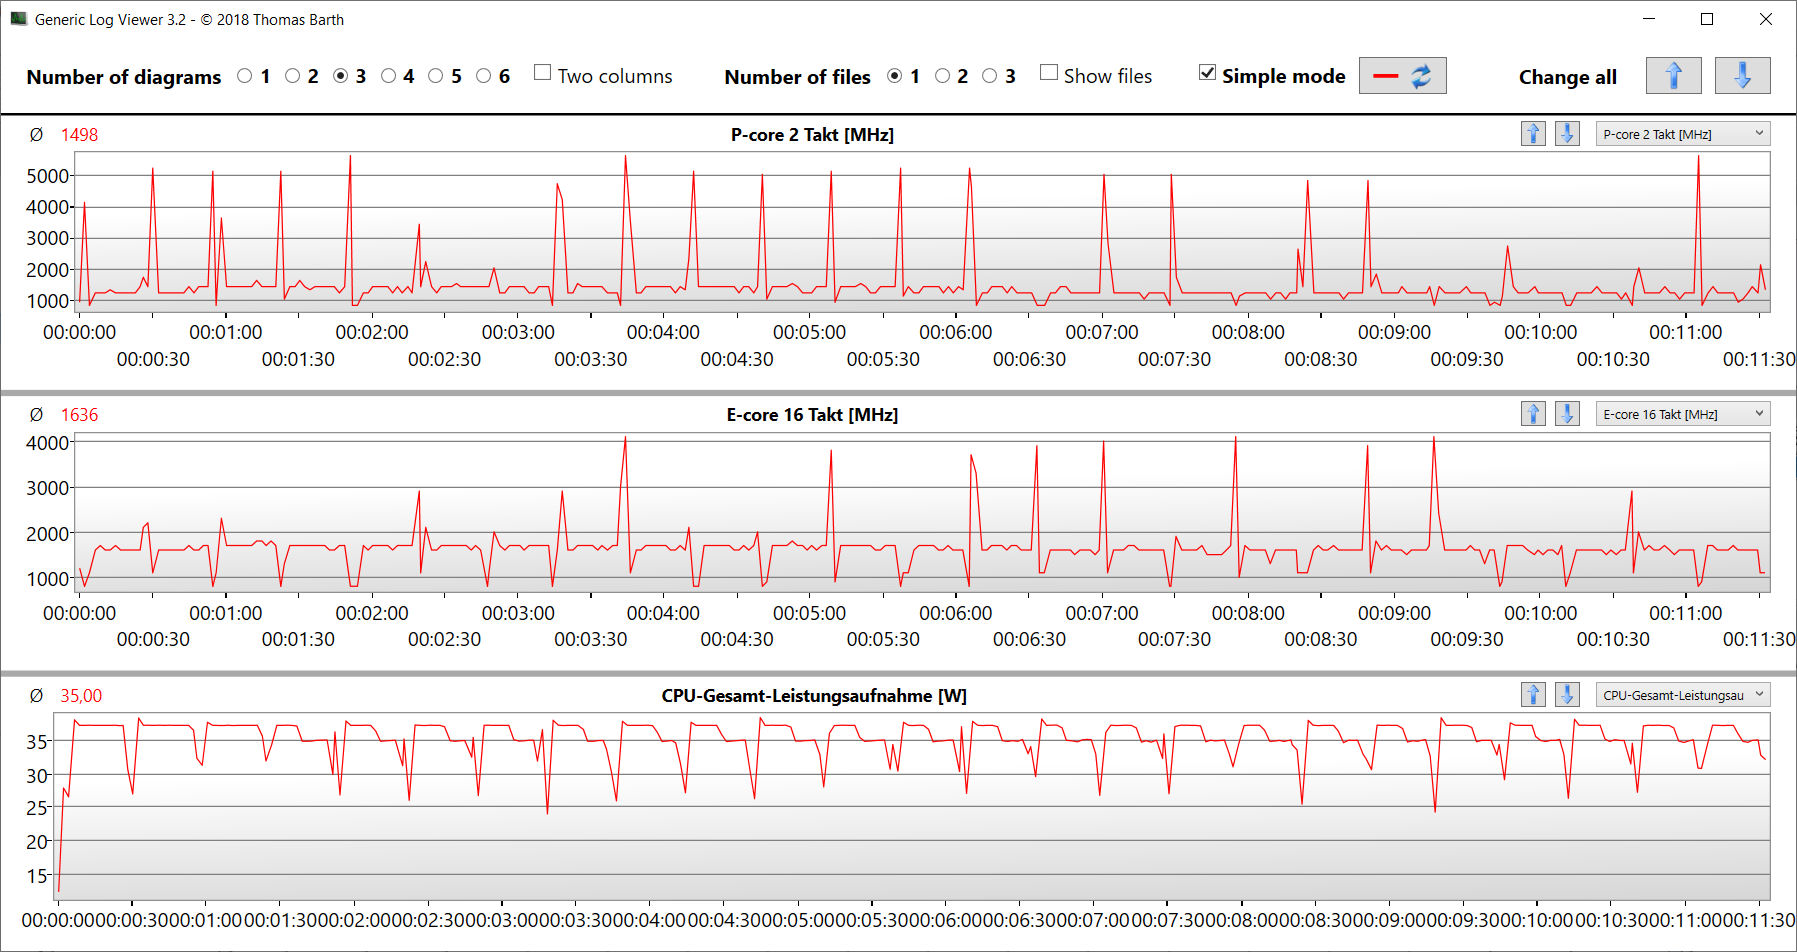
Titan 只有一种 CPU 可选,即 酷睿 i9-14900HX(猛禽湖)。其 24 个 CPU 内核(8P + 16E = 32 线程)的最高时钟频率为 5.8 GHz(P)和 4.1 GHz(E)。持续的多线程负载(CB15 循环)导致 CPU 时钟从第一次运行到第三次运行显著下降。此后,CPU 时钟保持在一个相当稳定的水平。游戏模式配置文件确保了更高的性能水平。
三种电源模式的单线程性能非常接近,与 CPU 的平均水平差不多。其多线程性能差异更大:在我们的测试中,只有游戏模式下的数值达到了 CPU 的平均水平,而其他两种模式下的数值要低得多。
有关酷睿 i9 的更多信息,请参阅我们的 分析文章.
Cinebench R15 Multi continuous test
| CPU Performance Rating - Percent | |
| Average Intel Core i9-14900HX | |
| Lenovo Legion Pro 5 16IRX9 G9 | |
| Nubia RedMagic Titan 16 Pro | |
| SCHENKER XMG Pro 16 Studio (Mid 24) | |
| Acer Predator Helios Neo 16 (2024) | |
| Nubia RedMagic Titan 16 Pro | |
| Average of class Gaming | |
| HP Victus 16 (2024) | |
| Gigabyte G6X 9KG (2024) | |
| Cinebench R20 | |
| CPU (Multi Core) | |
| Nubia RedMagic Titan 16 Pro (Gaming Mode) | |
| Average Intel Core i9-14900HX (6579 - 13832, n=37) | |
| Lenovo Legion Pro 5 16IRX9 G9 | |
| SCHENKER XMG Pro 16 Studio (Mid 24) | |
| HP Victus 16 (2024) | |
| Acer Predator Helios Neo 16 (2024) | |
| Average of class Gaming (2179 - 15517, n=151, last 2 years) | |
| Gigabyte G6X 9KG (2024) | |
| Nubia RedMagic Titan 16 Pro | |
| CPU (Single Core) | |
| Nubia RedMagic Titan 16 Pro | |
| Average Intel Core i9-14900HX (657 - 859, n=37) | |
| Lenovo Legion Pro 5 16IRX9 G9 | |
| Nubia RedMagic Titan 16 Pro (Gaming Mode) | |
| Acer Predator Helios Neo 16 (2024) | |
| SCHENKER XMG Pro 16 Studio (Mid 24) | |
| Average of class Gaming (439 - 866, n=151, last 2 years) | |
| Gigabyte G6X 9KG (2024) | |
| HP Victus 16 (2024) | |
| Cinebench R15 | |
| CPU Multi 64Bit | |
| Nubia RedMagic Titan 16 Pro (Gaming Mode) | |
| Average Intel Core i9-14900HX (3263 - 5589, n=38) | |
| SCHENKER XMG Pro 16 Studio (Mid 24) | |
| Lenovo Legion Pro 5 16IRX9 G9 | |
| HP Victus 16 (2024) | |
| Acer Predator Helios Neo 16 (2024) | |
| Nubia RedMagic Titan 16 Pro | |
| Average of class Gaming (905 - 6074, n=154, last 2 years) | |
| Gigabyte G6X 9KG (2024) | |
| CPU Single 64Bit | |
| Nubia RedMagic Titan 16 Pro | |
| Nubia RedMagic Titan 16 Pro (Gaming Mode) | |
| Average Intel Core i9-14900HX (247 - 323, n=37) | |
| Lenovo Legion Pro 5 16IRX9 G9 | |
| Acer Predator Helios Neo 16 (2024) | |
| SCHENKER XMG Pro 16 Studio (Mid 24) | |
| Average of class Gaming (191.9 - 343, n=151, last 2 years) | |
| Gigabyte G6X 9KG (2024) | |
| HP Victus 16 (2024) | |
| Blender - v2.79 BMW27 CPU | |
| Gigabyte G6X 9KG (2024) | |
| Nubia RedMagic Titan 16 Pro | |
| Average of class Gaming (81 - 555, n=144, last 2 years) | |
| HP Victus 16 (2024) | |
| Acer Predator Helios Neo 16 (2024) | |
| SCHENKER XMG Pro 16 Studio (Mid 24) | |
| Nubia RedMagic Titan 16 Pro (Gaming Mode) | |
| Lenovo Legion Pro 5 16IRX9 G9 | |
| Average Intel Core i9-14900HX (91 - 206, n=37) | |
| Geekbench 6.4 | |
| Multi-Core | |
| Lenovo Legion Pro 5 16IRX9 G9 (6.2.1) | |
| Average Intel Core i9-14900HX (13158 - 19665, n=37) | |
| Acer Predator Helios Neo 16 (2024) (6.2.1) | |
| SCHENKER XMG Pro 16 Studio (Mid 24) (6.2.1) | |
| HP Victus 16 (2024) (6.2.1) | |
| Nubia RedMagic Titan 16 Pro (6.2.1, Gaming Mode) | |
| Average of class Gaming (5340 - 21668, n=119, last 2 years) | |
| Gigabyte G6X 9KG (2024) (6.2.1) | |
| Nubia RedMagic Titan 16 Pro (6.2.1) | |
| Single-Core | |
| Nubia RedMagic Titan 16 Pro (6.2.1) | |
| Nubia RedMagic Titan 16 Pro (6.2.1, Gaming Mode) | |
| Acer Predator Helios Neo 16 (2024) (6.2.1) | |
| Average Intel Core i9-14900HX (2419 - 3129, n=37) | |
| Lenovo Legion Pro 5 16IRX9 G9 (6.2.1) | |
| SCHENKER XMG Pro 16 Studio (Mid 24) (6.2.1) | |
| Average of class Gaming (1490 - 3219, n=119, last 2 years) | |
| Gigabyte G6X 9KG (2024) (6.2.1) | |
| HP Victus 16 (2024) (6.2.1) | |
| HWBOT x265 Benchmark v2.2 - 4k Preset | |
| Nubia RedMagic Titan 16 Pro (Gaming Mode) | |
| Average Intel Core i9-14900HX (16.8 - 38.9, n=37) | |
| Lenovo Legion Pro 5 16IRX9 G9 | |
| SCHENKER XMG Pro 16 Studio (Mid 24) | |
| Acer Predator Helios Neo 16 (2024) | |
| Average of class Gaming (6.72 - 42.9, n=148, last 2 years) | |
| HP Victus 16 (2024) | |
| Gigabyte G6X 9KG (2024) | |
| Nubia RedMagic Titan 16 Pro | |
| LibreOffice - 20 Documents To PDF | |
| HP Victus 16 (2024) (6.3.4.2) | |
| Lenovo Legion Pro 5 16IRX9 G9 (6.3.4.2) | |
| Average of class Gaming (19 - 96.6, n=147, last 2 years) | |
| SCHENKER XMG Pro 16 Studio (Mid 24) (6.3.4.2) | |
| Average Intel Core i9-14900HX (19 - 85.1, n=37) | |
| Acer Predator Helios Neo 16 (2024) (6.3.4.2) | |
| Nubia RedMagic Titan 16 Pro (6.3.4.2, Gaming Mode) | |
| Gigabyte G6X 9KG (2024) (6.3.4.2) | |
| Nubia RedMagic Titan 16 Pro (6.3.4.2) | |
| R Benchmark 2.5 - Overall mean | |
| HP Victus 16 (2024) | |
| Average of class Gaming (0.3609 - 0.759, n=150, last 2 years) | |
| Gigabyte G6X 9KG (2024) | |
| SCHENKER XMG Pro 16 Studio (Mid 24) | |
| Lenovo Legion Pro 5 16IRX9 G9 | |
| Average Intel Core i9-14900HX (0.3604 - 0.4859, n=37) | |
| Acer Predator Helios Neo 16 (2024) | |
| Nubia RedMagic Titan 16 Pro | |
| Nubia RedMagic Titan 16 Pro (Gaming Mode) | |
* ... smaller is better
AIDA64: FP32 Ray-Trace | FPU Julia | CPU SHA3 | CPU Queen | FPU SinJulia | FPU Mandel | CPU AES | CPU ZLib | FP64 Ray-Trace | CPU PhotoWorxx
| Performance Rating | |
| Average Intel Core i9-14900HX | |
| Nubia RedMagic Titan 16 Pro | |
| Lenovo Legion Pro 5 16IRX9 G9 | |
| SCHENKER XMG Pro 16 Studio (Mid 24) | |
| Acer Predator Helios Neo 16 (2024) | |
| Average of class Gaming | |
| HP Victus 16 (2024) | |
| Nubia RedMagic Titan 16 Pro | |
| Gigabyte G6X 9KG (2024) | |
| AIDA64 / FP32 Ray-Trace | |
| Average Intel Core i9-14900HX (13098 - 33474, n=36) | |
| Nubia RedMagic Titan 16 Pro (v6.92.6600, Gaming Mode) | |
| Lenovo Legion Pro 5 16IRX9 G9 (v6.92.6600) | |
| Average of class Gaming (4986 - 81639, n=147, last 2 years) | |
| Acer Predator Helios Neo 16 (2024) (v6.92.6600) | |
| SCHENKER XMG Pro 16 Studio (Mid 24) (v6.92.6600) | |
| HP Victus 16 (2024) (v6.92.6600) | |
| Gigabyte G6X 9KG (2024) (v6.92.6600) | |
| Nubia RedMagic Titan 16 Pro (v6.92.6600) | |
| AIDA64 / FPU Julia | |
| Average Intel Core i9-14900HX (67573 - 166040, n=36) | |
| Nubia RedMagic Titan 16 Pro (v6.92.6600, Gaming Mode) | |
| Lenovo Legion Pro 5 16IRX9 G9 (v6.92.6600) | |
| SCHENKER XMG Pro 16 Studio (Mid 24) (v6.92.6600) | |
| Acer Predator Helios Neo 16 (2024) (v6.92.6600) | |
| Average of class Gaming (25360 - 252486, n=147, last 2 years) | |
| HP Victus 16 (2024) (v6.92.6600) | |
| Gigabyte G6X 9KG (2024) (v6.92.6600) | |
| Nubia RedMagic Titan 16 Pro (v6.92.6600) | |
| AIDA64 / CPU SHA3 | |
| Nubia RedMagic Titan 16 Pro (v6.92.6600, Gaming Mode) | |
| Average Intel Core i9-14900HX (3589 - 7979, n=36) | |
| SCHENKER XMG Pro 16 Studio (Mid 24) (v6.92.6600) | |
| Lenovo Legion Pro 5 16IRX9 G9 (v6.92.6600) | |
| Acer Predator Helios Neo 16 (2024) (v6.92.6600) | |
| Average of class Gaming (1339 - 10389, n=147, last 2 years) | |
| HP Victus 16 (2024) (v6.92.6600) | |
| Nubia RedMagic Titan 16 Pro (v6.92.6600) | |
| Gigabyte G6X 9KG (2024) (v6.92.6600) | |
| AIDA64 / CPU Queen | |
| Lenovo Legion Pro 5 16IRX9 G9 (v6.92.6600) | |
| Acer Predator Helios Neo 16 (2024) (v6.92.6600) | |
| Nubia RedMagic Titan 16 Pro (v6.92.6600, Gaming Mode) | |
| Average Intel Core i9-14900HX (118405 - 148966, n=36) | |
| SCHENKER XMG Pro 16 Studio (Mid 24) (v6.92.6600) | |
| HP Victus 16 (2024) (v6.92.6600) | |
| Nubia RedMagic Titan 16 Pro (v6.92.6600) | |
| Average of class Gaming (50699 - 200651, n=147, last 2 years) | |
| Gigabyte G6X 9KG (2024) (v6.92.6600) | |
| AIDA64 / FPU SinJulia | |
| Nubia RedMagic Titan 16 Pro (v6.92.6600, Gaming Mode) | |
| Average Intel Core i9-14900HX (10475 - 18517, n=36) | |
| Lenovo Legion Pro 5 16IRX9 G9 (v6.92.6600) | |
| SCHENKER XMG Pro 16 Studio (Mid 24) (v6.92.6600) | |
| Acer Predator Helios Neo 16 (2024) (v6.92.6600) | |
| Average of class Gaming (4800 - 32988, n=147, last 2 years) | |
| HP Victus 16 (2024) (v6.92.6600) | |
| Nubia RedMagic Titan 16 Pro (v6.92.6600) | |
| Gigabyte G6X 9KG (2024) (v6.92.6600) | |
| AIDA64 / FPU Mandel | |
| Average Intel Core i9-14900HX (32543 - 83662, n=36) | |
| Nubia RedMagic Titan 16 Pro (v6.92.6600, Gaming Mode) | |
| Lenovo Legion Pro 5 16IRX9 G9 (v6.92.6600) | |
| Acer Predator Helios Neo 16 (2024) (v6.92.6600) | |
| Average of class Gaming (12321 - 134044, n=147, last 2 years) | |
| SCHENKER XMG Pro 16 Studio (Mid 24) (v6.92.6600) | |
| HP Victus 16 (2024) (v6.92.6600) | |
| Gigabyte G6X 9KG (2024) (v6.92.6600) | |
| Nubia RedMagic Titan 16 Pro | |
| AIDA64 / CPU AES | |
| Nubia RedMagic Titan 16 Pro (v6.92.6600, Gaming Mode) | |
| Average Intel Core i9-14900HX (86964 - 241777, n=36) | |
| Nubia RedMagic Titan 16 Pro (v6.92.6600) | |
| Lenovo Legion Pro 5 16IRX9 G9 (v6.92.6600) | |
| SCHENKER XMG Pro 16 Studio (Mid 24) (v6.92.6600) | |
| Average of class Gaming (19065 - 328679, n=147, last 2 years) | |
| Acer Predator Helios Neo 16 (2024) (v6.92.6600) | |
| HP Victus 16 (2024) (v6.92.6600) | |
| Gigabyte G6X 9KG (2024) (v6.92.6600) | |
| AIDA64 / CPU ZLib | |
| Nubia RedMagic Titan 16 Pro (v6.92.6600, Gaming Mode) | |
| Average Intel Core i9-14900HX (1054 - 2292, n=36) | |
| Lenovo Legion Pro 5 16IRX9 G9 (v6.92.6600) | |
| SCHENKER XMG Pro 16 Studio (Mid 24) (v6.92.6600) | |
| Acer Predator Helios Neo 16 (2024) (v6.92.6600) | |
| Average of class Gaming (373 - 2531, n=147, last 2 years) | |
| HP Victus 16 (2024) (v6.92.6600) | |
| Gigabyte G6X 9KG (2024) (v6.92.6600) | |
| Nubia RedMagic Titan 16 Pro (v6.92.6600) | |
| AIDA64 / FP64 Ray-Trace | |
| Average Intel Core i9-14900HX (6809 - 18349, n=36) | |
| Lenovo Legion Pro 5 16IRX9 G9 (v6.92.6600) | |
| Nubia RedMagic Titan 16 Pro (v6.92.6600, Gaming Mode) | |
| Average of class Gaming (2540 - 43430, n=147, last 2 years) | |
| SCHENKER XMG Pro 16 Studio (Mid 24) (v6.92.6600) | |
| Acer Predator Helios Neo 16 (2024) (v6.92.6600) | |
| HP Victus 16 (2024) (v6.92.6600) | |
| Gigabyte G6X 9KG (2024) (v6.92.6600) | |
| Nubia RedMagic Titan 16 Pro (v6.92.6600) | |
| AIDA64 / CPU PhotoWorxx | |
| Lenovo Legion Pro 5 16IRX9 G9 (v6.92.6600) | |
| SCHENKER XMG Pro 16 Studio (Mid 24) (v6.92.6600) | |
| Average Intel Core i9-14900HX (23903 - 54702, n=36) | |
| Acer Predator Helios Neo 16 (2024) (v6.92.6600) | |
| Average of class Gaming (10805 - 60161, n=147, last 2 years) | |
| HP Victus 16 (2024) (v6.92.6600) | |
| Gigabyte G6X 9KG (2024) (v6.92.6600) | |
| Nubia RedMagic Titan 16 Pro (v6.92.6600) | |
| Nubia RedMagic Titan 16 Pro (v6.92.6600, Gaming Mode) | |
系统性能
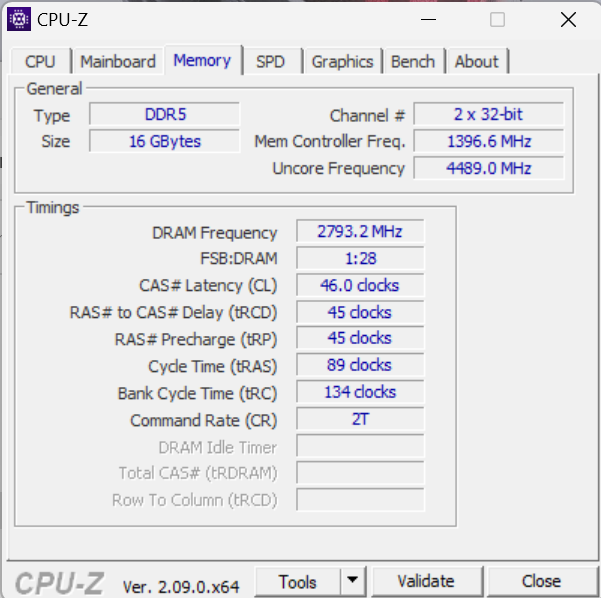
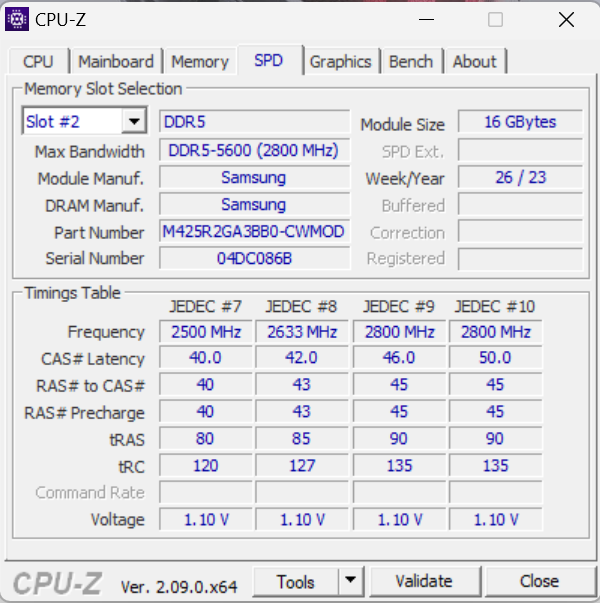
运行流畅的系统为游戏、渲染和流媒体等要求苛刻的应用提供了足够的动力。然而,由于内存(16 GB,DDR5-5600)只能在单通道模式下运行,笔记本电脑的内存传输速率与同类产品相比偏低,因此部分计算能力仍未得到充分利用。安装第二个内存模块(=激活双通道模式)可以解决这个问题。
CrossMark: Overall | Productivity | Creativity | Responsiveness
WebXPRT 3: Overall
WebXPRT 4: Overall
Mozilla Kraken 1.1: Total
| PCMark 10 / Score | |
| Acer Predator Helios Neo 16 (2024) | |
| Lenovo Legion Pro 5 16IRX9 G9 | |
| SCHENKER XMG Pro 16 Studio (Mid 24) | |
| Average Intel Core i9-14900HX, NVIDIA GeForce RTX 4060 Laptop GPU (7830 - 8322, n=2) | |
| Nubia RedMagic Titan 16 Pro | |
| Average of class Gaming (5776 - 9852, n=133, last 2 years) | |
| Gigabyte G6X 9KG (2024) | |
| HP Victus 16 (2024) | |
| PCMark 10 / Essentials | |
| Acer Predator Helios Neo 16 (2024) | |
| Average Intel Core i9-14900HX, NVIDIA GeForce RTX 4060 Laptop GPU (11022 - 11413, n=2) | |
| Lenovo Legion Pro 5 16IRX9 G9 | |
| Nubia RedMagic Titan 16 Pro | |
| HP Victus 16 (2024) | |
| Average of class Gaming (9057 - 12600, n=133, last 2 years) | |
| SCHENKER XMG Pro 16 Studio (Mid 24) | |
| Gigabyte G6X 9KG (2024) | |
| PCMark 10 / Productivity | |
| SCHENKER XMG Pro 16 Studio (Mid 24) | |
| Acer Predator Helios Neo 16 (2024) | |
| Gigabyte G6X 9KG (2024) | |
| Average Intel Core i9-14900HX, NVIDIA GeForce RTX 4060 Laptop GPU (9776 - 10558, n=2) | |
| HP Victus 16 (2024) | |
| Average of class Gaming (6662 - 14612, n=133, last 2 years) | |
| Lenovo Legion Pro 5 16IRX9 G9 | |
| Nubia RedMagic Titan 16 Pro | |
| PCMark 10 / Digital Content Creation | |
| Lenovo Legion Pro 5 16IRX9 G9 | |
| Acer Predator Helios Neo 16 (2024) | |
| Average Intel Core i9-14900HX, NVIDIA GeForce RTX 4060 Laptop GPU (12091 - 12979, n=2) | |
| SCHENKER XMG Pro 16 Studio (Mid 24) | |
| Average of class Gaming (6807 - 18475, n=133, last 2 years) | |
| Nubia RedMagic Titan 16 Pro | |
| Gigabyte G6X 9KG (2024) | |
| HP Victus 16 (2024) | |
| CrossMark / Overall | |
| Acer Predator Helios Neo 16 (2024) | |
| Average Intel Core i9-14900HX, NVIDIA GeForce RTX 4060 Laptop GPU (2103 - 2184, n=2) | |
| Lenovo Legion Pro 5 16IRX9 G9 | |
| Nubia RedMagic Titan 16 Pro | |
| SCHENKER XMG Pro 16 Studio (Mid 24) | |
| Gigabyte G6X 9KG (2024) | |
| HP Victus 16 (2024) | |
| Average of class Gaming (1247 - 2344, n=114, last 2 years) | |
| CrossMark / Productivity | |
| Acer Predator Helios Neo 16 (2024) | |
| Nubia RedMagic Titan 16 Pro | |
| Average Intel Core i9-14900HX, NVIDIA GeForce RTX 4060 Laptop GPU (2040 - 2042, n=2) | |
| Lenovo Legion Pro 5 16IRX9 G9 | |
| SCHENKER XMG Pro 16 Studio (Mid 24) | |
| Gigabyte G6X 9KG (2024) | |
| Average of class Gaming (1299 - 2204, n=114, last 2 years) | |
| HP Victus 16 (2024) | |
| CrossMark / Creativity | |
| Acer Predator Helios Neo 16 (2024) | |
| Lenovo Legion Pro 5 16IRX9 G9 | |
| SCHENKER XMG Pro 16 Studio (Mid 24) | |
| Average Intel Core i9-14900HX, NVIDIA GeForce RTX 4060 Laptop GPU (2240 - 2472, n=2) | |
| Nubia RedMagic Titan 16 Pro | |
| HP Victus 16 (2024) | |
| Average of class Gaming (1275 - 2660, n=114, last 2 years) | |
| Gigabyte G6X 9KG (2024) | |
| CrossMark / Responsiveness | |
| Acer Predator Helios Neo 16 (2024) | |
| Gigabyte G6X 9KG (2024) | |
| Nubia RedMagic Titan 16 Pro | |
| Lenovo Legion Pro 5 16IRX9 G9 | |
| Average Intel Core i9-14900HX, NVIDIA GeForce RTX 4060 Laptop GPU (1849 - 1899, n=2) | |
| HP Victus 16 (2024) | |
| SCHENKER XMG Pro 16 Studio (Mid 24) | |
| Average of class Gaming (1030 - 2330, n=114, last 2 years) | |
| WebXPRT 3 / Overall | |
| Average Intel Core i9-14900HX, NVIDIA GeForce RTX 4060 Laptop GPU (329 - 339, n=2) | |
| Nubia RedMagic Titan 16 Pro | |
| Acer Predator Helios Neo 16 (2024) | |
| SCHENKER XMG Pro 16 Studio (Mid 24) | |
| Gigabyte G6X 9KG (2024) | |
| Lenovo Legion Pro 5 16IRX9 G9 | |
| Average of class Gaming (215 - 480, n=127, last 2 years) | |
| HP Victus 16 (2024) | |
| WebXPRT 4 / Overall | |
| Average Intel Core i9-14900HX, NVIDIA GeForce RTX 4060 Laptop GPU (309 - 319, n=2) | |
| Nubia RedMagic Titan 16 Pro | |
| Acer Predator Helios Neo 16 (2024) | |
| SCHENKER XMG Pro 16 Studio (Mid 24) | |
| Lenovo Legion Pro 5 16IRX9 G9 | |
| Average of class Gaming (176.4 - 335, n=115, last 2 years) | |
| Gigabyte G6X 9KG (2024) | |
| HP Victus 16 (2024) | |
| Mozilla Kraken 1.1 / Total | |
| HP Victus 16 (2024) | |
| Gigabyte G6X 9KG (2024) | |
| Average of class Gaming (409 - 674, n=139, last 2 years) | |
| Lenovo Legion Pro 5 16IRX9 G9 | |
| SCHENKER XMG Pro 16 Studio (Mid 24) | |
| Acer Predator Helios Neo 16 (2024) | |
| Nubia RedMagic Titan 16 Pro | |
| Average Intel Core i9-14900HX, NVIDIA GeForce RTX 4060 Laptop GPU (430 - 439, n=2) | |
* ... smaller is better
| PCMark 10 Score | 7830 points | |
Help | ||
| AIDA64 / Memory Copy | |
| SCHENKER XMG Pro 16 Studio (Mid 24) | |
| Lenovo Legion Pro 5 16IRX9 G9 | |
| Acer Predator Helios Neo 16 (2024) | |
| Average Intel Core i9-14900HX (38028 - 83392, n=36) | |
| HP Victus 16 (2024) | |
| Average of class Gaming (21750 - 97515, n=147, last 2 years) | |
| Gigabyte G6X 9KG (2024) | |
| Nubia RedMagic Titan 16 Pro | |
| AIDA64 / Memory Read | |
| Lenovo Legion Pro 5 16IRX9 G9 | |
| SCHENKER XMG Pro 16 Studio (Mid 24) | |
| Acer Predator Helios Neo 16 (2024) | |
| Average Intel Core i9-14900HX (43306 - 87568, n=36) | |
| HP Victus 16 (2024) | |
| Average of class Gaming (22956 - 102937, n=147, last 2 years) | |
| Gigabyte G6X 9KG (2024) | |
| Nubia RedMagic Titan 16 Pro | |
| AIDA64 / Memory Write | |
| Lenovo Legion Pro 5 16IRX9 G9 | |
| SCHENKER XMG Pro 16 Studio (Mid 24) | |
| Average Intel Core i9-14900HX (37146 - 80589, n=36) | |
| Acer Predator Helios Neo 16 (2024) | |
| Average of class Gaming (22297 - 108954, n=147, last 2 years) | |
| HP Victus 16 (2024) | |
| Gigabyte G6X 9KG (2024) | |
| Nubia RedMagic Titan 16 Pro | |
| AIDA64 / Memory Latency | |
| HP Victus 16 (2024) | |
| Average of class Gaming (59.5 - 259, n=147, last 2 years) | |
| Acer Predator Helios Neo 16 (2024) | |
| Gigabyte G6X 9KG (2024) | |
| Average Intel Core i9-14900HX (76.1 - 105, n=36) | |
| SCHENKER XMG Pro 16 Studio (Mid 24) | |
| Lenovo Legion Pro 5 16IRX9 G9 | |
| Nubia RedMagic Titan 16 Pro | |
* ... smaller is better
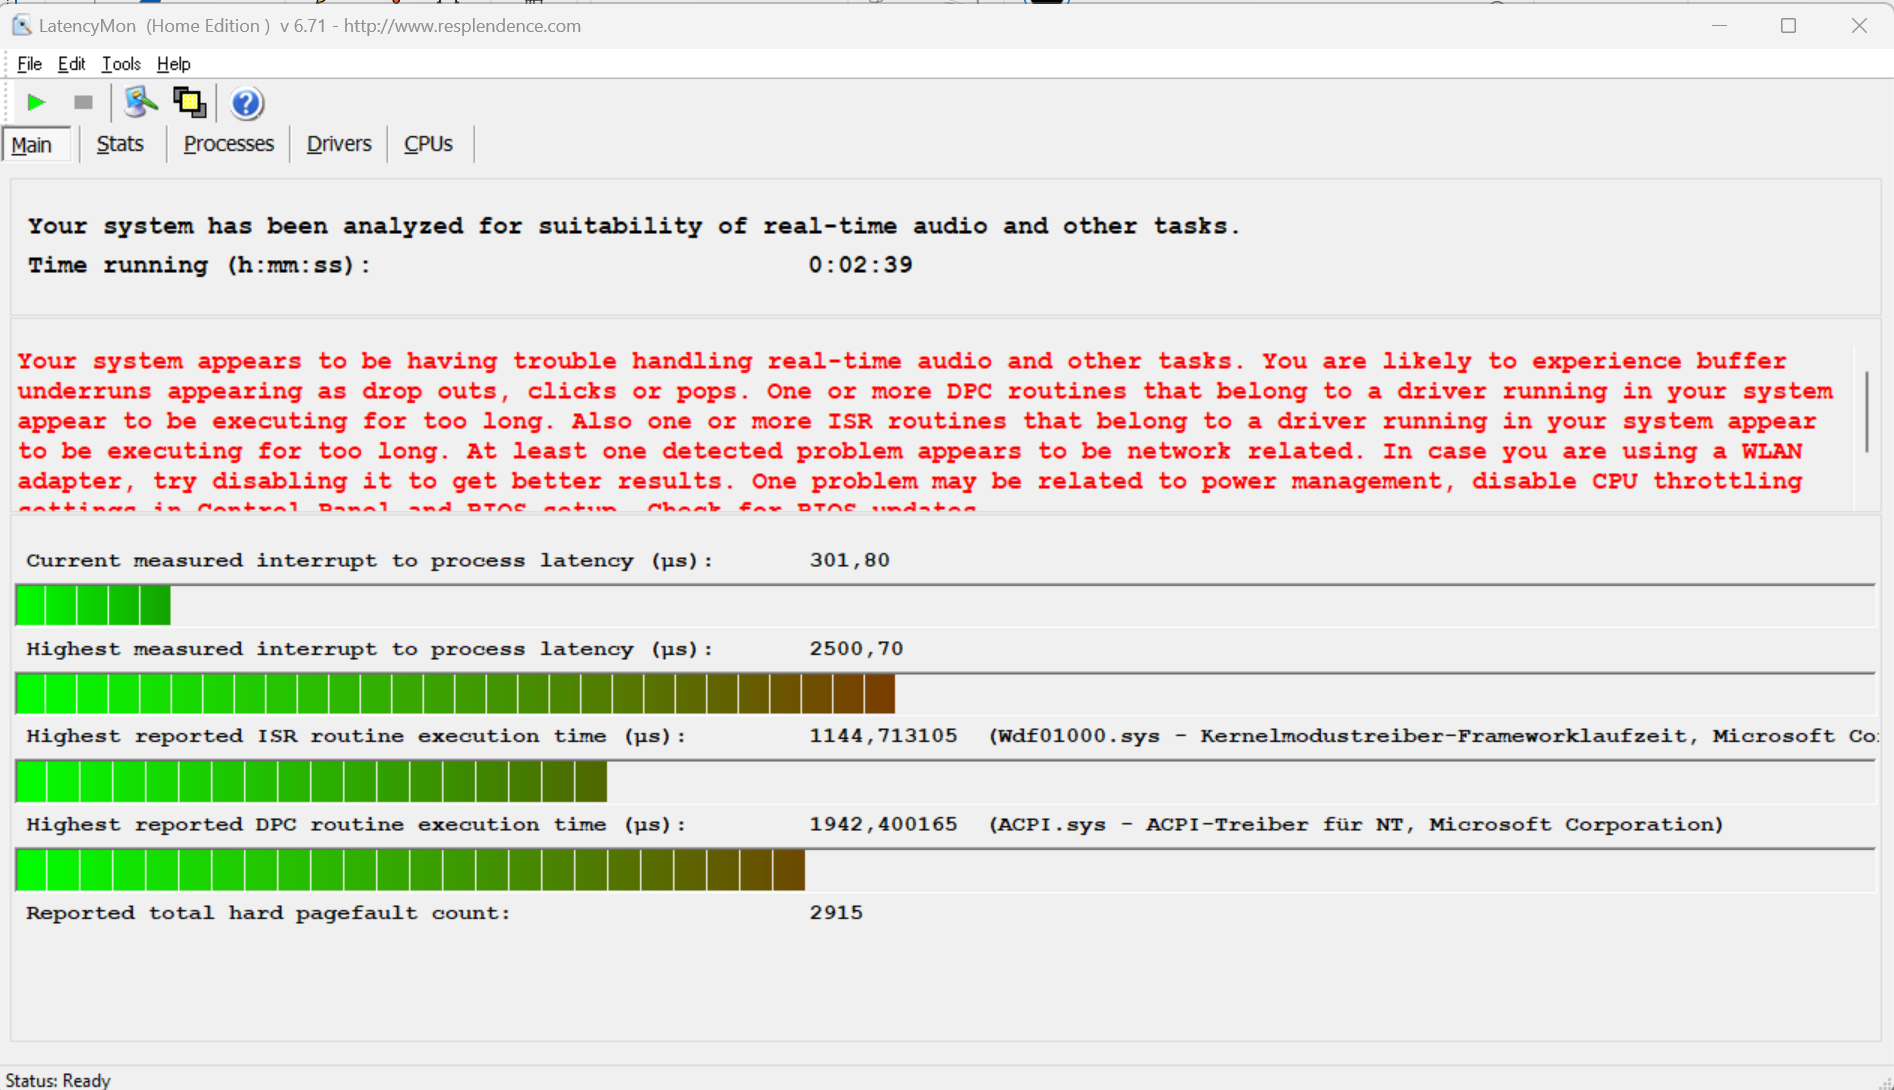
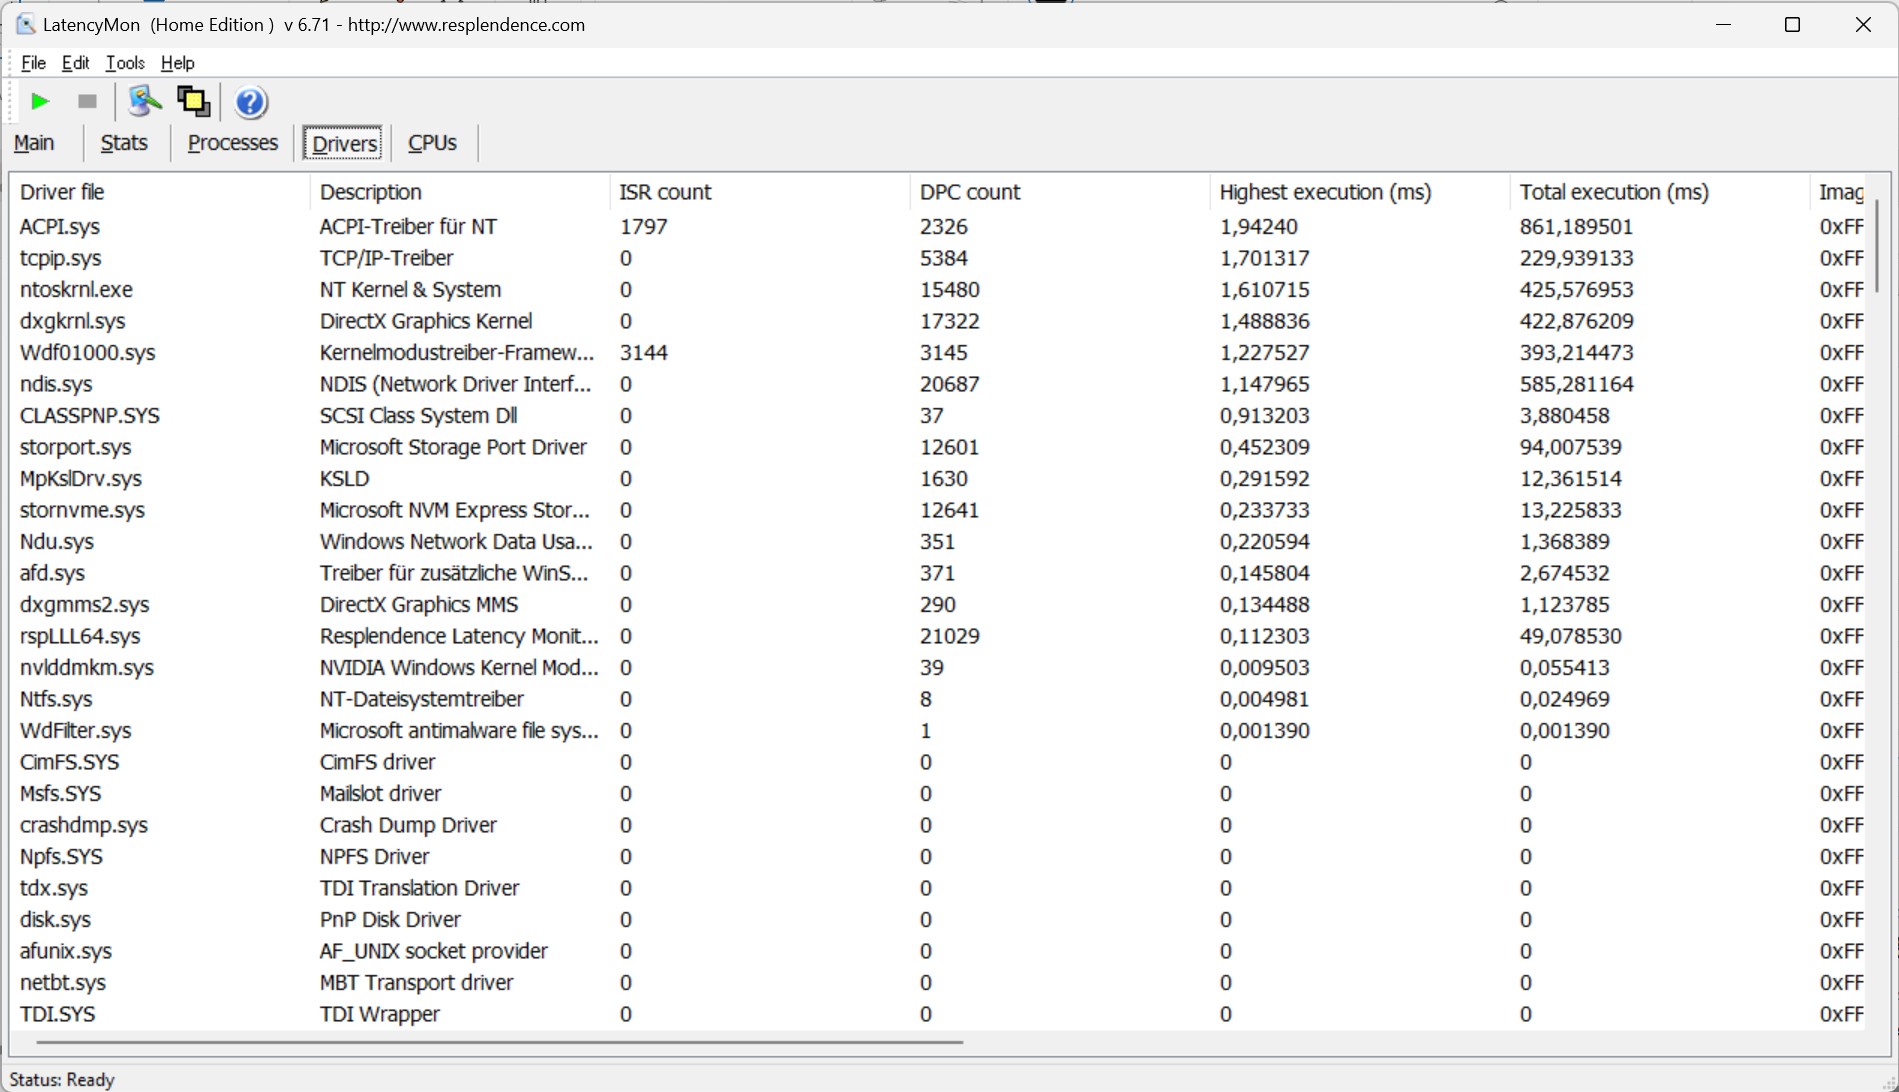
DPC 延迟
高延迟阻碍了视频和音频的实时编辑。未来的软件更新可能会带来改进甚至恶化。
| DPC Latencies / LatencyMon - interrupt to process latency (max), Web, Youtube, Prime95 | |
| Nubia RedMagic Titan 16 Pro | |
| Gigabyte G6X 9KG (2024) | |
| SCHENKER XMG Pro 16 Studio (Mid 24) | |
| Acer Predator Helios Neo 16 (2024) | |
| Lenovo Legion Pro 5 16IRX9 G9 | |
| HP Victus 16 (2024) | |
* ... smaller is better
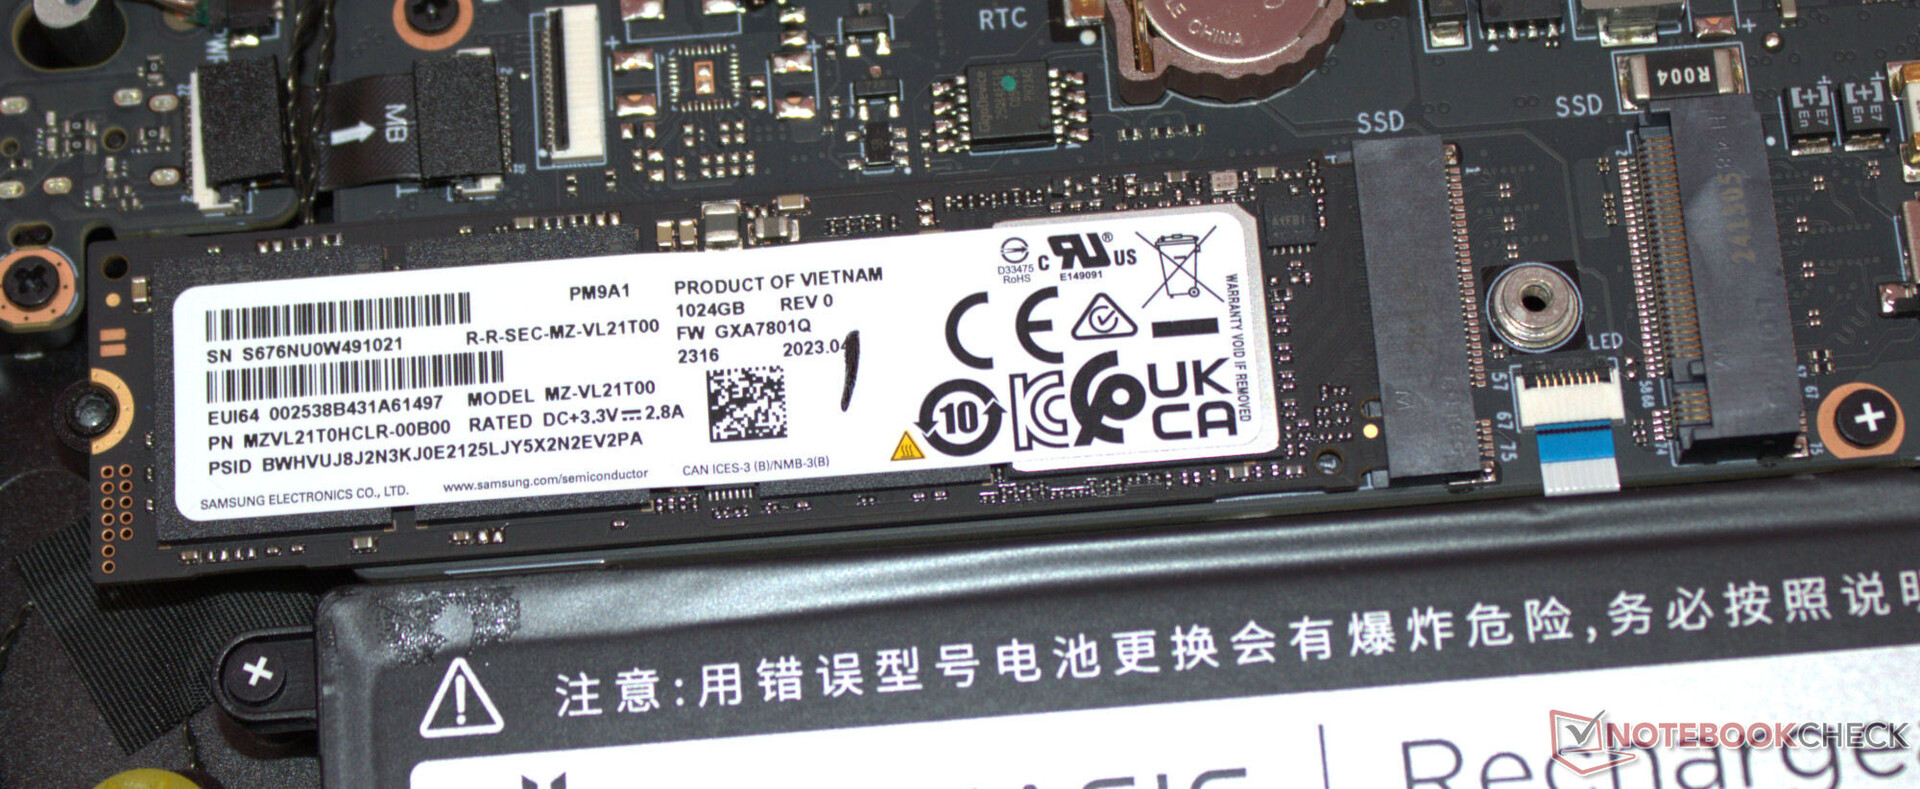
存储设备
三星的 PCIe 4 固态硬盘(M.2-2280)存储容量为 1 TB,数据传输率非常高。正面:我们没有观察到热引起的节流现象。笔记本电脑有空间安装第二个 PCIe 4 固态硬盘。

* ... smaller is better
Reading continuous performance: DiskSpd Read Loop, Queue Depth 8
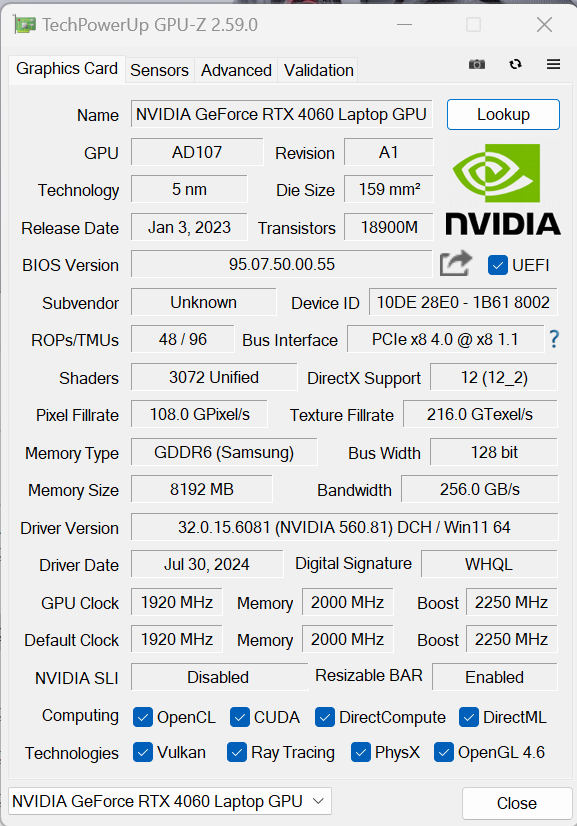
图形卡
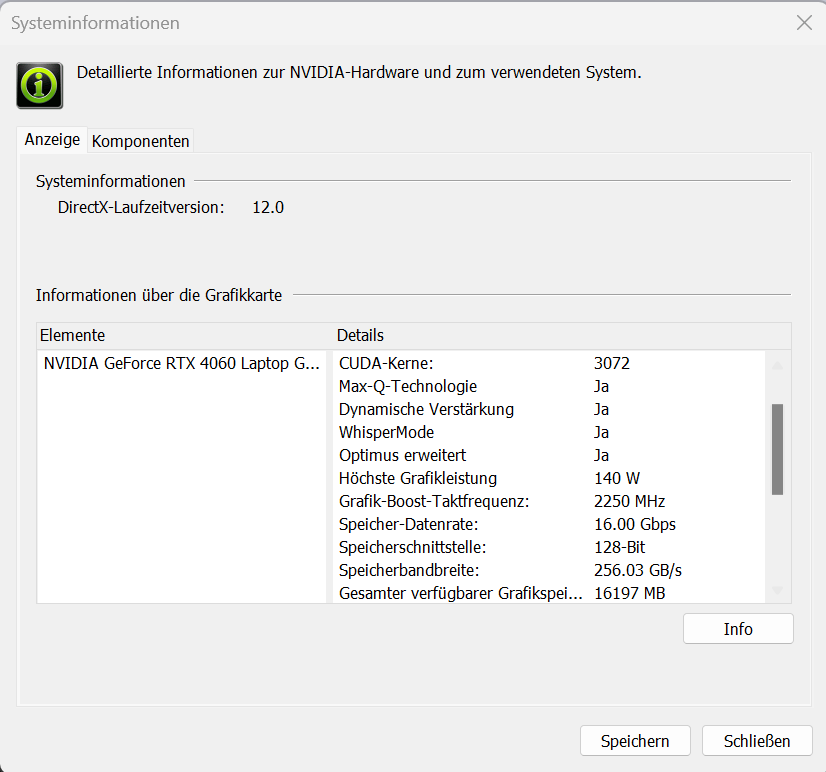
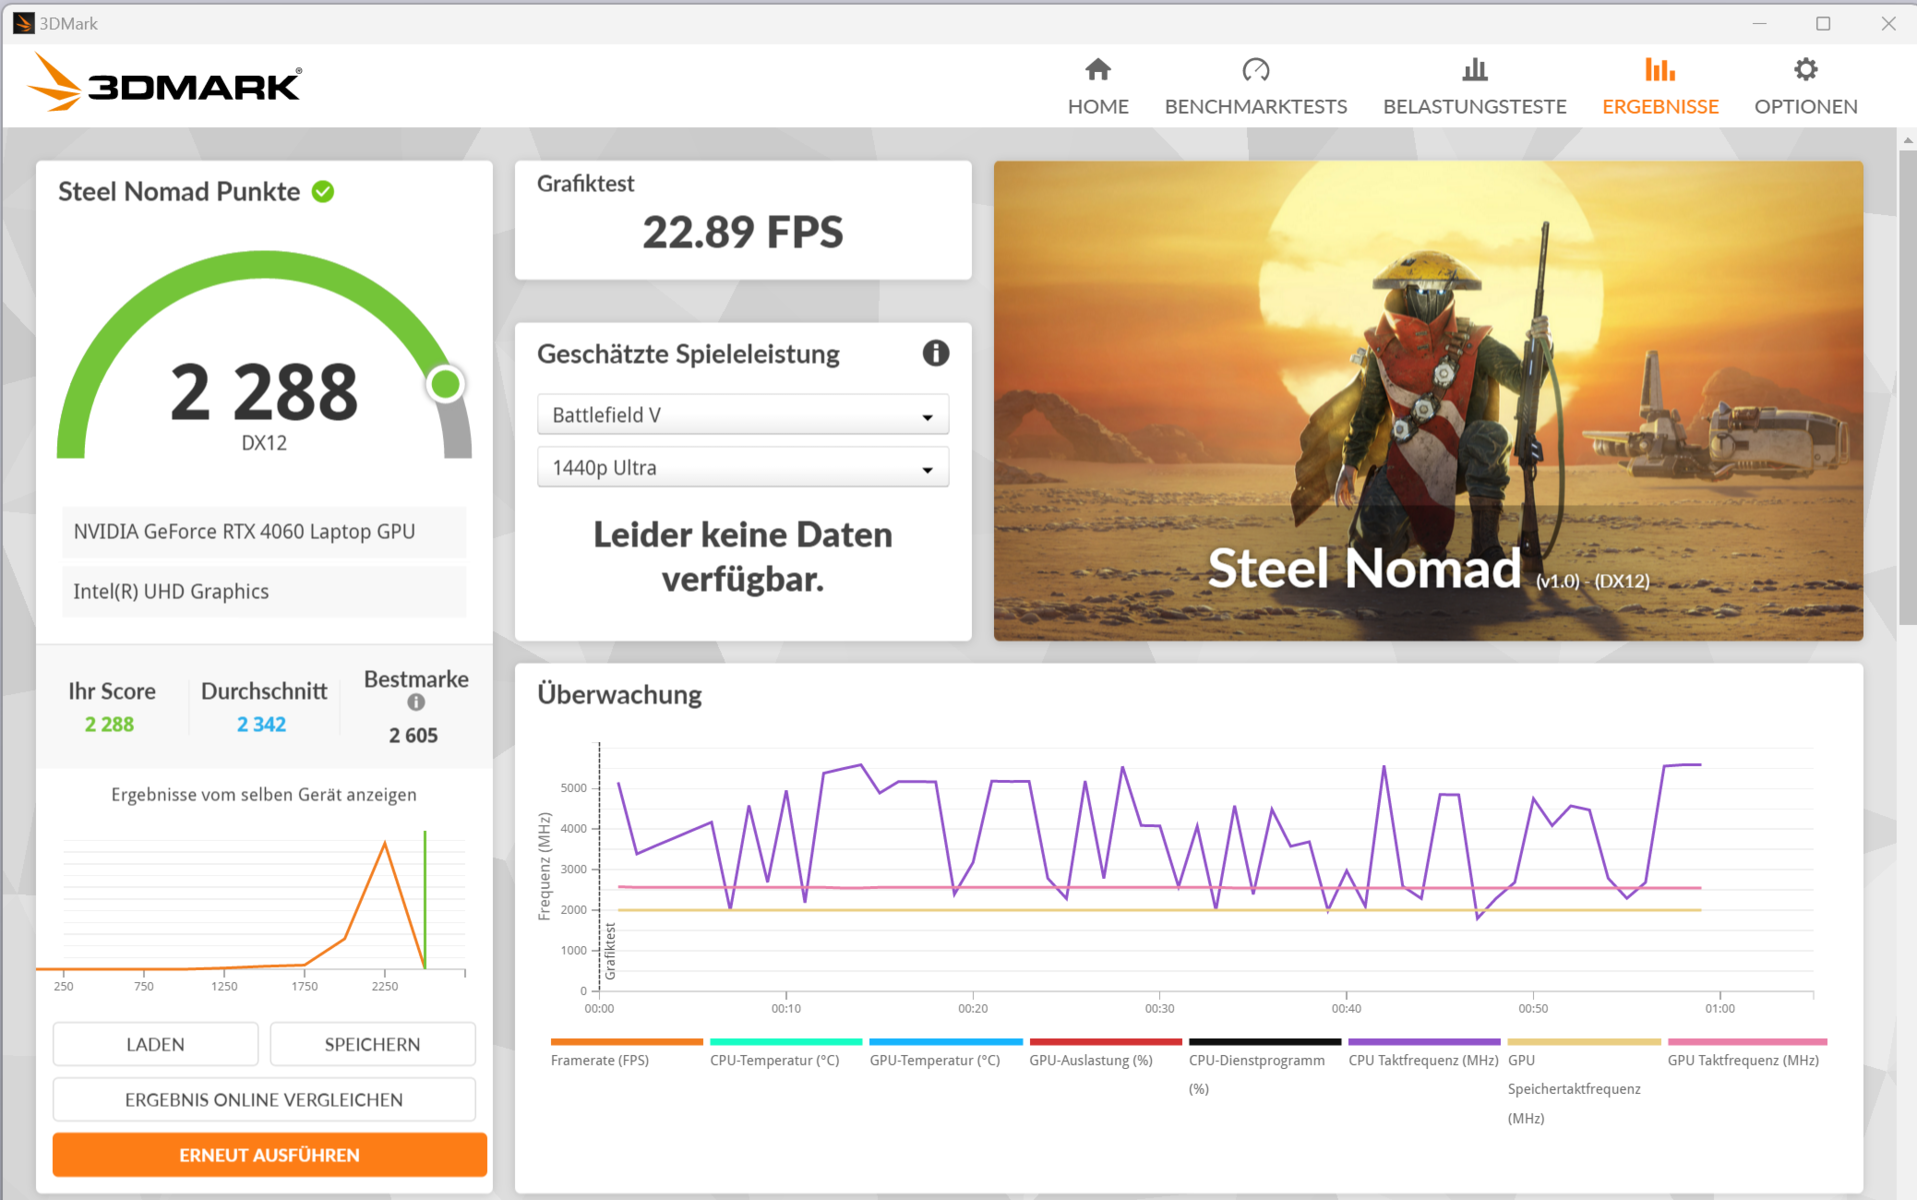
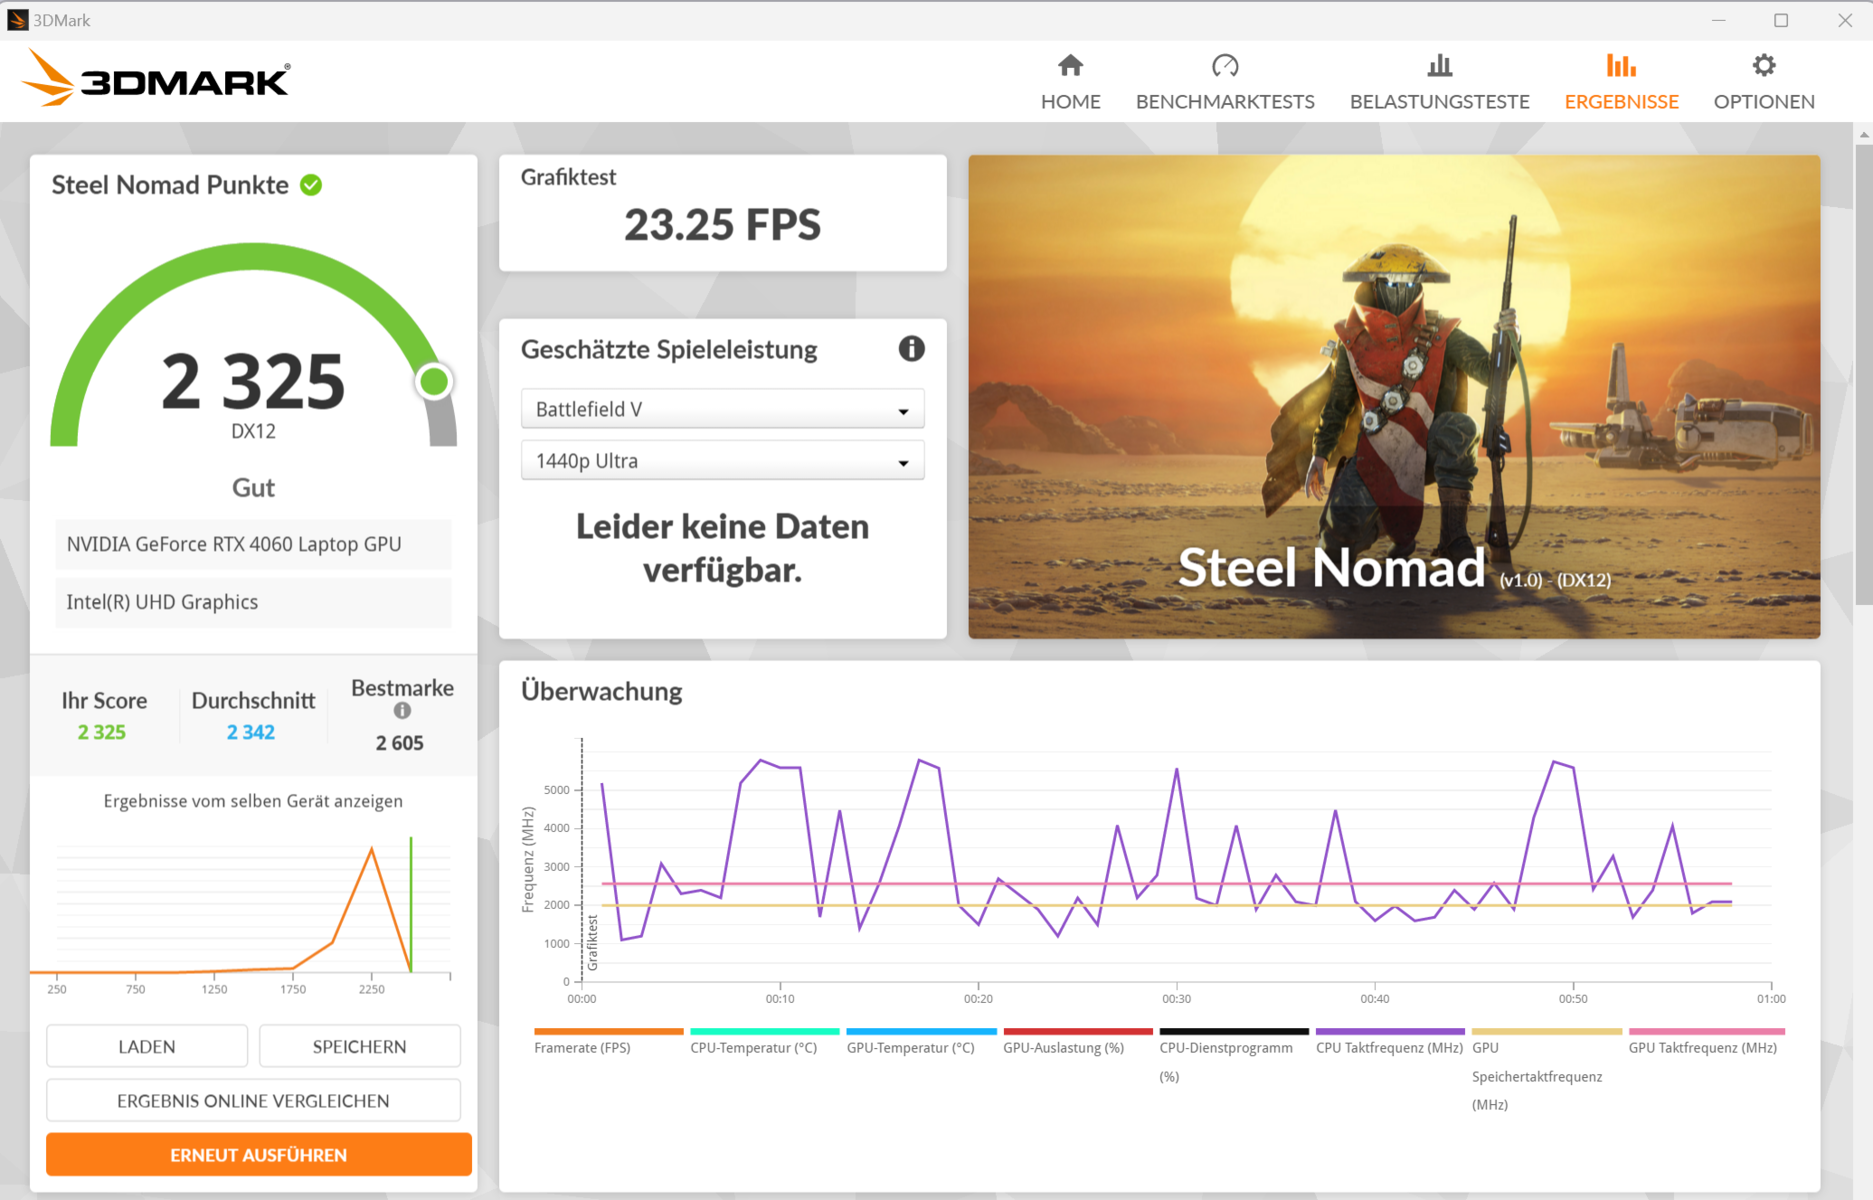
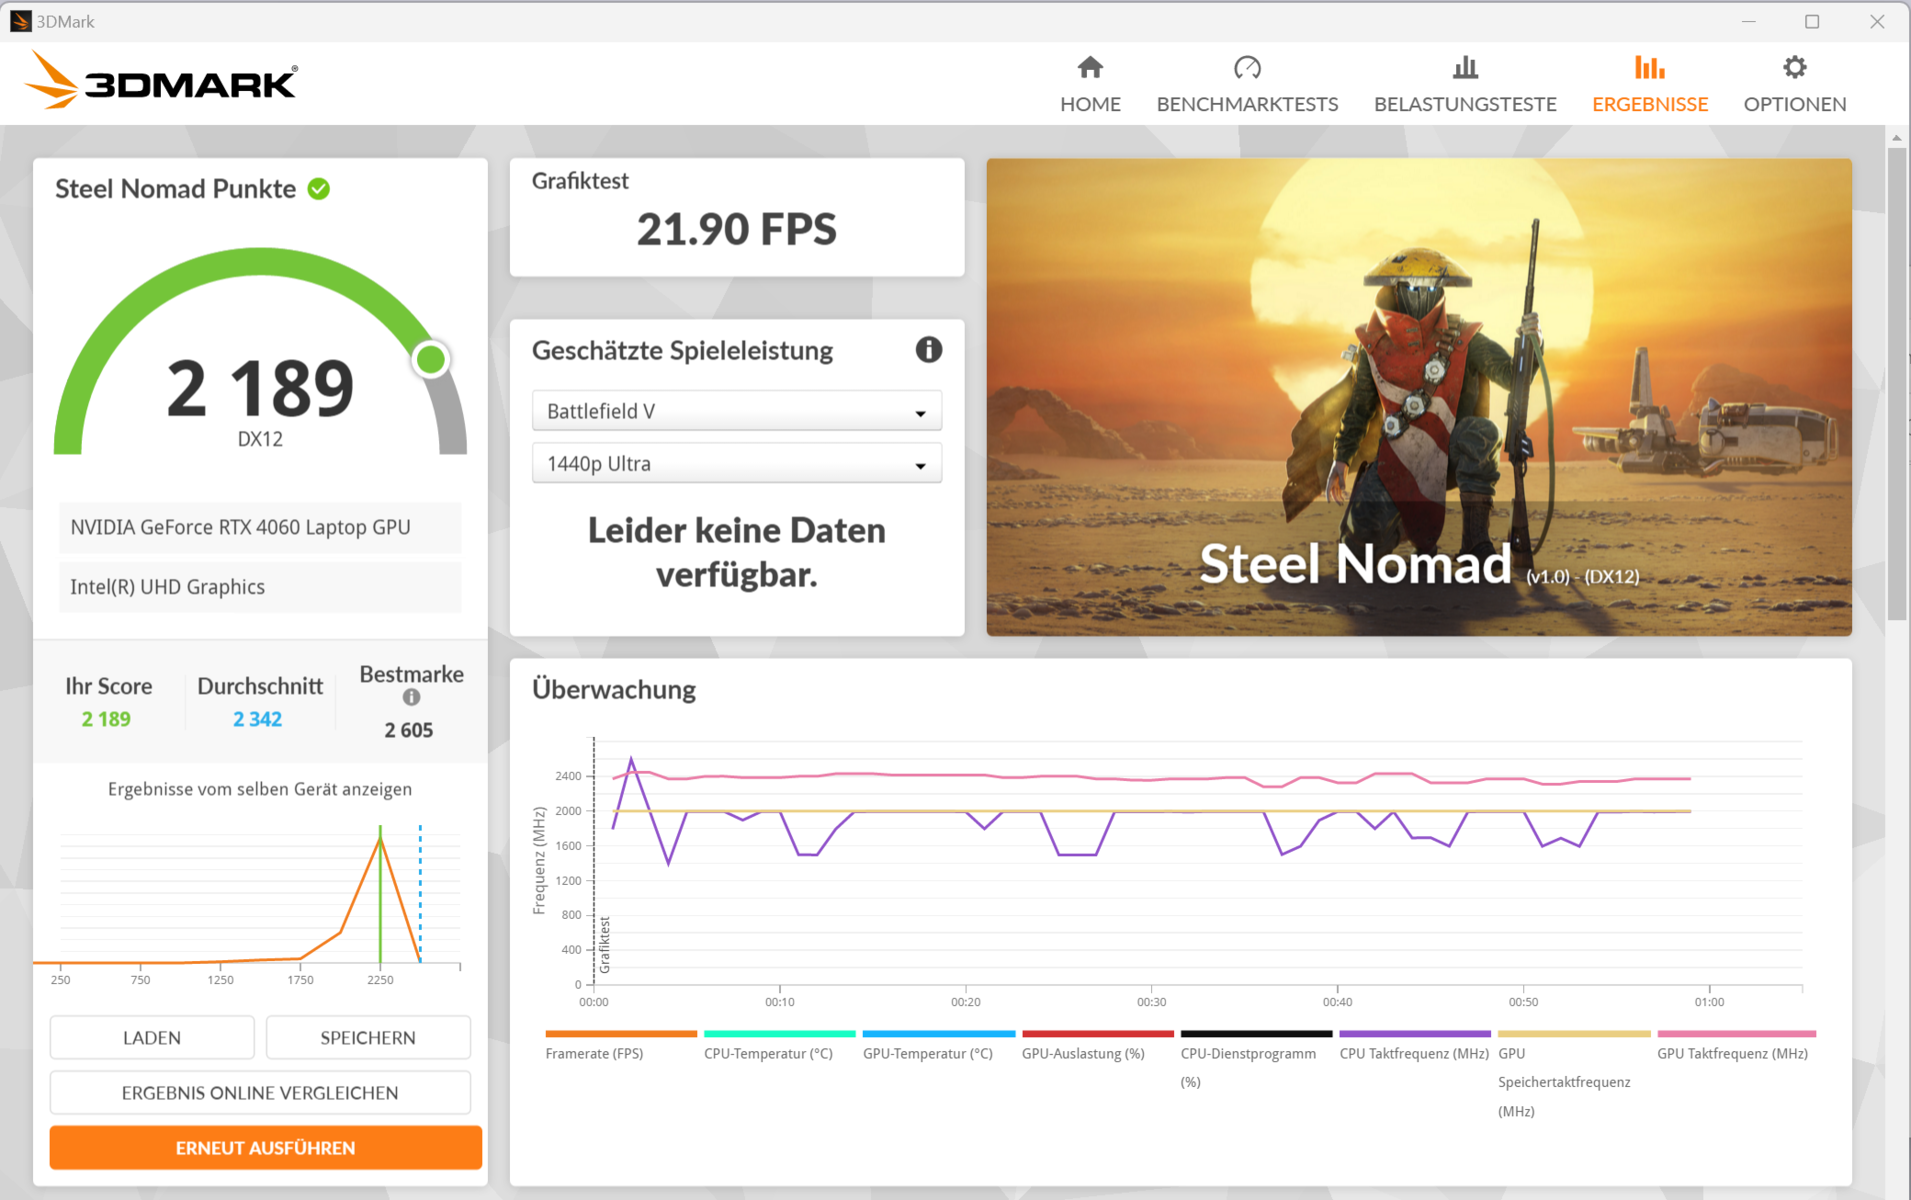
......(英文 GeForce RTX 4060(3,072个着色器、128位总线、8 GB GDDR6)是目前(较低端)的中档游戏 GPU。努比亚赋予它的最大 TGP 为 140 瓦--不可能更高。其基准测试结果略高于 RTX-4060 的平均水平(平衡模式)。游戏模式下没有增加。在 dGPU 和 Optimus 之间切换无需重启--支持高级 Optimus。

| 3DMark Performance Rating - Percent | |
| Acer Predator Helios Neo 16 (2024) | |
| Average of class Gaming | |
| SCHENKER XMG Pro 16 Studio (Mid 24) | |
| Lenovo Legion Pro 5 16IRX9 G9 | |
| Nubia RedMagic Titan 16 Pro | |
| Nubia RedMagic Titan 16 Pro | |
| Gigabyte G6X 9KG (2024) | |
| HP Victus 16 (2024) | |
| Average NVIDIA GeForce RTX 4060 Laptop GPU | |
| 3DMark 11 - 1280x720 Performance GPU | |
| Acer Predator Helios Neo 16 (2024) | |
| Average of class Gaming (10741 - 72178, n=143, last 2 years) | |
| SCHENKER XMG Pro 16 Studio (Mid 24) | |
| Lenovo Legion Pro 5 16IRX9 G9 | |
| Nubia RedMagic Titan 16 Pro (Gaming Mode) | |
| Nubia RedMagic Titan 16 Pro | |
| Gigabyte G6X 9KG (2024) | |
| HP Victus 16 (2024) | |
| Average NVIDIA GeForce RTX 4060 Laptop GPU (28136 - 38912, n=57) | |
| 3DMark | |
| 1920x1080 Fire Strike Graphics | |
| Acer Predator Helios Neo 16 (2024) | |
| Average of class Gaming (2913 - 56116, n=155, last 2 years) | |
| SCHENKER XMG Pro 16 Studio (Mid 24) | |
| Lenovo Legion Pro 5 16IRX9 G9 | |
| Gigabyte G6X 9KG (2024) | |
| HP Victus 16 (2024) | |
| Nubia RedMagic Titan 16 Pro (Gaming Mode) | |
| Nubia RedMagic Titan 16 Pro | |
| Average NVIDIA GeForce RTX 4060 Laptop GPU (20533 - 29656, n=54) | |
| 2560x1440 Time Spy Graphics | |
| Acer Predator Helios Neo 16 (2024) | |
| Average of class Gaming (2295 - 24599, n=151, last 2 years) | |
| SCHENKER XMG Pro 16 Studio (Mid 24) | |
| Lenovo Legion Pro 5 16IRX9 G9 | |
| Nubia RedMagic Titan 16 Pro (Gaming Mode) | |
| Nubia RedMagic Titan 16 Pro | |
| Average NVIDIA GeForce RTX 4060 Laptop GPU (7484 - 11451, n=56) | |
| HP Victus 16 (2024) | |
| Gigabyte G6X 9KG (2024) | |
| 3DMark 06 Standard Score | 55770 points | |
| 3DMark 11 Performance | 28427 points | |
| 3DMark Fire Strike Score | 22307 points | |
| 3DMark Time Spy Score | 10789 points | |
| 3DMark Steel Nomad Score | 2288 points | |
Help | ||
| Geekbench 6.4 | |
| GPU OpenCL | |
| Acer Predator Helios Neo 16 (2024) (6.2.1) | |
| Average of class Gaming (4321 - 234213, n=118, last 2 years) | |
| SCHENKER XMG Pro 16 Studio (Mid 24) (6.2.1) | |
| Nubia RedMagic Titan 16 Pro (6.2.1, Gaming Mode) | |
| Nubia RedMagic Titan 16 Pro (6.2.1) | |
| Gigabyte G6X 9KG (2024) (6.2.1) | |
| HP Victus 16 (2024) (6.2.1) | |
| Average NVIDIA GeForce RTX 4060 Laptop GPU (4321 - 100831, n=40) | |
| Lenovo Legion Pro 5 16IRX9 G9 (6.2.1) | |
| GPU Vulkan | |
| SCHENKER XMG Pro 16 Studio (Mid 24) (6.2.1) | |
| Nubia RedMagic Titan 16 Pro (6.2.1, Gaming Mode) | |
| Gigabyte G6X 9KG (2024) (6.2.1) | |
| Acer Predator Helios Neo 16 (2024) (6.2.1) | |
| HP Victus 16 (2024) (6.2.1) | |
| Average of class Gaming (4286 - 231659, n=110, last 2 years) | |
| Nubia RedMagic Titan 16 Pro (6.2.1) | |
| Lenovo Legion Pro 5 16IRX9 G9 (6.2.1) | |
| Average NVIDIA GeForce RTX 4060 Laptop GPU (4286 - 101001, n=36) | |
| V-Ray Benchmark Next 4.10 | |
| GPU | |
| Average of class Gaming (54 - 1317, n=122, last 2 years) | |
| Lenovo Legion Pro 5 16IRX9 G9 (v4.10.07 ) | |
| Acer Predator Helios Neo 16 (2024) (v4.10.07 ) | |
| Gigabyte G6X 9KG (2024) (v4.10.07 ) | |
| Nubia RedMagic Titan 16 Pro (v4.10.07 ) | |
| Nubia RedMagic Titan 16 Pro (v4.10.07, Gaming Mode ) | |
| Average NVIDIA GeForce RTX 4060 Laptop GPU (483 - 715, n=46) | |
| HP Victus 16 (2024) (v4.10.07 ) | |
| SCHENKER XMG Pro 16 Studio (Mid 24) (v4.10.07 ) | |
| CPU | |
| Nubia RedMagic Titan 16 Pro (v4.10.07, Gaming Mode) | |
| Lenovo Legion Pro 5 16IRX9 G9 (v4.10.07 ) | |
| SCHENKER XMG Pro 16 Studio (Mid 24) (v4.10.07 ) | |
| Acer Predator Helios Neo 16 (2024) (v4.10.07 ) | |
| HP Victus 16 (2024) (v4.10.07 ) | |
| Average of class Gaming (5413 - 44129, n=122, last 2 years) | |
| Average NVIDIA GeForce RTX 4060 Laptop GPU (12680 - 32360, n=46) | |
| Gigabyte G6X 9KG (2024) (v4.10.07 ) | |
| Nubia RedMagic Titan 16 Pro (v4.10.07 ) | |
* ... smaller is better
游戏性能
泰坦专为高至最高设置下的 QHD 游戏而设计。所安装的硬件产生的帧率略高于 RTX 4060 的平均水平(平衡模式)。在游戏模式下,CPU 性能较高的游戏(如《Dota 2 Reborn》和《X-Plane 11》)的帧率会有所提高。其他方面的图形性能完全相同。
| Cyberpunk 2077 2.2 Phantom Liberty - 1920x1080 Ultra Preset (FSR off) | |
| Average of class Gaming (6.76 - 158, n=90, last 2 years) | |
| Acer Predator Helios Neo 16 (2024) (2.02) | |
| SCHENKER XMG Pro 16 Studio (Mid 24) (2.12) | |
| Lenovo Legion Pro 5 16IRX9 G9 (2.12) | |
| Nubia RedMagic Titan 16 Pro (2.12, Gaming Mode) | |
| Nubia RedMagic Titan 16 Pro (2.12) | |
| Average NVIDIA GeForce RTX 4060 Laptop GPU (56.4 - 93.1, n=31) | |
| Gigabyte G6X 9KG (2024) (2.02) | |
| HP Victus 16 (2024) (2.02) | |
| Final Fantasy XV Benchmark - 1920x1080 High Quality | |
| Acer Predator Helios Neo 16 (2024) (1.3) | |
| SCHENKER XMG Pro 16 Studio (Mid 24) (1.3) | |
| Average of class Gaming (19.2 - 201, n=144, last 2 years) | |
| Lenovo Legion Pro 5 16IRX9 G9 (1.3) | |
| Nubia RedMagic Titan 16 Pro (1.3) | |
| Nubia RedMagic Titan 16 Pro (1.3, Gaming Mode ) | |
| Gigabyte G6X 9KG (2024) (1.3) | |
| HP Victus 16 (2024) (1.3) | |
| Average NVIDIA GeForce RTX 4060 Laptop GPU (75.1 - 109.8, n=51) | |
| Strange Brigade - 1920x1080 ultra AA:ultra AF:16 | |
| Average of class Gaming (38.9 - 420, n=140, last 2 years) | |
| Acer Predator Helios Neo 16 (2024) (1.47.22.14 D3D12) | |
| SCHENKER XMG Pro 16 Studio (Mid 24) (1.47.22.14 D3D12) | |
| Lenovo Legion Pro 5 16IRX9 G9 (1.47.22.14 D3D12) | |
| Nubia RedMagic Titan 16 Pro (1.47.22.14 D3D12, Gaming Mode ) | |
| Nubia RedMagic Titan 16 Pro (1.47.22.14 D3D12) | |
| Gigabyte G6X 9KG (2024) (1.47.22.14 D3D12) | |
| Average NVIDIA GeForce RTX 4060 Laptop GPU (135.3 - 210, n=50) | |
| HP Victus 16 (2024) (1.47.22.14 D3D12) | |
| Dota 2 Reborn - 1920x1080 ultra (3/3) best looking | |
| Lenovo Legion Pro 5 16IRX9 G9 | |
| Acer Predator Helios Neo 16 (2024) | |
| Nubia RedMagic Titan 16 Pro (Gaming Mode) | |
| SCHENKER XMG Pro 16 Studio (Mid 24) | |
| HP Victus 16 (2024) | |
| Average of class Gaming (65.1 - 220, n=148, last 2 years) | |
| Nubia RedMagic Titan 16 Pro | |
| Average NVIDIA GeForce RTX 4060 Laptop GPU (115 - 183.8, n=53) | |
| Gigabyte G6X 9KG (2024) | |
| X-Plane 11.11 - 1920x1080 high (fps_test=3) | |
| Nubia RedMagic Titan 16 Pro (Gaming Mode) | |
| Lenovo Legion Pro 5 16IRX9 G9 | |
| Acer Predator Helios Neo 16 (2024) | |
| SCHENKER XMG Pro 16 Studio (Mid 24) | |
| Nubia RedMagic Titan 16 Pro | |
| Gigabyte G6X 9KG (2024) | |
| Average of class Gaming (32.8 - 166.2, n=151, last 2 years) | |
| Average NVIDIA GeForce RTX 4060 Laptop GPU (60.7 - 141.1, n=54) | |
| HP Victus 16 (2024) | |
| Once Human | |
| 1920x1080 Very High Preset | |
| Nubia RedMagic Titan 16 Pro | |
| Average NVIDIA GeForce RTX 4060 Laptop GPU (88.7 - 94.2, n=2) | |
| Average of class Gaming (14.2 - 94.2, n=2, last 2 years) | |
| 2560x1440 Very High Preset | |
| Nubia RedMagic Titan 16 Pro | |
| Average of class Gaming (n=1last 2 years) | |
| Average NVIDIA GeForce RTX 4060 Laptop GPU (59.1 - 62.3, n=2) | |
| 2560x1440 Very High Preset + Quality FSR | |
| Nubia RedMagic Titan 16 Pro | |
| Average NVIDIA GeForce RTX 4060 Laptop GPU (n=1) | |
| Average of class Gaming (n=1last 2 years) | |
| F1 24 | |
| 1920x1080 Ultra High Preset AA:T AF:16x | |
| Average of class Gaming (54.1 - 148, n=19, last 2 years) | |
| SCHENKER XMG Pro 16 Studio (Mid 24) | |
| Lenovo Legion Pro 5 16IRX9 G9 | |
| Nubia RedMagic Titan 16 Pro | |
| Average NVIDIA GeForce RTX 4060 Laptop GPU (47.5 - 61.6, n=10) | |
| 2560x1440 Ultra High Preset AA:T AF:16x | |
| Average of class Gaming (36.7 - 100, n=16, last 2 years) | |
| SCHENKER XMG Pro 16 Studio (Mid 24) | |
| Nubia RedMagic Titan 16 Pro | |
| Average NVIDIA GeForce RTX 4060 Laptop GPU (24.3 - 38.8, n=6) | |
| 2560x1440 Ultra High Preset + Quality DLSS AF:16x | |
| Average of class Gaming (59.2 - 150.4, n=12, last 2 years) | |
| SCHENKER XMG Pro 16 Studio (Mid 24) | |
| Nubia RedMagic Titan 16 Pro | |
| Average NVIDIA GeForce RTX 4060 Laptop GPU (48.6 - 61, n=3) | |
| Ghost of Tsushima | |
| 1920x1080 Very High Preset AA:T | |
| SCHENKER XMG Pro 16 Studio (Mid 24) | |
| Nubia RedMagic Titan 16 Pro | |
| Average NVIDIA GeForce RTX 4060 Laptop GPU (55.6 - 63.4, n=5) | |
| Average of class Gaming (28.5 - 73.7, n=7, last 2 years) | |
| 2560x1440 Very High Preset AA:T | |
| SCHENKER XMG Pro 16 Studio (Mid 24) | |
| Nubia RedMagic Titan 16 Pro | |
| Average NVIDIA GeForce RTX 4060 Laptop GPU (41.1 - 47.7, n=3) | |
| Average of class Gaming (22.7 - 56.1, n=5, last 2 years) | |
| 2560x1440 Very High Preset + Quality DLSS | |
| SCHENKER XMG Pro 16 Studio (Mid 24) | |
| Average of class Gaming (63.6 - 74.2, n=3, last 2 years) | |
| Nubia RedMagic Titan 16 Pro | |
| Average NVIDIA GeForce RTX 4060 Laptop GPU (n=1) | |
| The First Descendant | |
| 1920x1080 Ultra Preset | |
| SCHENKER XMG Pro 16 Studio (Mid 24) | |
| Nubia RedMagic Titan 16 Pro | |
| Average NVIDIA GeForce RTX 4060 Laptop GPU (67.6 - 69.4, n=3) | |
| Average of class Gaming (15.4 - 80, n=5, last 2 years) | |
| 2560x1440 Ultra Preset | |
| SCHENKER XMG Pro 16 Studio (Mid 24) | |
| Average of class Gaming (43.7 - 51.2, n=3, last 2 years) | |
| Nubia RedMagic Titan 16 Pro | |
| Average NVIDIA GeForce RTX 4060 Laptop GPU (43.5 - 43.7, n=2) | |
| 2560x1440 Ultra Preset + Ultra Ray Tracing + DLSS Quality | |
| SCHENKER XMG Pro 16 Studio (Mid 24) | |
| Average of class Gaming (43.3 - 51.8, n=2, last 2 years) | |
| Nubia RedMagic Titan 16 Pro | |
| Average NVIDIA GeForce RTX 4060 Laptop GPU (n=1) | |
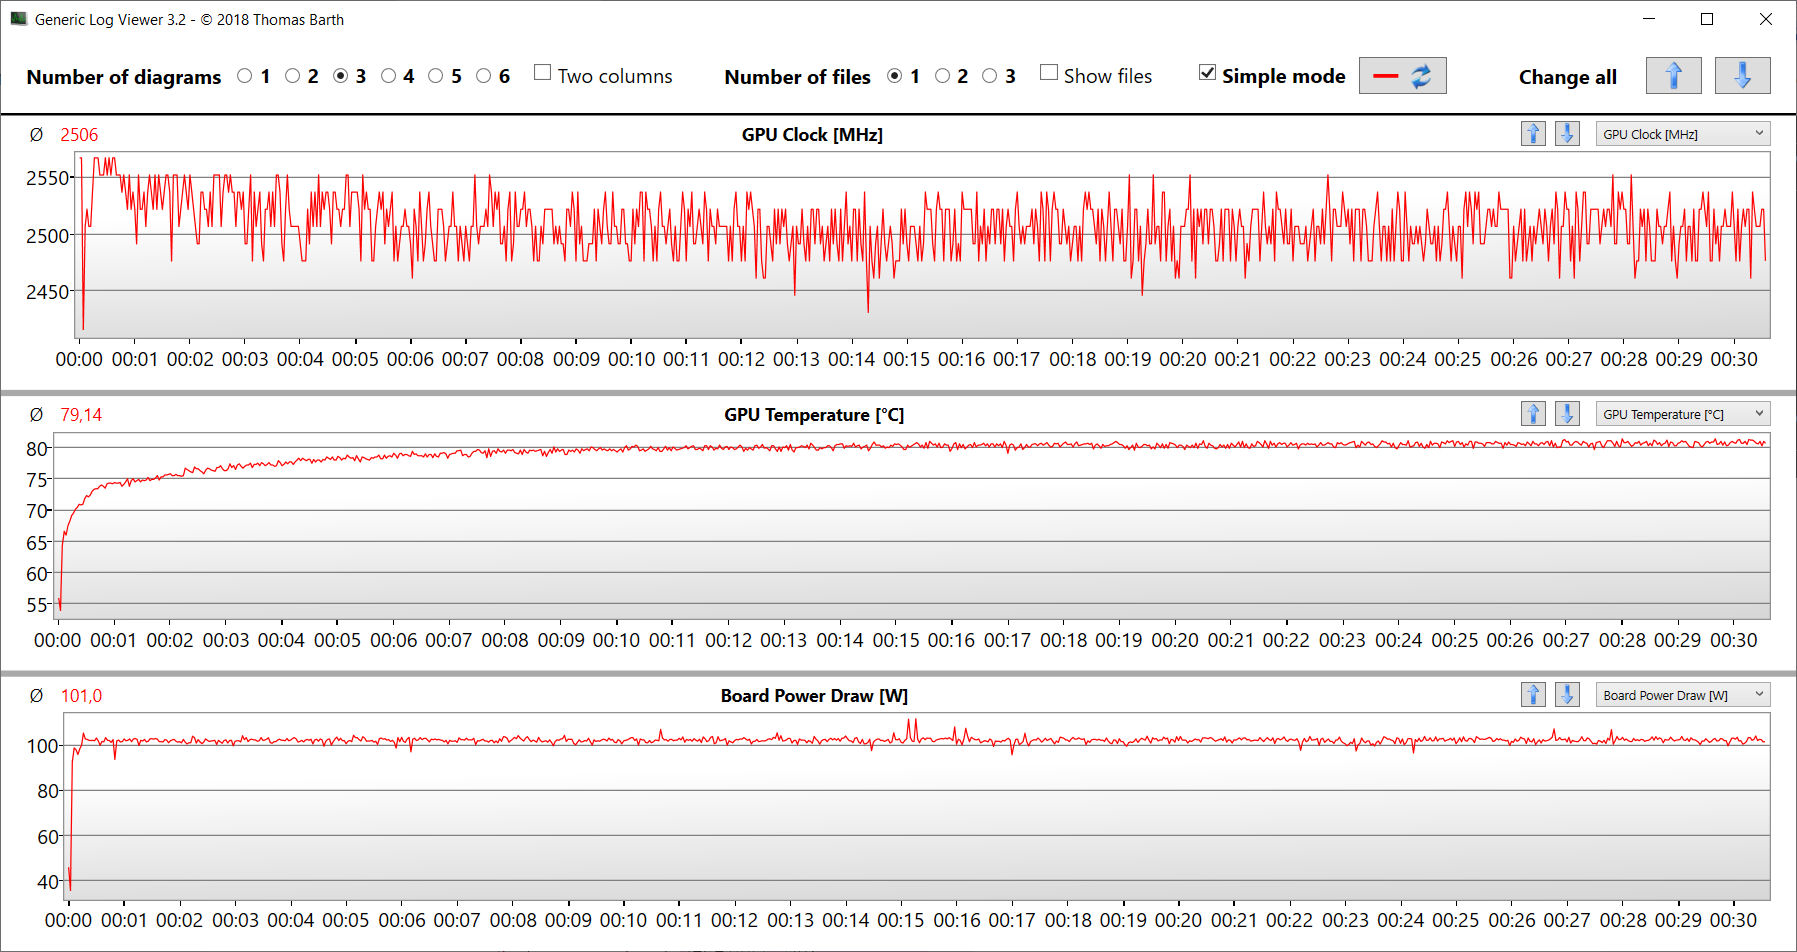
赛博朋克 2077》(Cyberpunk 2077 Phantom Liberty)在我们 30 分钟的测试中(最高设置,FHD),帧率略有波动,但相当稳定。我们没有发现明显的性能下降。
Cyberpunk 2077 ultra FPS diagram
| low | med. | high | ultra | QHD DLSS | QHD FSR | QHD | |
|---|---|---|---|---|---|---|---|
| GTA V (2015) | 186.1 | 184 | 177.7 | 118.4 | 89.3 | ||
| Dota 2 Reborn (2015) | 206 | 170.9 | 160.2 | 146.9 | |||
| Final Fantasy XV Benchmark (2018) | 199.7 | 146 | 105.4 | 76.9 | |||
| X-Plane 11.11 (2018) | 167 | 142.8 | 117.2 | ||||
| Strange Brigade (2018) | 480 | 277 | 219 | 189.2 | 126.9 | ||
| Baldur's Gate 3 (2023) | 140.3 | 110.8 | 97.5 | 96.5 | 65.9 | ||
| Cyberpunk 2077 2.2 Phantom Liberty (2023) | 121.4 | 101.1 | 86.2 | 74.7 | 46.9 | ||
| Dragon's Dogma 2 (2024) | 71.9 | 67.7 | 52.9 | ||||
| Ghost of Tsushima (2024) | 91.3 | 86.8 | 78.2 | 63.4 | 63.6 | 47.7 | |
| F1 24 (2024) | 243 | 225 | 175.8 | 58.8 | 36.7 | ||
| The First Descendant (2024) | 159 | 100.9 | 80.6 | 69.4 | 43.7 | ||
| Once Human (2024) | 164.8 | 132.9 | 108.3 | 94.2 | 76.5 | 62.3 |
排放 - 太吵、太热
噪音排放
Titan 绝不是一台运行安静的笔记本电脑。即使在空闲模式下,两个风扇也能持续发出声音。赛博朋克》模式下的噪音值高达 50 dB(A)(平衡模式),而游戏模式下则高达 53 dB(A)。办公模式下的噪音值仅为 47 dB(A),略微适中。风扇在电池模式下较为安静,偶尔会静止不动。
Noise Level
| Idle |
| 35 / 36 / 40 dB(A) |
| Load |
| 49 / 52 dB(A) |
 | ||
30 dB silent 40 dB(A) audible 50 dB(A) loud |
||
min: | ||
| Nubia RedMagic Titan 16 Pro NVIDIA GeForce RTX 4060 Laptop GPU, i9-14900HX, Samsung PM9A1 MZVL21T0HCLR | Lenovo Legion Pro 5 16IRX9 G9 NVIDIA GeForce RTX 4060 Laptop GPU, i7-14700HX, Samsung PM9A1 MZVL21T0HCLR | HP Victus 16 (2024) NVIDIA GeForce RTX 4060 Laptop GPU, i7-14700HX, Kioxia XG8 KXG80ZNV512G | Acer Predator Helios Neo 16 (2024) NVIDIA GeForce RTX 4070 Laptop GPU, i7-14700HX, Samsung PM9A1a MZVL21T0HDLU | SCHENKER XMG Pro 16 Studio (Mid 24) NVIDIA GeForce RTX 4070 Laptop GPU, i9-14900HX, Samsung 990 Pro 1 TB | Gigabyte G6X 9KG (2024) NVIDIA GeForce RTX 4060 Laptop GPU, i7-13650HX, Gigabyte AG450E1024-SI | |
|---|---|---|---|---|---|---|
| Noise | 17% | 13% | 10% | 5% | 5% | |
| off / environment * | 26 | 23 12% | 25 4% | 25.2 3% | 25 4% | 26 -0% |
| Idle Minimum * | 35 | 23 34% | 28 20% | 27.8 21% | 28 20% | 30 14% |
| Idle Average * | 36 | 23 36% | 29 19% | 32 11% | 31 14% | 32 11% |
| Idle Maximum * | 40 | 25 37% | 33 17% | 29.6 26% | 35 12% | 35 12% |
| Load Average * | 49 | 45.18 8% | 45 8% | 45.2 8% | 52 -6% | 51 -4% |
| Cyberpunk 2077 ultra * | 50 | 52.69 -5% | 53 -6% | |||
| Load Maximum * | 52 | 53.13 -2% | 48 8% | 55.8 -7% | 52 -0% | 54 -4% |
| Witcher 3 ultra * | 43 | 51 |
* ... smaller is better
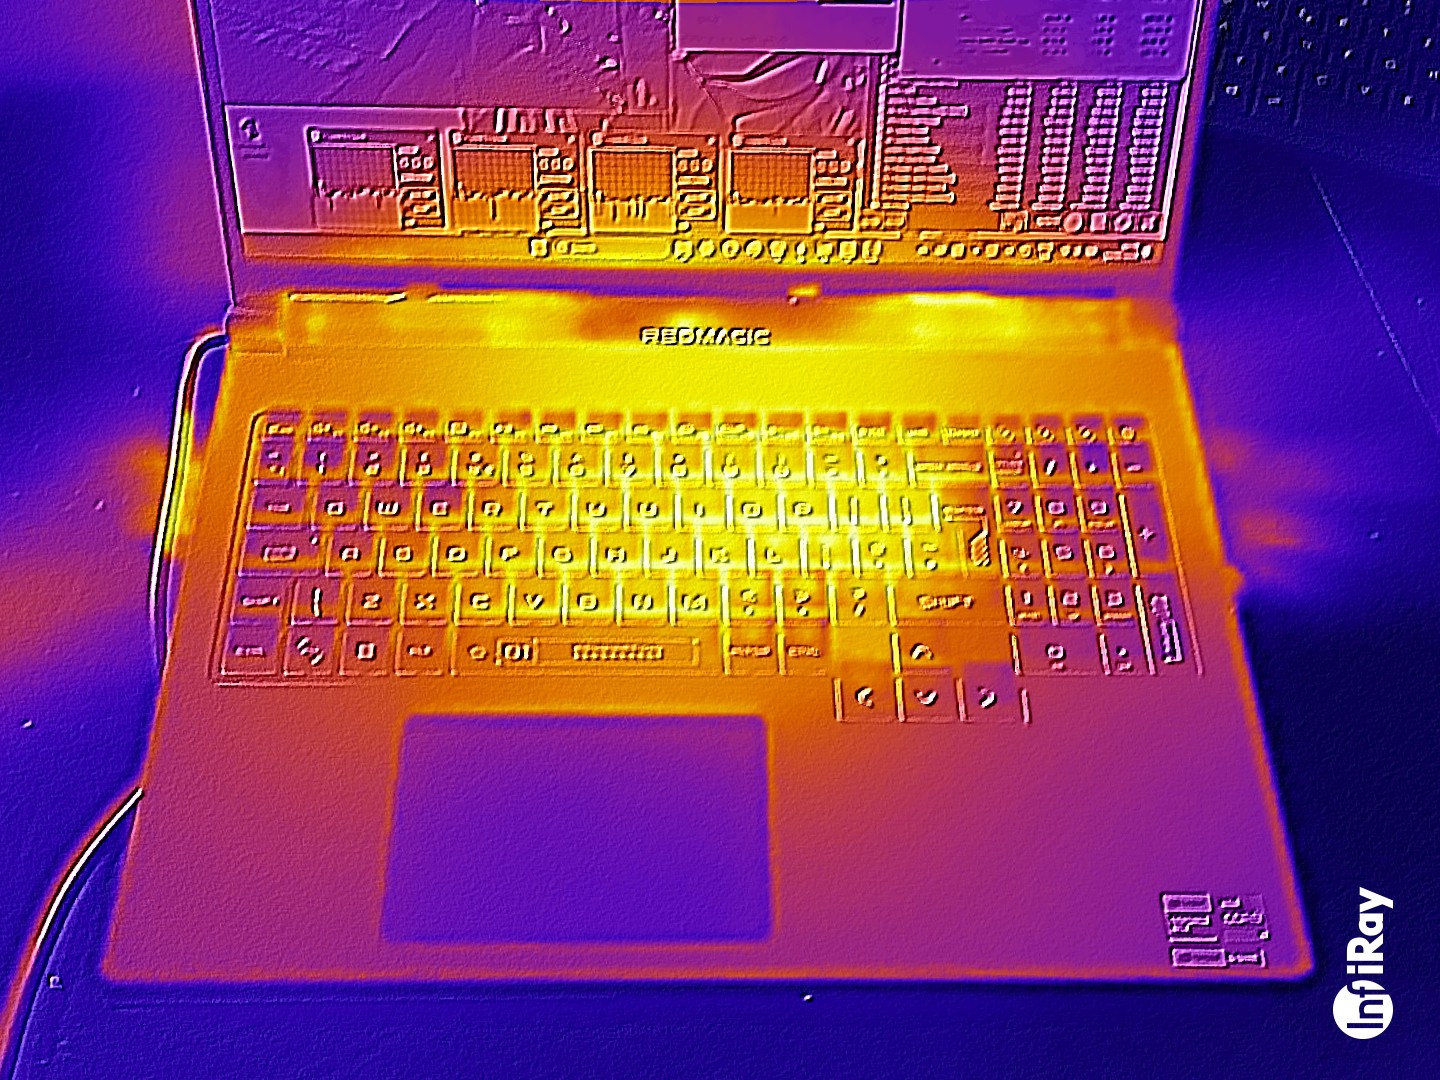
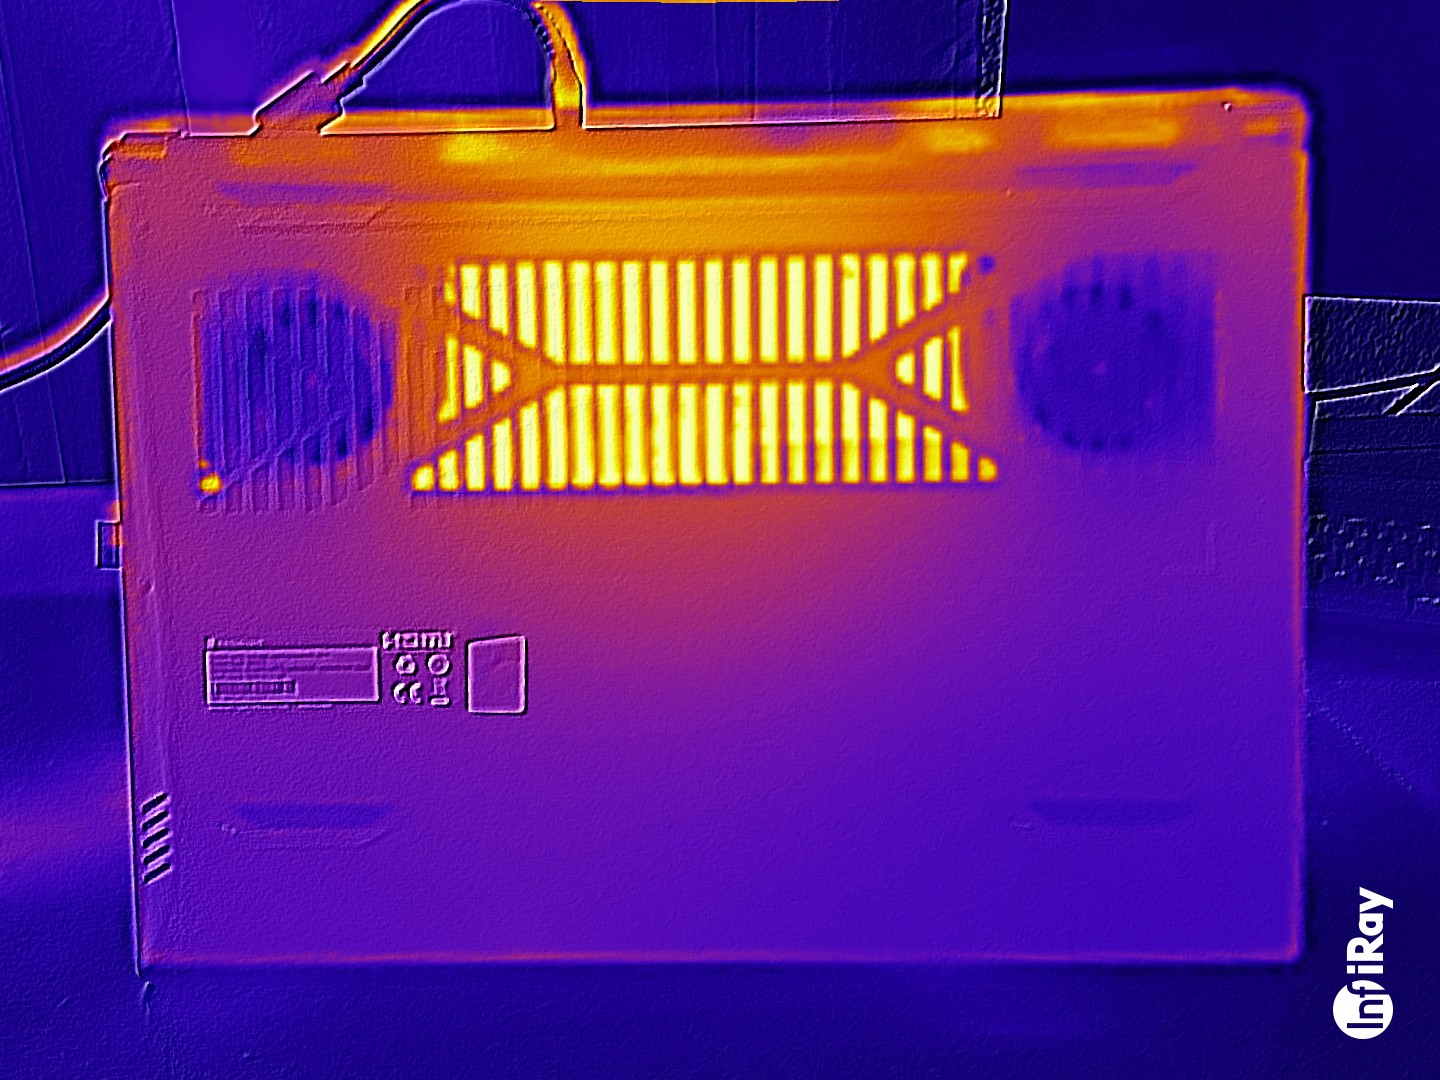
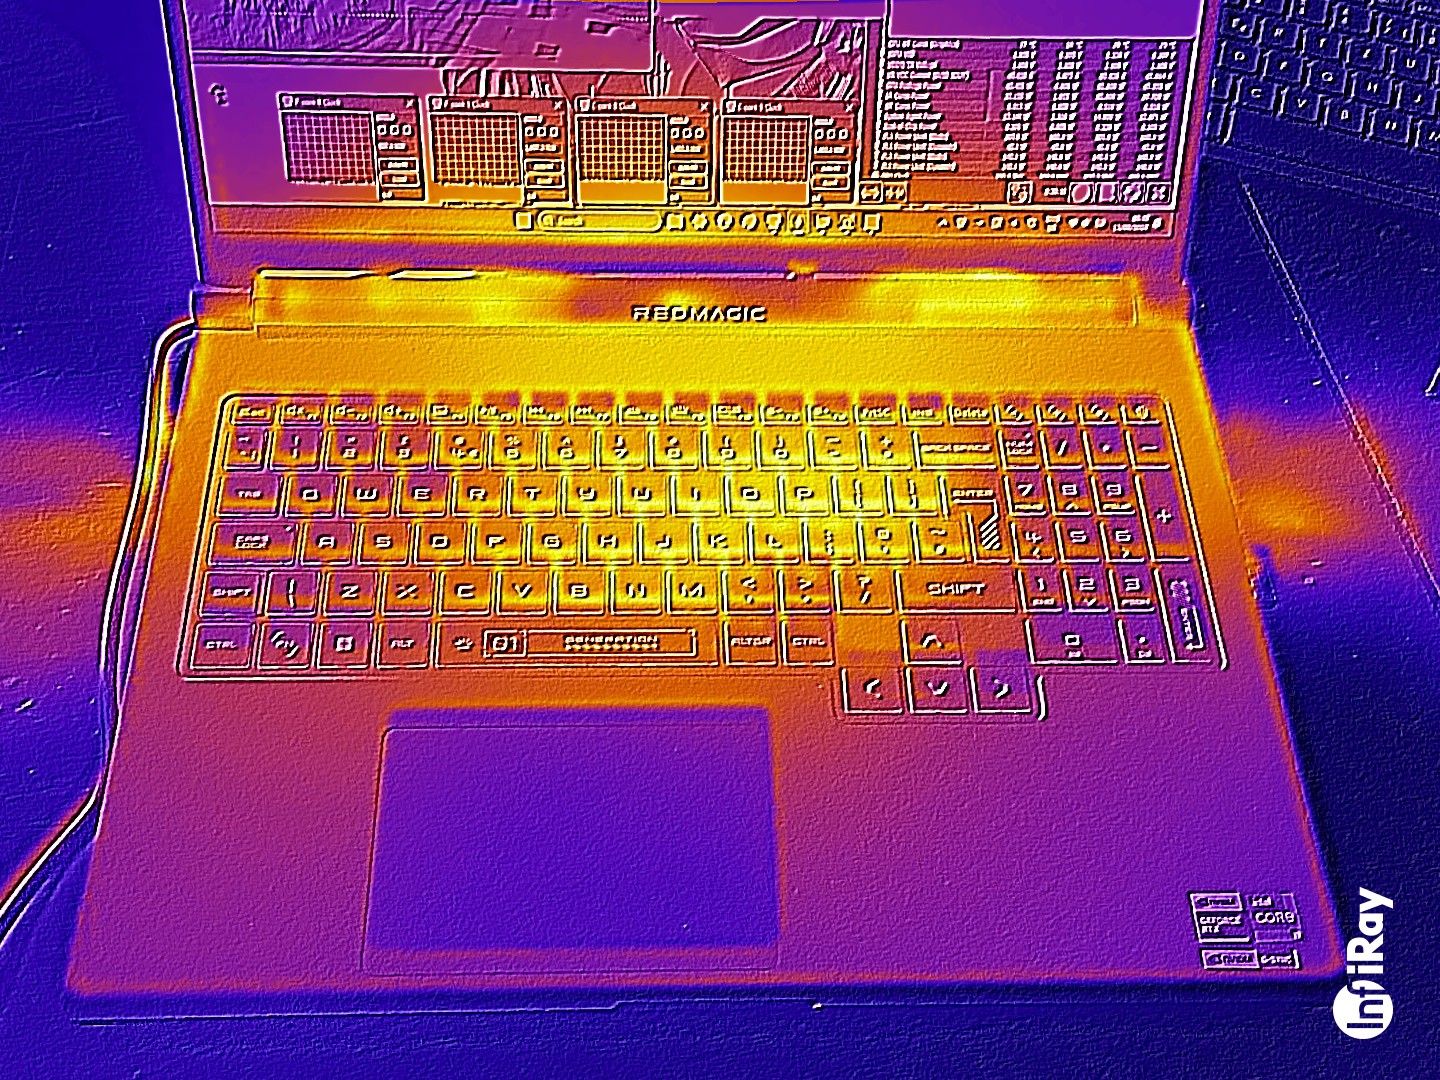
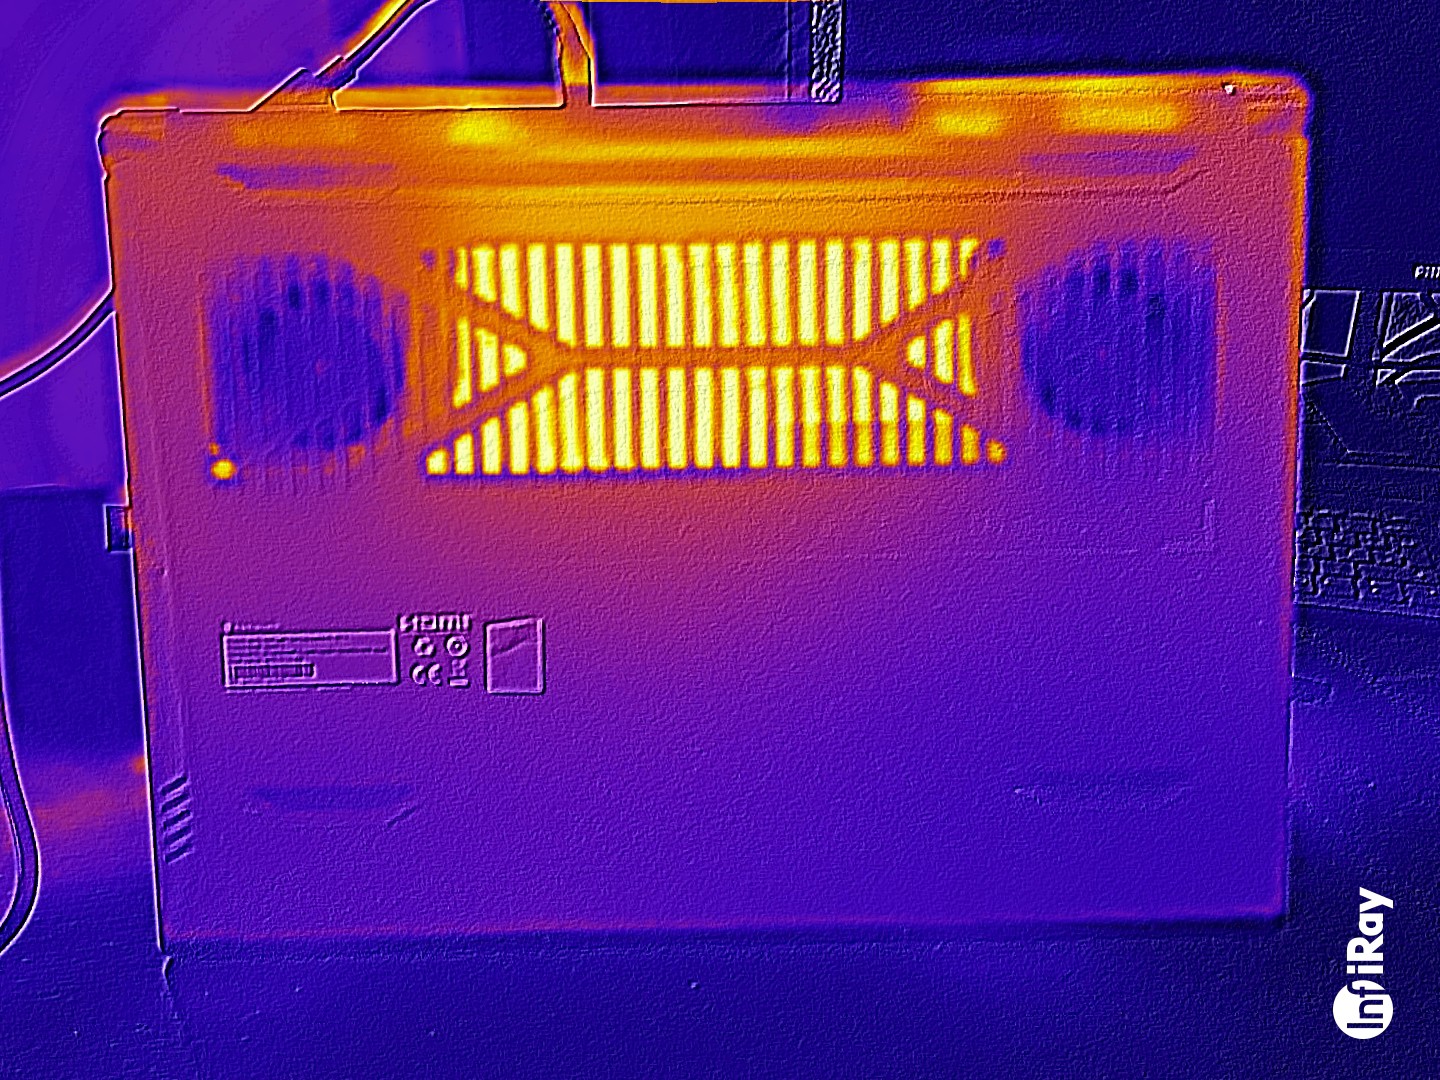
温度
在负载情况下,笔记本电脑会明显发热:赛博朋克 2077》和压力测试在某些情况下会导致温度超过 50 摄氏度。掌托的温度有时几乎过高。我们还注意到在空闲模式下的温度高于平均值。
(-) The maximum temperature on the upper side is 50 °C / 122 F, compared to the average of 40.4 °C / 105 F, ranging from 21.2 to 68.8 °C for the class Gaming.
(-) The bottom heats up to a maximum of 58 °C / 136 F, compared to the average of 43.2 °C / 110 F
(+) In idle usage, the average temperature for the upper side is 30.4 °C / 87 F, compared to the device average of 33.9 °C / 93 F.
(-) 3: The average temperature for the upper side is 45.1 °C / 113 F, compared to the average of 33.9 °C / 93 F for the class Gaming.
(-) The palmrests and touchpad can get very hot to the touch with a maximum of 40 °C / 104 F.
(-) The average temperature of the palmrest area of similar devices was 28.9 °C / 84 F (-11.1 °C / -20 F).
| Nubia RedMagic Titan 16 Pro Intel Core i9-14900HX, NVIDIA GeForce RTX 4060 Laptop GPU | Lenovo Legion Pro 5 16IRX9 G9 Intel Core i7-14700HX, NVIDIA GeForce RTX 4060 Laptop GPU | HP Victus 16 (2024) Intel Core i7-14700HX, NVIDIA GeForce RTX 4060 Laptop GPU | Acer Predator Helios Neo 16 (2024) Intel Core i7-14700HX, NVIDIA GeForce RTX 4070 Laptop GPU | SCHENKER XMG Pro 16 Studio (Mid 24) Intel Core i9-14900HX, NVIDIA GeForce RTX 4070 Laptop GPU | Gigabyte G6X 9KG (2024) Intel Core i7-13650HX, NVIDIA GeForce RTX 4060 Laptop GPU | |
|---|---|---|---|---|---|---|
| Heat | -9% | 13% | -3% | -13% | 6% | |
| Maximum Upper Side * | 50 | 50 -0% | 50 -0% | 58 -16% | 51 -2% | 41 18% |
| Maximum Bottom * | 58 | 57 2% | 50 14% | 45.2 22% | 66 -14% | 43 26% |
| Idle Upper Side * | 31 | 36 -16% | 25 19% | 31.1 -0% | 35 -13% | 32 -3% |
| Idle Bottom * | 32 | 39 -22% | 26 19% | 37.2 -16% | 39 -22% | 37 -16% |
* ... smaller is better
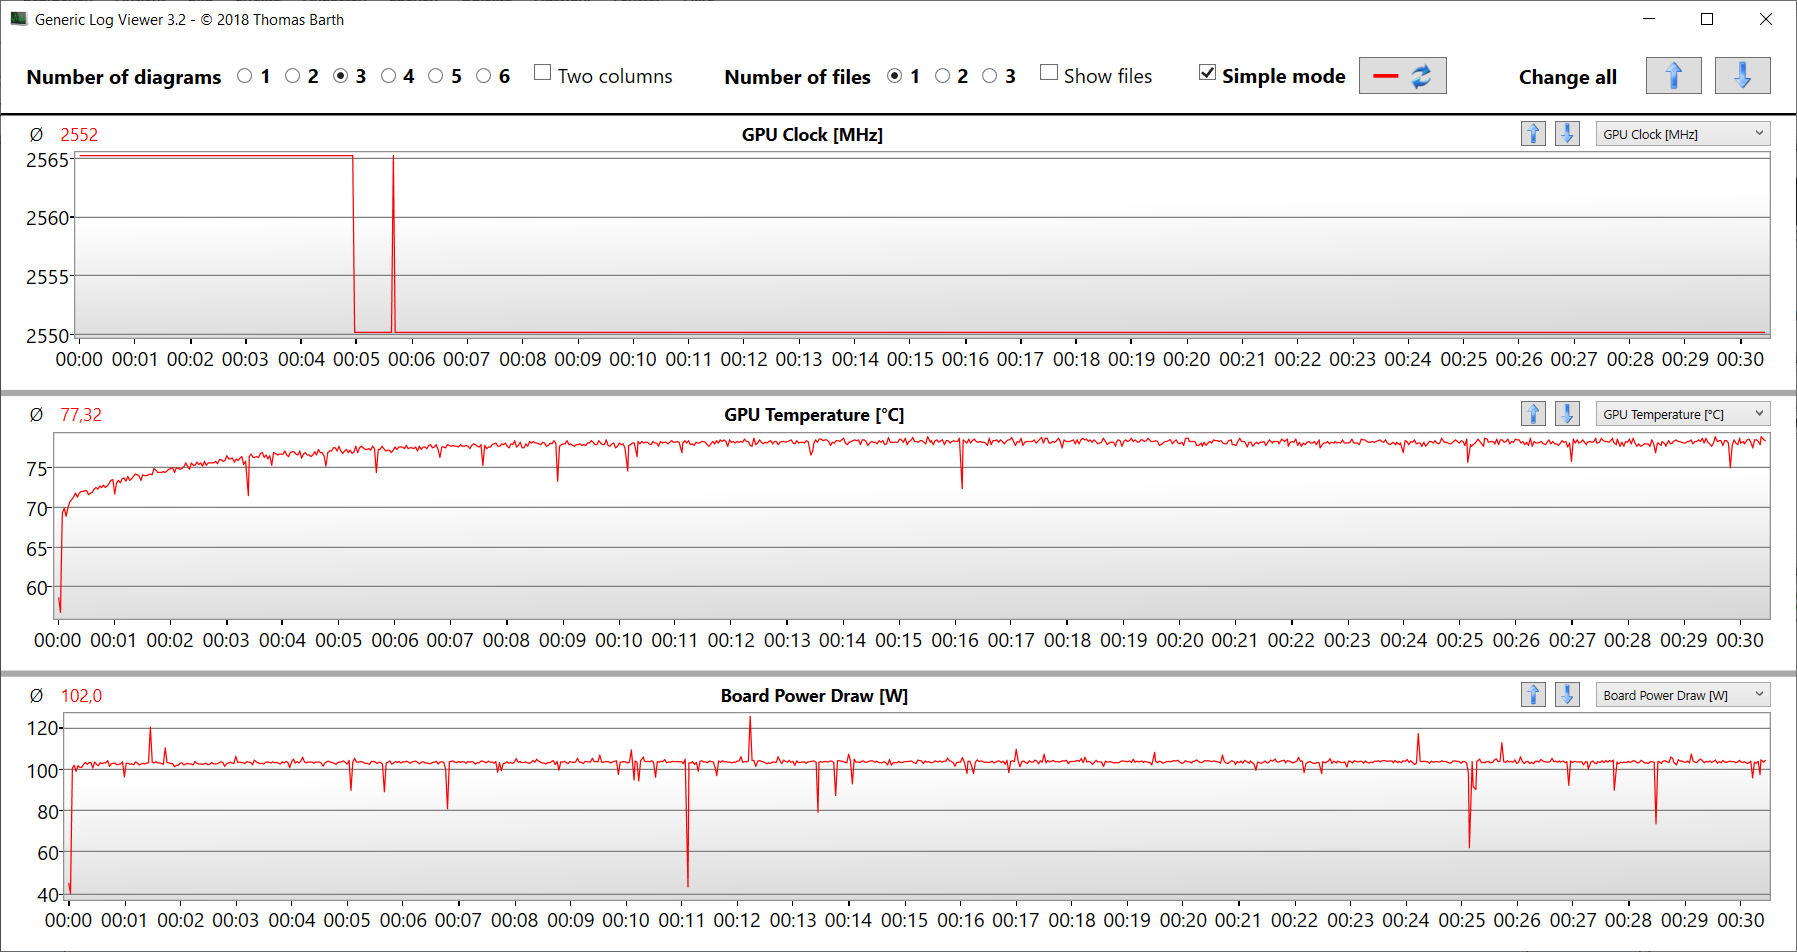
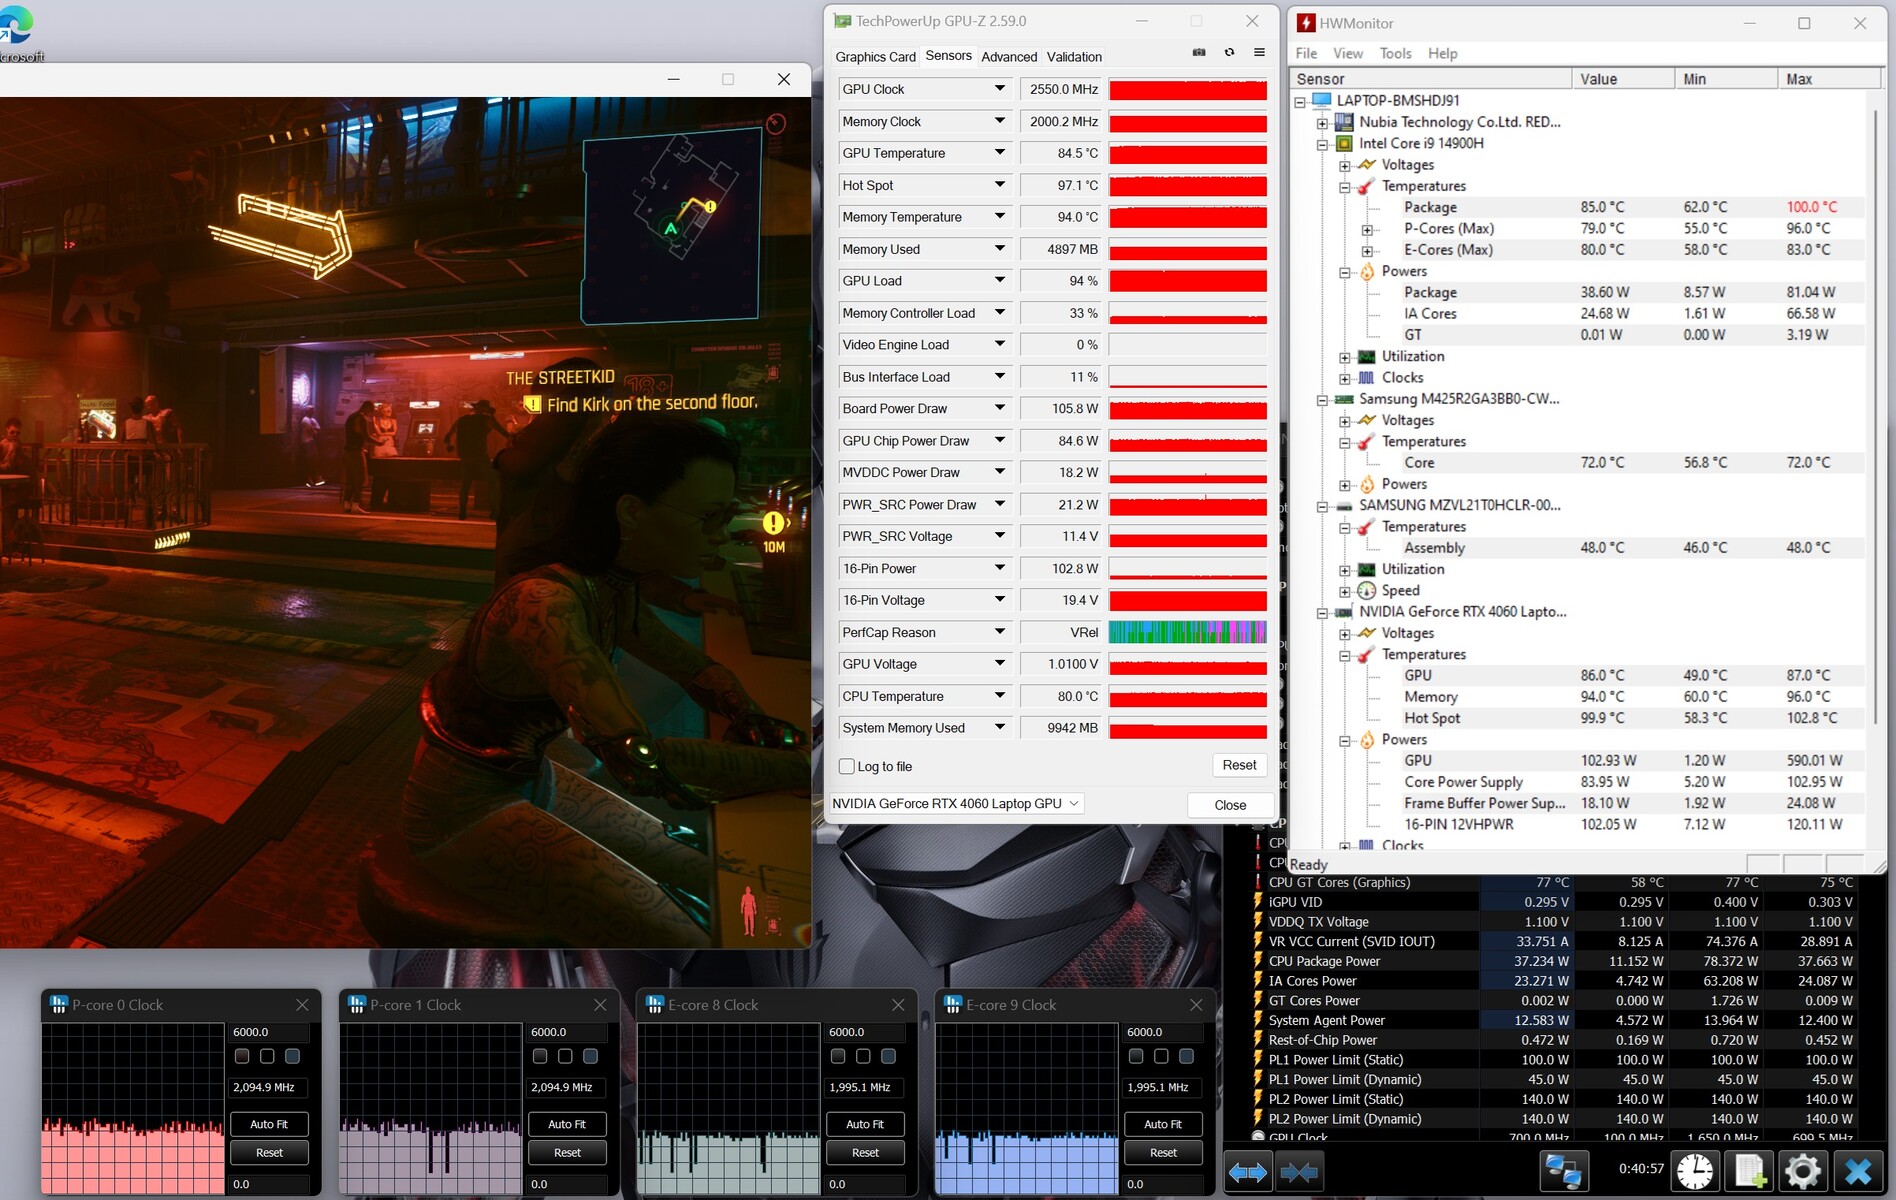
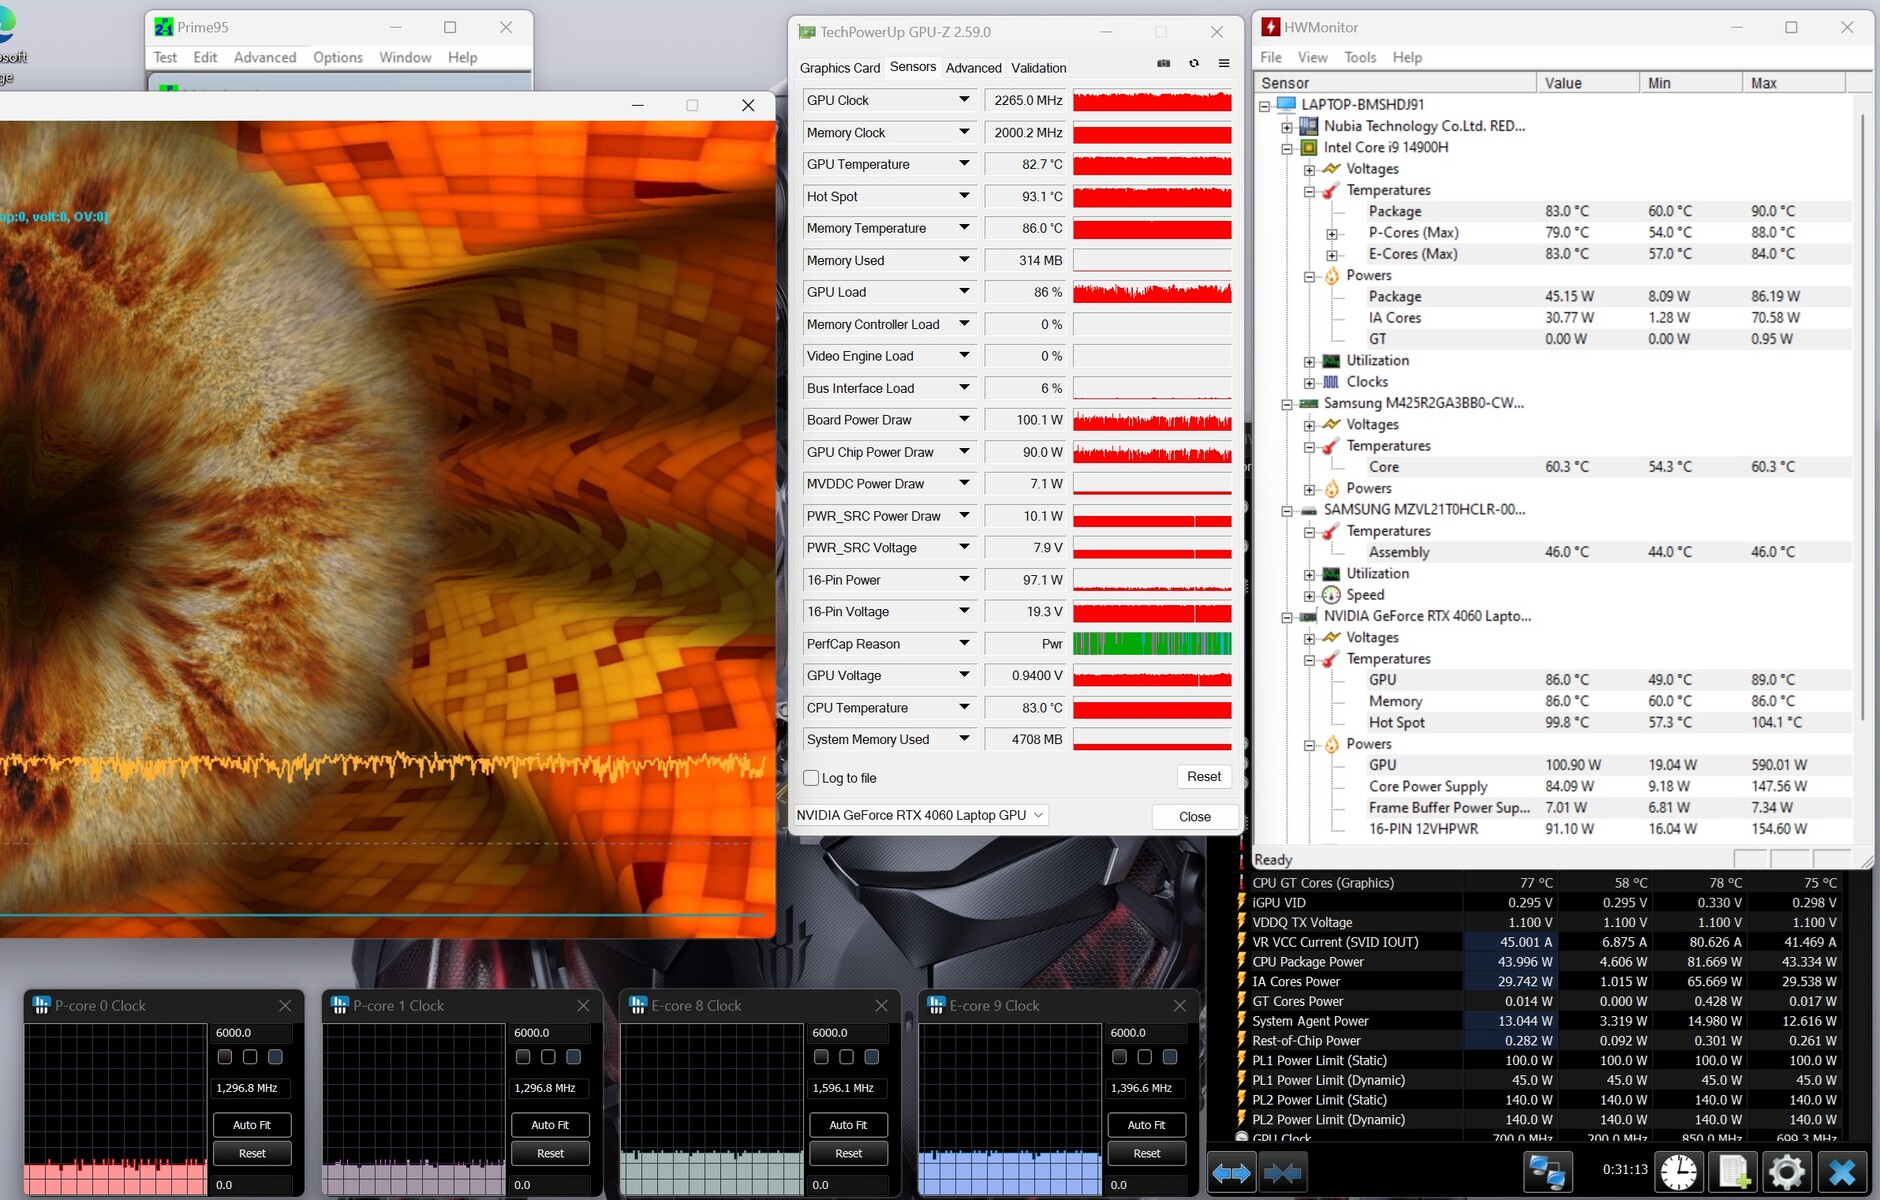
压力测试
极限压力测试(Prime95 和 Furmark 连续运行)检验了系统在满负荷情况下的稳定性。测试开始时,CPU 运行在高时钟频率下,但随后被节流到低于 2 GHz 的值。图形处理器以全功率运行。
发言人
立体声扬声器发出的声音整体上相当不错。低音还可以再明显一些。
Nubia RedMagic Titan 16 Pro audio analysis
(+) | speakers can play relatively loud (84 dB)
Bass 100 - 315 Hz
(±) | reduced bass - on average 14.3% lower than median
(±) | linearity of bass is average (11.3% delta to prev. frequency)
Mids 400 - 2000 Hz
(+) | balanced mids - only 1.8% away from median
(+) | mids are linear (4.9% delta to prev. frequency)
Highs 2 - 16 kHz
(+) | balanced highs - only 2.7% away from median
(+) | highs are linear (5.4% delta to prev. frequency)
Overall 100 - 16.000 Hz
(+) | overall sound is linear (11.5% difference to median)
Compared to same class
» 9% of all tested devices in this class were better, 3% similar, 88% worse
» The best had a delta of 6%, average was 18%, worst was 132%
Compared to all devices tested
» 6% of all tested devices were better, 2% similar, 92% worse
» The best had a delta of 4%, average was 24%, worst was 134%
Lenovo Legion Pro 5 16IRX9 G9 audio analysis
(±) | speaker loudness is average but good (77.13 dB)
Bass 100 - 315 Hz
(-) | nearly no bass - on average 18.3% lower than median
(±) | linearity of bass is average (12% delta to prev. frequency)
Mids 400 - 2000 Hz
(±) | higher mids - on average 6.9% higher than median
(+) | mids are linear (4.9% delta to prev. frequency)
Highs 2 - 16 kHz
(+) | balanced highs - only 4.5% away from median
(±) | linearity of highs is average (9.5% delta to prev. frequency)
Overall 100 - 16.000 Hz
(±) | linearity of overall sound is average (21.6% difference to median)
Compared to same class
» 76% of all tested devices in this class were better, 5% similar, 19% worse
» The best had a delta of 6%, average was 18%, worst was 132%
Compared to all devices tested
» 58% of all tested devices were better, 7% similar, 34% worse
» The best had a delta of 4%, average was 24%, worst was 134%
电源管理 - Titan 16 运行时间一般
耗电量
就所安装的硬件而言,其功耗是正常的。赛博朋克 2077》和压力测试均以恒定功耗运行。电源(280 瓦)的大小足够。
| Off / Standby | |
| Idle | |
| Load |
|
Key:
min: | |
| Nubia RedMagic Titan 16 Pro i9-14900HX, NVIDIA GeForce RTX 4060 Laptop GPU | Lenovo Legion Pro 5 16IRX9 G9 i7-14700HX, NVIDIA GeForce RTX 4060 Laptop GPU | HP Victus 16 (2024) i7-14700HX, NVIDIA GeForce RTX 4060 Laptop GPU | Acer Predator Helios Neo 16 (2024) i7-14700HX, NVIDIA GeForce RTX 4070 Laptop GPU | SCHENKER XMG Pro 16 Studio (Mid 24) i9-14900HX, NVIDIA GeForce RTX 4070 Laptop GPU | Gigabyte G6X 9KG (2024) i7-13650HX, NVIDIA GeForce RTX 4060 Laptop GPU | Average NVIDIA GeForce RTX 4060 Laptop GPU | Average of class Gaming | |
|---|---|---|---|---|---|---|---|---|
| Power Consumption | -4% | 16% | -23% | -35% | 17% | 21% | 7% | |
| Idle Minimum * | 16 | 13.7 14% | 9 44% | 26.7 -67% | 31 -94% | 12 25% | 11.5 ? 28% | 13.4 ? 16% |
| Idle Average * | 19 | 17.7 7% | 15 21% | 24.4 -28% | 33 -74% | 13 32% | 16 ? 16% | 18.9 ? 1% |
| Idle Maximum * | 27 | 18.5 31% | 23 15% | 32.7 -21% | 41 -52% | 27 -0% | 20.3 ? 25% | 26.3 ? 3% |
| Load Average * | 123 | 124 -1% | 123 -0% | 122.1 1% | 114 7% | 105 15% | 92.9 ? 24% | 102.7 ? 17% |
| Cyberpunk 2077 ultra external monitor * | 174.2 | 224 -29% | 196.8 -13% | |||||
| Cyberpunk 2077 ultra * | 184.3 | 229 -24% | 218 -18% | |||||
| Load Maximum * | 240 | 297 -24% | 241 -0% | 241 -0% | 250 -4% | 210 12% | 210 ? 12% | 244 ? -2% |
| Witcher 3 ultra * | 143.7 | 190.6 | 167.8 |
* ... smaller is better
Power consumption Cyberpunk / stress test
Power consumption with external monitor
运行时间
在 WiFi 测试(使用脚本访问网站)和视频测试(循环播放短片《Big Buck Bunny》(H.264 编码,全高清))中,16 英寸设备的运行时间分别为 4:40 小时和 5:16 小时--数值并不高。它的一些竞争对手的运行时间要长得多。
| Nubia RedMagic Titan 16 Pro i9-14900HX, NVIDIA GeForce RTX 4060 Laptop GPU, 80.1 Wh | Lenovo Legion Pro 5 16IRX9 G9 i7-14700HX, NVIDIA GeForce RTX 4060 Laptop GPU, 80 Wh | HP Victus 16 (2024) i7-14700HX, NVIDIA GeForce RTX 4060 Laptop GPU, 83 Wh | Acer Predator Helios Neo 16 (2024) i7-14700HX, NVIDIA GeForce RTX 4070 Laptop GPU, 90.61 Wh | SCHENKER XMG Pro 16 Studio (Mid 24) i9-14900HX, NVIDIA GeForce RTX 4070 Laptop GPU, 73 Wh | Gigabyte G6X 9KG (2024) i7-13650HX, NVIDIA GeForce RTX 4060 Laptop GPU, 73 Wh | Average of class Gaming | |
|---|---|---|---|---|---|---|---|
| Battery Runtime | 16% | 83% | -16% | 20% | 69% | 28% | |
| Reader / Idle | 481 | 356 -26% | 585 ? 22% | ||||
| H.264 | 316 | 312 -1% | 242 -23% | 447 ? 41% | |||
| WiFi v1.3 | 280 | 308 10% | 511 83% | 227 -19% | 337 20% | 474 69% | 387 ? 38% |
| Load | 76 | 105 38% | 79 4% | 84.5 ? 11% |
Pros
Cons
结论 - 有改进的余地

A 酷睿 i9-14900HX和 GeForce RTX 4060确保在高至最高设置下进行 QHD 游戏。由于内存以单通道模式运行,所安装的硬件并未充分发挥其潜力。建议安装第二个内存模块。
努比亚的首款产品实现了其设计目标:将游戏流畅地呈现在屏幕上。但竞争对手并不完全需要害怕的理由。
它的排放值非常令人失望:这款笔记本电脑在整个负载范围内都会产生(过多)噪音,而且发热量很大。另一方面,它明亮的真彩 IPS 屏幕(16 英寸、2560 x 1600 像素、240 Hz、G-Sync、DCI-P3)和适合工作的 16:10 宽高比给我们留下了良好的印象。
这款笔记本电脑的电池续航时间不会让任何人失望。对于一款配备 80 Wh 电池的游戏笔记本电脑,你的期望会更高(略高)。至少,它安装的 USB-C 端口(雷电 4)支持 Power Delivery(和 DP Alt 模式)。这就意味着,你不一定总是要随身携带笨重的专有电源。
在购买该设备之前,您应该考虑一个事实:与宏碁、联想或惠普等知名制造商相比,努比亚在全球范围内并没有真正的影响力。因此,我们无法估计备件供应、支持和维修方面的情况。
1699 美元的售价肯定不利于这款笔记本电脑:例如,配置几乎相同的 宏碁掠夺者 Helios Neo 16(除了内存是 32GB 而不是 16GB)目前的价格仅为 1,350 美元。另一种选择是 XMG Pro 16 Studio(中型 24).该设备的同类产品售价约为 2,000 美元(含 Windows 11)或 1,950 美元(不含 Windows 操作系统)。
价格和供应情况
努比亚红魔 Titan 16 Pro 于 2024 年 8 月 29 日上市,可通过RedMagic 商店以 1699 美元的价格购买。.
请注意:我们最近更新了评级系统,第 8 版的结果与第 7 版的结果不可比。更多信息请点击http://www.notebookcheck.net/Our-new-rating-system-v8-explained-Lower-but-more-realistic-scores-together-with-sustainability-assessment.853123.0.html.
Nubia RedMagic Titan 16 Pro
- 08/21/2024 v8
Sascha Mölck
 Total Sustainability Score:
 Transparency
The selection of devices to be reviewed is made by our editorial team. The test sample was provided to the author as a loan by the manufacturer or retailer for the purpose of this review. The lender had no influence on this review, nor did the manufacturer receive a copy of this review before publication. There was no obligation to publish this review. We never accept compensation or payment in return for our reviews. As an independent media company, Notebookcheck is not subjected to the authority of manufacturers, retailers or publishers.
This is how Notebookcheck is testing
Every year, Notebookcheck independently reviews hundreds of laptops and smartphones using standardized procedures to ensure that all results are comparable. We have continuously developed our test methods for around 20 years and set industry standards in the process. In our test labs, high-quality measuring equipment is utilized by experienced technicians and editors. These tests involve a multi-stage validation process. Our complex rating system is based on hundreds of well-founded measurements and benchmarks, which maintains objectivity. Further information on our test methods can be found here.
Price comparison

