

英特尔酷睿至尊 9 285K Arrow Lake-S 评测:售价 589 美元的 CPU 牺牲了游戏性能,在能效方面媲美 AMD Zen 5 Ryzen 9000
省电,但缺乏游戏性。
英特尔新推出的 Arrow Lake-S Core Ultra 9 285 采用了新的计算磁贴布局,牺牲了超线程功能,旨在通过显著提高效率来赢得发烧友的青睐。虽然酷睿至尊 9 285K 确实在 CPU 原始性能和效率方面表现出色,但在游戏方面却严重逊色于英特尔 Raptor Lake-S Refresh 和 AMD Zen 5 Ryzen 9000 产品。Vaidyanathan Subramaniam (translated by DeepL / Ninh Duy) Published 🇺🇸 🇩🇪 ... 🇫🇷 🇪🇸 🇵🇹 🇮🇹 🇳🇱 🇸🇪 🇹🇷 🇵🇱 🇭🇺 🇷🇺
Intel Arrow Lake Desktop Gaming
评语:英特尔的高效游戏遭遇游戏障碍
英特尔的台式机芯片并不以高效著称,但该公司希望通过今天发布的 Arrow Lake-S 重新改写这一说法。
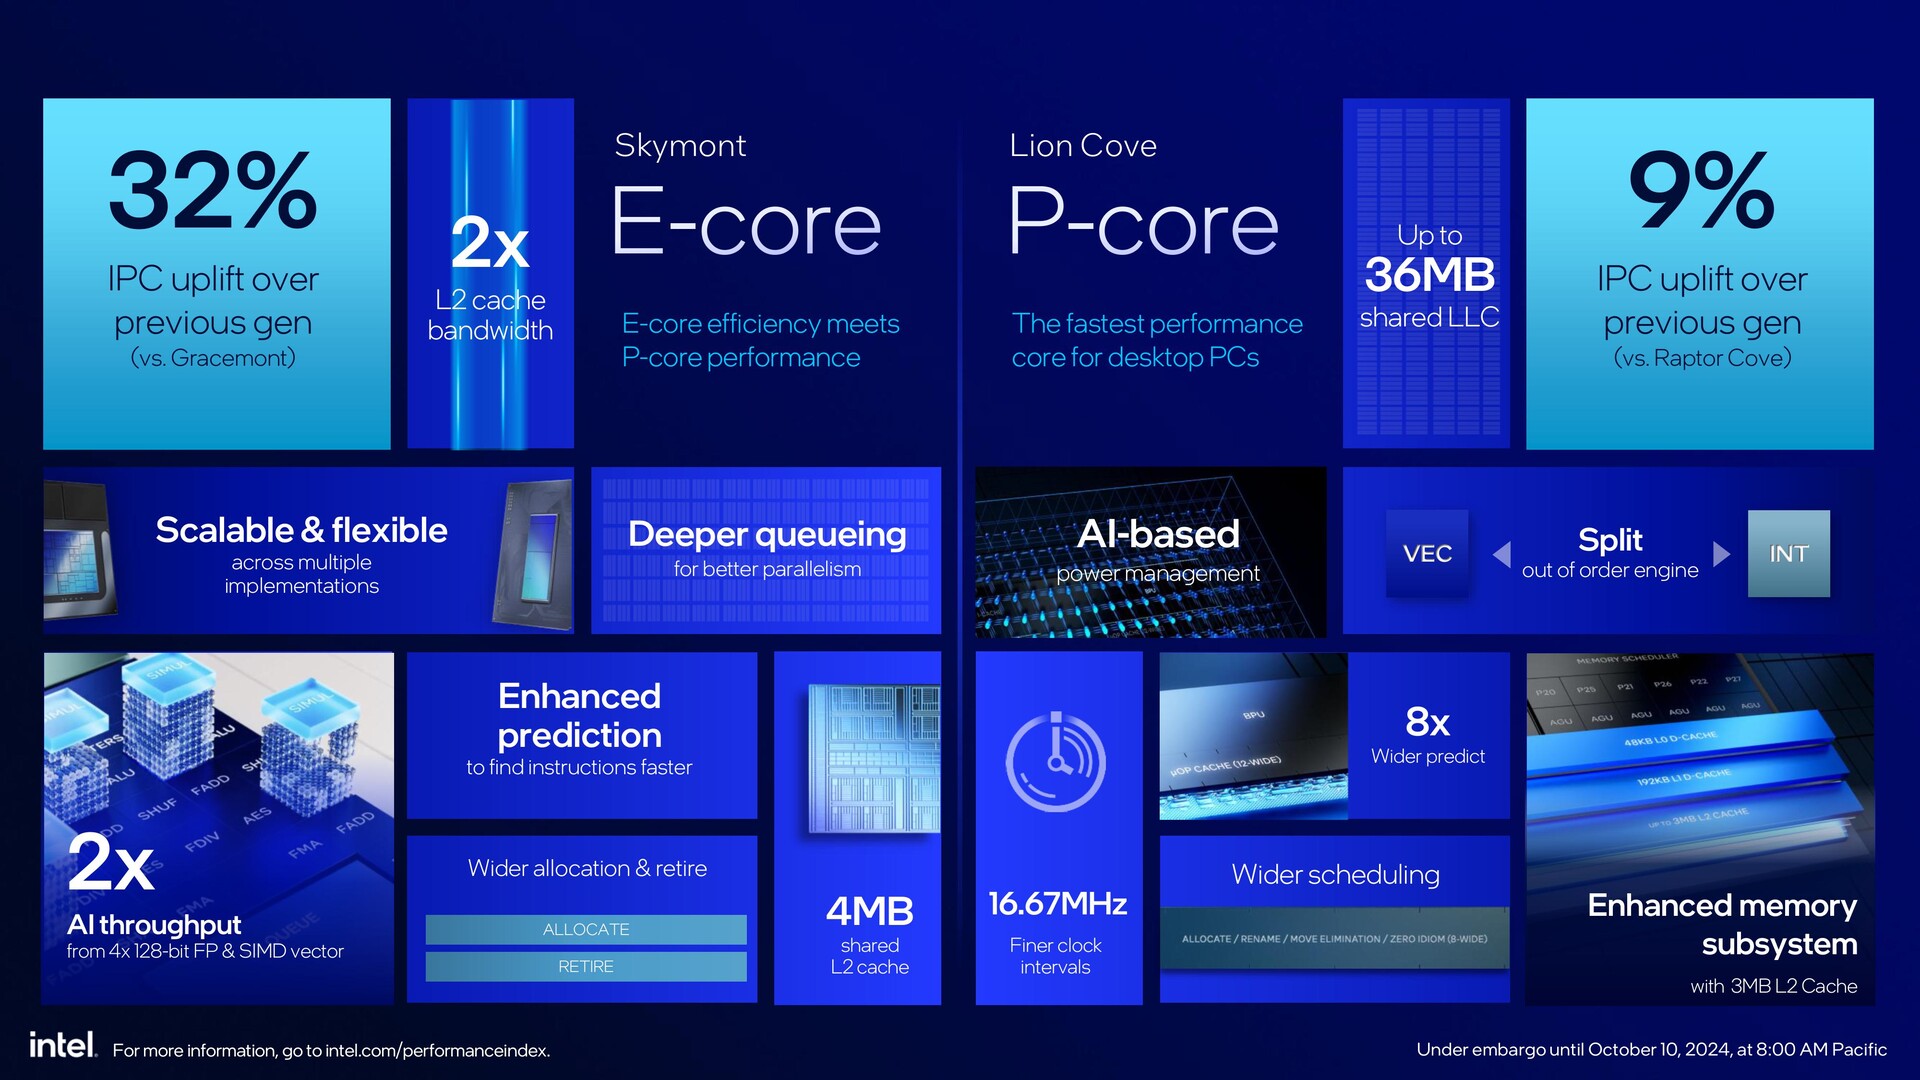
以酷睿 Ultra 9 285K 为首的英特尔全新 Arrow Lake-S 系列标志着一个重大转变,即取消了所有型号的超线程功能,这是自奔腾 4 时代以来的第一次。在累计 CPU 基准测试中,Core Ultra 9 285K 的性能与 Core i9-14900K 不相上下,几乎达到了 Ryzen 9 9950X 的性能水平。
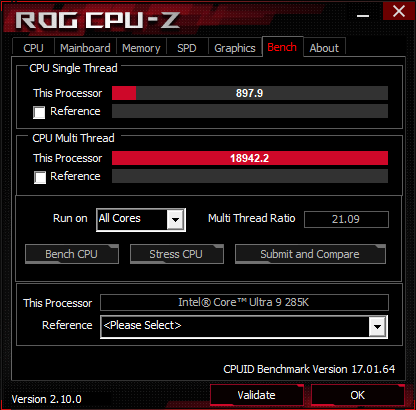
尽管如此,在单核和多核基准测试中,我们确实看到酷睿至尊 9 285K 的性能超过了这两款处理器。
我们特别喜欢的是,Arrow Lake-S 的性能与 Raptor Lake-S Refresh 相当,甚至略胜一筹,而能效却与 AMD 的 Zen 5 处理器相当。
然而,尽管取得了这些进步,酷睿至尊 9 285K 在游戏性能方面却步履维艰,在所有测试分辨率下均落后于酷睿 i9-14900K 和 Zen 5 CPU。
酷睿至尊 9 285K 在游戏方面只能与酷睿 i7-14700K 竞争。鉴于 Arrow Lake-S 的内置 APO 优化和超线程功能的缺失,这种情况令人惊讶,理论上超线程功能本应帮助 CPU 取得更好的游戏成绩。
新平台还需要额外投资购买新的 800 系列主板和 DDR5 内存,这也是升级前需要考虑的因素。
Pros
Cons
价格和供应情况
英特尔酷睿至尊 9 285K 将于今日起在全球零售商处发售,建议零售价为 589 美元。现已打折的 酷睿 i9-14900K尽管更新的 BIOS 对性能略有影响,但如果您将计算和游戏都放在首位,那么现在已经打折的酷睿 i9-14900K 仍然可行。
处理器 AMD Ryzen 9 9950X(目前在亚马逊售价为 709 美元)和 Ryzen 9 9900X(亚马逊售价 429 美元)仍然是出色的替代品,不会出现酷睿至尊 9 285K 在游戏方面的任何问题。
Price comparison
英特尔第 13 代和第 14 代旗舰台式机处理器因种种原因成为新闻焦点 错误的原因不久前,英特尔的第 13 代和第 14 代旗舰台式机处理器曾因种种原因而成为新闻焦点,但今天,这一切有望得到改善。继 月湖笔记本电脑处理器有了一个良好的开端之后,英特尔现在把重点转向了 箭湖-S台式机。
Arrow Lake-S,也就是市场营销中所说的 Core Ultra 200S 系列,标志着英特尔台式机 CPU 战略的范式转变。
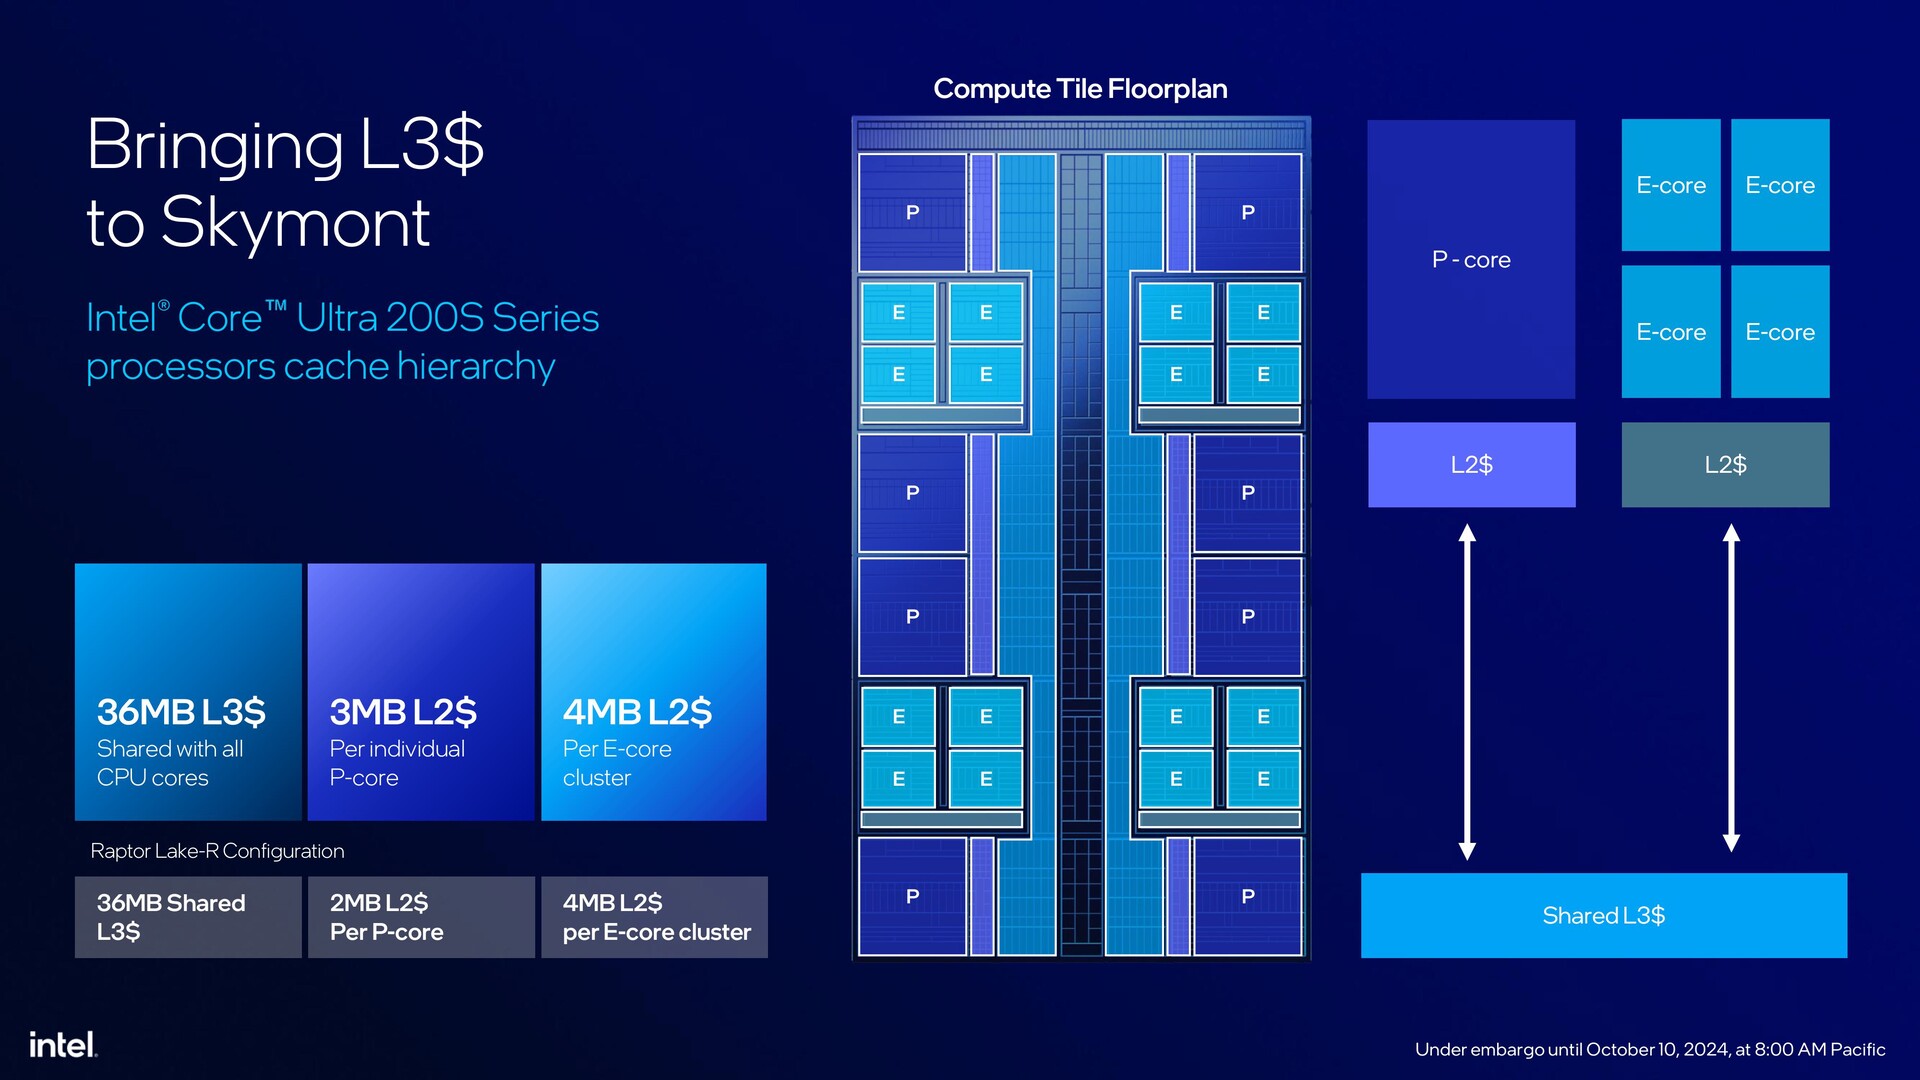
在这一代产品中,英特尔的Foveros 3D 封装 将首次应用于台式机,使用台积电的 3 纳米生产线而不是英特尔的生产线,新的计算磁贴(Compute tile)采用重新排列的 Lion Cove P 核和 Skymont E 核(无超线程),P 核上的二级缓存更大,Alchemist Xe iGPU 和 NPU 也将登场--两者都是从 Meteor Lake 重新使用的。
Arrow Lake-S 的 Foveros 封装共包括六块芯片,其中四块基于台积电节点。其中包括计算(N3B)、Xe-LPG Alchemist iGPU(N5P)、SoC(N6)、I/O(N6)、一个用于保持稳定的填充芯片,以及基础芯片(英特尔 1227.1 22 纳米 FinFET)。
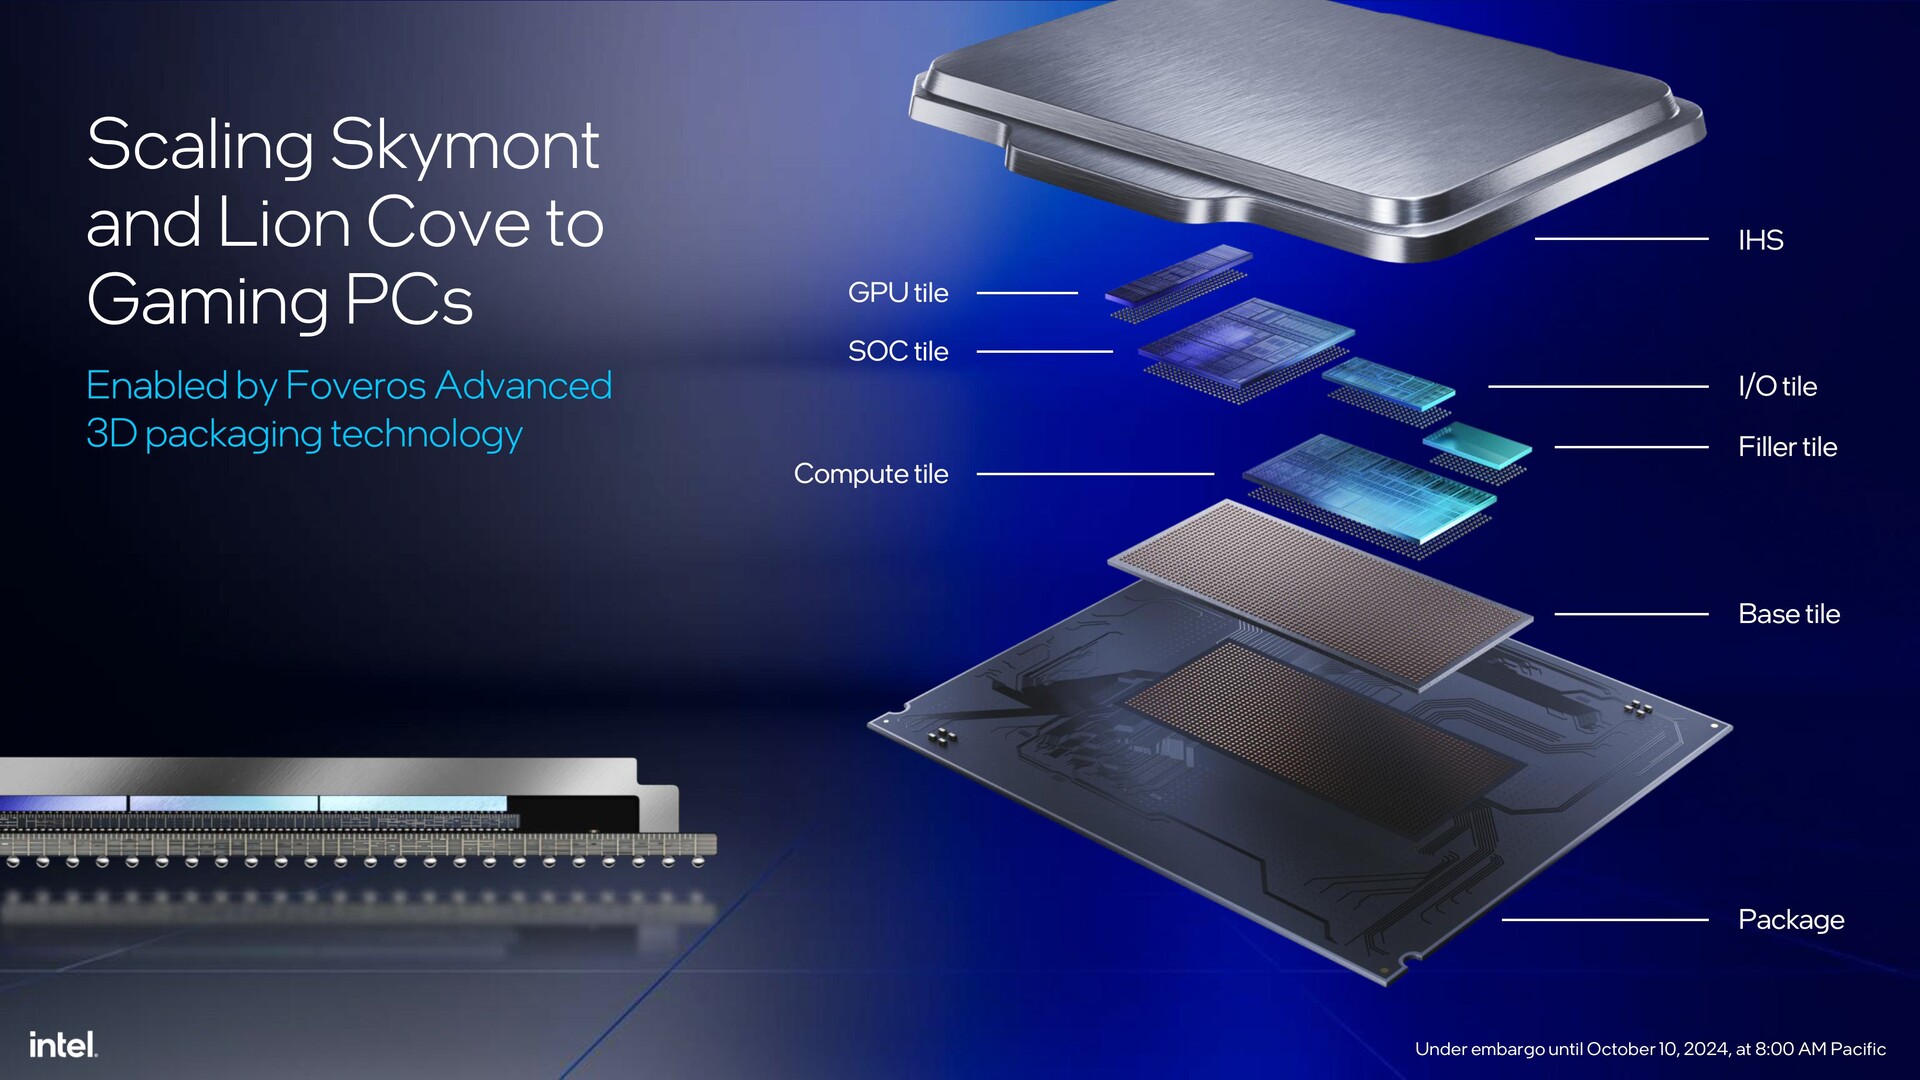
将所有这些组件封装在一起不可避免地需要新的电源要求,因此需要新的插座。Arrow Lake-S 处理器需要采用全新 LGA 1851 插座的 800 系列主板。遗憾的是,英特尔对未来几代 CPU 是否会使用这种新的针脚布局仍然讳莫如深。
此外,由于这些 CPU 缺少 Raptor Lake-S 和 Alder Lake-S 中的混合内存控制器,因此还需要完全过渡到 DDR5 内存。
在本篇评测中,我们将对新款英特尔酷睿至尊 9 285K进行评测,看看英特尔在台式机领域的决策能否给 AMD 最新的 Ryzen 9000 产品和英特尔自己的第 14 代芯片带来足够的挑战。
英特尔酷睿200S系列箭湖-S台式机处理器概述
| SKU | 核心/线程 | P-Core Clock / Turbo | E-Core Clock / Turbo | Turbo Boost Max 3.0 | Total L2 Cache | L3 Cache | Integrated Graphics | NPU Peak TOPS | PBP (PL1) | MTP (PL2) | MSRP |
|---|---|---|---|---|---|---|---|---|---|---|---|
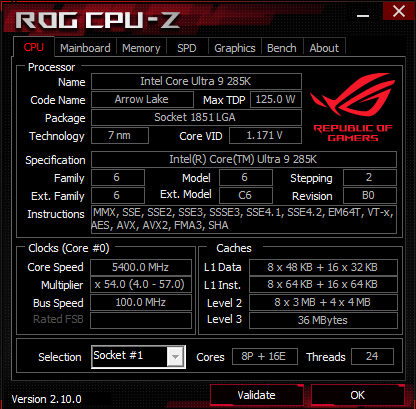
| Intel Core Ultra 9 285K | 24 (8P + 16E) /24 | 3.7 GHz / 5.5GHz | 3.2 GHz / 4.6 GHz | 5.6 GHz | 40 MB | 36 MB | 4Xe Cores, 2.0 GHz | 13 TOPS | 125 W | 250 W | $589 |
| Intel Core Ultra 7 265K | 20 (8P + 12E) /20 | 3.9 GHz / 5.4 GHz | 3.3 GHz / 4.6 GHz | 5.6 GHz | 36 MB | 30 MB | 4 Xe 内核,2.0 GHz | 13 TOPS | 125 W | 250 W | $394 |
| Intel Core Ultra 7 265KF | 20 (8P + 12E) /20 | 3.9 GHz / 5.4 GHz | 3.3 GHz / 4.6 GHz | 5.6 GHz | 36 MB | 30 MB | - | 13 TOPS | 125 W | 250 W | $379 |
| Intel Core Ultra 5 245K | 14 (6P + 8E) /14 | 3.9 GHz / 5.4 GHz | 4.2 GHz / 5.2 GHz | 5.2 GHz | 26 MB | 24 MB | 4 Xe Cores, 1.9 GHz | 13 TOPS | 125 W | 159 W | $309 |
| Intel Core Ultra 5 245KF | 14 (6P + 8E) /14 | 3.9 GHz / 5.4 GHz | 4.2 GHz / 5.2 GHz | 5.2 GHz | 26 MB | 24 MB | - | 13 TOPS | 125 W | 159 W | $294 |
测试台: GeForce RTX 4090 与 Core Ultra 9 285K 相得益彰
我们在测试 Core Ultra 9 285K 时使用了以下组件:
- Cooler Master MasterFrame 700 开放式测试台
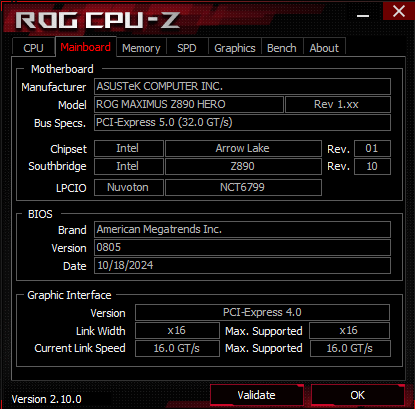
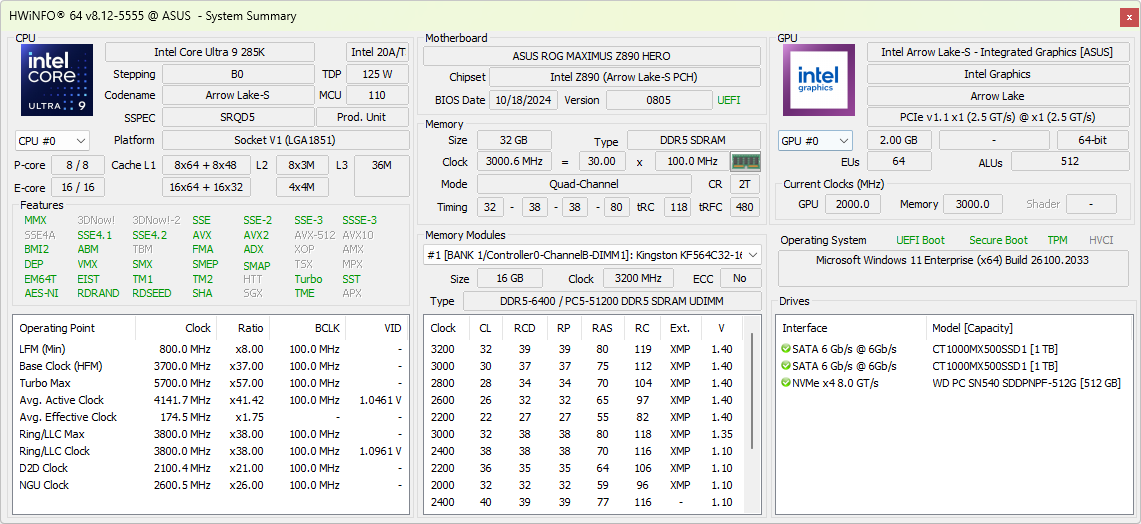
- 华硕 ROG Maximus Z890 Hero 主板,BIOS 版本 0805
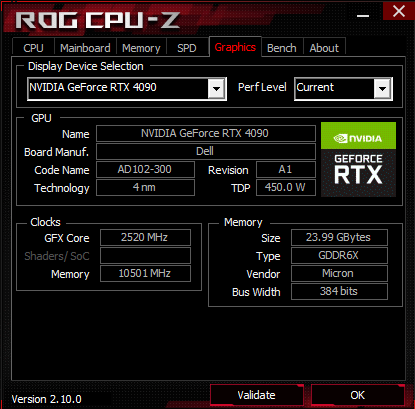
- NvidiaGeForce RTX 4090 Founders Edition图形处理器
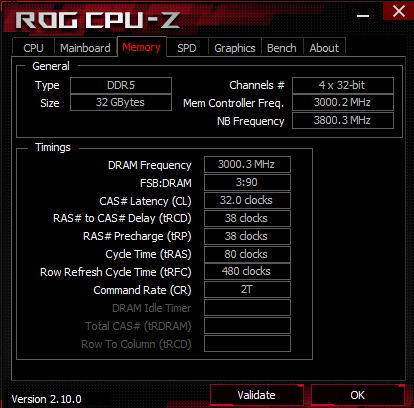
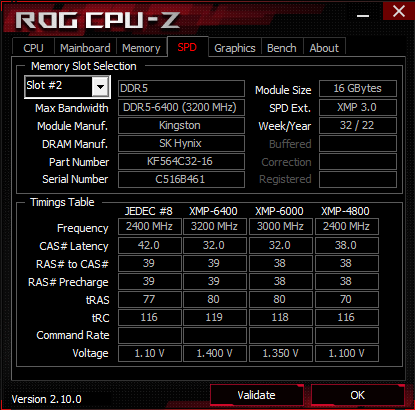
- 2x 16 GB Kingston Fury Beast DDR5-6400 内存,运行于 DDR5-6000,时序 32-38-38-80,电压 1.35 V
- Western Digital PC SN540 512 GB NVMe SSD 和 2x Crucial MX500 1 TB SATA SSD,用于操作系统、基准测试和游戏
- Alienware AW3225QF 4K 240 Hz QD-OLED 显示器
- 曜越 TH420 V2 Ultra EX ARGBAiO 散热器
- Cooler Master MVE Gold V2 1250 ATX 3.0 全模块化 PSU
我们要感谢英特尔(Intel)提供酷睿至尊 9 285K 测试样品,感谢英伟达(Nvidia)提供 RTX 4090 Founders Edition GPU,感谢华硕(Asus)提供 ROG Maximus Z890 Hero 主板,感谢戴尔(Dell)提供 AW3225QF 显示器,感谢金士顿(Kingston)提供 DDR5 内存套件,感谢曜越(Thermaltake)提供 TH420 V2 Ultra EX AIO,最后感谢 Cooler Master 提供测试台和电源。
所有测试均在全新安装的 Windows 11 24H2(Build 26100.2033)以及最新的平台驱动程序和 Nvidia Game Ready 驱动程序 566.03 上进行。
我们使用 BIOS 中默认的英特尔性能设置,并将 Windows 电源计划设置为终极性能,即 PL1=PL2=250 W。
CPU 性能:整体性能与酷睿 i9-14900K 相当,与 Ryzen 9 9950X 相比略有提升
在累积 CPU 测试中,Core Ultra 9 285K 与Core i9-14900K 相当,仅略微落后于AMD Ryzen 9 9950X 。这主要是由于酷睿至尊 9 285K 在 Blender 2.79 BMW27 CPU、V-Ray 测试、wPrime 2.1 和 R 基准等特定测试中落后于 Ryzen 9 9950X,尽管差异并不明显。
在 Cinebench 单核心测试中,Ultra 9 285K 略微领先于酷睿 i9-14900K,Ryzen 9 9900X 则略微落后于酷睿 i9-14900K。
Ryzen 9 9900X和 Ryzen 9 9950X 紧随其后。不过,在 Geekbench 中的情况有所不同,Zen 5 芯片在与 Arrow Lake-S 的较量中取得了微不足道的优势。在 Cinebench 多核测试中,尽管没有超线程技术,24C/24T 的 Core Ultra 9 285K 仍比 16C/32T 的 Ryzen 9 9950X 高出 4-6%。在 Geekbench 6.3 多核测试中,Core Ultra 9 285K、Core i9-14900K 和 Ryzen 9 9950X 的表现不相上下。
| CPU Performance Rating - Percent | |
| AMD Ryzen 9 9950X Ryzen 9 9950X, 4300 MHz |
81.3 pt |
| Intel Core i9-14900K -1! i9-14900K, 3200 MHz |
78.6 pt |
| Intel Core Ultra 9 285K Ultra 9 285K, 3200 MHz |
78.2 pt |
| AMD Ryzen 9 7950X -2! R9 7950X, 4500 MHz |
77.7 pt |
| Intel Core i9-13900K i9-13900K, 3000 MHz |
77.5 pt |
| AMD Ryzen 9 7950X3D R9 7950X3D, 4200 MHz |
76.7 pt |
| AMD Ryzen 9 9900X -9! Ryzen 9 9900X, 4400 MHz |
76.1 pt |
| Intel Core i7-14700K i7-14700K, 2500 MHz |
73.8 pt |
| AMD Ryzen 9 7900X -2! R9 7900X, 4700 MHz |
70 pt |
| AMD Ryzen 7 9700X Ryzen 7 9700X, 3800 MHz |
68.1 pt |
| Intel Core i5-14600K i5-14600K, 3500 MHz |
66.7 pt |
| Intel Core Ultra 5 245K Ultra 5 245K, 3600 MHz |
66.5 pt |
| Intel Core i9-12900K -1! i9-12900K, 3200 MHz |
66.1 pt |
| Intel Core i5-13600K -2! i5-13600K, 3500 MHz |
65 pt |
| AMD Ryzen 5 9600X -2! Ryzen 5 9600X, 3900 MHz |
64.9 pt |
| AMD Ryzen 7 7800X3D -3! R7 7800X3D, 4200 MHz |
64.2 pt |
| Intel Core i5-12600K -3! i5-12600K, 2800 MHz |
58.9 pt |
| Cinebench R15 | |
| CPU Single 64Bit | |
| Intel Core Ultra 9 285K Ultra 9 285K, 3200 MHz |
356 Points |
| AMD Ryzen 9 9900X Ryzen 9 9900X, 4400 MHz |
353 Points -1% |
| AMD Ryzen 7 9700X Ryzen 7 9700X, 3800 MHz |
346 Points -3% |
| AMD Ryzen 9 9950X Ryzen 9 9950X, 4300 MHz |
344 Points -3% |
| AMD Ryzen 5 9600X Ryzen 5 9600X, 3900 MHz |
341 Points -4% |
| Intel Core i9-14900K i9-14900K, 3200 MHz |
332 Points -7% |
| AMD Ryzen 9 7950X R9 7950X, 4500 MHz |
328 Points -8% |
| Intel Core i9-13900K i9-13900K, 3000 MHz |
327 Points -8% |
| AMD Ryzen 9 7950X3D R9 7950X3D, 4200 MHz |
326 Points -8% |
| AMD Ryzen 9 7900X R9 7900X, 4700 MHz |
324 Points -9% |
| Intel Core Ultra 5 245K Ultra 5 245K, 3600 MHz |
322 Points -10% |
| Intel Core i7-14700K i7-14700K, 2500 MHz |
314 Points -12% |
| Intel Core i5-14600K i5-14600K, 3500 MHz |
297 Points -17% |
| AMD Ryzen 7 7800X3D R7 7800X3D, 4200 MHz |
291 Points -18% |
| Intel Core i5-13600K i5-13600K, 3500 MHz |
289 Points -19% |
| Intel Core i9-12900K i9-12900K, 3200 MHz |
286 Points -20% |
| Intel Core i5-12600K i5-12600K, 2800 MHz |
275 Points -23% |
| CPU Multi 64Bit | |
| Intel Core Ultra 9 285K Ultra 9 285K, 3200 MHz |
6588 (6491.4min - 6587.62max) Points |
| AMD Ryzen 9 9950X Ryzen 9 9950X, 4300 MHz |
6335 (6262.72min - 6335.13max) Points -4% |
| Intel Core i9-14900K i9-14900K, 3200 MHz |
6282 Points -5% |
| AMD Ryzen 9 7950X R9 7950X, 4500 MHz |
6209 Points -6% |
| Intel Core i9-13900K i9-13900K, 3000 MHz |
6191 Points -6% |
| AMD Ryzen 9 7950X3D R9 7950X3D, 4200 MHz |
5974 Points -9% |
| Intel Core i7-14700K i7-14700K, 2500 MHz |
5459 (5323.4min - 5459.26max) Points -17% |
| AMD Ryzen 9 9900X Ryzen 9 9900X, 4400 MHz |
5008 (4929.75min - 5007.51max) Points -24% |
| AMD Ryzen 9 7900X R9 7900X, 4700 MHz |
4856 Points -26% |
| Intel Core i9-12900K i9-12900K, 3200 MHz |
4057 Points -38% |
| Intel Core Ultra 5 245K Ultra 5 245K, 3600 MHz |
3850 Points -42% |
| Intel Core i5-13600K i5-13600K, 3500 MHz |
3643 Points -45% |
| Intel Core i5-14600K i5-14600K, 3500 MHz |
3640 Points -45% |
| AMD Ryzen 7 9700X Ryzen 7 9700X, 3800 MHz |
3178 (3067.25min - 3120.37max) Points -52% |
| AMD Ryzen 7 7800X3D R7 7800X3D, 4200 MHz |
2974 Points -55% |
| AMD Ryzen 5 9600X Ryzen 5 9600X, 3900 MHz |
2630 Points -60% |
| Intel Core i5-12600K i5-12600K, 2800 MHz |
2555 Points -61% |
| Cinebench R20 | |
| CPU (Single Core) | |
| Intel Core Ultra 9 285K Ultra 9 285K, 3200 MHz |
902 Points |
| Intel Core i9-14900K i9-14900K, 3200 MHz |
900 Points 0% |
| AMD Ryzen 9 9900X Ryzen 9 9900X, 4400 MHz |
885 Points -2% |
| AMD Ryzen 9 9950X Ryzen 9 9950X, 4300 MHz |
871 Points -3% |
| AMD Ryzen 7 9700X Ryzen 7 9700X, 3800 MHz |
870 Points -4% |
| AMD Ryzen 5 9600X Ryzen 5 9600X, 3900 MHz |
858 Points -5% |
| Intel Core i7-14700K i7-14700K, 2500 MHz |
832 Points -8% |
| Intel Core i9-13900K i9-13900K, 3000 MHz |
828 Points -8% |
| Intel Core Ultra 5 245K Ultra 5 245K, 3600 MHz |
820 Points -9% |
| AMD Ryzen 9 7950X R9 7950X, 4500 MHz |
795 Points -12% |
| AMD Ryzen 9 7950X3D R9 7950X3D, 4200 MHz |
795 Points -12% |
| Intel Core i5-14600K i5-14600K, 3500 MHz |
790 Points -12% |
| AMD Ryzen 9 7900X R9 7900X, 4700 MHz |
786 Points -13% |
| Intel Core i5-13600K i5-13600K, 3500 MHz |
775 Points -14% |
| Intel Core i9-12900K i9-12900K, 3200 MHz |
766 Points -15% |
| Intel Core i5-12600K i5-12600K, 2800 MHz |
734 Points -19% |
| AMD Ryzen 7 7800X3D R7 7800X3D, 4200 MHz |
709 Points -21% |
| CPU (Multi Core) | |
| Intel Core Ultra 9 285K Ultra 9 285K, 3200 MHz |
16722 Points |
| AMD Ryzen 9 9950X Ryzen 9 9950X, 4300 MHz |
15788 Points -6% |
| Intel Core i9-14900K i9-14900K, 3200 MHz |
15466 Points -8% |
| Intel Core i9-13900K i9-13900K, 3000 MHz |
15181 Points -9% |
| AMD Ryzen 9 7950X R9 7950X, 4500 MHz |
14786 Points -12% |
| AMD Ryzen 9 7950X3D R9 7950X3D, 4200 MHz |
14188 Points -15% |
| Intel Core i7-14700K i7-14700K, 2500 MHz |
13672 Points -18% |
| AMD Ryzen 9 9900X Ryzen 9 9900X, 4400 MHz |
12551 Points -25% |
| AMD Ryzen 9 7900X R9 7900X, 4700 MHz |
11563 Points -31% |
| Intel Core i9-12900K i9-12900K, 3200 MHz |
10240 Points -39% |
| Intel Core Ultra 5 245K Ultra 5 245K, 3600 MHz |
9752 Points -42% |
| Intel Core i5-14600K i5-14600K, 3500 MHz |
9371 Points -44% |
| Intel Core i5-13600K i5-13600K, 3500 MHz |
9265 Points -45% |
| AMD Ryzen 7 9700X Ryzen 7 9700X, 3800 MHz |
7956 Points -52% |
| AMD Ryzen 7 7800X3D R7 7800X3D, 4200 MHz |
7121 Points -57% |
| AMD Ryzen 5 9600X Ryzen 5 9600X, 3900 MHz |
6719 Points -60% |
| Intel Core i5-12600K i5-12600K, 2800 MHz |
6692 Points -60% |
| Cinebench R23 | |
| Single Core | |
| Intel Core Ultra 9 285K Ultra 9 285K, 3200 MHz |
2353 Points |
| Intel Core i9-14900K i9-14900K, 3200 MHz |
2351 Points 0% |
| Intel Core i9-13900K i9-13900K, 3000 MHz |
2267 Points -4% |
| AMD Ryzen 9 9900X Ryzen 9 9900X, 4400 MHz |
2253 Points -4% |
| AMD Ryzen 7 9700X Ryzen 7 9700X, 3800 MHz |
2211 Points -6% |
| AMD Ryzen 9 9950X Ryzen 9 9950X, 4300 MHz |
2202 Points -6% |
| AMD Ryzen 5 9600X Ryzen 5 9600X, 3900 MHz |
2180 Points -7% |
| Intel Core i7-14700K i7-14700K, 2500 MHz |
2153 Points -8% |
| Intel Core Ultra 5 245K Ultra 5 245K, 3600 MHz |
2132 Points -9% |
| Intel Core i5-14600K i5-14600K, 3500 MHz |
2064 Points -12% |
| AMD Ryzen 9 7950X3D R9 7950X3D, 4200 MHz |
2053 Points -13% |
| AMD Ryzen 9 7950X R9 7950X, 4500 MHz |
2045 Points -13% |
| AMD Ryzen 9 7900X R9 7900X, 4700 MHz |
2039 Points -13% |
| Intel Core i5-13600K i5-13600K, 3500 MHz |
2010 Points -15% |
| Intel Core i9-12900K i9-12900K, 3200 MHz |
1998 Points -15% |
| Intel Core i5-12600K i5-12600K, 2800 MHz |
1907 Points -19% |
| AMD Ryzen 7 7800X3D R7 7800X3D, 4200 MHz |
1820 Points -23% |
| Multi Core | |
| Intel Core Ultra 9 285K Ultra 9 285K, 3200 MHz |
42705 Points |
| Intel Core i9-14900K i9-14900K, 3200 MHz |
41193 Points -4% |
| AMD Ryzen 9 9950X Ryzen 9 9950X, 4300 MHz |
40924 Points -4% |
| Intel Core i9-13900K i9-13900K, 3000 MHz |
40103 Points -6% |
| AMD Ryzen 9 7950X R9 7950X, 4500 MHz |
37792 Points -12% |
| AMD Ryzen 9 7950X3D R9 7950X3D, 4200 MHz |
36291 Points -15% |
| Intel Core i7-14700K i7-14700K, 2500 MHz |
35892 Points -16% |
| AMD Ryzen 9 9900X Ryzen 9 9900X, 4400 MHz |
32172 Points -25% |
| AMD Ryzen 9 7900X R9 7900X, 4700 MHz |
29480 Points -31% |
| Intel Core i9-12900K i9-12900K, 3200 MHz |
27005 Points -37% |
| Intel Core Ultra 5 245K Ultra 5 245K, 3600 MHz |
25066 Points -41% |
| Intel Core i5-14600K i5-14600K, 3500 MHz |
24491 Points -43% |
| Intel Core i5-13600K i5-13600K, 3500 MHz |
24268 Points -43% |
| AMD Ryzen 7 9700X Ryzen 7 9700X, 3800 MHz |
20485 Points -52% |
| AMD Ryzen 7 7800X3D R7 7800X3D, 4200 MHz |
18086 Points -58% |
| Intel Core i5-12600K i5-12600K, 2800 MHz |
17491 Points -59% |
| AMD Ryzen 5 9600X Ryzen 5 9600X, 3900 MHz |
17176 Points -60% |
| Blender - v2.79 BMW27 CPU | |
| Intel Core i5-12600K i5-12600K, 2800 MHz |
189.5 Seconds * -140% |
| AMD Ryzen 5 9600X Ryzen 5 9600X, 3900 MHz |
184 Seconds * -133% |
| AMD Ryzen 7 7800X3D R7 7800X3D, 4200 MHz |
169 Seconds * -114% |
| AMD Ryzen 7 9700X Ryzen 7 9700X, 3800 MHz |
154 Seconds * -95% |
| Intel Core Ultra 5 245K Ultra 5 245K, 3600 MHz |
136 Seconds * -72% |
| Intel Core i5-13600K i5-13600K, 3500 MHz |
135 Seconds * -71% |
| Intel Core i5-14600K i5-14600K, 3500 MHz |
134 Seconds * -70% |
| Intel Core i9-12900K i9-12900K, 3200 MHz |
121.1 Seconds * -53% |
| AMD Ryzen 9 7900X R9 7900X, 4700 MHz |
106 Seconds * -34% |
| AMD Ryzen 9 9900X Ryzen 9 9900X, 4400 MHz |
97 Seconds * -23% |
| Intel Core i7-14700K i7-14700K, 2500 MHz |
91 Seconds * -15% |
| AMD Ryzen 9 7950X3D R9 7950X3D, 4200 MHz |
86 Seconds * -9% |
| AMD Ryzen 9 7950X R9 7950X, 4500 MHz |
85 Seconds * -8% |
| Intel Core i9-13900K i9-13900K, 3000 MHz |
80 Seconds * -1% |
| Intel Core i9-14900K i9-14900K, 3200 MHz |
80 Seconds * -1% |
| Intel Core Ultra 9 285K Ultra 9 285K, 3200 MHz |
79 Seconds * |
| AMD Ryzen 9 9950X Ryzen 9 9950X, 4300 MHz |
77 Seconds * +3% |
| HWBOT x265 Benchmark v2.2 - 4k Preset | |
| Intel Core Ultra 9 285K Ultra 9 285K, 3200 MHz |
45.7 fps |
| AMD Ryzen 9 9950X Ryzen 9 9950X, 4300 MHz |
45.1 fps -1% |
| AMD Ryzen 9 7950X R9 7950X, 4500 MHz |
44.4 fps -3% |
| Intel Core i9-14900K i9-14900K, 3200 MHz |
42.8 fps -6% |
| Intel Core i9-13900K i9-13900K, 3000 MHz |
42.6 fps -7% |
| AMD Ryzen 9 7950X3D R9 7950X3D, 4200 MHz |
42.4 fps -7% |
| AMD Ryzen 9 9900X Ryzen 9 9900X, 4400 MHz |
38.7 fps -15% |
| Intel Core i7-14700K i7-14700K, 2500 MHz |
36.8 fps -19% |
| AMD Ryzen 9 7900X R9 7900X, 4700 MHz |
36.2 fps -21% |
| Intel Core i5-12600K i5-12600K, 2800 MHz |
30.1 fps -34% |
| Intel Core i9-12900K i9-12900K, 3200 MHz |
30 fps -34% |
| Intel Core Ultra 5 245K Ultra 5 245K, 3600 MHz |
29.6 fps -35% |
| Intel Core i5-14600K i5-14600K, 3500 MHz |
28.6 fps -37% |
| Intel Core i5-13600K i5-13600K, 3500 MHz |
27.6 fps -40% |
| AMD Ryzen 7 9700X Ryzen 7 9700X, 3800 MHz |
26.4 fps -42% |
| AMD Ryzen 7 7800X3D R7 7800X3D, 4200 MHz |
24.4 fps -47% |
| AMD Ryzen 5 9600X Ryzen 5 9600X, 3900 MHz |
23.2 fps -49% |
| WinRAR - Result | |
| AMD Ryzen 9 7900X R9 7900X, 4700 MHz |
17225 KB/s +33% |
| AMD Ryzen 7 7800X3D R7 7800X3D, 4200 MHz |
16585 KB/s +28% |
| AMD Ryzen 9 7950X R9 7950X, 4500 MHz |
16351 KB/s +26% |
| Intel Core i9-14900K i9-14900K, 3200 MHz |
16108 KB/s +24% |
| AMD Ryzen 9 7950X3D R9 7950X3D, 4200 MHz |
15779 KB/s +22% |
| Intel Core i9-13900K i9-13900K, 3000 MHz |
14836 KB/s +15% |
| AMD Ryzen 5 9600X Ryzen 5 9600X, 3900 MHz |
14819 KB/s +14% |
| AMD Ryzen 9 9950X Ryzen 9 9950X, 4300 MHz |
13778 KB/s +6% |
| AMD Ryzen 7 9700X Ryzen 7 9700X, 3800 MHz |
13549 KB/s +5% |
| Intel Core Ultra 9 285K Ultra 9 285K, 3200 MHz |
12944 KB/s |
| Intel Core i7-14700K i7-14700K, 2500 MHz |
12800 KB/s -1% |
| Intel Core i5-14600K i5-14600K, 3500 MHz |
11491 KB/s -11% |
| Intel Core i5-13600K i5-13600K, 3500 MHz |
10937 KB/s -16% |
| Intel Core i9-12900K i9-12900K, 3200 MHz |
10792 KB/s -17% |
| Intel Core Ultra 5 245K Ultra 5 245K, 3600 MHz |
10521 KB/s -19% |
| Intel Core i5-12600K i5-12600K, 2800 MHz |
6239 KB/s -52% |
| TrueCrypt | |
| AES Mean 100MB | |
| AMD Ryzen 9 9950X Ryzen 9 9950X, 4300 MHz |
32.4 GB/s +87% |
| AMD Ryzen 9 7950X R9 7950X, 4500 MHz |
30.7 GB/s +77% |
| Intel Core i9-13900K i9-13900K, 3000 MHz |
27 GB/s +56% |
| AMD Ryzen 9 7950X3D R9 7950X3D, 4200 MHz |
26.9 GB/s +55% |
| Intel Core i9-14900K i9-14900K, 3200 MHz |
26.7 GB/s +54% |
| Intel Core i7-14700K i7-14700K, 2500 MHz |
25.6 GB/s +48% |
| Intel Core i5-14600K i5-14600K, 3500 MHz |
19.5 GB/s +13% |
| Intel Core i5-13600K i5-13600K, 3500 MHz |
18.8 GB/s +9% |
| Intel Core i9-12900K i9-12900K, 3200 MHz |
18.5 GB/s +7% |
| Intel Core Ultra 9 285K Ultra 9 285K, 3200 MHz |
17.3 GB/s |
| Intel Core Ultra 5 245K Ultra 5 245K, 3600 MHz |
16.4 GB/s -5% |
| AMD Ryzen 7 9700X Ryzen 7 9700X, 3800 MHz |
16.1 GB/s -7% |
| AMD Ryzen 7 7800X3D R7 7800X3D, 4200 MHz |
15.3 GB/s -12% |
| AMD Ryzen 9 7900X R9 7900X, 4700 MHz |
14.8 GB/s -14% |
| AMD Ryzen 5 9600X Ryzen 5 9600X, 3900 MHz |
13.4 GB/s -23% |
| Intel Core i5-12600K i5-12600K, 2800 MHz |
12.8 GB/s -26% |
| Twofish Mean 100MB | |
| Intel Core i9-14900K i9-14900K, 3200 MHz |
5.8 GB/s +16% |
| AMD Ryzen 9 9950X Ryzen 9 9950X, 4300 MHz |
5.6 GB/s +12% |
| Intel Core i9-13900K i9-13900K, 3000 MHz |
5.4 GB/s +8% |
| Intel Core Ultra 9 285K Ultra 9 285K, 3200 MHz |
5 GB/s |
| Intel Core i7-14700K i7-14700K, 2500 MHz |
4.6 GB/s -8% |
| AMD Ryzen 9 7950X R9 7950X, 4500 MHz |
4.5 GB/s -10% |
| AMD Ryzen 9 7950X3D R9 7950X3D, 4200 MHz |
4.2 GB/s -16% |
| Intel Core i9-12900K i9-12900K, 3200 MHz |
3.7 GB/s -26% |
| Intel Core i5-14600K i5-14600K, 3500 MHz |
3.4 GB/s -32% |
| Intel Core i5-13600K i5-13600K, 3500 MHz |
3.1 GB/s -38% |
| Intel Core Ultra 5 245K Ultra 5 245K, 3600 MHz |
3 GB/s -40% |
| AMD Ryzen 9 7900X R9 7900X, 4700 MHz |
2.8 GB/s -44% |
| AMD Ryzen 7 9700X Ryzen 7 9700X, 3800 MHz |
2.8 GB/s -44% |
| Intel Core i5-12600K i5-12600K, 2800 MHz |
2.2 GB/s -56% |
| AMD Ryzen 5 9600X Ryzen 5 9600X, 3900 MHz |
2.2 GB/s -56% |
| AMD Ryzen 7 7800X3D R7 7800X3D, 4200 MHz |
2.1 GB/s -58% |
| Serpent Mean 100MB | |
| AMD Ryzen 9 9950X Ryzen 9 9950X, 4300 MHz |
3.4 GB/s +36% |
| Intel Core i9-13900K i9-13900K, 3000 MHz |
3 GB/s +20% |
| AMD Ryzen 9 7950X R9 7950X, 4500 MHz |
2.8 GB/s +12% |
| AMD Ryzen 9 7950X3D R9 7950X3D, 4200 MHz |
2.8 GB/s +12% |
| Intel Core i9-14900K i9-14900K, 3200 MHz |
2.8 GB/s +12% |
| Intel Core i7-14700K i7-14700K, 2500 MHz |
2.6 GB/s +4% |
| Intel Core Ultra 9 285K Ultra 9 285K, 3200 MHz |
2.5 GB/s |
| Intel Core i9-12900K i9-12900K, 3200 MHz |
1.9 GB/s -24% |
| Intel Core i5-14600K i5-14600K, 3500 MHz |
1.8 GB/s -28% |
| Intel Core i5-13600K i5-13600K, 3500 MHz |
1.7 GB/s -32% |
| AMD Ryzen 7 9700X Ryzen 7 9700X, 3800 MHz |
1.7 GB/s -32% |
| AMD Ryzen 9 7900X R9 7900X, 4700 MHz |
1.5 GB/s -40% |
| Intel Core Ultra 5 245K Ultra 5 245K, 3600 MHz |
1.5 GB/s -40% |
| AMD Ryzen 5 9600X Ryzen 5 9600X, 3900 MHz |
1.4 GB/s -44% |
| Intel Core i5-12600K i5-12600K, 2800 MHz |
1.3 GB/s -48% |
| AMD Ryzen 7 7800X3D R7 7800X3D, 4200 MHz |
1.3 GB/s -48% |
| Geekbench 5.5 | |
| Single-Core | |
| AMD Ryzen 9 9950X Ryzen 9 9950X, 4300 MHz |
2559 Points +6% |
| AMD Ryzen 9 9900X Ryzen 9 9900X, 4400 MHz |
2544 Points +6% |
| AMD Ryzen 5 9600X Ryzen 5 9600X, 3900 MHz |
2523 Points +5% |
| AMD Ryzen 7 9700X Ryzen 7 9700X, 3800 MHz |
2507 Points +4% |
| Intel Core Ultra 9 285K Ultra 9 285K, 3200 MHz |
2409 Points |
| AMD Ryzen 9 7950X R9 7950X, 4500 MHz |
2311 Points -4% |
| AMD Ryzen 9 7950X3D R9 7950X3D, 4200 MHz |
2311 Points -4% |
| Intel Core i9-13900K i9-13900K, 3000 MHz |
2290 Points -5% |
| AMD Ryzen 9 7900X R9 7900X, 4700 MHz |
2274 Points -6% |
| Intel Core i9-14900K i9-14900K, 3200 MHz |
2243 Points -7% |
| Intel Core Ultra 5 245K Ultra 5 245K, 3600 MHz |
2224 Points -8% |
| Intel Core i7-14700K i7-14700K, 2500 MHz |
2121 Points -12% |
| Intel Core i9-12900K i9-12900K, 3200 MHz |
2042 Points -15% |
| AMD Ryzen 7 7800X3D R7 7800X3D, 4200 MHz |
2027 Points -16% |
| Intel Core i5-14600K i5-14600K, 3500 MHz |
2017 Points -16% |
| Intel Core i5-13600K i5-13600K, 3500 MHz |
1967 Points -18% |
| Intel Core i5-12600K i5-12600K, 2800 MHz |
1904 Points -21% |
| Multi-Core | |
| Intel Core Ultra 9 285K Ultra 9 285K, 3200 MHz |
26186 Points |
| Intel Core i9-14900K i9-14900K, 3200 MHz |
25867 Points -1% |
| AMD Ryzen 9 7950X R9 7950X, 4500 MHz |
24625 Points -6% |
| AMD Ryzen 9 7950X3D R9 7950X3D, 4200 MHz |
24343 Points -7% |
| Intel Core i9-13900K i9-13900K, 3000 MHz |
24157 Points -8% |
| AMD Ryzen 9 9950X Ryzen 9 9950X, 4300 MHz |
23982 Points -8% |
| Intel Core i7-14700K i7-14700K, 2500 MHz |
23159 Points -12% |
| AMD Ryzen 9 9900X Ryzen 9 9900X, 4400 MHz |
21384 Points -18% |
| AMD Ryzen 9 7900X R9 7900X, 4700 MHz |
19987 Points -24% |
| Intel Core i9-12900K i9-12900K, 3200 MHz |
17854 Points -32% |
| Intel Core Ultra 5 245K Ultra 5 245K, 3600 MHz |
17760 Points -32% |
| Intel Core i5-14600K i5-14600K, 3500 MHz |
17516 Points -33% |
| Intel Core i5-13600K i5-13600K, 3500 MHz |
16651 Points -36% |
| AMD Ryzen 7 9700X Ryzen 7 9700X, 3800 MHz |
14613 Points -44% |
| AMD Ryzen 7 7800X3D R7 7800X3D, 4200 MHz |
14252 Points -46% |
| Intel Core i5-12600K i5-12600K, 2800 MHz |
12797 Points -51% |
| AMD Ryzen 5 9600X Ryzen 5 9600X, 3900 MHz |
12751 Points -51% |
| Geekbench 6.4 | |
| Single-Core | |
| AMD Ryzen 9 9900X Ryzen 9 9900X, 4400 MHz |
3429 Points +4% |
| AMD Ryzen 9 9950X Ryzen 9 9950X, 4300 MHz |
3408 Points +3% |
| AMD Ryzen 7 9700X Ryzen 7 9700X, 3800 MHz |
3373 Points +2% |
| Intel Core Ultra 9 285K Ultra 9 285K, 3200 MHz |
3306 Points |
| Intel Core i9-14900K i9-14900K, 3200 MHz |
3243 Points -2% |
| Intel Core i9-13900K i9-13900K, 3000 MHz |
3070 Points -7% |
| Intel Core Ultra 5 245K Ultra 5 245K, 3600 MHz |
3040 Points -8% |
| AMD Ryzen 9 7950X3D R9 7950X3D, 4200 MHz |
2990 Points -10% |
| Intel Core i7-14700K i7-14700K, 2500 MHz |
2902 Points -12% |
| Intel Core i5-14600K i5-14600K, 3500 MHz |
2879 Points -13% |
| Intel Core i9-12900K i9-12900K, 3200 MHz |
2715 Points -18% |
| Multi-Core | |
| Intel Core Ultra 9 285K Ultra 9 285K, 3200 MHz |
21688 Points |
| Intel Core i9-14900K i9-14900K, 3200 MHz |
21678 Points 0% |
| AMD Ryzen 9 9950X Ryzen 9 9950X, 4300 MHz |
21383 Points -1% |
| Intel Core i9-13900K i9-13900K, 3000 MHz |
20800 Points -4% |
| AMD Ryzen 9 9900X Ryzen 9 9900X, 4400 MHz |
20380 Points -6% |
| AMD Ryzen 9 7950X3D R9 7950X3D, 4200 MHz |
19960 Points -8% |
| Intel Core i7-14700K i7-14700K, 2500 MHz |
19790 Points -9% |
| Intel Core Ultra 5 245K Ultra 5 245K, 3600 MHz |
17575 Points -19% |
| Intel Core i9-12900K i9-12900K, 3200 MHz |
17450 Points -20% |
| Intel Core i5-14600K i5-14600K, 3500 MHz |
17409 Points -20% |
| AMD Ryzen 7 9700X Ryzen 7 9700X, 3800 MHz |
16817 Points -22% |
| 7-Zip 18.03 | |
| 7z b 4 | |
| AMD Ryzen 9 7950X R9 7950X, 4500 MHz |
161724 MIPS +25% |
| AMD Ryzen 9 9950X Ryzen 9 9950X, 4300 MHz |
160423 MIPS +24% |
| AMD Ryzen 9 7950X3D R9 7950X3D, 4200 MHz |
159341 MIPS +23% |
| Intel Core i9-14900K i9-14900K, 3200 MHz |
149570 MIPS +15% |
| Intel Core i9-13900K i9-13900K, 3000 MHz |
147068 MIPS +13% |
| Intel Core i7-14700K i7-14700K, 2500 MHz |
135648 MIPS +4% |
| Intel Core Ultra 9 285K Ultra 9 285K, 3200 MHz |
129871 MIPS |
| AMD Ryzen 9 7900X R9 7900X, 4700 MHz |
124975 MIPS -4% |
| AMD Ryzen 9 9900X Ryzen 9 9900X, 4400 MHz |
122724 MIPS -6% |
| Intel Core i9-12900K i9-12900K, 3200 MHz |
97671 MIPS -25% |
| Intel Core i5-14600K i5-14600K, 3500 MHz |
93235 MIPS -28% |
| Intel Core i5-13600K i5-13600K, 3500 MHz |
89647 MIPS -31% |
| AMD Ryzen 7 7800X3D R7 7800X3D, 4200 MHz |
85067 MIPS -34% |
| AMD Ryzen 7 9700X Ryzen 7 9700X, 3800 MHz |
82553 MIPS -36% |
| Intel Core Ultra 5 245K Ultra 5 245K, 3600 MHz |
77921 MIPS -40% |
| AMD Ryzen 5 9600X Ryzen 5 9600X, 3900 MHz |
68220 MIPS -47% |
| Intel Core i5-12600K i5-12600K, 2800 MHz |
64260 MIPS -51% |
| 7z b 4 -mmt1 | |
| AMD Ryzen 9 7950X R9 7950X, 4500 MHz |
8365 MIPS +12% |
| AMD Ryzen 9 7950X3D R9 7950X3D, 4200 MHz |
8321 MIPS +12% |
| AMD Ryzen 9 7900X R9 7900X, 4700 MHz |
8282 MIPS +11% |
| AMD Ryzen 7 7800X3D R7 7800X3D, 4200 MHz |
8235 MIPS +11% |
| AMD Ryzen 9 9900X Ryzen 9 9900X, 4400 MHz |
8020 MIPS +8% |
| AMD Ryzen 7 9700X Ryzen 7 9700X, 3800 MHz |
7894 MIPS +6% |
| AMD Ryzen 9 9950X Ryzen 9 9950X, 4300 MHz |
7852 MIPS +5% |
| AMD Ryzen 5 9600X Ryzen 5 9600X, 3900 MHz |
7796 MIPS +5% |
| Intel Core i9-14900K i9-14900K, 3200 MHz |
7772 MIPS +4% |
| Intel Core Ultra 9 285K Ultra 9 285K, 3200 MHz |
7444 MIPS |
| Intel Core i7-14700K i7-14700K, 2500 MHz |
7351 MIPS -1% |
| Intel Core i9-13900K i9-13900K, 3000 MHz |
7272 MIPS -2% |
| Intel Core i5-14600K i5-14600K, 3500 MHz |
6910 MIPS -7% |
| Intel Core i9-12900K i9-12900K, 3200 MHz |
6571 MIPS -12% |
| Intel Core i5-13600K i5-13600K, 3500 MHz |
6502 MIPS -13% |
| Intel Core Ultra 5 245K Ultra 5 245K, 3600 MHz |
6477 MIPS -13% |
| Intel Core i5-12600K i5-12600K, 2800 MHz |
5944 MIPS -20% |
| R Benchmark 2.5 - Overall mean | |
| Intel Core i5-12600K i5-12600K, 2800 MHz |
0.4456 sec * -17% |
| Intel Core i9-12900K i9-12900K, 3200 MHz |
0.4216 sec * -11% |
| AMD Ryzen 7 7800X3D R7 7800X3D, 4200 MHz |
0.4152 sec * -9% |
| Intel Core Ultra 5 245K Ultra 5 245K, 3600 MHz |
0.4086 sec * -8% |
| Intel Core Ultra 5 245K Ultra 5 245K, 3600 MHz |
0.4058 sec * -7% |
| Intel Core i5-13600K i5-13600K, 3500 MHz |
0.405 sec * -7% |
| Intel Core i5-14600K i5-14600K, 3500 MHz |
0.3937 sec * -4% |
| Intel Core i7-14700K i7-14700K, 2500 MHz |
0.3826 sec * -1% |
| Intel Core Ultra 9 285K Ultra 9 285K, 3200 MHz |
0.3796 sec * |
| AMD Ryzen 9 7900X R9 7900X, 4700 MHz |
0.3736 sec * +2% |
| AMD Ryzen 9 7950X3D R9 7950X3D, 4200 MHz |
0.372 sec * +2% |
| AMD Ryzen 9 7950X R9 7950X, 4500 MHz |
0.3682 sec * +3% |
| Intel Core i9-13900K i9-13900K, 3000 MHz |
0.3539 sec * +7% |
| Intel Core i9-14900K i9-14900K, 3200 MHz |
0.345 sec * +9% |
| AMD Ryzen 7 9700X Ryzen 7 9700X, 3800 MHz |
0.3414 sec * +10% |
| AMD Ryzen 5 9600X Ryzen 5 9600X, 3900 MHz |
0.3389 sec * +11% |
| AMD Ryzen 9 9900X Ryzen 9 9900X, 4400 MHz |
0.336 sec * +11% |
| AMD Ryzen 9 9950X Ryzen 9 9950X, 4300 MHz |
0.3307 sec * +13% |
| LibreOffice - 20 Documents To PDF | |
| Intel Core i5-12600K i5-12600K, 2800 MHz |
71.8 s * -90% |
| AMD Ryzen 5 9600X Ryzen 5 9600X, 3900 MHz |
46.4 s * -23% |
| AMD Ryzen 9 9950X Ryzen 9 9950X, 4300 MHz |
45.1 s * -20% |
| AMD Ryzen 9 9900X Ryzen 9 9900X, 4400 MHz |
44.2 s * -17% |
| AMD Ryzen 7 9700X Ryzen 7 9700X, 3800 MHz |
43.8 s * -16% |
| Intel Core Ultra 5 245K Ultra 5 245K, 3600 MHz |
43.1 s * -14% |
| Intel Core Ultra 5 245K Ultra 5 245K, 3600 MHz |
39.3 s * -4% |
| AMD Ryzen 7 7800X3D R7 7800X3D, 4200 MHz |
40.7 s * -8% |
| Intel Core i9-12900K i9-12900K, 3200 MHz |
40.6 s * -8% |
| Intel Core i7-14700K i7-14700K, 2500 MHz |
39.8 s * -6% |
| AMD Ryzen 9 7950X3D R9 7950X3D, 4200 MHz |
38.6 s * -2% |
| Intel Core Ultra 9 285K Ultra 9 285K, 3200 MHz |
37.7 s * |
| Intel Core i9-13900K i9-13900K, 3000 MHz |
36.6 s * +3% |
| AMD Ryzen 9 7950X R9 7950X, 4500 MHz |
35.5 s * +6% |
| Intel Core i5-13600K i5-13600K, 3500 MHz |
35 s * +7% |
| AMD Ryzen 9 7900X R9 7900X, 4700 MHz |
34.9 s * +7% |
| Intel Core i9-14900K i9-14900K, 3200 MHz |
32.5 s * +14% |
| Intel Core i5-14600K i5-14600K, 3500 MHz |
31.9 s * +15% |
| WebXPRT 3 - Overall | |
| AMD Ryzen 9 9950X Ryzen 9 9950X, 4300 MHz |
409 Points +3% |
| AMD Ryzen 7 9700X Ryzen 7 9700X, 3800 MHz |
398 Points 0% |
| AMD Ryzen 9 9900X Ryzen 9 9900X, 4400 MHz |
398 Points 0% |
| Intel Core Ultra 9 285K Ultra 9 285K, 3200 MHz |
397 Points |
| AMD Ryzen 9 7950X3D R9 7950X3D, 4200 MHz |
383 Points -4% |
| Intel Core i9-14900K i9-14900K, 3200 MHz |
382 Points -4% |
| AMD Ryzen 9 7900X R9 7900X, 4700 MHz |
371 Points -7% |
| AMD Ryzen 9 7950X R9 7950X, 4500 MHz |
366 Points -8% |
| AMD Ryzen 5 9600X Ryzen 5 9600X, 3900 MHz |
364 Points -8% |
| Intel Core i9-13900K i9-13900K, 3000 MHz |
361 Points -9% |
| Intel Core i5-14600K i5-14600K, 3500 MHz |
354 Points -11% |
| AMD Ryzen 7 7800X3D R7 7800X3D, 4200 MHz |
353 Points -11% |
| Intel Core Ultra 5 245K Ultra 5 245K, 3600 MHz |
346 Points -13% |
| Intel Core i7-14700K i7-14700K, 2500 MHz |
339 Points -15% |
| Intel Core i5-13600K i5-13600K, 3500 MHz |
333 Points -16% |
| Intel Core i9-12900K i9-12900K, 3200 MHz |
320 Points -19% |
| Intel Core i5-12600K i5-12600K, 2800 MHz |
293 Points -26% |
| WebXPRT 4 - Overall | |
| AMD Ryzen 9 9950X Ryzen 9 9950X, 4300 MHz |
357 Points +1% |
| Intel Core Ultra 9 285K Ultra 9 285K, 3200 MHz |
355 Points |
| AMD Ryzen 9 9900X Ryzen 9 9900X, 4400 MHz |
349 Points -2% |
| AMD Ryzen 7 9700X Ryzen 7 9700X, 3800 MHz |
346 Points -3% |
| AMD Ryzen 5 9600X Ryzen 5 9600X, 3900 MHz |
338 Points -5% |
| Intel Core Ultra 5 245K Ultra 5 245K, 3600 MHz |
318 Points -10% |
| Intel Core i9-13900K i9-13900K, 3000 MHz |
316 Points -11% |
| AMD Ryzen 9 7900X R9 7900X, 4700 MHz |
314 Points -12% |
| Intel Core i7-14700K i7-14700K, 2500 MHz |
314 Points -12% |
| AMD Ryzen 9 7950X3D R9 7950X3D, 4200 MHz |
313 Points -12% |
| AMD Ryzen 9 7950X R9 7950X, 4500 MHz |
304 Points -14% |
| Intel Core i5-14600K i5-14600K, 3500 MHz |
301 Points -15% |
| Intel Core i5-13600K i5-13600K, 3500 MHz |
288 Points -19% |
| AMD Ryzen 7 7800X3D R7 7800X3D, 4200 MHz |
282 Points -21% |
| Mozilla Kraken 1.1 - Total | |
| Intel Core i5-12600K i5-12600K, 2800 MHz |
511 ms * -29% |
| AMD Ryzen 7 7800X3D R7 7800X3D, 4200 MHz |
487 ms * -23% |
| Intel Core i9-12900K i9-12900K, 3200 MHz |
481 ms * -21% |
| Intel Core i5-13600K i5-13600K, 3500 MHz |
469 ms * -18% |
| Intel Core i5-14600K i5-14600K, 3500 MHz |
450 ms * -13% |
| Intel Core i7-14700K i7-14700K, 2500 MHz |
439 ms * -11% |
| AMD Ryzen 9 7950X3D R9 7950X3D, 4200 MHz |
437 ms * -10% |
| AMD Ryzen 9 7950X R9 7950X, 4500 MHz |
433 ms * -9% |
| Intel Core i9-13900K i9-13900K, 3000 MHz |
432 ms * -9% |
| AMD Ryzen 9 7900X R9 7900X, 4700 MHz |
431 ms * -9% |
| Intel Core Ultra 5 245K Ultra 5 245K, 3600 MHz |
425 ms * -7% |
| Intel Core i9-14900K i9-14900K, 3200 MHz |
418 ms * -5% |
| Intel Core Ultra 9 285K Ultra 9 285K, 3200 MHz |
397 ms * |
| AMD Ryzen 5 9600X Ryzen 5 9600X, 3900 MHz |
389 ms * +2% |
| AMD Ryzen 7 9700X Ryzen 7 9700X, 3800 MHz |
383 ms * +4% |
| AMD Ryzen 9 9900X Ryzen 9 9900X, 4400 MHz |
383 ms * +4% |
| AMD Ryzen 9 9950X Ryzen 9 9950X, 4300 MHz |
377 ms * +5% |
| V-Ray Benchmark Next 4.10 - CPU | |
| AMD Ryzen 9 9950X Ryzen 9 9950X, 4300 MHz |
45178 ksamples +2% |
| Intel Core Ultra 9 285K Ultra 9 285K, 3200 MHz |
44113 ksamples |
| AMD Ryzen 9 7950X R9 7950X, 4500 MHz |
43529 ksamples -1% |
| AMD Ryzen 9 7950X3D R9 7950X3D, 4200 MHz |
42381 ksamples -4% |
| Intel Core i9-14900K i9-14900K, 3200 MHz |
40942 ksamples -7% |
| Intel Core i9-13900K i9-13900K, 3000 MHz |
40076 ksamples -9% |
| AMD Ryzen 9 9900X Ryzen 9 9900X, 4400 MHz |
36389 ksamples -18% |
| Intel Core i7-14700K i7-14700K, 2500 MHz |
35640 ksamples -19% |
| AMD Ryzen 9 7900X R9 7900X, 4700 MHz |
32353 ksamples -27% |
| Intel Core i9-12900K i9-12900K, 3200 MHz |
27376 ksamples -38% |
| Intel Core Ultra 5 245K Ultra 5 245K, 3600 MHz |
25063 ksamples -43% |
| Intel Core i5-14600K i5-14600K, 3500 MHz |
24871 ksamples -44% |
| Intel Core i5-13600K i5-13600K, 3500 MHz |
24288 ksamples -45% |
| AMD Ryzen 7 9700X Ryzen 7 9700X, 3800 MHz |
23591 ksamples -47% |
| AMD Ryzen 5 9600X Ryzen 5 9600X, 3900 MHz |
19653 ksamples -55% |
| Intel Core i5-12600K i5-12600K, 2800 MHz |
17739 ksamples -60% |
| V-Ray 5 Benchmark - CPU | |
| AMD Ryzen 9 9950X Ryzen 9 9950X, 4300 MHz |
31302 mpaths +2% |
| Intel Core Ultra 9 285K Ultra 9 285K, 3200 MHz |
30762 mpaths |
| AMD Ryzen 9 7950X R9 7950X, 4500 MHz |
29602 mpaths -4% |
| AMD Ryzen 9 7950X3D R9 7950X3D, 4200 MHz |
28258 mpaths -8% |
| Intel Core i9-13900K i9-13900K, 3000 MHz |
27447 mpaths -11% |
| Intel Core i9-14900K i9-14900K, 3200 MHz |
27341 mpaths -11% |
| Intel Core i7-14700K i7-14700K, 2500 MHz |
23557 mpaths -23% |
| AMD Ryzen 9 7900X R9 7900X, 4700 MHz |
22376 mpaths -27% |
| Intel Core i9-12900K i9-12900K, 3200 MHz |
18056 mpaths -41% |
| Intel Core Ultra 5 245K Ultra 5 245K, 3600 MHz |
17310 mpaths -44% |
| Intel Core i5-14600K i5-14600K, 3500 MHz |
16552 mpaths -46% |
| Intel Core i5-13600K i5-13600K, 3500 MHz |
16034 mpaths -48% |
| AMD Ryzen 7 9700X Ryzen 7 9700X, 3800 MHz |
15648 mpaths -49% |
| AMD Ryzen 7 7800X3D R7 7800X3D, 4200 MHz |
14397 mpaths -53% |
| AMD Ryzen 5 9600X Ryzen 5 9600X, 3900 MHz |
13355 mpaths -57% |
| Intel Core i5-12600K i5-12600K, 2800 MHz |
11579 mpaths -62% |
| wPrime 2.10 | |
| 32m | |
| Intel Core i9-12900K i9-12900K, 3200 MHz |
4.924 s * -132% |
| Intel Core i5-12600K i5-12600K, 2800 MHz |
4.725 s * -123% |
| Intel Core Ultra 5 245K Ultra 5 245K, 3600 MHz |
2.976 s * -40% |
| AMD Ryzen 5 9600X Ryzen 5 9600X, 3900 MHz |
2.617 s * -23% |
| Intel Core i5-13600K i5-13600K, 3500 MHz |
2.527 s * -19% |
| AMD Ryzen 7 7800X3D R7 7800X3D, 4200 MHz |
2.435 s * -15% |
| Intel Core i5-14600K i5-14600K, 3500 MHz |
2.39 s * -13% |
| AMD Ryzen 7 9700X Ryzen 7 9700X, 3800 MHz |
2.36 s * -11% |
| Intel Core i7-14700K i7-14700K, 2500 MHz |
2.147 s * -1% |
| Intel Core Ultra 9 285K Ultra 9 285K, 3200 MHz |
2.12 s * |
| AMD Ryzen 9 9950X Ryzen 9 9950X, 4300 MHz |
2.077 s * +2% |
| Intel Core i9-14900K i9-14900K, 3200 MHz |
2.07 s * +2% |
| AMD Ryzen 9 7950X3D R9 7950X3D, 4200 MHz |
2.007 s * +5% |
| Intel Core i9-13900K i9-13900K, 3000 MHz |
1.818 s * +14% |
| AMD Ryzen 9 7900X R9 7900X, 4700 MHz |
1.781 s * +16% |
| AMD Ryzen 9 7950X R9 7950X, 4500 MHz |
1.669 s * +21% |
| 1024m | |
| Intel Core i5-12600K i5-12600K, 2800 MHz |
202.7 s * -376% |
| Intel Core i9-12900K i9-12900K, 3200 MHz |
190.6 s * -348% |
| Intel Core i5-13600K i5-13600K, 3500 MHz |
177.592 s * -317% |
| Intel Core i5-14600K i5-14600K, 3500 MHz |
158.77 s * -273% |
| Intel Core i7-14700K i7-14700K, 2500 MHz |
109.801 s * -158% |
| Intel Core i9-13900K i9-13900K, 3000 MHz |
79.738 s * -87% |
| Intel Core Ultra 5 245K Ultra 5 245K, 3600 MHz |
77.721 s * -82% |
| Intel Core i9-14900K i9-14900K, 3200 MHz |
74.47 s * -75% |
| AMD Ryzen 5 9600X Ryzen 5 9600X, 3900 MHz |
72.546 s * -70% |
| AMD Ryzen 7 7800X3D R7 7800X3D, 4200 MHz |
62.733 s * -47% |
| AMD Ryzen 7 9700X Ryzen 7 9700X, 3800 MHz |
59.56 s * -40% |
| Intel Core Ultra 9 285K Ultra 9 285K, 3200 MHz |
42.591 s * |
| AMD Ryzen 9 7900X R9 7900X, 4700 MHz |
39.954 s * +6% |
| AMD Ryzen 9 7950X3D R9 7950X3D, 4200 MHz |
33.879 s * +20% |
| AMD Ryzen 9 7950X R9 7950X, 4500 MHz |
30.811 s * +28% |
| AMD Ryzen 9 9950X Ryzen 9 9950X, 4300 MHz |
29.318 s * +31% |
| Super Pi mod 1.5 XS 1M - 1M | |
| AMD Ryzen 5 9600X Ryzen 5 9600X, 3900 MHz |
7.614 s * -11% |
| AMD Ryzen 7 9700X Ryzen 7 9700X, 3800 MHz |
7.54 s * -10% |
| Intel Core i5-12600K i5-12600K, 2800 MHz |
7.406 s * -8% |
| AMD Ryzen 9 9950X Ryzen 9 9950X, 4300 MHz |
7.31 s * -7% |
| Intel Core Ultra 5 245K Ultra 5 245K, 3600 MHz |
7.303 s * -7% |
| AMD Ryzen 7 7800X3D R7 7800X3D, 4200 MHz |
7.089 s * -3% |
| Intel Core i9-12900K i9-12900K, 3200 MHz |
7.063 s * -3% |
| Intel Core Ultra 9 285K Ultra 9 285K, 3200 MHz |
6.857 s * |
| Intel Core i5-13600K i5-13600K, 3500 MHz |
6.58 s * +4% |
| Intel Core i5-14600K i5-14600K, 3500 MHz |
6.234 s * +9% |
| AMD Ryzen 9 7900X R9 7900X, 4700 MHz |
6.141 s * +10% |
| AMD Ryzen 9 7950X3D R9 7950X3D, 4200 MHz |
6.109 s * +11% |
| AMD Ryzen 9 7950X R9 7950X, 4500 MHz |
6.088 s * +11% |
| Intel Core i7-14700K i7-14700K, 2500 MHz |
5.98 s * +13% |
| Intel Core i9-13900K i9-13900K, 3000 MHz |
5.655 s * +18% |
| Intel Core i9-14900K i9-14900K, 3200 MHz |
5.476 s * +20% |
| Super Pi mod 1.5 XS 2M - 2M | |
| Intel Core i5-12600K i5-12600K, 2800 MHz |
16.42 s * -10% |
| AMD Ryzen 5 9600X Ryzen 5 9600X, 3900 MHz |
16.363 s * -10% |
| AMD Ryzen 7 9700X Ryzen 7 9700X, 3800 MHz |
16.1 s * -8% |
| Intel Core Ultra 5 245K Ultra 5 245K, 3600 MHz |
16.026 s * -7% |
| AMD Ryzen 9 9950X Ryzen 9 9950X, 4300 MHz |
15.61 s * -5% |
| Intel Core i9-12900K i9-12900K, 3200 MHz |
15.59 s * -4% |
| AMD Ryzen 7 7800X3D R7 7800X3D, 4200 MHz |
15.335 s * -3% |
| Intel Core Ultra 9 285K Ultra 9 285K, 3200 MHz |
14.936 s * |
| Intel Core i5-13600K i5-13600K, 3500 MHz |
14.876 s * -0% |
| Intel Core i5-14600K i5-14600K, 3500 MHz |
13.657 s * +9% |
| AMD Ryzen 9 7950X R9 7950X, 4500 MHz |
13.291 s * +11% |
| AMD Ryzen 9 7900X R9 7900X, 4700 MHz |
13.251 s * +11% |
| Intel Core i9-13900K i9-13900K, 3000 MHz |
13.193 s * +12% |
| AMD Ryzen 9 7950X3D R9 7950X3D, 4200 MHz |
13.189 s * +12% |
| Intel Core i7-14700K i7-14700K, 2500 MHz |
12.844 s * +14% |
| Intel Core i9-14900K i9-14900K, 3200 MHz |
11.996 s * +20% |
* ... smaller is better
Cinebench R15 多回路运行
与前代产品一样,酷睿至尊 9 285K 的包装盒中没有配备 CPU 散热器。英特尔表示,为 LGA 1700 设计的散热器应与 LGA 1851 兼容。我们使用与 LGA 1700 插座相同的安装支架安装 Thermaltake TH420 V2 Ultra EX ARGB 一体式散热器时没有遇到任何问题。
尽管如此,我们仍期待看到新的 LGA 1851 专用散热器,它们会考虑到包装西南部的 Compute 瓦的存在。专为 Arrow Lake-S 设计的散热器可能会提供稍好的散热性能,但现有的 LGA 1700 解决方案也能正常工作。
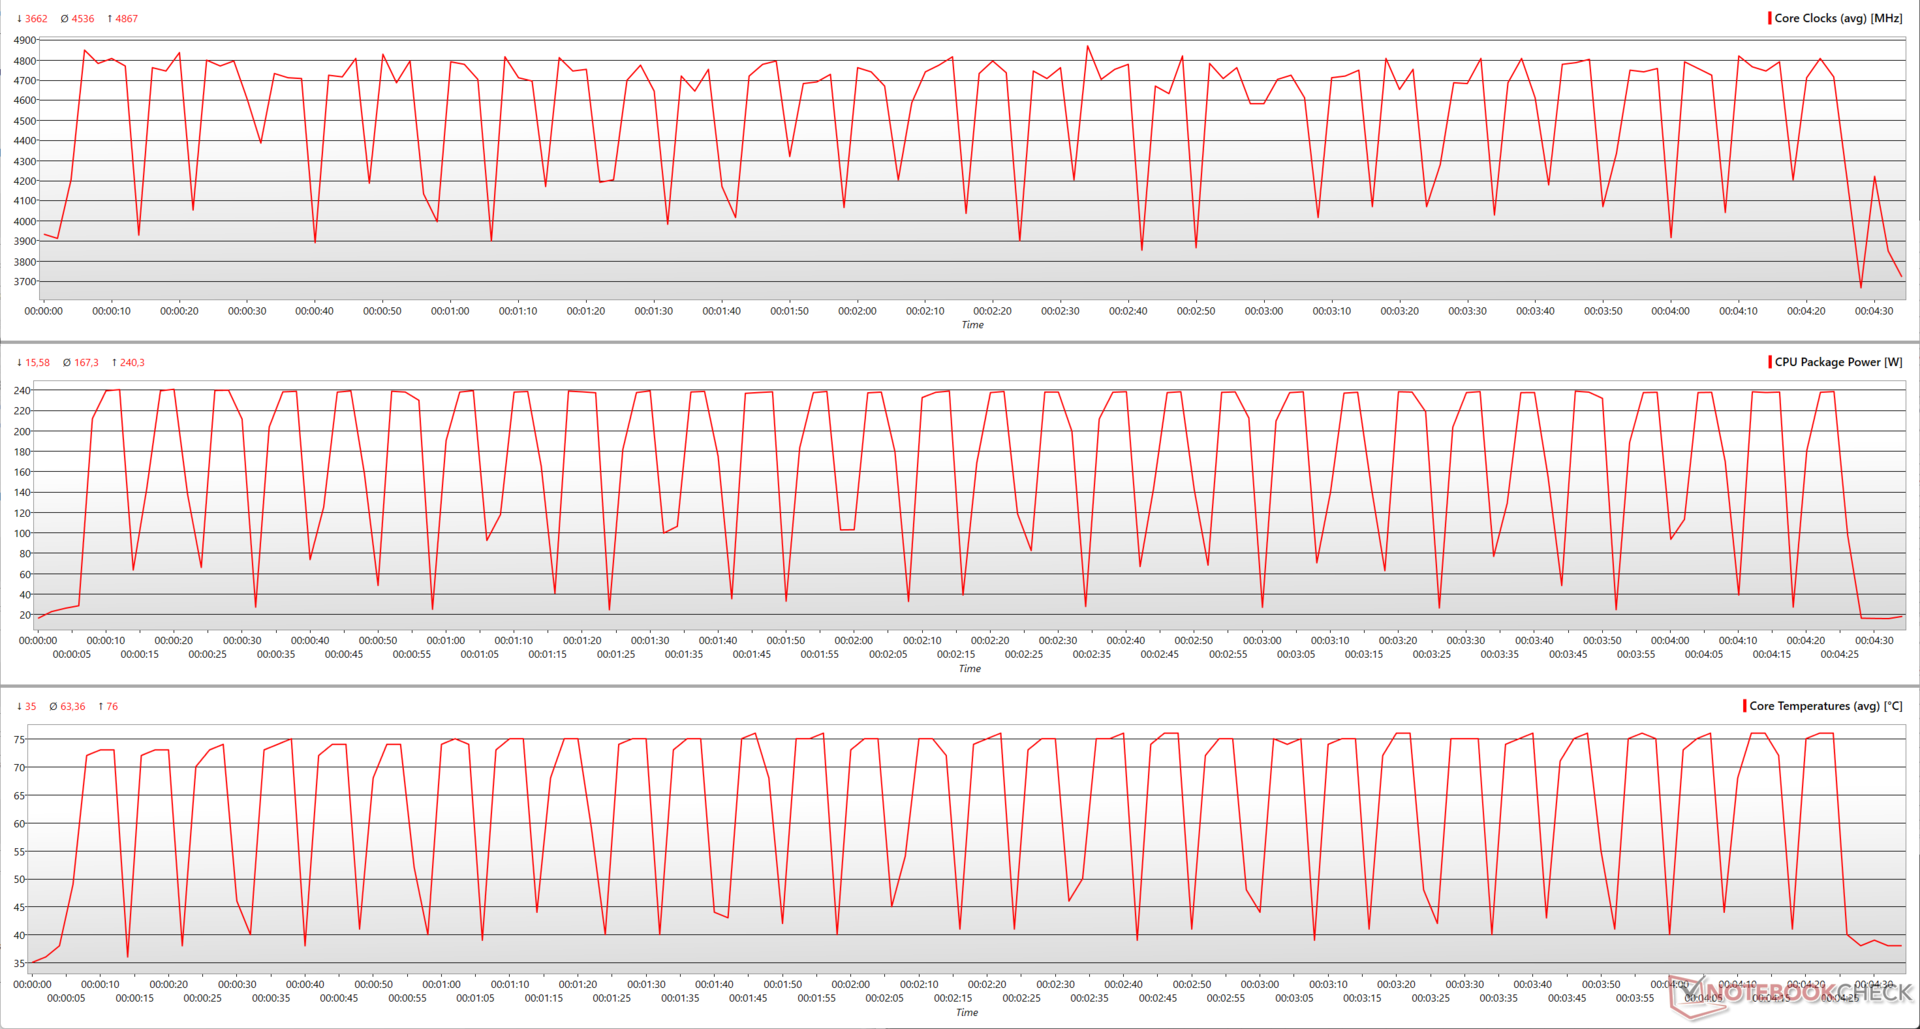
在下面的 Cinebench R15 多核循环测试中,TH420 V2 Ultra EX 为酷睿 Ultra 9 285K 带来的稳定性能充分证明了它的高效散热能力。
我们看到,在 Cinebench R15 多核循环中,酷睿至尊 9 285K 的主频最高可达 4.86 GHz,平均主频为 4.53 GHz。
实现这一性能的封装功耗为 240 W,最高核心温度为 76 °C,明显低于Core i9-14900K 的 349 W 和 87 °C。事实上,即使是Core i7-14700K 的数据也更高,封装功耗为 313 W,核心温度为 92 °C。
Core Ultra 9 285K 的平均封装功耗为 167 W,核心温度为 63 °C,均低于 Core i7-14700K 的 195 W 和 76 °C。
| Cinebench 2024 CPU Multi Core in comparison | |
| Asus ExpertCenter PN42-BBN200MV (min)
N200, UHD Graphics Xe 750 32EUs | 91 |
| ... | |
| Asus Strix Scar 18 G835LX Ultra 9 275HX, GeForce RTX 5090 Laptop | 2223 |
| i9-14900K, NVIDIA GeForce RTX 4090 | 2352 |
| AMD Ryzen 9 9950X3D Ryzen 9 9950X3D, NVIDIA GeForce RTX 4090 | 2365 |
| Intel Core Ultra 9 285K Ultra 9 285K, NVIDIA GeForce RTX 4090 | 2436 |
| ... | |
| (max)
TR Pro 7995WX, RTX 6000 Ada Generation | 5372 |
系统性能与酷睿 i9-14900K 和 AMD Zen 5 性能相当
酷睿至尊 9 285K 的整体系统性能与酷睿 i9-14900K 和 Ryzen 9 9950X 相当,与我们看到的 与 Ryzen 9 7950X, 酷睿 i9-13900K和 Ryzen 9 9900X 的性能相差不大。
不过,在 3DMarkTime Spy CPU、3DMark 11 Performance Physics 和 CrossMark 中,个别基准测试显示酷睿 i9-14900K 的性能略胜一筹。PCMark 10 总体上显示酷睿至尊 9 285K 比酷睿 i9-14900K 略胜一筹,但主要与 AMD Zen 5 相当。
AMD CPU 在 AIDA64 CPU 测试中优势明显,但在 CPU PhotoWorxx 测试中,Core Ultra 9 285K 明显领先。
不过,在日常使用中,常规的生产力任务不会出现任何问题。
3DMark 11: 1280x720 Performance Physics
3DMark: 1920x1080 Fire Strike Physics | 2560x1440 Time Spy CPU
CrossMark: Overall | Responsiveness | Creativity | Productivity
PCMark 10: Score | Essentials | Productivity | Digital Content Creation
AIDA64: FP32 Ray-Trace | FPU Julia | CPU SHA3 | CPU Queen | FPU SinJulia | FPU Mandel | CPU AES | CPU ZLib | FP64 Ray-Trace | CPU PhotoWorxx
| System Performance Rating | |
| AMD Ryzen 9 9950X |
57 pt |
| Intel Core i9-14900K |
54.9 pt |
| Intel Core Ultra 9 285K |
53.9 pt |
| AMD Ryzen 9 7950X |
53.6 pt |
| AMD Ryzen 9 9900X |
52.9 pt |
| Intel Core i9-13900K |
52.8 pt |
| AMD Ryzen 9 7950X3D -2! |
50.5 pt |
| Intel Core i7-14700K |
49.9 pt |
| AMD Ryzen 9 7900X |
49.6 pt |
| AMD Ryzen 7 9700X |
47.1 pt |
| Intel Core i5-14600K |
46.4 pt |
| AMD Ryzen 7 7800X3D |
44.6 pt |
| Intel Core i5-13600K |
44.5 pt |
| AMD Ryzen 5 9600X |
42.8 pt |
| Intel Core Ultra 5 245K |
41.9 pt |
| Intel Core i9-12900K -4! |
36.5 pt |
| Intel Core i5-12600K -4! |
31.3 pt |
| 3DMark 11 / Performance Physics | |
| AMD Ryzen 9 9950X |
38269 Points +24% |
| AMD Ryzen 9 7950X3D |
36991 Points +20% |
| AMD Ryzen 7 7800X3D |
35127 Points +14% |
| Intel Core i7-14700K |
32336 Points +5% |
| Intel Core i9-13900K |
32273 Points +5% |
| Intel Core i9-14900K |
32188 Points +5% |
| Intel Core i5-14600K |
31641 Points +3% |
| Intel Core Ultra 9 285K |
30767 Points |
| AMD Ryzen 7 9700X |
30757 Points 0% |
| Intel Core i5-13600K |
30480 Points -1% |
| AMD Ryzen 9 9900X |
29231 Points -5% |
| AMD Ryzen 9 7900X |
28618 Points -7% |
| AMD Ryzen 9 7950X |
28618 Points -7% |
| Intel Core i9-12900K |
28211 Points -8% |
| Intel Core Ultra 5 245K |
27022 Points -12% |
| AMD Ryzen 5 9600X |
25717 Points -16% |
| Intel Core i5-12600K |
25017 Points -19% |
| 3DMark / Fire Strike Physics | |
| Intel Core i9-14900K |
56087 Points +5% |
| Intel Core i9-13900K |
53853 Points +1% |
| Intel Core Ultra 9 285K |
53541 Points |
| AMD Ryzen 9 9950X |
49522 Points -8% |
| Intel Core i7-14700K |
49142 Points -8% |
| AMD Ryzen 9 7950X3D |
44787 Points -16% |
| AMD Ryzen 9 9900X |
44322 Points -17% |
| AMD Ryzen 9 7900X |
42682 Points -20% |
| AMD Ryzen 9 7950X |
42682 Points -20% |
| Intel Core i5-14600K |
40164 Points -25% |
| Intel Core i9-12900K |
39112 Points -27% |
| Intel Core Ultra 5 245K |
38202 Points -29% |
| AMD Ryzen 7 9700X |
38088 Points -29% |
| Intel Core i5-13600K |
35386 Points -34% |
| AMD Ryzen 5 9600X |
33462 Points -38% |
| AMD Ryzen 7 7800X3D |
33345 Points -38% |
| Intel Core i5-12600K |
29671 Points -45% |
| 3DMark / Time Spy CPU | |
| Intel Core i9-14900K |
23721 Points +29% |
| Intel Core i7-14700K |
21541 Points +18% |
| Intel Core i9-13900K |
19392 Points +6% |
| Intel Core i5-14600K |
18768 Points +2% |
| Intel Core i9-12900K |
18431 Points +1% |
| Intel Core Ultra 9 285K |
18322 Points |
| AMD Ryzen 9 7950X3D |
17206 Points -6% |
| Intel Core i5-13600K |
17124 Points -7% |
| AMD Ryzen 9 7900X |
16616 Points -9% |
| AMD Ryzen 9 7950X |
16616 Points -9% |
| AMD Ryzen 9 9950X |
16112 Points -12% |
| AMD Ryzen 9 9900X |
15940 Points -13% |
| Intel Core Ultra 5 245K |
15010 Points -18% |
| AMD Ryzen 7 9700X |
14306 Points -22% |
| AMD Ryzen 7 7800X3D |
14098 Points -23% |
| Intel Core i5-12600K |
13869 Points -24% |
| AMD Ryzen 5 9600X |
10821 Points -41% |
| CrossMark / Overall | |
| Intel Core i9-14900K |
2611 Points +3% |
| Intel Core i9-13900K |
2589 Points +2% |
| Intel Core Ultra 9 285K |
2529 Points |
| AMD Ryzen 9 7950X |
2512 Points -1% |
| AMD Ryzen 9 9950X |
2451 Points -3% |
| AMD Ryzen 9 7900X |
2405 Points -5% |
| Intel Core i5-14600K |
2310 Points -9% |
| AMD Ryzen 9 9900X |
2289 Points -9% |
| Intel Core i7-14700K |
2288 Points -10% |
| Intel Core i5-13600K |
2271 Points -10% |
| Intel Core Ultra 5 245K |
2245 Points -11% |
| AMD Ryzen 7 7800X3D |
2216 Points -12% |
| AMD Ryzen 9 7950X3D |
2193 Points -13% |
| AMD Ryzen 7 9700X |
2174 Points -14% |
| AMD Ryzen 5 9600X |
2103 Points -17% |
| CrossMark / Responsiveness | |
| Intel Core i9-13900K |
2653 Points +13% |
| Intel Core i9-14900K |
2413 Points +3% |
| Intel Core Ultra 9 285K |
2351 Points |
| Intel Core i5-13600K |
2350 Points 0% |
| AMD Ryzen 9 7950X |
2288 Points -3% |
| AMD Ryzen 9 7900X |
2251 Points -4% |
| Intel Core Ultra 5 245K |
2169 Points -8% |
| Intel Core i5-14600K |
2090 Points -11% |
| AMD Ryzen 7 7800X3D |
2039 Points -13% |
| Intel Core i7-14700K |
2033 Points -14% |
| AMD Ryzen 9 9950X |
2024 Points -14% |
| AMD Ryzen 9 7950X3D |
1795 Points -24% |
| AMD Ryzen 9 9900X |
1795 Points -24% |
| AMD Ryzen 7 9700X |
1616 Points -31% |
| AMD Ryzen 5 9600X |
1536 Points -35% |
| CrossMark / Creativity | |
| AMD Ryzen 9 9950X |
2929 Points +6% |
| Intel Core i9-14900K |
2891 Points +5% |
| AMD Ryzen 9 7950X |
2786 Points +1% |
| Intel Core i9-13900K |
2784 Points +1% |
| Intel Core Ultra 9 285K |
2766 Points |
| AMD Ryzen 9 9900X |
2743 Points -1% |
| AMD Ryzen 9 7900X |
2673 Points -3% |
| Intel Core i7-14700K |
2601 Points -6% |
| AMD Ryzen 7 9700X |
2590 Points -6% |
| Intel Core i5-14600K |
2575 Points -7% |
| AMD Ryzen 9 7950X3D |
2552 Points -8% |
| AMD Ryzen 5 9600X |
2501 Points -10% |
| AMD Ryzen 7 7800X3D |
2434 Points -12% |
| Intel Core i5-13600K |
2412 Points -13% |
| Intel Core Ultra 5 245K |
2364 Points -15% |
| CrossMark / Productivity | |
| Intel Core i9-14900K |
2421 Points +2% |
| Intel Core i9-13900K |
2388 Points +1% |
| Intel Core Ultra 9 285K |
2369 Points |
| AMD Ryzen 9 7950X |
2336 Points -1% |
| AMD Ryzen 9 7900X |
2211 Points -7% |
| AMD Ryzen 9 9950X |
2187 Points -8% |
| Intel Core Ultra 5 245K |
2156 Points -9% |
| Intel Core i5-14600K |
2142 Points -10% |
| Intel Core i5-13600K |
2115 Points -11% |
| Intel Core i7-14700K |
2093 Points -12% |
| AMD Ryzen 7 7800X3D |
2074 Points -12% |
| AMD Ryzen 9 9900X |
2071 Points -13% |
| AMD Ryzen 7 9700X |
2015 Points -15% |
| AMD Ryzen 9 7950X3D |
2014 Points -15% |
| AMD Ryzen 5 9600X |
1962 Points -17% |
| PCMark 10 / Score | |
| AMD Ryzen 7 9700X |
10699 Points +2% |
| AMD Ryzen 9 9950X |
10699 Points +2% |
| AMD Ryzen 9 9900X |
10677 Points +2% |
| Intel Core Ultra 9 285K |
10514 Points |
| Intel Core i9-14900K |
10101 Points -4% |
| AMD Ryzen 5 9600X |
10060 Points -4% |
| AMD Ryzen 9 7900X |
9911 Points -6% |
| AMD Ryzen 9 7950X |
9911 Points -6% |
| Intel Core i9-13900K |
9788 Points -7% |
| Intel Core i7-14700K |
9741 Points -7% |
| Intel Core i5-14600K |
9587 Points -9% |
| AMD Ryzen 7 7800X3D |
9500 Points -10% |
| Intel Core Ultra 5 245K |
9409 Points -11% |
| Intel Core i5-13600K |
9362 Points -11% |
| Intel Core i9-12900K |
8604 Points -18% |
| Intel Core i5-12600K |
8259 Points -21% |
| PCMark 10 / Essentials | |
| Intel Core i9-13900K |
12868 Points +11% |
| AMD Ryzen 9 7900X |
12651 Points +9% |
| AMD Ryzen 9 7950X |
12651 Points +9% |
| AMD Ryzen 7 9700X |
12591 Points +8% |
| Intel Core i9-14900K |
12352 Points +6% |
| Intel Core i5-13600K |
12306 Points +6% |
| AMD Ryzen 9 9900X |
12192 Points +5% |
| AMD Ryzen 9 7950X3D |
12130 Points +4% |
| AMD Ryzen 5 9600X |
12047 Points +4% |
| AMD Ryzen 9 9950X |
12044 Points +4% |
| Intel Core i7-14700K |
11934 Points +3% |
| Intel Core Ultra 9 285K |
11613 Points |
| Intel Core i5-14600K |
11532 Points -1% |
| AMD Ryzen 7 7800X3D |
11337 Points -2% |
| Intel Core Ultra 5 245K |
11292 Points -3% |
| Intel Core i9-12900K |
11086 Points -5% |
| Intel Core i5-12600K |
10650 Points -8% |
| PCMark 10 / Productivity | |
| AMD Ryzen 9 9900X |
12944 Points +5% |
| AMD Ryzen 5 9600X |
12915 Points +5% |
| AMD Ryzen 9 9950X |
12883 Points +4% |
| AMD Ryzen 7 9700X |
12873 Points +4% |
| AMD Ryzen 9 7950X3D |
12576 Points +2% |
| Intel Core Ultra 9 285K |
12340 Points |
| AMD Ryzen 7 7800X3D |
12108 Points -2% |
| Intel Core i5-14600K |
12075 Points -2% |
| Intel Core i7-14700K |
11903 Points -4% |
| AMD Ryzen 9 7900X |
11853 Points -4% |
| AMD Ryzen 9 7950X |
11853 Points -4% |
| Intel Core i9-14900K |
11784 Points -5% |
| Intel Core i5-13600K |
11630 Points -6% |
| Intel Core i9-13900K |
11370 Points -8% |
| Intel Core Ultra 5 245K |
11131 Points -10% |
| Intel Core i5-12600K |
11001 Points -11% |
| Intel Core i9-12900K |
10699 Points -13% |
| PCMark 10 / Digital Content Creation | |
| Intel Core Ultra 9 285K |
22005 Points |
| AMD Ryzen 9 9950X |
21420 Points -3% |
| AMD Ryzen 9 9900X |
20931 Points -5% |
| AMD Ryzen 7 9700X |
20506 Points -7% |
| Intel Core i9-14900K |
19214 Points -13% |
| Intel Core Ultra 5 245K |
17984 Points -18% |
| AMD Ryzen 5 9600X |
17760 Points -19% |
| Intel Core i7-14700K |
17659 Points -20% |
| AMD Ryzen 9 7900X |
17617 Points -20% |
| AMD Ryzen 9 7950X |
17617 Points -20% |
| Intel Core i9-13900K |
17393 Points -21% |
| Intel Core i5-14600K |
17170 Points -22% |
| AMD Ryzen 7 7800X3D |
16950 Points -23% |
| Intel Core i5-13600K |
15558 Points -29% |
| Intel Core i9-12900K |
14573 Points -34% |
| Intel Core i5-12600K |
13047 Points -41% |
| AIDA64 / FP32 Ray-Trace | |
| AMD Ryzen 9 9950X |
83214 KRay/s +94% |
| AMD Ryzen 9 9900X |
66524 KRay/s +55% |
| AMD Ryzen 9 7950X |
61180 KRay/s +43% |
| AMD Ryzen 9 7950X3D |
58359 KRay/s +36% |
| Intel Core Ultra 9 285K |
42871 KRay/s |
| AMD Ryzen 7 9700X |
41146 KRay/s -4% |
| Intel Core i9-14900K |
37224 KRay/s -13% |
| Intel Core i9-13900K |
36939 KRay/s -14% |
| AMD Ryzen 5 9600X |
36389 KRay/s -15% |
| AMD Ryzen 9 7900X |
33676 KRay/s -21% |
| Intel Core i7-14700K |
31200 KRay/s -27% |
| AMD Ryzen 7 7800X3D |
29390 KRay/s -31% |
| Intel Core i5-14600K |
24047 KRay/s -44% |
| Intel Core i5-13600K |
23446 KRay/s -45% |
| Intel Core Ultra 5 245K |
18517 KRay/s -57% |
| Intel Core i9-12900K |
13266 KRay/s -69% |
| Intel Core i5-12600K |
8243 KRay/s -81% |
| AIDA64 / FPU Julia | |
| AMD Ryzen 9 7950X3D |
245308 Points +11% |
| AMD Ryzen 9 9950X |
242692 Points +10% |
| AMD Ryzen 9 7950X |
234844 Points +6% |
| Intel Core Ultra 9 285K |
220808 Points |
| AMD Ryzen 9 7900X |
201995 Points -9% |
| AMD Ryzen 9 9900X |
191485 Points -13% |
| Intel Core i9-14900K |
184059 Points -17% |
| Intel Core i9-13900K |
183390 Points -17% |
| Intel Core i7-14700K |
157539 Points -29% |
| AMD Ryzen 7 7800X3D |
121296 Points -45% |
| AMD Ryzen 7 9700X |
116886 Points -47% |
| Intel Core i5-14600K |
113603 Points -49% |
| Intel Core i5-13600K |
111374 Points -50% |
| AMD Ryzen 5 9600X |
100758 Points -54% |
| Intel Core Ultra 5 245K |
95048 Points -57% |
| Intel Core i9-12900K |
59419 Points -73% |
| Intel Core i5-12600K |
37321 Points -83% |
| AIDA64 / CPU SHA3 | |
| AMD Ryzen 9 7950X3D |
11001 MB/s +2% |
| Intel Core Ultra 9 285K |
10804 MB/s |
| AMD Ryzen 9 9950X |
10453 MB/s -3% |
| AMD Ryzen 9 7950X |
10076 MB/s -7% |
| Intel Core i9-13900K |
9180 MB/s -15% |
| Intel Core i9-14900K |
9166 MB/s -15% |
| AMD Ryzen 9 9900X |
8278 MB/s -23% |
| Intel Core i7-14700K |
7372 MB/s -32% |
| AMD Ryzen 9 7900X |
7018 MB/s -35% |
| Intel Core i5-14600K |
5326 MB/s -51% |
| AMD Ryzen 7 9700X |
5307 MB/s -51% |
| AMD Ryzen 7 7800X3D |
5287 MB/s -51% |
| Intel Core i5-13600K |
5253 MB/s -51% |
| Intel Core i9-12900K |
4952 MB/s -54% |
| Intel Core Ultra 5 245K |
4378 MB/s -59% |
| AMD Ryzen 5 9600X |
4246 MB/s -61% |
| Intel Core i5-12600K |
3250 MB/s -70% |
| AIDA64 / CPU Queen | |
| AMD Ryzen 9 7950X |
203324 Points +43% |
| AMD Ryzen 9 7950X3D |
199943 Points +41% |
| AMD Ryzen 9 9950X |
187912 Points +32% |
| AMD Ryzen 9 7900X |
172637 Points +21% |
| Intel Core i7-14700K |
167941 Points +18% |
| Intel Core i9-14900K |
163637 Points +15% |
| Intel Core i9-13900K |
159676 Points +12% |
| AMD Ryzen 9 9900X |
158102 Points +11% |
| Intel Core Ultra 9 285K |
142132 Points |
| Intel Core i5-14600K |
123679 Points -13% |
| AMD Ryzen 7 7800X3D |
121911 Points -14% |
| Intel Core i5-13600K |
120485 Points -15% |
| AMD Ryzen 7 9700X |
118203 Points -17% |
| Intel Core i9-12900K |
112694 Points -21% |
| AMD Ryzen 5 9600X |
97731 Points -31% |
| Intel Core i5-12600K |
88337 Points -38% |
| Intel Core Ultra 5 245K |
84390 Points -41% |
| AIDA64 / FPU SinJulia | |
| AMD Ryzen 9 9950X |
35251 Points +139% |
| AMD Ryzen 9 7950X |
32823 Points +122% |
| AMD Ryzen 9 7950X3D |
32423 Points +120% |
| AMD Ryzen 9 9900X |
26220 Points +78% |
| AMD Ryzen 9 7900X |
24881 Points +69% |
| Intel Core i9-14900K |
20615 Points +40% |
| Intel Core i9-13900K |
19920 Points +35% |
| Intel Core i7-14700K |
18111 Points +23% |
| AMD Ryzen 7 9700X |
17330 Points +17% |
| AMD Ryzen 7 7800X3D |
15299 Points +4% |
| Intel Core Ultra 9 285K |
14755 Points |
| Intel Core i9-12900K |
14664 Points -1% |
| AMD Ryzen 5 9600X |
13269 Points -10% |
| Intel Core i5-14600K |
12663 Points -14% |
| Intel Core i5-13600K |
12201 Points -17% |
| Intel Core i5-12600K |
9510 Points -36% |
| Intel Core Ultra 5 245K |
6443 Points -56% |
| AIDA64 / FPU Mandel | |
| AMD Ryzen 9 7950X3D |
131740 Points +16% |
| AMD Ryzen 9 9950X |
127572 Points +12% |
| AMD Ryzen 9 7950X |
118564 Points +4% |
| Intel Core Ultra 9 285K |
114044 Points |
| AMD Ryzen 9 7900X |
106620 Points -7% |
| AMD Ryzen 9 9900X |
100990 Points -11% |
| Intel Core i9-14900K |
92191 Points -19% |
| Intel Core i9-13900K |
91721 Points -20% |
| Intel Core i7-14700K |
76413 Points -33% |
| AMD Ryzen 7 7800X3D |
65670 Points -42% |
| AMD Ryzen 7 9700X |
62328 Points -45% |
| Intel Core i5-14600K |
58795 Points -48% |
| Intel Core i5-13600K |
57797 Points -49% |
| AMD Ryzen 5 9600X |
54123 Points -53% |
| Intel Core Ultra 5 245K |
50258 Points -56% |
| Intel Core i9-12900K |
38042 Points -67% |
| Intel Core i5-12600K |
24230 Points -79% |
| AIDA64 / CPU AES | |
| AMD Ryzen 9 9900X |
513073 MB/s +103% |
| AMD Ryzen 9 7950X |
377952 MB/s +49% |
| AMD Ryzen 9 7950X3D |
364030 MB/s +44% |
| AMD Ryzen 7 9700X |
321370 MB/s +27% |
| Intel Core i9-14900K |
305071 MB/s +20% |
| Intel Core i9-13900K |
297727 MB/s +18% |
| AMD Ryzen 9 7900X |
279956 MB/s +10% |
| AMD Ryzen 5 9600X |
264125 MB/s +4% |
| Intel Core Ultra 9 285K |
253364 MB/s |
| Intel Core i5-14600K |
181167 MB/s -28% |
| AMD Ryzen 7 7800X3D |
177487 MB/s -30% |
| Intel Core i5-13600K |
175556 MB/s -31% |
| AMD Ryzen 9 9950X |
174821 MB/s -31% |
| Intel Core i7-14700K |
144308 MB/s -43% |
| Intel Core i9-12900K |
94062 MB/s -63% |
| Intel Core Ultra 5 245K |
60360 MB/s -76% |
| Intel Core i5-12600K |
58635 MB/s -77% |
| AIDA64 / CPU ZLib | |
| AMD Ryzen 9 9950X |
2632 MB/s +11% |
| Intel Core i9-14900K |
2562 MB/s +8% |
| Intel Core i9-13900K |
2490 MB/s +5% |
| AMD Ryzen 9 7950X |
2427 MB/s +2% |
| Intel Core Ultra 9 285K |
2380 MB/s |
| AMD Ryzen 9 7950X3D |
2315 MB/s -3% |
| Intel Core i7-14700K |
2148 MB/s -10% |
| AMD Ryzen 9 9900X |
2039 MB/s -14% |
| AMD Ryzen 9 7900X |
1848 MB/s -22% |
| Intel Core i9-12900K |
1560 MB/s -34% |
| Intel Core i5-14600K |
1468 MB/s -38% |
| Intel Core i5-13600K |
1426 MB/s -40% |
| AMD Ryzen 7 9700X |
1272 MB/s -47% |
| AMD Ryzen 7 7800X3D |
1156 MB/s -51% |
| AMD Ryzen 5 9600X |
1050 MB/s -56% |
| Intel Core i5-12600K |
988 MB/s -58% |
| Intel Core Ultra 5 245K |
988 MB/s -58% |
| AIDA64 / FP64 Ray-Trace | |
| AMD Ryzen 9 9950X |
44013 KRay/s +87% |
| AMD Ryzen 9 9900X |
35033 KRay/s +49% |
| AMD Ryzen 9 7950X |
32883 KRay/s +40% |
| AMD Ryzen 9 7950X3D |
31732 KRay/s +35% |
| Intel Core Ultra 9 285K |
23501 KRay/s |
| AMD Ryzen 7 9700X |
21984 KRay/s -6% |
| Intel Core i9-14900K |
20599 KRay/s -12% |
| Intel Core i9-13900K |
20298 KRay/s -14% |
| AMD Ryzen 5 9600X |
19437 KRay/s -17% |
| AMD Ryzen 9 7900X |
18490 KRay/s -21% |
| Intel Core i7-14700K |
17130 KRay/s -27% |
| AMD Ryzen 7 7800X3D |
15690 KRay/s -33% |
| Intel Core i5-14600K |
13236 KRay/s -44% |
| Intel Core i5-13600K |
12806 KRay/s -46% |
| Intel Core Ultra 5 245K |
10486 KRay/s -55% |
| Intel Core i9-12900K |
8078 KRay/s -66% |
| Intel Core i5-12600K |
5149 KRay/s -78% |
| AIDA64 / CPU PhotoWorxx | |
| Intel Core i9-14900K |
55912 MPixel/s +2% |
| Intel Core i5-14600K |
55888 MPixel/s +2% |
| Intel Core Ultra 9 285K |
54680 MPixel/s |
| Intel Core i7-14700K |
54037 MPixel/s -1% |
| AMD Ryzen 9 7950X3D |
53949 MPixel/s -1% |
| Intel Core i9-13900K |
48674 MPixel/s -11% |
| Intel Core i5-12600K |
48577 MPixel/s -11% |
| Intel Core i5-13600K |
48434 MPixel/s -11% |
| AMD Ryzen 9 9900X |
48396 MPixel/s -11% |
| Intel Core i9-12900K |
48307 MPixel/s -12% |
| AMD Ryzen 9 9950X |
47615 MPixel/s -13% |
| AMD Ryzen 7 7800X3D |
46968 MPixel/s -14% |
| AMD Ryzen 9 7950X |
43947 MPixel/s -20% |
| AMD Ryzen 9 7900X |
40893 MPixel/s -25% |
| AMD Ryzen 7 9700X |
40890 MPixel/s -25% |
| AMD Ryzen 5 9600X |
40853 MPixel/s -25% |
| Intel Core Ultra 5 245K |
40535 MPixel/s -26% |
3DMark 11: 1280x720 Performance Physics
3DMark: 1920x1080 Fire Strike Physics | 2560x1440 Time Spy CPU
CrossMark: Overall | Responsiveness | Creativity | Productivity
PCMark 10: Score | Essentials | Productivity | Digital Content Creation
AIDA64: FP32 Ray-Trace | FPU Julia | CPU SHA3 | CPU Queen | FPU SinJulia | FPU Mandel | CPU AES | CPU ZLib | FP64 Ray-Trace | CPU PhotoWorxx
| PCMark 10 Score | 10514 points | |
Help | ||
英特尔在 Arrow Lake-S 中采用了全新的计算板块设计。P 核心和 E 核心不再位于各自连续的区块中,也没有各自的缓存。取而代之的是,E 核心以每四个为一簇的方式分布在瓦片四角的 P 核心之间。
现在,所有内核都共享一个贯穿磁贴中心的统一 L3 高速缓存和统一环形总线。理论上,这种设计应有助于加快内核间的数据传输,并防止热量集中在一个或一组内核周围。
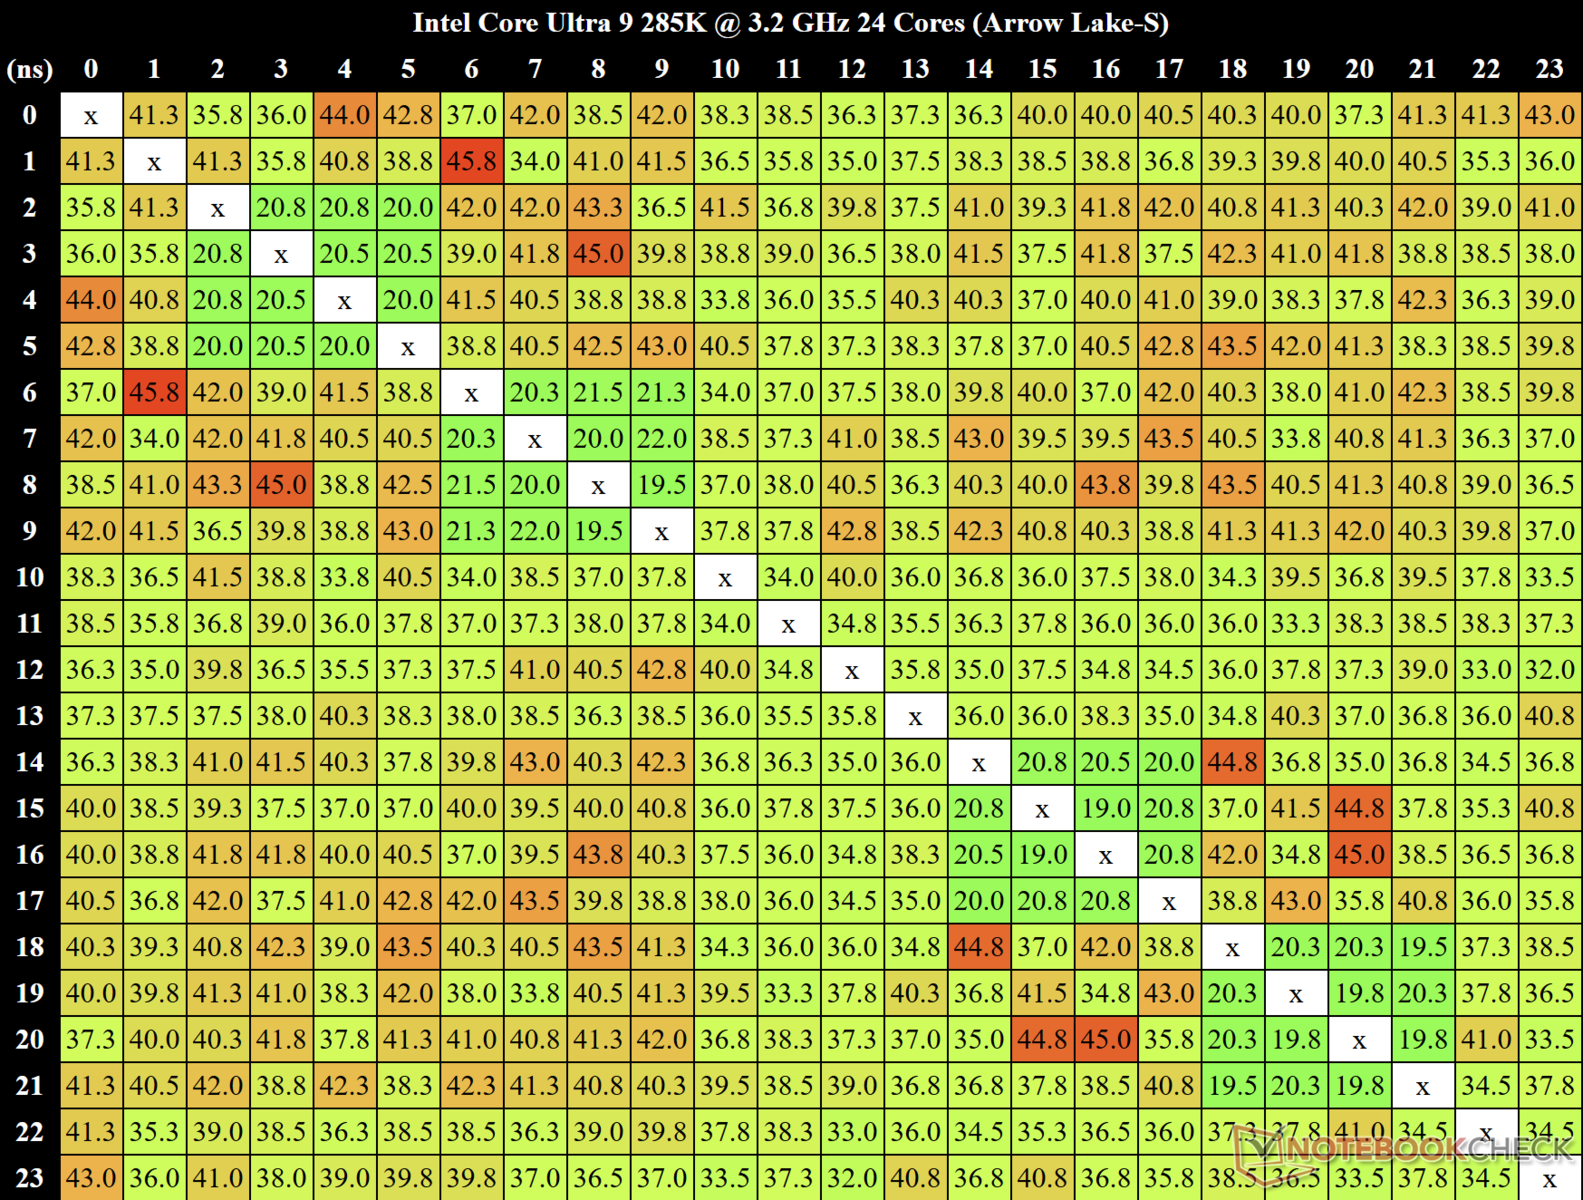
我们使用MicrobenchX计算内核间延迟。核心 2 到核心 7 之间的核心间延迟高达 45.8 ns,这表明数据从 E 核到 E 核之间可能存在较长的延迟。
不过,四个 E 核集群内部的数据传输延迟似乎最小,在 19 ns 到 21.3 ns 之间。
我们测得内核到内核的总延迟中位数为 38.25 ns。
| AIDA64 Memory Performance Rating - Percent | |
| Intel Core i9-12900K -1! |
84.1 pt |
| Intel Core i9-14900K |
83.9 pt |
| Intel Core i7-14700K |
83.2 pt |
| Intel Core i5-12600K -1! |
81.7 pt |
| Intel Core i5-14600K |
81.6 pt |
| Intel Core Ultra 9 285K |
80.1 pt |
| AMD Ryzen 9 7950X3D |
78.4 pt |
| AMD Ryzen 9 7950X |
76.6 pt |
| AMD Ryzen 9 9950X |
74.4 pt |
| Intel Core i9-13900K |
73.9 pt |
| AMD Ryzen 9 9900X |
73.9 pt |
| AMD Ryzen 9 7900X |
73.5 pt |
| AMD Ryzen 7 7800X3D |
70.5 pt |
| Intel Core i5-13600K |
69.7 pt |
| AMD Ryzen 7 9700X |
68.5 pt |
| AMD Ryzen 5 9600X |
65.4 pt |
| Intel Core Ultra 5 245K |
51.8 pt |
| AIDA64 | |
| Memory Copy | |
| Intel Core Ultra 9 285K |
88386 MB/s |
| Intel Core i9-14900K |
85662 MB/s -3% |
| Intel Core i7-14700K |
85092 MB/s -4% |
| Intel Core i5-14600K |
82790 MB/s -6% |
| Intel Core i9-13900K |
74937 MB/s -15% |
| AMD Ryzen 9 7950X3D |
73868 MB/s -16% |
| Intel Core i9-12900K |
73146 MB/s -17% |
| AMD Ryzen 9 7950X |
73104 MB/s -17% |
| Intel Core i5-13600K |
71725 MB/s -19% |
| Intel Core i5-12600K |
70749 MB/s -20% |
| AMD Ryzen 9 9950X |
70530 MB/s -20% |
| AMD Ryzen 9 9900X |
69921 MB/s -21% |
| AMD Ryzen 9 7900X |
69140 MB/s -22% |
| AMD Ryzen 7 7800X3D |
63242 MB/s -28% |
| Intel Core Ultra 5 245K |
61112 MB/s -31% |
| AMD Ryzen 7 9700X |
59073 MB/s -33% |
| AMD Ryzen 5 9600X |
55115 MB/s -38% |
| Memory Latency | |
| Intel Core Ultra 5 245K |
123.3 ns * -38% |
| Intel Core Ultra 9 285K |
89.3 ns * |
| Intel Core i5-13600K |
81.1 ns * +9% |
| Intel Core i9-13900K |
76.5 ns * +14% |
| Intel Core i7-14700K |
71.5 ns * +20% |
| Intel Core i9-14900K |
70.3 ns * +21% |
| Intel Core i5-14600K |
69.7 ns * +22% |
| AMD Ryzen 9 9900X |
68.7 ns * +23% |
| AMD Ryzen 9 9950X |
68.6 ns * +23% |
| AMD Ryzen 7 9700X |
68.5 ns * +23% |
| AMD Ryzen 5 9600X |
68.1 ns * +24% |
| AMD Ryzen 7 7800X3D |
68 ns * +24% |
| AMD Ryzen 9 7950X3D |
65.6 ns * +27% |
| AMD Ryzen 9 7900X |
63.3 ns * +29% |
| AMD Ryzen 9 7950X |
61.7 ns * +31% |
| Memory Read | |
| Intel Core i9-14900K |
95232 MB/s +3% |
| Intel Core i7-14700K |
94830 MB/s +3% |
| Intel Core Ultra 9 285K |
92063 MB/s |
| Intel Core i5-14600K |
88793 MB/s -4% |
| Intel Core i9-13900K |
83883 MB/s -9% |
| Intel Core i9-12900K |
81059 MB/s -12% |
| AMD Ryzen 9 7950X3D |
80946 MB/s -12% |
| AMD Ryzen 9 9900X |
79594 MB/s -14% |
| AMD Ryzen 9 9950X |
78986 MB/s -14% |
| AMD Ryzen 9 7950X |
78282 MB/s -15% |
| Intel Core i5-12600K |
76864 MB/s -17% |
| Intel Core i5-13600K |
75757 MB/s -18% |
| AMD Ryzen 9 7900X |
75338 MB/s -18% |
| Intel Core Ultra 5 245K |
65415 MB/s -29% |
| AMD Ryzen 7 7800X3D |
62528 MB/s -32% |
| AMD Ryzen 7 9700X |
62369 MB/s -32% |
| AMD Ryzen 5 9600X |
59008 MB/s -36% |
| Memory Write | |
| AMD Ryzen 7 7800X3D |
87412 MB/s +4% |
| AMD Ryzen 9 7950X3D |
85951 MB/s +2% |
| AMD Ryzen 7 9700X |
84869 MB/s +1% |
| Intel Core Ultra 9 285K |
84216 MB/s |
| Intel Core i5-14600K |
84101 MB/s 0% |
| Intel Core i9-14900K |
83670 MB/s -1% |
| Intel Core i7-14700K |
82856 MB/s -2% |
| AMD Ryzen 5 9600X |
80805 MB/s -4% |
| AMD Ryzen 9 7950X |
79843 MB/s -5% |
| AMD Ryzen 9 9950X |
79040 MB/s -6% |
| AMD Ryzen 9 9900X |
77408 MB/s -8% |
| AMD Ryzen 9 7900X |
76967 MB/s -9% |
| Intel Core i9-13900K |
74140 MB/s -12% |
| Intel Core i5-12600K |
73824 MB/s -12% |
| Intel Core i9-12900K |
73707 MB/s -12% |
| Intel Core i5-13600K |
73484 MB/s -13% |
| Intel Core Ultra 5 245K |
60635 MB/s -28% |
* ... smaller is better
3D 和游戏性能:Arrow Lake-S 令人大失所望
人们本以为缺乏超线程技术、英特尔 APO 和 IPC 的提高(尤其是 Skymont 内核)会带来良好的游戏体验。不过,你要做好失望的准备。
虽然酷睿至尊 9 285K 以相对较低的功耗表现出了值得称赞的 CPU 性能,但在 3D 和游戏任务中,情况却发生了逆转。
酷睿至尊 9 285K 配备了NvidiaGeForce RTX 4090 GPU,在 3DMark 11 GPU 性能测试中领先 Ryzen 9 9900X 13%,在 3DMarkTime Spy 图形测试中领先 Ryzen 9 9950X 6%。
不过,在 3DMarkFire Strike Graphics 中,该系统明显输给了其他 Raptor Lake-S Refresh 和 Zen 5 产品,使其处于整体劣势。
| 3DMark Performance Rating - Percent | |
| Intel Core i5-14600K NVIDIA GeForce RTX 4090 |
80.3 pt |
| AMD Ryzen 7 7800X3D NVIDIA GeForce RTX 4090 |
77.3 pt |
| AMD Ryzen 5 9600X NVIDIA GeForce RTX 4090 |
75.9 pt |
| Intel Core Ultra 5 245K NVIDIA GeForce RTX 4090 |
75.6 pt |
| AMD Ryzen 7 9700X NVIDIA GeForce RTX 4090 |
74.5 pt |
| AMD Ryzen 9 7950X3D NVIDIA GeForce RTX 4090 |
74.2 pt |
| Intel Core i9-14900K NVIDIA GeForce RTX 4090 |
74.1 pt |
| Intel Core i7-14700K NVIDIA GeForce RTX 4090 |
73.4 pt |
| AMD Ryzen 9 9950X NVIDIA GeForce RTX 4090 |
71.4 pt |
| AMD Ryzen 9 9900X NVIDIA GeForce RTX 4090 |
69.2 pt |
| Intel Core Ultra 9 285K NVIDIA GeForce RTX 4090 |
66.1 pt |
| 3DMark 11 - 1280x720 Performance GPU | |
| AMD Ryzen 7 7800X3D NVIDIA GeForce RTX 4090 |
114641 Points +20% |
| Intel Core i5-14600K NVIDIA GeForce RTX 4090 |
110994 Points +16% |
| AMD Ryzen 9 7950X3D NVIDIA GeForce RTX 4090 |
105886 Points +10% |
| Intel Core i9-14900K NVIDIA GeForce RTX 4090 |
104998 Points +10% |
| Intel Core Ultra 5 245K NVIDIA GeForce RTX 4090 |
104781 Points +9% |
| AMD Ryzen 5 9600X NVIDIA GeForce RTX 4090 |
104516 Points +9% |
| Intel Core i7-14700K NVIDIA GeForce RTX 4090 |
103598 Points +8% |
| AMD Ryzen 9 9950X NVIDIA GeForce RTX 4090 |
100037 Points +4% |
| AMD Ryzen 7 9700X NVIDIA GeForce RTX 4090 |
99851 Points +4% |
| Intel Core Ultra 9 285K NVIDIA GeForce RTX 4090 |
95851 Points |
| AMD Ryzen 9 9900X NVIDIA GeForce RTX 4090 |
85108 Points -11% |
| 3DMark | |
| 2560x1440 Time Spy Graphics | |
| Intel Core i5-14600K NVIDIA GeForce RTX 4090 |
37769 Points +7% |
| Intel Core i9-14900K NVIDIA GeForce RTX 4090 |
37762 Points +7% |
| AMD Ryzen 7 7800X3D NVIDIA GeForce RTX 4090 |
37664 Points +7% |
| Intel Core i7-14700K NVIDIA GeForce RTX 4090 |
37589 Points +7% |
| AMD Ryzen 5 9600X NVIDIA GeForce RTX 4090 |
37161 Points +6% |
| Intel Core Ultra 5 245K NVIDIA GeForce RTX 4090 |
36813 Points +5% |
| AMD Ryzen 9 7950X3D NVIDIA GeForce RTX 4090 |
36665 Points +4% |
| AMD Ryzen 7 9700X NVIDIA GeForce RTX 4090 |
36564 Points +4% |
| AMD Ryzen 9 9900X NVIDIA GeForce RTX 4090 |
36395 Points +3% |
| Intel Core Ultra 9 285K NVIDIA GeForce RTX 4090 |
35166 Points |
| AMD Ryzen 9 9950X NVIDIA GeForce RTX 4090 |
33198 Points -6% |
| 1920x1080 Fire Strike Graphics | |
| Intel Core i5-14600K NVIDIA GeForce RTX 4090 |
86031 Points +48% |
| AMD Ryzen 7 9700X NVIDIA GeForce RTX 4090 |
79185 Points +36% |
| AMD Ryzen 5 9600X NVIDIA GeForce RTX 4090 |
78579 Points +35% |
| Intel Core Ultra 5 245K NVIDIA GeForce RTX 4090 |
78079 Points +35% |
| AMD Ryzen 9 9950X NVIDIA GeForce RTX 4090 |
76388 Points +32% |
| AMD Ryzen 9 9900X NVIDIA GeForce RTX 4090 |
74552 Points +28% |
| AMD Ryzen 7 7800X3D NVIDIA GeForce RTX 4090 |
73447 Points +27% |
| AMD Ryzen 9 7950X3D NVIDIA GeForce RTX 4090 |
72901 Points +26% |
| Intel Core i9-14900K NVIDIA GeForce RTX 4090 |
70971 Points +22% |
| Intel Core i7-14700K NVIDIA GeForce RTX 4090 |
70246 Points +21% |
| Intel Core Ultra 9 285K NVIDIA GeForce RTX 4090 |
58028 Points |
| 3DMark 11 Performance | 62846 points | |
| 3DMark Fire Strike Score | 44363 points | |
| 3DMark Time Spy Score | 30904 points | |
Help | ||
| 3DMark 11 in comparison | |
| HP Stream 7 5700ng (min)
Z3735G, HD Graphics (Bay Trail) | 183 |
| ... | |
| i9-14900K, NVIDIA GeForce RTX 4080 Super | 60267 |
| AMD Ryzen 7 9700X Ryzen 7 9700X, NVIDIA GeForce RTX 4090 | 62688 |
| R9 7950X, NVIDIA GeForce RTX 4080 | 62760 |
| Intel Core Ultra 9 285K Ultra 9 285K, NVIDIA GeForce RTX 4090 | 62846 |
| SCHENKER XMG SECTOR, i9 13900K, RTX 4090 i9-13900K, NVIDIA GeForce RTX 4090 | 62922 |
| AMD Radeon RX 9070 R7 9800X3D, Radeon RX 9070 | 64253 |
| R7 7745HX, NVIDIA GeForce RTX 4090 | 64642 |
| ... | |
| NVIDIA GeForce RTX 5090 Founders Edition (max)
R7 9800X3D, GeForce RTX 5090 | 82642 |
游戏方面也出现了类似的趋势。与英特尔在发布时的说法相反,与 RTX 4090 搭配的酷睿至尊 9 285K 在我们的游戏对比排行榜上排名垫底,仅次于酷睿 i7-14700K,在 720p Low 和 1080p Ultra 的累积游戏测试中,明显落后于 Zen 5 产品(最多落后 12%)。
与酷睿 i7-14700K 相比,酷睿至尊 9 285K 在Far Cry 5 、 Dota2 Reborn 和 Metro Exodus 中的性能似乎略有提升。 地铁出埃及记(非增强版),但差异微乎其微,整体性能仍远远落后于酷睿 i9-14700K 和酷睿 i9-14900K。
即使是 酷睿 i5-14600K与酷睿 Ultra 9 285K 相比,整体性能提升了 7%,看起来是一款更好的游戏 CPU
| Gaming Performance Rating - Percent | |
| AMD Ryzen 7 7800X3D NVIDIA GeForce RTX 4090 |
99.3 pt |
| AMD Ryzen 9 7950X3D NVIDIA GeForce RTX 4090 |
92.5 pt |
| Intel Core i9-14900K NVIDIA GeForce RTX 4090 |
89.9 pt |
| AMD Ryzen 7 9700X NVIDIA GeForce RTX 4090 |
87.4 pt |
| AMD Ryzen 9 9900X NVIDIA GeForce RTX 4090 |
86.4 pt |
| AMD Ryzen 5 9600X NVIDIA GeForce RTX 4090 |
85.7 pt |
| AMD Ryzen 9 9950X NVIDIA GeForce RTX 4090 |
84.9 pt |
| Intel Core i5-14600K NVIDIA GeForce RTX 4090 |
81.6 pt |
| Intel Core i7-14700K NVIDIA GeForce RTX 4090 |
76.9 pt |
| Intel Core Ultra 9 285K NVIDIA GeForce RTX 4090 |
76.2 pt |
| Intel Core Ultra 5 245K NVIDIA GeForce RTX 4090 |
67.1 pt |
| F1 22 | |
| 1280x720 Ultra Low Preset AA:T AF:16x | |
| AMD Ryzen 7 7800X3D NVIDIA GeForce RTX 4090 |
629 (477min, 404P1 - 691max) fps +49% |
| Intel Core i9-14900K NVIDIA GeForce RTX 4090 |
576 (428min, 362P1 - 644max) fps +36% |
| AMD Ryzen 9 7950X3D NVIDIA GeForce RTX 4090 |
564 (406min, 353P1 - 626max) fps +34% |
| AMD Ryzen 9 9950X NVIDIA GeForce RTX 4090 |
532 (367min, 331P1 - 582max) fps +26% |
| AMD Ryzen 5 9600X NVIDIA GeForce RTX 4090 |
507 (370min, 322P1 - 562max) fps +20% |
| AMD Ryzen 7 9700X NVIDIA GeForce RTX 4090 |
497 (363min, 324P1 - 552max) fps +18% |
| AMD Ryzen 9 9900X NVIDIA GeForce RTX 4090 |
494 (363min, 315P1 - 547max) fps +17% |
| Intel Core i5-14600K NVIDIA GeForce RTX 4090 |
463 (344min, 290P1 - 519max) fps +10% |
| Intel Core i7-14700K NVIDIA GeForce RTX 4090 |
435 (343min, 277P1 - 488max) fps +3% |
| Intel Core Ultra 9 285K NVIDIA GeForce RTX 4090 |
422 (321min, 251P1 - 465max) fps |
| Intel Core Ultra 5 245K NVIDIA GeForce RTX 4090 |
328 (258min, 191P1 - 376max) fps -22% |
| 1920x1080 Low Preset AA:T AF:16x | |
| AMD Ryzen 7 7800X3D NVIDIA GeForce RTX 4090 |
533 (380min, 288P1 - 637max) fps +49% |
| AMD Ryzen 9 7950X3D NVIDIA GeForce RTX 4090 |
475 (338min, 264P1 - 542max) fps +33% |
| Intel Core i9-14900K NVIDIA GeForce RTX 4090 |
462 (309min, 256P1 - 558max) fps +29% |
| AMD Ryzen 5 9600X NVIDIA GeForce RTX 4090 |
439 (256min, 238P1 - 510max) fps +23% |
| AMD Ryzen 9 9950X NVIDIA GeForce RTX 4090 |
428 (277min, 226P1 - 544max) fps +20% |
| AMD Ryzen 7 9700X NVIDIA GeForce RTX 4090 |
418 (280min, 246P1 - 506max) fps +17% |
| AMD Ryzen 9 9900X NVIDIA GeForce RTX 4090 |
399 (257min, 232P1 - 471max) fps +12% |
| Intel Core i5-14600K NVIDIA GeForce RTX 4090 |
379 (280min, 225P1 - 455max) fps +6% |
| Intel Core i7-14700K NVIDIA GeForce RTX 4090 |
359 (275min, 204P1 - 431max) fps +1% |
| Intel Core Ultra 9 285K NVIDIA GeForce RTX 4090 |
357 (276min, 212P1 - 434max) fps |
| Intel Core Ultra 5 245K NVIDIA GeForce RTX 4090 |
311 (242min, 180P1 - 346max) fps -13% |
| 1920x1080 Ultra High Preset AA:T AF:16x | |
| AMD Ryzen 7 7800X3D NVIDIA GeForce RTX 4090 |
221 (196min, 145P1 - 248max) fps +27% |
| Intel Core i9-14900K NVIDIA GeForce RTX 4090 |
217 (156min, 142P1 - 244max) fps +24% |
| AMD Ryzen 7 9700X NVIDIA GeForce RTX 4090 |
213 (130min, 131P1 - 242max) fps +22% |
| Intel Core i5-14600K NVIDIA GeForce RTX 4090 |
210 (169min, 140P1 - 237max) fps +20% |
| AMD Ryzen 9 7950X3D NVIDIA GeForce RTX 4090 |
204 (138min, 120P1 - 232max) fps +17% |
| AMD Ryzen 5 9600X NVIDIA GeForce RTX 4090 |
202 (157min, 133P1 - 233max) fps +16% |
| AMD Ryzen 9 9900X NVIDIA GeForce RTX 4090 |
194.5 (155min, 130P1 - 220max) fps +11% |
| AMD Ryzen 9 9950X NVIDIA GeForce RTX 4090 |
193.3 (148min, 121P1 - 215max) fps +11% |
| Intel Core i7-14700K NVIDIA GeForce RTX 4090 |
187 (149min, 119P1 - 207max) fps +7% |
| Intel Core Ultra 9 285K NVIDIA GeForce RTX 4090 |
174.6 (142min, 115P1 - 193max) fps |
| Intel Core Ultra 5 245K NVIDIA GeForce RTX 4090 |
161 (122min, 105P1 - 183max) fps -8% |
| Far Cry 5 | |
| 1280x720 Low Preset AA:T | |
| AMD Ryzen 7 7800X3D NVIDIA GeForce RTX 4090 |
344 (220min - 464max) fps +53% |
| AMD Ryzen 9 7950X3D NVIDIA GeForce RTX 4090 |
299 (201min - 390max) fps +33% |
| Intel Core i9-14900K NVIDIA GeForce RTX 4090 |
280 (214min - 355max) fps +24% |
| AMD Ryzen 9 9900X NVIDIA GeForce RTX 4090 |
277 (215min - 357max) fps +23% |
| AMD Ryzen 5 9600X NVIDIA GeForce RTX 4090 |
263 (201min - 342max) fps +17% |
| AMD Ryzen 7 9700X NVIDIA GeForce RTX 4090 |
263 (202min - 350max) fps +17% |
| Intel Core i5-14600K NVIDIA GeForce RTX 4090 |
255 (199min - 343max) fps +13% |
| AMD Ryzen 9 9950X NVIDIA GeForce RTX 4090 |
248 (185min - 322max) fps +10% |
| Intel Core Ultra 9 285K NVIDIA GeForce RTX 4090 |
225 (180min - 283max) fps |
| Intel Core Ultra 5 245K NVIDIA GeForce RTX 4090 |
204 (149min - 271max) fps -9% |
| Intel Core i7-14700K NVIDIA GeForce RTX 4090 |
180 (138min - 249max) fps -20% |
| 1920x1080 Ultra Preset AA:T | |
| AMD Ryzen 7 7800X3D NVIDIA GeForce RTX 4090 |
278 (200min - 402max) fps +63% |
| AMD Ryzen 9 7950X3D NVIDIA GeForce RTX 4090 |
248 (186min - 370max) fps +45% |
| AMD Ryzen 9 9900X NVIDIA GeForce RTX 4090 |
223 (160min - 308max) fps +30% |
| Intel Core i9-14900K NVIDIA GeForce RTX 4090 |
217 (159min - 296max) fps +27% |
| AMD Ryzen 5 9600X NVIDIA GeForce RTX 4090 |
203 (152min - 277max) fps +19% |
| AMD Ryzen 7 9700X NVIDIA GeForce RTX 4090 |
202 (147min - 286max) fps +18% |
| Intel Core i5-14600K NVIDIA GeForce RTX 4090 |
196 (146min - 270max) fps +15% |
| AMD Ryzen 9 9950X NVIDIA GeForce RTX 4090 |
194 (144min - 265max) fps +13% |
| Intel Core Ultra 9 285K NVIDIA GeForce RTX 4090 |
171 (126min - 236max) fps |
| Intel Core Ultra 5 245K NVIDIA GeForce RTX 4090 |
156 (120min - 216max) fps -9% |
| Intel Core i7-14700K NVIDIA GeForce RTX 4090 |
154 (115min - 213max) fps -10% |
| X-Plane 11.11 | |
| 1280x720 low (fps_test=1) | |
| AMD Ryzen 7 9700X NVIDIA GeForce RTX 4090 |
256 fps +35% |
| AMD Ryzen 9 9900X NVIDIA GeForce RTX 4090 |
254 fps +34% |
| AMD Ryzen 5 9600X NVIDIA GeForce RTX 4090 |
245 fps +30% |
| Intel Core i9-14900K NVIDIA GeForce RTX 4090 |
244 fps +29% |
| Intel Core i5-14600K NVIDIA GeForce RTX 4090 |
228 fps +21% |
| Intel Core i7-14700K NVIDIA GeForce RTX 4090 |
227 fps +20% |
| AMD Ryzen 9 7950X3D NVIDIA GeForce RTX 4090 |
225 fps +19% |
| AMD Ryzen 7 7800X3D NVIDIA GeForce RTX 4090 |
219 fps +16% |
| AMD Ryzen 9 9950X NVIDIA GeForce RTX 4090 |
209 fps +11% |
| Intel Core Ultra 9 285K NVIDIA GeForce RTX 4090 |
189.1 fps |
| Intel Core Ultra 5 245K NVIDIA GeForce RTX 4090 |
129.1 fps -32% |
| 1920x1080 high (fps_test=3) | |
| AMD Ryzen 7 7800X3D NVIDIA GeForce RTX 4090 |
188.1 fps +34% |
| AMD Ryzen 9 7950X3D NVIDIA GeForce RTX 4090 |
187.1 fps +33% |
| AMD Ryzen 7 9700X NVIDIA GeForce RTX 4090 |
171.8 fps +22% |
| AMD Ryzen 9 9900X NVIDIA GeForce RTX 4090 |
170.9 fps +22% |
| AMD Ryzen 5 9600X NVIDIA GeForce RTX 4090 |
166.1 fps +18% |
| Intel Core i9-14900K NVIDIA GeForce RTX 4090 |
161 fps +15% |
| AMD Ryzen 9 9950X NVIDIA GeForce RTX 4090 |
153.3 fps +9% |
| Intel Core i7-14700K NVIDIA GeForce RTX 4090 |
151.7 fps +8% |
| Intel Core i5-14600K NVIDIA GeForce RTX 4090 |
147.8 fps +5% |
| Intel Core Ultra 9 285K NVIDIA GeForce RTX 4090 |
140.5 fps |
| Intel Core Ultra 5 245K NVIDIA GeForce RTX 4090 |
98.2 fps -30% |
| Final Fantasy XV Benchmark | |
| 1280x720 Lite Quality | |
| AMD Ryzen 5 9600X NVIDIA GeForce RTX 4090 |
237 fps +1% |
| AMD Ryzen 7 7800X3D NVIDIA GeForce RTX 4090 |
236 fps +1% |
| Intel Core i5-14600K NVIDIA GeForce RTX 4090 |
236 fps +1% |
| AMD Ryzen 9 9950X NVIDIA GeForce RTX 4090 |
236 fps +1% |
| Intel Core i9-14900K NVIDIA GeForce RTX 4090 |
235 fps 0% |
| Intel Core i7-14700K NVIDIA GeForce RTX 4090 |
235 fps 0% |
| AMD Ryzen 7 9700X NVIDIA GeForce RTX 4090 |
235 fps 0% |
| Intel Core Ultra 5 245K NVIDIA GeForce RTX 4090 |
235 fps 0% |
| AMD Ryzen 9 9900X NVIDIA GeForce RTX 4090 |
235 fps 0% |
| AMD Ryzen 9 7950X3D NVIDIA GeForce RTX 4090 |
234 fps 0% |
| Intel Core Ultra 9 285K NVIDIA GeForce RTX 4090 |
234 fps |
| 1920x1080 High Quality | |
| Intel Core i9-14900K NVIDIA GeForce RTX 4090 |
234 fps +3% |
| AMD Ryzen 7 7800X3D NVIDIA GeForce RTX 4090 |
233 fps +2% |
| Intel Core i5-14600K NVIDIA GeForce RTX 4090 |
233 fps +2% |
| AMD Ryzen 9 7950X3D NVIDIA GeForce RTX 4090 |
232 fps +2% |
| AMD Ryzen 9 9900X NVIDIA GeForce RTX 4090 |
230 fps +1% |
| AMD Ryzen 5 9600X NVIDIA GeForce RTX 4090 |
229 fps 0% |
| Intel Core i7-14700K NVIDIA GeForce RTX 4090 |
228 fps 0% |
| Intel Core Ultra 9 285K NVIDIA GeForce RTX 4090 |
228 fps |
| AMD Ryzen 7 9700X NVIDIA GeForce RTX 4090 |
226 fps -1% |
| AMD Ryzen 9 9950X NVIDIA GeForce RTX 4090 |
226 fps -1% |
| Intel Core Ultra 5 245K NVIDIA GeForce RTX 4090 |
219 fps -4% |
| Dota 2 Reborn | |
| 1280x720 min (0/3) fastest | |
| AMD Ryzen 7 7800X3D NVIDIA GeForce RTX 4090 |
322.9 (268min) fps +26% |
| AMD Ryzen 7 9700X NVIDIA GeForce RTX 4090 |
319.7 (274min) fps +25% |
| AMD Ryzen 9 7950X3D NVIDIA GeForce RTX 4090 |
314.1 (261.7min) fps +23% |
| AMD Ryzen 9 9900X NVIDIA GeForce RTX 4090 |
312.8 (268.9min) fps +22% |
| AMD Ryzen 9 9950X NVIDIA GeForce RTX 4090 |
305 (258.9min) fps +19% |
| Intel Core i9-14900K NVIDIA GeForce RTX 4090 |
299.9 (248.4min) fps +17% |
| AMD Ryzen 5 9600X NVIDIA GeForce RTX 4090 |
291 (244.2min) fps +14% |
| Intel Core i5-14600K NVIDIA GeForce RTX 4090 |
261.5 (226.3min) fps +2% |
| Intel Core Ultra 9 285K NVIDIA GeForce RTX 4090 |
256 (223.6min) fps |
| Intel Core i7-14700K NVIDIA GeForce RTX 4090 |
239.4 (208min) fps -6% |
| Intel Core Ultra 5 245K NVIDIA GeForce RTX 4090 |
213.7 (189.8min) fps -17% |
| 1920x1080 ultra (3/3) best looking | |
| AMD Ryzen 7 7800X3D NVIDIA GeForce RTX 4090 |
267.5 (216.9min) fps +31% |
| AMD Ryzen 9 7950X3D NVIDIA GeForce RTX 4090 |
252.7 (208.9min) fps +24% |
| AMD Ryzen 9 9900X NVIDIA GeForce RTX 4090 |
241.4 (199.9min) fps +18% |
| AMD Ryzen 9 9950X NVIDIA GeForce RTX 4090 |
241 (202.8min) fps +18% |
| AMD Ryzen 7 9700X NVIDIA GeForce RTX 4090 |
239.4 (204.5min) fps +17% |
| AMD Ryzen 5 9600X NVIDIA GeForce RTX 4090 |
233 (200min) fps +14% |
| Intel Core i9-14900K NVIDIA GeForce RTX 4090 |
231.4 (197.9min) fps +13% |
| Intel Core i5-14600K NVIDIA GeForce RTX 4090 |
217 (186.1min) fps +6% |
| Intel Core Ultra 9 285K NVIDIA GeForce RTX 4090 |
204 (167.7min) fps |
| Intel Core i7-14700K NVIDIA GeForce RTX 4090 |
200 (172.6min) fps -2% |
| Intel Core Ultra 5 245K NVIDIA GeForce RTX 4090 |
172.9 (149.5min) fps -15% |
| The Witcher 3 | |
| 1024x768 Low Graphics & Postprocessing | |
| AMD Ryzen 9 7950X3D NVIDIA GeForce RTX 4090 |
864.7 fps +38% |
| AMD Ryzen 7 7800X3D NVIDIA GeForce RTX 4090 |
858.4 fps +37% |
| Intel Core i9-14900K NVIDIA GeForce RTX 4090 |
829 (31.9min, 380P0.1, 595P1 - 1296max) fps +32% |
| AMD Ryzen 9 9950X NVIDIA GeForce RTX 4090 |
797 (699min, 700.24P1 - 934max) fps +27% |
| AMD Ryzen 5 9600X NVIDIA GeForce RTX 4090 |
762 (66min, 266P0.1, 520P1 - 1355max) fps +22% |
| AMD Ryzen 7 9700X NVIDIA GeForce RTX 4090 |
751 (650min - 945max) fps +20% |
| AMD Ryzen 9 9900X NVIDIA GeForce RTX 4090 |
711 (651min, 652.6P1 - 830max) fps +14% |
| Intel Core i7-14700K NVIDIA GeForce RTX 4090 |
634 (573min, 574.2P1 - 727max) fps +1% |
| Intel Core i5-14600K NVIDIA GeForce RTX 4090 |
632 (29.4min, 209P0.1, 471P1 - 1028max) fps +1% |
| Intel Core Ultra 9 285K NVIDIA GeForce RTX 4090 |
626 (535min, 544.02P1 - 798max) fps |
| Intel Core Ultra 5 245K NVIDIA GeForce RTX 4090 |
536 (23.7min, 212P0.1, 371P1 - 944max) fps -14% |
| 1920x1080 Ultra Graphics & Postprocessing (HBAO+) | |
| Intel Core i5-14600K NVIDIA GeForce RTX 4090 |
316 (105.2min, 154.9P0.1, 222P1 - 551max) fps +7% |
| AMD Ryzen 7 7800X3D NVIDIA GeForce RTX 4090 |
314.3 fps +7% |
| Intel Core i9-14900K NVIDIA GeForce RTX 4090 |
314 (65.8min, 172.6P0.1, 242P1 - 579max) fps +7% |
| Intel Core Ultra 5 245K NVIDIA GeForce RTX 4090 |
308 (29.8min, 149.7P0.1, 222P1 - 485max) fps +5% |
| AMD Ryzen 9 7950X3D NVIDIA GeForce RTX 4090 |
305 fps +4% |
| Intel Core Ultra 9 285K NVIDIA GeForce RTX 4090 |
294 (259min, 261.4P1 - 333max) fps |
| Intel Core i7-14700K NVIDIA GeForce RTX 4090 |
287 (259min, 261.1P1 - 328max) fps -2% |
| AMD Ryzen 5 9600X NVIDIA GeForce RTX 4090 |
286 (74.6min, 128.5P0.1, 200P1 - 609max) fps -3% |
| AMD Ryzen 9 9950X NVIDIA GeForce RTX 4090 |
285 (259min, 259.96P1 - 323max) fps -3% |
| AMD Ryzen 7 9700X NVIDIA GeForce RTX 4090 |
283 (259min, 259P1 - 322max) fps -4% |
| AMD Ryzen 9 9900X NVIDIA GeForce RTX 4090 |
274 (248min, 248.6P1 - 312max) fps -7% |
| GTA V | |
| 1024x768 Lowest Settings possible | |
| AMD Ryzen 7 7800X3D NVIDIA GeForce RTX 4090 |
188.5 fps +1% |
| AMD Ryzen 5 9600X NVIDIA GeForce RTX 4090 |
188.1 (3min, 200P1 - 713max) fps +1% |
| AMD Ryzen 9 7950X3D NVIDIA GeForce RTX 4090 |
188 (3.25min, 200P1 - 705max) fps +1% |
| Intel Core i9-14900K NVIDIA GeForce RTX 4090 |
187.9 (3.8min, 200P1 - 705max) fps +1% |
| AMD Ryzen 7 9700X NVIDIA GeForce RTX 4090 |
187.9 (7.35min, 200P1 - 714max) fps +1% |
| AMD Ryzen 9 9900X NVIDIA GeForce RTX 4090 |
187.8 (2.72min, 200P1 - 578max) fps 0% |
| Intel Core i5-14600K NVIDIA GeForce RTX 4090 |
187.7 (4.67min, 200P1 - 640max) fps 0% |
| Intel Core Ultra 5 245K NVIDIA GeForce RTX 4090 |
187.7 (4.11min, 200P1 - 547max) fps 0% |
| Intel Core i7-14700K NVIDIA GeForce RTX 4090 |
187.6 (4.85min, 200P1 - 537max) fps 0% |
| AMD Ryzen 9 9950X NVIDIA GeForce RTX 4090 |
187.3 (1.439min, 200P1 - 454max) fps 0% |
| Intel Core Ultra 9 285K NVIDIA GeForce RTX 4090 |
186.9 (1.378min, 142.9P1 - 474max) fps |
| 1920x1080 Highest Settings possible AA:4xMSAA + FX AF:16x | |
| AMD Ryzen 7 7800X3D NVIDIA GeForce RTX 4090 |
182 (2.73min, 142.9P1 - 445max) fps +13% |
| Intel Core i9-14900K NVIDIA GeForce RTX 4090 |
170.9 (3.95min, 142.9P1 - 448max) fps +6% |
| AMD Ryzen 9 9900X NVIDIA GeForce RTX 4090 |
170.7 (2.88min, 125P1 - 346max) fps +6% |
| AMD Ryzen 7 9700X NVIDIA GeForce RTX 4090 |
170.4 (3.21min, 125P1 - 355max) fps +6% |
| AMD Ryzen 5 9600X NVIDIA GeForce RTX 4090 |
166.3 (2.04min, 125P1 - 360max) fps +3% |
| AMD Ryzen 9 9950X NVIDIA GeForce RTX 4090 |
164.1 (2.57min, 111.1P1 - 309max) fps +2% |
| Intel Core i5-14600K NVIDIA GeForce RTX 4090 |
162.3 (14.2min, 125P1 - 354max) fps +1% |
| Intel Core Ultra 9 285K NVIDIA GeForce RTX 4090 |
161.3 (2.63min, 111.1P1 - 310max) fps |
| AMD Ryzen 9 7950X3D NVIDIA GeForce RTX 4090 |
160.2 (11.4min, 111.1P1 - 366max) fps -1% |
| Intel Core i7-14700K NVIDIA GeForce RTX 4090 |
151.2 (3.55min, 83.3P1 - 351max) fps -6% |
| Intel Core Ultra 5 245K NVIDIA GeForce RTX 4090 |
149.8 (3.65min, 111.1P1 - 305max) fps -7% |
| Borderlands 3 | |
| 1280x720 Very Low Overall Quality (DX11) | |
| AMD Ryzen 7 7800X3D NVIDIA GeForce RTX 4090 |
310 fps +48% |
| AMD Ryzen 9 7950X3D NVIDIA GeForce RTX 4090 |
308 fps +47% |
| Intel Core i9-14900K NVIDIA GeForce RTX 4090 |
263 fps +26% |
| AMD Ryzen 7 9700X NVIDIA GeForce RTX 4090 |
247 fps +18% |
| AMD Ryzen 9 9900X NVIDIA GeForce RTX 4090 |
244 fps +17% |
| AMD Ryzen 9 9950X NVIDIA GeForce RTX 4090 |
238 fps +14% |
| Intel Core i5-14600K NVIDIA GeForce RTX 4090 |
237 fps +13% |
| AMD Ryzen 5 9600X NVIDIA GeForce RTX 4090 |
228 fps +9% |
| Intel Core i7-14700K NVIDIA GeForce RTX 4090 |
220 fps +5% |
| Intel Core Ultra 9 285K NVIDIA GeForce RTX 4090 |
209 fps |
| Intel Core Ultra 5 245K NVIDIA GeForce RTX 4090 |
172.1 fps -18% |
| 1920x1080 Very Low Overall Quality (DX11) | |
| AMD Ryzen 9 7950X3D NVIDIA GeForce RTX 4090 |
306 fps +51% |
| AMD Ryzen 7 7800X3D NVIDIA GeForce RTX 4090 |
305 fps +50% |
| Intel Core i9-14900K NVIDIA GeForce RTX 4090 |
259 fps +28% |
| AMD Ryzen 9 9900X NVIDIA GeForce RTX 4090 |
250 fps +23% |
| AMD Ryzen 7 9700X NVIDIA GeForce RTX 4090 |
249 fps +23% |
| AMD Ryzen 9 9950X NVIDIA GeForce RTX 4090 |
235 fps +16% |
| Intel Core i5-14600K NVIDIA GeForce RTX 4090 |
233 fps +15% |
| AMD Ryzen 5 9600X NVIDIA GeForce RTX 4090 |
227 fps +12% |
| Intel Core i7-14700K NVIDIA GeForce RTX 4090 |
217 fps +7% |
| Intel Core Ultra 9 285K NVIDIA GeForce RTX 4090 |
203 fps |
| Intel Core Ultra 5 245K NVIDIA GeForce RTX 4090 |
177.6 fps -13% |
| 1920x1080 Badass Overall Quality (DX11) | |
| AMD Ryzen 9 7950X3D NVIDIA GeForce RTX 4090 |
242 fps +52% |
| AMD Ryzen 7 7800X3D NVIDIA GeForce RTX 4090 |
241 fps +51% |
| Intel Core i9-14900K NVIDIA GeForce RTX 4090 |
204 fps +28% |
| AMD Ryzen 7 9700X NVIDIA GeForce RTX 4090 |
192.8 fps +21% |
| AMD Ryzen 9 9900X NVIDIA GeForce RTX 4090 |
191.2 fps +20% |
| Intel Core i5-14600K NVIDIA GeForce RTX 4090 |
182 fps +14% |
| AMD Ryzen 9 9950X NVIDIA GeForce RTX 4090 |
181.1 fps +14% |
| AMD Ryzen 5 9600X NVIDIA GeForce RTX 4090 |
178.7 fps +12% |
| Intel Core i7-14700K NVIDIA GeForce RTX 4090 |
170.4 fps +7% |
| Intel Core Ultra 9 285K NVIDIA GeForce RTX 4090 |
159.1 fps |
| Intel Core Ultra 5 245K NVIDIA GeForce RTX 4090 |
138.8 fps -13% |
| Shadow of the Tomb Raider | |
| 1280x720 Lowest Preset | |
| AMD Ryzen 7 7800X3D NVIDIA GeForce RTX 4090 |
407 fps +44% |
| AMD Ryzen 9 7950X3D NVIDIA GeForce RTX 4090 |
383 fps +36% |
| AMD Ryzen 7 9700X NVIDIA GeForce RTX 4090 |
335 fps +19% |
| AMD Ryzen 9 9950X NVIDIA GeForce RTX 4090 |
335 fps +19% |
| Intel Core i9-14900K NVIDIA GeForce RTX 4090 |
332 fps +18% |
| AMD Ryzen 9 9900X NVIDIA GeForce RTX 4090 |
327 fps +16% |
| AMD Ryzen 5 9600X NVIDIA GeForce RTX 4090 |
319 fps +13% |
| Intel Core Ultra 9 285K NVIDIA GeForce RTX 4090 |
282 fps |
| Intel Core i5-14600K NVIDIA GeForce RTX 4090 |
281 fps 0% |
| Intel Core i7-14700K NVIDIA GeForce RTX 4090 |
278 fps -1% |
| Intel Core Ultra 5 245K NVIDIA GeForce RTX 4090 |
246 fps -13% |
| 1920x1080 Highest Preset AA:T | |
| AMD Ryzen 7 7800X3D NVIDIA GeForce RTX 4090 |
375 fps +39% |
| AMD Ryzen 9 7950X3D NVIDIA GeForce RTX 4090 |
361 fps +34% |
| Intel Core i9-14900K NVIDIA GeForce RTX 4090 |
313 fps +16% |
| AMD Ryzen 9 9900X NVIDIA GeForce RTX 4090 |
306 fps +13% |
| AMD Ryzen 7 9700X NVIDIA GeForce RTX 4090 |
303 fps +12% |
| AMD Ryzen 9 9950X NVIDIA GeForce RTX 4090 |
294 fps +9% |
| AMD Ryzen 5 9600X NVIDIA GeForce RTX 4090 |
283 fps +5% |
| Intel Core i5-14600K NVIDIA GeForce RTX 4090 |
272 fps +1% |
| Intel Core Ultra 9 285K NVIDIA GeForce RTX 4090 |
270 fps |
| Intel Core i7-14700K NVIDIA GeForce RTX 4090 |
266 fps -1% |
| Intel Core Ultra 5 245K NVIDIA GeForce RTX 4090 |
233 fps -14% |
| Metro Exodus | |
| 1280x720 Low Quality AF:4x | |
| AMD Ryzen 7 7800X3D NVIDIA GeForce RTX 4090 |
374 (214.41min - 571.76max) fps +25% |
| AMD Ryzen 7 9700X NVIDIA GeForce RTX 4090 |
351 (190.8min - 547.05max) fps +17% |
| AMD Ryzen 5 9600X NVIDIA GeForce RTX 4090 |
349 (182.25min - 551.57max) fps +17% |
| AMD Ryzen 9 9950X NVIDIA GeForce RTX 4090 |
346 (188.11min - 534.47max) fps +16% |
| AMD Ryzen 9 9900X NVIDIA GeForce RTX 4090 |
325 (183.15min - 495.29max) fps +9% |
| Intel Core i9-14900K NVIDIA GeForce RTX 4090 |
319 (166.53min - 527.7max) fps +7% |
| Intel Core Ultra 9 285K NVIDIA GeForce RTX 4090 |
299 (145.39min - 494.8max) fps |
| Intel Core i5-14600K NVIDIA GeForce RTX 4090 |
296 (170.68min - 455.17max) fps -1% |
| AMD Ryzen 9 7950X3D NVIDIA GeForce RTX 4090 |
293 (157.18min - 462.11max) fps -2% |
| Intel Core i7-14700K NVIDIA GeForce RTX 4090 |
289 (165.56min - 442.67max) fps -3% |
| Intel Core Ultra 5 245K NVIDIA GeForce RTX 4090 |
256 (135.37min - 427.35max) fps -14% |
| 1920x1080 Ultra Quality AF:16x | |
| AMD Ryzen 7 7800X3D NVIDIA GeForce RTX 4090 |
219 (104.41min - 354.23max) fps +13% |
| AMD Ryzen 5 9600X NVIDIA GeForce RTX 4090 |
218 (90.41min - 345.54max) fps +12% |
| Intel Core i9-14900K NVIDIA GeForce RTX 4090 |
214 (96.03min - 351.12max) fps +10% |
| AMD Ryzen 7 9700X NVIDIA GeForce RTX 4090 |
213 (90.34min - 345.18max) fps +10% |
| AMD Ryzen 9 9900X NVIDIA GeForce RTX 4090 |
211 (94.84min - 333.44max) fps +9% |
| AMD Ryzen 9 9950X NVIDIA GeForce RTX 4090 |
205 (89.97min - 340.37max) fps +6% |
| Intel Core i5-14600K NVIDIA GeForce RTX 4090 |
202 (100.6min - 297.35max) fps +4% |
| Intel Core i7-14700K NVIDIA GeForce RTX 4090 |
194.7 (90.04min - 299.94max) fps 0% |
| Intel Core Ultra 9 285K NVIDIA GeForce RTX 4090 |
193.8 (101.45min - 321.75max) fps |
| AMD Ryzen 9 7950X3D NVIDIA GeForce RTX 4090 |
193.5 (110.2min - 306.94max) fps 0% |
| Intel Core Ultra 5 245K NVIDIA GeForce RTX 4090 |
175.4 (99.36min - 276.55max) fps -9% |
| F1 2021 | |
| 1280x720 Ultra Low Preset | |
| AMD Ryzen 7 7800X3D NVIDIA GeForce RTX 4090 |
830 (632min, 515P1 - 919max) fps +57% |
| Intel Core i9-14900K NVIDIA GeForce RTX 4090 |
733 (560min, 450P1 - 806max) fps +38% |
| AMD Ryzen 9 7950X3D NVIDIA GeForce RTX 4090 |
682 (522min, 418P1 - 767max) fps +29% |
| AMD Ryzen 5 9600X NVIDIA GeForce RTX 4090 |
669 (451min, 412P1 - 741max) fps +26% |
| AMD Ryzen 9 9950X NVIDIA GeForce RTX 4090 |
662 (489min, 410P1 - 734max) fps +25% |
| AMD Ryzen 7 9700X NVIDIA GeForce RTX 4090 |
642 (470min, 407P1 - 708max) fps +21% |
| AMD Ryzen 9 9900X NVIDIA GeForce RTX 4090 |
631 (466min, 402P1 - 691max) fps +19% |
| Intel Core i5-14600K NVIDIA GeForce RTX 4090 |
562 (468min, 364P1 - 618max) fps +6% |
| Intel Core i7-14700K NVIDIA GeForce RTX 4090 |
547 (425min, 350P1 - 595max) fps +3% |
| Intel Core Ultra 9 285K NVIDIA GeForce RTX 4090 |
530 (401min, 330P1 - 588max) fps |
| Intel Core Ultra 5 245K NVIDIA GeForce RTX 4090 |
386 (318min, 250P1 - 422max) fps -27% |
| 1920x1080 Ultra High Preset + Raytracing AA:T AF:16x | |
| AMD Ryzen 7 7800X3D NVIDIA GeForce RTX 4090 |
369 (301min, 276P1 - 395max) fps +59% |
| Intel Core i9-14900K NVIDIA GeForce RTX 4090 |
307 (260min, 234P1 - 327max) fps +32% |
| AMD Ryzen 7 9700X NVIDIA GeForce RTX 4090 |
287 (244min, 221P1 - 309max) fps +24% |
| AMD Ryzen 5 9600X NVIDIA GeForce RTX 4090 |
280 (231min, 211P1 - 307max) fps +21% |
| Intel Core i5-14600K NVIDIA GeForce RTX 4090 |
278 (237min, 198P1 - 299max) fps +20% |
| AMD Ryzen 9 7950X3D NVIDIA GeForce RTX 4090 |
271 (216min, 208P1 - 293max) fps +17% |
| AMD Ryzen 9 9900X NVIDIA GeForce RTX 4090 |
270 (227min, 211P1 - 289max) fps +16% |
| AMD Ryzen 9 9950X NVIDIA GeForce RTX 4090 |
265 (211min, 195P1 - 288max) fps +14% |
| Intel Core i7-14700K NVIDIA GeForce RTX 4090 |
260 (225min, 197P1 - 278max) fps +12% |
| Intel Core Ultra 9 285K NVIDIA GeForce RTX 4090 |
232 (201min, 165P1 - 248max) fps |
| Intel Core Ultra 5 245K NVIDIA GeForce RTX 4090 |
203 (168min, 142P1 - 218max) fps -12% |
即使是 QHD Ultra 和 UHD Ultra 等依赖 GPU 的设置,酷睿至尊 9 285K 也似乎失去了吸引力。不过,与酷睿 i9-14900K 相比,在这些设置下的累积性能差距目前为 10%,而在更受 CPU 限制的分辨率下则为 15%。
虽然说酷睿 Ultra 9 285K 对 RTX 4090 造成了瓶颈有点牵强,但如果游戏是你的主要用途,你还有更好(更便宜)的选择。
| Gaming Performance Rating - Percent | |
| AMD Ryzen 7 7800X3D NVIDIA GeForce RTX 4090 |
99.4 pt |
| AMD Ryzen 9 7950X3D NVIDIA GeForce RTX 4090 |
95.3 pt |
| Intel Core i9-14900K NVIDIA GeForce RTX 4090 |
95.1 pt |
| AMD Ryzen 7 9700X NVIDIA GeForce RTX 4090 |
91.8 pt |
| AMD Ryzen 9 9900X NVIDIA GeForce RTX 4090 |
91.6 pt |
| Intel Core i5-14600K NVIDIA GeForce RTX 4090 |
91.5 pt |
| AMD Ryzen 5 9600X NVIDIA GeForce RTX 4090 |
91.4 pt |
| AMD Ryzen 9 9950X NVIDIA GeForce RTX 4090 |
89.2 pt |
| Intel Core i7-14700K NVIDIA GeForce RTX 4090 |
86.9 pt |
| Intel Core Ultra 9 285K NVIDIA GeForce RTX 4090 |
85.8 pt |
| Intel Core Ultra 5 245K NVIDIA GeForce RTX 4090 |
83.2 pt |
| F1 22 | |
| 2560x1440 Ultra High Preset AA:T AF:16x | |
| AMD Ryzen 7 7800X3D NVIDIA GeForce RTX 4090 |
162.9 (140min, 114P1 - 191max) fps +9% |
| AMD Ryzen 5 9600X NVIDIA GeForce RTX 4090 |
162.7 (141min, 119P1 - 186max) fps +9% |
| Intel Core i9-14900K NVIDIA GeForce RTX 4090 |
161.1 (140min, 115P1 - 184max) fps +7% |
| AMD Ryzen 9 9900X NVIDIA GeForce RTX 4090 |
160.8 (136min, 113P1 - 185max) fps +7% |
| Intel Core i5-14600K NVIDIA GeForce RTX 4090 |
160.3 (139min, 112P1 - 182max) fps +7% |
| AMD Ryzen 7 9700X NVIDIA GeForce RTX 4090 |
160 (114min, 112P1 - 185max) fps +7% |
| AMD Ryzen 9 7950X3D NVIDIA GeForce RTX 4090 |
158.9 (138min, 107P1 - 178max) fps +6% |
| AMD Ryzen 9 9950X NVIDIA GeForce RTX 4090 |
155.1 (128min, 107P1 - 178max) fps +3% |
| Intel Core Ultra 5 245K NVIDIA GeForce RTX 4090 |
152.1 (120min, 103P1 - 169max) fps +1% |
| Intel Core i7-14700K NVIDIA GeForce RTX 4090 |
151.1 (130min, 105P1 - 173max) fps +1% |
| Intel Core Ultra 9 285K NVIDIA GeForce RTX 4090 |
149.9 (128min, 103P1 - 170max) fps |
| 3840x2160 Ultra High Preset AA:T AF:16x | |
| AMD Ryzen 9 9900X NVIDIA GeForce RTX 4090 |
86.9 (74min, 73P1 - 103max) fps +5% |
| Intel Core Ultra 5 245K NVIDIA GeForce RTX 4090 |
85.5 (74min, 69P1 - 98max) fps +3% |
| AMD Ryzen 5 9600X NVIDIA GeForce RTX 4090 |
85 (73min, 72P1 - 99max) fps +2% |
| AMD Ryzen 7 9700X NVIDIA GeForce RTX 4090 |
84.8 (73min, 72P1 - 98max) fps +2% |
| AMD Ryzen 7 7800X3D NVIDIA GeForce RTX 4090 |
84.5 (72min, 71P1 - 97max) fps +2% |
| AMD Ryzen 9 9950X NVIDIA GeForce RTX 4090 |
84.5 (72min, 71P1 - 98max) fps +2% |
| Intel Core i5-14600K NVIDIA GeForce RTX 4090 |
83.5 (72min, 71P1 - 96max) fps +1% |
| Intel Core i9-14900K NVIDIA GeForce RTX 4090 |
83.4 (72min, 71P1 - 96max) fps 0% |
| Intel Core Ultra 9 285K NVIDIA GeForce RTX 4090 |
83 (70min, 69P1 - 96max) fps |
| AMD Ryzen 9 7950X3D NVIDIA GeForce RTX 4090 |
82.3 (71min, 70P1 - 94max) fps -1% |
| Intel Core i7-14700K NVIDIA GeForce RTX 4090 |
82.3 (71min, 70P1 - 95max) fps -1% |
| Far Cry 5 | |
| 2560x1440 Ultra Preset AA:T | |
| AMD Ryzen 7 7800X3D NVIDIA GeForce RTX 4090 |
268 (202min - 364max) fps +56% |
| AMD Ryzen 9 7950X3D NVIDIA GeForce RTX 4090 |
246 (178min - 355max) fps +43% |
| AMD Ryzen 9 9900X NVIDIA GeForce RTX 4090 |
219 (158min - 305max) fps +27% |
| Intel Core i9-14900K NVIDIA GeForce RTX 4090 |
216 (164min - 298max) fps +26% |
| AMD Ryzen 5 9600X NVIDIA GeForce RTX 4090 |
203 (148min - 267max) fps +18% |
| AMD Ryzen 7 9700X NVIDIA GeForce RTX 4090 |
203 (151min - 282max) fps +18% |
| Intel Core i5-14600K NVIDIA GeForce RTX 4090 |
195 (148min - 267max) fps +13% |
| AMD Ryzen 9 9950X NVIDIA GeForce RTX 4090 |
193 (146min - 266max) fps +12% |
| Intel Core Ultra 9 285K NVIDIA GeForce RTX 4090 |
172 (124min - 234max) fps |
| Intel Core i7-14700K NVIDIA GeForce RTX 4090 |
155 (118min - 229max) fps -10% |
| Intel Core Ultra 5 245K NVIDIA GeForce RTX 4090 |
155 (120min - 219max) fps -10% |
| 3840x2160 Ultra Preset AA:T | |
| AMD Ryzen 7 7800X3D NVIDIA GeForce RTX 4090 |
187 (166min - 215max) fps +15% |
| Intel Core i9-14900K NVIDIA GeForce RTX 4090 |
187 (168min - 216max) fps +15% |
| AMD Ryzen 9 7950X3D NVIDIA GeForce RTX 4090 |
182 (157min - 212max) fps +12% |
| Intel Core i5-14600K NVIDIA GeForce RTX 4090 |
181 (151min - 215max) fps +12% |
| AMD Ryzen 5 9600X NVIDIA GeForce RTX 4090 |
170 (136min - 198max) fps +5% |
| AMD Ryzen 9 9900X NVIDIA GeForce RTX 4090 |
169 (143min - 197max) fps +4% |
| AMD Ryzen 9 9950X NVIDIA GeForce RTX 4090 |
169 (142min - 196max) fps +4% |
| AMD Ryzen 7 9700X NVIDIA GeForce RTX 4090 |
165 (135min - 198max) fps +2% |
| Intel Core Ultra 9 285K NVIDIA GeForce RTX 4090 |
162 (127min - 201max) fps |
| Intel Core Ultra 5 245K NVIDIA GeForce RTX 4090 |
153 (117min - 210max) fps -6% |
| Intel Core i7-14700K NVIDIA GeForce RTX 4090 |
152 (118min - 207max) fps -6% |
| X-Plane 11.11 - 3840x2160 high (fps_test=3) | |
| AMD Ryzen 7 7800X3D NVIDIA GeForce RTX 4090 |
160.5 fps +37% |
| AMD Ryzen 9 7950X3D NVIDIA GeForce RTX 4090 |
158.4 fps +35% |
| AMD Ryzen 7 9700X NVIDIA GeForce RTX 4090 |
142 fps +21% |
| AMD Ryzen 5 9600X NVIDIA GeForce RTX 4090 |
136.6 fps +16% |
| Intel Core i9-14900K NVIDIA GeForce RTX 4090 |
136.3 fps +16% |
| AMD Ryzen 9 9900X NVIDIA GeForce RTX 4090 |
133.5 fps +14% |
| Intel Core i7-14700K NVIDIA GeForce RTX 4090 |
128.2 fps +9% |
| Intel Core i5-14600K NVIDIA GeForce RTX 4090 |
124.6 fps +6% |
| AMD Ryzen 9 9950X NVIDIA GeForce RTX 4090 |
123.1 fps +5% |
| Intel Core Ultra 9 285K NVIDIA GeForce RTX 4090 |
117.3 fps |
| Intel Core Ultra 5 245K NVIDIA GeForce RTX 4090 |
93.4 fps -20% |
| Final Fantasy XV Benchmark | |
| 2560x1440 High Quality | |
| AMD Ryzen 7 7800X3D NVIDIA GeForce RTX 4090 |
231 fps +5% |
| Intel Core i9-14900K NVIDIA GeForce RTX 4090 |
229 fps +4% |
| Intel Core i5-14600K NVIDIA GeForce RTX 4090 |
226 fps +2% |
| AMD Ryzen 9 7950X3D NVIDIA GeForce RTX 4090 |
225 fps +2% |
| AMD Ryzen 9 9950X NVIDIA GeForce RTX 4090 |
222 fps 0% |
| Intel Core Ultra 9 285K NVIDIA GeForce RTX 4090 |
221 fps |
| Intel Core i7-14700K NVIDIA GeForce RTX 4090 |
219 fps -1% |
| AMD Ryzen 5 9600X NVIDIA GeForce RTX 4090 |
215 fps -3% |
| Intel Core Ultra 5 245K NVIDIA GeForce RTX 4090 |
214 fps -3% |
| AMD Ryzen 7 9700X NVIDIA GeForce RTX 4090 |
213 fps -4% |
| AMD Ryzen 9 9900X NVIDIA GeForce RTX 4090 |
212 fps -4% |
| 3840x2160 High Quality | |
| Intel Core Ultra 5 245K NVIDIA GeForce RTX 4090 |
162.3 fps +5% |
| Intel Core i9-14900K NVIDIA GeForce RTX 4090 |
161.9 fps +5% |
| Intel Core i5-14600K NVIDIA GeForce RTX 4090 |
161.5 fps +5% |
| Intel Core i7-14700K NVIDIA GeForce RTX 4090 |
159.2 fps +3% |
| AMD Ryzen 7 7800X3D NVIDIA GeForce RTX 4090 |
158.2 fps +3% |
| AMD Ryzen 9 7950X3D NVIDIA GeForce RTX 4090 |
157.6 fps +2% |
| Intel Core Ultra 9 285K NVIDIA GeForce RTX 4090 |
154.3 fps |
| AMD Ryzen 9 9950X NVIDIA GeForce RTX 4090 |
152.9 fps -1% |
| AMD Ryzen 9 9900X NVIDIA GeForce RTX 4090 |
151.3 fps -2% |
| AMD Ryzen 5 9600X NVIDIA GeForce RTX 4090 |
150.9 fps -2% |
| AMD Ryzen 7 9700X NVIDIA GeForce RTX 4090 |
148.3 fps -4% |
| Dota 2 Reborn - 3840x2160 ultra (3/3) best looking | |
| AMD Ryzen 7 7800X3D NVIDIA GeForce RTX 4090 |
258.2 (201.3min) fps +32% |
| AMD Ryzen 9 7950X3D NVIDIA GeForce RTX 4090 |
245.4 (195.9min) fps +25% |
| AMD Ryzen 9 9950X NVIDIA GeForce RTX 4090 |
238 (203.3min) fps +21% |
| AMD Ryzen 7 9700X NVIDIA GeForce RTX 4090 |
237.2 (194.3min) fps +21% |
| AMD Ryzen 9 9900X NVIDIA GeForce RTX 4090 |
233.2 (195.2min) fps +19% |
| Intel Core i9-14900K NVIDIA GeForce RTX 4090 |
227.8 (188.3min) fps +16% |
| AMD Ryzen 5 9600X NVIDIA GeForce RTX 4090 |
225 (189.1min) fps +15% |
| Intel Core i5-14600K NVIDIA GeForce RTX 4090 |
211.5 (179.5min) fps +8% |
| Intel Core i7-14700K NVIDIA GeForce RTX 4090 |
198.1 (161.6min) fps +1% |
| Intel Core Ultra 9 285K NVIDIA GeForce RTX 4090 |
196.3 (160.9min) fps |
| Intel Core Ultra 5 245K NVIDIA GeForce RTX 4090 |
168 (143.3min) fps -14% |
| The Witcher 3 - 3840x2160 Ultra Graphics & Postprocessing (HBAO+) | |
| Intel Core i9-14900K NVIDIA GeForce RTX 4090 |
180.1 (98.9min, 123.4P0.1, 150.3P1 - 473max) fps +10% |
| Intel Core Ultra 5 245K NVIDIA GeForce RTX 4090 |
177.5 (113.8min, 145.4P0.1, 162P1 - 312max) fps +9% |
| AMD Ryzen 7 7800X3D NVIDIA GeForce RTX 4090 |
174.8 fps +7% |
| Intel Core i5-14600K NVIDIA GeForce RTX 4090 |
172.6 (94.4min, 106.5P0.1, 142.2P1 - 408max) fps +6% |
| AMD Ryzen 9 7950X3D NVIDIA GeForce RTX 4090 |
171.8 fps +5% |
| AMD Ryzen 5 9600X NVIDIA GeForce RTX 4090 |
168 (64min, 99P0.1, 134.4P1 - 449max) fps +3% |
| Intel Core i7-14700K NVIDIA GeForce RTX 4090 |
164.7 (150min, 150.62P1 - 176max) fps +1% |
| Intel Core Ultra 9 285K NVIDIA GeForce RTX 4090 |
163.2 (146min, 146P1 - 178max) fps |
| AMD Ryzen 7 9700X NVIDIA GeForce RTX 4090 |
160.9 (144min, 145.45P1 - 176max) fps -1% |
| AMD Ryzen 9 9900X NVIDIA GeForce RTX 4090 |
160.4 (148min, 148.3P1 - 173max) fps -2% |
| AMD Ryzen 9 9950X NVIDIA GeForce RTX 4090 |
158 (143min, 143.31P1 - 169max) fps -3% |
| GTA V | |
| 2560x1440 Highest Settings possible AA:4xMSAA + FX AF:16x | |
| AMD Ryzen 7 7800X3D NVIDIA GeForce RTX 4090 |
181.1 (6.02min, 142.9P1 - 480max) fps +17% |
| Intel Core i9-14900K NVIDIA GeForce RTX 4090 |
171.9 (4.45min, 142.9P1 - 406max) fps +11% |
| AMD Ryzen 9 9900X NVIDIA GeForce RTX 4090 |
171.3 (4.56min, 125P1 - 356max) fps +11% |
| AMD Ryzen 7 9700X NVIDIA GeForce RTX 4090 |
169.3 (2.93min, 125P1 - 341max) fps +10% |
| AMD Ryzen 5 9600X NVIDIA GeForce RTX 4090 |
166.7 (6.04min, 125P1 - 387max) fps +8% |
| AMD Ryzen 9 9950X NVIDIA GeForce RTX 4090 |
164.4 (2.77min, 125P1 - 304max) fps +7% |
| Intel Core i5-14600K NVIDIA GeForce RTX 4090 |
163.5 (9.19min, 125P1 - 340max) fps +6% |
| AMD Ryzen 9 7950X3D NVIDIA GeForce RTX 4090 |
160.9 (7.74min, 111.1P1 - 368max) fps +4% |
| Intel Core Ultra 9 285K NVIDIA GeForce RTX 4090 |
154.2 (2.83min, 111.1P1 - 325max) fps |
| Intel Core Ultra 5 245K NVIDIA GeForce RTX 4090 |
151.7 (3.63min, 111.1P1 - 294max) fps -2% |
| Intel Core i7-14700K NVIDIA GeForce RTX 4090 |
151.2 (2.91min, 83.3P1 - 363max) fps -2% |
| 3840x2160 Highest Settings possible AA:4xMSAA + FX AF:16x | |
| AMD Ryzen 7 7800X3D NVIDIA GeForce RTX 4090 |
146.2 (8.5min, 90.9P1 - 331max) fps +8% |
| Intel Core i9-14900K NVIDIA GeForce RTX 4090 |
146.1 (4.68min, 100P1 - 354max) fps +7% |
| Intel Core i5-14600K NVIDIA GeForce RTX 4090 |
141.9 (11.7min, 100P1 - 301max) fps +4% |
| AMD Ryzen 9 9900X NVIDIA GeForce RTX 4090 |
141.8 (19.1min, 90.9P1 - 286max) fps +4% |
| AMD Ryzen 5 9600X NVIDIA GeForce RTX 4090 |
140.8 (8.91min, 90.9P1 - 270max) fps +4% |
| AMD Ryzen 7 9700X NVIDIA GeForce RTX 4090 |
140.7 (16min, 90.9P1 - 276max) fps +3% |
| AMD Ryzen 9 7950X3D NVIDIA GeForce RTX 4090 |
136.9 (8.24min, 90.9P1 - 318max) fps +1% |
| Intel Core Ultra 9 285K NVIDIA GeForce RTX 4090 |
136 (4.29min, 90.9P1 - 284max) fps |
| Intel Core Ultra 5 245K NVIDIA GeForce RTX 4090 |
135.7 (8.52min, 90.9P1 - 241max) fps 0% |
| Intel Core i7-14700K NVIDIA GeForce RTX 4090 |
133.8 (5.14min, 83.3P1 - 293max) fps -2% |
| AMD Ryzen 9 9950X NVIDIA GeForce RTX 4090 |
125.7 (14.4min, 83.3P1 - 209max) fps -8% |
| Borderlands 3 | |
| 2560x1440 Badass Overall Quality (DX11) | |
| AMD Ryzen 7 7800X3D NVIDIA GeForce RTX 4090 |
224 fps +42% |
| AMD Ryzen 9 7950X3D NVIDIA GeForce RTX 4090 |
223 fps +41% |
| Intel Core i9-14900K NVIDIA GeForce RTX 4090 |
198.4 fps +25% |
| AMD Ryzen 7 9700X NVIDIA GeForce RTX 4090 |
188.3 fps +19% |
| AMD Ryzen 9 9900X NVIDIA GeForce RTX 4090 |
186.9 fps +18% |
| Intel Core i5-14600K NVIDIA GeForce RTX 4090 |
179.3 fps +13% |
| AMD Ryzen 9 9950X NVIDIA GeForce RTX 4090 |
177.7 fps +12% |
| Intel Core i7-14700K NVIDIA GeForce RTX 4090 |
171.6 fps +8% |
| AMD Ryzen 5 9600X NVIDIA GeForce RTX 4090 |
171.6 fps +8% |
| Intel Core Ultra 9 285K NVIDIA GeForce RTX 4090 |
158.2 fps |
| Intel Core Ultra 5 245K NVIDIA GeForce RTX 4090 |
140.9 fps -11% |
| 3840x2160 Badass Overall Quality (DX11) | |
| Intel Core i9-14900K NVIDIA GeForce RTX 4090 |
137.9 fps +8% |
| AMD Ryzen 7 7800X3D NVIDIA GeForce RTX 4090 |
137.4 fps +8% |
| AMD Ryzen 9 7950X3D NVIDIA GeForce RTX 4090 |
136.4 fps +7% |
| Intel Core i5-14600K NVIDIA GeForce RTX 4090 |
136.1 fps +7% |
| Intel Core i7-14700K NVIDIA GeForce RTX 4090 |
132.6 fps +4% |
| AMD Ryzen 9 9900X NVIDIA GeForce RTX 4090 |
132 fps +4% |
| AMD Ryzen 5 9600X NVIDIA GeForce RTX 4090 |
131.8 fps +4% |
| AMD Ryzen 7 9700X NVIDIA GeForce RTX 4090 |
131.5 fps +3% |
| AMD Ryzen 9 9950X NVIDIA GeForce RTX 4090 |
130.5 fps +3% |
| Intel Core Ultra 9 285K NVIDIA GeForce RTX 4090 |
127.3 fps |
| Intel Core Ultra 5 245K NVIDIA GeForce RTX 4090 |
124 fps -3% |
| Shadow of the Tomb Raider | |
| 2560x1440 Highest Preset AA:T | |
| AMD Ryzen 7 7800X3D NVIDIA GeForce RTX 4090 |
322 fps +26% |
| AMD Ryzen 9 7950X3D NVIDIA GeForce RTX 4090 |
315 fps +24% |
| Intel Core i9-14900K NVIDIA GeForce RTX 4090 |
293 fps +15% |
| AMD Ryzen 9 9900X NVIDIA GeForce RTX 4090 |
278.1 fps +9% |
| AMD Ryzen 9 9950X NVIDIA GeForce RTX 4090 |
275 fps +8% |
| AMD Ryzen 7 9700X NVIDIA GeForce RTX 4090 |
273 fps +7% |
| AMD Ryzen 5 9600X NVIDIA GeForce RTX 4090 |
267 fps +5% |
| Intel Core i5-14600K NVIDIA GeForce RTX 4090 |
266 fps +4% |
| Intel Core i7-14700K NVIDIA GeForce RTX 4090 |
258 fps +1% |
| Intel Core Ultra 9 285K NVIDIA GeForce RTX 4090 |
255 fps |
| Intel Core Ultra 5 245K NVIDIA GeForce RTX 4090 |
229 fps -10% |
| 3840x2160 Highest Preset AA:T | |
| Intel Core i9-14900K NVIDIA GeForce RTX 4090 |
189.7 fps +6% |
| Intel Core i5-14600K NVIDIA GeForce RTX 4090 |
188.8 fps +6% |
| AMD Ryzen 5 9600X NVIDIA GeForce RTX 4090 |
188.1 fps +5% |
| AMD Ryzen 7 7800X3D NVIDIA GeForce RTX 4090 |
187.7 fps +5% |
| AMD Ryzen 9 7950X3D NVIDIA GeForce RTX 4090 |
187.6 fps +5% |
| Intel Core Ultra 5 245K NVIDIA GeForce RTX 4090 |
186.6 fps +5% |
| AMD Ryzen 9 9900X NVIDIA GeForce RTX 4090 |
185.1 fps +4% |
| AMD Ryzen 7 9700X NVIDIA GeForce RTX 4090 |
185 fps +4% |
| Intel Core i7-14700K NVIDIA GeForce RTX 4090 |
180.4 fps +1% |
| Intel Core Ultra 9 285K NVIDIA GeForce RTX 4090 |
178.4 fps |
| AMD Ryzen 9 9950X NVIDIA GeForce RTX 4090 |
177.2 fps -1% |
| Metro Exodus | |
| 2560x1440 Ultra Quality AF:16x | |
| AMD Ryzen 7 7800X3D NVIDIA GeForce RTX 4090 |
199.8 (101.33min - 324.25max) fps +12% |
| Intel Core i9-14900K NVIDIA GeForce RTX 4090 |
194.6 (92.87min - 333.22max) fps +10% |
| AMD Ryzen 5 9600X NVIDIA GeForce RTX 4090 |
194.4 (86.13min - 328.84max) fps +9% |
| AMD Ryzen 7 9700X NVIDIA GeForce RTX 4090 |
190.5 (88.41min - 319.18max) fps +7% |
| Intel Core i5-14600K NVIDIA GeForce RTX 4090 |
188.8 (91.88min - 291.97max) fps +6% |
| AMD Ryzen 9 9900X NVIDIA GeForce RTX 4090 |
188.7 (90.82min - 309.5max) fps +6% |
| Intel Core i7-14700K NVIDIA GeForce RTX 4090 |
181.3 (87.39min - 285.47max) fps +2% |
| AMD Ryzen 9 9950X NVIDIA GeForce RTX 4090 |
180.3 (85.69min - 309.5max) fps +1% |
| AMD Ryzen 9 7950X3D NVIDIA GeForce RTX 4090 |
178.9 (99.89min - 271.52max) fps +1% |
| Intel Core Ultra 9 285K NVIDIA GeForce RTX 4090 |
177.7 (81.24min - 295.86max) fps |
| Intel Core Ultra 5 245K NVIDIA GeForce RTX 4090 |
169 (98.55min - 262.95max) fps -5% |
| 3840x2160 Ultra Quality AF:16x | |
| Intel Core i9-14900K NVIDIA GeForce RTX 4090 |
143.4 (84.04min - 227.17max) fps +9% |
| Intel Core i5-14600K NVIDIA GeForce RTX 4090 |
142.1 (81.45min - 230.73max) fps +8% |
| AMD Ryzen 7 7800X3D NVIDIA GeForce RTX 4090 |
141.6 (85.41min - 213.31max) fps +8% |
| AMD Ryzen 9 7950X3D NVIDIA GeForce RTX 4090 |
139.4 (76.47min - 227.32max) fps +6% |
| AMD Ryzen 7 9700X NVIDIA GeForce RTX 4090 |
138.6 (75.99min - 226.65max) fps +6% |
| Intel Core i7-14700K NVIDIA GeForce RTX 4090 |
138.5 (76.17min - 231.7max) fps +5% |
| AMD Ryzen 9 9900X NVIDIA GeForce RTX 4090 |
138.1 (77.88min - 220.02max) fps +5% |
| AMD Ryzen 5 9600X NVIDIA GeForce RTX 4090 |
138 (71.03min - 235.4max) fps +5% |
| Intel Core Ultra 5 245K NVIDIA GeForce RTX 4090 |
134.7 (69.85min - 225.07max) fps +3% |
| Intel Core Ultra 9 285K NVIDIA GeForce RTX 4090 |
131.3 (68.99min - 225.89max) fps |
| AMD Ryzen 9 9950X NVIDIA GeForce RTX 4090 |
129.6 (72.65min - 198.26max) fps -1% |
| F1 2021 | |
| 2560x1440 Ultra High Preset + Raytracing AA:T AF:16x | |
| AMD Ryzen 7 7800X3D NVIDIA GeForce RTX 4090 |
324 (276min, 240P1 - 345max) fps +41% |
| AMD Ryzen 7 9700X NVIDIA GeForce RTX 4090 |
292 (240min, 215P1 - 314max) fps +28% |
| Intel Core i9-14900K NVIDIA GeForce RTX 4090 |
291 (246min, 214P1 - 308max) fps +27% |
| AMD Ryzen 5 9600X NVIDIA GeForce RTX 4090 |
276 (222min, 198P1 - 303max) fps +21% |
| AMD Ryzen 9 7950X3D NVIDIA GeForce RTX 4090 |
271 (223min, 202P1 - 294max) fps +18% |
| Intel Core i5-14600K NVIDIA GeForce RTX 4090 |
268 (219min, 187P1 - 288max) fps +17% |
| AMD Ryzen 9 9950X NVIDIA GeForce RTX 4090 |
268 (219min, 195P1 - 292max) fps +17% |
| Intel Core i7-14700K NVIDIA GeForce RTX 4090 |
257 (218min, 192P1 - 275max) fps +12% |
| AMD Ryzen 9 9900X NVIDIA GeForce RTX 4090 |
256 (189min, 174P1 - 279max) fps +12% |
| Intel Core Ultra 9 285K NVIDIA GeForce RTX 4090 |
229 (196min, 162P1 - 248max) fps |
| Intel Core Ultra 5 245K NVIDIA GeForce RTX 4090 |
201 (170min, 143P1 - 216max) fps -12% |
| 3840x2160 Ultra High Preset + Raytracing AA:T AF:16x | |
| AMD Ryzen 7 7800X3D NVIDIA GeForce RTX 4090 |
207 (179min, 176P1 - 230max) fps +4% |
| AMD Ryzen 9 9950X NVIDIA GeForce RTX 4090 |
207 (165min, 166P1 - 230max) fps +4% |
| AMD Ryzen 5 9600X NVIDIA GeForce RTX 4090 |
205 (176min, 168P1 - 232max) fps +3% |
| AMD Ryzen 9 7950X3D NVIDIA GeForce RTX 4090 |
203 (169min, 169P1 - 225max) fps +2% |
| Intel Core i9-14900K NVIDIA GeForce RTX 4090 |
203 (173min, 165P1 - 226max) fps +2% |
| AMD Ryzen 7 9700X NVIDIA GeForce RTX 4090 |
203 (174min, 169P1 - 227max) fps +2% |
| AMD Ryzen 9 9900X NVIDIA GeForce RTX 4090 |
203 (170min, 163P1 - 225max) fps +2% |
| Intel Core i5-14600K NVIDIA GeForce RTX 4090 |
201 (173min, 153P1 - 227max) fps +1% |
| Intel Core Ultra 9 285K NVIDIA GeForce RTX 4090 |
198.2 (171min, 145P1 - 214max) fps |
| Intel Core Ultra 5 245K NVIDIA GeForce RTX 4090 |
196.9 (171min, 139P1 - 211max) fps -1% |
| Intel Core i7-14700K NVIDIA GeForce RTX 4090 |
194.9 (158min, 156P1 - 217max) fps -2% |
| low | med. | high | ultra | QHD DLSS | QHD | 4K DLSS | 4K FSR | 4K | |
|---|---|---|---|---|---|---|---|---|---|
| GTA V (2015) | 186.9 | 185.6 | 183.2 | 161.3 | 154.2 | 182.4 | |||
| The Witcher 3 (2015) | 626 | 584 | 545 | 294 | 251 | 276 | |||
| Dota 2 Reborn (2015) | 256 | 230 | 218 | 204 | 196.3 | ||||
| Final Fantasy XV Benchmark (2018) | 234 | 237 | 228 | 221 | 154.3 | ||||
| X-Plane 11.11 (2018) | 189.1 | 172.5 | 140.5 | 117.3 | |||||
| Far Cry 5 (2018) | 225 | 194 | 186 | 171 | 172 | 162 | |||
| Strange Brigade (2018) | 705 | 557 | 552 | 547 | 501 | 276 | |||
| Shadow of the Tomb Raider (2018) | 282 | 273 | 275 | 270 | 255 | 178.4 | |||
| Metro Exodus (2019) | 299 | 271 | 230 | 193.8 | 177.7 | 131.3 | |||
| Borderlands 3 (2019) | 209 | 183 | 166.8 | 159.1 | 158.2 | 127.3 | |||
| F1 2021 (2021) | 530 | 510 | 486 | 232 | 229 | 198.2 | |||
| F1 22 (2022) | 357 | 388 | 373 | 174.6 | 149.9 | 83 | |||
| F1 23 (2023) | 376 | 394 | 393 | 182.9 | 145.7 | 127 | 78.5 | ||
| Baldur's Gate 3 (2023) | 304 | 293 | 271 | 269 | 225 | 193.2 | 131.7 | ||
| Cyberpunk 2077 2.2 Phantom Liberty (2023) | 212 | 214 | 195.1 | 180.3 | 145.2 | 73.2 | |||
| Assassin's Creed Mirage (2023) | 287 | 268 | 255 | 198 | 178 | 156 | 125 | ||
| F1 24 (2024) | 373 | 394 | 365 | 184.8 | 139.9 | 121 | 137.2 | 77 | |
| Black Myth: Wukong (2024) | 214 | 162 | 128 | 81 | 89 | 65 | 68 | 42 |
功耗:英特尔终于实现了正确的能效
英特尔将电源效率作为 Arrow Lake-S 的主要优势,我们可以看到酷睿至尊 9 285K 在这方面确实不负众望。
与酷睿 i9-14900K 相比,酷睿至尊 9 285K 在运行 Cinebench R23 多核时的功耗降低了 37%,而 Cinebench R23 单核功耗降低了约 27%。
在运行 Prime95 就地大型 FFT 时,功耗也比我们在 Core i9-14900K 上观察到的低 29%,Core Ultra 9 285K 更接近 Core i5-14600K 的水平。
在TheWitcher 3 的 1080p Ultra 游戏中,Core Ultra 9 285K 系统的功耗比 Core i9-14900K 低 18%,在 Cyberpunk 2077的 1080p Ultra 游戏中,Core Ultra 9 285K 系统的功耗比 Ryzen 9 9950X 低 22%:Phantom Liberty在 1080p 超高清下的功耗比Ryzen9 9950X 低 22%。
Power Consumption: External monitor
: Cyberpunk 2077 ultra external monitor
| Power Consumption / Cinebench R15 Multi (external Monitor) | |
| Intel Core i9-14900K, NVIDIA GeForce RTX 4090 |
548 (545min, 545P1 - 551max) Watt * -54% |
| Intel Core i9-13900K, NVIDIA GeForce RTX 3090 |
480 (263min, 277P1 - 553max) Watt * -35% |
| Intel Core i7-14700K, NVIDIA GeForce RTX 4090 |
428 (421min, 421P1 - 440max) Watt * -20% |
| Intel Core Ultra 9 285K, NVIDIA GeForce RTX 4090 (Idle: 76.2 W) |
356 (355min, 355P1 - 358max) Watt * |
| Intel Core i5-14600K, NVIDIA GeForce RTX 4090 |
329 (323min, 324P1 - 331max) Watt * +8% |
| Intel Core i9-12900K, NVIDIA Titan RTX (Idle: 70.5 W) |
324.4 Watt * +9% |
| AMD Ryzen 9 7950X, NVIDIA GeForce RTX 3090 |
320 (235min, 239P1 - 448max) Watt * +10% |
| AMD Ryzen 9 7900X, NVIDIA GeForce RTX 3090 |
313 (214min, 221P1 - 406max) Watt * +12% |
| AMD Ryzen 9 9950X, NVIDIA GeForce RTX 4090 (Idle: 100 W) |
313 (309min, 309P1 - 315max) Watt * +12% |
| Intel Core i5-13600K, NVIDIA GeForce RTX 3090 |
286 (232min, 235P1 - 343max) Watt * +20% |
| AMD Ryzen 9 9900X, NVIDIA GeForce RTX 4090 (Idle: 85.1 W) |
274 (272min, 272P1 - 277max) Watt * +23% |
| AMD Ryzen 9 7950X3D, NVIDIA GeForce RTX 4090 |
273 (264min, 264P1 - 304max) Watt * +23% |
| Intel Core Ultra 5 245K, NVIDIA GeForce RTX 4090 |
244 (242min, 242P1 - 246max) Watt * +31% |
| AMD Ryzen 5 9600X, NVIDIA GeForce RTX 4090 |
210 (209min, 209P1 - 210max) Watt * +41% |
| AMD Ryzen 7 7800X3D, NVIDIA GeForce RTX 4090 |
207 (203min, 203P1 - 216max) Watt * +42% |
| Intel Core i5-12600K, NVIDIA Titan RTX (Idle: 70.45 W) |
205.9 (145min - 213max) Watt * +42% |
| AMD Ryzen 7 9700X, NVIDIA GeForce RTX 4090 (Idle: 83 W) |
174.6 (173.6min, 173.6P1 - 175.1max) Watt * +51% |
| Power Consumption / Cinebench R23 Single (external Monitor) | |
| AMD Ryzen 7 7800X3D, NVIDIA GeForce RTX 4090 |
190.8 (180min, 184.6P1 - 261max) Watt * -72% |
| Intel Core i7-14700K, NVIDIA GeForce RTX 4090 |
153.6 (149.9min, 150.4P1 - 202max) Watt * -38% |
| Intel Core i9-14900K, NVIDIA GeForce RTX 4090 |
151.5 (145.4min, 146.4P1 - 205max) Watt * -36% |
| Intel Core i5-14600K, NVIDIA GeForce RTX 4090 |
149.7 (143.8min, 144.7P1 - 227max) Watt * -35% |
| AMD Ryzen 5 9600X, NVIDIA GeForce RTX 4090 |
143.5 (139.1min, 139.7P1 - 160.8max) Watt * -29% |
| AMD Ryzen 9 9950X, NVIDIA GeForce RTX 4090 (100) |
139.7 (129.3min, 130.4P1 - 183.3max) Watt * -26% |
| AMD Ryzen 9 9900X, NVIDIA GeForce RTX 4090 (85.1) |
128.2 (124.1min, 125.4P1 - 184.4max) Watt * -15% |
| Intel Core Ultra 5 245K, NVIDIA GeForce RTX 4090 |
114.4 (109.6min, 110.8P1 - 170.5max) Watt * -3% |
| AMD Ryzen 7 9700X, NVIDIA GeForce RTX 4090 (83) |
112.2 (110.2min, 110.5P1 - 131.2max) Watt * -1% |
| Intel Core Ultra 9 285K, NVIDIA GeForce RTX 4090 (76.2) |
111.2 (106min, 106.3P1 - 122.1max) Watt * |
| Power Consumption / Cinebench R23 Multi (external Monitor) | |
| Intel Core i9-14900K, NVIDIA GeForce RTX 4090 |
531 (470min, 479P1 - 573max) Watt * -59% |
| Intel Core i7-14700K, NVIDIA GeForce RTX 4090 |
414 (402min, 402P1 - 450max) Watt * -24% |
| Intel Core Ultra 9 285K, NVIDIA GeForce RTX 4090 (76.2) |
335 (332min, 332P1 - 339max) Watt * |
| Intel Core i5-14600K, NVIDIA GeForce RTX 4090 |
332 (329min, 329P1 - 336max) Watt * +1% |
| AMD Ryzen 9 9950X, NVIDIA GeForce RTX 4090 (100) |
316 (312min, 312P1 - 318max) Watt * +6% |
| AMD Ryzen 9 7950X3D, NVIDIA GeForce RTX 4090 |
289 (287min, 287P1 - 290max) Watt * +14% |
| AMD Ryzen 9 9900X, NVIDIA GeForce RTX 4090 (85.1) |
275 (274min, 274P1 - 277max) Watt * +18% |
| Intel Core Ultra 5 245K, NVIDIA GeForce RTX 4090 |
228 (225min, 225P1 - 232max) Watt * +32% |
| AMD Ryzen 5 9600X, NVIDIA GeForce RTX 4090 |
209 (208min, 208P1 - 210max) Watt * +38% |
| AMD Ryzen 7 7800X3D, NVIDIA GeForce RTX 4090 |
203 (202min, 202P1 - 204max) Watt * +39% |
| AMD Ryzen 7 9700X, NVIDIA GeForce RTX 4090 (83) |
175.3 (172.5min, 173.4P1 - 176.2max) Watt * +48% |
| Power Consumption / Prime95 V2810 Stress (external Monitor) | |
| Intel Core i9-14900K, NVIDIA GeForce RTX 4090 |
537 (508min, 510P1 - 606max) Watt * -42% |
| Intel Core i9-13900K, NVIDIA GeForce RTX 3090 |
471 (414min, 427P1 - 561max) Watt * -24% |
| Intel Core i7-14700K, NVIDIA GeForce RTX 4090 |
400 (376min, 377P1 - 428max) Watt * -6% |
| Intel Core Ultra 9 285K, NVIDIA GeForce RTX 4090 (Idle: 76.2 W) |
379 (374min, 376P1 - 383max) Watt * |
| Intel Core i5-14600K, NVIDIA GeForce RTX 4090 |
370 (349min, 349P1 - 422max) Watt * +2% |
| Intel Core i5-13600K, NVIDIA GeForce RTX 3090 |
348 (283min, 288P1 - 496max) Watt * +8% |
| AMD Ryzen 9 7950X, NVIDIA GeForce RTX 3090 |
321 (303min, 304P1 - 439max) Watt * +15% |
| AMD Ryzen 9 7900X, NVIDIA GeForce RTX 3090 |
319 (310min, 311P1 - 357max) Watt * +16% |
| AMD Ryzen 9 9950X, NVIDIA GeForce RTX 4090 (Idle: 100 W) |
319 (318min, 318P1 - 325max) Watt * +16% |
| Intel Core i9-12900K, NVIDIA Titan RTX (Idle: 70.5 W) |
279.6 (261min - 357max) Watt * +26% |
| AMD Ryzen 9 9900X, NVIDIA GeForce RTX 4090 (Idle: 85.1 W) |
278 (277min, 277P1 - 280max) Watt * +27% |
| AMD Ryzen 9 7950X3D, NVIDIA GeForce RTX 4090 |
276 (267min, 267P1 - 329max) Watt * +27% |
| Intel Core Ultra 5 245K, NVIDIA GeForce RTX 4090 |
263 (256min, 256P1 - 271max) Watt * +31% |
| Intel Core i5-12600K, NVIDIA Titan RTX (Idle: 70.45 W) |
256.5 (238min - 275max) Watt * +32% |
| AMD Ryzen 7 7800X3D, NVIDIA GeForce RTX 4090 |
218 (214min, 215P1 - 223max) Watt * +42% |
| AMD Ryzen 5 9600X, NVIDIA GeForce RTX 4090 |
213 (207min, 208P1 - 220max) Watt * +44% |
| AMD Ryzen 7 9700X, NVIDIA GeForce RTX 4090 (Idle: 83 W) |
180.2 (178.9min, 178.9P1 - 181.7max) Watt * +52% |
| Power Consumption / The Witcher 3 ultra (external Monitor) | |
| Intel Core i5-14600K, NVIDIA GeForce RTX 4090 |
564 (547min, 549P1 - 586max) Watt * -23% |
| Intel Core i9-14900K, NVIDIA GeForce RTX 4090 |
561 (551min, 552P1 - 597max) Watt * -22% |
| AMD Ryzen 9 7900X, NVIDIA GeForce RTX 3090 |
555 (547min, 549P1 - 607max) Watt * -21% |
| AMD Ryzen 9 7950X, NVIDIA GeForce RTX 3090 |
538 (532min, 532P1 - 570max) Watt * -17% |
| Intel Core i9-13900K, NVIDIA GeForce RTX 3090 |
533 (520min, 525P1 - 568max) Watt * -16% |
| Intel Core i7-14700K, NVIDIA GeForce RTX 4090 |
531 (516min, 519P1 - 557max) Watt * -16% |
| AMD Ryzen 9 7950X3D, NVIDIA GeForce RTX 4090 |
517 (508min, 510P1 - 539max) Watt * -13% |
| Intel Core i5-13600K, NVIDIA GeForce RTX 3090 |
500 (491min, 493P1 - 528max) Watt * -9% |
| AMD Ryzen 7 7800X3D, NVIDIA GeForce RTX 4090 |
497 (482min, 484P1 - 510max) Watt * -8% |
| Intel Core Ultra 5 245K, NVIDIA GeForce RTX 4090 |
492 (455min, 476P1 - 506max) Watt * -7% |
| AMD Ryzen 9 9950X, NVIDIA GeForce RTX 4090 (Idle: 100 W) |
489 (480min, 483P1 - 501max) Watt * -7% |
| AMD Ryzen 9 9900X, NVIDIA GeForce RTX 4090 (Idle: 85.1 W) |
470 (463min, 464P1 - 482max) Watt * -2% |
| Intel Core i9-12900K, NVIDIA Titan RTX (Idle: 70.5 W) |
463 (439min - 490max) Watt * -1% |
| Intel Core Ultra 9 285K, NVIDIA GeForce RTX 4090 (Idle: 76.2 W) |
459 (448min, 450P1 - 491max) Watt * |
| AMD Ryzen 7 9700X, NVIDIA GeForce RTX 4090 (Idle: 83 W) |
441 (430min, 431P1 - 454max) Watt * +4% |
| Intel Core i5-12600K, NVIDIA Titan RTX (Idle: 70.45 W) |
408.9 (401min - 460max) Watt * +11% |
| Power Consumption | |
| Intel Core Ultra 9 285K, NVIDIA GeForce RTX 4090 |
446 Watt * |
| AMD Ryzen 5 9600X, NVIDIA GeForce RTX 4090 |
561 Watt * |
| AMD Ryzen 9 9900X, NVIDIA GeForce RTX 4090 |
507 Watt * |
| AMD Ryzen 9 9950X, NVIDIA GeForce RTX 4090 |
572 Watt * |
| AMD Ryzen 7 9700X, NVIDIA GeForce RTX 4090 |
475 Watt * |
| Intel Core Ultra 5 245K, NVIDIA GeForce RTX 4090 |
425 Watt * |
: Cyberpunk 2077 ultra external monitor
* ... smaller is better
更低的功耗自然会带来更高的效率。在 Cinebench R15 多核测试中,酷睿至尊 9 285K 的能效比酷睿 i9-14900K 高出 61%,而在 Cinebench R23 多核测试中则高出 64%。
在 Cinebench R23 单核测试中,Core Ultra 9 285K 的效率提高了 37%,达到 21.2 分/瓦,而 Core i9-14900K 为 15.51 分/瓦。
即使与 Ryzen 9 9950X 相比,Core Ultra 9 285K 在 Cinebench 单核测试中的单核能效也保持了 32% 至 34% 的领先优势。
在以 1080p 超高清分辨率播放《Witcher 3 》时,箭湖-S CPU 的能效也比酷睿 i9-14900K 提升了 14%,甚至略高于 Ryzen 7 7800X3D。 Ryzen 7 7800X3D系统。
| Power Consumption / Cinebench R15 Multi Efficiency (external Monitor) | |
| AMD Ryzen 9 7950X3D, NVIDIA GeForce RTX 4090 |
21.9 Points per Watt +18% |
| AMD Ryzen 9 9950X, NVIDIA GeForce RTX 4090 |
20.2 Points per Watt +9% |
| Intel Core Ultra 9 285K, NVIDIA GeForce RTX 4090 |
18.5 Points per Watt |
| AMD Ryzen 9 9900X, NVIDIA GeForce RTX 4090 |
18.3 Points per Watt -1% |
| Intel Core Ultra 5 245K, NVIDIA GeForce RTX 4090 |
15.8 Points per Watt -15% |
| AMD Ryzen 7 7800X3D, NVIDIA GeForce RTX 4090 |
14.4 Points per Watt -22% |
| Intel Core i7-14700K, NVIDIA GeForce RTX 4090 |
12.8 Points per Watt -31% |
| AMD Ryzen 5 9600X, NVIDIA GeForce RTX 4090 |
12.5 Points per Watt -32% |
| Intel Core i9-14900K, NVIDIA GeForce RTX 4090 |
11.5 Points per Watt -38% |
| Intel Core i5-14600K, NVIDIA GeForce RTX 4090 |
11.1 Points per Watt -40% |
| Power Consumption / Cinebench R23 Single Power Efficiency - external Monitor | |
| Intel Core Ultra 9 285K, NVIDIA GeForce RTX 4090 |
21.2 Points per Watt |
| Intel Core Ultra 5 245K, NVIDIA GeForce RTX 4090 |
18.6 Points per Watt -12% |
| AMD Ryzen 9 9900X, NVIDIA GeForce RTX 4090 |
17.6 Points per Watt -17% |
| AMD Ryzen 9 9950X, NVIDIA GeForce RTX 4090 |
15.8 Points per Watt -25% |
| Intel Core i9-14900K, NVIDIA GeForce RTX 4090 |
15.51 Points per Watt -27% |
| AMD Ryzen 5 9600X, NVIDIA GeForce RTX 4090 |
15.2 Points per Watt -28% |
| Intel Core i7-14700K, NVIDIA GeForce RTX 4090 |
14 Points per Watt -34% |
| Intel Core i5-14600K, NVIDIA GeForce RTX 4090 |
13.8 Points per Watt -35% |
| AMD Ryzen 7 7800X3D, NVIDIA GeForce RTX 4090 |
9.54 Points per Watt -55% |
| Power Consumption / Cinebench R23 Multi Power Efficiency - external Monitor | |
| AMD Ryzen 9 9950X, NVIDIA GeForce RTX 4090 |
129.5 Points per Watt +2% |
| Intel Core Ultra 9 285K, NVIDIA GeForce RTX 4090 |
127.5 Points per Watt |
| AMD Ryzen 9 7950X3D, NVIDIA GeForce RTX 4090 |
125.6 Points per Watt -1% |
| AMD Ryzen 9 9900X, NVIDIA GeForce RTX 4090 |
117 Points per Watt -8% |
| Intel Core Ultra 5 245K, NVIDIA GeForce RTX 4090 |
109.9 Points per Watt -14% |
| AMD Ryzen 7 7800X3D, NVIDIA GeForce RTX 4090 |
89.1 Points per Watt -30% |
| Intel Core i7-14700K, NVIDIA GeForce RTX 4090 |
86.7 Points per Watt -32% |
| AMD Ryzen 5 9600X, NVIDIA GeForce RTX 4090 |
82.2 Points per Watt -36% |
| Intel Core i9-14900K, NVIDIA GeForce RTX 4090 |
77.57 Points per Watt -39% |
| Intel Core i5-14600K, NVIDIA GeForce RTX 4090 |
73.8 Points per Watt -42% |
| Power Consumption / Cinebench 2024 Single Power Efficiency - external Monitor | |
| Intel Core Ultra 9 285K, NVIDIA GeForce RTX 4090 |
1.321 Points per Watt |
| AMD Ryzen 9 9900X, NVIDIA GeForce RTX 4090 |
1.095 Points per Watt -17% |
| AMD Ryzen 9 9950X, NVIDIA GeForce RTX 4090 |
0.997 Points per Watt -25% |
| Power Consumption / Cinebench 2024 Multi Power Efficiency - external Monitor | |
| Intel Core Ultra 9 285K, NVIDIA GeForce RTX 4090 |
7.43 Points per Watt |
| AMD Ryzen 9 9950X, NVIDIA GeForce RTX 4090 |
7.18 Points per Watt -3% |
| AMD Ryzen 9 9900X, NVIDIA GeForce RTX 4090 |
6.61 Points per Watt -11% |
| Power Consumption / Witcher 3 ultra Efficiency (external Monitor) | |
| Intel Core Ultra 9 285K, NVIDIA GeForce RTX 4090 |
0.641 fps per Watt |
| AMD Ryzen 7 7800X3D, NVIDIA GeForce RTX 4090 |
0.632 fps per Watt -1% |
| Intel Core i5-12400F, NVIDIA GeForce RTX 4090 |
0.627 fps per Watt -2% |
| Intel Core Ultra 5 245K, NVIDIA GeForce RTX 4090 |
0.626 fps per Watt -2% |
| AMD Ryzen 9 7950X3D, NVIDIA GeForce RTX 4090 |
0.59 fps per Watt -8% |
| AMD Ryzen 9 9900X, NVIDIA GeForce RTX 4090 |
0.583 fps per Watt -9% |
| AMD Ryzen 9 9950X, NVIDIA GeForce RTX 4090 |
0.583 fps per Watt -9% |
| AMD Ryzen 9 7950X, NVIDIA GeForce RTX 4090 |
0.56 fps per Watt -13% |
| Intel Core i9-14900K, NVIDIA GeForce RTX 4090 |
0.56 fps per Watt -13% |
| Intel Core i5-14600K, NVIDIA GeForce RTX 4090 |
0.56 fps per Watt -13% |
| Intel Core i5-13400, NVIDIA GeForce RTX 4090 |
0.557 fps per Watt -13% |
| Intel Core i7-14700K, NVIDIA GeForce RTX 4090 |
0.54 fps per Watt -16% |
| Intel Core i9-14900K, NVIDIA GeForce RTX 4090 |
0.518 fps per Watt -19% |
Notebookcheck 对酷睿 Ultra 9 285K 的总体印象
英特尔酷睿至尊 9 285K 以较低的功耗成功提供了酷睿 i9-14900K 级别的原始 CPU 性能。
然而,游戏性能却不尽如人意,这也是其 589 美元售价的一大问题。
铁杆游戏玩家可能要等到 11 月初 Ryzen 9000X3D 芯片上市时再花钱购买。
More articles related to this device
Intel Core Ultra 9 285K (Core Ultra Series)Transparency
The selection of devices to be reviewed is made by our editorial team. The test sample was provided to the author as a loan by the manufacturer or retailer for the purpose of this review. The lender had no influence on this review, nor did the manufacturer receive a copy of this review before publication. There was no obligation to publish this review. We never accept compensation or payment in return for our reviews. As an independent media company, Notebookcheck is not subjected to the authority of manufacturers, retailers or publishers.
This is how Notebookcheck is testing
Every year, Notebookcheck independently reviews hundreds of laptops and smartphones using standardized procedures to ensure that all results are comparable. We have continuously developed our test methods for around 20 years and set industry standards in the process. In our test labs, high-quality measuring equipment is utilized by experienced technicians and editors. These tests involve a multi-stage validation process. Our complex rating system is based on hundreds of well-founded measurements and benchmarks, which maintains objectivity. Further information on our test methods can be found here.

