

Apple iPad Air 13 (2024) 评测--最经济实惠的 13 英寸平板电脑Apple
第六代 iPad Air 还首次推出了 13 英寸版本。在此之前,想要拥有这样一款大型Apple 平板电脑的用户必须花大价钱购买 iPad Pro 系列的机型。iPad Pro 13 (2024) 售价至少 1549 欧元(美国售价 1299 美元)。Apple iPad Air 13 (2024) 则可以节省 500 欧元,因为它的起价为 949 欧元(美国为 799 美元)。
iPad Air 13 (2024) 继承了制造商自己的 Apple M2芯片组。虽然与iPad Pro 13(2024)相比,它的 M4处理器相比,性能并不理想,但速度明显快于其 Apple iPad Air 5 (2022)前代产品的 M1处理器的前代产品要快得多。
除了新的 13 英寸外形外,Apple iPad Air 13(2024)还推出了其他一些较小的设备升级。WLAN 模块从 WiFi 6 升级到 WiFi 6E,蓝牙也从 5.0 升级到 5.3。自拍摄像头从短边移到了长边,因此在视频通话时,你不会再觉得用户的视线越过了摄像头。
潜在的竞争对手比较
Version | Rating | Date | Model | Weight | Height | Size | Resolution | Price |
|---|---|---|---|---|---|---|---|---|
| v8 | 85.7 % | 06 / 2024 | Apple iPad Air 13 2024 M2, M2 10-Core GPU | 617 g | 6.1 mm | 13.00" | 2732x2048 | |
| v7 (old) | 91.7 % v7 (old) | 03 / 2022 | Apple iPad Air 5 2022 M1, M1 8-Core GPU | 461 g | 6.1 mm | 10.90" | 2360x1640 | |
| v7 (old) | 90 % v7 (old) | 05 / 2024 | Apple iPad Air 11 2024 M2, M2 10-Core GPU | 462 g | 6.1 mm | 10.86" | 2360x1640 | |
| v7 (old) | 93.2 % v7 (old) | 05 / 2024 | Apple iPad Pro 11 2024 M4 (9 cores), M4 10-Core GPU | 444 g | 5.3 mm | 11.00" | 2420x1668 | |
| v7 (old) | 91.3 % v7 (old) | 10 / 2023 | Samsung Galaxy Tab S9+ SD 8 Gen 2 for Galaxy, Adreno 740 | 586 g | 5.7 mm | 12.40" | 2800x1752 | |
| v7 (old) | 89.3 % v7 (old) | 05 / 2024 | Xiaomi Pad 6S Pro SD 8 Gen 2, Adreno 740 | 590 g | 6.26 mm | 12.40" | 3048x2032 |
请注意,我们已经更新了评级系统,因此第 8 版的结果已不能与第 7 版的结果进行比较。您可以在 这里.
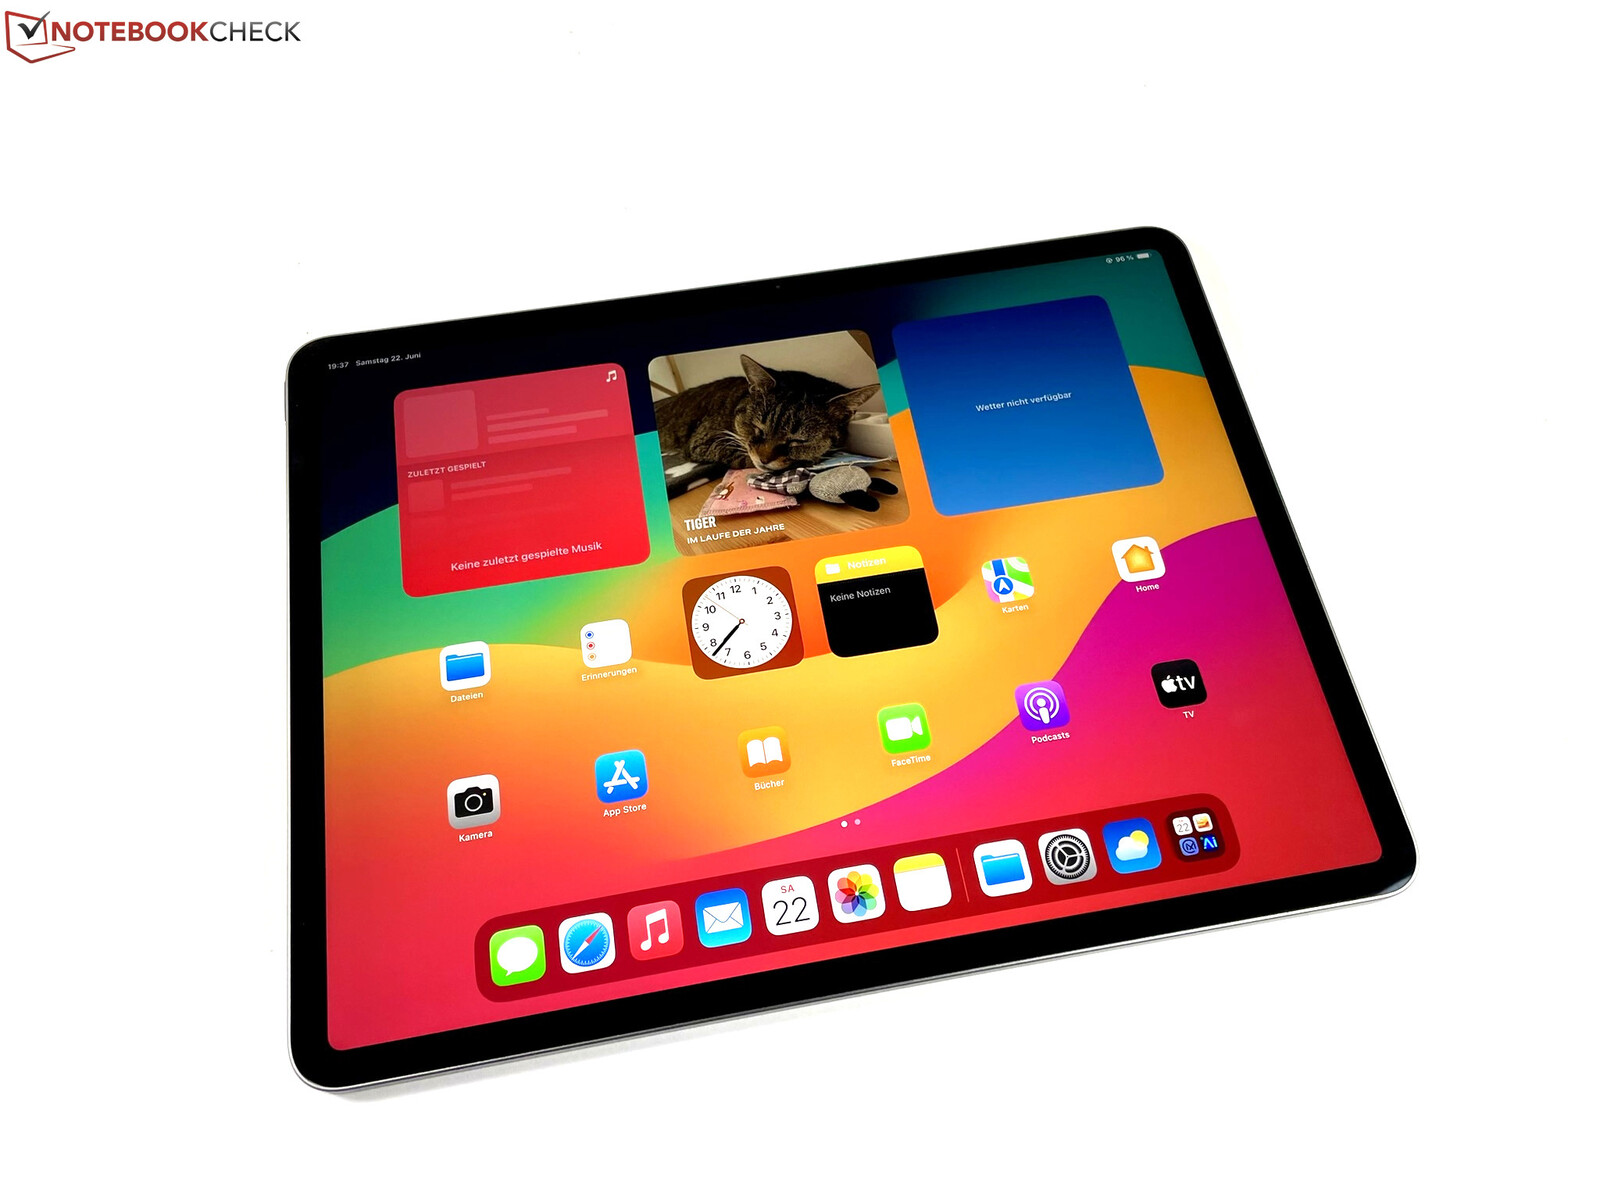
保护壳 - iPad Air 13 (2024) 铝质保护壳
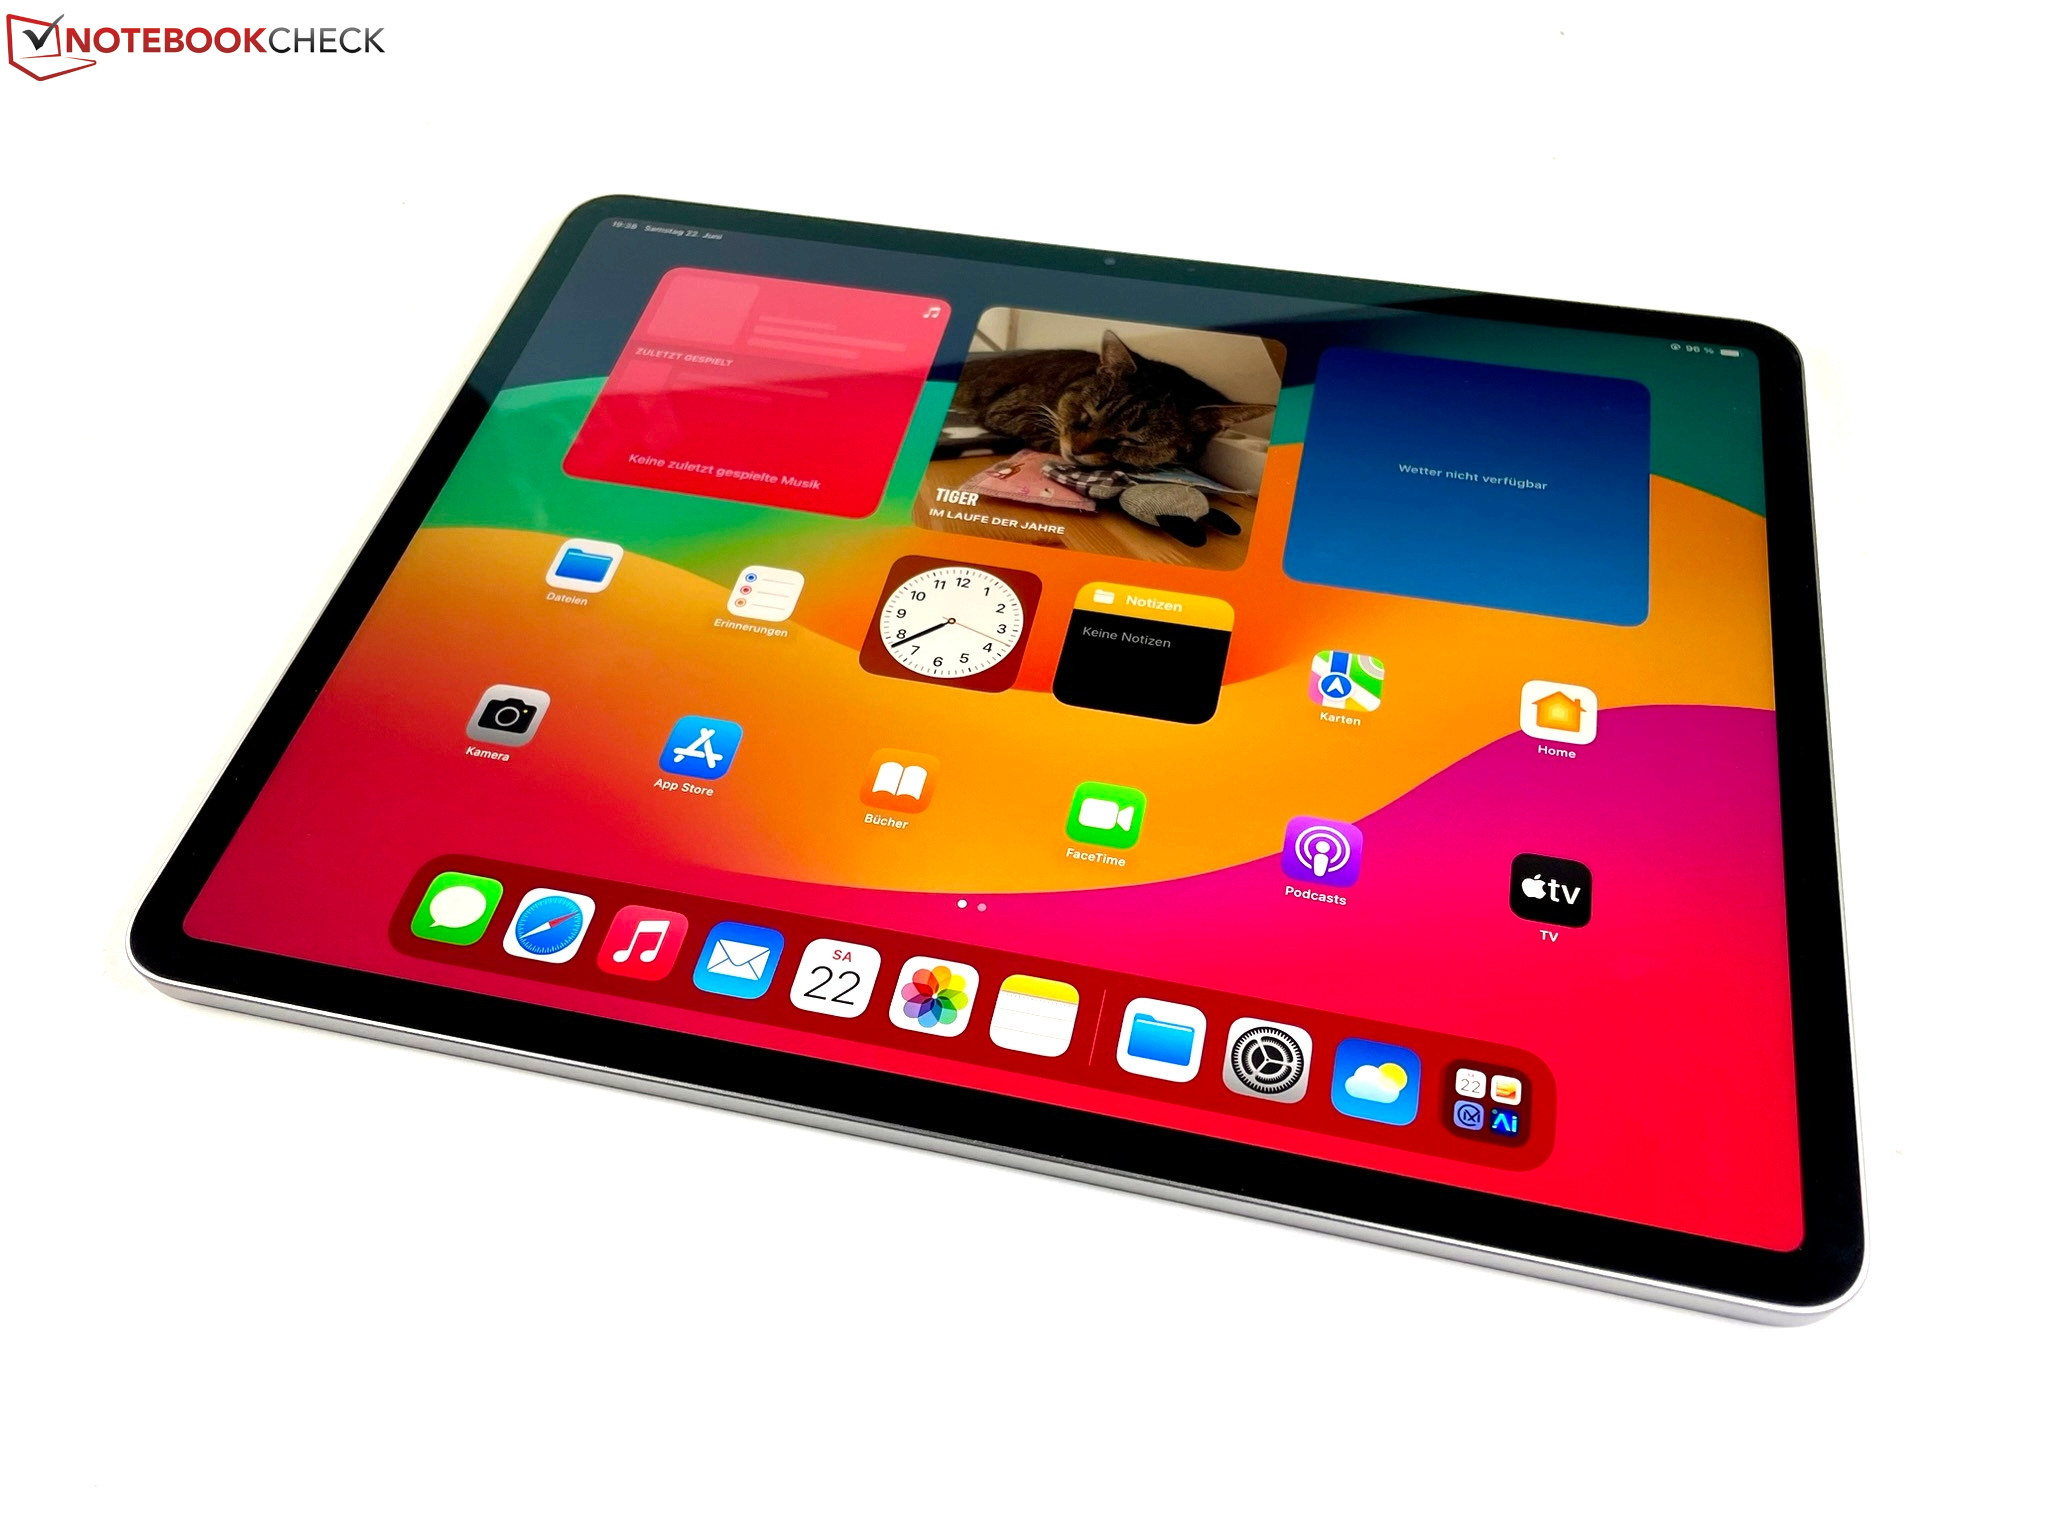
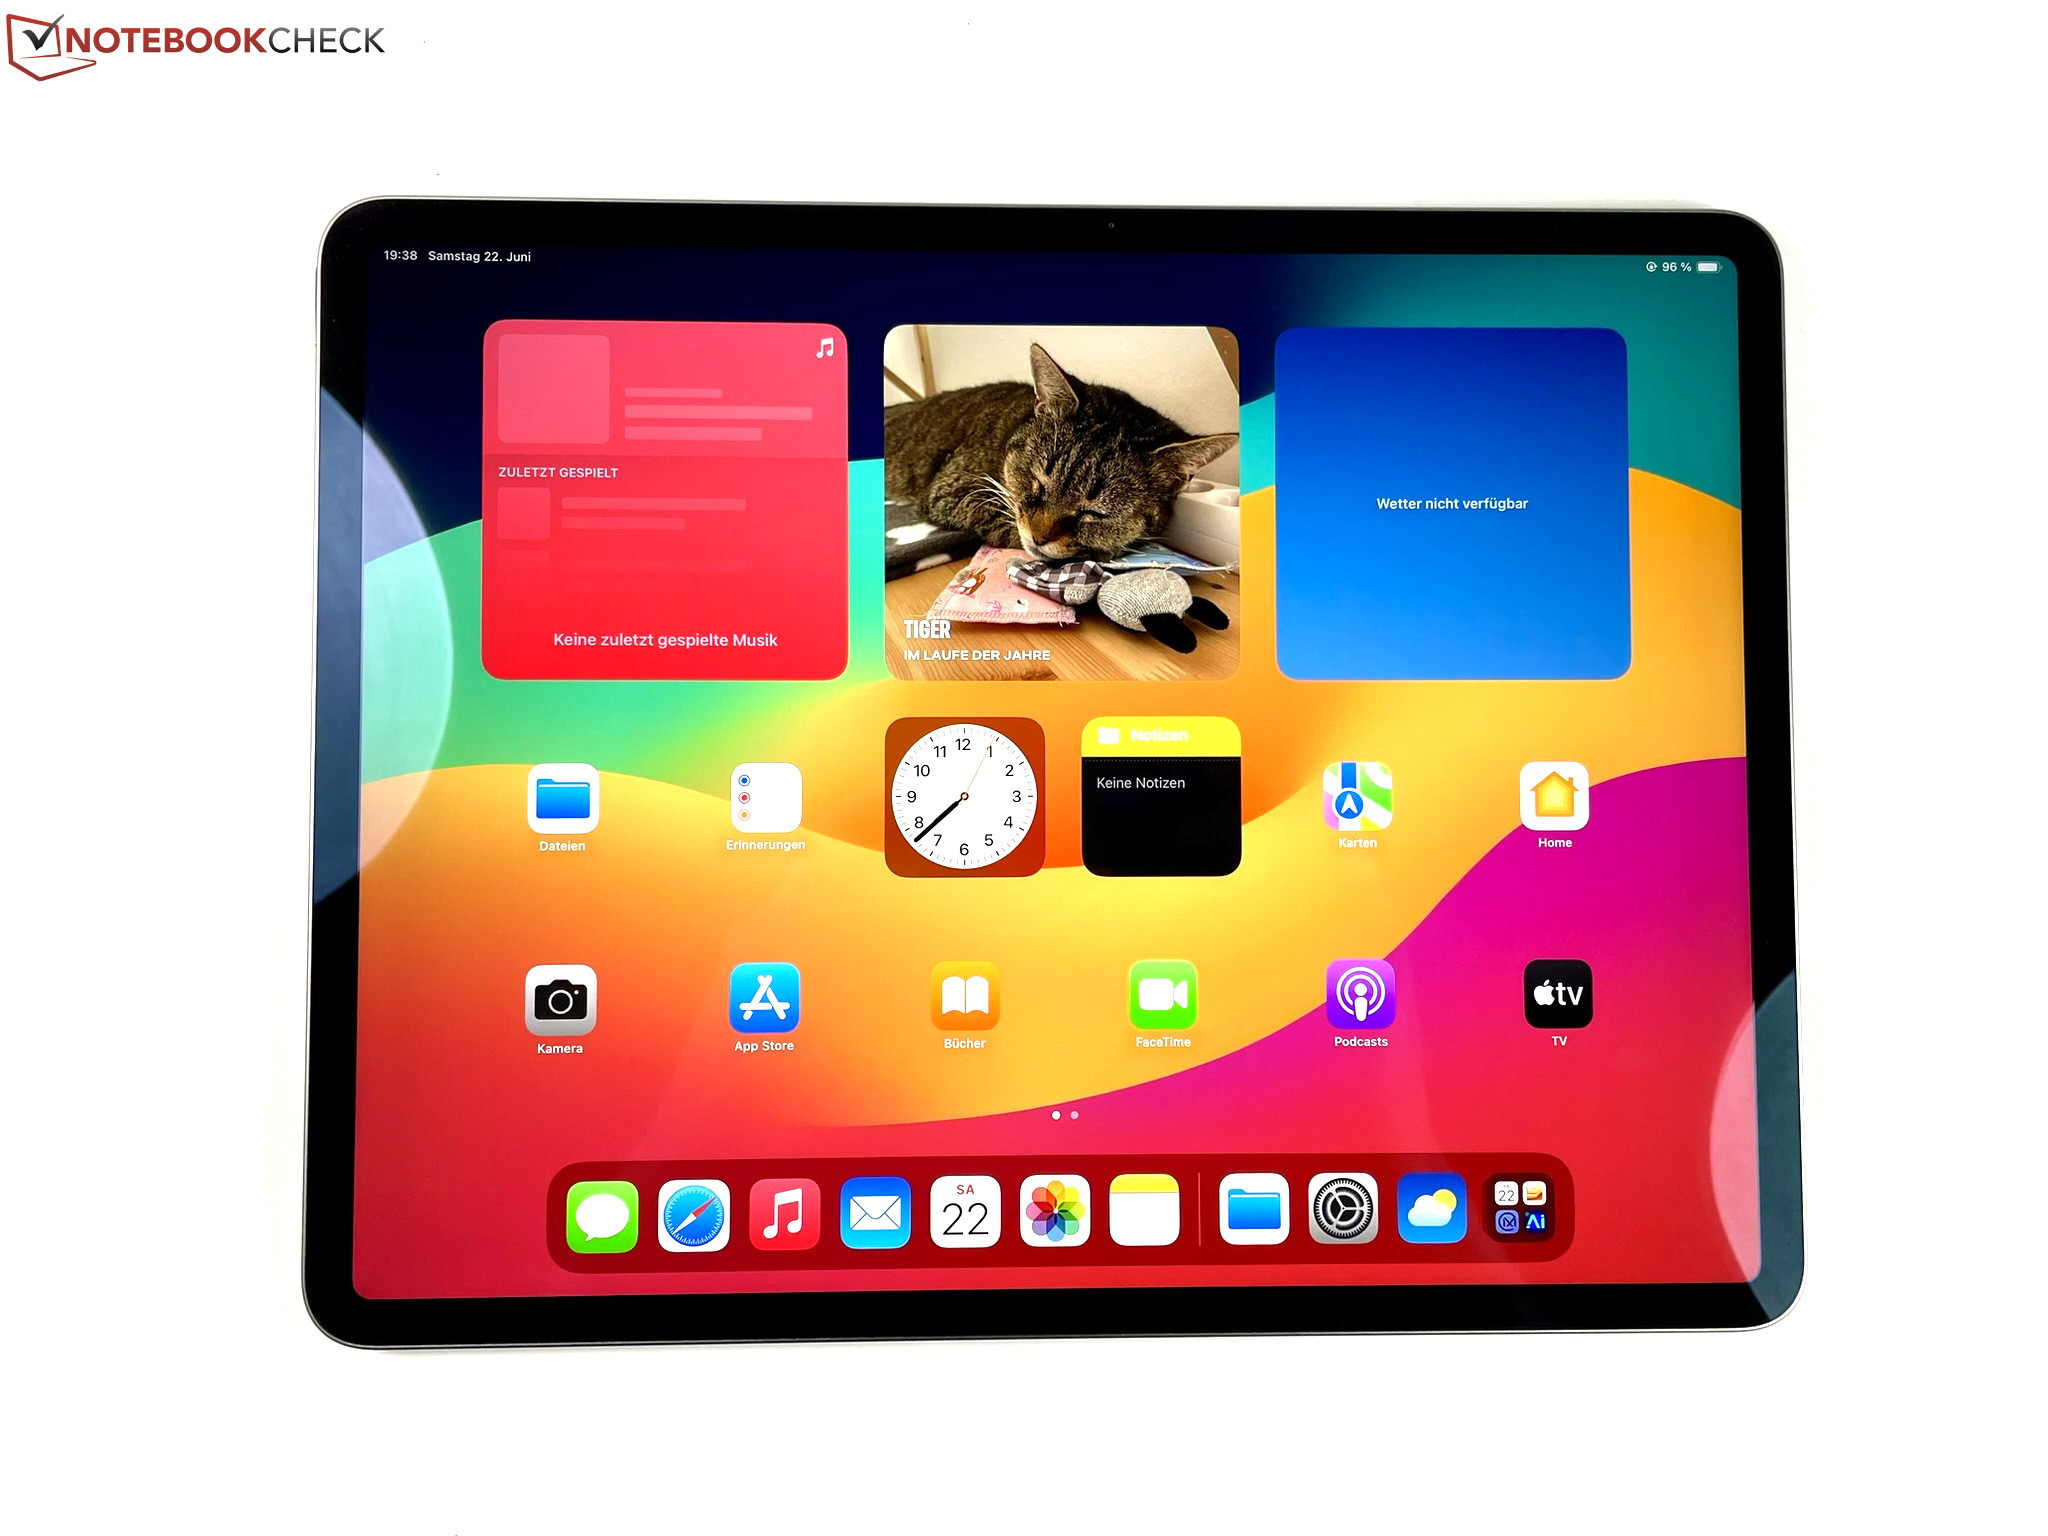
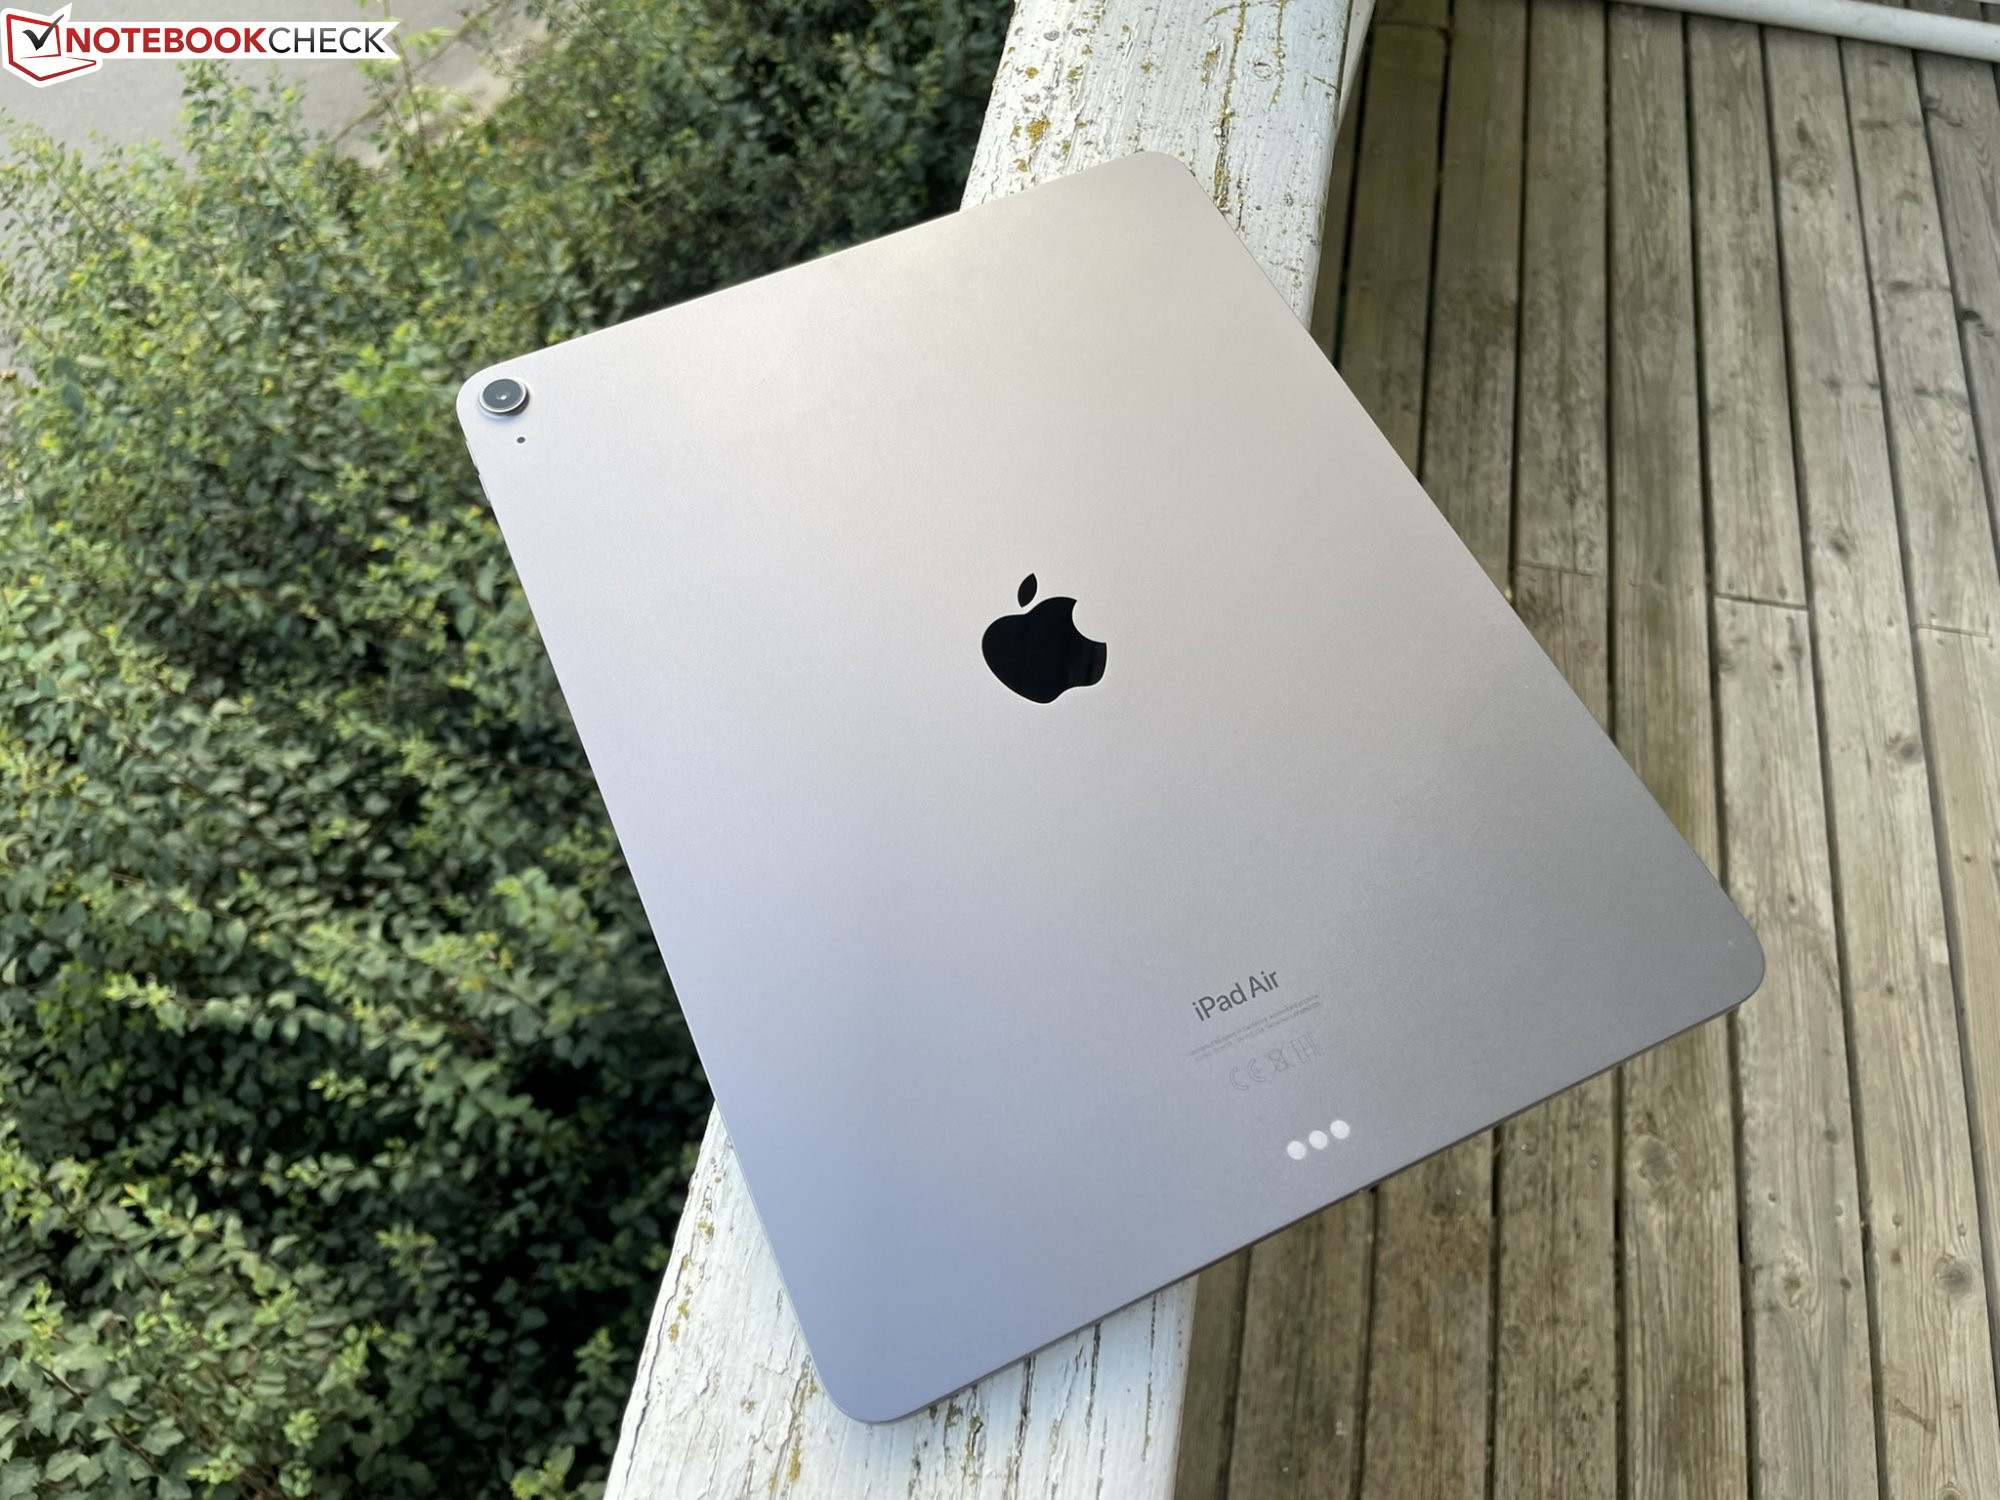
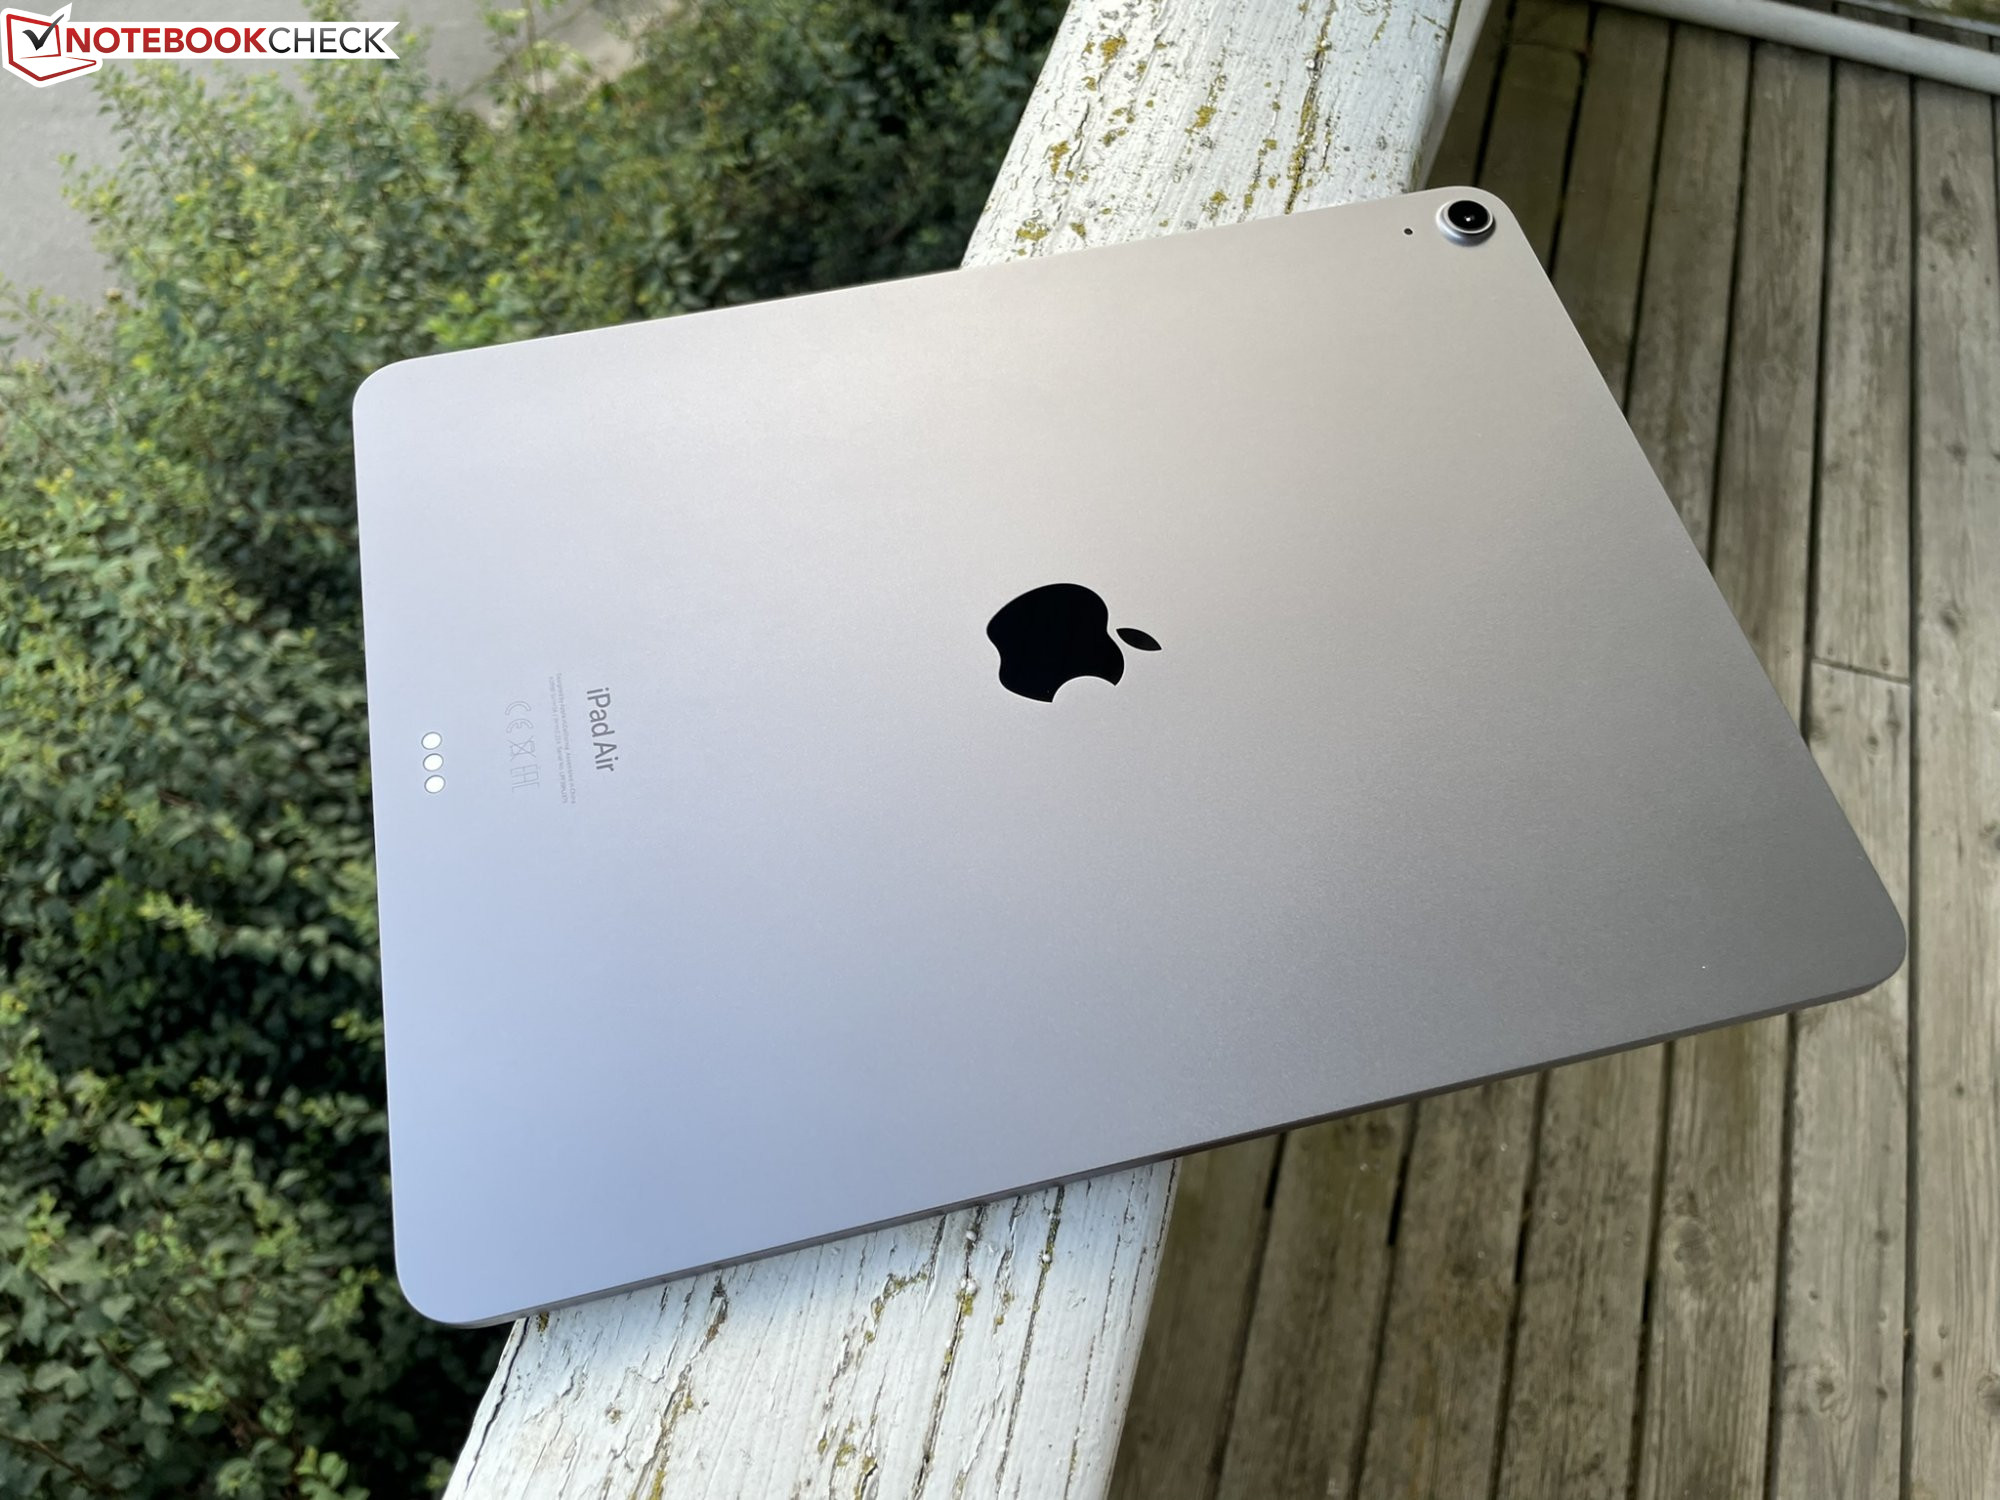
Apple iPad Air 13 (2024) 的金属外壳与 iPad Air 5 (2022) 基本保持一致。 Apple iPad Air 5(2022 年).Apple 提供蓝色、紫色、北极星色和太空灰四种颜色,我们的测试机选择了太空灰。
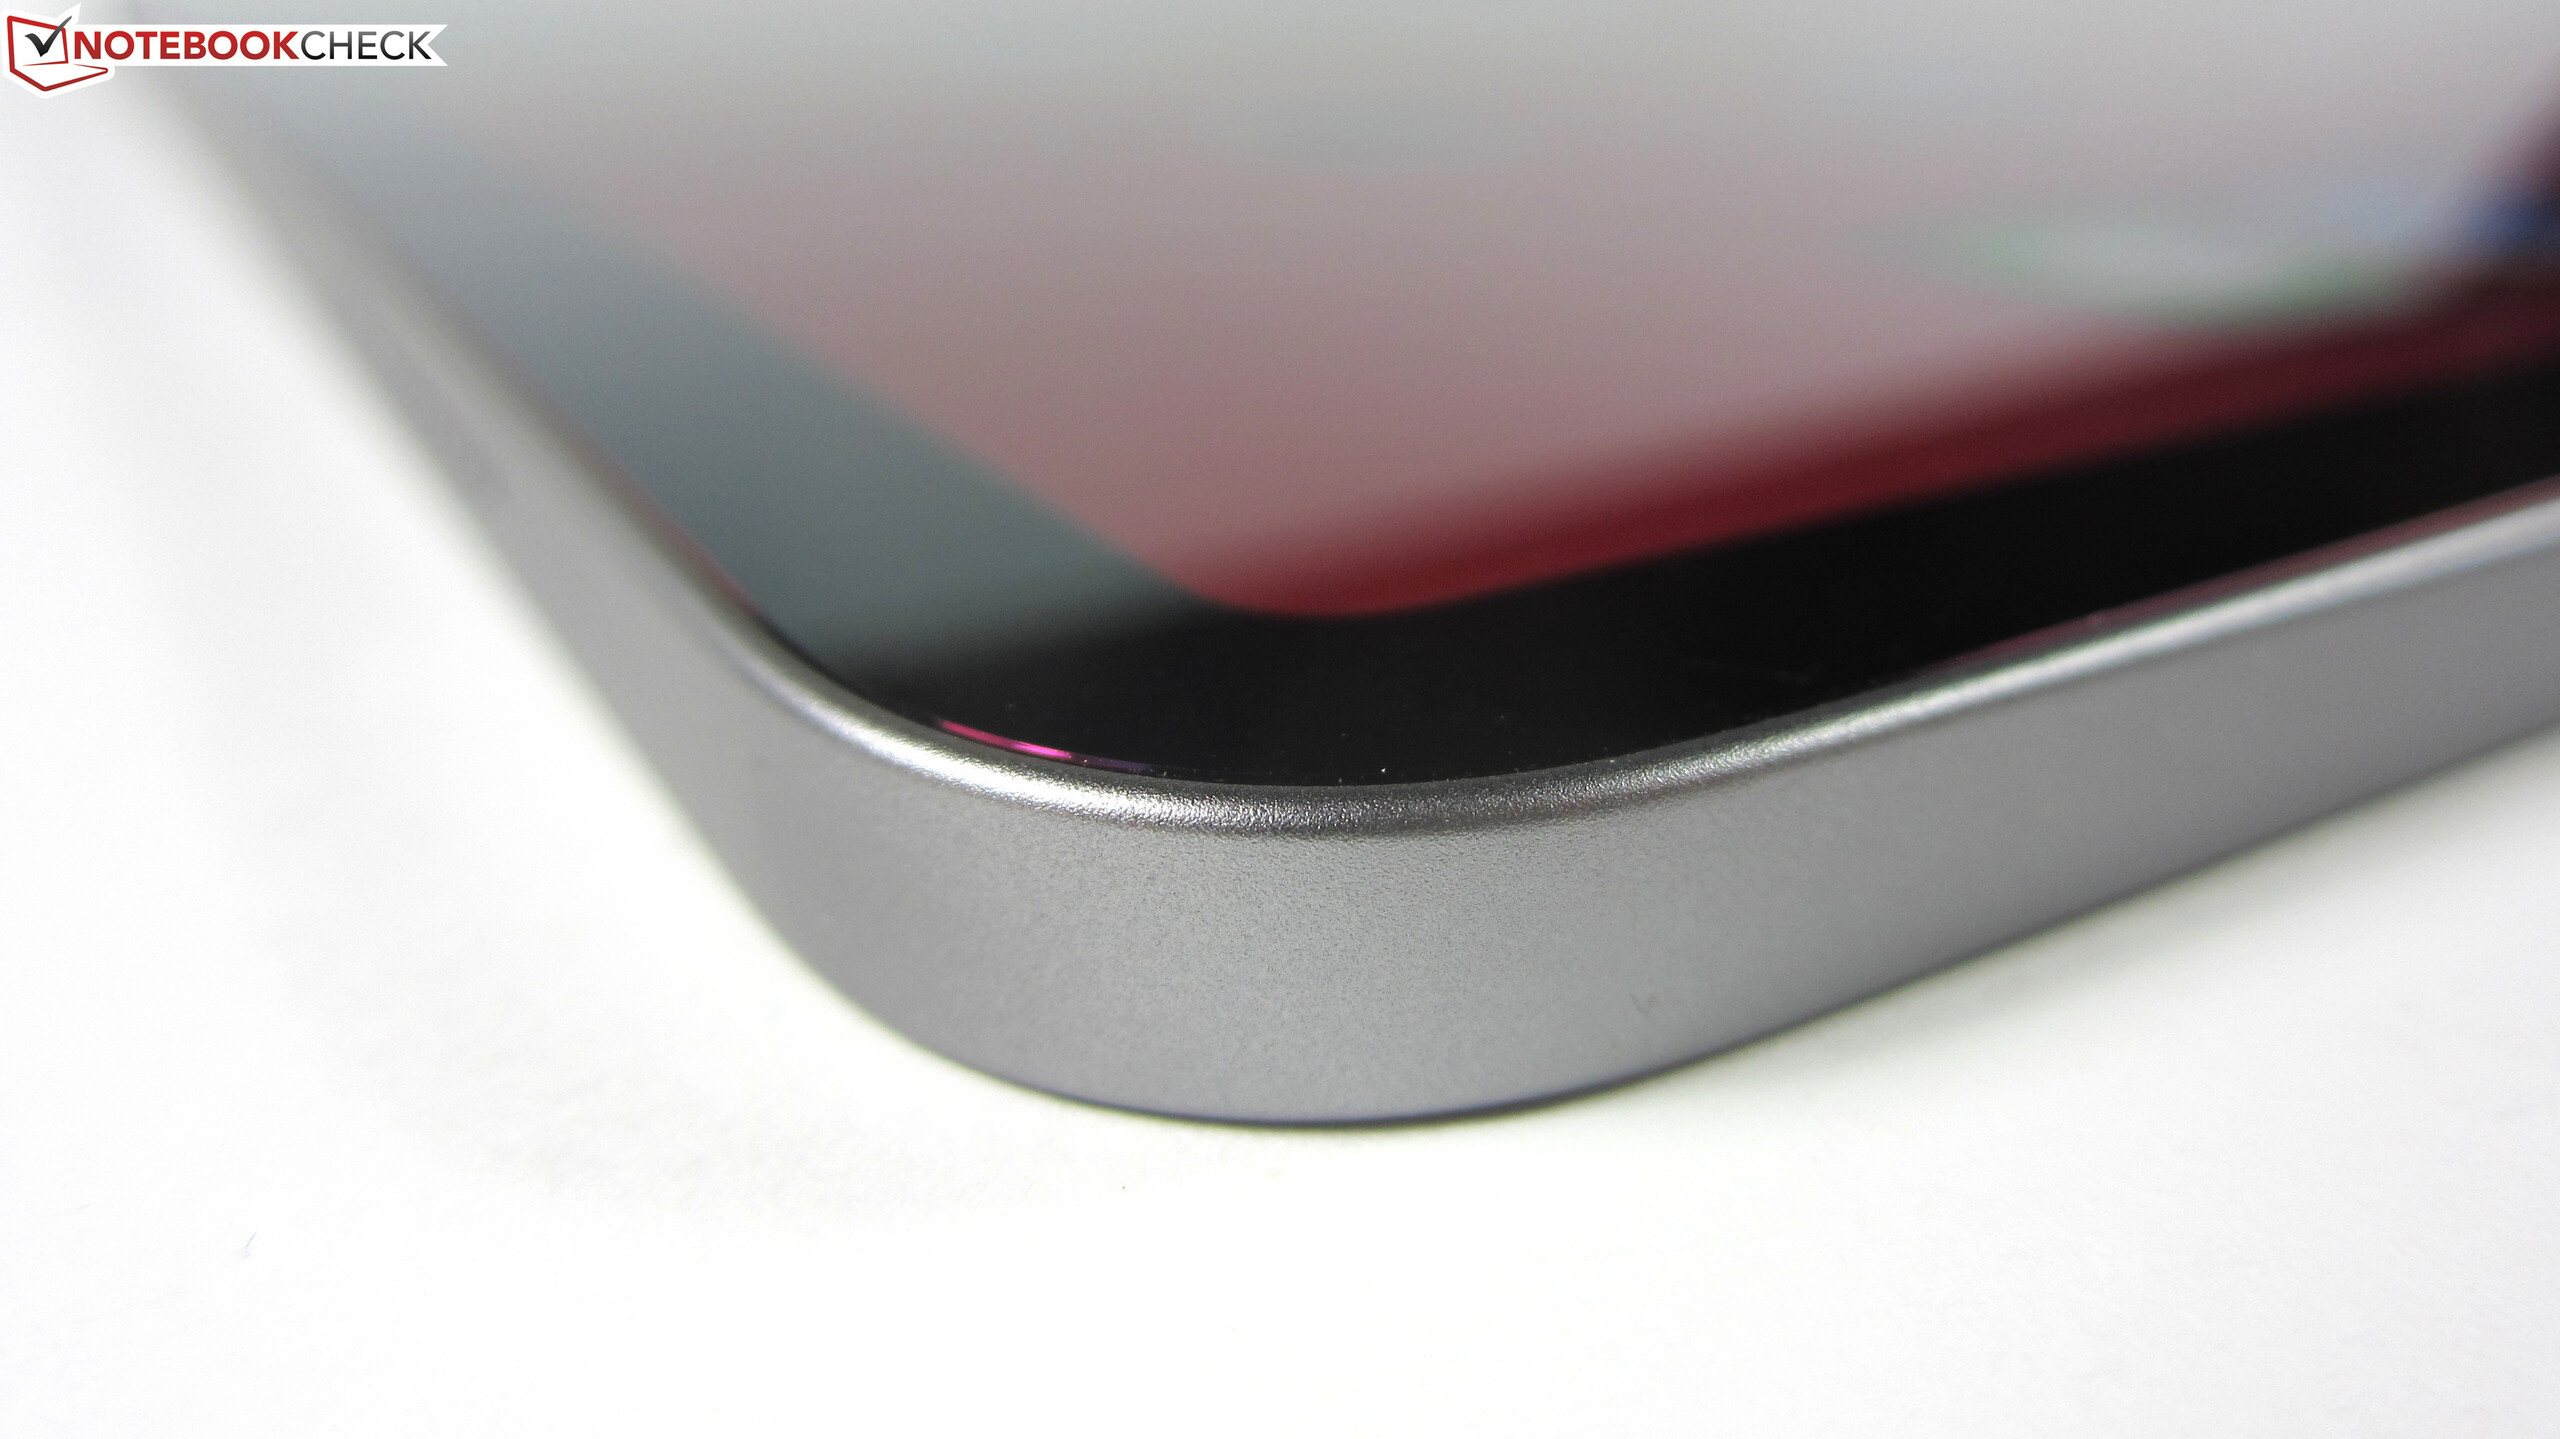
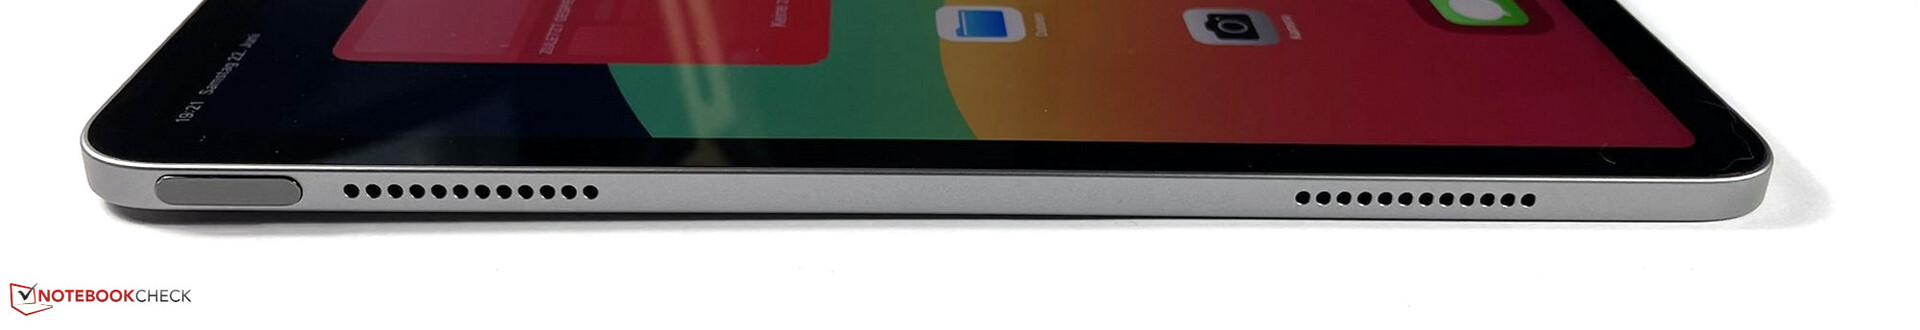
在我们的测试中,iPad Air 13 (2024) 表现出了出色的做工,材料之间的过渡紧密而均匀,也没有出现任何变形。不过,对 IPS 面板施加较大的压力足以造成一些图像伪影。这款平板电脑没有 IP 认证。尽管背面的摄像头突出了约 2 毫米(约 0.08 英寸),但当把 XXL 平板电脑放在桌子上时,它几乎不会晃动。
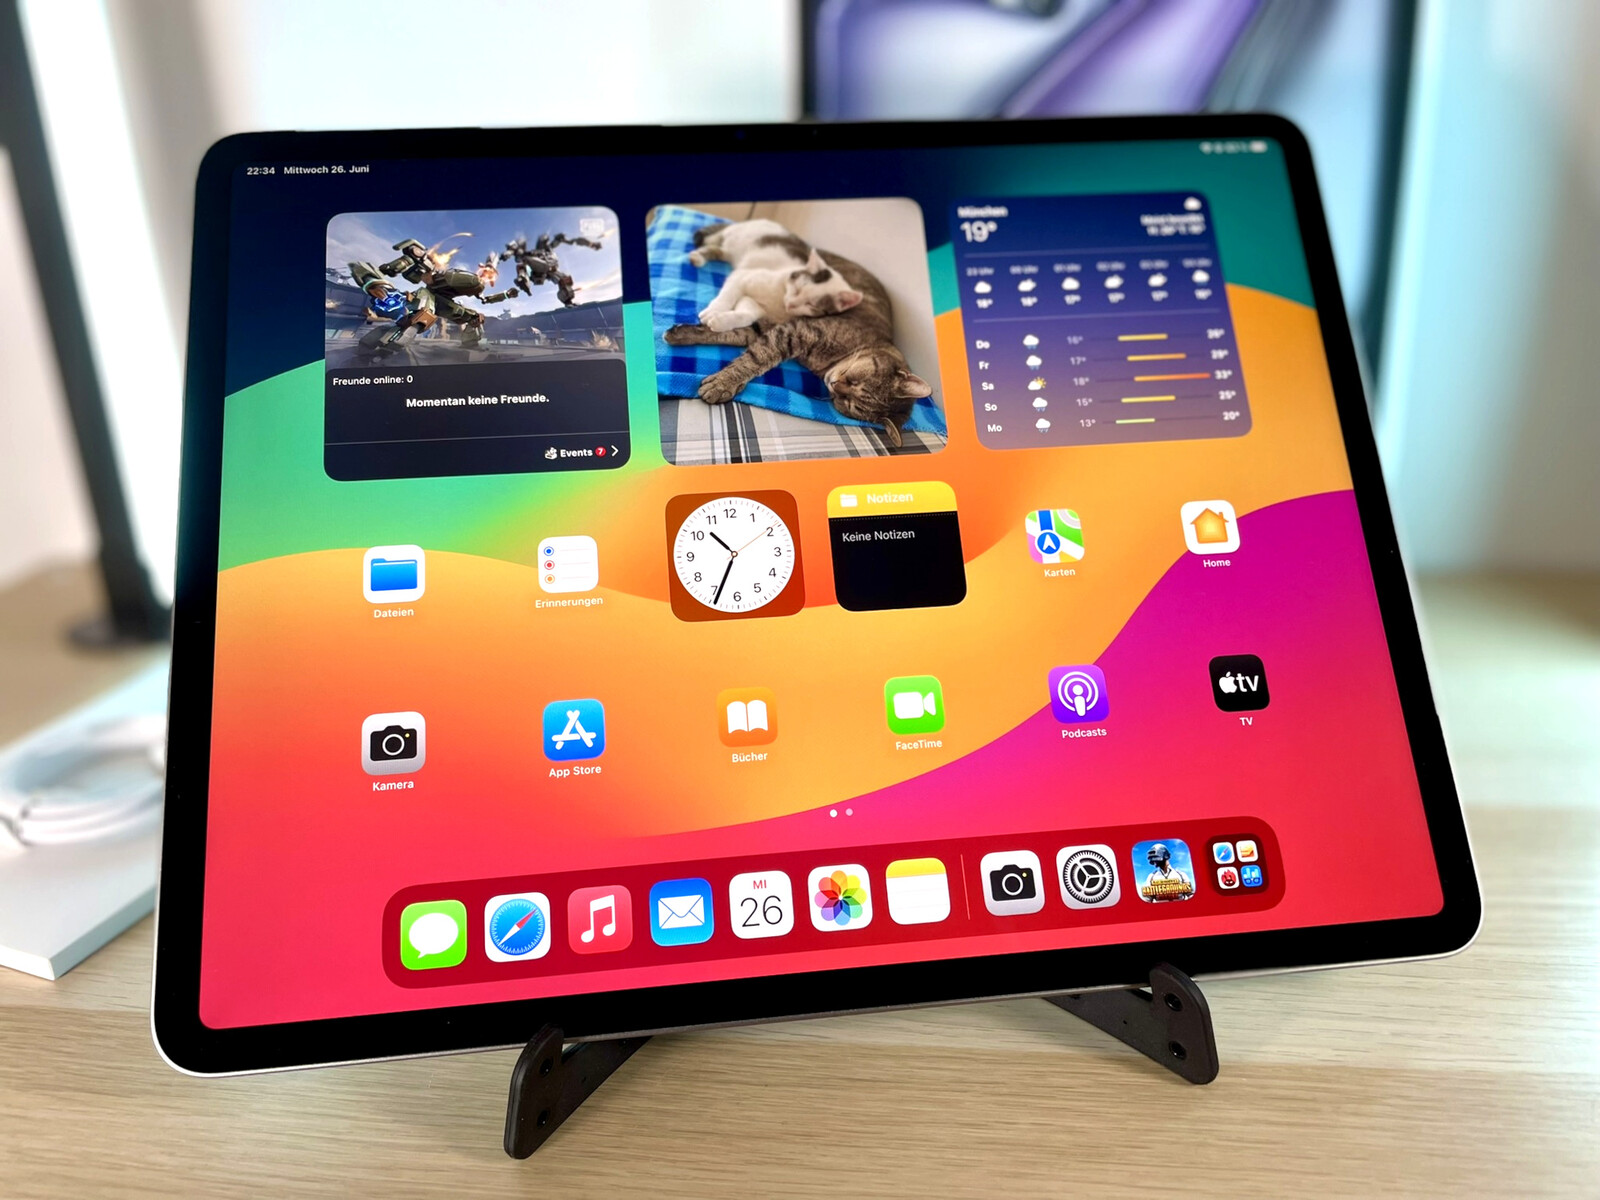
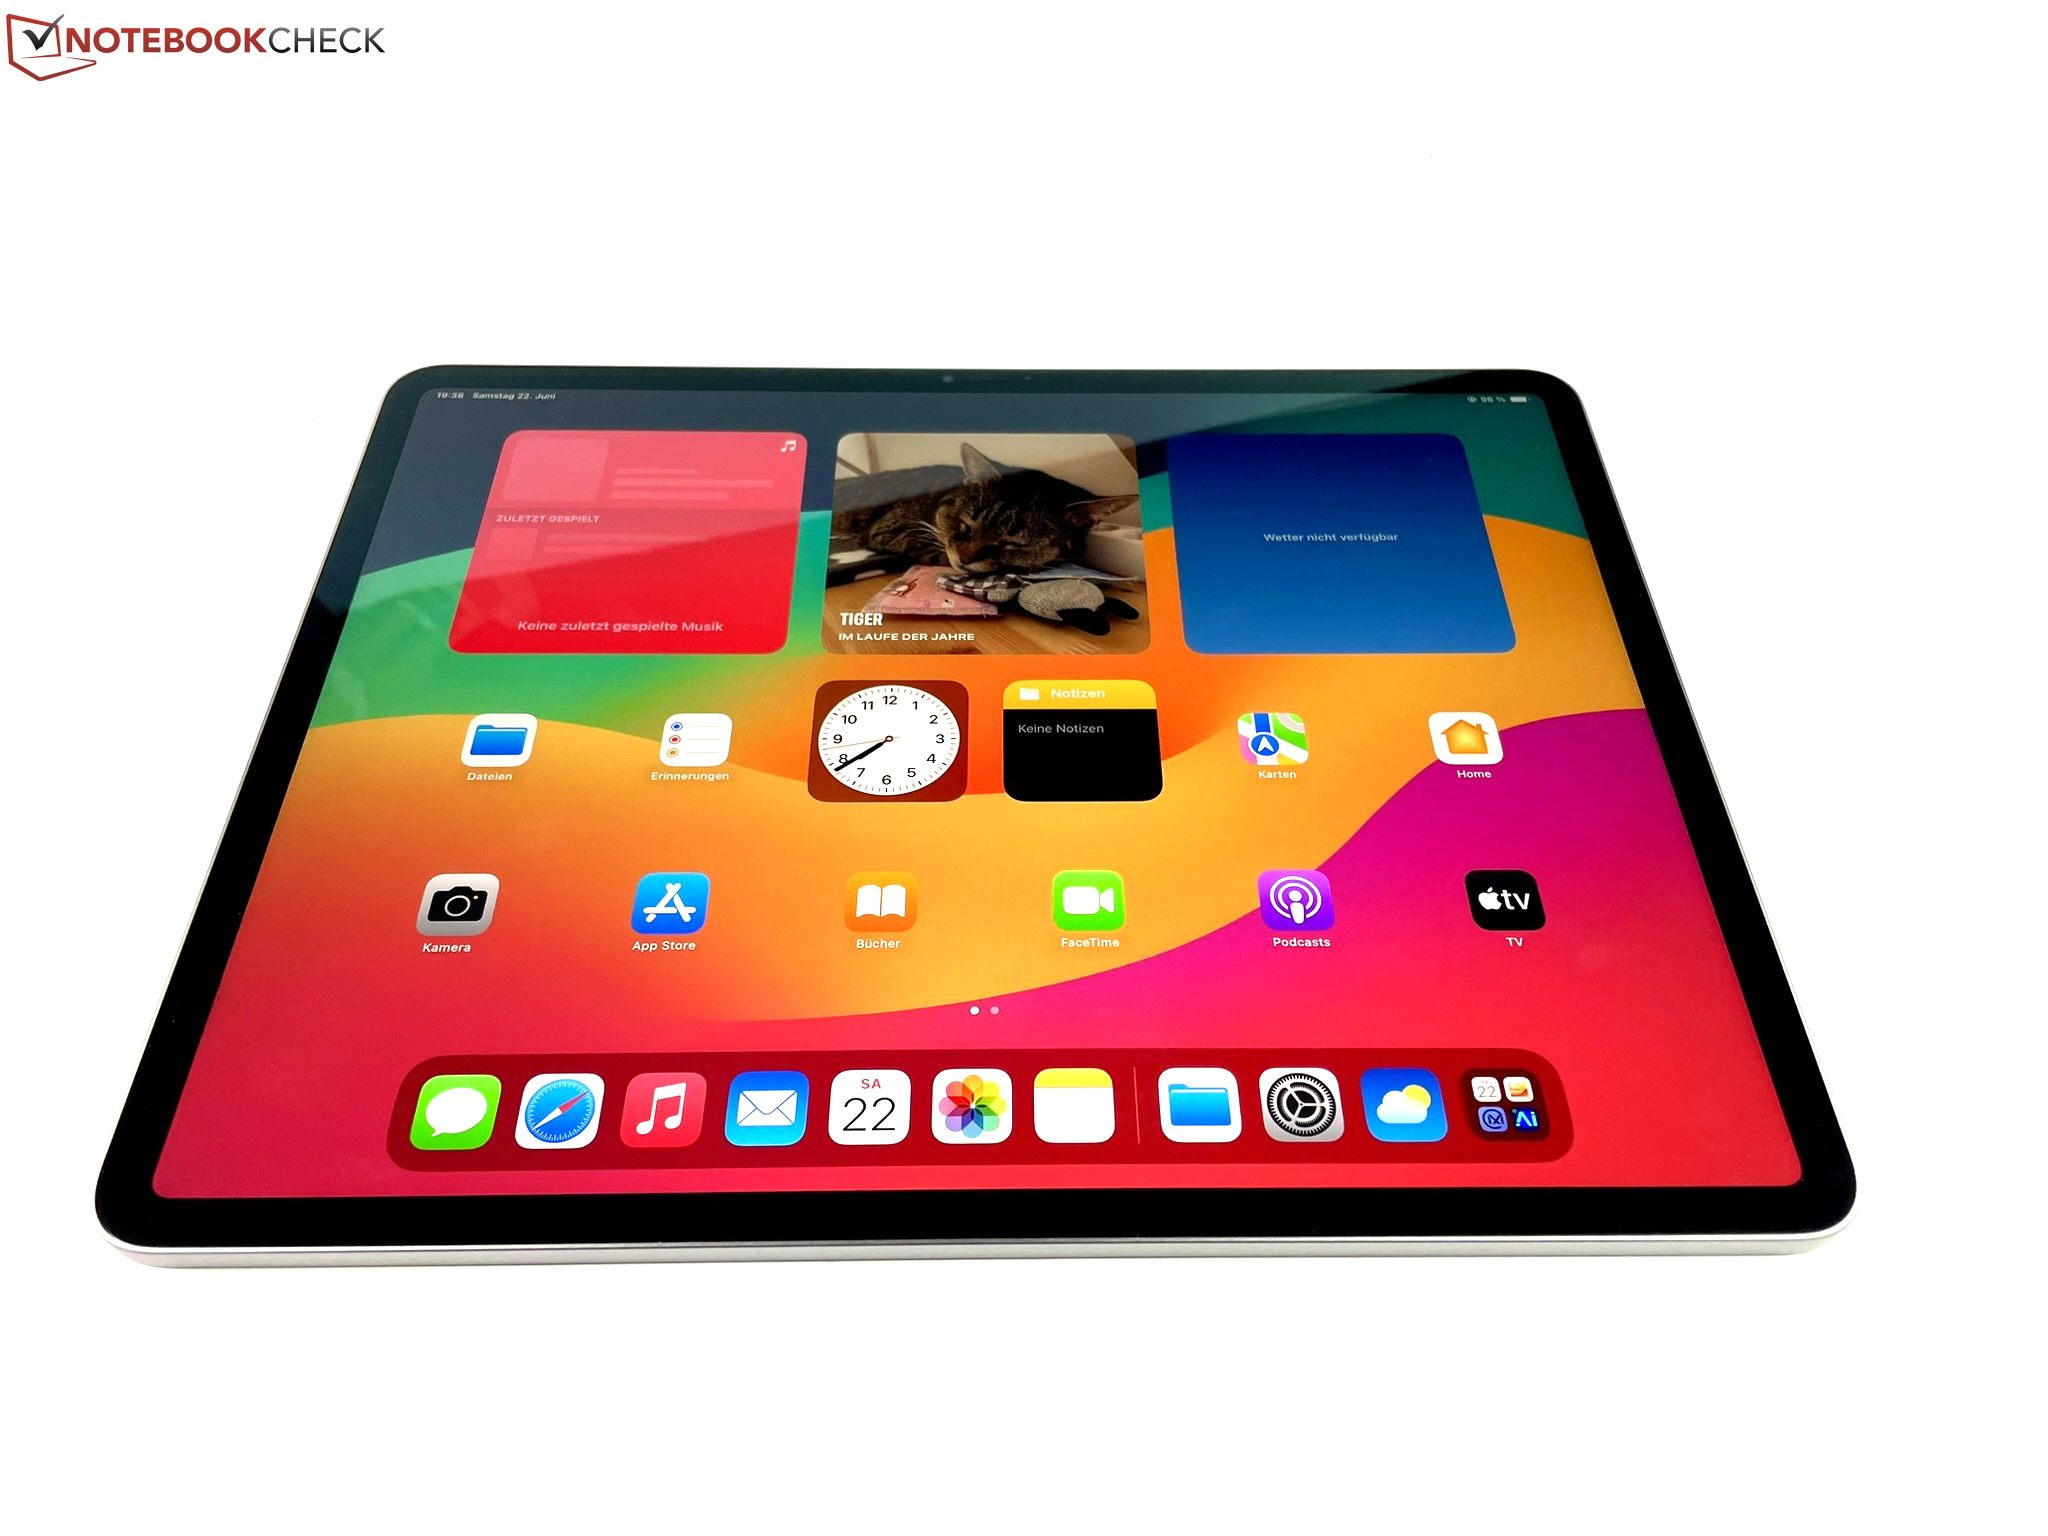
iPad Air 13 (2024) 的四周边框为 8 毫米(约合 0.3 英寸),显示屏与机身表面的比例达到了 87%,看起来比 11 英寸的 iPad Air 11 (2024) 更加时尚。 iPad Air 11 (2024)相比,11 英寸 iPad Air 11(2024)的屏占比仅为 81%。另一方面,我们的测试机仍未完全进入现代时代,因为只有 iPad Pro 机型通过 Face ID 提供面部识别功能。
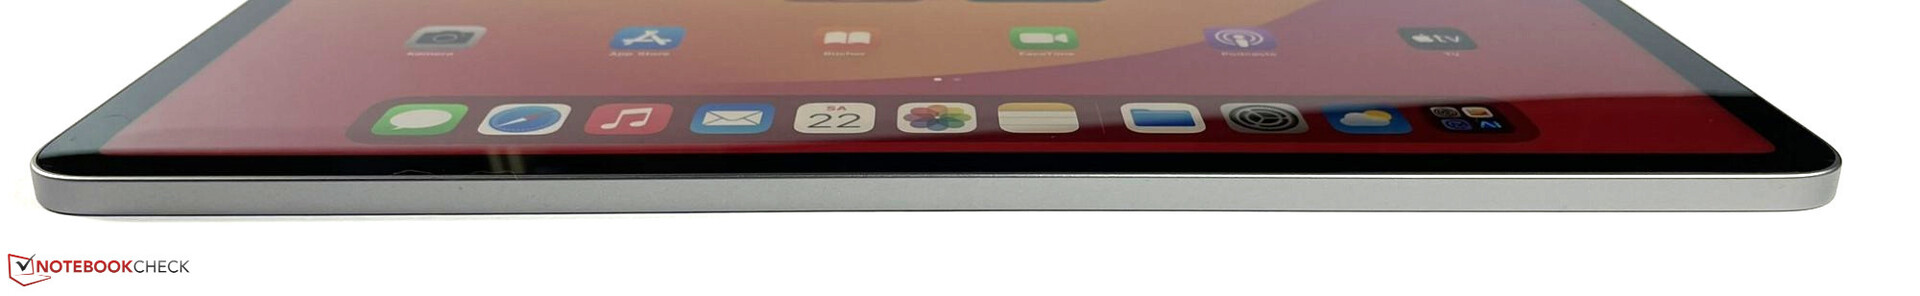
Air "代表着最薄、最轻的平板电脑系列,来自Apple 。然而,对于 6.1 毫米(约 0.24 英寸)的纤薄 iPad Air 13 (2024) WiFi 版(重 671 克(约 23.7 盎司))来说,这两个特点都不再适用,尽管这仍然让它握起来非常舒适。iPad Pro 13 (2024) 厚度为 5.1 毫米(约 0.2 英寸),重量为 582 克(约 20.5 盎司),在 13 英寸细分市场中确立了新的最高价值。

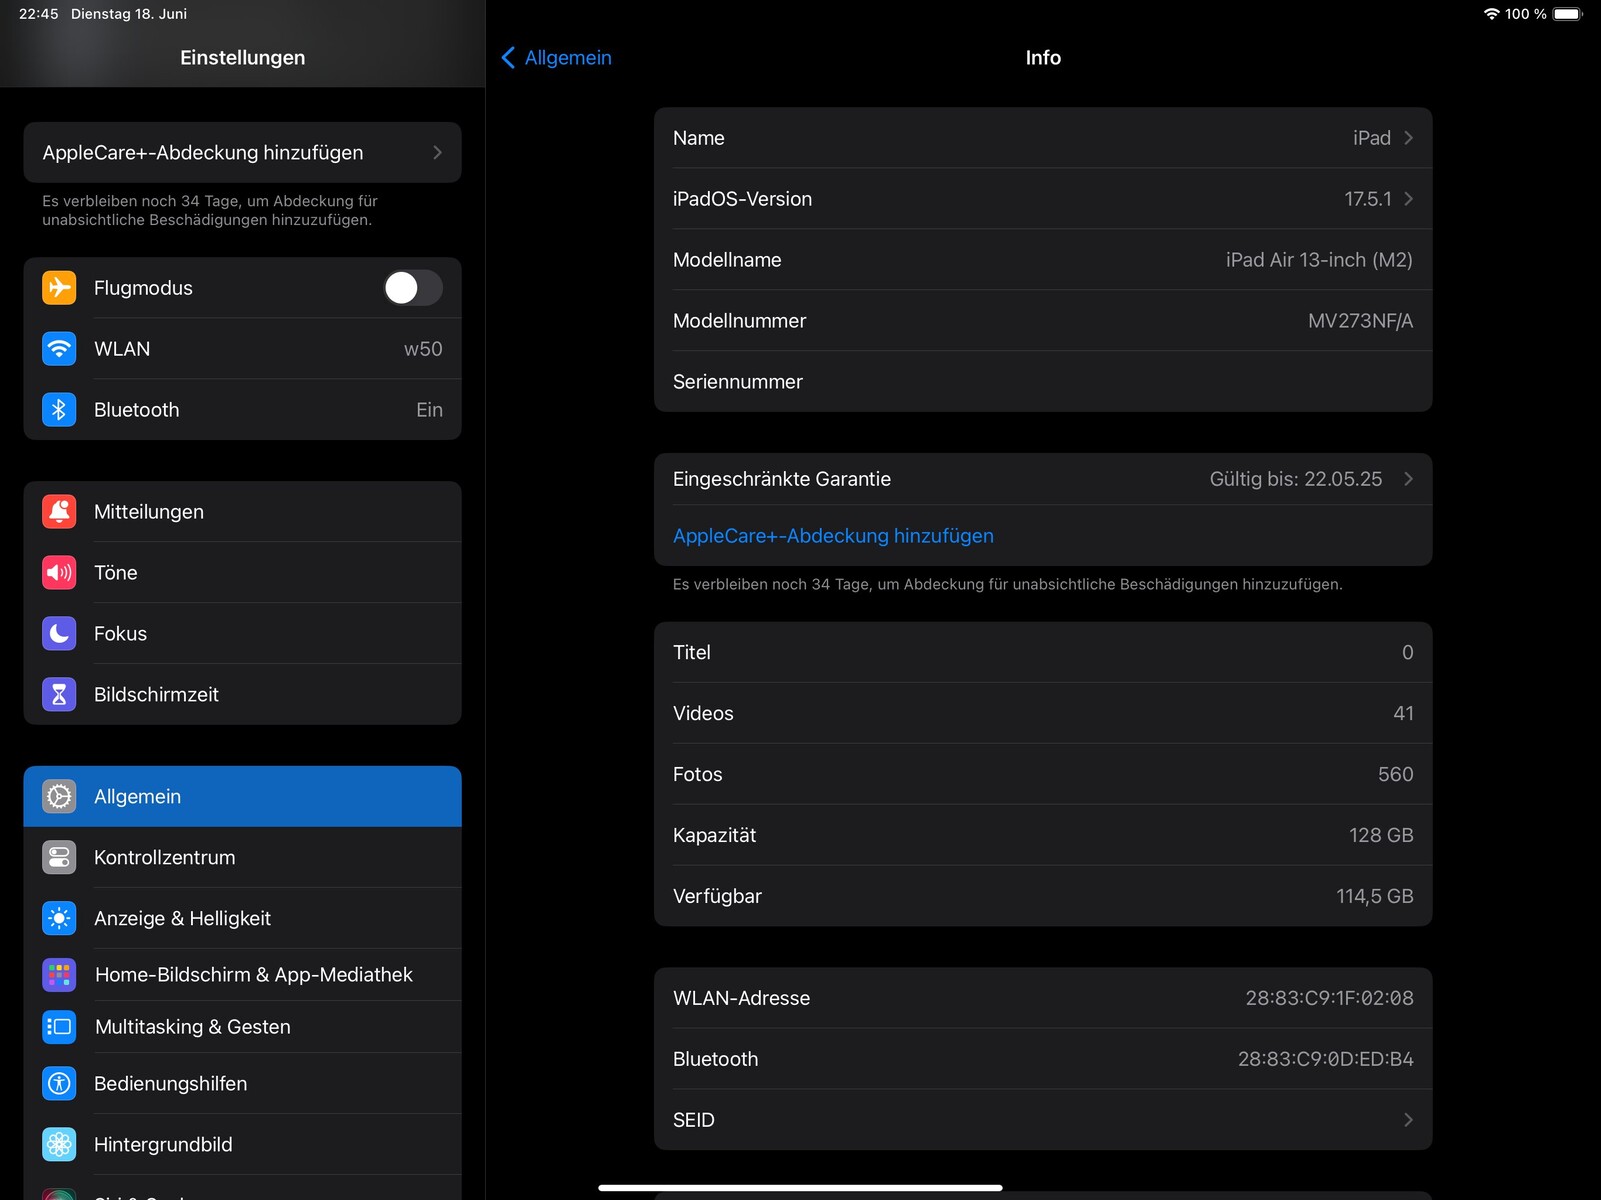
设备 - iPad Air 的存储空间至少为 128 GB
Apple iPad Air 13 (2024) 提供 128 GB、256 GB、512 GB 和 1 TB 四种存储版本。始终配备 WiFi 6E。对于 WiFi + Cellular 版本,你还可以选择配备 5G 移动连接的版本。与 iPad Pro 机型相比,所有 iPad Air 配置均配备 8GB 内存。
Apple 网上商店中德语国家的价格档次如下,其他欧盟国家的价格档次也非常相似:
- 8GB RAM、128GB ROM:949 欧元 WiFi 上网费(美国售价 799 美元)/1119 欧元 WiFi + 手机上网费(美国售价 949 美元)
- 8GB RAM, 256GB ROM: 1,079 欧元 WiFi (美国售价 899 美元) / 1,249 欧元 WiFi + Cellular (美国售价 1,049 美元)
- 8GB RAM, 512GB ROM: 1,329 欧元 WiFi (美国售价 1,099 美元) / 1,499 欧元 WiFi + Cellular (美国售价 1,249 美元)
- 8GB RAM, 1 TB ROM: 1,579 欧元 WiFi (美国售价 1,299 美元) / 1,749 欧元 WiFi + Cellular (美国售价 1,449 美元)
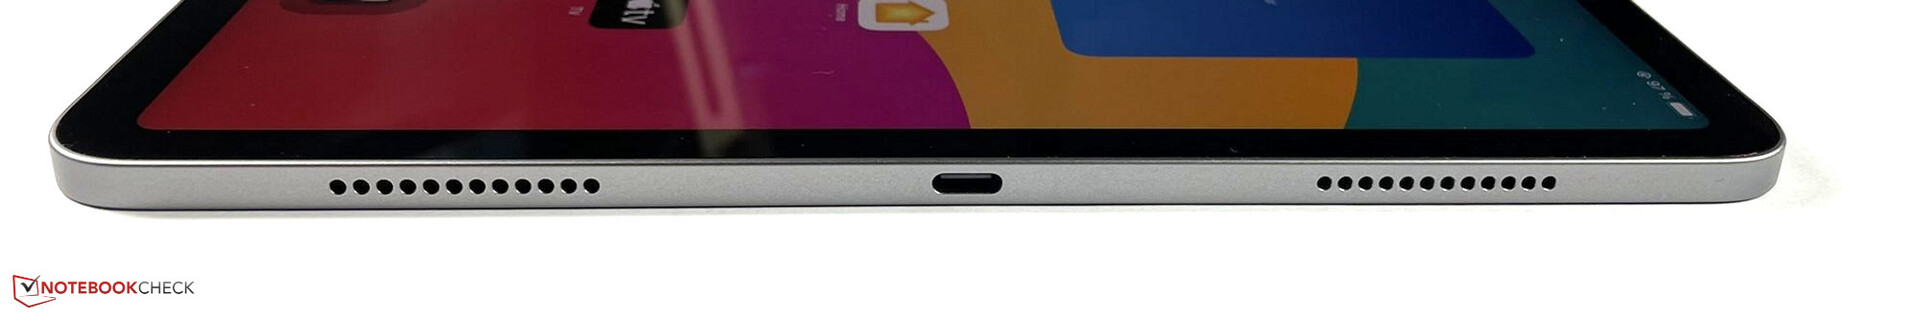
iPad Air 13 (2024) 的 USB-C 端口以 USB 3.1 Gen.2 的速度运行,数据传输最高可达 10 Gb/s。使用外置三星 980 Pro 固态硬盘,我们测得 USB-C 端口的传输速率为 587.5 MB/s。USB-C 端口还支持原生 DisplayPort 图像输出,但不能使用附带的 USB-C 连接线,因为它仅限于 USB 2.0。外部显示器的输出分辨率可达 6K,频率为 60Hz。
平板电脑的顶部有一个磁性吸附区,可吸附Apple Pencil Pro或Apple Pencil (USB-C) 的磁性固定区域。您还可以使用 3 针智能连接器连接选配的Apple Magic Keyboard您还可以使用背面的 3 针智能连接器连接可选的 Magic Keyboard。
软件 - 配备 iPadOS 17.5 的 iPad Air
Apple iPad Air 13(2024 年)包含 iPadOS 17.5 操作系统。尽管制造商没有就该平板电脑将在多长时间内提供更新发表任何官方声明,但我们可以认为至少需要 5 年的时间。过去是这样,现在也应该是这样,例如Apple的 iPadOS 18 预览就显示了这一点。所示。最新的操作系统版本还将在第七代 iPad 和第五代 iPad Mini 上运行,这两款平板电脑已于 2019 年推出。
通信 - 仅在 WiFi + 手机版本中使用 GPS
虽然其 前代产品仅限于 WiFi 6,而 iPad Air 13 (2024) 还支持 WiFi 6E,能够连接到 6 GHz 网络。与我们的华硕 ROG Rapture GT-AXE11000 参考路由器配合使用时,这款平板电脑的传输速率非常高且相当稳定,最高值接近 1500 Mb/s。
Apple iPad Air 13 (2024) 的 WiFi 版不包括 GPS 模块。虽然有无线局域网、数字罗盘和 iBeacon 微定位功能,但这并不足以实现导航和记录路线。只有 WiFi + Cellular 版本才能实现这一功能,该版本除了 5G 移动通信外,还包括 GPS 模块。不过,平板电脑不能插入实体 SIM 卡,只能使用 eSIM 卡。
| Networking | |
| Apple iPad Air 13 2024 | |
| iperf3 receive AXE11000 | |
| iperf3 transmit AXE11000 | |
| iperf3 transmit AXE11000 6GHz | |
| iperf3 receive AXE11000 6GHz | |
| Apple iPad Air 5 2022 | |
| iperf3 receive AXE11000 | |
| iperf3 transmit AXE11000 | |
| Apple iPad Air 11 2024 | |
| iperf3 transmit AXE11000 6GHz | |
| iperf3 receive AXE11000 6GHz | |
| Apple iPad Pro 11 2024 | |
| iperf3 transmit AXE11000 6GHz | |
| iperf3 receive AXE11000 6GHz | |
| Samsung Galaxy Tab S9+ | |
| iperf3 transmit AXE11000 6GHz | |
| iperf3 receive AXE11000 6GHz | |
| Xiaomi Pad 6S Pro | |
| iperf3 receive AXE11000 | |
| iperf3 transmit AXE11000 | |
| iperf3 transmit AXE11000 6GHz | |
| iperf3 receive AXE11000 6GHz | |
摄像头 - 1200 万像素单摄像头

除了新的位置(在长边而不是短边),超广角自拍摄像头在技术上没有太大变化。1200 万像素摄像头采用 f/2 光圈,成像质量稳定。您可以录制最高 1080p 的视频,帧数可达每秒 60 帧。在视频通话过程中,当图像中的人物移动时,便捷的 "中心舞台 "功能也会自动跟随。
背面配备了 1200 万像素摄像头,配备 f/1.8 光圈、自动对焦和 5 倍数码变焦。 Apple iPad Air 5.虽然细节和图像清晰度与当前 iPhone 的图像质量相比仍有很大差距,但它在日光下也能获得不错的效果,并能产生高于平板电脑平均水平的效果。在光线不足的条件下,这一点尤为明显,平板电脑只能捕捉到色彩暗淡的场景。主摄像头最高能以每秒 60 帧的速度录制 4K 视频。


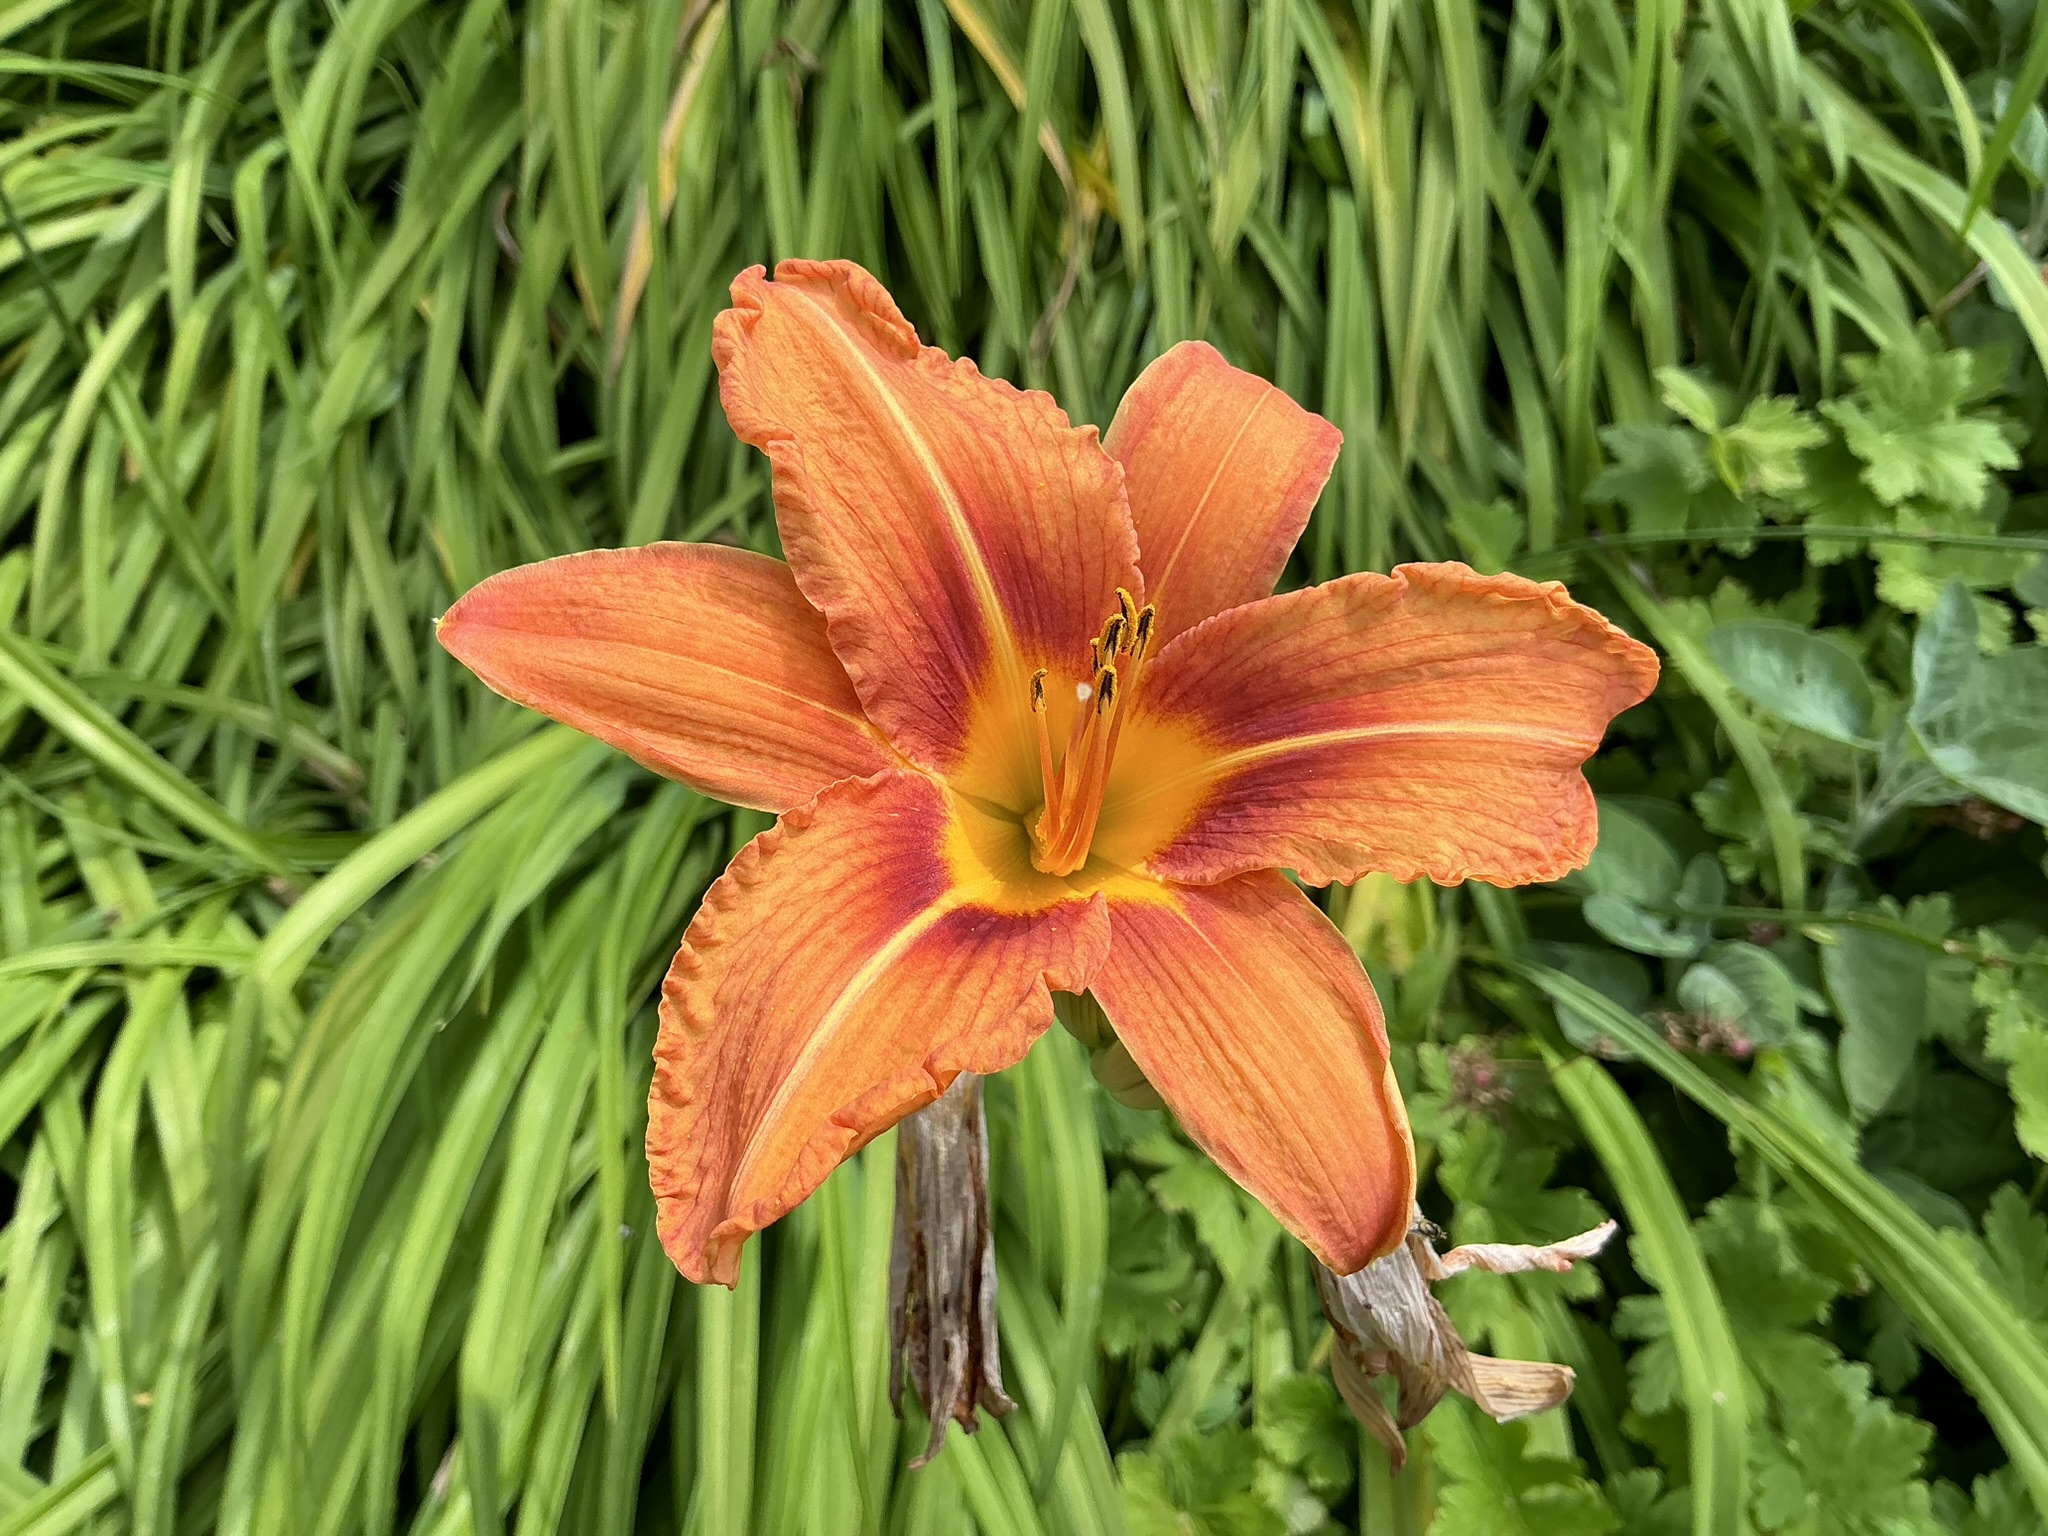

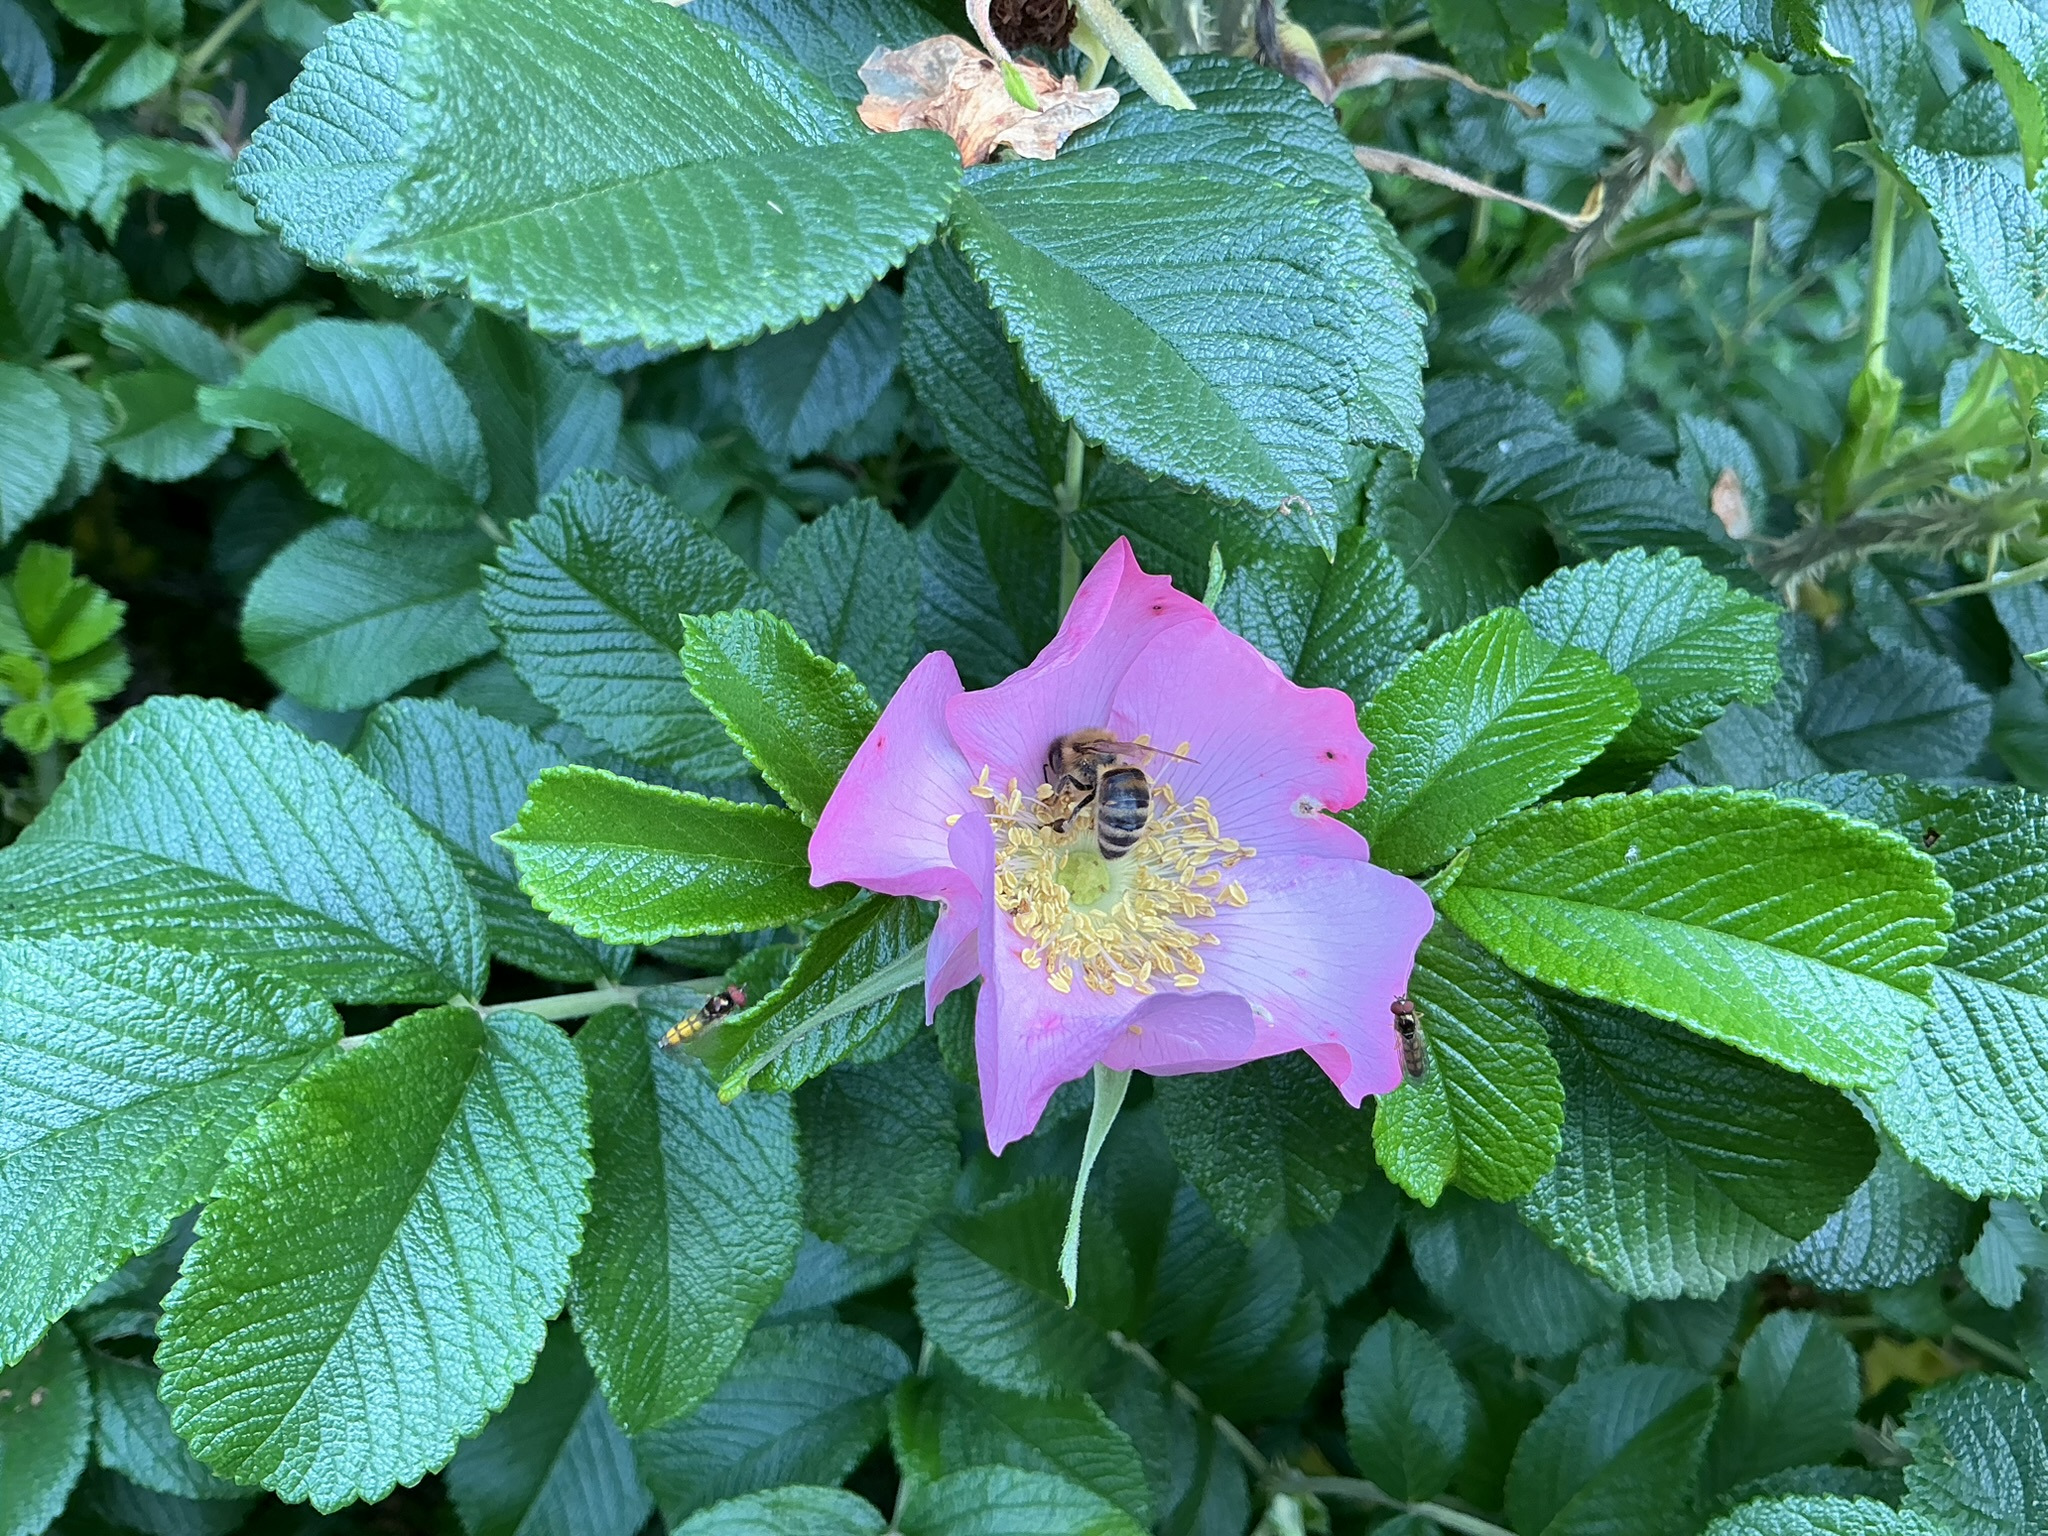

Image Comparison
Choose a scene and navigate within the first image. One click changes the position on touchscreens. One click on the zoomed-in image opens the original in a new window. The first image shows the scaled photograph of the test device.
Daylight picture 1Daylight picture 25x zoomLow light picture


我们在测试实验室再看一下主摄像头。在最佳光线条件下,色彩还原准确,测试图表的图像清晰锐利。但在 1 Lux 的剩余光照条件下,情况就发生了变化:色彩准确度下降,我们只能看到测试图表的轮廓。


配件和保修 - 包装盒内物品有限
Apple 将 iPad Air 的包装内容限制在最低限度。除 iPad 外,包装盒内只有一条 1 米(约 3 英尺)长的织物包裹 USB-C 连接线和几张信息资料传单。
除了保护套、充电器和充电线缆,Apple 还提供了可选的Apple Pencil Pro(建议零售价 149 欧元,美国售价 129 美元)。Apple Pencil (USB-C)一样,它也可以通过磁力吸附到平板电脑上。Apple Magic Keyboard也需要额外付费,制造商开价高达 399 欧元(美国售价 299 美元)。
Apple iPad Air 13 的保修期为 12 个月(2024 年),但这并不影响(德国)法律规定的制造商保修期。
您可以使用AppleCare+ 延长制造商保修期。保险套餐,保险期为两年,每月费用为 5.49 欧元(美国为 3.99 美元),或一次性费用 109 欧元(美国为 79 美元)。在此期间,AppleCare+ 不限次承保意外损坏,但每次都需要支付 29 欧元的服务费(美国为 29 美元)。
输入设备和操作 - 指纹传感器,但没有 Face ID
13 英寸超大 IPS 面板能非常准确地执行输入,没有任何明显的延迟。不过,由于刷新率较低,仅为 60 赫兹,iPad Air 13 (2024) 显示动画和滚动运动的流畅度不如 iPad Pro 或其他竞争对手,如 三星Galaxy Tab S9+.除了手指输入,你还可以使用笔输入。为此,您可以使用Apple Pencil (USB-C)或Apple Pencil ProPencil Pro 提供额外的压力传感器。
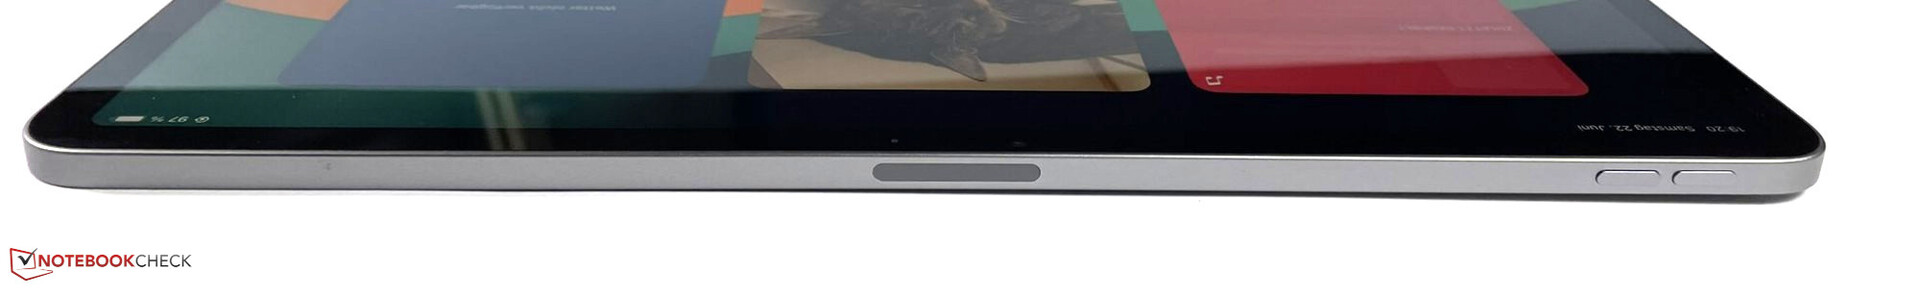
集成在电源键中的 Touch ID 指纹传感器运行完美,可快速解锁 iPad Air 13 (2024)。但它只能被动运行,因此在关闭屏幕时必须按压两次:第一次用于打开屏幕,第二次用于验证。
由于平板电脑尺寸较大,电源键有时难以触及,因此人脸识别功能对于Apple 平板电脑来说将是一项非常有用的功能。不过,iPad Air 仍然没有 Face ID,因为生物人脸识别功能仍然是 iPad Pro 机型的专利。
显示屏 - 无 PWM 的 IPS 面板
iPad Air 13(2024)的 13 英寸 IPS 面板分辨率为 2732x2048 像素,相当于 4:3 图像格式。与 iPad Air 11(2024)相比,它不仅显示屏尺寸更大 iPad Air 11 (2024)而且亮度也略高。虽然差别不是很大--根据规格,它的亮度为 600 尼特,而不是 500 尼特--但在我们的测试中,iPad Air 13(2024)实现了它的承诺。
在白色背景下,显示屏的平均亮度为 589.4 cd/m²,而在图像明暗区域分布均匀的情况下(APL18),亮度可增至 631 cd/m²。因此,IPS 面板无法达到 "真正的 "HDR,因为这需要四位数的亮度,就像 iPad Pro 11 (2024) 一样。 Apple iPad Pro 11 (2024)为例。不过,除了 HDR10,IPS 面板还支持 Dolby Vision。最低亮度仍能达到 2.13 cd/m²。
IPS 面板无需使用脉宽调制(PWM)来调节亮度。这使得Apple 平板电脑也非常适合对 PWM 闪烁敏感的用户。
| |||||||||||||||||||||||||
Brightness Distribution: 88 %
Center on Battery: 631 cd/m²
Contrast: 1018:1 (Black: 0.62 cd/m²)
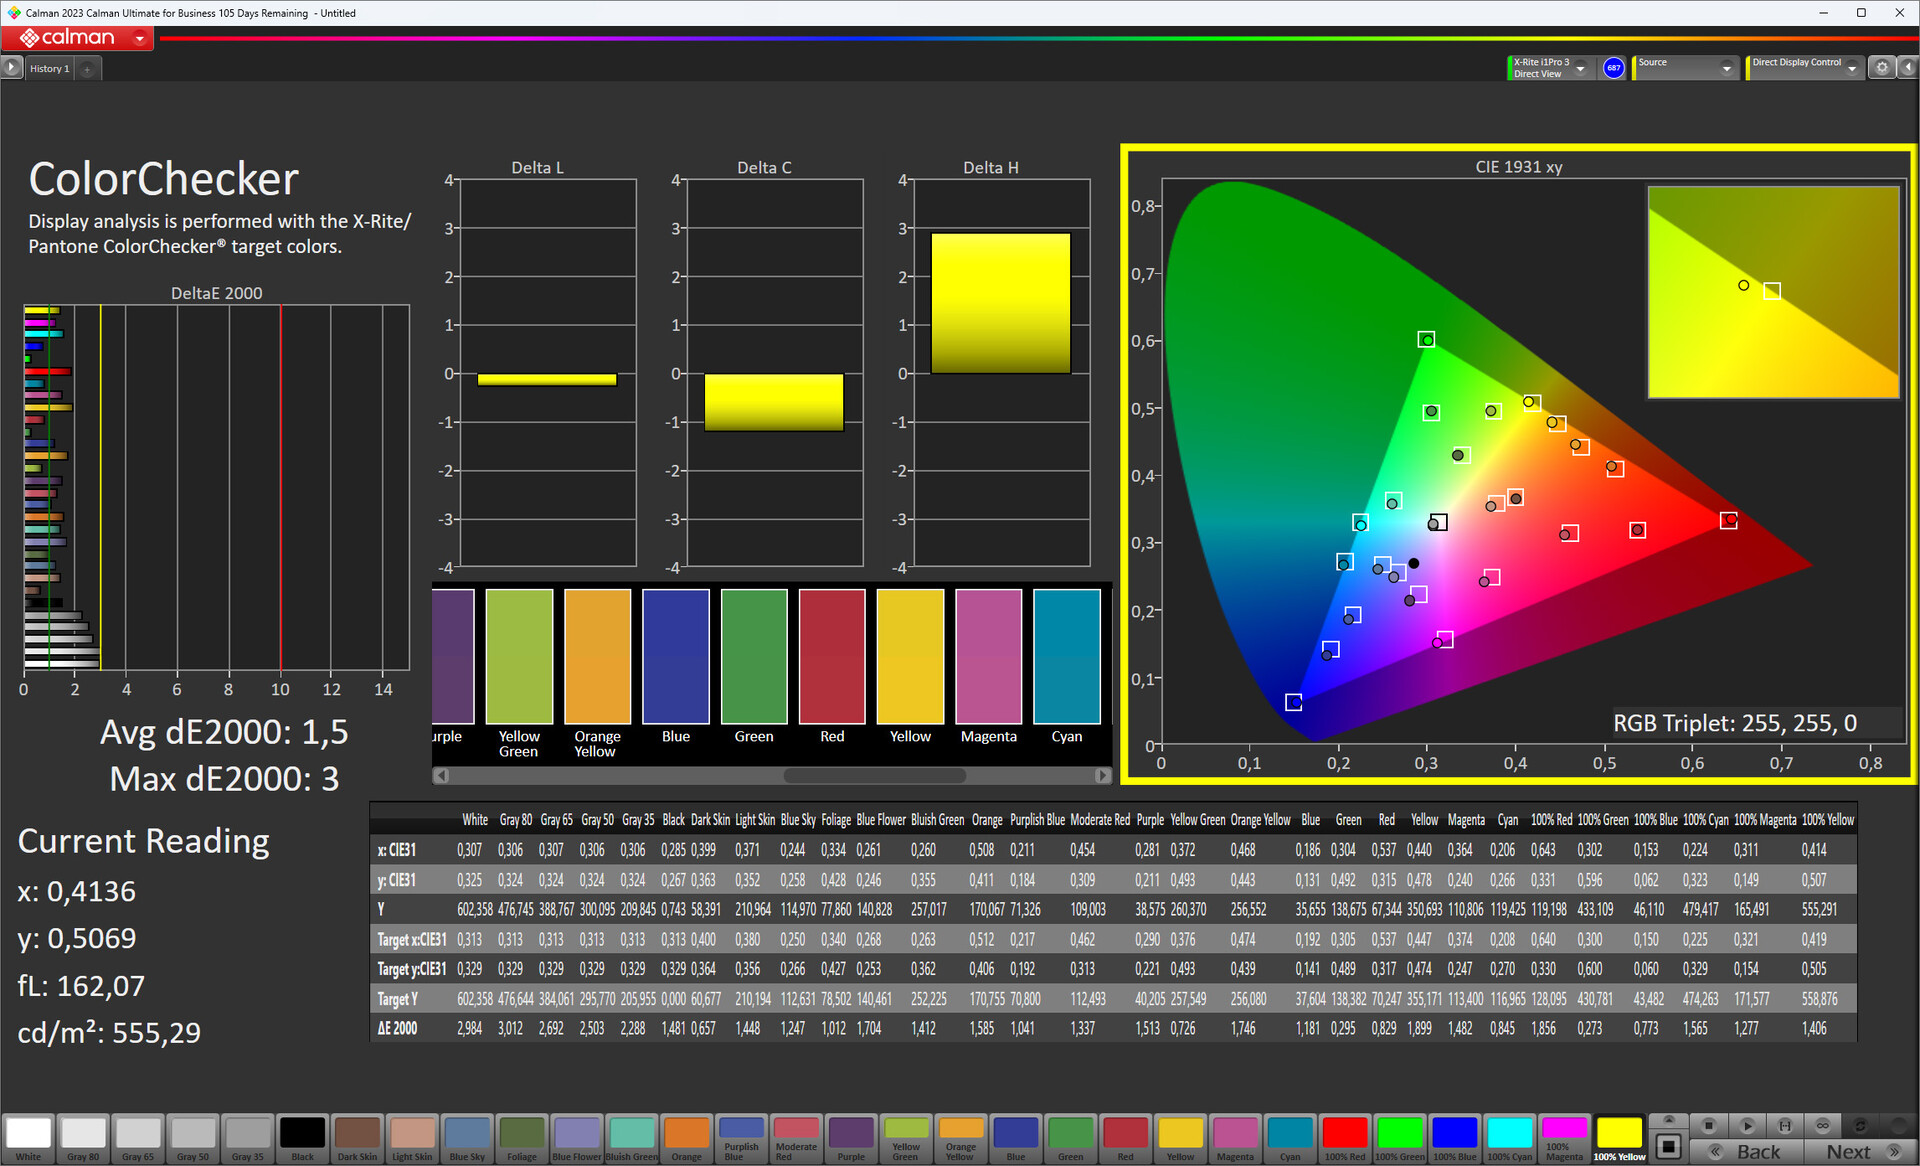
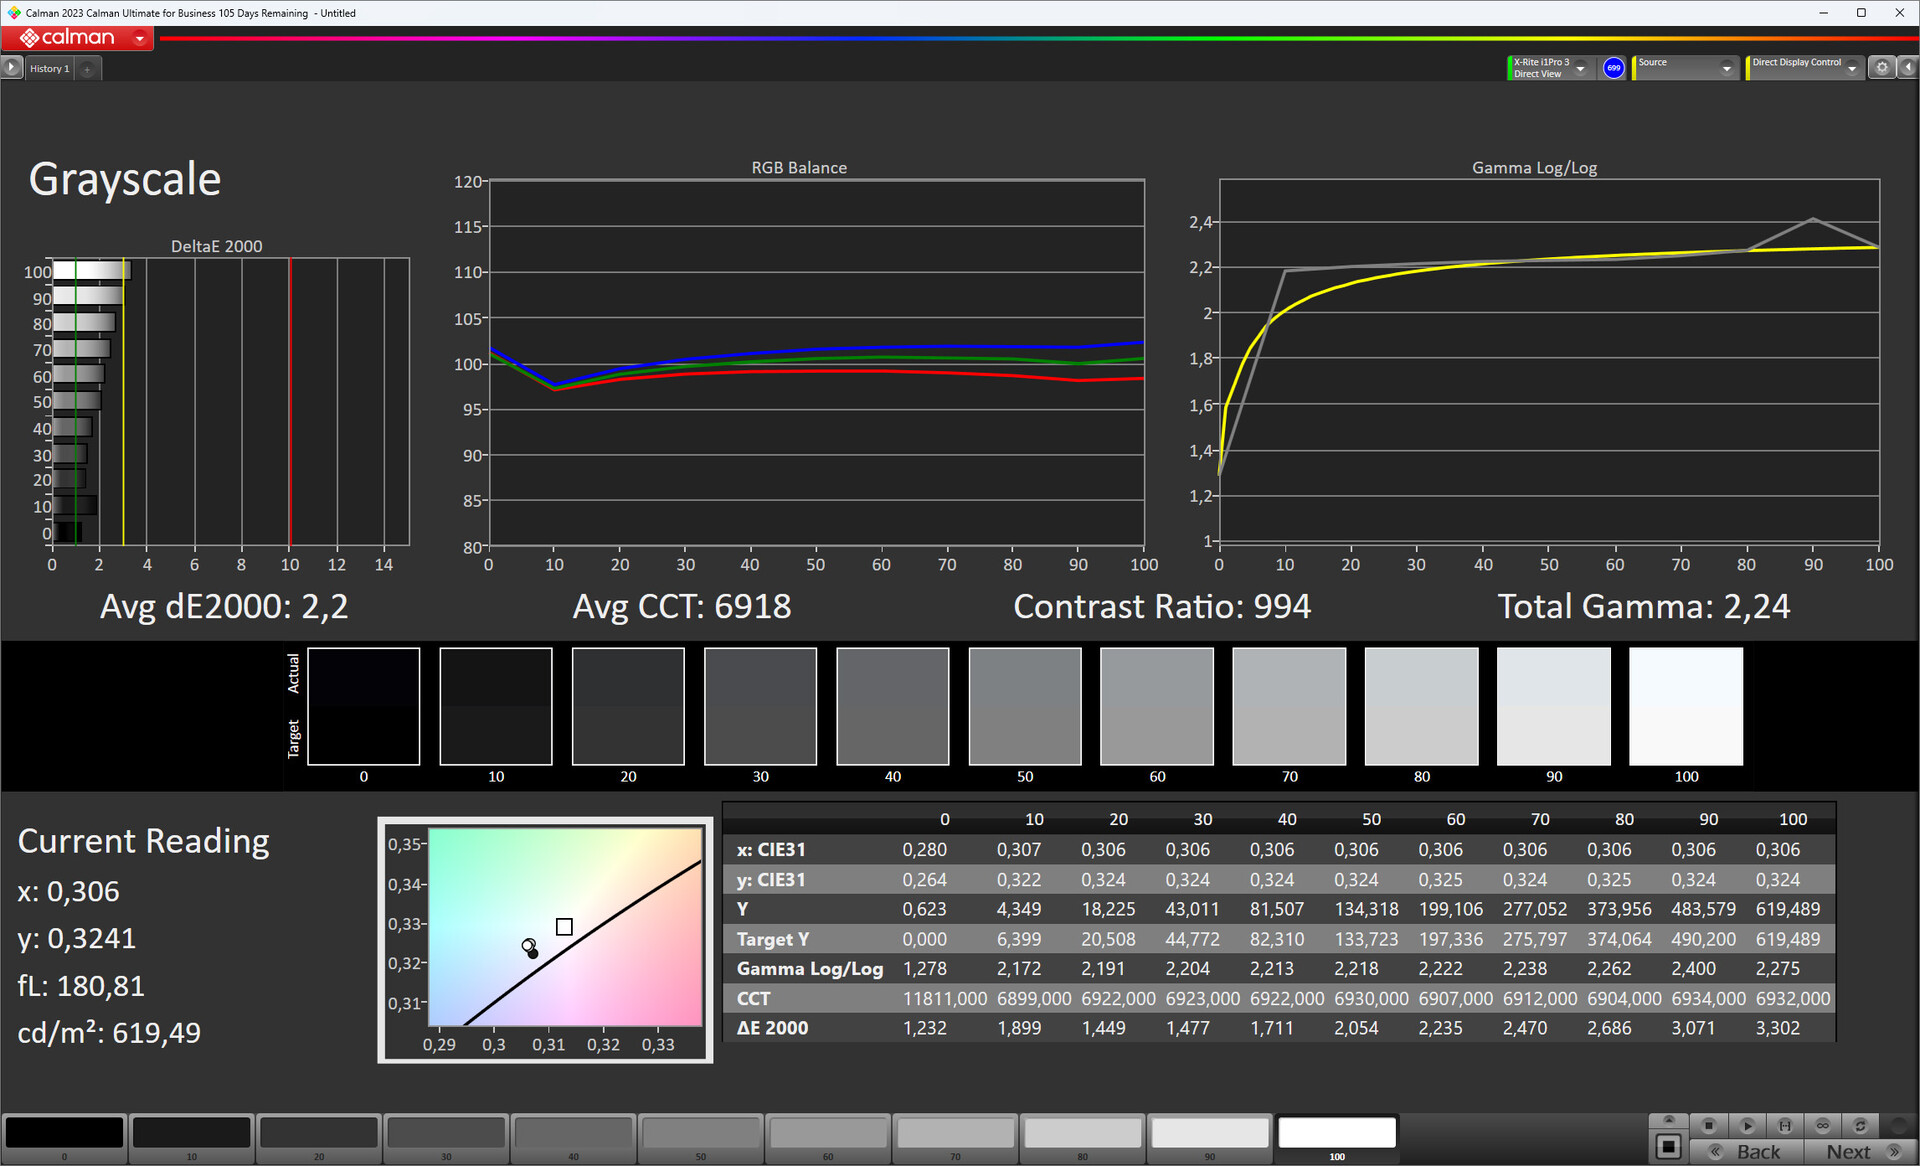
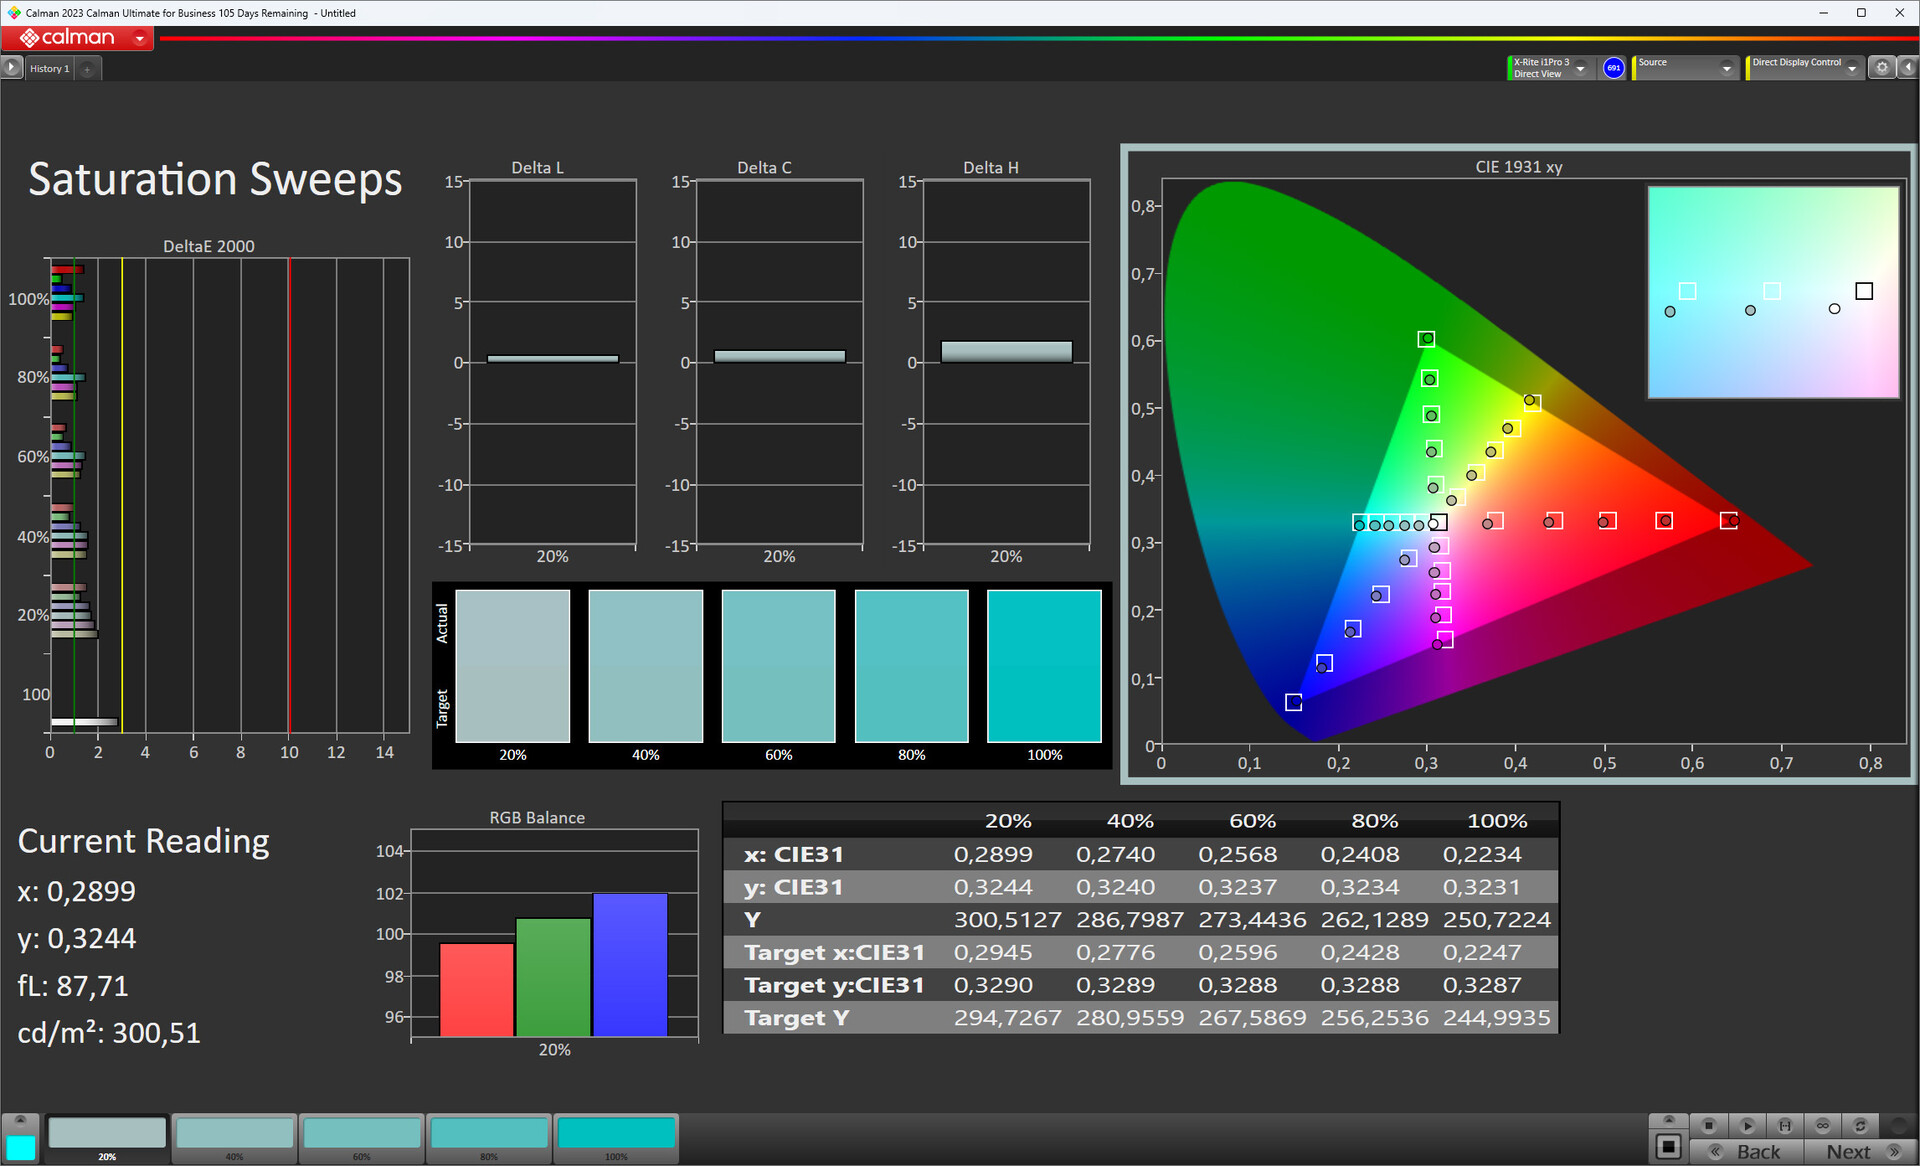
ΔE Color 1.5 | 0.5-29.43 Ø4.87
ΔE Greyscale 2.2 | 0.5-98 Ø5.1
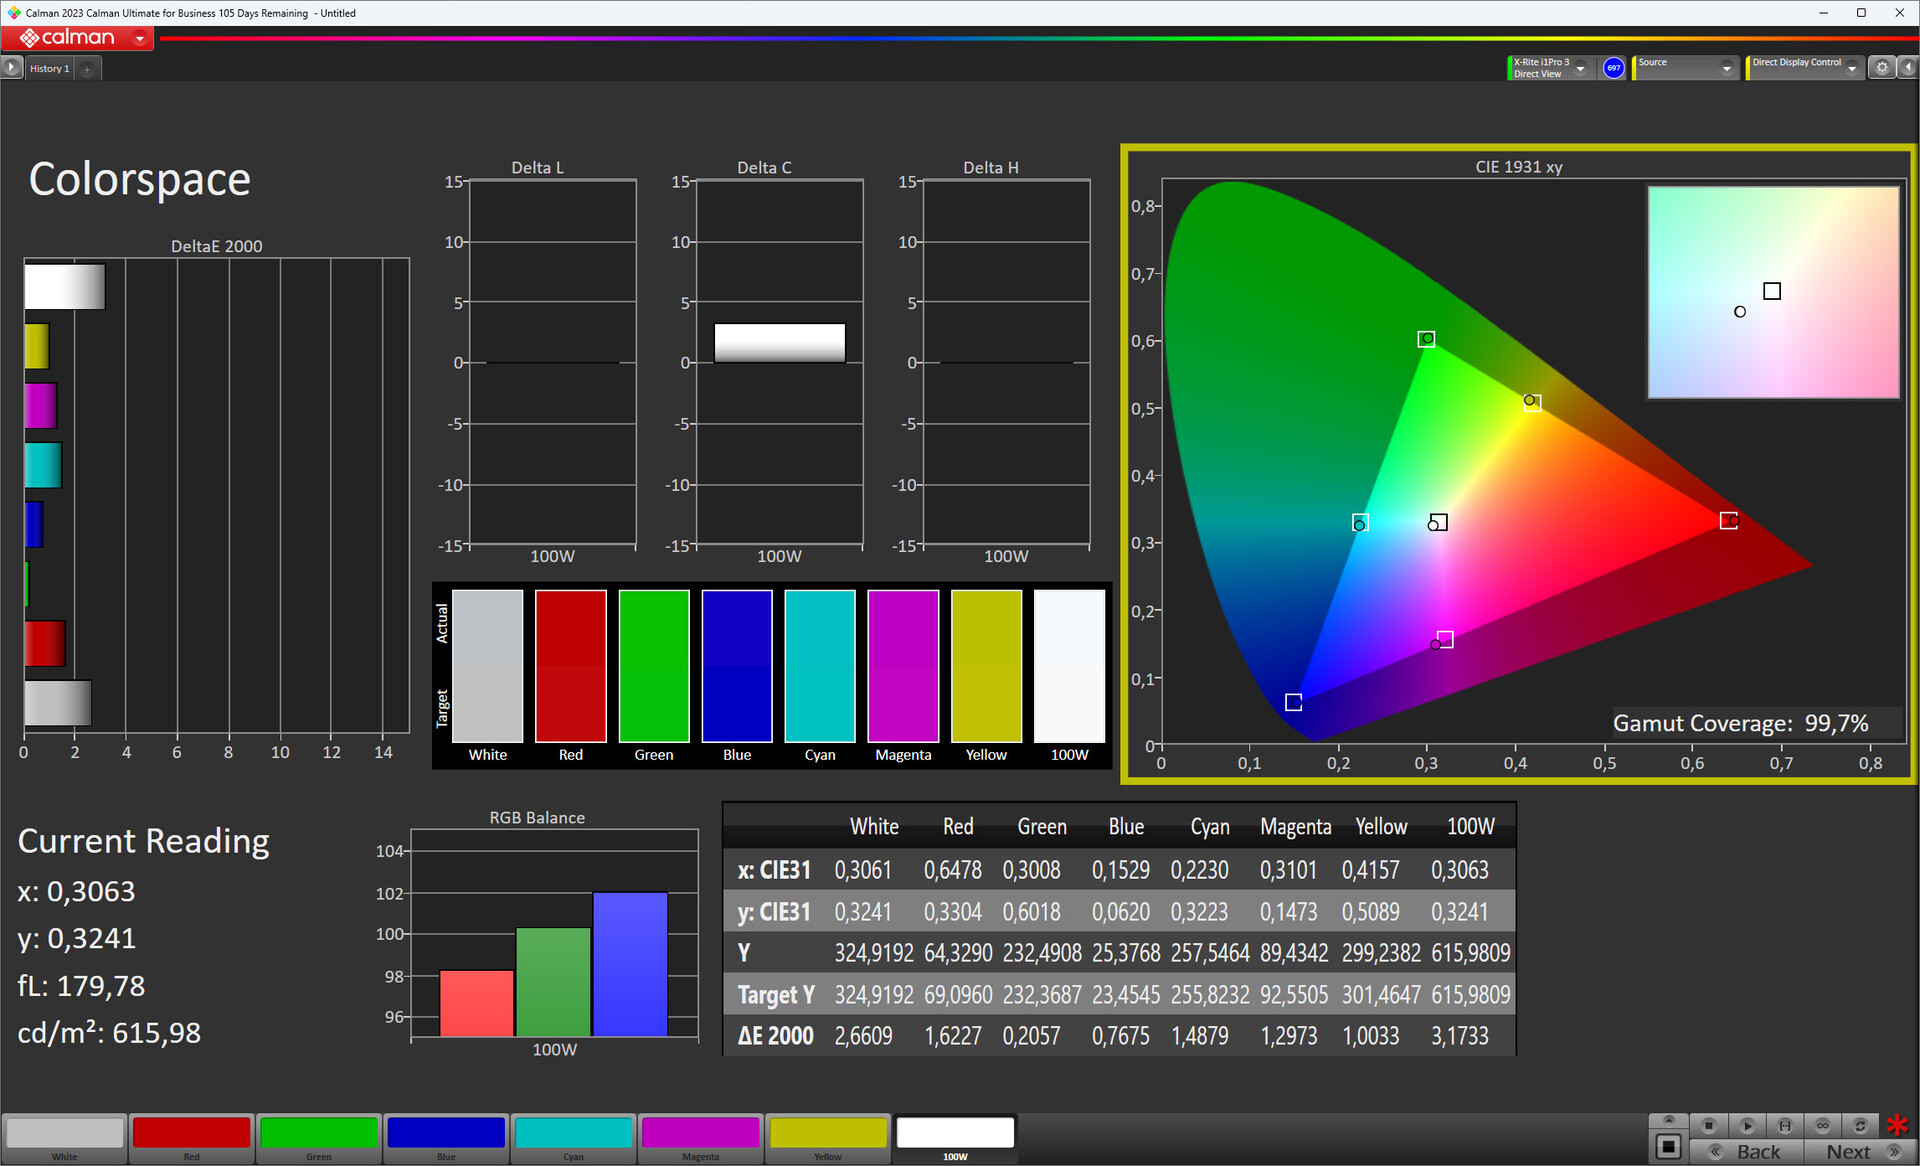
99.7% sRGB (Calman 2D)
Gamma: 2.24
| Apple iPad Air 13 2024 IPS, 2732x2048, 13" | Apple iPad Air 5 2022 IPS, 2360x1640, 10.9" | Apple iPad Air 11 2024 IPS, 2360x1640, 10.9" | Apple iPad Pro 11 2024 OLED, 2420x1668, 11" | Samsung Galaxy Tab S9+ AMOLED, 2800x1752, 12.4" | Xiaomi Pad 6S Pro IPS, 3048x2032, 12.4" | |
|---|---|---|---|---|---|---|
| Screen | 10% | 1% | 41% | -23% | -3% | |
| Brightness middle | 631 | 529 -16% | 506 -20% | 1005 59% | 574 -9% | 867 37% |
| Brightness | 589 | 490 -17% | 474 -20% | 1004 70% | 551 -6% | 810 38% |
| Brightness Distribution | 88 | 86 -2% | 87 -1% | 99 13% | 89 1% | 87 -1% |
| Black Level * | 0.62 | 0.37 40% | 0.4 35% | 0.58 6% | ||
| Contrast | 1018 | 1430 40% | 1265 24% | 1495 47% | ||
| Colorchecker dE 2000 * | 1.5 | 1.35 10% | 1.48 1% | 0.92 39% | 2.01 -34% | 2 -33% |
| Colorchecker dE 2000 max. * | 3 | 2.45 18% | 3.12 -4% | 2 33% | 4.93 -64% | 5.5 -83% |
| Greyscale dE 2000 * | 2.2 | 2.1 5% | 2.3 -5% | 1.5 32% | 2.8 -27% | 3 -36% |
| Gamma | 2.24 98% | 2.183 101% | 2.204 100% | 2.224 99% | 2.066 106% | 2.29 96% |
| CCT | 6918 94% | 6939 94% | 6954 93% | 6604 98% | 6566 99% | 6957 93% |
* ... smaller is better
Screen Flickering / PWM (Pulse-Width Modulation)
| Screen flickering / PWM not detected | 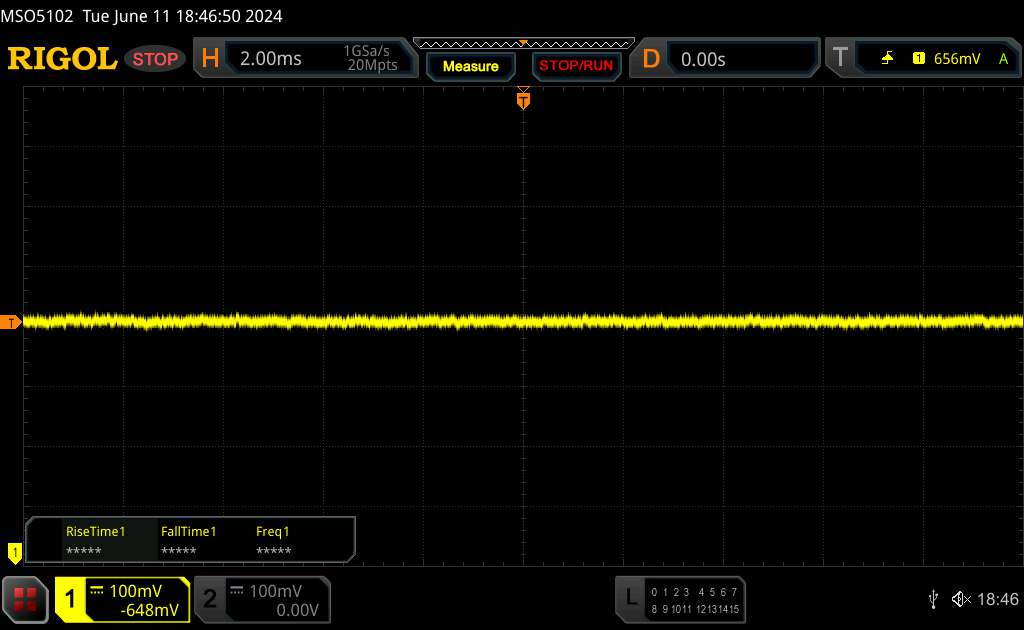 | ||
In comparison: 53 % of all tested devices do not use PWM to dim the display. If PWM was detected, an average of 8516 (minimum: 5 - maximum: 343500) Hz was measured. | |||
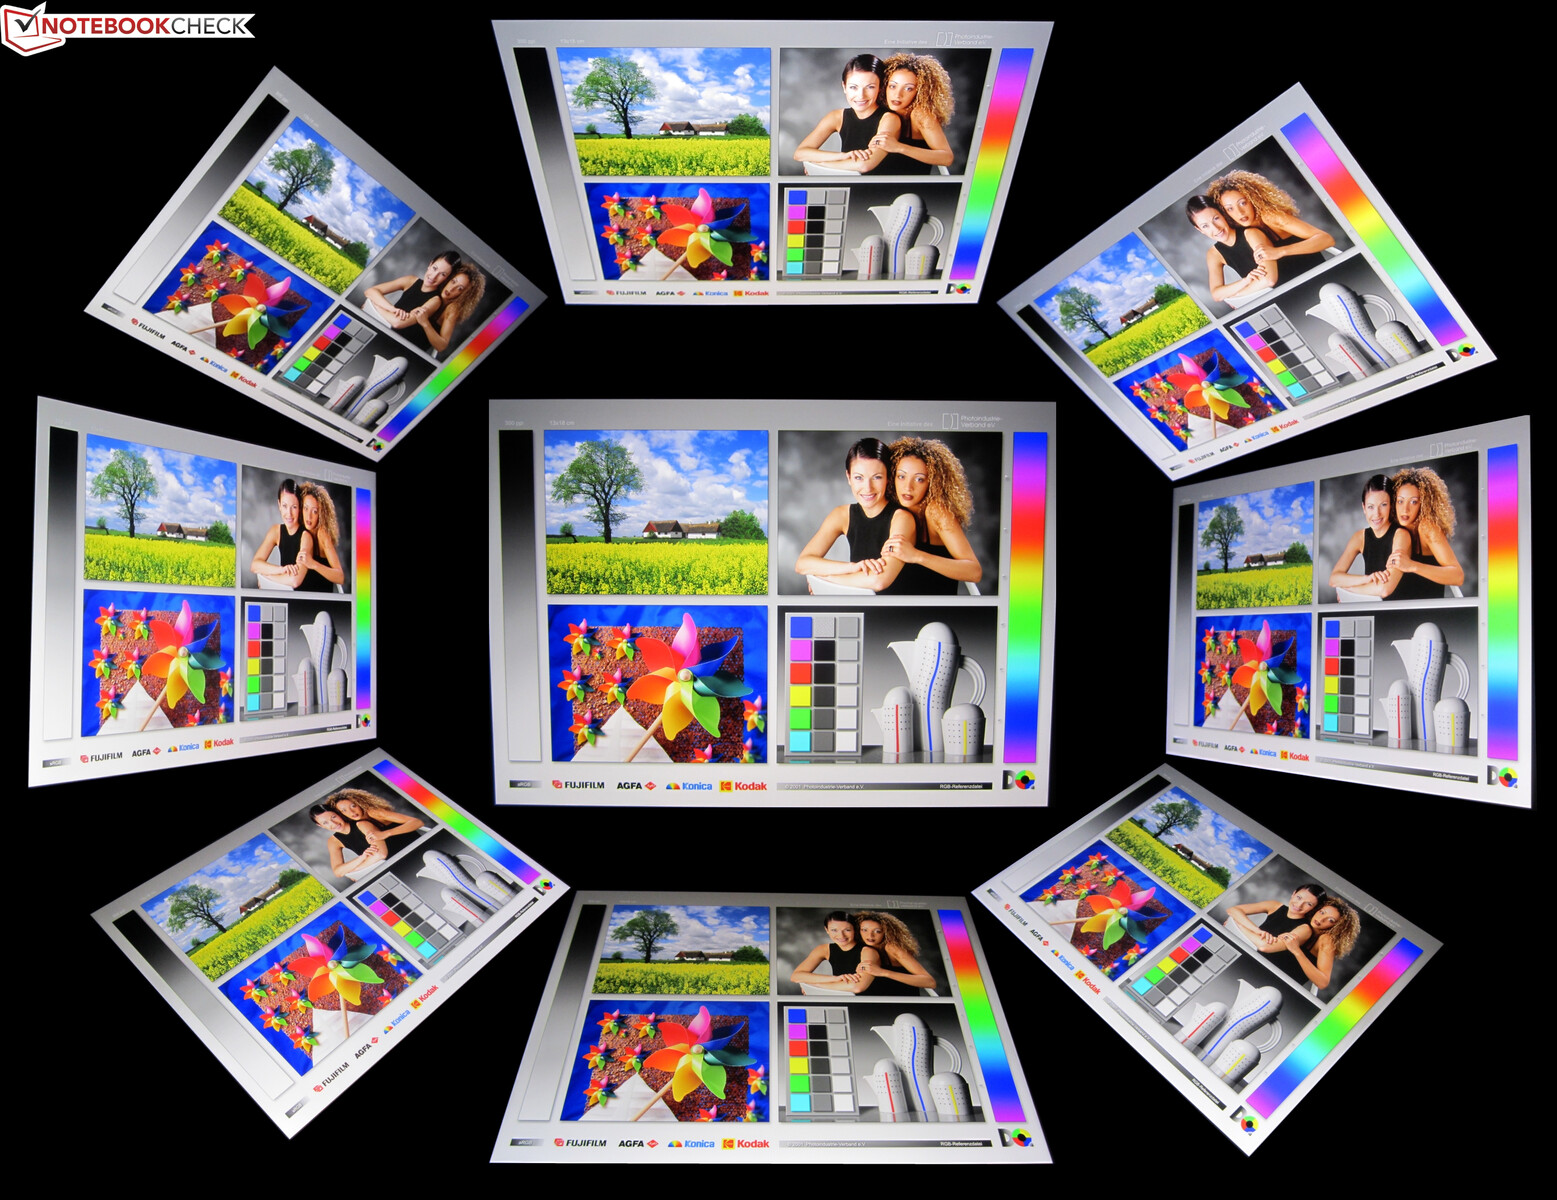
IPS 面板会根据当前的光线条件,通过True Tone 自动调节色温和亮度。因此,为了防止出现色彩偏差,我们在使用卡尔曼分析软件和光电光谱仪进行测量时必须关闭这一功能。在没有True Tone 的情况下,IPS 面板可以实现非常好的色彩还原,与理想目标值的偏差已经无法用肉眼识别。不过,iPad Pro 在这方面做得更好,其 OLED 面板也能呈现出更加鲜艳的色彩。
Display Response Times
| ↔ Response Time Black to White | ||
|---|---|---|
| 35.21 ms ... rise ↗ and fall ↘ combined | ↗ 18.76 ms rise | 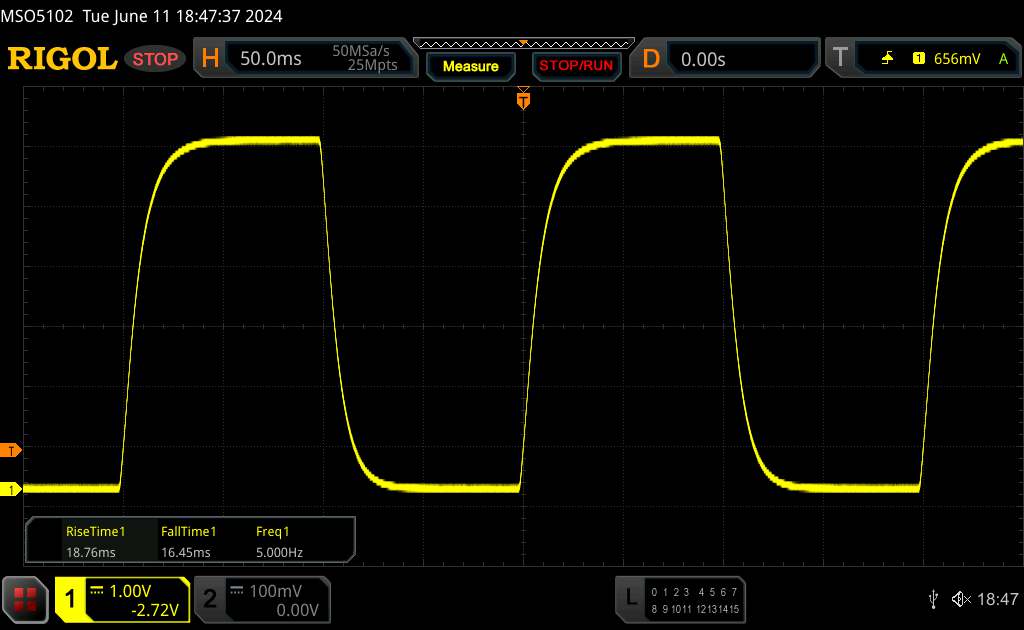 |
| ↘ 16.45 ms fall | ||
| The screen shows slow response rates in our tests and will be unsatisfactory for gamers. In comparison, all tested devices range from 0.1 (minimum) to 240 (maximum) ms. » 93 % of all devices are better. This means that the measured response time is worse than the average of all tested devices (20.8 ms). | ||
| ↔ Response Time 50% Grey to 80% Grey | ||
| 54.3 ms ... rise ↗ and fall ↘ combined | ↗ 25.04 ms rise | 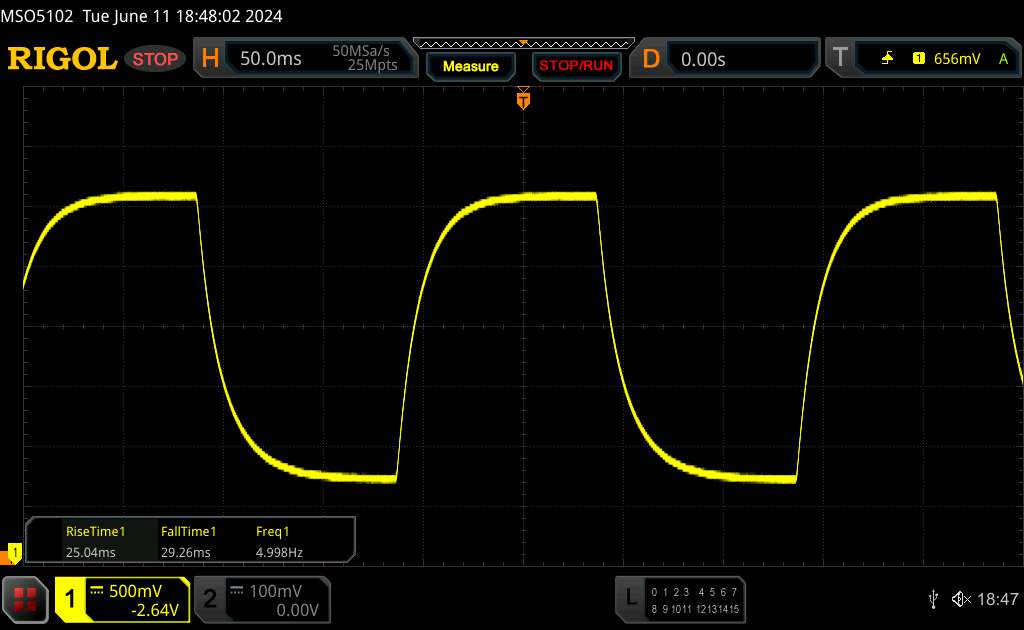 |
| ↘ 29.26 ms fall | ||
| The screen shows slow response rates in our tests and will be unsatisfactory for gamers. In comparison, all tested devices range from 0.165 (minimum) to 636 (maximum) ms. » 90 % of all devices are better. This means that the measured response time is worse than the average of all tested devices (32.5 ms). | ||
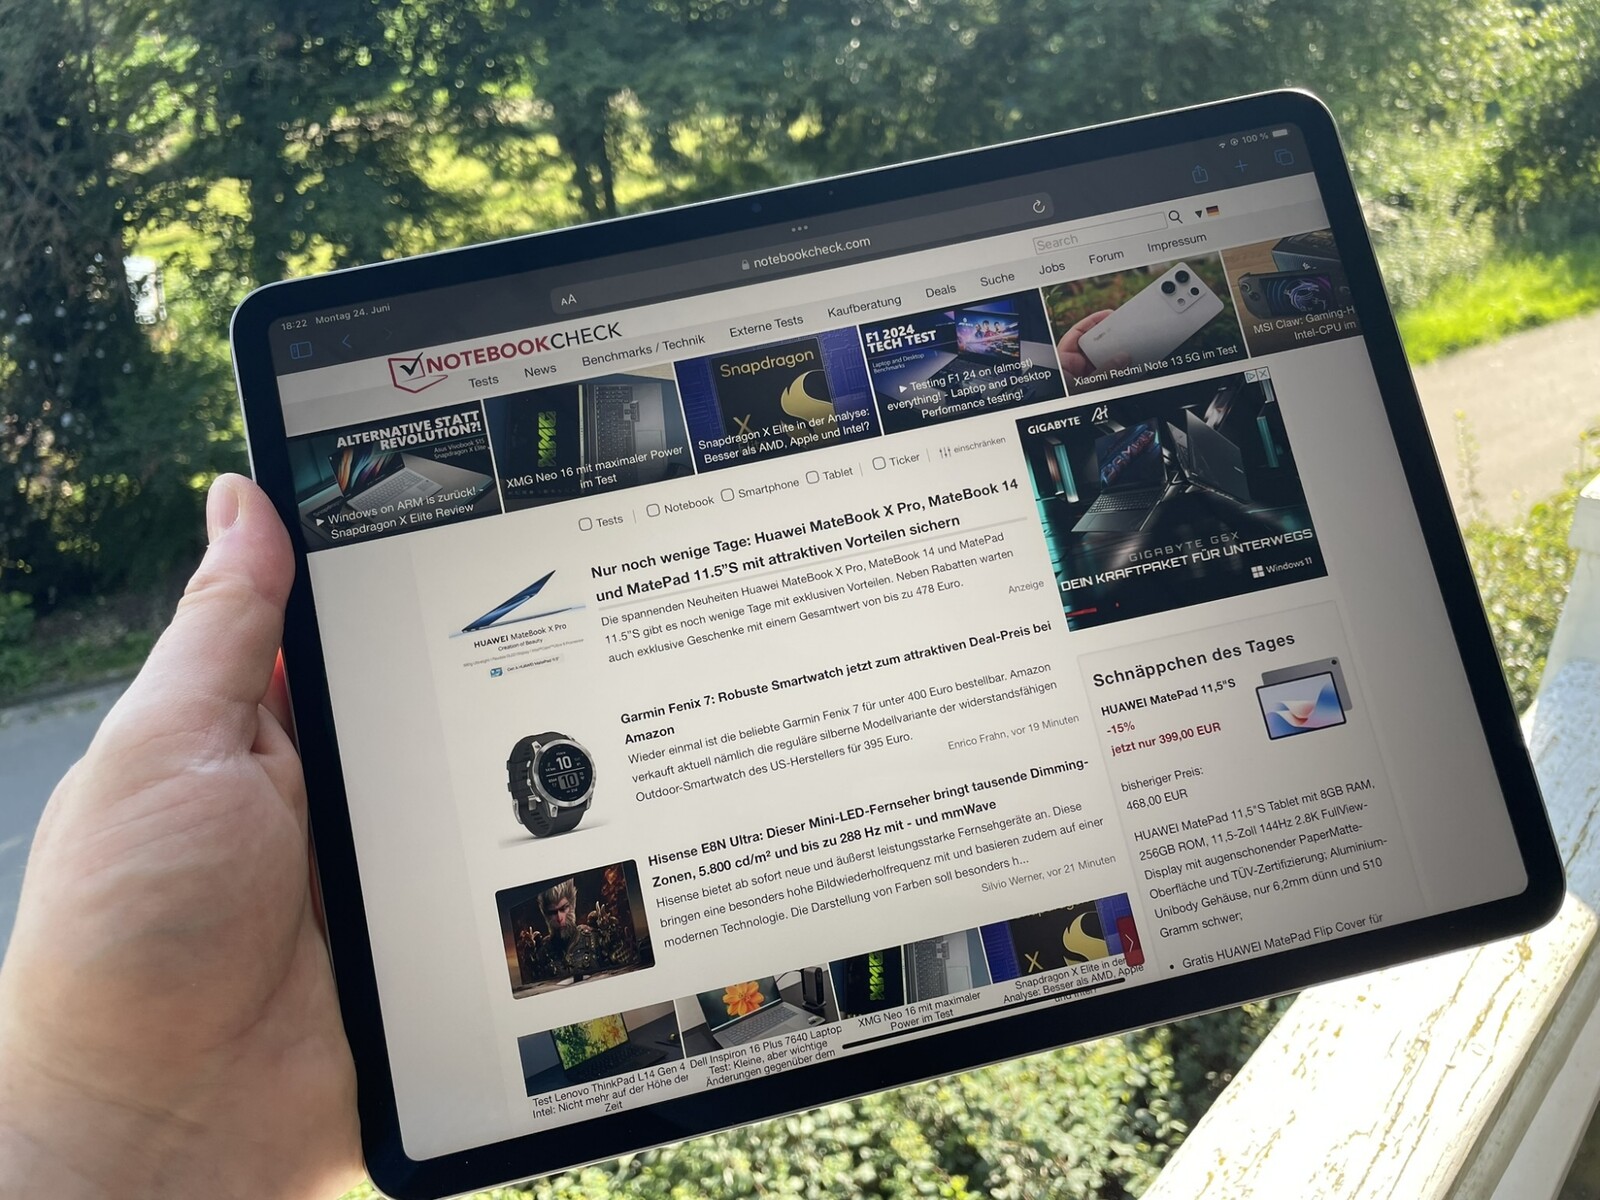
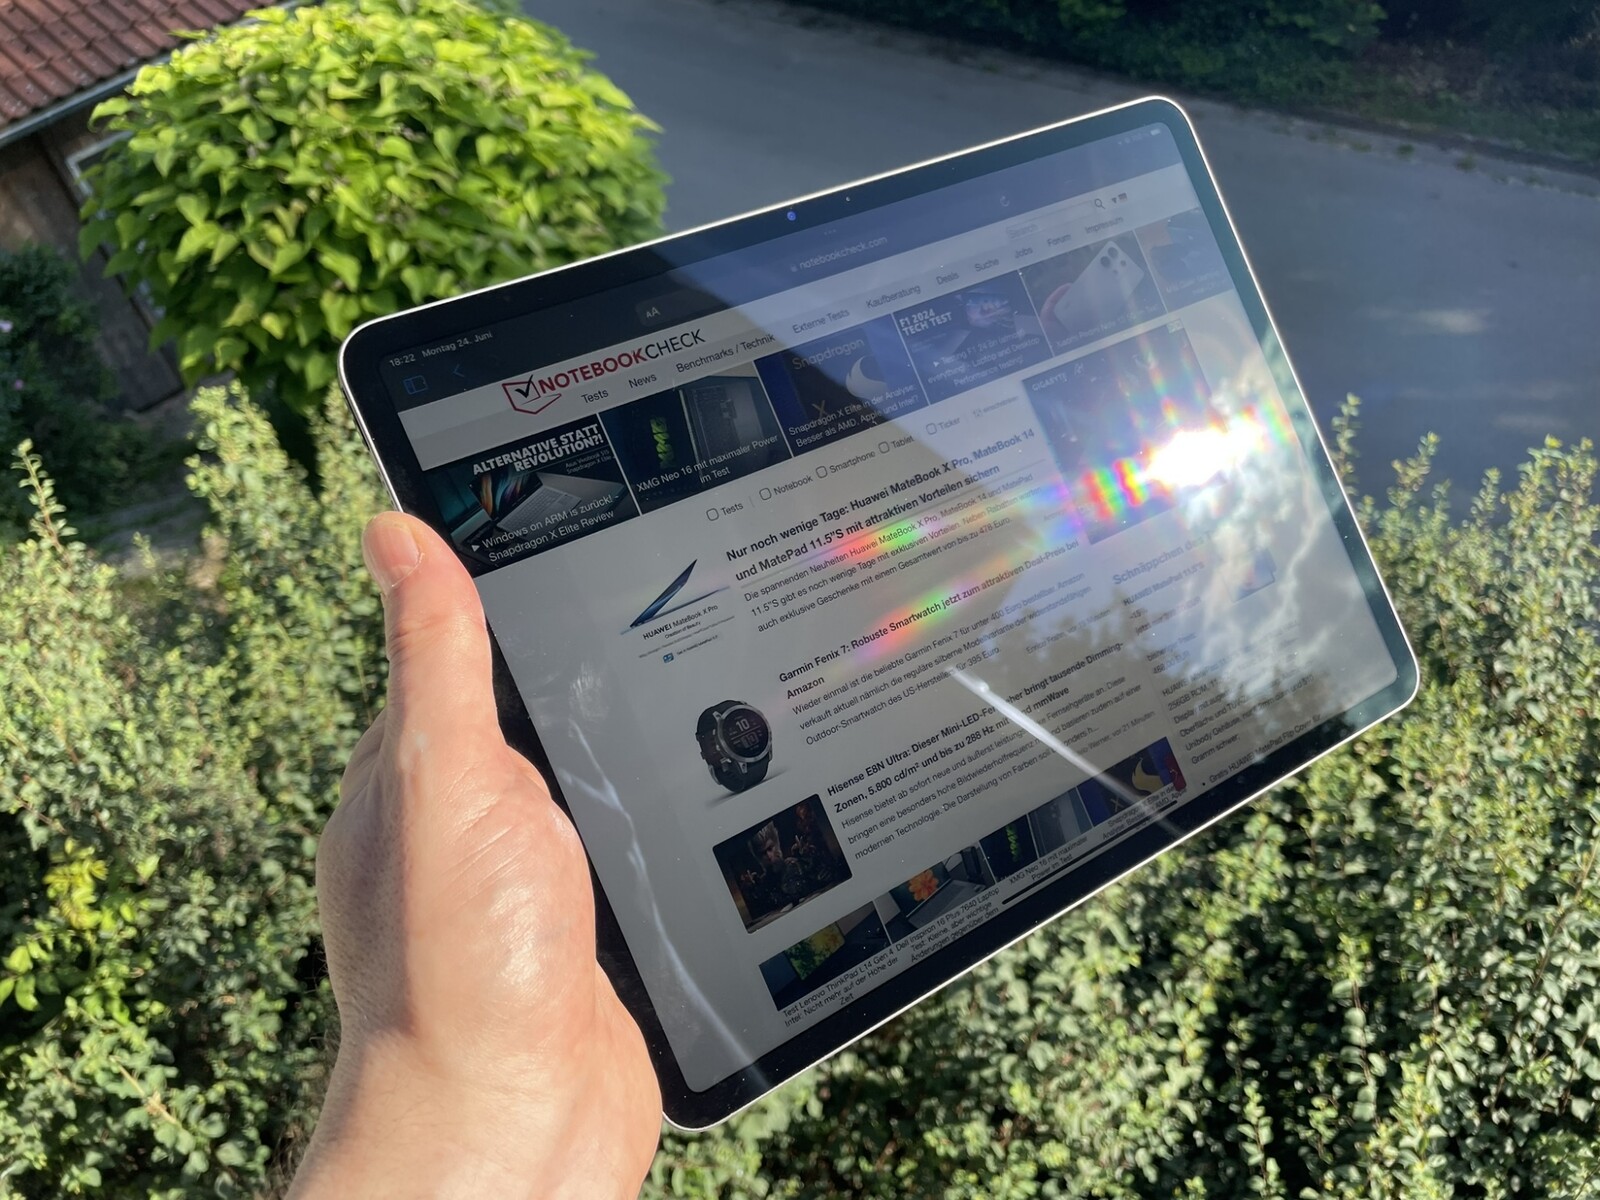
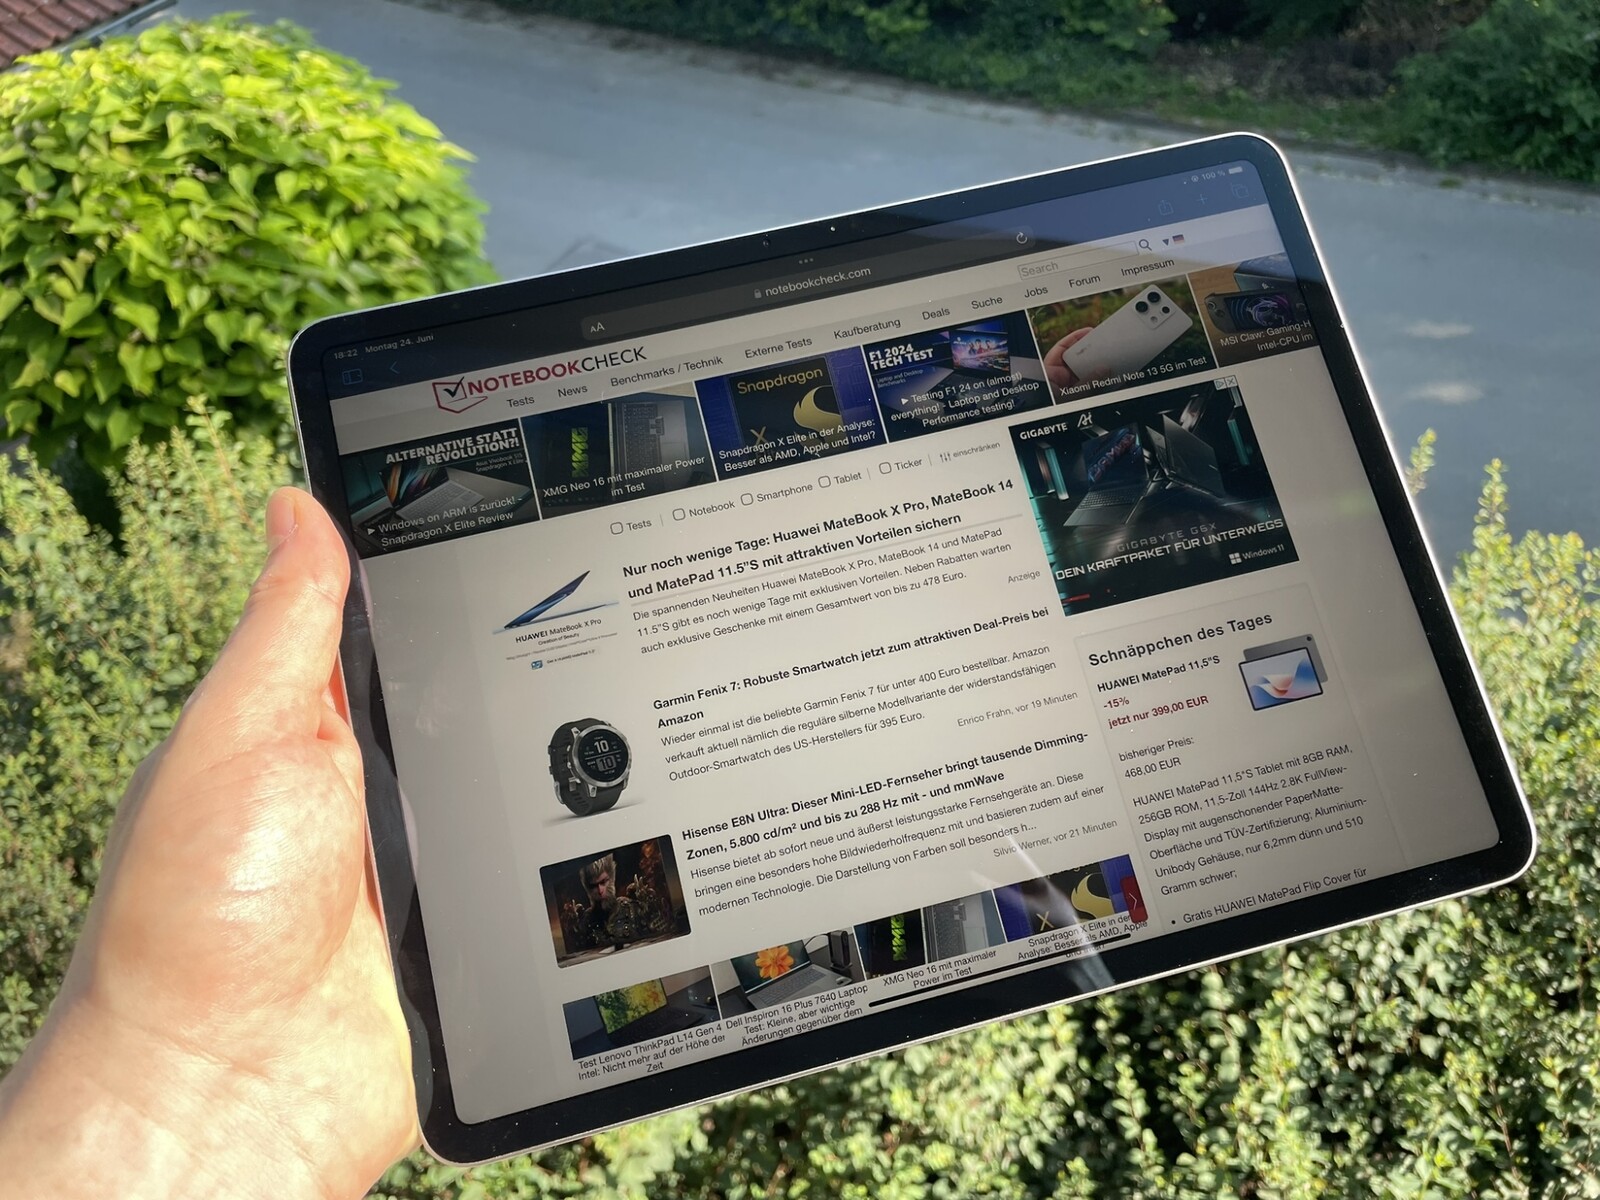
由于 iPad Air 13 (2024) 显示屏采用了防反射涂层,因此在户外使用时表现出色,而且与 iPad Air 11 (2024) 相比,它的亮度储备更高,使用更灵活。 iPad Air 11 (2024).但当阳光直射屏幕时,即使 13 英寸平板电脑的亮度也很难超越显示屏表面的反光。
性能 - 配备Apple M2 的 iPad Air 13 (2024)
iPad Air 13 (2024) 的 CPU 性能储备丰富,因为它继承了 Apple M2的 iPad Pro 11(2022 年).与 Apple M1相比,M2 的性能大幅提升,是目前速度最快的移动处理器之一。凭借强劲的性能,iPad Air 13(2024 年)毫不费力地超越了所有Android 平板电脑,为任何使用场景提供了足够的动力。但更快的是 Apple M4处理器。
| Geekbench ML - 0.6 Core ML Neural Engine | |
| Average of class Tablet (6978 - 9283, n=2, last 2 years) | |
| Average Apple M2 (6978 - 7586, n=2) | |
| Apple iPad Air 13 2024 | |
在 GPU 性能方面,Apple 平板电脑之间再次争夺第一名。iPad Air 13(2024 年)再次排在 iPad Pro 之后,将Android 阵营的高端竞争对手远远甩在身后,其中包括 三星Galaxy Tab S9+和 小米 Pad 6S Pro.两者仅在 GFXBench 的部分屏幕测试中领先,但这只是因为Apple 平板电脑无法显示每秒 60 帧以上的画面。
GFXBench (DX / GLBenchmark) 2.7: T-Rex Onscreen | 1920x1080 T-Rex Offscreen
GFXBench 3.0: on screen Manhattan Onscreen OGL | 1920x1080 1080p Manhattan Offscreen
GFXBench 3.1: on screen Manhattan ES 3.1 Onscreen | 1920x1080 Manhattan ES 3.1 Offscreen
GFXBench: on screen Car Chase Onscreen | 1920x1080 Car Chase Offscreen | on screen Aztec Ruins High Tier Onscreen | 2560x1440 Aztec Ruins High Tier Offscreen | on screen Aztec Ruins Normal Tier Onscreen | 1920x1080 Aztec Ruins Normal Tier Offscreen | 3840x2160 4K Aztec Ruins High Tier Offscreen
| 3DMark / Wild Life Extreme Unlimited | |
| Apple iPad Pro 11 2024 | |
| Apple iPad Air 13 2024 | |
| Apple iPad Air 11 2024 | |
| Apple iPad Air 5 2022 | |
| Samsung Galaxy Tab S9+ | |
| Xiaomi Pad 6S Pro | |
| 3DMark / Wild Life Extreme | |
| Apple iPad Pro 11 2024 | |
| Apple iPad Air 13 2024 | |
| Apple iPad Air 11 2024 | |
| Apple iPad Air 5 2022 | |
| Samsung Galaxy Tab S9+ | |
| Xiaomi Pad 6S Pro | |
| 3DMark / Wild Life Unlimited Score | |
| Apple iPad Pro 11 2024 | |
| Apple iPad Air 13 2024 | |
| Apple iPad Air 11 2024 | |
| Apple iPad Air 5 2022 | |
| Xiaomi Pad 6S Pro | |
| 3DMark / Solar Bay Unlimited Score | |
| Apple iPad Pro 11 2024 | |
| Apple iPad Air 11 2024 | |
| Apple iPad Air 13 2024 | |
| Samsung Galaxy Tab S9+ | |
| Xiaomi Pad 6S Pro | |
| 3DMark / Solar Bay Score | |
| Apple iPad Pro 11 2024 | |
| Apple iPad Air 13 2024 | |
| Apple iPad Air 11 2024 | |
| Samsung Galaxy Tab S9+ | |
| Xiaomi Pad 6S Pro | |
| GFXBench (DX / GLBenchmark) 2.7 / T-Rex Onscreen | |
| Xiaomi Pad 6S Pro | |
| Samsung Galaxy Tab S9+ | |
| Apple iPad Air 5 2022 | |
| Apple iPad Pro 11 2024 | |
| Apple iPad Air 11 2024 | |
| Apple iPad Air 13 2024 | |
| GFXBench (DX / GLBenchmark) 2.7 / T-Rex Offscreen | |
| Apple iPad Air 13 2024 | |
| Apple iPad Pro 11 2024 | |
| Apple iPad Air 11 2024 | |
| Apple iPad Air 5 2022 | |
| Samsung Galaxy Tab S9+ | |
| Xiaomi Pad 6S Pro | |
| GFXBench 3.0 / Manhattan Onscreen OGL | |
| Xiaomi Pad 6S Pro | |
| Apple iPad Pro 11 2024 | |
| Samsung Galaxy Tab S9+ | |
| Apple iPad Air 5 2022 | |
| Apple iPad Air 11 2024 | |
| Apple iPad Air 13 2024 | |
| GFXBench 3.0 / 1080p Manhattan Offscreen | |
| Apple iPad Air 13 2024 | |
| Apple iPad Pro 11 2024 | |
| Apple iPad Air 11 2024 | |
| Samsung Galaxy Tab S9+ | |
| Apple iPad Air 5 2022 | |
| Xiaomi Pad 6S Pro | |
| GFXBench 3.1 / Manhattan ES 3.1 Onscreen | |
| Apple iPad Pro 11 2024 | |
| Samsung Galaxy Tab S9+ | |
| Xiaomi Pad 6S Pro | |
| Apple iPad Air 5 2022 | |
| Apple iPad Air 11 2024 | |
| Apple iPad Air 13 2024 | |
| GFXBench 3.1 / Manhattan ES 3.1 Offscreen | |
| Apple iPad Pro 11 2024 | |
| Apple iPad Air 13 2024 | |
| Apple iPad Air 11 2024 | |
| Apple iPad Air 5 2022 | |
| Samsung Galaxy Tab S9+ | |
| Xiaomi Pad 6S Pro | |
| GFXBench / Car Chase Onscreen | |
| Apple iPad Pro 11 2024 | |
| Samsung Galaxy Tab S9+ | |
| Apple iPad Air 5 2022 | |
| Apple iPad Air 11 2024 | |
| Apple iPad Air 13 2024 | |
| Xiaomi Pad 6S Pro | |
| GFXBench / Car Chase Offscreen | |
| Apple iPad Pro 11 2024 | |
| Apple iPad Air 13 2024 | |
| Apple iPad Air 11 2024 | |
| Apple iPad Air 5 2022 | |
| Samsung Galaxy Tab S9+ | |
| Xiaomi Pad 6S Pro | |
| GFXBench / Aztec Ruins High Tier Onscreen | |
| Apple iPad Pro 11 2024 | |
| Apple iPad Air 5 2022 | |
| Apple iPad Air 11 2024 | |
| Apple iPad Air 13 2024 | |
| Samsung Galaxy Tab S9+ | |
| Xiaomi Pad 6S Pro | |
| GFXBench / Aztec Ruins High Tier Offscreen | |
| Apple iPad Pro 11 2024 | |
| Apple iPad Air 13 2024 | |
| Apple iPad Air 11 2024 | |
| Samsung Galaxy Tab S9+ | |
| Apple iPad Air 5 2022 | |
| Xiaomi Pad 6S Pro | |
| GFXBench / Aztec Ruins Normal Tier Onscreen | |
| Apple iPad Pro 11 2024 | |
| Samsung Galaxy Tab S9+ | |
| Apple iPad Air 5 2022 | |
| Apple iPad Air 11 2024 | |
| Apple iPad Air 13 2024 | |
| Xiaomi Pad 6S Pro | |
| GFXBench / Aztec Ruins Normal Tier Offscreen | |
| Apple iPad Pro 11 2024 | |
| Apple iPad Air 13 2024 | |
| Apple iPad Air 11 2024 | |
| Samsung Galaxy Tab S9+ | |
| Apple iPad Air 5 2022 | |
| Xiaomi Pad 6S Pro | |
| GFXBench / 4K Aztec Ruins High Tier Offscreen | |
| Apple iPad Pro 11 2024 | |
| Apple iPad Air 13 2024 | |
| Apple iPad Air 11 2024 | |
| Samsung Galaxy Tab S9+ | |
| Xiaomi Pad 6S Pro | |
iPad Air 13 (2024) 的网站渲染速度非常快,考虑到它的性能,这并不令人意外。 Apple M2SoC 的性能。在浏览器基准测试中,该平板电脑的成绩明显领先于Android 的竞争对手。
| Jetstream 2 - 2.0 Total Score | |
| Apple iPad Pro 11 2024 (Safari 17) | |
| Apple iPad Air 11 2024 (Safari 17) | |
| Apple iPad Air 13 2024 (Safari 17) | |
| Average Apple M2 (220 - 257, n=9) | |
| Samsung Galaxy Tab S9+ (Chrome 117) | |
| Apple iPad Air 5 2022 (Safari 15) | |
| Xiaomi Pad 6S Pro (Chrome 125.0.6422.52) | |
| Average of class Tablet (19.9 - 393, n=70, last 2 years) | |
| WebXPRT 4 - Overall | |
| Apple iPad Air 13 2024 (Safari 17) | |
| Apple iPad Air 11 2024 | |
| Average Apple M2 (223 - 256, n=8) | |
| Samsung Galaxy Tab S9+ (Chrome 117) | |
| Xiaomi Pad 6S Pro (Chrome 125.0.6422.52) | |
| Average of class Tablet (21 - 315, n=68, last 2 years) | |
| WebXPRT 3 - Overall | |
| Apple iPad Pro 11 2024 (Safari 17) | |
| Average Apple M2 (342 - 387, n=8) | |
| Apple iPad Air 13 2024 (Safari 17) | |
| Apple iPad Air 5 2022 (Safari 15) | |
| Samsung Galaxy Tab S9+ (Chrome 117) | |
| Xiaomi Pad 6S Pro (Chrome 125.0.6422.52) | |
| Average of class Tablet (36 - 435, n=40, last 2 years) | |
| Speedometer 2.0 - Result | |
| Apple iPad Pro 11 2024 (Safari 17) | |
| Apple iPad Air 13 2024 (Safari 17) | |
| Apple iPad Air 11 2024 (Safari 17) | |
| Apple iPad Air 11 2024 | |
| Average Apple M2 (437 - 445, n=10) | |
| Apple iPad Air 5 2022 (Safari 15) | |
| Xiaomi Pad 6S Pro (Chrome 125.0.6422.52) | |
| Samsung Galaxy Tab S9+ (Chrome 117) | |
| Average of class Tablet (2.59 - 572, n=64, last 2 years) | |
| Octane V2 - Total Score | |
| Apple iPad Pro 11 2024 (Safari 17) | |
| Apple iPad Air 13 2024 (Safari 17) | |
| Apple iPad Air 11 2024 (Safari 17) | |
| Average Apple M2 (72484 - 78736, n=9) | |
| Apple iPad Air 5 2022 (Safari 15) | |
| Samsung Galaxy Tab S9+ (Chrome 117) | |
| Xiaomi Pad 6S Pro (Chrome 125.0.6422.52) | |
| Average of class Tablet (763 - 111219, n=91, last 2 years) | |
| Mozilla Kraken 1.1 - Total | |
| Average of class Tablet (319 - 34733, n=77, last 2 years) | |
| Samsung Galaxy Tab S9+ (Chrome 117) | |
| Xiaomi Pad 6S Pro (Chrome 125.0.6422.52) | |
| Apple iPad Air 5 2022 (Safari 15) | |
| Average Apple M2 (440 - 467, n=9) | |
| Apple iPad Air 11 2024 (Safari 17) | |
| Apple iPad Air 13 2024 (Safari 17) | |
| Apple iPad Pro 11 2024 (Safari 17) | |
* ... smaller is better
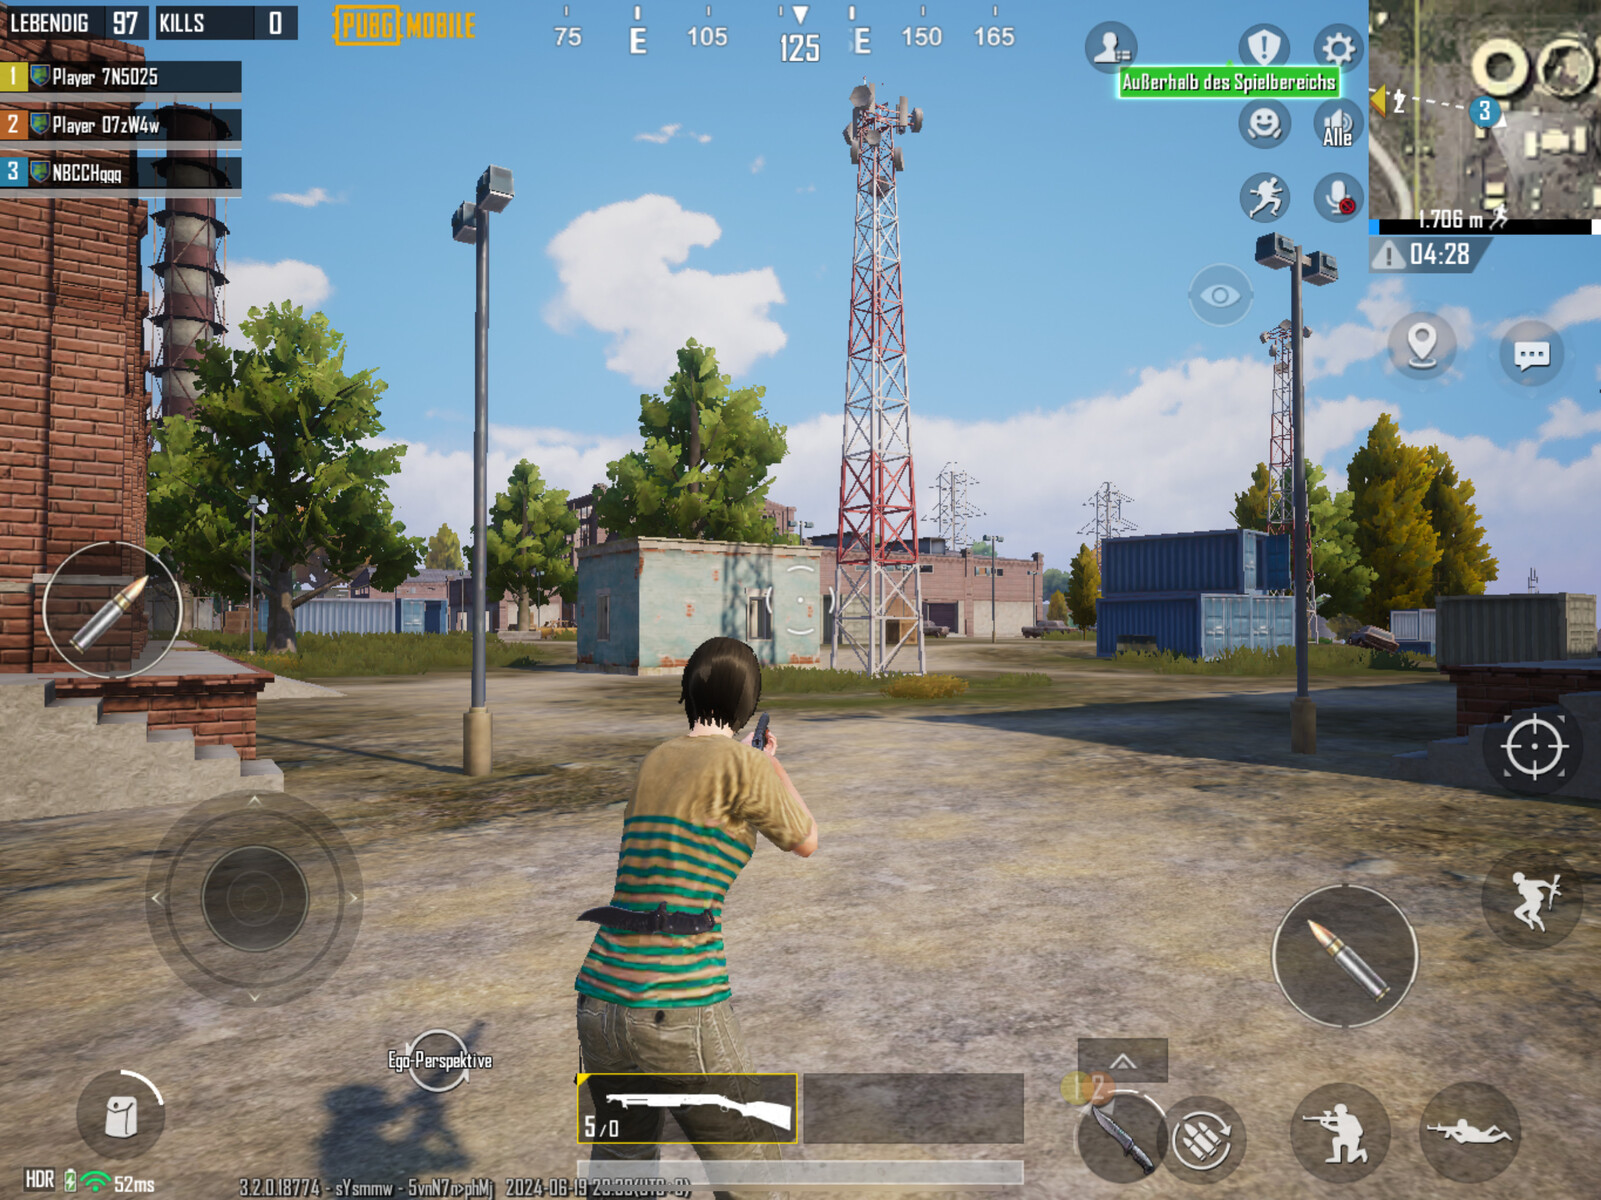
游戏 - 功能强大的游戏平板电脑
iPad Air 13 (2024) 非常适合玩游戏,即使是《PUBG Mobile》或《Genshin Impact》等对图形要求很高的游戏,在高细节设置下也能流畅运行。目前,App Store 中可能还没有一款游戏能真正将平板电脑的性能发挥到极致。我们通常会使用 Gamebench 测试工具对游戏性能进行额外的评估,以测量实际帧率,但 iOS 17.5 目前无法做到这一点。

Emissions - 音效震撼的立体声扬声器
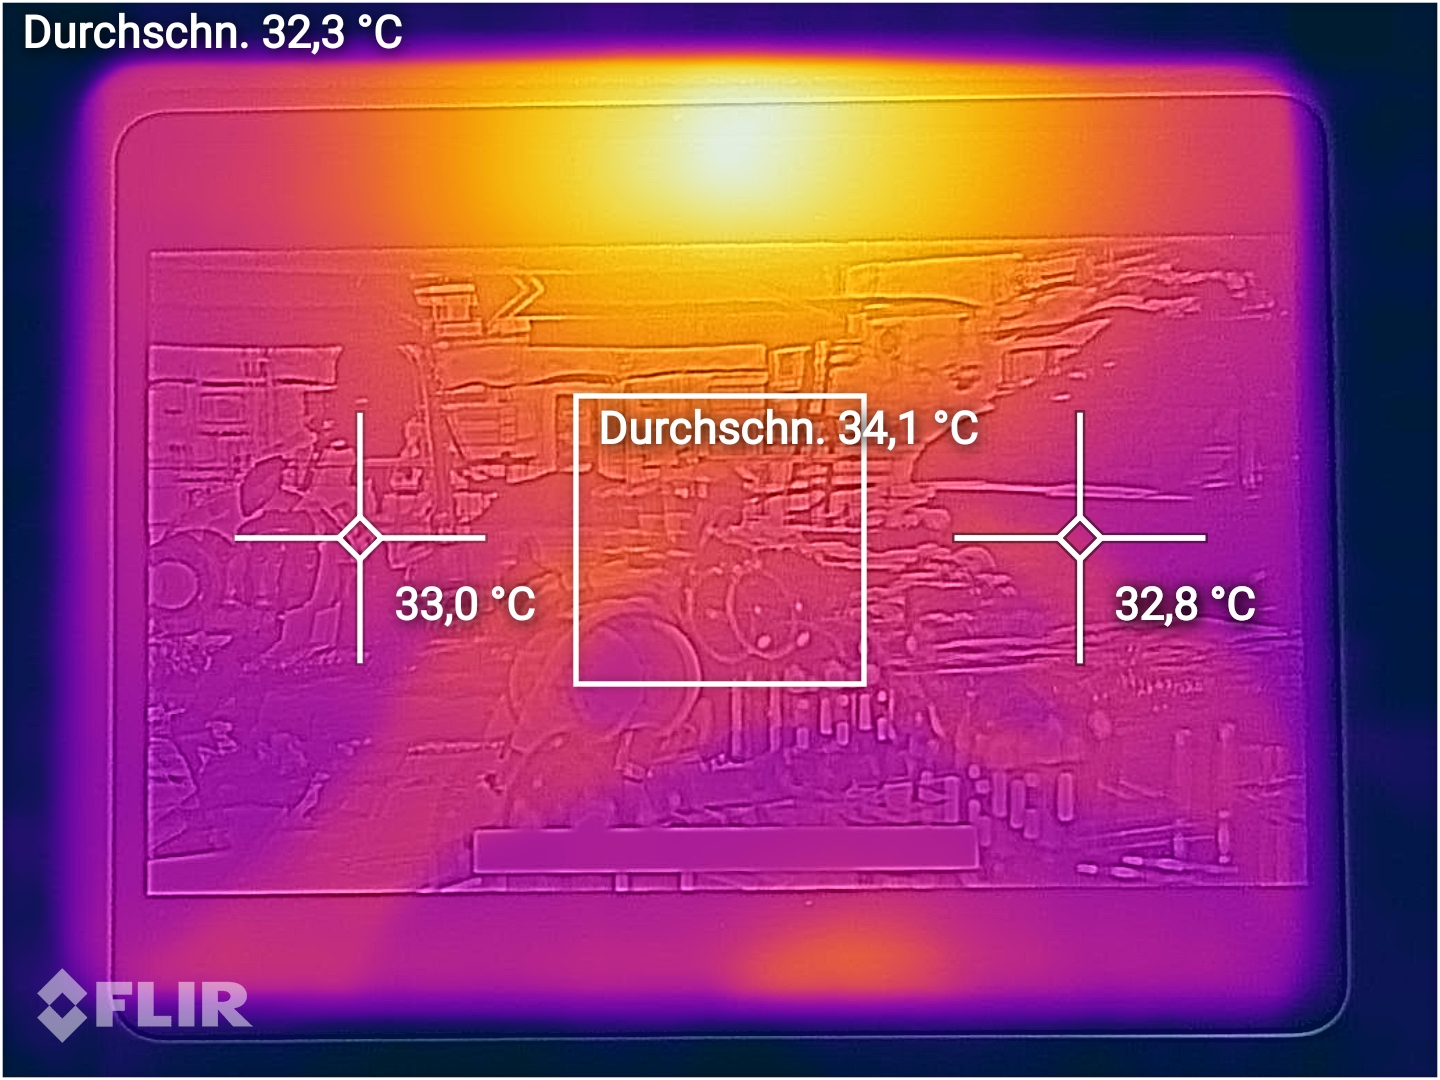
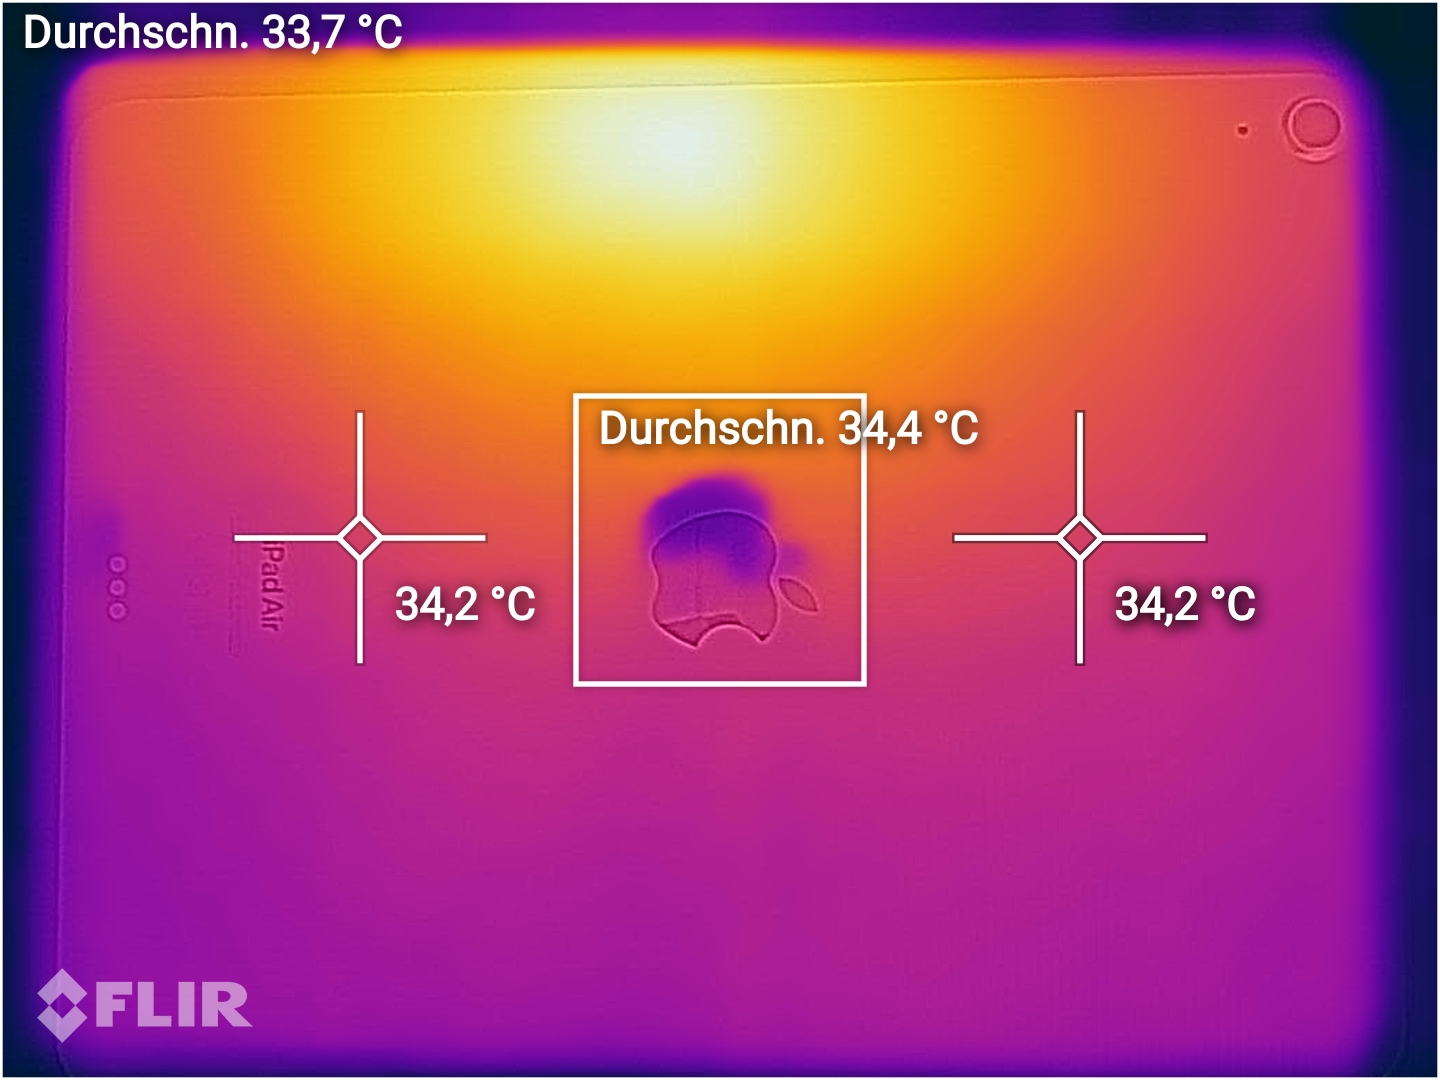
温度
许多功能强大的平板电脑只能在短时间内发挥全部性能,然后 SoC 功耗就会因散热原因而下降。3DMark 的压力测试表明,iPad Air 13 (2024) 也会出现这种情况。不过,即使在这种节流情况下,平板电脑仍能提供足够的性能储备,在日常操作中也不会明显感觉到性能下降。尤其是,iPad Air 13 (2024) 即使在负载情况下,也几乎不会有超过手掌的温度。我们在平板电脑背面的热点测得的温度为 41.7 °C(107 °F)。
(±) The maximum temperature on the upper side is 40.6 °C / 105 F, compared to the average of 33.7 °C / 93 F, ranging from 20.7 to 53.2 °C for the class Tablet.
(±) The bottom heats up to a maximum of 41.7 °C / 107 F, compared to the average of 33.2 °C / 92 F
(±) In idle usage, the average temperature for the upper side is 32.9 °C / 91 F, compared to the device average of 30 °C / 86 F.
3DMark Wild Life Stress Test
| 3DMark | |
| Wild Life Extreme Stress Test | |
| Xiaomi Pad 6S Pro | |
| Samsung Galaxy Tab S9+ | |
| Apple iPad Pro 11 2024 | |
| Apple iPad Air 5 2022 | |
| Apple iPad Air 11 2024 | |
| Apple iPad Air 13 2024 | |
| Wild Life Stress Test Stability | |
| Apple iPad Pro 11 2024 | |
| Apple iPad Air 11 2024 | |
| Apple iPad Air 13 2024 | |
| Xiaomi Pad 6S Pro | |
| Samsung Galaxy Tab S9+ | |
| Solar Bay Stress Test Stability | |
| Samsung Galaxy Tab S9+ | |
| Xiaomi Pad 6S Pro | |
| Apple iPad Pro 11 2024 | |
| Apple iPad Air 11 2024 | |
| Apple iPad Air 13 2024 | |
发言人
Apple 平板电脑通过四个扬声器开口输出立体声,每个短边两个。尽管与其他移动设备一样,它很难发出真正的低音,但我们并没有看到太多抱怨的理由,因为这款平板电脑的声音均衡而饱满。不过,除了 AAC 和 SBC 外,它几乎不支持任何其他蓝牙音频编解码器。
Apple iPad Air 13 2024 audio analysis
(±) | speaker loudness is average but good (80.1 dB)
Bass 100 - 315 Hz
(±) | reduced bass - on average 6.6% lower than median
(±) | linearity of bass is average (13.8% delta to prev. frequency)
Mids 400 - 2000 Hz
(+) | balanced mids - only 3.7% away from median
(+) | mids are linear (6.3% delta to prev. frequency)
Highs 2 - 16 kHz
(+) | balanced highs - only 2.4% away from median
(+) | highs are linear (2.6% delta to prev. frequency)
Overall 100 - 16.000 Hz
(+) | overall sound is linear (10.4% difference to median)
Compared to same class
» 6% of all tested devices in this class were better, 3% similar, 91% worse
» The best had a delta of 7%, average was 21%, worst was 129%
Compared to all devices tested
» 4% of all tested devices were better, 1% similar, 94% worse
» The best had a delta of 4%, average was 24%, worst was 134%
Samsung Galaxy Tab S9+ audio analysis
(+) | speakers can play relatively loud (82.2 dB)
Bass 100 - 315 Hz
(±) | reduced bass - on average 12.3% lower than median
(±) | linearity of bass is average (7.6% delta to prev. frequency)
Mids 400 - 2000 Hz
(+) | balanced mids - only 2% away from median
(+) | mids are linear (4.2% delta to prev. frequency)
Highs 2 - 16 kHz
(+) | balanced highs - only 4.1% away from median
(+) | highs are linear (6.2% delta to prev. frequency)
Overall 100 - 16.000 Hz
(+) | overall sound is linear (11.9% difference to median)
Compared to same class
» 13% of all tested devices in this class were better, 4% similar, 83% worse
» The best had a delta of 7%, average was 21%, worst was 129%
Compared to all devices tested
» 8% of all tested devices were better, 2% similar, 90% worse
» The best had a delta of 4%, average was 24%, worst was 134%
电源管理 - 2.5 小时内完全充电
耗电量
iPad Air 13 (2024) 的 36.59 瓦时电池最高可以 20 瓦特的功率充电,但你必须自己找到相应的充电器。在我们的测试中,这款Apple 平板电脑似乎并不太挑剔,能够从不同制造商生产的充电器中获得 20 瓦的最大充电功率。完全充满电池大约需要 2.5 小时。
在空闲运行时,Apple 平板电脑显得很耗电,比类似尺寸的对比设备(如 三星Galaxy Tab S9+或 小米 Pad 6S Pro.在负载情况下,它的表现并不突出,尽管它仍能从电池中消耗高达 16.8 瓦的电量,这并没有留下多少电力储备。
| Off / Standby | |
| Idle | |
| Load |
|
Key:
min: | |
| Apple iPad Air 13 2024 mAh | Apple iPad Air 5 2022 mAh | Apple iPad Air 11 2024 mAh | Apple iPad Pro 11 2024 8340 mAh | Samsung Galaxy Tab S9+ 10090 mAh | Xiaomi Pad 6S Pro 10000 mAh | |
|---|---|---|---|---|---|---|
| Power Consumption | 16% | 27% | -3% | 14% | 14% | |
| Idle Minimum * | 2.23 | 1.65 26% | 1.5 33% | 3.5 -57% | 3.4 -52% | 1.22 45% |
| Idle Average * | 8.45 | 8.1 4% | 3.6 57% | 4.8 43% | 3.6 57% | 7.18 15% |
| Idle Maximum * | 8.53 | 9.4 -10% | 4.6 46% | 5.9 31% | 3.9 54% | 8.22 4% |
| Load Average * | 12.52 | 9.5 24% | 12.8 -2% | 15.6 -25% | 11.7 7% | 13.63 -9% |
| Load Maximum * | 16.76 | 10.4 38% | 16.8 -0% | 17.6 -5% | 15.8 6% | 14.56 13% |
* ... smaller is better
Power Consumption: Geekbench (150 cd/m²)
Power Consumption: GFXBench (150 cd/m²)
电池寿命
iPad Air 13 (2024) 的 36.59 瓦时电池续航时间不错。在我们进行的实际无线局域网测试和持续循环播放视频时,它的续航时间分别为 13 小时左右。因此,它的续航时间刚刚超过其 11 英寸机型的续航时间也略长于 12.4 英寸的 三星Galaxy Tab S9+.
| Apple iPad Air 13 2024 mAh | Apple iPad Air 5 2022 mAh | Apple iPad Air 11 2024 mAh | Apple iPad Pro 11 2024 8340 mAh | Samsung Galaxy Tab S9+ 10090 mAh | Xiaomi Pad 6S Pro 10000 mAh | |
|---|---|---|---|---|---|---|
| Battery Runtime | -13% | -9% | 23% | -9% | 19% | |
| Reader / Idle | 1519 | 1508 -1% | 2253 48% | 996 -34% | 2565 69% | |
| H.264 | 783 | 768 -2% | 966 23% | 693 -11% | 773 -1% | |
| WiFi v1.3 | 771 | 646 -16% | 683 -11% | 911 18% | 584 -24% | 959 24% |
| Load | 272 | 245 -10% | 211 -22% | 276 1% | 365 34% | 224 -18% |
Pros
Cons
Apple iPad Air 13 (2024) 的结论

Apple iPad Air 13 (2024) 的问世开辟了新天地,因为在此之前,13 英寸平板电脑只有 Pro 系列才有。凭借其 Apple M2SoC 系统芯片,第六代 iPad Air 还可作为 iPad Pro 的替代品,因为它能提供出色的性能,轻松将Android 竞争对手远远甩在身后。此外,这款 13 英寸平板电脑还拥有明亮的 IPS 显示屏、良好的电池续航能力和现代化的连接功能。
然而,除了更大的外形尺寸外,从11 英寸的前身 ,几乎没有任何升级的理由,因为其余的创新仅限于细节,如更先进的蓝牙版本、更符合人体工程学的自拍摄像头位置以及支持Apple Pencil Pro。仅仅为了更高的性能而升级并不值得。Apple M1 的前代产品已经提供了非常高的性能,在接受 App Store 中任何应用程序的挑战时,仍然很难达到其极限。
第六代 iPad Air 首次推出了 13 英寸版本,其Apple M2 可提供更强的性能。除此之外,iPad Air 与前代产品相比并无太大变化。
对于 iPad Air,Apple 也面临着一个两难的选择,那就是不能把平板电脑做得太好,因为它不应该在自己的地盘上与 iPad Pro 竞争。因此,那些希望获得 OLED 面板、120 赫兹刷新率和 Face ID 等 Pro 功能的用户不得不花更多钱购买 iPad Pro。相比之下,iPad Air 13(2024 年)的价格要比 iPad Pro 便宜几百欧元,后者 13 英寸版本的起价为 1549 欧元(美国为 1299 美元),如果考虑到 Magic Keyboard 等配件,价格很快就会突破 2000 欧元大关。
如果不一定非要使用Apple 平板电脑,Android 方面也有很多不错的替代品,尽管功能不是很强大。其中包括 三星Galaxy Tab S9+和 小米 Pad 6S Pro等。这两款 12.4 英寸平板电脑的部分配置都明显优于 iPad Air 13(2024)。
价格和供应情况
Apple iPad Air 13 (2024) 在美国的建议零售价为 799 美元起,可直接从制造商处购买或从亚马逊等其他销售商处购买,769 美元起。
请注意,我们已经更新了评级系统,第 8 版的结果与第 7 版的结果不具可比性。您可以在 这里.
Apple iPad Air 13 2024
- 06/27/2024 v8
Manuel Masiero
 Total Sustainability Score:
 Transparency
The selection of devices to be reviewed is made by our editorial team. The test sample was provided to the author as a loan by the manufacturer or retailer for the purpose of this review. The lender had no influence on this review, nor did the manufacturer receive a copy of this review before publication. There was no obligation to publish this review. We never accept compensation or payment in return for our reviews. As an independent media company, Notebookcheck is not subjected to the authority of manufacturers, retailers or publishers.
This is how Notebookcheck is testing
Every year, Notebookcheck independently reviews hundreds of laptops and smartphones using standardized procedures to ensure that all results are comparable. We have continuously developed our test methods for around 20 years and set industry standards in the process. In our test labs, high-quality measuring equipment is utilized by experienced technicians and editors. These tests involve a multi-stage validation process. Our complex rating system is based on hundreds of well-founded measurements and benchmarks, which maintains objectivity. Further information on our test methods can be found here.
Price comparison

