

戴尔 Inspiron 16 Plus 7630 笔记本电脑评测:60 WGeForce RTX 4060 并不差

2023 戴尔 Inspiron 16 Plus 7630 继承了去年的2022 Inspiron 16 Plus 7620 ,更新了内部和外观,尽管事实上 2022 机型已经是对2021 Inspiron 16 Plus 7610 的全面重新设计。连续三年对一个系列进行三次重大重新设计的情况并不多见,因为制造商通常每隔几年才会对外观进行一次修改。与 2023 年的其他多媒体笔记本电脑一样,Inspiron 16 Plus 7630 配备了英特尔第 13 代 Raptor Lake-H CPU 和 Nvidia Ada Lovelace GPU。
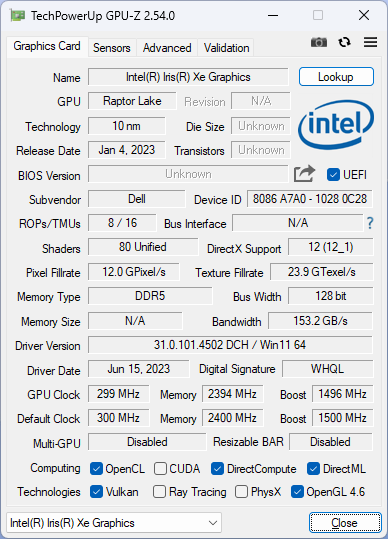
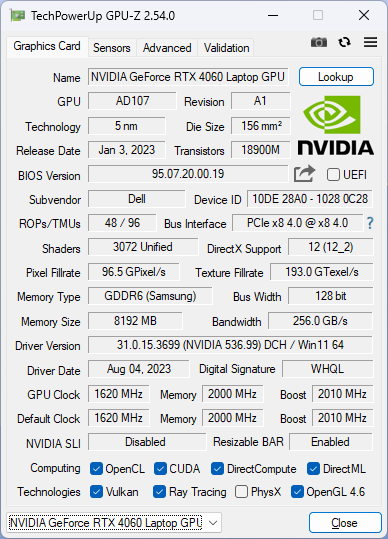
我们的评测机是高端配置,配备酷睿 i7-13700H CPU、GeForce RTX 4060 GPU 和 2560 x 1600 120 Hz IPS 显示屏,售价约为 1250 美元。搭载酷睿 i5-13500H、集成虹膜 Xe、RTX 3050、RTX 4050 或 1200p 60 Hz 显示屏的低配产品正在开发中。此外,还计划推出配备 Ryzen 5 7640HS 和 Ryzen 7 7840HS 的 AMD 机型,型号为 Inspiron 16 Plus 7635。
Inspiron 16 Plus 7630 的替代产品包括其他 16 英寸多媒体笔记本电脑,如Lenovo Slim Pro 9i 16,Asus VivoBook Pro 16X,HP Envy 16, 或MSI Summit E16 Flip 。Inspiron 16 Plus 7630 不应与速度较慢的标准 Inspiron 16 或Inspiron 16 Plus 7630 二合一 混淆,它们的规格和功能截然不同。
更多戴尔评论:
潜在的竞争对手比较
Rating | Date | Model | Weight | Height | Size | Resolution | Price |
|---|---|---|---|---|---|---|---|
| 87.1 % v7 (old) | 08 / 2023 | Dell Inspiron 16 Plus 7630 i7-13700H, NVIDIA GeForce RTX 4060 Laptop GPU | 2.2 kg | 19.95 mm | 16.00" | 2560x1600 | |
| 87.4 % v7 (old) | 08 / 2022 | Dell Inspiron 16 Plus 7620 i7-12700H, GeForce RTX 3050 Ti Laptop GPU | 2.1 kg | 18.99 mm | 16.00" | 3072x1920 | |
| 88 % v7 (old) | 08 / 2023 | Lenovo Slim Pro 9i 16IRP8 i9-13905H, NVIDIA GeForce RTX 4050 Laptop GPU | 2.2 kg | 18.2 mm | 16.00" | 3200x2000 | |
| 86.2 % v7 (old) | 07 / 2023 | Asus Vivobook Pro 16X K6604JV-MX016W i9-13980HX, NVIDIA GeForce RTX 4060 Laptop GPU | 2.1 kg | 22.8 mm | 16.00" | 3200x2000 | |
| 86.9 % v7 (old) | 09 / 2022 | HP Envy 16 h0112nr i7-12700H, GeForce RTX 3060 Laptop GPU | 2.3 kg | 19.8 mm | 16.00" | 3840x2400 | |
| 84.2 % v7 (old) | 10 / 2022 | MSI Summit E16 Flip A12UDT-031 i7-1280P, GeForce RTX 3050 Ti Laptop GPU | 1.9 kg | 16.85 mm | 16.00" | 2560x1600 |
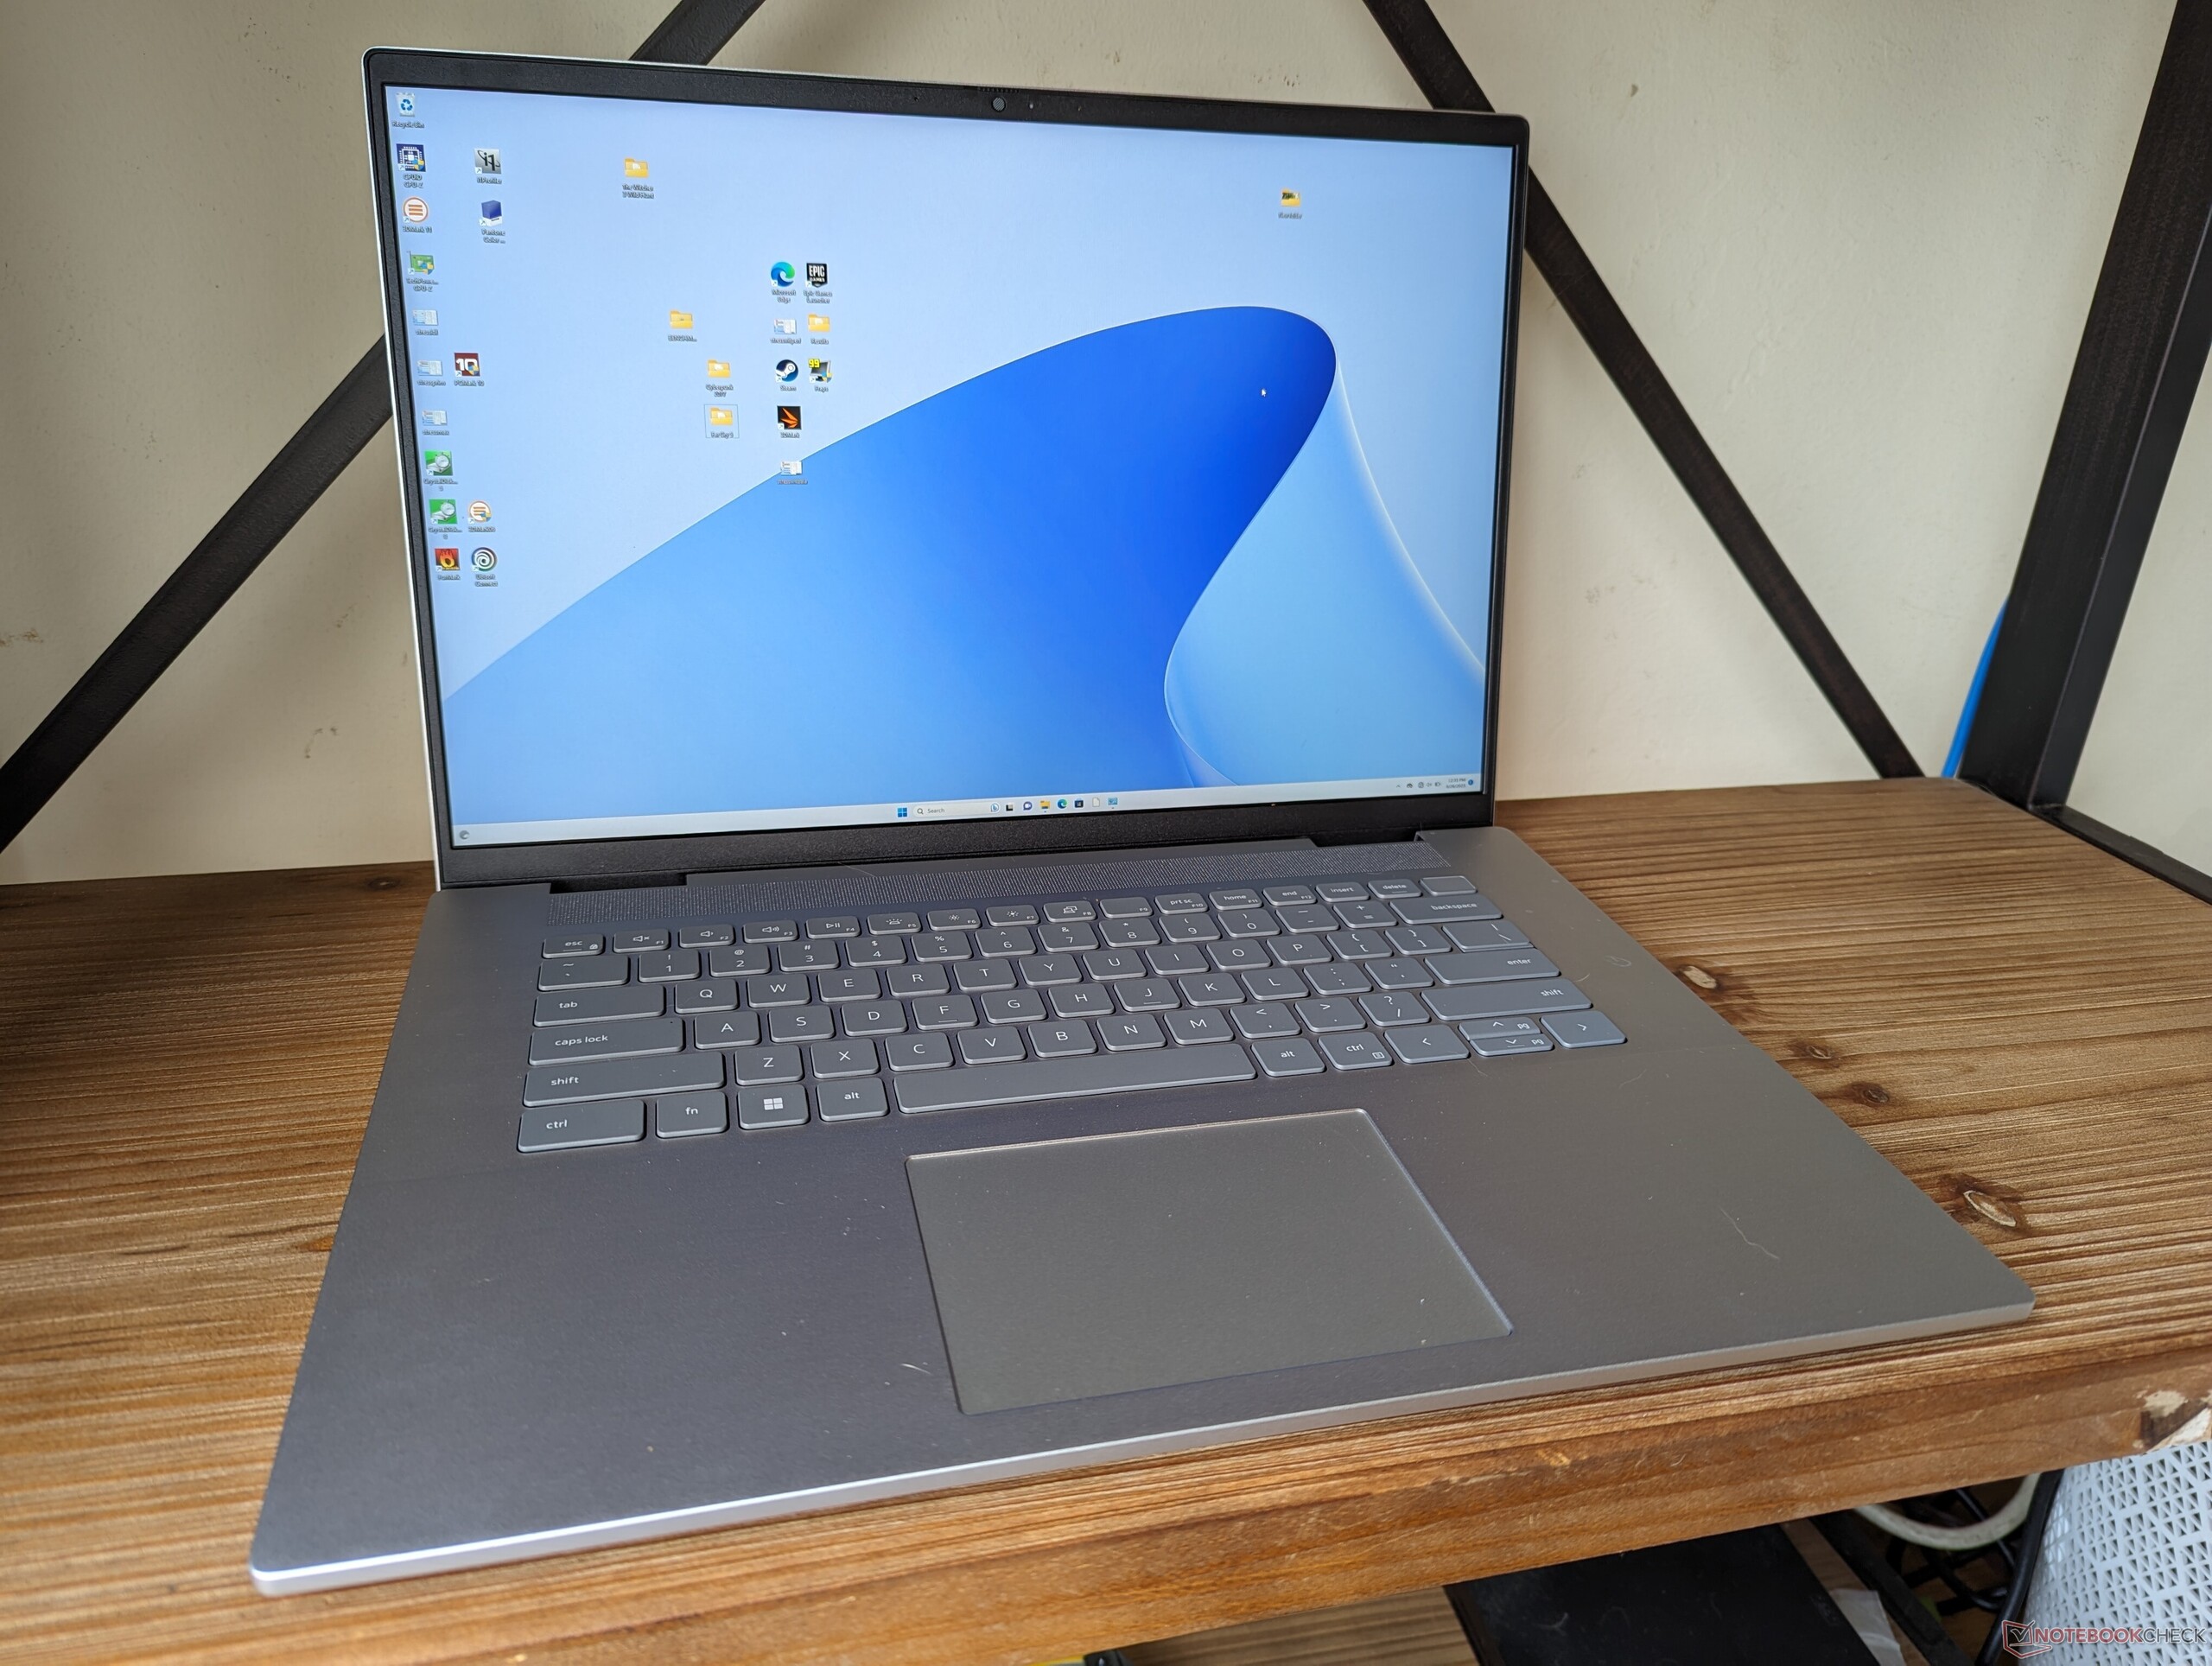
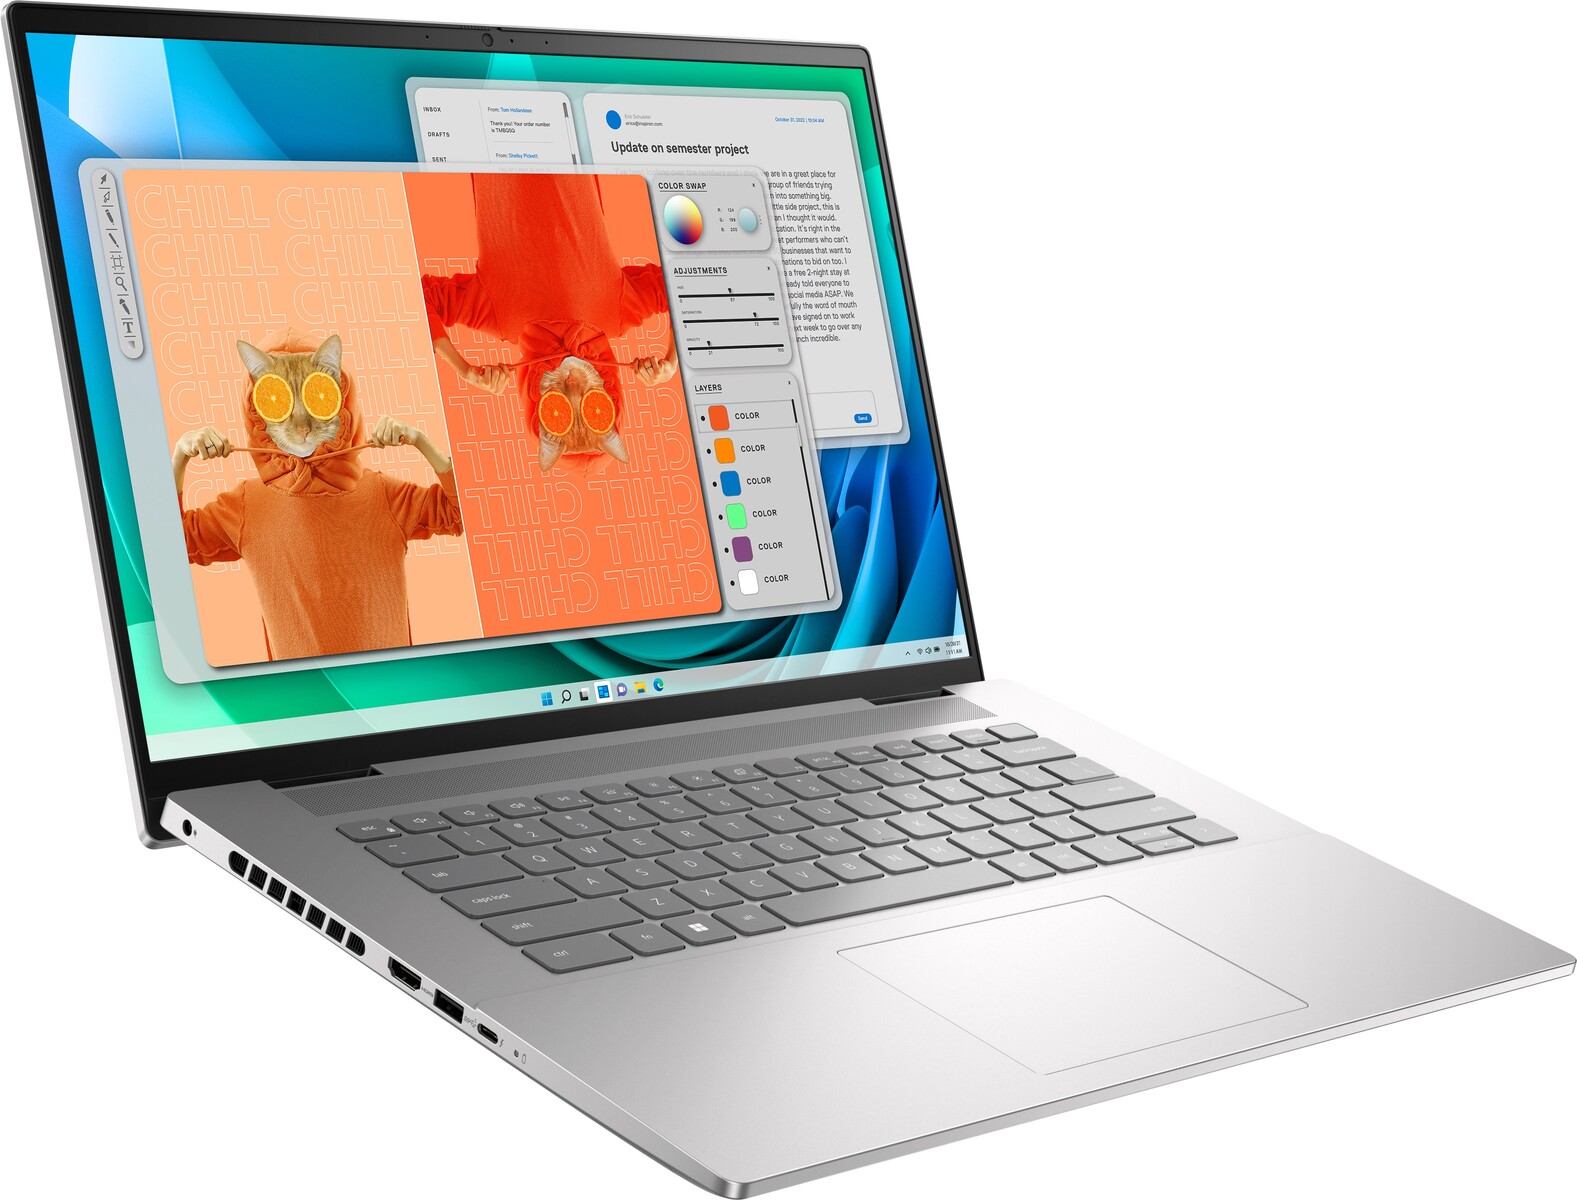
案例 - 保持简单
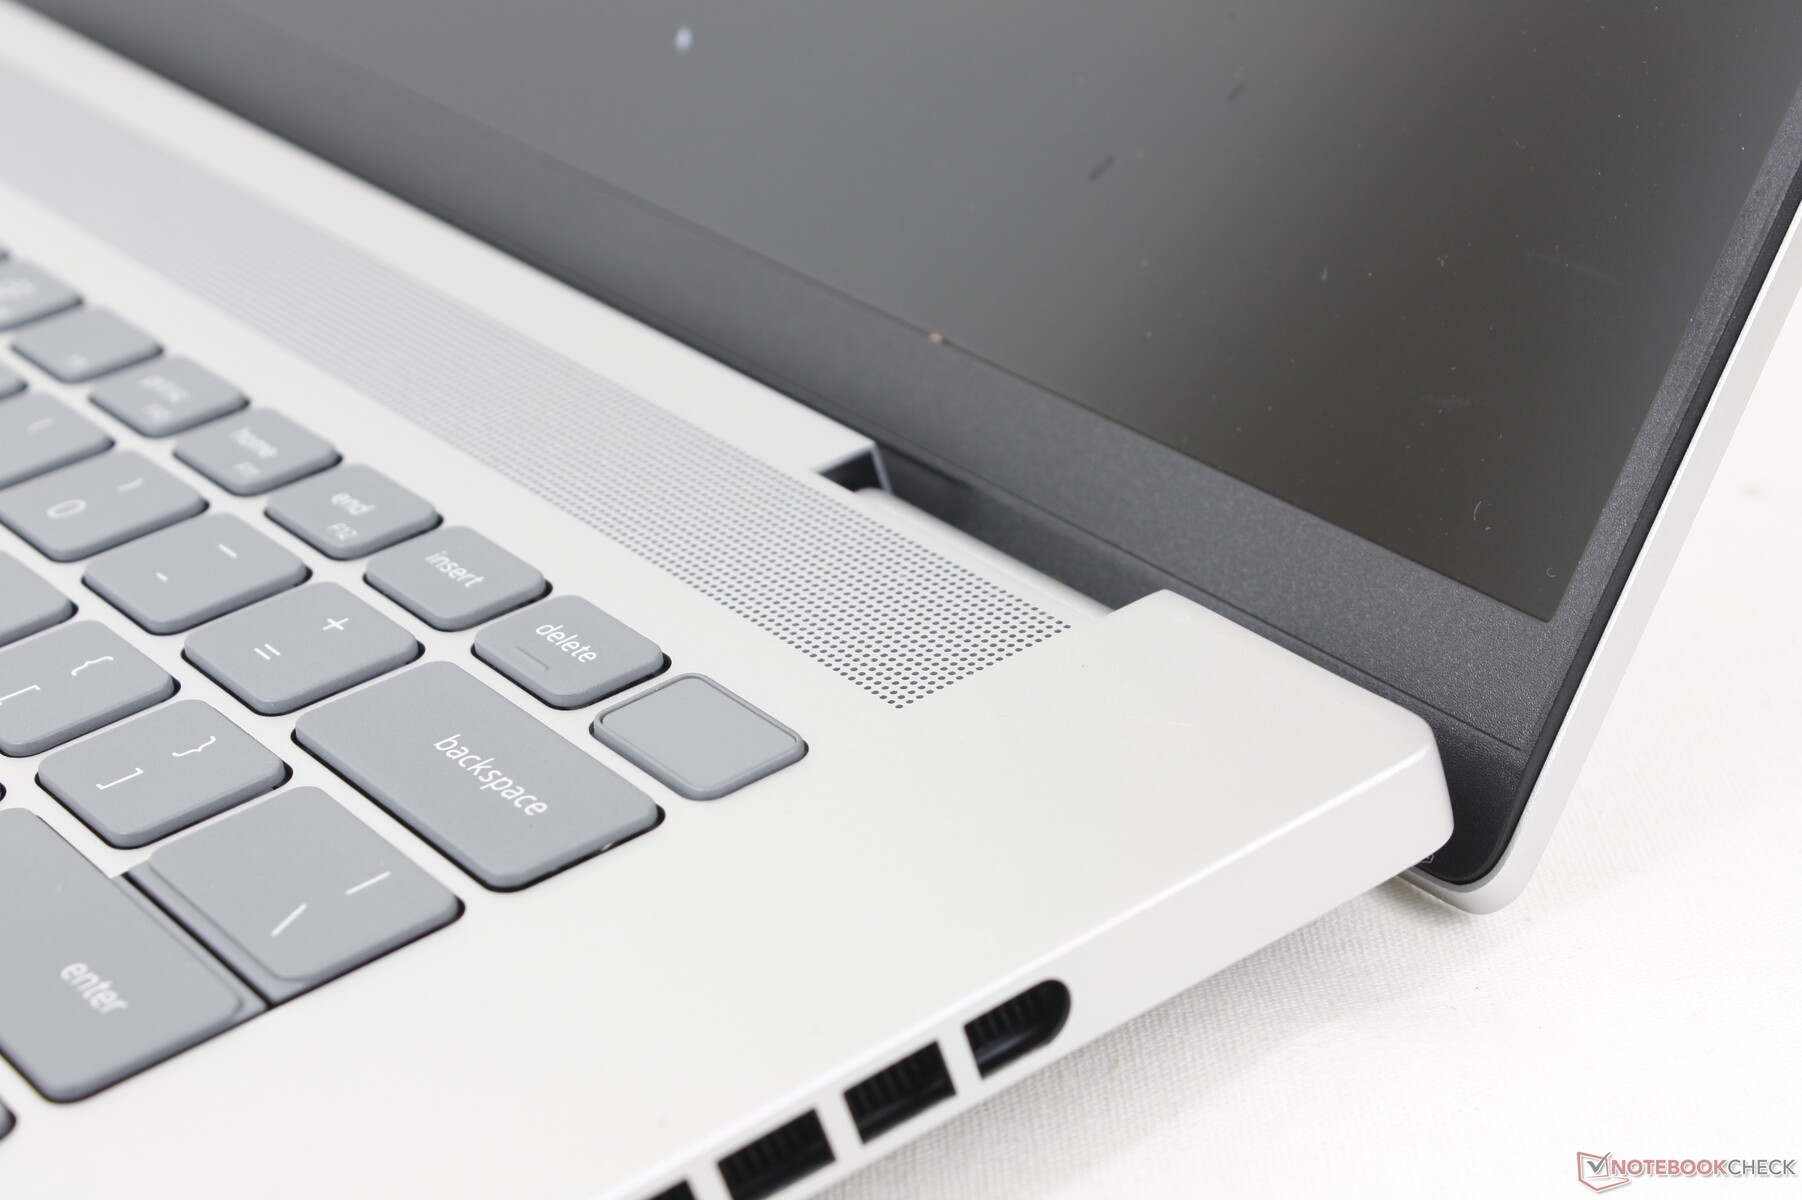
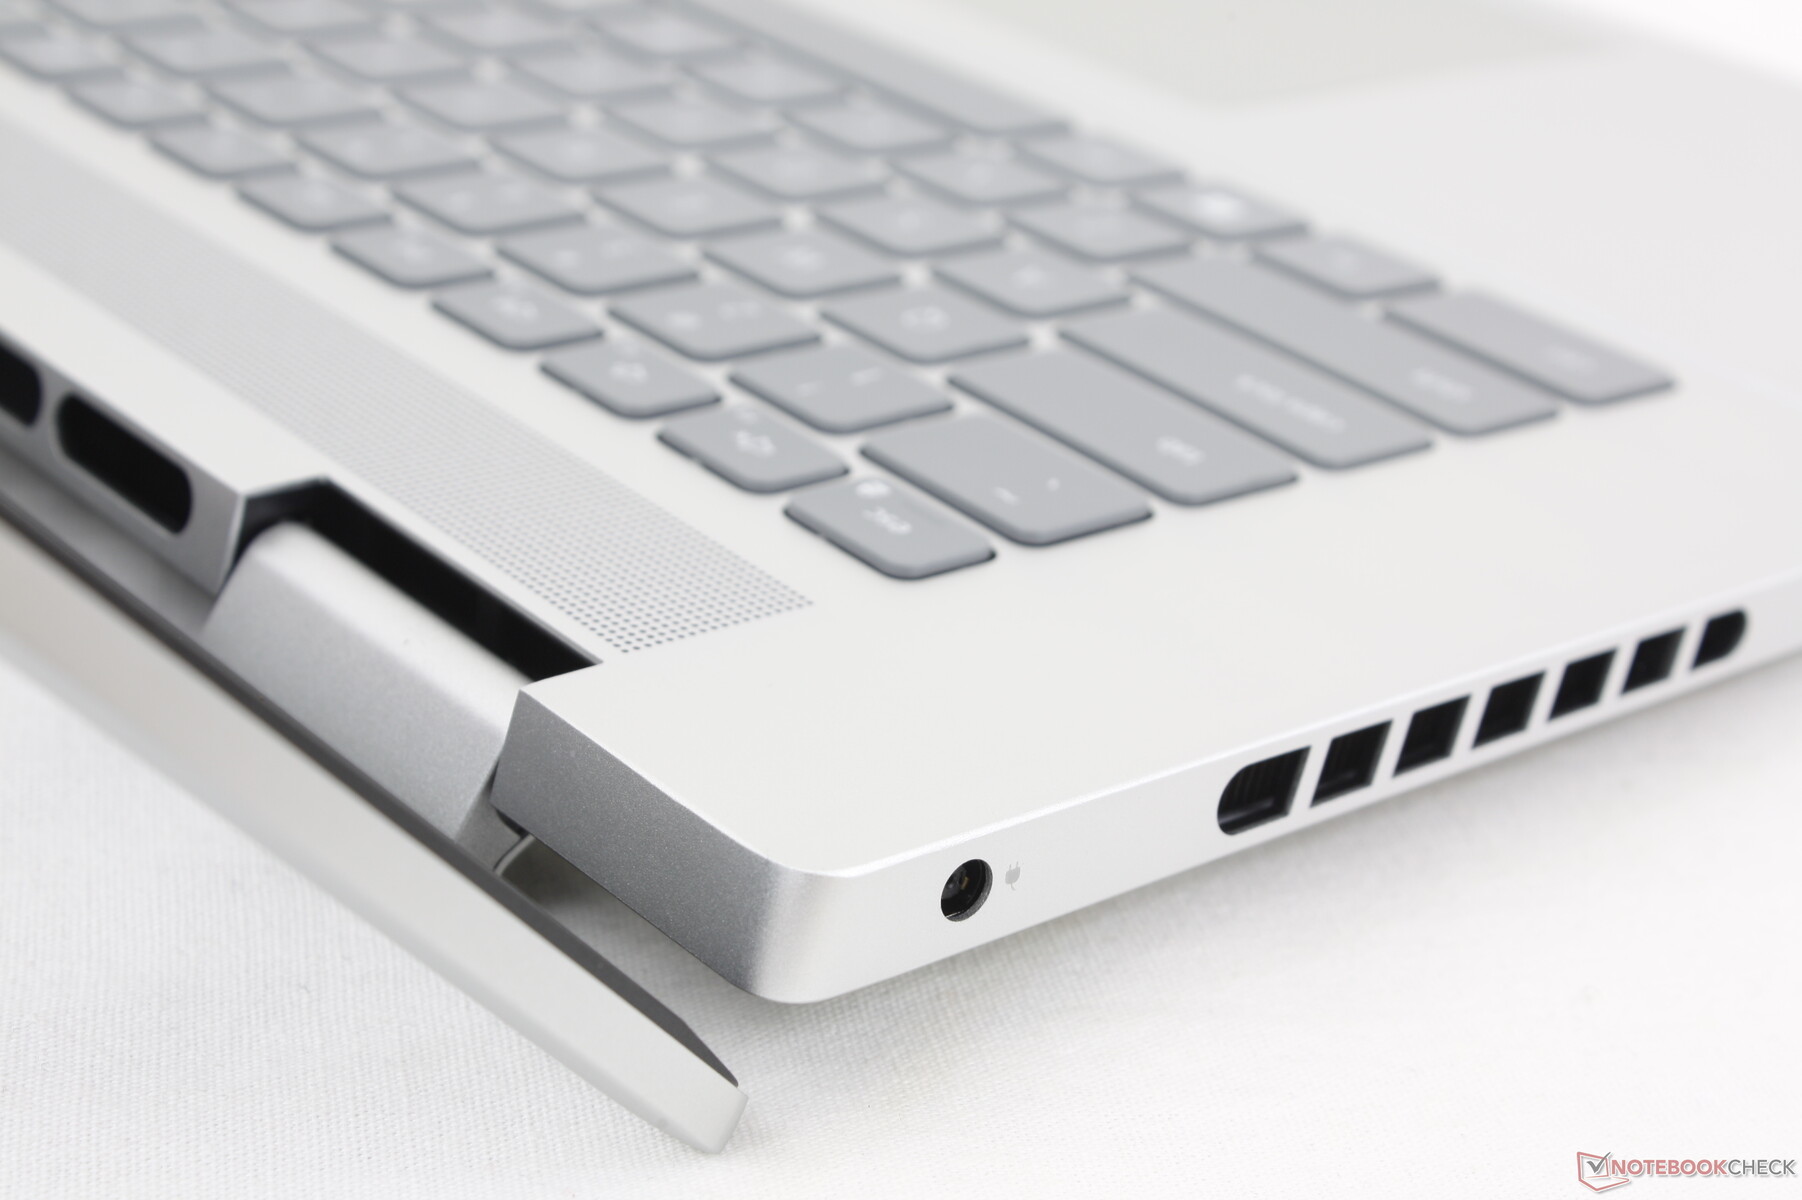
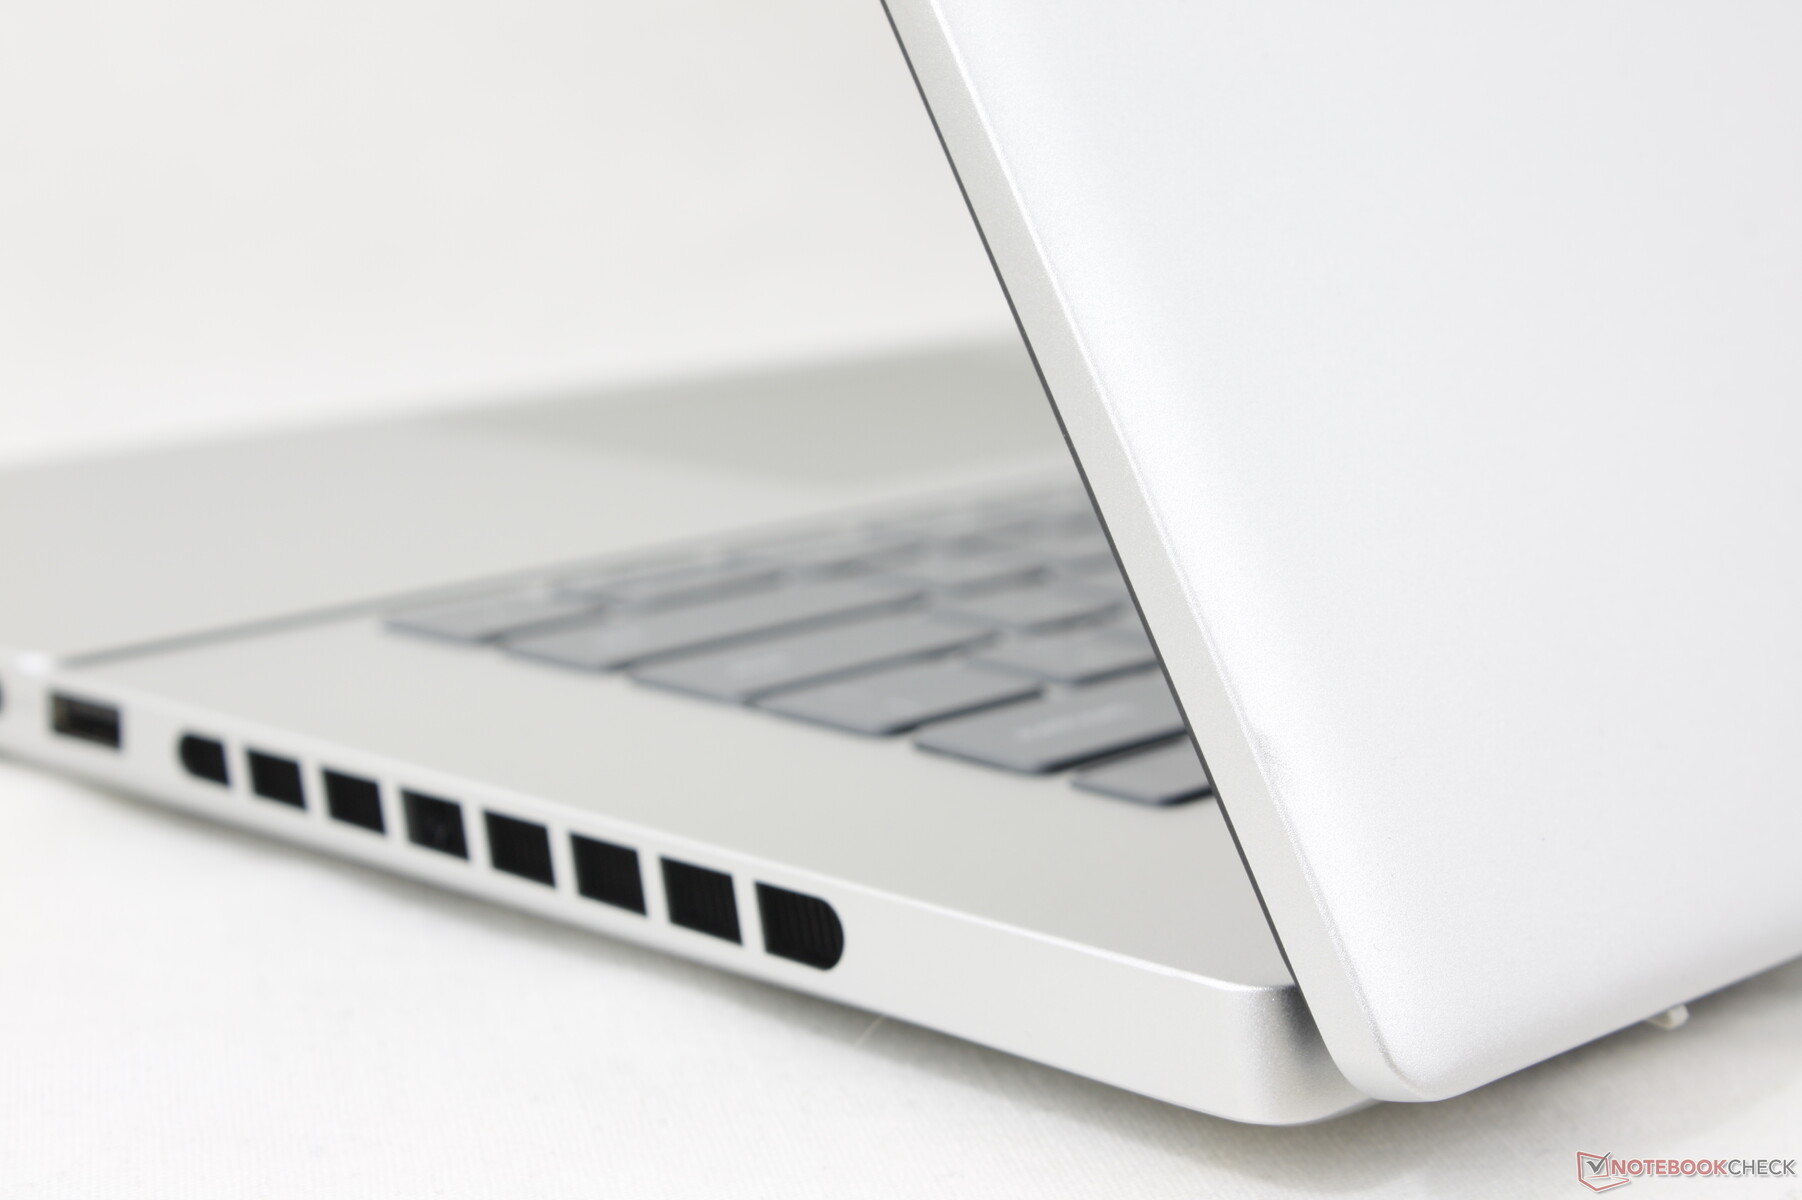
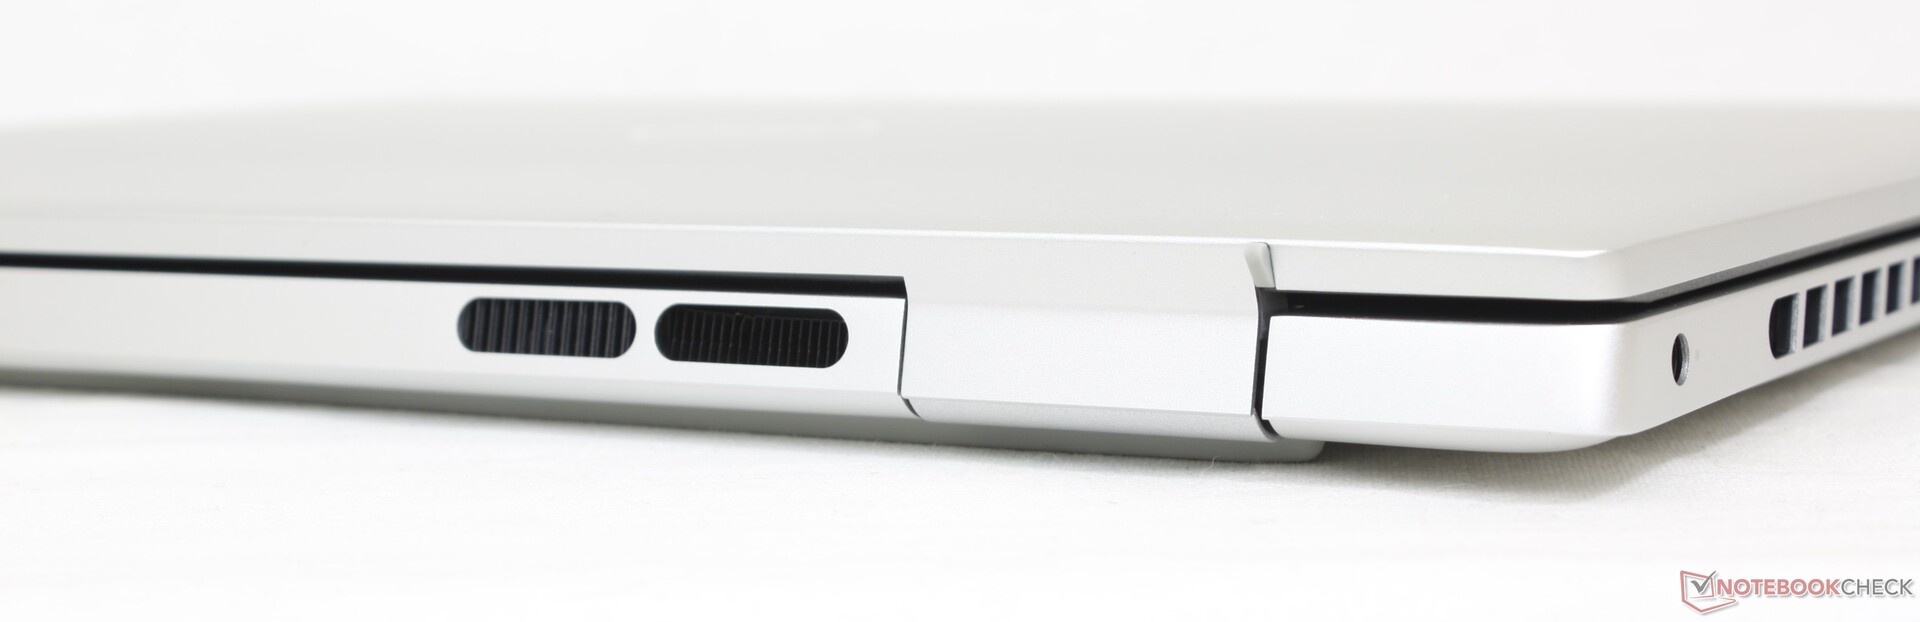
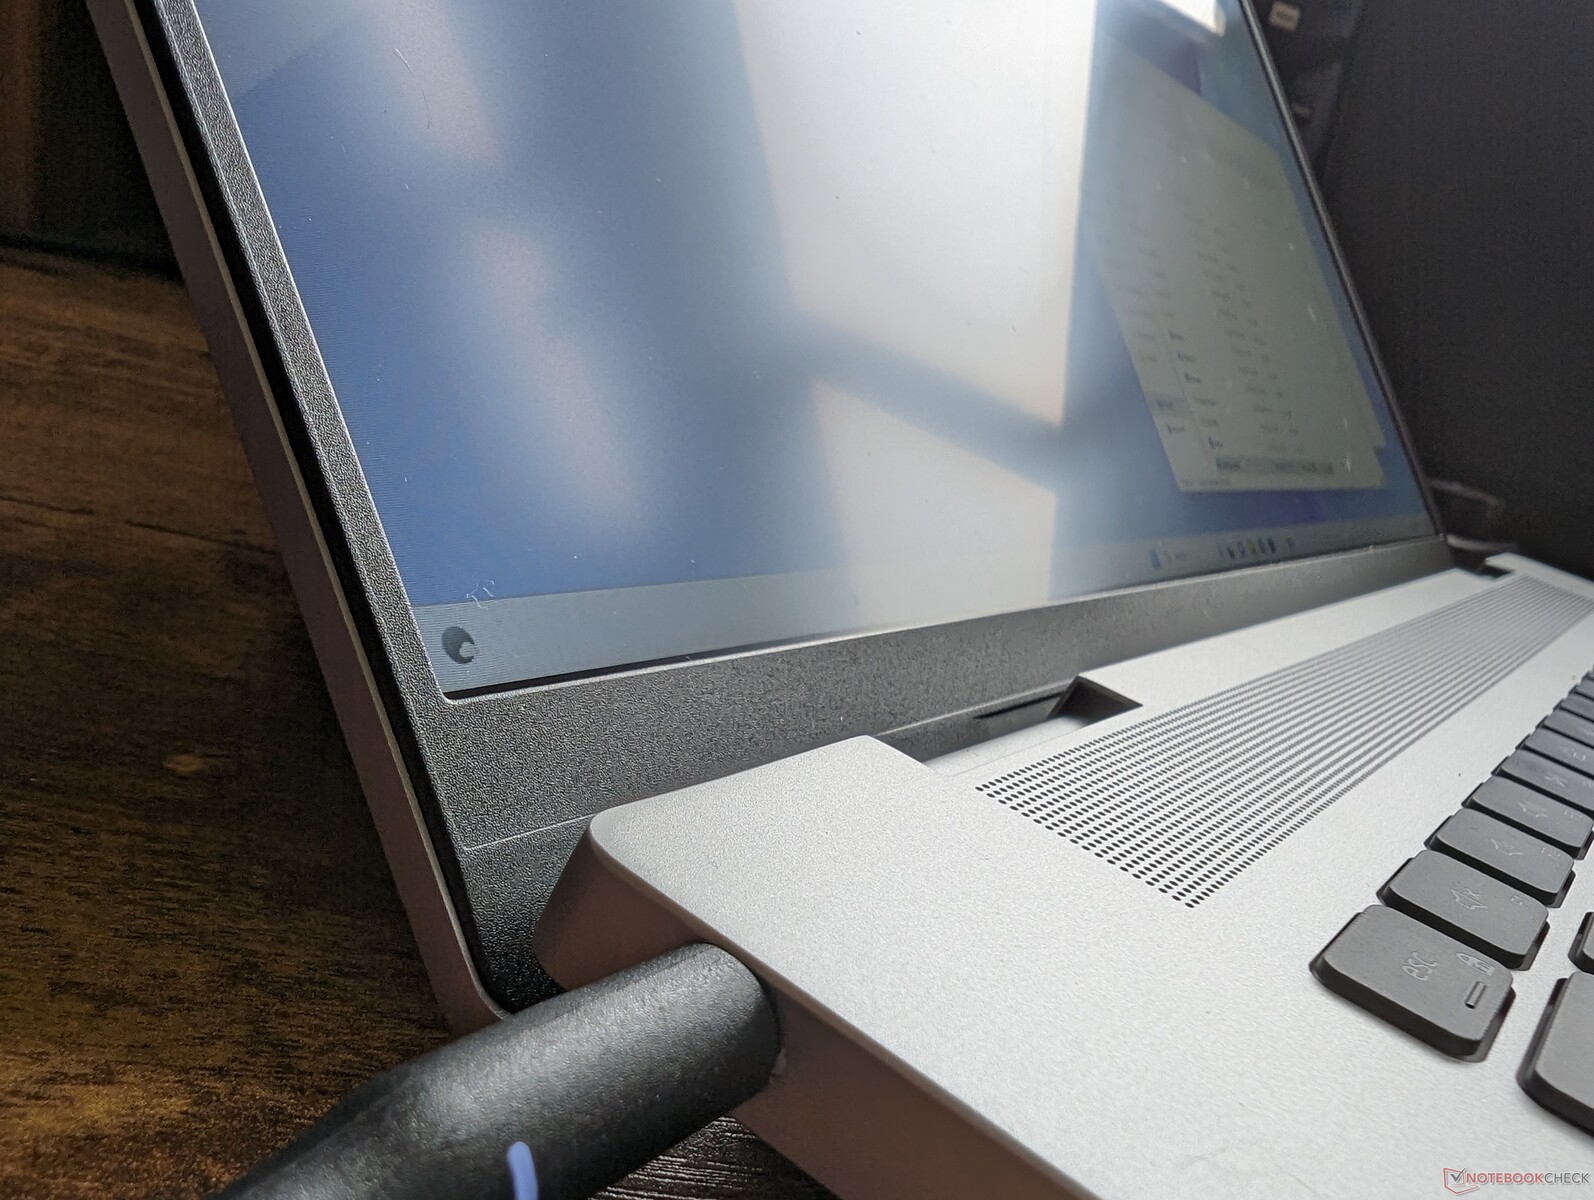
与去年的机型相比,Inspiron 16 Plus 7630 在外观上有三个显著的变化。首先,或许也是最重要的一点,铰链经过重新设计,比以前更厚、更结实。其次,机身边缘增加了通风栅,有助于散热。最后,与 Inspiron 16 Plus 7635 二合一机型一样,Mylar 掌托和点击板也被移除。前两项措施有望延长系统的使用寿命,而最后一项可能是为了节约成本。
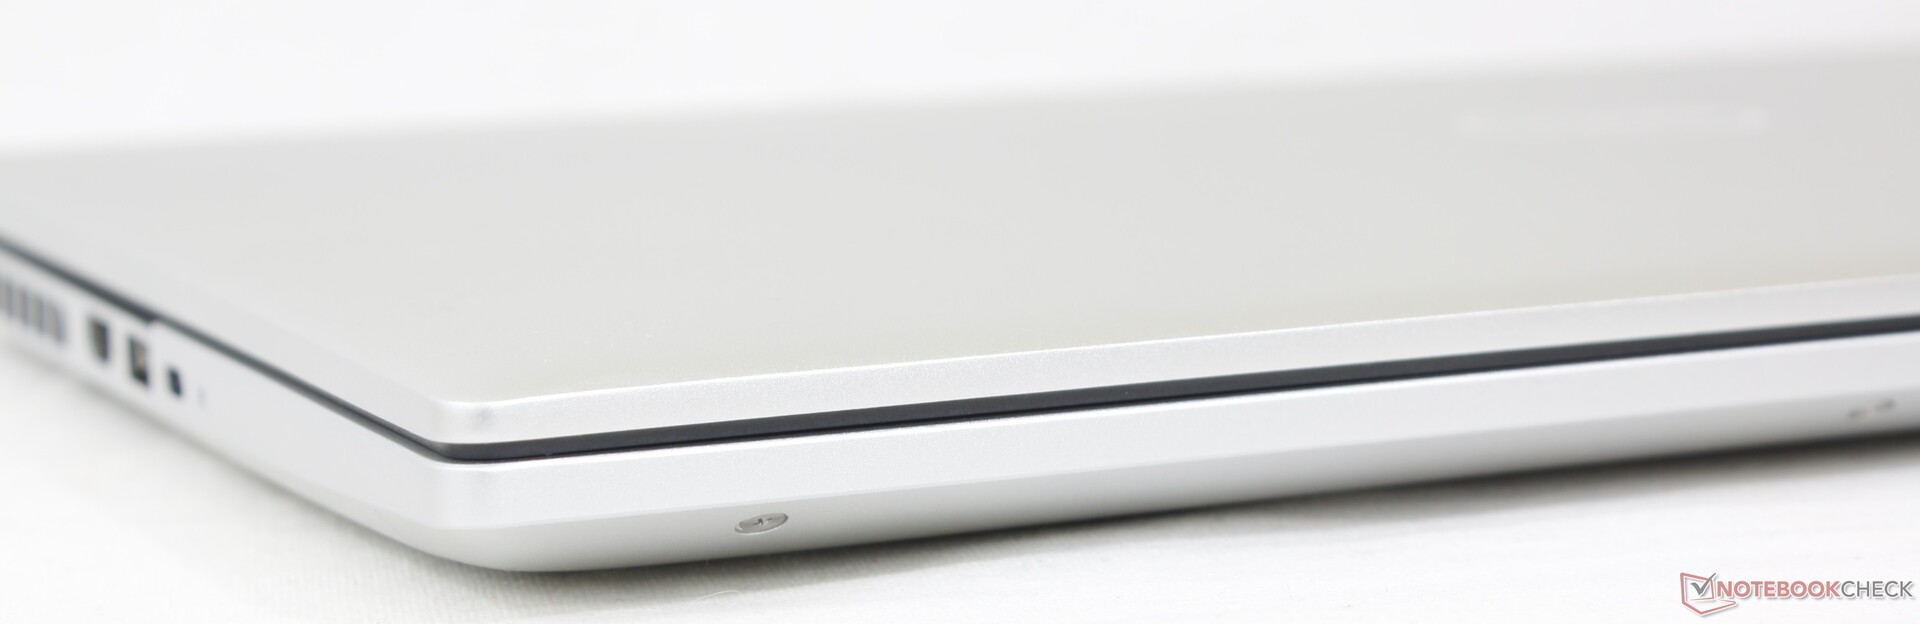
由于采用了相同的材料,机箱的整体刚性与 Inspiron 16 Plus 7620 大致相同。该设备的手感与 Envy 16但由于戴尔没有采用大猩猩玻璃加固,因此盖子的强度稍弱。
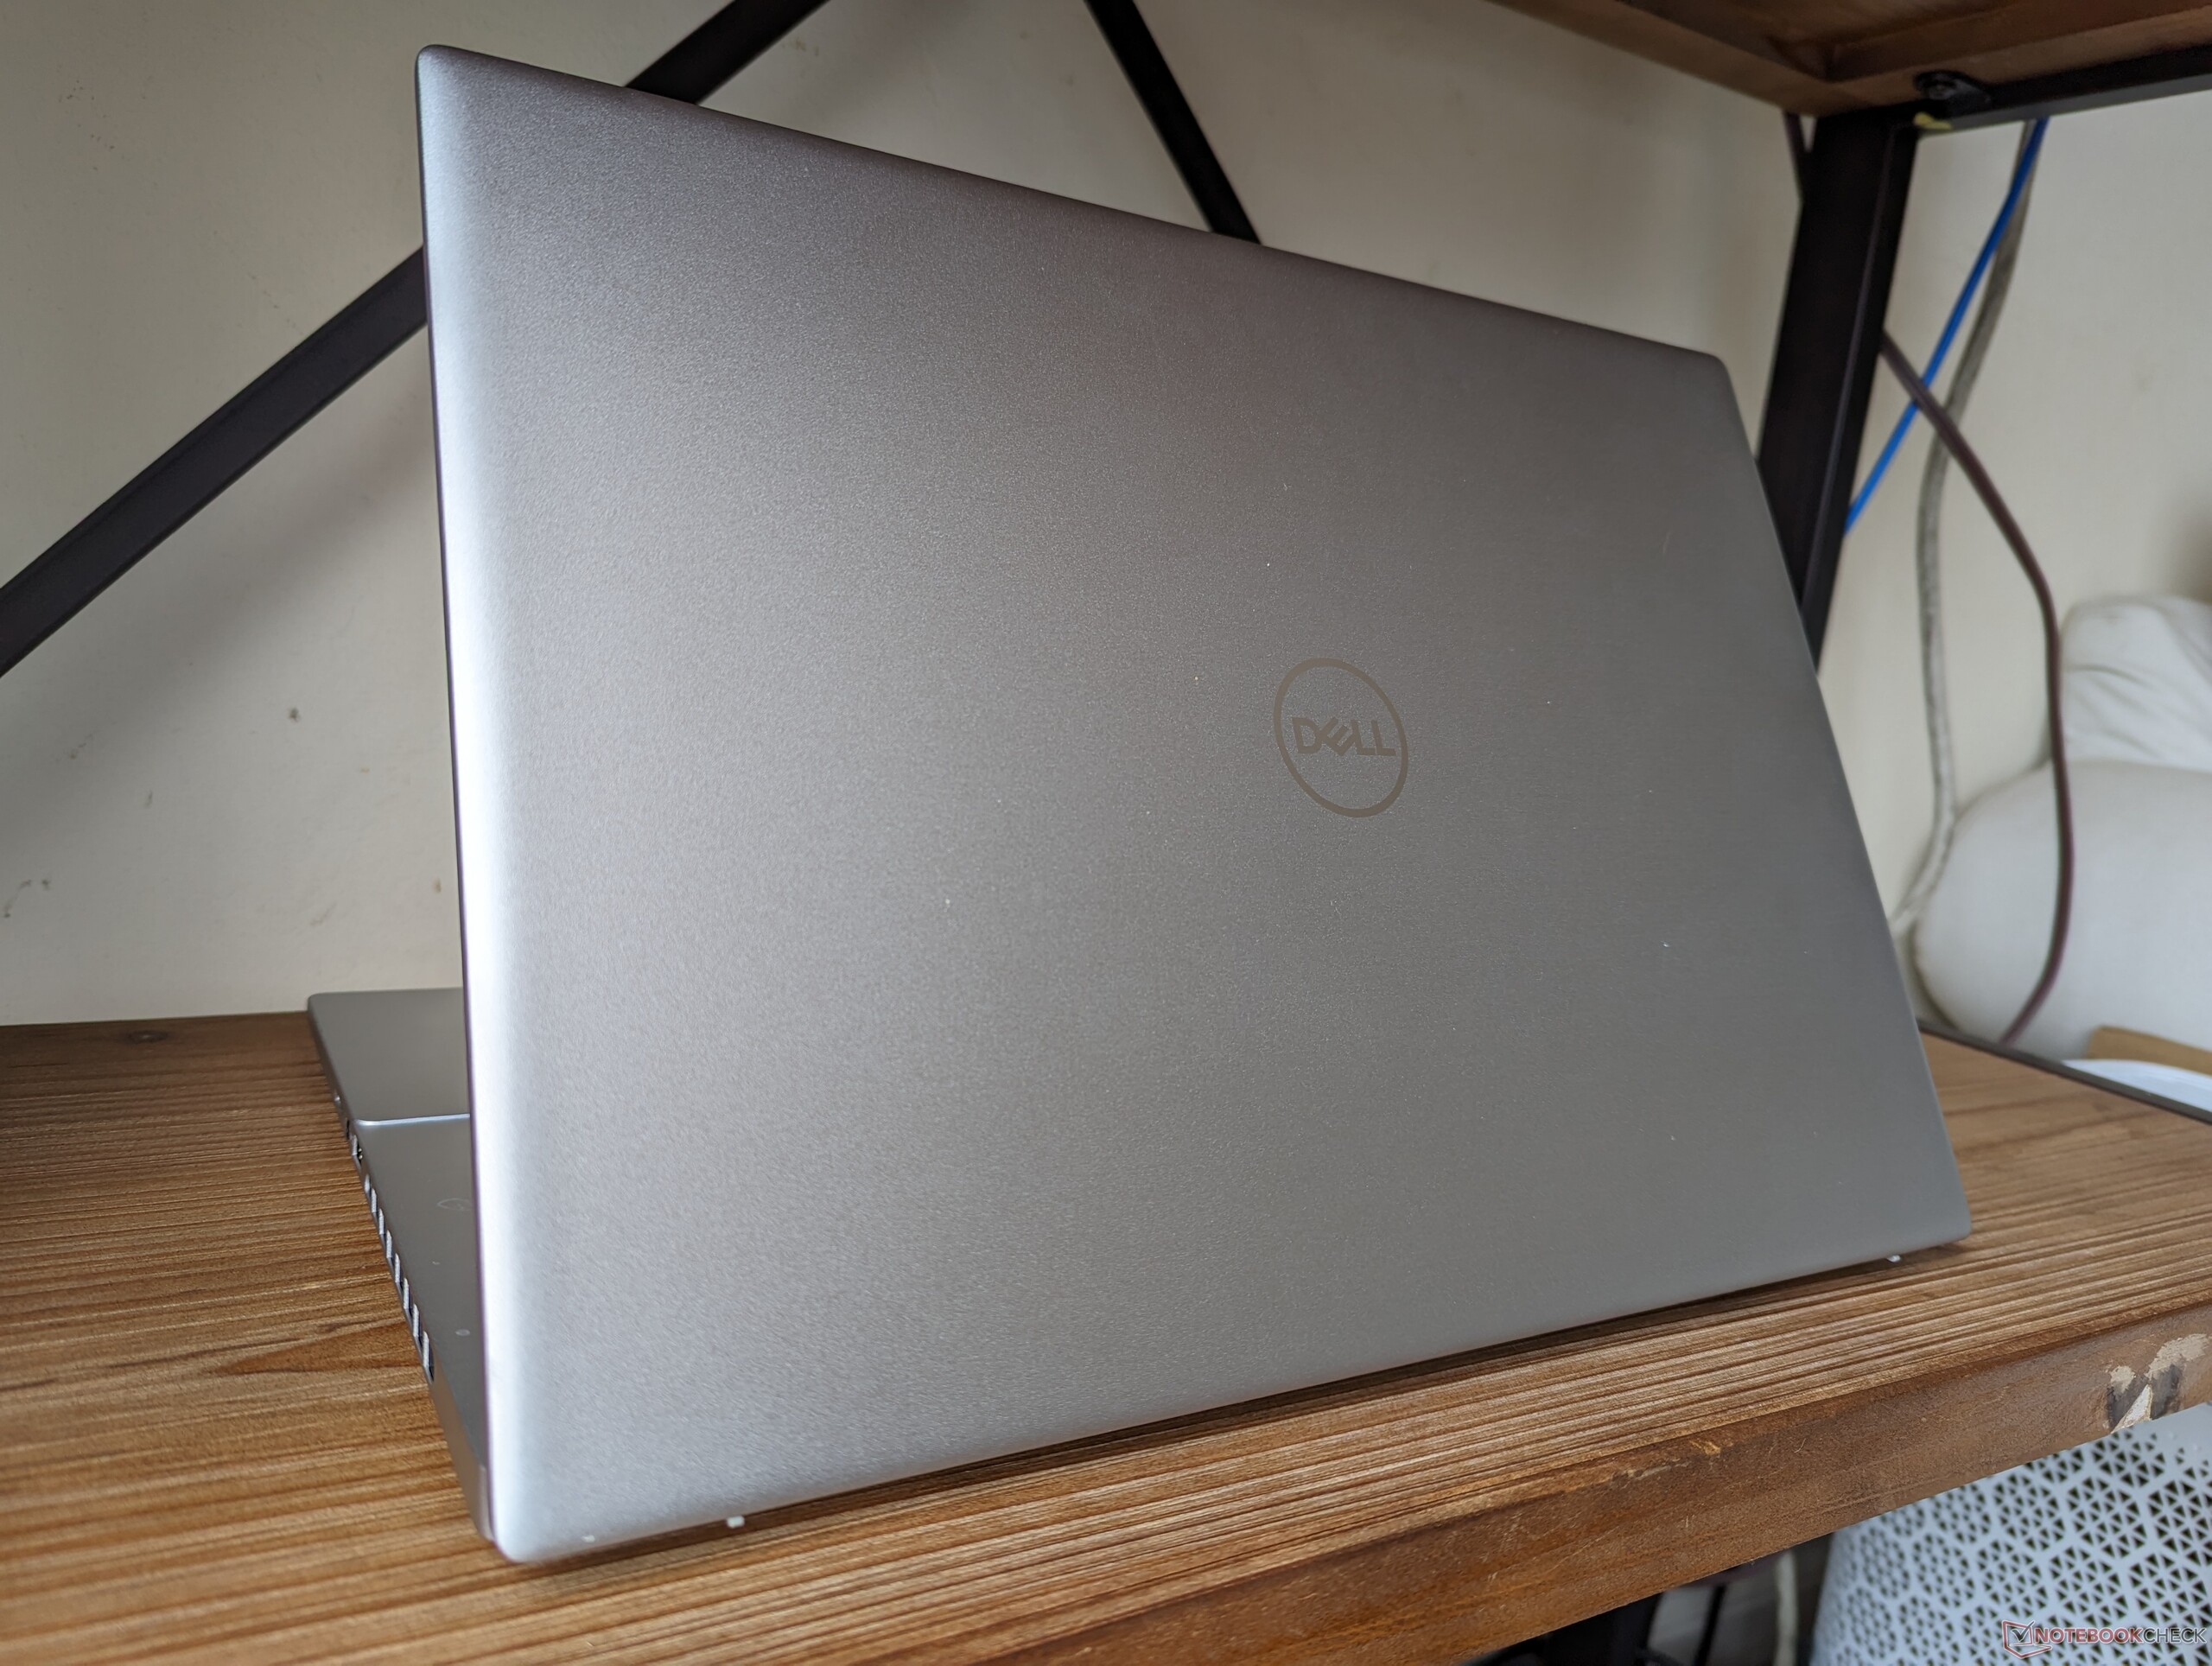
尺寸和重量与去年的设计大致相同,只是略重了约 100 克。 Envy 16等产品相比。
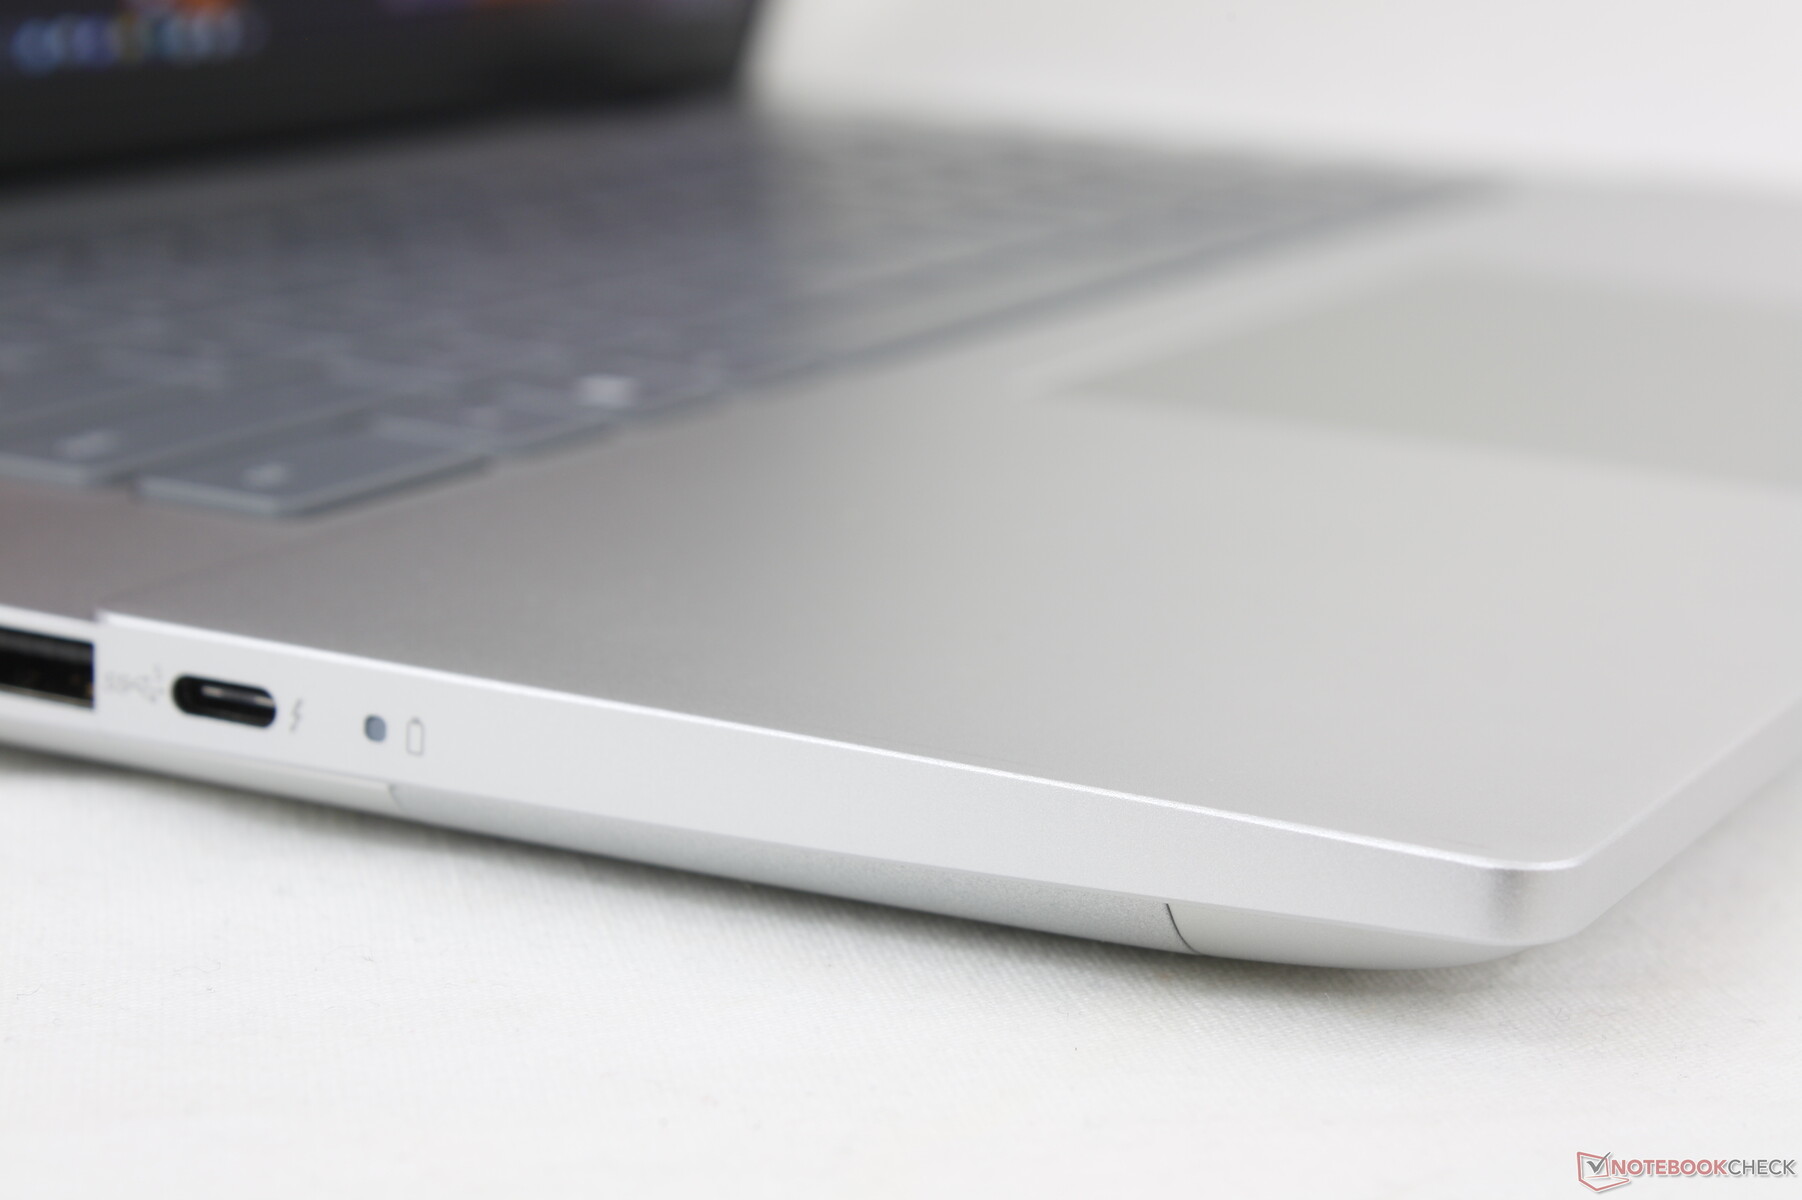
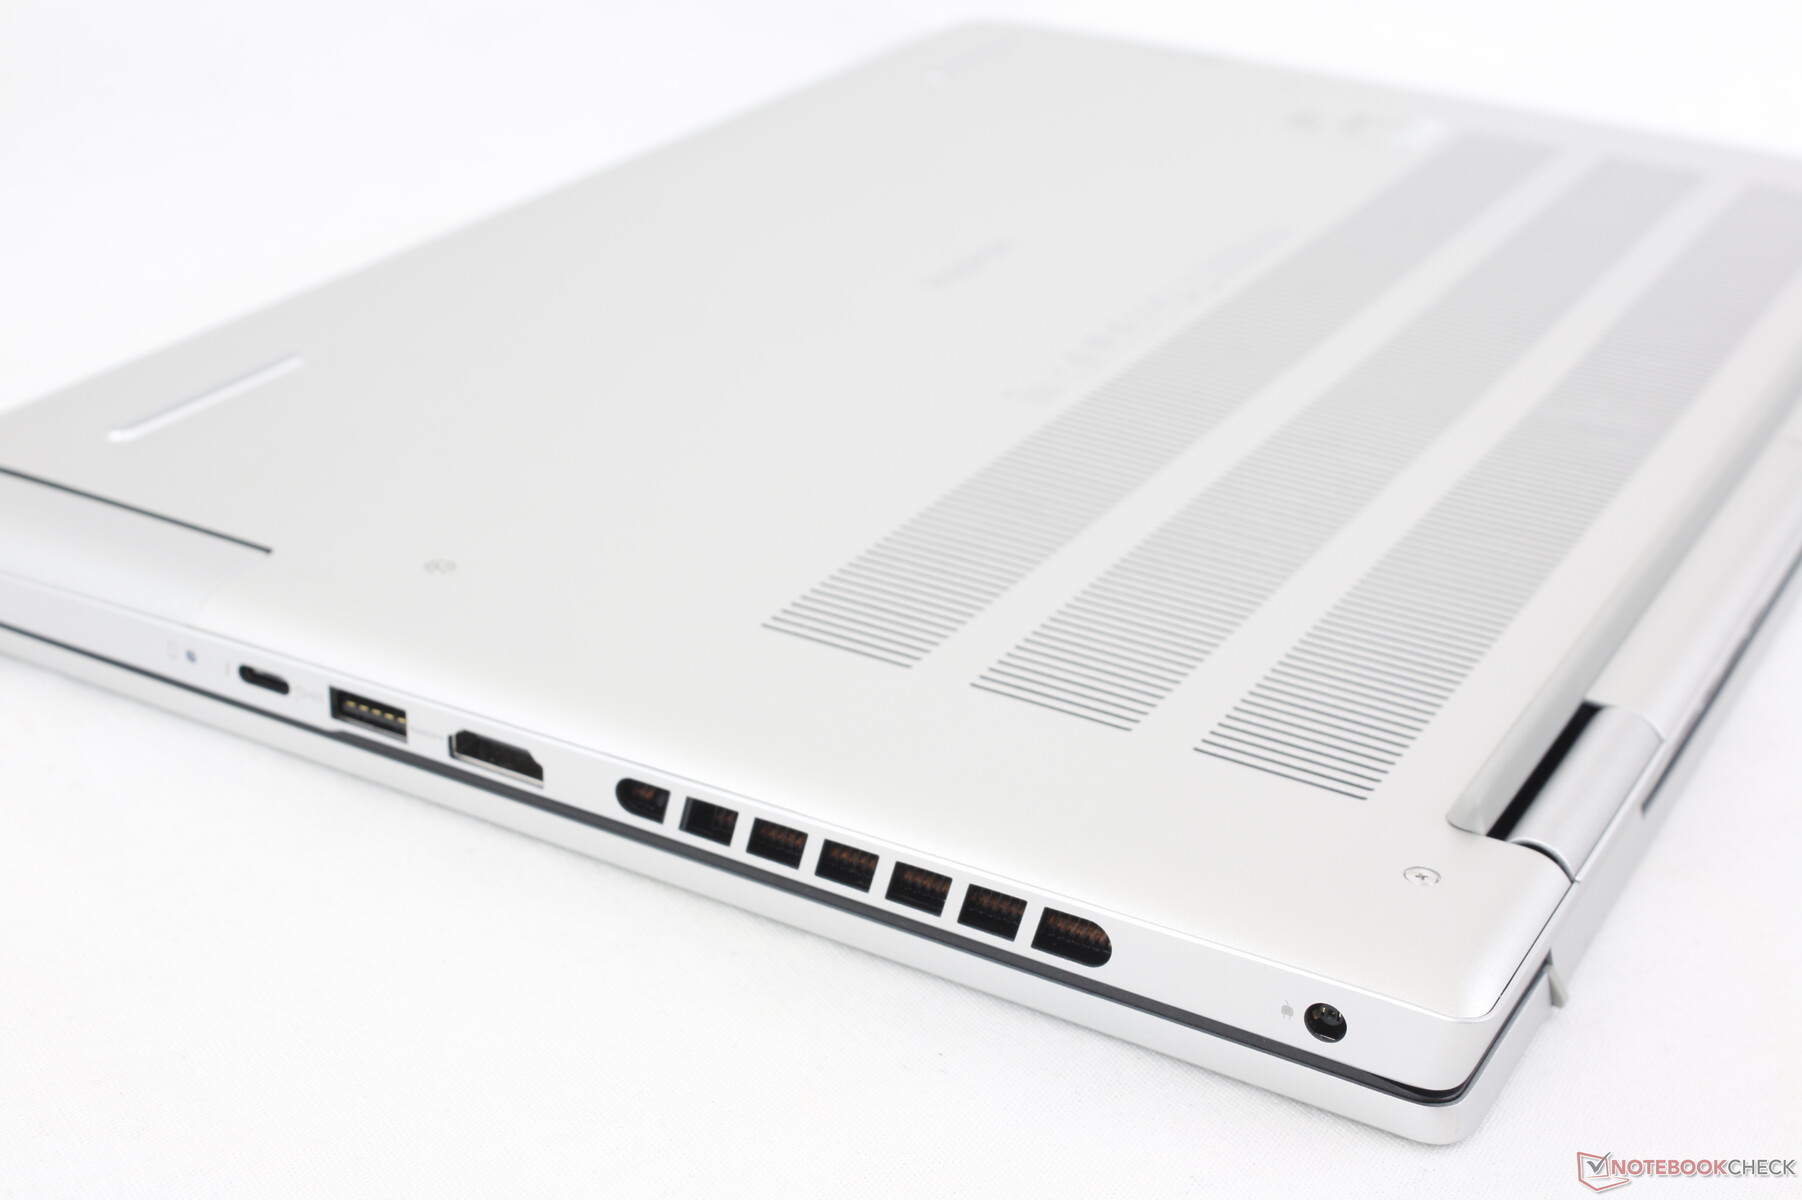
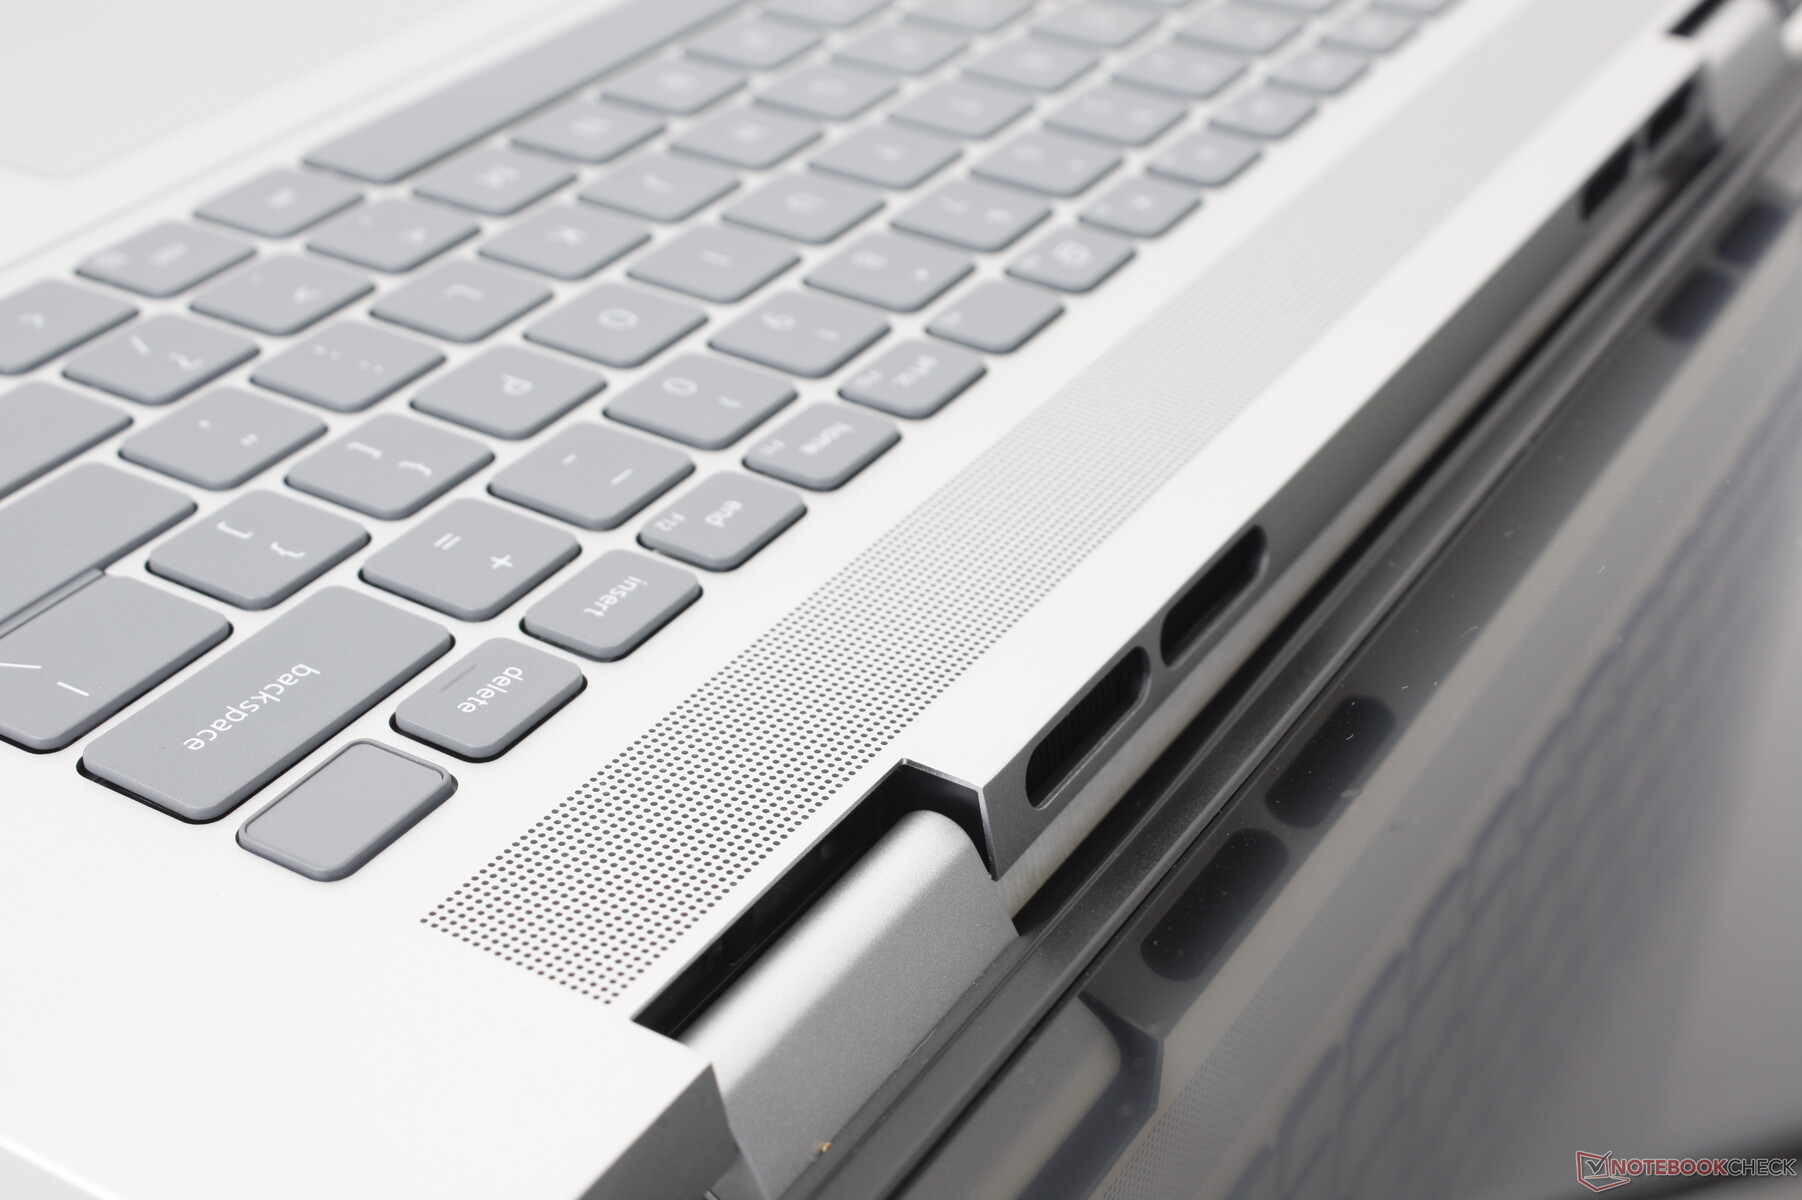
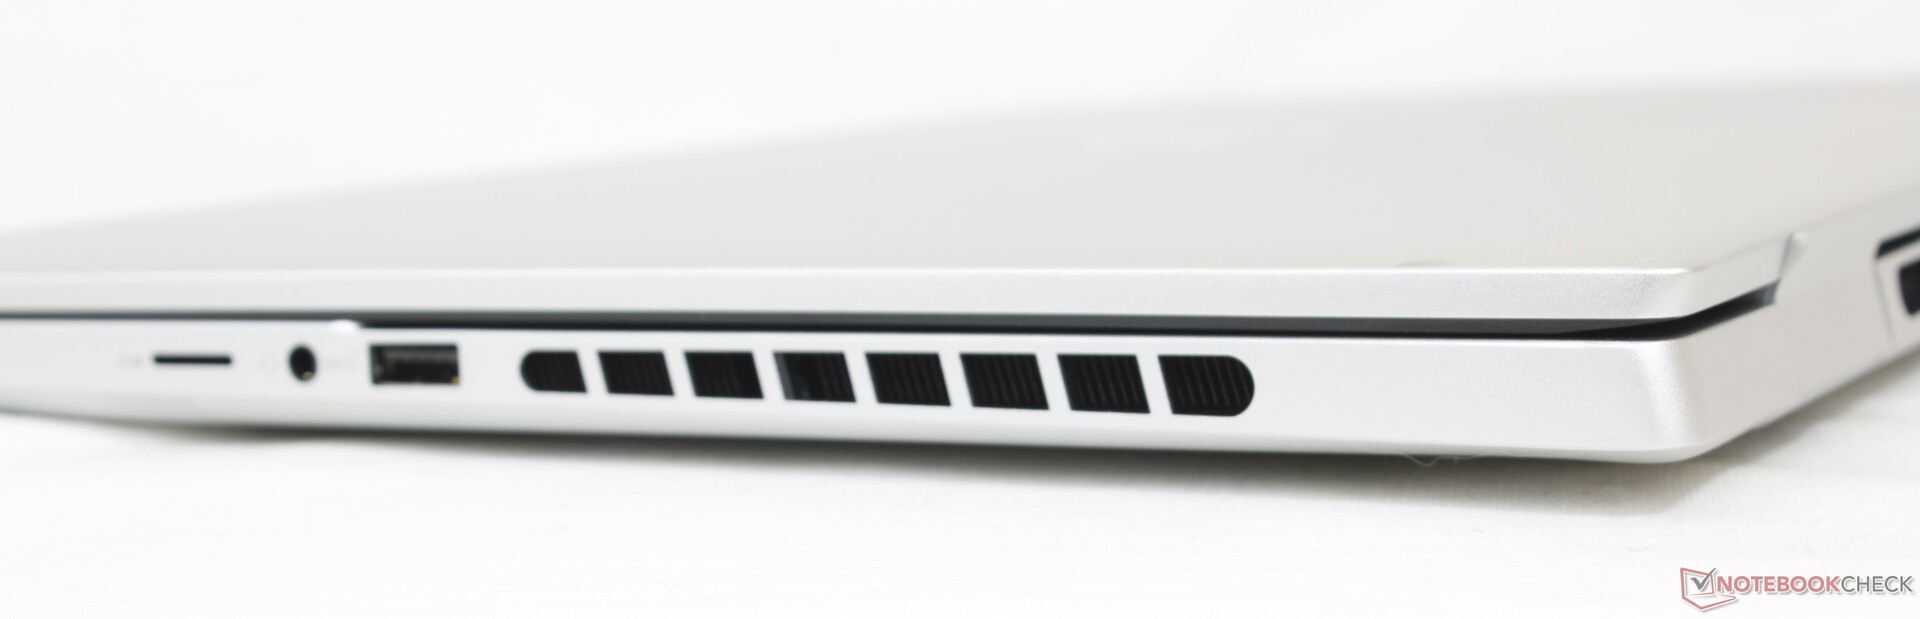
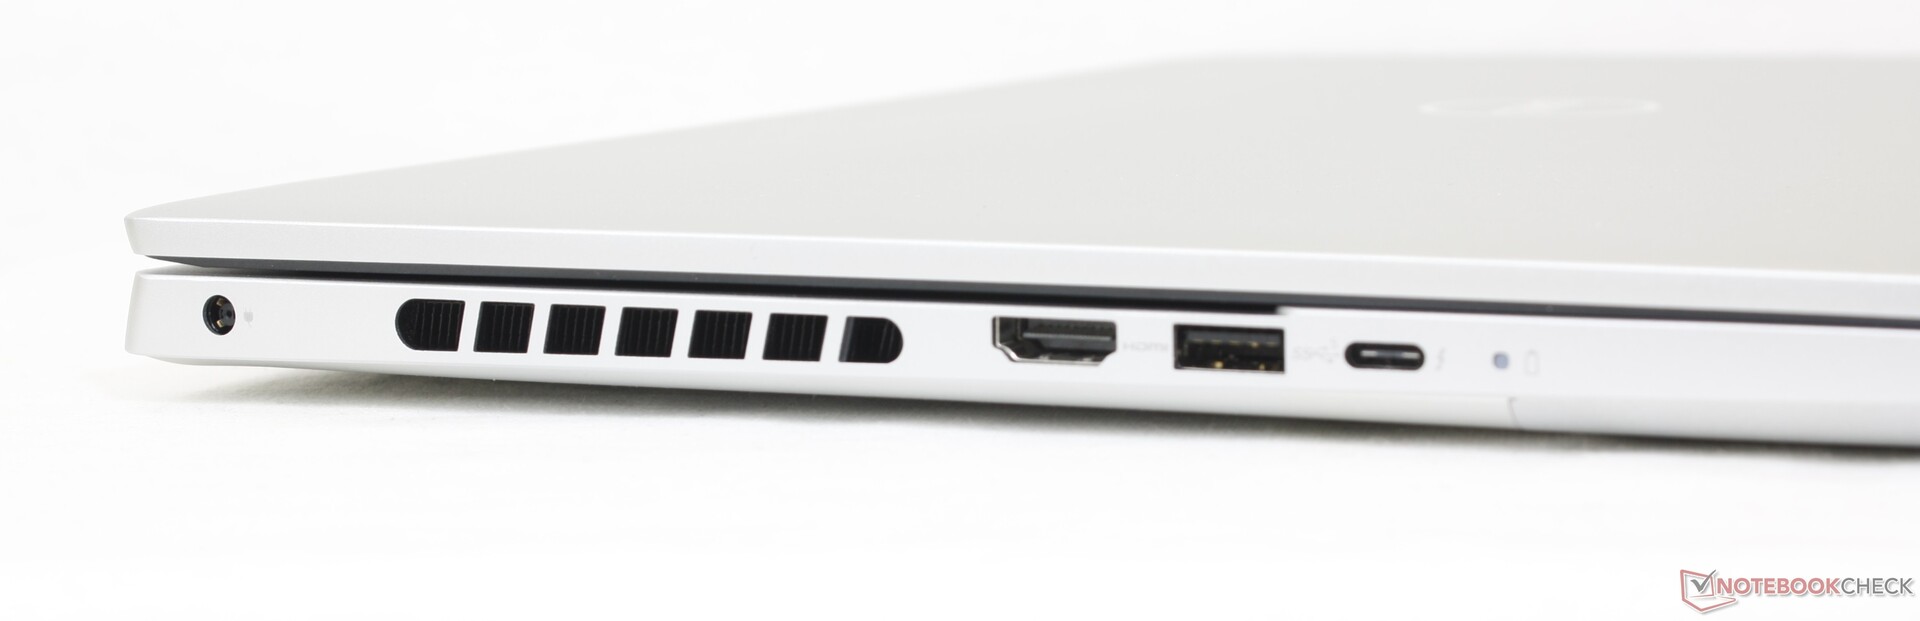
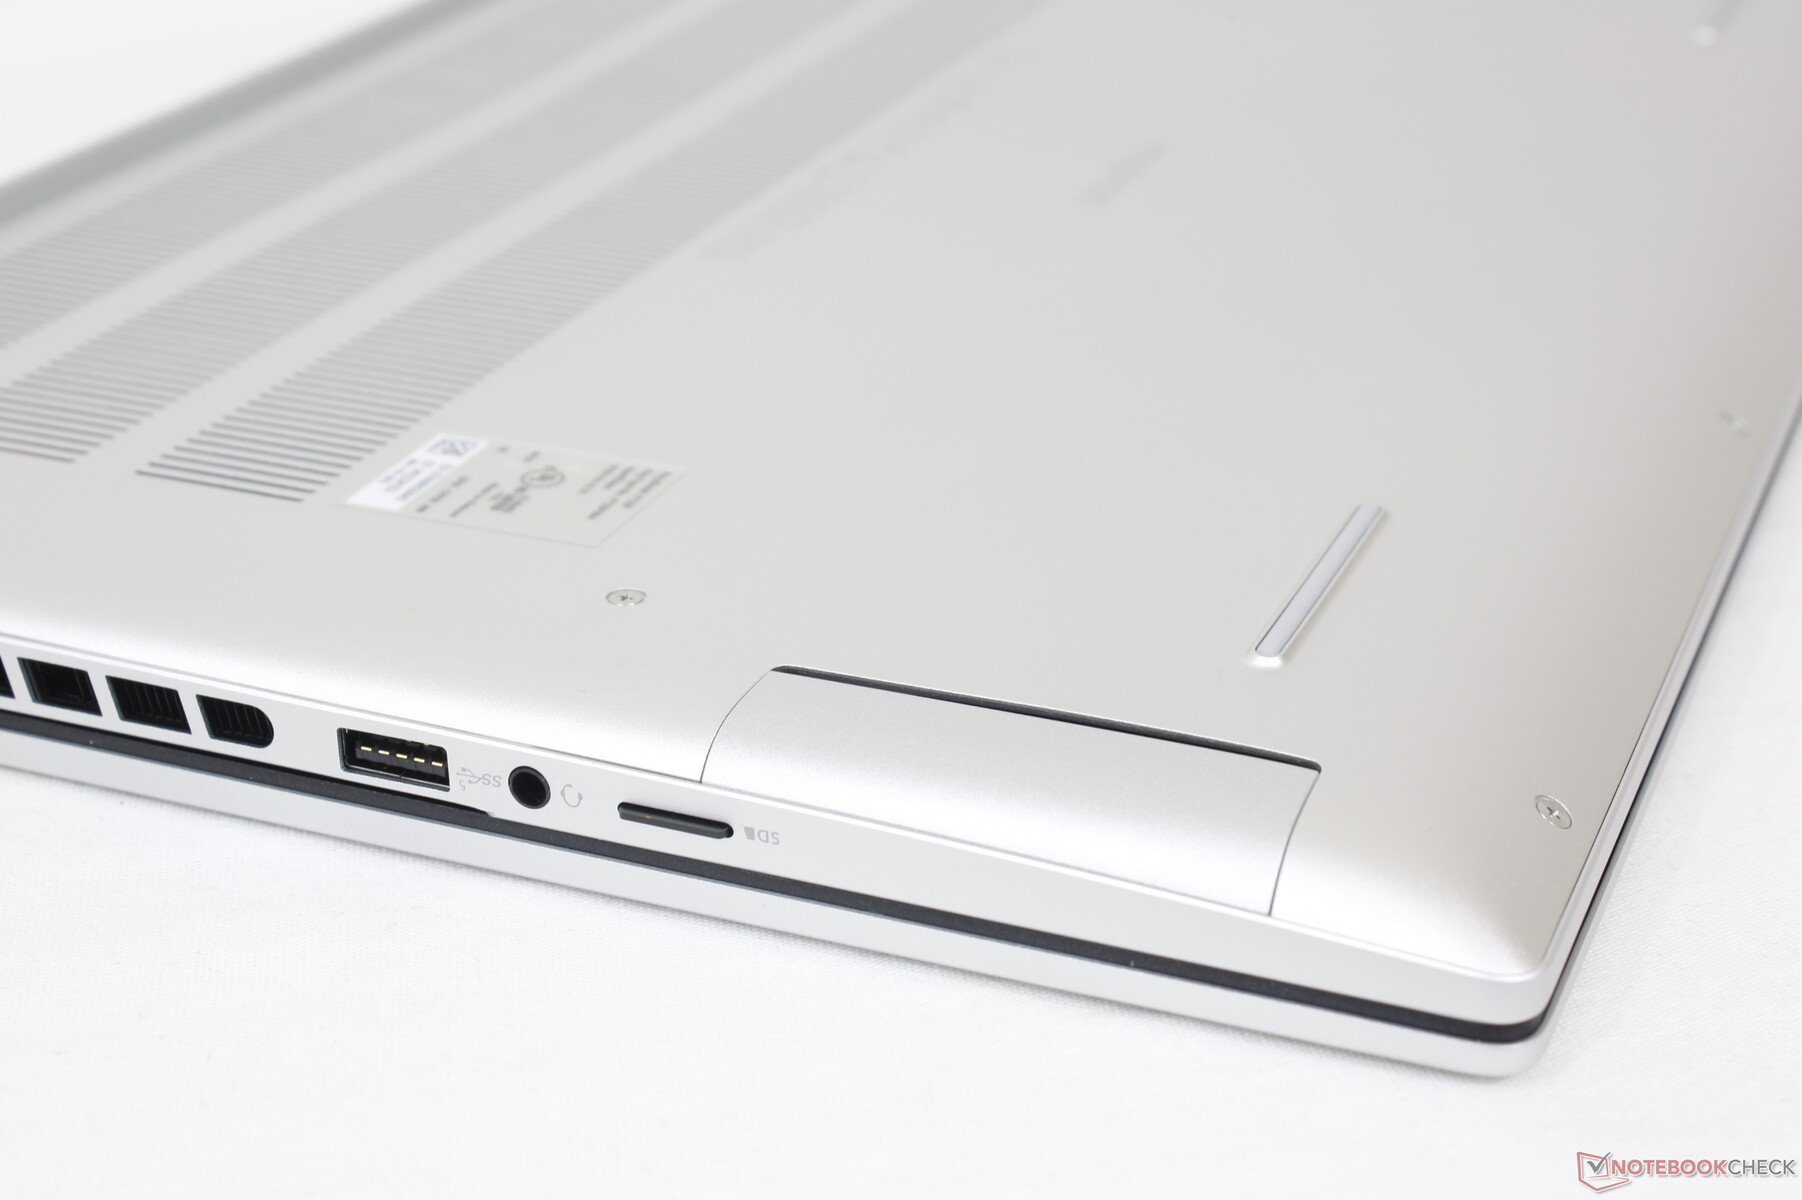
连接性 - 可以使用更多 USB-C 接口
端口定位和选项包括去年机型的所有内容,但有一个明显的降级:所有 RTX 4060 配置都取消了全尺寸 SD 读卡器,改用较小的 microSD 读卡器。像 Envy 16 或 VivoBook Pro 16X比戴尔集成了更多的 USB-C 端口,或者拥有全尺寸 SD 读卡器。
我们还希望看到未来的 Inspiron 机型能像 XPS 15 和 XPS 17 系列那样,放弃专有的交流适配器桶形端口,转而使用 USB-C 充电。
SD 读卡器
XPS 系列拥有笔记本电脑中速度最快的 SD 卡读卡器,而 Inspiron 系列则拥有速度最慢的读卡器。将 1 GB 的图片从我们的 UHS-II 测试卡传输到台式机需要 50 多秒,而在 XPS 15 上只需要 5 到 6 秒。XPS 15或 XPS 17 仅需 5 至 6 秒。
| SD Card Reader | |
| average JPG Copy Test (av. of 3 runs) | |
| MSI Summit E16 Flip A12UDT-031 (AV Pro SD microSD 128 GB V60) | |
| Asus Vivobook Pro 16X K6604JV-MX016W | |
| Lenovo Slim Pro 9i 16IRP8 (PNY EliteX-Pro60 V60 256 GB) | |
| HP Envy 16 h0112nr (AV Pro SD microSD 128 GB V60) | |
| Dell Inspiron 16 Plus 7620 (Toshiba Exceria Pro SDXC 64 GB UHS-II) | |
| Dell Inspiron 16 Plus 7630 (AV Pro SD microSD 128 GB V60) | |
| maximum AS SSD Seq Read Test (1GB) | |
| MSI Summit E16 Flip A12UDT-031 (AV Pro SD microSD 128 GB V60) | |
| Asus Vivobook Pro 16X K6604JV-MX016W | |
| Lenovo Slim Pro 9i 16IRP8 (PNY EliteX-Pro60 V60 256 GB) | |
| HP Envy 16 h0112nr (AV Pro SD microSD 128 GB V60) | |
| Dell Inspiron 16 Plus 7620 (Toshiba Exceria Pro SDXC 64 GB UHS-II) | |
| Dell Inspiron 16 Plus 7630 (AV Pro SD microSD 128 GB V60) | |
交流
标配的英特尔 AX211 支持 Wi-Fi 6E 和蓝牙 5.3 连接。与华硕 AXE11000 6GHz 测试网络配对时,我们体验到了稳定可靠的性能。
如果配置 AMD CPU,还可使用联发科模块。
网络摄像头
200 万像素网络摄像头已成为大多数多媒体笔记本电脑的标准配置。 惠普更昂贵的机型 包括 500 万像素甚至 800 万像素网络摄像头。
为了保护个人隐私,还配备了一个物理滑块,但不支持红外功能。


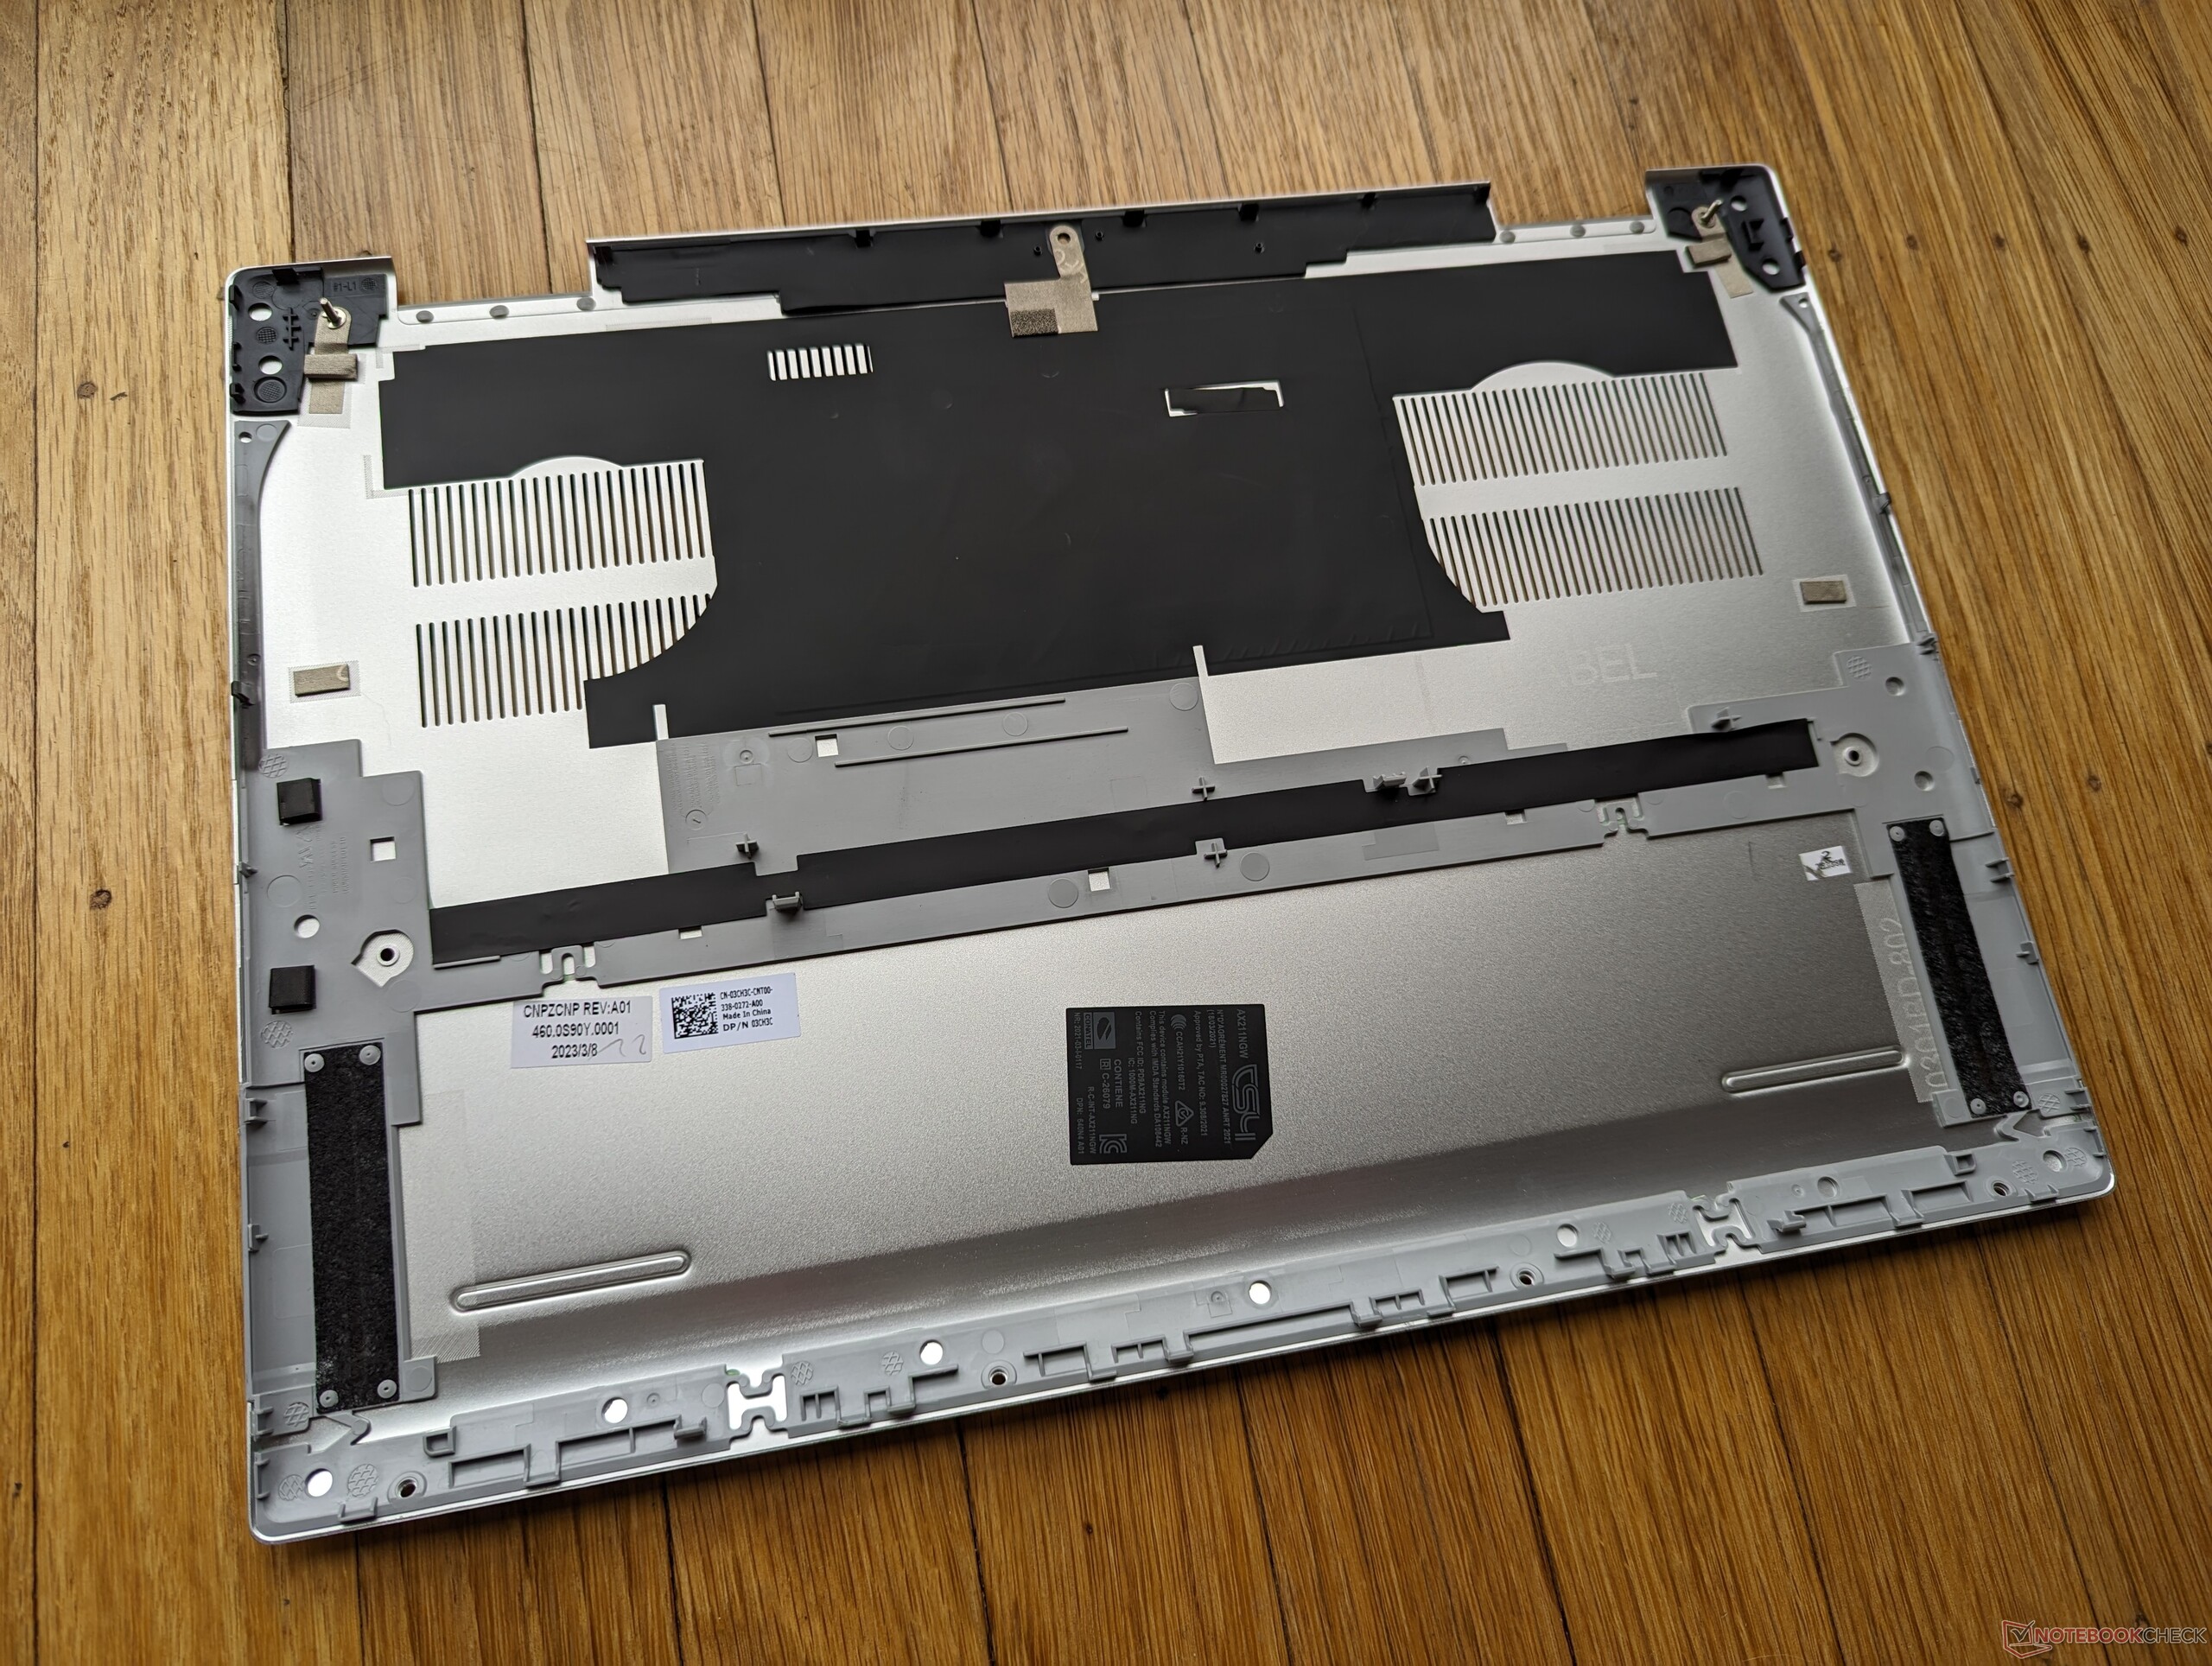
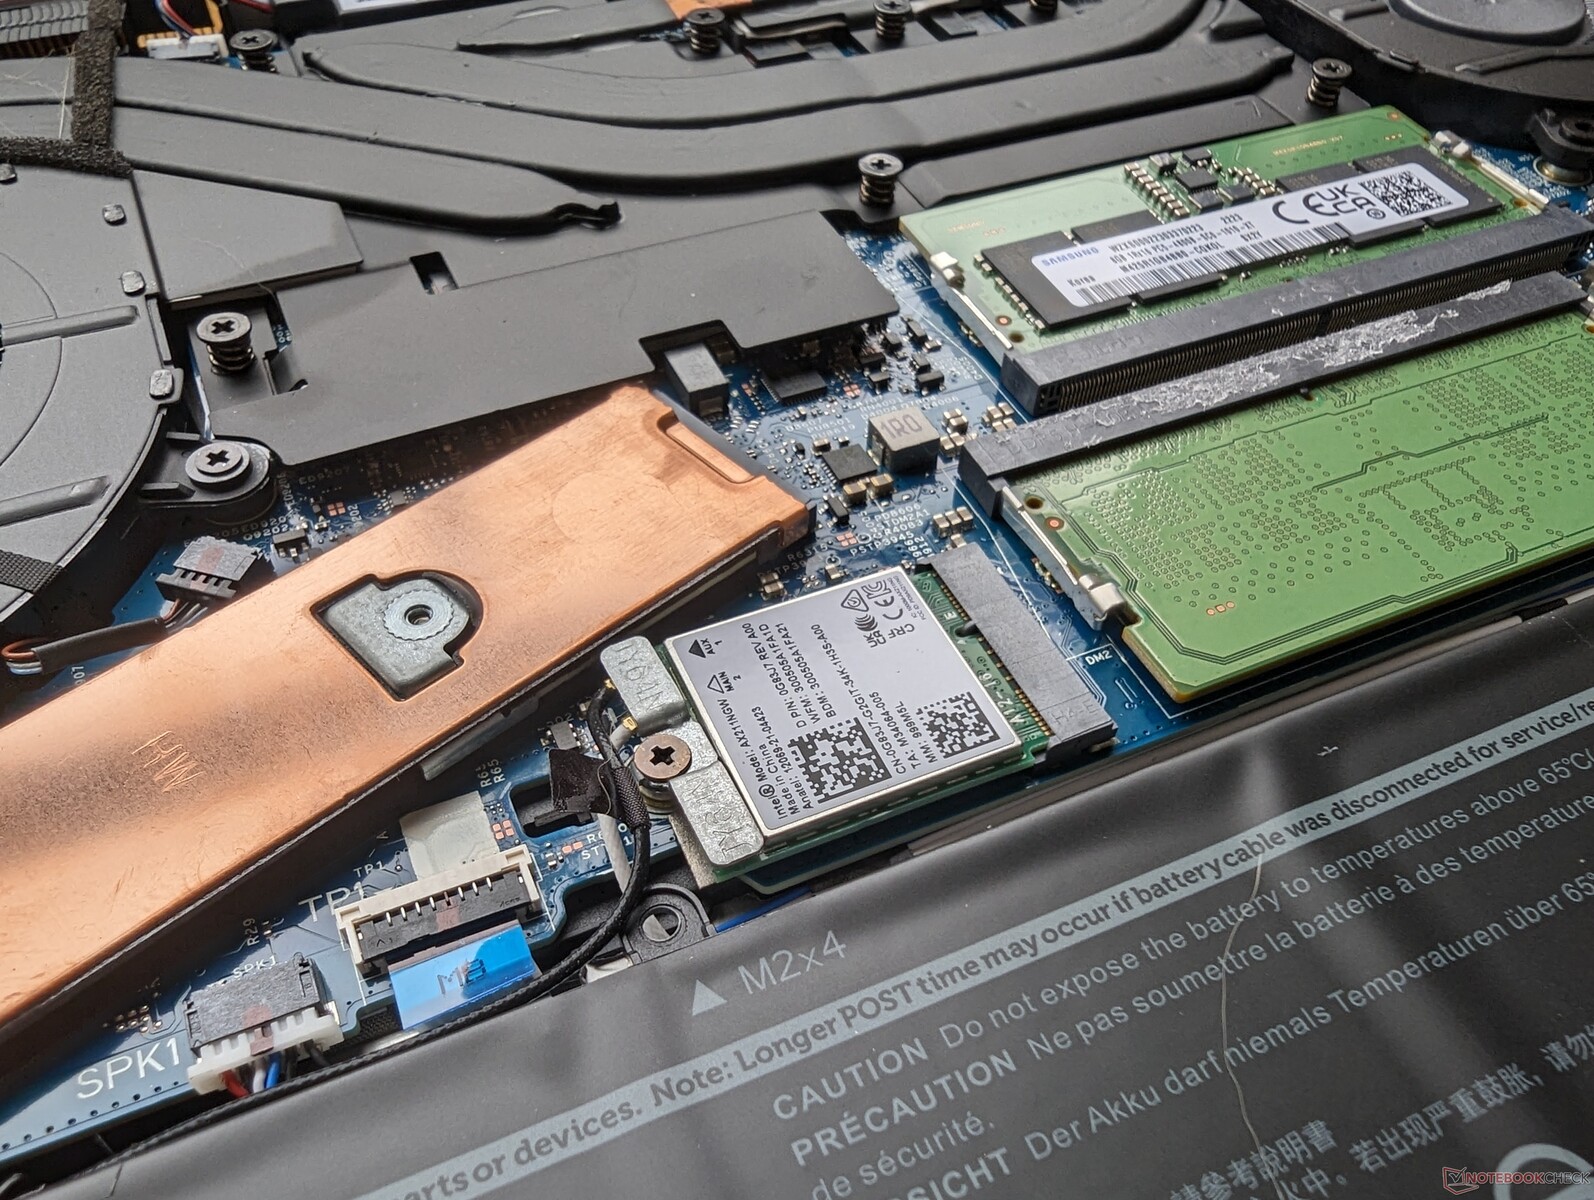
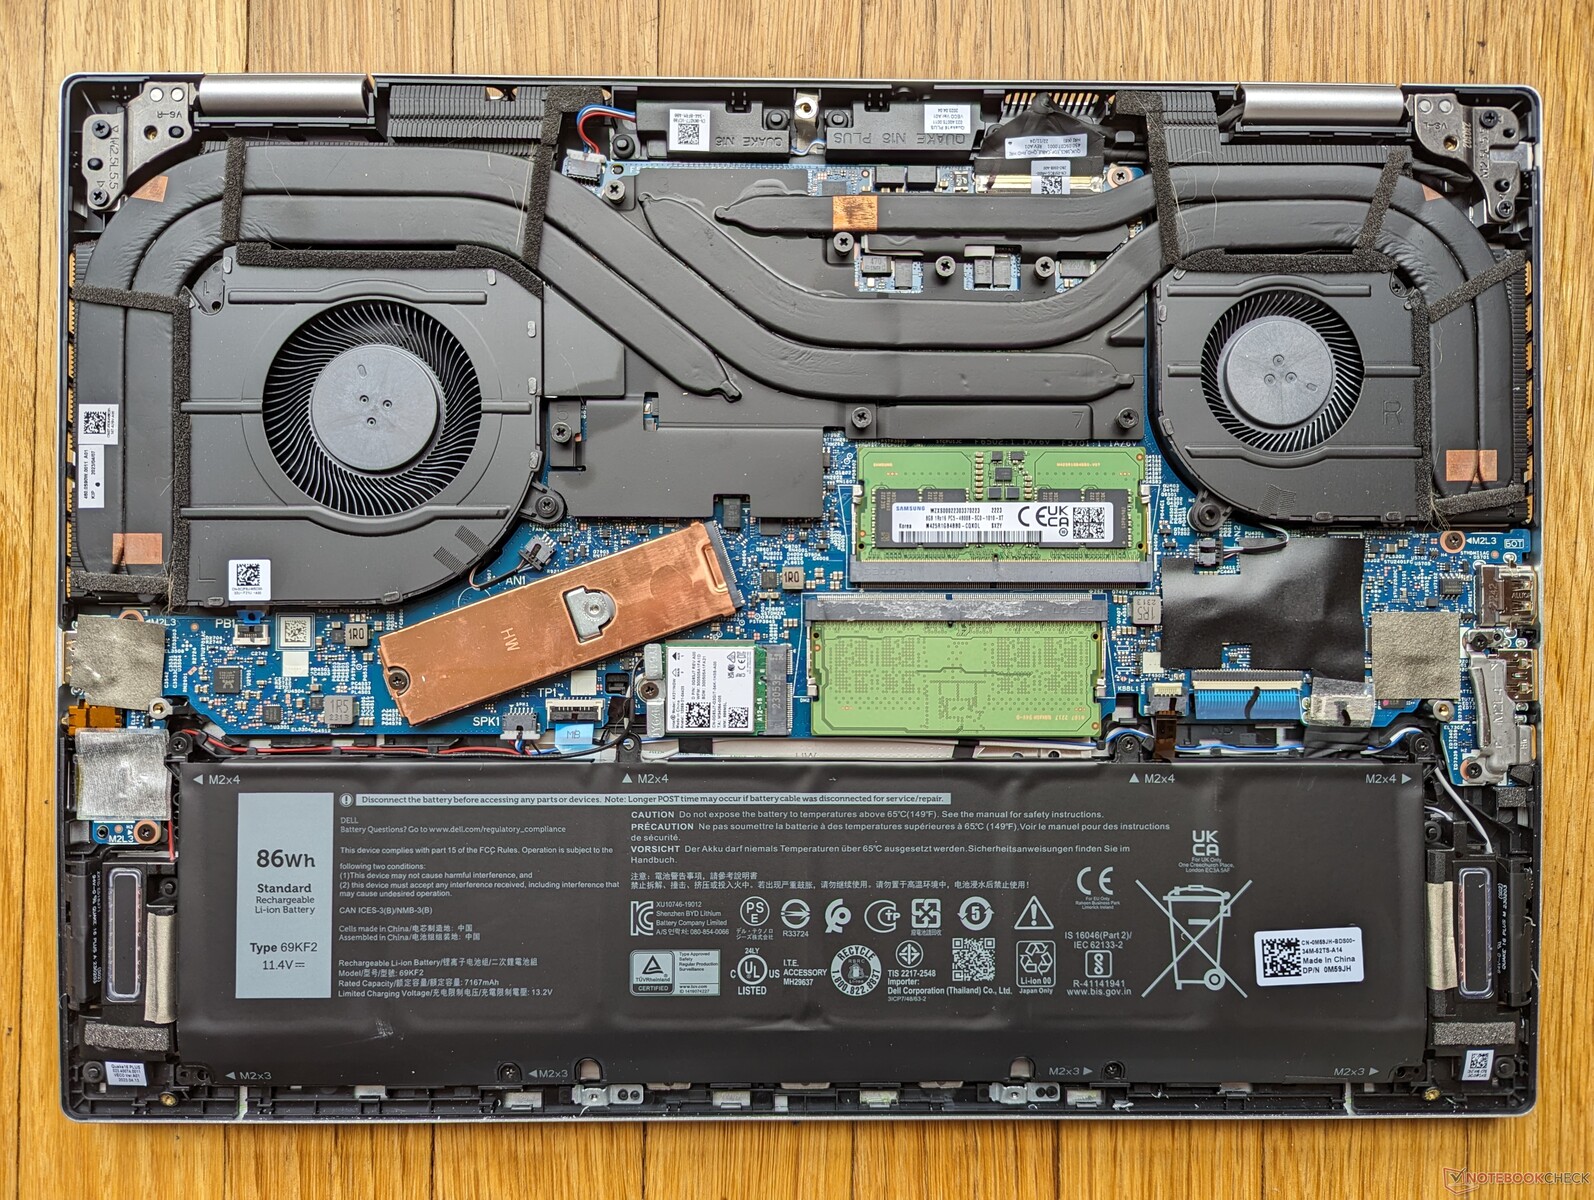
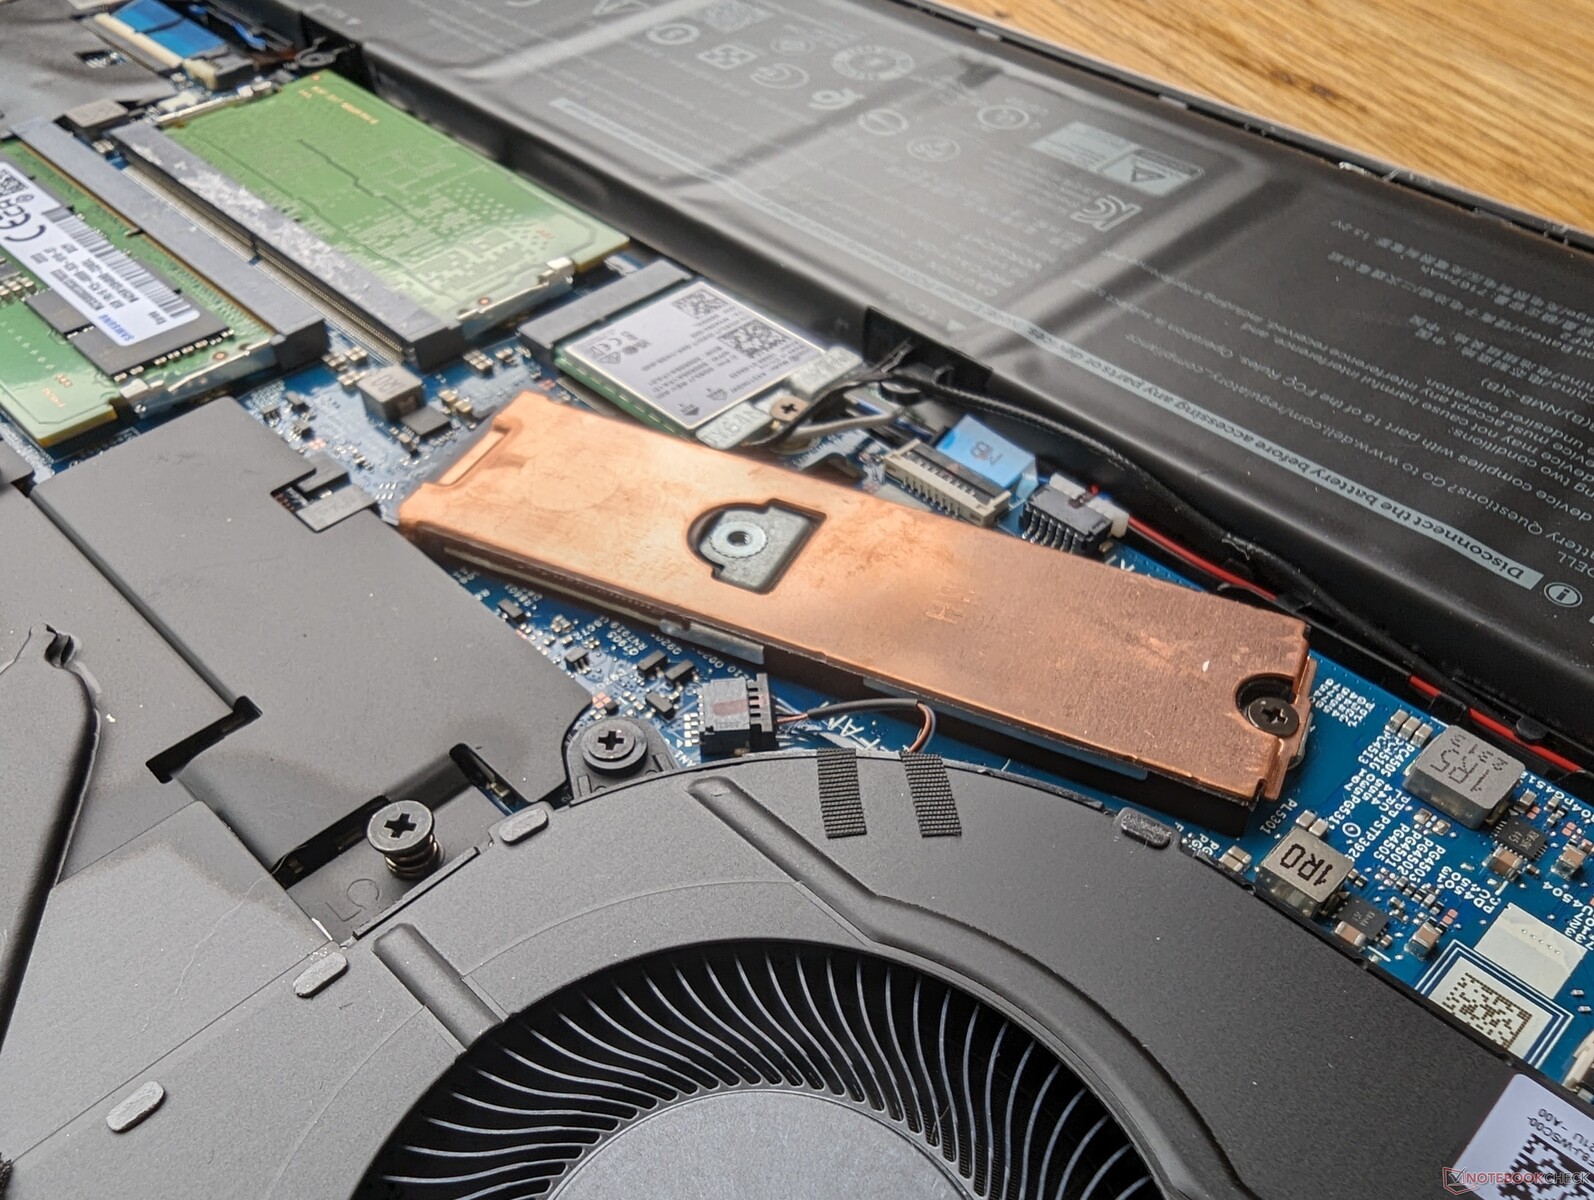
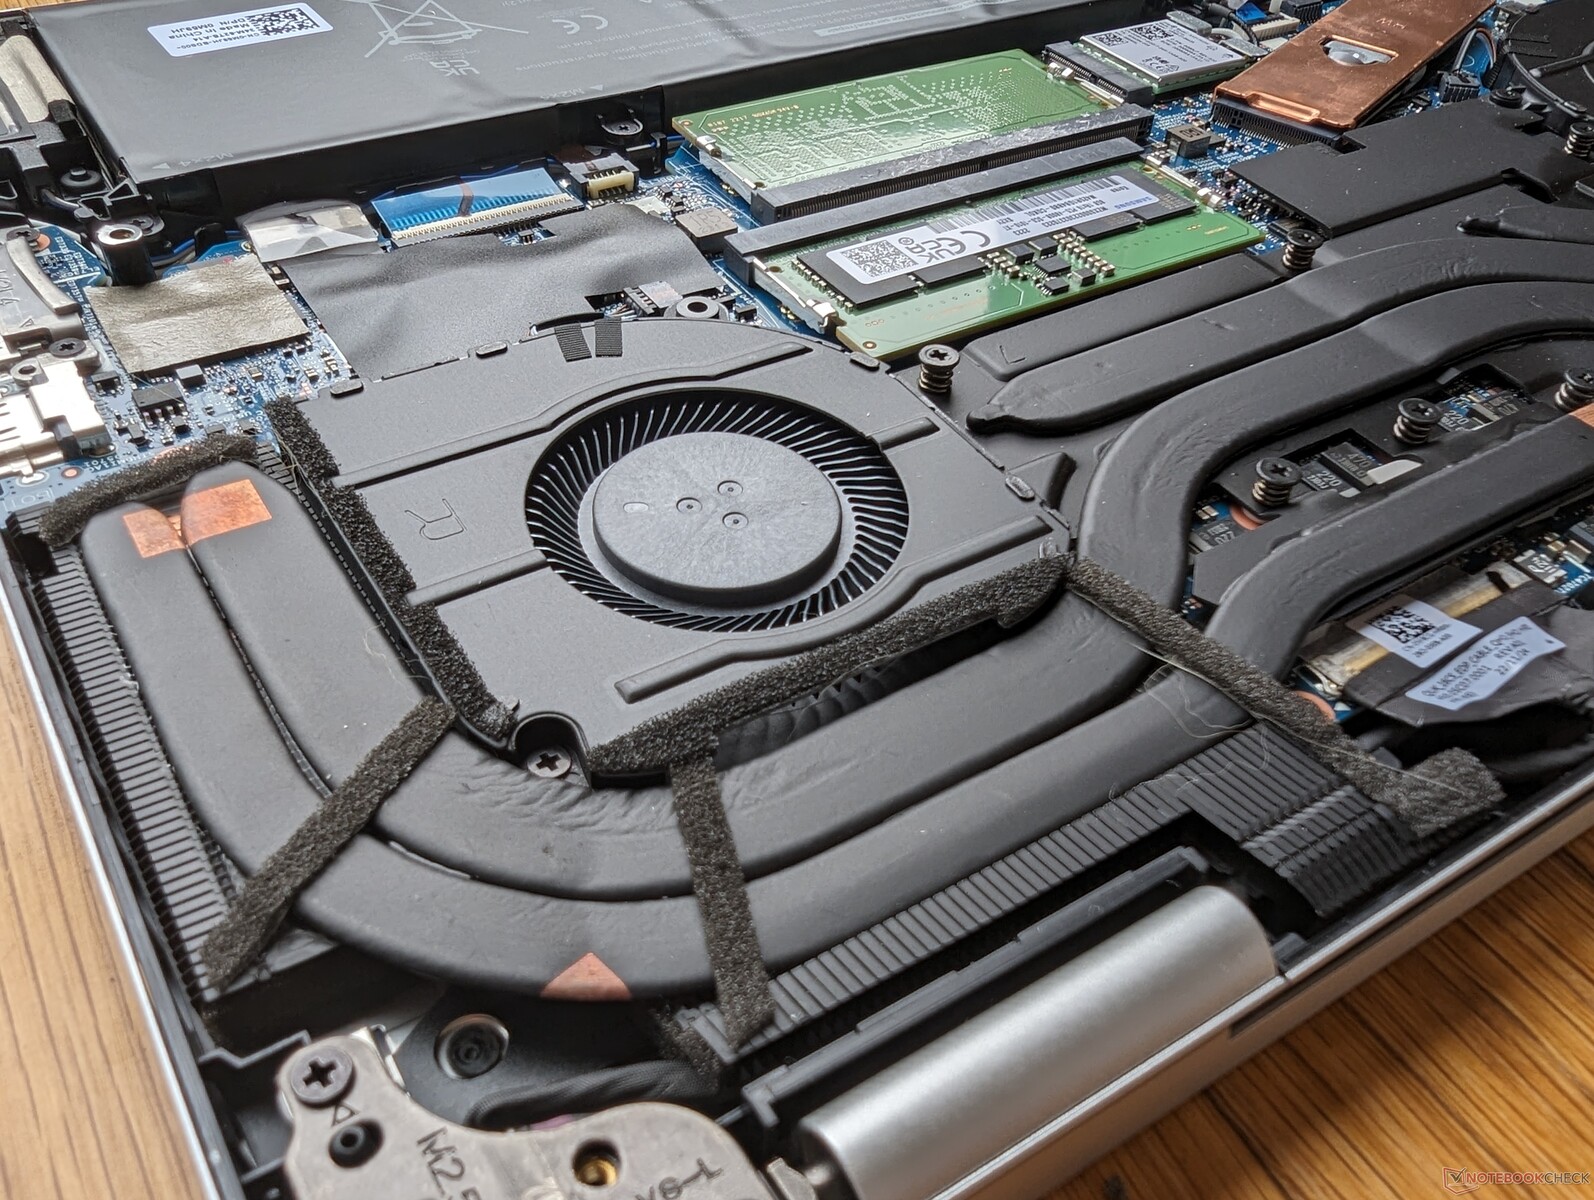
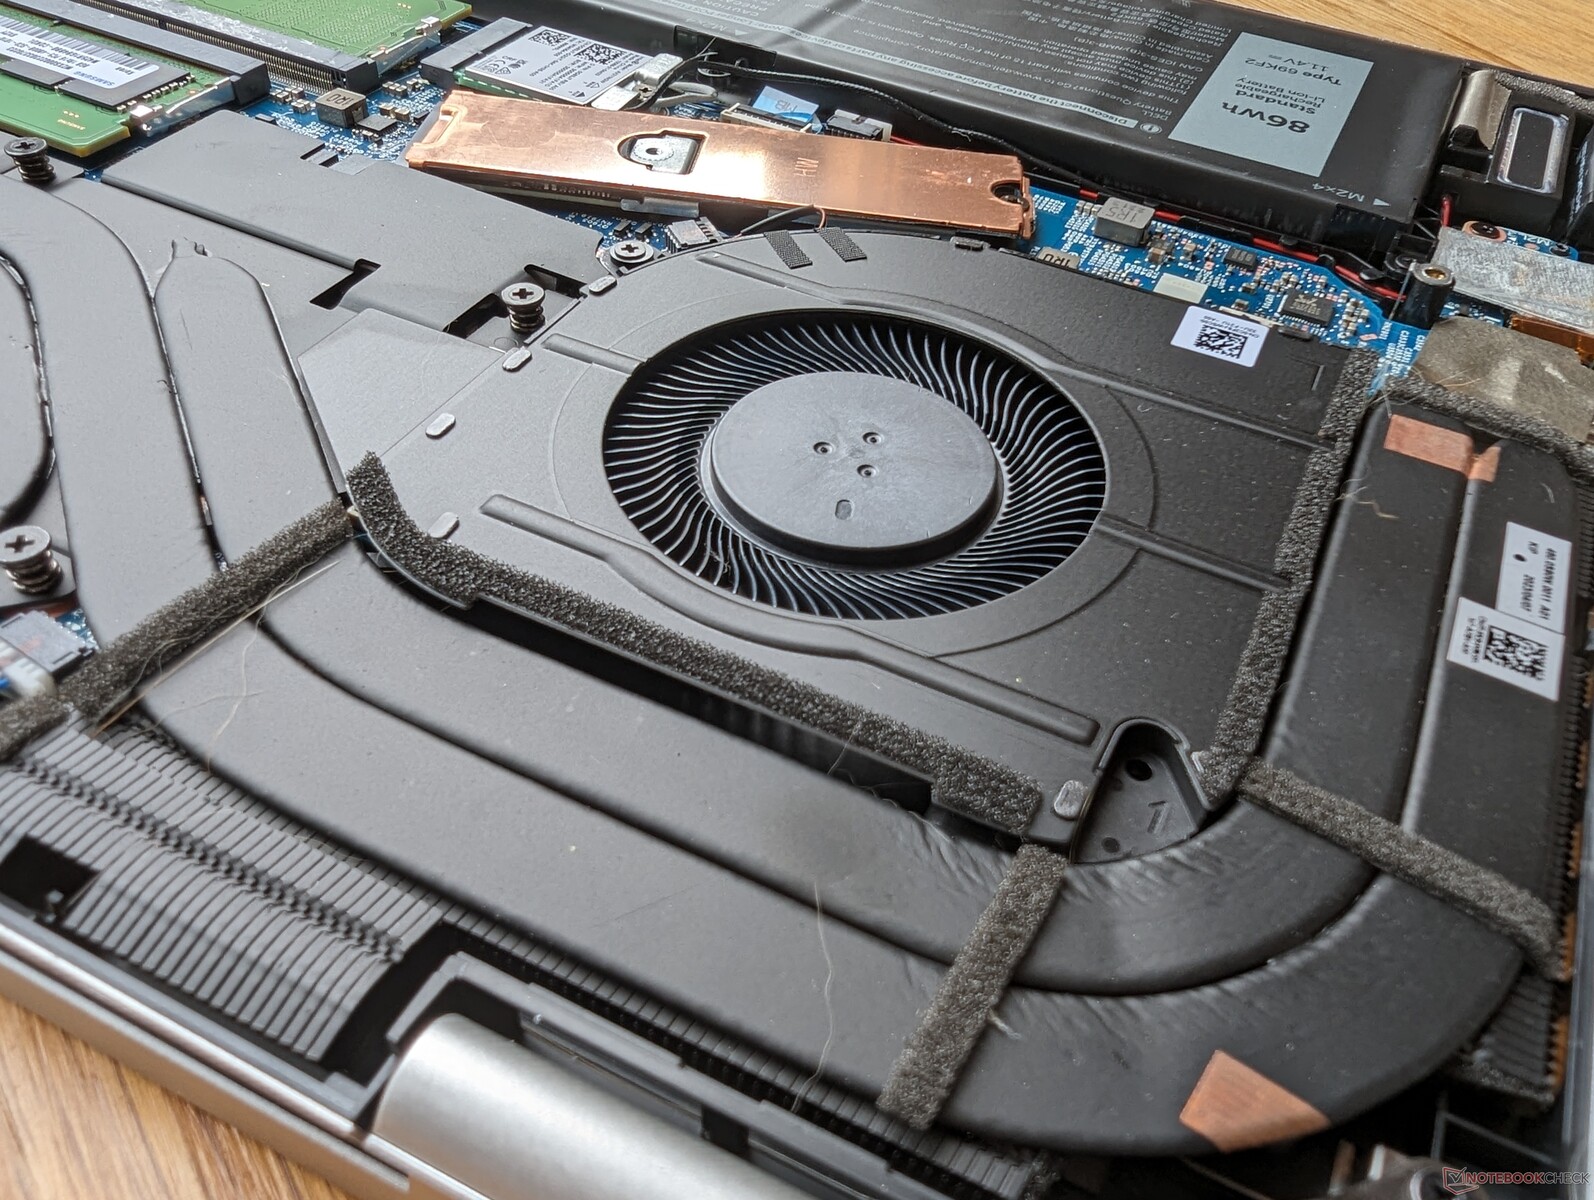
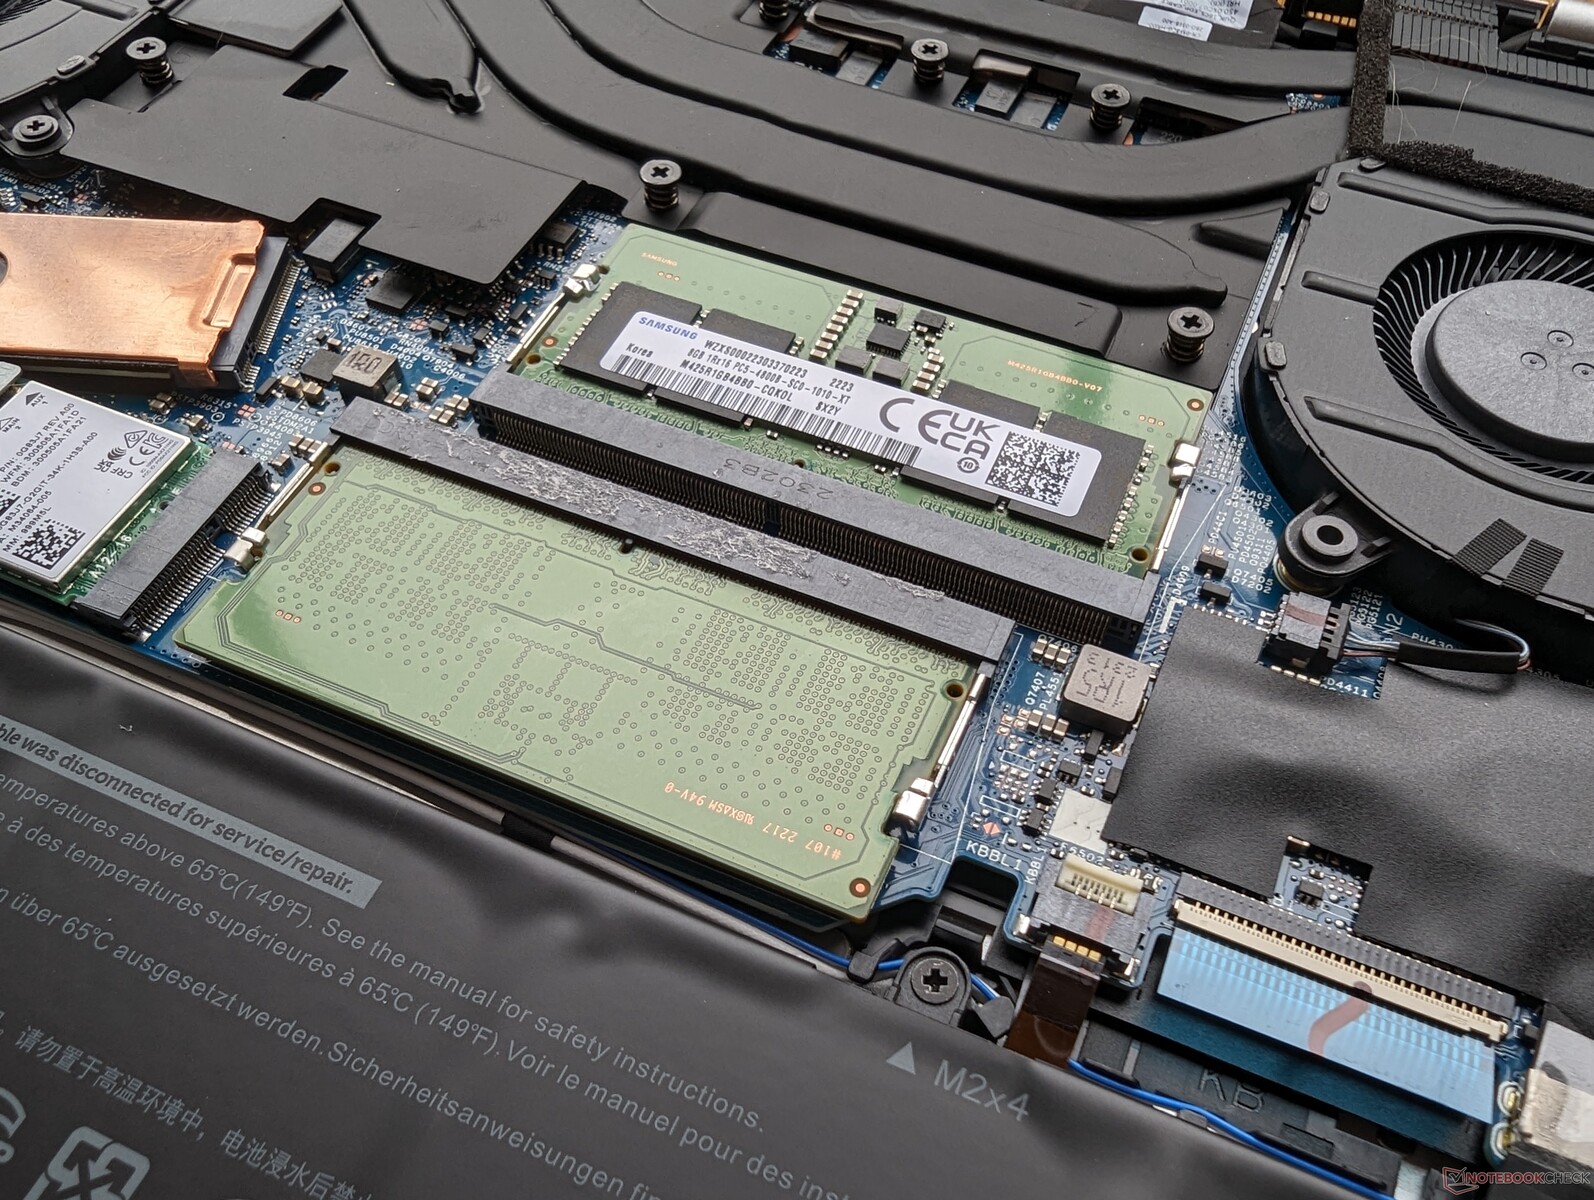
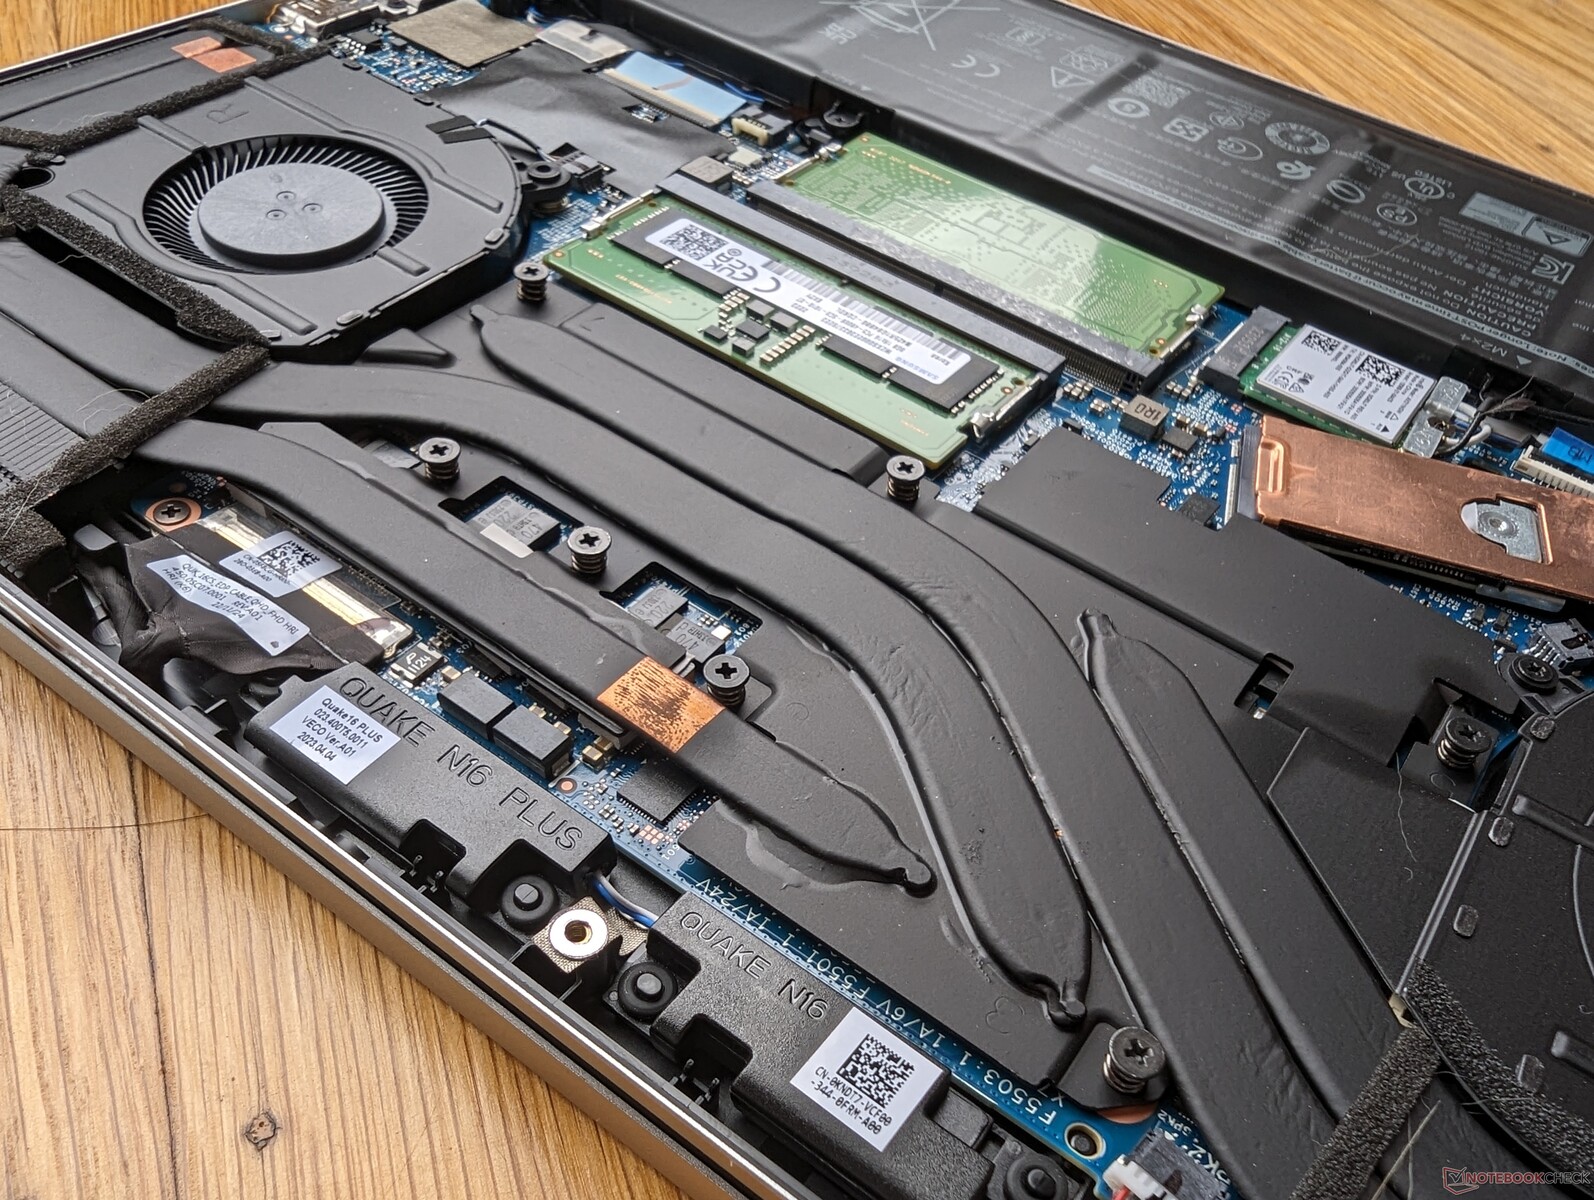
维护
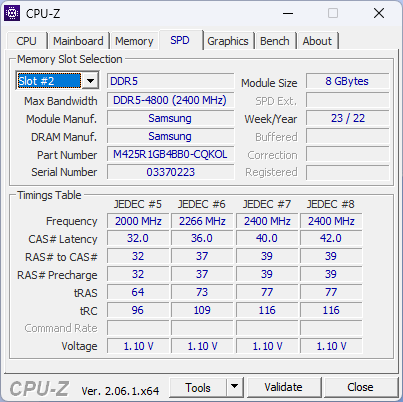
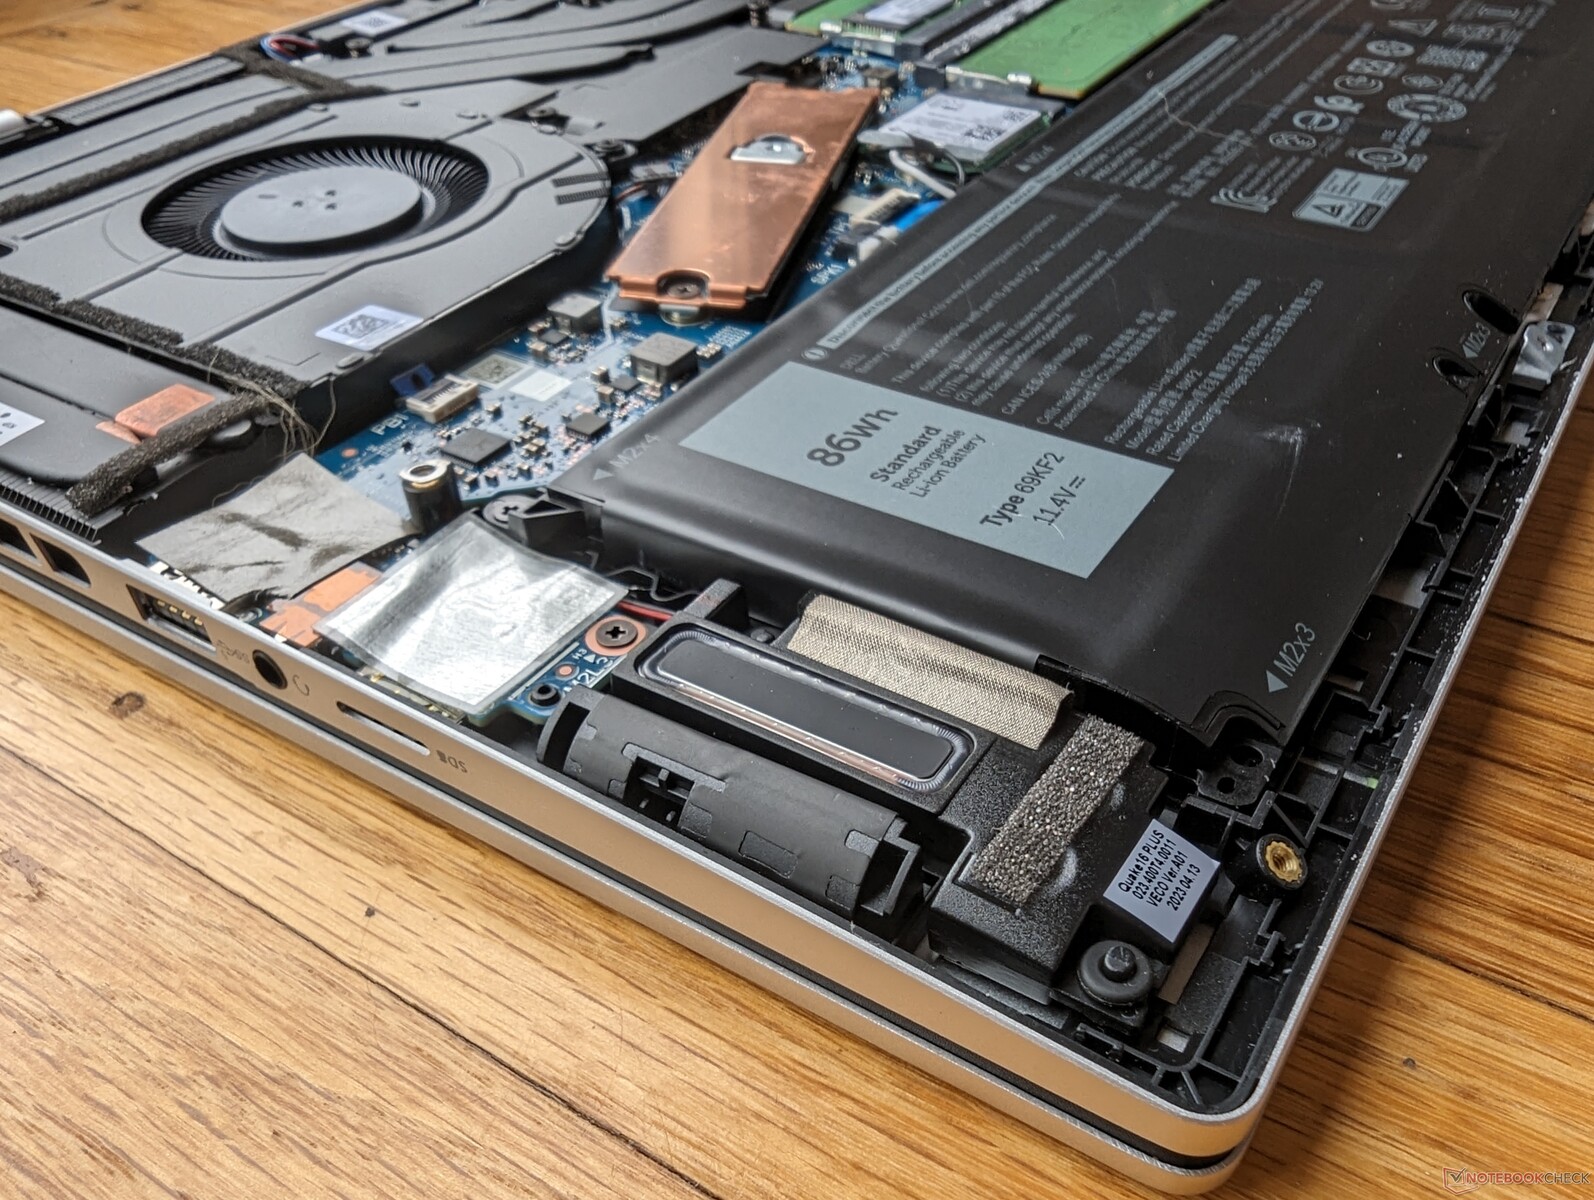
底部面板只需要一把十字螺丝刀和锋利的边缘,维修起来相对容易。用户可以直接访问固态硬盘、无线局域网和 2 个 SODIMM 插槽,而去年的机型只有 1 个 SODIMM 插槽,如下图所示。这次的风扇也更大,并采用了更粗的铜质热导管,以提高散热潜力。
请注意,与英特尔版本的完全可扩展 2x SODIMM 方式相比,AMD 版本的该机型采用焊接式 LPDDR5 内存。

配件和保修
包装盒内除了交流适配器和文件外,没有其他附件。如果在美国购买,制造商通常提供一年有限保修。
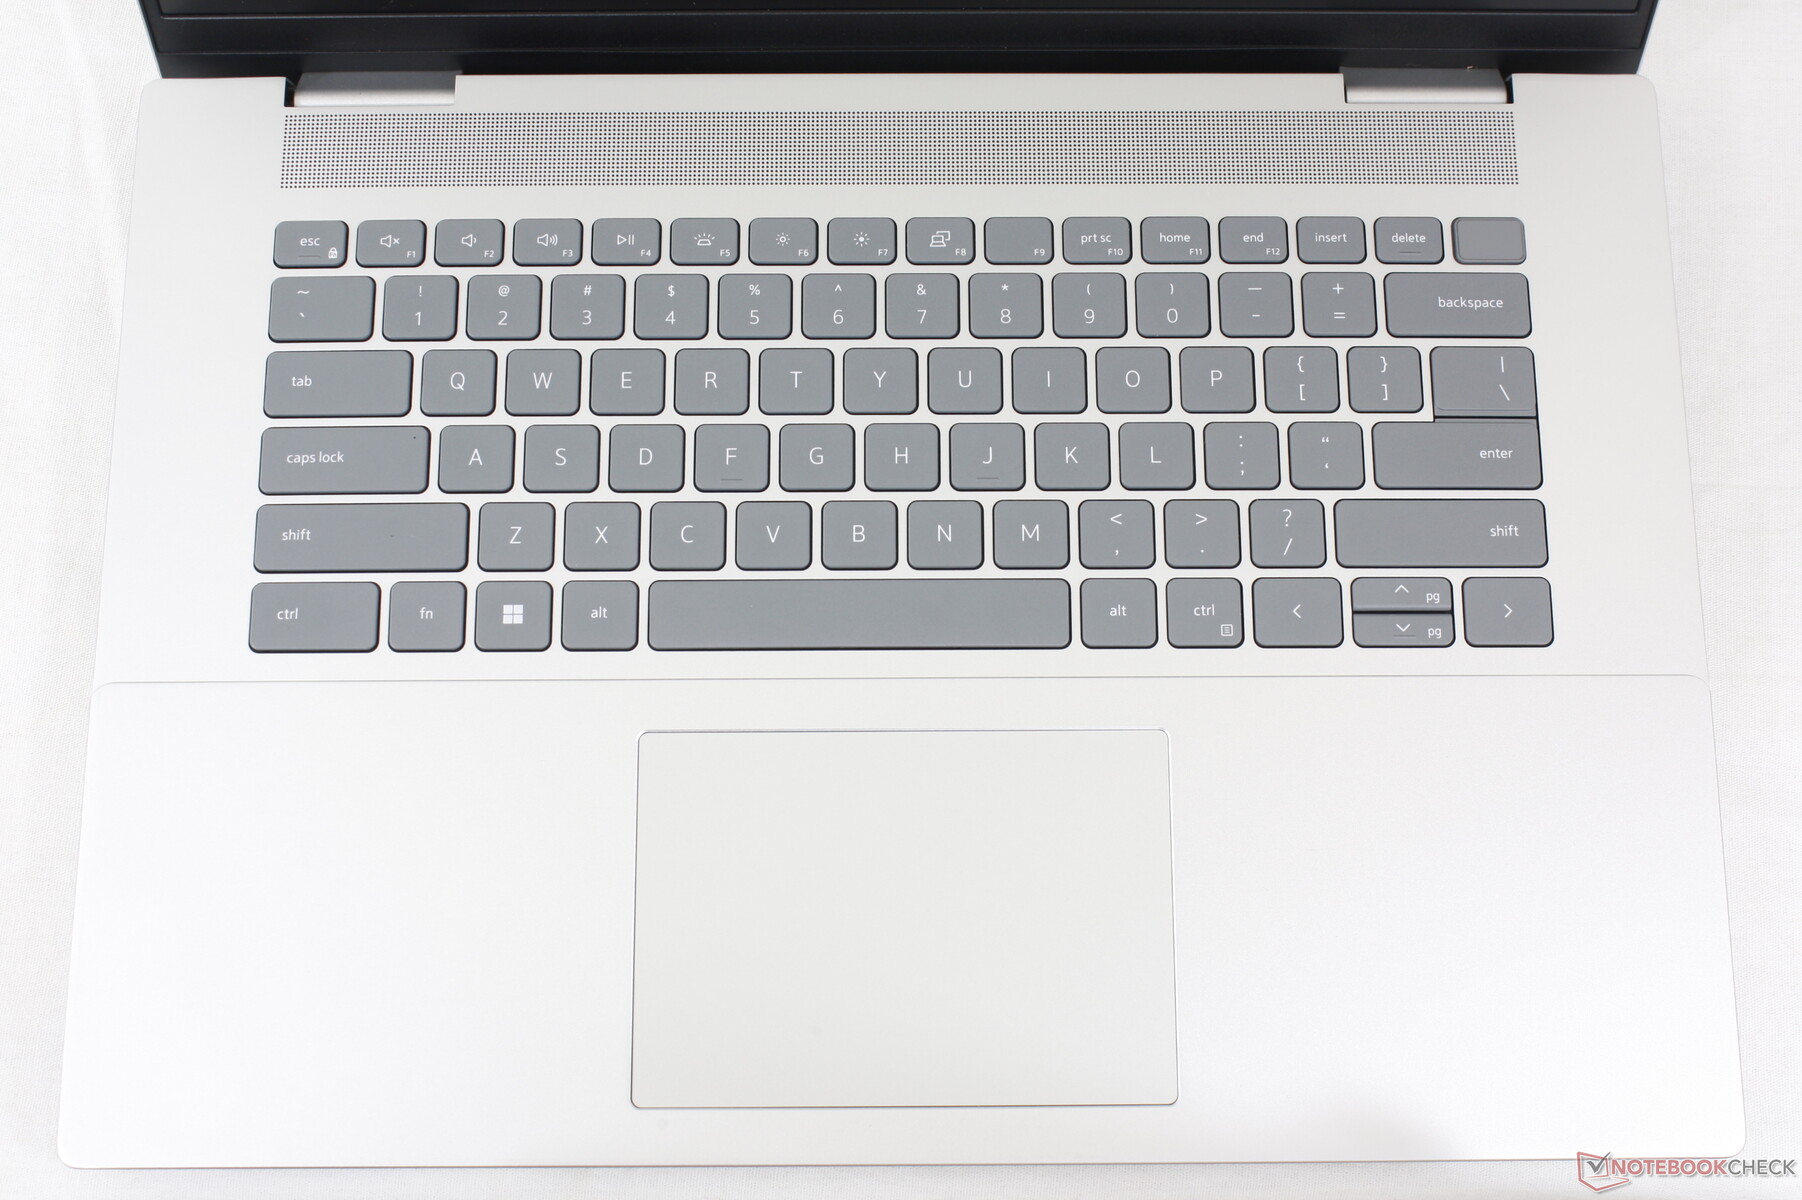
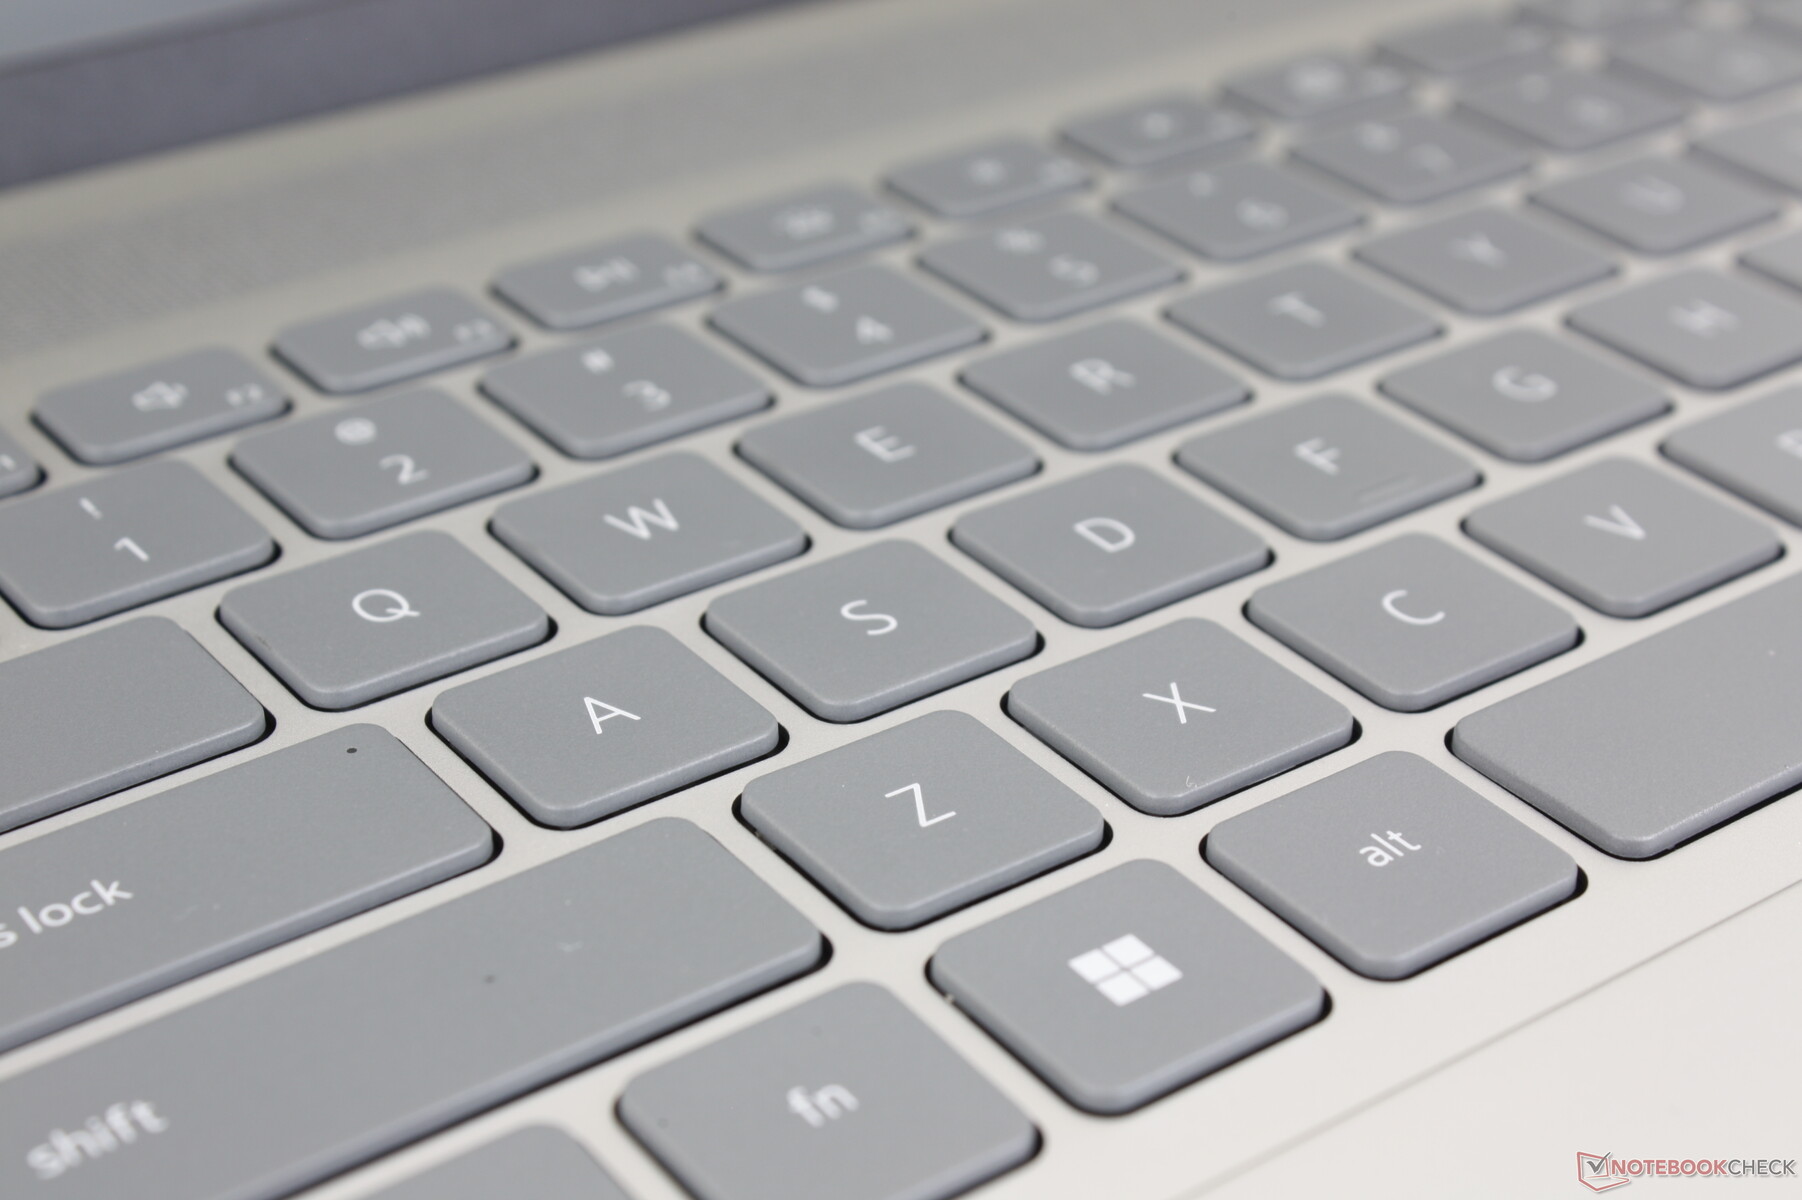
输入设备 - 熟悉的 Inspiron 手感
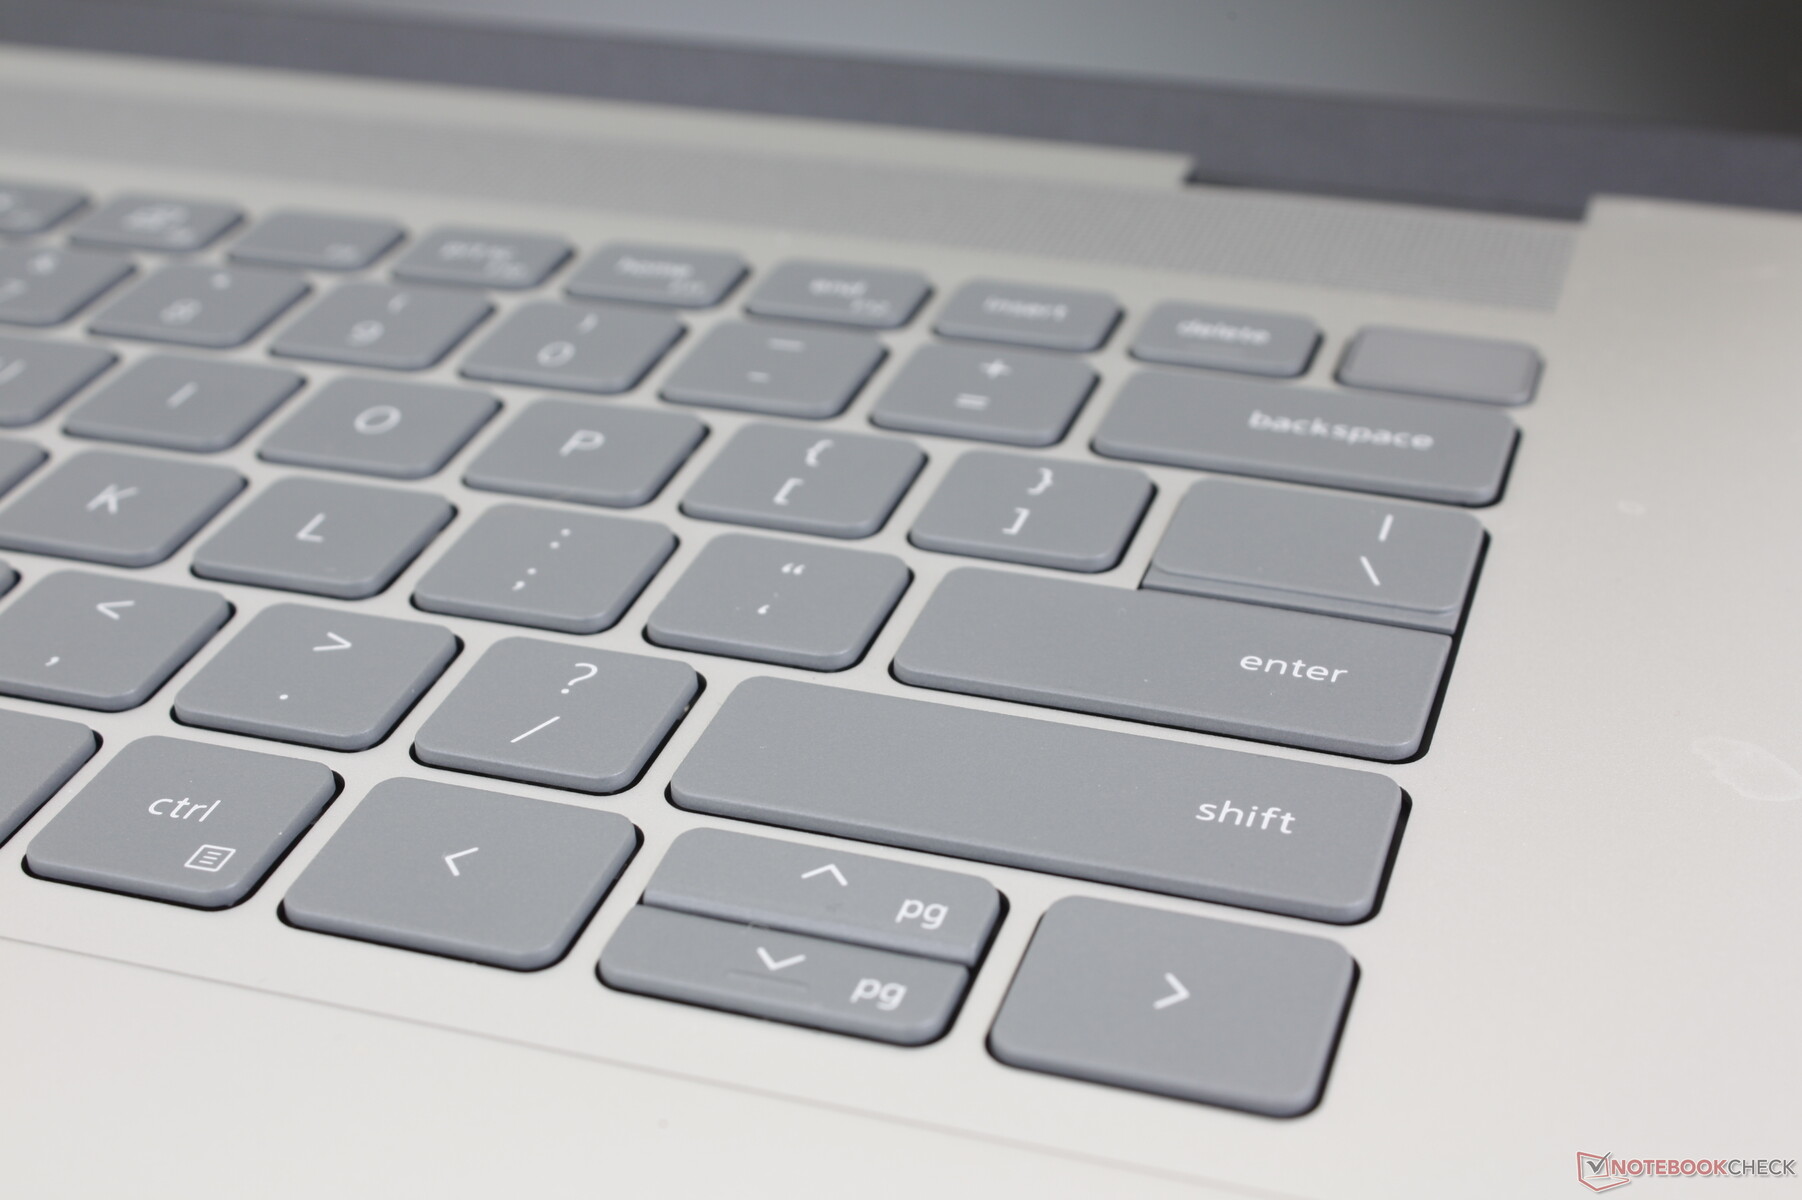
键盘
打字体验与 Inspiron 16 Plus 7620直到每个功能键和辅助操作。这并不一定是坏事,因为不同型号的 Inspiron 之间保持一致是值得赞赏的。不过,其他多媒体笔记本电脑,如 LG Gram 16或 HP Spectre x360 16 等其他多媒体笔记本电脑的按键明显更坚硬、更舒适。
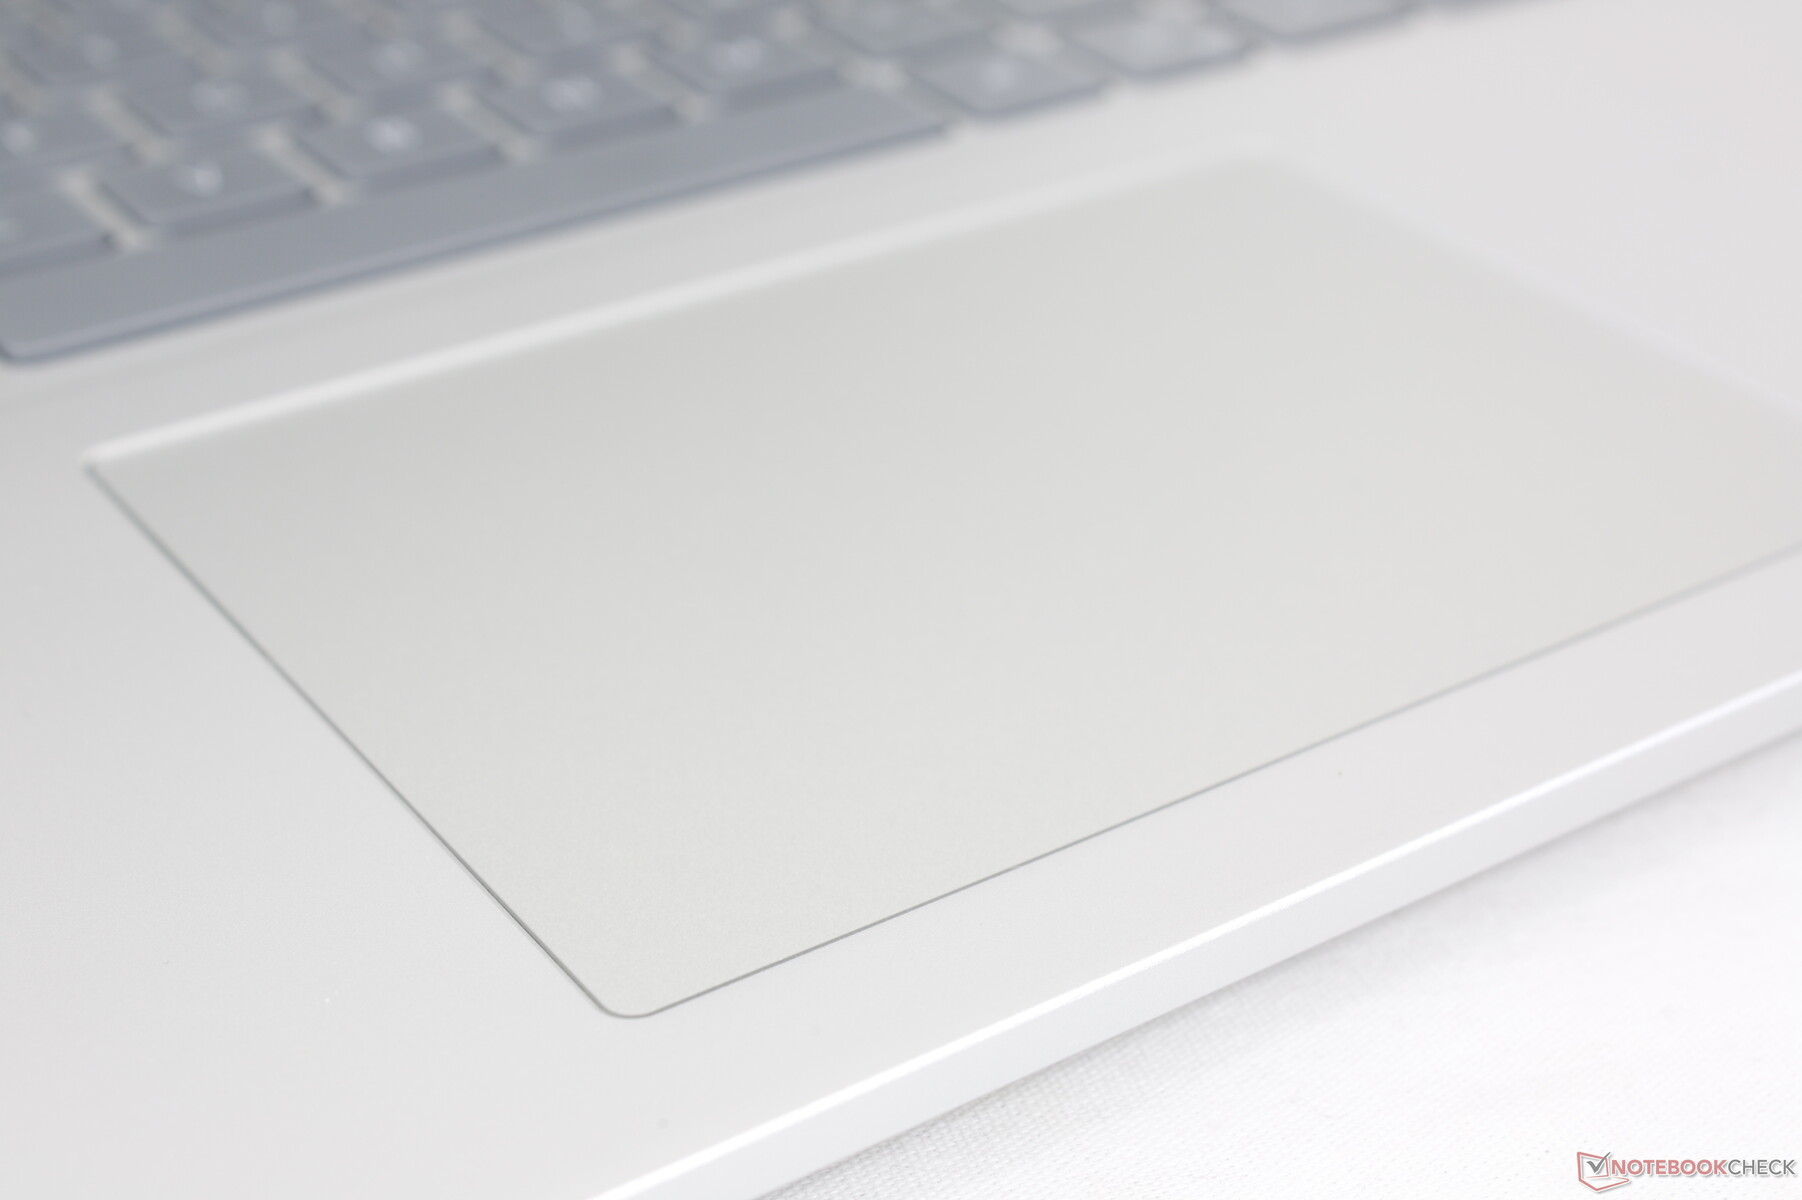
触摸板
点击板的大小与去年机型相同(11.5 x 8 厘米)。滑动很流畅,速度较慢时会有一些粘滞感,以便进行更准确的输入。遗憾的是,按下点击板时的反馈偏软,尽管有响亮的 "咔嗒 "声。
显示屏 - 体面,但选项有限
与旧款 Inspiron 16 Plus 7620 相比,显示屏选项发生了变化。3K 3072 x 1920 面板已不复存在,取而代之的是这两种新选择:
- 2560 x 1600 (2.5K), 120 Hz
- 1920 x 1200,60 赫兹
两个选项均为 IPS 非触摸屏,均不支持 G-Sync。下面的测量结果只反映了加粗的 1600p 选项。
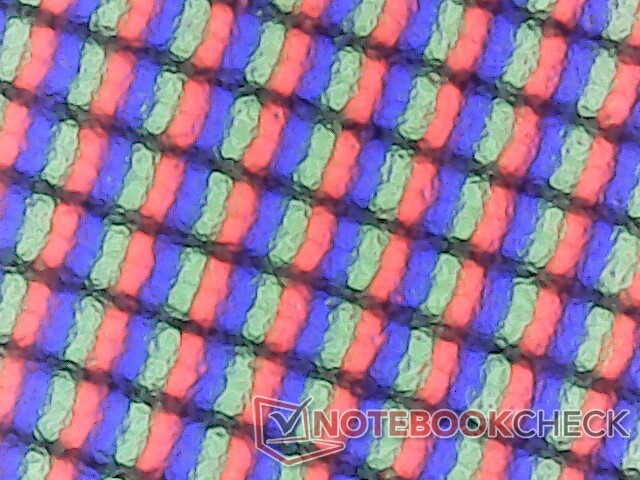
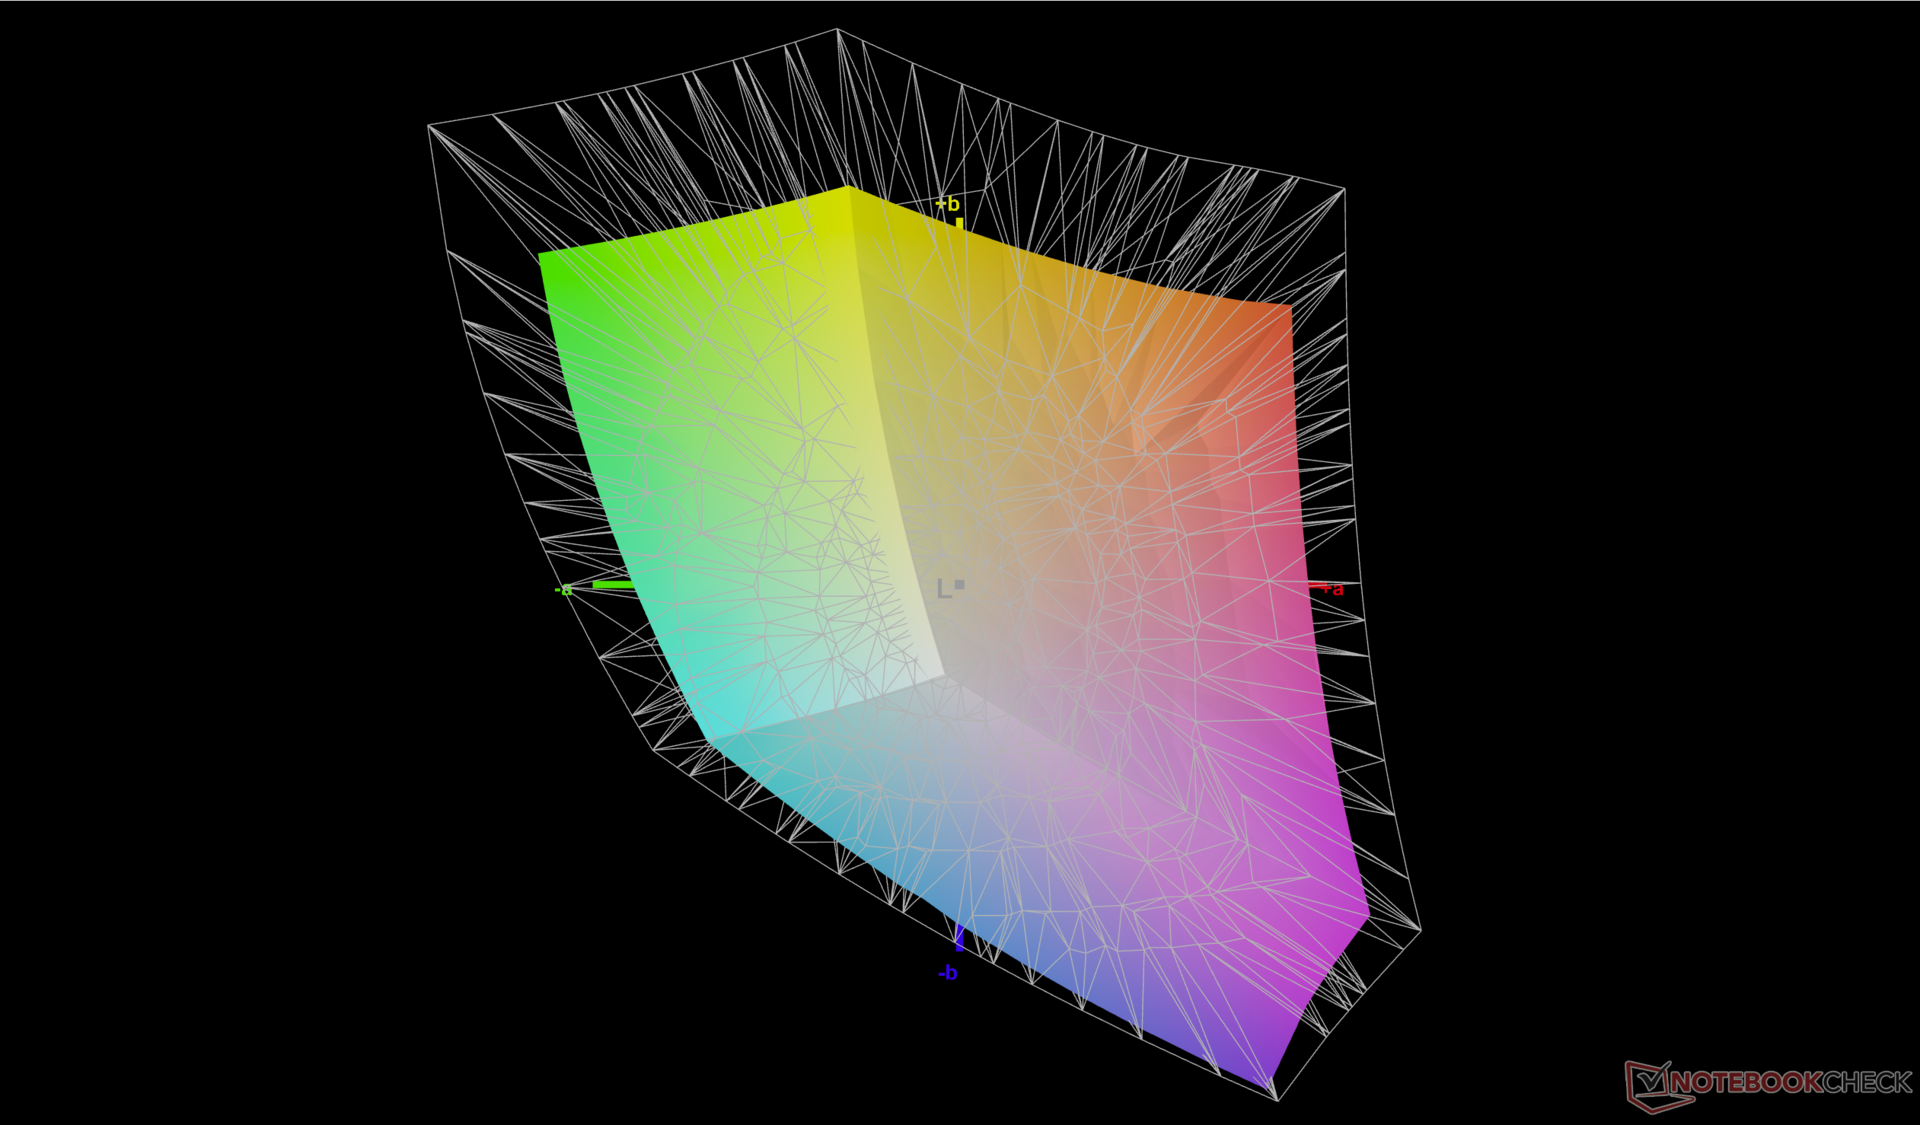
与去年的京东方 3K 面板相比,新的 LG 飞利浦 2.5K 面板的原生刷新率提高了一倍,但原生分辨率却降低了。在其他方面,它们的 sRGB 全覆盖、300 尼特亮度、大于 1000:1 的对比度和平均响应时间都非常相似。尽管如此,竞争机型如 Vivobook Pro 16X或 Envy 16 等竞争机型都提供了更高的分辨率和更深的色彩,内容创作者可能会喜欢它们。因此,我们的 LG 飞利浦面板更具预算意识。

| |||||||||||||||||||||||||
Brightness Distribution: 92 %
Center on Battery: 299.4 cd/m²
Contrast: 1426:1 (Black: 0.21 cd/m²)
ΔE Color 4.25 | 0.5-29.43 Ø4.87, calibrated: 0.52
ΔE Greyscale 5.5 | 0.5-98 Ø5.1
72.3% AdobeRGB 1998 (Argyll 2.2.0 3D)
99.6% sRGB (Argyll 2.2.0 3D)
70.1% Display P3 (Argyll 2.2.0 3D)
Gamma: 2.35
| Dell Inspiron 16 Plus 7630 LG Philips 160WQ2, IPS, 2560x1600, 16" | Dell Inspiron 16 Plus 7620 BOE NE16N41, IPS, 3072x1920, 16" | Lenovo Slim Pro 9i 16IRP8 LEN160-3.2K, Mini-LED, 3200x2000, 16" | Asus Vivobook Pro 16X K6604JV-MX016W Samsung SDC4178 ATNA60BX01-1, OLED, 3200x2000, 16" | HP Envy 16 h0112nr Samsung SDC4174, OLED, 3840x2400, 16" | MSI Summit E16 Flip A12UDT-031 AU Optronics B16QAN02.N, IPS, 2560x1600, 16" | |
|---|---|---|---|---|---|---|
| Display | 1% | 18% | 24% | 21% | 20% | |
| Display P3 Coverage | 70.1 | 70.8 1% | 95.1 36% | 98.4 40% | 99.3 42% | 98.9 41% |
| sRGB Coverage | 99.6 | 99.5 0% | 99.9 0% | 99.7 0% | 100 0% | 100 0% |
| AdobeRGB 1998 Coverage | 72.3 | 73.2 1% | 84.6 17% | 95.8 33% | 88 22% | 86.5 20% |
| Response Times | -13% | 61% | 95% | 93% | 63% | |
| Response Time Grey 50% / Grey 80% * | 35 ? | 38 ? -9% | 14 ? 60% | 1.6 ? 95% | 2 ? 94% | 13 ? 63% |
| Response Time Black / White * | 24.2 ? | 28 ? -16% | 9.2 ? 62% | 1.4 ? 94% | 1.9 ? 92% | 9 ? 63% |
| PWM Frequency | 5784 ? | 120 ? | 240.4 ? | |||
| Screen | 14% | -55% | 35% | 30% | -5% | |
| Brightness middle | 299.4 | 288.9 -4% | 627.4 110% | 347 16% | 328.8 10% | 314 5% |
| Brightness | 290 | 276 -5% | 618 113% | 346 19% | 332 14% | 294 1% |
| Brightness Distribution | 92 | 92 0% | 95 3% | 97 5% | 97 5% | 89 -3% |
| Black Level * | 0.21 | 0.26 -24% | 0.19 10% | 0.06 71% | 0.28 -33% | |
| Contrast | 1426 | 1111 -22% | 3302 132% | 5783 306% | 1121 -21% | |
| Colorchecker dE 2000 * | 4.25 | 1.88 56% | 5.84 -37% | 1.89 56% | 1.53 64% | 3.08 28% |
| Colorchecker dE 2000 max. * | 6.71 | 4.37 35% | 10.22 -52% | 3.26 51% | 6.04 10% | 5.49 18% |
| Colorchecker dE 2000 calibrated * | 0.52 | 0.42 19% | 4.45 -756% | 1.97 -279% | 0.88 -69% | |
| Greyscale dE 2000 * | 5.5 | 1.4 75% | 6.7 -22% | 1.55 72% | 1.3 76% | 3.99 27% |
| Gamma | 2.35 94% | 2.3 96% | 2.77 79% | 2.39 92% | 2.18 101% | 2.3 96% |
| CCT | 6368 102% | 6634 98% | 5795 112% | 6458 101% | 6362 102% | 6219 105% |
| Total Average (Program / Settings) | 1% /
8% | 8% /
-23% | 51% /
41% | 48% /
39% | 26% /
10% |
* ... smaller is better
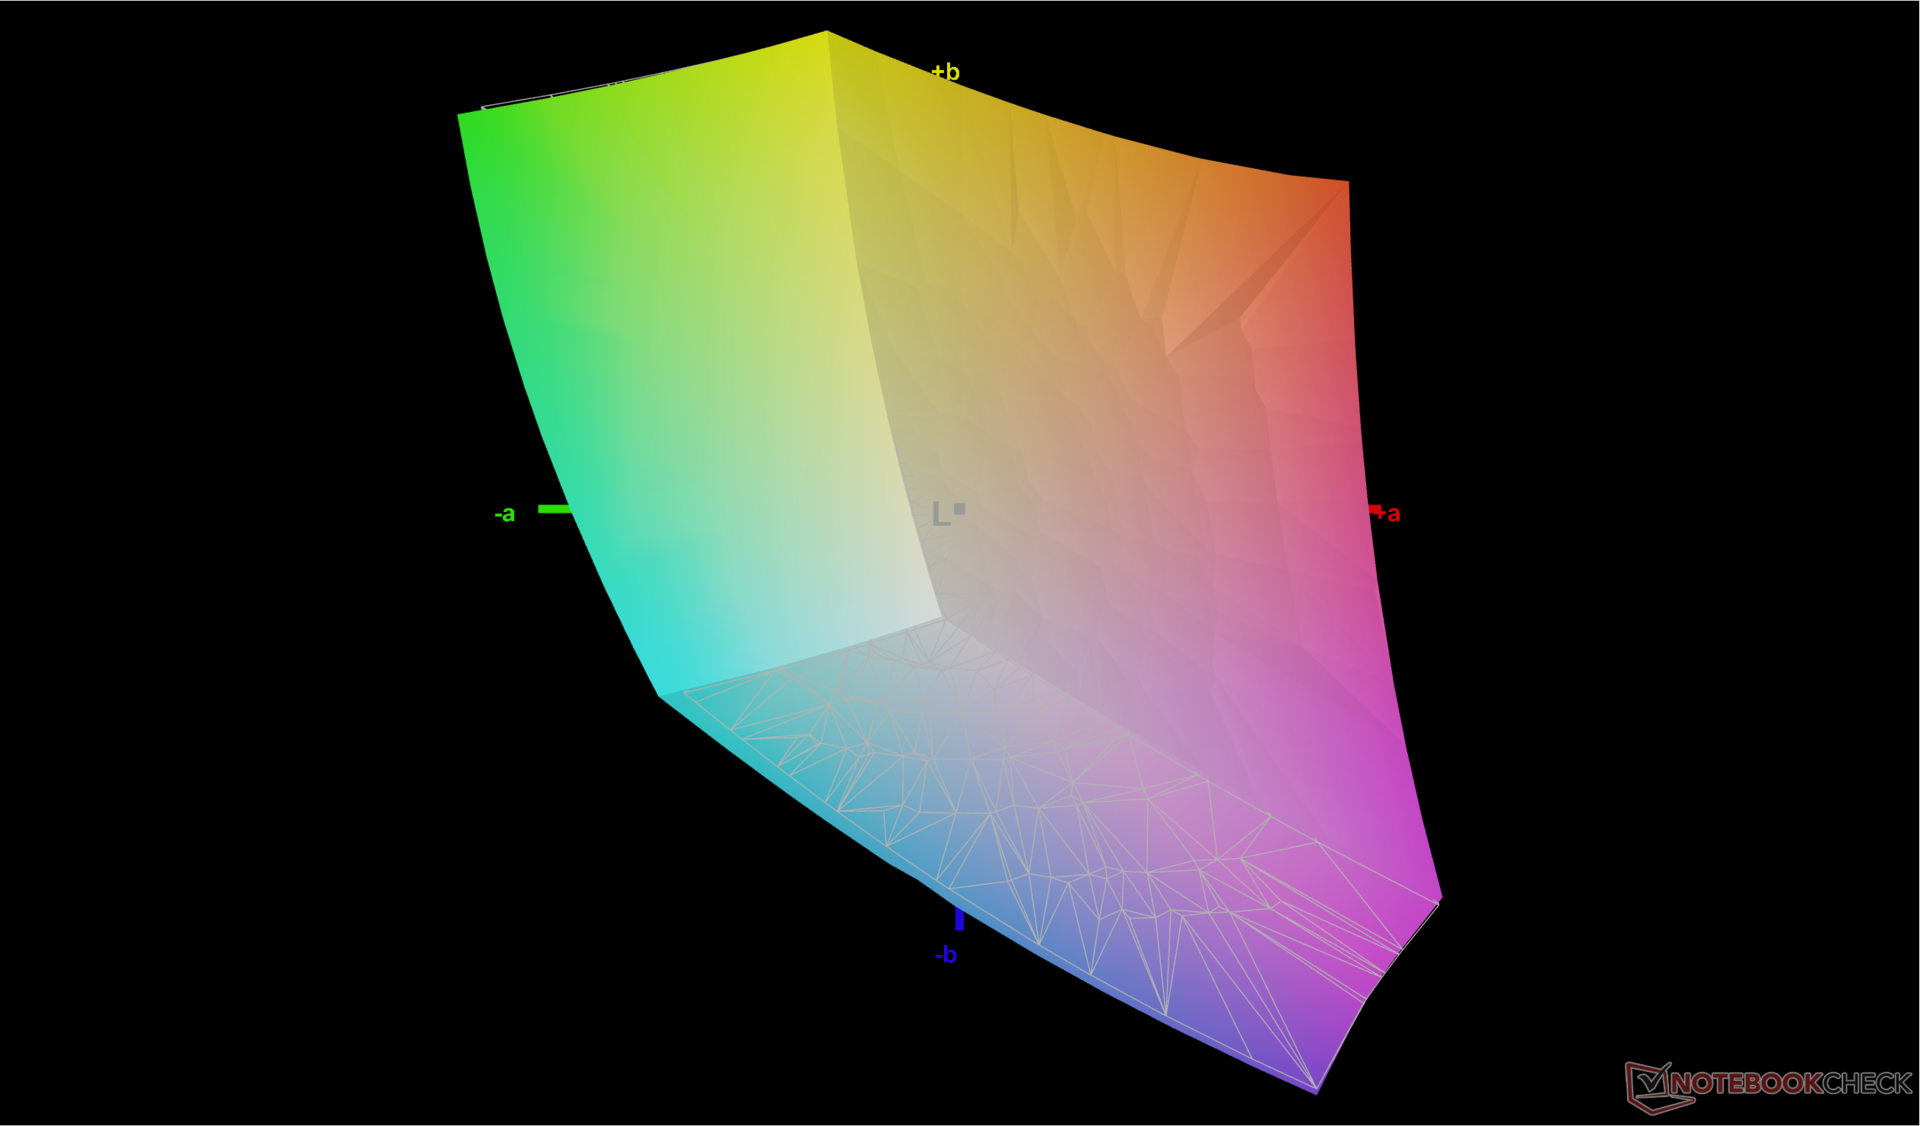
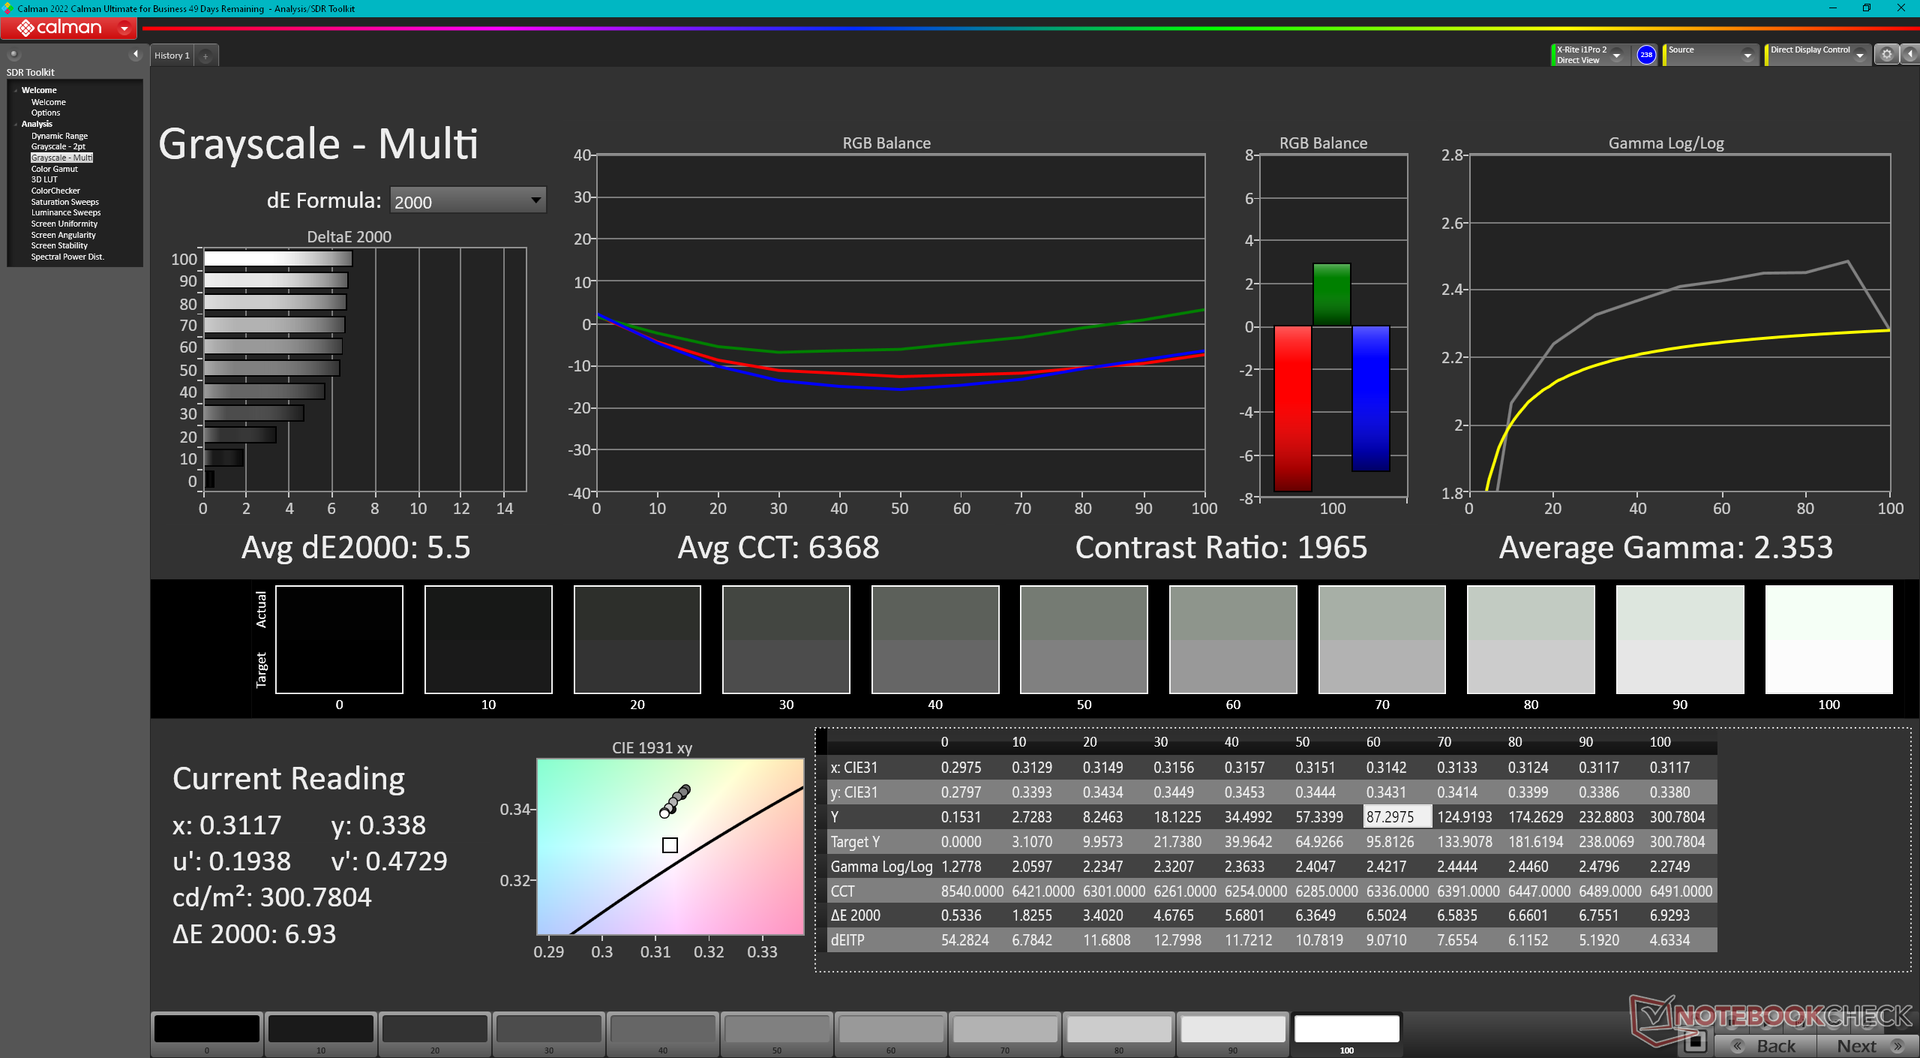
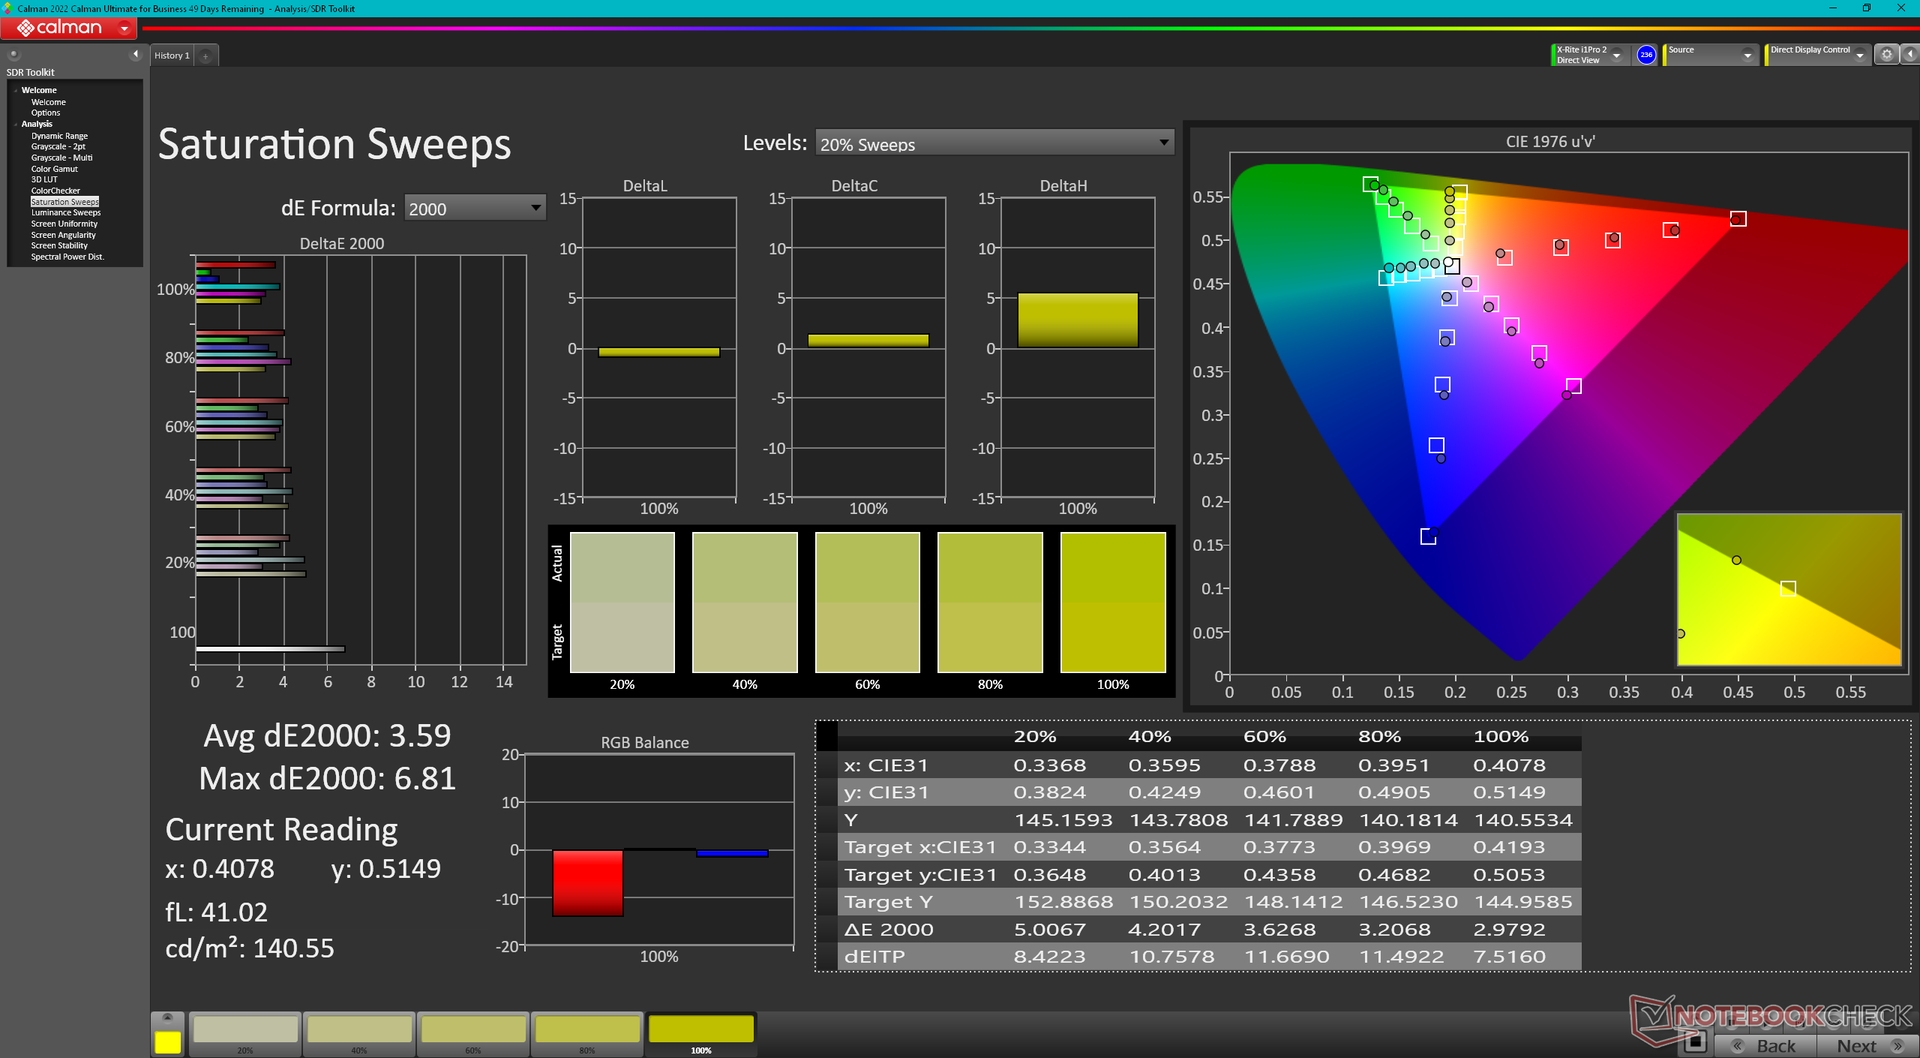
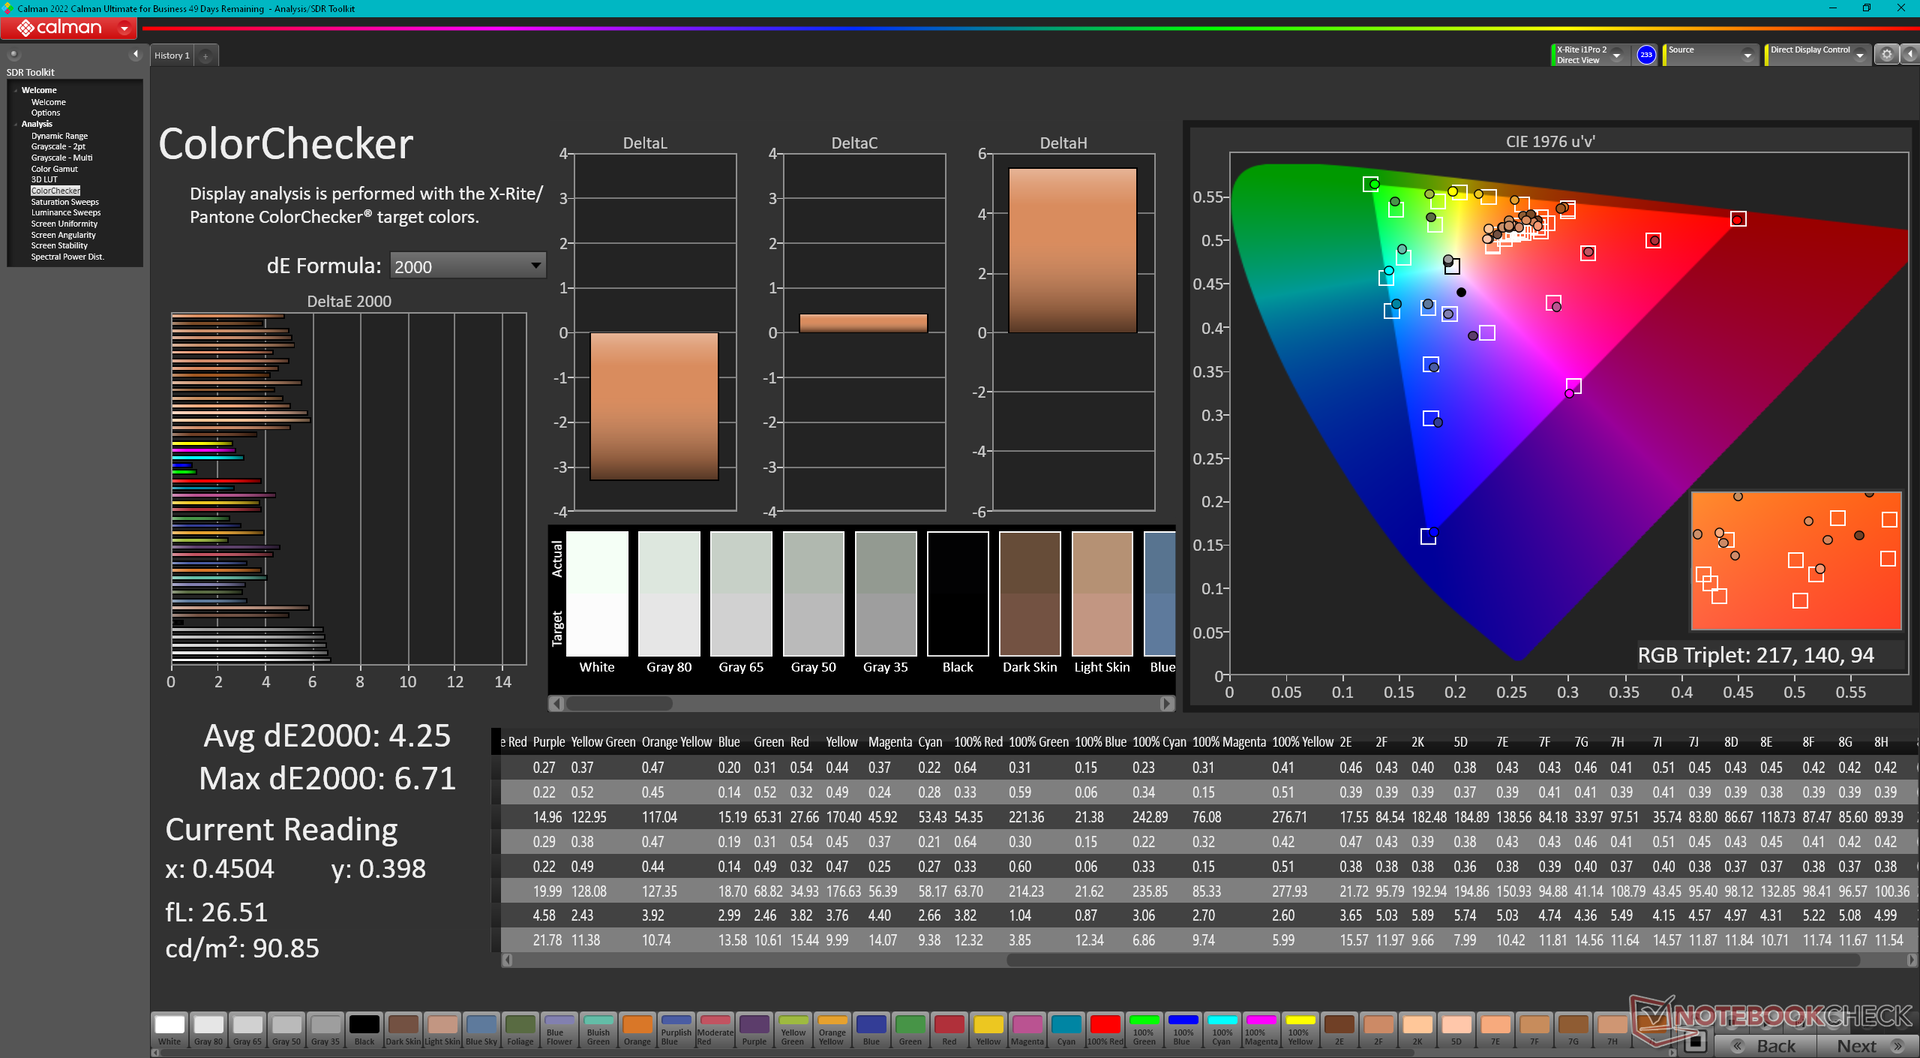
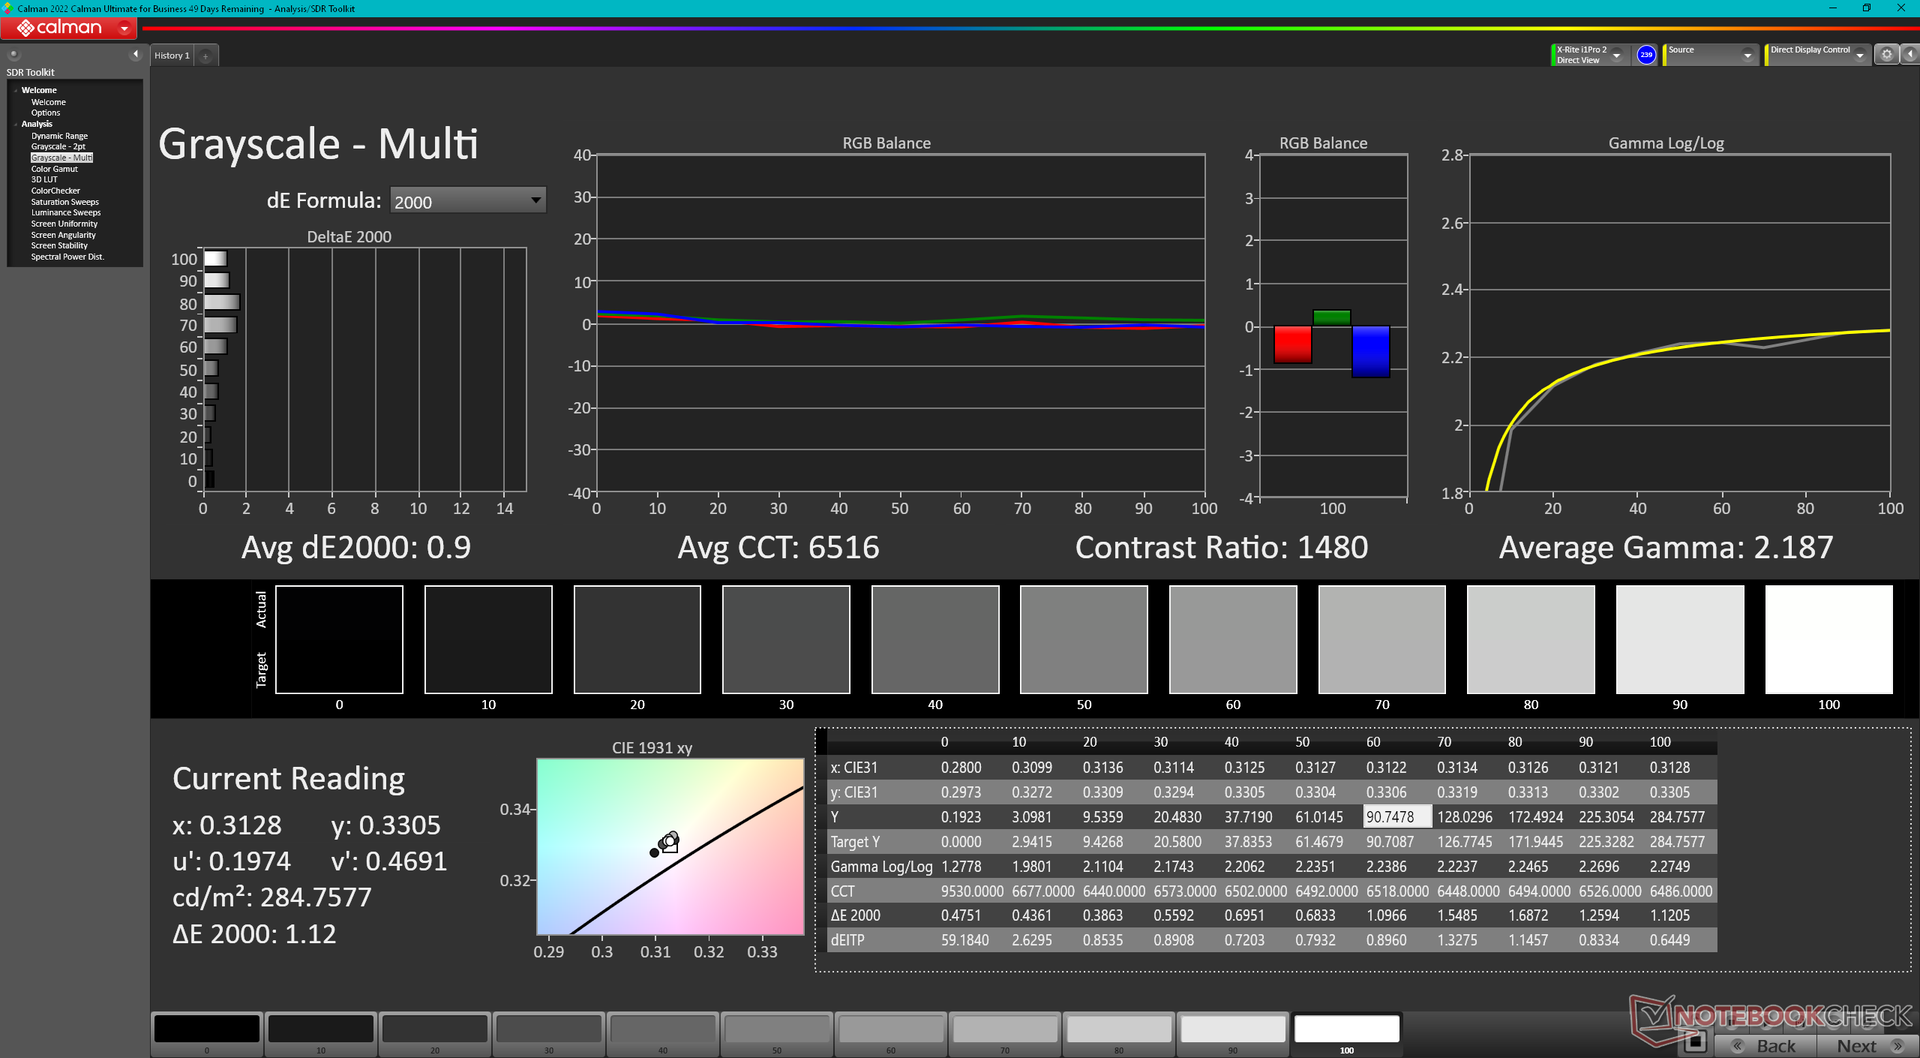
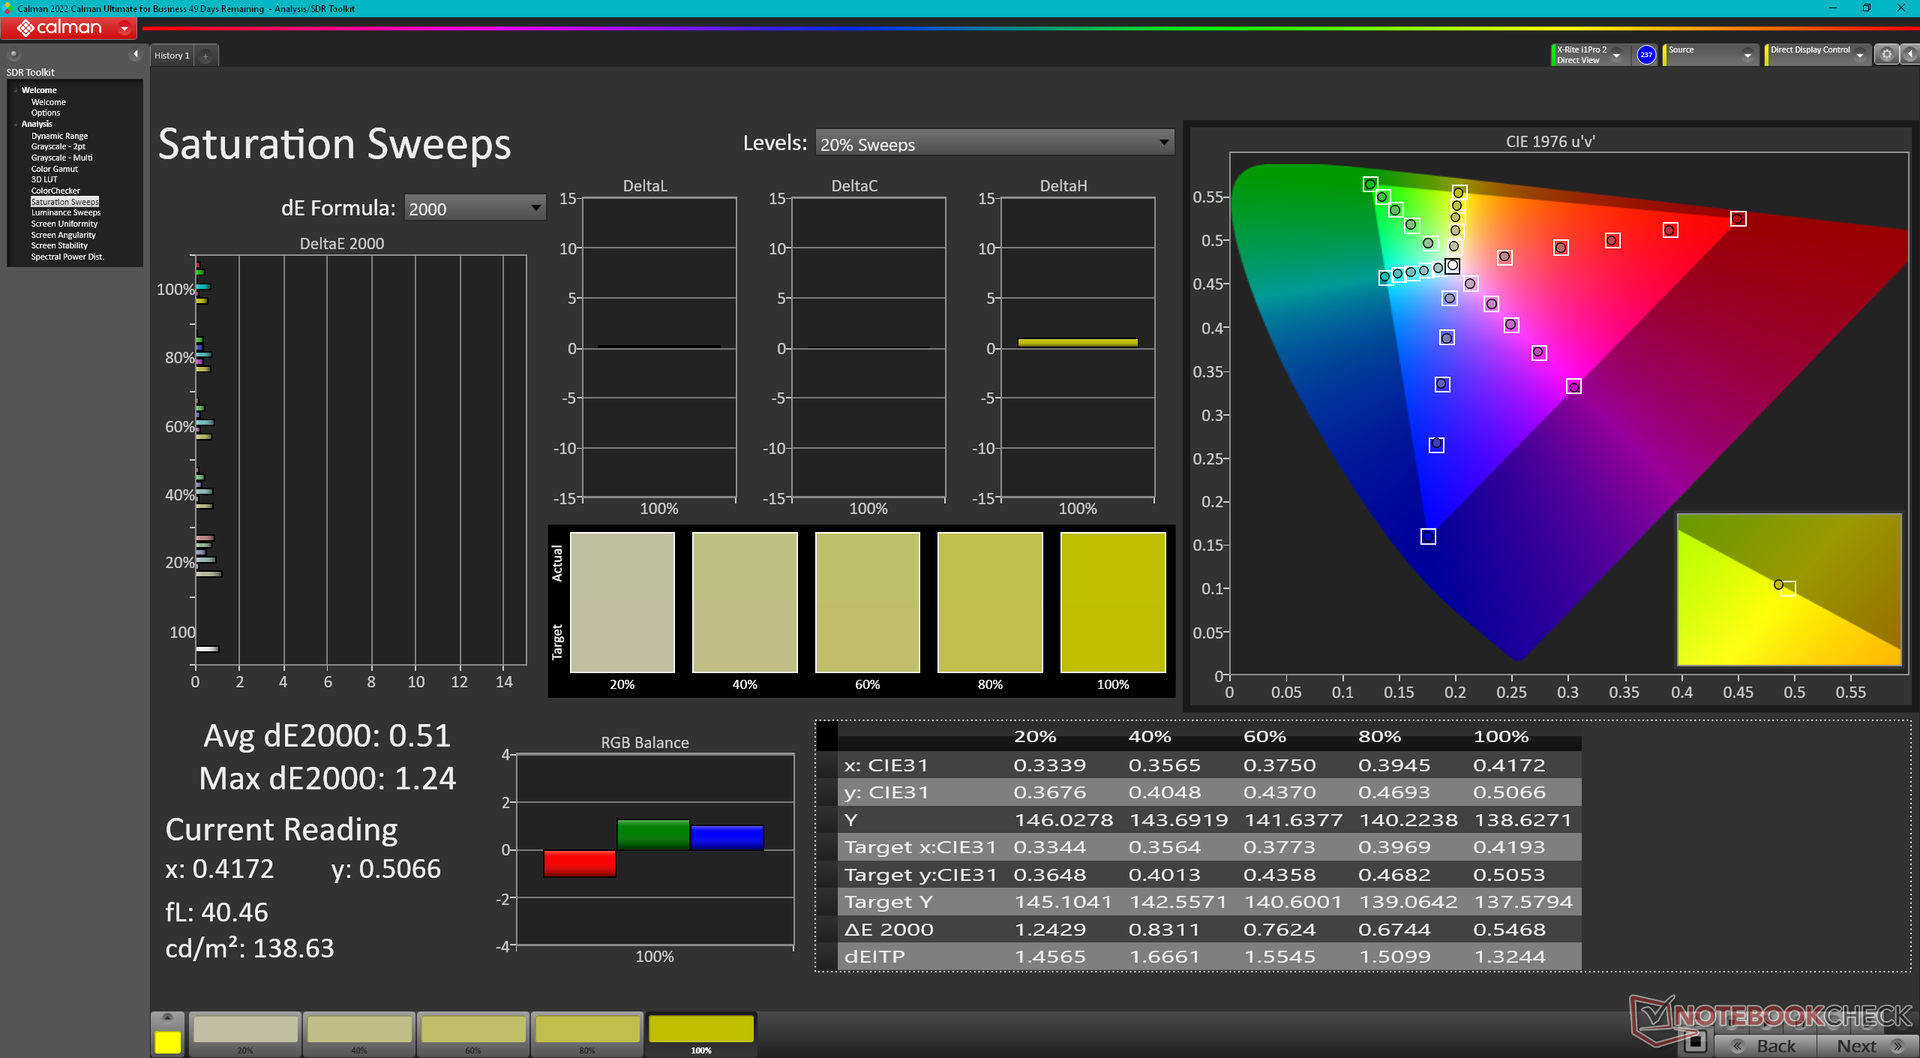
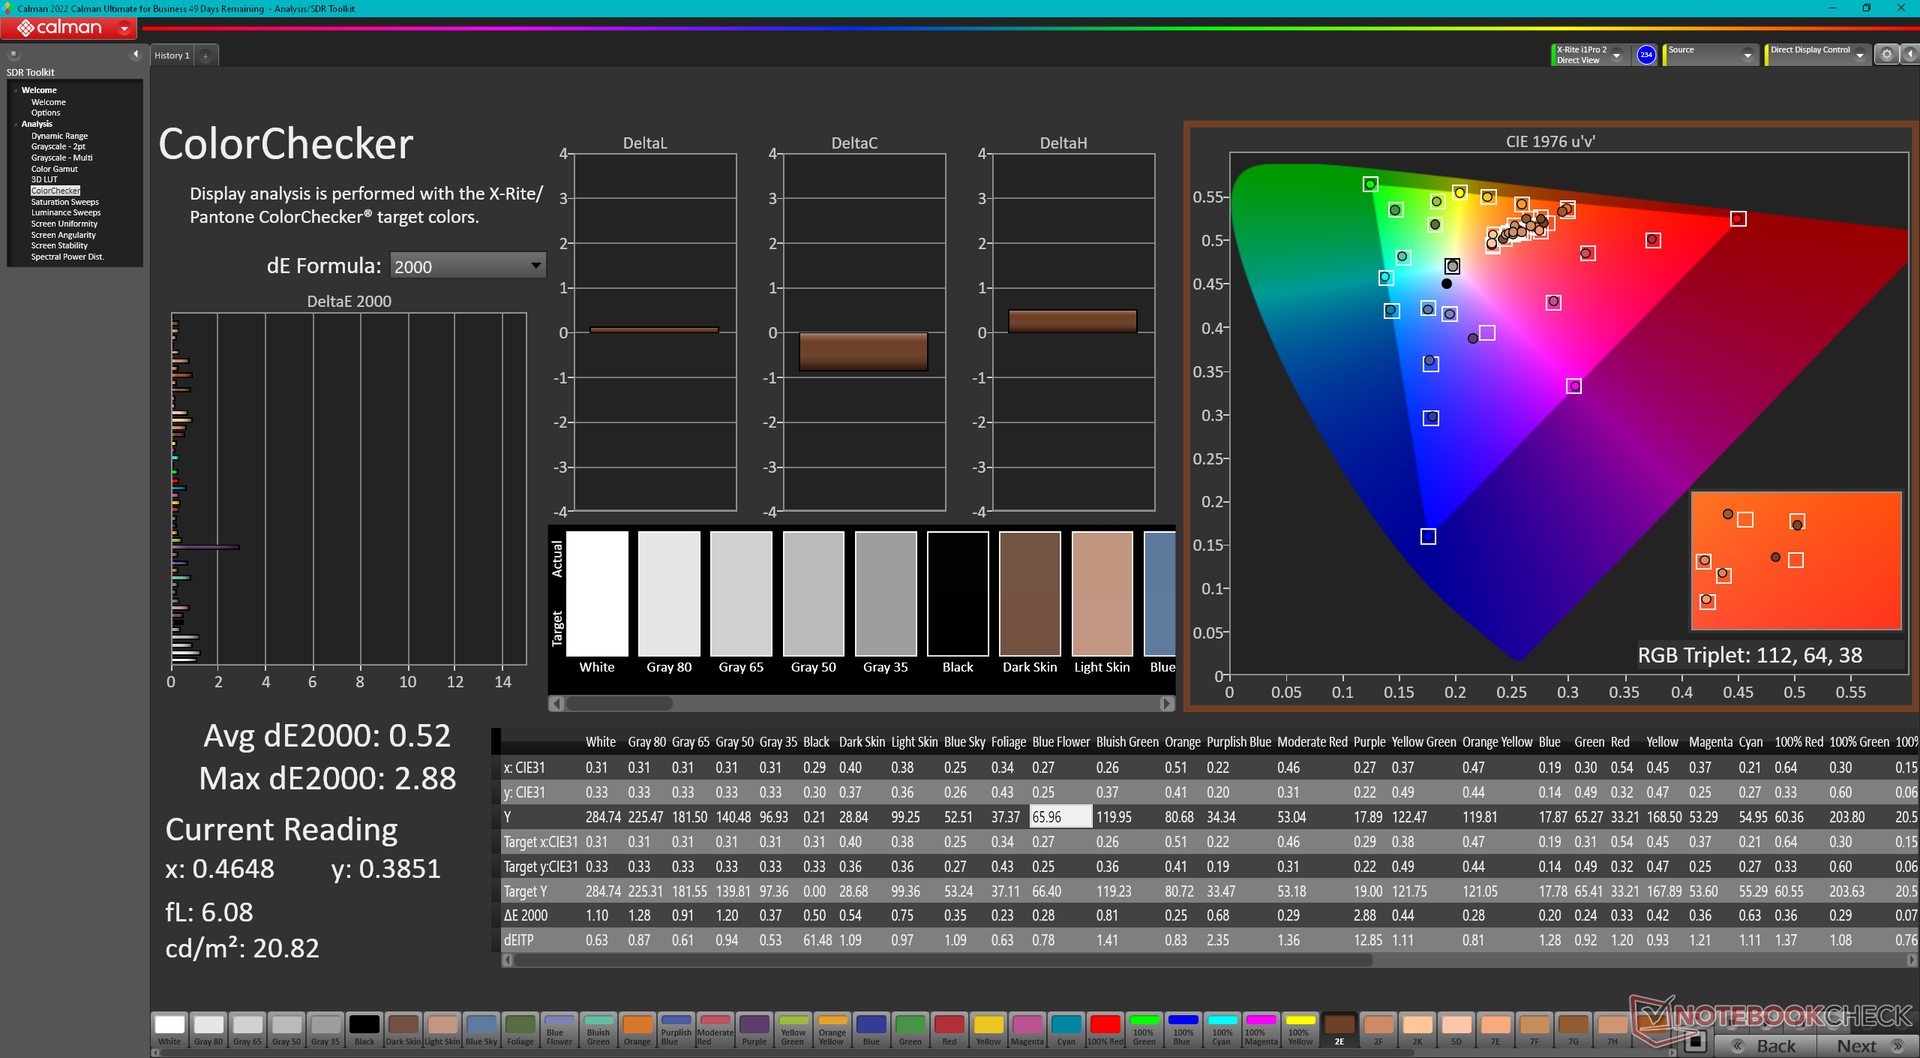
显示屏没有经过预校准,灰度和色彩 deltaE 平均值分别为 5.5 和 4.25。色温为 6368,也比通常要高。使用我们的 X-Rite 色度计进行适当的校准,可以解决所有这些问题,使显示效果明显更准确,如下所示的 CalMAN 结果。如果用户没有自己的校准工具,可以免费下载我们校准过的 ICM 配置文件。
Display Response Times
| ↔ Response Time Black to White | ||
|---|---|---|
| 24.2 ms ... rise ↗ and fall ↘ combined | ↗ 10.8 ms rise | 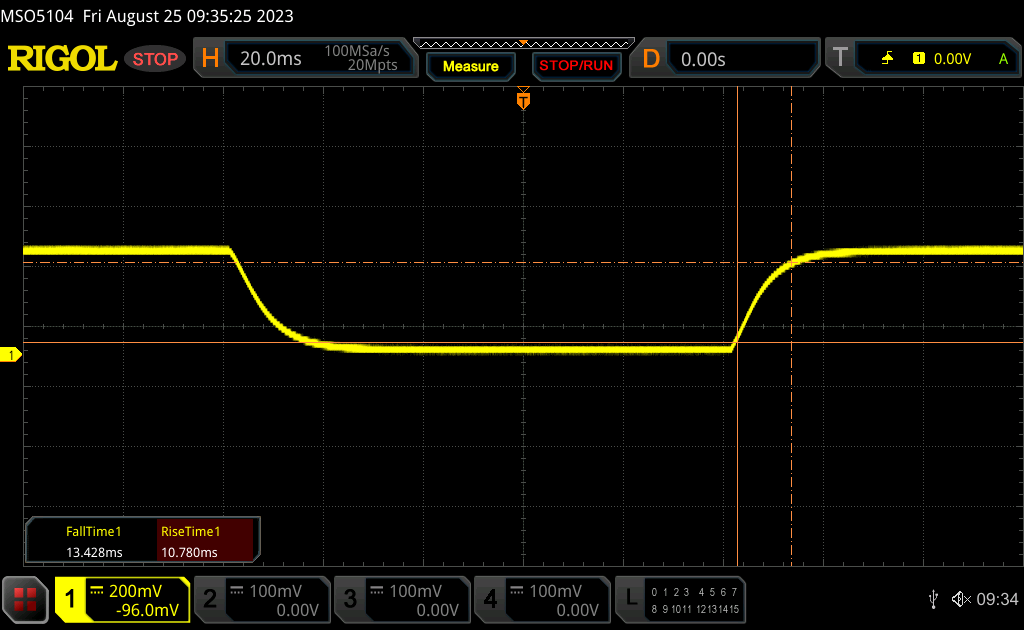 |
| ↘ 13.4 ms fall | ||
| The screen shows good response rates in our tests, but may be too slow for competitive gamers. In comparison, all tested devices range from 0.1 (minimum) to 240 (maximum) ms. » 54 % of all devices are better. This means that the measured response time is worse than the average of all tested devices (20.8 ms). | ||
| ↔ Response Time 50% Grey to 80% Grey | ||
| 35 ms ... rise ↗ and fall ↘ combined | ↗ 15.7 ms rise | 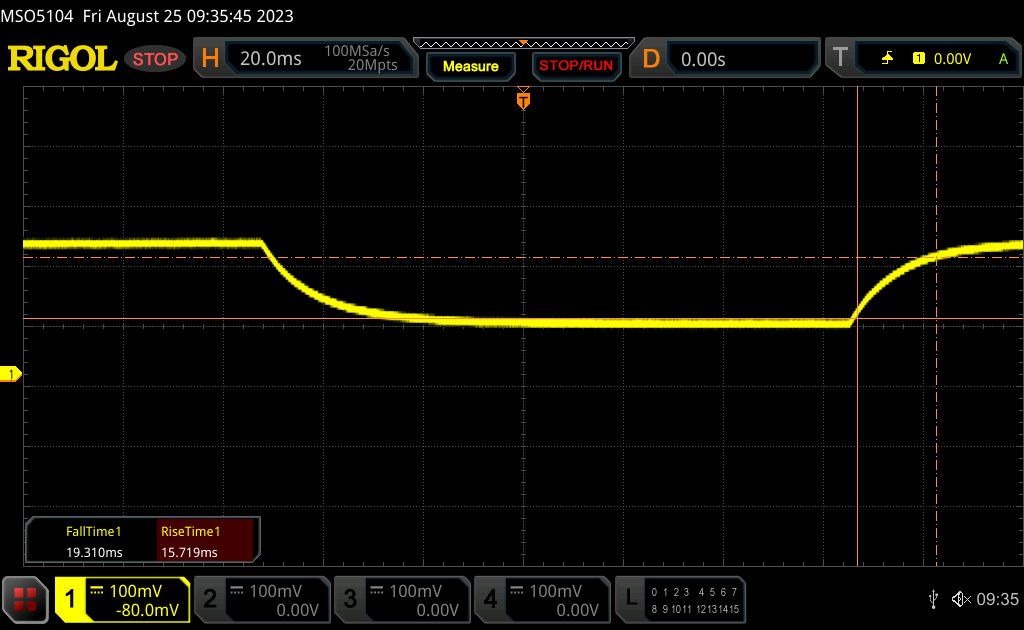 |
| ↘ 19.3 ms fall | ||
| The screen shows slow response rates in our tests and will be unsatisfactory for gamers. In comparison, all tested devices range from 0.165 (minimum) to 636 (maximum) ms. » 45 % of all devices are better. This means that the measured response time is similar to the average of all tested devices (32.5 ms). | ||
Screen Flickering / PWM (Pulse-Width Modulation)
| Screen flickering / PWM not detected | 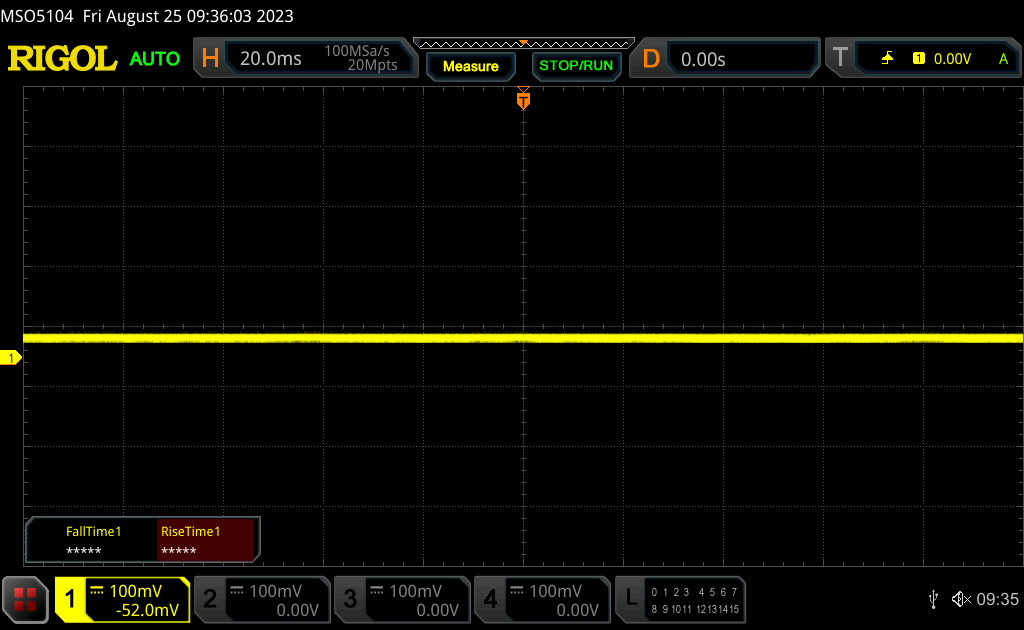 | ||
In comparison: 53 % of all tested devices do not use PWM to dim the display. If PWM was detected, an average of 8516 (minimum: 5 - maximum: 343500) Hz was measured. | |||
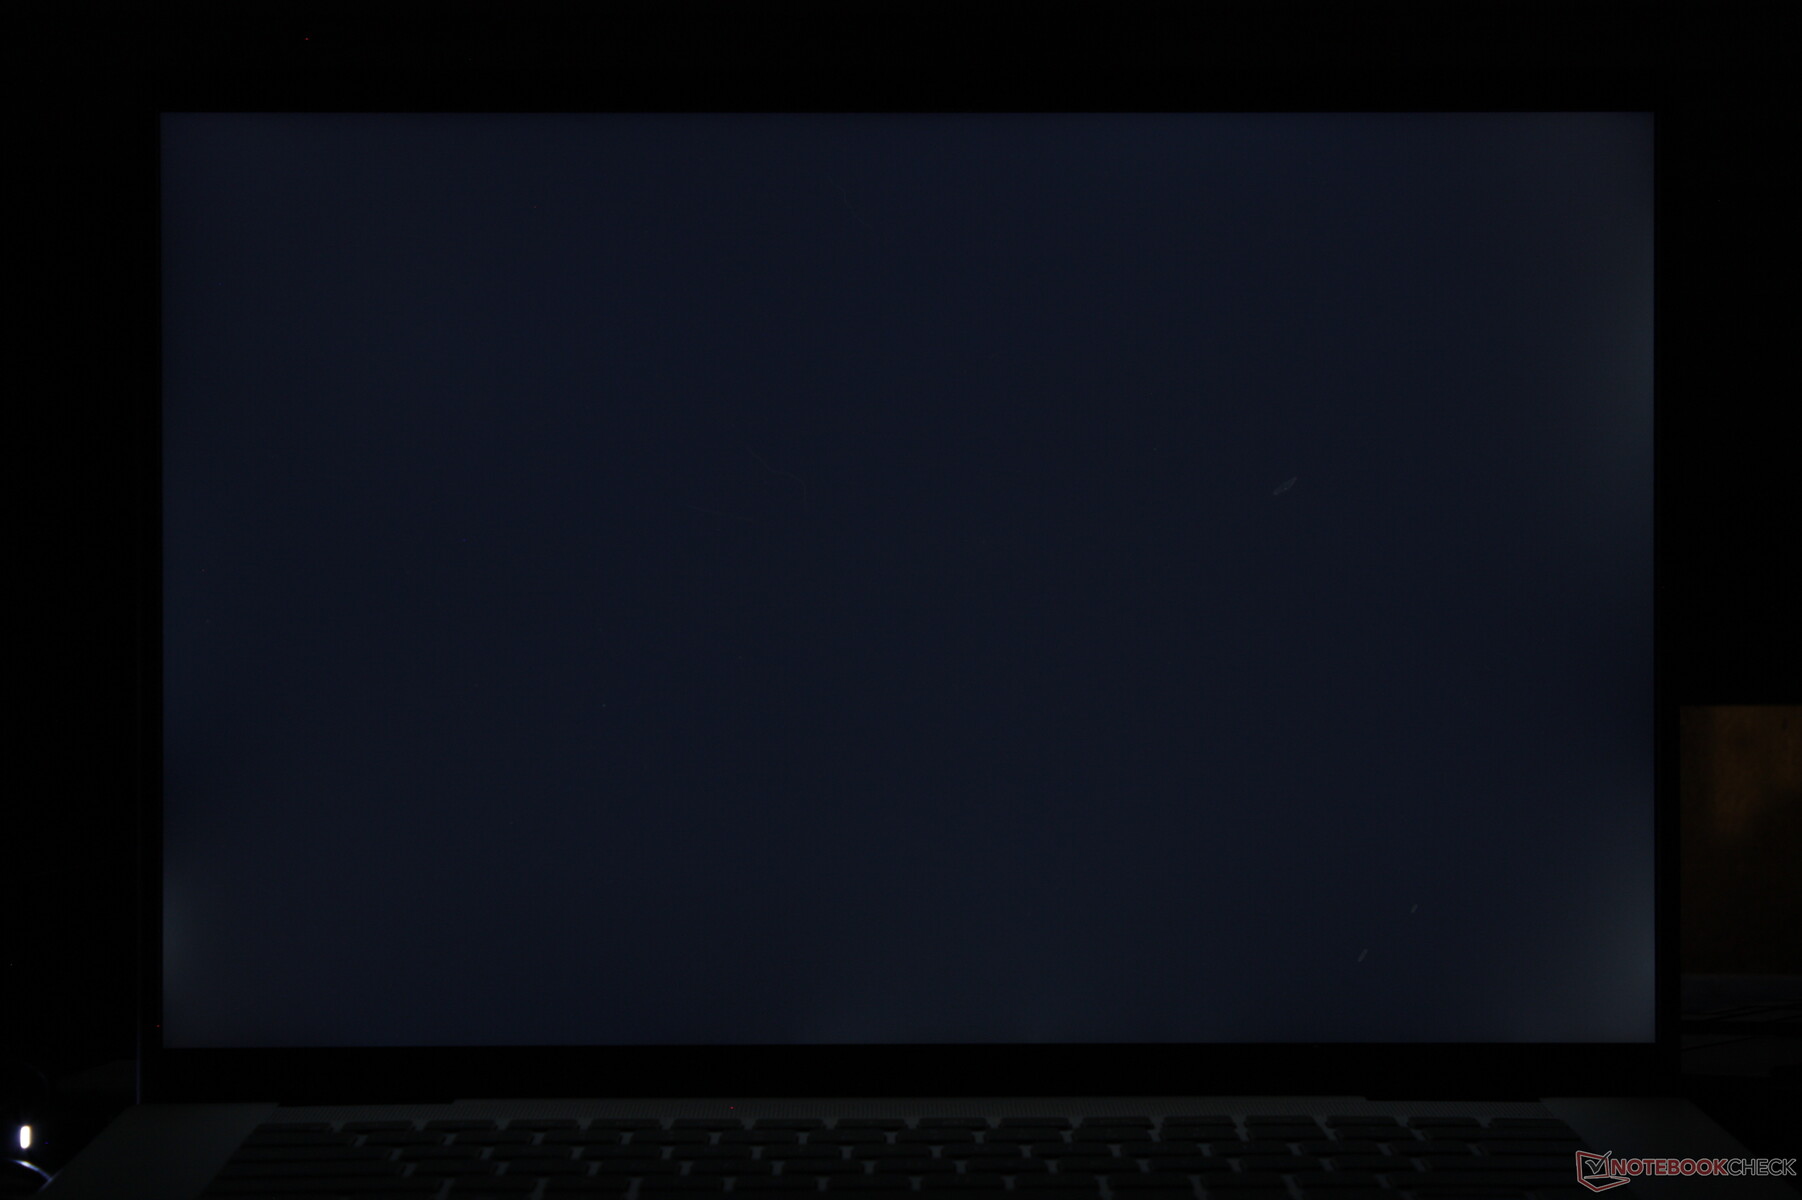
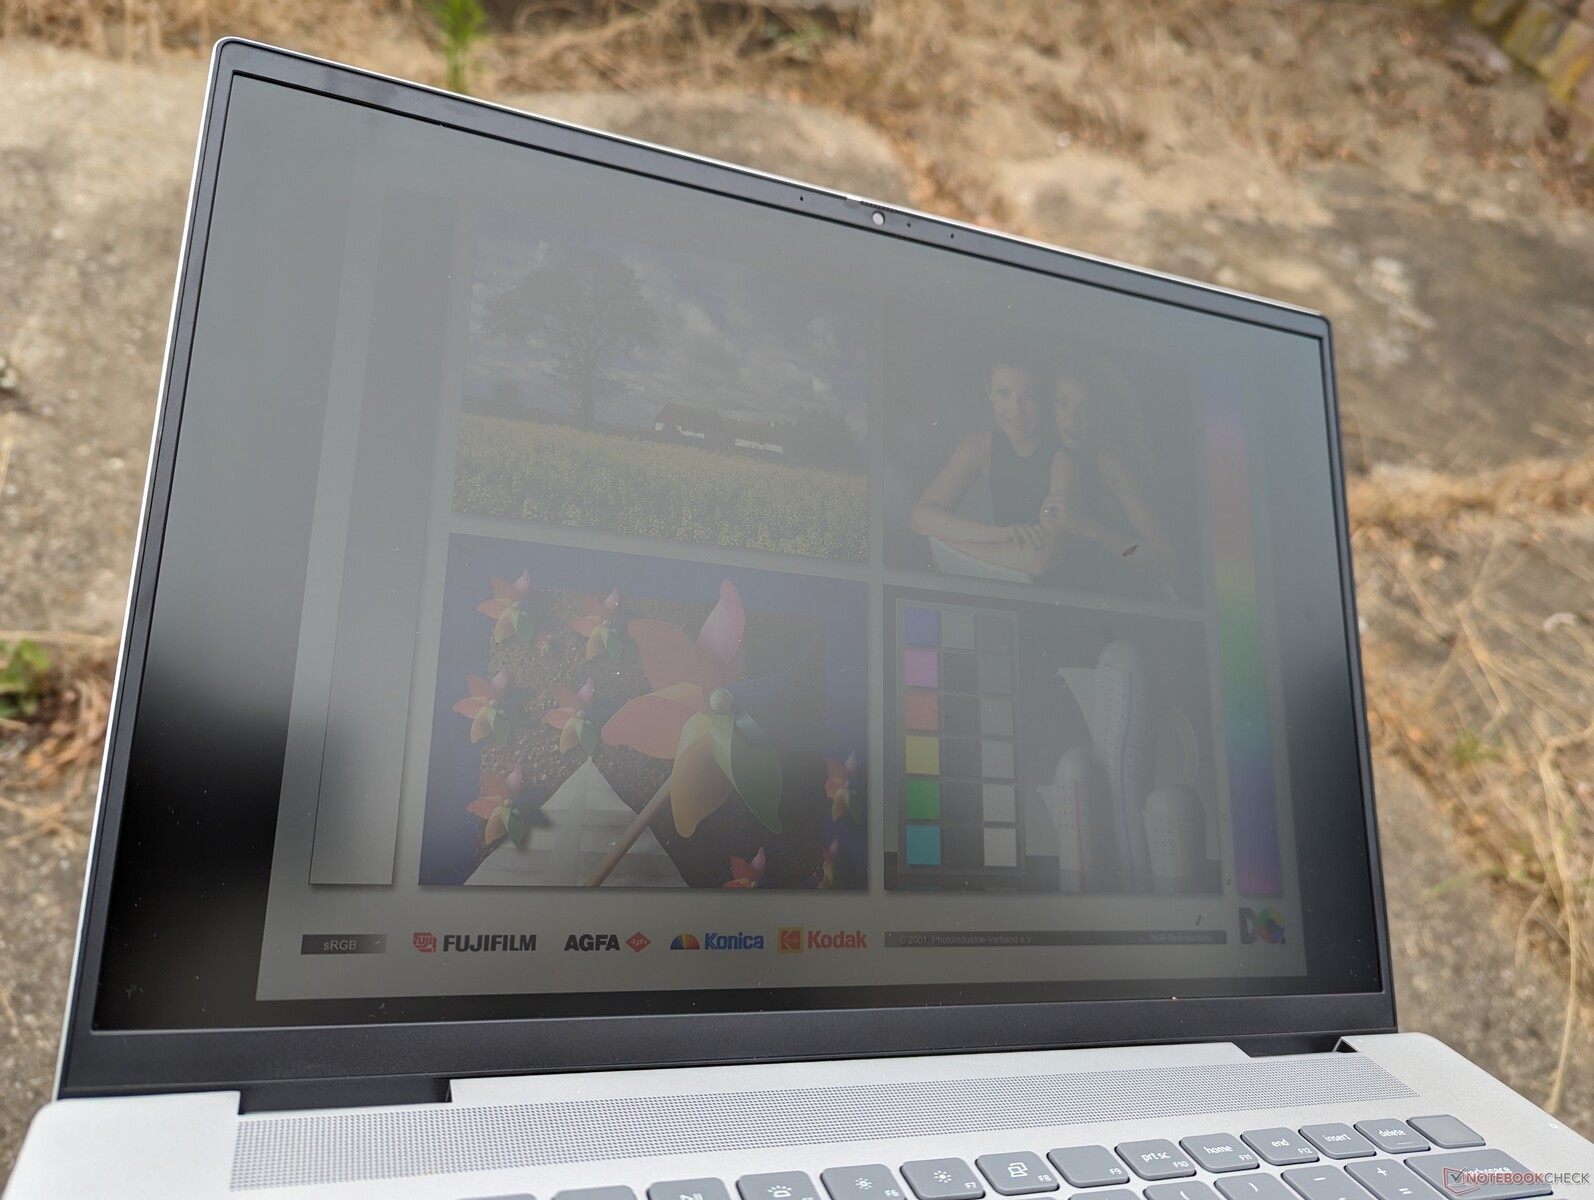
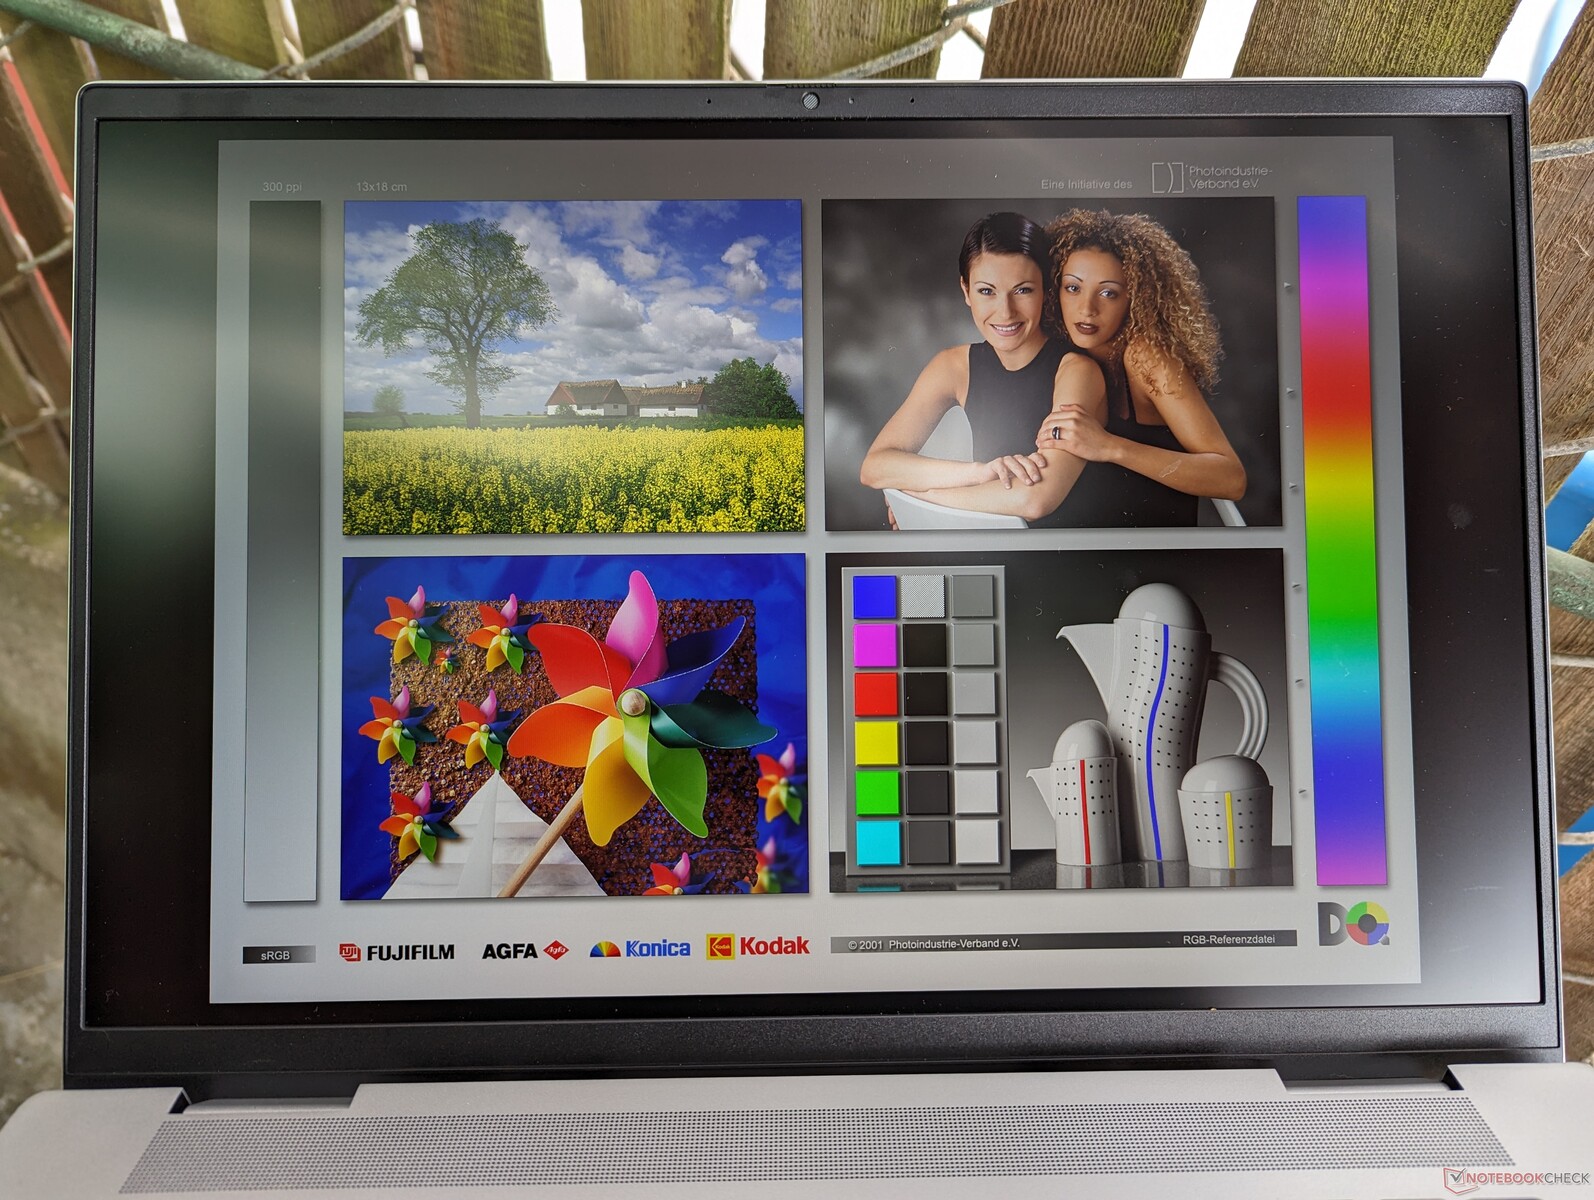
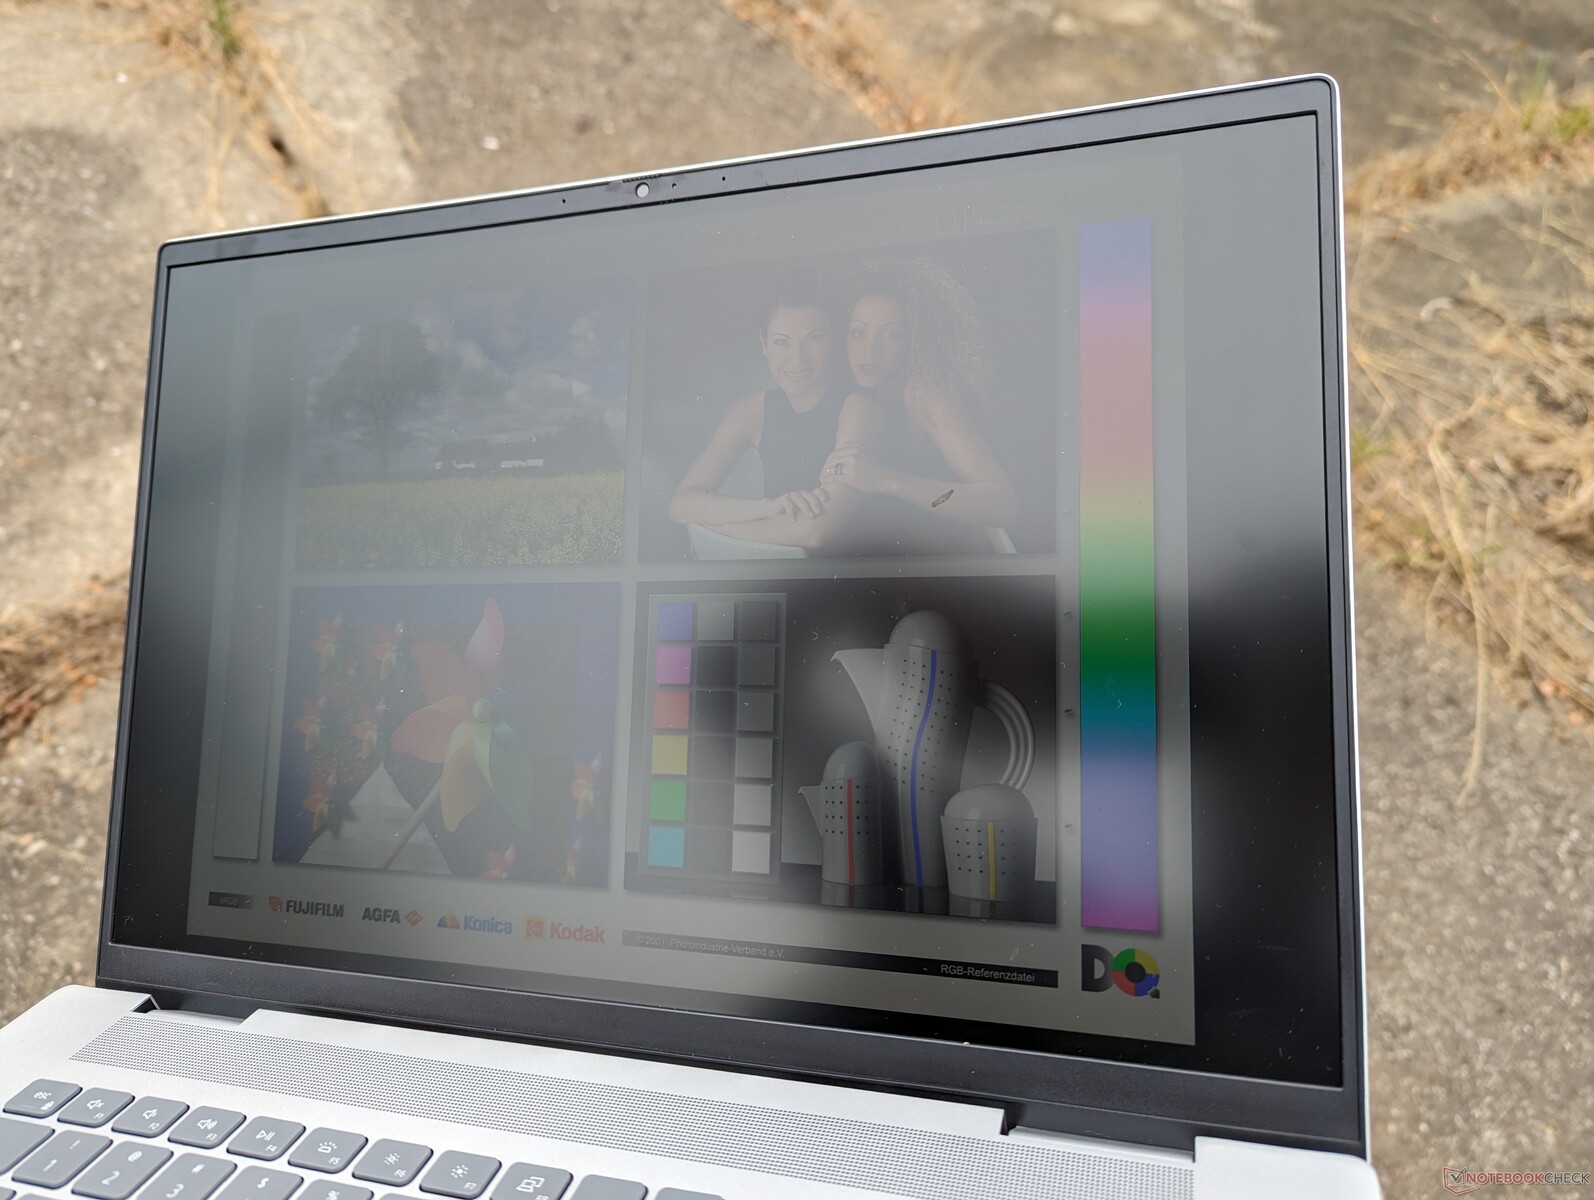
室外能见度与去年的机型相当,只有在阴凉处才能最大限度地减少眩光。其他采用迷你 LED 或 OLED 的 16 英寸笔记本电脑,如 Yoga 9i 16 或 Razer Blade 16等其他采用迷你 LED 或 OLED 显示屏的 16 英寸笔记本电脑亮度更高,室外可视性更好,但价格也比戴尔贵得多。

性能 - 英特尔第 13 代 Raptor Lake-H

测试条件
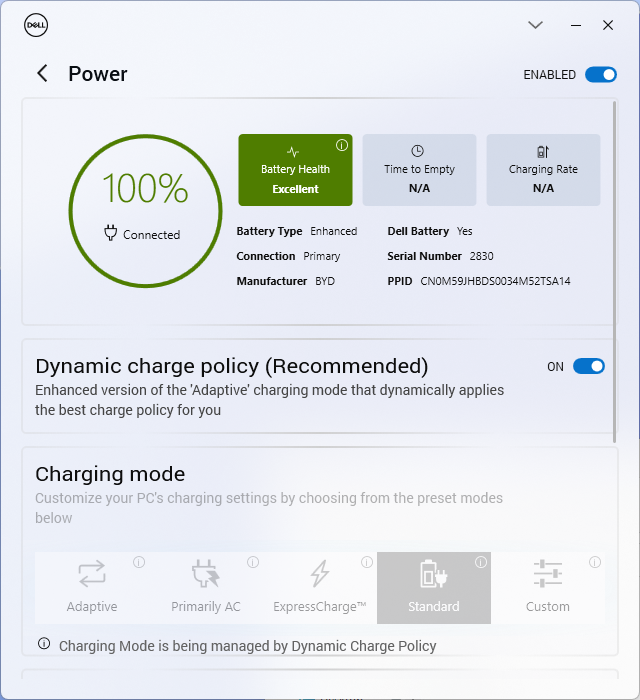
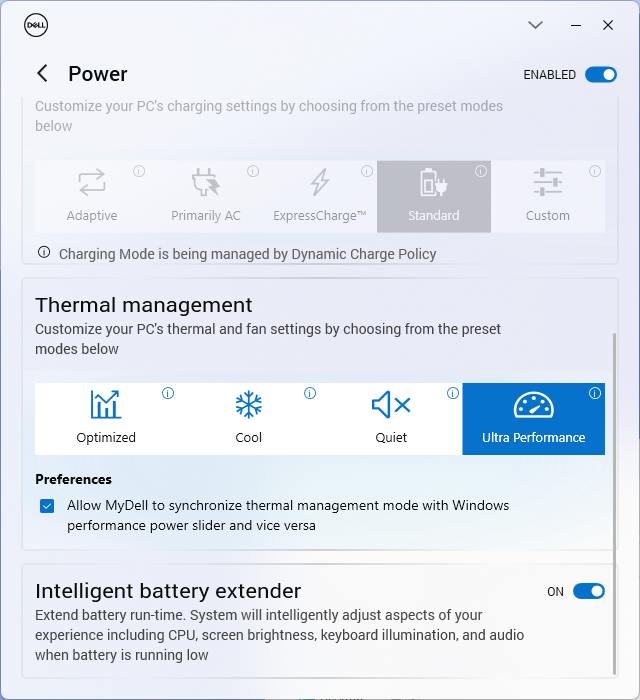
在运行以下基准测试之前,我们通过预装的 MyDell 软件将设备设置为性能模式。MyDell 电源配置文件可与 Windows 电源配置文件同步,以减少混乱并避免设置冲突。
Inspiron 不支持 Advanced Optimus 或 MUX,而这是戴尔 G 系列或 Alienware 系列专用游戏机型的常见功能。
处理器
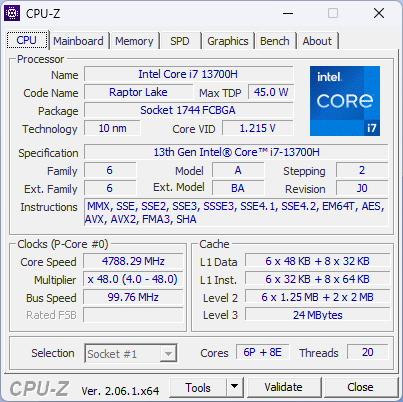
第 13 代 酷睿 i7-13700H 仅比第 12 代 酷睿 i7-12700H快 10%。然而,一旦各自的 Turbo Boost 优势减弱,它们的性能差距就会变得更小,正如下面的 CineBench R15 xT 循环结果所示。换句话说,就处理器性能而言,Inspiron 16 Plus 7630 最多只能比去年的机型快一点点。
降级到 酷睿 i5-13500H根据我们使用华硕 VivoBook 14 的经验,降级到酷睿 i5-13500H 配置对处理器性能的影响预计只有 10%左右。 华硕 VivoBook 14X.同时,基于 AMD 的 Ryzen 7 7840HS配置的性能预计将与我们的酷睿 i7-13700H 不相上下。
Cinebench R15 Multi Loop
Cinebench R23: Multi Core | Single Core
Cinebench R20: CPU (Multi Core) | CPU (Single Core)
Cinebench R15: CPU Multi 64Bit | CPU Single 64Bit
Blender: v2.79 BMW27 CPU
7-Zip 18.03: 7z b 4 | 7z b 4 -mmt1
Geekbench 5.5: Multi-Core | Single-Core
HWBOT x265 Benchmark v2.2: 4k Preset
LibreOffice : 20 Documents To PDF
R Benchmark 2.5: Overall mean
* ... smaller is better
AIDA64: FP32 Ray-Trace | FPU Julia | CPU SHA3 | CPU Queen | FPU SinJulia | FPU Mandel | CPU AES | CPU ZLib | FP64 Ray-Trace | CPU PhotoWorxx
| Performance Rating | |
| Asus Vivobook Pro 16X K6604JV-MX016W | |
| Lenovo Slim Pro 9i 16IRP8 | |
| Average Intel Core i7-13700H | |
| Dell Inspiron 16 Plus 7630 | |
| MSI Summit E16 Flip A12UDT-031 | |
| HP Envy 16 h0112nr | |
| Dell Inspiron 16 Plus 7620 | |
| AIDA64 / FP32 Ray-Trace | |
| Asus Vivobook Pro 16X K6604JV-MX016W | |
| Lenovo Slim Pro 9i 16IRP8 | |
| Average Intel Core i7-13700H (4986 - 18908, n=29) | |
| Dell Inspiron 16 Plus 7630 | |
| MSI Summit E16 Flip A12UDT-031 | |
| Dell Inspiron 16 Plus 7620 | |
| HP Envy 16 h0112nr | |
| AIDA64 / FPU Julia | |
| Asus Vivobook Pro 16X K6604JV-MX016W | |
| Lenovo Slim Pro 9i 16IRP8 | |
| Average Intel Core i7-13700H (25360 - 92359, n=29) | |
| Dell Inspiron 16 Plus 7630 | |
| MSI Summit E16 Flip A12UDT-031 | |
| Dell Inspiron 16 Plus 7620 | |
| HP Envy 16 h0112nr | |
| AIDA64 / CPU SHA3 | |
| Asus Vivobook Pro 16X K6604JV-MX016W | |
| Lenovo Slim Pro 9i 16IRP8 | |
| Average Intel Core i7-13700H (1339 - 4224, n=29) | |
| Dell Inspiron 16 Plus 7630 | |
| MSI Summit E16 Flip A12UDT-031 | |
| Dell Inspiron 16 Plus 7620 | |
| HP Envy 16 h0112nr | |
| AIDA64 / CPU Queen | |
| Asus Vivobook Pro 16X K6604JV-MX016W | |
| Lenovo Slim Pro 9i 16IRP8 | |
| Dell Inspiron 16 Plus 7630 | |
| HP Envy 16 h0112nr | |
| MSI Summit E16 Flip A12UDT-031 | |
| Average Intel Core i7-13700H (59324 - 107159, n=29) | |
| Dell Inspiron 16 Plus 7620 | |
| AIDA64 / FPU SinJulia | |
| Asus Vivobook Pro 16X K6604JV-MX016W | |
| Lenovo Slim Pro 9i 16IRP8 | |
| Dell Inspiron 16 Plus 7630 | |
| Average Intel Core i7-13700H (4800 - 11050, n=29) | |
| MSI Summit E16 Flip A12UDT-031 | |
| Dell Inspiron 16 Plus 7620 | |
| HP Envy 16 h0112nr | |
| AIDA64 / FPU Mandel | |
| Asus Vivobook Pro 16X K6604JV-MX016W | |
| Lenovo Slim Pro 9i 16IRP8 | |
| Average Intel Core i7-13700H (12321 - 45118, n=29) | |
| Dell Inspiron 16 Plus 7630 | |
| MSI Summit E16 Flip A12UDT-031 | |
| Dell Inspiron 16 Plus 7620 | |
| HP Envy 16 h0112nr | |
| AIDA64 / CPU AES | |
| HP Envy 16 h0112nr | |
| Asus Vivobook Pro 16X K6604JV-MX016W | |
| Lenovo Slim Pro 9i 16IRP8 | |
| Average Intel Core i7-13700H (28769 - 151254, n=29) | |
| Dell Inspiron 16 Plus 7620 | |
| MSI Summit E16 Flip A12UDT-031 | |
| Dell Inspiron 16 Plus 7630 | |
| AIDA64 / CPU ZLib | |
| Asus Vivobook Pro 16X K6604JV-MX016W | |
| Lenovo Slim Pro 9i 16IRP8 | |
| Dell Inspiron 16 Plus 7620 | |
| Average Intel Core i7-13700H (389 - 1215, n=29) | |
| MSI Summit E16 Flip A12UDT-031 | |
| Dell Inspiron 16 Plus 7630 | |
| HP Envy 16 h0112nr | |
| AIDA64 / FP64 Ray-Trace | |
| Asus Vivobook Pro 16X K6604JV-MX016W | |
| Lenovo Slim Pro 9i 16IRP8 | |
| Average Intel Core i7-13700H (2540 - 10135, n=29) | |
| Dell Inspiron 16 Plus 7630 | |
| MSI Summit E16 Flip A12UDT-031 | |
| Dell Inspiron 16 Plus 7620 | |
| HP Envy 16 h0112nr | |
| AIDA64 / CPU PhotoWorxx | |
| Lenovo Slim Pro 9i 16IRP8 | |
| Asus Vivobook Pro 16X K6604JV-MX016W | |
| MSI Summit E16 Flip A12UDT-031 | |
| Average Intel Core i7-13700H (12872 - 52727, n=29) | |
| Dell Inspiron 16 Plus 7630 | |
| HP Envy 16 h0112nr | |
| Dell Inspiron 16 Plus 7620 | |
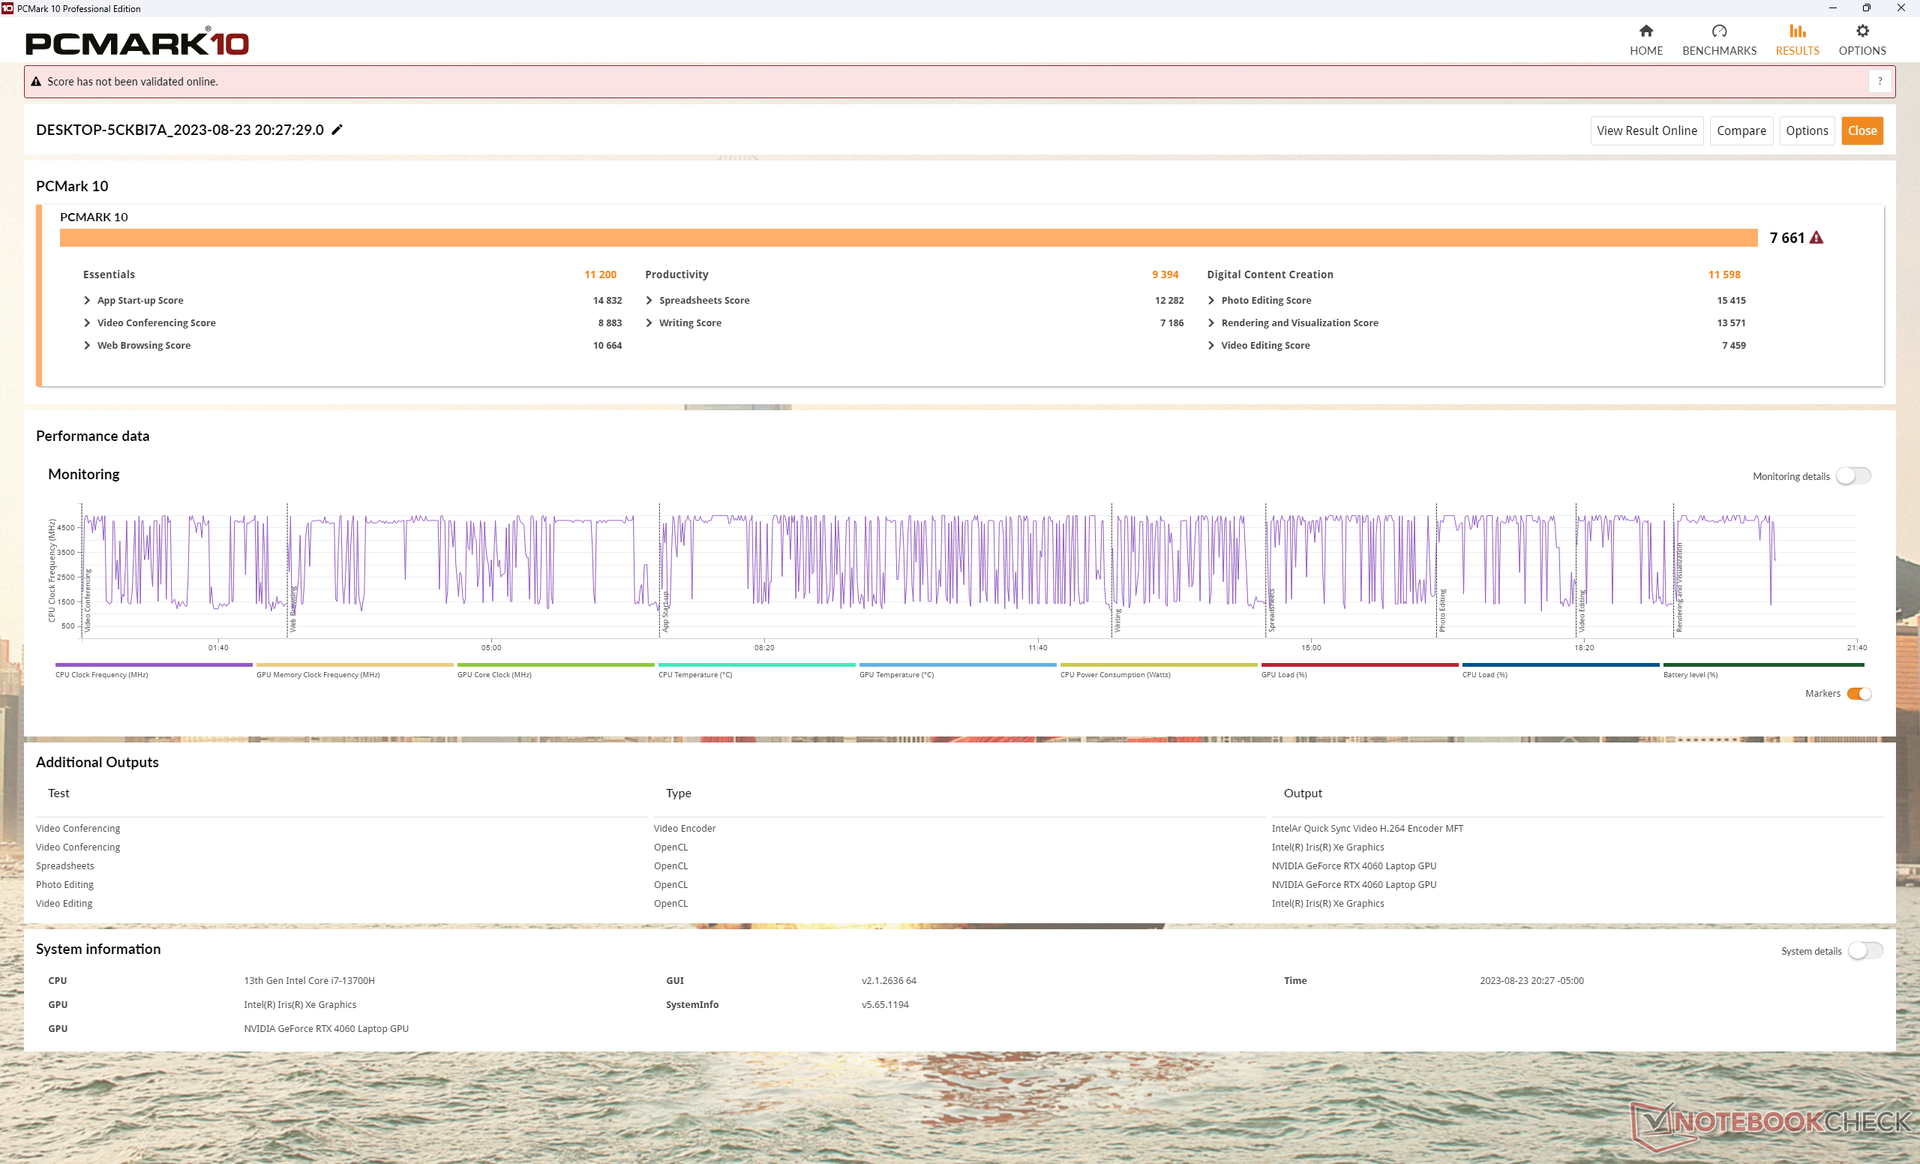
系统性能
PCMark 分数始终高于去年的 Inspiron 16 Plus 7620,尤其是在 GPU 性能最为重要的数字内容创建子测试中。
我们没有遇到从睡眠中唤醒的问题或 BSOD,这与最近的 Alienware m16 R1.
CrossMark: Overall | Productivity | Creativity | Responsiveness
| PCMark 10 / Score | |
| Lenovo Slim Pro 9i 16IRP8 | |
| Dell Inspiron 16 Plus 7630 | |
| HP Envy 16 h0112nr | |
| Average Intel Core i7-13700H, NVIDIA GeForce RTX 4060 Laptop GPU (7157 - 7661, n=5) | |
| Asus Vivobook Pro 16X K6604JV-MX016W | |
| Dell Inspiron 16 Plus 7620 | |
| MSI Summit E16 Flip A12UDT-031 | |
| PCMark 10 / Essentials | |
| HP Envy 16 h0112nr | |
| Lenovo Slim Pro 9i 16IRP8 | |
| Dell Inspiron 16 Plus 7630 | |
| Average Intel Core i7-13700H, NVIDIA GeForce RTX 4060 Laptop GPU (10179 - 11200, n=5) | |
| Asus Vivobook Pro 16X K6604JV-MX016W | |
| Dell Inspiron 16 Plus 7620 | |
| MSI Summit E16 Flip A12UDT-031 | |
| PCMark 10 / Productivity | |
| Lenovo Slim Pro 9i 16IRP8 | |
| Average Intel Core i7-13700H, NVIDIA GeForce RTX 4060 Laptop GPU (8238 - 10249, n=5) | |
| Dell Inspiron 16 Plus 7630 | |
| HP Envy 16 h0112nr | |
| Dell Inspiron 16 Plus 7620 | |
| Asus Vivobook Pro 16X K6604JV-MX016W | |
| MSI Summit E16 Flip A12UDT-031 | |
| PCMark 10 / Digital Content Creation | |
| Dell Inspiron 16 Plus 7630 | |
| Lenovo Slim Pro 9i 16IRP8 | |
| Average Intel Core i7-13700H, NVIDIA GeForce RTX 4060 Laptop GPU (10308 - 11862, n=5) | |
| HP Envy 16 h0112nr | |
| Dell Inspiron 16 Plus 7620 | |
| Asus Vivobook Pro 16X K6604JV-MX016W | |
| MSI Summit E16 Flip A12UDT-031 | |
| CrossMark / Overall | |
| Asus Vivobook Pro 16X K6604JV-MX016W | |
| Dell Inspiron 16 Plus 7630 | |
| HP Envy 16 h0112nr | |
| Lenovo Slim Pro 9i 16IRP8 | |
| Dell Inspiron 16 Plus 7620 | |
| Average Intel Core i7-13700H, NVIDIA GeForce RTX 4060 Laptop GPU (1629 - 1849, n=5) | |
| MSI Summit E16 Flip A12UDT-031 | |
| CrossMark / Productivity | |
| Asus Vivobook Pro 16X K6604JV-MX016W | |
| Dell Inspiron 16 Plus 7630 | |
| HP Envy 16 h0112nr | |
| Dell Inspiron 16 Plus 7620 | |
| Lenovo Slim Pro 9i 16IRP8 | |
| Average Intel Core i7-13700H, NVIDIA GeForce RTX 4060 Laptop GPU (1561 - 1743, n=5) | |
| MSI Summit E16 Flip A12UDT-031 | |
| CrossMark / Creativity | |
| Asus Vivobook Pro 16X K6604JV-MX016W | |
| Lenovo Slim Pro 9i 16IRP8 | |
| Dell Inspiron 16 Plus 7630 | |
| HP Envy 16 h0112nr | |
| Dell Inspiron 16 Plus 7620 | |
| Average Intel Core i7-13700H, NVIDIA GeForce RTX 4060 Laptop GPU (1691 - 2064, n=5) | |
| MSI Summit E16 Flip A12UDT-031 | |
| CrossMark / Responsiveness | |
| Asus Vivobook Pro 16X K6604JV-MX016W | |
| HP Envy 16 h0112nr | |
| Dell Inspiron 16 Plus 7630 | |
| MSI Summit E16 Flip A12UDT-031 | |
| Dell Inspiron 16 Plus 7620 | |
| Average Intel Core i7-13700H, NVIDIA GeForce RTX 4060 Laptop GPU (1381 - 1656, n=5) | |
| Lenovo Slim Pro 9i 16IRP8 | |
| PCMark 10 Score | 7661 points | |
Help | ||
| AIDA64 / Memory Copy | |
| Lenovo Slim Pro 9i 16IRP8 | |
| Asus Vivobook Pro 16X K6604JV-MX016W | |
| MSI Summit E16 Flip A12UDT-031 | |
| Average Intel Core i7-13700H (24334 - 78081, n=29) | |
| Dell Inspiron 16 Plus 7630 | |
| HP Envy 16 h0112nr | |
| Dell Inspiron 16 Plus 7620 | |
| AIDA64 / Memory Read | |
| Asus Vivobook Pro 16X K6604JV-MX016W | |
| Lenovo Slim Pro 9i 16IRP8 | |
| Dell Inspiron 16 Plus 7630 | |
| HP Envy 16 h0112nr | |
| MSI Summit E16 Flip A12UDT-031 | |
| Average Intel Core i7-13700H (23681 - 79656, n=29) | |
| Dell Inspiron 16 Plus 7620 | |
| AIDA64 / Memory Write | |
| Lenovo Slim Pro 9i 16IRP8 | |
| Asus Vivobook Pro 16X K6604JV-MX016W | |
| Average Intel Core i7-13700H (22986 - 99898, n=29) | |
| Dell Inspiron 16 Plus 7630 | |
| HP Envy 16 h0112nr | |
| MSI Summit E16 Flip A12UDT-031 | |
| Dell Inspiron 16 Plus 7620 | |
| AIDA64 / Memory Latency | |
| MSI Summit E16 Flip A12UDT-031 | |
| Lenovo Slim Pro 9i 16IRP8 | |
| Dell Inspiron 16 Plus 7620 | |
| Average Intel Core i7-13700H (82.4 - 136.8, n=29) | |
| Dell Inspiron 16 Plus 7630 | |
| HP Envy 16 h0112nr | |
| Asus Vivobook Pro 16X K6604JV-MX016W | |
* ... smaller is better
DPC 延迟
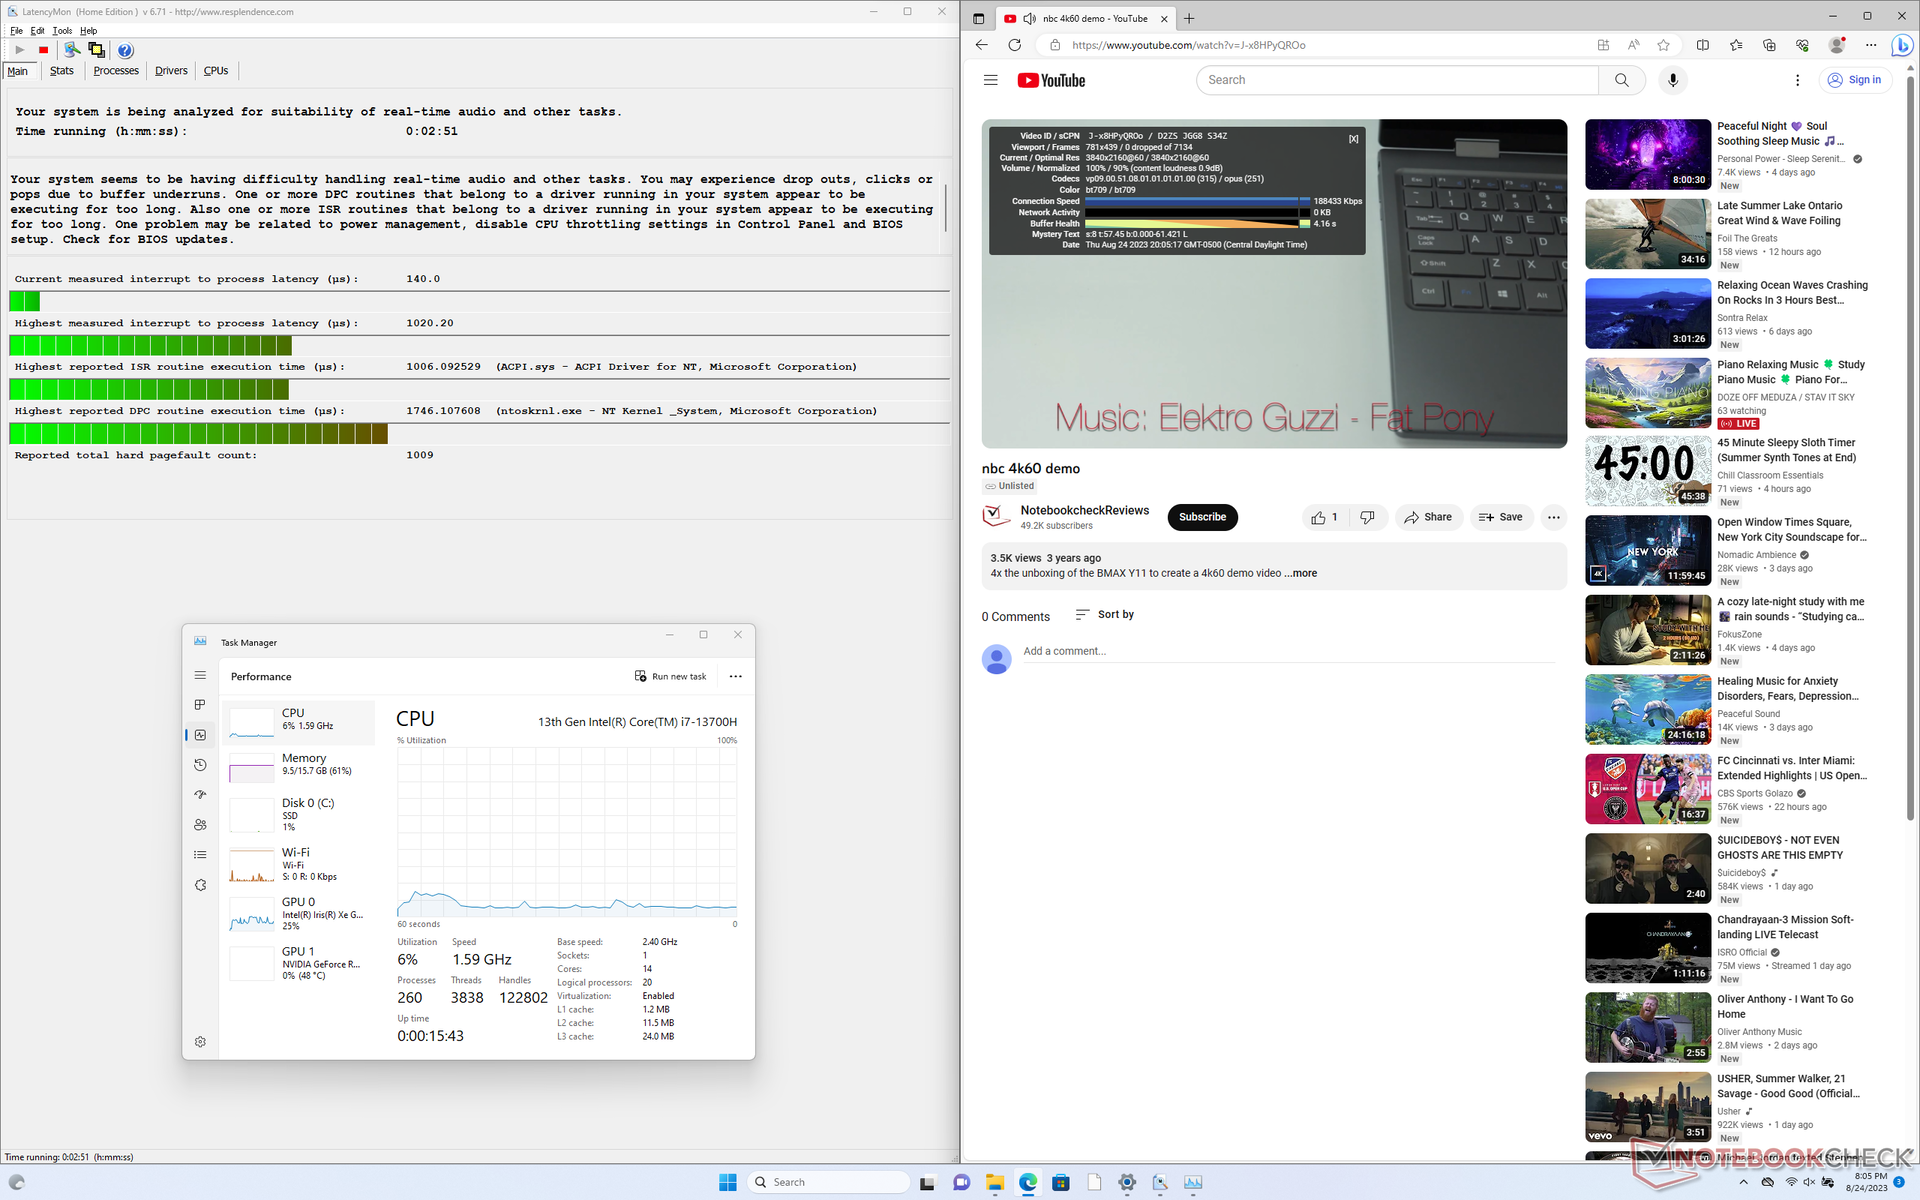
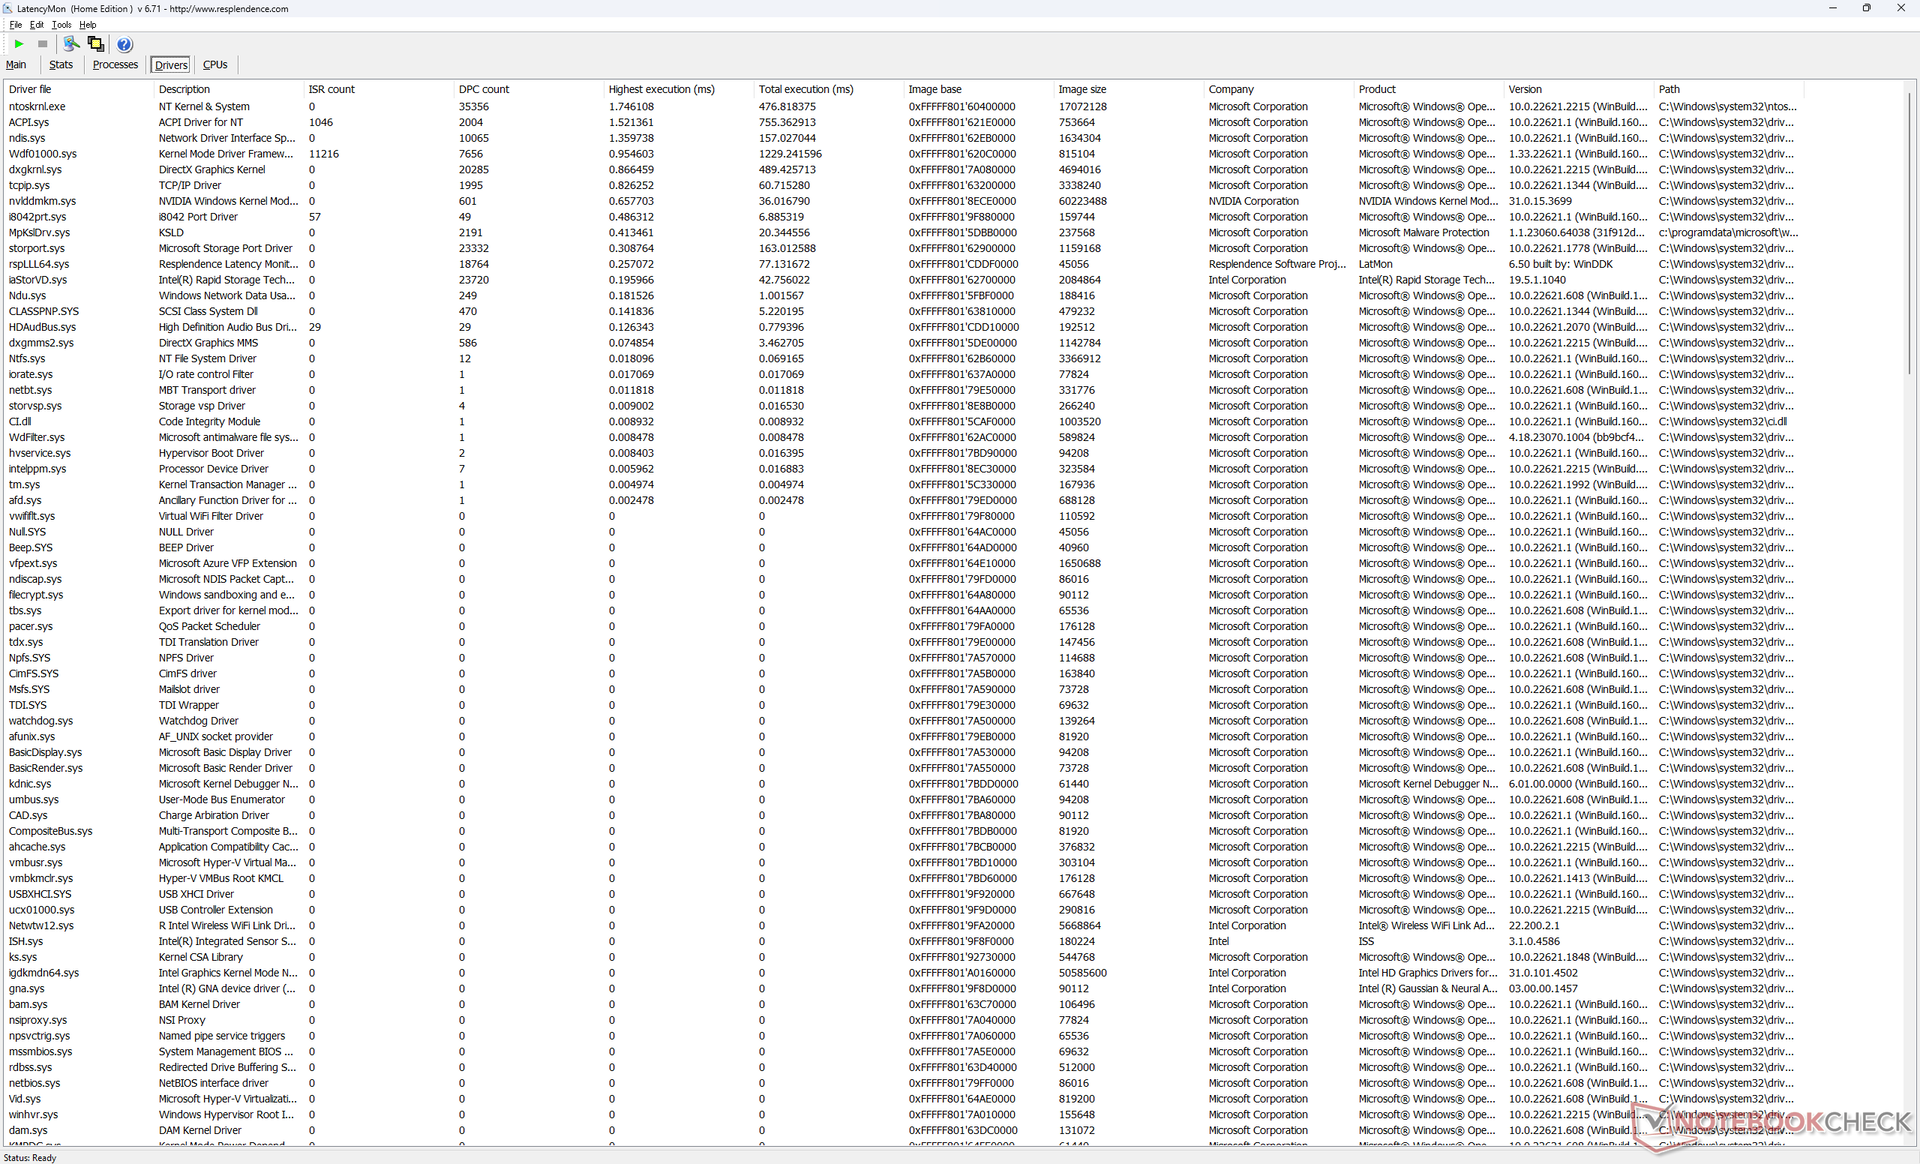
LatencyMon 仅在打开我们主页的多个浏览器标签时显示了轻微的 DPC 问题。60 FPS 的 4K 视频回放也非常完美,没有掉帧记录,不像最近的 Alienware m16 R1 会持续跳帧。
| DPC Latencies / LatencyMon - interrupt to process latency (max), Web, Youtube, Prime95 | |
| Asus Vivobook Pro 16X K6604JV-MX016W | |
| Lenovo Slim Pro 9i 16IRP8 | |
| Dell Inspiron 16 Plus 7630 | |
| Dell Inspiron 16 Plus 7620 | |
| MSI Summit E16 Flip A12UDT-031 | |
| HP Envy 16 h0112nr | |
* ... smaller is better
存储设备 - 仅支持一个固态硬盘
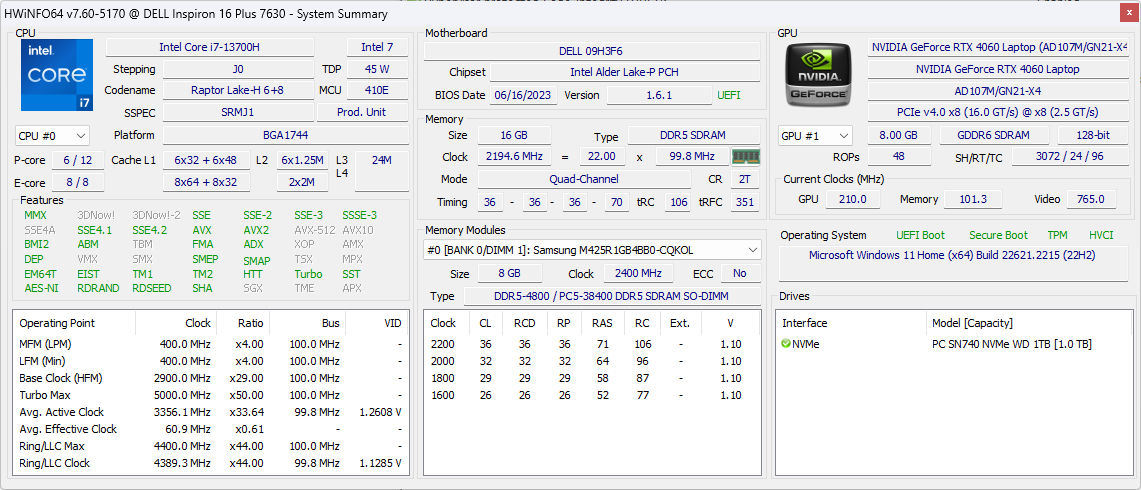
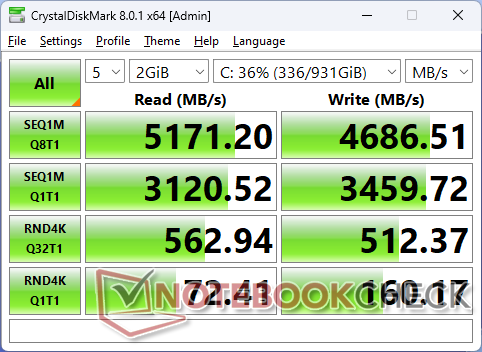
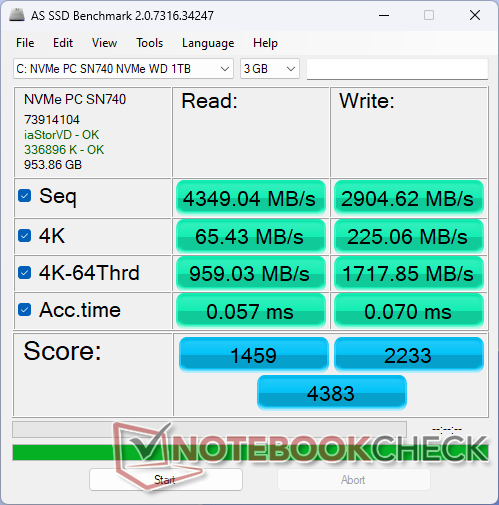
我们的设备配备了中端 西部数据 SN740PCIe4 x4 NVMe 固态硬盘,传输速率高达 5200 MB/s。但这一最高传输速率只能维持约一分钟,最终会节流到 2400 MB/s,如下文 DiskSpd 循环测试结果所示。对于游戏性能和绝大多数使用场景来说,这一限制不是问题。
该机型最多只能支持一个内置固态硬盘,而其他几款 16 英寸笔记本电脑,如 Envy 16可以支持多达两个硬盘。

| Drive Performance Rating - Percent | |
| MSI Summit E16 Flip A12UDT-031 | |
| Lenovo Slim Pro 9i 16IRP8 | |
| HP Envy 16 h0112nr | |
| Dell Inspiron 16 Plus 7630 | |
| Asus Vivobook Pro 16X K6604JV-MX016W | |
| Dell Inspiron 16 Plus 7620 | |
* ... smaller is better
Disk Throttling: DiskSpd Read Loop, Queue Depth 8
图形处理器性能
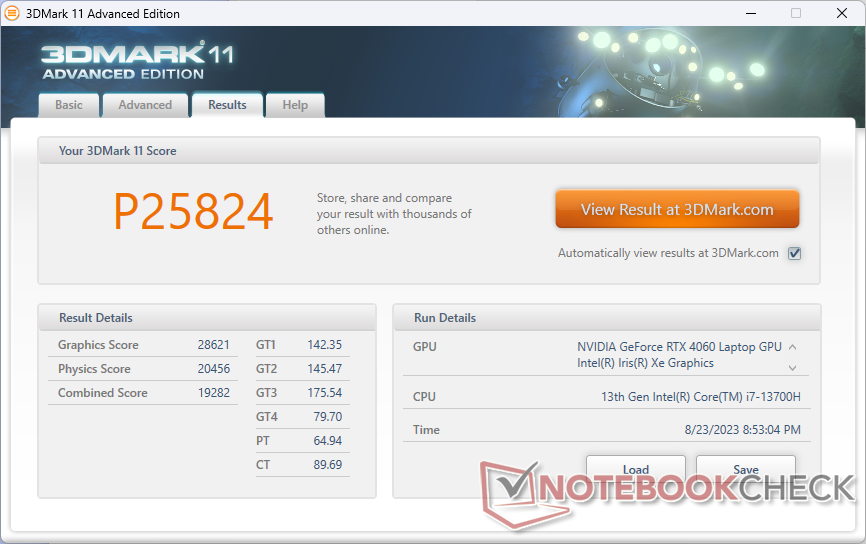
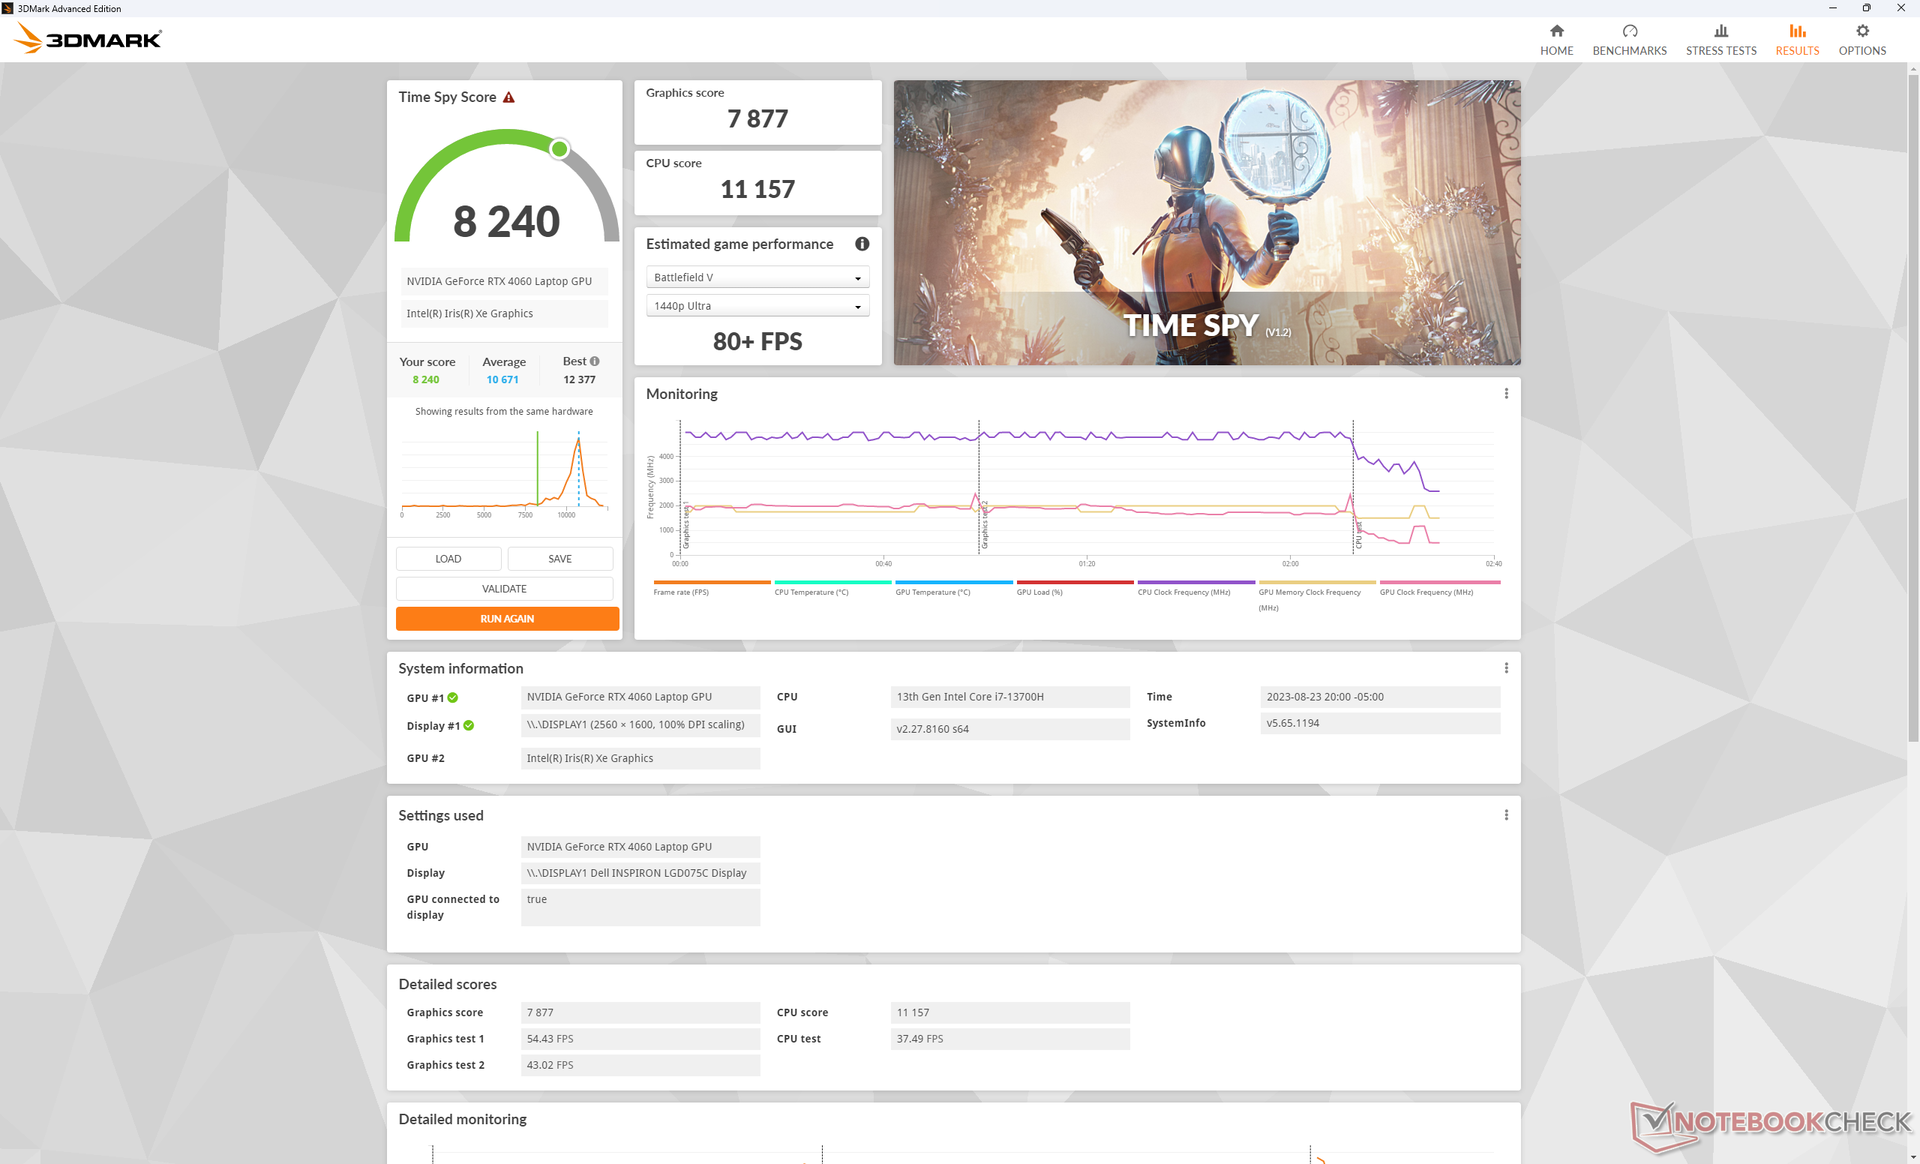
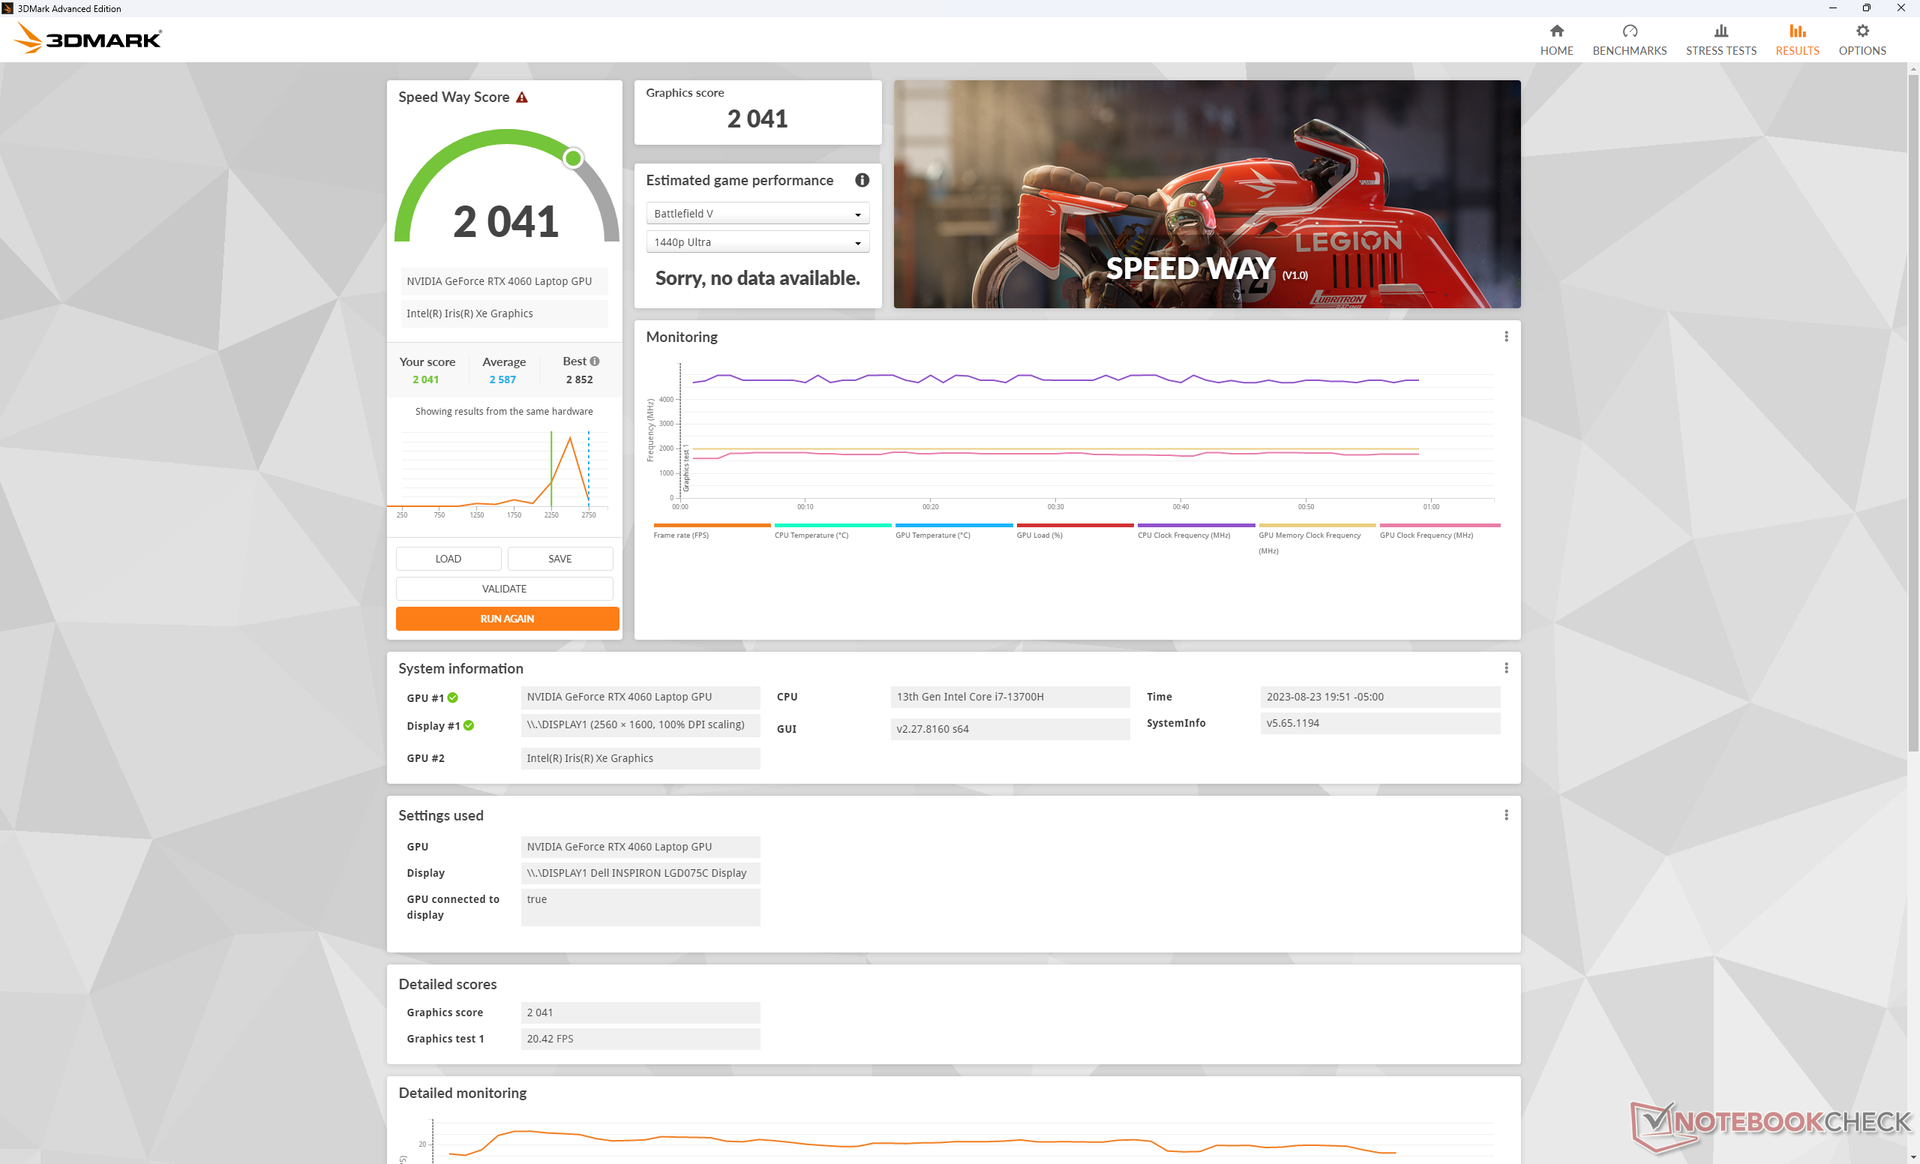
GeForce RTX 4060 比我们数据库中配备相同 GPU 的普通笔记本电脑要慢 10% 到 15%。出现这种差距的原因可能是 Inspiron 16 Plus 7630 的 TGP 目标值相对较低,仅为 60 瓦,因为大多数配备 RTX 4060 的笔记本电脑往往是专用游戏笔记本电脑,针对 90 瓦或更高的 GPU 功率范围进行了优化。因此,整体性能与联想 Slim Pro 9i 16 中的GeForce RTX 4050 更为接近,这让人有些失望。尽管如此,与去年 Inspiron 16 Plus 7620 中的RTX 3050 Ti相比,性能仍有 40% 至 60% 的显著提升。
用户可能会考虑在 Inspiron 16 Plus 7630 上配置更便宜的 RTX 4050,因为 RTX 4060 的性能较差。所有 GPU 选项的目标都是相同的 60 W TGP。
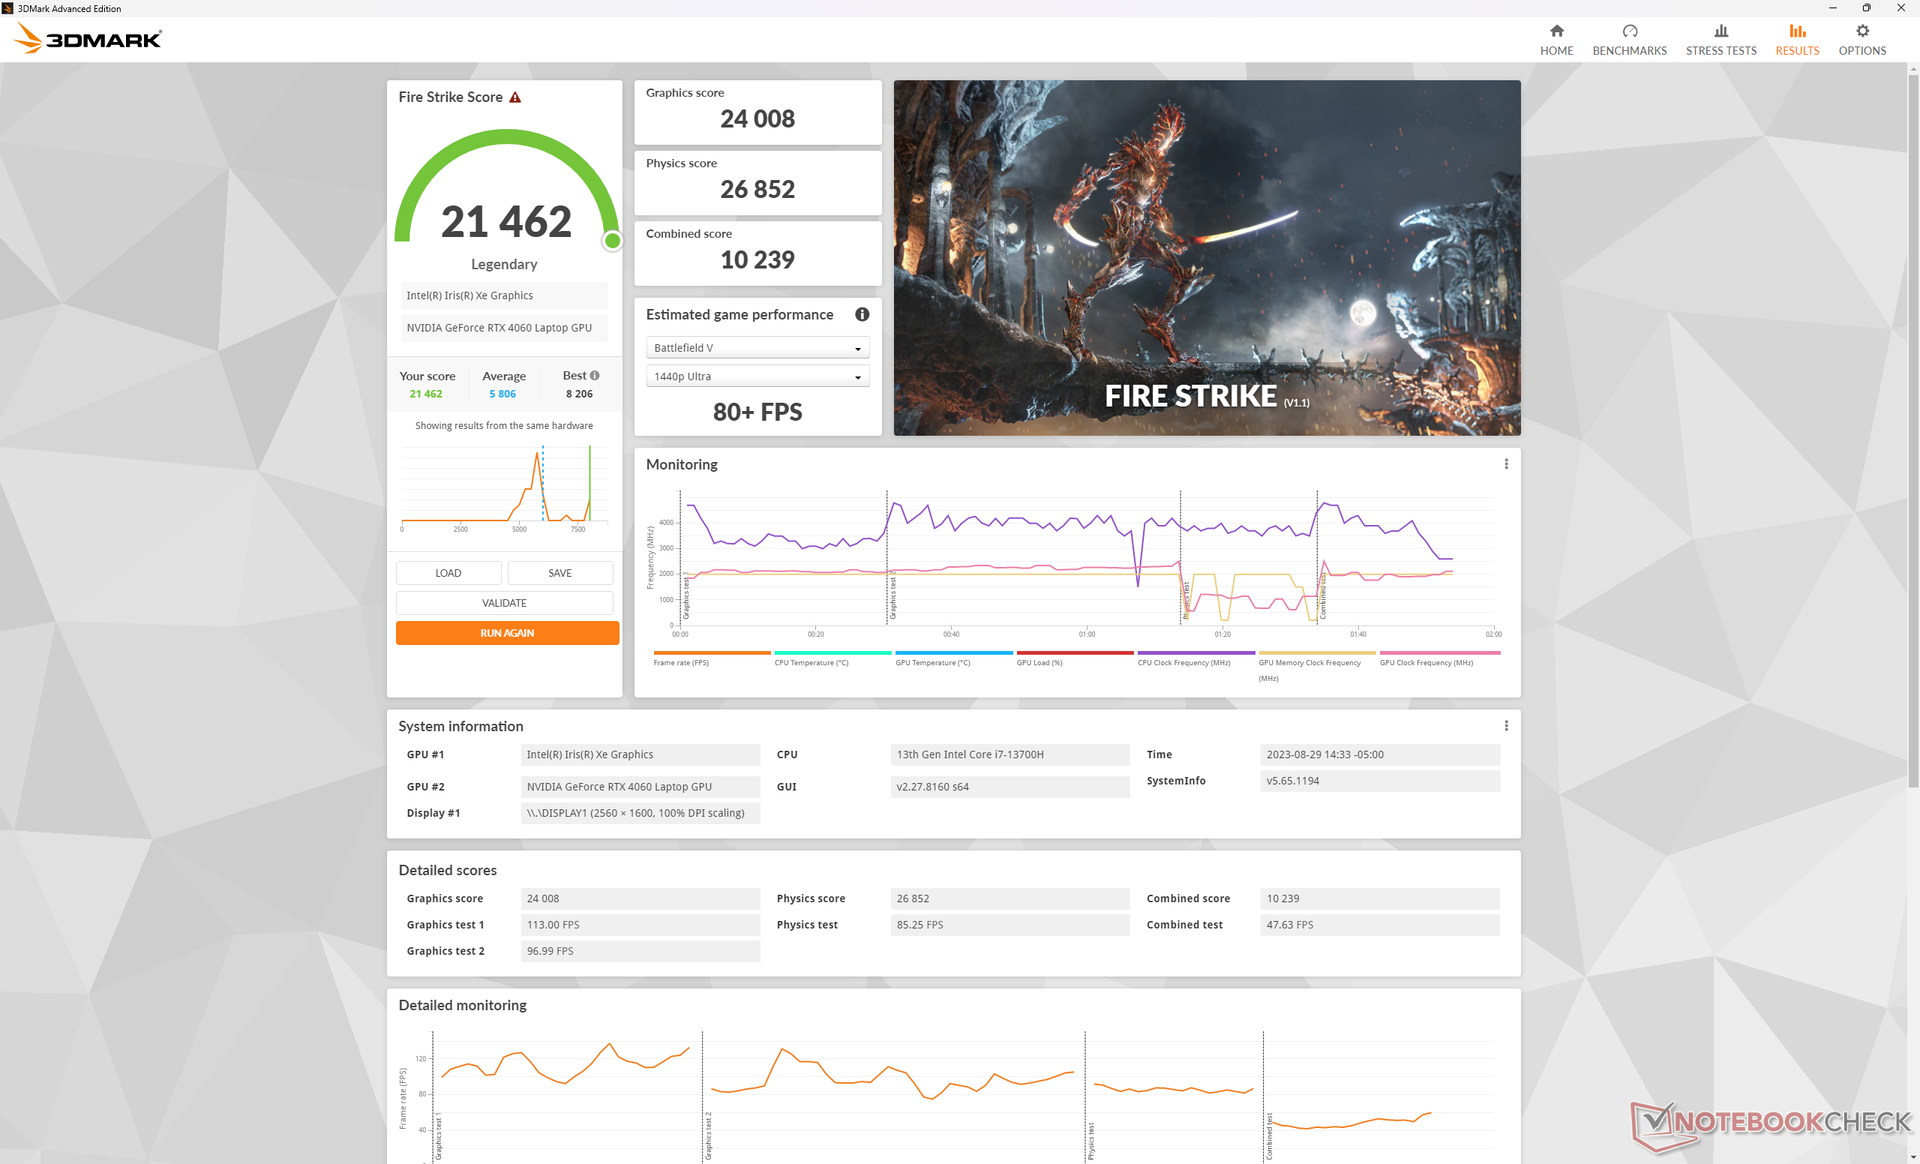
从 "性能 "模式切换到 "平衡 "模式,CPU 性能会受到很大影响,而 GPU 性能则几乎保持不变,如下图Fire Strike 结果所示。如果运行 CPU 密集型任务,请确保使用 "性能 "模式。
| 电源配置文件 | 图形得分 | 物理得分 | 综合得分 |
| 电池电量 | 19574 (-9%) | 10010 (-61%) | 4793 (-46%) |
| 平衡模式 | 23511 (-2%) | 15963 (-41%) | 8110 (-21%) |
| 绩效模式 | 24008 | 26852 | 10239 |


| 3DMark Performance Rating - Percent | |
| Asus Zephyrus Duo 16 GX650PY-NM006W | |
| Alienware m16 R1 AMD | |
| Lenovo Legion Pro 5 16ARX8 | |
| Asus Vivobook Pro 16X K6604JV-MX016W -2! | |
| Average NVIDIA GeForce RTX 4060 Laptop GPU | |
| Lenovo Legion S7 16ARHA7 -1! | |
| Lenovo Slim Pro 9i 16IRP8 | |
| Dell Inspiron 16 Plus 7630 | |
| HP Omen 16-n0033dx | |
| HP Omen 15-en0375ng -1! | |
| Dell Inspiron 16 Plus 7620 -2! | |
| MSI Summit E16 Flip A12UDT-031 -1! | |
| Lenovo IdeaPad 5 Pro 16IHU6 -2! | |
| 3DMark 11 Performance | 25824 points | |
| 3DMark Fire Strike Score | 19289 points | |
| 3DMark Time Spy Score | 8240 points | |
Help | ||
* ... smaller is better
游戏性能
正如上述 3DMark 结果所预测的那样,对于配备 RTX 4060 显卡的笔记本电脑来说,整体游戏性能略低于平均水平。例如,《小小蒂娜的仙境》在最高 1440p 设置下的运行速度为 48 FPS,而大多数其他 RTX 4060 笔记本电脑的运行速度为 57 FPS。遗憾的是,Inspiron 7630 系列不支持 G-Sync,而 G-Sync 可以平滑帧撕裂。
Witcher 3 FPS Chart
| low | med. | high | ultra | QHD | |
|---|---|---|---|---|---|
| The Witcher 3 (2015) | 409.3 | 275.3 | 169.5 | 90.9 | 68 |
| Dota 2 Reborn (2015) | 184.7 | 166.6 | 157.9 | 146.1 | |
| Final Fantasy XV Benchmark (2018) | 172.2 | 122.2 | 88.9 | 64.4 | |
| X-Plane 11.11 (2018) | 153.5 | 135.7 | 109.7 | ||
| Far Cry 5 (2018) | 133 | 120 | 115 | 103 | 83 |
| Strange Brigade (2018) | 378 | 234 | 185.9 | 161 | 110.9 |
| Cyberpunk 2077 1.6 (2022) | 108.1 | 84.2 | 72.9 | 65.7 | 40.8 |
| Tiny Tina's Wonderlands (2022) | 169.5 | 141.5 | 92.1 | 71.4 | 48 |
| F1 22 (2022) | 205 | 201 | 148.4 | 53.8 | 34.1 |
| Returnal (2023) | 71 | 68 | 63 | 57 | 39 |
排放量
系统噪音 - 比以前更安静、更响亮
在桌面上空转时,内部风扇可以保持安静,但在运行网络浏览器或视频流等常见负载时,内部风扇通常会在 26 至 28 dB(A) 之间徘徊。更令人印象深刻的是,即使在较高负载的情况下,它们也能在相当长的时间内保持相对安静,而 Inspiron 16 Plus 7620 的风扇则会更快、更容易跳动。例如,在运行 3DMark 06 时,风扇噪音只有在第一个 90 秒的基准测试场景结束时才会上升到 35 dB(A)。
运行游戏时,风扇噪音明显增大。在运行要求不高的负载时,Inspiron 16 Plus 7630 总体上比去年的机型更安静,但在运行游戏时却恰恰相反。在运行Witcher 3 时,风扇噪音最高可达近 53 dB(A),而 Inspiron 16 Plus 7620 只有略高于 49 dB(A)。尽管如此,50 分贝(A)的低噪音范围仍可与竞争对手媲美,如Slim Pro 9i 16或 Envy 16 等竞争对手不相上下。
有趣的是,在平衡模式和性能模式之间改变电源配置文件并不会影响游戏时的风扇噪音上限,因为在这两种设置下,风扇噪音上限仍为 52.5 分贝(A)。
Noise Level
| Idle |
| 23.2 / 23.2 / 23.2 dB(A) |
| Load |
| 35.1 / 52.5 dB(A) |
 | ||
30 dB silent 40 dB(A) audible 50 dB(A) loud |
||
min: | ||
| Dell Inspiron 16 Plus 7630 NVIDIA GeForce RTX 4060 Laptop GPU, i7-13700H, WD PC SN740 SDDPTQD-1T00 | Dell Inspiron 16 Plus 7620 GeForce RTX 3050 Ti Laptop GPU, i7-12700H, Kioxia BG5 KBG50ZNS512G | Lenovo Slim Pro 9i 16IRP8 NVIDIA GeForce RTX 4050 Laptop GPU, i9-13905H, Samsung PM9A1 MZVL21T0HCLR | Asus Vivobook Pro 16X K6604JV-MX016W NVIDIA GeForce RTX 4060 Laptop GPU, i9-13980HX, Solidigm P41 Plus SSDPFKNU010TZ | HP Envy 16 h0112nr GeForce RTX 3060 Laptop GPU, i7-12700H, Micron 3400 1TB MTFDKBA1T0TFH | MSI Summit E16 Flip A12UDT-031 GeForce RTX 3050 Ti Laptop GPU, i7-1280P, Samsung PM9A1 MZVL22T0HBLB | |
|---|---|---|---|---|---|---|
| Noise | -11% | 1% | -21% | -6% | -14% | |
| off / environment * | 23.2 | 23.3 -0% | 22.7 2% | 25.2 -9% | 22.8 2% | 25 -8% |
| Idle Minimum * | 23.2 | 25.7 -11% | 22.7 2% | 26.6 -15% | 22.9 1% | 25 -8% |
| Idle Average * | 23.2 | 26.1 -13% | 22.7 2% | 26.6 -15% | 22.9 1% | 25 -8% |
| Idle Maximum * | 23.2 | 30.6 -32% | 27.5 -19% | 29.2 -26% | 30.5 -31% | 28.9 -25% |
| Load Average * | 35.1 | 46.2 -32% | 28.9 18% | 53.4 -52% | 41.4 -18% | 49.3 -40% |
| Witcher 3 ultra * | 52.5 | 49.2 6% | 52.6 -0% | 51.1 3% | ||
| Load Maximum * | 52.5 | 49.4 6% | 52.5 -0% | 56.9 -8% | 51.4 2% | 48.2 8% |
* ... smaller is better
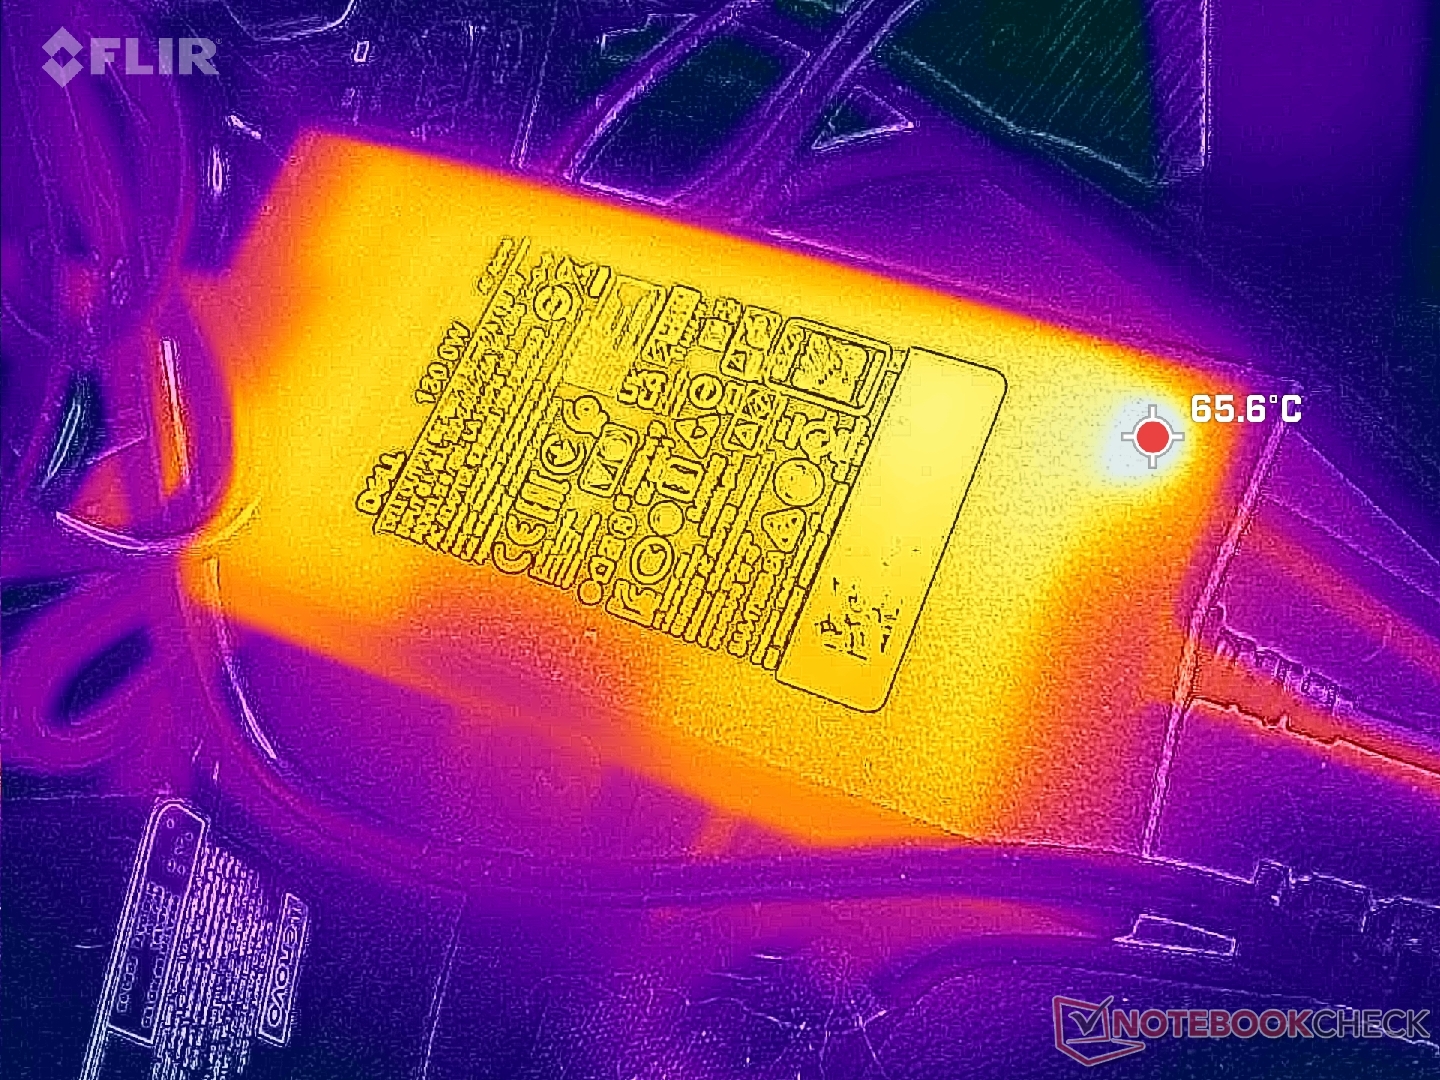
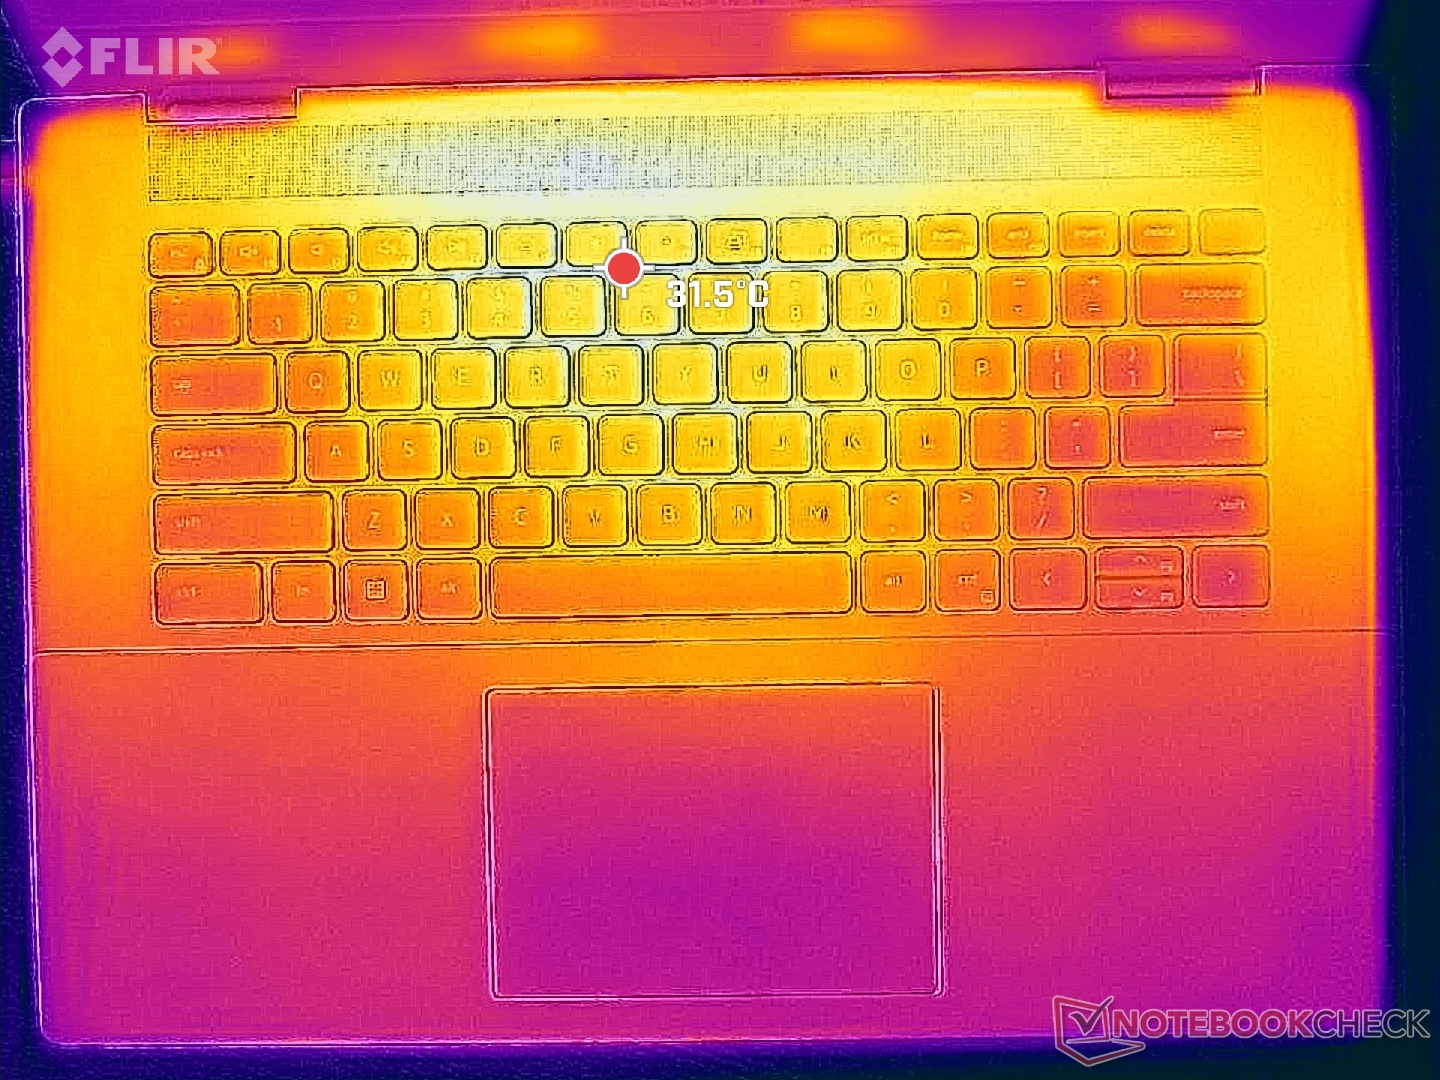
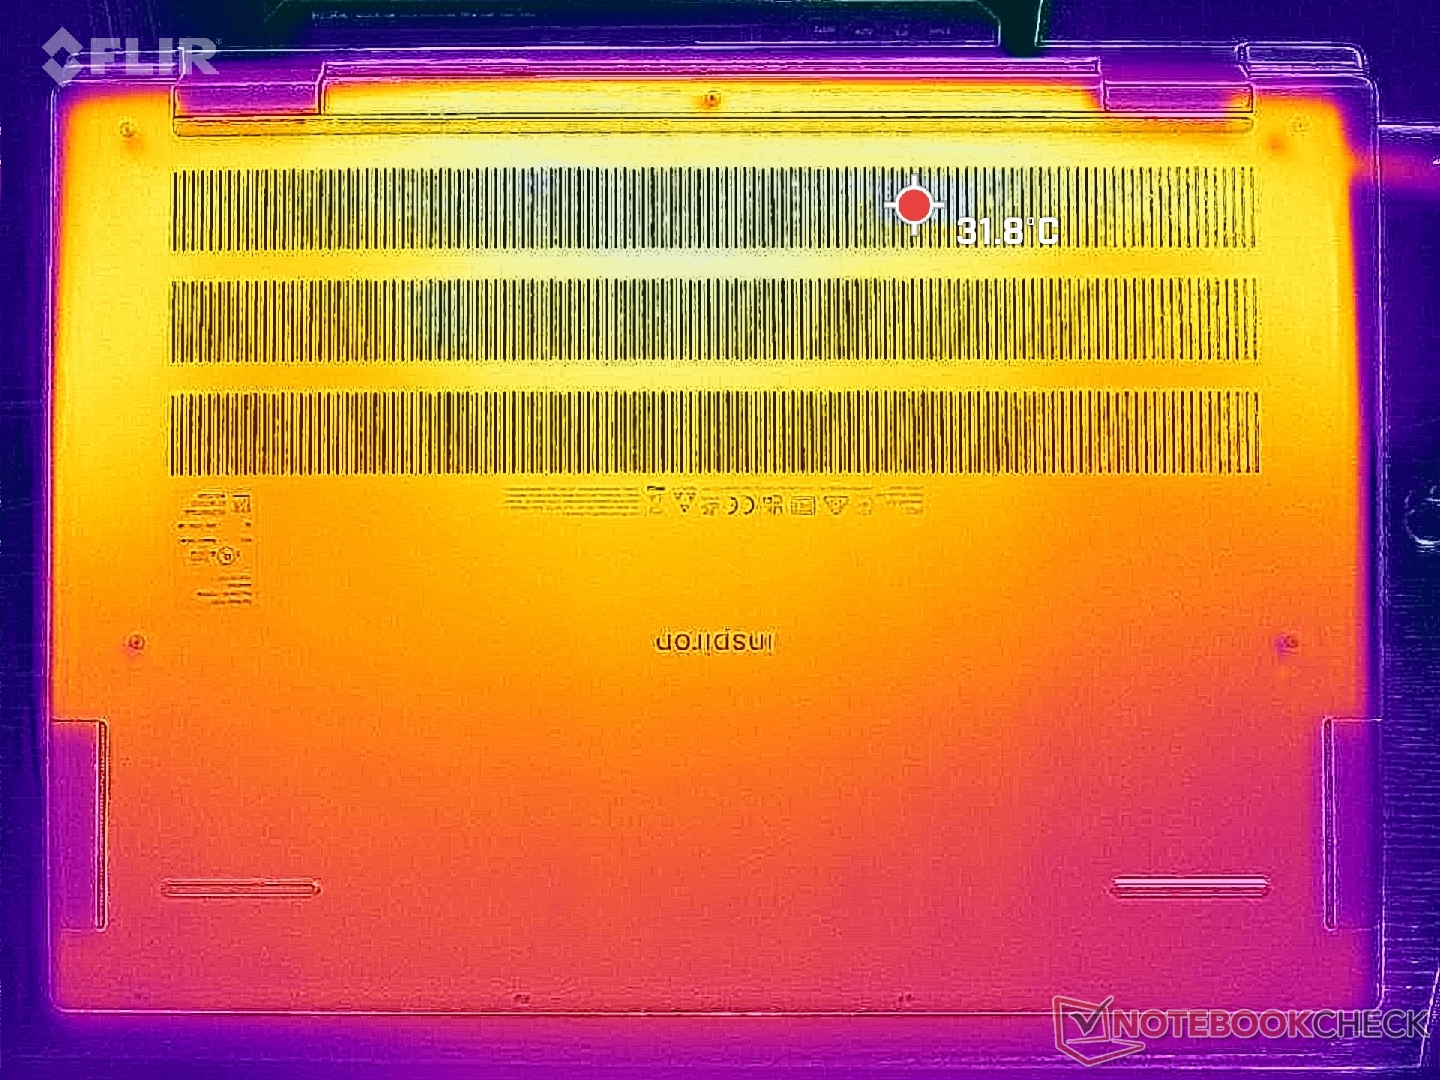
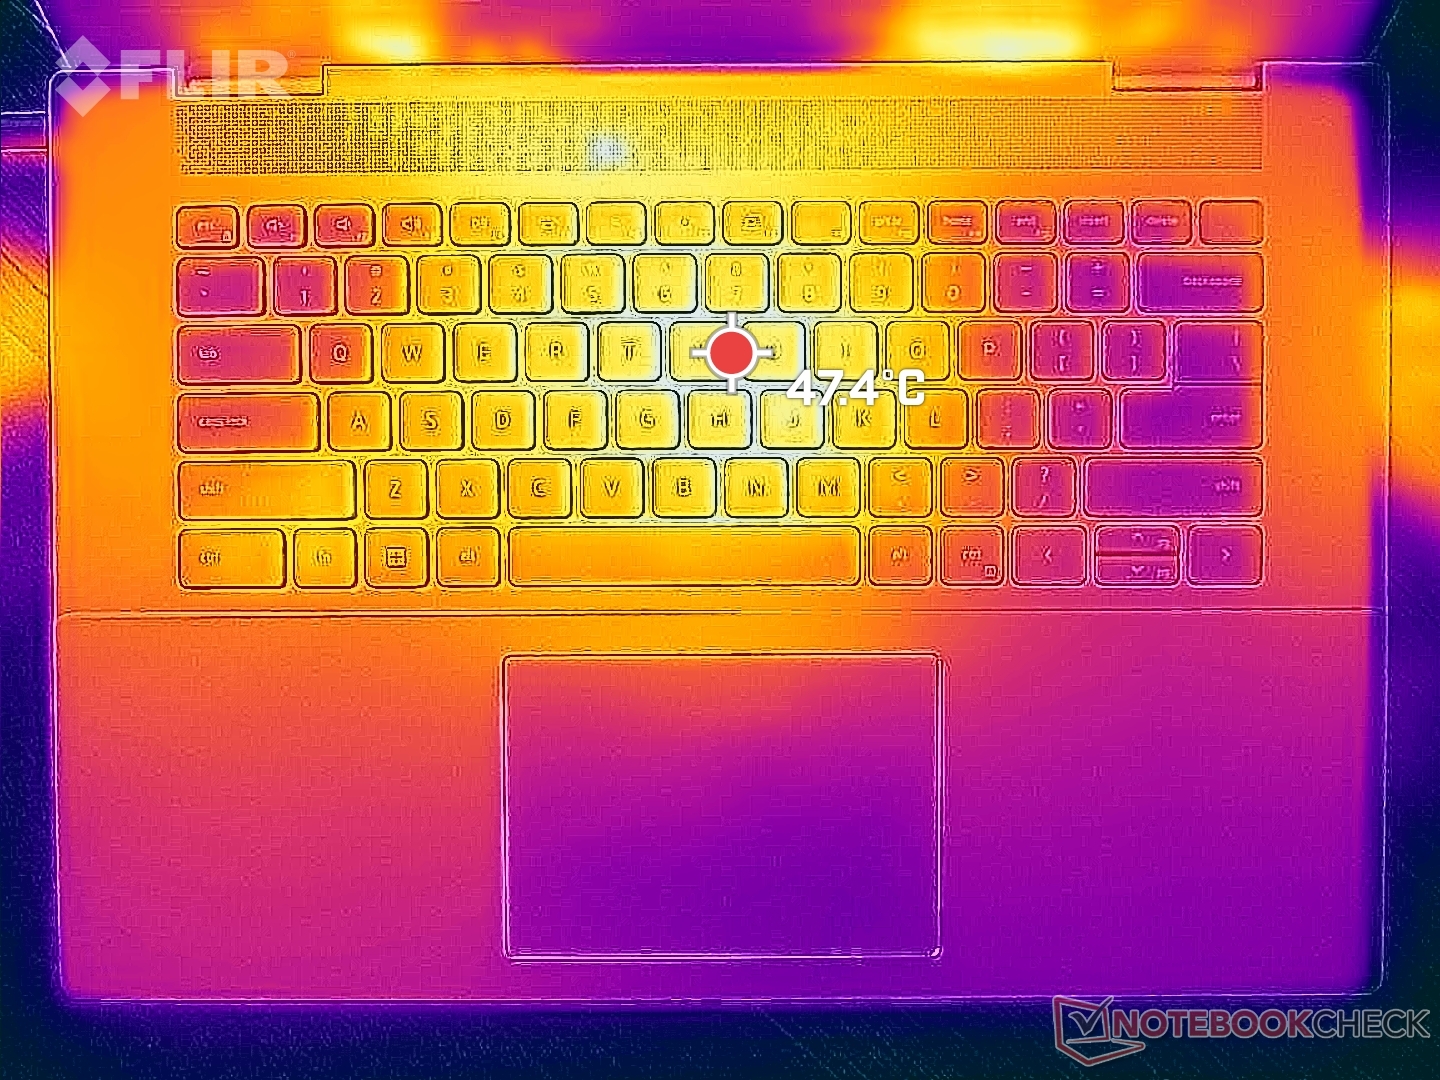
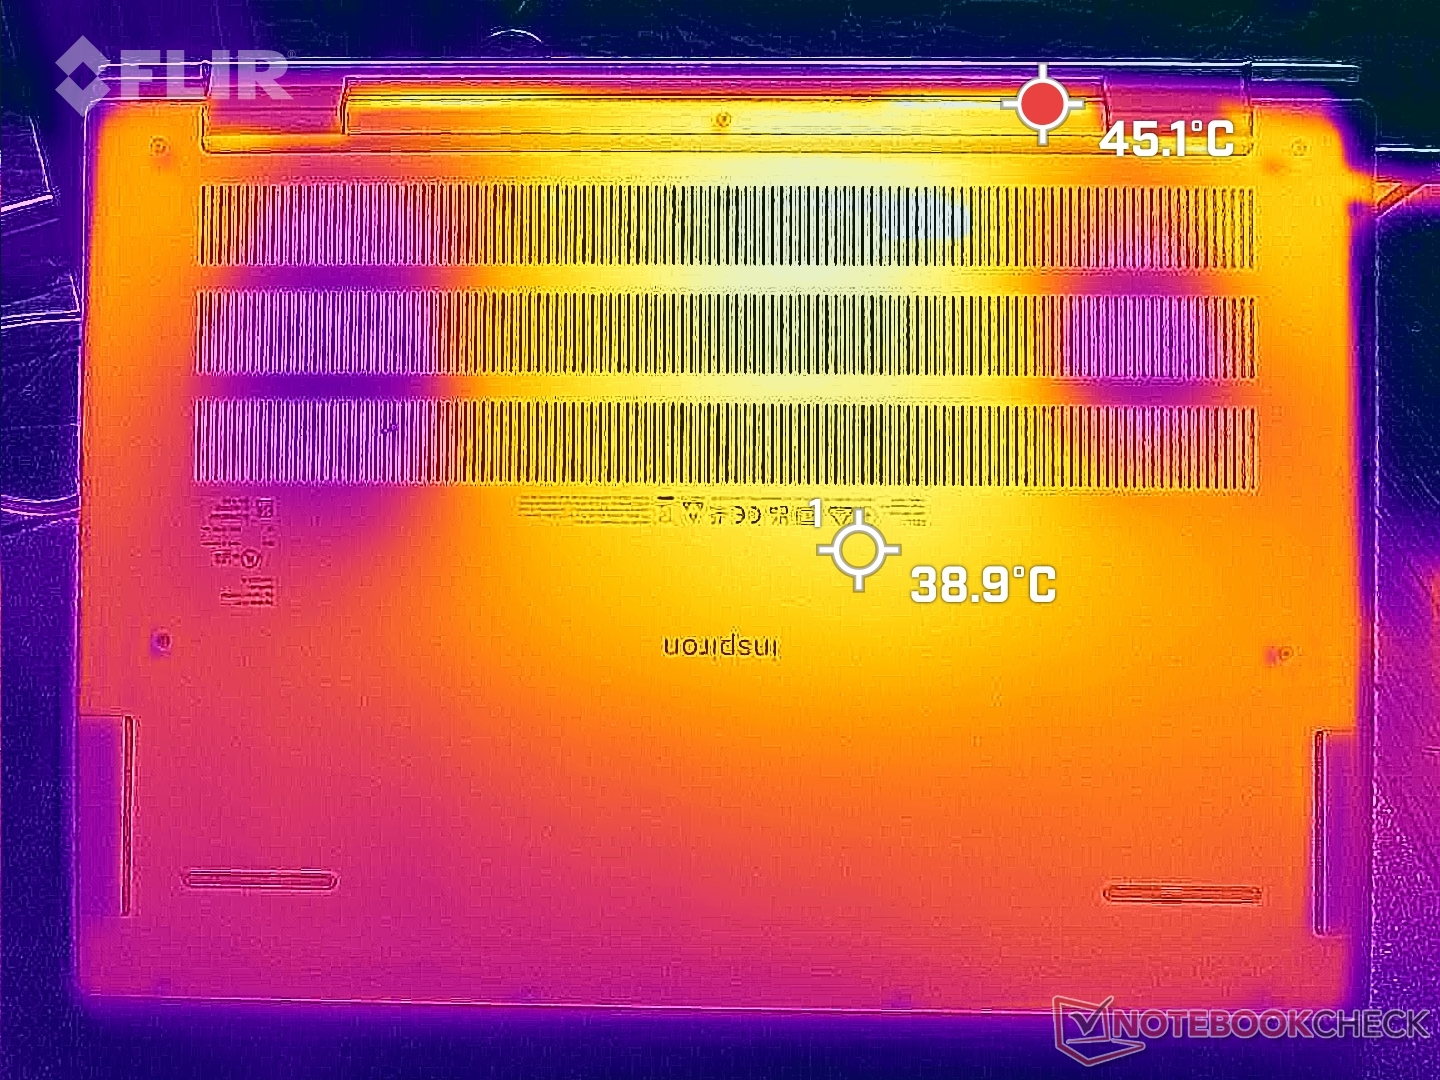
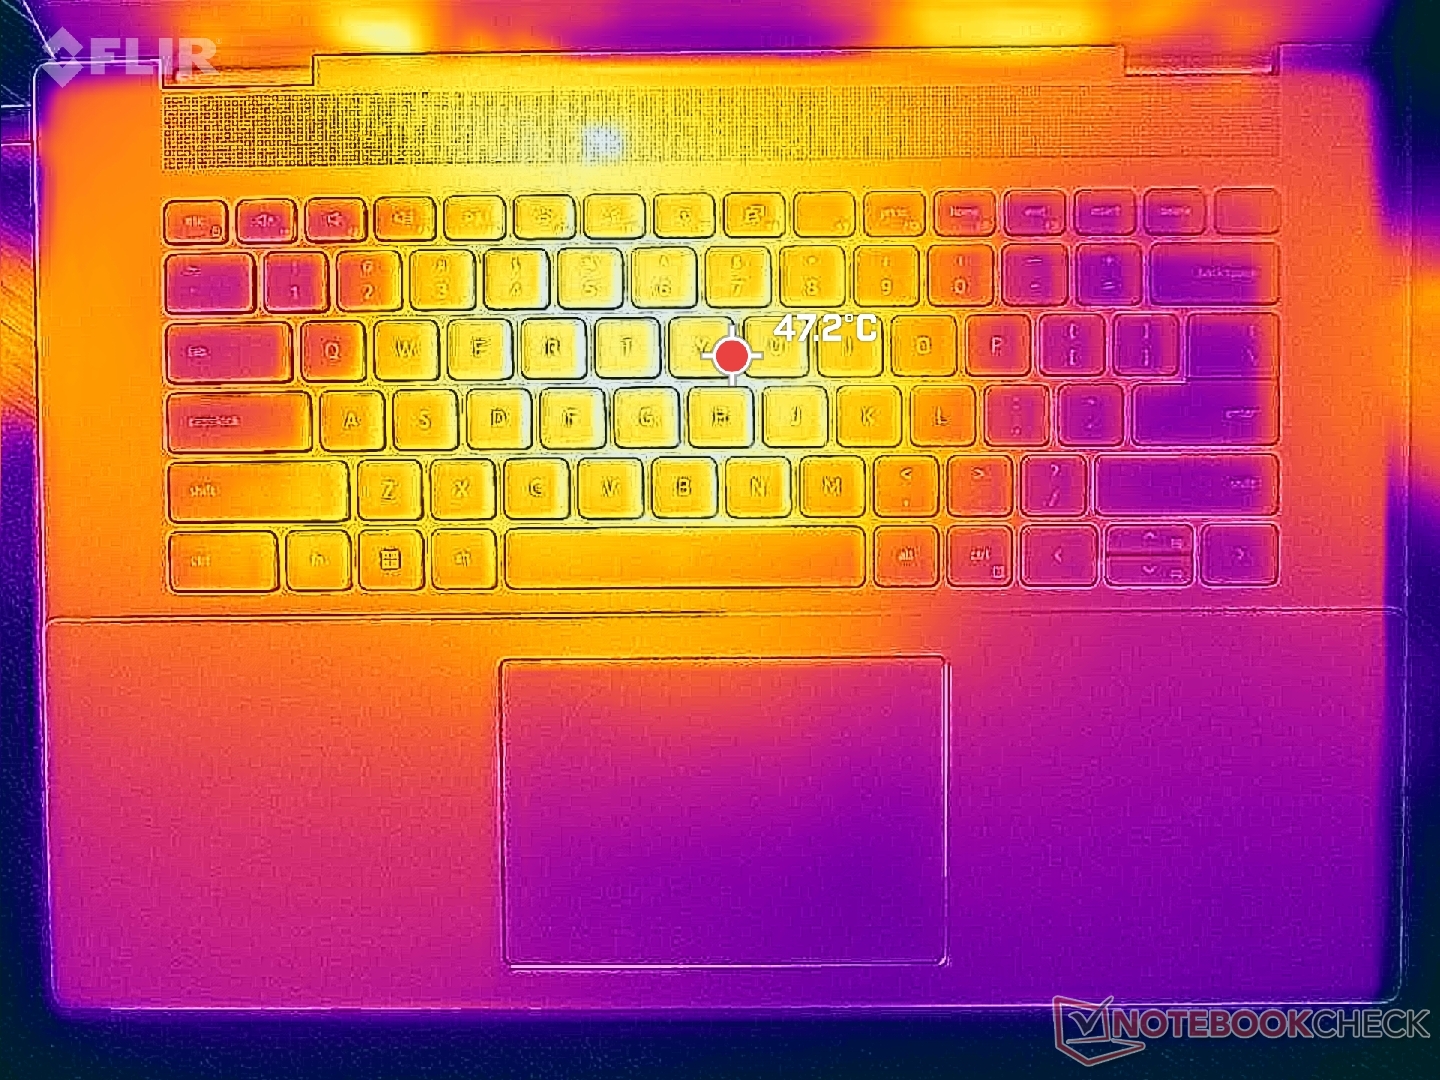
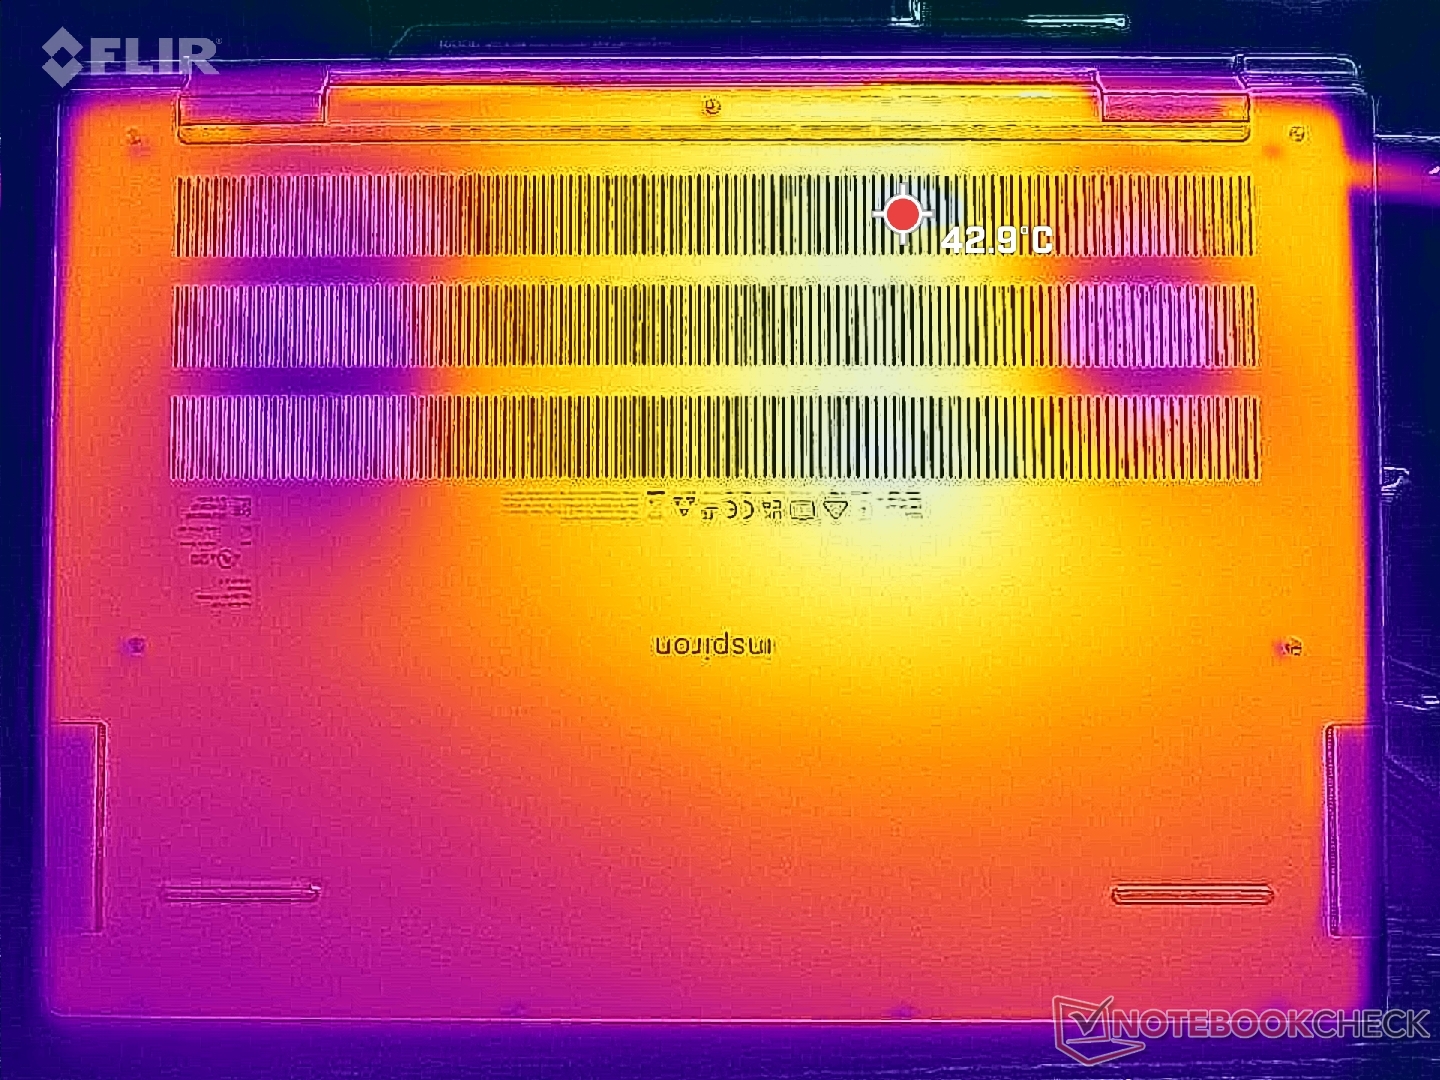
温度
运行游戏等要求较高的负载时,表面温度比预期的要高。靠近键盘中心的顶部和底部热点温度分别高达 48 摄氏度和 43 摄氏度。掌托的温度也很高,可达 37 摄氏度,而华硕 Vivobook Pro 16 的温度仅为 31 摄氏度。华硕 Vivobook Pro 16X或惠普 Envy 16 的温度仅为 31 摄氏度。与其他笔记本电脑相比,这无疑更容易暖手。
此外,交流适配器的温度明显高于平均水平,超过 65 摄氏度。
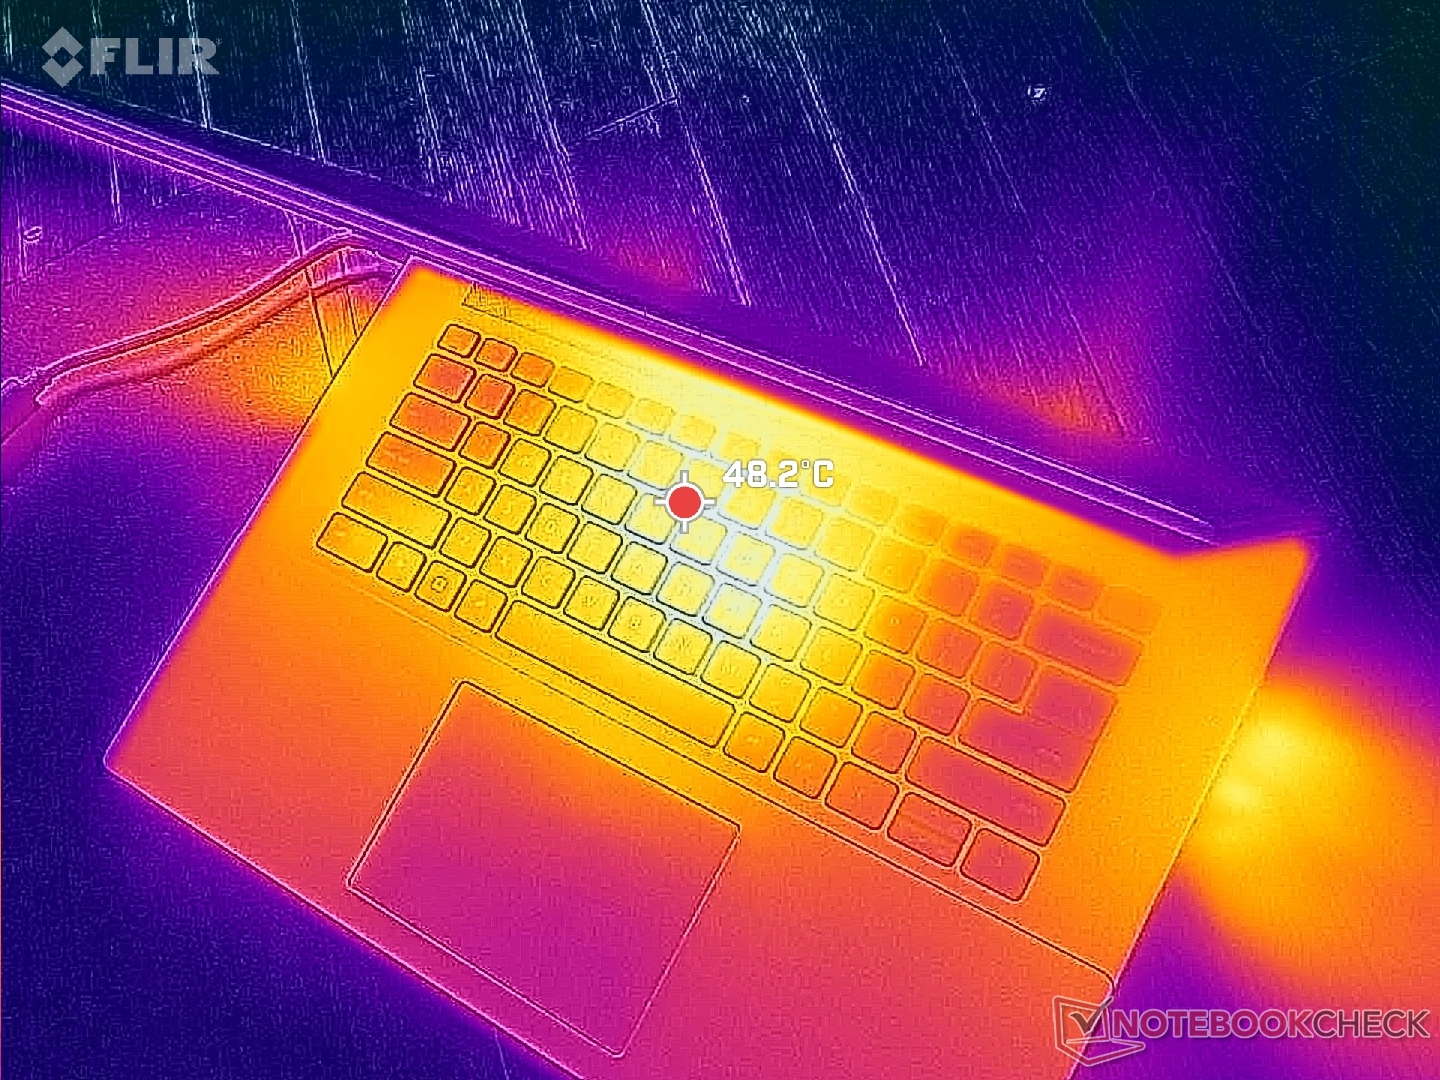
(-) The maximum temperature on the upper side is 47.8 °C / 118 F, compared to the average of 36.9 °C / 98 F, ranging from 21.1 to 71 °C for the class Multimedia.
(±) The bottom heats up to a maximum of 42.2 °C / 108 F, compared to the average of 39.2 °C / 103 F
(±) In idle usage, the average temperature for the upper side is 32 °C / 90 F, compared to the device average of 31.3 °C / 88 F.
(-) Playing The Witcher 3, the average temperature for the upper side is 40.6 °C / 105 F, compared to the device average of 31.3 °C / 88 F.
(±) The palmrests and touchpad can get very hot to the touch with a maximum of 36.6 °C / 97.9 F.
(-) The average temperature of the palmrest area of similar devices was 28.8 °C / 83.8 F (-7.8 °C / -14.1 F).
| Dell Inspiron 16 Plus 7630 Intel Core i7-13700H, NVIDIA GeForce RTX 4060 Laptop GPU | Dell Inspiron 16 Plus 7620 Intel Core i7-12700H, NVIDIA GeForce RTX 3050 Ti Laptop GPU | Lenovo Slim Pro 9i 16IRP8 Intel Core i9-13905H, NVIDIA GeForce RTX 4050 Laptop GPU | Asus Vivobook Pro 16X K6604JV-MX016W Intel Core i9-13980HX, NVIDIA GeForce RTX 4060 Laptop GPU | HP Envy 16 h0112nr Intel Core i7-12700H, NVIDIA GeForce RTX 3060 Laptop GPU | MSI Summit E16 Flip A12UDT-031 Intel Core i7-1280P, NVIDIA GeForce RTX 3050 Ti Laptop GPU | |
|---|---|---|---|---|---|---|
| Heat | 6% | 10% | -3% | 3% | 2% | |
| Maximum Upper Side * | 47.8 | 46 4% | 37.8 21% | 39.7 17% | 45.2 5% | 49.2 -3% |
| Maximum Bottom * | 42.2 | 45.8 -9% | 44.8 -6% | 60 -42% | 44 -4% | 50.2 -19% |
| Idle Upper Side * | 35.2 | 29.2 17% | 30.6 13% | 30.9 12% | 33.6 5% | 29.4 16% |
| Idle Bottom * | 35 | 31 11% | 31 11% | 34.7 1% | 32.6 7% | 30 14% |
* ... smaller is better
压力测试
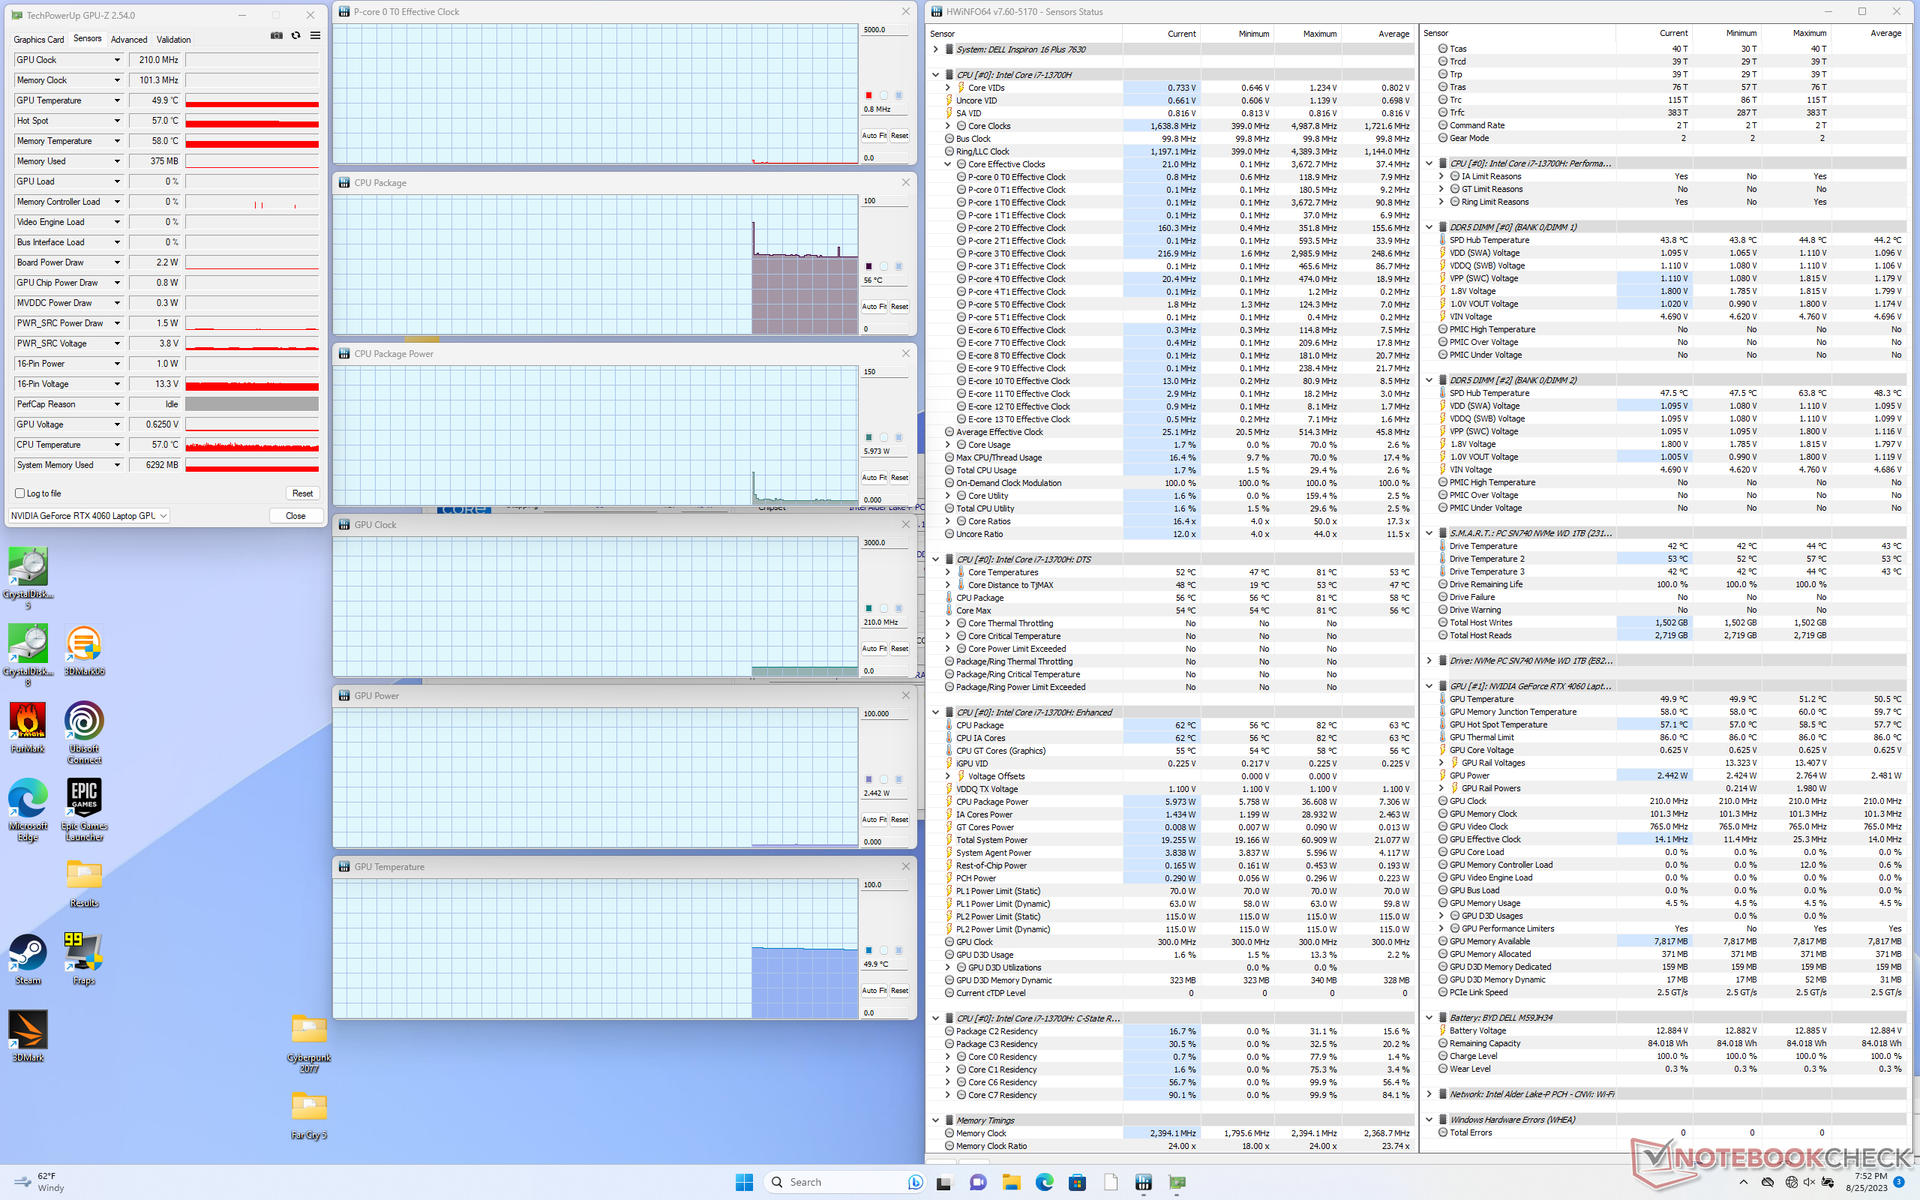
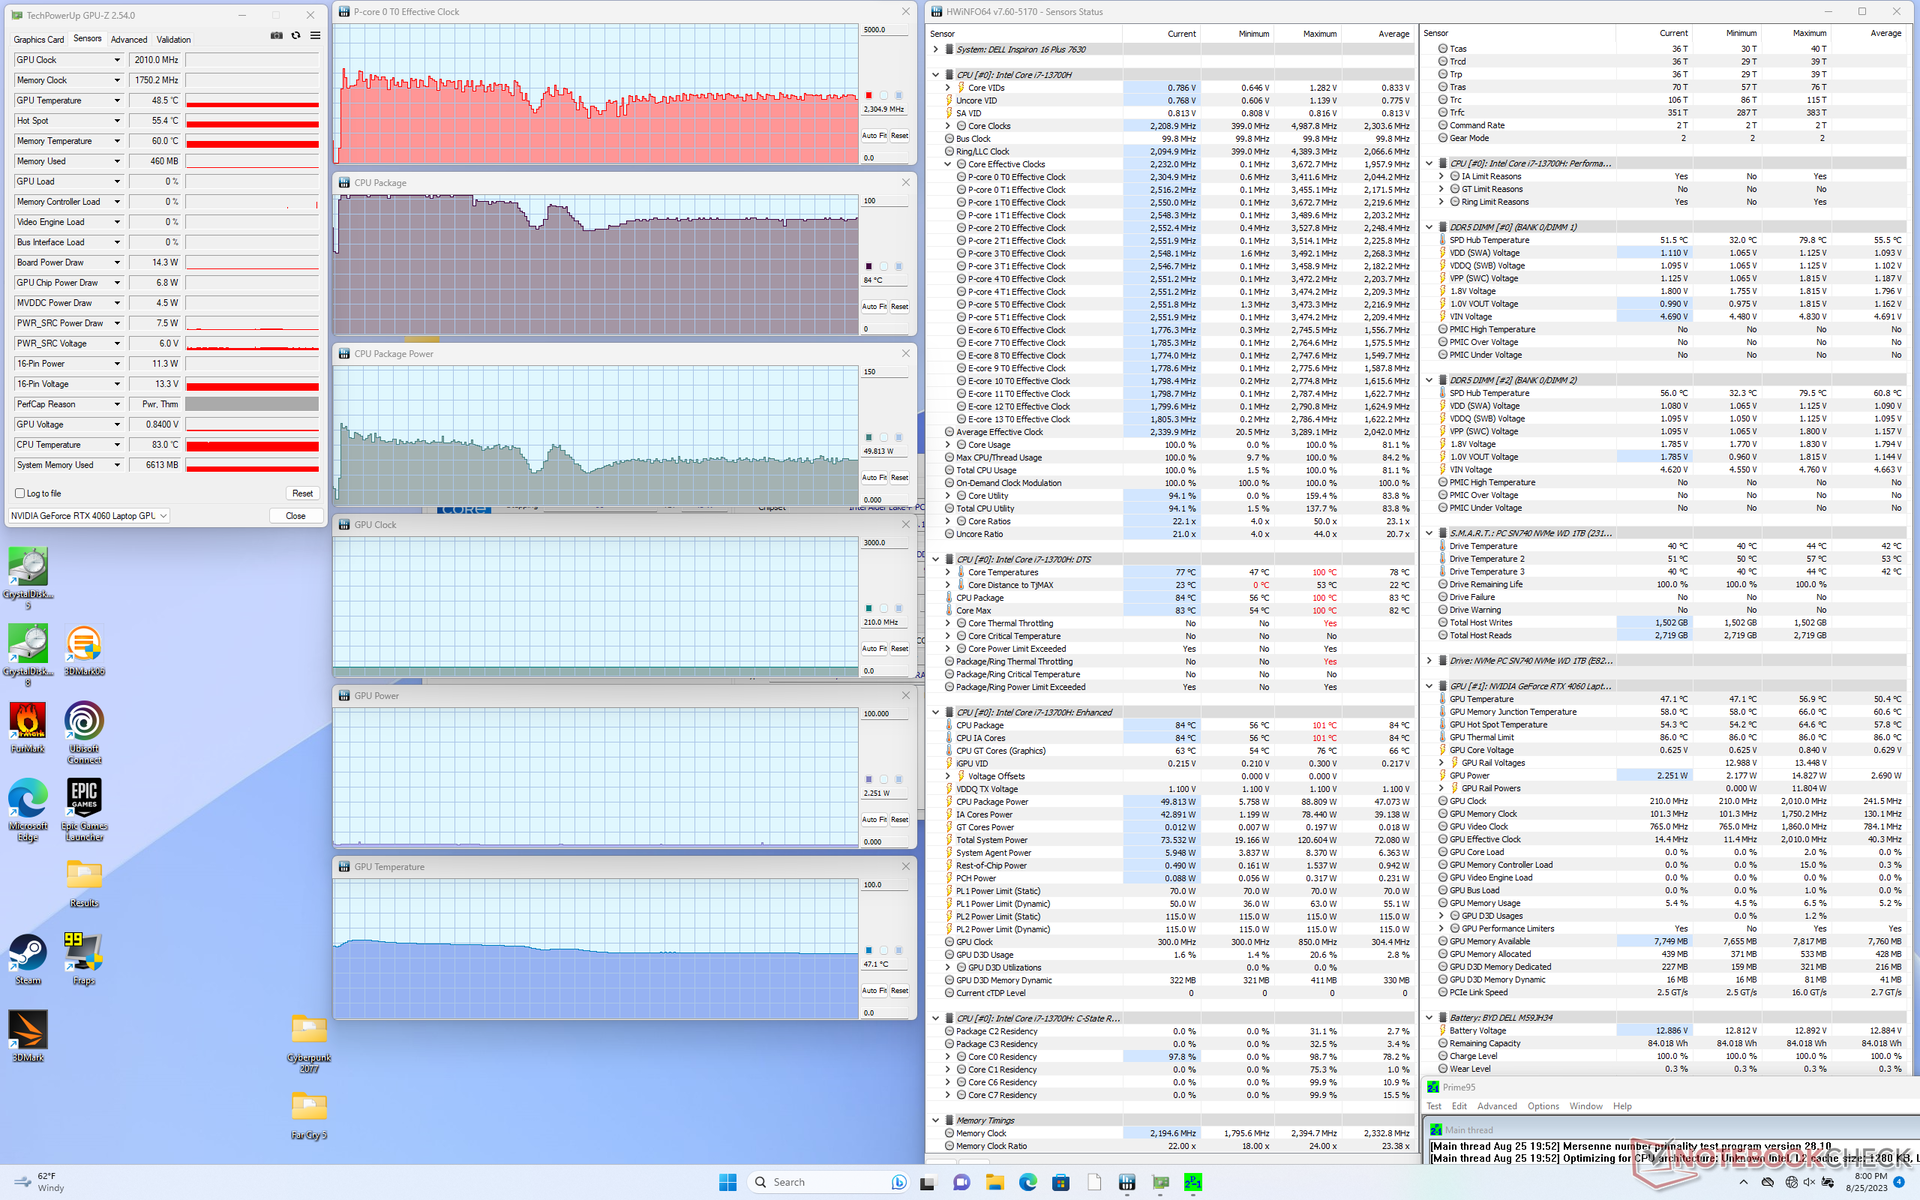
在运行 Prime95 时,CPU 会在短短几秒钟内升至 3.4 GHz、89 W 和 100 C,最终稳定在 2.3 GHz 和 50 W 左右,以保持 84 C 的合理核心温度。
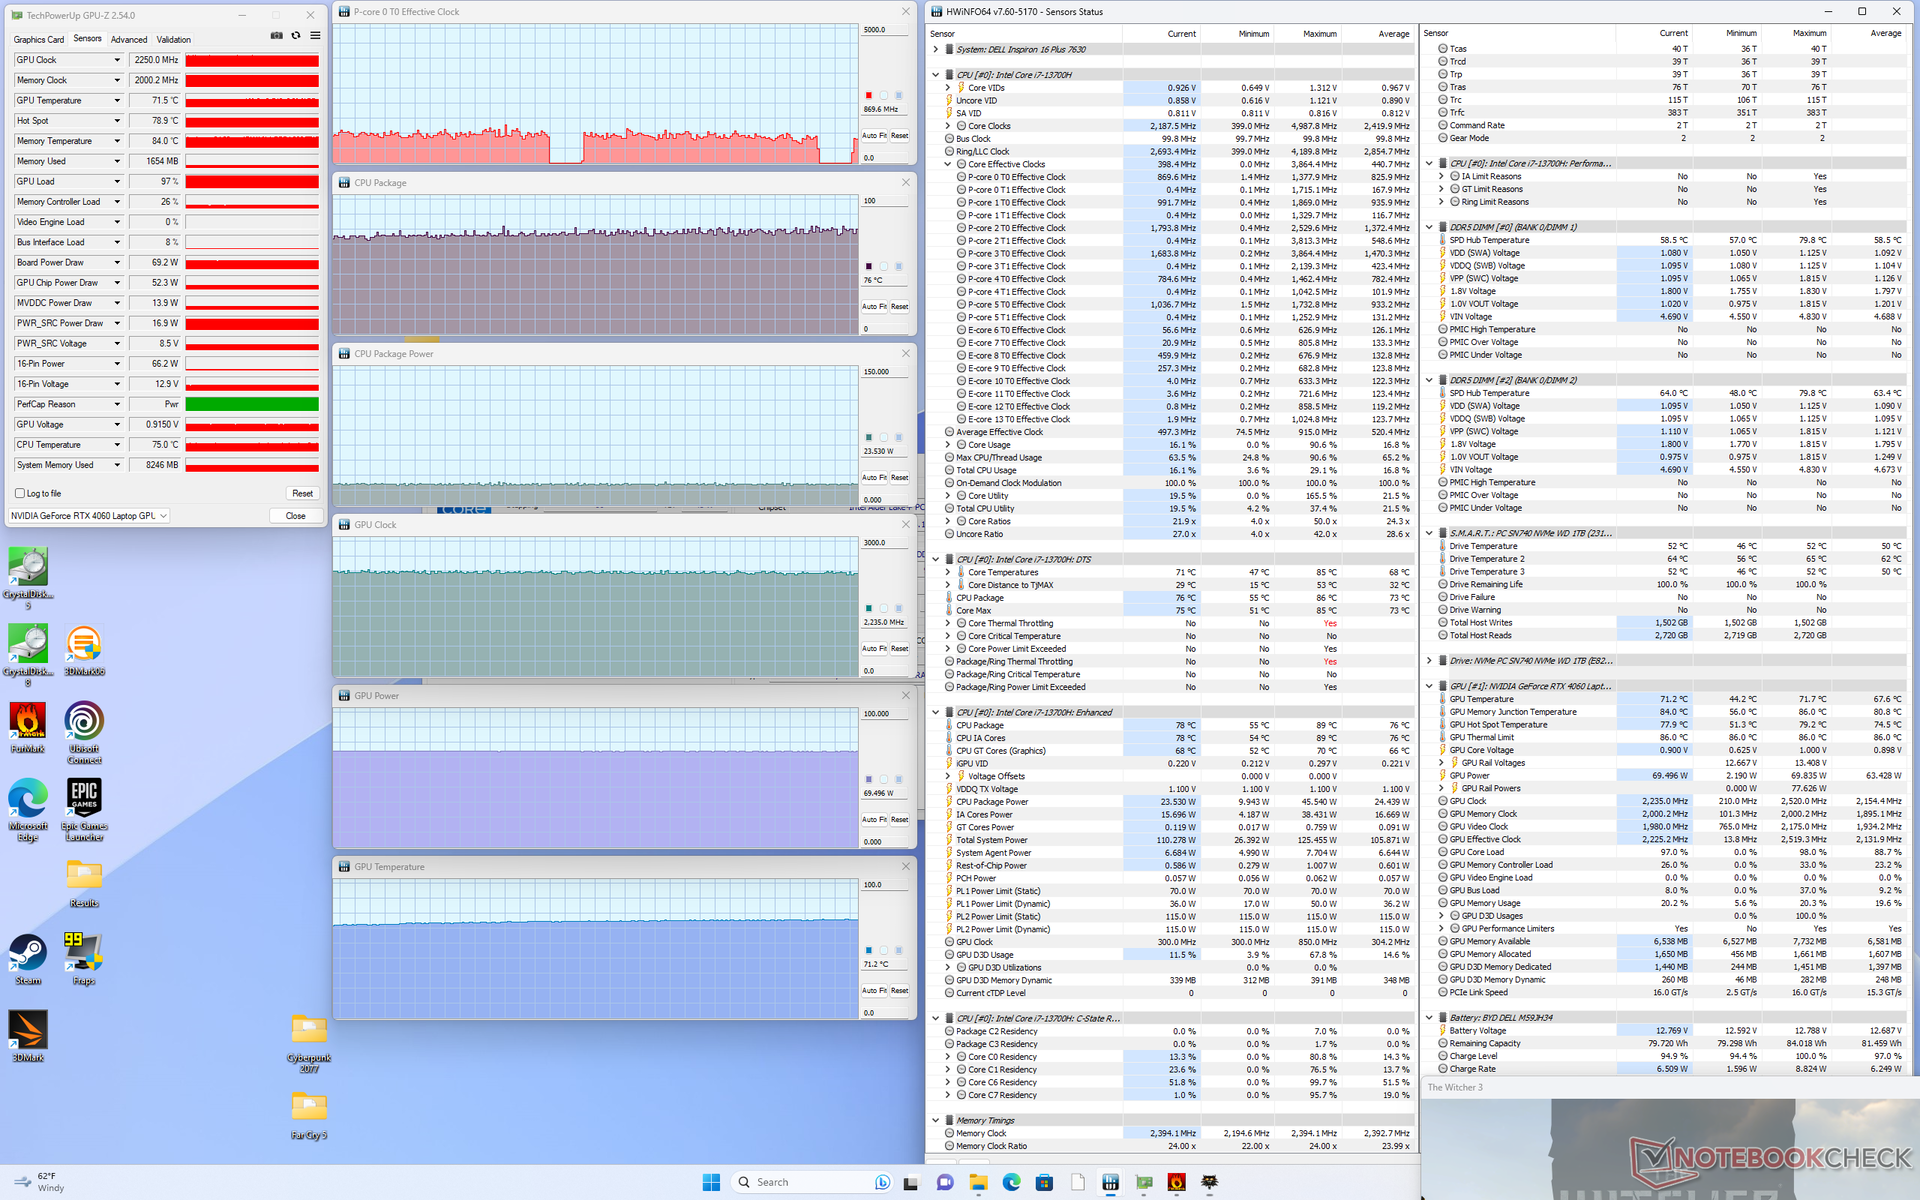
运行 Witcher 3根据 HWiNFO 的数据,在代表典型游戏负载的 "性能 "模式下,Nvidia GPU 将稳定在 2235 MHz、71 C 和 69 W。降至平衡模式不会对这些值产生明显影响,这与我们在Fire Strike 上观察到的结果一致。有趣的是,核心温度比我们在 Inspiron 16 Plus 7620在运行相同游戏时,核心温度要比我们在 Inspiron 16 Plus 7620 上记录到的温度低得多,这可能是由于我们的风扇噪音较大以及散热解决方案的整体改进所致。
请注意,虽然 HWiNFO 报告游戏时 GPU 功耗为 69 W,但戴尔宣传的 GPU 功耗仅为 60 W。
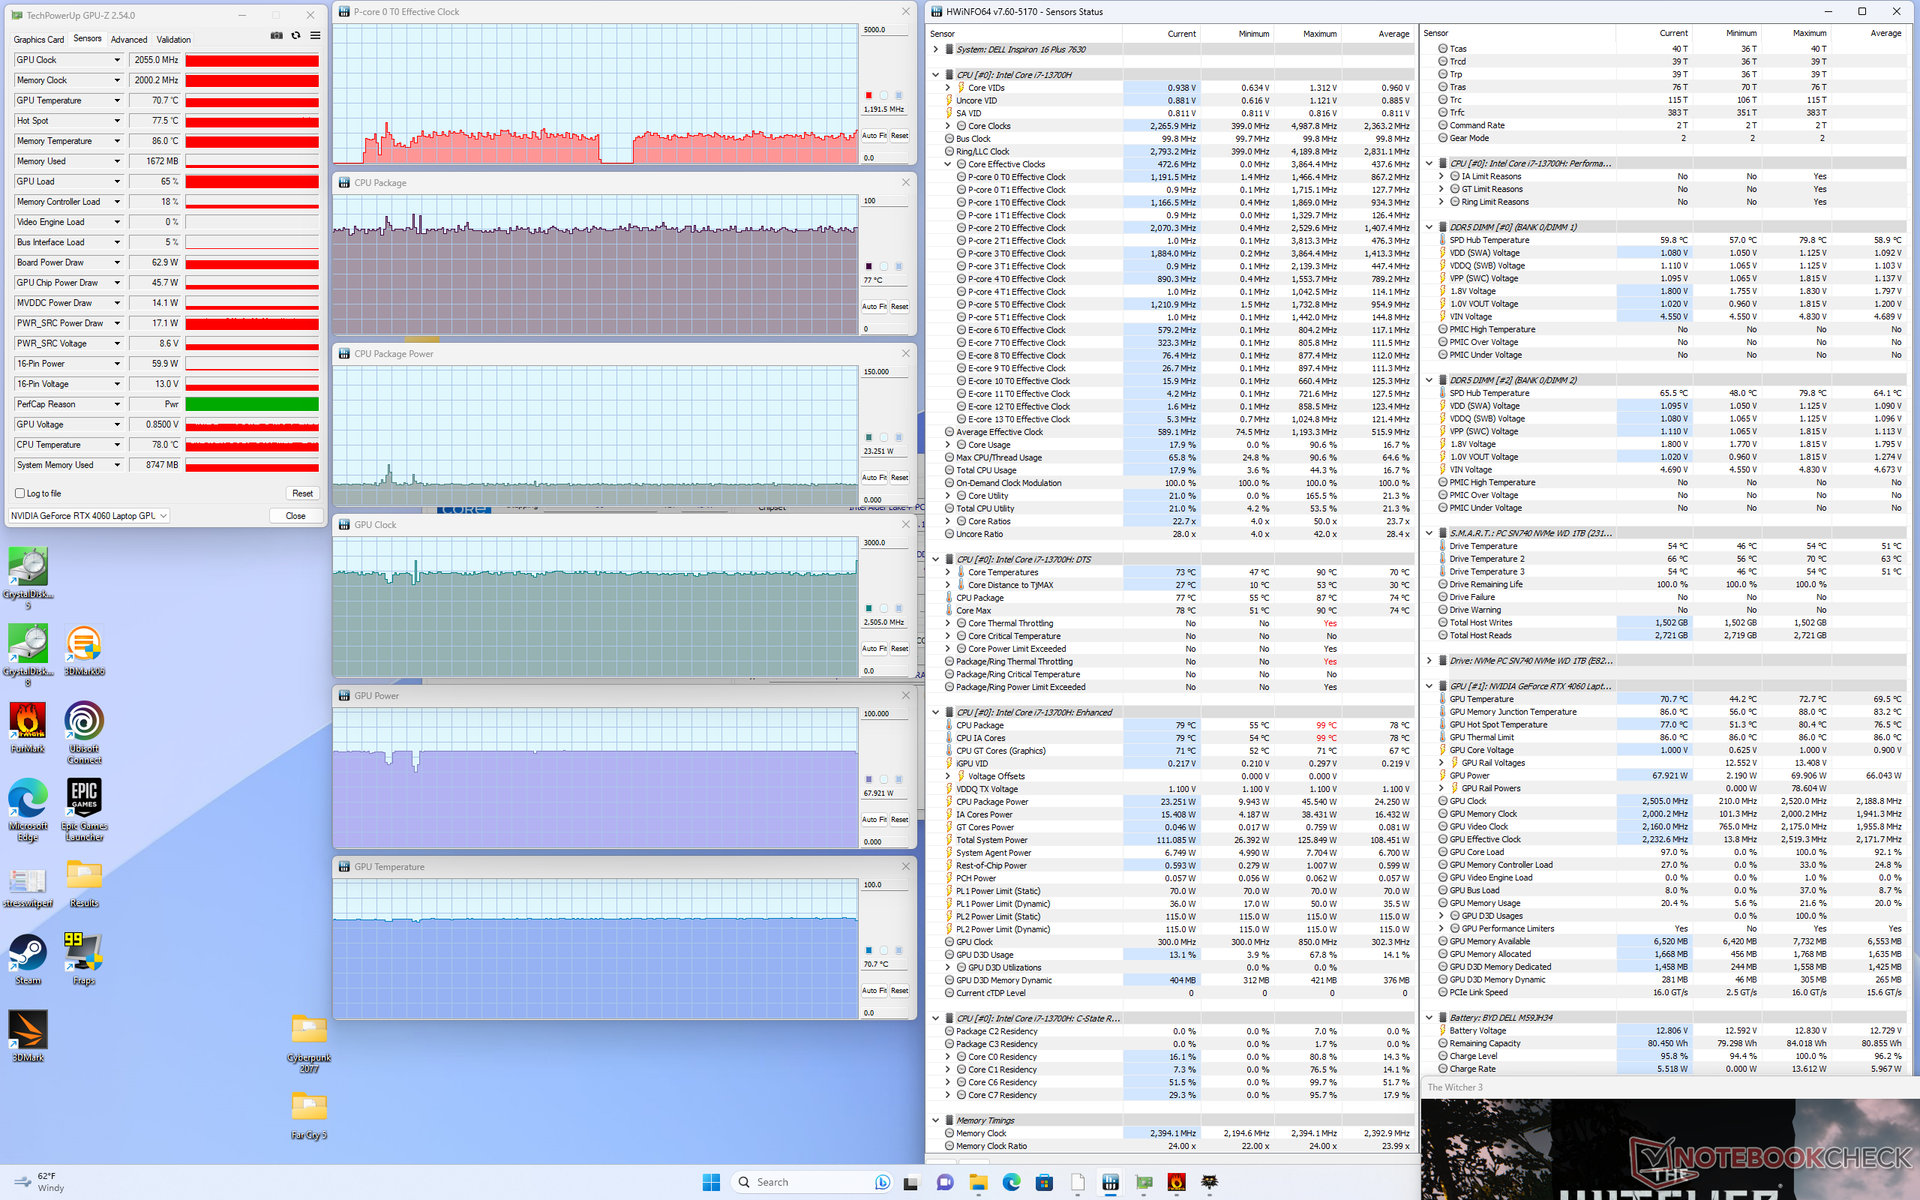
| CPU 时钟 (GHz) | GPU 时钟 (MHz) | CPU 平均温度 (°C) | GPU 平均温度(°C) | |
| 系统闲置 | -- | -- | 56 | 50 |
| Prime95 压力 | 2.3 - 2.4 | -- | 84 | 47 |
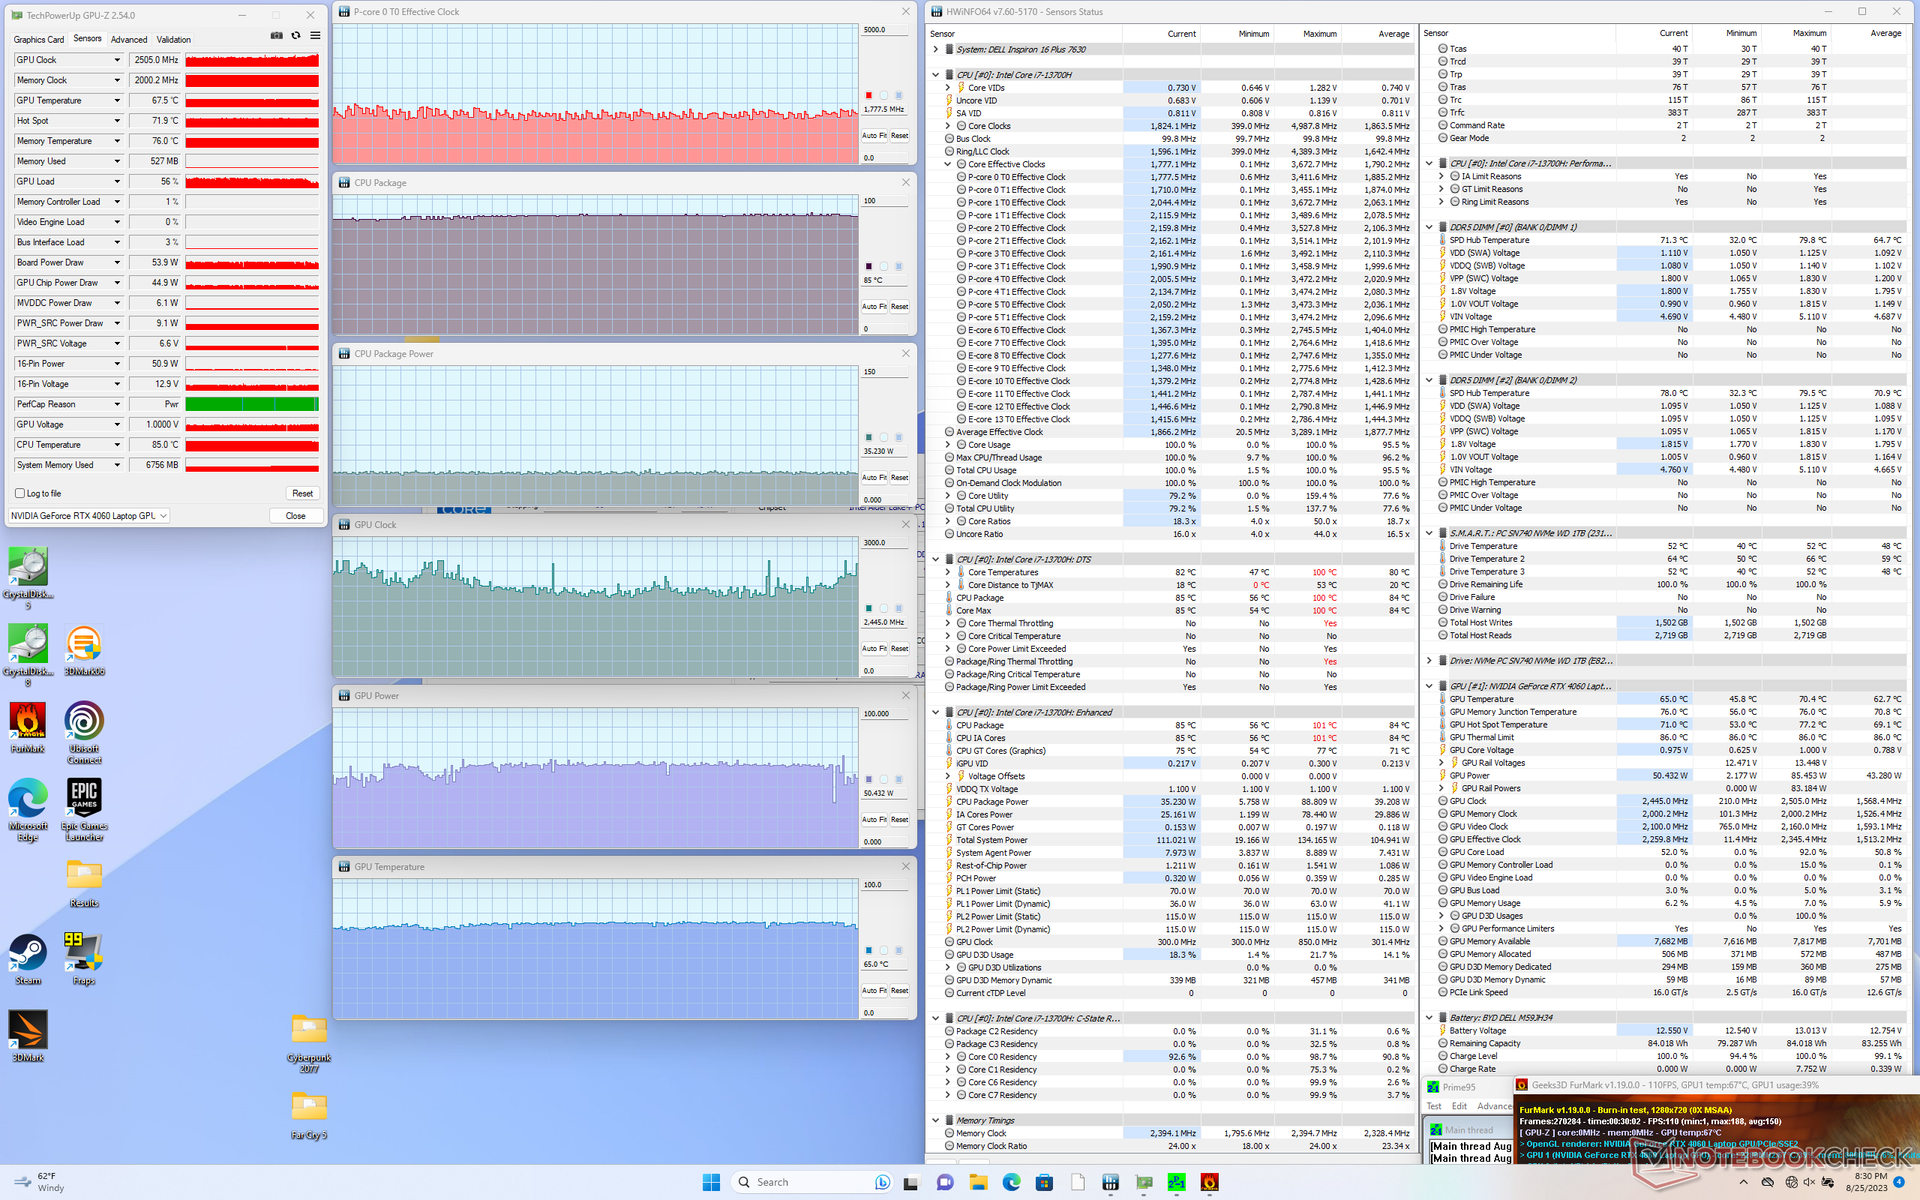
| Prime95 + FurMark 压力 | ~1.8 | ~2445 | 85 | 65 |
| Witcher 3 压力(平衡模式) | ~1.1 | 2055 | 77 | 71 |
| Witcher 3 压力(性能模式) | ~1.1 | 2250 | 76 | 71 |
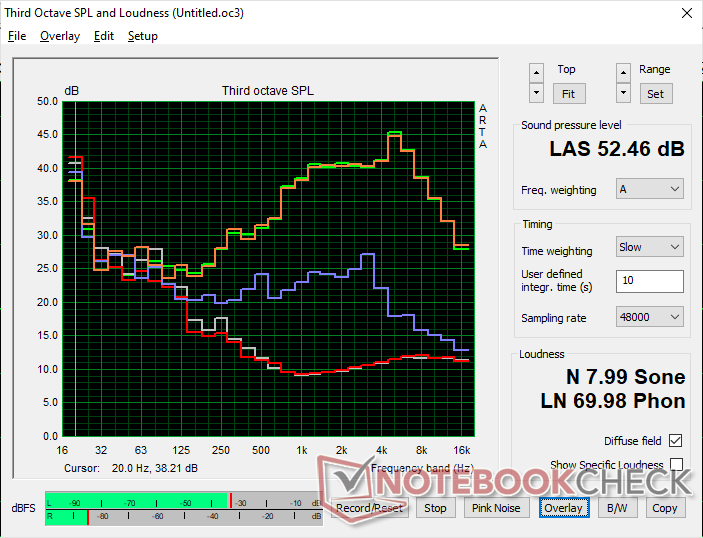
发言人
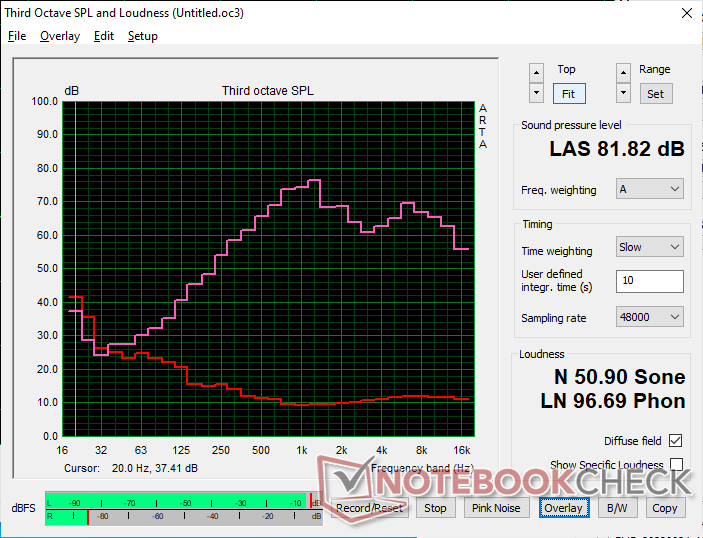
Dell Inspiron 16 Plus 7630 audio analysis
(±) | speaker loudness is average but good (81.8 dB)
Bass 100 - 315 Hz
(-) | nearly no bass - on average 17% lower than median
(±) | linearity of bass is average (8.4% delta to prev. frequency)
Mids 400 - 2000 Hz
(±) | higher mids - on average 6.3% higher than median
(+) | mids are linear (6.2% delta to prev. frequency)
Highs 2 - 16 kHz
(+) | balanced highs - only 2.2% away from median
(+) | highs are linear (5.6% delta to prev. frequency)
Overall 100 - 16.000 Hz
(±) | linearity of overall sound is average (15.9% difference to median)
Compared to same class
» 36% of all tested devices in this class were better, 6% similar, 58% worse
» The best had a delta of 5%, average was 18%, worst was 45%
Compared to all devices tested
» 23% of all tested devices were better, 5% similar, 72% worse
» The best had a delta of 4%, average was 24%, worst was 134%
Apple MacBook Pro 16 2021 M1 Pro audio analysis
(+) | speakers can play relatively loud (84.7 dB)
Bass 100 - 315 Hz
(+) | good bass - only 3.8% away from median
(+) | bass is linear (5.2% delta to prev. frequency)
Mids 400 - 2000 Hz
(+) | balanced mids - only 1.3% away from median
(+) | mids are linear (2.1% delta to prev. frequency)
Highs 2 - 16 kHz
(+) | balanced highs - only 1.9% away from median
(+) | highs are linear (2.7% delta to prev. frequency)
Overall 100 - 16.000 Hz
(+) | overall sound is linear (4.6% difference to median)
Compared to same class
» 0% of all tested devices in this class were better, 0% similar, 100% worse
» The best had a delta of 5%, average was 18%, worst was 45%
Compared to all devices tested
» 0% of all tested devices were better, 0% similar, 100% worse
» The best had a delta of 4%, average was 24%, worst was 134%
能源管理
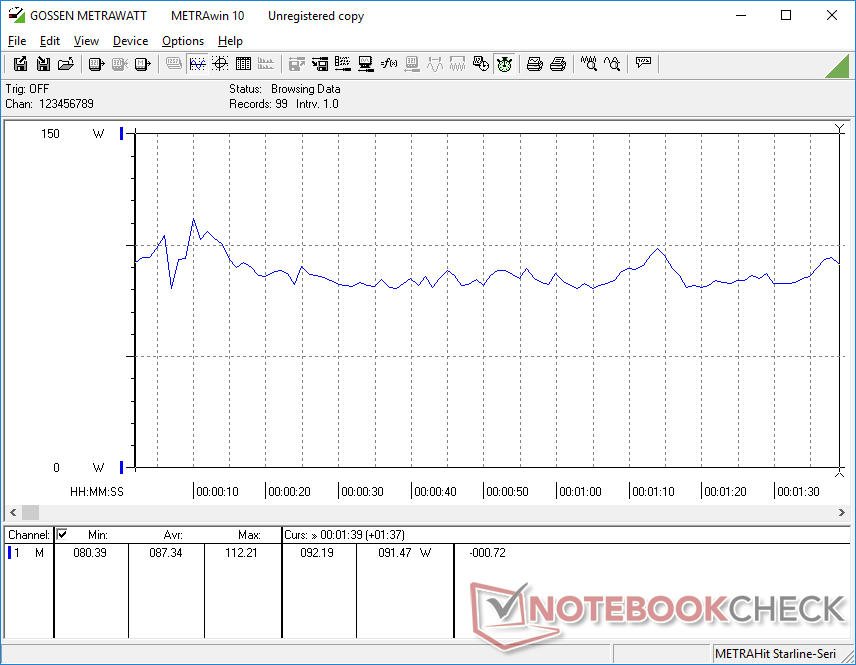
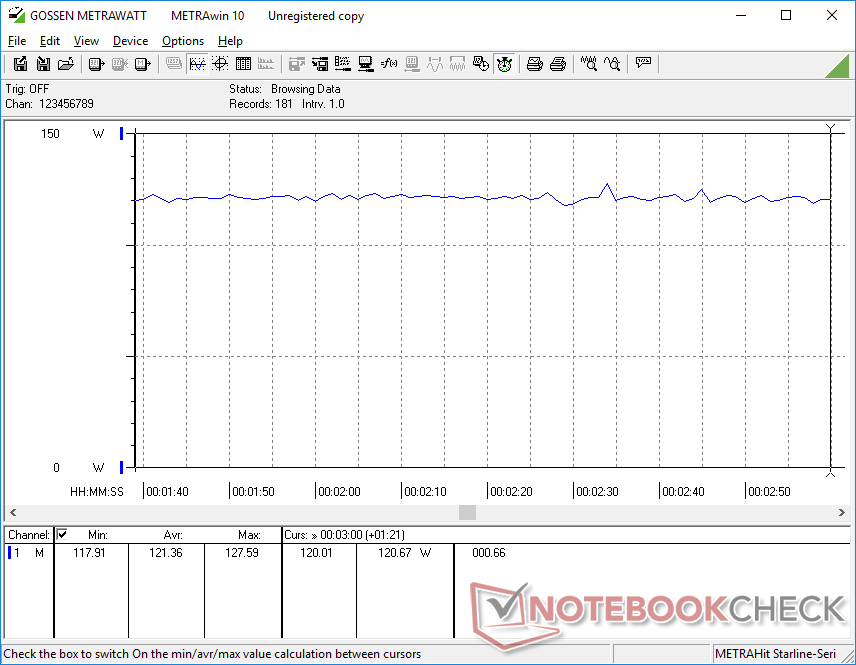
功耗 - GPU 每瓦特高性能
在桌面空闲或运行游戏时,耗电量略高于去年的型号。不过,与 RTX 3050 Ti 相比图形性能提高 40% 至 60% 相比,运行游戏时增加的 8% 显得微不足道。因此,尽管功耗可能会稍高一些,但每瓦性能仍然有利于我们的新机型。
采用与戴尔 Inspiron 相同 CPU 和 GPU 的游戏笔记本电脑,如宏碁 Nitro 17等游戏笔记本电脑往往更耗电,因为它们需要更高的能耗水平,才能从处理器中榨取更多性能。例如,在玩游戏时,宏碁需要多消耗约 30 瓦的功率。
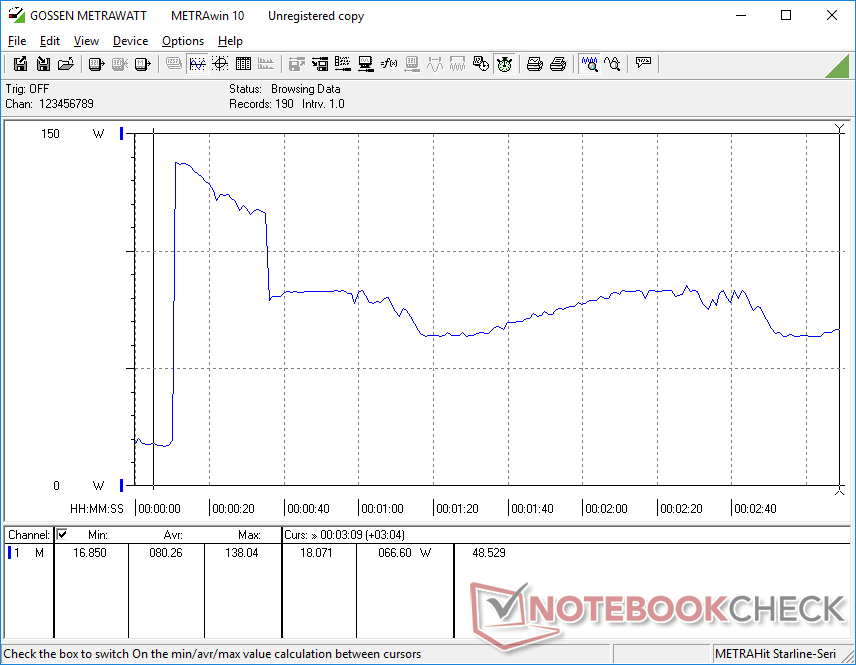
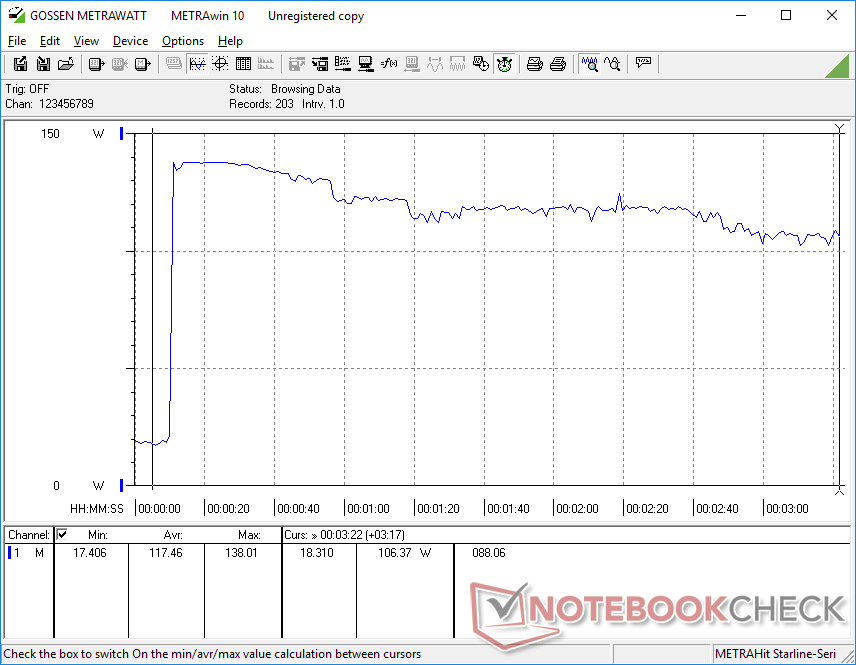
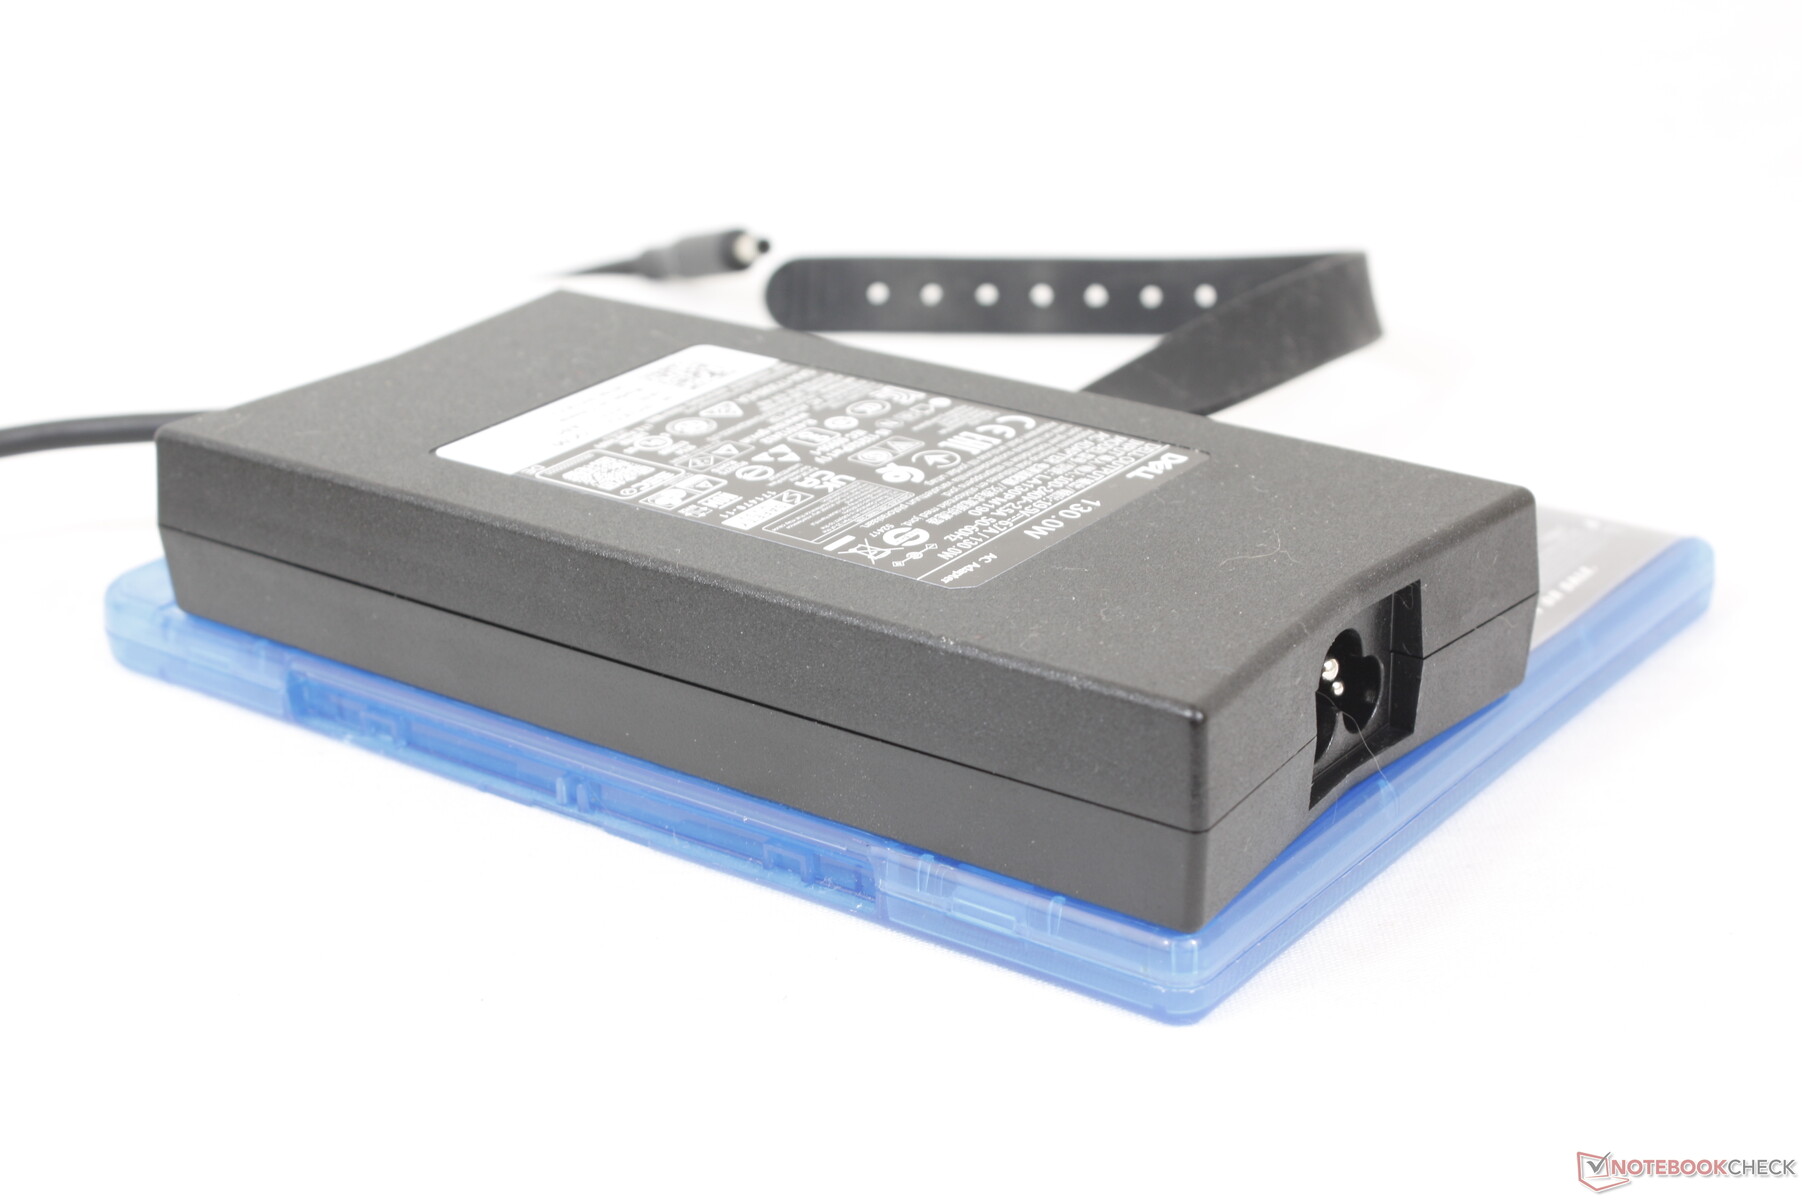
当 CPU 和 GPU 的利用率达到 100% 时,我们可以测量到中等尺寸(约 15 x 7.4 x 2.5 厘米)的 130 W AC 适配器的临时最大功耗为 138 W。请注意,没有独立显卡的配置配备的是较小的 90 瓦交流适配器。
| Off / Standby | |
| Idle | |
| Load |
|
Key:
min: | |
| Dell Inspiron 16 Plus 7630 i7-13700H, NVIDIA GeForce RTX 4060 Laptop GPU, WD PC SN740 SDDPTQD-1T00, IPS, 2560x1600, 16" | Dell Inspiron 16 Plus 7620 i7-12700H, GeForce RTX 3050 Ti Laptop GPU, Kioxia BG5 KBG50ZNS512G, IPS, 3072x1920, 16" | Lenovo Slim Pro 9i 16IRP8 i9-13905H, NVIDIA GeForce RTX 4050 Laptop GPU, Samsung PM9A1 MZVL21T0HCLR, Mini-LED, 3200x2000, 16" | Asus Vivobook Pro 16X K6604JV-MX016W i9-13980HX, NVIDIA GeForce RTX 4060 Laptop GPU, Solidigm P41 Plus SSDPFKNU010TZ, OLED, 3200x2000, 16" | HP Envy 16 h0112nr i7-12700H, GeForce RTX 3060 Laptop GPU, Micron 3400 1TB MTFDKBA1T0TFH, OLED, 3840x2400, 16" | MSI Summit E16 Flip A12UDT-031 i7-1280P, GeForce RTX 3050 Ti Laptop GPU, Samsung PM9A1 MZVL22T0HBLB, IPS, 2560x1600, 16" | |
|---|---|---|---|---|---|---|
| Power Consumption | 15% | -28% | -23% | -9% | 22% | |
| Idle Minimum * | 15.6 | 6.8 56% | 16 -3% | 13.8 12% | 10 36% | 9.8 37% |
| Idle Average * | 17.7 | 9.6 46% | 30 -69% | 16 10% | 10.9 38% | 15.3 14% |
| Idle Maximum * | 20.6 | 17 17% | 30.4 -48% | 19 8% | 27.8 -35% | 16.3 21% |
| Load Average * | 87.4 | 117.5 -34% | 78.9 10% | 147 -68% | 116.4 -33% | 87 -0% |
| Witcher 3 ultra * | 121.7 | 113.1 7% | 155.3 -28% | 147.8 -21% | 133.7 -10% | 86.1 29% |
| Load Maximum * | 138 | 137.4 -0% | 180.4 -31% | 244 -77% | 209.8 -52% | 100 28% |
* ... smaller is better
Power Consumption Witcher 3 / Stresstest
Power Consumption external Monitor
电池寿命
电池容量和续航时间都与以前一样。在平衡模式下,我们可以记录 9.5 小时的实际无线局域网浏览时间,这比竞争对手的机型(如联想超薄 Pro 9i 16IRP8或 HP Envy 16 等竞争机型至少各延长了几个小时。
使用随附的交流适配器,从空电到满电大约需要 90 分钟。该系统还可以使用 USB-C 适配器充电,如 XPS 系列随附的适配器。
| Dell Inspiron 16 Plus 7630 i7-13700H, NVIDIA GeForce RTX 4060 Laptop GPU, 86 Wh | Dell Inspiron 16 Plus 7620 i7-12700H, GeForce RTX 3050 Ti Laptop GPU, 86 Wh | Lenovo Slim Pro 9i 16IRP8 i9-13905H, NVIDIA GeForce RTX 4050 Laptop GPU, 75 Wh | Asus Vivobook Pro 16X K6604JV-MX016W i9-13980HX, NVIDIA GeForce RTX 4060 Laptop GPU, 90 Wh | HP Envy 16 h0112nr i7-12700H, GeForce RTX 3060 Laptop GPU, 83 Wh | MSI Summit E16 Flip A12UDT-031 i7-1280P, GeForce RTX 3050 Ti Laptop GPU, 82 Wh | |
|---|---|---|---|---|---|---|
| Battery Runtime | -4% | -30% | -14% | -2% | -24% | |
| Reader / Idle | 1055 | 1114 6% | 1068 1% | |||
| WiFi v1.3 | 566 | 575 2% | 395 -30% | 390 -31% | 472 -17% | 428 -24% |
| Load | 85 | 69 -19% | 88 4% | 94 11% | ||
| H.264 | 319 |
Pros
Cons
结论 - 升级更快的图形处理器
与去年的 Inspiron 16 Plus 7620在许多方面都比最初预期的更为重要。除了从 RTX 3050 Ti 升级到 RTX 4060 时图形性能的大幅提升外,两款机型之间更安静和更响亮的风扇噪音以及更新机型上更低的核心温度也值得注意。显示器选项也有所不同,现在可以选择 120 Hz 刷新率,而 SODIMM 升级现在提供两个插槽,而不是一个。更坚固的铰链也是一个值得欢迎的变化,可以降低铰链过早损坏的几率。即使 CPU 性能不佳,用户体验也得到了充分改善,键盘也与以前一样。
Inspiron 16 Plus 7630 注重的是平衡。它的功能和性能足以满足大多数多媒体和游戏需求,而无需花费巨资。
不过,作为一款全能型多媒体和游戏笔记本电脑,Inspiron 16 Plus 7630 缺少了一些硬核多媒体笔记本电脑和硬核游戏笔记本电脑往往会配备的功能。在多媒体方面,Inspiron 16 Plus 7630 的用户将错过更饱满的 DCi-P3 色彩、更高的原始分辨率和快速集成的 SD 卡读卡器。在游戏方面,该系统省略了 G-Sync 和 MUX,其 RTX 4060 的速度普遍低于平均水平。Inspiron 16 Plus 7630 非常适合内容创建和游戏,但更倾向于内容创建的用户应考虑使用 惠普 Envy 16或 华硕 ZenBook Pro Duo而重度游戏玩家则需要考虑专用游戏机,如 戴尔 G 机型或 华硕 ROG.
价格和供应情况
戴尔现已出货配备酷睿 i7 和 RTX 4060 的 Inspiron 16 Plus 7630,售价 1250 美元。
Dell Inspiron 16 Plus 7630
- 08/30/2023 v7 (old)
Allen Ngo
Transparency
The selection of devices to be reviewed is made by our editorial team. The test sample was provided to the author as a loan by the manufacturer or retailer for the purpose of this review. The lender had no influence on this review, nor did the manufacturer receive a copy of this review before publication. There was no obligation to publish this review. We never accept compensation or payment in return for our reviews. As an independent media company, Notebookcheck is not subjected to the authority of manufacturers, retailers or publishers.
This is how Notebookcheck is testing
Every year, Notebookcheck independently reviews hundreds of laptops and smartphones using standardized procedures to ensure that all results are comparable. We have continuously developed our test methods for around 20 years and set industry standards in the process. In our test labs, high-quality measuring equipment is utilized by experienced technicians and editors. These tests involve a multi-stage validation process. Our complex rating system is based on hundreds of well-founded measurements and benchmarks, which maintains objectivity. Further information on our test methods can be found here.
Price comparison

