

华硕 TUF Gaming A16 评论:酷炫、安静、经济实惠的游戏笔记本电脑,弱点突出但可行
Alienware 的暗示。
Ryzen AI 9 HX 370 加上 RTX 4060 以及分辨率为 1200p 的 144 Hz 显示屏是华硕 TUF Gaming A16 的主要亮点。我们对这款价格相对实惠的 16 英寸游戏笔记本电脑进行了测试,看看它在竞争中的表现如何。Christian Hintze, 👁 Christian Hintze (translated by DeepL / Ninh Duy) Published 🇺🇸 🇩🇪 ...
结论:价格低廉、运行时间长的游戏笔记本电脑
华硕 TUF Gaming A16 重新设计的机箱已初见成效,除非选择涡轮增压模式,否则这款笔记本电脑依然非常凉爽,而且相对安静。
总的来说,TUF Gaming A16 在很多方面都做得很好。只有在显示屏方面,你应该避免选择色彩不准确的廉价机型,而应该选择价格稍高的 1600p 面板。
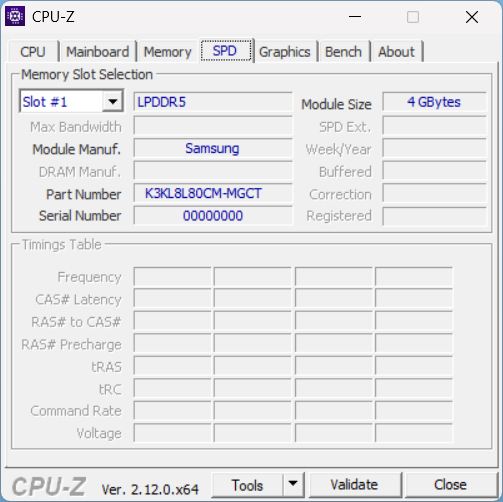
遗憾的是,16 GB 内存是永久安装的,不利于升级,尤其是对于游戏笔记本电脑而言。
Pros
Cons
价格和供应情况
我们的租赁商Alternate正在以 1399 欧元的价格销售 TUF Gaming A16。
配备 165 Hz 2.5K 显示屏的华硕 TUF Gaming A16 在亚马逊的售价为 1,399.99 美元。配备 RTX 4070 和 32 GB LPDDR5X 内存的 TUF Gaming A16 变体在亚马逊的售价也是1699.99 美元。
可能的替代品比较
Image | Model / Review | Price | Weight | Height | Display |
|---|---|---|---|---|---|
1. 83%  | Asus TUF Gaming A16 FA608WV AMD Ryzen AI 9 HX 370 ⎘ NVIDIA GeForce RTX 4060 Laptop GPU ⎘ 16 GB Memory, 1024 GB SSD | Amazon: $1,499.99 List Price: 1399 Euro | 2.2 kg | 25.7 mm | 16.00" 1920x1200 142 PPI IPS |
2. 82.3%  | Lenovo Legion Pro 5 16IRX9 G9 Intel Core i7-14700HX ⎘ NVIDIA GeForce RTX 4060 Laptop GPU ⎘ 32 GB Memory, 1024 GB SSD | Amazon: $1,699.00 List Price: 1.432 Euro | 2.5 kg | 26.55 mm | 16.00" 2560x1600 189 PPI IPS |
3. 85.5% v7 (old)  | Dell G16, i7-13650HX, RTX 4060 Intel Core i7-13650HX ⎘ NVIDIA GeForce RTX 4060 Laptop GPU ⎘ 16 GB Memory, 1024 GB SSD | Amazon: $1,449.99 List Price: 1.599 Euro | 2.8 kg | 25.65 mm | 16.00" 2560x1600 189 PPI IPS |
4. 84.3% v7 (old)  | HP Victus 16 (2024) Intel Core i7-14700HX ⎘ NVIDIA GeForce RTX 4060 Laptop GPU ⎘ 16 GB Memory, 512 GB SSD | Amazon: $1,749.00 List Price: 1499 Euro | 2.4 kg | 23.9 mm | 16.10" 1920x1080 137 PPI IPS |
5. 76.3%  | Acer Nitro V 16 ANV16-41-R5AT AMD Ryzen 7 8845HS ⎘ NVIDIA GeForce RTX 4060 Laptop GPU ⎘ 16 GB Memory, 1024 GB SSD | List Price: 1100 EUR | 2.5 kg | 25.5 mm | 16.00" 1920x1200 142 PPI IPS |
6. 85.1%  | Lenovo ThinkBook 16p G5 IRX 21N50011GE Intel Core i9-14900HX ⎘ NVIDIA GeForce RTX 4060 Laptop GPU ⎘ 32 GB Memory, 1024 GB SSD | Amazon: 1. $1,208.75 Lenovo ThinkBook 16p G4 IRH ... 2. $39.99 Original New for Lenovo Thin... 3. $807.98 Lenovo Thinkbook 16 G7 Ultra... List Price: 2120 Euro | 2.2 kg | 23.1 mm | 16.00" 3200x2000 236 PPI IPS LCD |
华硕 TUF 系列旨在满足入门级游戏玩家的需求。自去年的 TUF GAMING A16.现在,机箱完全重新设计,接口更新,CPU 和 GPU 也更换为 AMD 和 Nvidia 的最新产品。
华硕 TUF Gaming A16 有两个变体 - FA608WI 配备了 RTX 4070 笔记本电脑 GPU和 1600p 显示屏,而我们的测试机 FA608WV 配备了 RTX 4060 笔记本电脑 GPU和我们的测试机 FA608WV(配备 RTX 4060 笔记本电脑 GPU),显示屏分辨率同为 1600p,也可选择 1200p。
规格
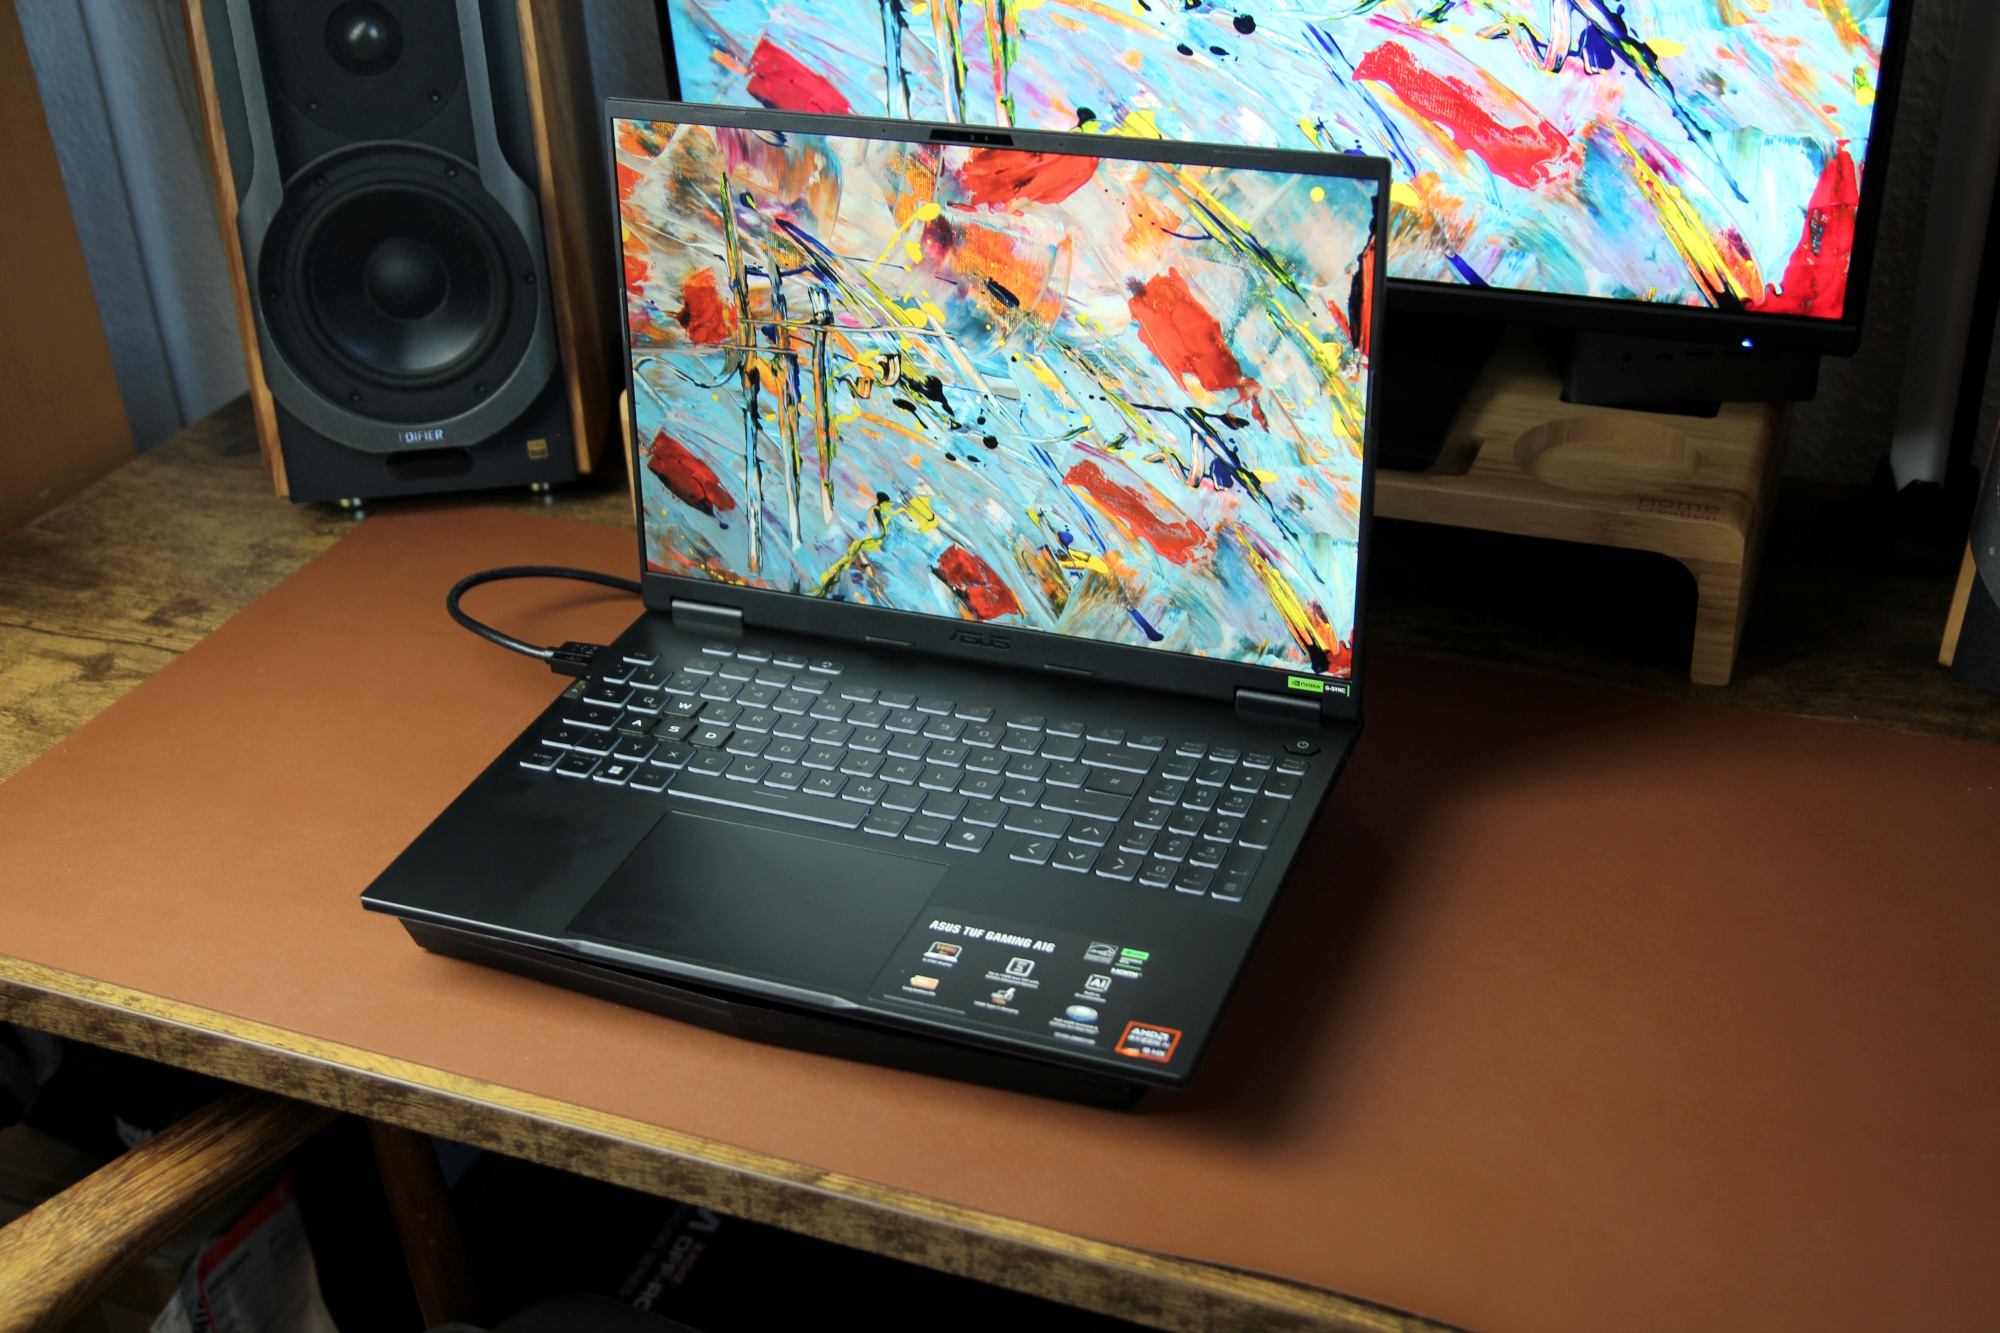
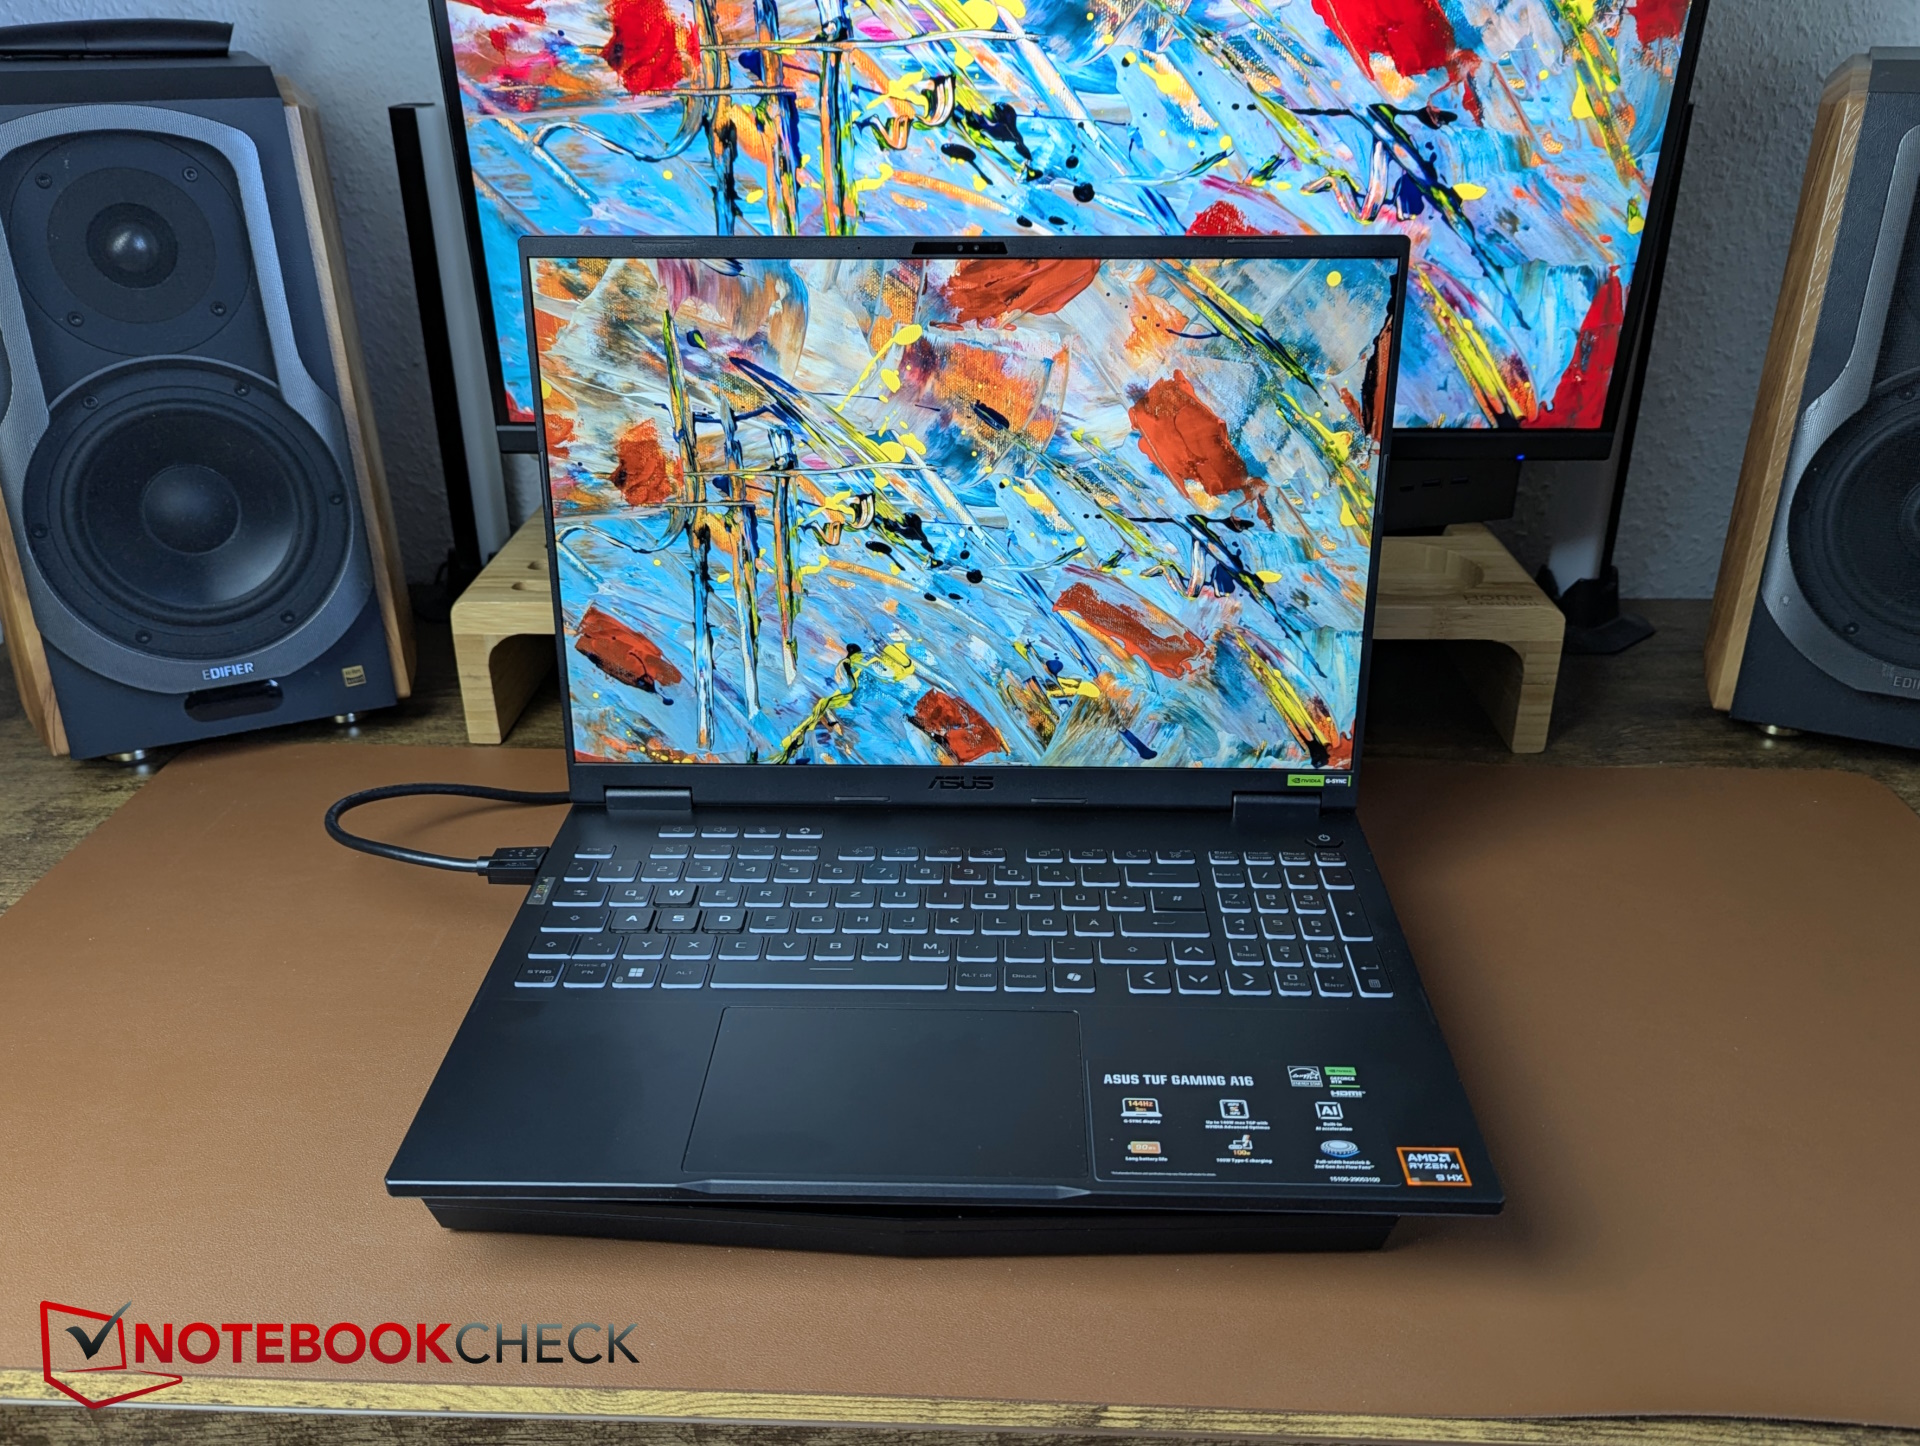
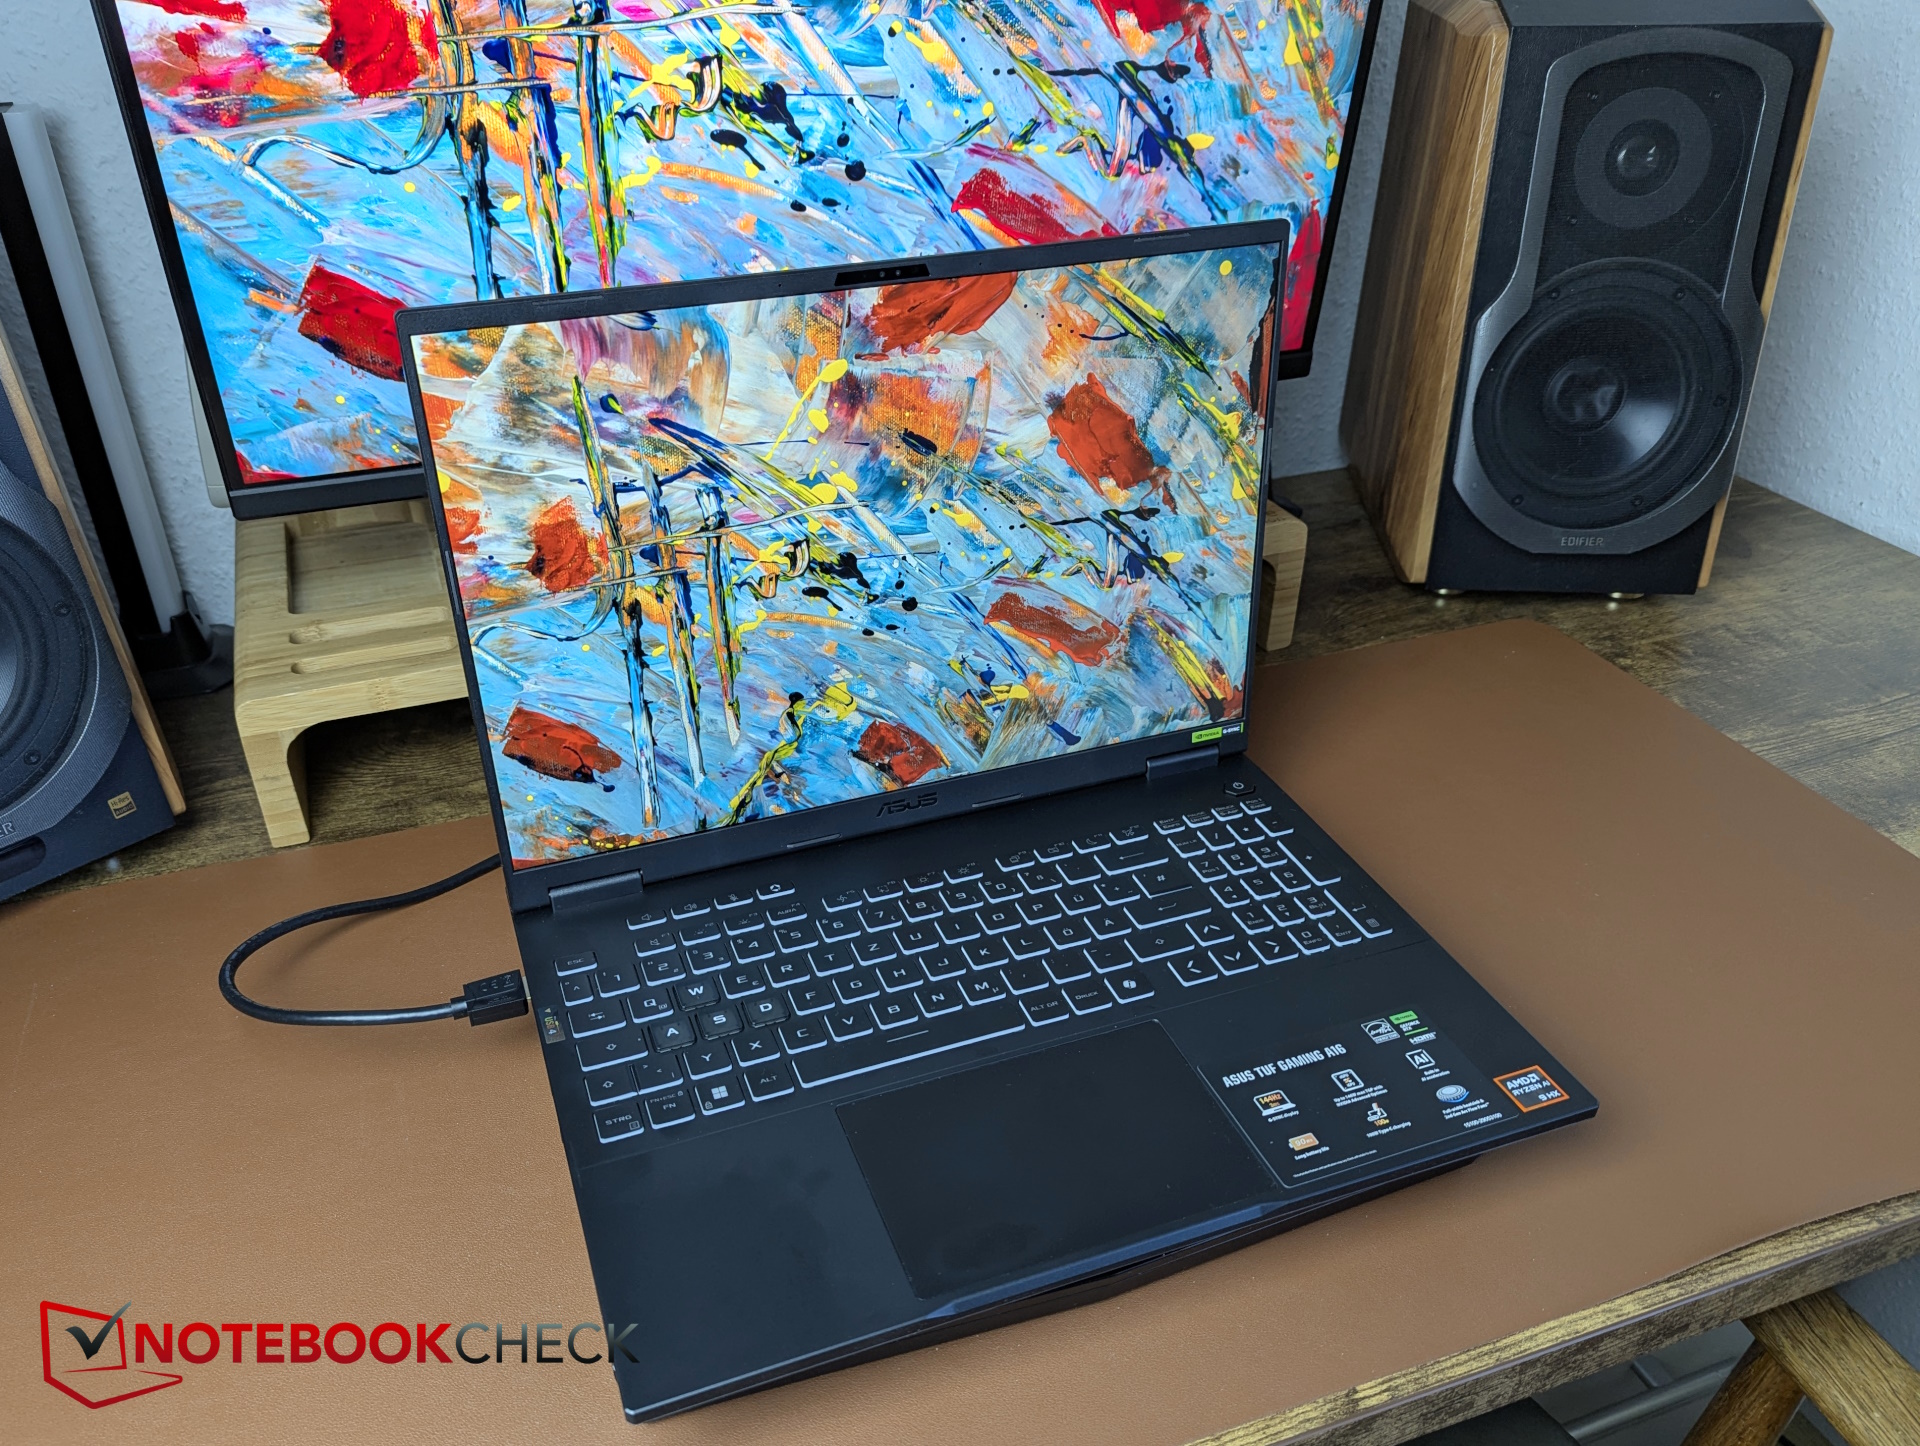
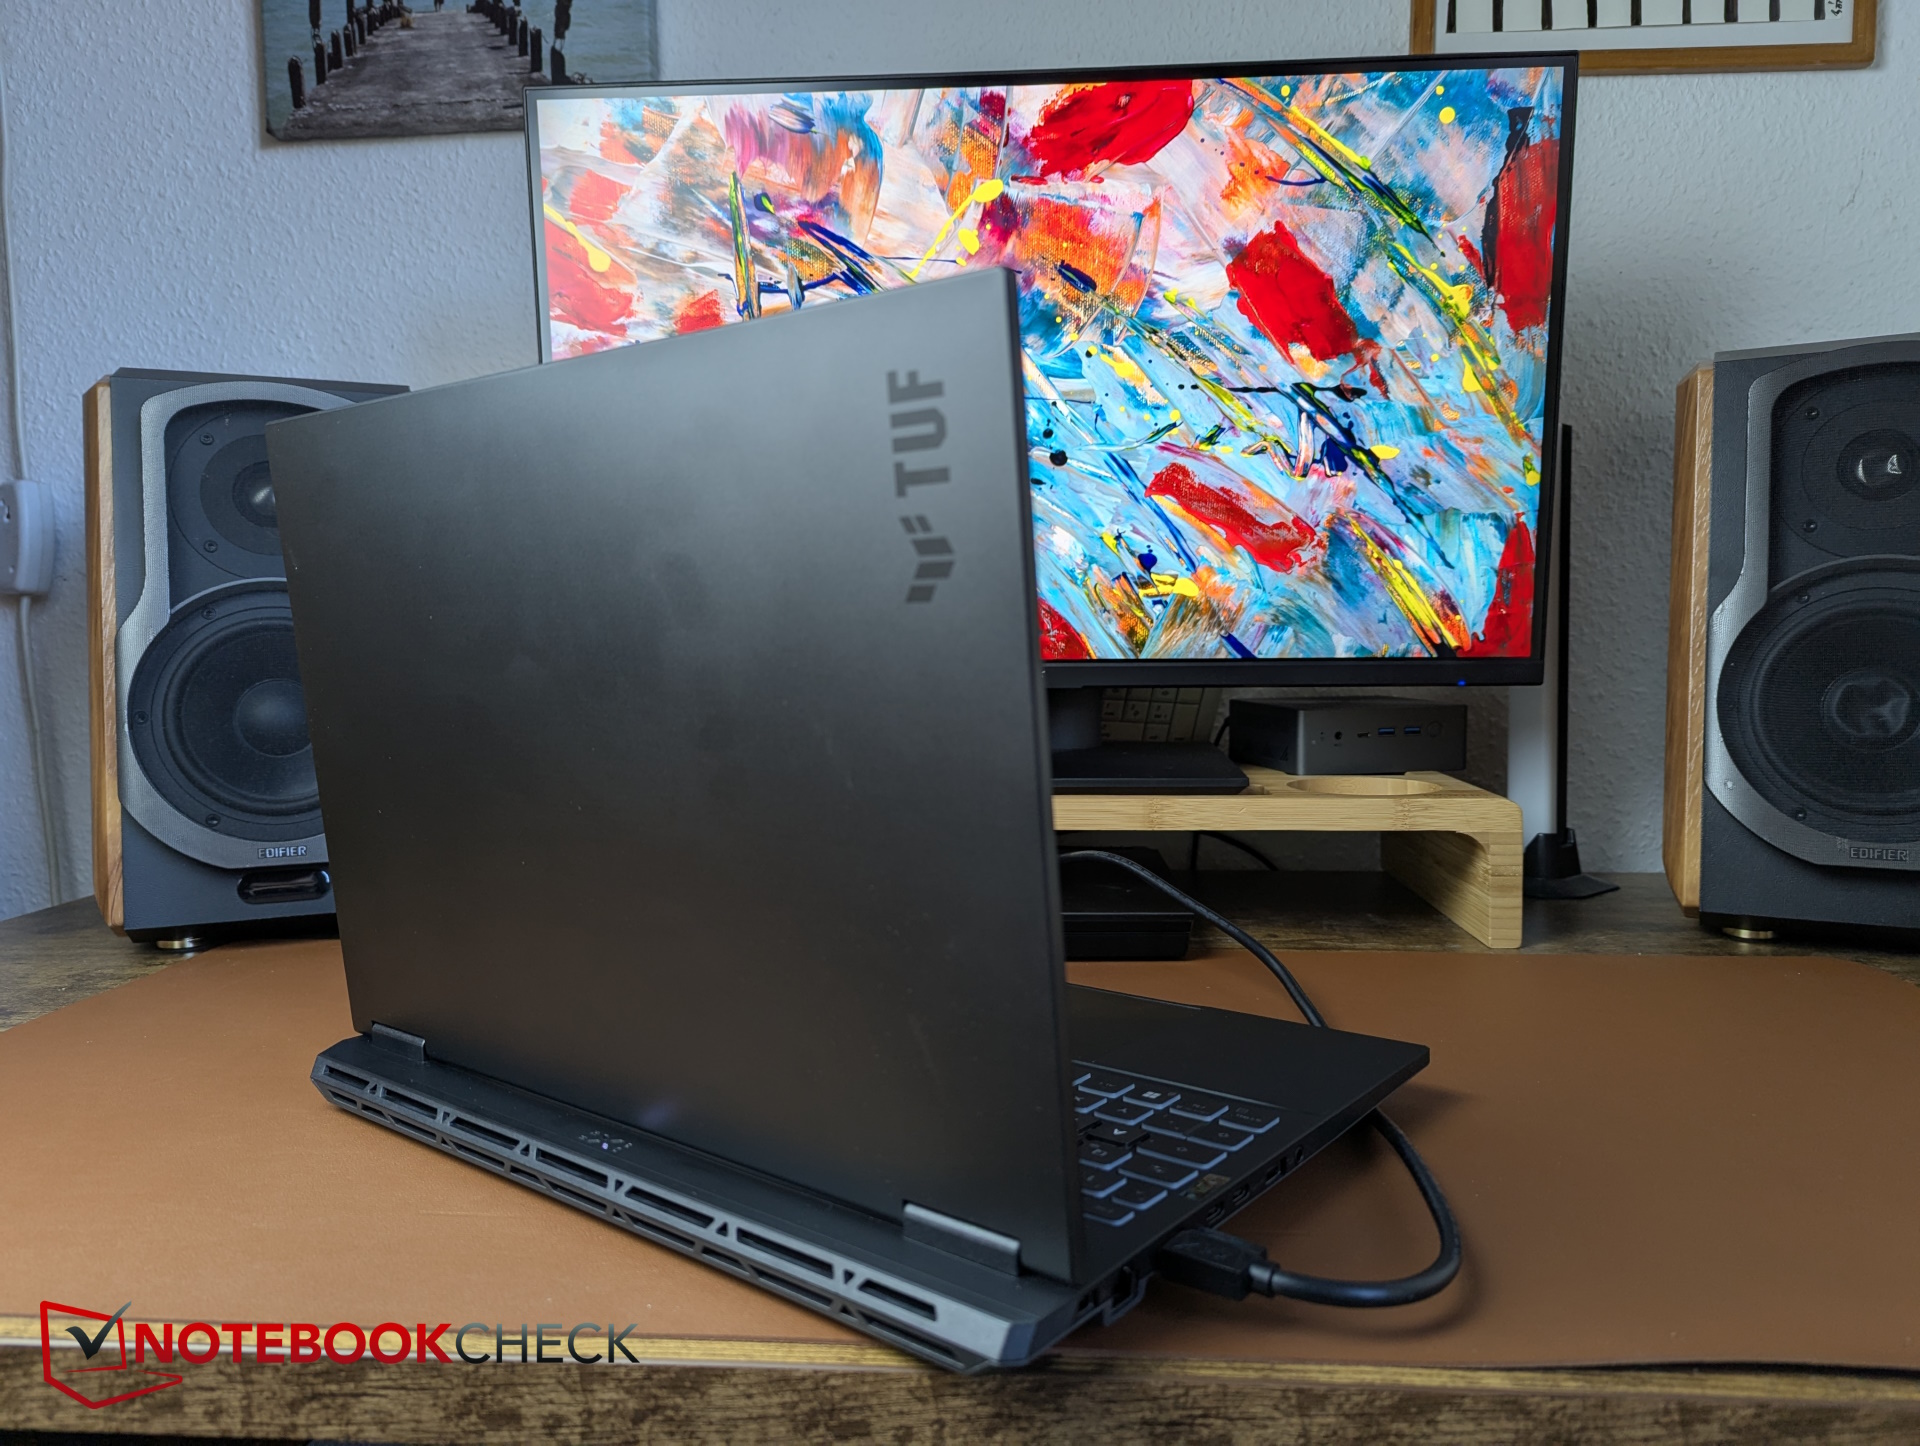
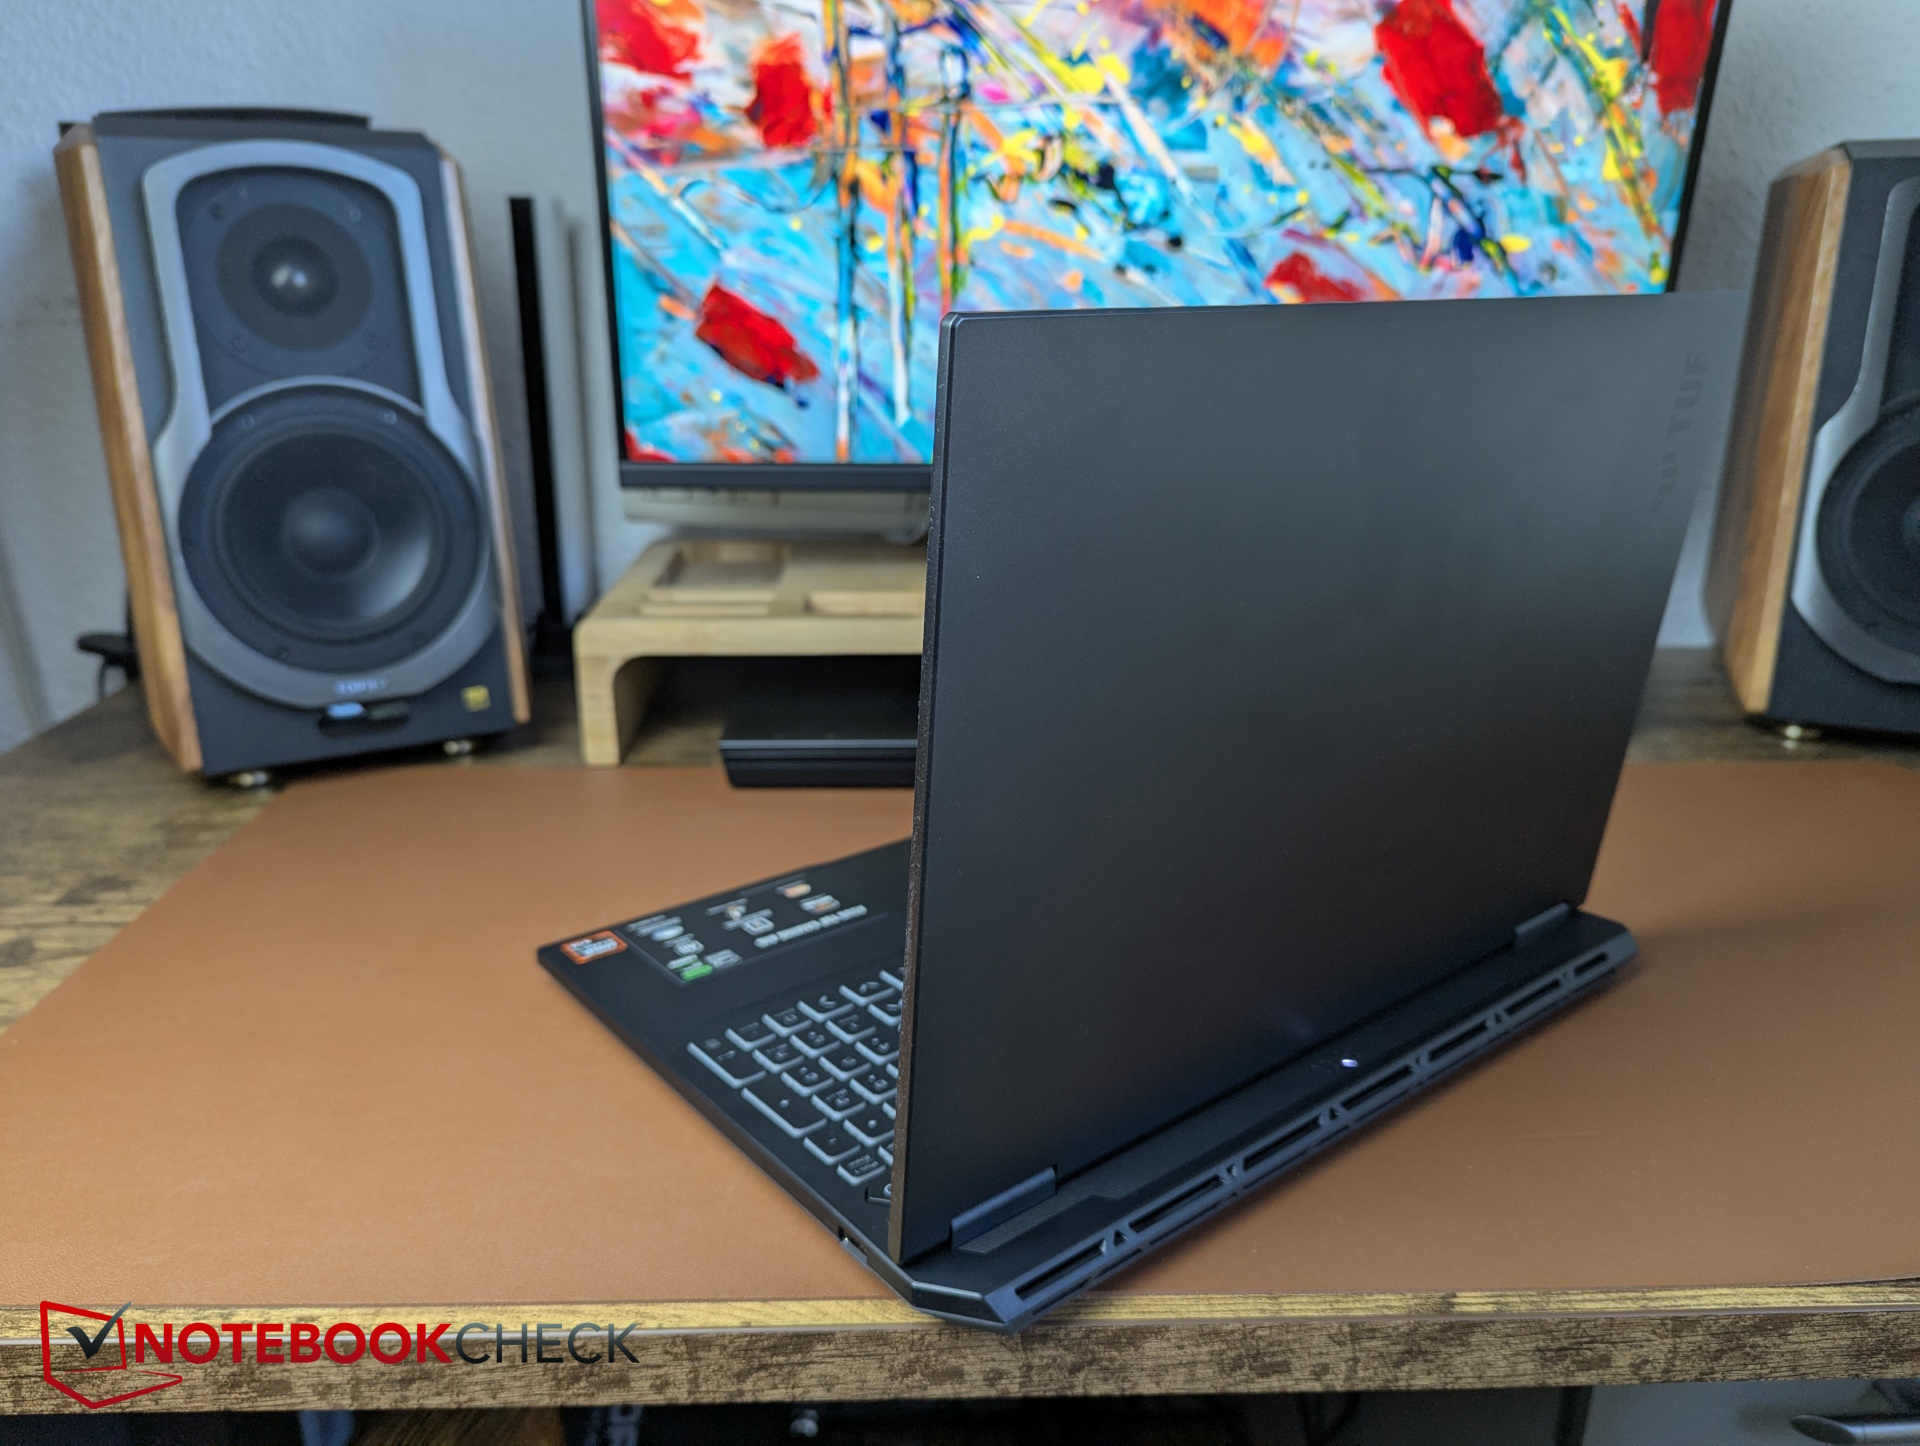
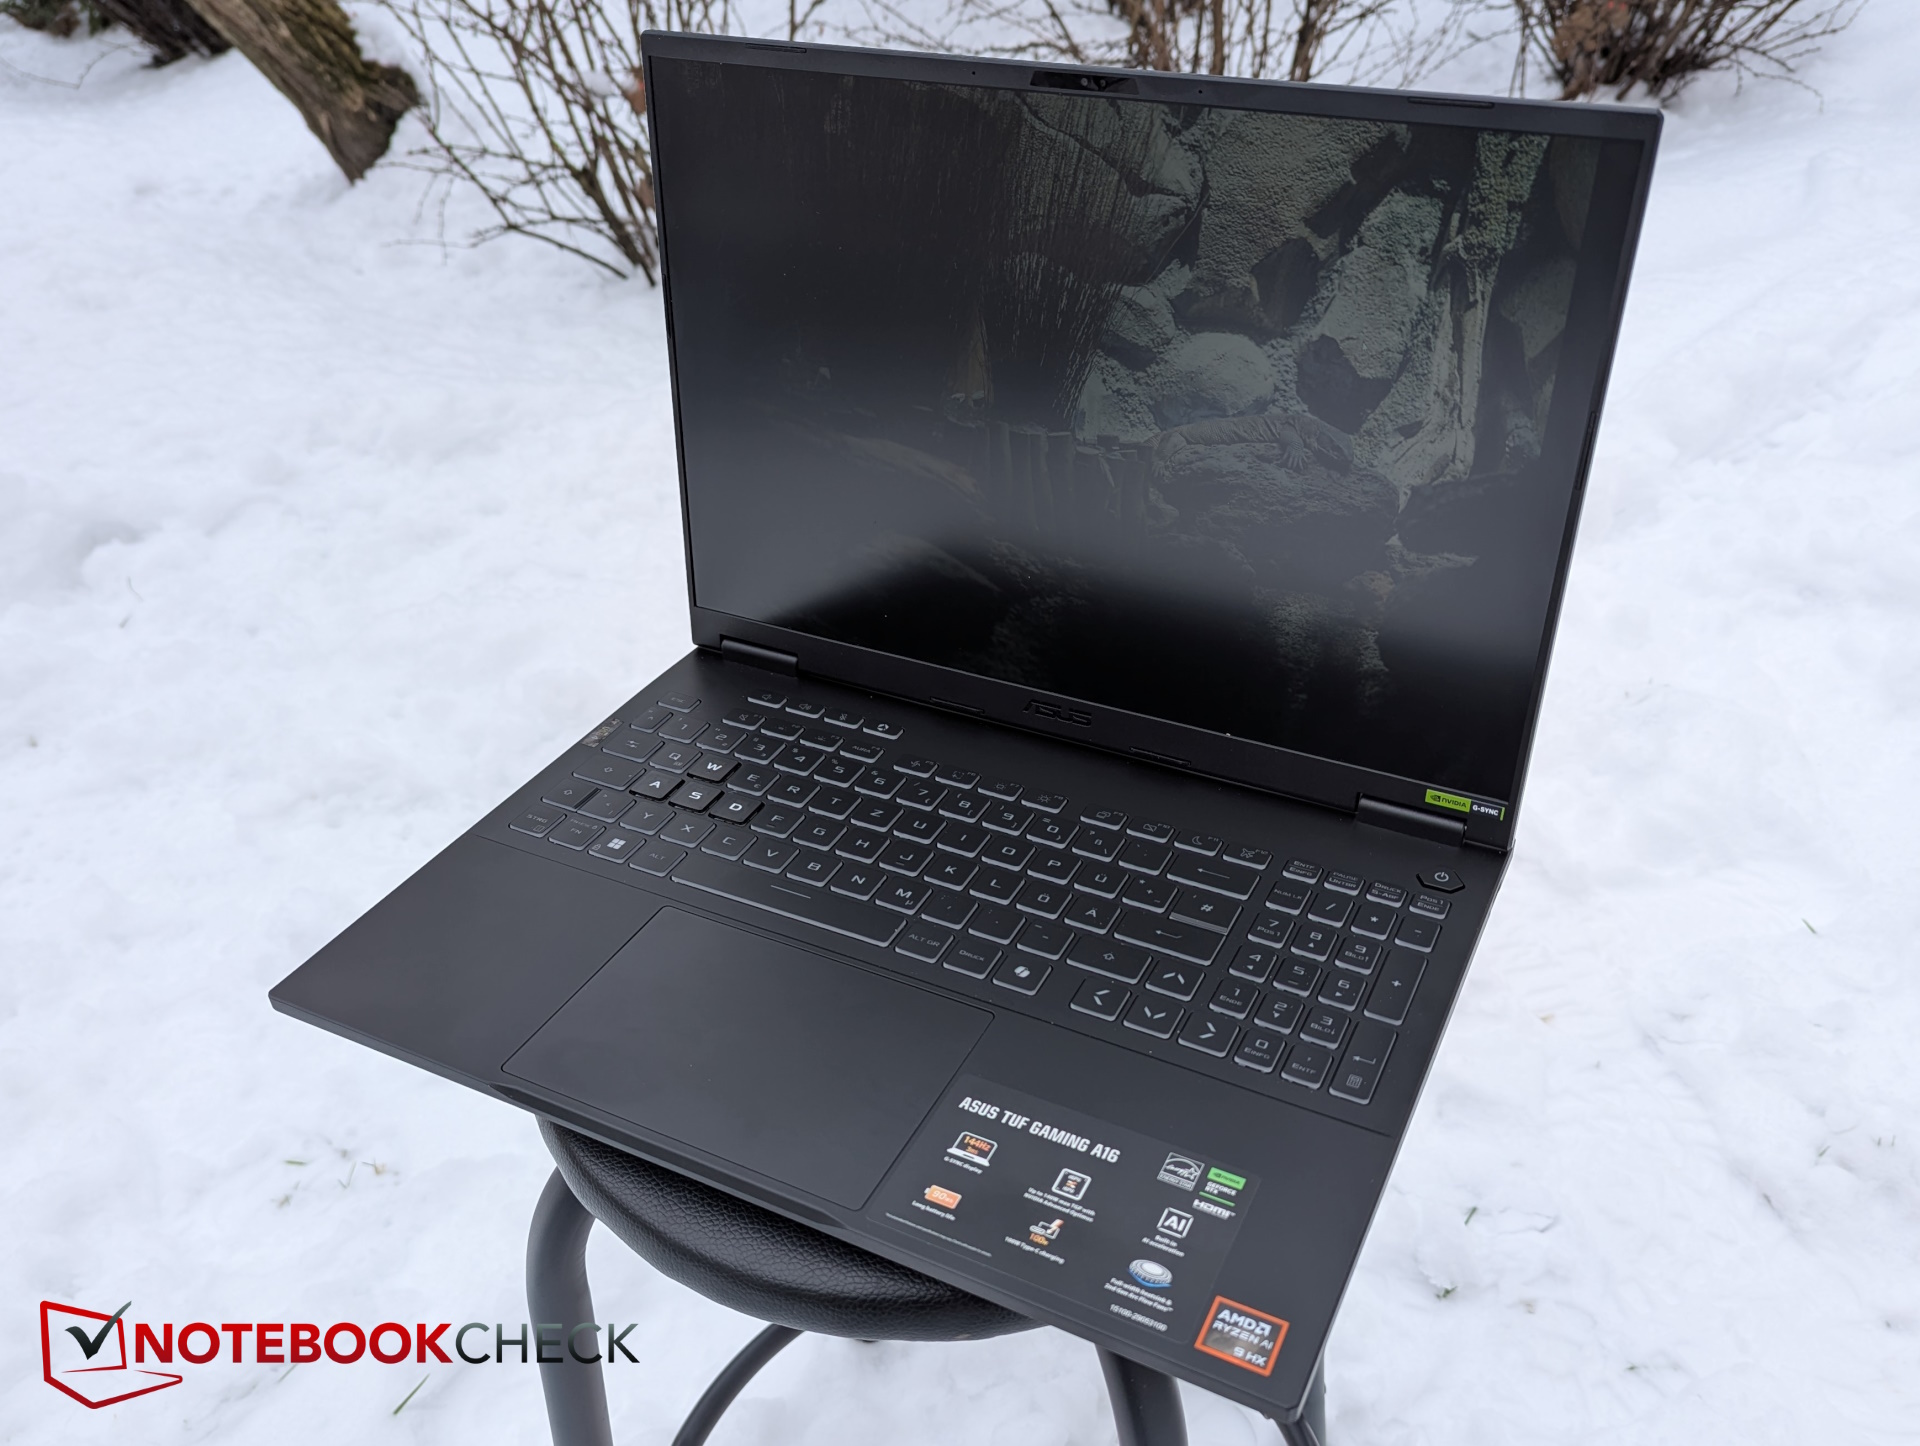
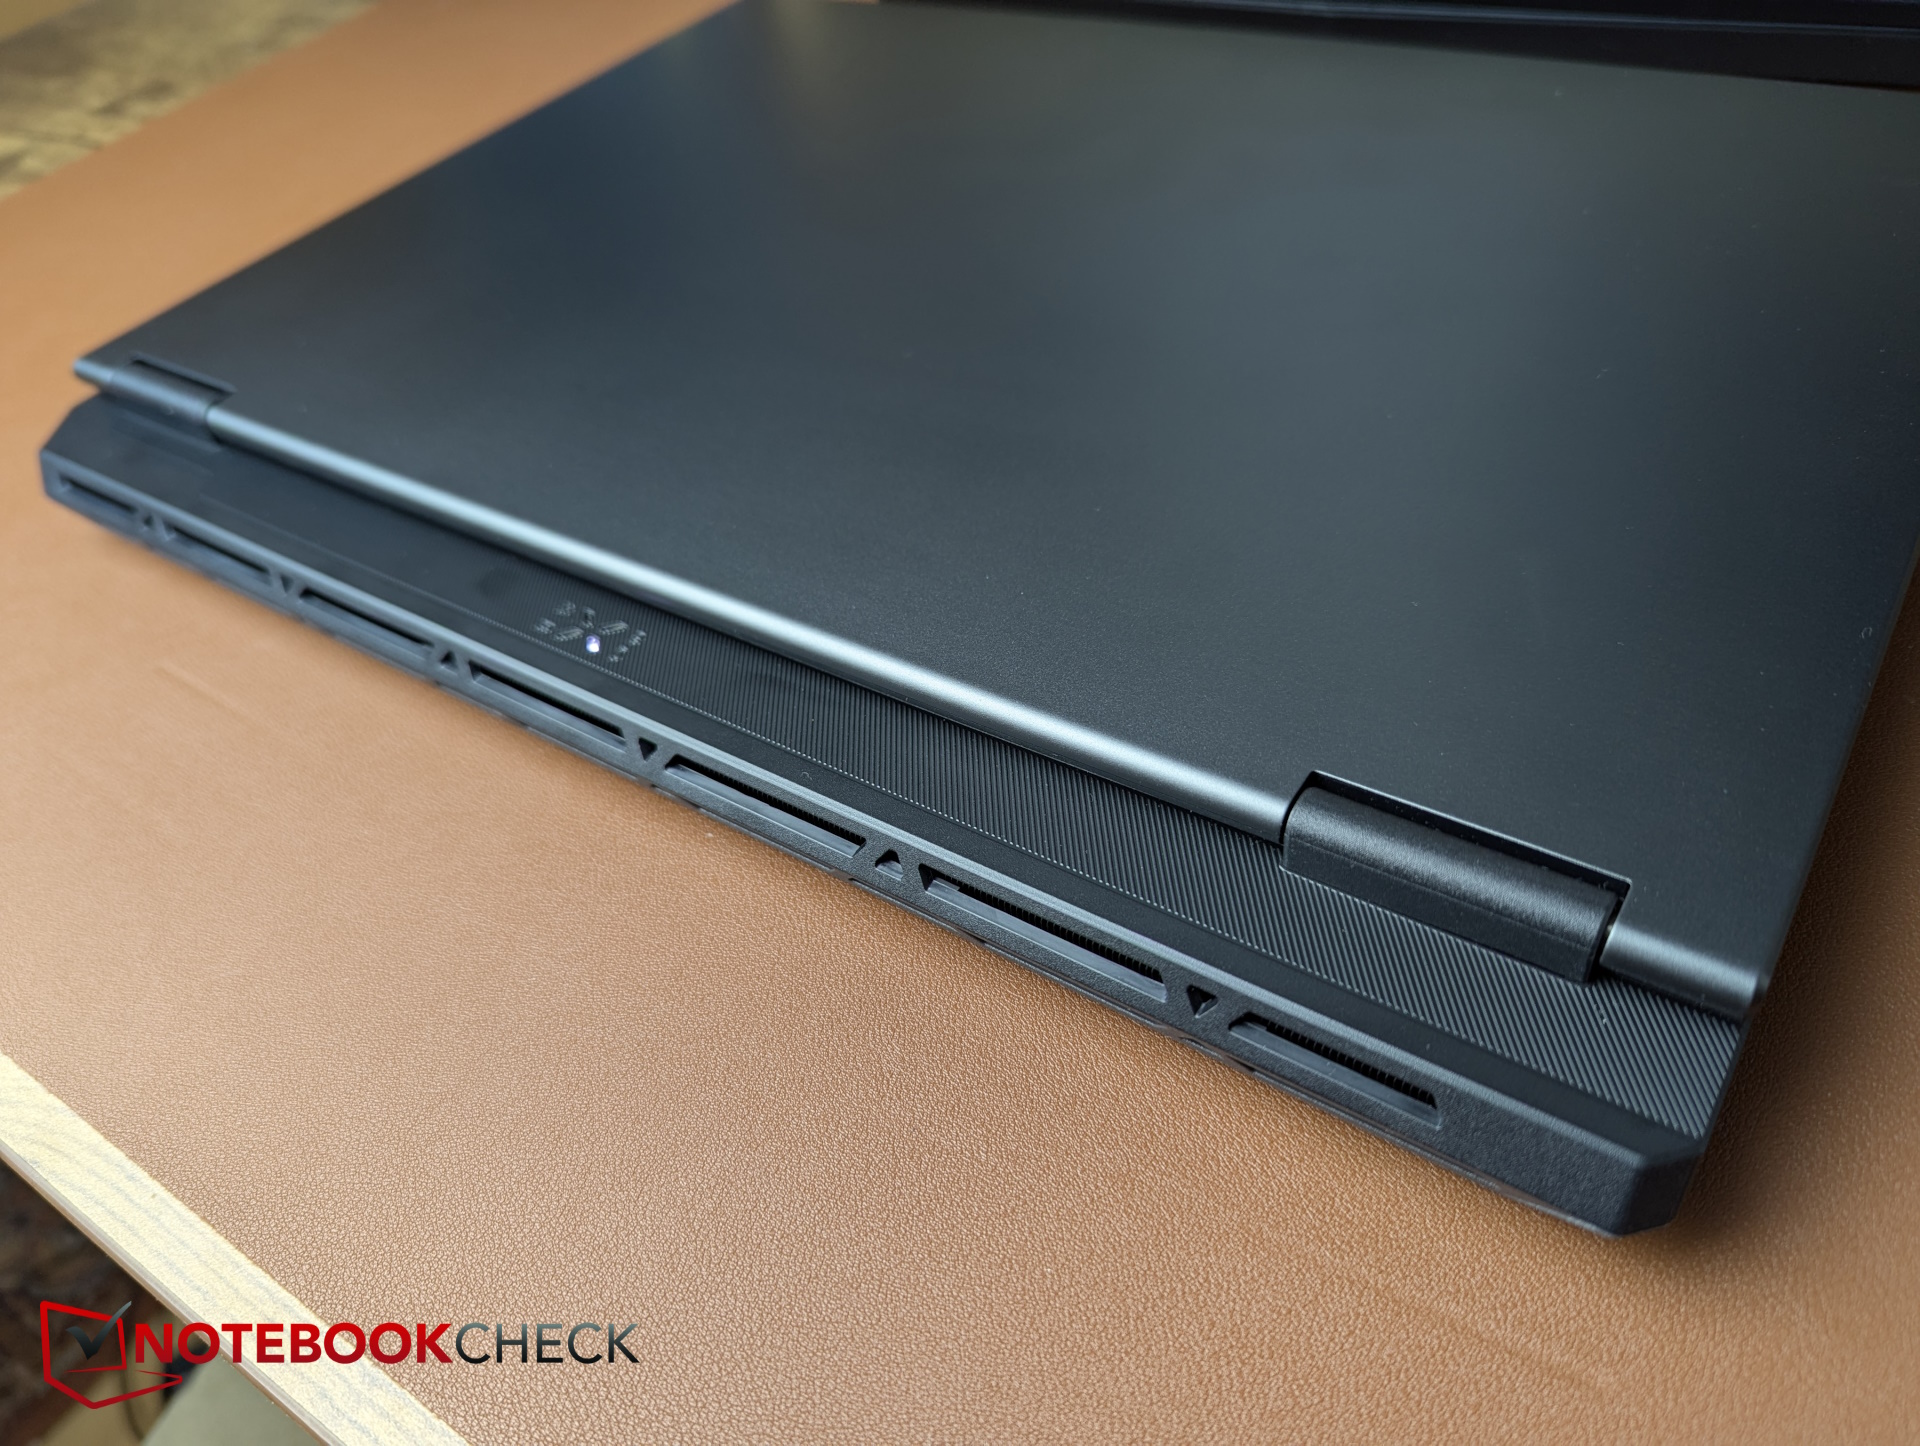
机箱和功能:华硕 TUF Gaming A16 给人 Alienware 的感觉
由于进行了重新设计,TUF Gaming A16 现在的散热系统略微向后方突出,类似于 Alienware 型号或 戴尔 G16(2024)不过,A16 的散热系统更为隐蔽。
因此,TUF Gaming A16 的尺寸明显较小,而上述 G16 则较大。由于这款笔记本电脑通过了多项军用认证,因此带有 180° 盖板的黑色塑料外壳相当稳定。
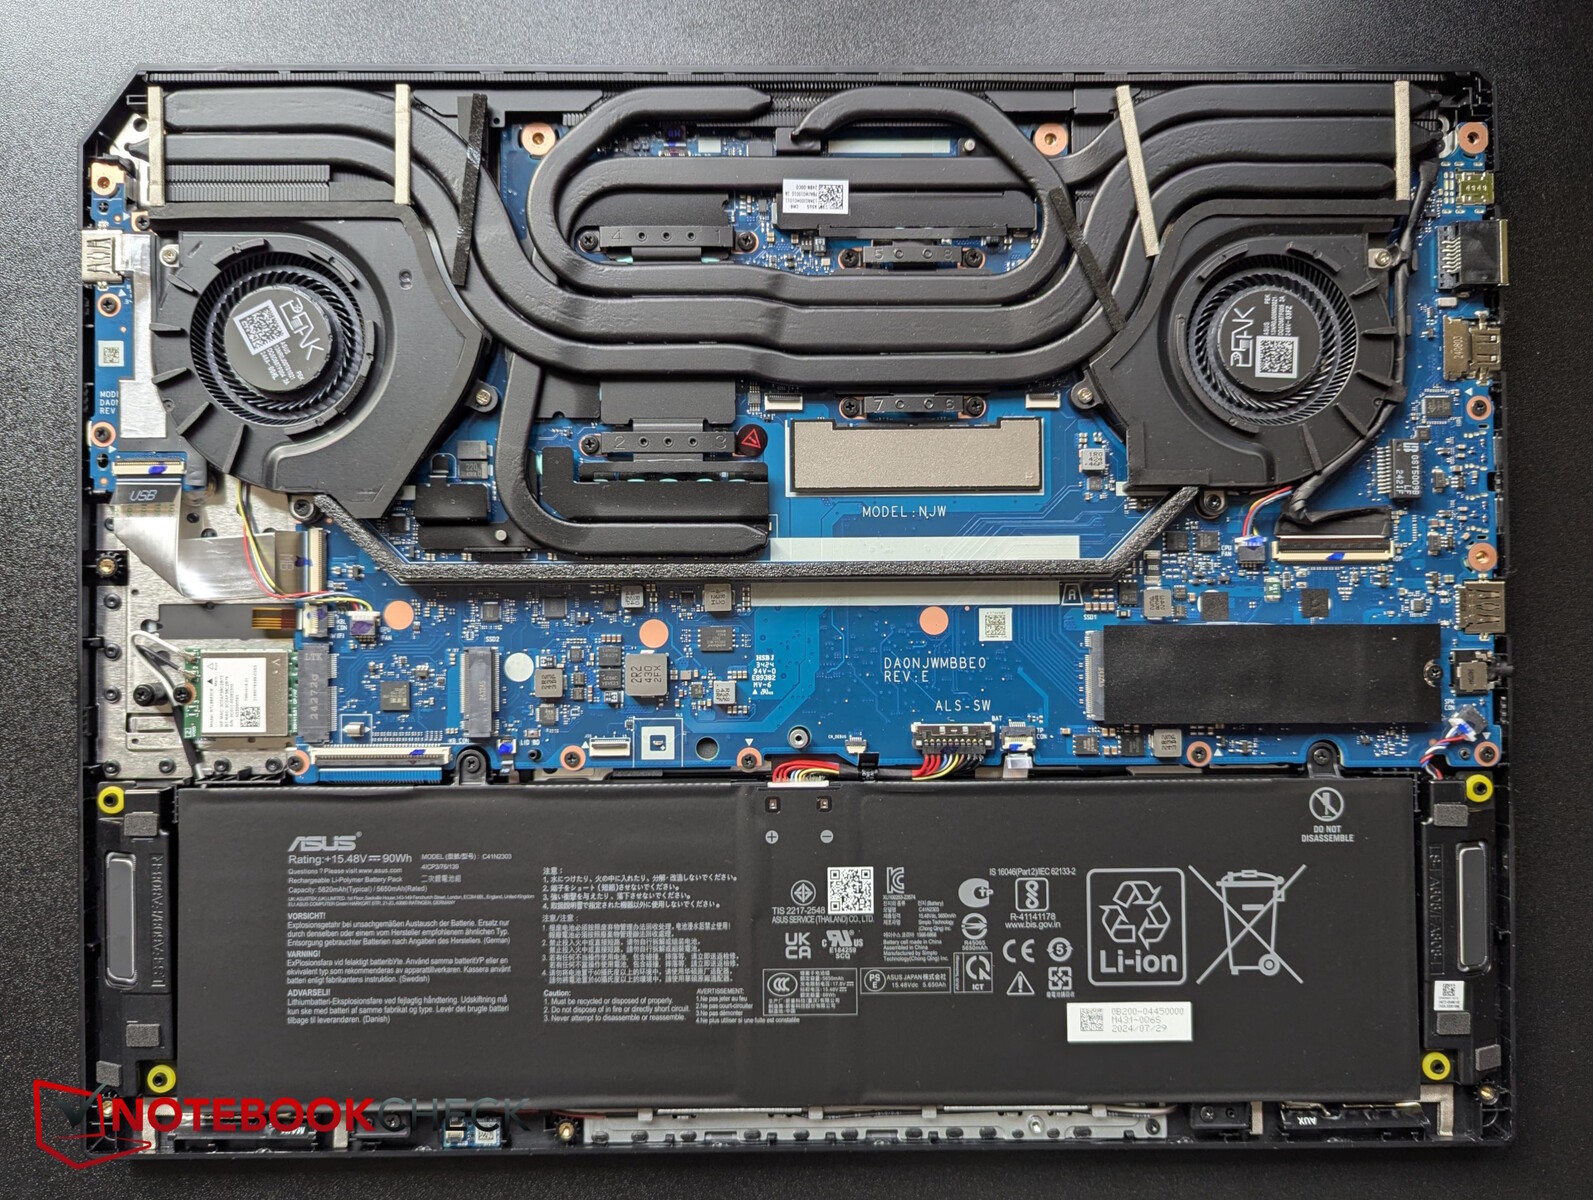
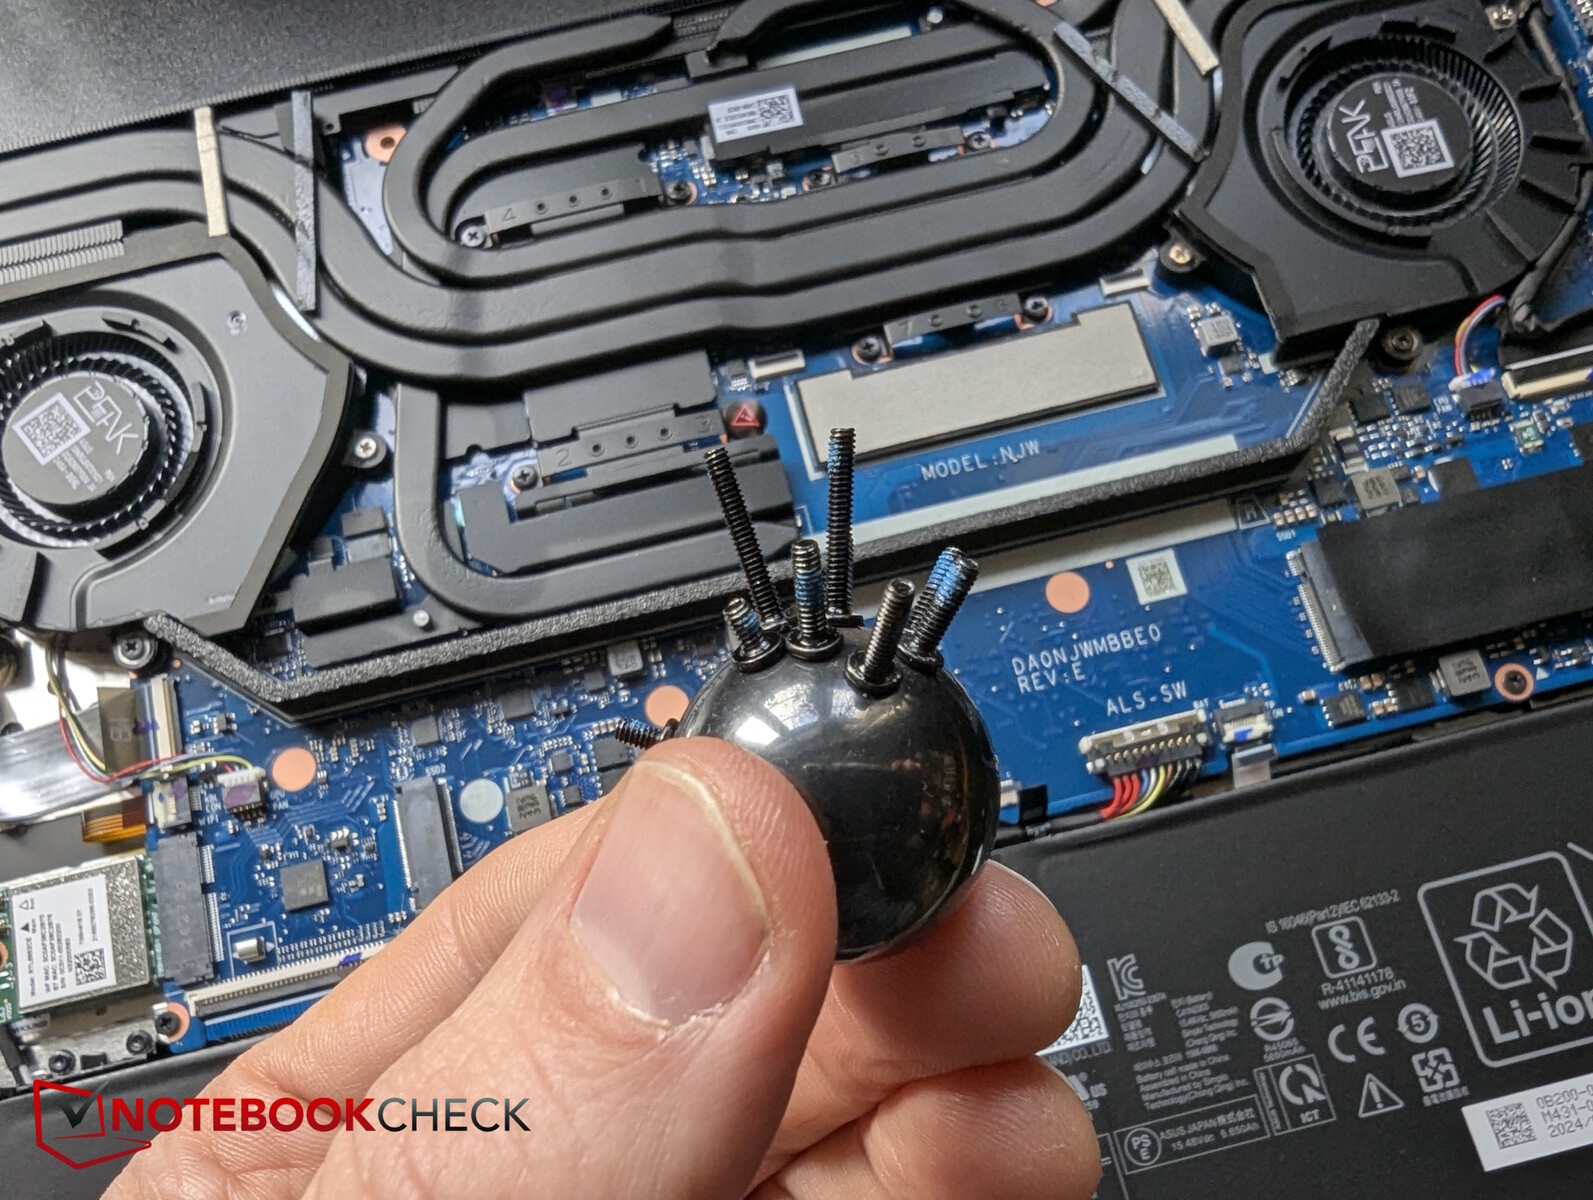
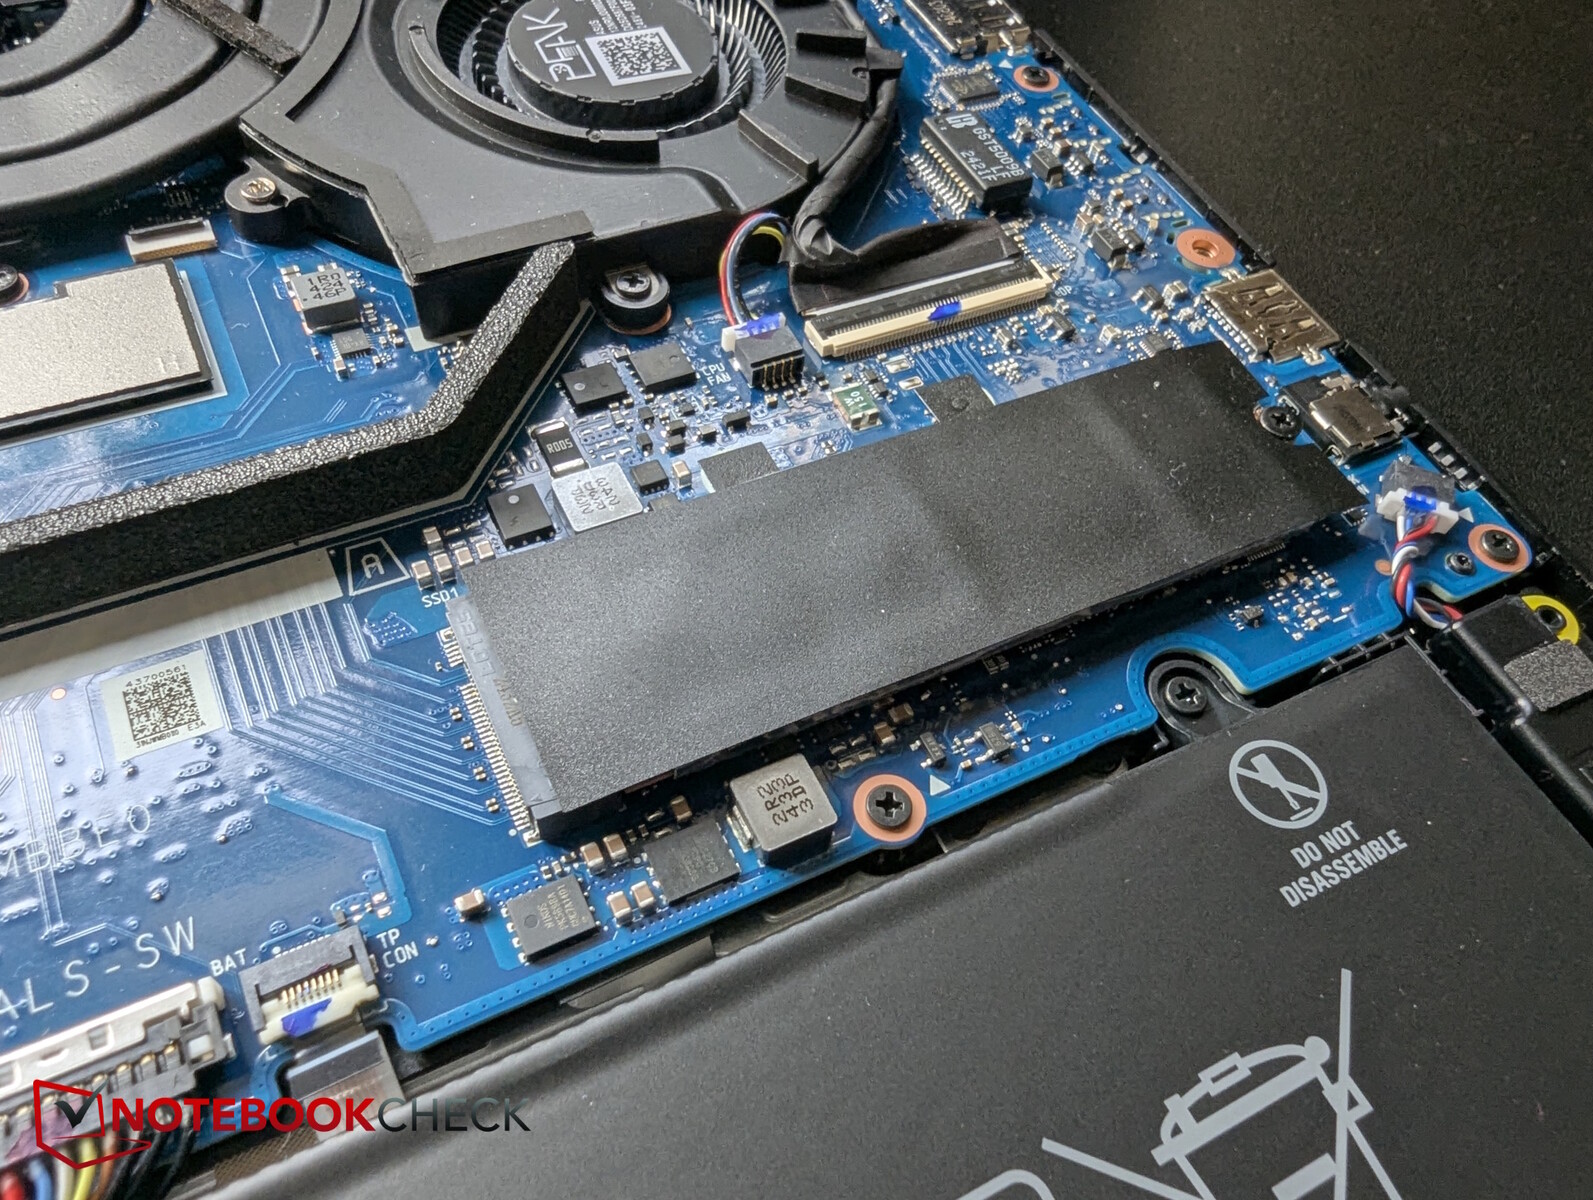
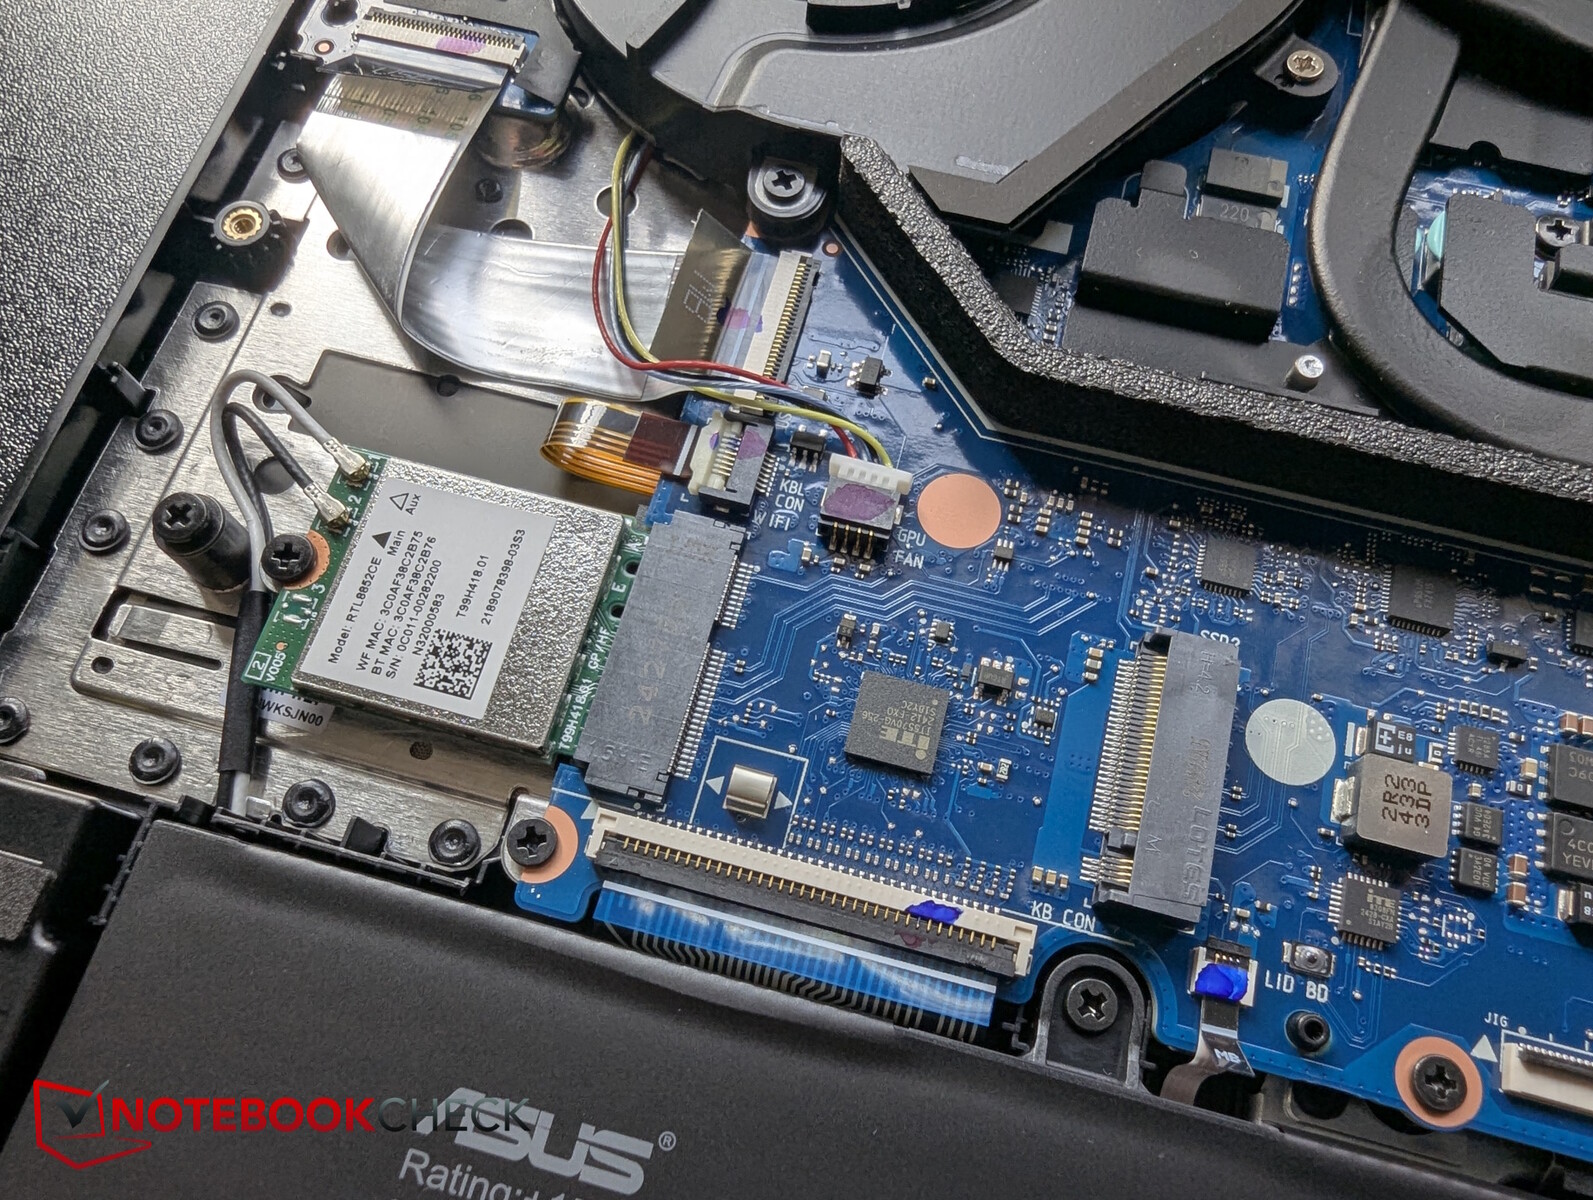
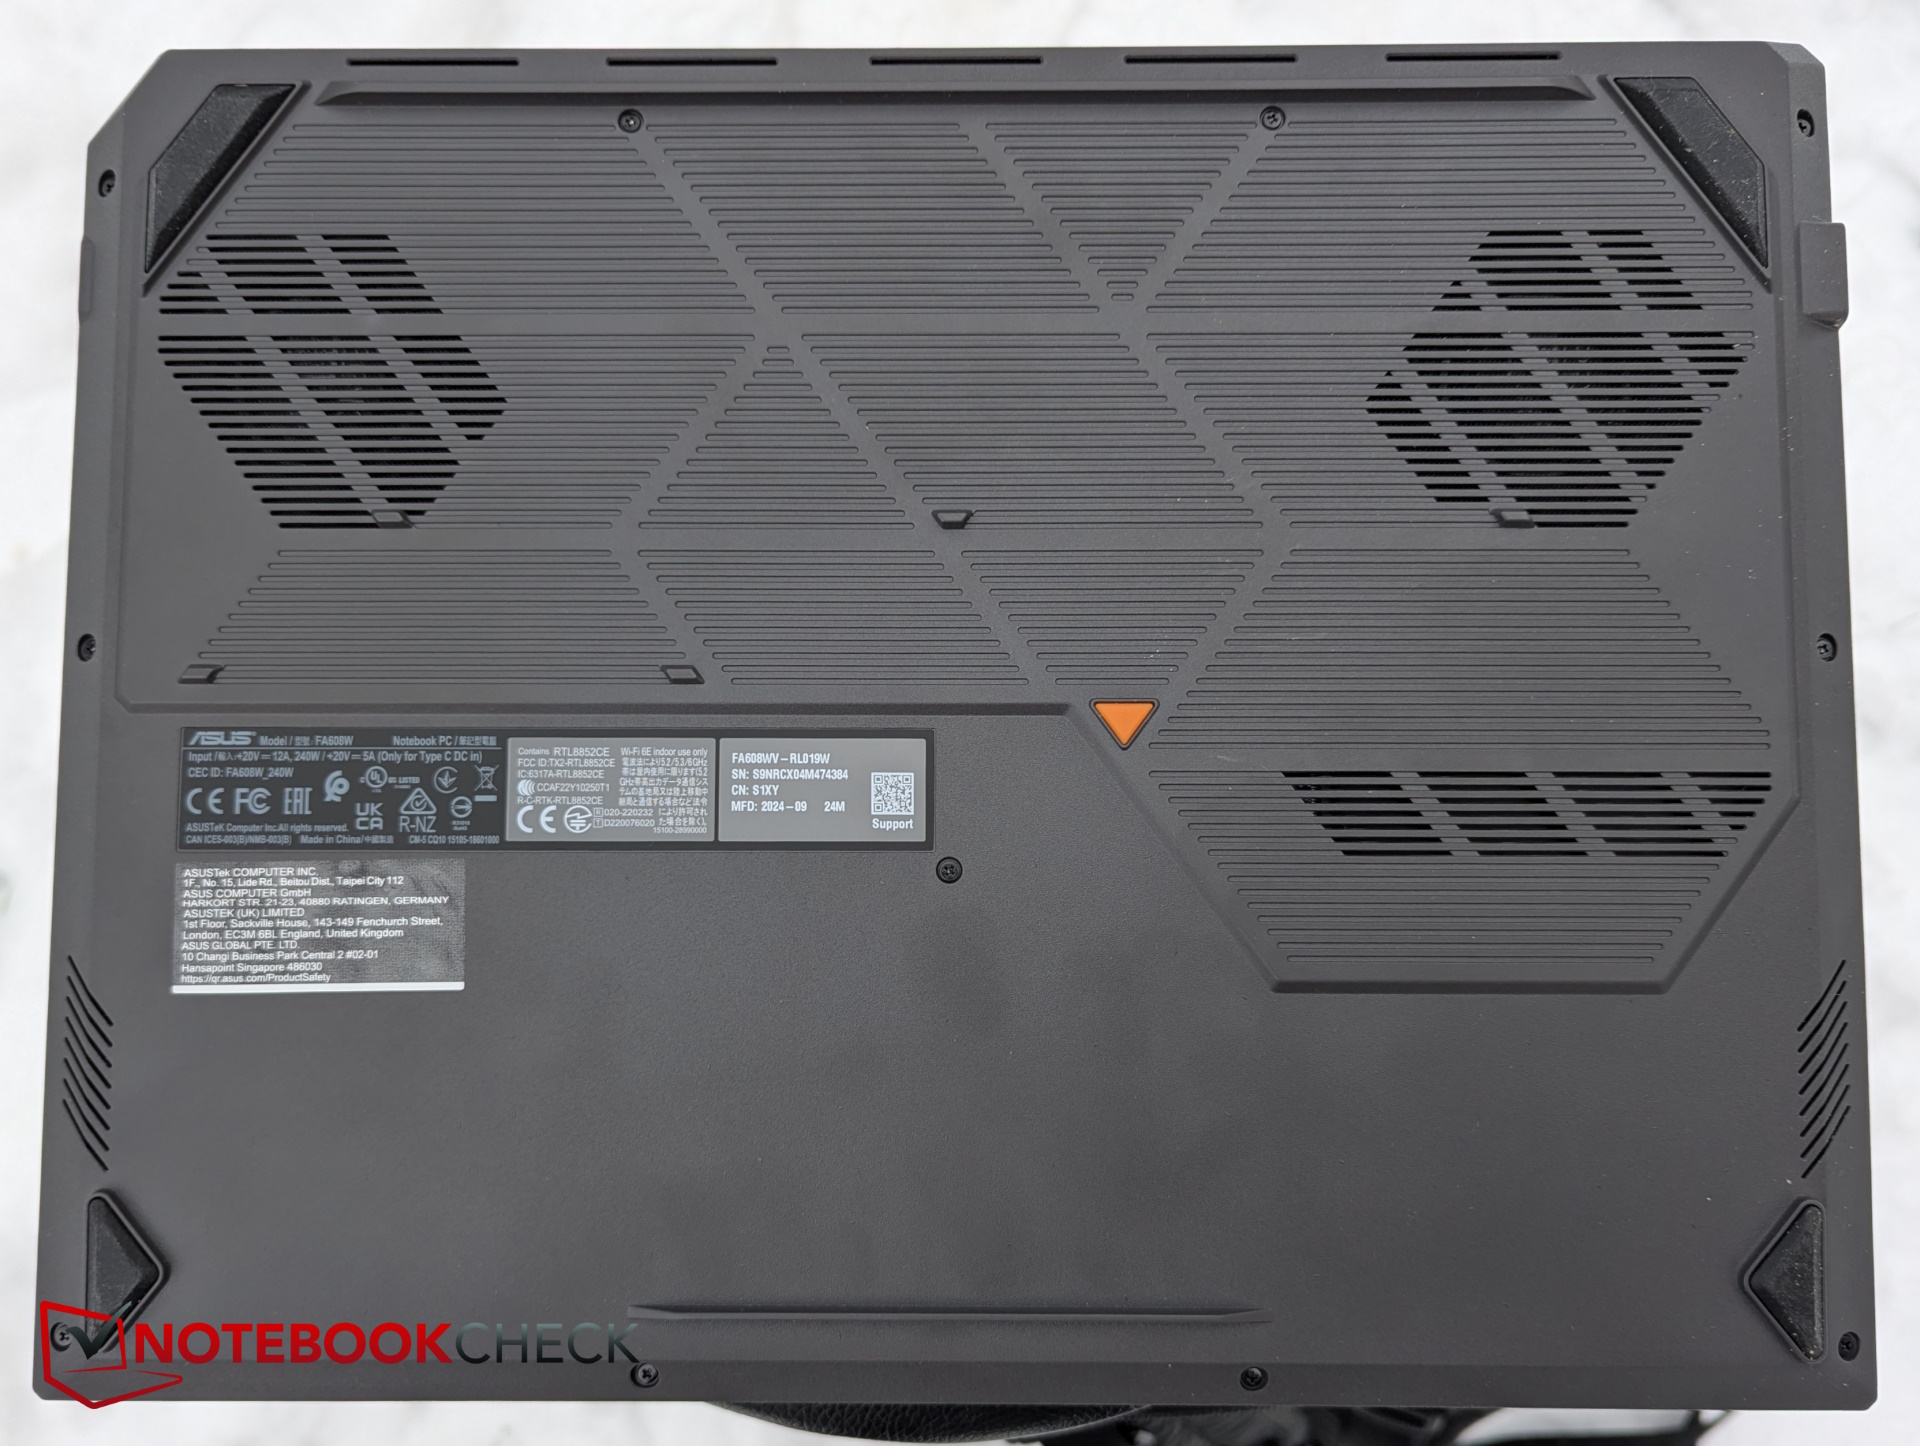
11 颗不同长度的十字螺丝固定在底部。内部有两个 M.2 固态硬盘插槽和一个可更换的 Wi-Fi 模块。
不过,我们错过了内存的升级选项。内存是永久安装的,对于游戏笔记本电脑来说,这是一个相当不切实际的解决方案。
全高清网络摄像头没有物理快门,因此必须应对蓝色和红色色调的巨大色彩偏差,通常还会出现噪点,因此也会出现模糊。
另一方面,6 GHz 和 5 GHz 网络的 Wi-Fi 传输速率相对较高,无线性能稳定,吞吐量不会下降。
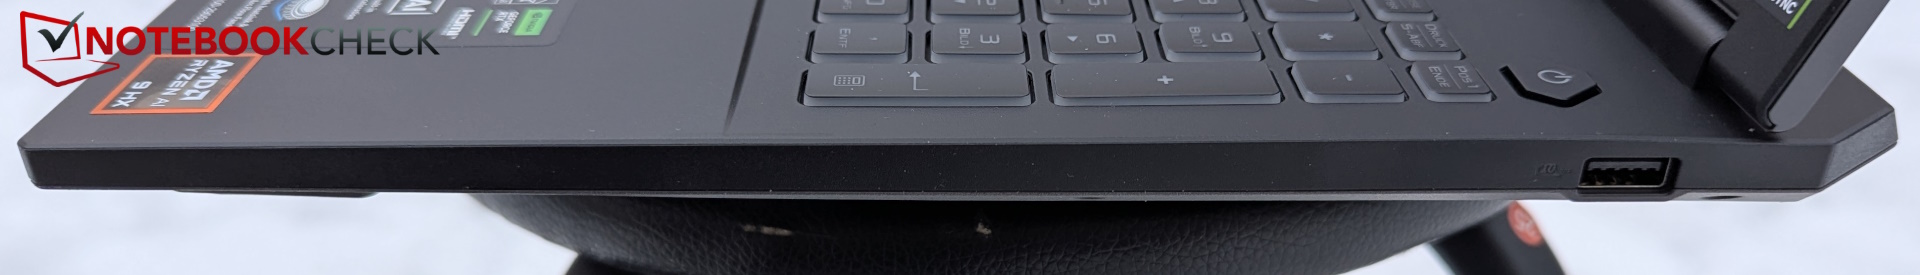
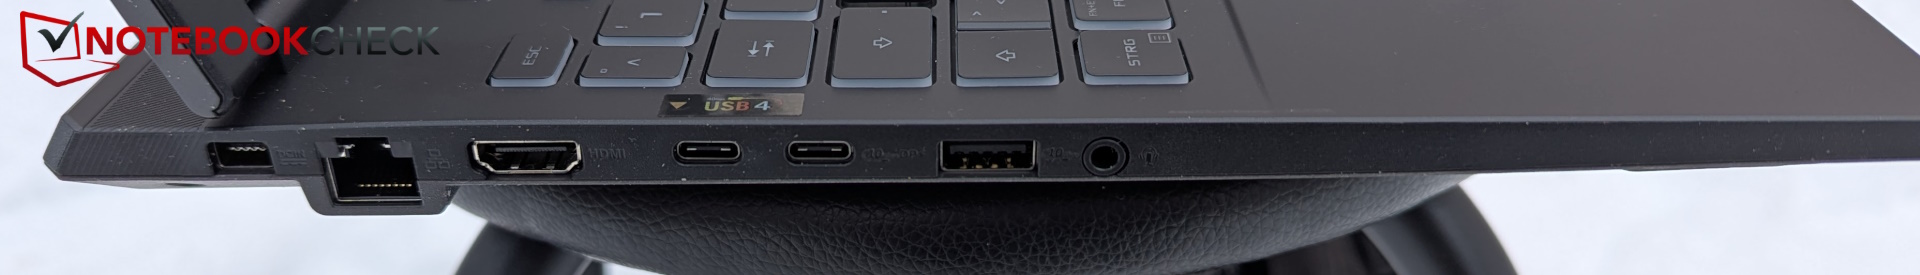
几乎所有的接口都被移到了左侧,只有一个 USB Type-A 接口在右侧。这可能会让左侧显得有些拥挤,但只有 USB-A 插槽和更靠前的耳机插孔在使用较大的插头时可能会相互妨碍。
在相邻的两个 USB-C 插槽中,只有第一个支持 USB4,而后面的一个只支持 USB 3.2 Gen2 和 DisplayPort 1.4-out 而不是 2.1,但提供 100 W 的功率传输。


可持续性
华硕表示,它们符合能源之星和 EPEAT 标准。此外,TUF Gaming A16 的包装主要由纸板和纸张制成。
华硕没有提供任何有关 A16 具体二氧化碳排放量的信息,也没有说明在设备制造过程中是否使用了可回收材料。
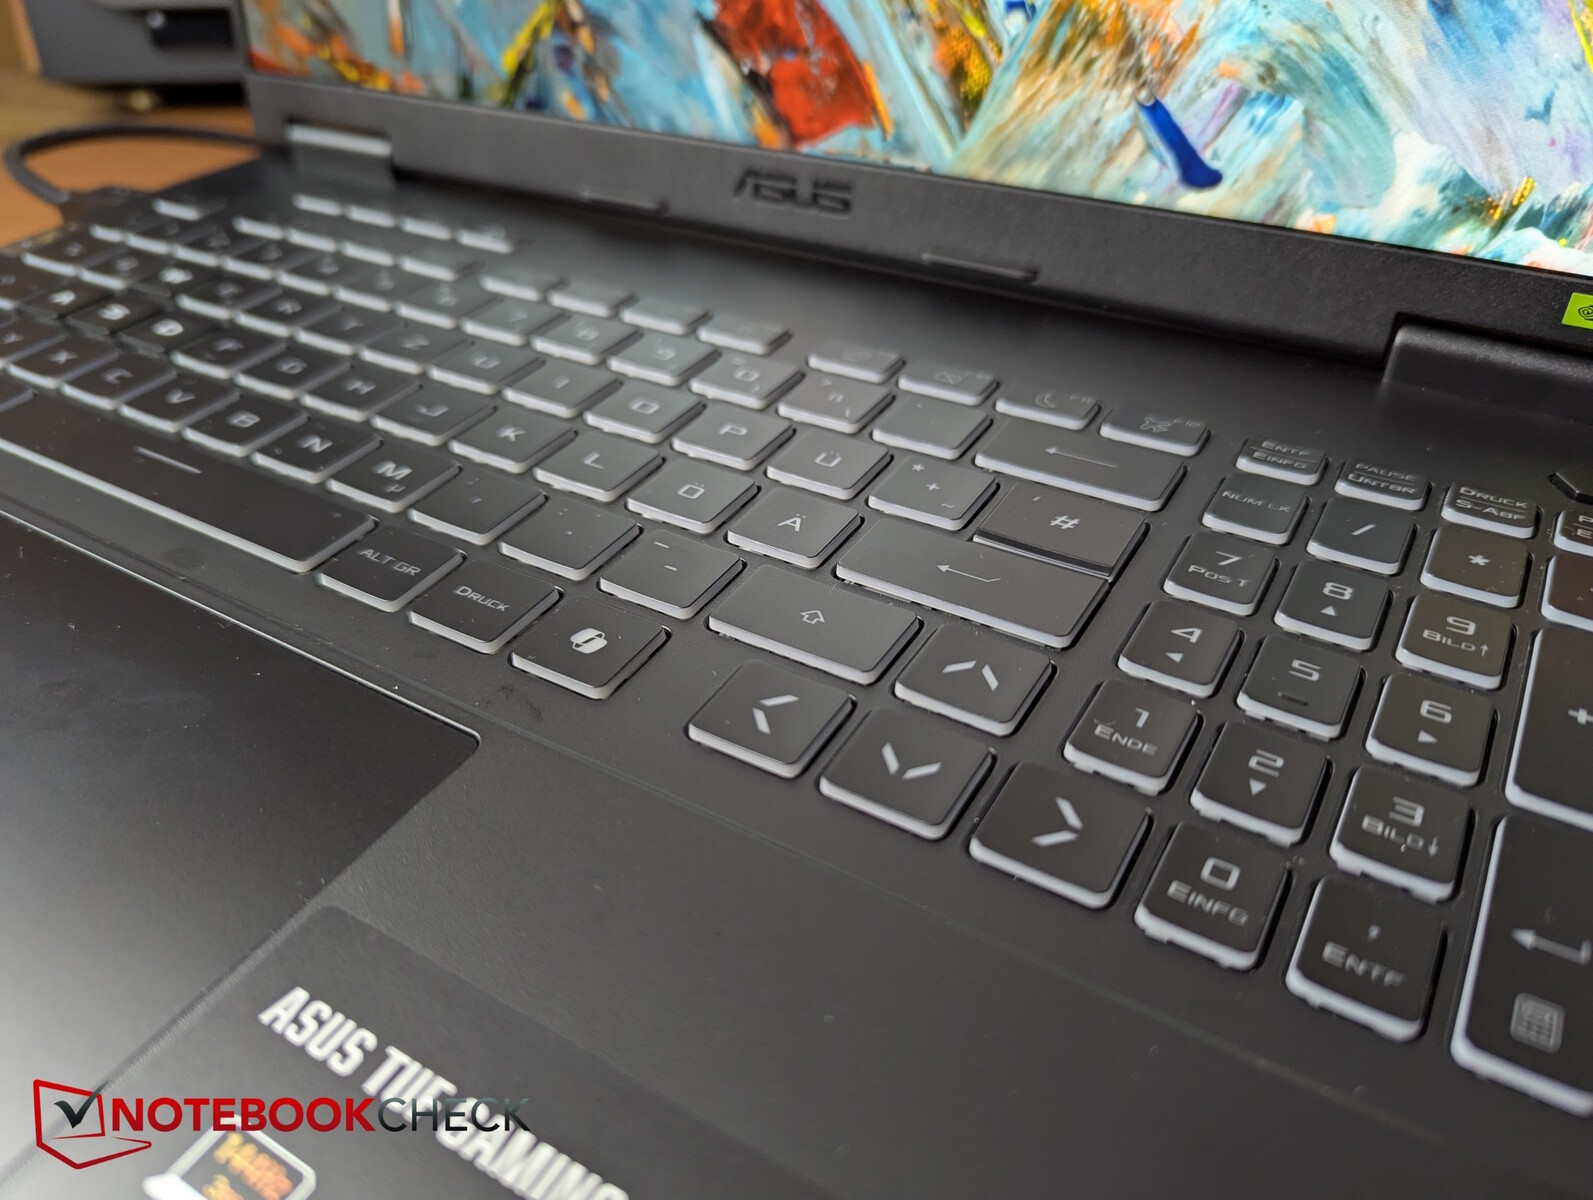
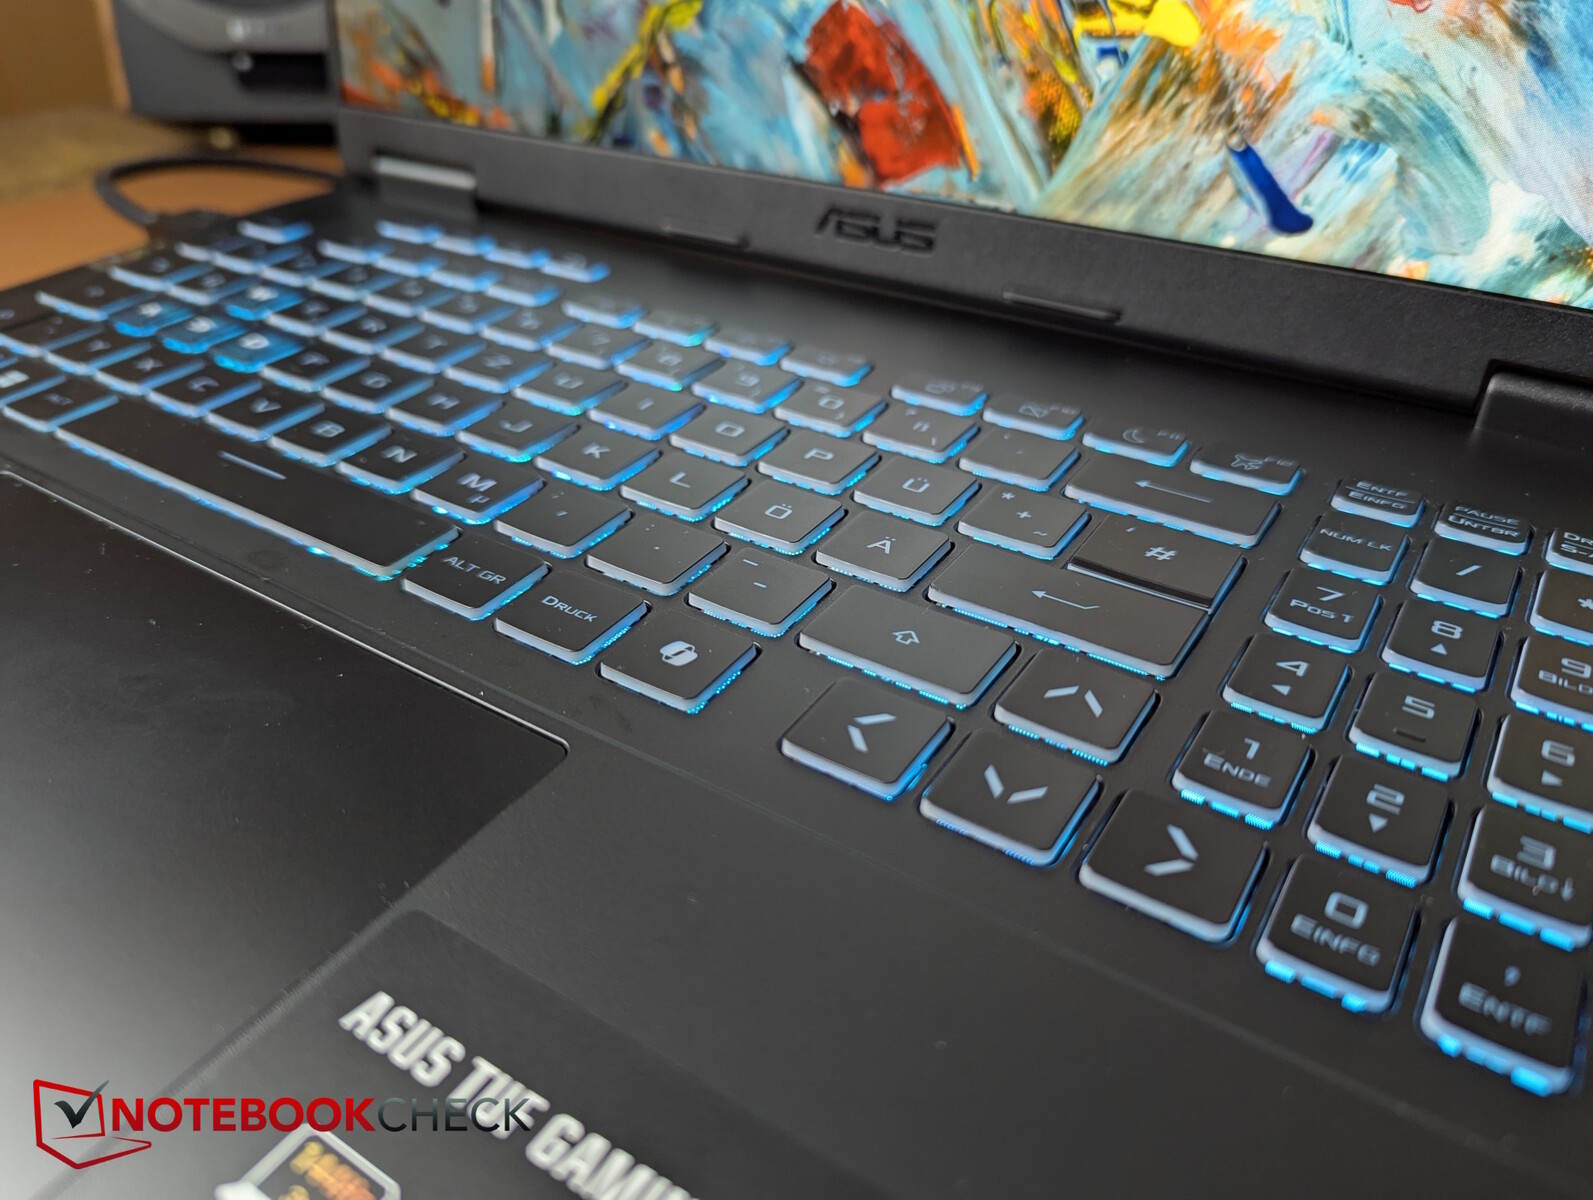
输入设备游戏键盘和更大的触摸板
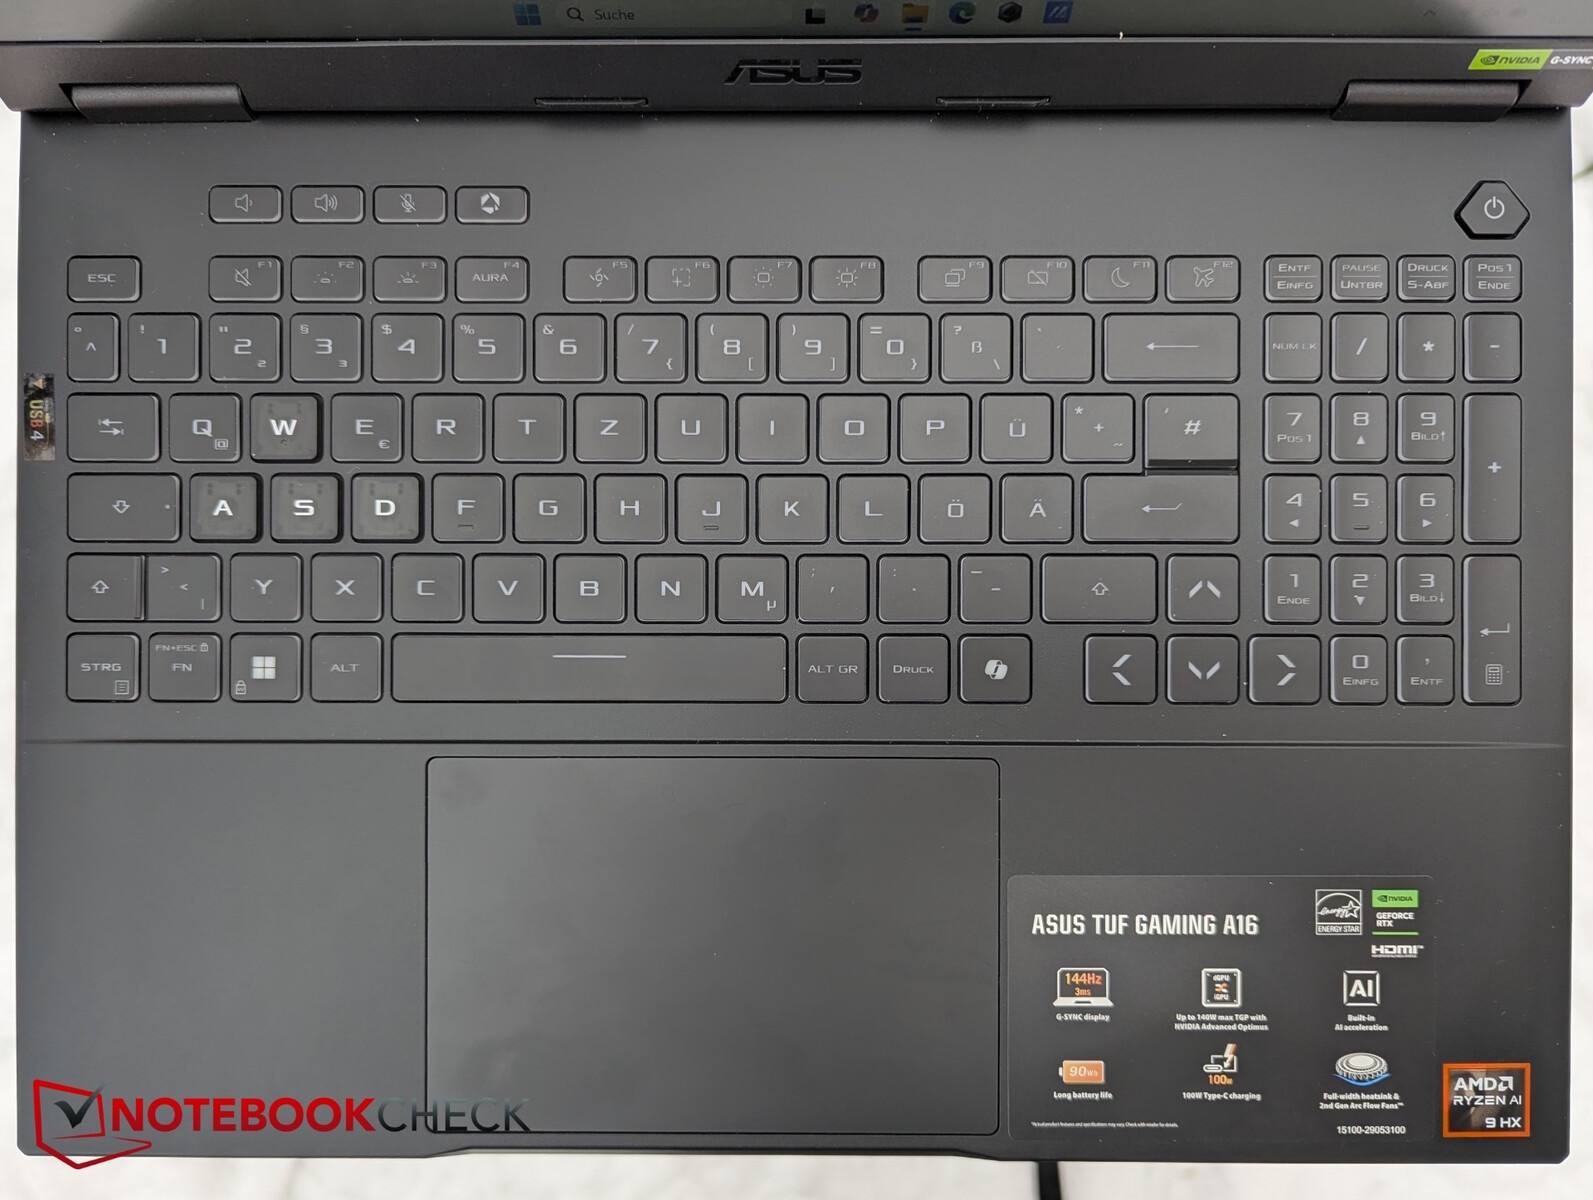
四个特殊按键(音量减小/增大、麦克风静音和军械库木箱)和全格式方向键又回来了。此外,现在还有一个专用的 Copilot 键。华硕宣称,按键启动的延迟时间缩短了 17%。
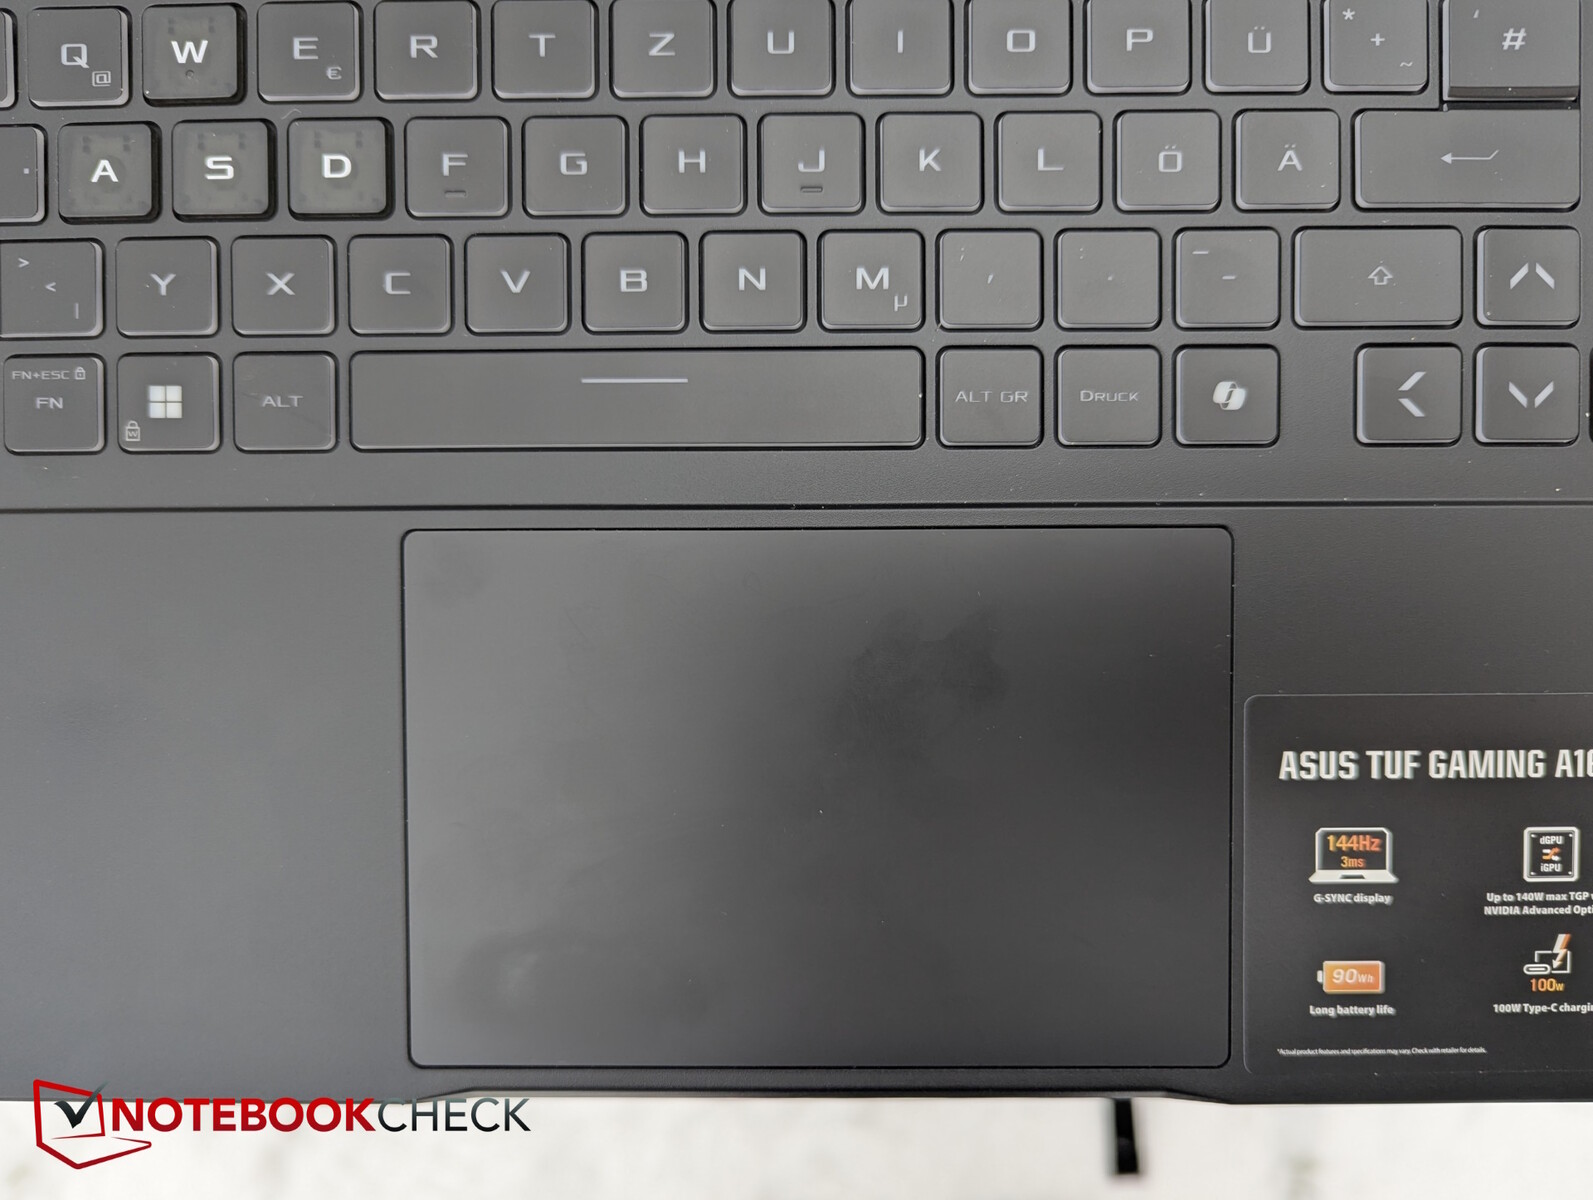
华硕规定按键行程为 1.7 毫米。按键反馈明显,按键噪音适中。与华硕游戏笔记本电脑通常的做法一样,WASD 键在视觉上得到了突出显示,但其他字母的灰色颜色有点过深。单个 RGB 背光可在弱光环境下提供帮助。
光滑的触摸板表面扩大了 10%,因此手势操作的空间更大了。点击触发可靠,反馈良好,噪音适中。
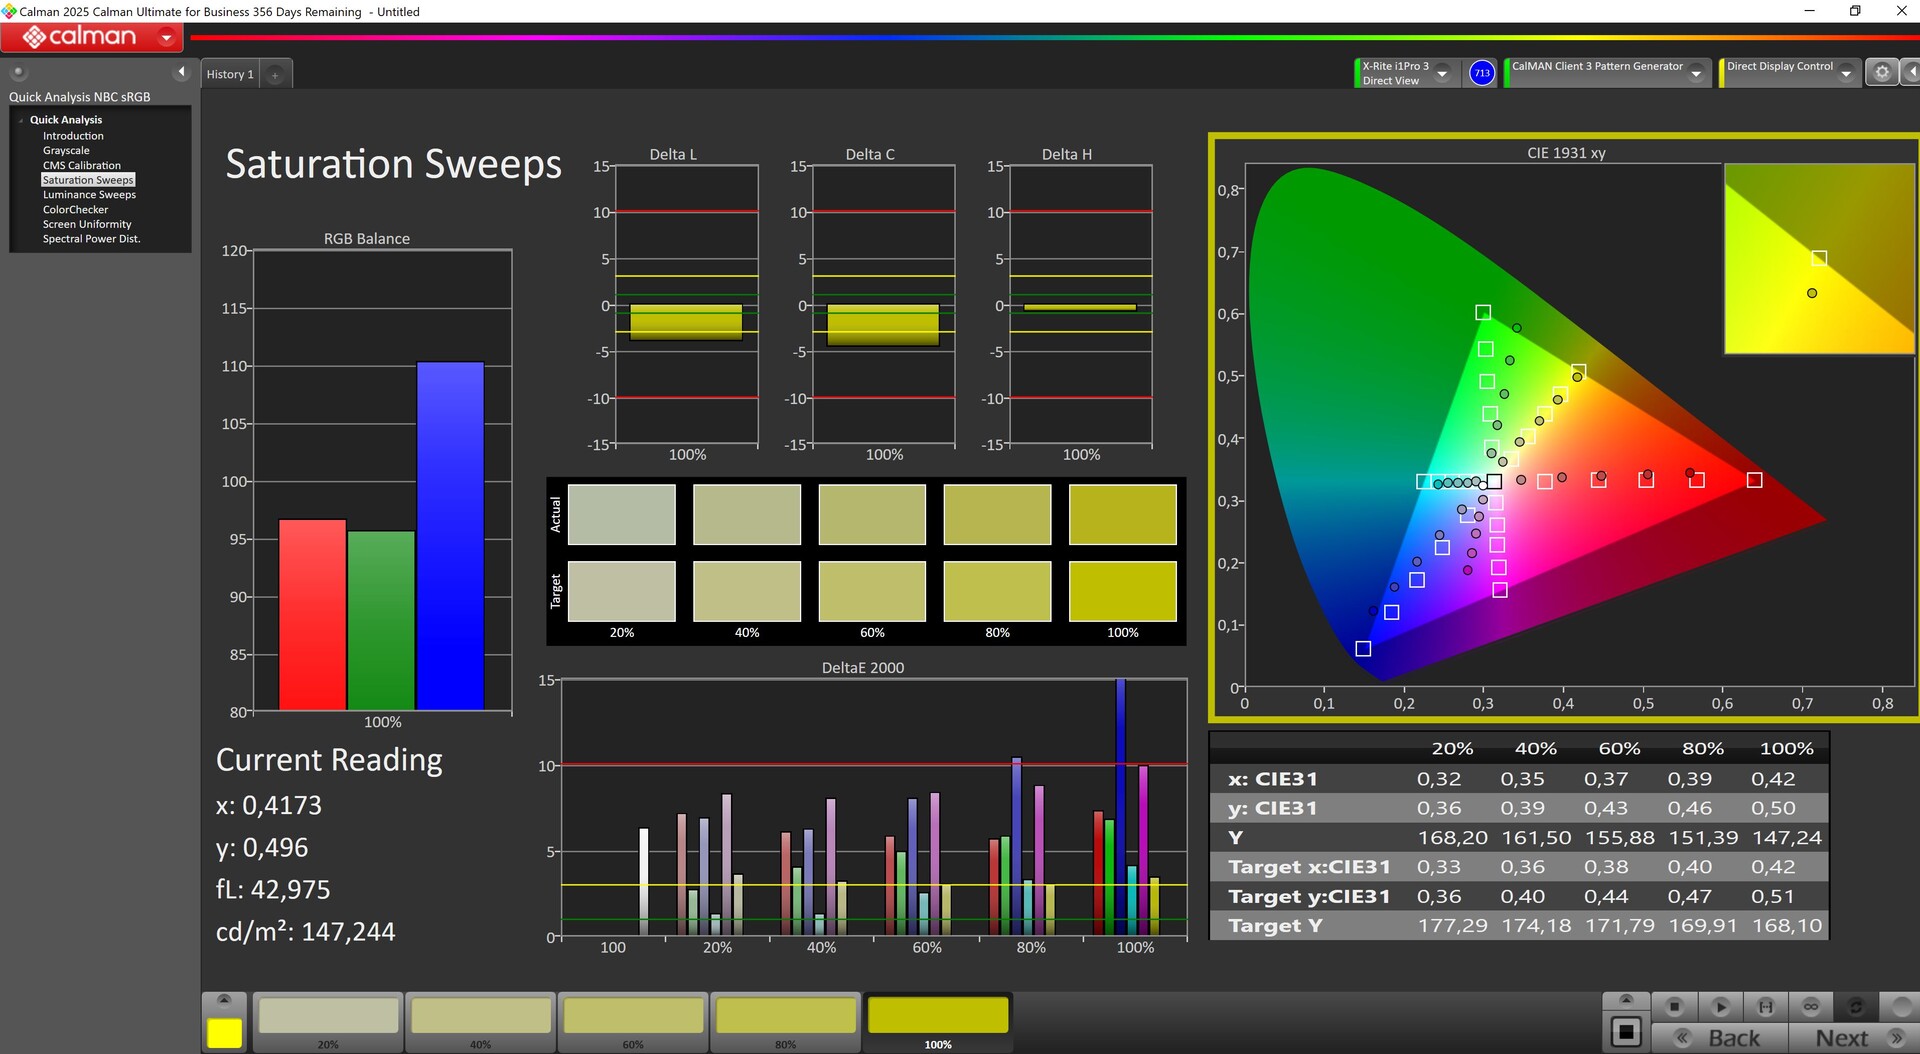
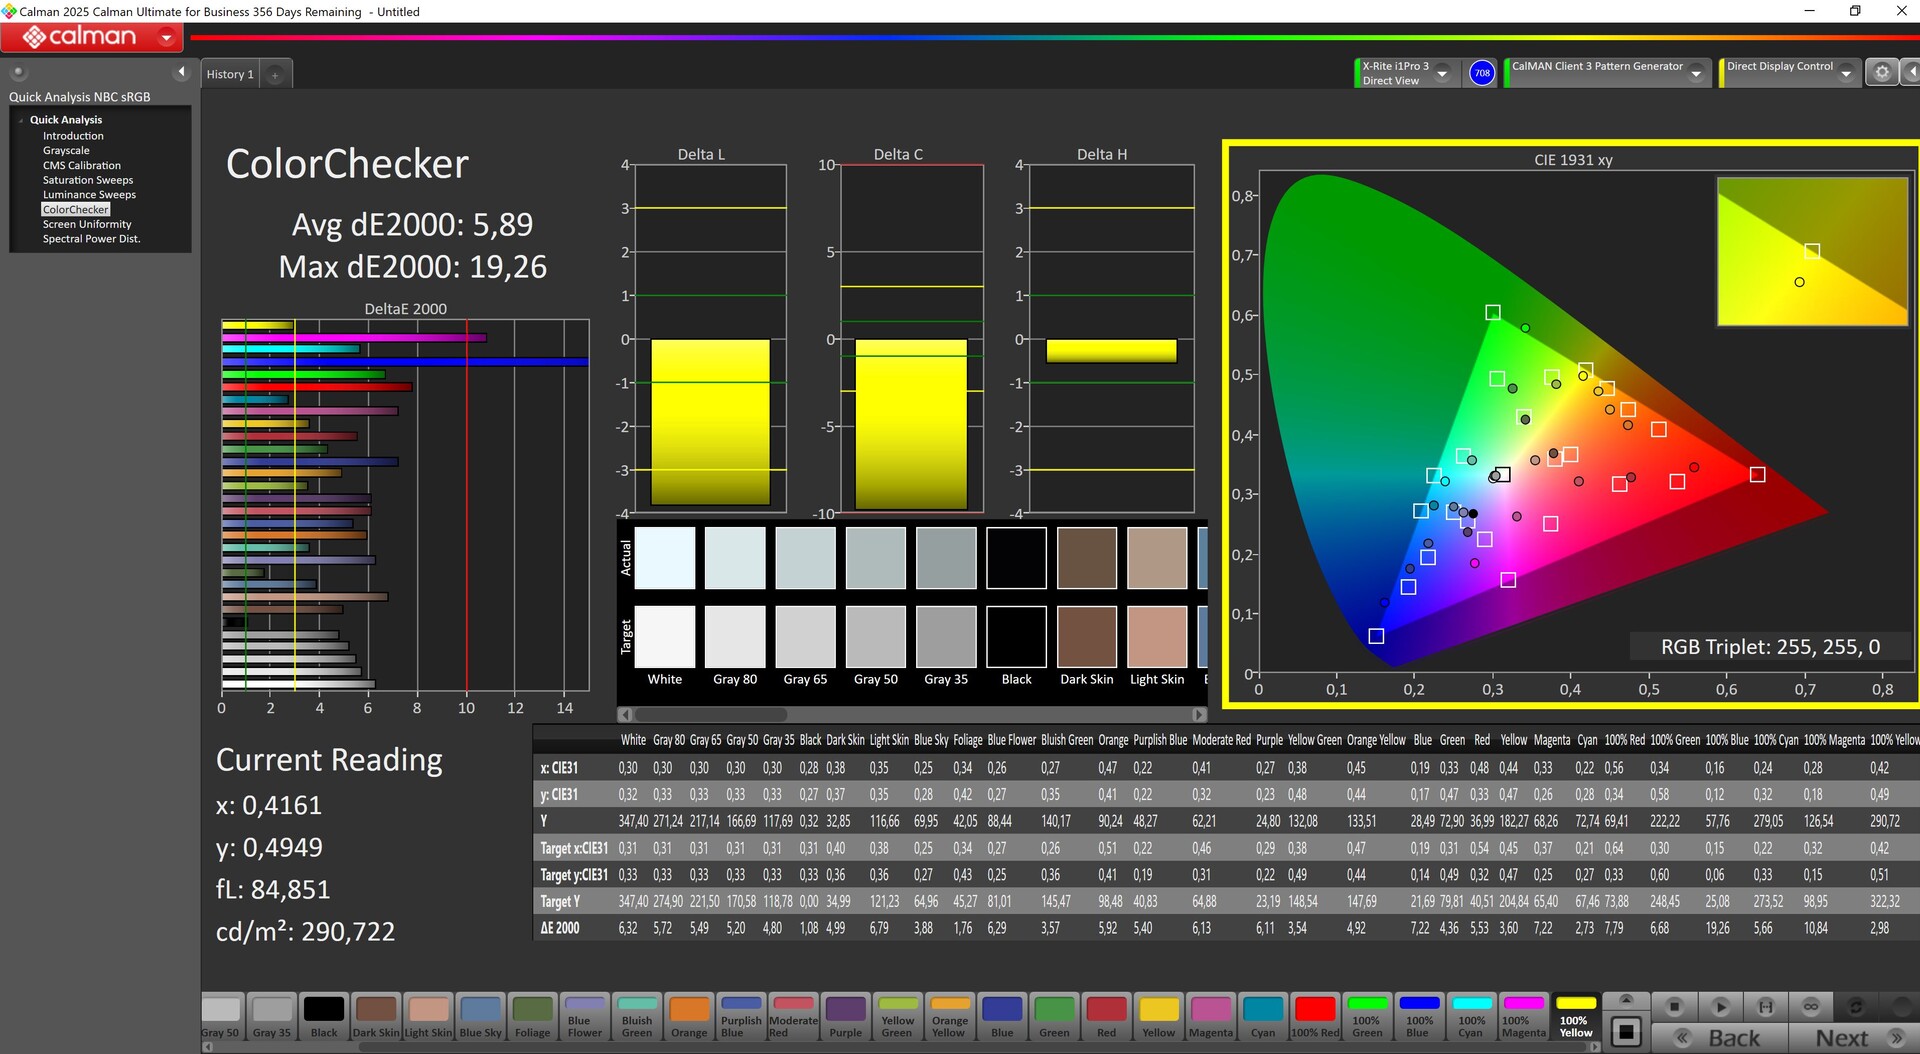
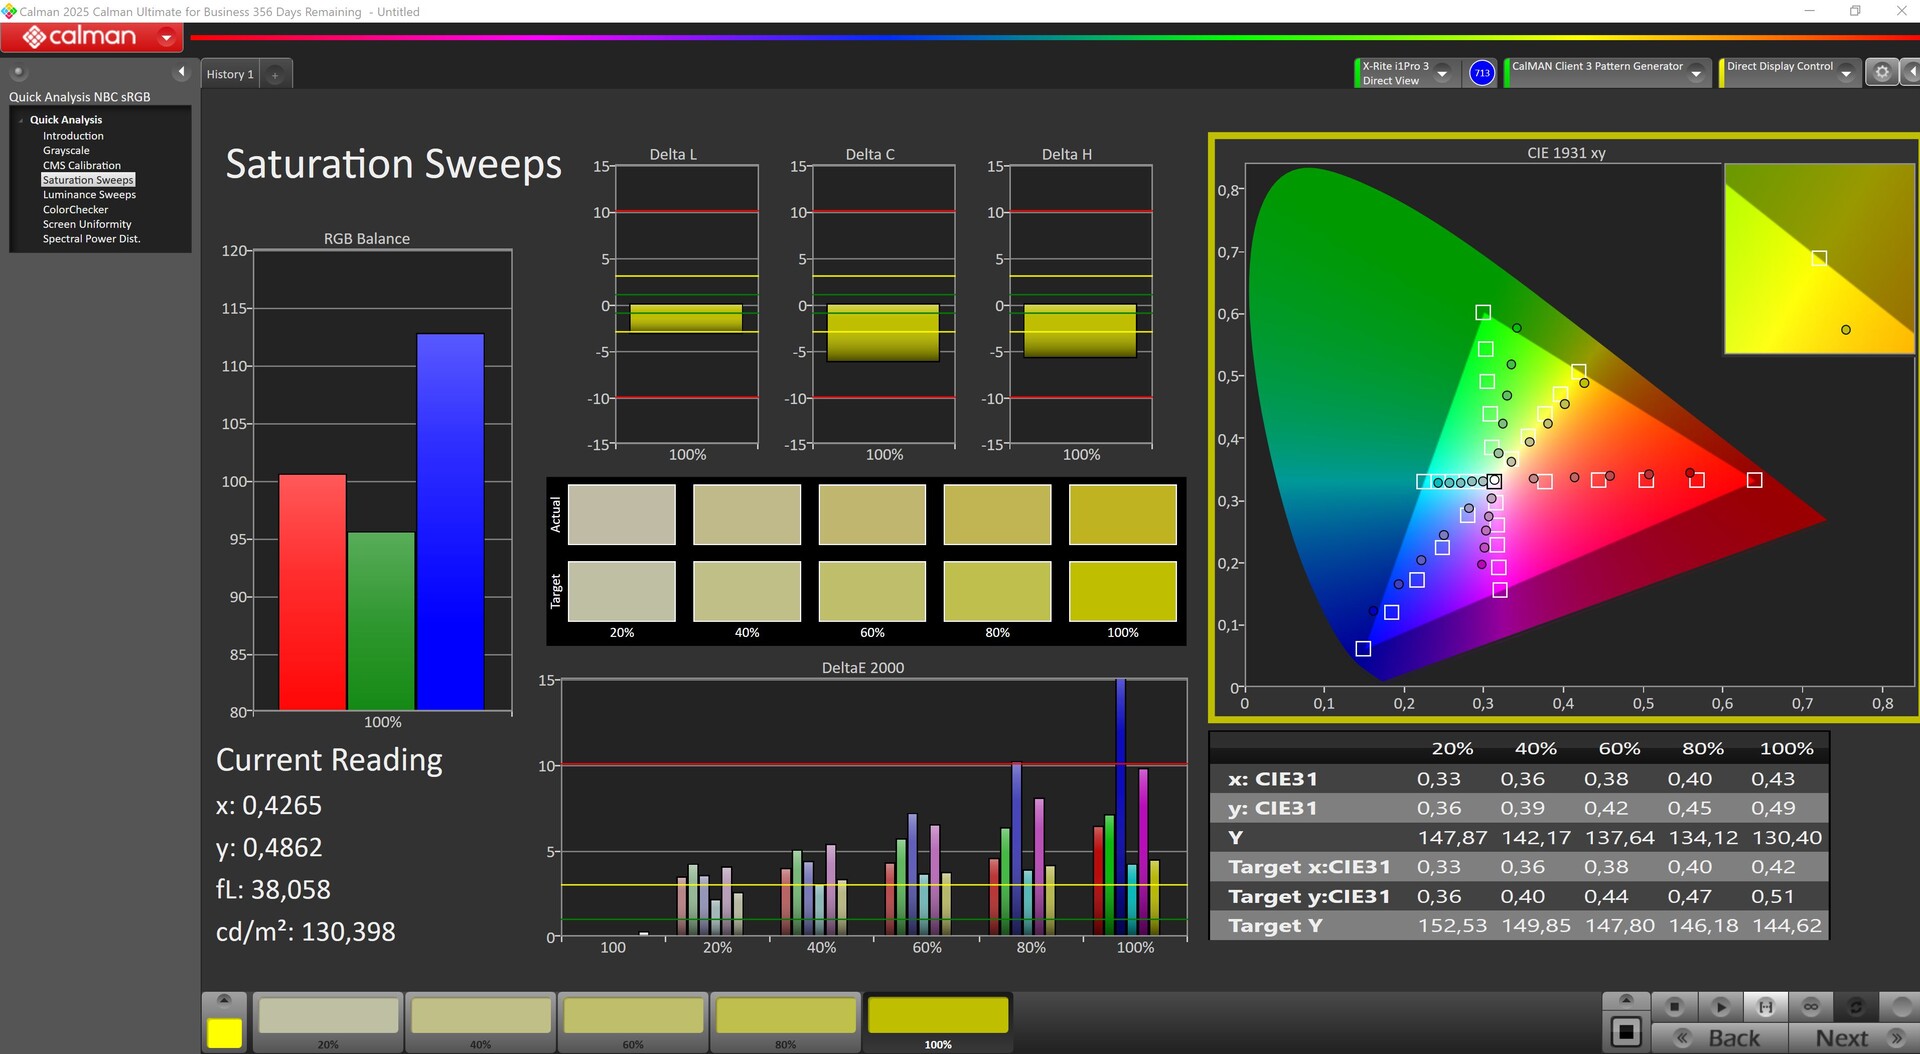
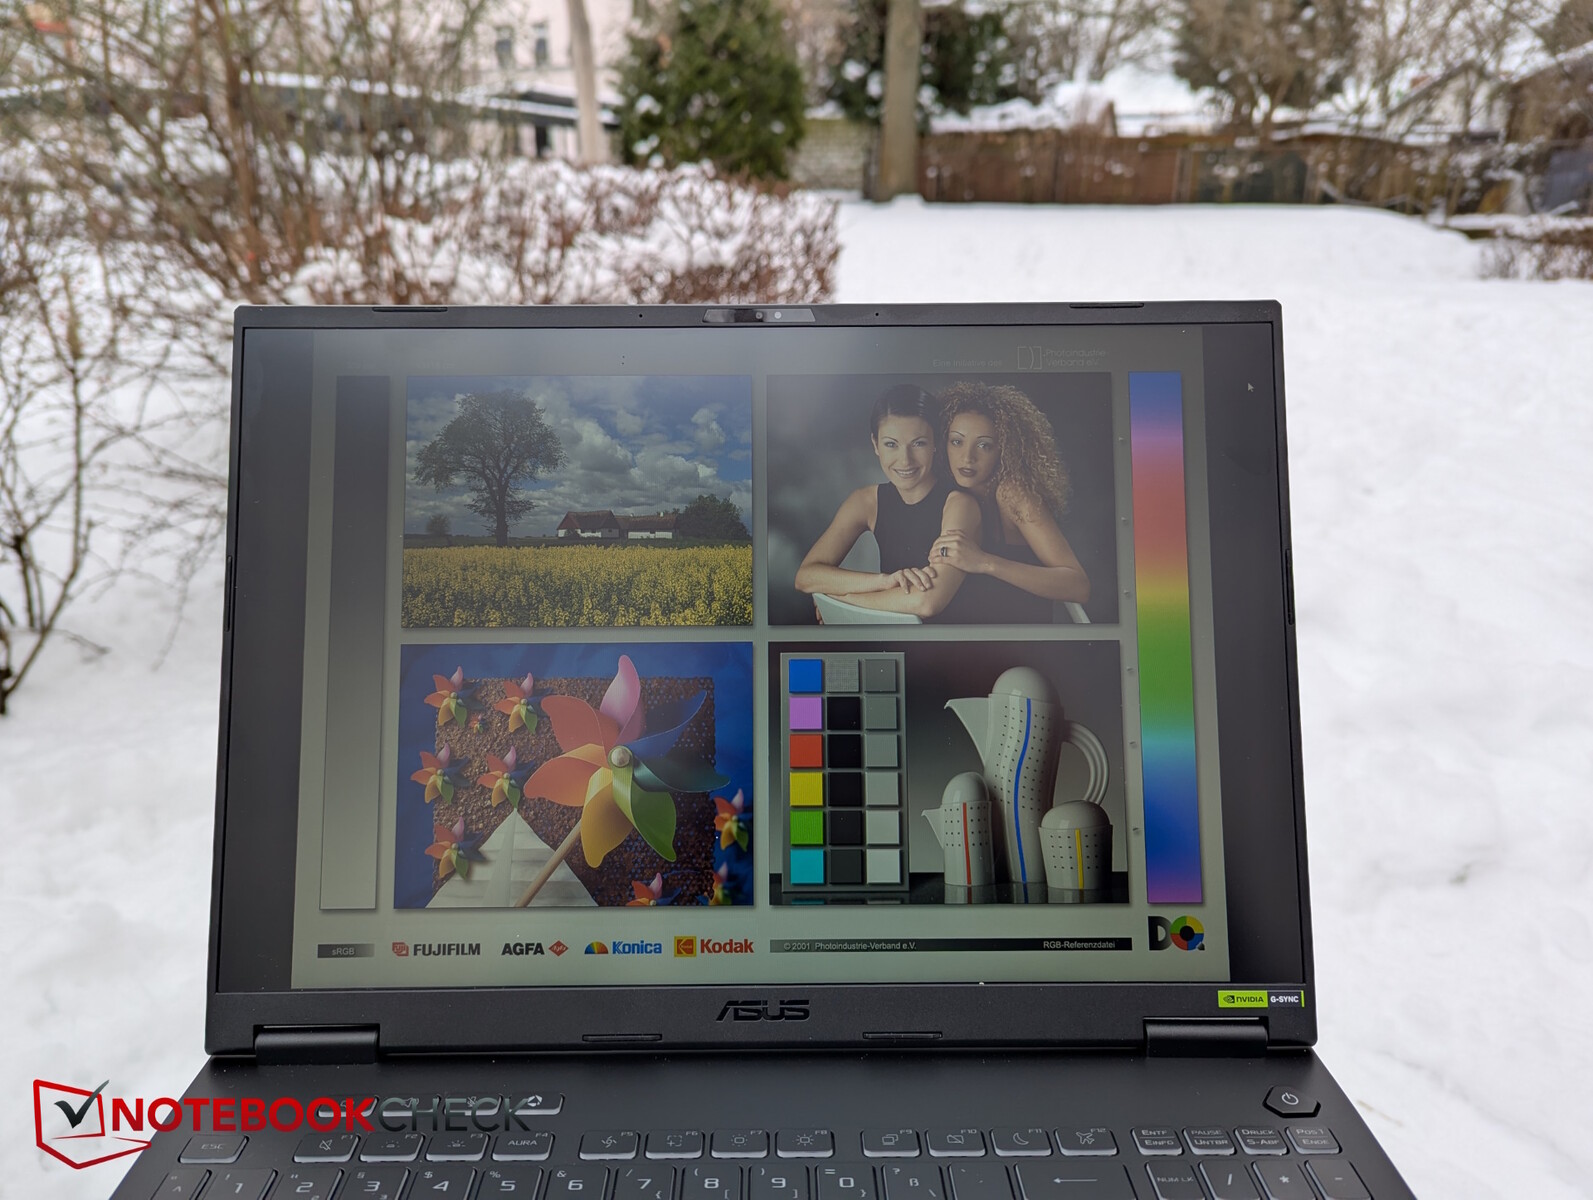
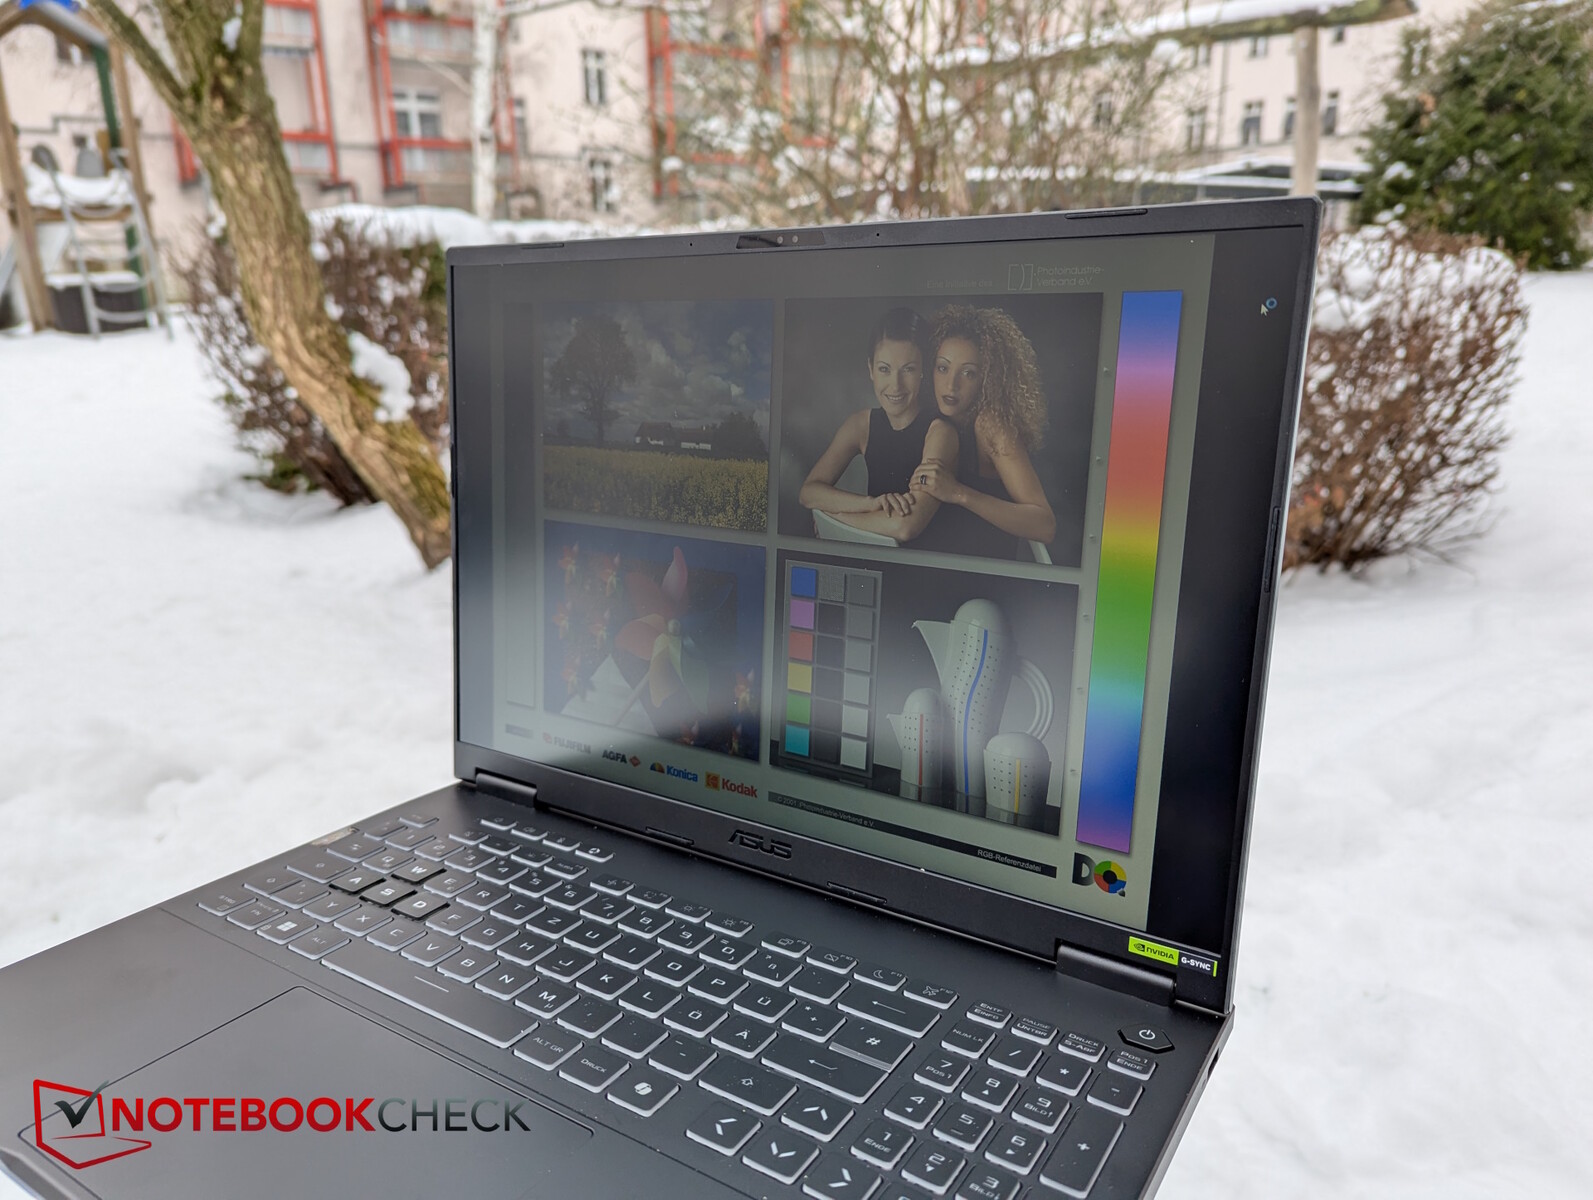
显示屏1200p 显示屏,色彩不准确
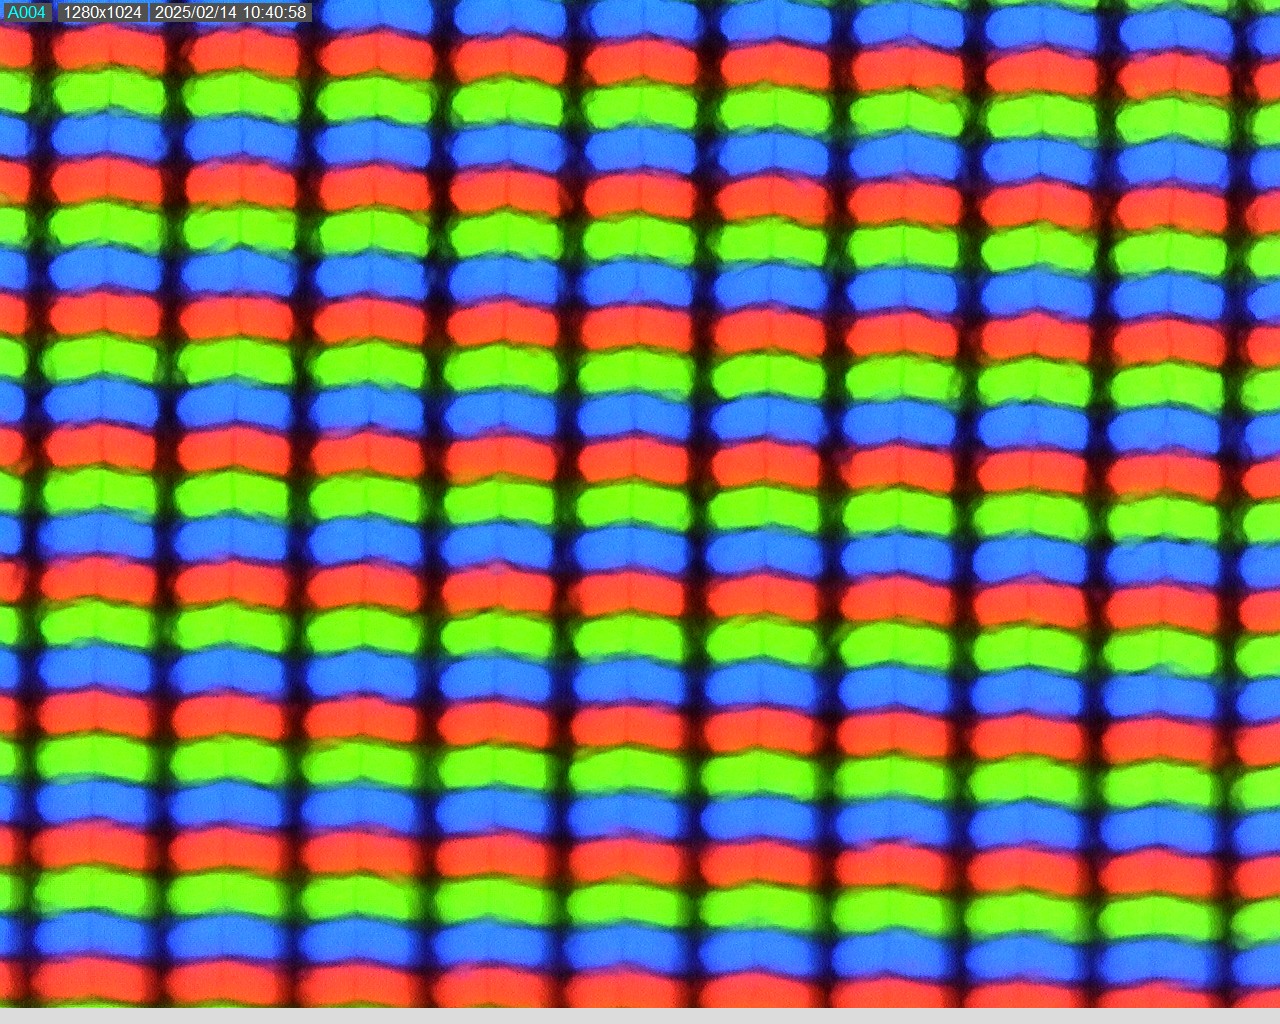

TUF Gaming A16 的屏幕是一块 16 英寸哑光 IPS 显示屏,宽高比为 16:10,分辨率为 1,920 x 1,200,最大刷新率为 144 Hz。此外,如果需要,该笔记本电脑还可以配备更好的 1600p 面板。
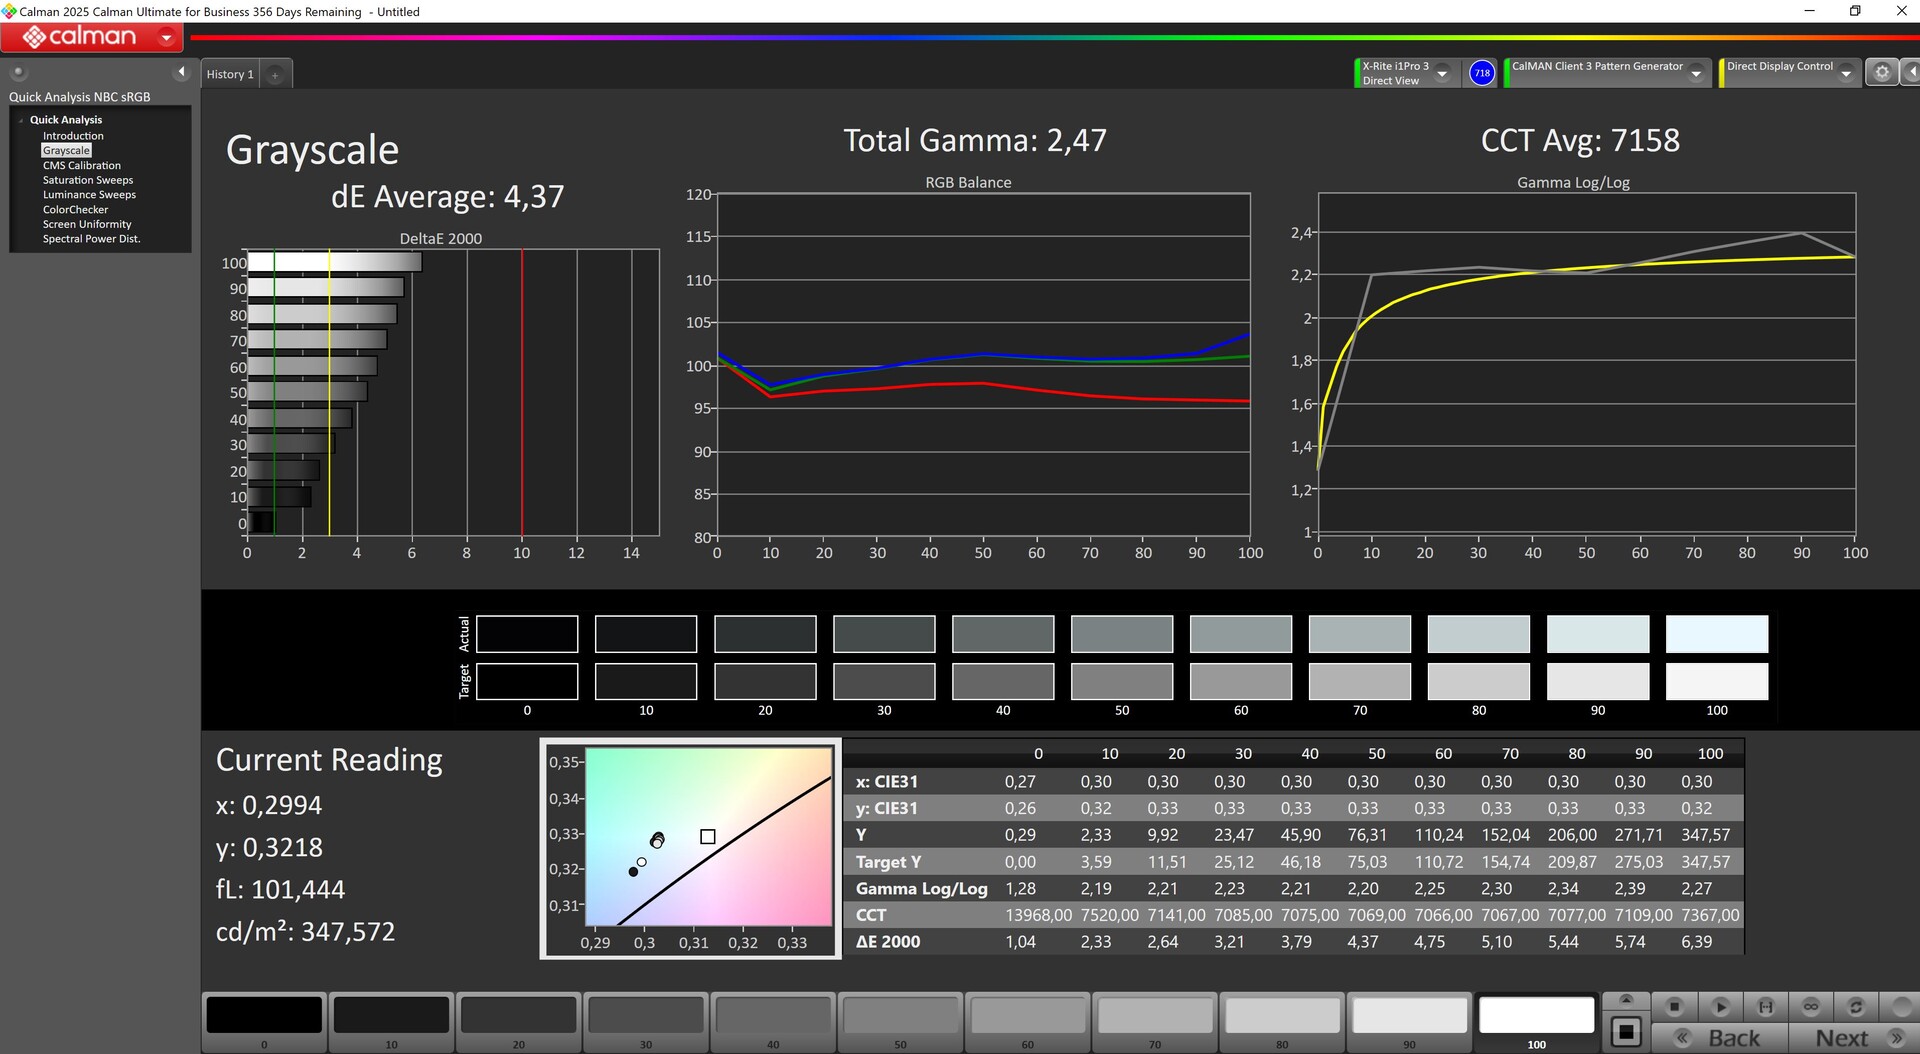
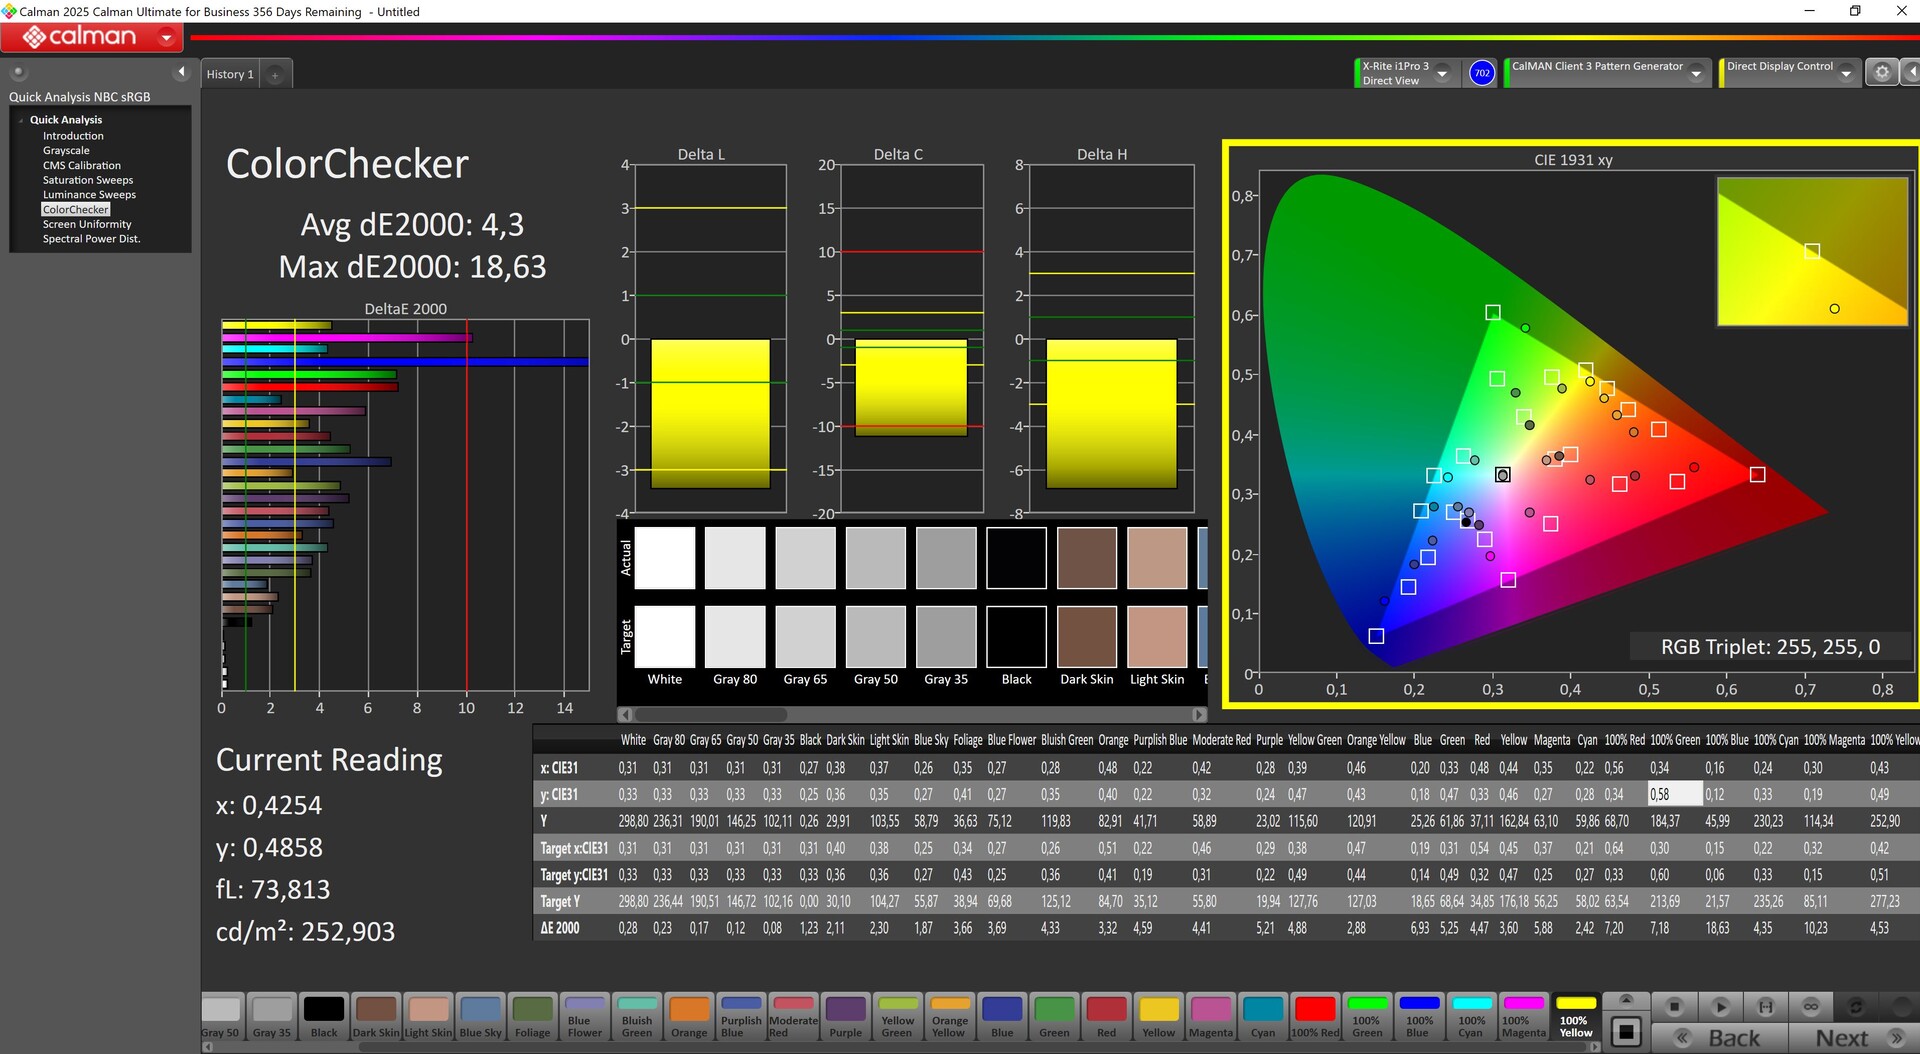
我们测得的平均亮度为 321 尼特。与其他面板不同的是,华硕没有说明 1200p 版本的色彩空间。这也难怪,我们的测量结果甚至不包括 sRGB!因此,我们建议您选择据称更好的 1600p 显示屏。
响应时间也很一般,但没有明显的背光出血现象。
| |||||||||||||||||||||||||
Brightness Distribution: 88 %
Center on Battery: 345 cd/m²
Contrast: 1157:1 (Black: 0.3 cd/m²)
ΔE Color 5.89 | 0.5-29.43 Ø4.86, calibrated: 4.3
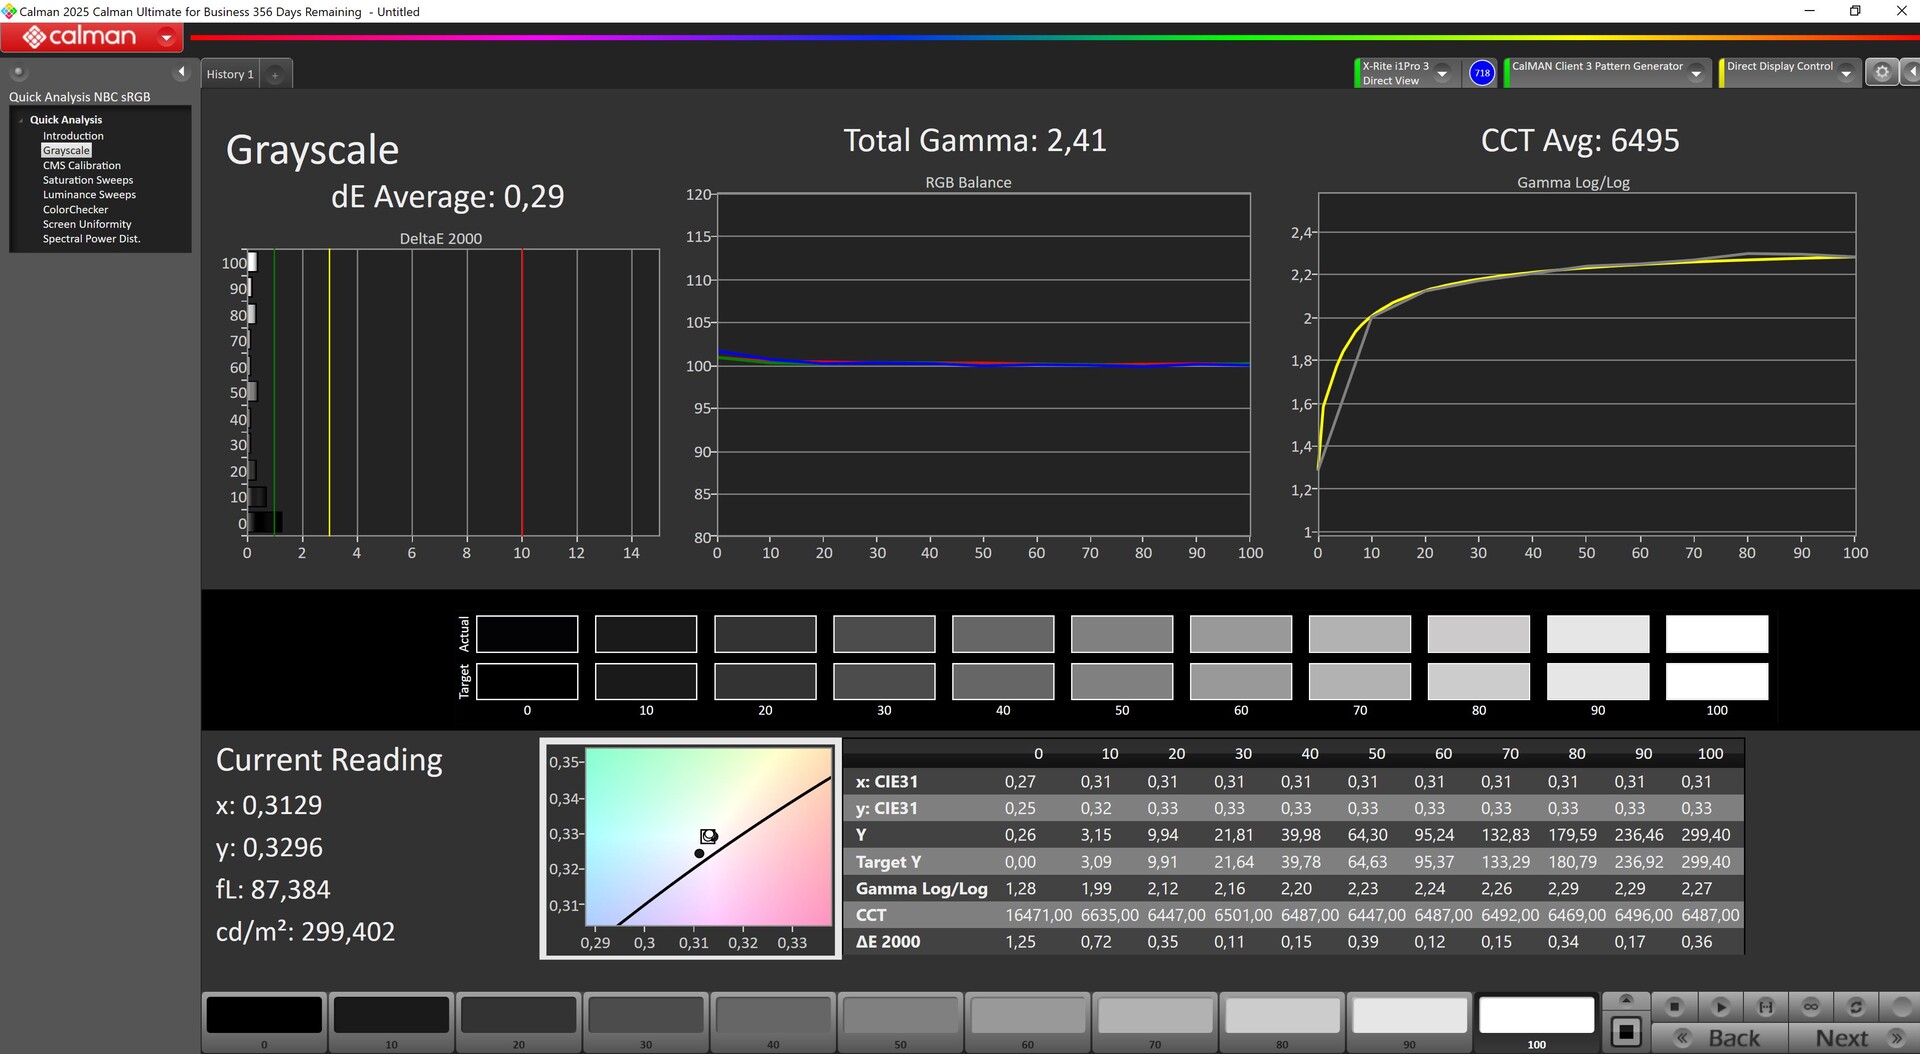
ΔE Greyscale 4.27 | 0.5-98 Ø5.1
41.1% AdobeRGB 1998 (Argyll 2.2.0 3D)
59.7% sRGB (Argyll 2.2.0 3D)
39.8% Display P3 (Argyll 2.2.0 3D)
Gamma: 2.47
| Asus TUF Gaming A16 FA608WV B160UAN08.1 (AUO9BB0), IPS, 1920x1200, 16", 144 Hz | Asus TUF Gaming A16 FA617XS BOE NE160WUM-NX2, IPS, 1920x1200, 16", 165 Hz | Lenovo Legion Pro 5 16IRX9 G9 BOE NE160QDM-NZB, IPS, 2560x1600, 16", 240 Hz | Dell G16, i7-13650HX, RTX 4060 Chi Mei CMN161D (160GME), IPS, 2560x1600, 16", 165 Hz | HP Victus 16 (2024) Chi Mei CMN163E, IPS, 1920x1080, 16.1", 144 Hz | Acer Nitro V 16 ANV16-41-R5AT AUO B160UAN05.B (AUOD8B1), IPS, 1920x1200, 16", 165 Hz | |
|---|---|---|---|---|---|---|
| Display | 70% | 110% | 68% | 4% | -4% | |
| Display P3 Coverage | 39.8 | 69.3 74% | 99.22 149% | 67.5 70% | 41.3 4% | 38.3 -4% |
| sRGB Coverage | 59.7 | 97.3 63% | 99.93 67% | 98.5 65% | 61.7 3% | 57.4 -4% |
| AdobeRGB 1998 Coverage | 41.1 | 70.7 72% | 87.81 114% | 69.3 69% | 42.7 4% | 39.6 -4% |
| Response Times | -17% | 28% | 10% | -117% | -114% | |
| Response Time Grey 50% / Grey 80% * | 13.6 ? | 15.6 ? -15% | 4.8 ? 65% | 7.6 ? 44% | 28.6 ? -110% | 26.5 ? -95% |
| Response Time Black / White * | 8.4 ? | 10 ? -19% | 9.2 ? -10% | 10.4 ? -24% | 18.7 ? -123% | 19.6 ? -133% |
| PWM Frequency | ||||||
| Screen | 34% | 33% | 26% | 5% | -4% | |
| Brightness middle | 347 | 301 -13% | 518 49% | 369 6% | 287 -17% | 303 -13% |
| Brightness | 321 | 294 -8% | 491 53% | 344 7% | 288 -10% | 305 -5% |
| Brightness Distribution | 88 | 94 7% | 90 2% | 89 1% | 86 -2% | 93 6% |
| Black Level * | 0.3 | 0.21 30% | 0.36 -20% | 0.26 13% | 0.19 37% | 0.32 -7% |
| Contrast | 1157 | 1433 24% | 1439 24% | 1419 23% | 1511 31% | 947 -18% |
| Colorchecker dE 2000 * | 5.89 | 1.79 70% | 4.32 27% | 3.04 48% | 5.46 7% | 5.74 3% |
| Colorchecker dE 2000 max. * | 19.26 | 3.48 82% | 6.37 67% | 5.56 71% | 20.36 -6% | 22.69 -18% |
| Colorchecker dE 2000 calibrated * | 4.3 | 1.2 72% | 0.75 83% | 2.35 45% | 3.52 18% | 3.78 12% |
| Greyscale dE 2000 * | 4.27 | 2.5 41% | 3.66 14% | 3.38 21% | 4.8 -12% | 4 6% |
| Gamma | 2.47 89% | 2.265 97% | 2.19 100% | 2.47 89% | 2.108 104% | 2.372 93% |
| CCT | 7158 91% | 6157 106% | 6841 95% | 6040 108% | 6442 101% | 7461 87% |
| Total Average (Program / Settings) | 29% /
34% | 57% /
49% | 35% /
33% | -36% /
-13% | -41% /
-20% |
* ... smaller is better
色彩精确度尤其有待提高。该面板在灰度和 ColorChecker 出厂值方面的偏差很大。
经过我们的手动校准后,灰度级别的 DeltaE 值明显下降,但遗憾的是,色彩偏差仍保持在相对较高的水平;60% sRGB 面板无法提供比这更高的准确度。
Display Response Times
| ↔ Response Time Black to White | ||
|---|---|---|
| 8.4 ms ... rise ↗ and fall ↘ combined | ↗ 4.2 ms rise | 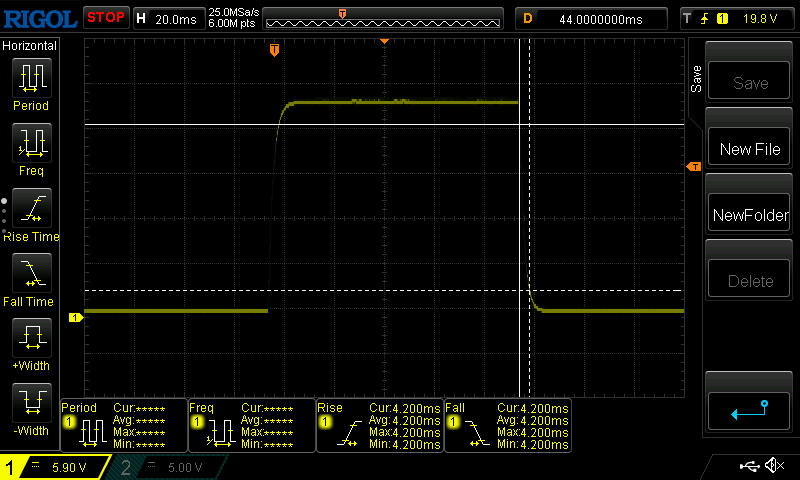 |
| ↘ 4.2 ms fall | ||
| The screen shows fast response rates in our tests and should be suited for gaming. In comparison, all tested devices range from 0.1 (minimum) to 240 (maximum) ms. » 21 % of all devices are better. This means that the measured response time is better than the average of all tested devices (20.7 ms). | ||
| ↔ Response Time 50% Grey to 80% Grey | ||
| 13.6 ms ... rise ↗ and fall ↘ combined | ↗ 6.6 ms rise | 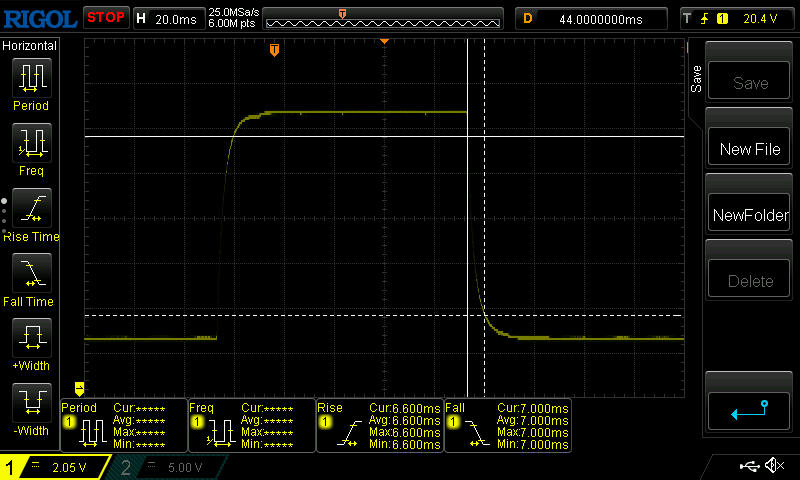 |
| ↘ 7 ms fall | ||
| The screen shows good response rates in our tests, but may be too slow for competitive gamers. In comparison, all tested devices range from 0.165 (minimum) to 636 (maximum) ms. » 24 % of all devices are better. This means that the measured response time is better than the average of all tested devices (32.5 ms). | ||
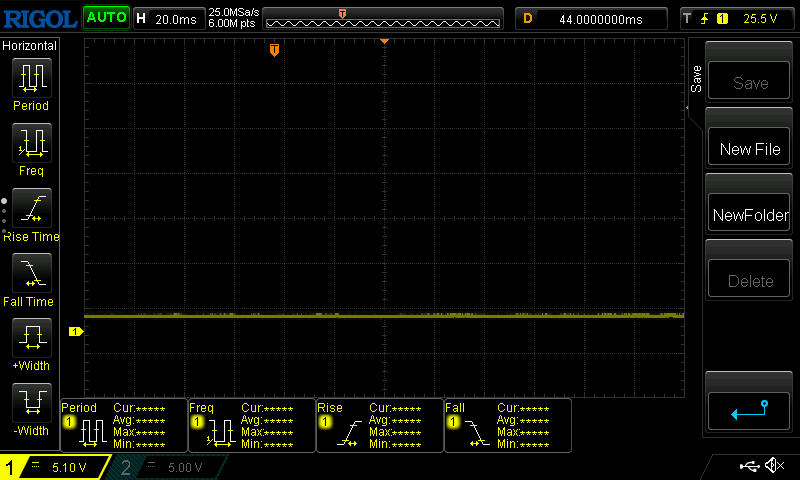
Screen Flickering / PWM (Pulse-Width Modulation)
| Screen flickering / PWM not detected |  | ||
In comparison: 53 % of all tested devices do not use PWM to dim the display. If PWM was detected, an average of 8485 (minimum: 5 - maximum: 343500) Hz was measured. | |||
尽管 TUF Gaming A16 拥有 300 尼特的亮度和哑光面板,但在室外,它的画面看起来相当苍白,对比度也很低。虽然可以在阴凉处工作,但观看体验并不令人愉悦。

性能Ryzen AI 9 和 RTX 4060 的良好组合
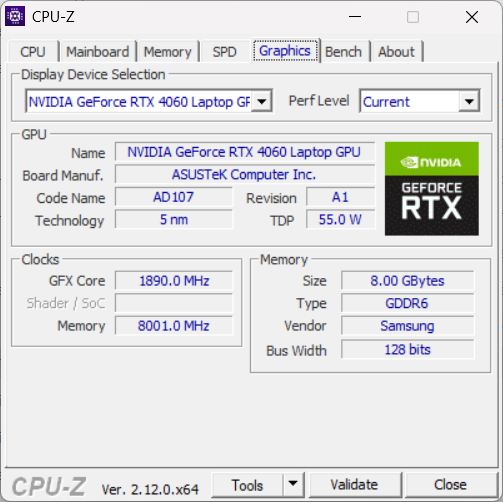
我们的评测机型配备了 AMD Ryzen AI 9 HX 370APU 和 英伟达GeForce RTX 4060 笔记本电脑图形处理器以及 16 GB 内存和 1 TB 固态硬盘。
两种配置的 CPU 是一样的,但不是 RTX 4060,而是更强大的 RTX 4070 笔记本电脑图形处理器也可以使用 FA608WI SKU。

测试条件
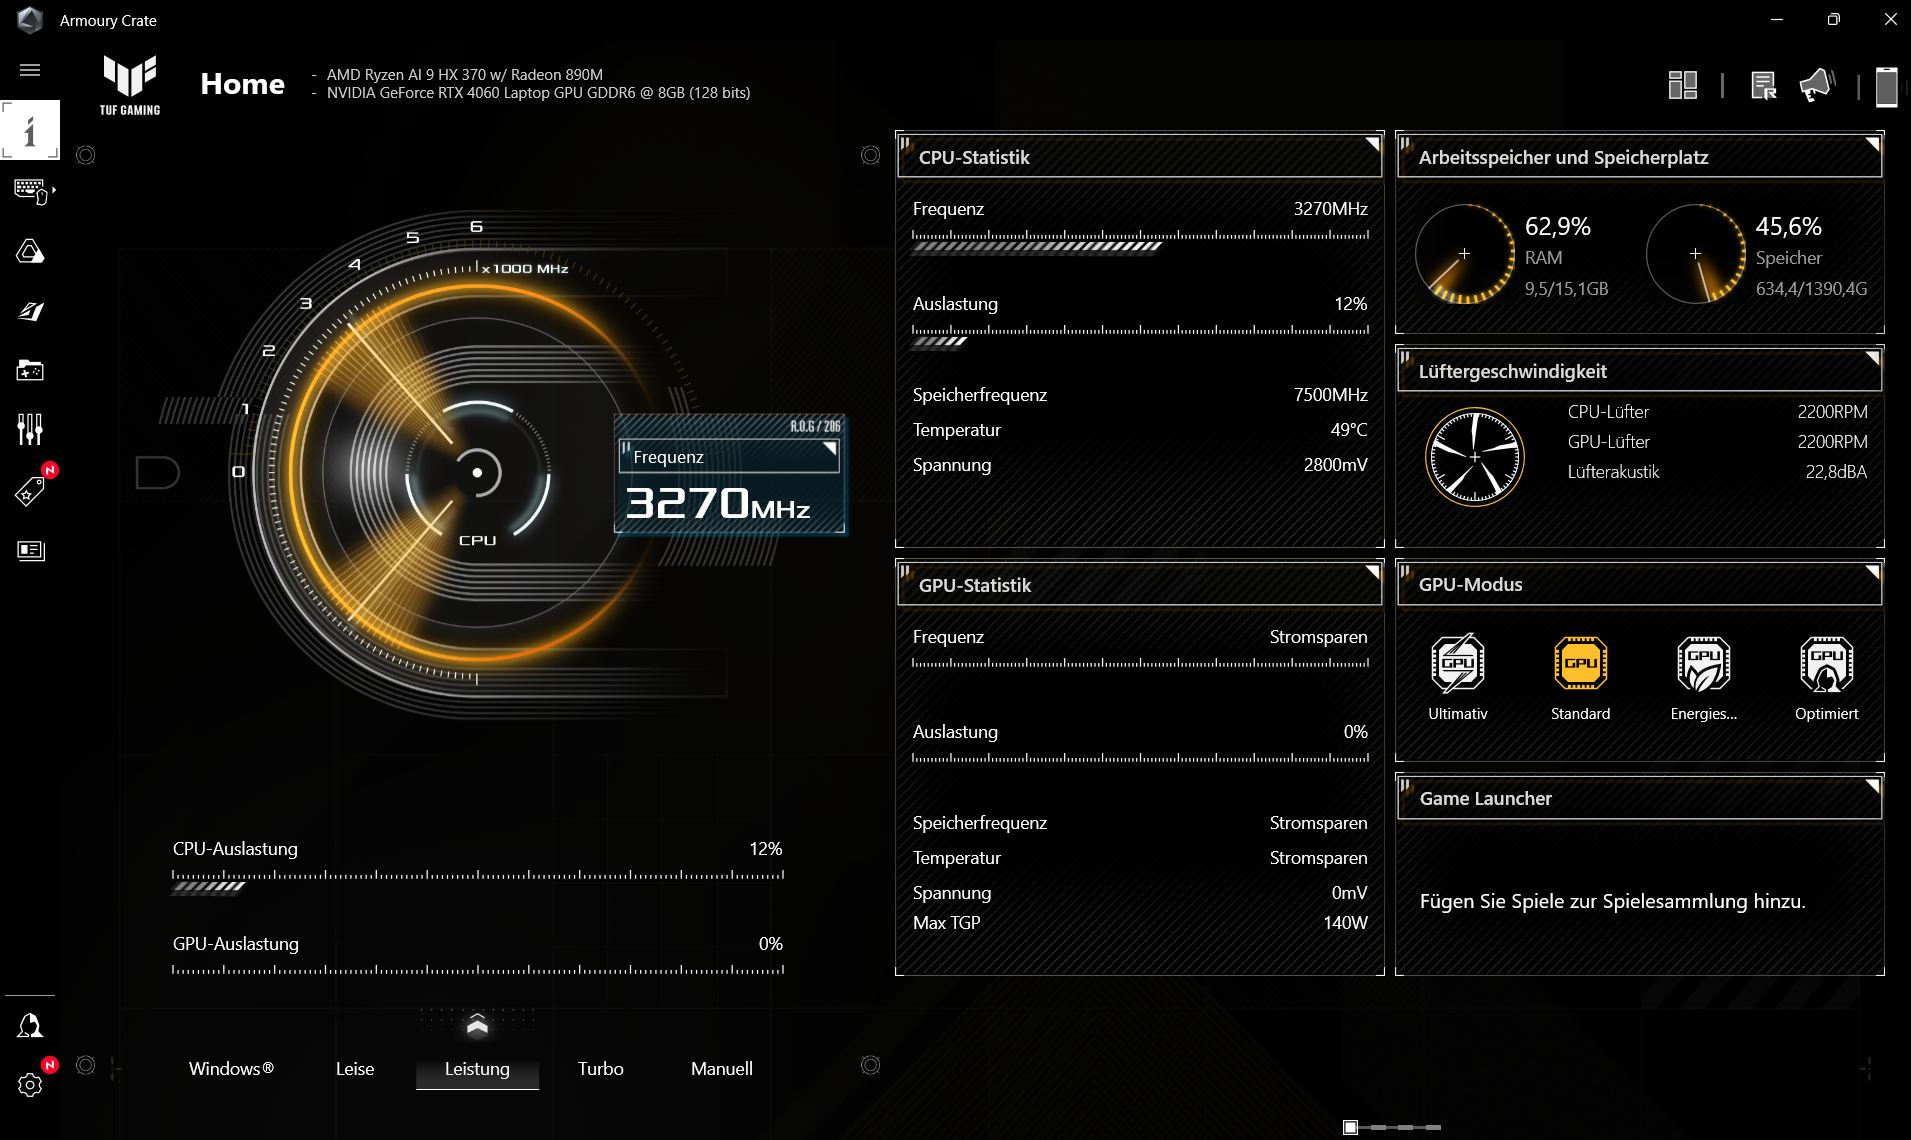
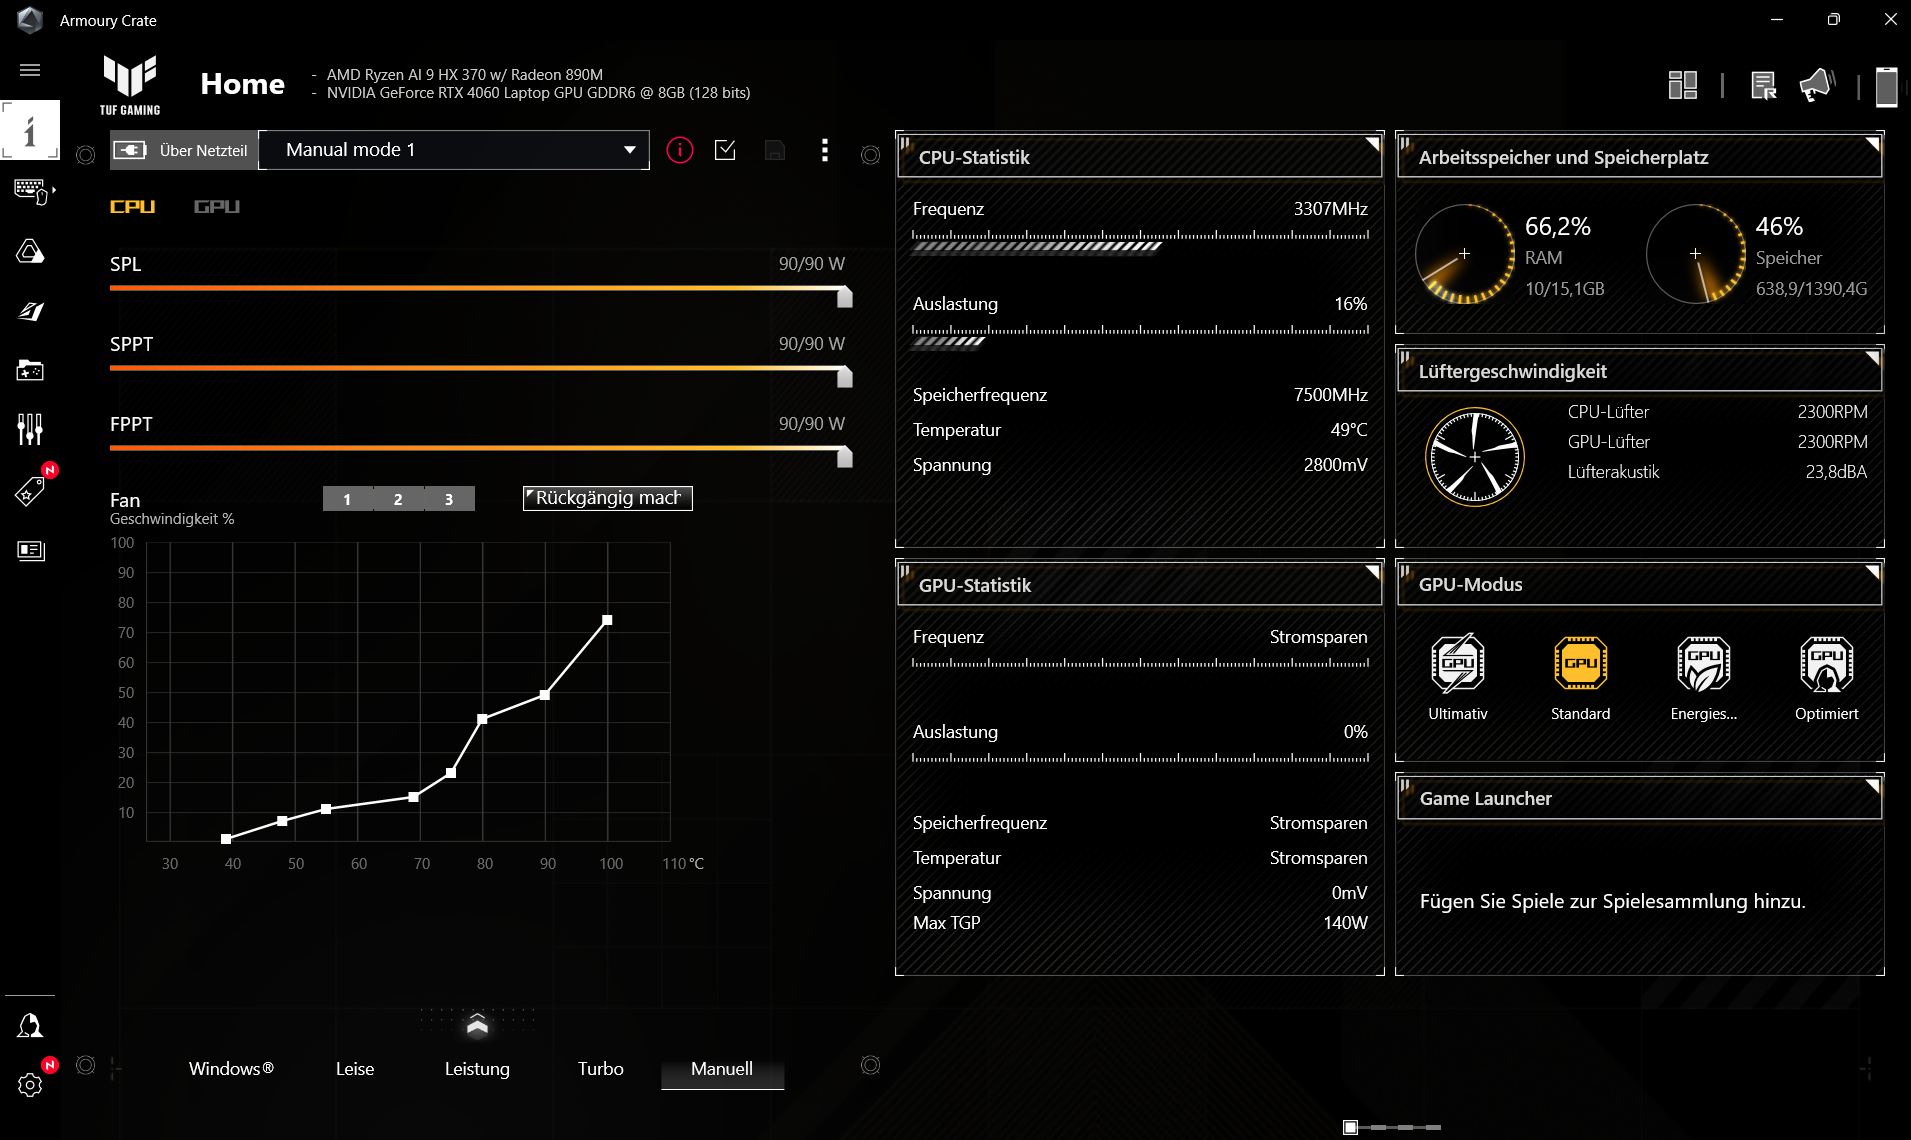
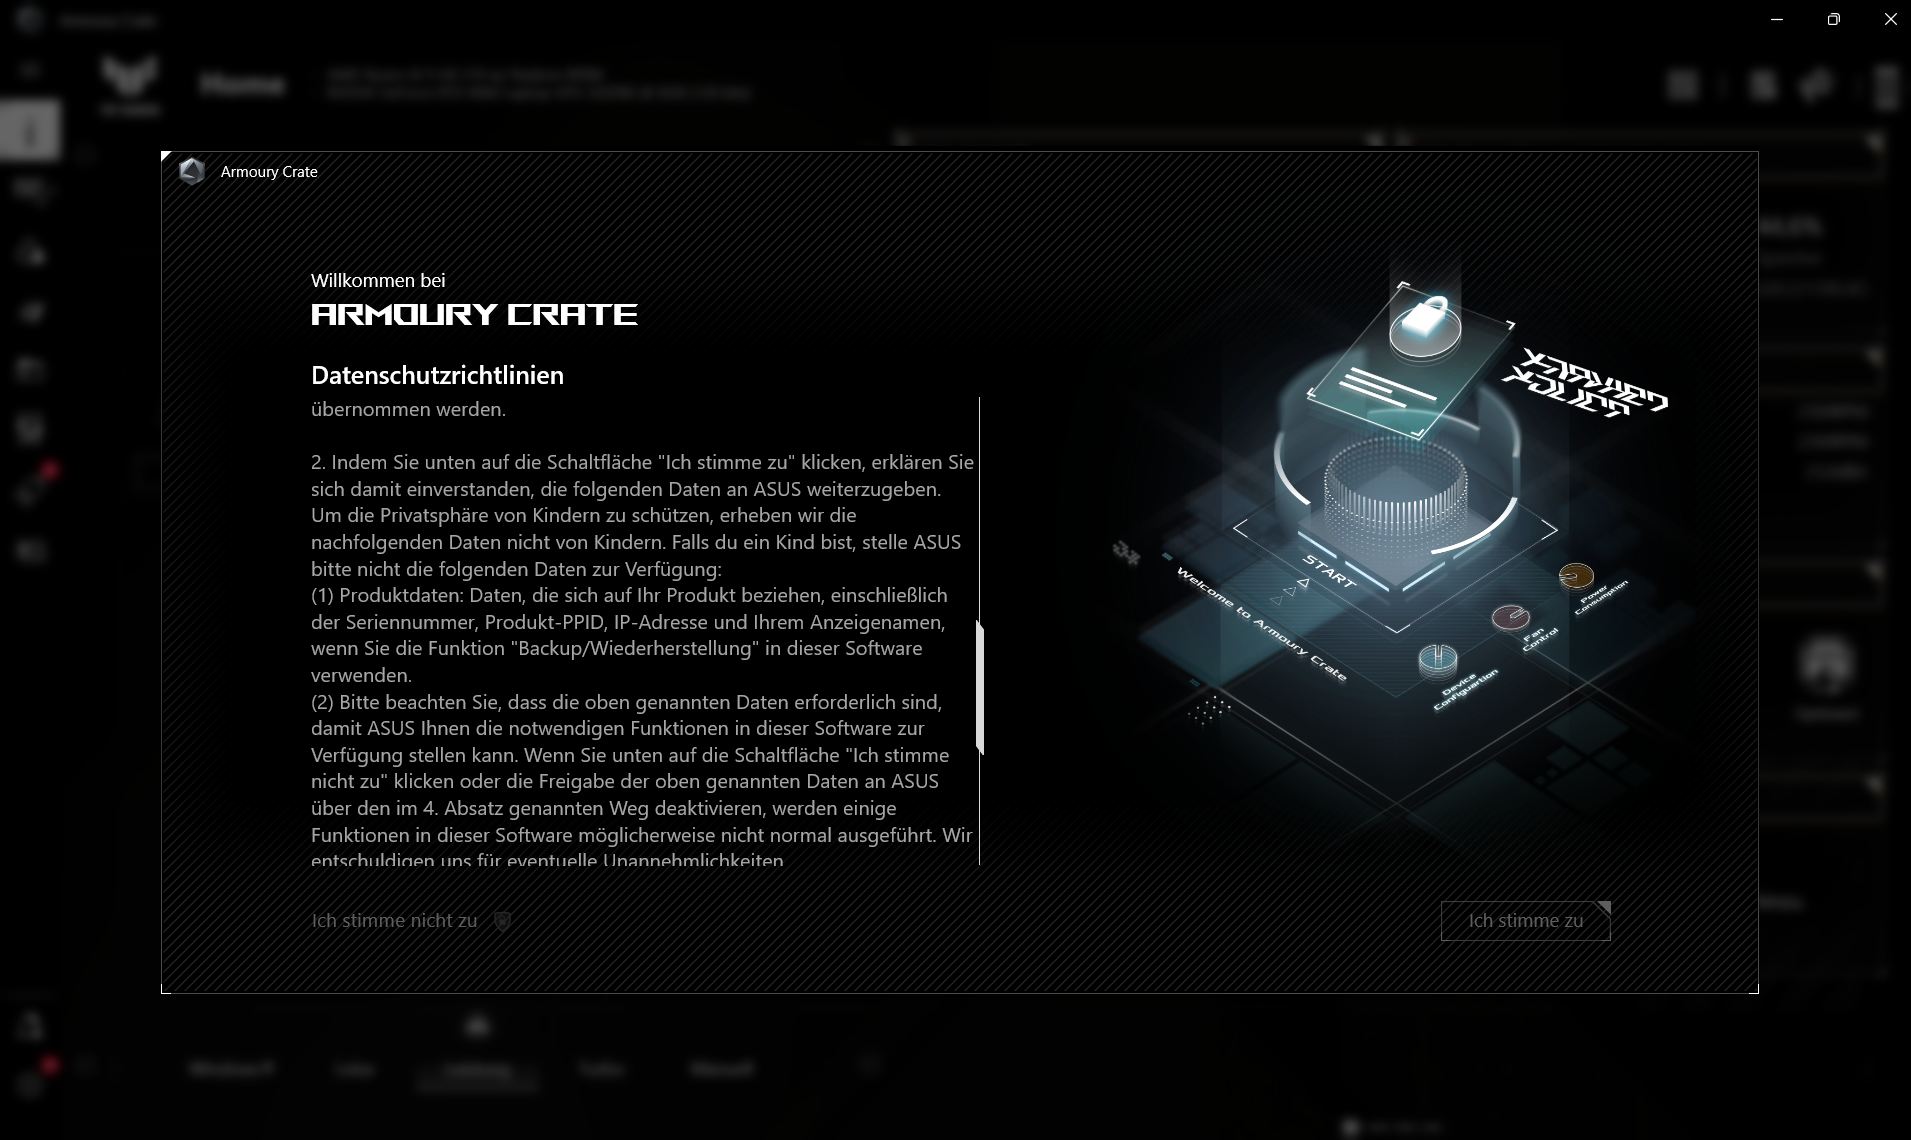
华硕的 Armoury Crate 是一个控制中心。它提供四种电源模式(静音、强力、涡轮和手动)。
还有其他设置,如 MUX、灯光效果等。我们在所有基准测试中都使用了 "强力 "模式。
此外,华硕还捆绑了 MyAsus 应用程序,我们可以在其中找到系统更新和客户支持。
在使用 Armory Crate 的过程中,会向华硕发送各种数据。荒谬的细节:华硕在同意声明中声明不会收集儿童数据。作为儿童,您应该禁止华硕收集这些数据。但是,只有在不同意的情况下才可以这样做,否则就不能充分使用 Armory Crate。孩子们 "知道这一点吗?
华硕不仅安装了测试版的 McAfee,还安装了该公司相应的 "网络顾问",并显示该软件的横幅广告,直到卸载为止。

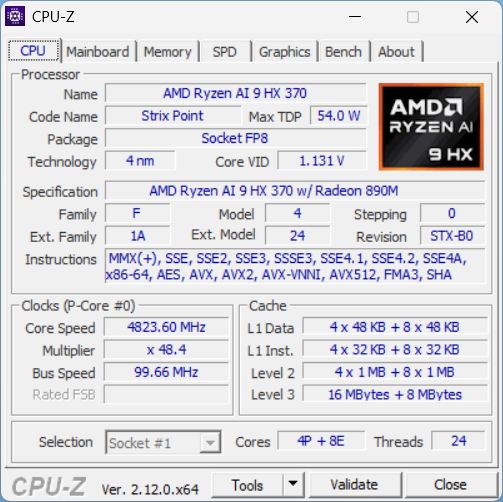
处理器
产品 AMD Ryzen AI 9 HX 370APU 在 TUF Gaming A16 的所有配置中均有提供。它的 12 个处理器内核主频从 2 GHz 到 5.1 GHz,还集成了 50 TOPS NPU 和 RDNA3+ 图形处理器。
在 Cinebench R15 多核耐久性测试中,该处理器表现出高度稳定的性能,没有出现性能下降的情况,这与 英特尔酷睿 i7-14700HX在 惠普 Victus 16.不过,HP Victus 16 中的英特尔酷睿 i7-14700HX 联想Legion Pro 5性能略胜一筹。
在所有 CPU 测试中,TUF Gaming A16 排名第二,落后于 Pro 5。 Legion Pro 5而在 AIDA64 中则遥遥领先。与前代产品相比,目前的 CPU 性能提高了约 20%。
A16 在电池模式下的性能有所下降,尤其是在长期使用时。例如,在 Cinebench R15 中,我们测得电池电量下降了近 40%。
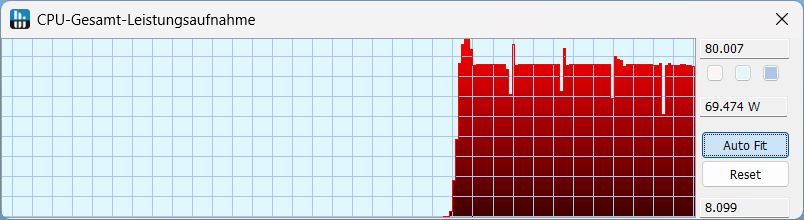
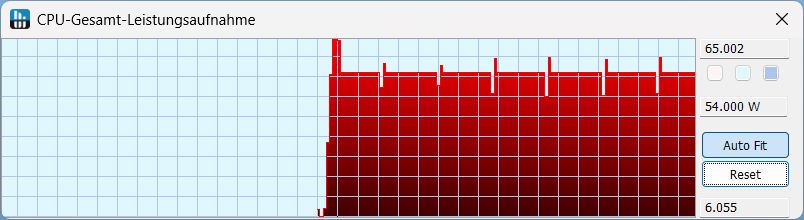
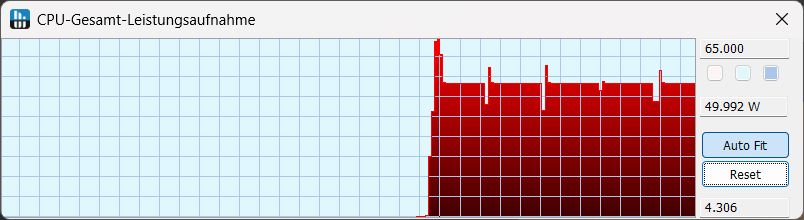
| Cinebench R23 | Turbo | 性能 | 静音 | 电池 |
|---|---|---|---|---|
| 功耗(瓦) | 70+ | 54+ | 50+ | 55 - 15 |
Cinebench R15 Multi loop
Cinebench R23: Multi Core | Single Core
Cinebench R20: CPU (Multi Core) | CPU (Single Core)
Cinebench R15: CPU Multi 64Bit | CPU Single 64Bit
Blender: v2.79 BMW27 CPU
7-Zip 18.03: 7z b 4 | 7z b 4 -mmt1
Geekbench 6.4: Multi-Core | Single-Core
Geekbench 5.5: Multi-Core | Single-Core
HWBOT x265 Benchmark v2.2: 4k Preset
LibreOffice : 20 Documents To PDF
R Benchmark 2.5: Overall mean
| CPU Performance Rating | |
| Lenovo Legion Pro 5 16IRX9 G9 | |
| Asus TUF Gaming A16 FA608WV | |
| Average AMD Ryzen AI 9 HX 370 | |
| Average of class Gaming | |
| HP Victus 16 (2024) | |
| Dell G16, i7-13650HX, RTX 4060 | |
| Asus TUF Gaming A16 FA617XS -2! | |
| Acer Nitro V 16 ANV16-41-R5AT | |
| Cinebench R23 / Multi Core | |
| Lenovo Legion Pro 5 16IRX9 G9 | |
| HP Victus 16 (2024) | |
| Asus TUF Gaming A16 FA608WV | |
| Average of class Gaming (5668 - 39652, n=151, last 2 years) | |
| Dell G16, i7-13650HX, RTX 4060 | |
| Average AMD Ryzen AI 9 HX 370 (10435 - 23805, n=24) | |
| Asus TUF Gaming A16 FA617XS | |
| Acer Nitro V 16 ANV16-41-R5AT | |
| Cinebench R23 / Single Core | |
| Lenovo Legion Pro 5 16IRX9 G9 | |
| Asus TUF Gaming A16 FA608WV | |
| Average AMD Ryzen AI 9 HX 370 (1921 - 2049, n=17) | |
| Average of class Gaming (1136 - 2252, n=151, last 2 years) | |
| Dell G16, i7-13650HX, RTX 4060 | |
| Asus TUF Gaming A16 FA617XS | |
| Acer Nitro V 16 ANV16-41-R5AT | |
| HP Victus 16 (2024) | |
| Cinebench R20 / CPU (Multi Core) | |
| Lenovo Legion Pro 5 16IRX9 G9 | |
| HP Victus 16 (2024) | |
| Asus TUF Gaming A16 FA608WV | |
| Average of class Gaming (2179 - 15517, n=151, last 2 years) | |
| Average AMD Ryzen AI 9 HX 370 (6449 - 9250, n=16) | |
| Dell G16, i7-13650HX, RTX 4060 | |
| Asus TUF Gaming A16 FA617XS | |
| Acer Nitro V 16 ANV16-41-R5AT | |
| Cinebench R20 / CPU (Single Core) | |
| Lenovo Legion Pro 5 16IRX9 G9 | |
| Asus TUF Gaming A16 FA608WV | |
| Average AMD Ryzen AI 9 HX 370 (753 - 804, n=16) | |
| Average of class Gaming (439 - 866, n=151, last 2 years) | |
| Dell G16, i7-13650HX, RTX 4060 | |
| Asus TUF Gaming A16 FA617XS | |
| Acer Nitro V 16 ANV16-41-R5AT | |
| HP Victus 16 (2024) | |
| Cinebench R15 / CPU Multi 64Bit | |
| Lenovo Legion Pro 5 16IRX9 G9 | |
| HP Victus 16 (2024) | |
| Asus TUF Gaming A16 FA608WV | |
| Average of class Gaming (905 - 6074, n=154, last 2 years) | |
| Average AMD Ryzen AI 9 HX 370 (2498 - 3505, n=16) | |
| Dell G16, i7-13650HX, RTX 4060 | |
| Asus TUF Gaming A16 FA617XS | |
| Acer Nitro V 16 ANV16-41-R5AT | |
| Cinebench R15 / CPU Single 64Bit | |
| Asus TUF Gaming A16 FA608WV | |
| Average AMD Ryzen AI 9 HX 370 (293 - 315, n=16) | |
| Lenovo Legion Pro 5 16IRX9 G9 | |
| Asus TUF Gaming A16 FA617XS | |
| Average of class Gaming (191.9 - 343, n=151, last 2 years) | |
| Acer Nitro V 16 ANV16-41-R5AT | |
| Dell G16, i7-13650HX, RTX 4060 | |
| HP Victus 16 (2024) | |
| Blender / v2.79 BMW27 CPU | |
| Acer Nitro V 16 ANV16-41-R5AT | |
| Asus TUF Gaming A16 FA617XS | |
| Average of class Gaming (81 - 555, n=145, last 2 years) | |
| HP Victus 16 (2024) | |
| Dell G16, i7-13650HX, RTX 4060 | |
| Average AMD Ryzen AI 9 HX 370 (140 - 192, n=16) | |
| Asus TUF Gaming A16 FA608WV | |
| Lenovo Legion Pro 5 16IRX9 G9 | |
| 7-Zip 18.03 / 7z b 4 | |
| Lenovo Legion Pro 5 16IRX9 G9 | |
| HP Victus 16 (2024) | |
| Average of class Gaming (23795 - 144064, n=149, last 2 years) | |
| Asus TUF Gaming A16 FA608WV | |
| Average AMD Ryzen AI 9 HX 370 (66154 - 83714, n=16) | |
| Dell G16, i7-13650HX, RTX 4060 | |
| Acer Nitro V 16 ANV16-41-R5AT | |
| Asus TUF Gaming A16 FA617XS | |
| 7-Zip 18.03 / 7z b 4 -mmt1 | |
| Lenovo Legion Pro 5 16IRX9 G9 | |
| Asus TUF Gaming A16 FA617XS | |
| Acer Nitro V 16 ANV16-41-R5AT | |
| Average of class Gaming (4199 - 7573, n=149, last 2 years) | |
| Average AMD Ryzen AI 9 HX 370 (5859 - 6497, n=16) | |
| Asus TUF Gaming A16 FA608WV | |
| Dell G16, i7-13650HX, RTX 4060 | |
| HP Victus 16 (2024) | |
| Geekbench 6.4 / Multi-Core | |
| Lenovo Legion Pro 5 16IRX9 G9 | |
| HP Victus 16 (2024) | |
| Average of class Gaming (5340 - 21668, n=123, last 2 years) | |
| Average AMD Ryzen AI 9 HX 370 (11973 - 15671, n=18) | |
| Asus TUF Gaming A16 FA608WV | |
| Dell G16, i7-13650HX, RTX 4060 | |
| Acer Nitro V 16 ANV16-41-R5AT | |
| Geekbench 6.4 / Single-Core | |
| Lenovo Legion Pro 5 16IRX9 G9 | |
| Average AMD Ryzen AI 9 HX 370 (2780 - 2965, n=18) | |
| Asus TUF Gaming A16 FA608WV | |
| Average of class Gaming (1490 - 3219, n=123, last 2 years) | |
| Acer Nitro V 16 ANV16-41-R5AT | |
| Dell G16, i7-13650HX, RTX 4060 | |
| HP Victus 16 (2024) | |
| Geekbench 5.5 / Multi-Core | |
| Lenovo Legion Pro 5 16IRX9 G9 | |
| HP Victus 16 (2024) | |
| Average of class Gaming (4557 - 25855, n=148, last 2 years) | |
| Asus TUF Gaming A16 FA608WV | |
| Average AMD Ryzen AI 9 HX 370 (11394 - 15407, n=17) | |
| Dell G16, i7-13650HX, RTX 4060 | |
| Asus TUF Gaming A16 FA617XS | |
| Acer Nitro V 16 ANV16-41-R5AT | |
| Geekbench 5.5 / Single-Core | |
| Lenovo Legion Pro 5 16IRX9 G9 | |
| Asus TUF Gaming A16 FA608WV | |
| Average AMD Ryzen AI 9 HX 370 (1957 - 2136, n=17) | |
| Asus TUF Gaming A16 FA617XS | |
| Acer Nitro V 16 ANV16-41-R5AT | |
| Average of class Gaming (986 - 2423, n=148, last 2 years) | |
| Dell G16, i7-13650HX, RTX 4060 | |
| HP Victus 16 (2024) | |
| HWBOT x265 Benchmark v2.2 / 4k Preset | |
| Lenovo Legion Pro 5 16IRX9 G9 | |
| Asus TUF Gaming A16 FA608WV | |
| Average AMD Ryzen AI 9 HX 370 (20.3 - 28.7, n=16) | |
| Average of class Gaming (6.72 - 42.9, n=149, last 2 years) | |
| HP Victus 16 (2024) | |
| Asus TUF Gaming A16 FA617XS | |
| Acer Nitro V 16 ANV16-41-R5AT | |
| Dell G16, i7-13650HX, RTX 4060 | |
| LibreOffice / 20 Documents To PDF | |
| HP Victus 16 (2024) | |
| Acer Nitro V 16 ANV16-41-R5AT | |
| Average AMD Ryzen AI 9 HX 370 (46.8 - 66.6, n=16) | |
| Dell G16, i7-13650HX, RTX 4060 | |
| Lenovo Legion Pro 5 16IRX9 G9 | |
| Asus TUF Gaming A16 FA608WV | |
| Average of class Gaming (19 - 96.6, n=147, last 2 years) | |
| Asus TUF Gaming A16 FA617XS | |
| R Benchmark 2.5 / Overall mean | |
| HP Victus 16 (2024) | |
| Average of class Gaming (0.3609 - 0.759, n=150, last 2 years) | |
| Acer Nitro V 16 ANV16-41-R5AT | |
| Asus TUF Gaming A16 FA617XS | |
| Dell G16, i7-13650HX, RTX 4060 | |
| Dell G16, i7-13650HX, RTX 4060 | |
| Average AMD Ryzen AI 9 HX 370 (0.3892 - 0.529, n=16) | |
| Asus TUF Gaming A16 FA608WV | |
| Lenovo Legion Pro 5 16IRX9 G9 | |
* ... smaller is better
AIDA64: FP32 Ray-Trace | FPU Julia | CPU SHA3 | CPU Queen | FPU SinJulia | FPU Mandel | CPU AES | CPU ZLib | FP64 Ray-Trace | CPU PhotoWorxx
| Performance Rating | |
| Asus TUF Gaming A16 FA608WV | |
| Lenovo Legion Pro 5 16IRX9 G9 | |
| Average AMD Ryzen AI 9 HX 370 | |
| Asus TUF Gaming A16 FA617XS | |
| Average of class Gaming | |
| Acer Nitro V 16 ANV16-41-R5AT | |
| Dell G16, i7-13650HX, RTX 4060 | |
| HP Victus 16 (2024) | |
| AIDA64 / FP32 Ray-Trace | |
| Asus TUF Gaming A16 FA608WV | |
| Average AMD Ryzen AI 9 HX 370 (24673 - 37654, n=15) | |
| Asus TUF Gaming A16 FA617XS | |
| Acer Nitro V 16 ANV16-41-R5AT | |
| Lenovo Legion Pro 5 16IRX9 G9 | |
| Average of class Gaming (4986 - 81639, n=149, last 2 years) | |
| Dell G16, i7-13650HX, RTX 4060 | |
| HP Victus 16 (2024) | |
| AIDA64 / FPU Julia | |
| Asus TUF Gaming A16 FA608WV | |
| Average AMD Ryzen AI 9 HX 370 (95655 - 147937, n=16) | |
| Asus TUF Gaming A16 FA617XS | |
| Lenovo Legion Pro 5 16IRX9 G9 | |
| Acer Nitro V 16 ANV16-41-R5AT | |
| Average of class Gaming (25360 - 252486, n=149, last 2 years) | |
| Dell G16, i7-13650HX, RTX 4060 | |
| HP Victus 16 (2024) | |
| AIDA64 / CPU SHA3 | |
| Asus TUF Gaming A16 FA608WV | |
| Lenovo Legion Pro 5 16IRX9 G9 | |
| Average AMD Ryzen AI 9 HX 370 (4421 - 5843, n=16) | |
| Average of class Gaming (1339 - 10389, n=149, last 2 years) | |
| Acer Nitro V 16 ANV16-41-R5AT | |
| Asus TUF Gaming A16 FA617XS | |
| Dell G16, i7-13650HX, RTX 4060 | |
| HP Victus 16 (2024) | |
| AIDA64 / CPU Queen | |
| Lenovo Legion Pro 5 16IRX9 G9 | |
| HP Victus 16 (2024) | |
| Asus TUF Gaming A16 FA617XS | |
| Acer Nitro V 16 ANV16-41-R5AT | |
| Average of class Gaming (50699 - 200651, n=149, last 2 years) | |
| Dell G16, i7-13650HX, RTX 4060 | |
| Asus TUF Gaming A16 FA608WV | |
| Average AMD Ryzen AI 9 HX 370 (41744 - 99088, n=16) | |
| AIDA64 / FPU SinJulia | |
| Asus TUF Gaming A16 FA608WV | |
| Average AMD Ryzen AI 9 HX 370 (16445 - 19115, n=16) | |
| Asus TUF Gaming A16 FA617XS | |
| Acer Nitro V 16 ANV16-41-R5AT | |
| Lenovo Legion Pro 5 16IRX9 G9 | |
| Average of class Gaming (4800 - 32988, n=149, last 2 years) | |
| HP Victus 16 (2024) | |
| Dell G16, i7-13650HX, RTX 4060 | |
| AIDA64 / FPU Mandel | |
| Asus TUF Gaming A16 FA608WV | |
| Average AMD Ryzen AI 9 HX 370 (50357 - 79251, n=15) | |
| Asus TUF Gaming A16 FA617XS | |
| Acer Nitro V 16 ANV16-41-R5AT | |
| Lenovo Legion Pro 5 16IRX9 G9 | |
| Average of class Gaming (12321 - 134044, n=149, last 2 years) | |
| Dell G16, i7-13650HX, RTX 4060 | |
| HP Victus 16 (2024) | |
| AIDA64 / CPU AES | |
| Lenovo Legion Pro 5 16IRX9 G9 | |
| Average of class Gaming (19065 - 328679, n=149, last 2 years) | |
| Asus TUF Gaming A16 FA617XS | |
| Dell G16, i7-13650HX, RTX 4060 | |
| HP Victus 16 (2024) | |
| Asus TUF Gaming A16 FA608WV | |
| Average AMD Ryzen AI 9 HX 370 (67015 - 96781, n=16) | |
| Acer Nitro V 16 ANV16-41-R5AT | |
| AIDA64 / CPU ZLib | |
| Lenovo Legion Pro 5 16IRX9 G9 | |
| Asus TUF Gaming A16 FA608WV | |
| Average AMD Ryzen AI 9 HX 370 (1077 - 1530, n=16) | |
| Average of class Gaming (373 - 2531, n=149, last 2 years) | |
| Dell G16, i7-13650HX, RTX 4060 | |
| HP Victus 16 (2024) | |
| Asus TUF Gaming A16 FA617XS | |
| Acer Nitro V 16 ANV16-41-R5AT | |
| AIDA64 / FP64 Ray-Trace | |
| Asus TUF Gaming A16 FA608WV | |
| Average AMD Ryzen AI 9 HX 370 (13665 - 20608, n=16) | |
| Asus TUF Gaming A16 FA617XS | |
| Acer Nitro V 16 ANV16-41-R5AT | |
| Lenovo Legion Pro 5 16IRX9 G9 | |
| Average of class Gaming (2540 - 43430, n=149, last 2 years) | |
| Dell G16, i7-13650HX, RTX 4060 | |
| HP Victus 16 (2024) | |
| AIDA64 / CPU PhotoWorxx | |
| Lenovo Legion Pro 5 16IRX9 G9 | |
| Average AMD Ryzen AI 9 HX 370 (36752 - 51727, n=16) | |
| Average of class Gaming (10805 - 60161, n=149, last 2 years) | |
| HP Victus 16 (2024) | |
| Asus TUF Gaming A16 FA608WV | |
| Dell G16, i7-13650HX, RTX 4060 | |
| Acer Nitro V 16 ANV16-41-R5AT | |
| Asus TUF Gaming A16 FA617XS | |
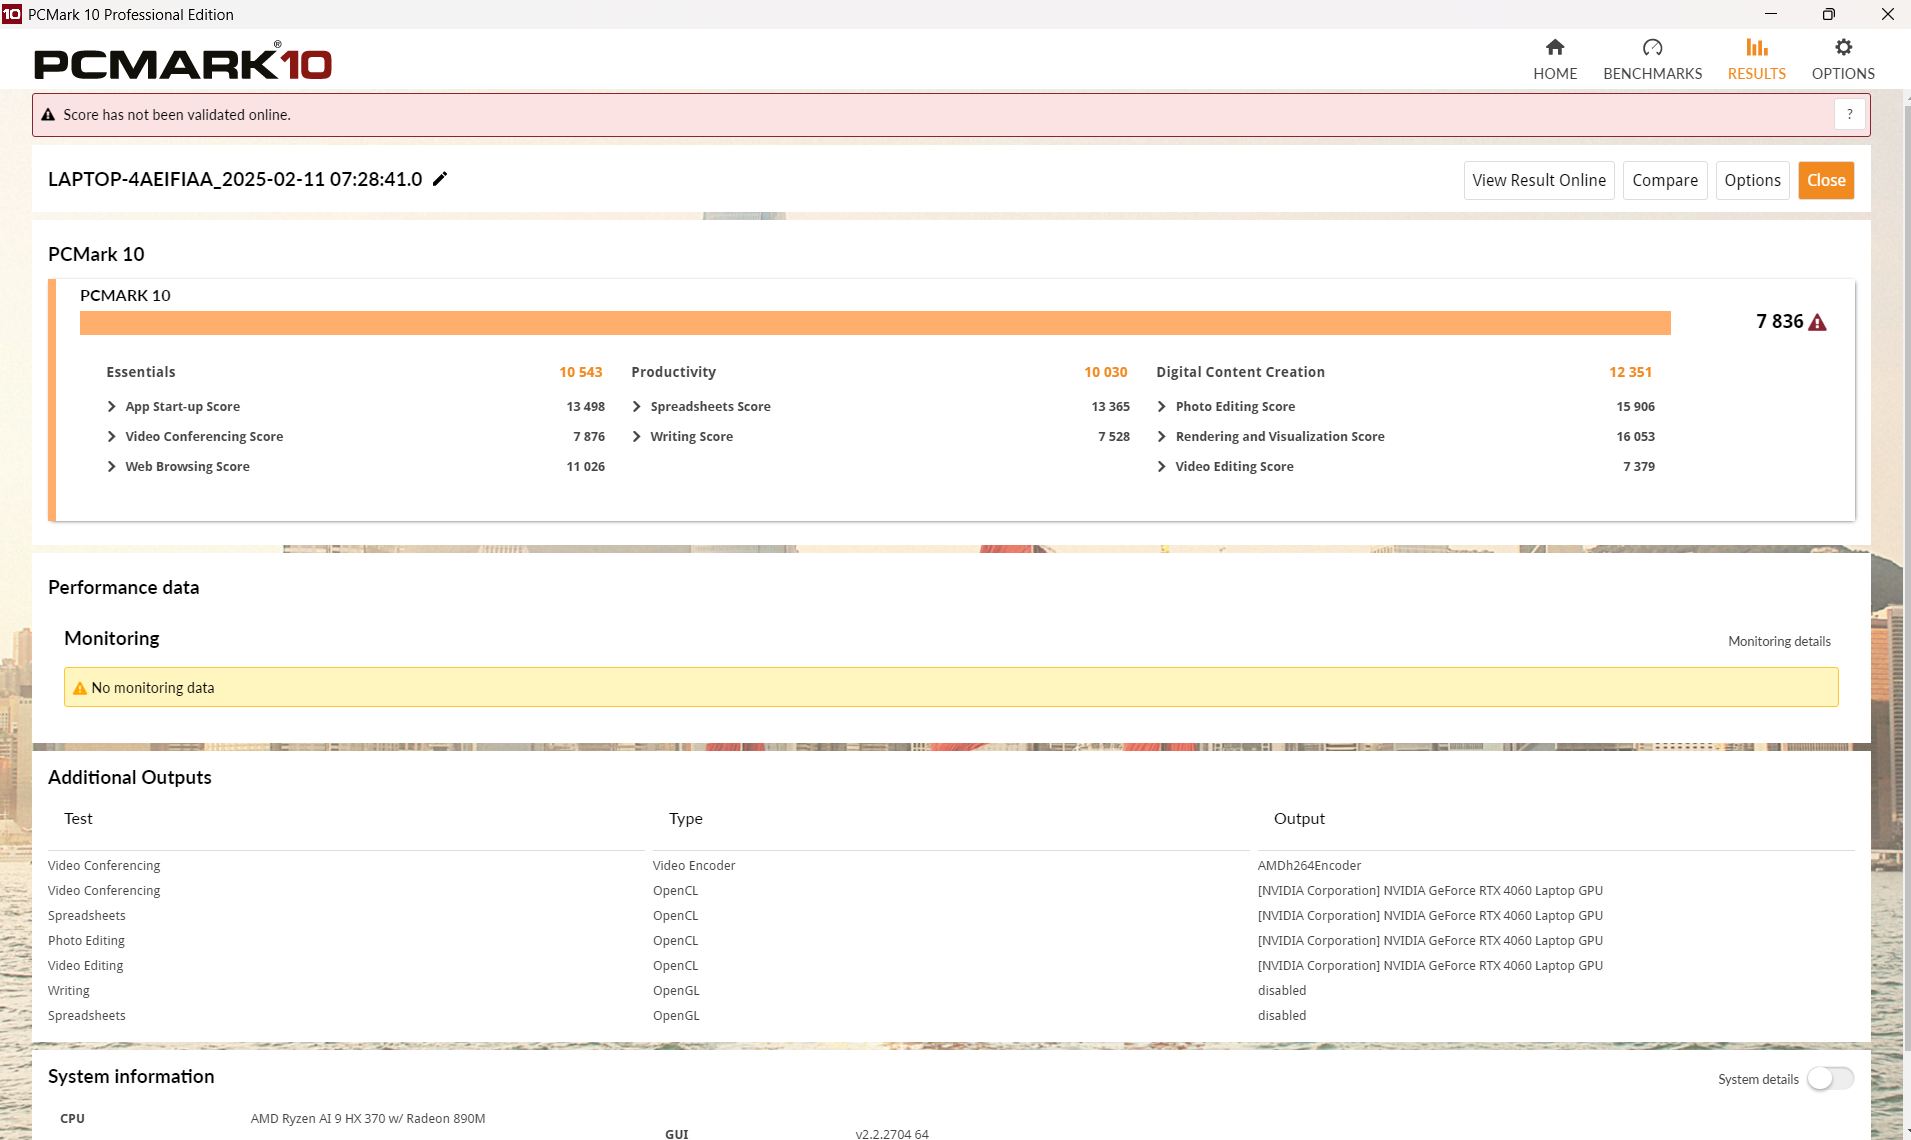
系统性能
该系统主观上运行流畅,PCMark 10 的测量结果也证明了其良好的数值,但 TUF Gaming A16 的速度并不比配备 Ryzen 9 7940HS和 Radeon RX 7600S.CrossMark 也是如此。
而 AIDA 内存值则非常不错。
CrossMark: Overall | Productivity | Creativity | Responsiveness
WebXPRT 3: Overall
WebXPRT 4: Overall
Mozilla Kraken 1.1: Total
| PCMark 10 / Score | |
| Lenovo Legion Pro 5 16IRX9 G9 | |
| Asus TUF Gaming A16 FA617XS | |
| Average of class Gaming (5776 - 9852, n=132, last 2 years) | |
| Asus TUF Gaming A16 FA608WV | |
| Average AMD Ryzen AI 9 HX 370, NVIDIA GeForce RTX 4060 Laptop GPU (7645 - 7915, n=3) | |
| Acer Nitro V 16 ANV16-41-R5AT | |
| HP Victus 16 (2024) | |
| Dell G16, i7-13650HX, RTX 4060 | |
| PCMark 10 / Essentials | |
| Lenovo Legion Pro 5 16IRX9 G9 | |
| Asus TUF Gaming A16 FA617XS | |
| HP Victus 16 (2024) | |
| Average of class Gaming (9057 - 12600, n=132, last 2 years) | |
| Asus TUF Gaming A16 FA608WV | |
| Average AMD Ryzen AI 9 HX 370, NVIDIA GeForce RTX 4060 Laptop GPU (10140 - 10543, n=3) | |
| Acer Nitro V 16 ANV16-41-R5AT | |
| Dell G16, i7-13650HX, RTX 4060 | |
| PCMark 10 / Productivity | |
| Asus TUF Gaming A16 FA617XS | |
| Dell G16, i7-13650HX, RTX 4060 | |
| Asus TUF Gaming A16 FA608WV | |
| Average AMD Ryzen AI 9 HX 370, NVIDIA GeForce RTX 4060 Laptop GPU (9925 - 10030, n=3) | |
| HP Victus 16 (2024) | |
| Average of class Gaming (6662 - 14612, n=132, last 2 years) | |
| Lenovo Legion Pro 5 16IRX9 G9 | |
| Acer Nitro V 16 ANV16-41-R5AT | |
| PCMark 10 / Digital Content Creation | |
| Lenovo Legion Pro 5 16IRX9 G9 | |
| Average AMD Ryzen AI 9 HX 370, NVIDIA GeForce RTX 4060 Laptop GPU (12351 - 13395, n=3) | |
| Average of class Gaming (6807 - 19351, n=132, last 2 years) | |
| Asus TUF Gaming A16 FA608WV | |
| Acer Nitro V 16 ANV16-41-R5AT | |
| Asus TUF Gaming A16 FA617XS | |
| Dell G16, i7-13650HX, RTX 4060 | |
| HP Victus 16 (2024) | |
| CrossMark / Overall | |
| Lenovo Legion Pro 5 16IRX9 G9 | |
| HP Victus 16 (2024) | |
| Average of class Gaming (1247 - 2344, n=112, last 2 years) | |
| Dell G16, i7-13650HX, RTX 4060 | |
| Asus TUF Gaming A16 FA617XS | |
| Asus TUF Gaming A16 FA608WV | |
| Average AMD Ryzen AI 9 HX 370, NVIDIA GeForce RTX 4060 Laptop GPU (1710 - 1819, n=3) | |
| CrossMark / Productivity | |
| Lenovo Legion Pro 5 16IRX9 G9 | |
| Average of class Gaming (1299 - 2204, n=112, last 2 years) | |
| HP Victus 16 (2024) | |
| Dell G16, i7-13650HX, RTX 4060 | |
| Asus TUF Gaming A16 FA617XS | |
| Average AMD Ryzen AI 9 HX 370, NVIDIA GeForce RTX 4060 Laptop GPU (1574 - 1637, n=3) | |
| Asus TUF Gaming A16 FA608WV | |
| CrossMark / Creativity | |
| Lenovo Legion Pro 5 16IRX9 G9 | |
| Average AMD Ryzen AI 9 HX 370, NVIDIA GeForce RTX 4060 Laptop GPU (2077 - 2264, n=3) | |
| Asus TUF Gaming A16 FA608WV | |
| HP Victus 16 (2024) | |
| Average of class Gaming (1275 - 2660, n=112, last 2 years) | |
| Dell G16, i7-13650HX, RTX 4060 | |
| Asus TUF Gaming A16 FA617XS | |
| CrossMark / Responsiveness | |
| Lenovo Legion Pro 5 16IRX9 G9 | |
| HP Victus 16 (2024) | |
| Average of class Gaming (1030 - 2330, n=112, last 2 years) | |
| Dell G16, i7-13650HX, RTX 4060 | |
| Asus TUF Gaming A16 FA617XS | |
| Asus TUF Gaming A16 FA608WV | |
| Average AMD Ryzen AI 9 HX 370, NVIDIA GeForce RTX 4060 Laptop GPU (1226 - 1385, n=3) | |
| WebXPRT 3 / Overall | |
| Acer Nitro V 16 ANV16-41-R5AT | |
| Average of class Gaming (215 - 480, n=127, last 2 years) | |
| Lenovo Legion Pro 5 16IRX9 G9 | |
| Average AMD Ryzen AI 9 HX 370, NVIDIA GeForce RTX 4060 Laptop GPU (274 - 288, n=2) | |
| HP Victus 16 (2024) | |
| Asus TUF Gaming A16 FA608WV | |
| Dell G16, i7-13650HX, RTX 4060 | |
| WebXPRT 4 / Overall | |
| Lenovo Legion Pro 5 16IRX9 G9 | |
| Asus TUF Gaming A16 FA608WV | |
| Average of class Gaming (176.4 - 336, n=113, last 2 years) | |
| Asus TUF Gaming A16 FA617XS | |
| Average AMD Ryzen AI 9 HX 370, NVIDIA GeForce RTX 4060 Laptop GPU (252 - 271, n=3) | |
| HP Victus 16 (2024) | |
| Acer Nitro V 16 ANV16-41-R5AT | |
| Mozilla Kraken 1.1 / Total | |
| HP Victus 16 (2024) | |
| Acer Nitro V 16 ANV16-41-R5AT | |
| Dell G16, i7-13650HX, RTX 4060 | |
| Asus TUF Gaming A16 FA617XS | |
| Average of class Gaming (405 - 674, n=140, last 2 years) | |
| Lenovo Legion Pro 5 16IRX9 G9 | |
| Average AMD Ryzen AI 9 HX 370, NVIDIA GeForce RTX 4060 Laptop GPU (430 - 450, n=3) | |
| Asus TUF Gaming A16 FA608WV | |
* ... smaller is better
| PCMark 10 Score | 7836 points | |
Help | ||
| AIDA64 / Memory Copy | |
| Asus TUF Gaming A16 FA608WV | |
| Average AMD Ryzen AI 9 HX 370 (72702 - 93640, n=16) | |
| Lenovo Legion Pro 5 16IRX9 G9 | |
| HP Victus 16 (2024) | |
| Average of class Gaming (21750 - 97515, n=149, last 2 years) | |
| Acer Nitro V 16 ANV16-41-R5AT | |
| Asus TUF Gaming A16 FA617XS | |
| Dell G16, i7-13650HX, RTX 4060 | |
| AIDA64 / Memory Read | |
| Asus TUF Gaming A16 FA608WV | |
| Average AMD Ryzen AI 9 HX 370 (84635 - 102937, n=16) | |
| Lenovo Legion Pro 5 16IRX9 G9 | |
| HP Victus 16 (2024) | |
| Average of class Gaming (22956 - 102937, n=149, last 2 years) | |
| Dell G16, i7-13650HX, RTX 4060 | |
| Asus TUF Gaming A16 FA617XS | |
| Acer Nitro V 16 ANV16-41-R5AT | |
| AIDA64 / Memory Write | |
| Asus TUF Gaming A16 FA608WV | |
| Average AMD Ryzen AI 9 HX 370 (83907 - 108954, n=16) | |
| Acer Nitro V 16 ANV16-41-R5AT | |
| Lenovo Legion Pro 5 16IRX9 G9 | |
| Asus TUF Gaming A16 FA617XS | |
| Average of class Gaming (22297 - 108954, n=149, last 2 years) | |
| HP Victus 16 (2024) | |
| Dell G16, i7-13650HX, RTX 4060 | |
| AIDA64 / Memory Latency | |
| Asus TUF Gaming A16 FA608WV | |
| Average AMD Ryzen AI 9 HX 370 (87.2 - 119.4, n=16) | |
| Average of class Gaming (59.5 - 259, n=149, last 2 years) | |
| HP Victus 16 (2024) | |
| Dell G16, i7-13650HX, RTX 4060 | |
| Asus TUF Gaming A16 FA617XS | |
| Acer Nitro V 16 ANV16-41-R5AT | |
| Lenovo Legion Pro 5 16IRX9 G9 | |
* ... smaller is better
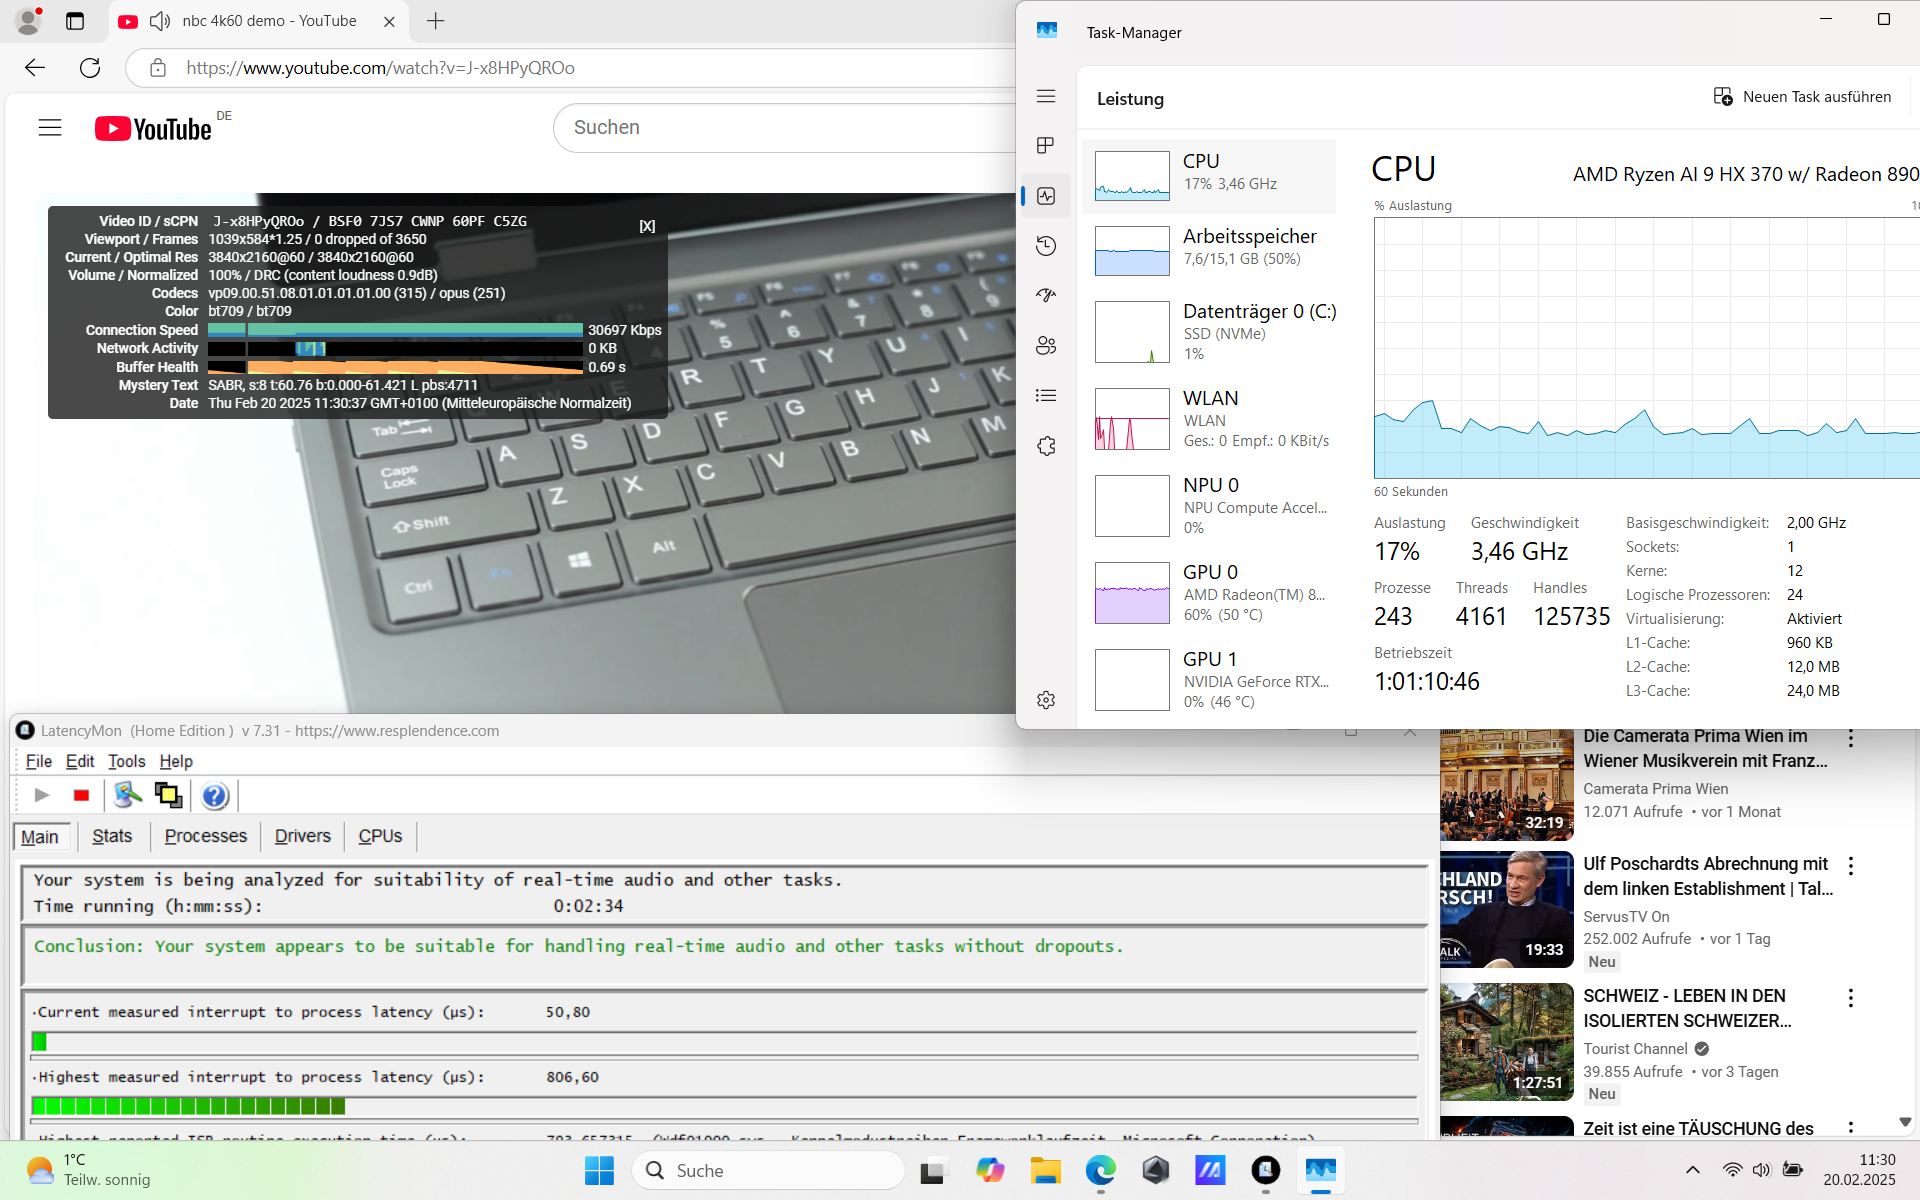
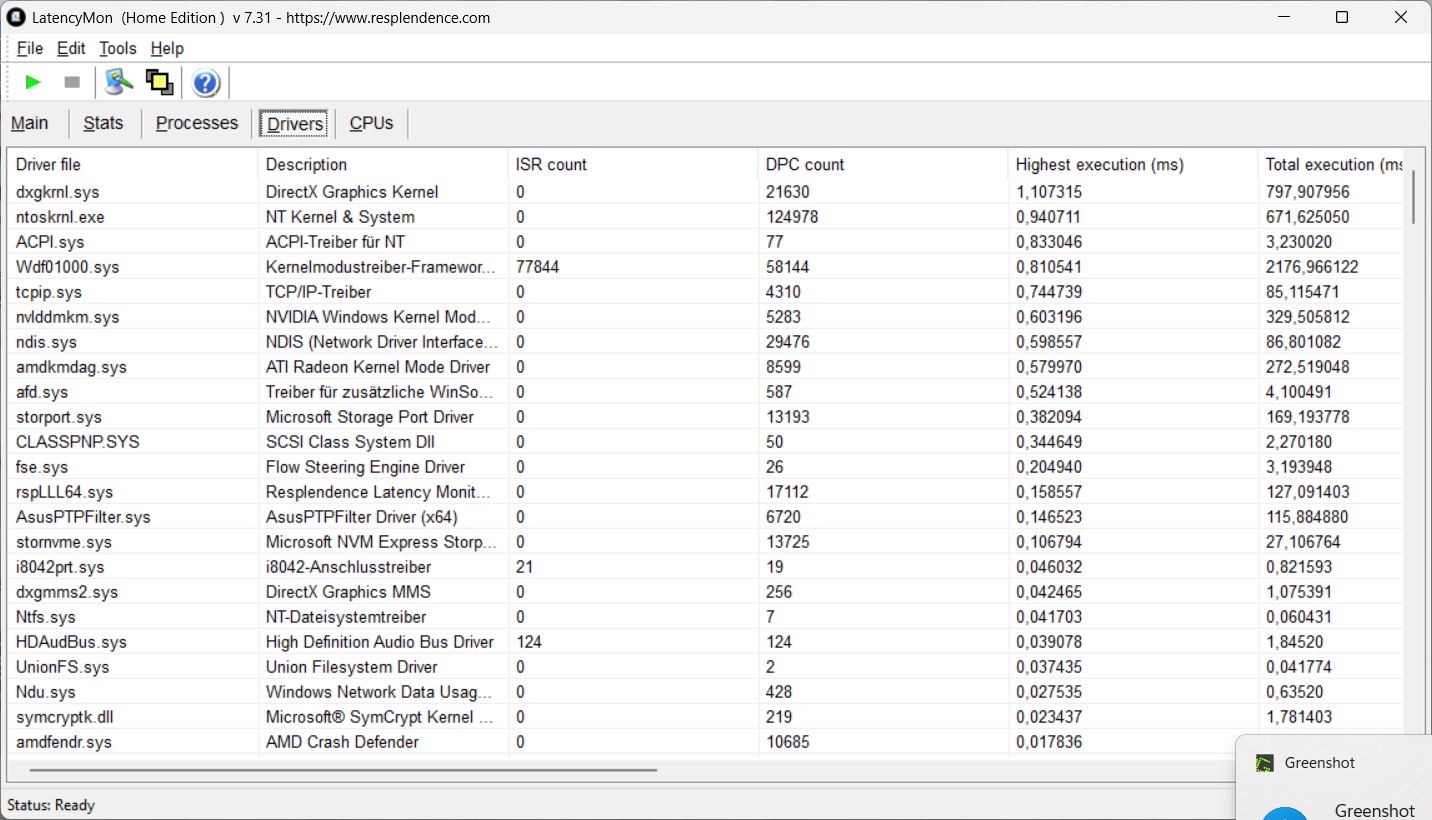
DPC 延迟
无论是打开浏览器还是打开多个标签页,都没有明显的延迟。播放 4K/60 fps 的 YouTube 测试视频也相当流畅。只有在启动 Prime95 时才会出现较高的延迟。

| DPC Latencies / LatencyMon - interrupt to process latency (max), Web, Youtube, Prime95 | |
| Acer Nitro V 16 ANV16-41-R5AT | |
| Asus TUF Gaming A16 FA608WV | |
| Asus TUF Gaming A16 FA617XS | |
| Dell G16, i7-13650HX, RTX 4060 | |
| Lenovo Legion Pro 5 16IRX9 G9 | |
| HP Victus 16 (2024) | |
* ... smaller is better
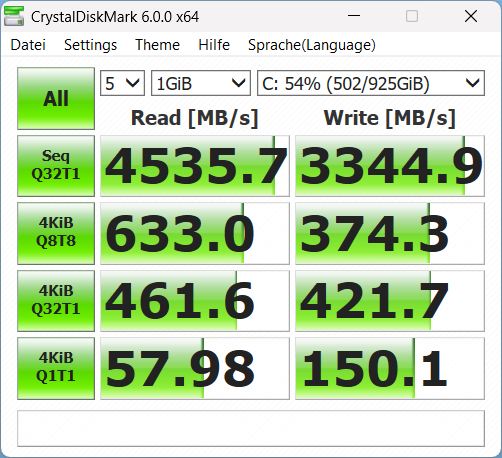
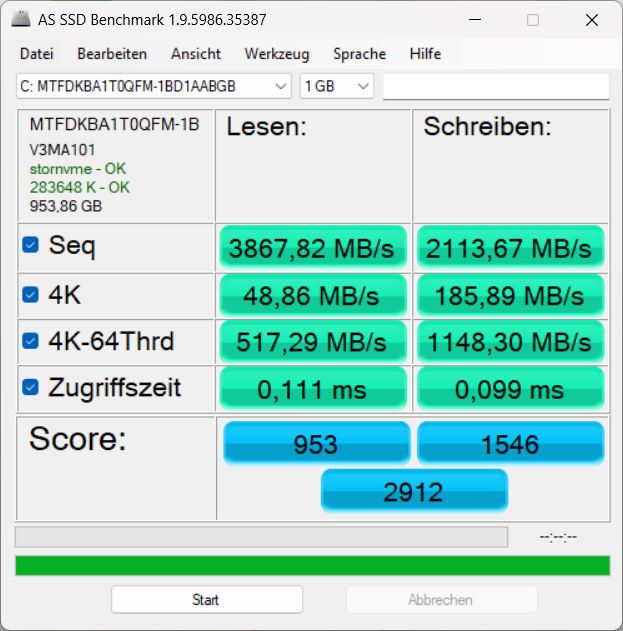
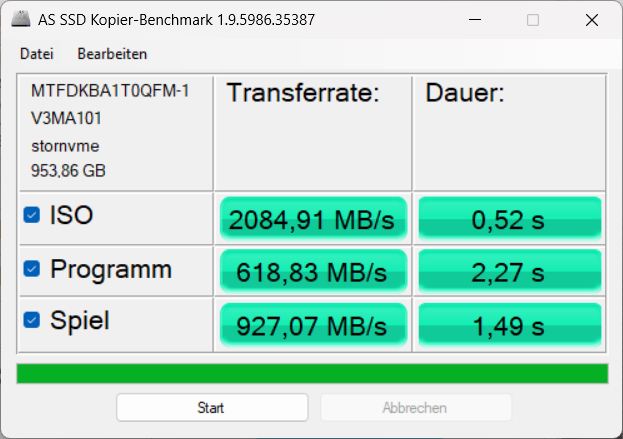
大容量存储器
遗憾的是,在我们的测试机型中,1 TB 的美光固态硬盘并不令人信服,它没有达到预期的性能,而且比上一代产品要慢。尽管如此,性能还是非常稳定的。

* ... smaller is better
Disk throttling: DiskSpd Read Loop, Queue Depth 8
图形卡
骁龙 660 Nvidia Geforce RTX 4060TUF Gaming A16 中的 Nvidia Geforce RTX 4060 在 3DMarks 中的表现比平均水平高出约 6%。不过,至少在游戏中 Legion Pro 5明显领先。在电池模式下,A16 的 3D 性能足足下降了 75%,这是在另一次 3DMarkFire Strike 测试中测得的结果。
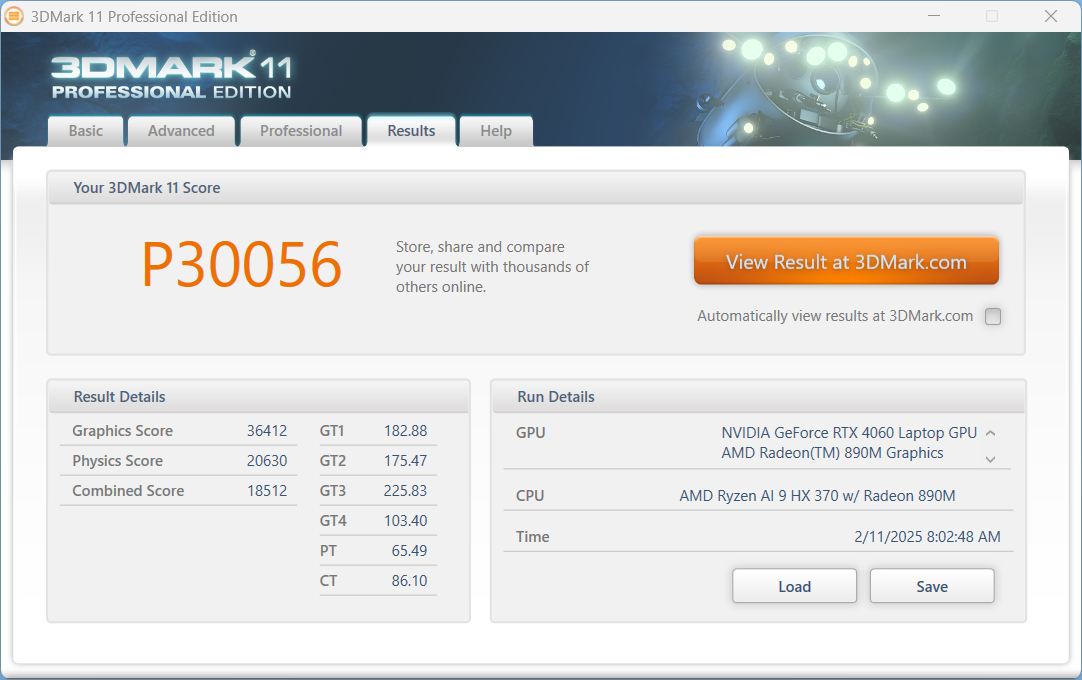
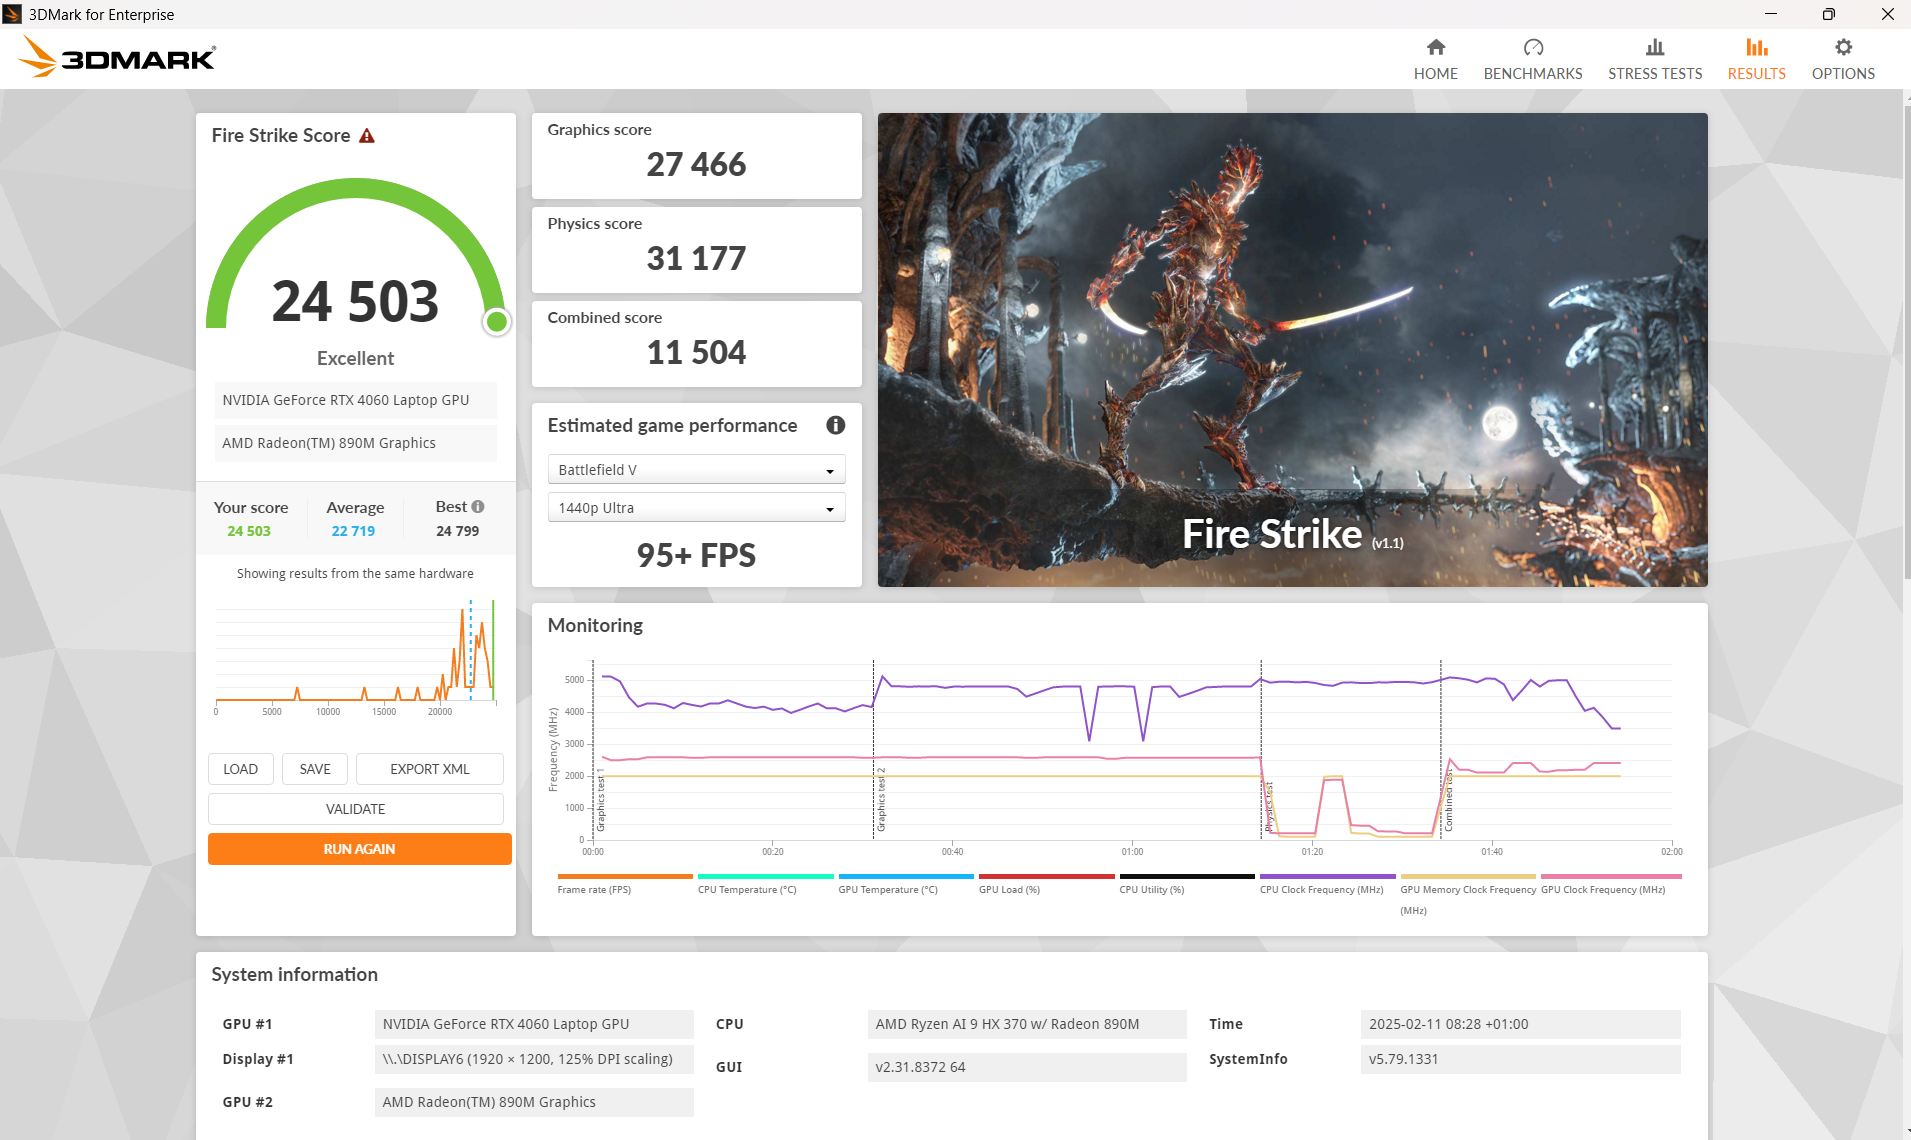
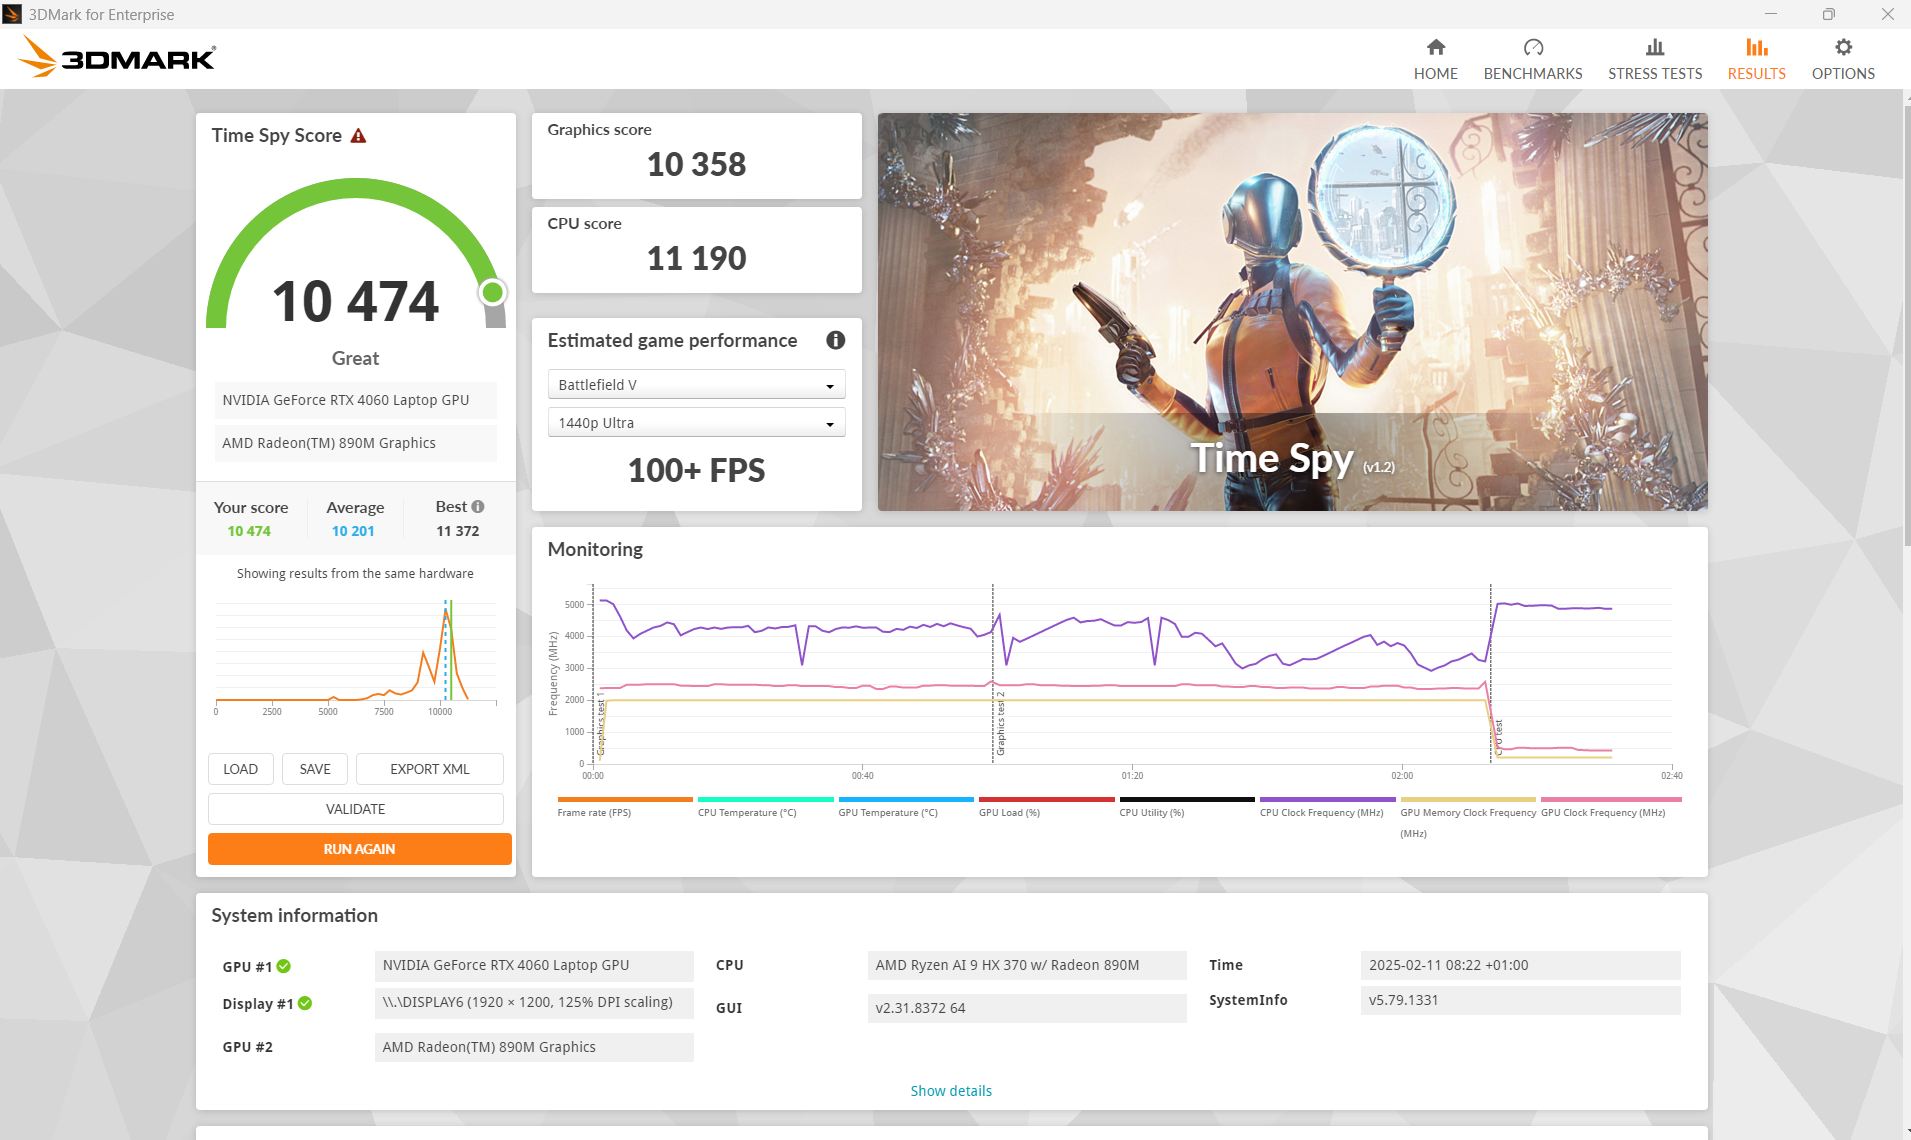
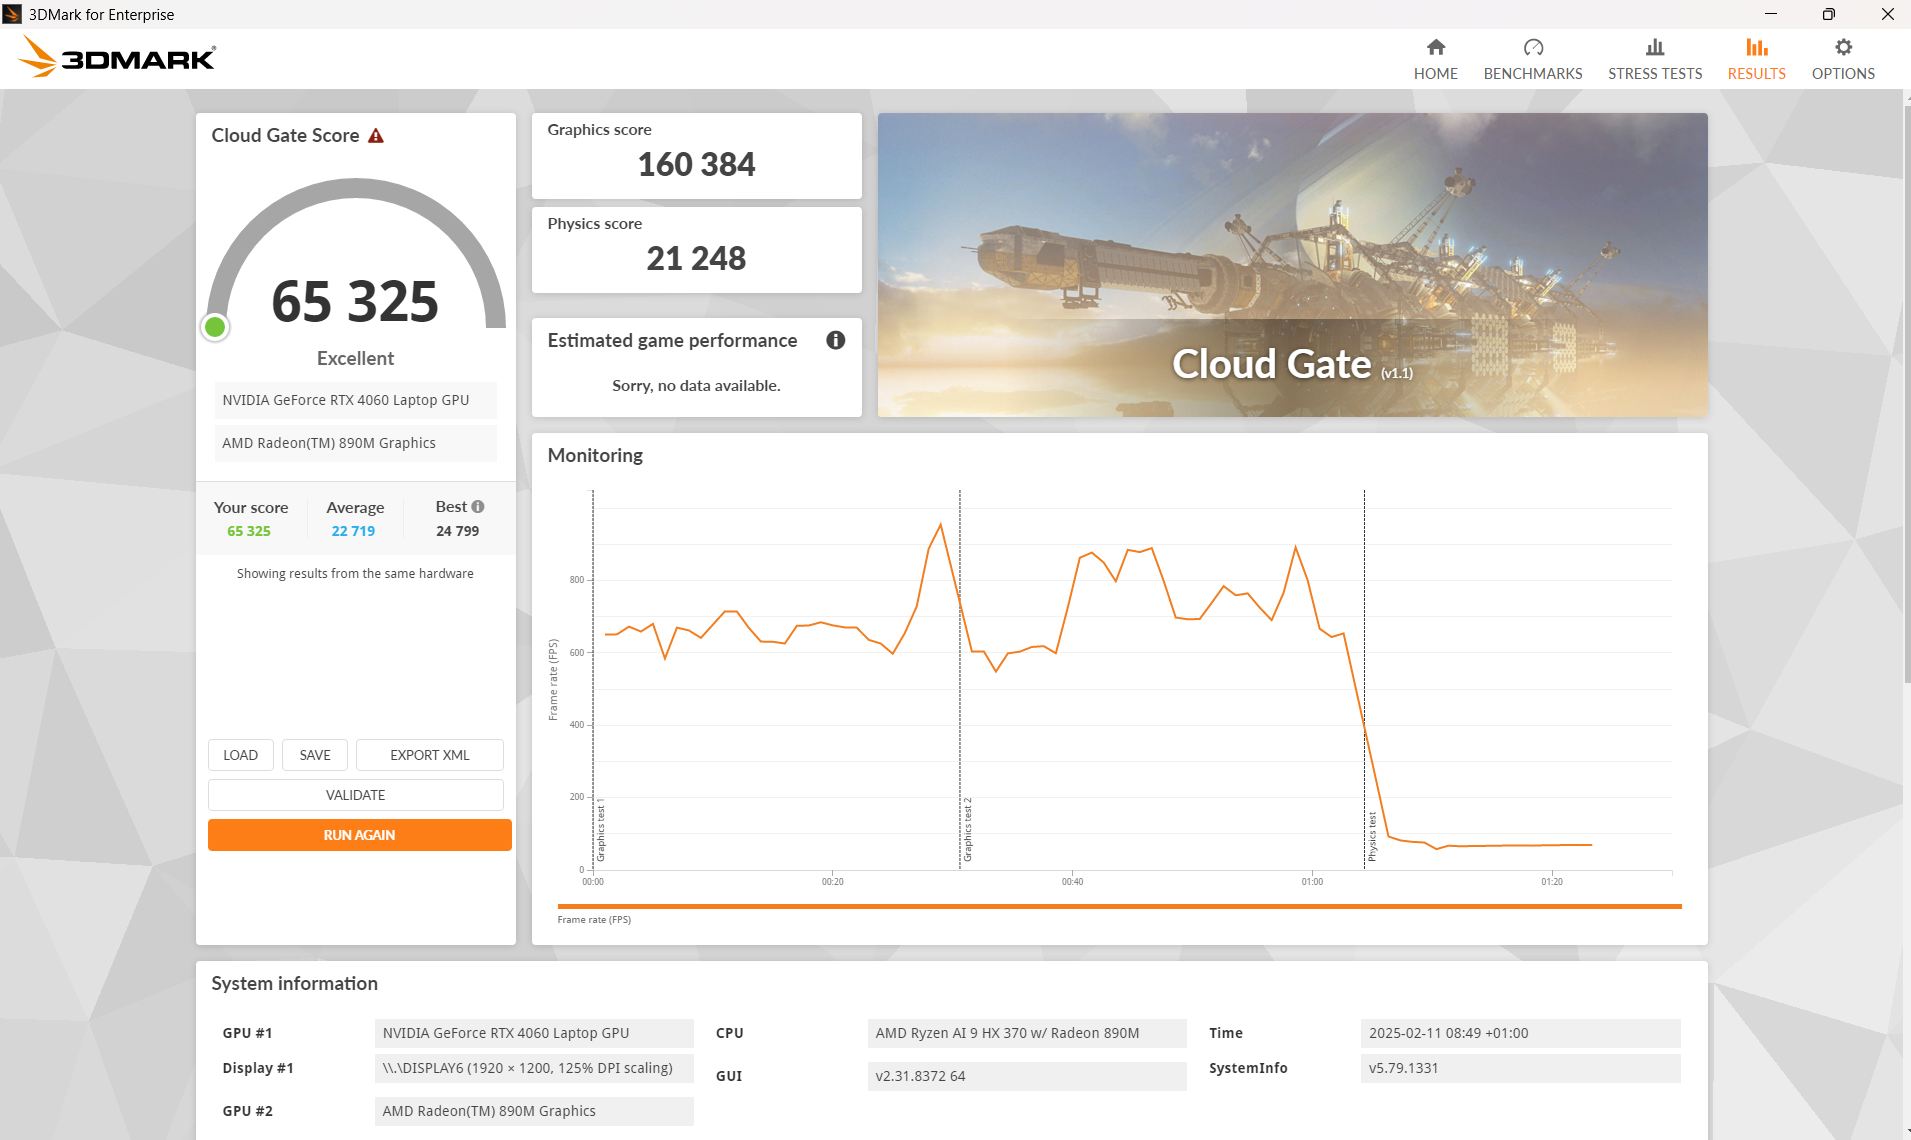
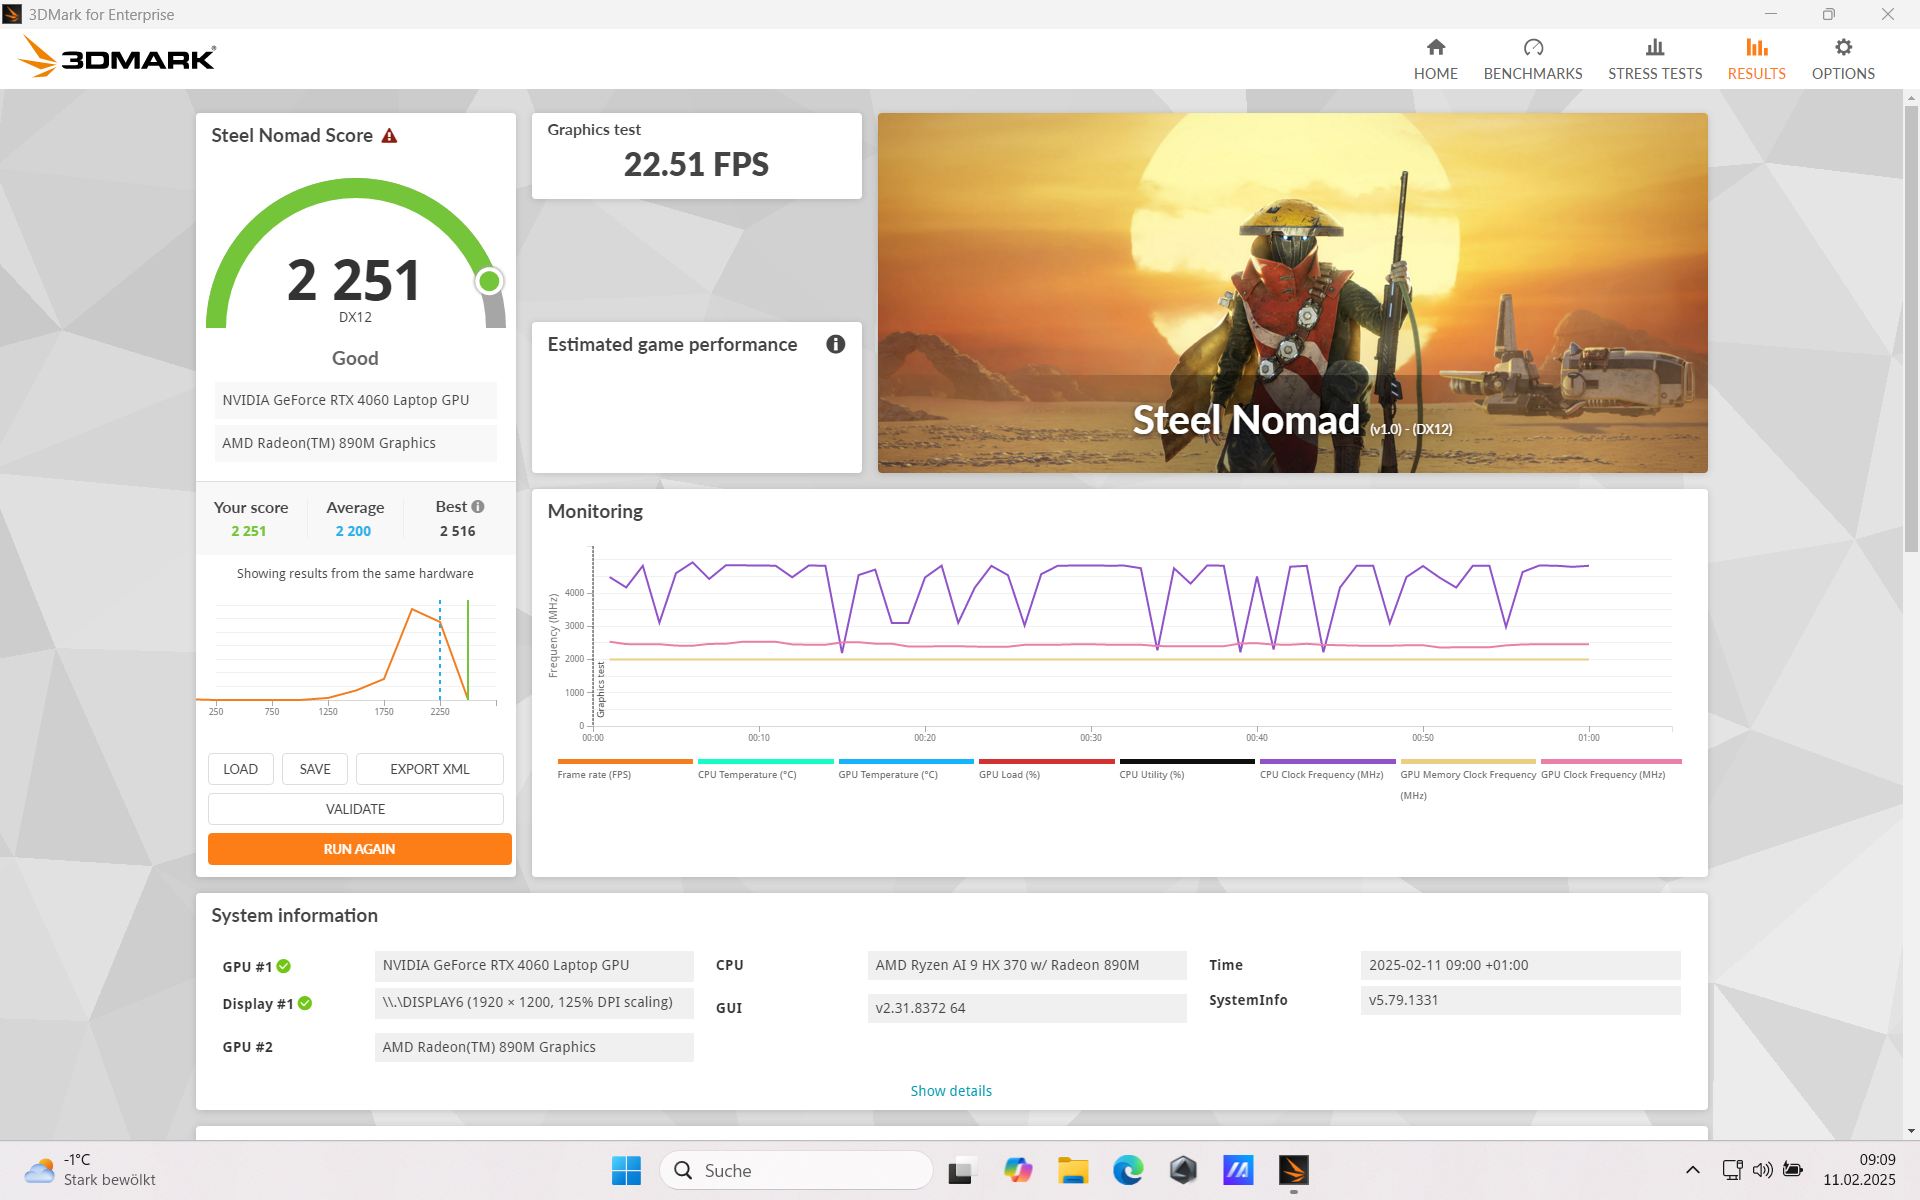
| 3DMark 11 Performance | 30056 points | |
| 3DMark Cloud Gate Standard Score | 65325 points | |
| 3DMark Fire Strike Score | 24503 points | |
| 3DMark Time Spy Score | 10474 points | |
| 3DMark Steel Nomad Score | 2251 points | |
Help | ||
* ... smaller is better
| Cyberpunk 2077 2.2 Phantom Liberty - 1920x1080 Ultra Preset (FSR off) | |
| Average of class Gaming (6.76 - 158, n=93, last 2 years) | |
| Lenovo Legion Pro 5 16IRX9 G9 | |
| Asus TUF Gaming A16 FA608WV | |
| Dell G16, i7-13650HX, RTX 4060 | |
| HP Victus 16 (2024) | |
| Acer Nitro V 16 ANV16-41-R5AT | |
| Baldur's Gate 3 - 1920x1080 Ultra Preset | |
| Average of class Gaming (34.5 - 212, n=60, last 2 years) | |
| Asus TUF Gaming A16 FA608WV | |
| Acer Nitro V 16 ANV16-41-R5AT | |
| Lenovo Legion Pro 5 16IRX9 G9 | |
| GTA V - 1920x1080 Highest Settings possible AA:4xMSAA + FX AF:16x | |
| Lenovo Legion Pro 5 16IRX9 G9 | |
| Dell G16, i7-13650HX, RTX 4060 | |
| Asus TUF Gaming A16 FA608WV | |
| Average of class Gaming (12.1 - 168.2, n=129, last 2 years) | |
| HP Victus 16 (2024) | |
| Acer Nitro V 16 ANV16-41-R5AT | |
| Asus TUF Gaming A16 FA617XS | |
| Final Fantasy XV Benchmark - 1920x1080 High Quality | |
| Average of class Gaming (19.2 - 210, n=143, last 2 years) | |
| Lenovo Legion Pro 5 16IRX9 G9 | |
| Dell G16, i7-13650HX, RTX 4060 | |
| Asus TUF Gaming A16 FA608WV | |
| HP Victus 16 (2024) | |
| Acer Nitro V 16 ANV16-41-R5AT | |
| Asus TUF Gaming A16 FA617XS | |
| Dota 2 Reborn - 1920x1080 ultra (3/3) best looking | |
| Lenovo Legion Pro 5 16IRX9 G9 | |
| HP Victus 16 (2024) | |
| Average of class Gaming (65.1 - 220, n=147, last 2 years) | |
| Dell G16, i7-13650HX, RTX 4060 | |
| Asus TUF Gaming A16 FA608WV | |
| Acer Nitro V 16 ANV16-41-R5AT | |
| Asus TUF Gaming A16 FA617XS | |
Cyberpunk 2077 1080p Ultra FPS chart
| low | med. | high | ultra | |
|---|---|---|---|---|
| GTA V (2015) | 179 | 177 | 170.7 | 114 |
| Dota 2 Reborn (2015) | 166.9 | 145.9 | 141.7 | 136.2 |
| Final Fantasy XV Benchmark (2018) | 179.7 | 139.6 | 102.5 | |
| X-Plane 11.11 (2018) | 95.3 | 86 | 69.9 | |
| Strange Brigade (2018) | 415 | 281 | 224 | 191.9 |
| Baldur's Gate 3 (2023) | 144 | 115 | 103 | 99 |
| Cyberpunk 2077 2.2 Phantom Liberty (2023) | 117.8 | 100.2 | 86.9 | 75.6 |
| F1 24 (2024) | 177.4 | 61.6 |
排放与能源:相对安静、凉爽的 TUF Gaming A16
噪音排放
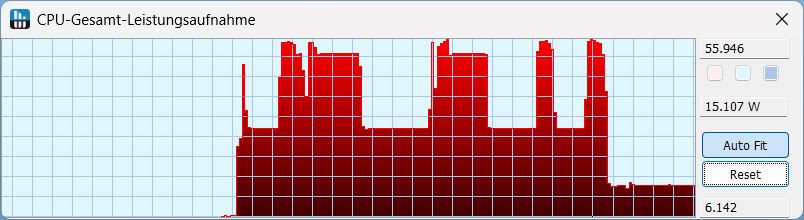
风扇在空闲时基本处于关闭状态,只有在涡轮增压模式下才开始发出 29 分贝(A)的低声。在压力测试中,风扇噪音在 36 至 39 dB(A)之间。这种变化是周期性的、渐进的,没有任何脉动。
在 Turbo 模式下,TUF Gaming A16 的噪音确实明显增大,但 3D 性能却很难从中受益。
| 赛博朋克 2077 | 静音 | 性能 | 涡轮增压 |
|---|---|---|---|
| 噪音水平,单位 dB(A) | 30.7 | 36.23 | 50.97 |
| 平均帧数 | 59.6 | 68.8 | 69.4 |
Noise Level
| Idle |
| 23 / 23 / 29.11 dB(A) |
| Load |
| 31 / 39.44 dB(A) |
 | ||
30 dB silent 40 dB(A) audible 50 dB(A) loud |
||
min: | ||
| Asus TUF Gaming A16 FA608WV NVIDIA GeForce RTX 4060 Laptop GPU, Ryzen AI 9 HX 370, Micron 2400 MTFDKBA1T0QFM | Asus TUF Gaming A16 FA617XS Radeon RX 7600S, R9 7940HS, Micron 2400 MTFDKBA512QFM | Lenovo Legion Pro 5 16IRX9 G9 NVIDIA GeForce RTX 4060 Laptop GPU, i7-14700HX, Samsung PM9A1 MZVL21T0HCLR | Dell G16, i7-13650HX, RTX 4060 NVIDIA GeForce RTX 4060 Laptop GPU, i7-13650HX, WD PC SN740 SDDPNQD-1T00 | HP Victus 16 (2024) NVIDIA GeForce RTX 4060 Laptop GPU, i7-14700HX, Kioxia XG8 KXG80ZNV512G | Acer Nitro V 16 ANV16-41-R5AT NVIDIA GeForce RTX 4060 Laptop GPU, R7 8845HS, Micron 2550 1TB | |
|---|---|---|---|---|---|---|
| Noise | -17% | -16% | -1% | -23% | -30% | |
| off / environment * | 23 | 25 -9% | 23 -0% | 23 -0% | 25 -9% | 25 -9% |
| Idle Minimum * | 23 | 25 -9% | 23 -0% | 23 -0% | 28 -22% | 25 -9% |
| Idle Average * | 23 | 26 -13% | 23 -0% | 23 -0% | 29 -26% | 28 -22% |
| Idle Maximum * | 29.11 | 28 4% | 25 14% | 27.96 4% | 33 -13% | 37 -27% |
| Load Average * | 31 | 43 -39% | 45.18 -46% | 27.96 10% | 45 -45% | 51 -65% |
| Cyberpunk 2077 ultra * | 36.23 | 52.69 -45% | 54 -49% | |||
| Load Maximum * | 39.44 | 53 -34% | 53.13 -35% | 47.89 -21% | 48 -22% | 52 -32% |
| Witcher 3 ultra * | 51 | 47.89 | 43 |
* ... smaller is better
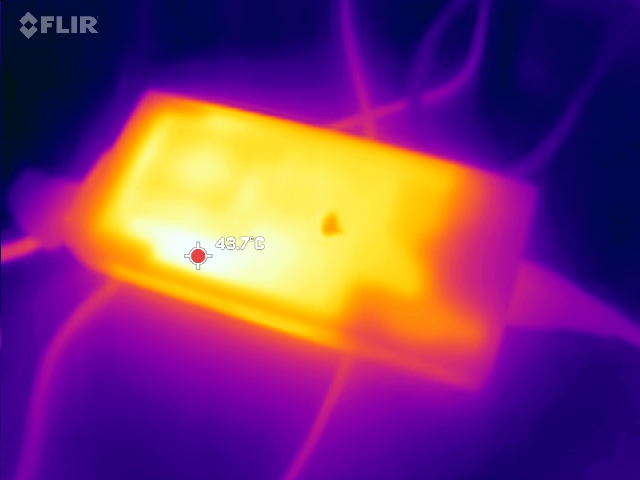
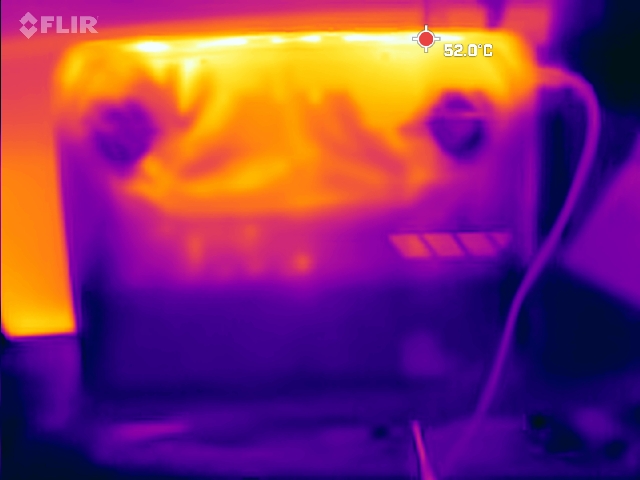
温度
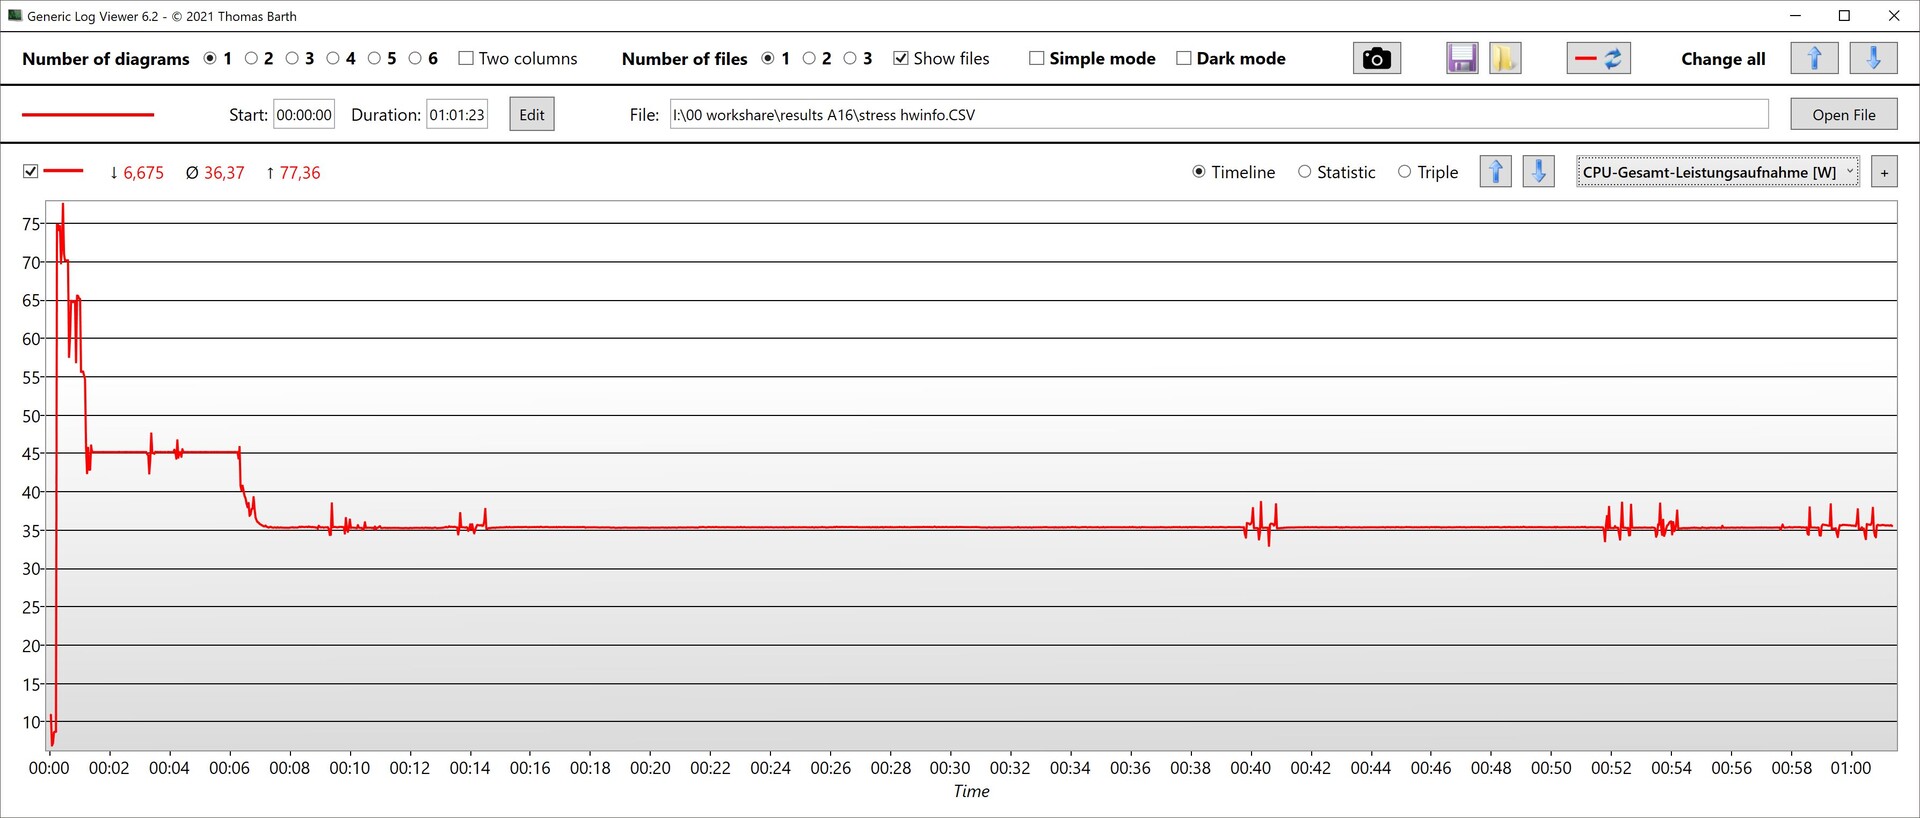
即使在压力测试中,A16 也能保持相当低的温度,这也与 CPU 的 TDP 很快从 80 W 左右降至恒定的 35 W 有关。
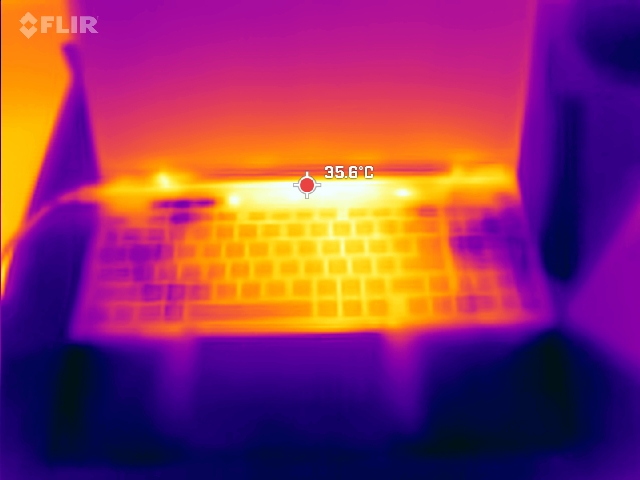
虽然显示屏中心的温度略高,但掌托和 WASD 键的温度从低温到微温不等。

(+) The maximum temperature on the upper side is 38 °C / 100 F, compared to the average of 40.4 °C / 105 F, ranging from 21.2 to 68.8 °C for the class Gaming.
(+) The bottom heats up to a maximum of 37 °C / 99 F, compared to the average of 43.2 °C / 110 F
(+) In idle usage, the average temperature for the upper side is 24.7 °C / 76 F, compared to the device average of 33.9 °C / 93 F.
(+) 3: The average temperature for the upper side is 30.8 °C / 87 F, compared to the average of 33.9 °C / 93 F for the class Gaming.
(+) The palmrests and touchpad are cooler than skin temperature with a maximum of 22 °C / 71.6 F and are therefore cool to the touch.
(+) The average temperature of the palmrest area of similar devices was 28.9 °C / 84 F (+6.9 °C / 12.4 F).
| Asus TUF Gaming A16 FA608WV AMD Ryzen AI 9 HX 370, NVIDIA GeForce RTX 4060 Laptop GPU | Asus TUF Gaming A16 FA617XS AMD Ryzen 9 7940HS, AMD Radeon RX 7600S | Lenovo Legion Pro 5 16IRX9 G9 Intel Core i7-14700HX, NVIDIA GeForce RTX 4060 Laptop GPU | Dell G16, i7-13650HX, RTX 4060 Intel Core i7-13650HX, NVIDIA GeForce RTX 4060 Laptop GPU | HP Victus 16 (2024) Intel Core i7-14700HX, NVIDIA GeForce RTX 4060 Laptop GPU | Acer Nitro V 16 ANV16-41-R5AT AMD Ryzen 7 8845HS, NVIDIA GeForce RTX 4060 Laptop GPU | |
|---|---|---|---|---|---|---|
| Heat | -19% | -36% | -32% | -11% | -19% | |
| Maximum Upper Side * | 38 | 53 -39% | 50 -32% | 49 -29% | 50 -32% | 41 -8% |
| Maximum Bottom * | 37 | 48 -30% | 57 -54% | 58 -57% | 50 -35% | 49 -32% |
| Idle Upper Side * | 28 | 30 -7% | 36 -29% | 35 -25% | 25 11% | 32 -14% |
| Idle Bottom * | 30 | 30 -0% | 39 -30% | 35 -17% | 26 13% | 37 -23% |
* ... smaller is better
扬声器
扬声器声音略小,低音不足,但高音均衡。3.5 毫米插孔可连接外部音频设备。
Asus TUF Gaming A16 FA608WV audio analysis
(±) | speaker loudness is average but good (79.84 dB)
Bass 100 - 315 Hz
(-) | nearly no bass - on average 18.3% lower than median
(+) | bass is linear (6.8% delta to prev. frequency)
Mids 400 - 2000 Hz
(±) | higher mids - on average 5.6% higher than median
(+) | mids are linear (5.5% delta to prev. frequency)
Highs 2 - 16 kHz
(+) | balanced highs - only 4.4% away from median
(+) | highs are linear (5.4% delta to prev. frequency)
Overall 100 - 16.000 Hz
(±) | linearity of overall sound is average (18.8% difference to median)
Compared to same class
» 60% of all tested devices in this class were better, 8% similar, 31% worse
» The best had a delta of 6%, average was 18%, worst was 132%
Compared to all devices tested
» 41% of all tested devices were better, 8% similar, 51% worse
» The best had a delta of 4%, average was 24%, worst was 134%
Lenovo Legion Pro 5 16IRX9 G9 audio analysis
(±) | speaker loudness is average but good (77.13 dB)
Bass 100 - 315 Hz
(-) | nearly no bass - on average 18.3% lower than median
(±) | linearity of bass is average (12% delta to prev. frequency)
Mids 400 - 2000 Hz
(±) | higher mids - on average 6.9% higher than median
(+) | mids are linear (4.9% delta to prev. frequency)
Highs 2 - 16 kHz
(+) | balanced highs - only 4.5% away from median
(±) | linearity of highs is average (9.5% delta to prev. frequency)
Overall 100 - 16.000 Hz
(±) | linearity of overall sound is average (21.6% difference to median)
Compared to same class
» 76% of all tested devices in this class were better, 5% similar, 19% worse
» The best had a delta of 6%, average was 18%, worst was 132%
Compared to all devices tested
» 59% of all tested devices were better, 7% similar, 34% worse
» The best had a delta of 4%, average was 24%, worst was 134%
耗电量
尽管 CPU 速度更快,但空闲功耗并未增加。在中等负载(3DMark06)或游戏中也是如此,与竞争对手相比,A16 的功耗相对较低。
在压力测试中,我们测得的短时间负载峰值高达 199 W,这对于有点笨重的 240 W 电源单元来说不成问题。
| Off / Standby | |
| Idle | |
| Load |
|
Key:
min: | |
| Asus TUF Gaming A16 FA608WV Ryzen AI 9 HX 370, NVIDIA GeForce RTX 4060 Laptop GPU | Asus TUF Gaming A16 FA617XS R9 7940HS, Radeon RX 7600S | Lenovo Legion Pro 5 16IRX9 G9 i7-14700HX, NVIDIA GeForce RTX 4060 Laptop GPU | Dell G16, i7-13650HX, RTX 4060 i7-13650HX, NVIDIA GeForce RTX 4060 Laptop GPU | HP Victus 16 (2024) i7-14700HX, NVIDIA GeForce RTX 4060 Laptop GPU | Acer Nitro V 16 ANV16-41-R5AT R7 8845HS, NVIDIA GeForce RTX 4060 Laptop GPU | Average of class Gaming | |
|---|---|---|---|---|---|---|---|
| Power Consumption | 6% | -53% | -28% | -33% | 14% | -54% | |
| Idle Minimum * | 6.8 | 7 -3% | 13.7 -101% | 11 -62% | 9 -32% | 9 -32% | 13.7 ? -101% |
| Idle Average * | 12.7 | 10 21% | 17.7 -39% | 14.8 -17% | 15 -18% | 10 21% | 19.1 ? -50% |
| Idle Maximum * | 15.2 | 15 1% | 18.5 -22% | 16.8 -11% | 23 -51% | 13 14% | 26.6 ? -75% |
| Load Average * | 85 | 86 -1% | 124 -46% | 103.7 -22% | 123 -45% | 61 28% | 102.4 ? -20% |
| Cyberpunk 2077 ultra * | 145 | 229 -58% | 118.9 18% | ||||
| Cyberpunk 2077 ultra external monitor * | 143 | 224 -57% | 116.3 19% | ||||
| Load Maximum * | 199 | 172 14% | 297 -49% | 255 -28% | 241 -21% | 134 33% | 247 ? -24% |
| Witcher 3 ultra * | 160.6 | 185 | 143.7 |
* ... smaller is better
Power consumption: Cyberpunk 2077 / Stress test
Power consumption: External monitor
电池寿命
尽管价格低廉,但华硕安装的电池(90 Wh)比大多数竞争对手的电池稍大。在视频和 Wi-Fi 测试中,A16 在亮度降低的情况下仍能保持 14 小时以上的出色续航时间。
| Asus TUF Gaming A16 FA608WV Ryzen AI 9 HX 370, NVIDIA GeForce RTX 4060 Laptop GPU, 90 Wh | Asus TUF Gaming A16 FA617XS R9 7940HS, Radeon RX 7600S, 90 Wh | Lenovo Legion Pro 5 16IRX9 G9 i7-14700HX, NVIDIA GeForce RTX 4060 Laptop GPU, 80 Wh | Dell G16, i7-13650HX, RTX 4060 i7-13650HX, NVIDIA GeForce RTX 4060 Laptop GPU, 86 Wh | HP Victus 16 (2024) i7-14700HX, NVIDIA GeForce RTX 4060 Laptop GPU, 83 Wh | Acer Nitro V 16 ANV16-41-R5AT R7 8845HS, NVIDIA GeForce RTX 4060 Laptop GPU, 57 Wh | Average of class Gaming | |
|---|---|---|---|---|---|---|---|
| Battery Runtime | -29% | -49% | -51% | -40% | -58% | -45% | |
| H.264 | 884 | 746 -16% | 312 -65% | 381 -57% | 457 ? -48% | ||
| WiFi v1.3 | 853 | 745 -13% | 308 -64% | 378 -56% | 511 -40% | 356 -58% | 389 ? -54% |
| Load | 126 | 52 -59% | 105 -17% | 76 -40% | 84.7 ? -33% | ||
| Reader / Idle | 1217 | 585 ? |
Notebookcheck 总体评分
华硕 TUF Gaming A16 是一款功能强大且价格相对实惠的游戏笔记本电脑,电池续航时间长,这主要归功于 Ryzen AI 9 HX 370。它的主要弱点是 1200p 低色彩显示屏,不过幸好还有更好的选择。
Asus TUF Gaming A16 FA608WV
- 02/20/2025 v8
Christian Hintze
 Total Sustainability Score:
 Transparency
The selection of devices to be reviewed is made by our editorial team. The test sample was provided to the author as a loan by the manufacturer or retailer for the purpose of this review. The lender had no influence on this review, nor did the manufacturer receive a copy of this review before publication. There was no obligation to publish this review. We never accept compensation or payment in return for our reviews. As an independent media company, Notebookcheck is not subjected to the authority of manufacturers, retailers or publishers.
This is how Notebookcheck is testing
Every year, Notebookcheck independently reviews hundreds of laptops and smartphones using standardized procedures to ensure that all results are comparable. We have continuously developed our test methods for around 20 years and set industry standards in the process. In our test labs, high-quality measuring equipment is utilized by experienced technicians and editors. These tests involve a multi-stage validation process. Our complex rating system is based on hundreds of well-founded measurements and benchmarks, which maintains objectivity. Further information on our test methods can be found here.
