

华硕 VivoBook 18 笔记本电脑评测:不到 1,000 美元的显示屏怪物
有待改进。
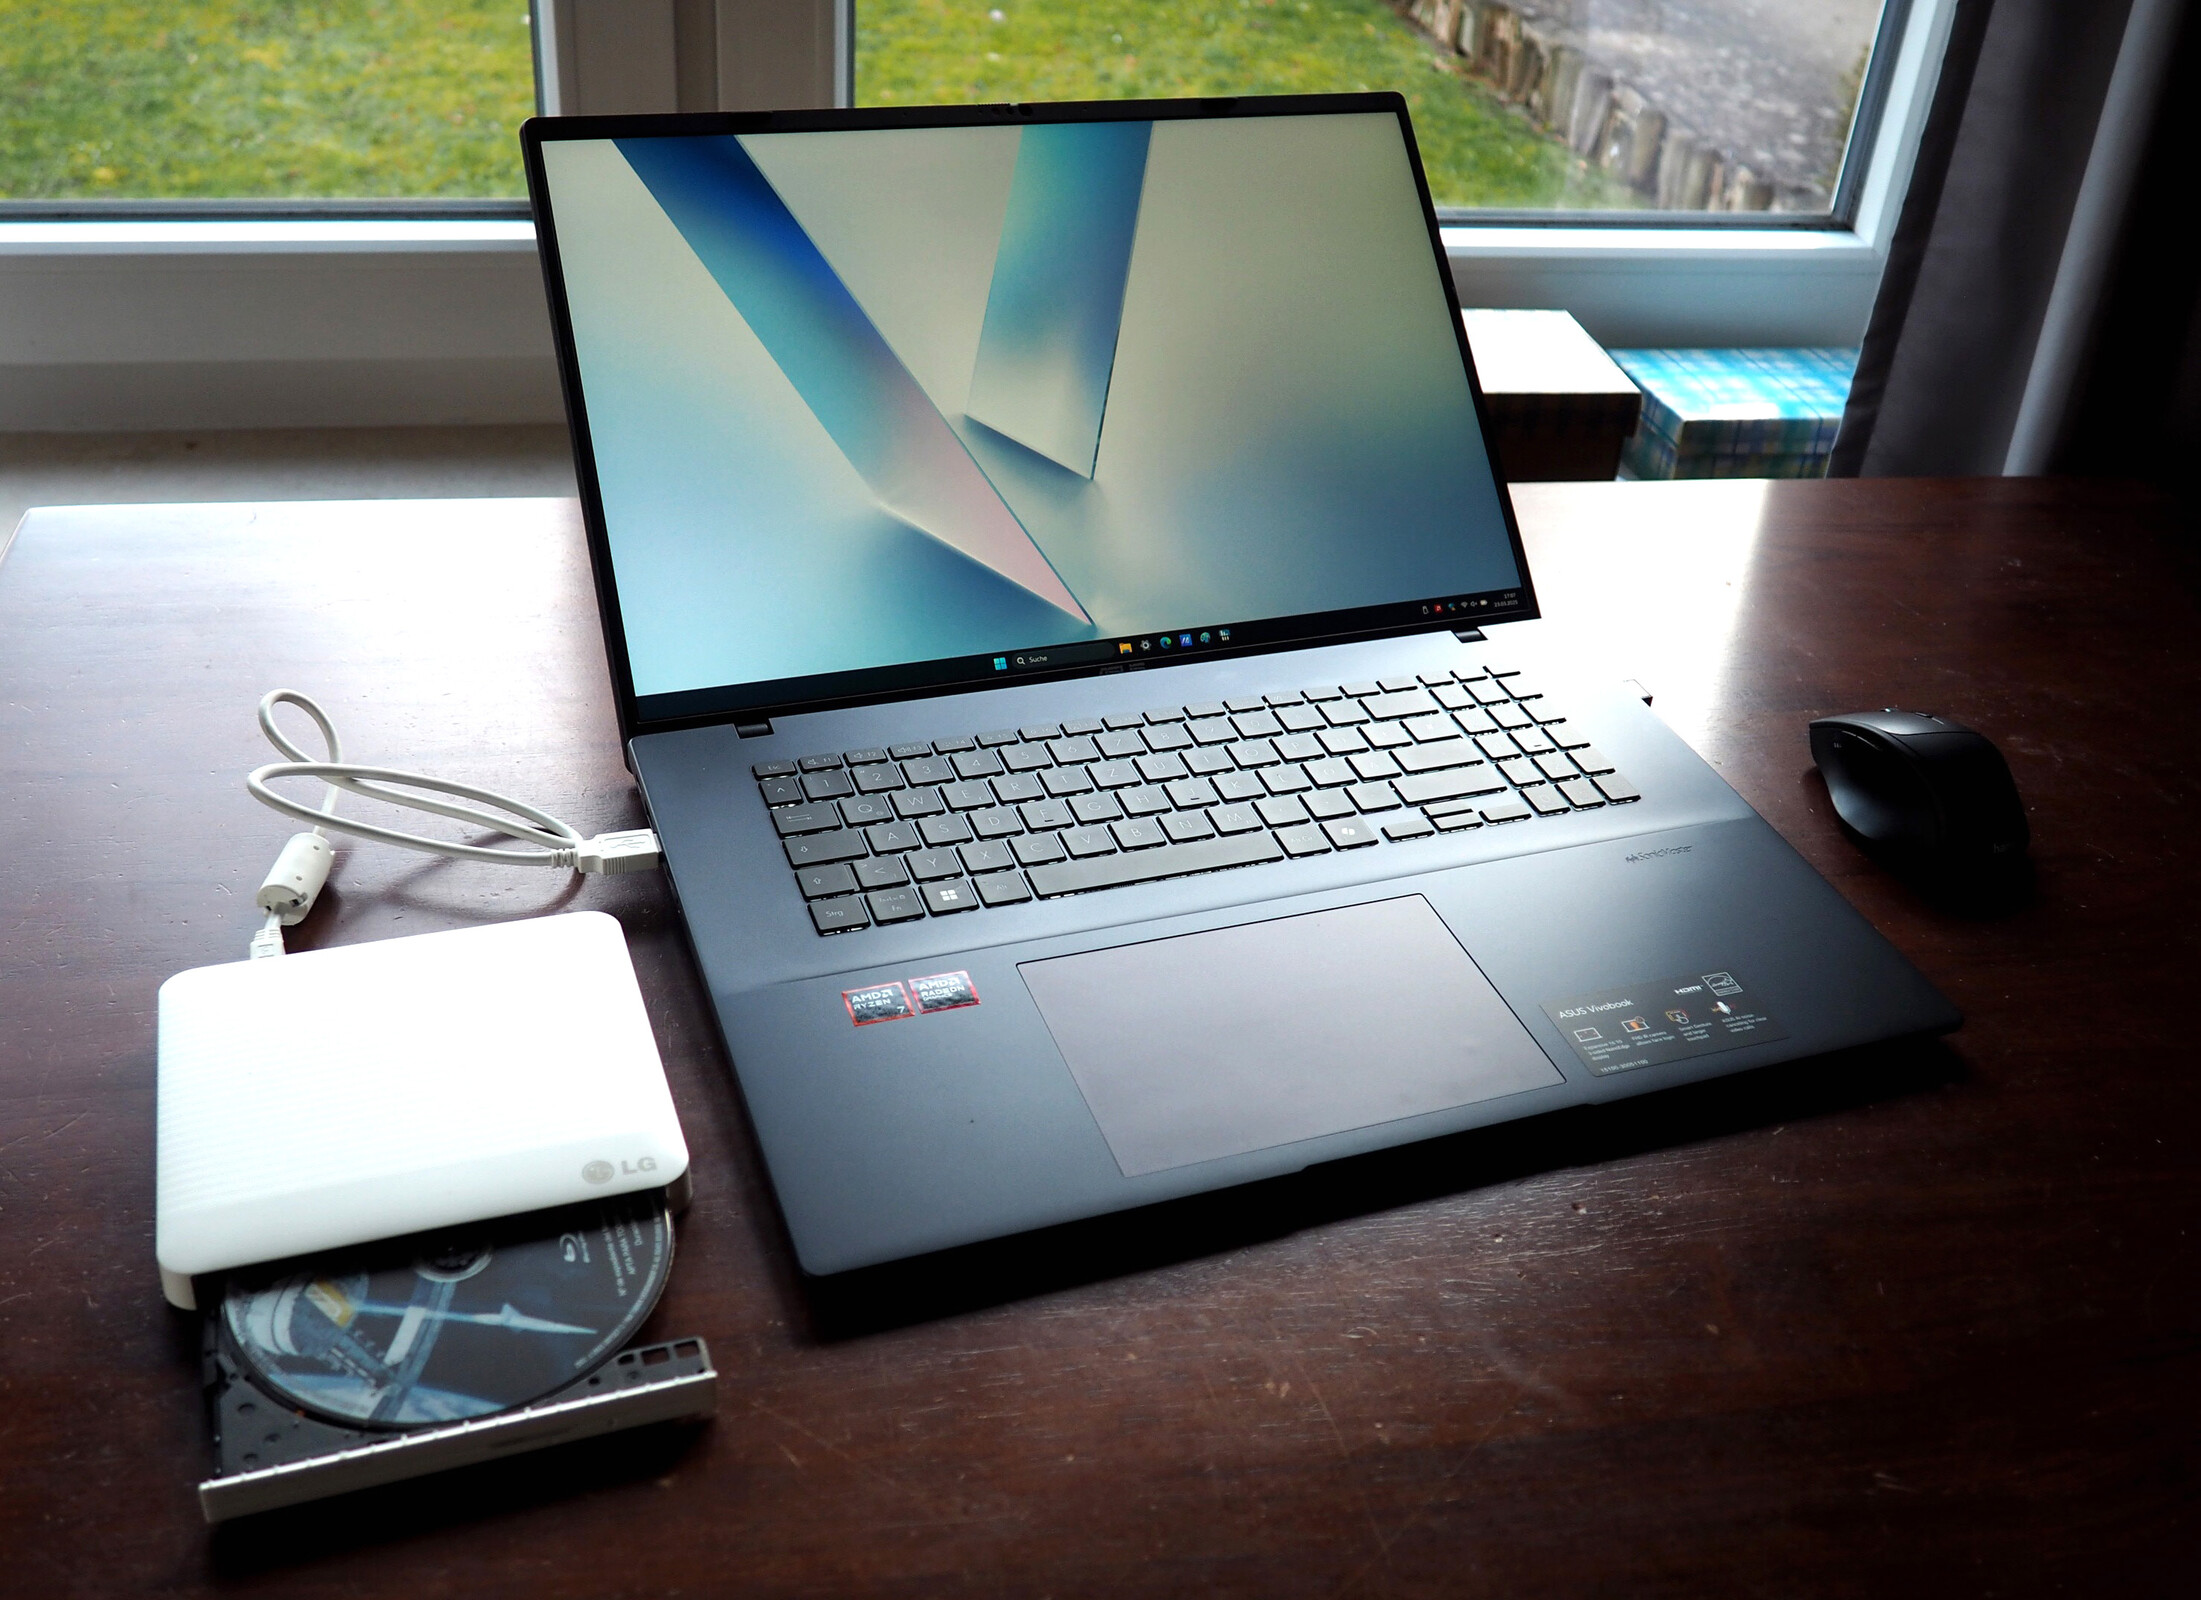
随着 VivoBook 18 的发布,华硕将自己定位在了 18 英寸笔记本电脑的利基市场,但与竞争对手不同的是,它没有配备 dGPU。您可以在我们的评测中了解这一概念是否可行。Florian Glaser, 👁 Florian Glaser (translated by DeepL / Ninh Duy) Published 🇺🇸 🇩🇪 ...
结论 - 市场空白,但仍有改进空间
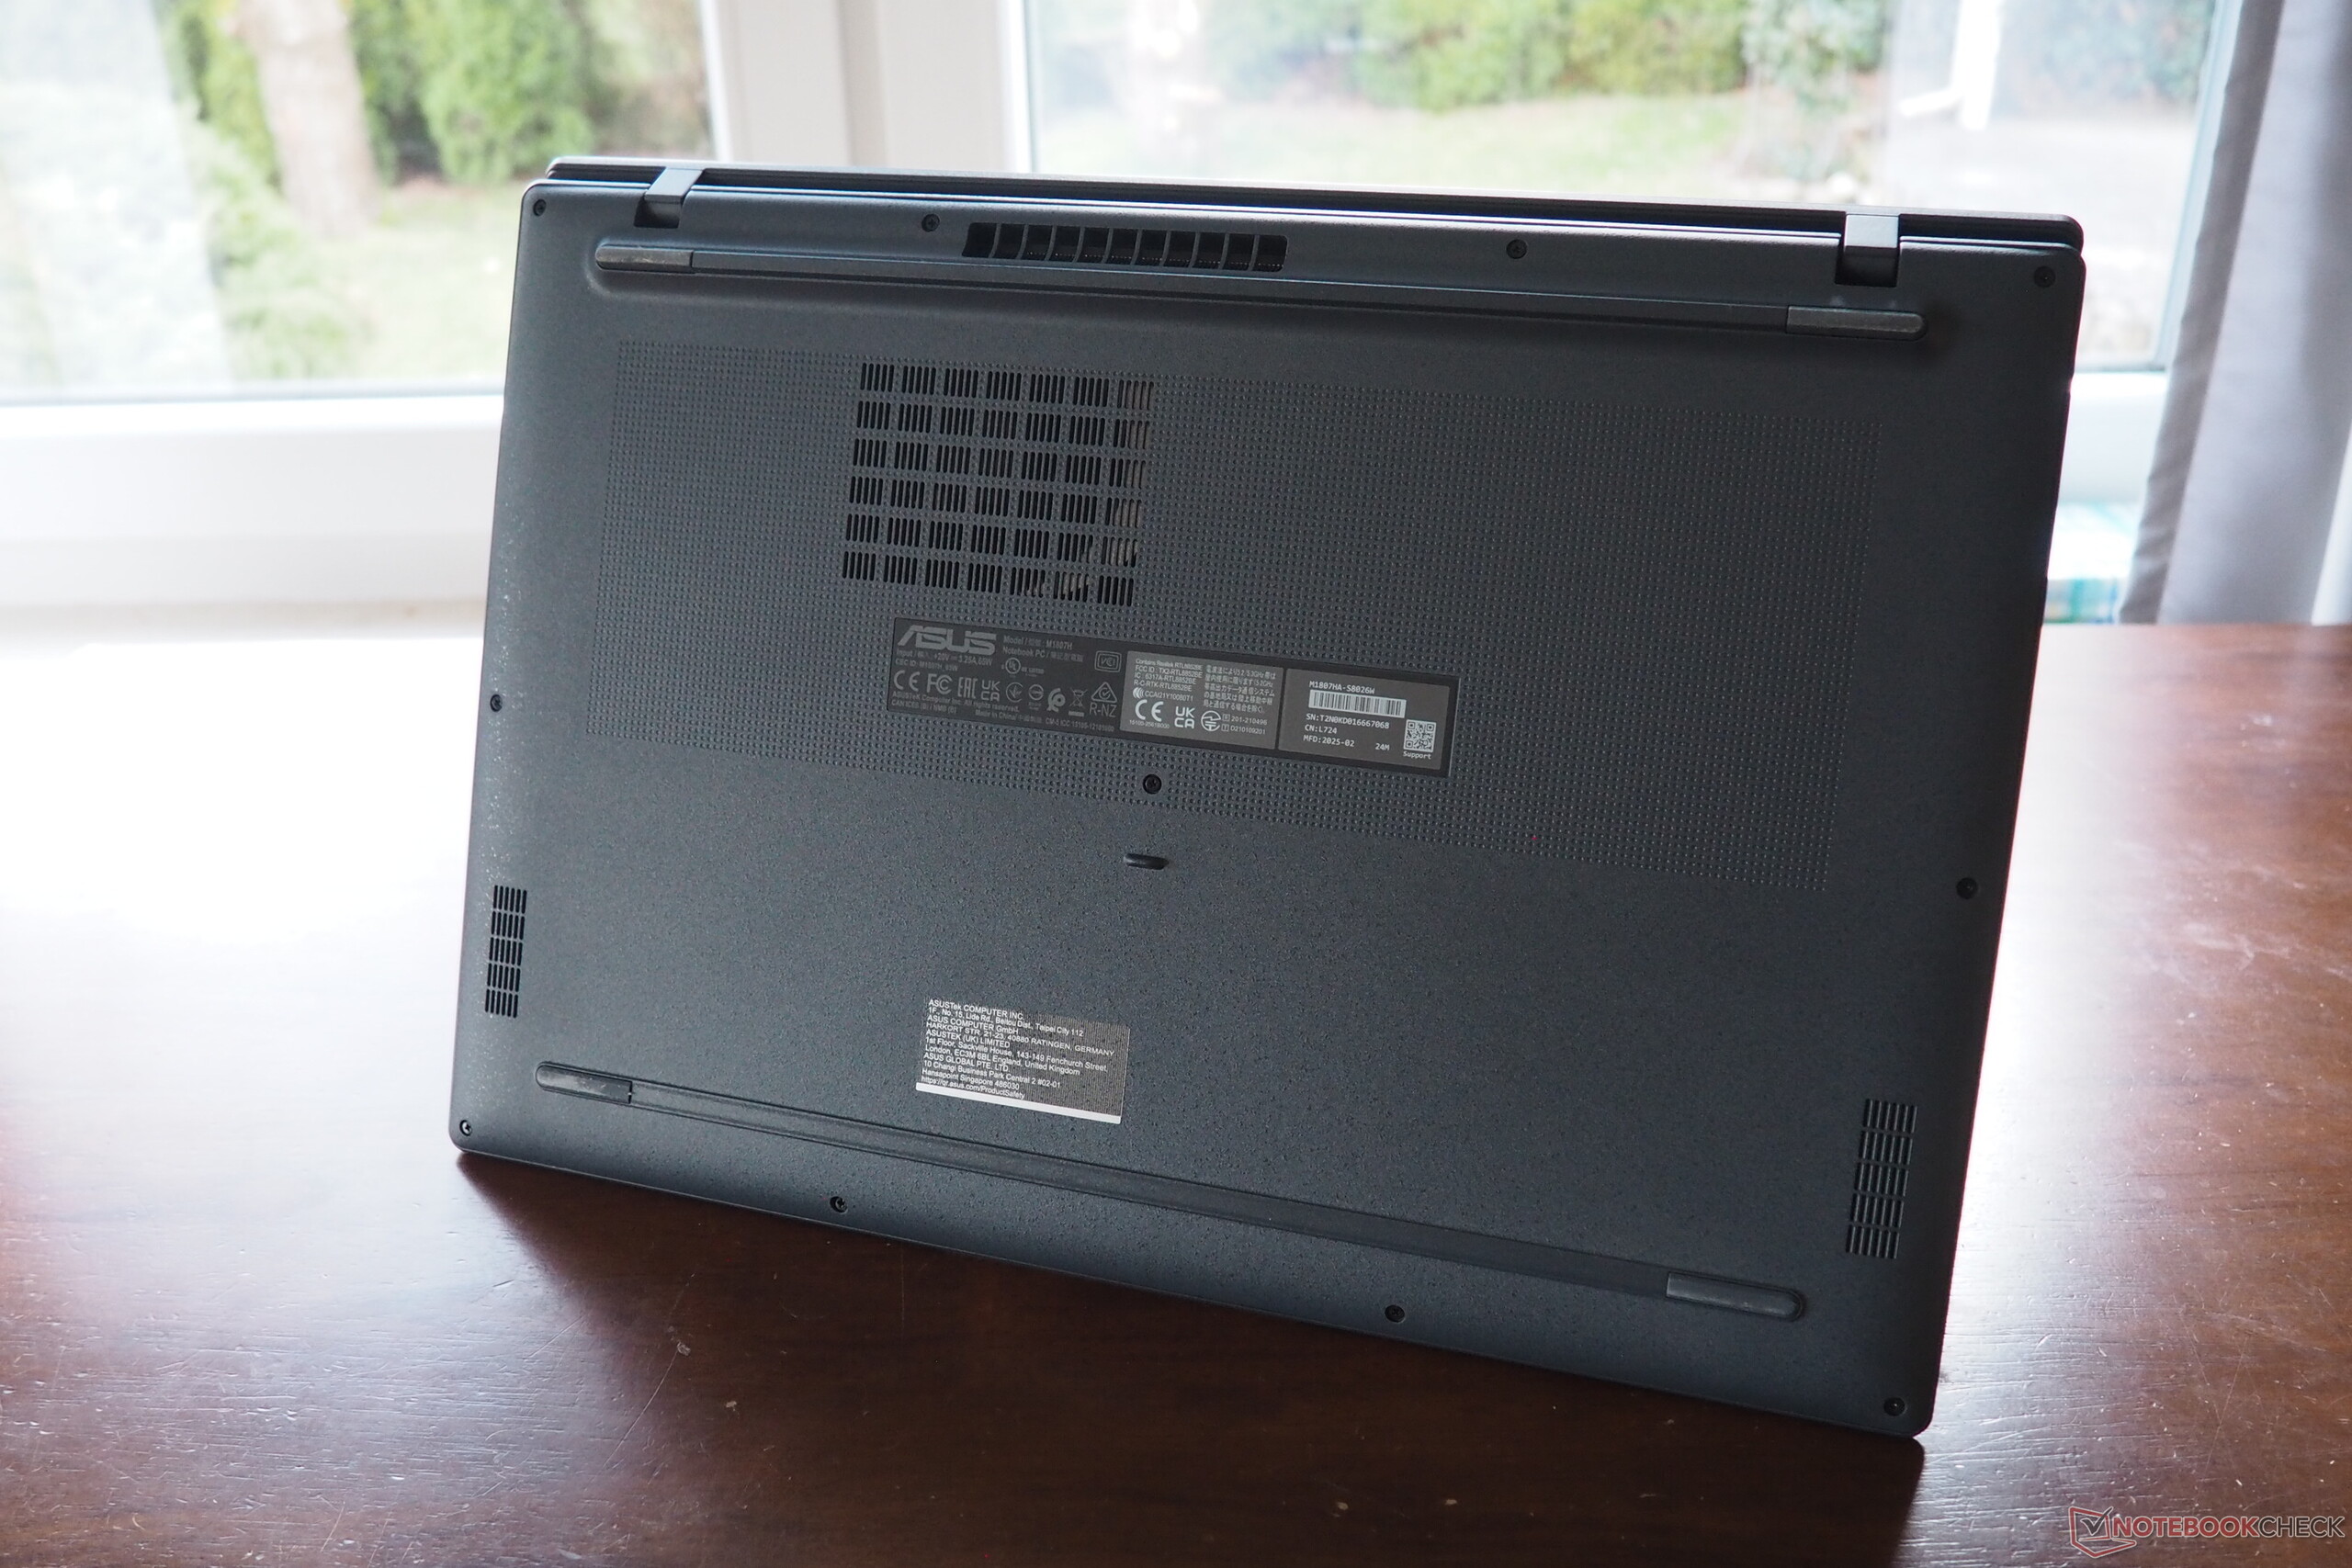
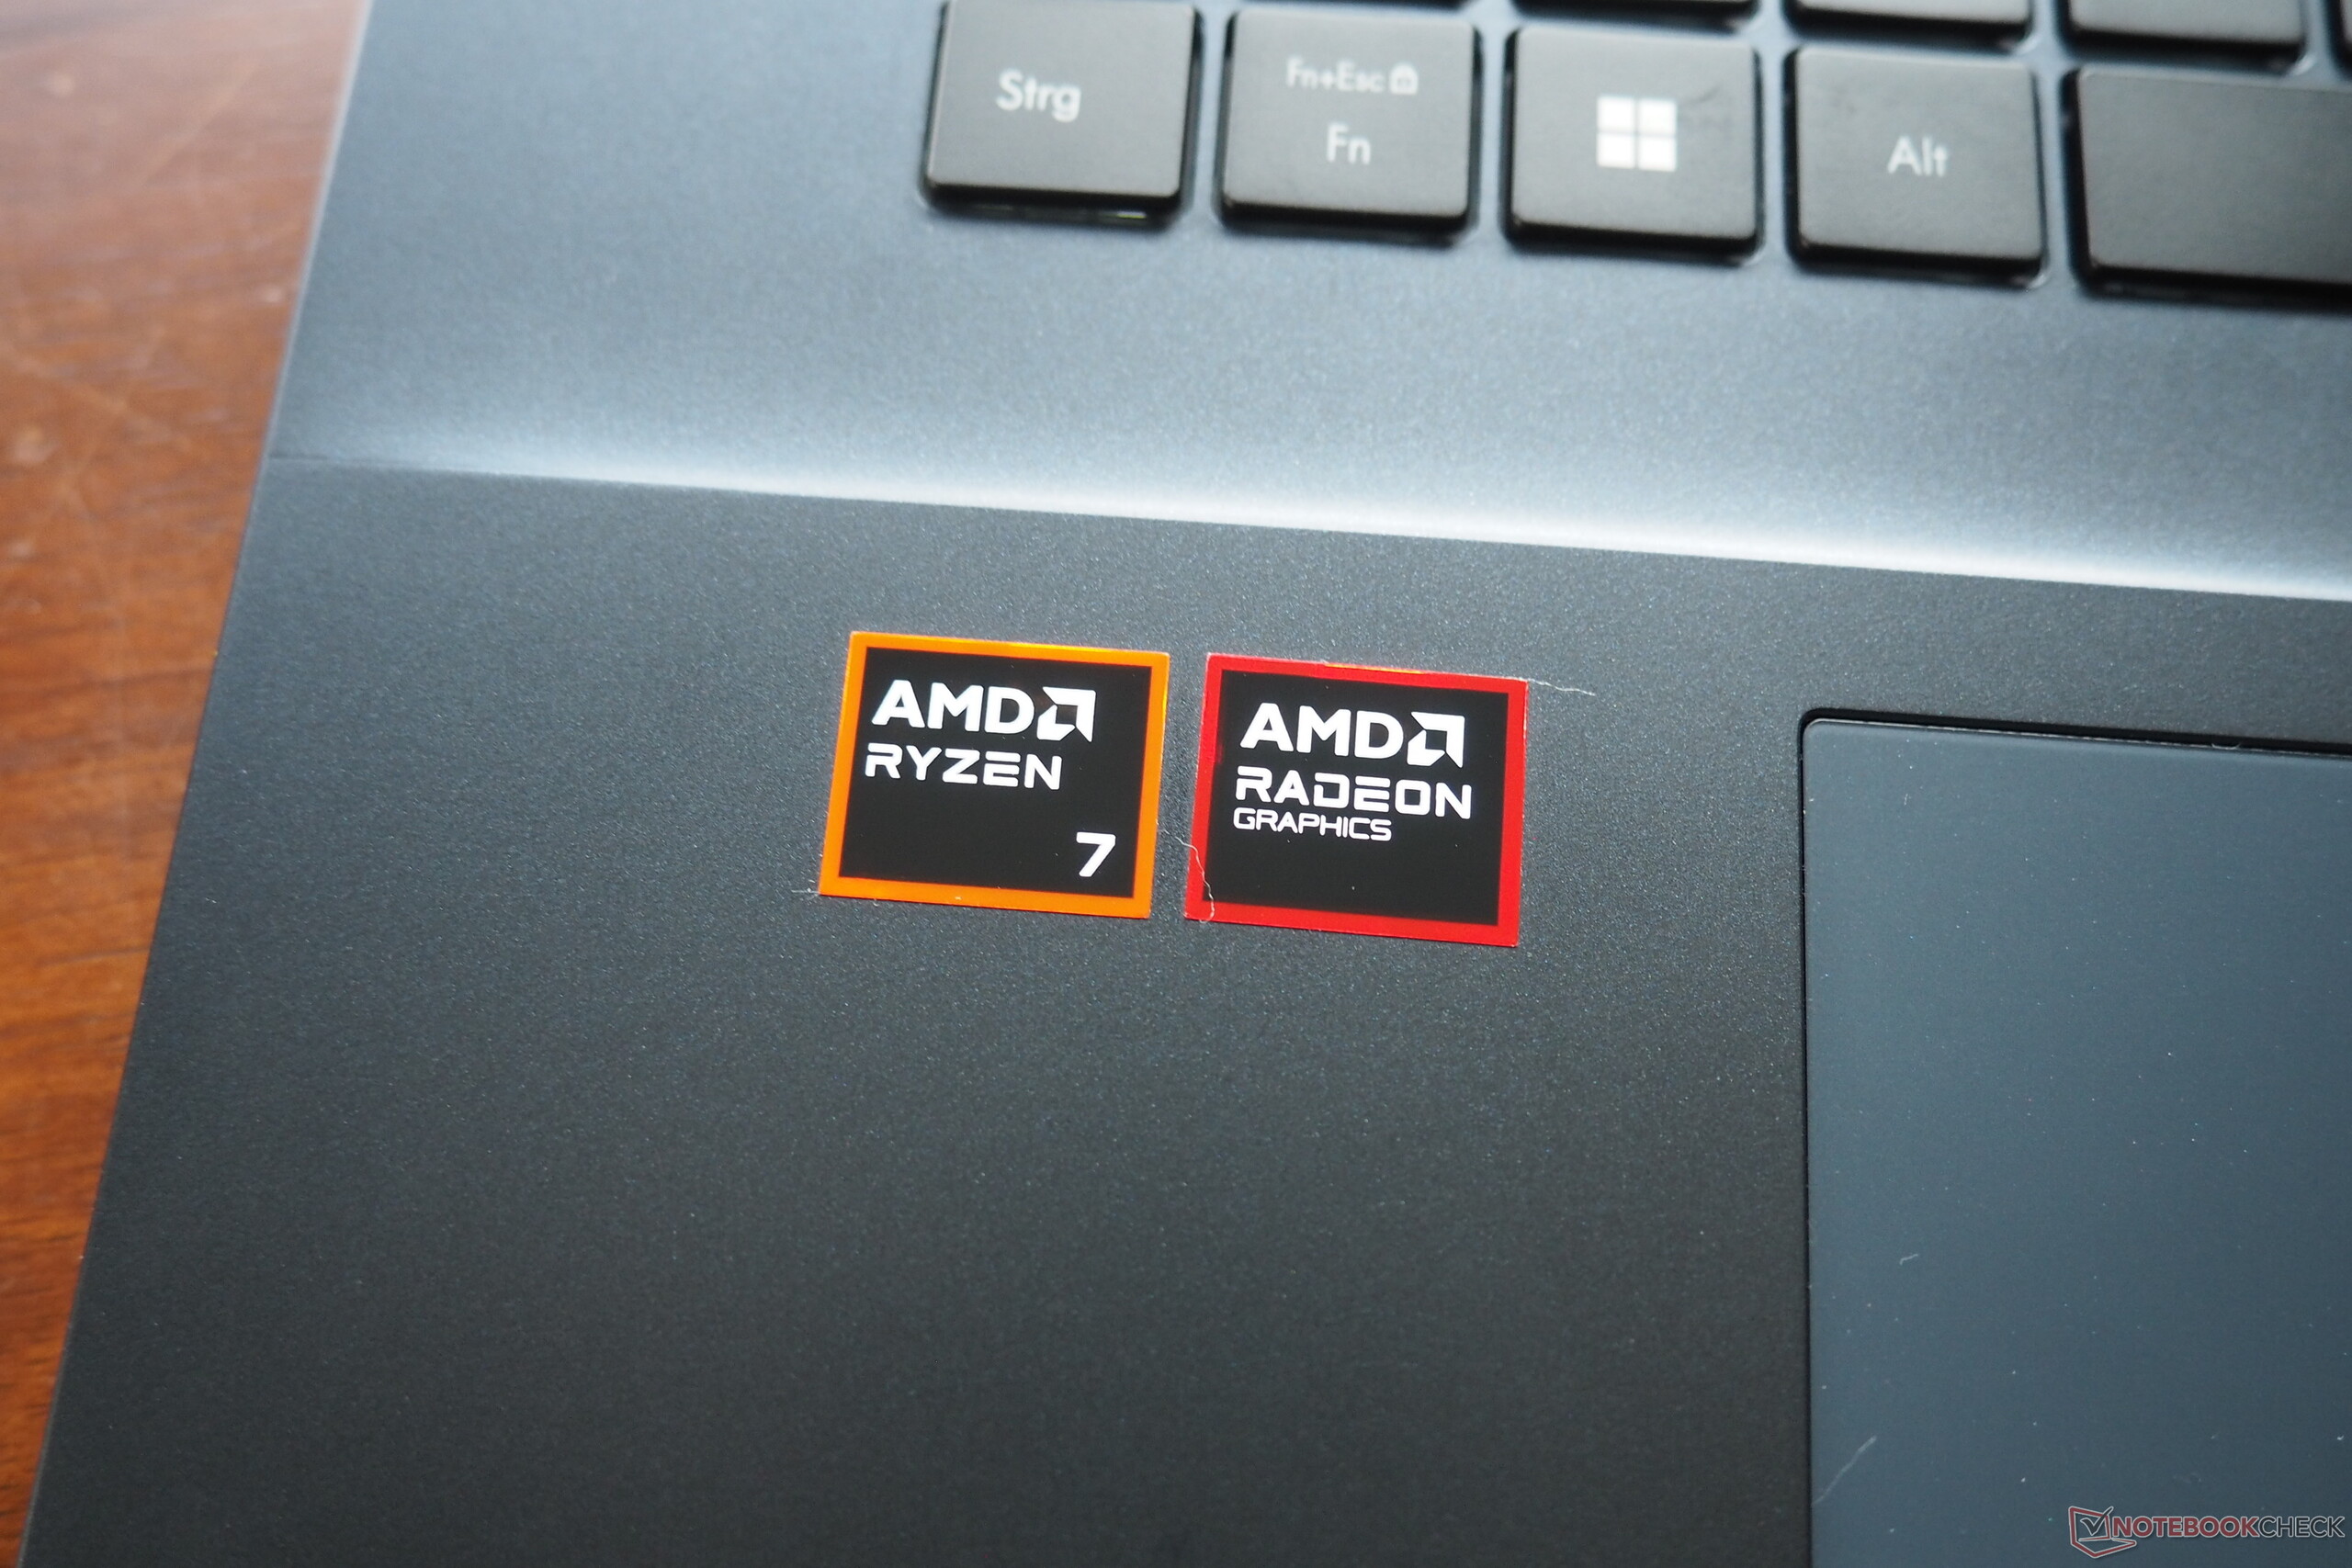
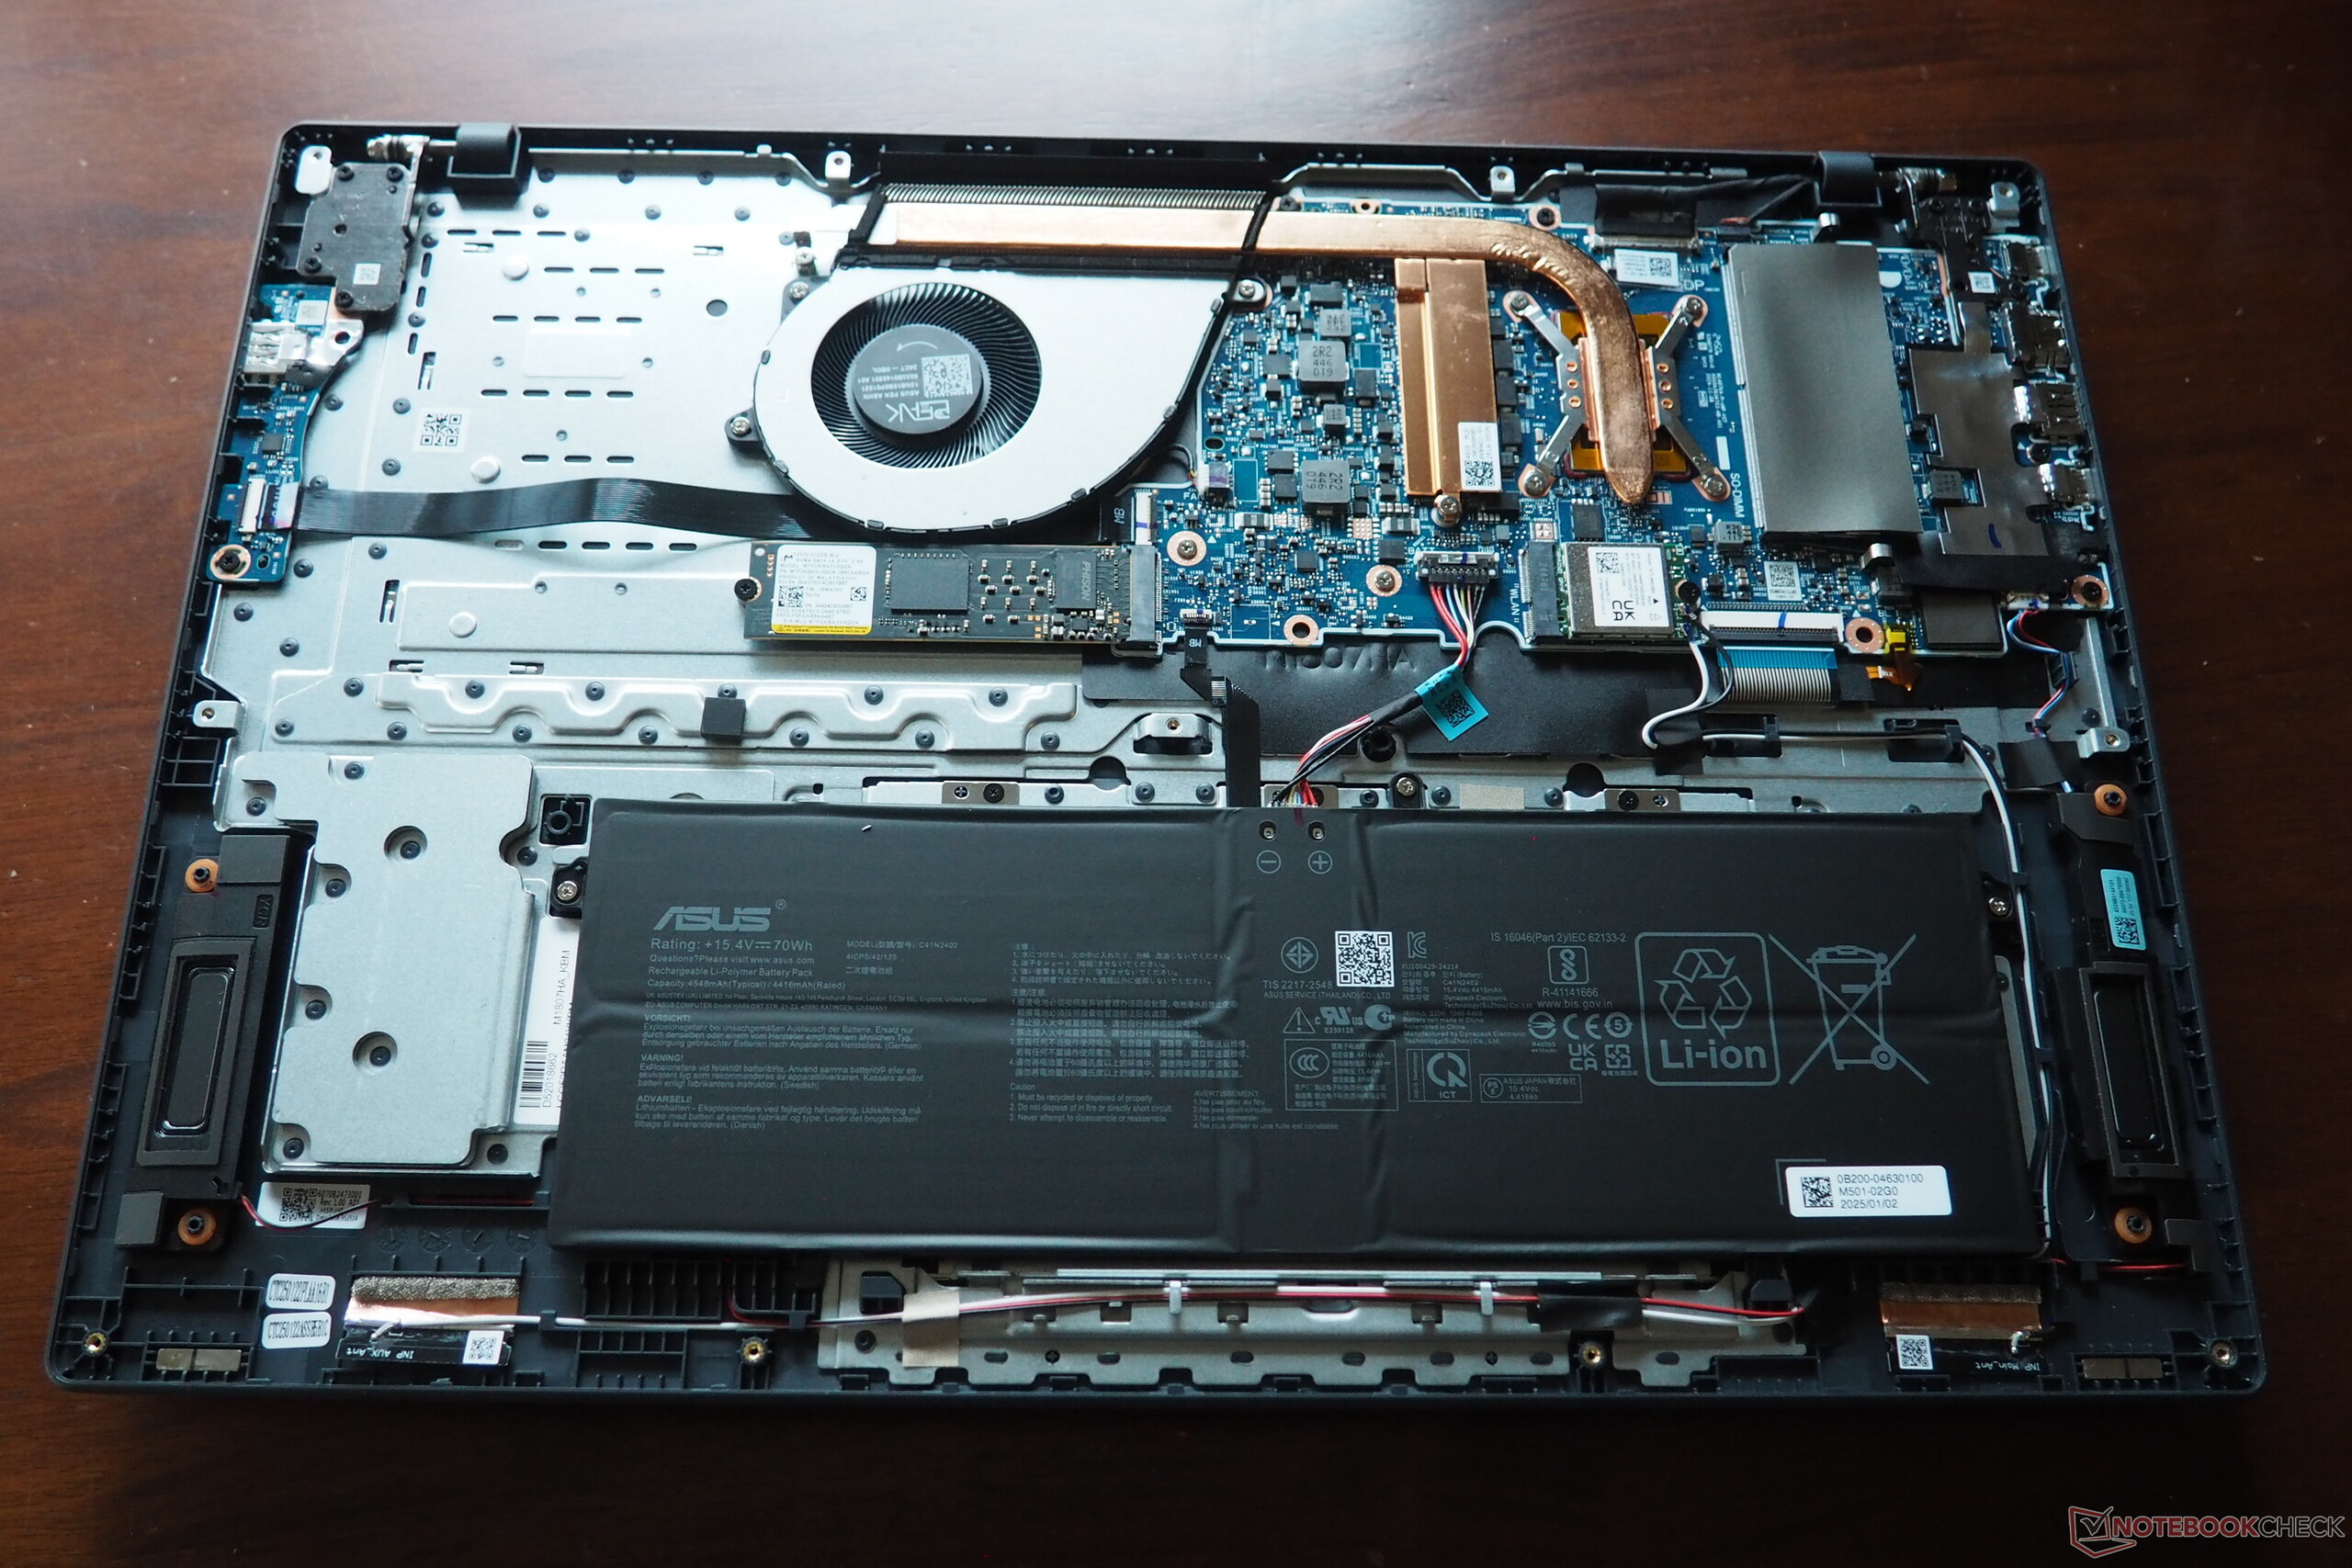
在此之前,不配备专用显卡的经济实惠型 18 英寸笔记本电脑一直非常罕见。因此,搭载 Ryzen 7 260 和 Radeon 780M iGPU 的 VivoBook 18 M1807HA 确实具有独特的卖点,但遗憾的是,华硕并没有充分挖掘其潜力。首先是它的外壳,质量可以更高、更稳定,尤其是在触摸板方面。相对于可用空间而言,它的键盘相当小(没有标准数字键盘),这也是一个遗憾。此外,华硕还应该在笔记本的散热上下功夫,因为尽管其 GPU 性能低于平均水平,但 18 英寸设备在负载情况下(至少从性能模式开始)噪音还是相当大。除了第二个风扇外,机箱内还应该有空间安装第二个 M.2 或内存插槽(现有的 16 GB 内存是焊接上去的)。由于 18 英寸机身没有 USB 4 接口,其部分过时的连接功能进一步降低了评分。
在所有其他类别中,VivoBook 18 的表现都相当出色。例如,我们对其 CPU 速度、图像质量和电池续航时间几乎没有什么可抱怨的。总的来说,我们只建议那些绝对需要一款 18 英寸设备且价格不高的用户购买。
Pros
Cons
价格和供应情况
VivoBook 18 M1807HA 尚未在美国发售。它的最高售价估计略低于 1,000 美元。
- $421.00ASUS VivoBook 17 Business Laptop 17.3" FHD IPS Anti-Glare Intel 6-core i3-1215U (Beats i7-1165G7) 16GB RAM 512GB SSD USB-C SonicMaster Win11 w/ICP Accessory
- $1,299.99ASUS Vivobook 17X Laptop, 17.3” FHD Display, Intel Core i9-13900H CPU, 16GB RAM, 1TB SSD, Windows 11 Home, Indie Black, K3704VA-DS96
规格
案例
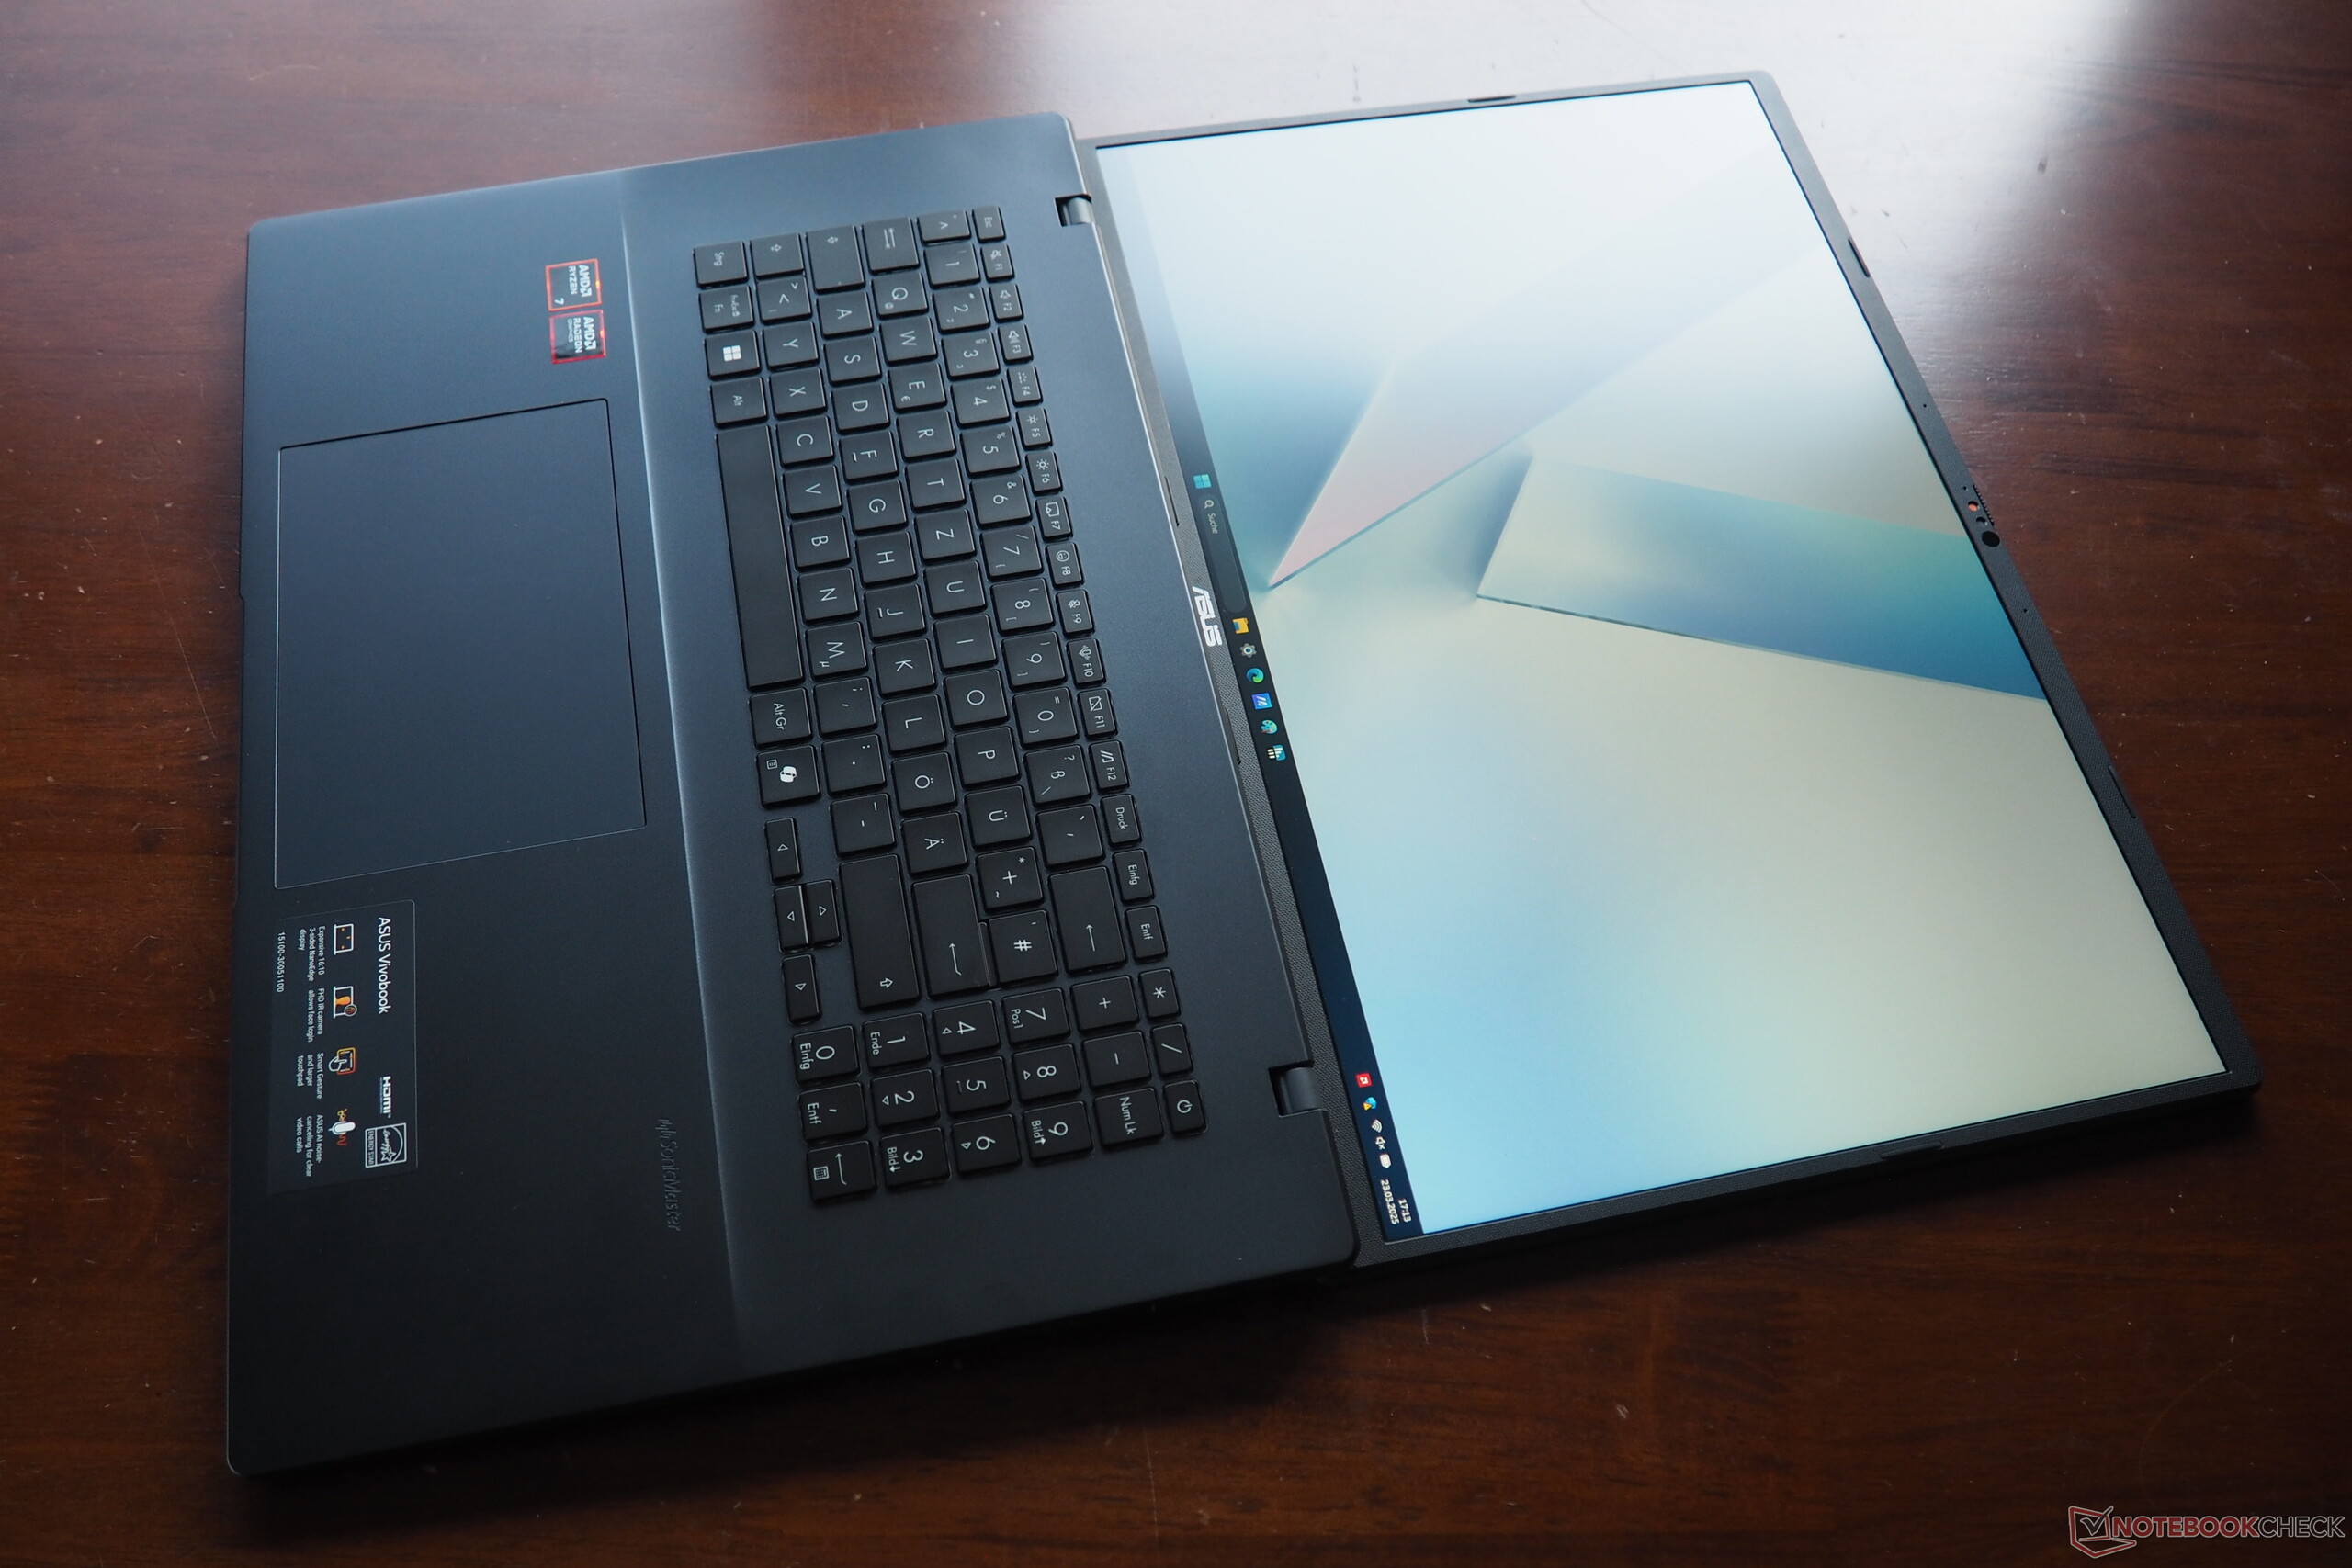
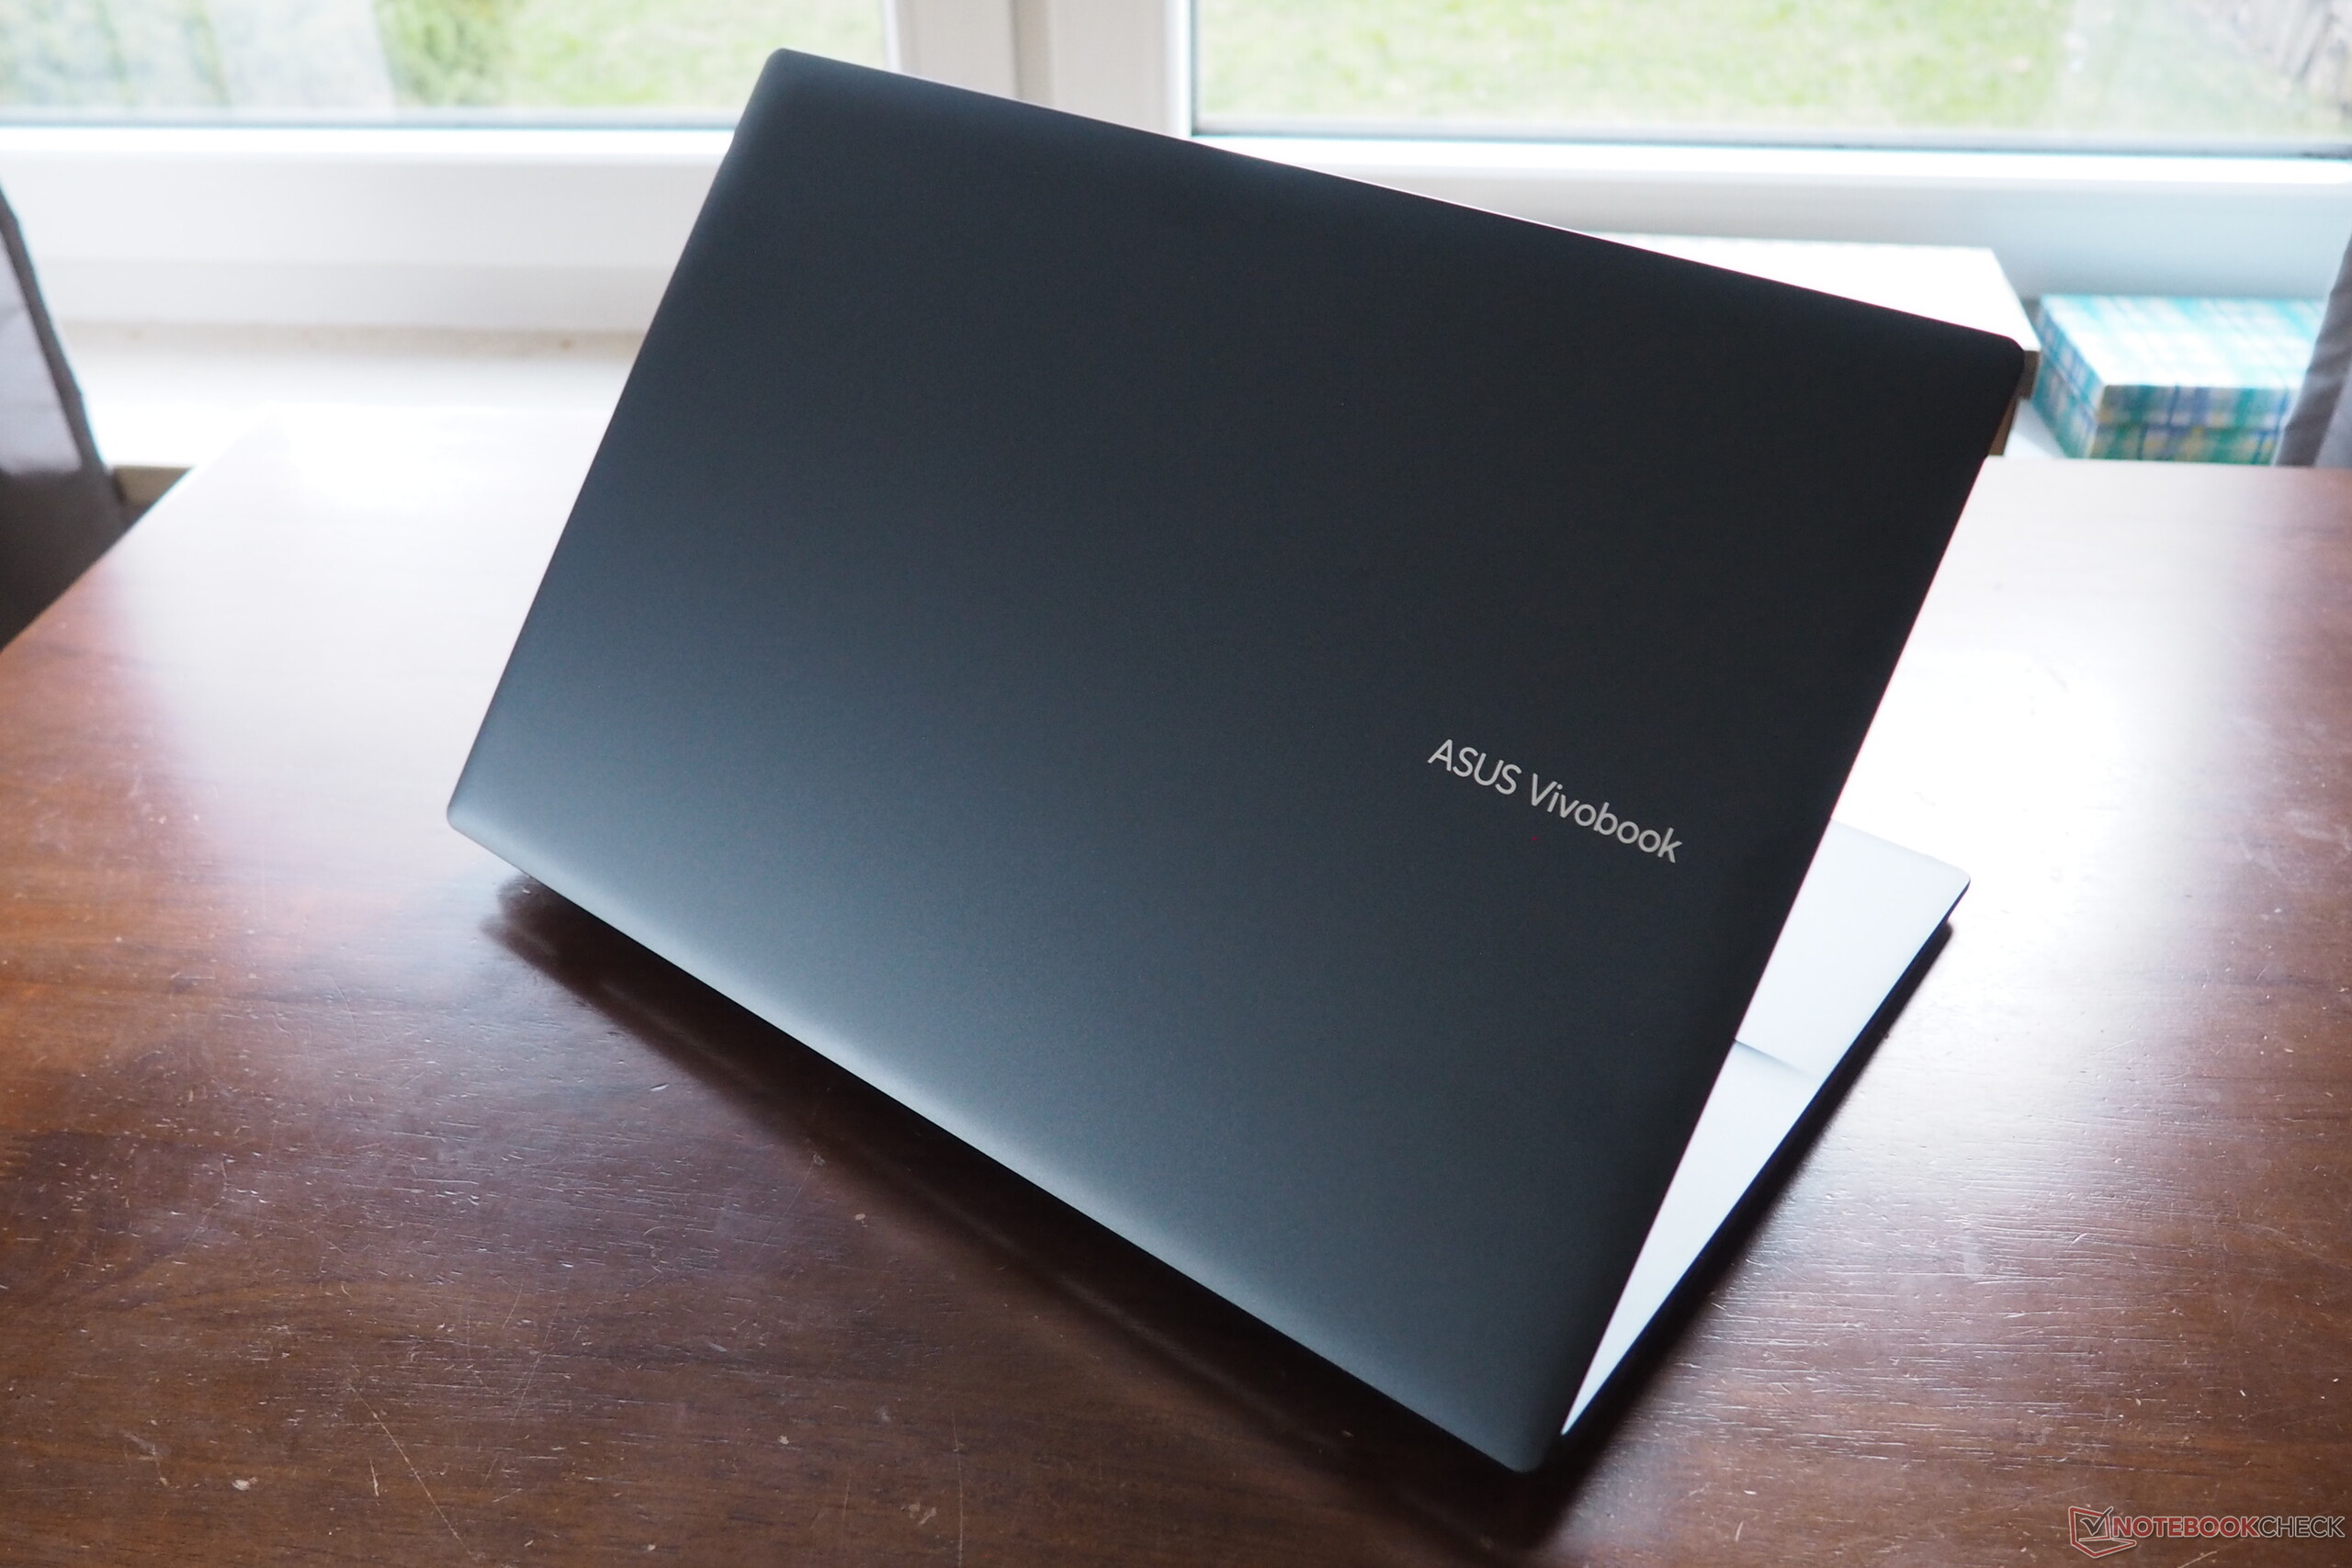
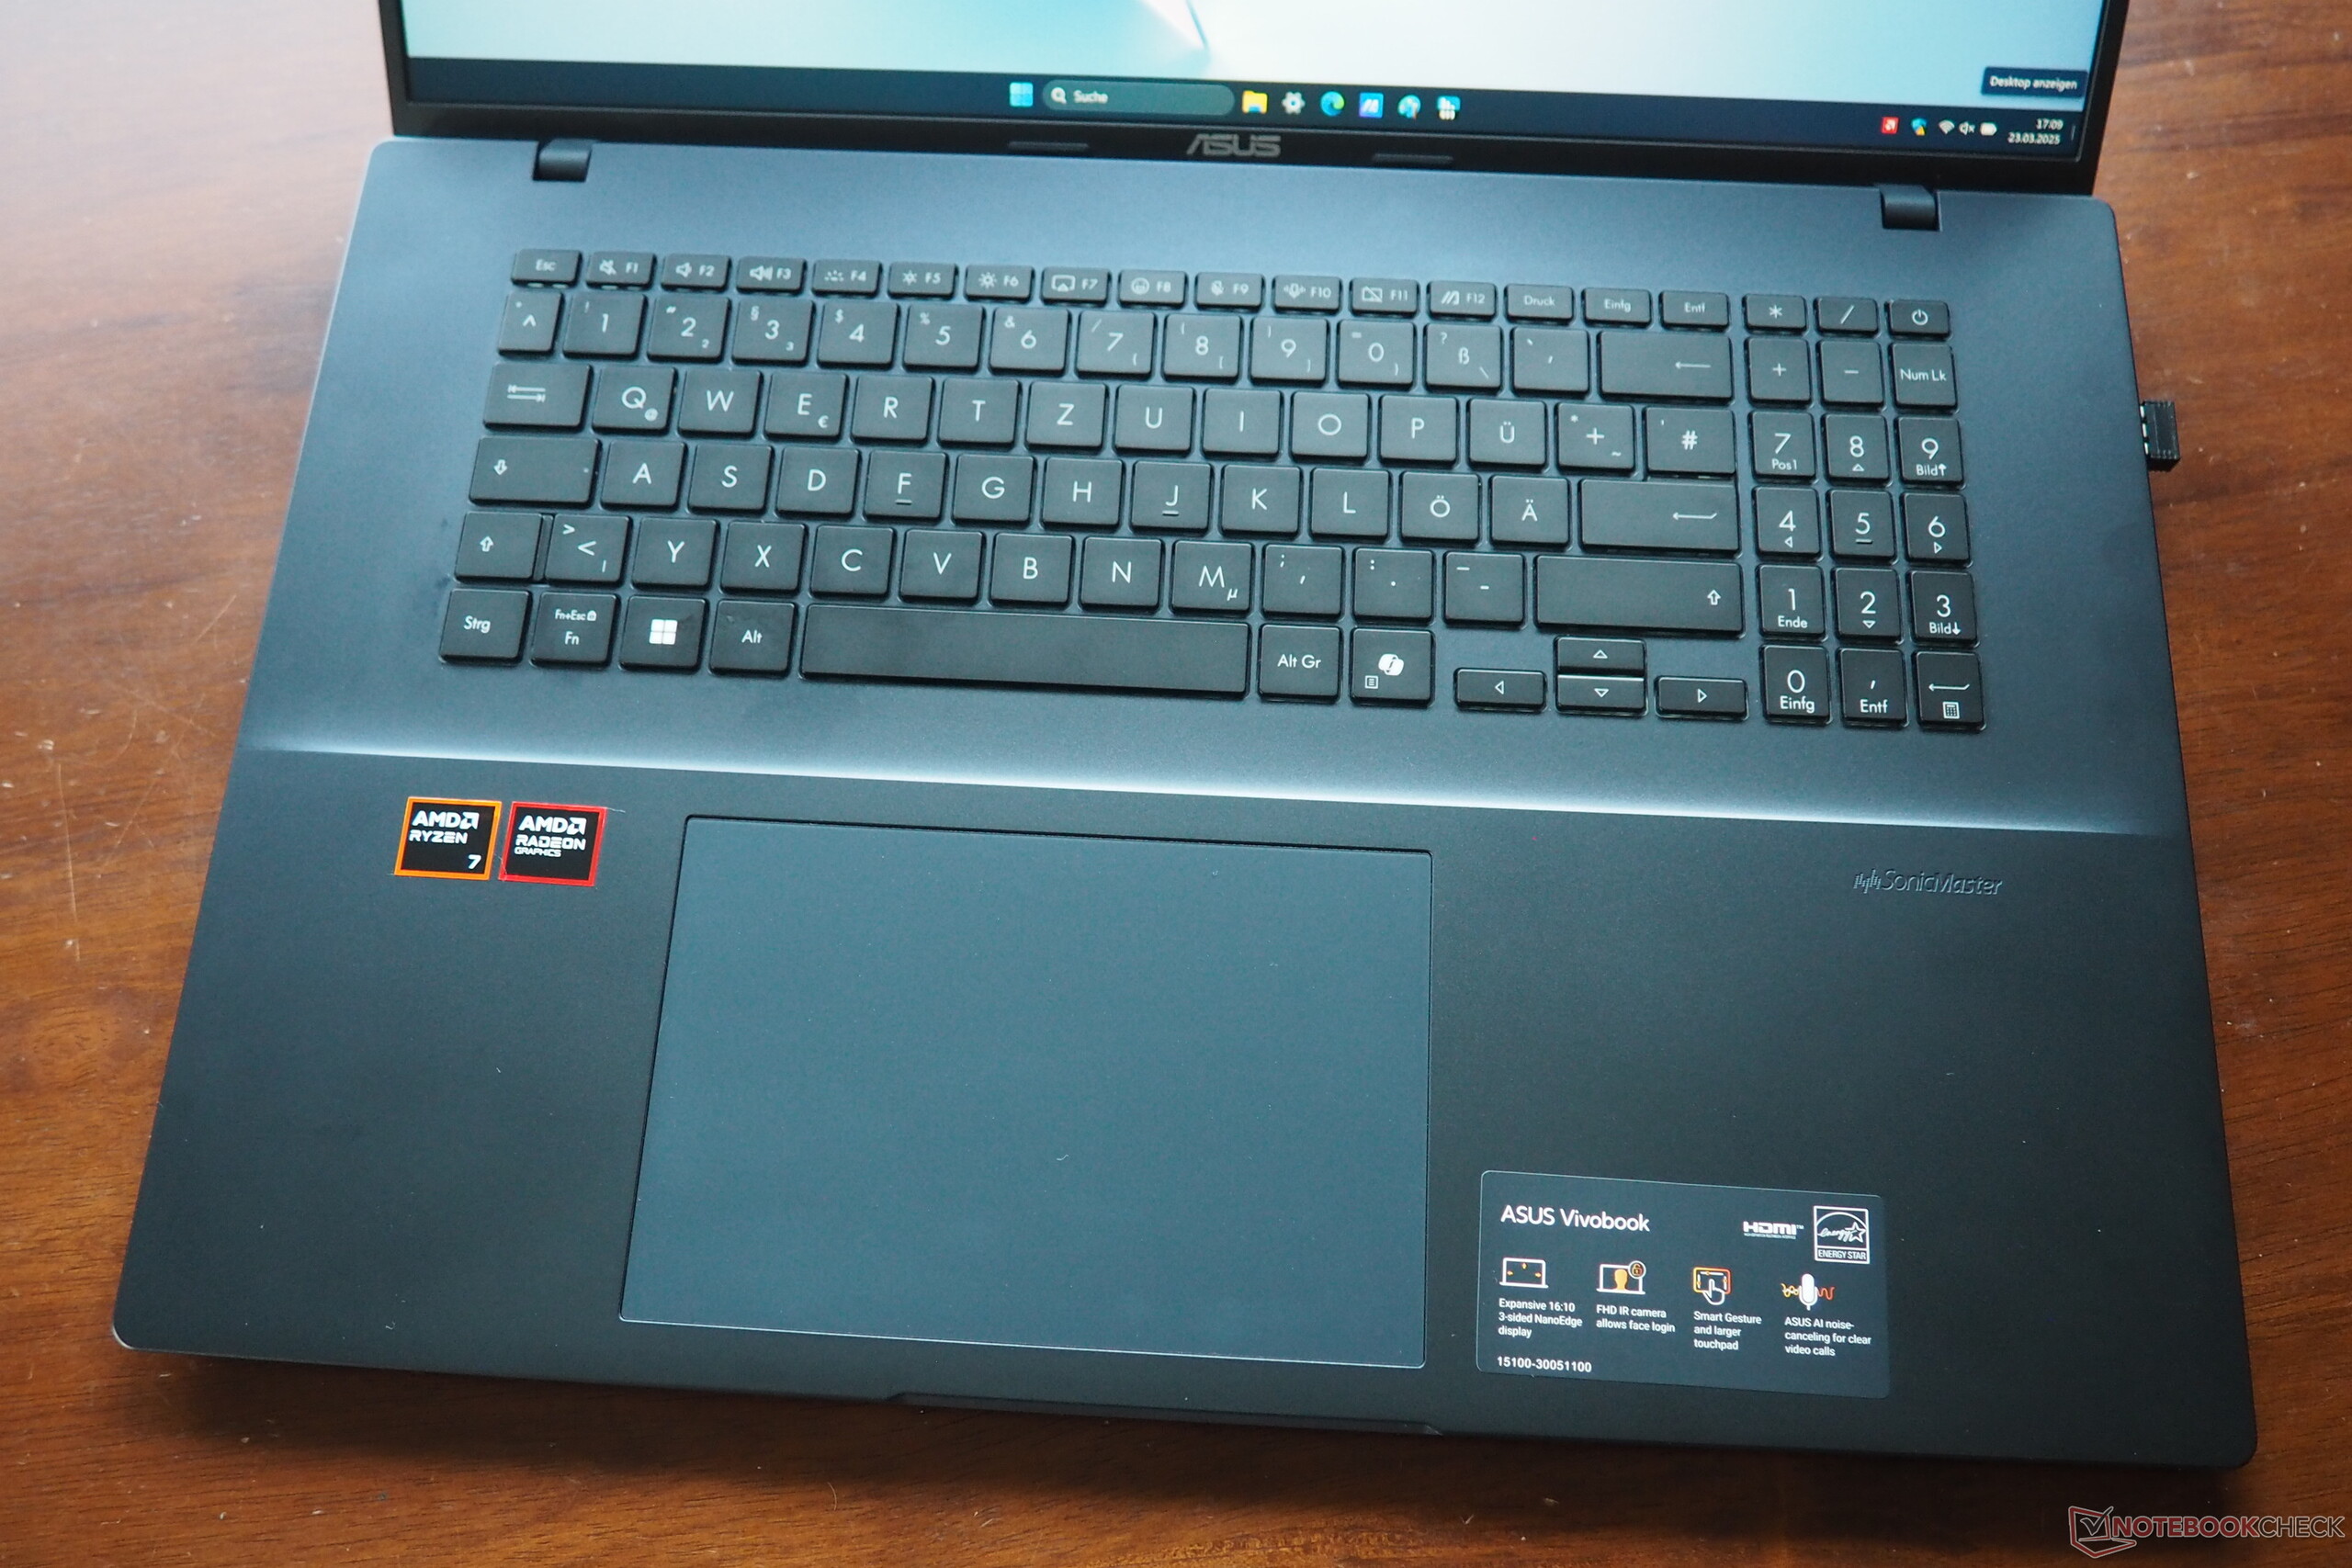
制造商采用了塑料外壳。正如我们从许多笔记本电脑中了解到的那样,深灰色的表面很容易留下指纹痕迹。VivoBook 18 的高度约为 20 毫米(不含脚垫),既不算厚也不算薄。约 2.6 千克的重量对于 18 英寸笔记本电脑来说也还可以接受。它的一大亮点是 180° 的大开合角度,尽管铰链感觉有些微妙。总体而言,它的制造质量很高。
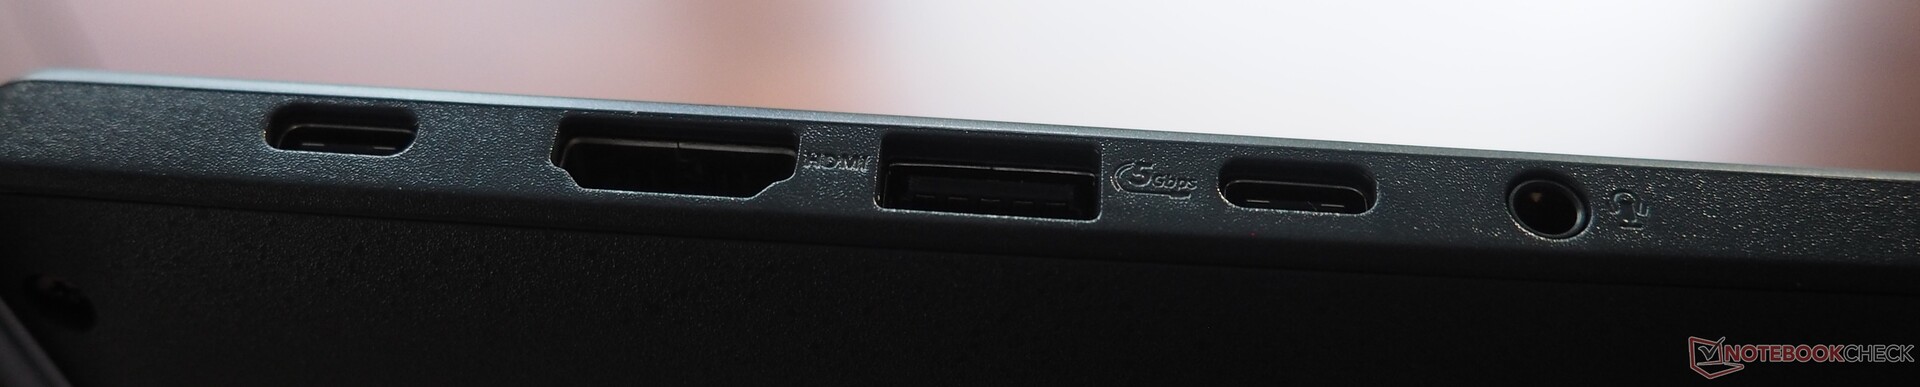
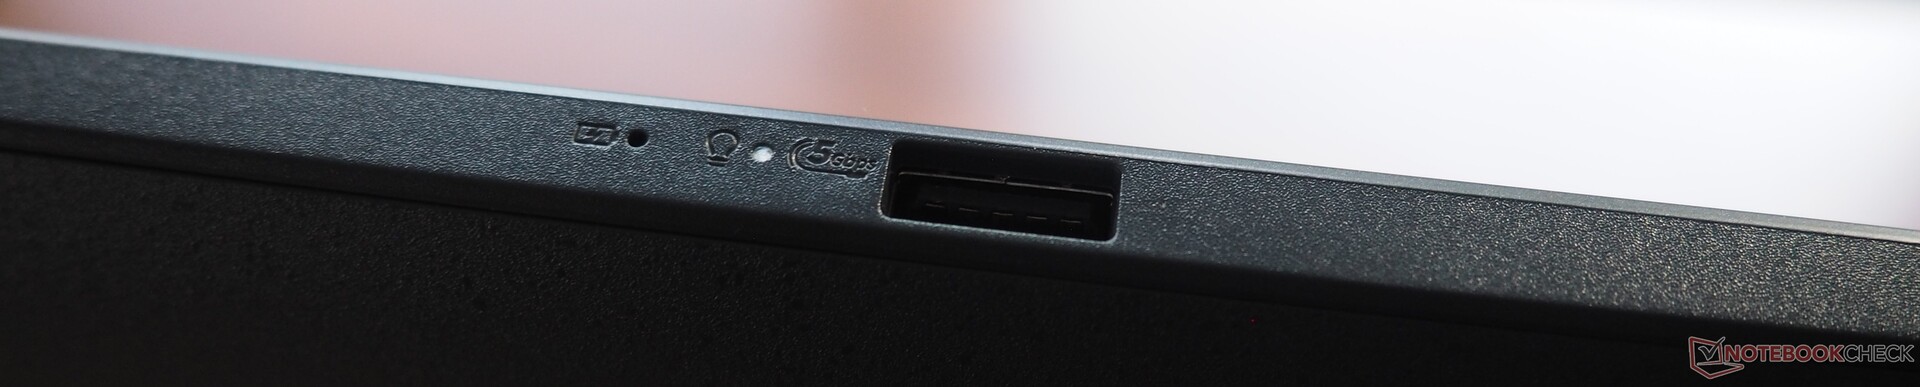
连接性
VivoBook 18 只能使用四个 USB 3.2 Gen 1 端口,不过它的两个 Type-C 端口支持 PowerDelivery 和 DisplayPort。它还配有一个音频插孔和一个 HDMI 2.0 输出。没有 LAN 端口或读卡器。
在我们的测试中,集成无线模块(Realtek RTL8852BE)的 Wi-Fi 速度只能算一般。
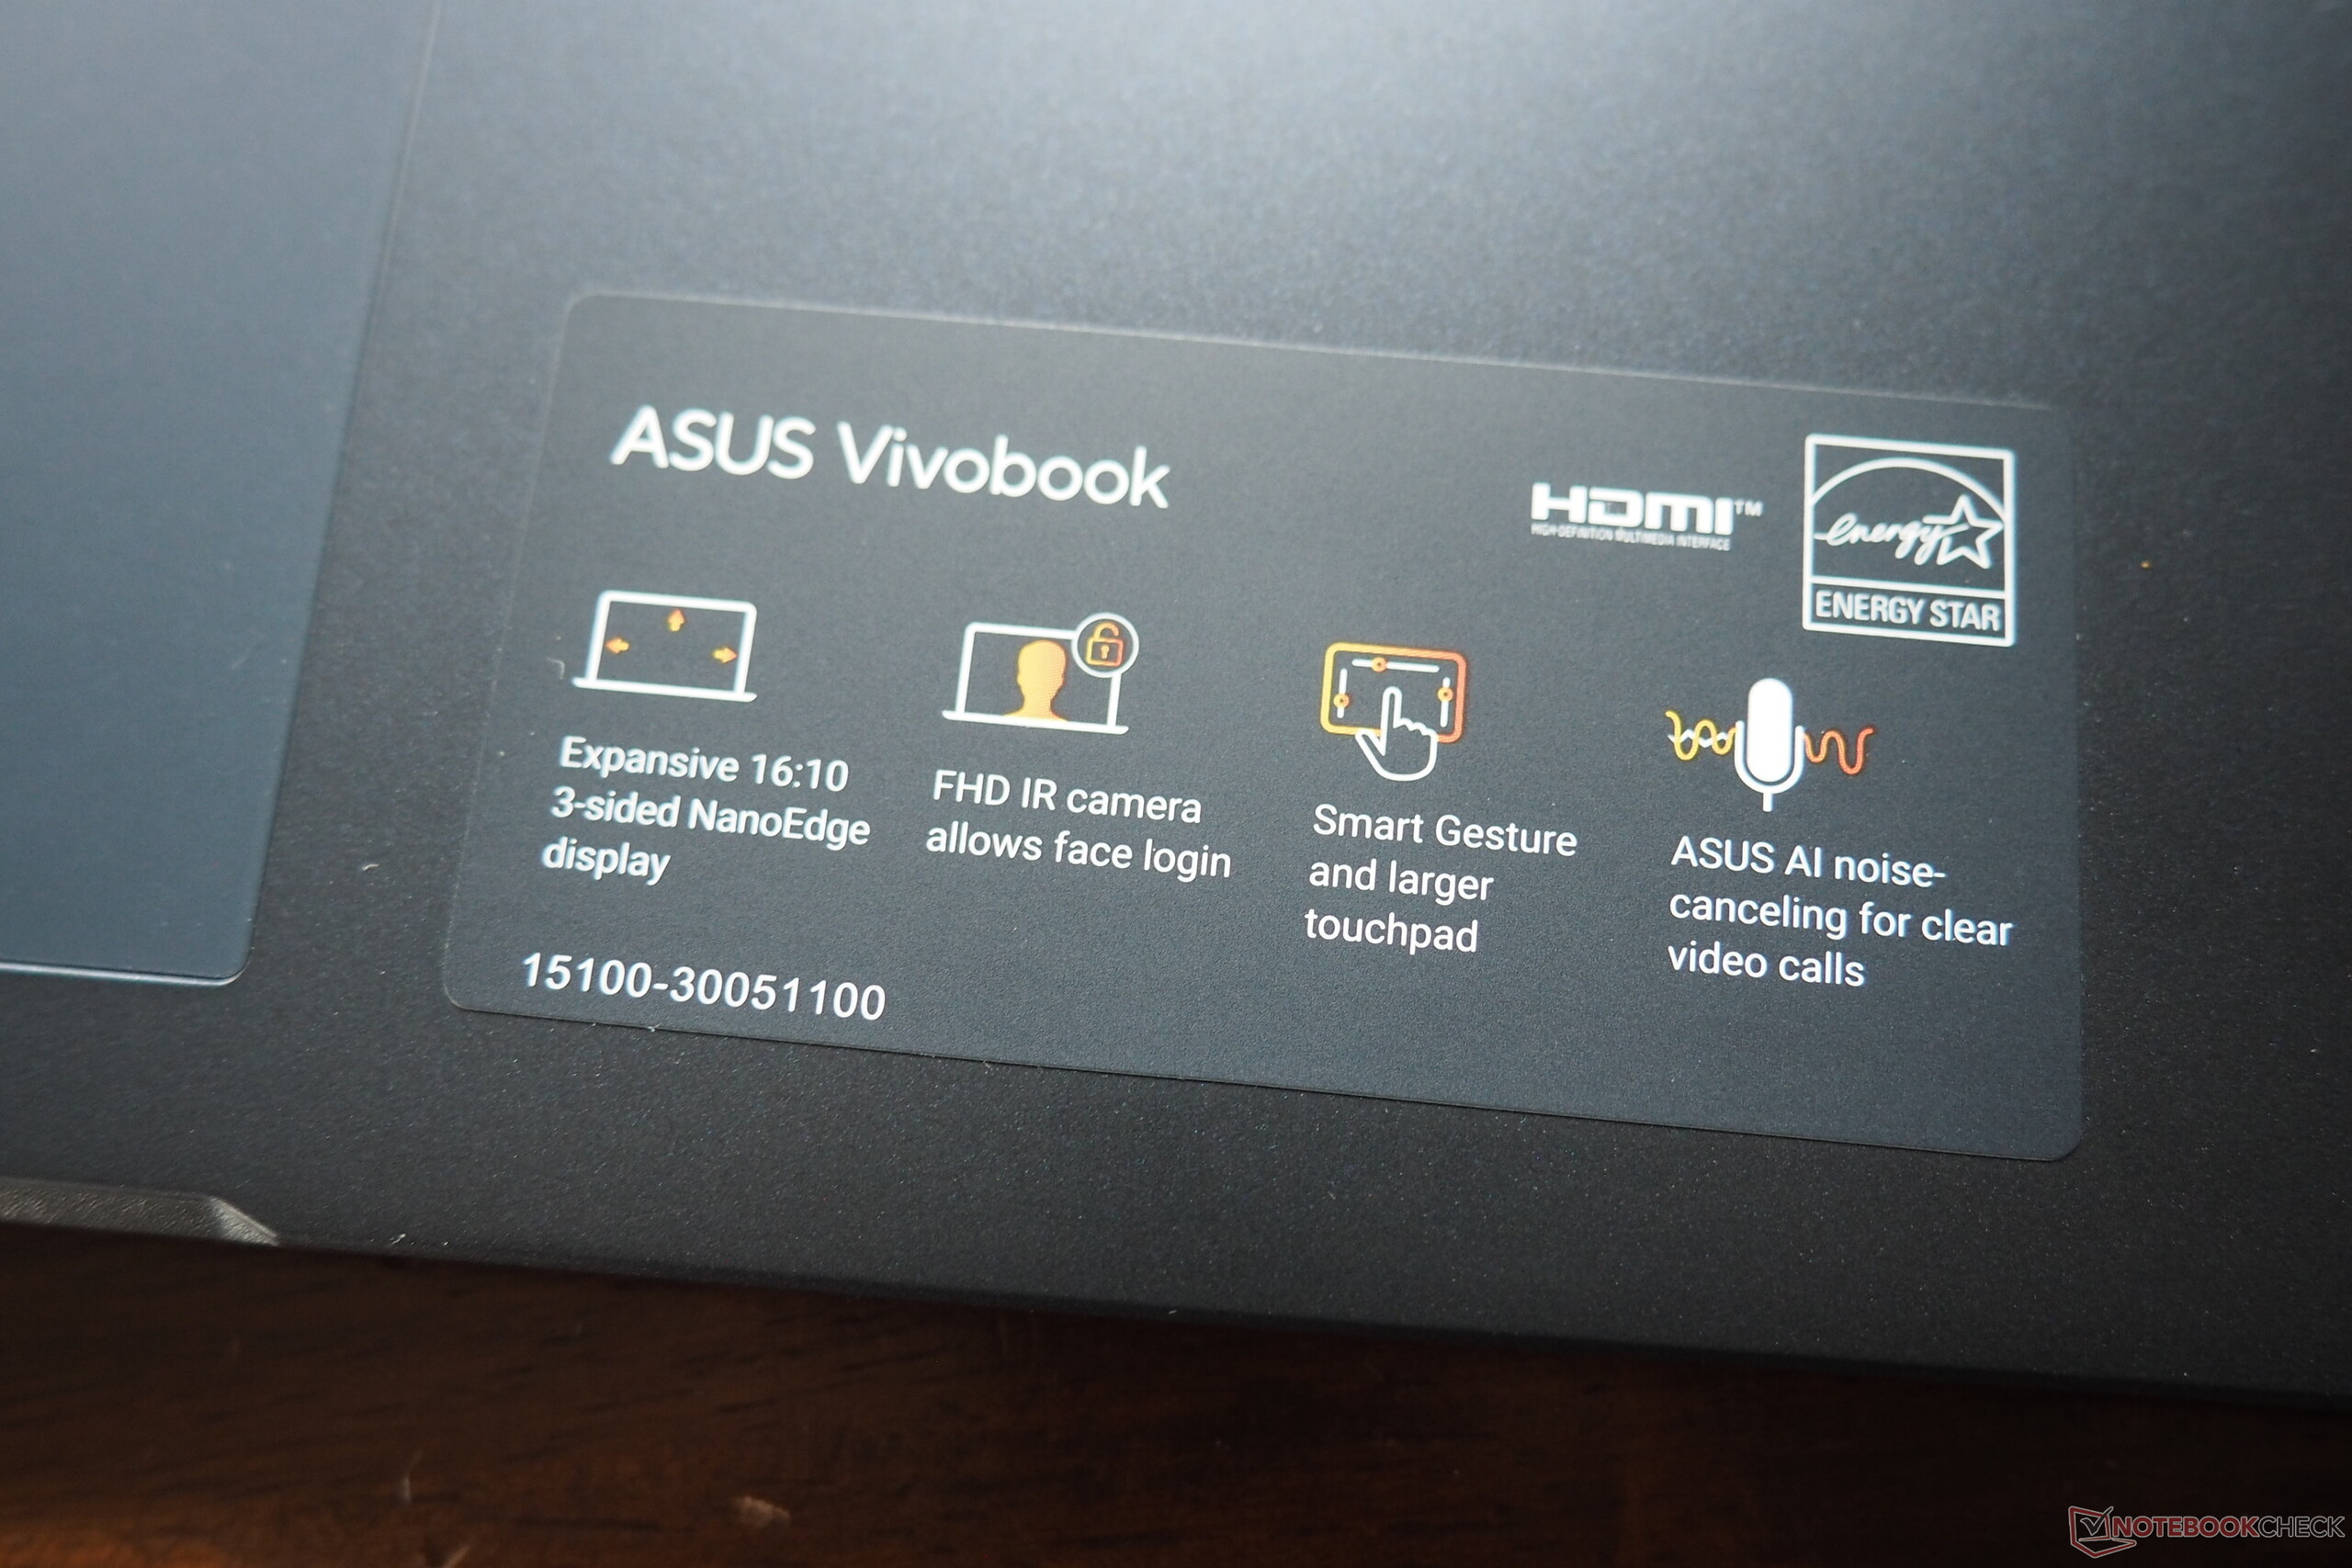
该笔记本的全高清网络摄像头配有机械盖,清晰度很高,但色彩还不够准确。
交流
网络摄像头


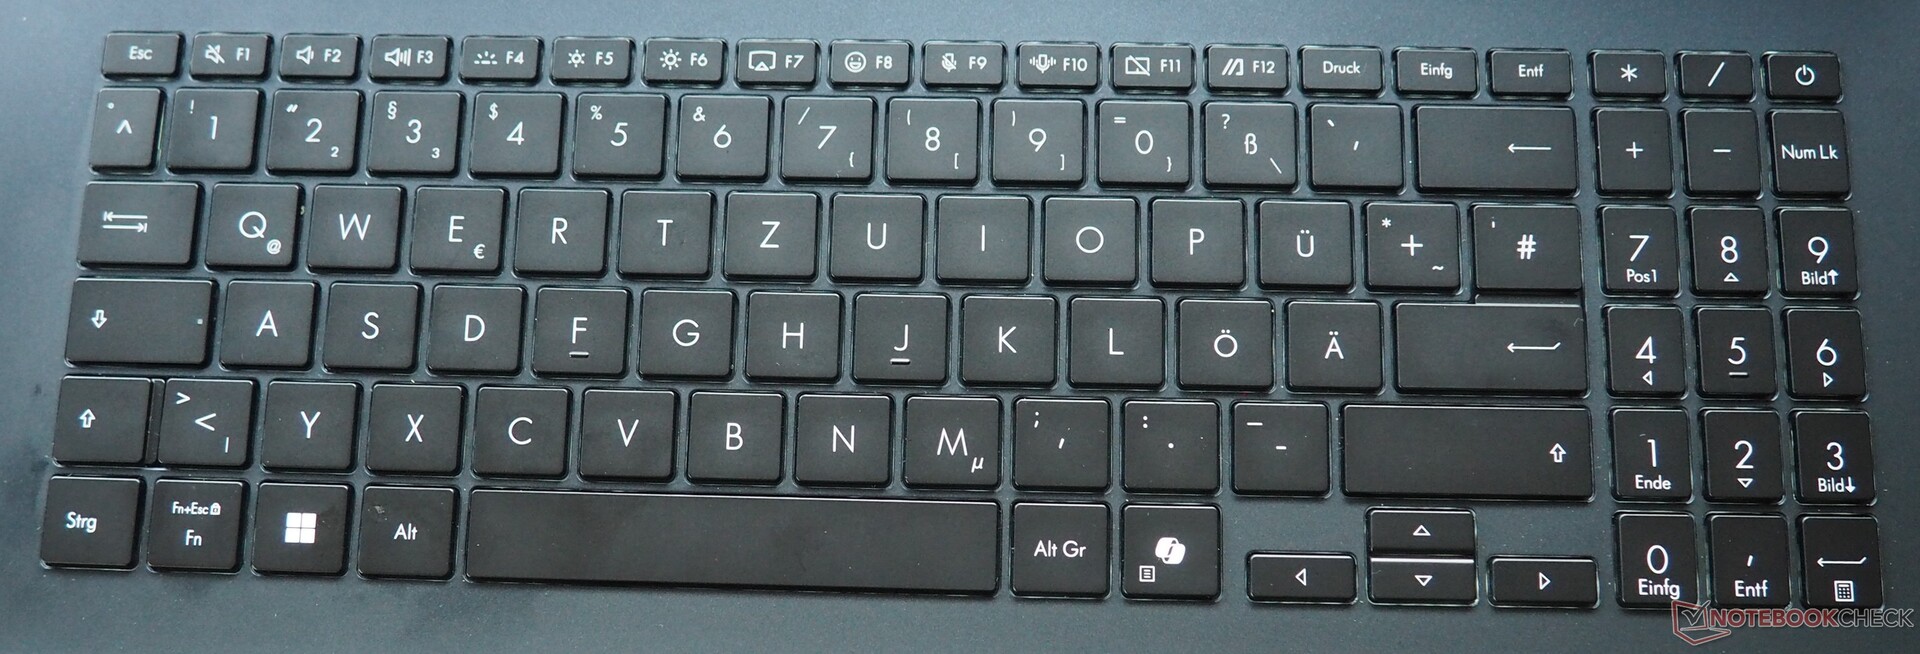
输入设备
我们对其键盘的设计了解有限。尽管笔记本的外壳很宽,但华硕只安装了三列而不是四列数字键盘,方向箭头也非常小。我们对键盘的键入手感和白色背光(3 级)没有太多批评。
与键盘相比,该设备的触摸板比一般键盘要大。不到 15 x 10 厘米的尺寸创下了笔记本电脑的记录,但正如开头提到的,它的稳定性还有待提高。得益于光滑的表面,手指在触摸板上的滑动相当顺畅。制造商可以改进一下不稳定的点击区域。
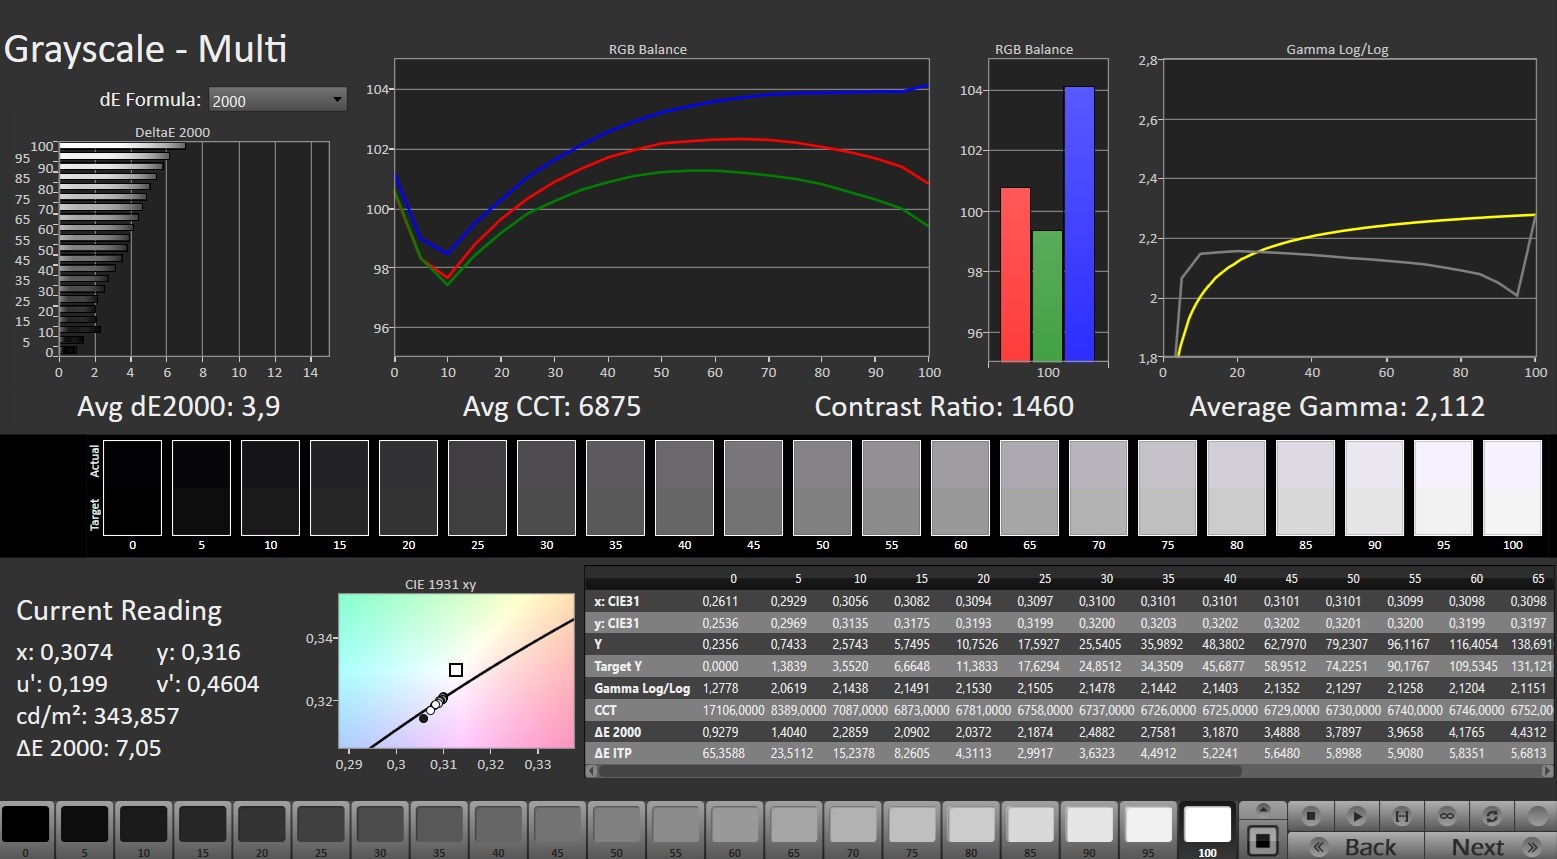
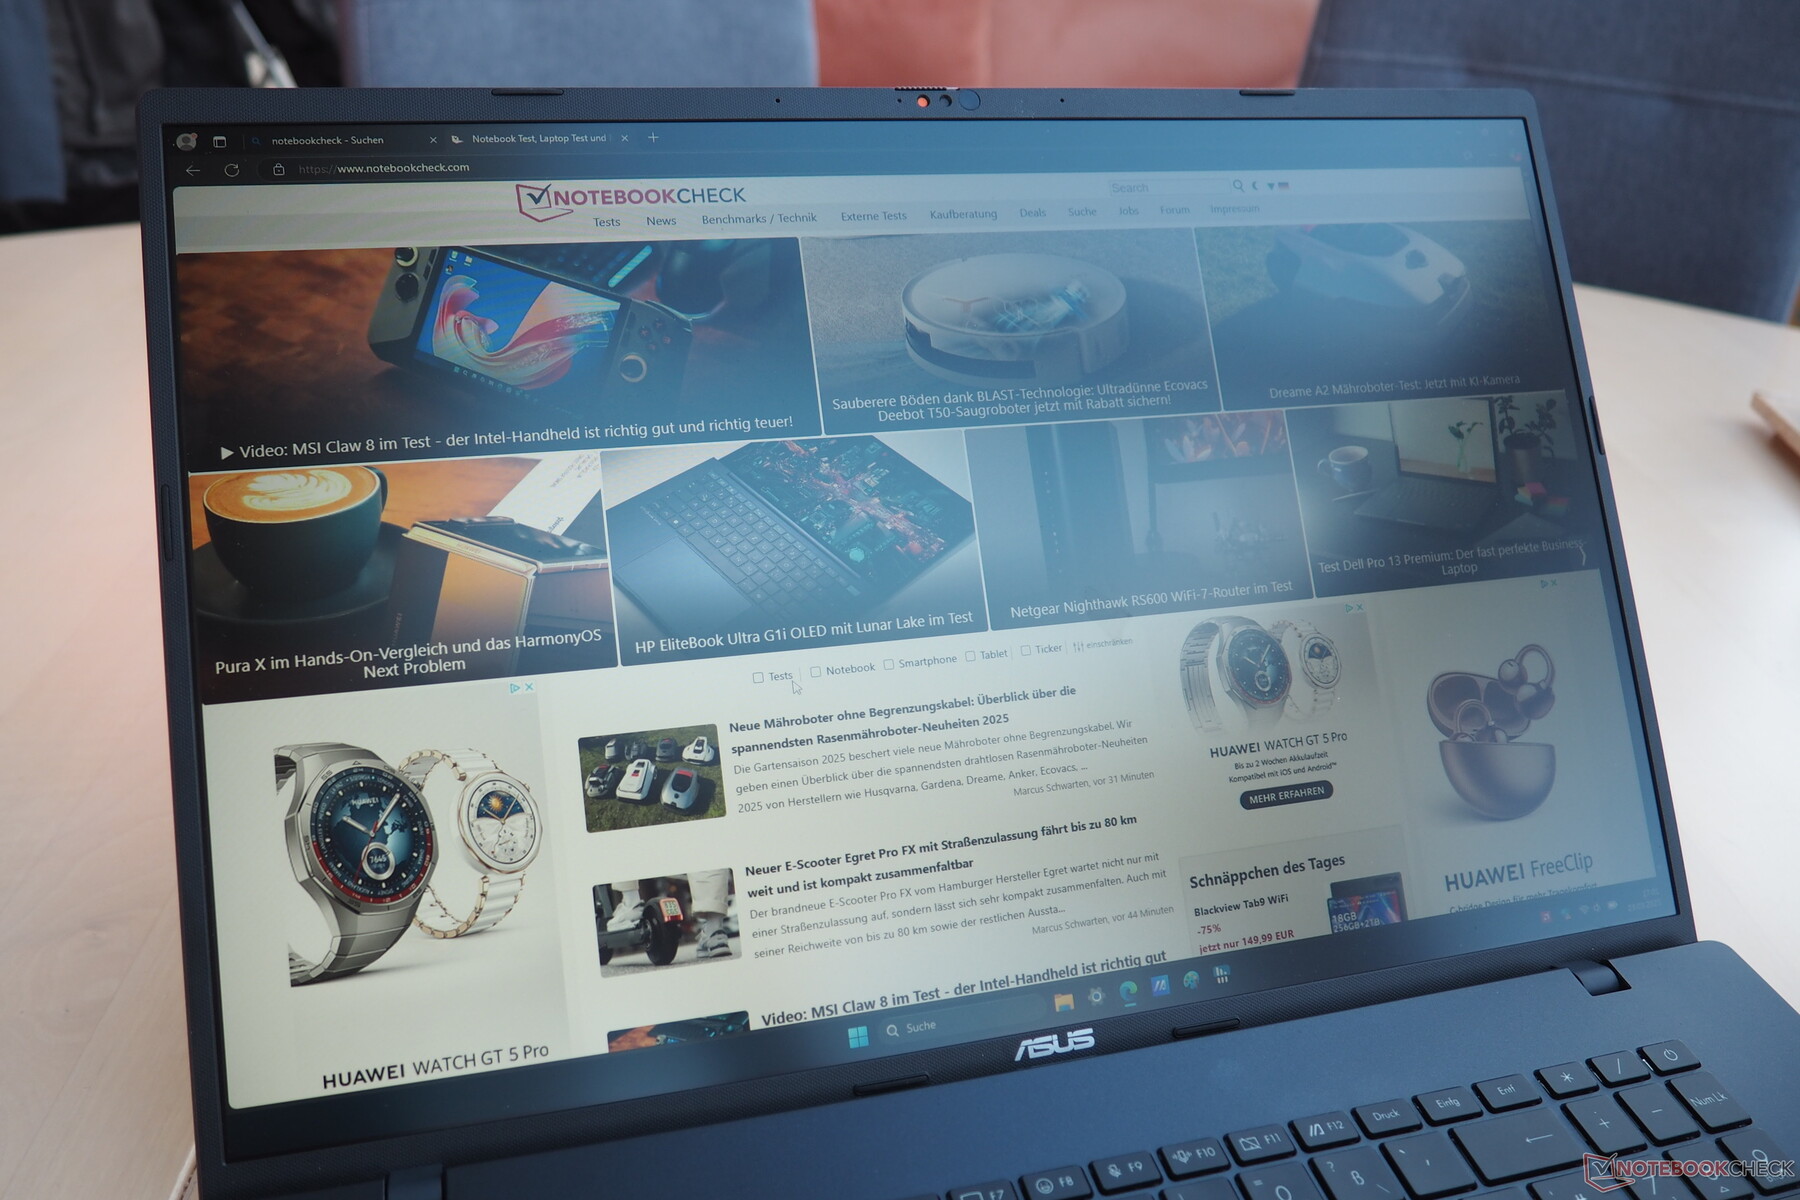
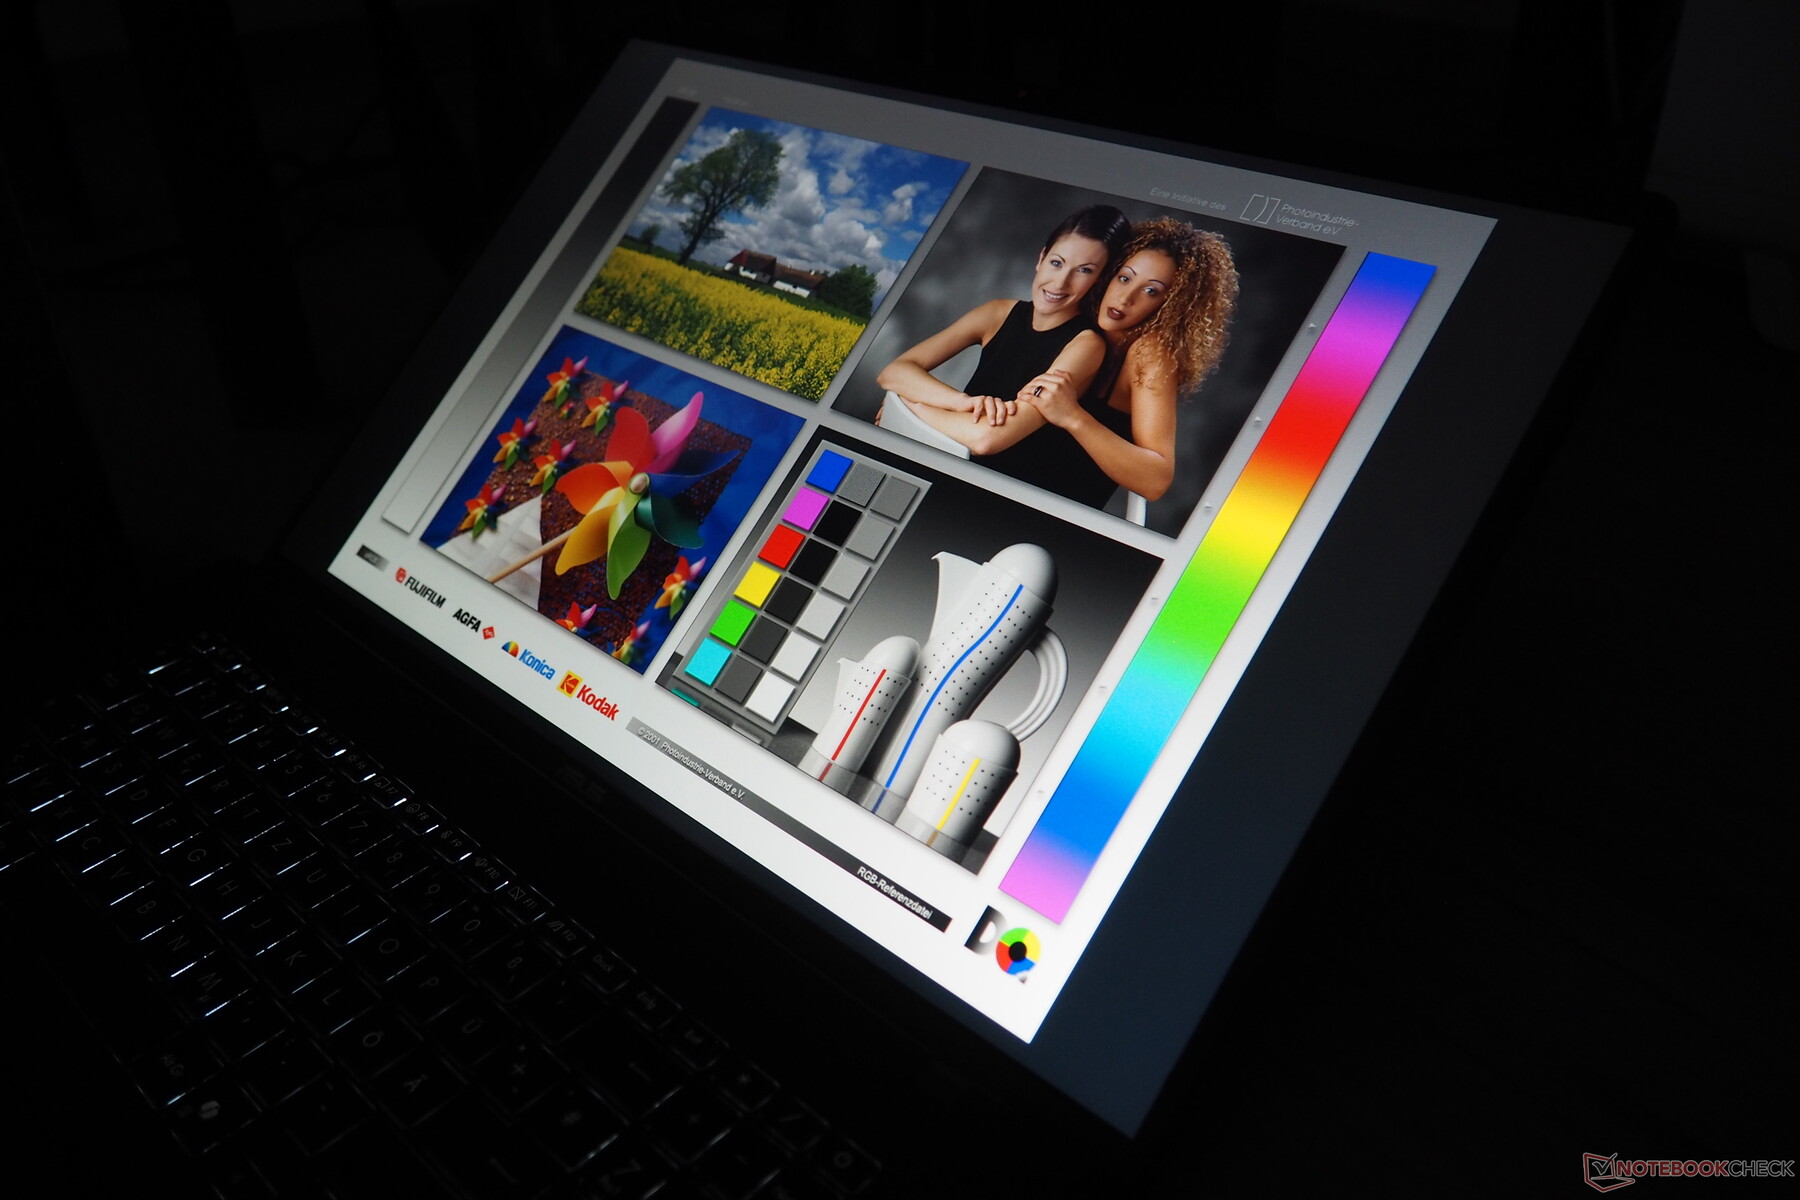
显示屏
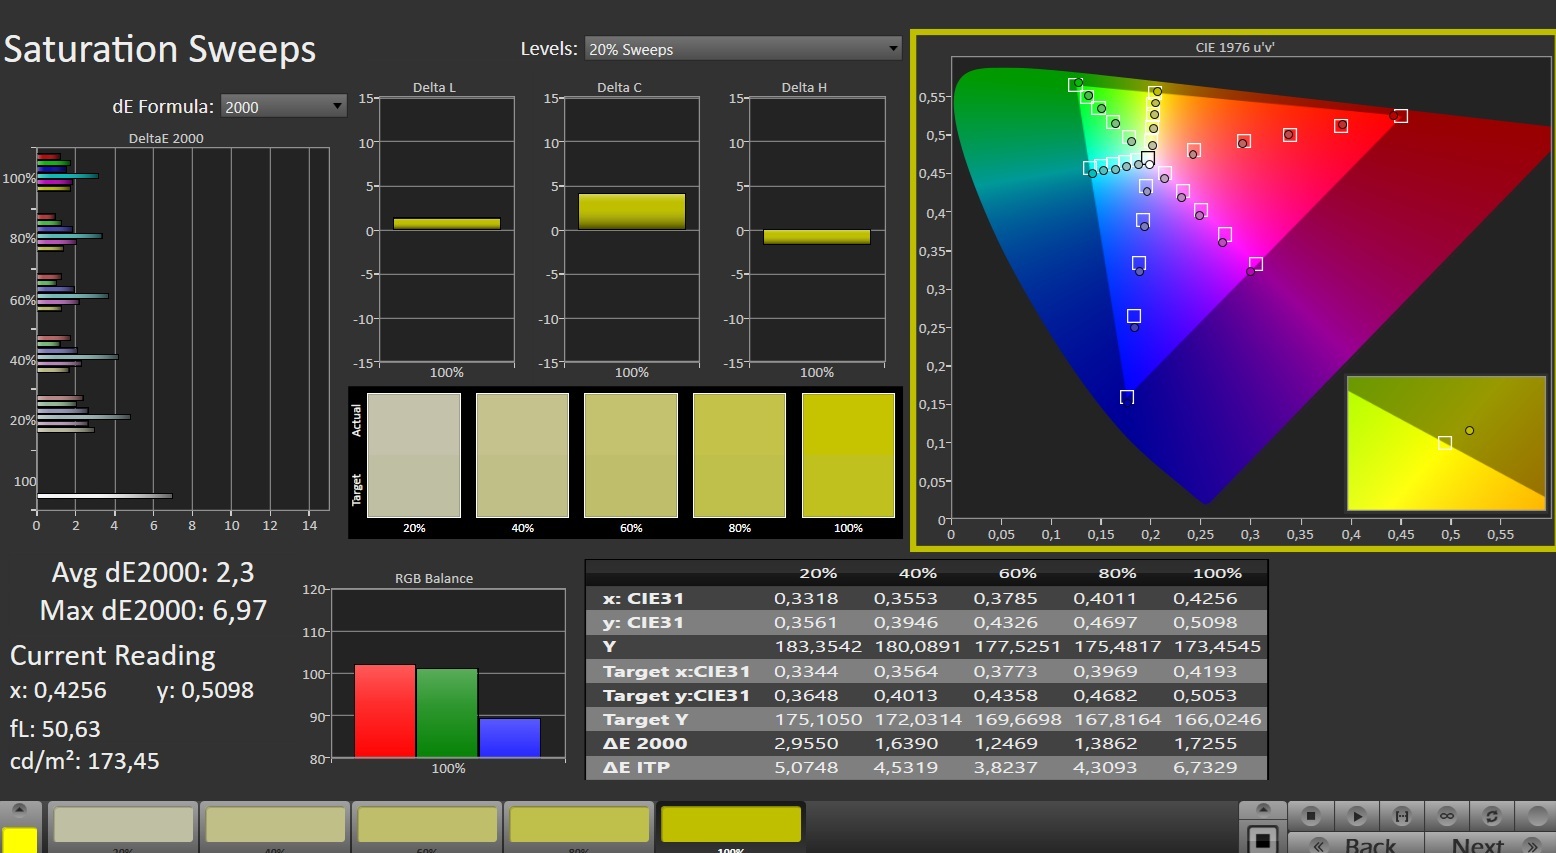
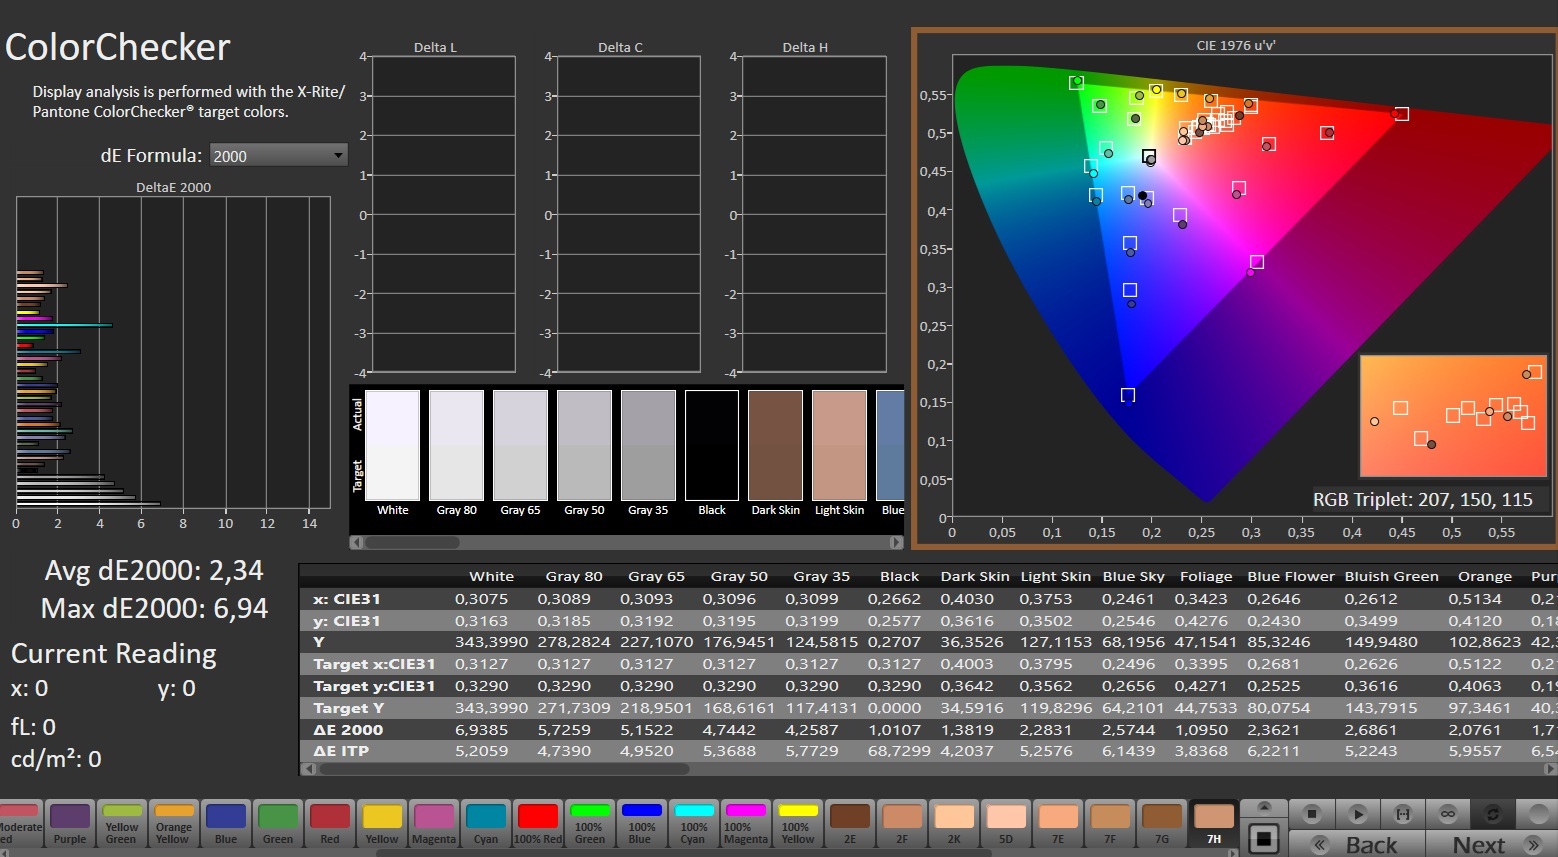
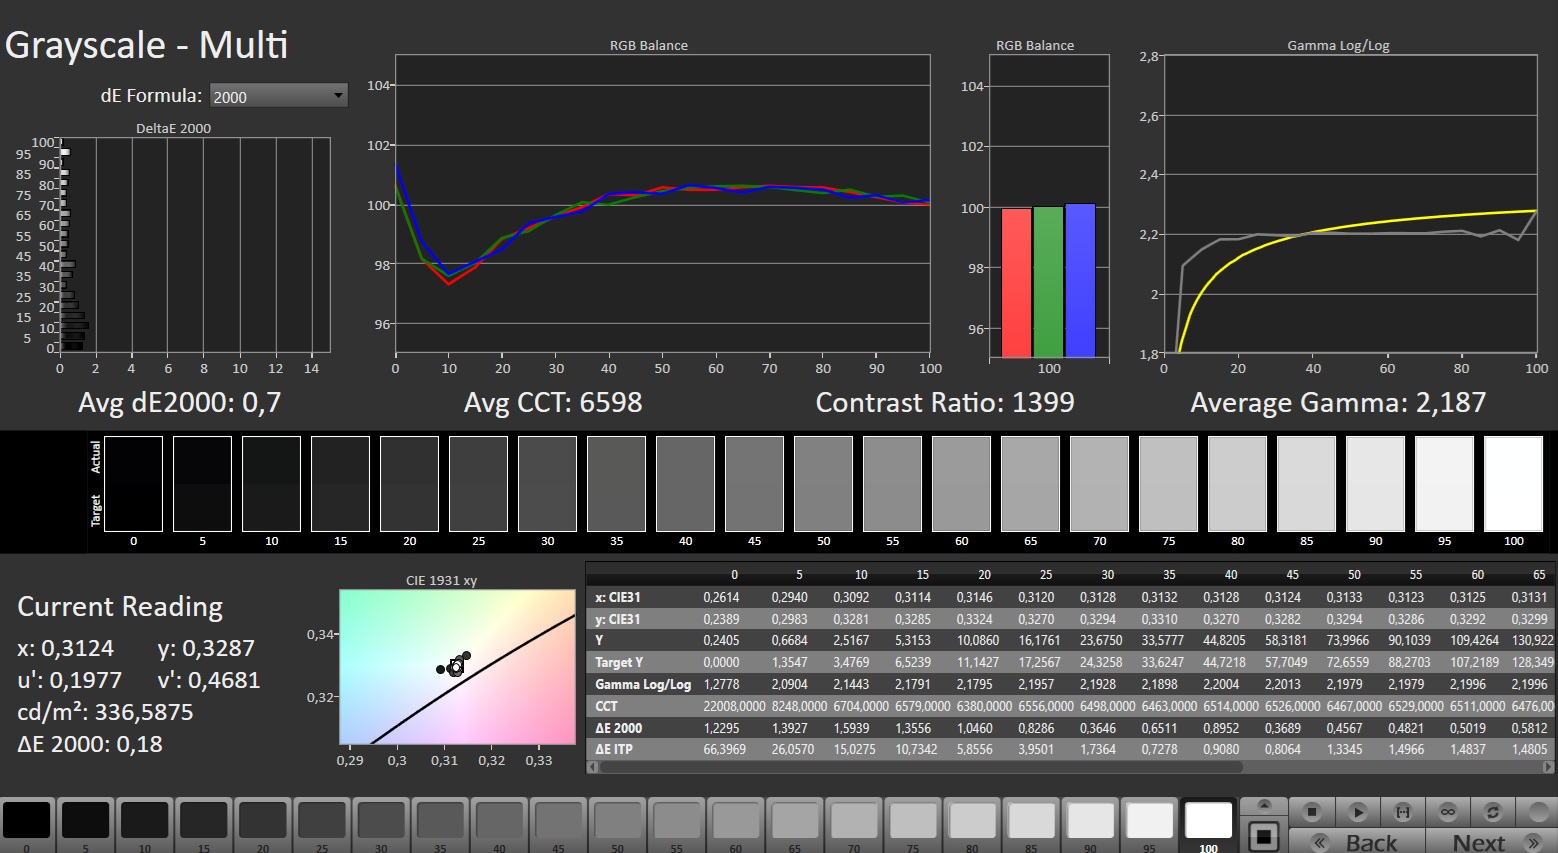
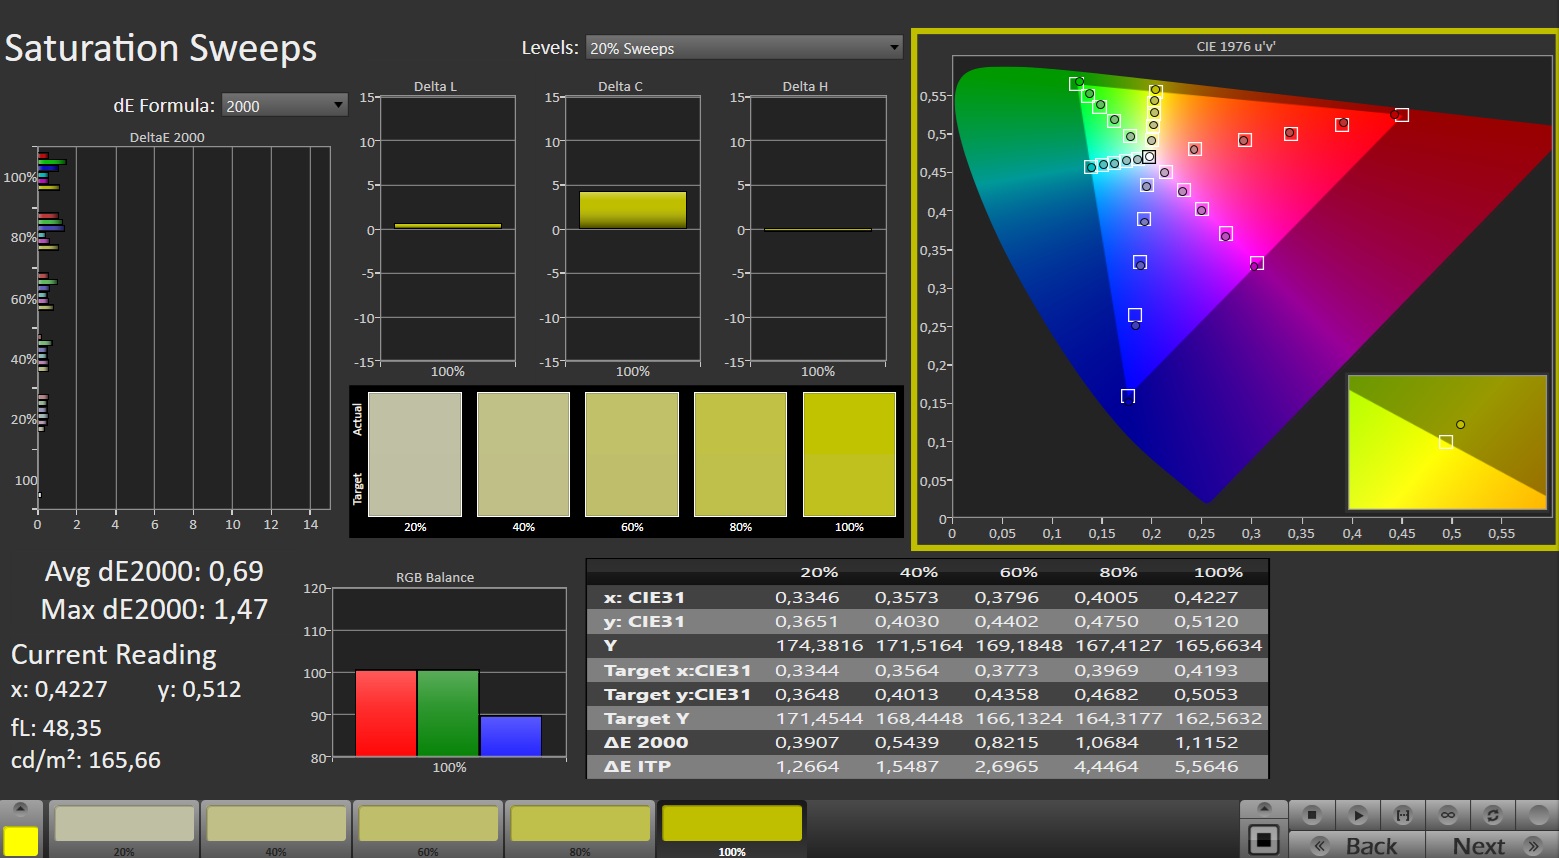
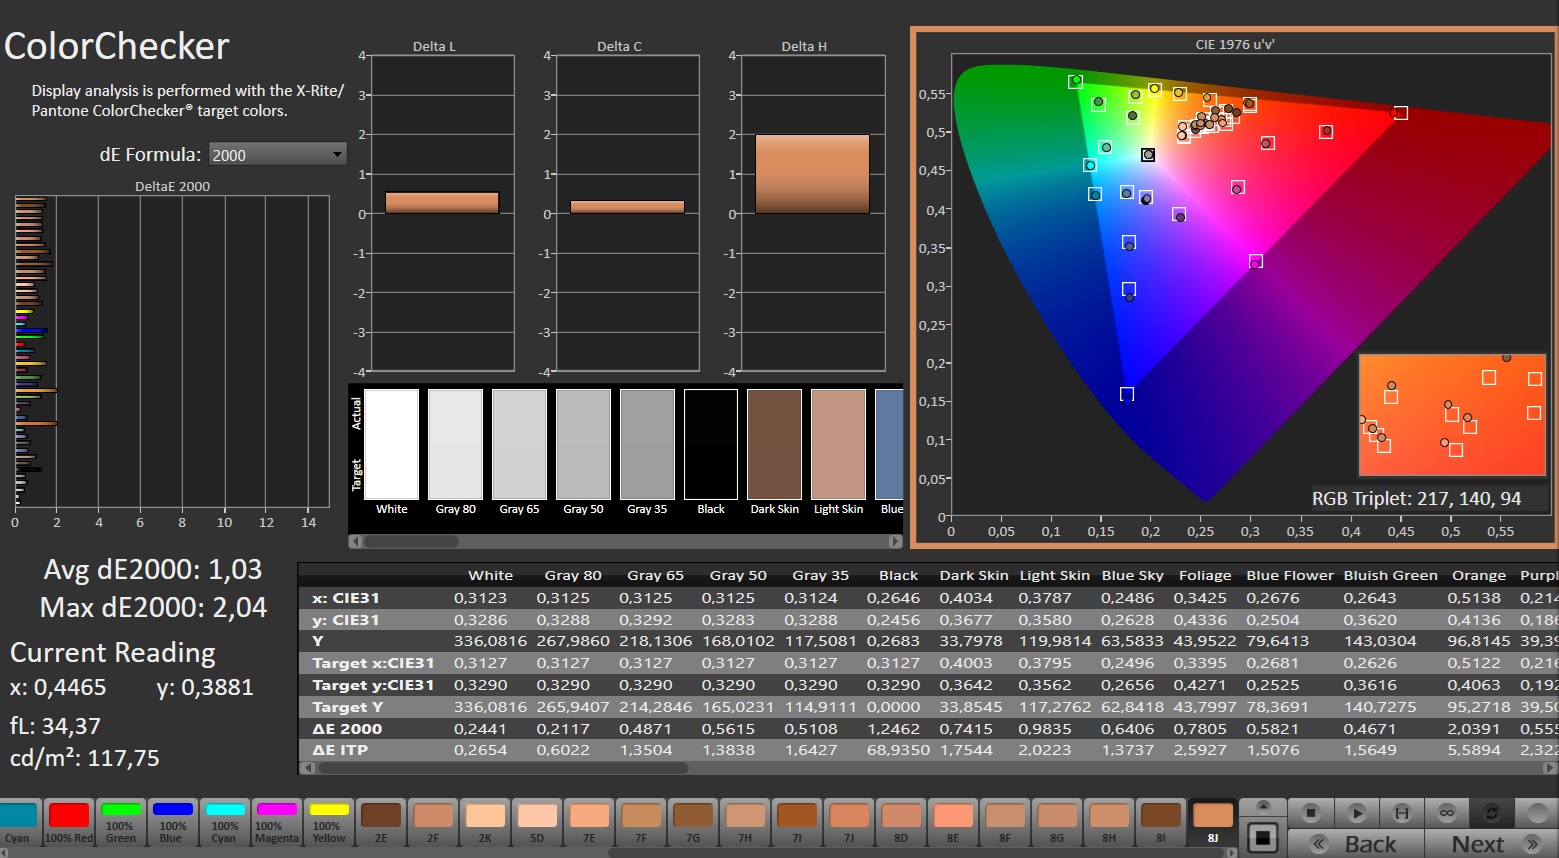
除了不同寻常的尺寸外,华硕还采用了相对不够出色的 IPS 面板。对于一款 18 英寸的设备来说,1920 x 1200 像素(16:10 长宽比)的显示屏已经达到了极限;我们希望看到至少 2560 x 1600 像素的显示屏。不过,在我们的测试中,显示屏没有出现任何明显的错误。略低于 100% sRGB 的覆盖率与 1375:1 的对比度一样适合笔记本电脑的价格。324 cd/m² 左右的亮度足以应付大多数室内环境,但在室外使用时则需要更高的亮度。在交付状态下,面板有轻微的偏蓝现象,但可以通过校准来纠正。其响应时间在典型的 IPS 范围内。我们没有发现图像闪烁现象。
| |||||||||||||||||||||||||
Brightness Distribution: 89 %
Center on Battery: 330 cd/m²
Contrast: 1375:1 (Black: 0.24 cd/m²)
ΔE Color 2.34 | 0.5-29.43 Ø4.87, calibrated: 1.03
ΔE Greyscale 3.9 | 0.5-98 Ø5.1
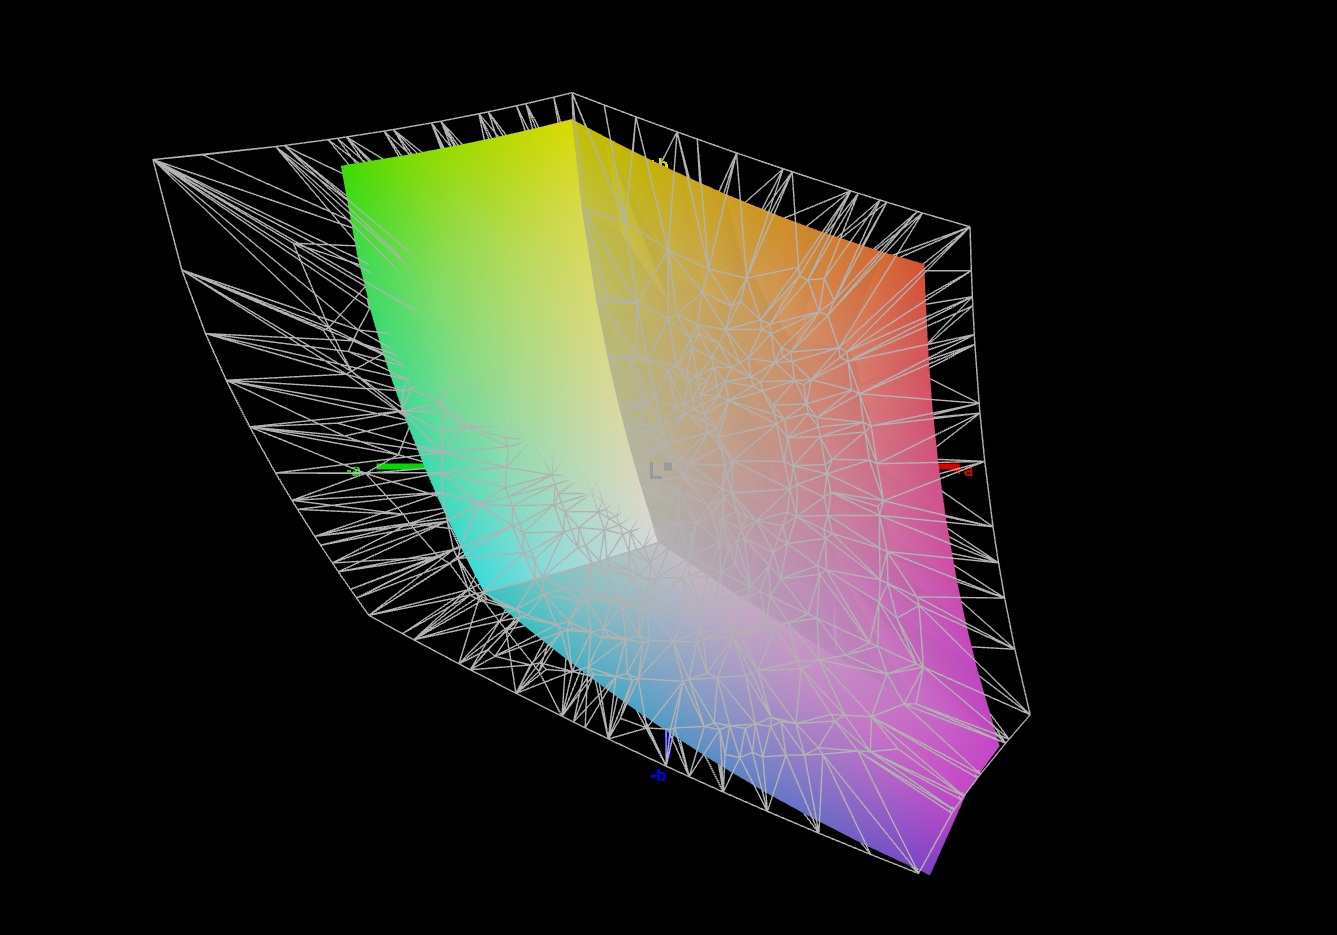
68.8% AdobeRGB 1998 (Argyll 2.2.0 3D)
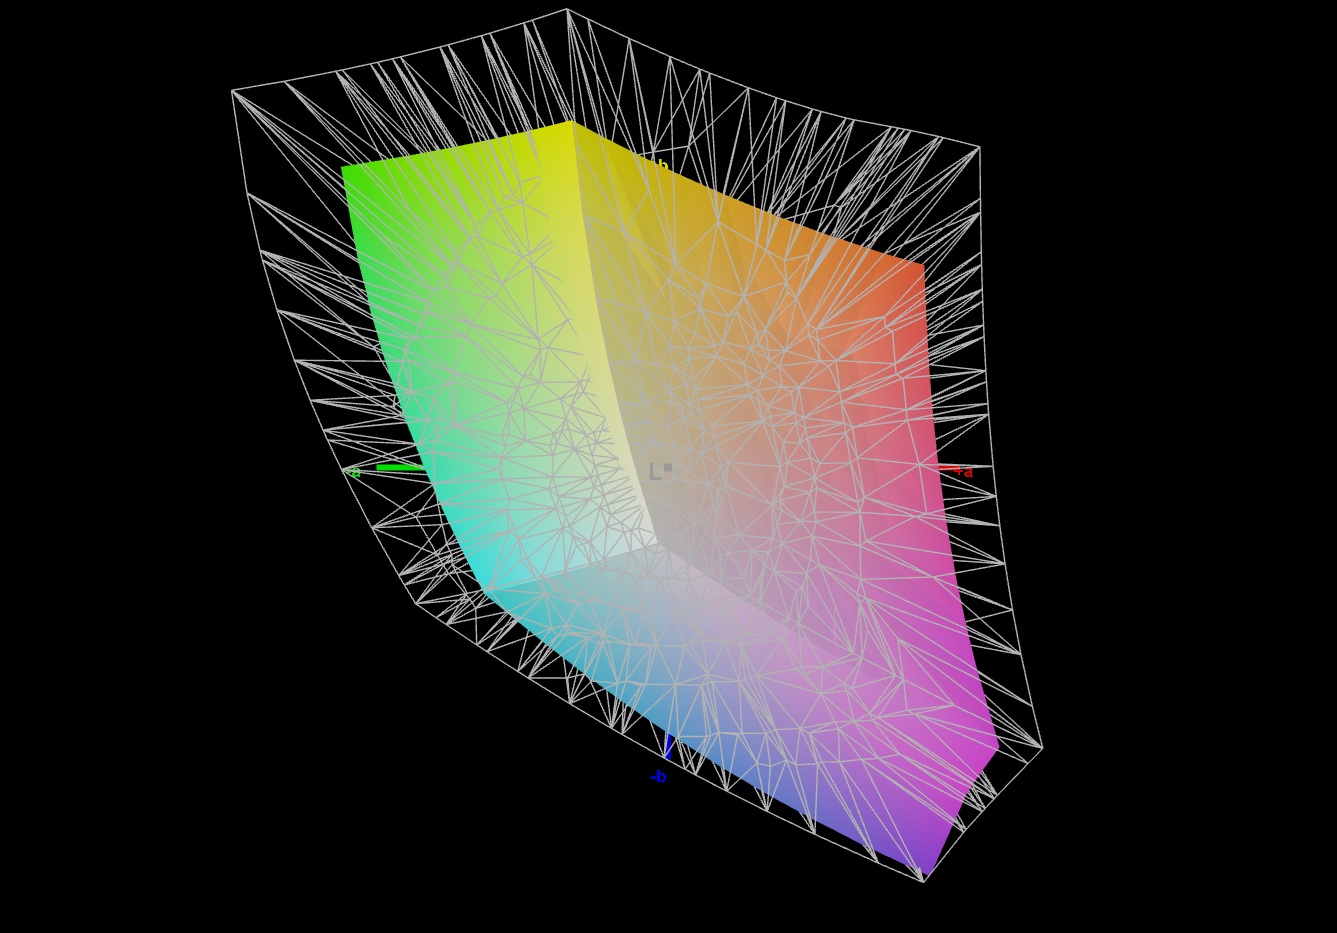
97.7% sRGB (Argyll 2.2.0 3D)
66.9% Display P3 (Argyll 2.2.0 3D)
Gamma: 2.112
| Asus VivoBook 18 M1807HA BOE NE180WUM-NY3, IPS, 1920x1200, 18.4", 144 Hz | HP Envy x360 2-in-1 16-ad0097nr Samsung SDC41A6, OLED, 2880x1800, 16", 120 Hz | Acer Swift Edge SFE16 Ryzen 7 7840U Samsung ATNA60BX03-0, OLED, 3200x2000, 16", 120 Hz | MSI Prestige A16 AI+ A3HMG-036 AUO28B2 (B160QAN02.N), IPS, 2560x1600, 16", 165 Hz | Samsung Galaxy Book5 Pro 360 ATNA60CL09-0, OLED, 2880x1800, 16", 120 Hz | |
|---|---|---|---|---|---|
| Display | 30% | 32% | 21% | 30% | |
| Display P3 Coverage | 66.9 | 99.6 49% | 99.9 49% | 94.6 41% | 99.9 49% |
| sRGB Coverage | 97.7 | 100 2% | 100 2% | 99.7 2% | 100 2% |
| AdobeRGB 1998 Coverage | 68.8 | 96.5 40% | 100 45% | 83.4 21% | 96.6 40% |
| Response Times | 93% | 93% | 20% | 95% | |
| Response Time Grey 50% / Grey 80% * | 13.8 ? | 0.8 ? 94% | 0.57 ? 96% | 5.6 ? 59% | 0.48 ? 97% |
| Response Time Black / White * | 9.4 ? | 0.89 ? 91% | 1 ? 89% | 11.2 ? -19% | 0.64 ? 93% |
| PWM Frequency | 491.8 ? | 238.8 | 240 ? | ||
| Screen | 9% | 9% | -6% | 39% | |
| Brightness middle | 330 | 399.4 21% | 379.8 15% | 488 48% | 387 17% |
| Brightness | 324 | 405 25% | 383 18% | 444 37% | 392 21% |
| Brightness Distribution | 89 | 98 10% | 98 10% | 86 -3% | 98 10% |
| Black Level * | 0.24 | 0.36 -50% | |||
| Contrast | 1375 | 1356 -1% | |||
| Colorchecker dE 2000 * | 2.34 | 4.05 -73% | 4.7 -101% | 3.45 -47% | 1 57% |
| Colorchecker dE 2000 max. * | 6.94 | 6.69 4% | 7.51 -8% | 6.77 2% | 1.9 73% |
| Colorchecker dE 2000 calibrated * | 1.03 | 1.02 1% | 0.55 47% | 1.35 -31% | |
| Greyscale dE 2000 * | 3.9 | 1.1 72% | 0.8 79% | 4.16 -7% | 1.7 56% |
| Gamma | 2.112 104% | 2.27 97% | 2.22 99% | 2.52 87% | 2.25 98% |
| CCT | 6875 95% | 6419 101% | 6381 102% | 6832 95% | 6325 103% |
| Total Average (Program / Settings) | 44% /
28% | 45% /
28% | 12% /
4% | 55% /
47% |
* ... smaller is better

Display Response Times
| ↔ Response Time Black to White | ||
|---|---|---|
| 9.4 ms ... rise ↗ and fall ↘ combined | ↗ 5 ms rise | 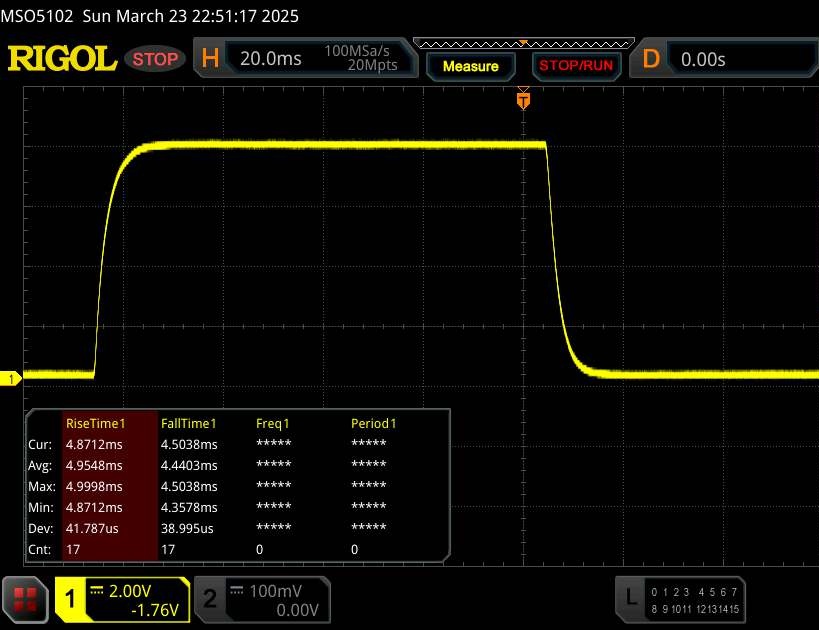 |
| ↘ 4.4 ms fall | ||
| The screen shows fast response rates in our tests and should be suited for gaming. In comparison, all tested devices range from 0.1 (minimum) to 240 (maximum) ms. » 23 % of all devices are better. This means that the measured response time is better than the average of all tested devices (20.8 ms). | ||
| ↔ Response Time 50% Grey to 80% Grey | ||
| 13.8 ms ... rise ↗ and fall ↘ combined | ↗ 6.7 ms rise | 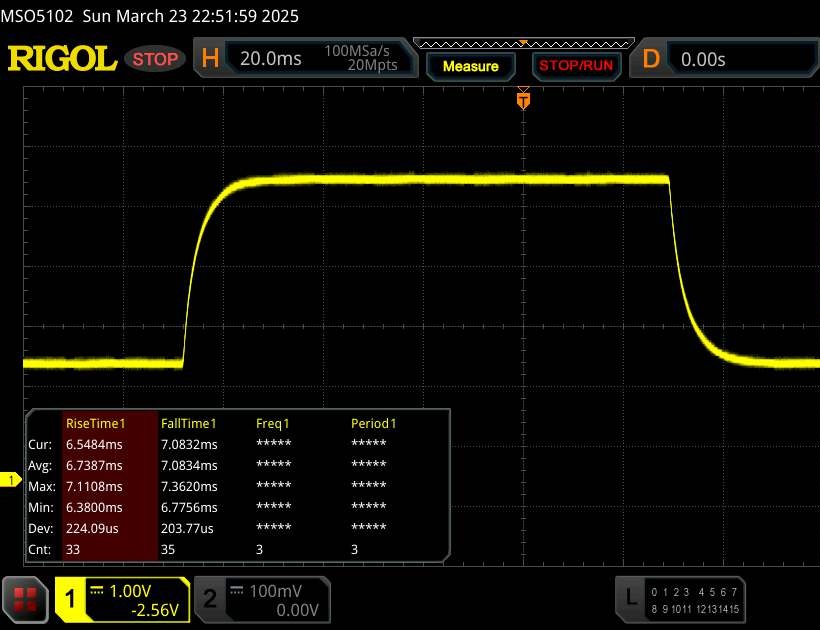 |
| ↘ 7.1 ms fall | ||
| The screen shows good response rates in our tests, but may be too slow for competitive gamers. In comparison, all tested devices range from 0.165 (minimum) to 636 (maximum) ms. » 25 % of all devices are better. This means that the measured response time is better than the average of all tested devices (32.5 ms). | ||
Screen Flickering / PWM (Pulse-Width Modulation)
| Screen flickering / PWM not detected | 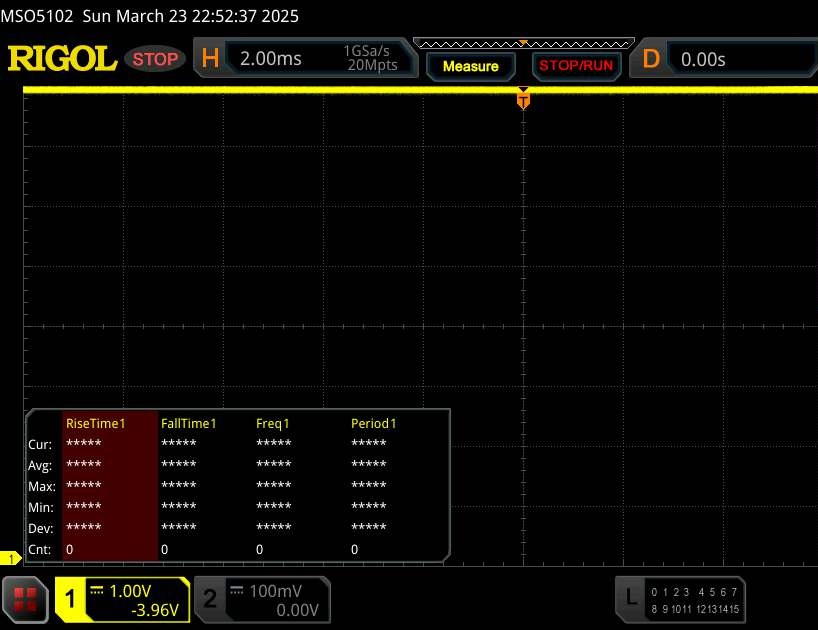 | ||
In comparison: 53 % of all tested devices do not use PWM to dim the display. If PWM was detected, an average of 8516 (minimum: 5 - maximum: 343500) Hz was measured. | |||
性能
在我们的测试中,CPU 性能处于中端水平,而 GPU 性能却只处于入门级水平。16GB 内存和 512GB 固态硬盘对于其不到 1,000 美元的价格来说还算不错,但并没有什么值得称道的地方。

测试条件
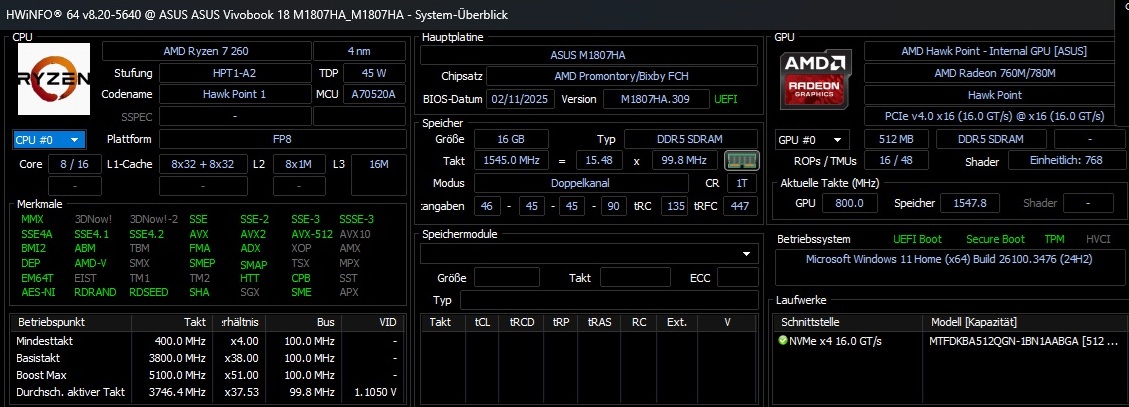
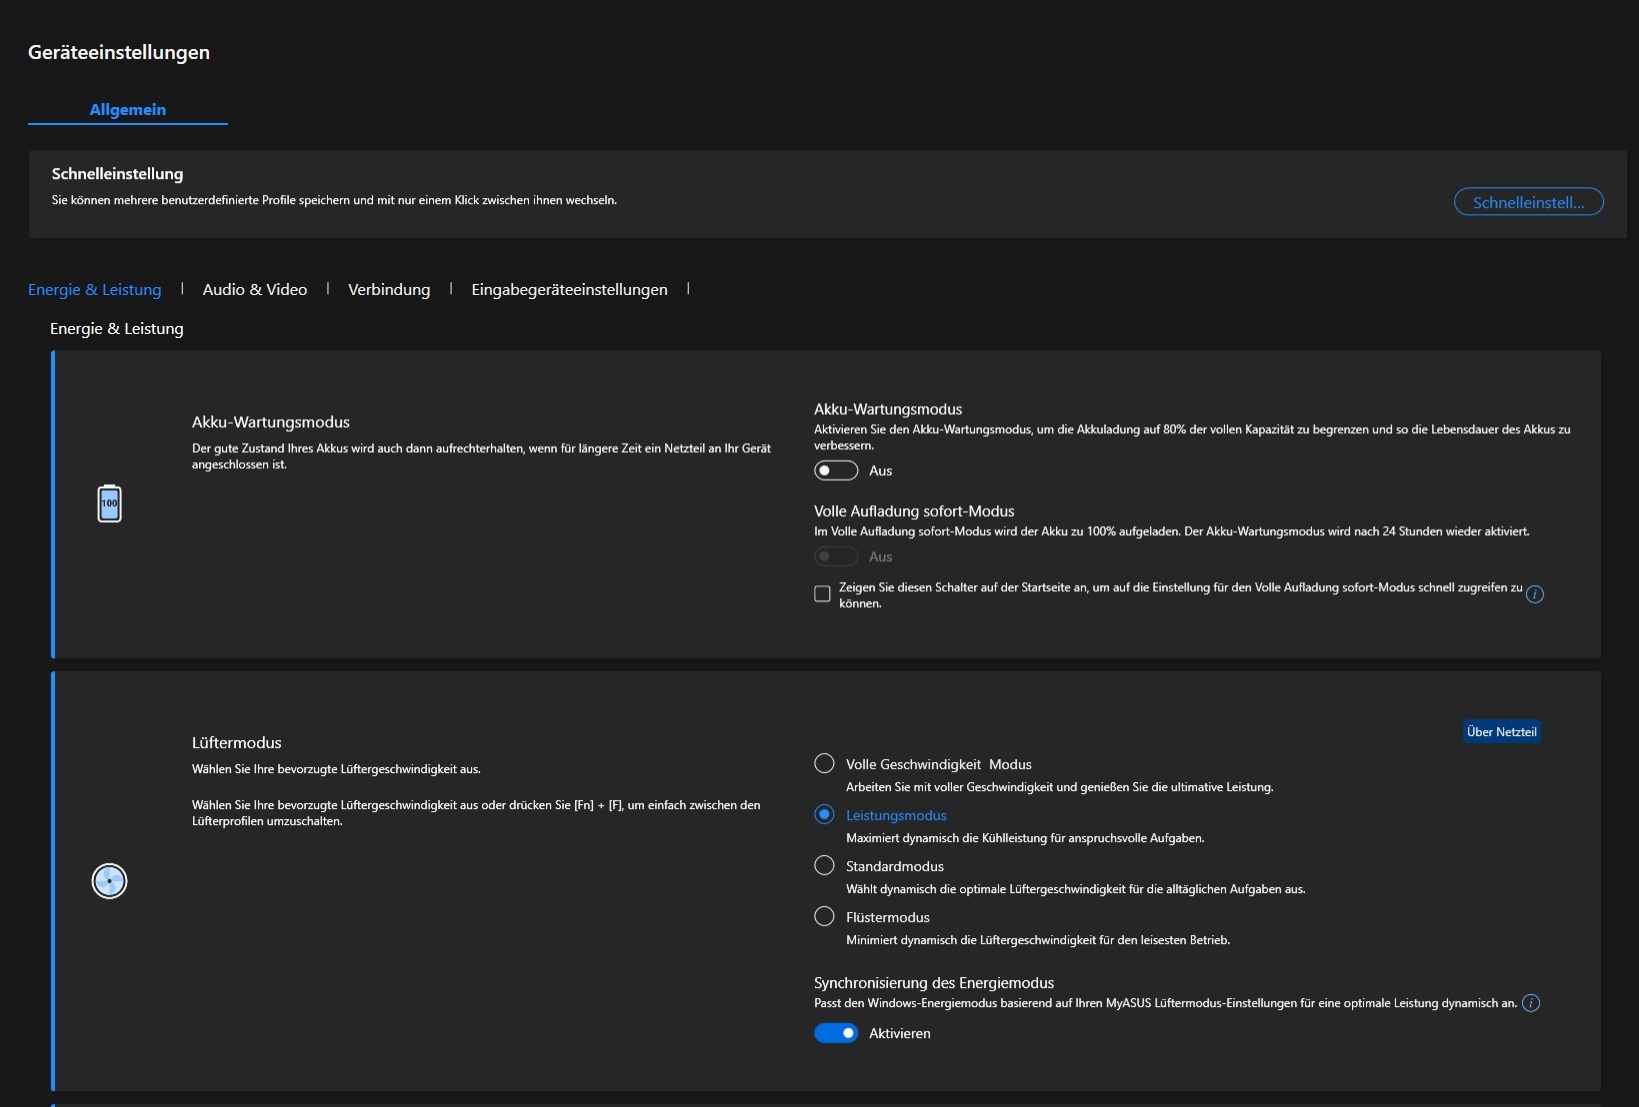
MyAsus 软件包含四种运行模式,主要在噪音开发和处理器 TDP 方面有所不同(见表)。图形功耗方面的偏差非常有限。我们的测量是在性能模式下进行的。
| 华硕模式 | 低声模式 | 标准 | 性能 | 全速 |
| 赛博朋克 2077 噪音 | 34 dB(A) | 40 dB(A) | 50 dB(A) | 55 dB(A) |
| 赛博朋克 2077》性能(FHD/超高清) | 13.2fps | 13.5fps | 13.6fps | 13.7fps |
| Cinebench R15 Multi Score | 2002 分 | 2358 分 | 2523 分 | 2539 分 |
| CPU PL1 | 27 瓦 | 40 瓦 | 54 瓦 | 54 瓦 |
| CPU PL2 | 32 瓦 | 50 瓦 | 60 瓦 | 60 瓦 |
处理器
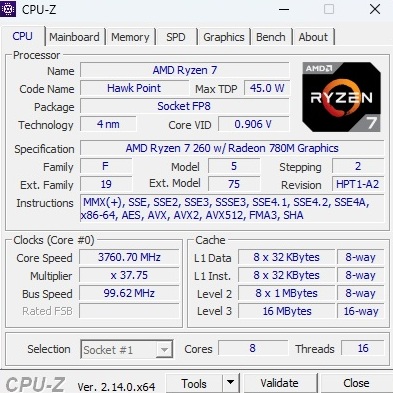
......(英文 Ryzen 7 260Ryzen 7 260 是 Zen 4 代(4 纳米)的八核机型,我们之前未对其进行过测试,它可通过 SMT 处理多达 16 个并行线程,并拥有 16 MB 三级缓存。在基准测试过程中,这款笔记本电脑的 CPU 表现相当出色,几乎可以媲美 Ryzen AI 9 365(微星 Prestige A16)不相上下。
Cinebench R15 Multi continuous test
* ... smaller is better
AIDA64: FP32 Ray-Trace | FPU Julia | CPU SHA3 | CPU Queen | FPU SinJulia | FPU Mandel | CPU AES | CPU ZLib | FP64 Ray-Trace | CPU PhotoWorxx
| Performance Rating | |
| MSI Prestige A16 AI+ A3HMG-036 | |
| Asus VivoBook 18 M1807HA | |
| Average AMD Ryzen 7 260 | |
| HP Envy x360 2-in-1 16-ad0097nr | |
| Acer Swift Edge SFE16 Ryzen 7 7840U | |
| Average of class Office | |
| Samsung Galaxy Book5 Pro 360 | |
| AIDA64 / FP32 Ray-Trace | |
| MSI Prestige A16 AI+ A3HMG-036 | |
| Asus VivoBook 18 M1807HA | |
| Average AMD Ryzen 7 260 (n=1) | |
| HP Envy x360 2-in-1 16-ad0097nr | |
| Acer Swift Edge SFE16 Ryzen 7 7840U | |
| Samsung Galaxy Book5 Pro 360 | |
| Average of class Office (763 - 31245, n=92, last 2 years) | |
| AIDA64 / FPU Julia | |
| MSI Prestige A16 AI+ A3HMG-036 | |
| Asus VivoBook 18 M1807HA | |
| Average AMD Ryzen 7 260 (n=1) | |
| HP Envy x360 2-in-1 16-ad0097nr | |
| Acer Swift Edge SFE16 Ryzen 7 7840U | |
| Samsung Galaxy Book5 Pro 360 | |
| Average of class Office (4113 - 125394, n=92, last 2 years) | |
| AIDA64 / CPU SHA3 | |
| Asus VivoBook 18 M1807HA | |
| Average AMD Ryzen 7 260 (n=1) | |
| MSI Prestige A16 AI+ A3HMG-036 | |
| HP Envy x360 2-in-1 16-ad0097nr | |
| Acer Swift Edge SFE16 Ryzen 7 7840U | |
| Samsung Galaxy Book5 Pro 360 | |
| Average of class Office (287 - 5398, n=92, last 2 years) | |
| AIDA64 / CPU Queen | |
| Asus VivoBook 18 M1807HA | |
| Average AMD Ryzen 7 260 (n=1) | |
| HP Envy x360 2-in-1 16-ad0097nr | |
| Acer Swift Edge SFE16 Ryzen 7 7840U | |
| MSI Prestige A16 AI+ A3HMG-036 | |
| Average of class Office (8185 - 115197, n=92, last 2 years) | |
| Samsung Galaxy Book5 Pro 360 | |
| AIDA64 / FPU SinJulia | |
| MSI Prestige A16 AI+ A3HMG-036 | |
| Asus VivoBook 18 M1807HA | |
| Average AMD Ryzen 7 260 (n=1) | |
| HP Envy x360 2-in-1 16-ad0097nr | |
| Acer Swift Edge SFE16 Ryzen 7 7840U | |
| Average of class Office (404 - 18321, n=92, last 2 years) | |
| Samsung Galaxy Book5 Pro 360 | |
| AIDA64 / FPU Mandel | |
| MSI Prestige A16 AI+ A3HMG-036 | |
| Asus VivoBook 18 M1807HA | |
| Average AMD Ryzen 7 260 (n=1) | |
| HP Envy x360 2-in-1 16-ad0097nr | |
| Acer Swift Edge SFE16 Ryzen 7 7840U | |
| Samsung Galaxy Book5 Pro 360 | |
| Average of class Office (2075 - 66922, n=92, last 2 years) | |
| AIDA64 / CPU AES | |
| Asus VivoBook 18 M1807HA | |
| Average AMD Ryzen 7 260 (n=1) | |
| HP Envy x360 2-in-1 16-ad0097nr | |
| MSI Prestige A16 AI+ A3HMG-036 | |
| Acer Swift Edge SFE16 Ryzen 7 7840U | |
| Average of class Office (7254 - 155900, n=92, last 2 years) | |
| Samsung Galaxy Book5 Pro 360 | |
| AIDA64 / CPU ZLib | |
| MSI Prestige A16 AI+ A3HMG-036 | |
| Asus VivoBook 18 M1807HA | |
| Average AMD Ryzen 7 260 (n=1) | |
| HP Envy x360 2-in-1 16-ad0097nr | |
| Acer Swift Edge SFE16 Ryzen 7 7840U | |
| Average of class Office (78 - 1366, n=92, last 2 years) | |
| Samsung Galaxy Book5 Pro 360 | |
| AIDA64 / FP64 Ray-Trace | |
| MSI Prestige A16 AI+ A3HMG-036 | |
| Asus VivoBook 18 M1807HA | |
| Average AMD Ryzen 7 260 (n=1) | |
| HP Envy x360 2-in-1 16-ad0097nr | |
| Acer Swift Edge SFE16 Ryzen 7 7840U | |
| Samsung Galaxy Book5 Pro 360 | |
| Average of class Office (432 - 17834, n=92, last 2 years) | |
| AIDA64 / CPU PhotoWorxx | |
| Samsung Galaxy Book5 Pro 360 | |
| MSI Prestige A16 AI+ A3HMG-036 | |
| HP Envy x360 2-in-1 16-ad0097nr | |
| Average of class Office (4814 - 54971, n=92, last 2 years) | |
| Acer Swift Edge SFE16 Ryzen 7 7840U | |
| Asus VivoBook 18 M1807HA | |
| Average AMD Ryzen 7 260 (n=1) | |
系统性能
尽管 VivoBook 18 的系统性能在对比设备中仅处于中游水平,但这款笔记本电脑的系统性能也不差。在我们的测试中,其工作内存的迟缓变得十分明显。
CrossMark: Overall | Productivity | Creativity | Responsiveness
WebXPRT 3: Overall
WebXPRT 4: Overall
Mozilla Kraken 1.1: Total
| PCMark 10 / Score | |
| MSI Prestige A16 AI+ A3HMG-036 | |
| HP Envy x360 2-in-1 16-ad0097nr | |
| Acer Swift Edge SFE16 Ryzen 7 7840U | |
| Asus VivoBook 18 M1807HA | |
| Average AMD Ryzen 7 260, AMD Radeon 780M (n=1) | |
| Samsung Galaxy Book5 Pro 360 | |
| Average of class Office (2463 - 7578, n=82, last 2 years) | |
| PCMark 10 / Essentials | |
| MSI Prestige A16 AI+ A3HMG-036 | |
| Acer Swift Edge SFE16 Ryzen 7 7840U | |
| HP Envy x360 2-in-1 16-ad0097nr | |
| Asus VivoBook 18 M1807HA | |
| Average AMD Ryzen 7 260, AMD Radeon 780M (n=1) | |
| Average of class Office (5575 - 20841, n=82, last 2 years) | |
| Samsung Galaxy Book5 Pro 360 | |
| PCMark 10 / Productivity | |
| MSI Prestige A16 AI+ A3HMG-036 | |
| Acer Swift Edge SFE16 Ryzen 7 7840U | |
| HP Envy x360 2-in-1 16-ad0097nr | |
| Asus VivoBook 18 M1807HA | |
| Average AMD Ryzen 7 260, AMD Radeon 780M (n=1) | |
| Samsung Galaxy Book5 Pro 360 | |
| Average of class Office (3041 - 10415, n=82, last 2 years) | |
| PCMark 10 / Digital Content Creation | |
| MSI Prestige A16 AI+ A3HMG-036 | |
| Samsung Galaxy Book5 Pro 360 | |
| Asus VivoBook 18 M1807HA | |
| Average AMD Ryzen 7 260, AMD Radeon 780M (n=1) | |
| HP Envy x360 2-in-1 16-ad0097nr | |
| Acer Swift Edge SFE16 Ryzen 7 7840U | |
| Average of class Office (2049 - 11108, n=82, last 2 years) | |
| CrossMark / Overall | |
| Acer Swift Edge SFE16 Ryzen 7 7840U | |
| MSI Prestige A16 AI+ A3HMG-036 | |
| HP Envy x360 2-in-1 16-ad0097nr | |
| Samsung Galaxy Book5 Pro 360 | |
| Average of class Office (348 - 1891, n=86, last 2 years) | |
| CrossMark / Productivity | |
| Acer Swift Edge SFE16 Ryzen 7 7840U | |
| HP Envy x360 2-in-1 16-ad0097nr | |
| MSI Prestige A16 AI+ A3HMG-036 | |
| Samsung Galaxy Book5 Pro 360 | |
| Average of class Office (393 - 1870, n=86, last 2 years) | |
| CrossMark / Creativity | |
| MSI Prestige A16 AI+ A3HMG-036 | |
| Acer Swift Edge SFE16 Ryzen 7 7840U | |
| HP Envy x360 2-in-1 16-ad0097nr | |
| Samsung Galaxy Book5 Pro 360 | |
| Average of class Office (340 - 2155, n=86, last 2 years) | |
| CrossMark / Responsiveness | |
| Acer Swift Edge SFE16 Ryzen 7 7840U | |
| HP Envy x360 2-in-1 16-ad0097nr | |
| MSI Prestige A16 AI+ A3HMG-036 | |
| Samsung Galaxy Book5 Pro 360 | |
| Average of class Office (258 - 2017, n=86, last 2 years) | |
| WebXPRT 3 / Overall | |
| MSI Prestige A16 AI+ A3HMG-036 | |
| Acer Swift Edge SFE16 Ryzen 7 7840U | |
| HP Envy x360 2-in-1 16-ad0097nr | |
| Asus VivoBook 18 M1807HA | |
| Average AMD Ryzen 7 260, AMD Radeon 780M (n=1) | |
| Samsung Galaxy Book5 Pro 360 | |
| Average of class Office (121 - 455, n=85, last 2 years) | |
| WebXPRT 4 / Overall | |
| MSI Prestige A16 AI+ A3HMG-036 | |
| Asus VivoBook 18 M1807HA | |
| Average AMD Ryzen 7 260, AMD Radeon 780M (n=1) | |
| Samsung Galaxy Book5 Pro 360 | |
| Acer Swift Edge SFE16 Ryzen 7 7840U | |
| HP Envy x360 2-in-1 16-ad0097nr | |
| Average of class Office (80 - 328, n=86, last 2 years) | |
| Mozilla Kraken 1.1 / Total | |
| Average of class Office (399 - 1966, n=94, last 2 years) | |
| HP Envy x360 2-in-1 16-ad0097nr | |
| Acer Swift Edge SFE16 Ryzen 7 7840U | |
| Samsung Galaxy Book5 Pro 360 | |
| MSI Prestige A16 AI+ A3HMG-036 | |
* ... smaller is better
| PCMark 10 Score | 6810 points | |
Help | ||
| AIDA64 / Memory Copy | |
| Samsung Galaxy Book5 Pro 360 | |
| MSI Prestige A16 AI+ A3HMG-036 | |
| HP Envy x360 2-in-1 16-ad0097nr | |
| Acer Swift Edge SFE16 Ryzen 7 7840U | |
| Average of class Office (7158 - 108783, n=93, last 2 years) | |
| Asus VivoBook 18 M1807HA | |
| Average AMD Ryzen 7 260 (n=1) | |
| AIDA64 / Memory Read | |
| MSI Prestige A16 AI+ A3HMG-036 | |
| Samsung Galaxy Book5 Pro 360 | |
| Average of class Office (7325 - 127282, n=93, last 2 years) | |
| Acer Swift Edge SFE16 Ryzen 7 7840U | |
| HP Envy x360 2-in-1 16-ad0097nr | |
| Asus VivoBook 18 M1807HA | |
| Average AMD Ryzen 7 260 (n=1) | |
| AIDA64 / Memory Write | |
| Samsung Galaxy Book5 Pro 360 | |
| MSI Prestige A16 AI+ A3HMG-036 | |
| Acer Swift Edge SFE16 Ryzen 7 7840U | |
| HP Envy x360 2-in-1 16-ad0097nr | |
| Average of class Office (7579 - 117935, n=93, last 2 years) | |
| Asus VivoBook 18 M1807HA | |
| Average AMD Ryzen 7 260 (n=1) | |
| AIDA64 / Memory Latency | |
| MSI Prestige A16 AI+ A3HMG-036 | |
| HP Envy x360 2-in-1 16-ad0097nr | |
| Acer Swift Edge SFE16 Ryzen 7 7840U | |
| Average of class Office (7.6 - 185.2, n=90, last 2 years) | |
| Samsung Galaxy Book5 Pro 360 | |
| Asus VivoBook 18 M1807HA | |
| Average AMD Ryzen 7 260 (n=1) | |
* ... smaller is better
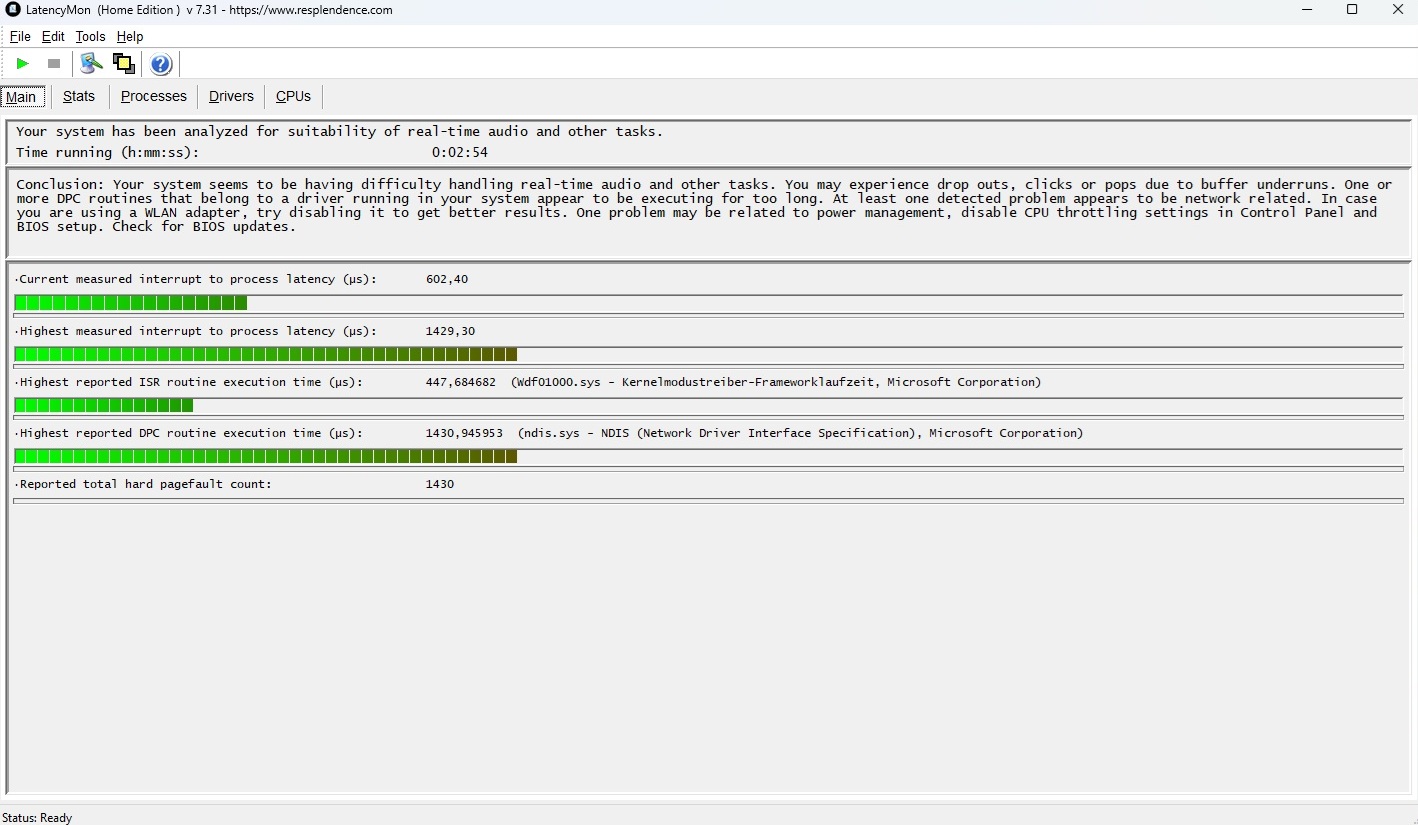
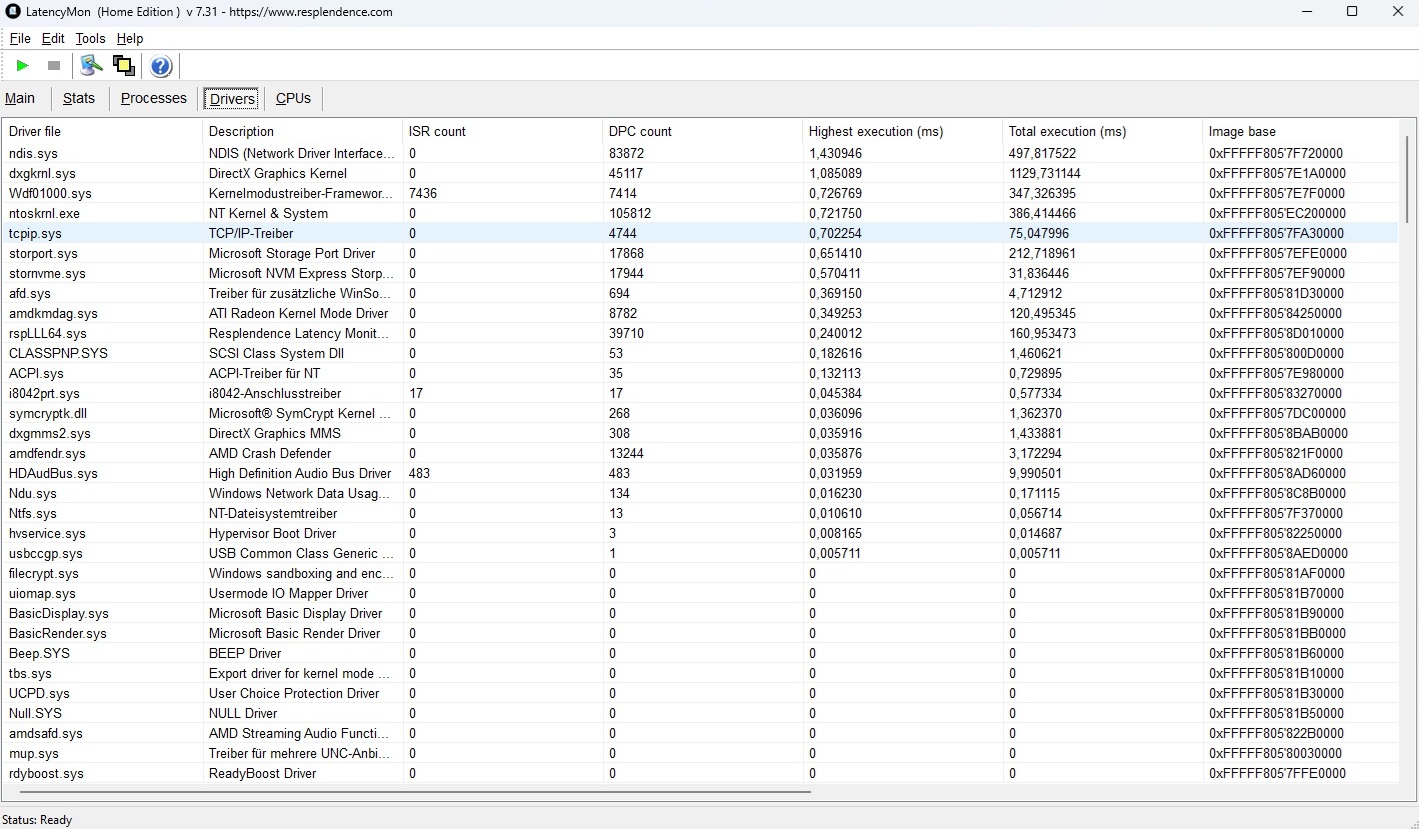
DPC 延迟
与大多数笔记本电脑一样,这款机型的延迟也是一个问题,这可能会导致在执行某些任务时出现一些问题。
| DPC Latencies / LatencyMon - interrupt to process latency (max), Web, Youtube, Prime95 | |
| HP Envy x360 2-in-1 16-ad0097nr | |
| Asus VivoBook 18 M1807HA | |
| Samsung Galaxy Book5 Pro 360 | |
| Acer Swift Edge SFE16 Ryzen 7 7840U | |
| MSI Prestige A16 AI+ A3HMG-036 | |
* ... smaller is better
存储设备
如果不考虑循环基准测试结束时性能略有下降的情况,我们测试设备中安装的美光 512GB SSD 总体性能相当不错。由于只有一个 M.2 插槽,如果容量过于紧张,就必须更换现有硬盘。

* ... smaller is better
Reading continuous performance: DiskSpd Read Loop, Queue Depth 8
图形卡
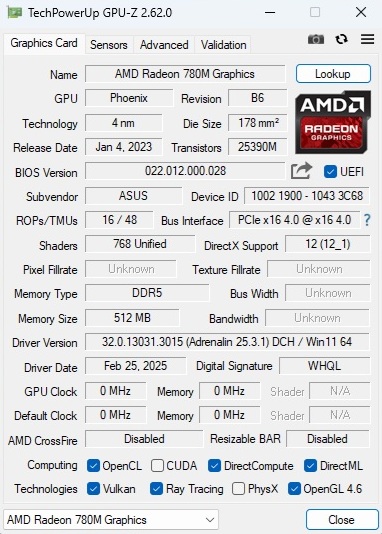
在性能方面,Radeon 780M Radeon 780M的性能相对令人失望。VivoBook 18 的 iGPU 计算速度比我们迄今测定的平均速度慢 30%--无论是在合成基准测试中还是在游戏时。三星 三星Galaxy Book5 Pro 360's Arc Graphics 130V和 微星 Prestige A16's Radeon 880M明显更快。
| 3DMark 06 Standard Score | 30503 points | |
| 3DMark 11 Performance | 8127 points | |
| 3DMark Ice Storm Standard Score | 159875 points | |
| 3DMark Cloud Gate Standard Score | 26552 points | |
| 3DMark Fire Strike Score | 4496 points | |
| 3DMark Time Spy Score | 1875 points | |
Help | ||
游戏性能
虽然 VivoBook 18 中的 Radeon 780M 仍能处理《GTA V》等较老的游戏,但在现代游戏中的表现却相当黯淡。在我们测试的大约 10 款 2023 年后发布的游戏中,只有 文明 7在低细节的情况下也能流畅运行。
| Cyberpunk 2077 2.2 Phantom Liberty - 1920x1080 Ultra Preset (FSR off) | |
| MSI Prestige A16 AI+ A3HMG-036 | |
| Samsung Galaxy Book5 Pro 360 | |
| Average AMD Radeon 780M (11.5 - 26.3, n=40) | |
| HP Envy x360 2-in-1 16-ad0097nr | |
| Average of class Office (6.65 - 29.6, n=38, last 2 years) | |
| Asus VivoBook 18 M1807HA | |
| GTA V - 1920x1080 Highest Settings possible AA:4xMSAA + FX AF:16x | |
| MSI Prestige A16 AI+ A3HMG-036 | |
| Average AMD Radeon 780M (12.2 - 29, n=57) | |
| Samsung Galaxy Book5 Pro 360 | |
| Acer Swift Edge SFE16 Ryzen 7 7840U | |
| Average of class Office (3.98 - 47.8, n=79, last 2 years) | |
| Asus VivoBook 18 M1807HA | |
| low | med. | high | ultra | |
|---|---|---|---|---|
| GTA V (2015) | 104.4 | 94.2 | 34.4 | 13.6 |
| Dota 2 Reborn (2015) | 125.3 | 91.1 | 36.5 | 34.4 |
| Final Fantasy XV Benchmark (2018) | 44.1 | 22 | 16.3 | |
| X-Plane 11.11 (2018) | 57 | 40.7 | 35.2 | |
| Strange Brigade (2018) | 88 | 34.9 | 30.2 | 26.4 |
| Baldur's Gate 3 (2023) | 23.6 | 19 | 15 | 14.2 |
| Cyberpunk 2077 2.2 Phantom Liberty (2023) | 23.9 | 19.6 | 15.1 | 13.6 |
| Space Marine 2 (2024) | 14 | 12.5 | 10.5 | |
| Until Dawn (2024) | 27.4 | 18.4 | 10.8 | |
| Call of Duty Black Ops 6 (2024) | 31 | 28 | 20 | |
| Stalker 2 (2024) | 12.3 | 11.3 | 9.31 | |
| Indiana Jones and the Great Circle (2024) | 12.7 | 0 () | ||
| Kingdom Come Deliverance 2 (2025) | 18 | 15.4 | 13.4 | |
| Civilization 7 (2025) | 66.7 | 26.6 | 13.9 |
正如我们的赛博朋克测试所显示的那样,至少它的帧速率长期保持稳定。
Cyberpunk 2077 ultra FPS diagram
排放量
噪音排放
如前所述,VivoBook 18 在性能模式下声音非常大,在我们的测试中超过了所有竞争设备。我们在负载状态下测得的 50-53 dB(A)的噪音非常大,这就是为什么我们建议在正常使用时使用标准模式(约 40 dB)--反正几乎不耗电。在空闲模式下,风扇很少静止不动,通常以 27-29 分贝(A)的相当低的水平运行。
Noise Level
| Idle |
| 27 / 28 / 29 dB(A) |
| Load |
| 52 / 53 dB(A) |
 | ||
30 dB silent 40 dB(A) audible 50 dB(A) loud |
||
min: | ||
| Asus VivoBook 18 M1807HA R7 260, Radeon 780M | HP Envy x360 2-in-1 16-ad0097nr R7 8840HS, Radeon 780M | Acer Swift Edge SFE16 Ryzen 7 7840U R7 7840U, Radeon 780M | MSI Prestige A16 AI+ A3HMG-036 Ryzen AI 9 365, Radeon 880M | Samsung Galaxy Book5 Pro 360 Core Ultra 5 226V, Arc 130V | |
|---|---|---|---|---|---|
| Noise | 22% | 13% | 16% | 20% | |
| off / environment * | 25 | 22.9 8% | 23.4 6% | 23 8% | 23.6 6% |
| Idle Minimum * | 27 | 23 15% | 24.1 11% | 23 15% | 23.6 13% |
| Idle Average * | 28 | 23 18% | 24.3 13% | 23 18% | 23.6 16% |
| Idle Maximum * | 29 | 23 21% | 28 3% | 25.02 14% | 23.6 19% |
| Load Average * | 52 | 23.8 54% | 41 21% | 41.88 19% | 29.4 43% |
| Cyberpunk 2077 ultra * | 50 | 39.79 20% | 40.6 19% | ||
| Load Maximum * | 53 | 43.8 17% | 40.9 23% | 41.88 21% | 40.6 23% |
| Witcher 3 ultra * | 43.8 | 40.9 |
* ... smaller is better
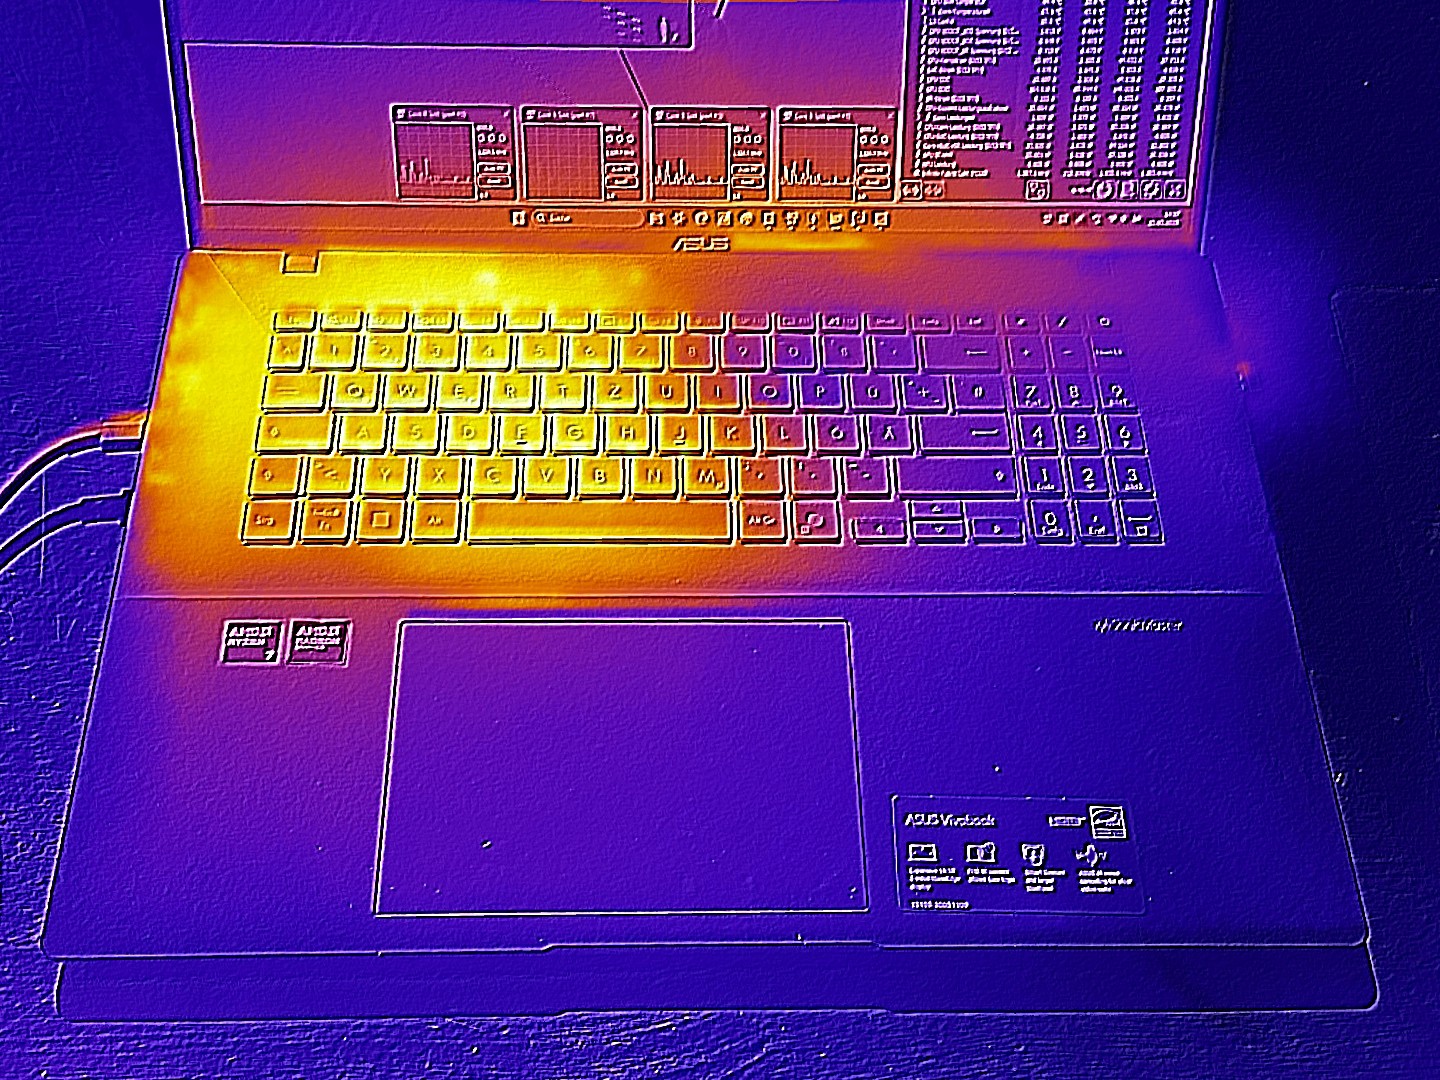
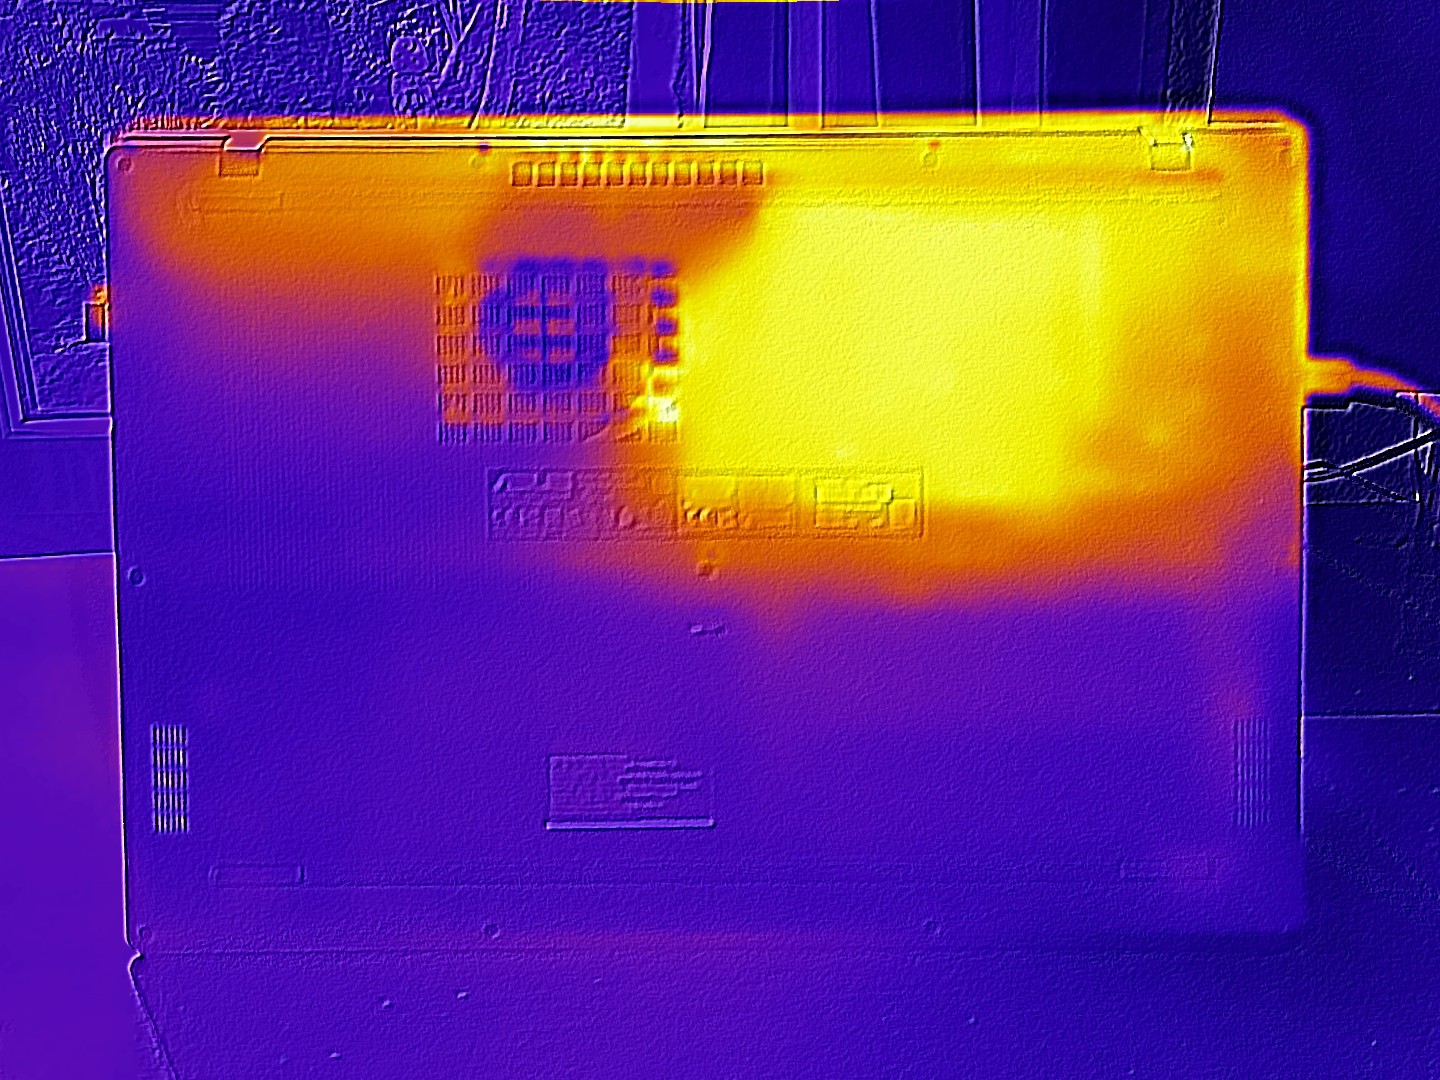
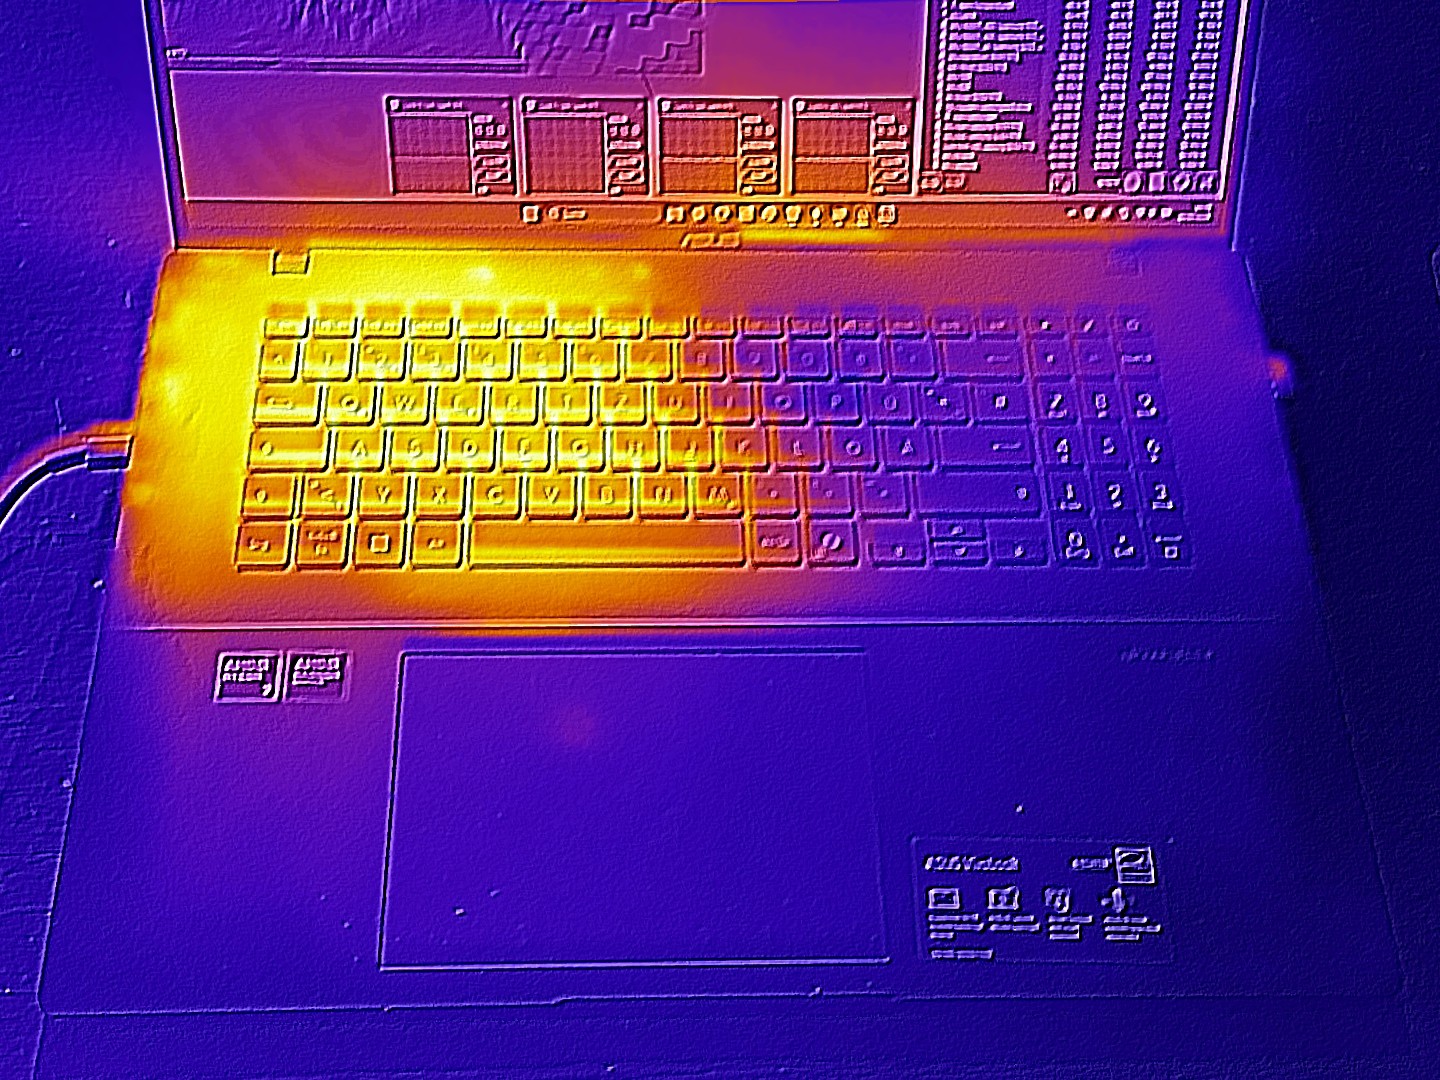
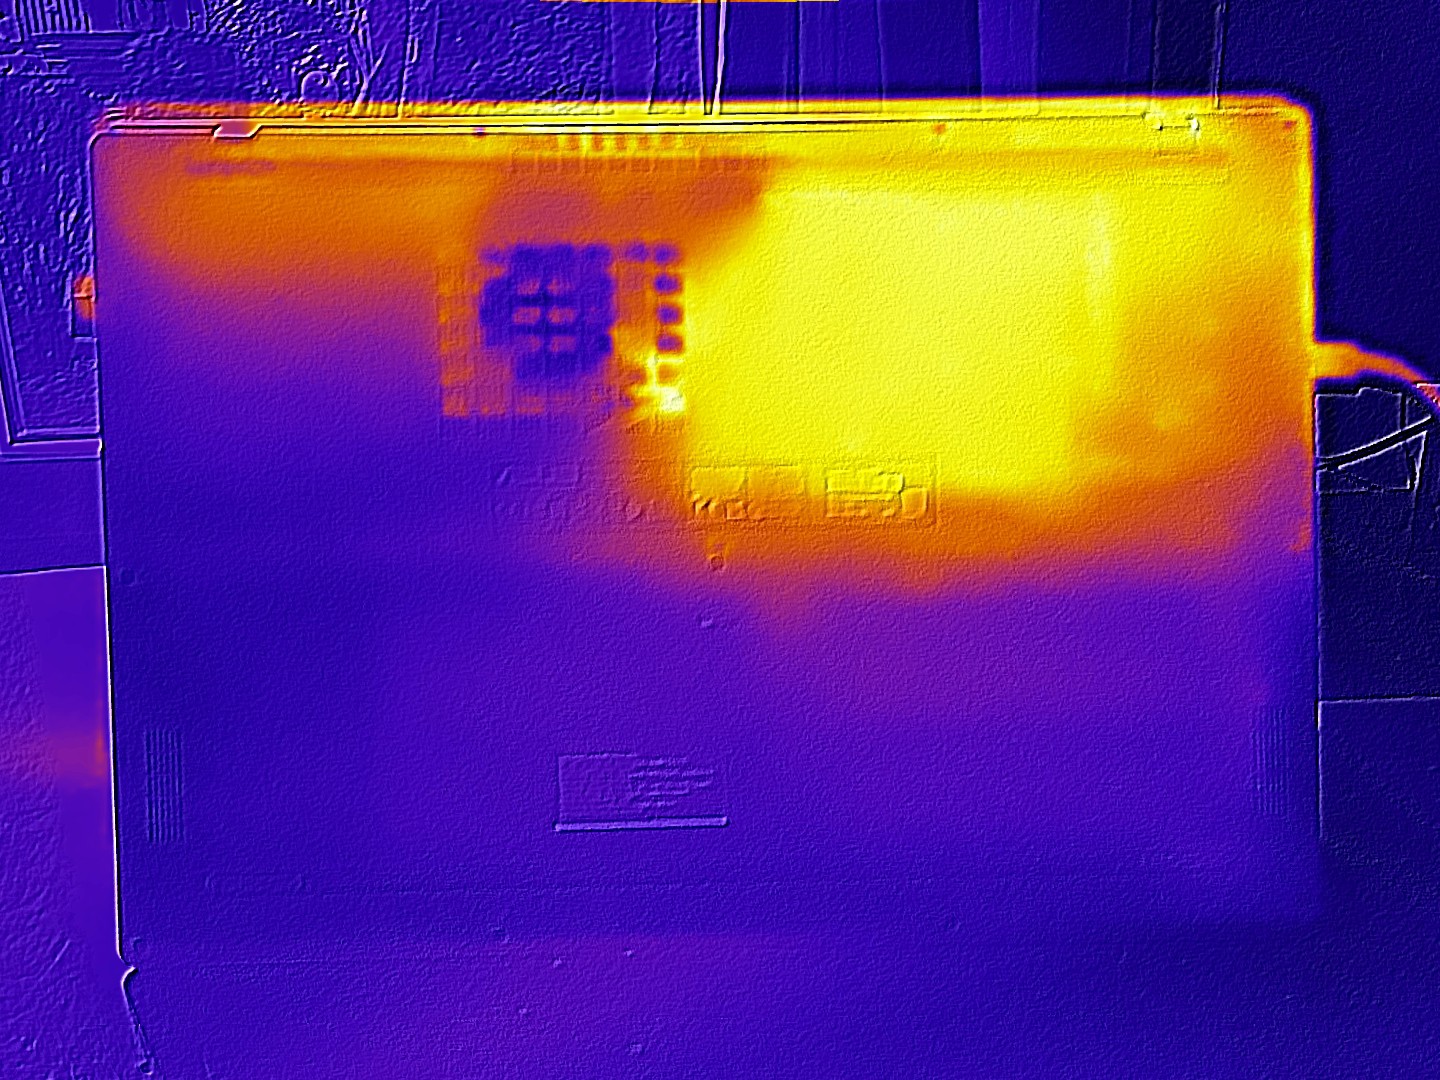
温度
在温度方面,这款 18 英寸设备没有带来任何惊喜。机箱顶部的最高温度为 47 °C,底部的最高温度为 45 °C,这都是可以接受的,尤其是在空闲状态下(低于 30 °C)仍能保持良好的低温。
(-) The maximum temperature on the upper side is 47 °C / 117 F, compared to the average of 34.3 °C / 94 F, ranging from 21.2 to 62.5 °C for the class Office.
(±) The bottom heats up to a maximum of 45 °C / 113 F, compared to the average of 36.8 °C / 98 F
(+) In idle usage, the average temperature for the upper side is 24.6 °C / 76 F, compared to the device average of 29.5 °C / 85 F.
(±) 3: The average temperature for the upper side is 36.9 °C / 98 F, compared to the average of 29.5 °C / 85 F for the class Office.
(+) The palmrests and touchpad are reaching skin temperature as a maximum (33 °C / 91.4 F) and are therefore not hot.
(-) The average temperature of the palmrest area of similar devices was 27.6 °C / 81.7 F (-5.4 °C / -9.7 F).
| Asus VivoBook 18 M1807HA R7 260, Radeon 780M | HP Envy x360 2-in-1 16-ad0097nr R7 8840HS, Radeon 780M | Acer Swift Edge SFE16 Ryzen 7 7840U R7 7840U, Radeon 780M | MSI Prestige A16 AI+ A3HMG-036 Ryzen AI 9 365, Radeon 880M | Samsung Galaxy Book5 Pro 360 Core Ultra 5 226V, Arc 130V | |
|---|---|---|---|---|---|
| Heat | -2% | -8% | -6% | 8% | |
| Maximum Upper Side * | 47 | 42.6 9% | 41.6 11% | 52 -11% | 40.9 13% |
| Maximum Bottom * | 45 | 47.8 -6% | 46.6 -4% | 44 2% | 45.1 -0% |
| Idle Upper Side * | 27 | 27.4 -1% | 30.4 -13% | 28 -4% | 23.8 12% |
| Idle Bottom * | 25 | 27.8 -11% | 31 -24% | 28 -12% | 23.5 6% |
* ... smaller is better
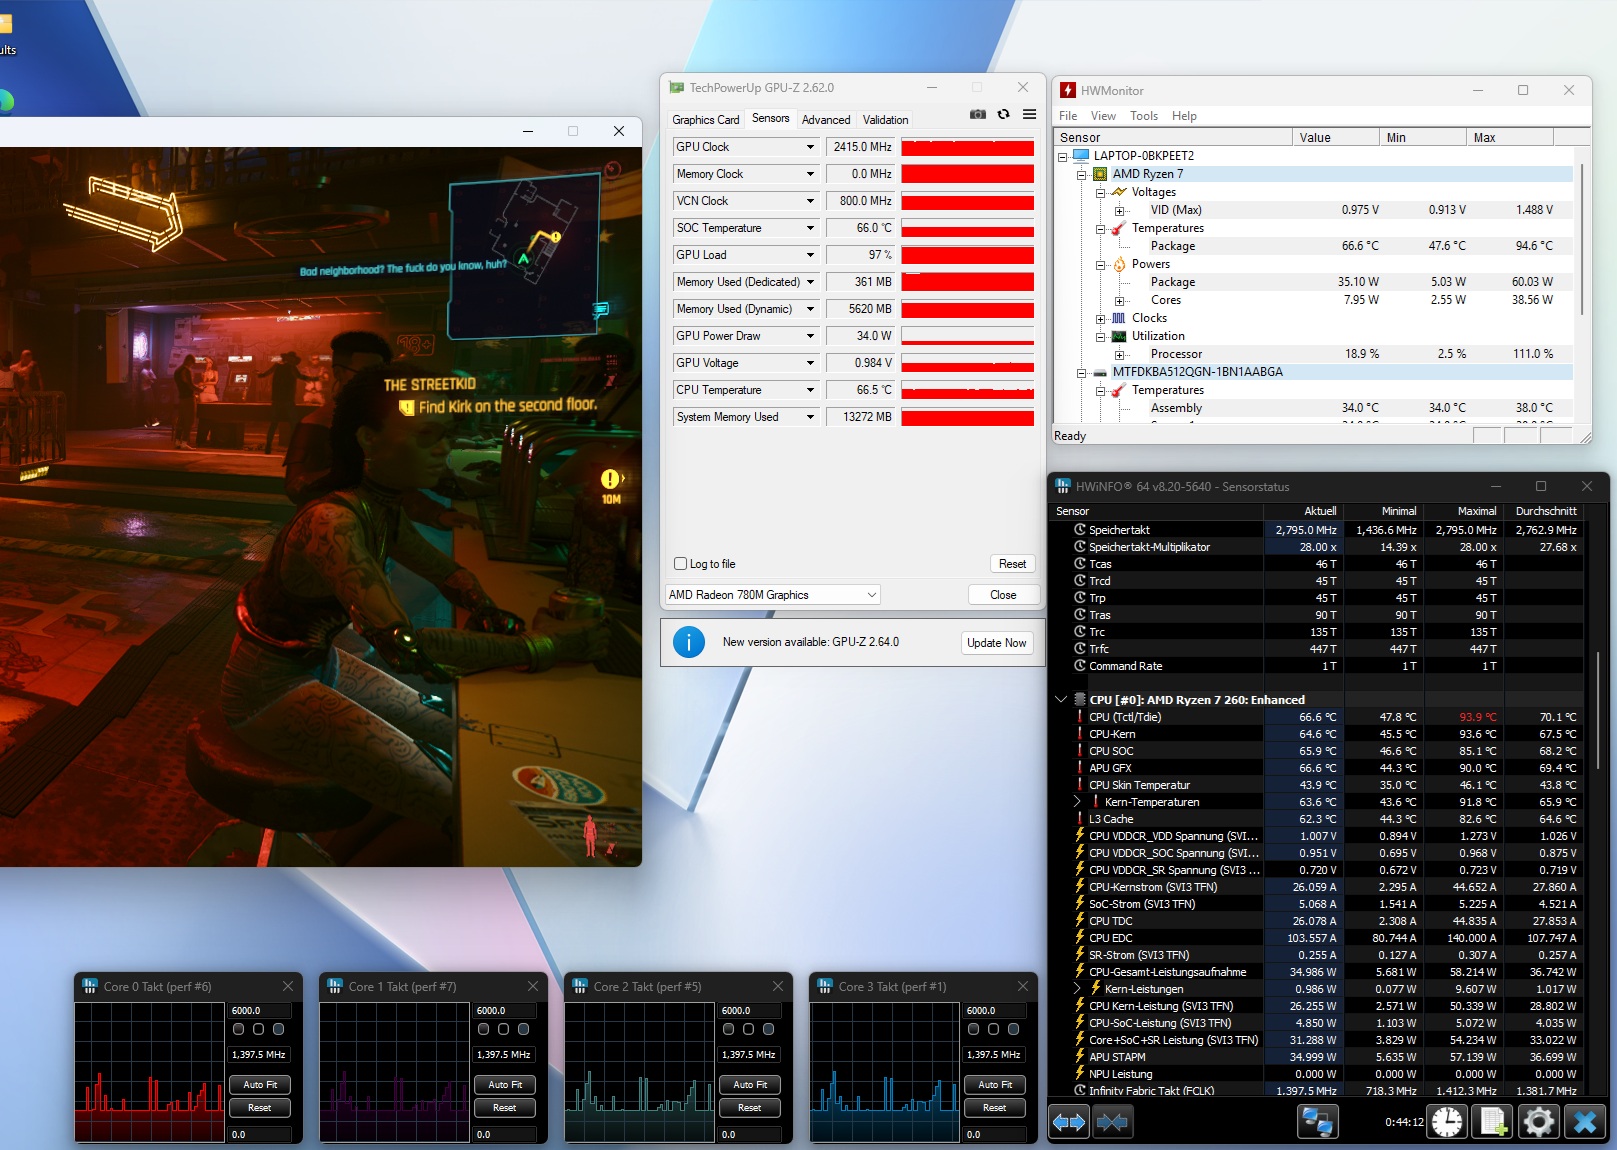
压力测试
在使用 Furmark 和 Prime 95 工具进行的压力测试中,Ryzen 7 260 的温度稳定在 70°C 左右。

发言人
它的音质略好于笔记本电脑的平均水平,不过还是缺少一些低音。
Asus VivoBook 18 M1807HA audio analysis
(±) | speaker loudness is average but good (77 dB)
Bass 100 - 315 Hz
(±) | reduced bass - on average 14.4% lower than median
(±) | linearity of bass is average (9.4% delta to prev. frequency)
Mids 400 - 2000 Hz
(+) | balanced mids - only 4.4% away from median
(+) | mids are linear (4.7% delta to prev. frequency)
Highs 2 - 16 kHz
(+) | balanced highs - only 3.7% away from median
(±) | linearity of highs is average (9.9% delta to prev. frequency)
Overall 100 - 16.000 Hz
(±) | linearity of overall sound is average (17.7% difference to median)
Compared to same class
» 26% of all tested devices in this class were better, 6% similar, 68% worse
» The best had a delta of 7%, average was 21%, worst was 53%
Compared to all devices tested
» 33% of all tested devices were better, 8% similar, 59% worse
» The best had a delta of 4%, average was 24%, worst was 134%
Acer Swift Edge SFE16 Ryzen 7 7840U audio analysis
(±) | speaker loudness is average but good (80.8 dB)
Bass 100 - 315 Hz
(-) | nearly no bass - on average 24.5% lower than median
(±) | linearity of bass is average (14.2% delta to prev. frequency)
Mids 400 - 2000 Hz
(+) | balanced mids - only 2.9% away from median
(+) | mids are linear (3.5% delta to prev. frequency)
Highs 2 - 16 kHz
(+) | balanced highs - only 4.8% away from median
(+) | highs are linear (3.7% delta to prev. frequency)
Overall 100 - 16.000 Hz
(±) | linearity of overall sound is average (19.8% difference to median)
Compared to same class
» 38% of all tested devices in this class were better, 9% similar, 53% worse
» The best had a delta of 7%, average was 21%, worst was 53%
Compared to all devices tested
» 48% of all tested devices were better, 7% similar, 45% worse
» The best had a delta of 4%, average was 24%, worst was 134%
电源管理
耗电量
虽然这不是 HS 或 U-CPU,但笔记本电脑在闲置模式下的功耗还是很低的。事实证明,4.4 瓦的平均功耗是整个测试领域的最佳值。然而,在负载情况下,VivoBook 18 的功耗超过了 60 瓦,因此附带的 65 瓦电源被用到了极限。
| Off / Standby | |
| Idle | |
| Load |
|
Key:
min: | |
| Asus VivoBook 18 M1807HA R7 260, Radeon 780M | HP Envy x360 2-in-1 16-ad0097nr R7 8840HS, Radeon 780M | Acer Swift Edge SFE16 Ryzen 7 7840U R7 7840U, Radeon 780M | MSI Prestige A16 AI+ A3HMG-036 Ryzen AI 9 365, Radeon 880M | Samsung Galaxy Book5 Pro 360 Core Ultra 5 226V, Arc 130V | Average of class Office | |
|---|---|---|---|---|---|---|
| Power Consumption | -23% | -56% | -53% | 6% | -11% | |
| Idle Minimum * | 3.6 | 5 -39% | 7.1 -97% | 6.9 -92% | 5.3 -47% | 4.52 ? -26% |
| Idle Average * | 4.4 | 6.2 -41% | 10.1 -130% | 12 -173% | 6.7 -52% | 7.52 ? -71% |
| Idle Maximum * | 9 | 14.7 -63% | 18.6 -107% | 12.5 -39% | 7.3 19% | 9.05 ? -1% |
| Load Average * | 64 | 49.9 22% | 45.3 29% | 79.8 -25% | 37.6 41% | 42.7 ? 33% |
| Cyberpunk 2077 ultra external monitor * | 68 | 74.5 -10% | 42.8 37% | |||
| Cyberpunk 2077 ultra * | 68 | 62.5 8% | 44.6 34% | |||
| Load Maximum * | 69 | 65 6% | 52.9 23% | 96 -39% | 64.1 7% | 62.5 ? 9% |
| Witcher 3 ultra * | 54.5 | 39.5 |
* ... smaller is better
Power consumption Cyberpunk / stress test
Power consumption with external monitor
运行时间
70 瓦时电池的续航时间绝对令人印象深刻。在亮度降至 150 cd/m² 的网页浏览测试中,笔记本电脑的续航时间达到了 11 小时。在对比设备中,只有微星 Prestige A16 略胜一筹。
| Asus VivoBook 18 M1807HA R7 260, Radeon 780M, 70 Wh | HP Envy x360 2-in-1 16-ad0097nr R7 8840HS, Radeon 780M, 68 Wh | Acer Swift Edge SFE16 Ryzen 7 7840U R7 7840U, Radeon 780M, 54 Wh | MSI Prestige A16 AI+ A3HMG-036 Ryzen AI 9 365, Radeon 880M, 82 Wh | Samsung Galaxy Book5 Pro 360 Core Ultra 5 226V, Arc 130V, 76 Wh | Average of class Office | |
|---|---|---|---|---|---|---|
| Battery Runtime | -31% | -49% | 3% | -3% | -3% | |
| WiFi v1.3 | 663 | 459 -31% | 336 -49% | 683 3% | 646 -3% | 643 ? -3% |
| Reader / Idle | 935 | 1300 ? | ||||
| Load | 116 | 127 | 128 | 114.9 ? | ||
| H.264 | 609 | 1181 | 750 ? |
Notebookcheck 总评分
VivoBook 18 M1807HA 是目前唯一一款售价低于 1000 美元的 18 英寸笔记本电脑,这使它在众多产品中脱颖而出。然而,我们的测试表明,华硕本可以在这里和那里再下点功夫,例如在外壳质量、连接性、内部构造(关键词:升级)和散热系统方面。
Asus VivoBook 18 M1807HA
- 03/24/2025 v8
Florian Glaser
 Total Sustainability Score:
 Possible alternatives compared
Image | Model / Review | Price | Weight | Height | Display |
|---|---|---|---|---|---|
1. 77.2%  | Asus VivoBook 18 M1807HA AMD Ryzen 7 260 ⎘ AMD Radeon 780M ⎘ 16 GB Memory, 512 GB SSD | Amazon: 1. ASUS VivoBook 16 Laptop, 16�... 2. $421.00 ASUS VivoBook 17 Business La... 3. $1,299.99 ASUS Vivobook 17X Laptop, 17... List Price: 800 EUR | 2.6 kg | 20 mm | 18.40" 1920x1200 123 PPI IPS |
2. 87.2% v7 (old)  | HP Envy x360 2-in-1 16-ad0097nr AMD Ryzen 7 8840HS ⎘ AMD Radeon 780M ⎘ 16 GB Memory, 1024 GB SSD | Amazon: 1. $728.99 HP Envy x360 2-in-1 Laptop, ... 2. $899.99 HP Envy x360 2-in-1 Touchscr... 3. $799.98 HP Envy 2-in-1 16" 2K Touch-... List Price: 1300 USD | 1.8 kg | 18.3 mm | 16.00" 2880x1800 212 PPI OLED |
3. 88.6% v7 (old)  | Acer Swift Edge SFE16 Ryzen 7 7840U AMD Ryzen 7 7840U ⎘ AMD Radeon 780M ⎘ 16 GB Memory, 512 GB SSD | Amazon: $1,029.99 List Price: 1300 USD | 1.2 kg | 13 mm | 16.00" 3200x2000 236 PPI OLED |
4. 81.9%  | MSI Prestige A16 AI+ A3HMG-036 AMD Ryzen AI 9 365 ⎘ AMD Radeon 880M ⎘ 32 GB Memory, 1024 GB SSD | List Price: 1599 Euro | 2 kg | 17.35 mm | 16.00" 2560x1600 189 PPI IPS |
5. 85.9%  | Samsung Galaxy Book5 Pro 360 Intel Core Ultra 5 226V ⎘ Intel Arc Graphics 130V ⎘ 16 GB Memory, 512 GB SSD | Amazon: $1,699.99 List Price: 1799€ | 1.7 kg | 12.8 mm | 16.00" 2880x1800 212 PPI OLED |
Transparency
The selection of devices to be reviewed is made by our editorial team. The test sample was provided to the author as a loan by the manufacturer or retailer for the purpose of this review. The lender had no influence on this review, nor did the manufacturer receive a copy of this review before publication. There was no obligation to publish this review. We never accept compensation or payment in return for our reviews. As an independent media company, Notebookcheck is not subjected to the authority of manufacturers, retailers or publishers.
This is how Notebookcheck is testing
Every year, Notebookcheck independently reviews hundreds of laptops and smartphones using standardized procedures to ensure that all results are comparable. We have continuously developed our test methods for around 20 years and set industry standards in the process. In our test labs, high-quality measuring equipment is utilized by experienced technicians and editors. These tests involve a multi-stage validation process. Our complex rating system is based on hundreds of well-founded measurements and benchmarks, which maintains objectivity. Further information on our test methods can be found here.

