戴尔 XPS 13 9340 笔记本电脑评测--运行时间长、缺陷多的紧凑型超极本
在测试了最新 XPS 系列的 14 英寸和 16 英寸新机型之后,我们现在来看看小巧的戴尔 XPS 13 9340。旧款 XPS 13 Plus已经停产。不过,戴尔推出了经过瘦身的 XPS 13 9315不过,戴尔还是推出了配备旧款 Alder Lake 处理器和传统输入设备的超薄型 XPS 13 9315。
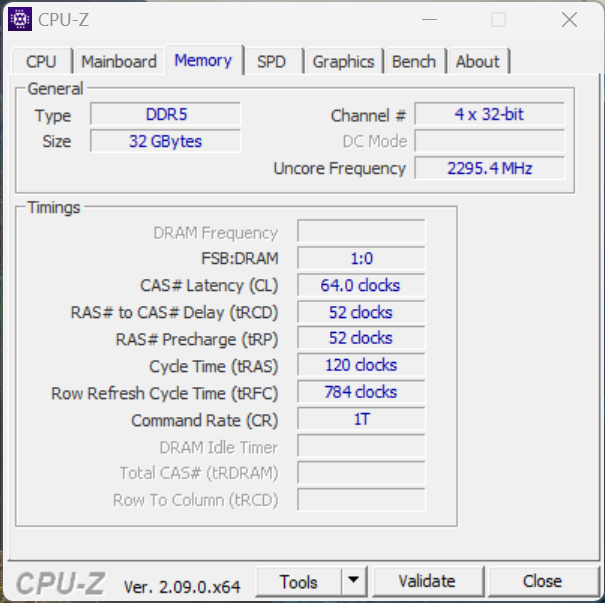
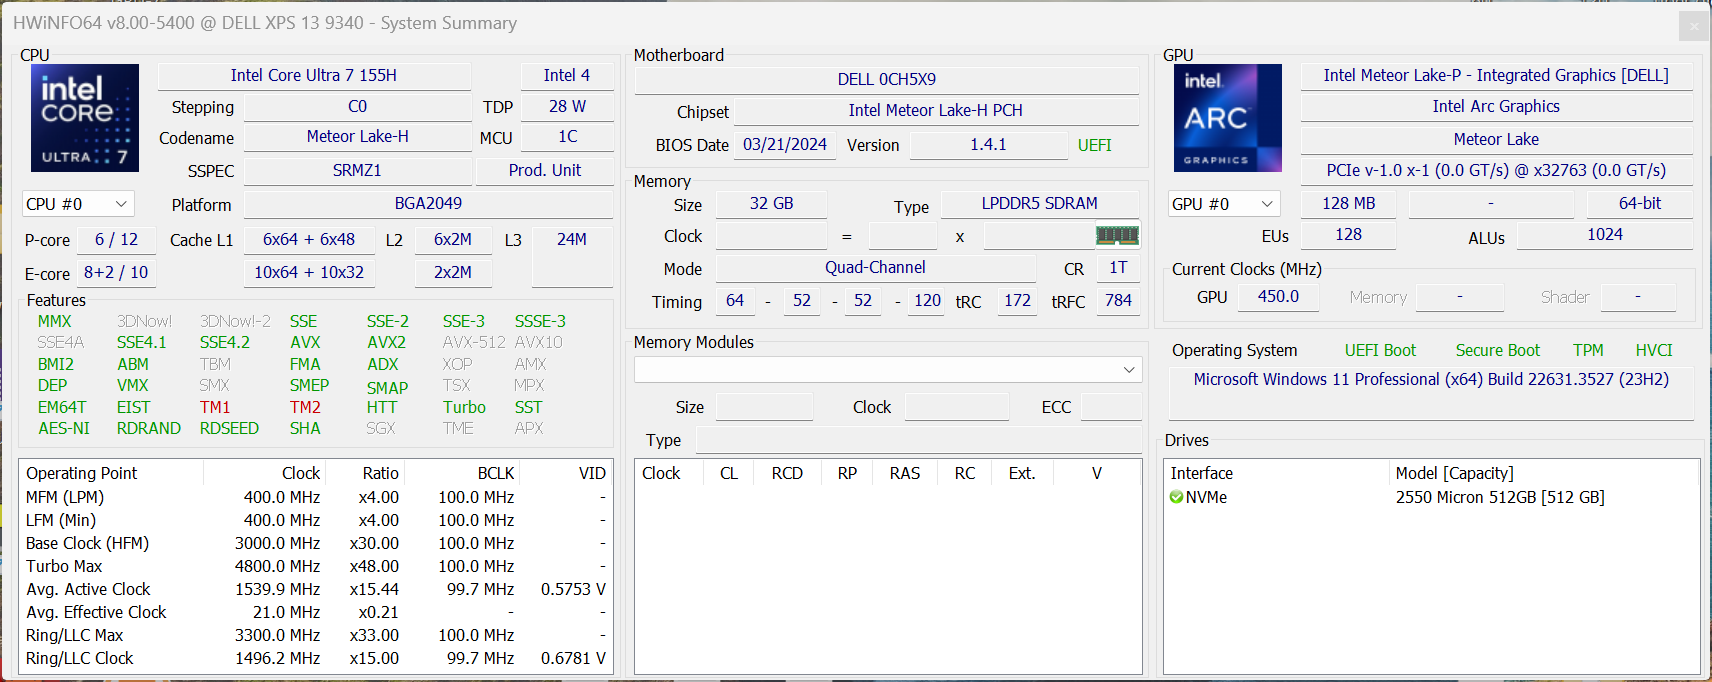
我们的测试设备配备了新的流星湖处理器--Core Ultra 7 155H,以及 32 GB 内存、512 GB PCIe SSD 和全高清面板。戴尔对这一配置的要价为 1,599 美元(配备 Core Ultra 5 和 16 GB 内存的入门价为 1,149 美元)。您可以将价格提高到最高 2,659 美元(Core Ultra 7、64 GB 内存、2 TB SSD、QHD+)。
潜在的竞争对手比较
Rating | Date | Model | Weight | Height | Size | Resolution | Price |
|---|---|---|---|---|---|---|---|
| 86.5 % v7 (old) | 05 / 2024 | Dell XPS 13 9340 Core Ultra 7 Ultra 7 155H, Arc 8-Core | 1.2 kg | 15.3 mm | 13.40" | 1920x1200 | |
| 92.4 % v7 (old) | 03 / 2024 | Apple MacBook Air 13 M3 10C GPU M3, M3 10-Core GPU | 1.2 kg | 11.3 mm | 13.60" | 2560x1664 | |
| 85.4 % v7 (old) | 05 / 2023 | Asus ZenBook S13 OLED UX5304 i7-1355U, Iris Xe G7 96EUs | 1 kg | 11.8 mm | 13.30" | 2880x1800 | |
| 89.5 % v7 (old) | 01 / 2024 | Lenovo ThinkPad Z13 Gen 2 R7 PRO 7840U, Radeon 780M | 1.2 kg | 13.99 mm | 13.30" | 2880x1800 | |
| 91.9 % v7 (old) | 07 / 2023 | HP Dragonfly G4 i7-1365U, Iris Xe G7 96EUs | 1.1 kg | 16.3 mm | 13.50" | 1920x1280 |
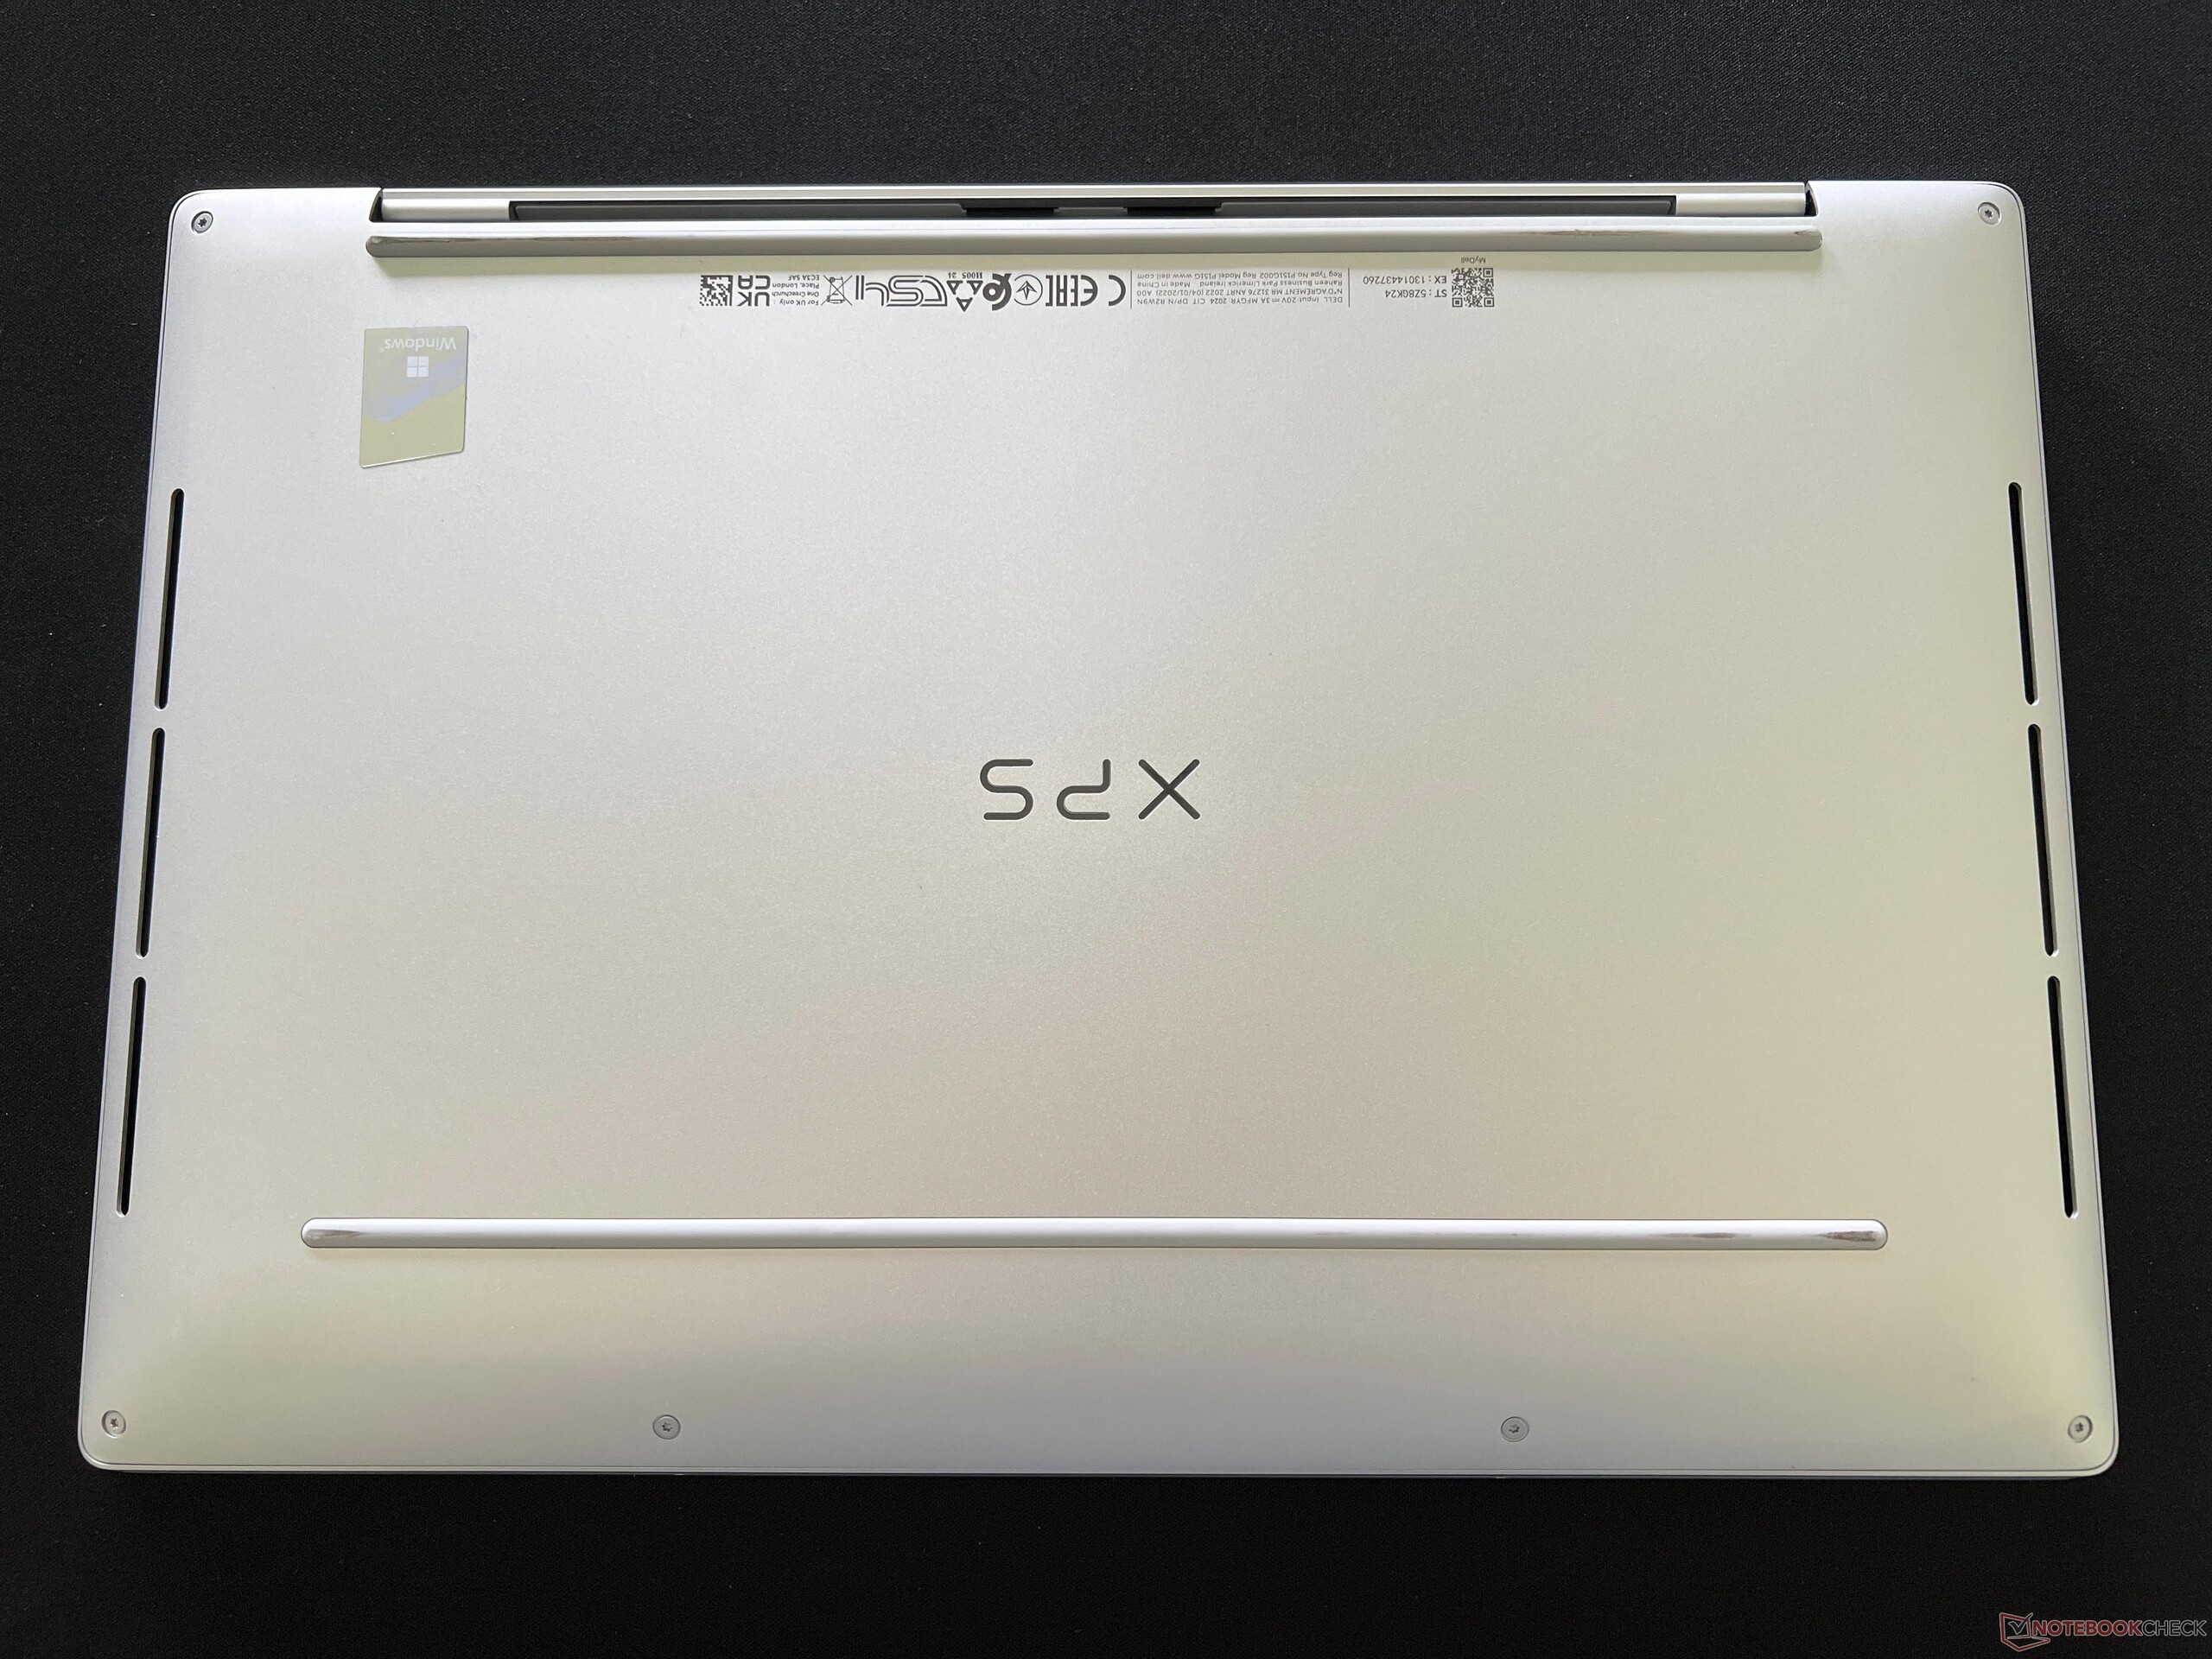
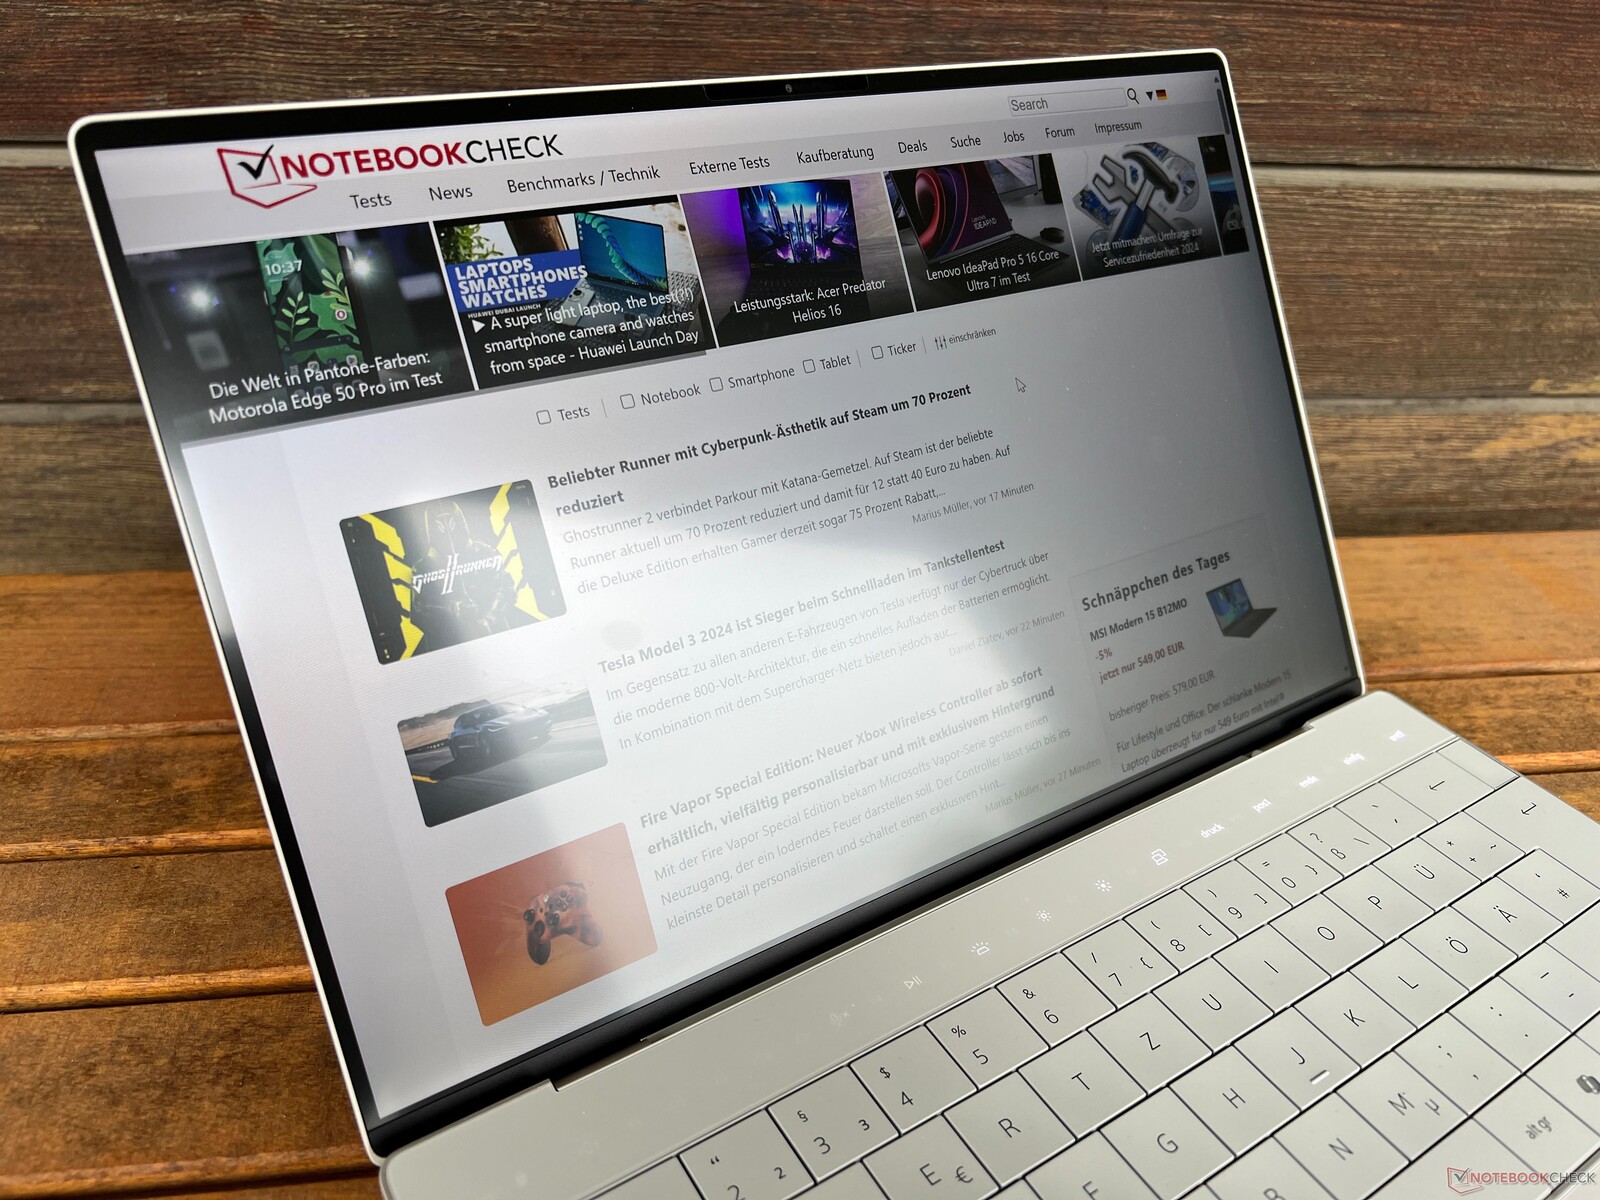
外壳 - 稳定的铝质
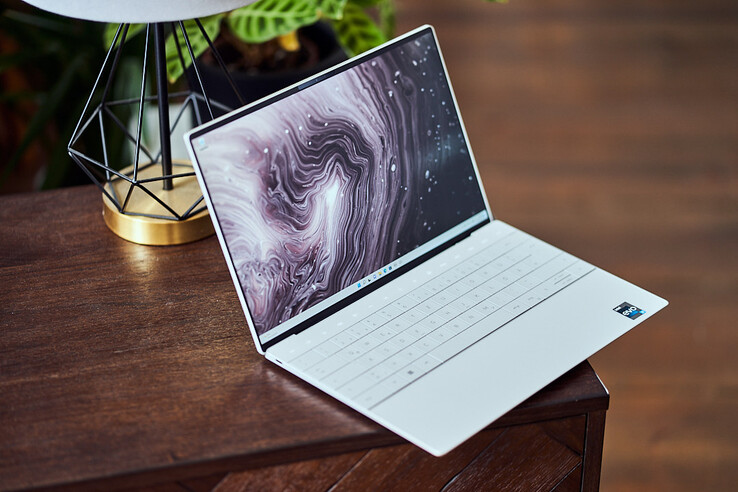
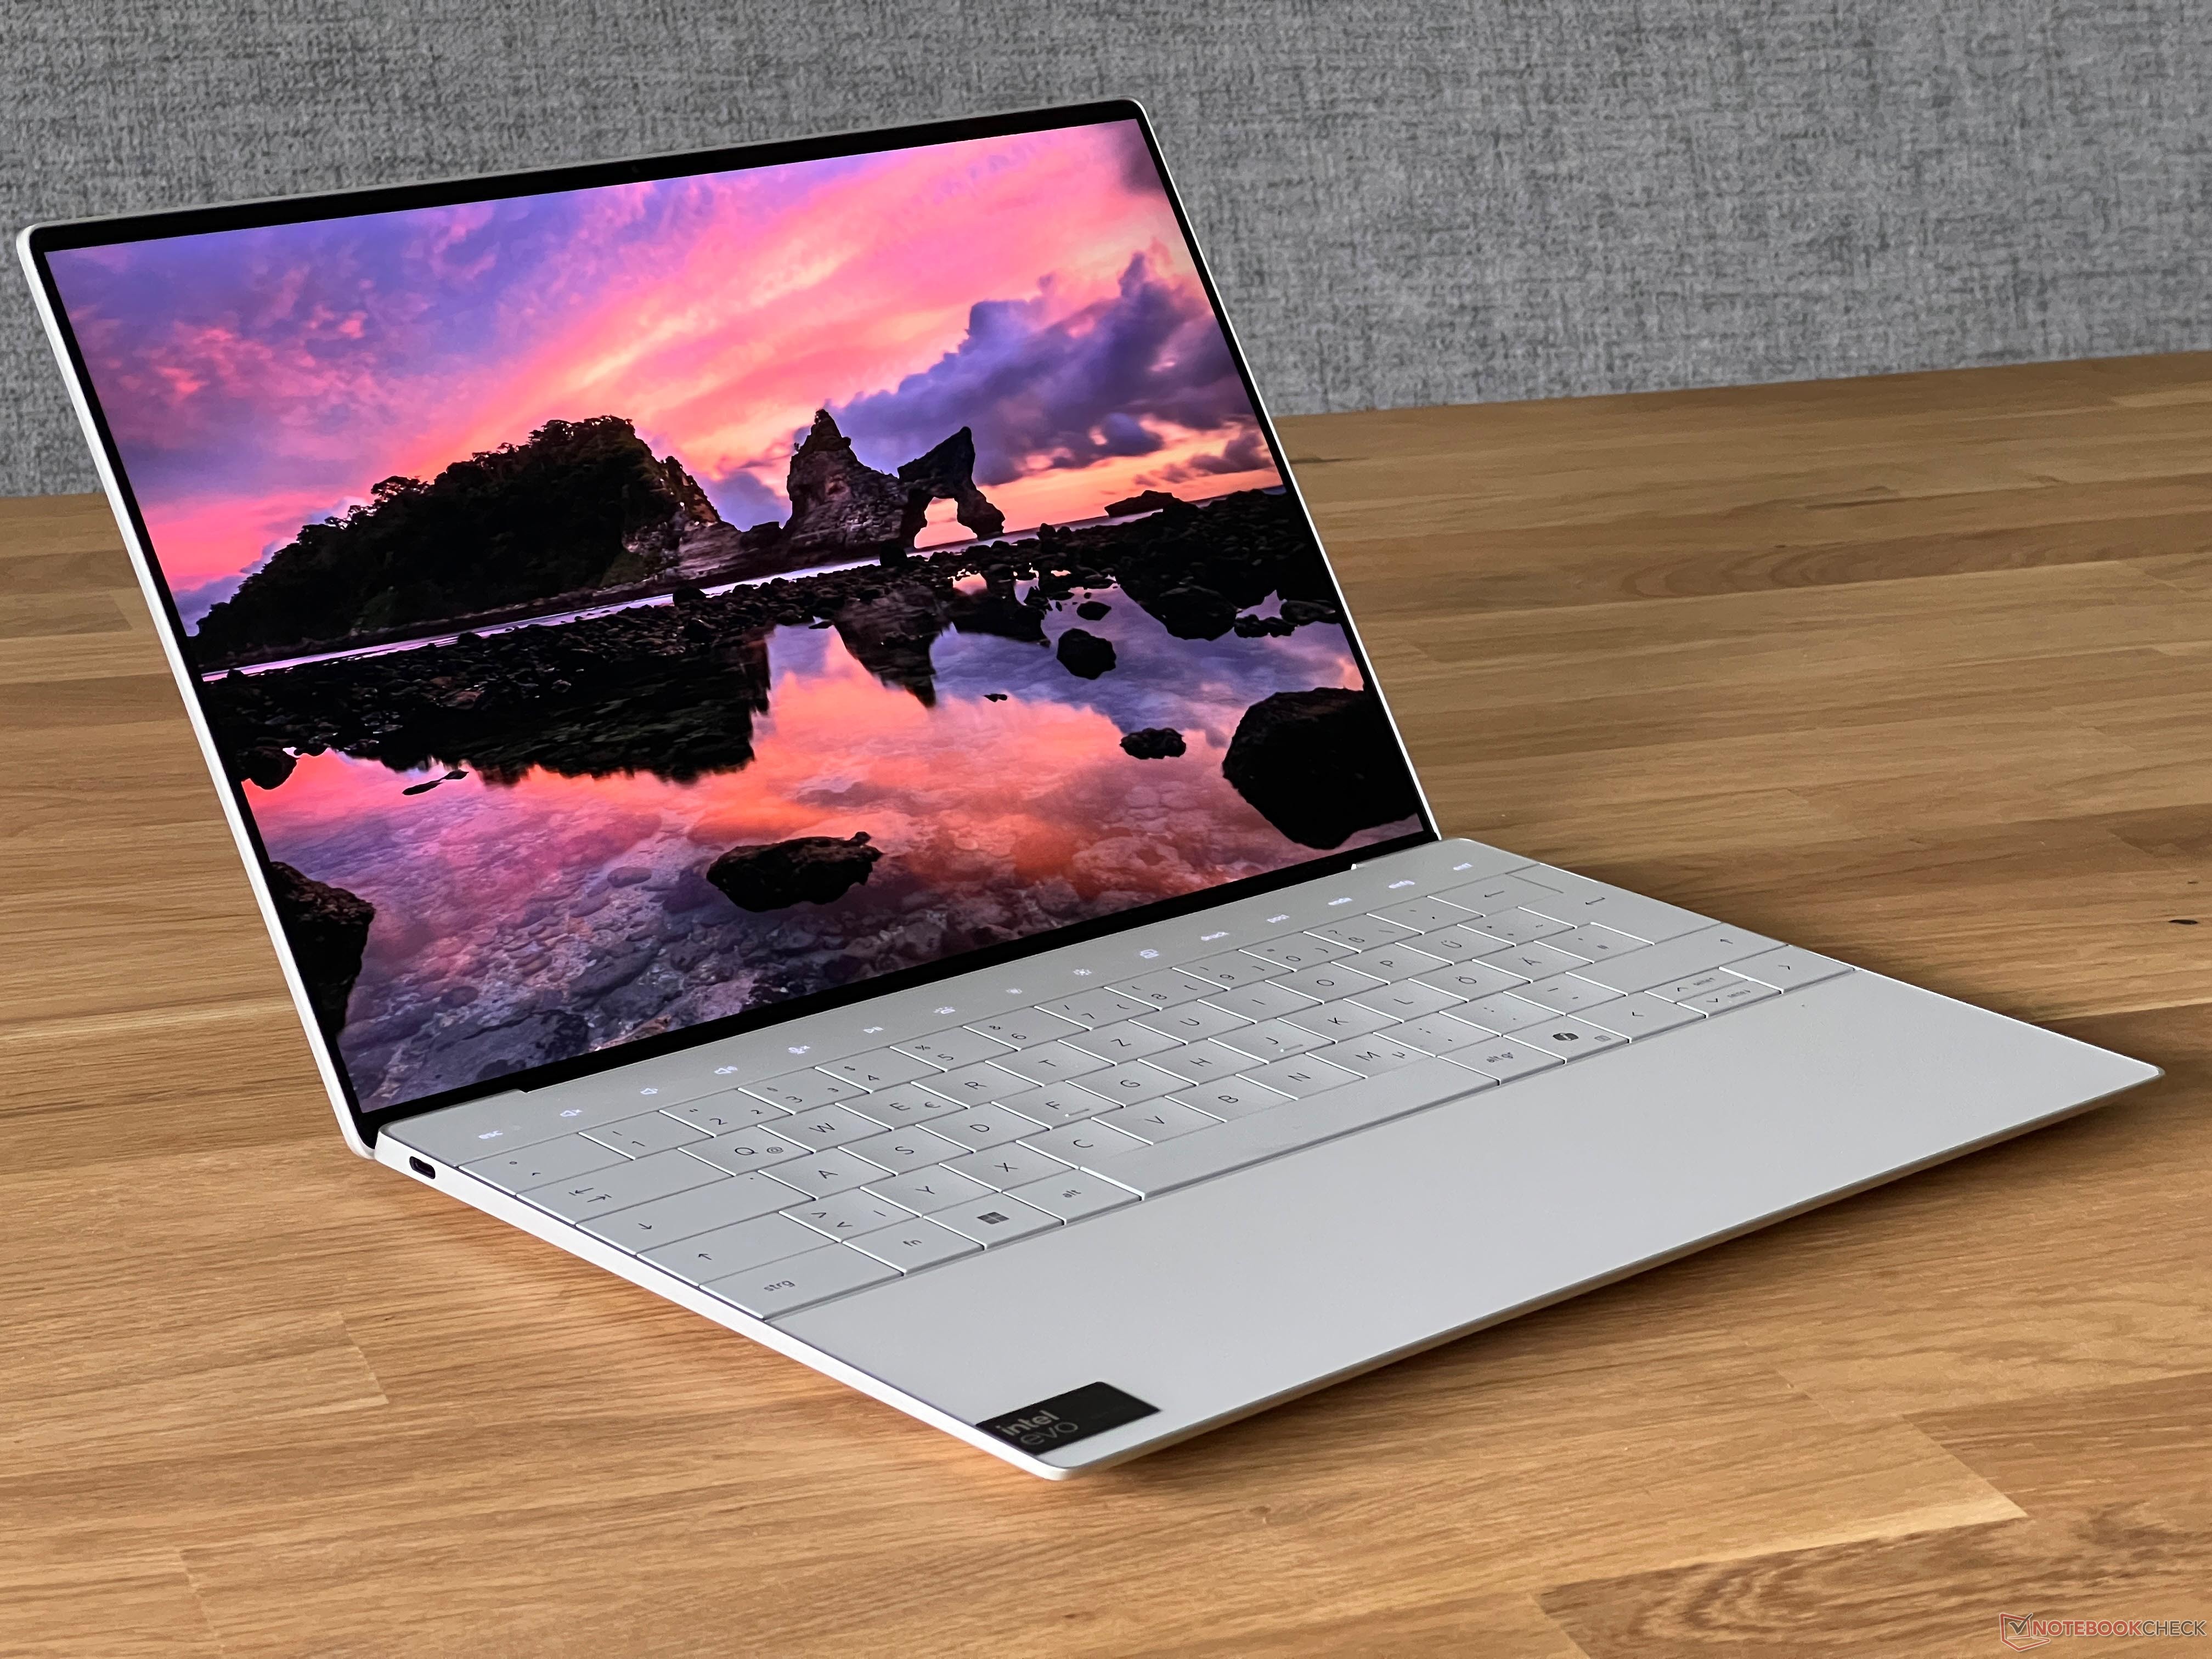
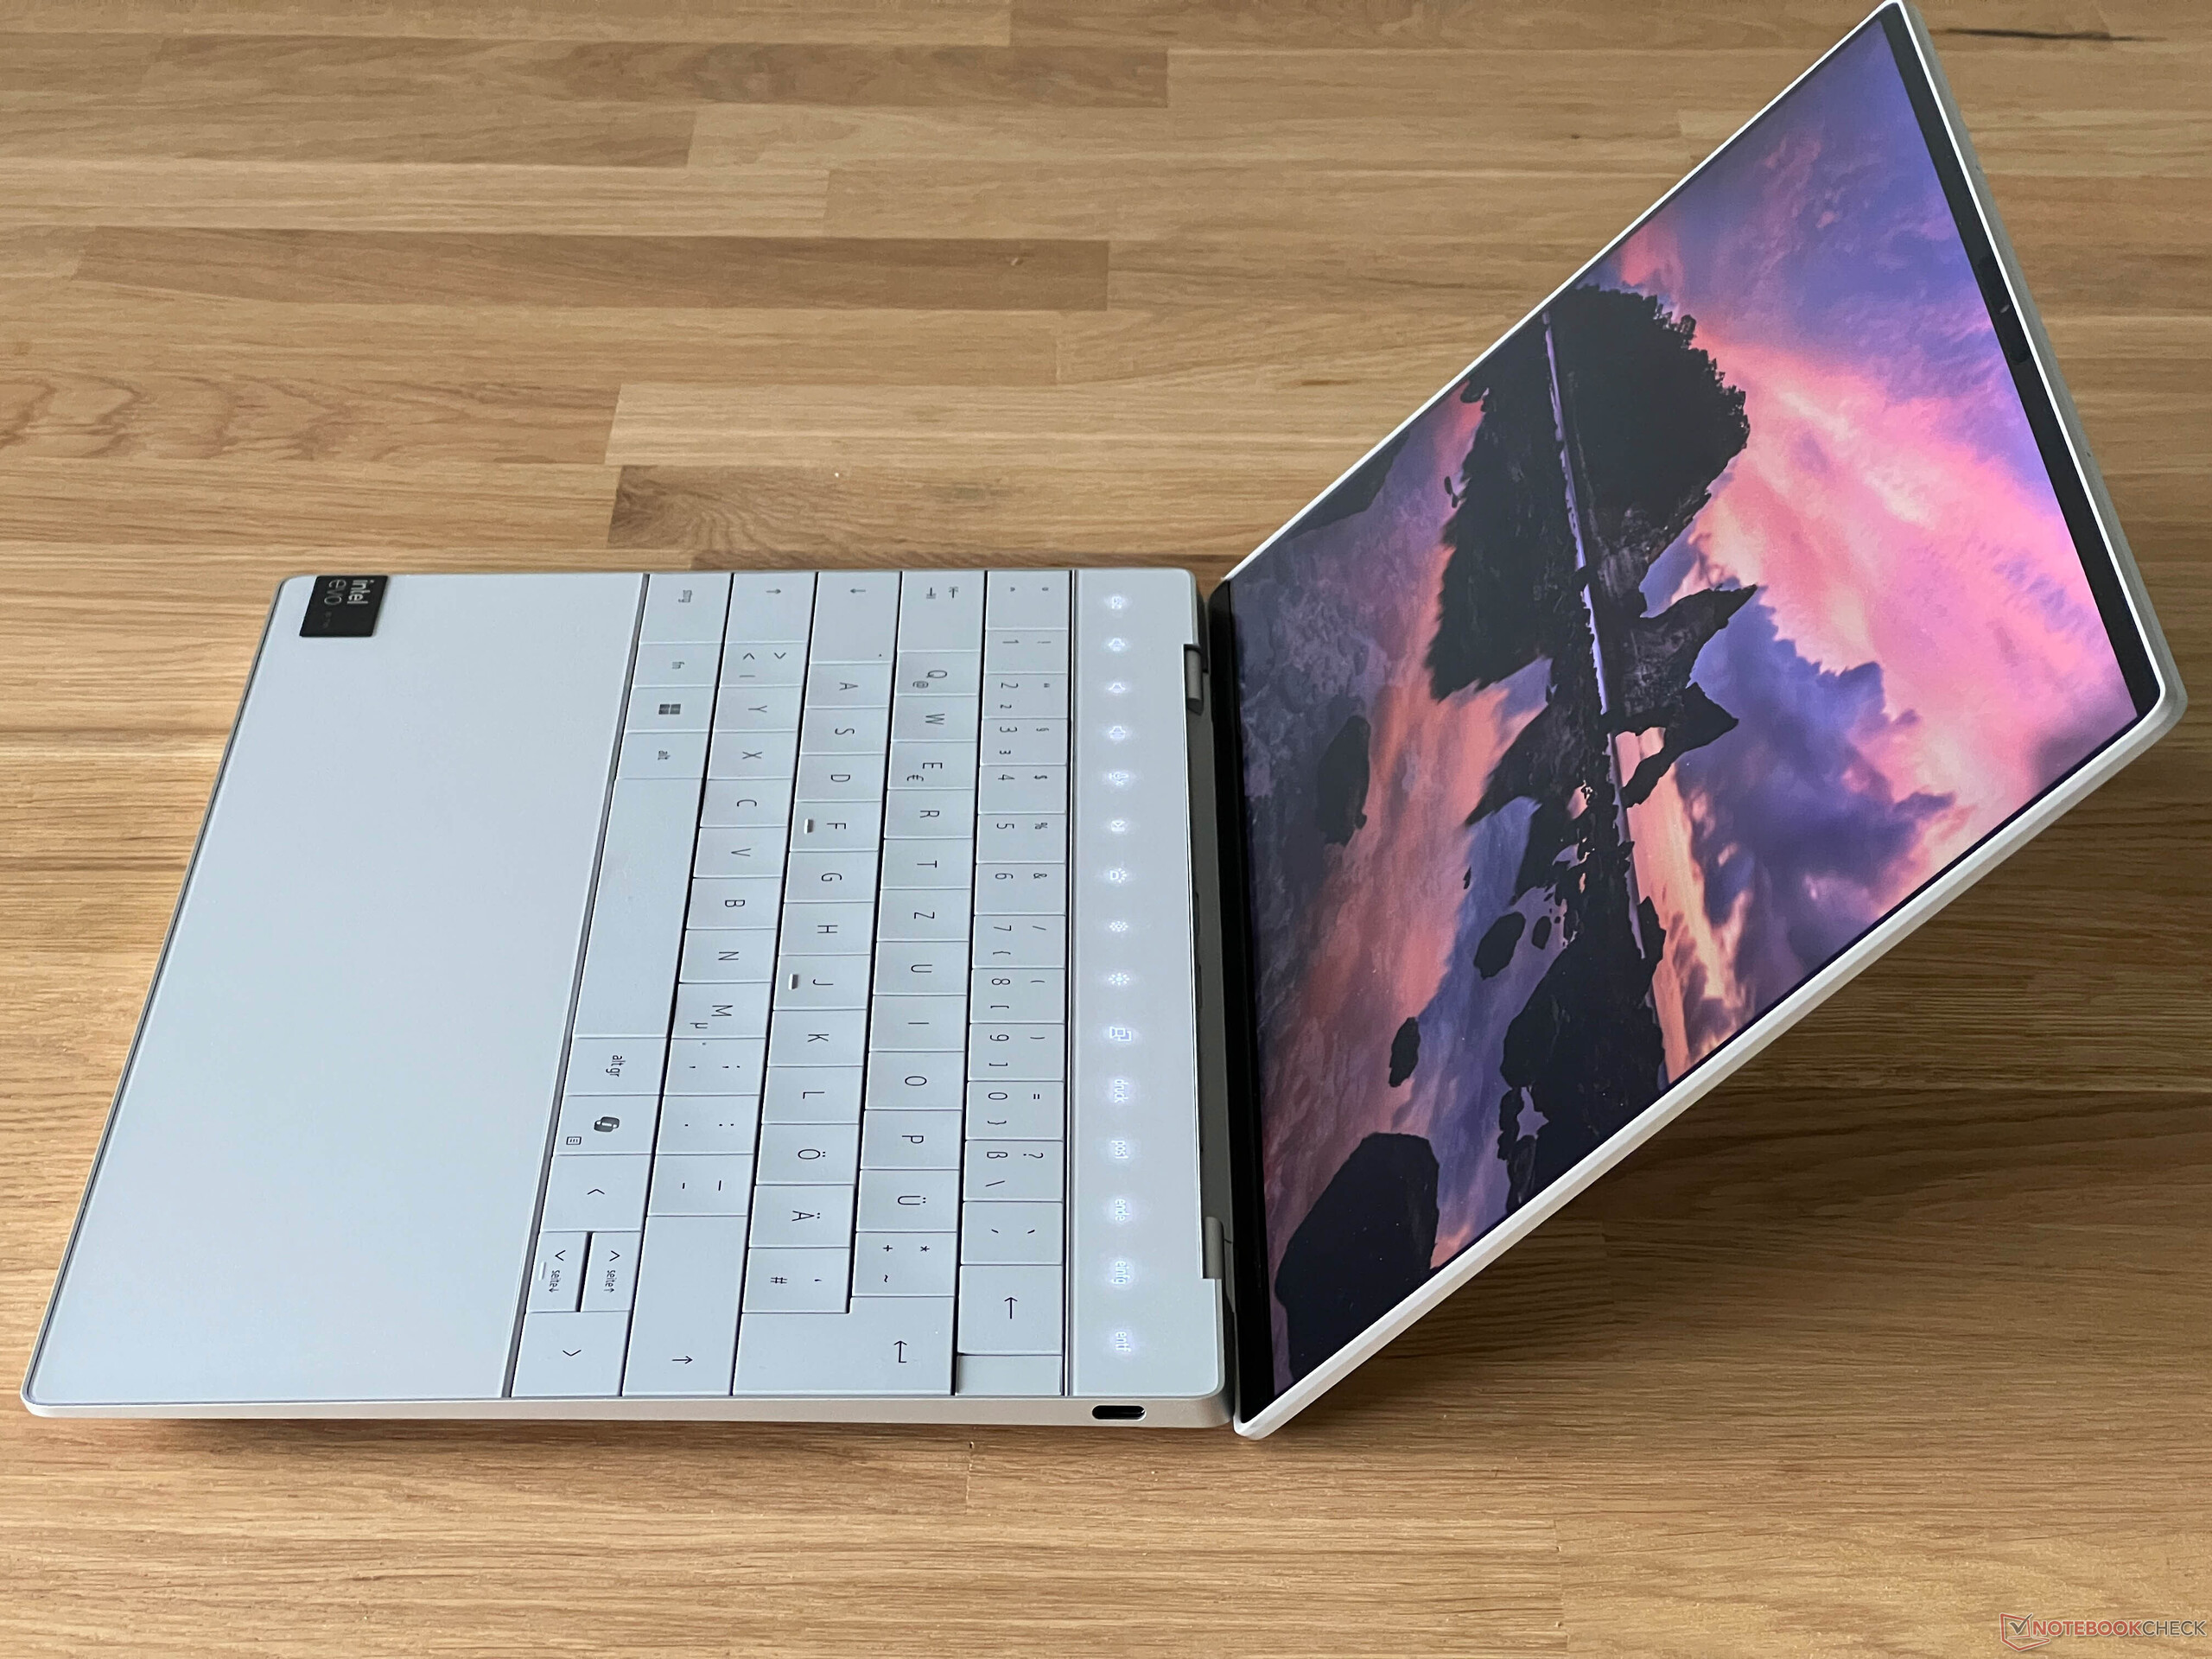
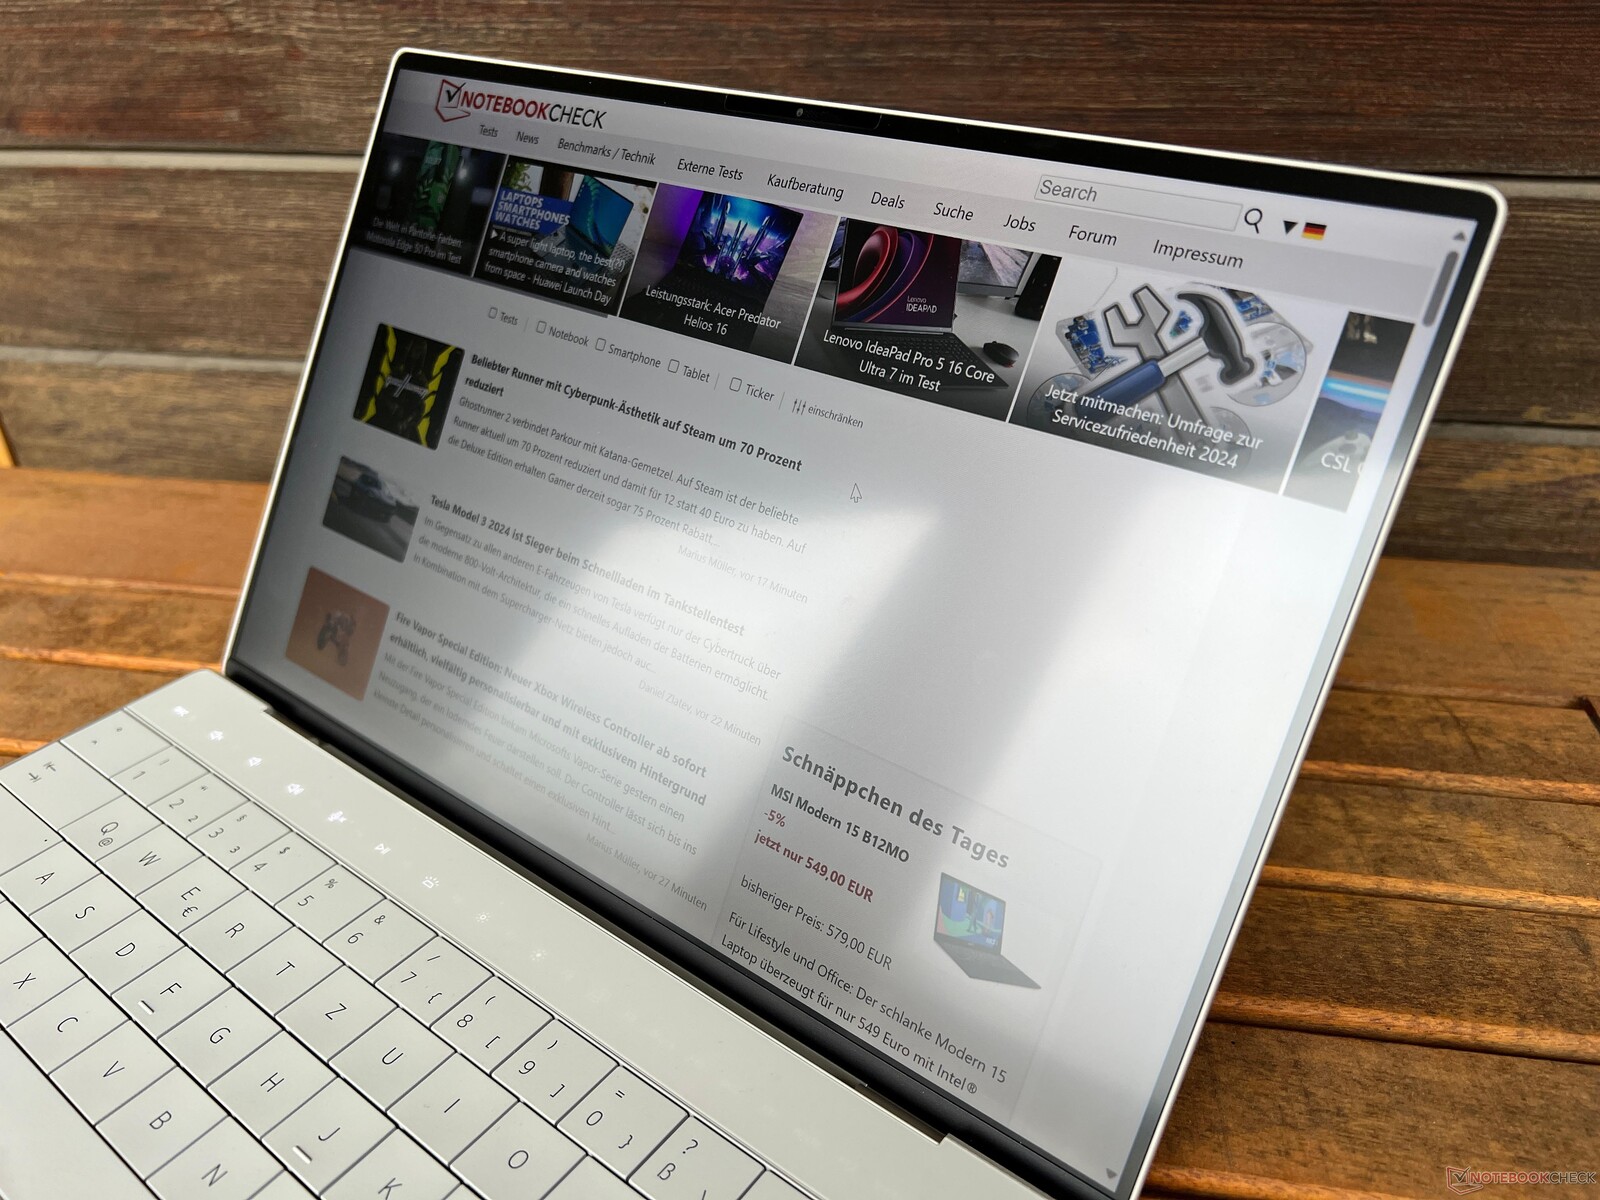
戴尔不久前在 XPS 13 Plus 上引入了当前的 XPS 设计,现在整个系列都采用了这一设计。我们认为,这种设计在小型 XPS 13 9340 上效果最佳,因为它给人的感觉非常紧凑(尤其是与笨重的 XPS 14).除了银色机型外,制造商还提供了深灰色机型。该设备看起来质量很高,我们没有发现任何制造问题。此外,它似乎也不太容易沾染指纹。
单手即可轻松打开显示屏盖,除了独特的输入设备(稍后详述)外,笔记本电脑纤薄的边框立即吸引了你的眼球。铰链调节良好,但屏幕的最大开启角度被限制在 135 度左右。底座的稳定性很好,即使使用很大的压力,我们也只能将键盘压出轻微的凹痕。显示屏的盖子也是如此,我们没有发现任何图像错误。
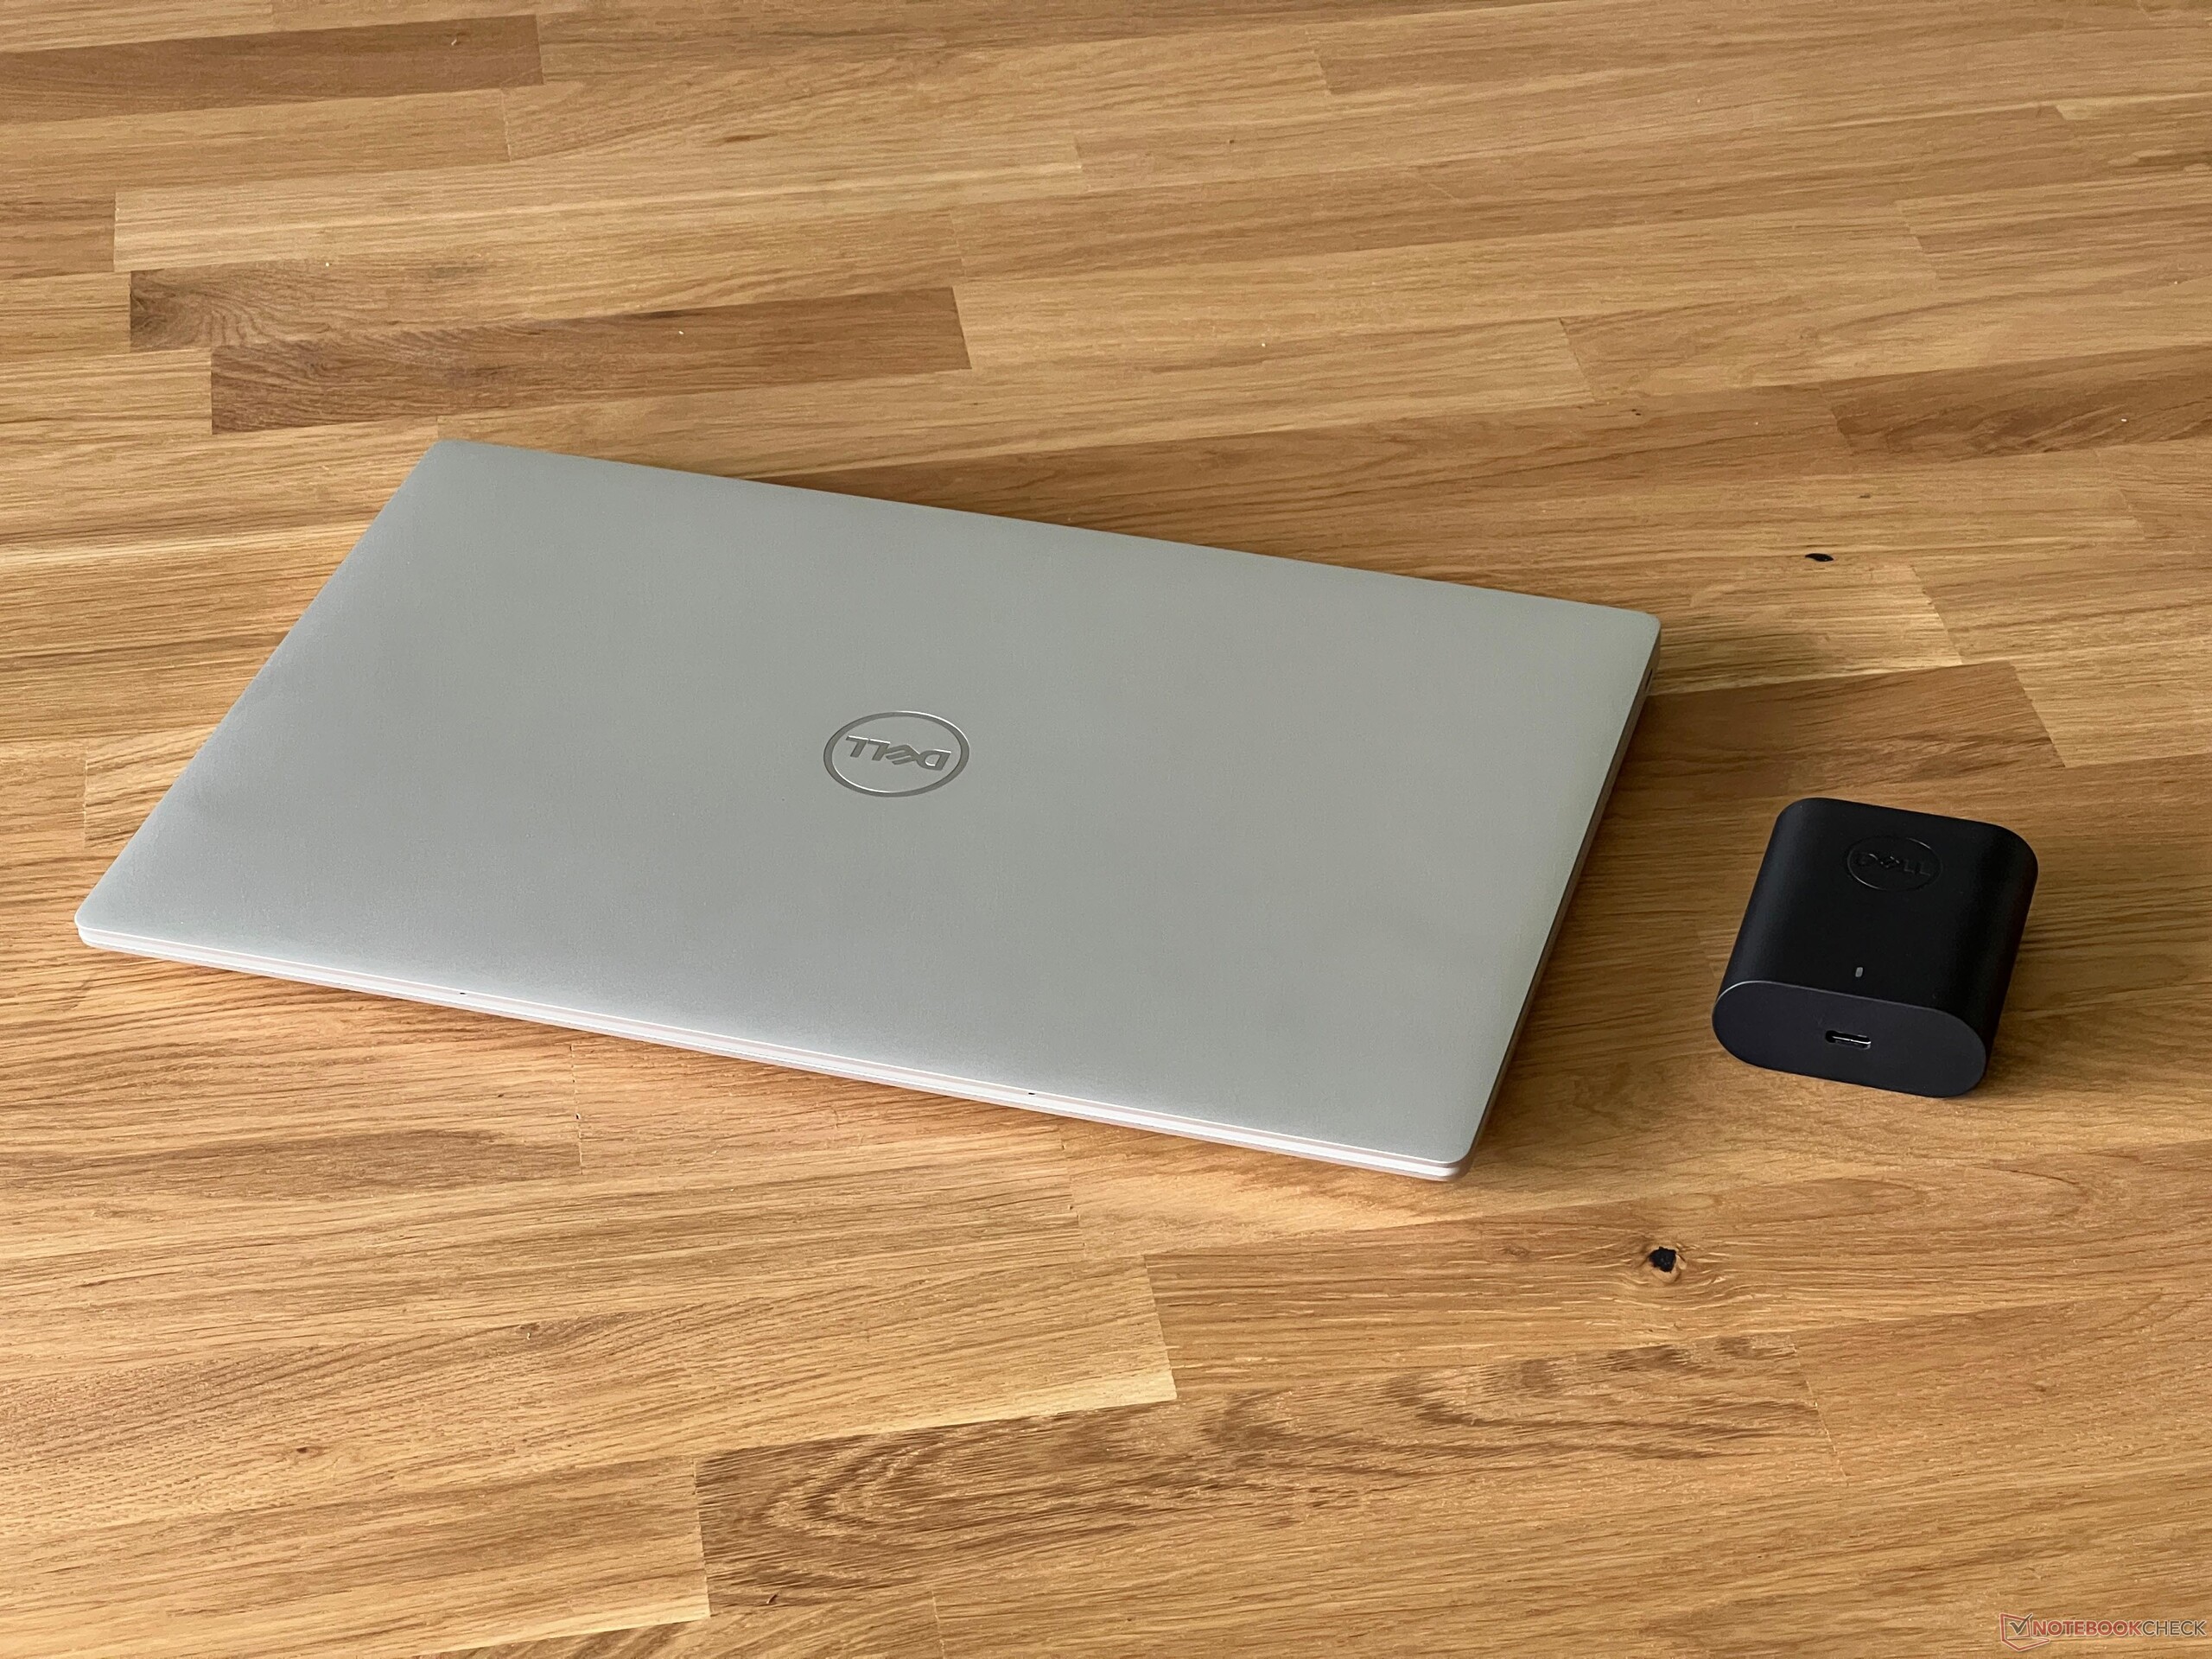
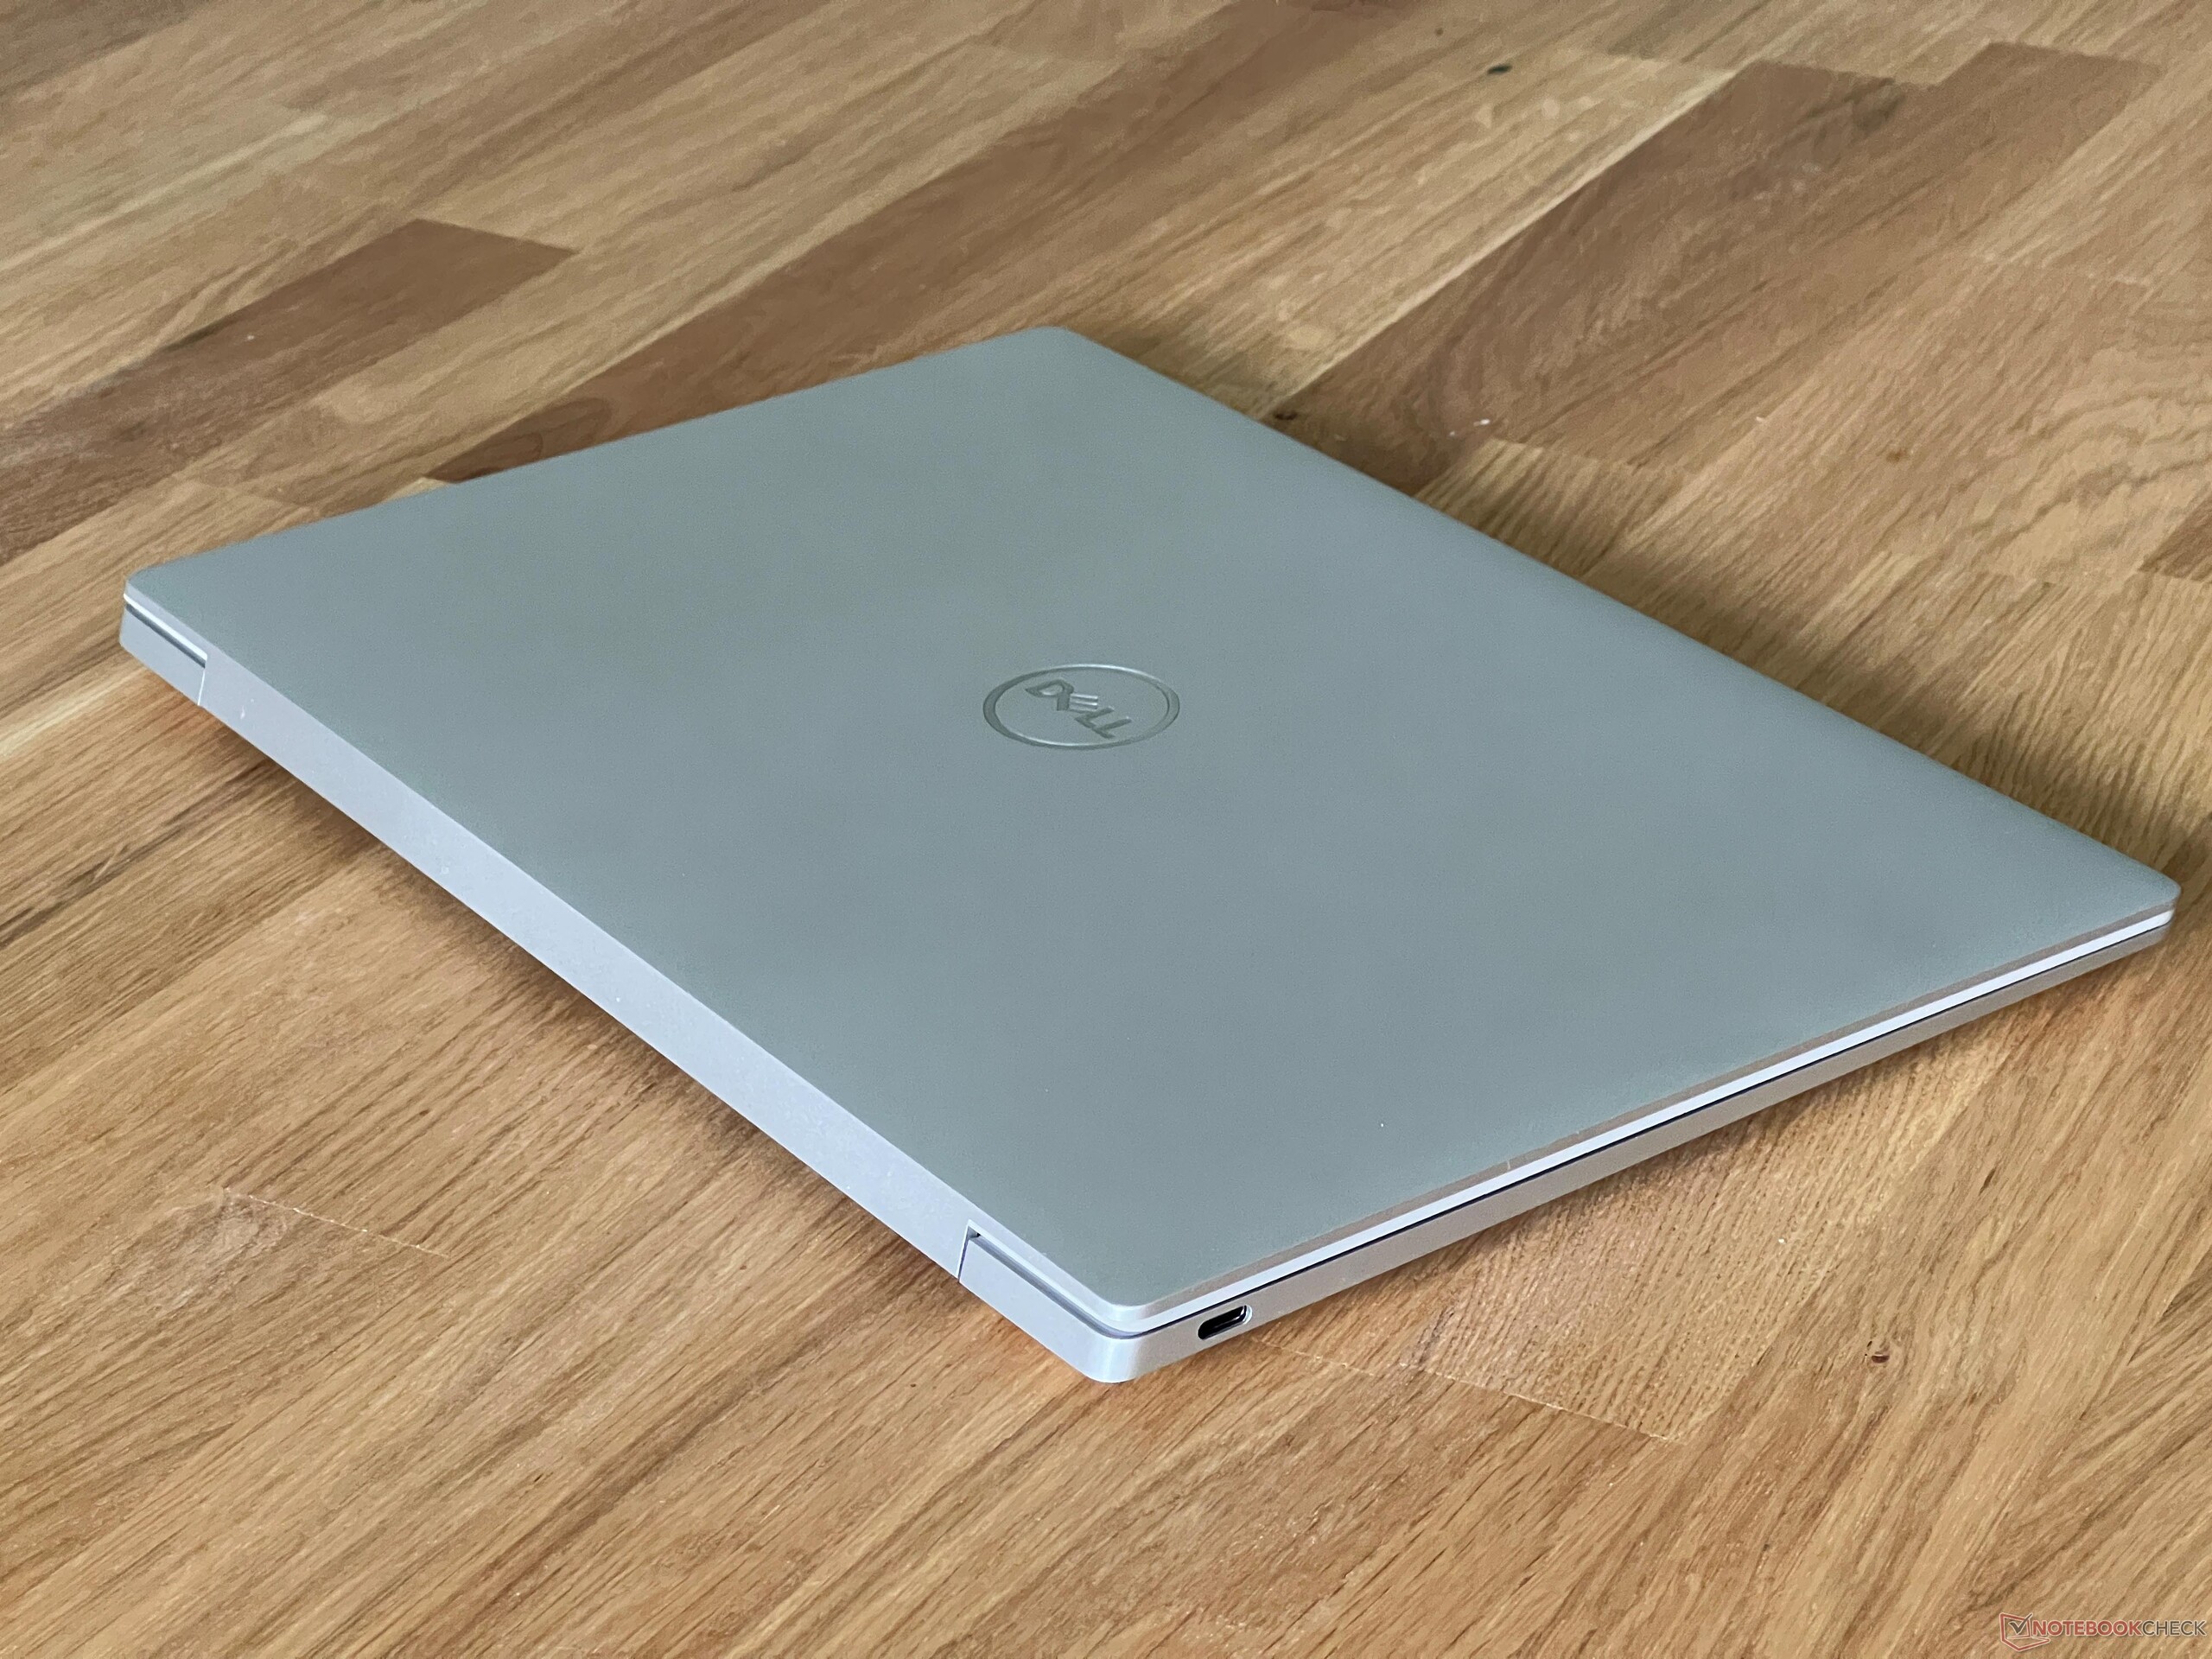
XPS 13 9340 是我们对比组中最小巧的设备,不会占用太多空间。例如,如果您要旅行(火车、飞机),这就非常方便。不过,它的重量刚刚超过 1.2 千克,并不是最轻的机型。附带的 60 瓦电源也非常小巧,加上 USB-C 连接线,重量又增加了 256 克。
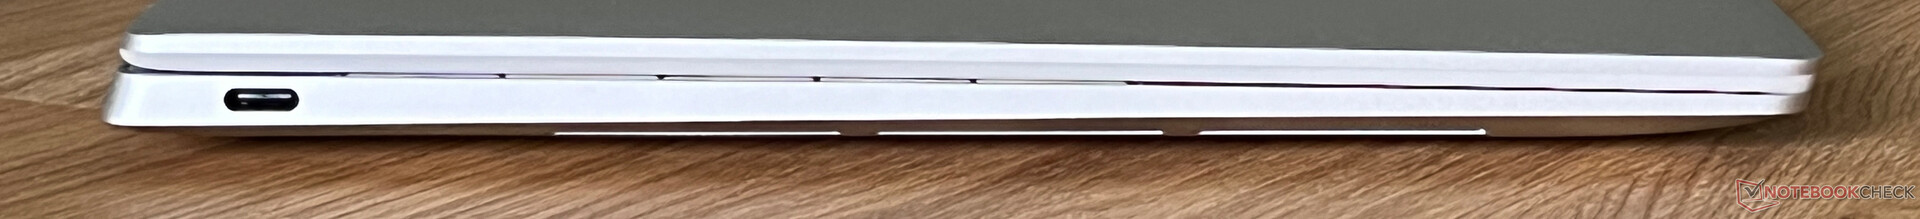
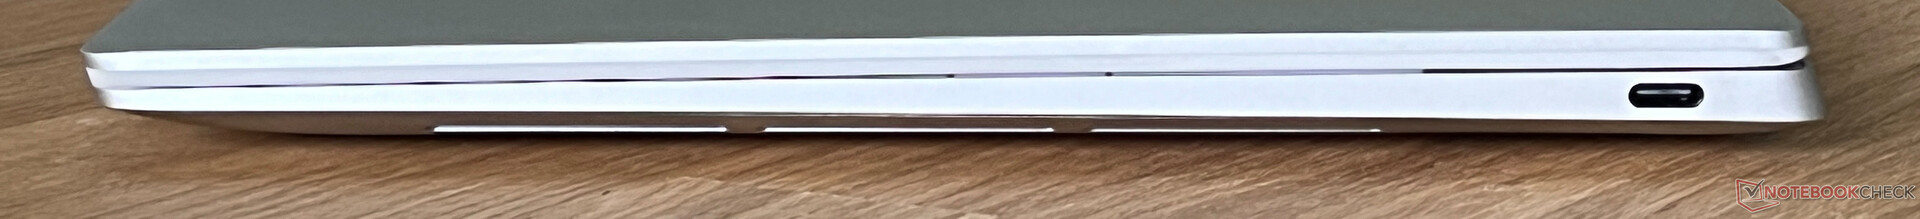
连接性 - 没有音频插孔的 XPS 13
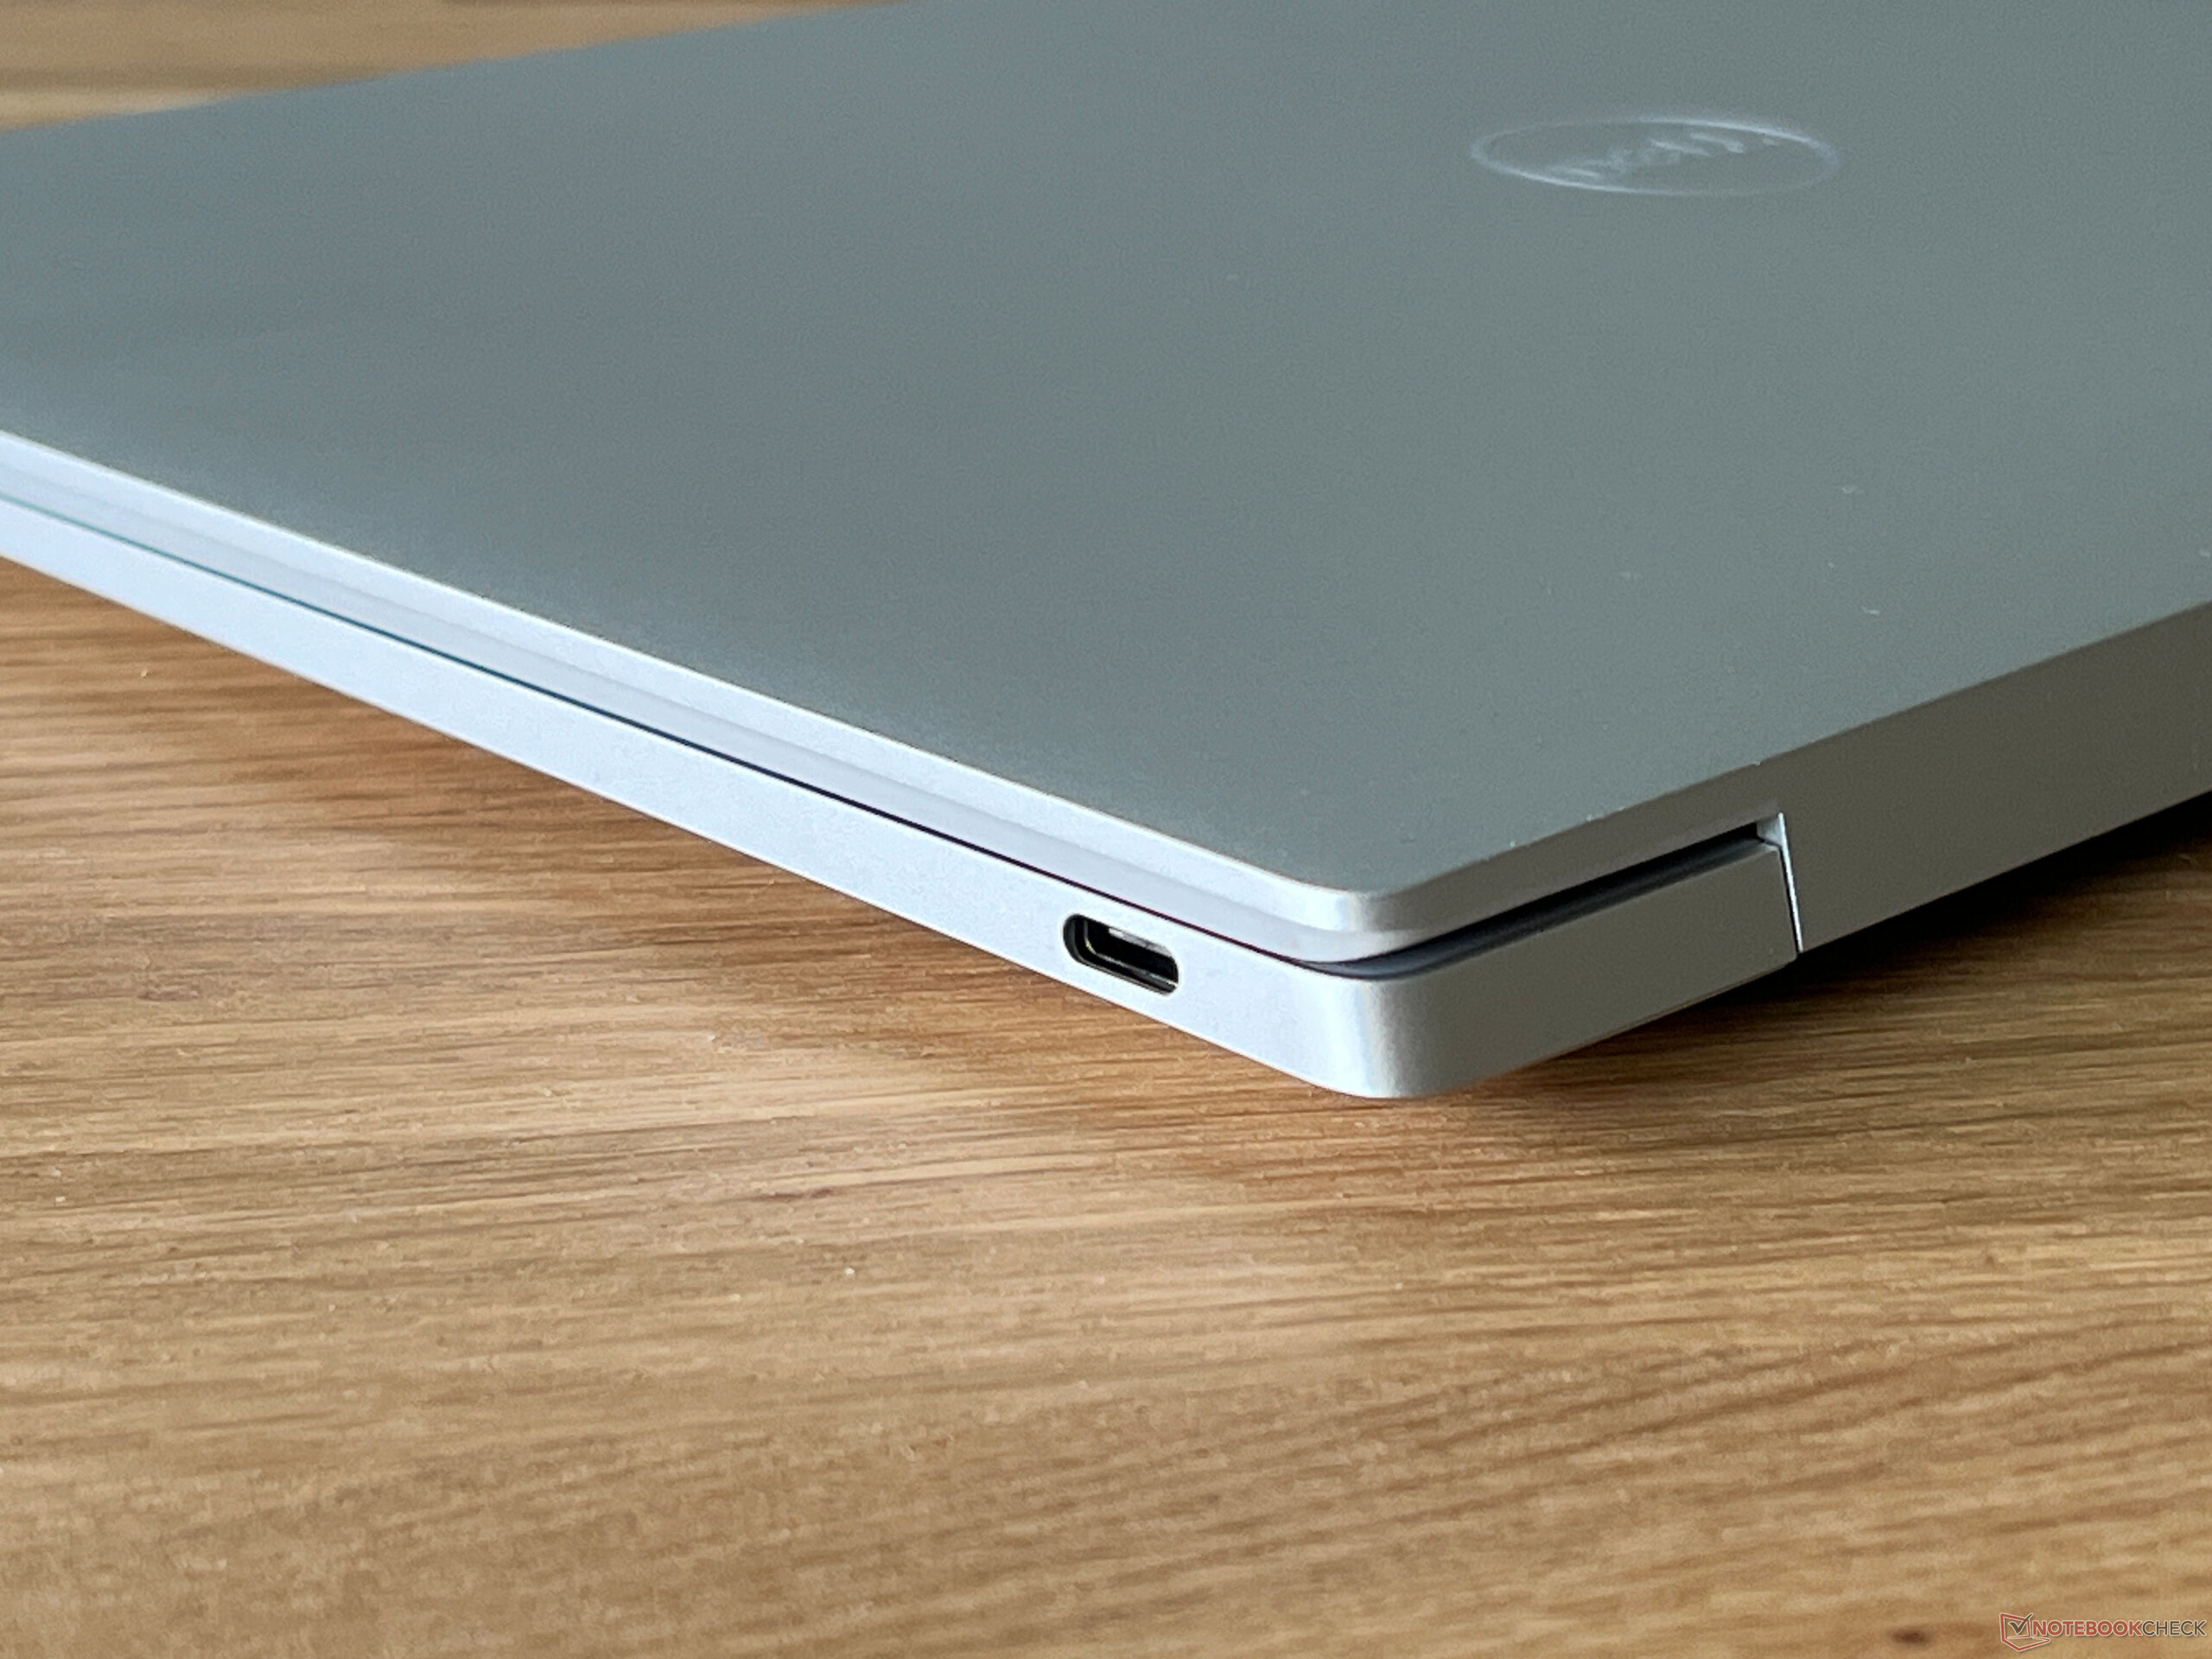
与两个较大的同胞兄弟相比,XPS 13 在端口方面需要弥补很多不足,因为读卡器和音频插孔都被取消了。它只有一个 USB-C 端口,两侧各有一个雷电 4 接口。实际上,两侧都能连接电源是件好事,但这样往往只能空出一个端口来使用。
交流
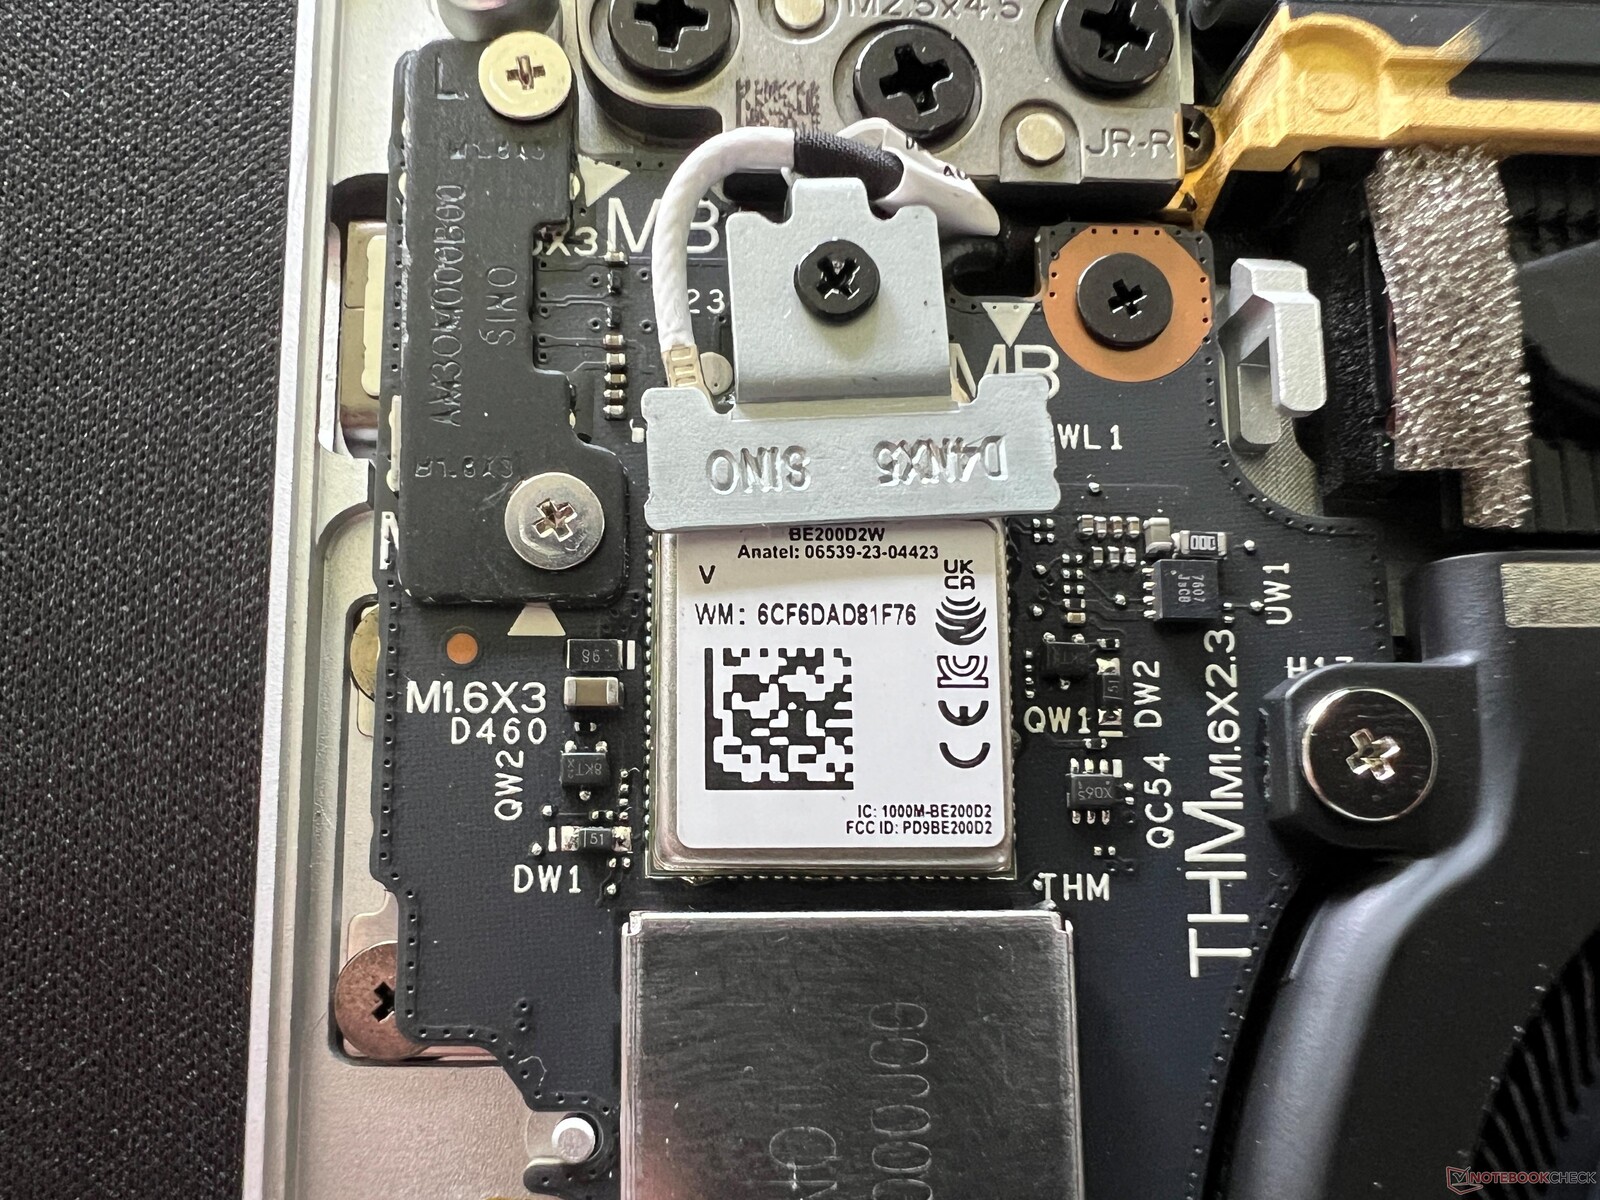
英特尔 BE200 WLAN 模块已经支持 Wi-Fi 7 和蓝牙 5.4。在我们的 WLAN 测试中,它与华硕的参考路由器配合使用,整体传输速率高且稳定。在整个测试阶段,我们没有发现任何问题。
| Networking | |
| Dell XPS 13 9340 Core Ultra 7 | |
| iperf3 transmit AXE11000 | |
| iperf3 receive AXE11000 | |
| Apple MacBook Air 13 M3 10C GPU | |
| iperf3 transmit AXE11000 | |
| iperf3 receive AXE11000 | |
| Asus ZenBook S13 OLED UX5304 | |
| iperf3 transmit AXE11000 | |
| iperf3 receive AXE11000 | |
| Lenovo ThinkPad Z13 Gen 2 | |
| iperf3 transmit AXE11000 | |
| iperf3 receive AXE11000 | |
| iperf3 transmit AXE11000 6GHz | |
| iperf3 receive AXE11000 6GHz | |
| HP Dragonfly G4 | |
| iperf3 transmit AXE11000 | |
| iperf3 receive AXE11000 | |
| iperf3 transmit AXE11000 6GHz | |
| iperf3 receive AXE11000 6GHz | |
| Dell XPS 13 Plus 9320 Core i7-1360P | |
| iperf3 transmit AXE11000 | |
| iperf3 receive AXE11000 | |
| iperf3 transmit AXE11000 6GHz | |
| iperf3 receive AXE11000 6GHz | |
网络摄像头
安装在显示屏上边缘的 1080p 摄像头可拍摄出漂亮的照片,结合流星湖处理器,工作室效果(如背景柔焦)理应成为笔记本电脑操作系统的一部分。此外,该设备还可以利用红外摄像头通过 Windows Hello 进行面部识别。


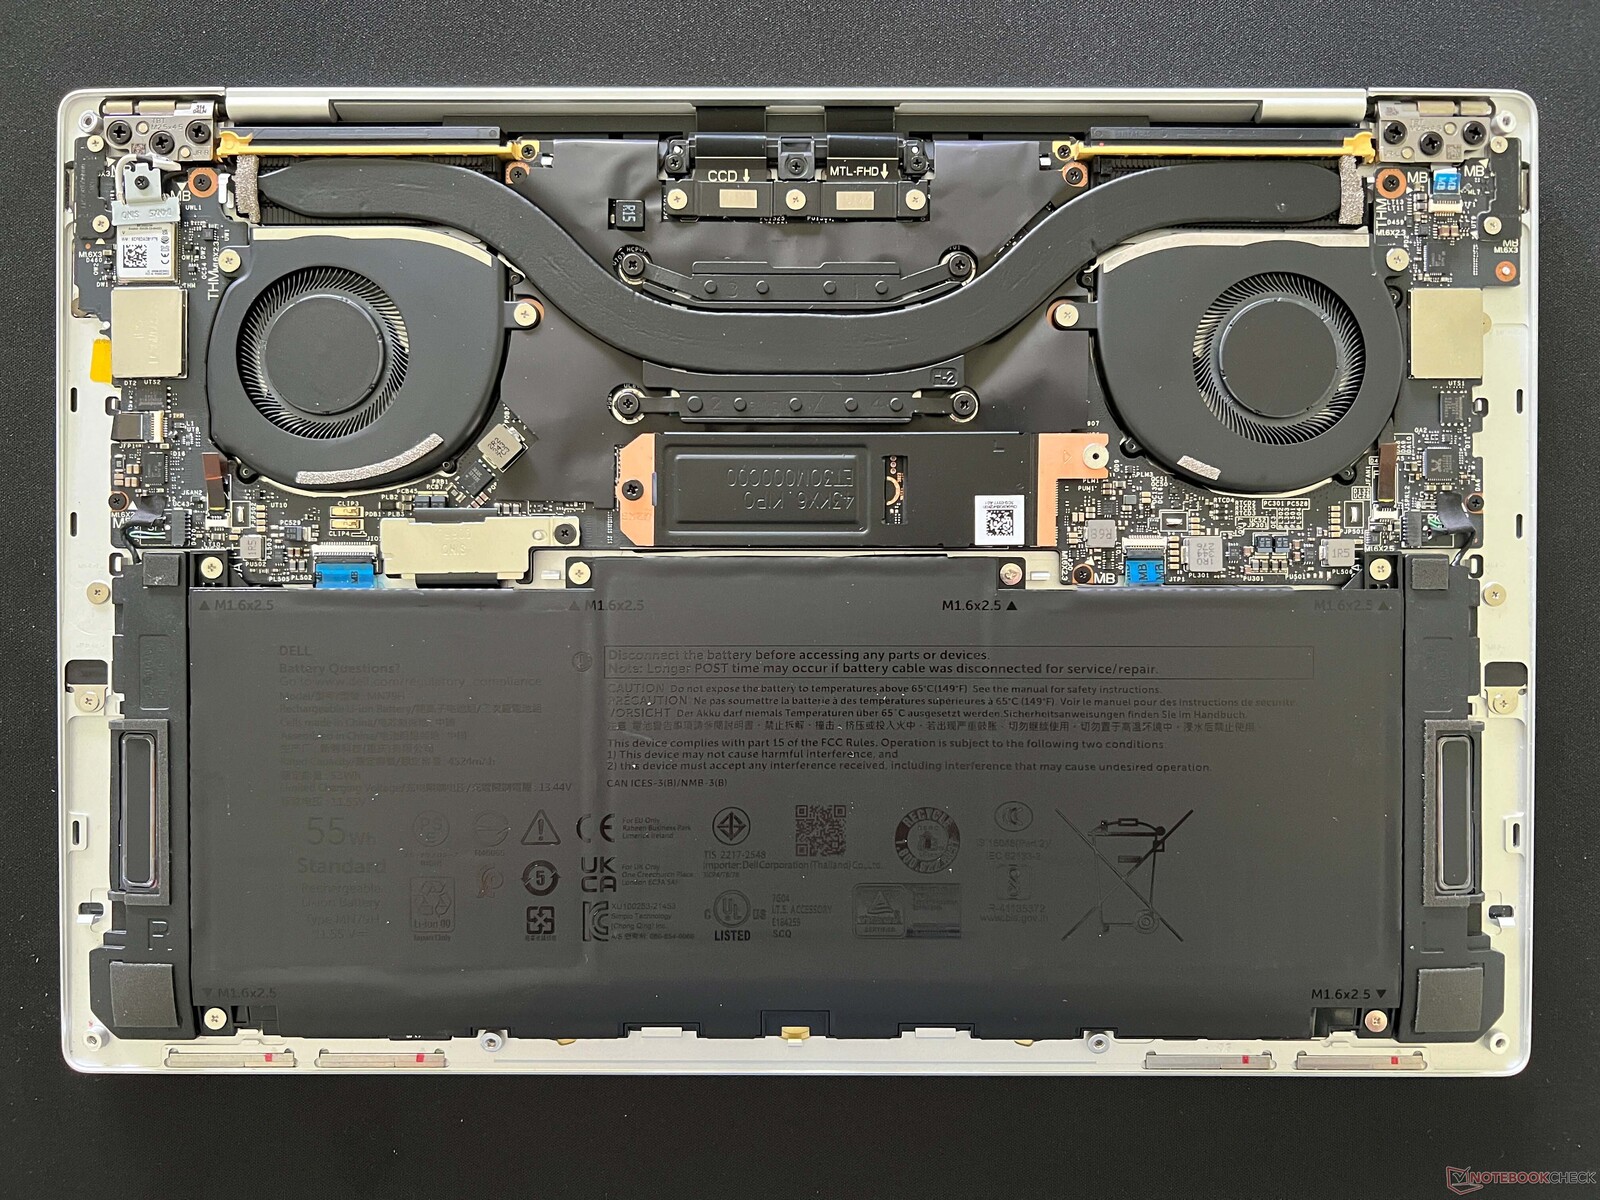
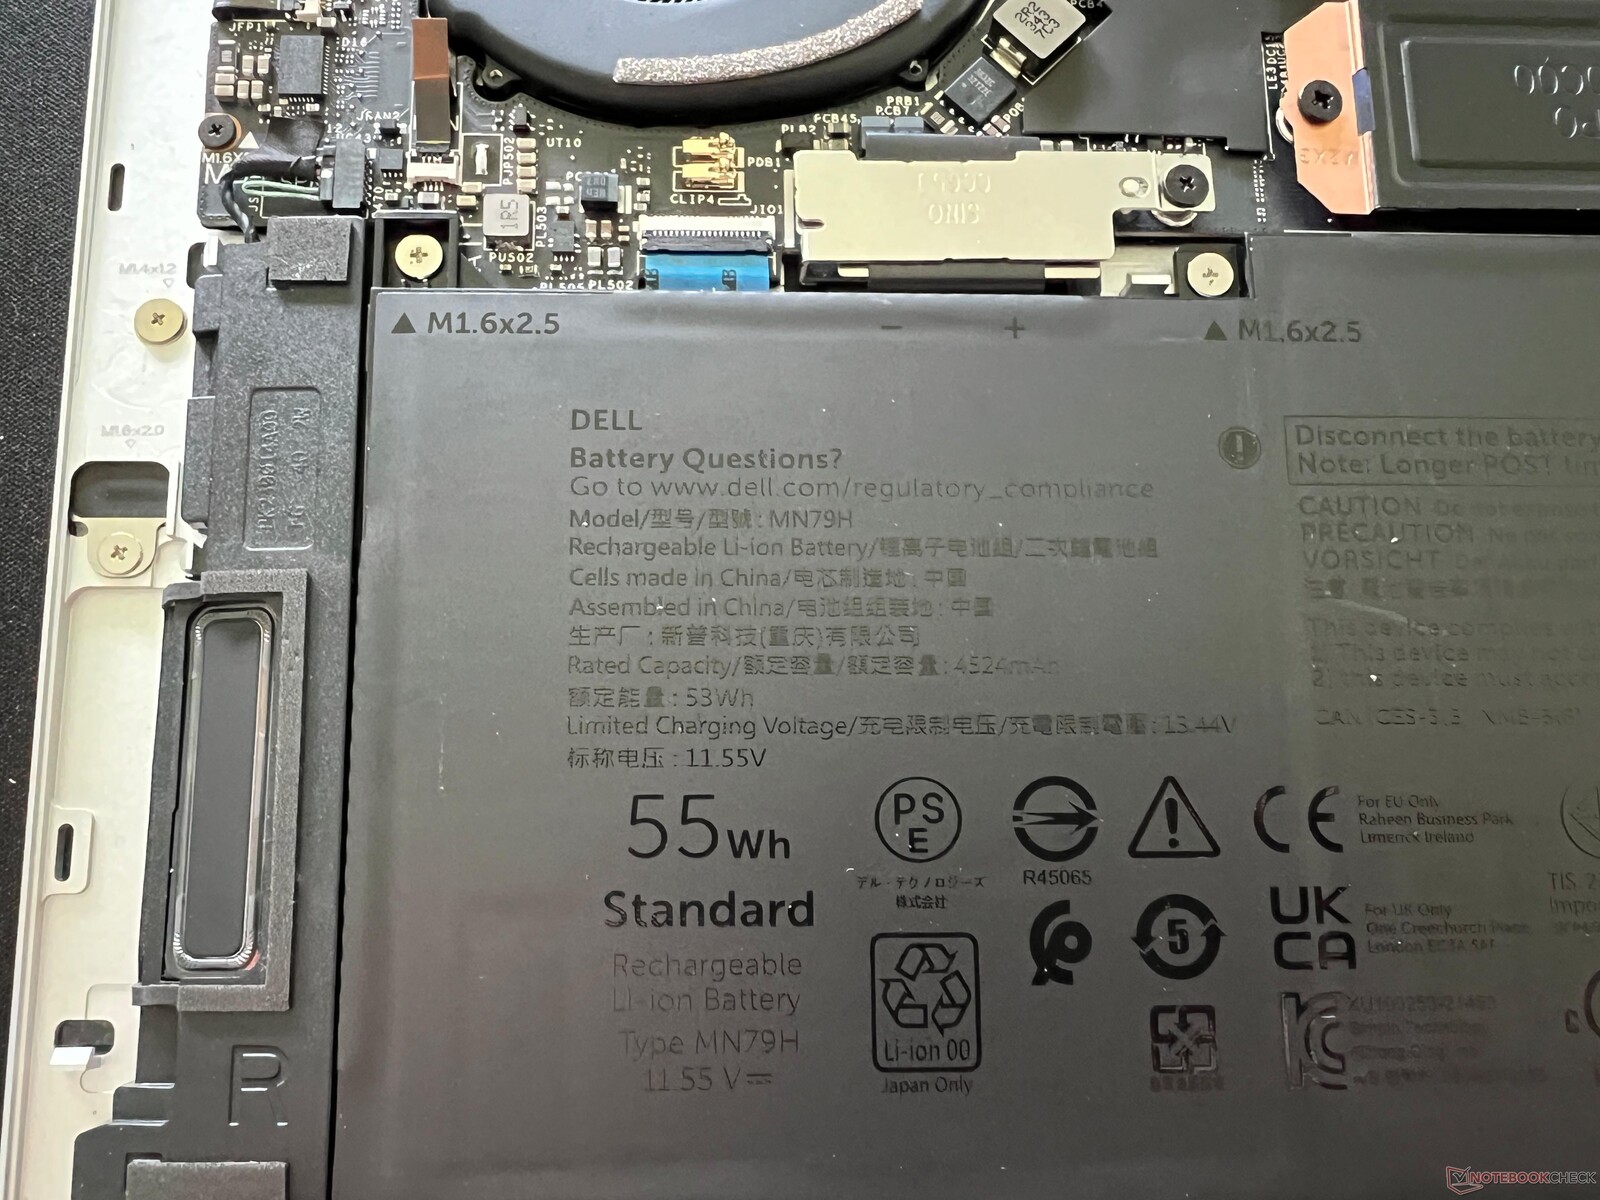
维护
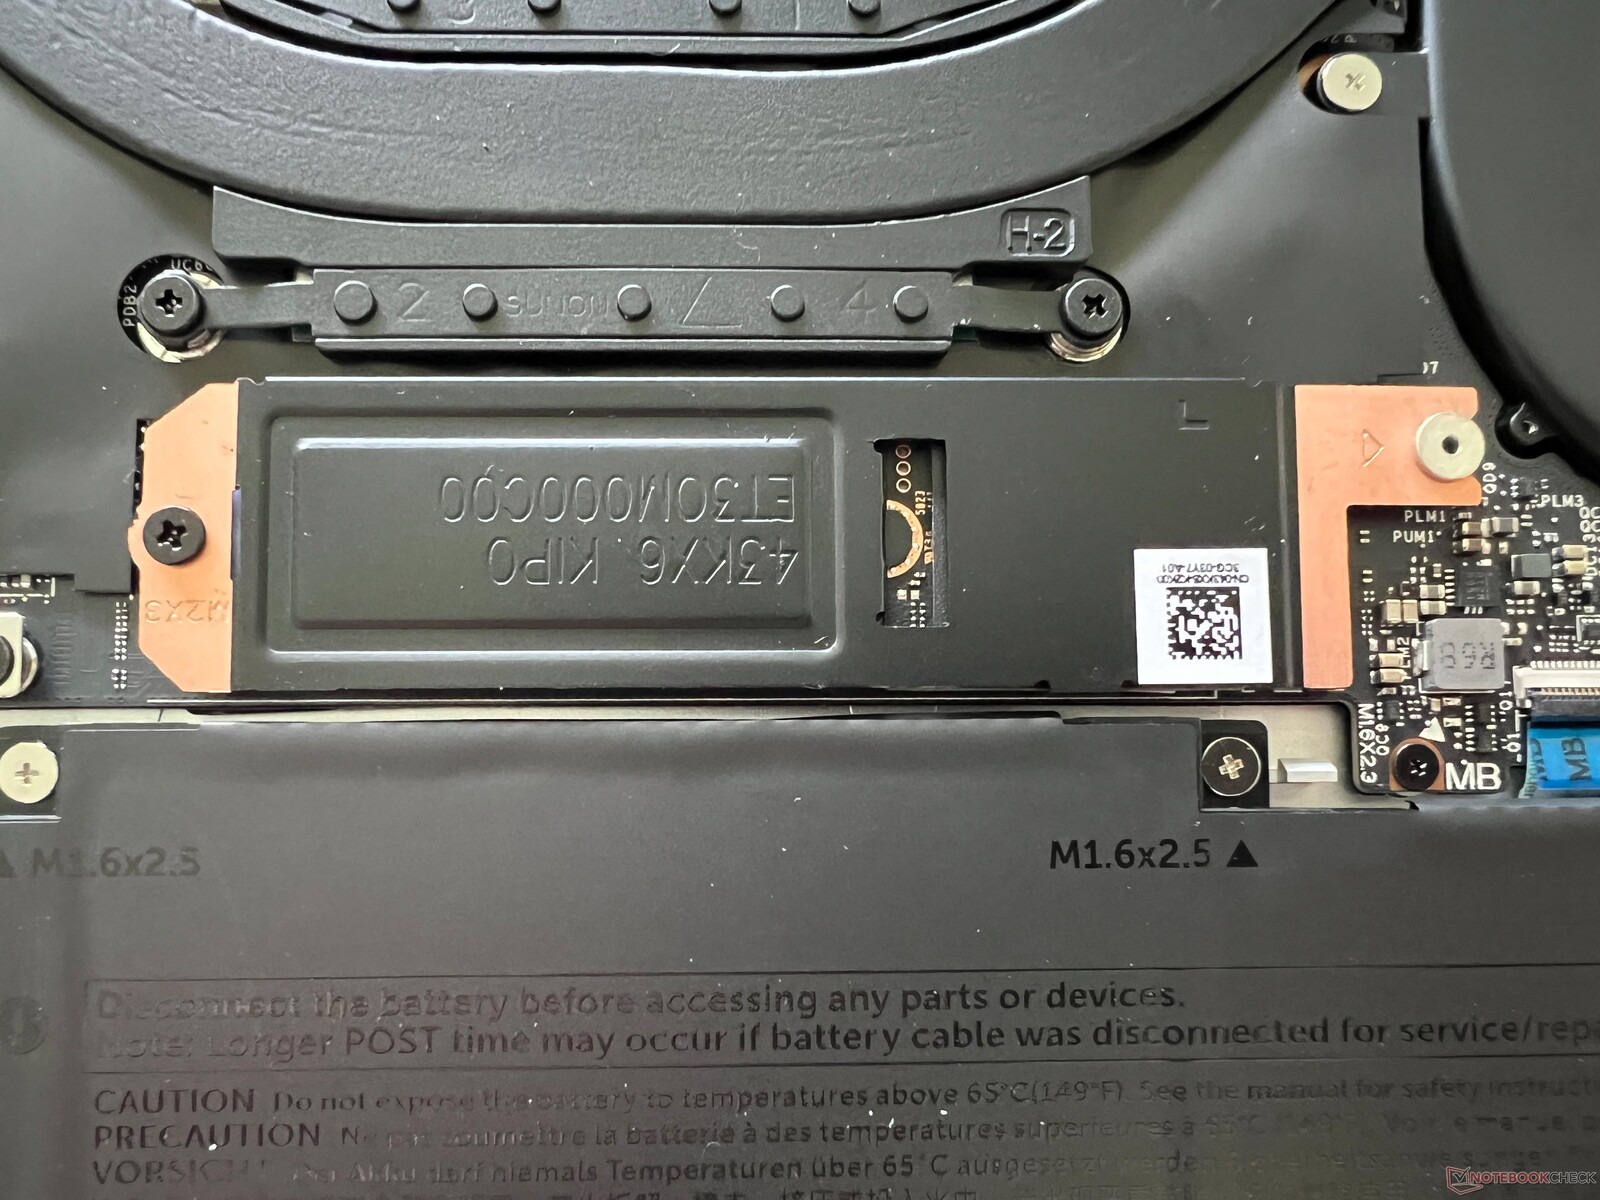
底盖用 Torx 螺钉(T5)固定,可以轻松拆卸。不过,在内部,你的维护选项仅限于清洁风扇和更换位于额外盖板下的 M.2-2280 SSD。电池用螺丝固定,需要时可以更换。
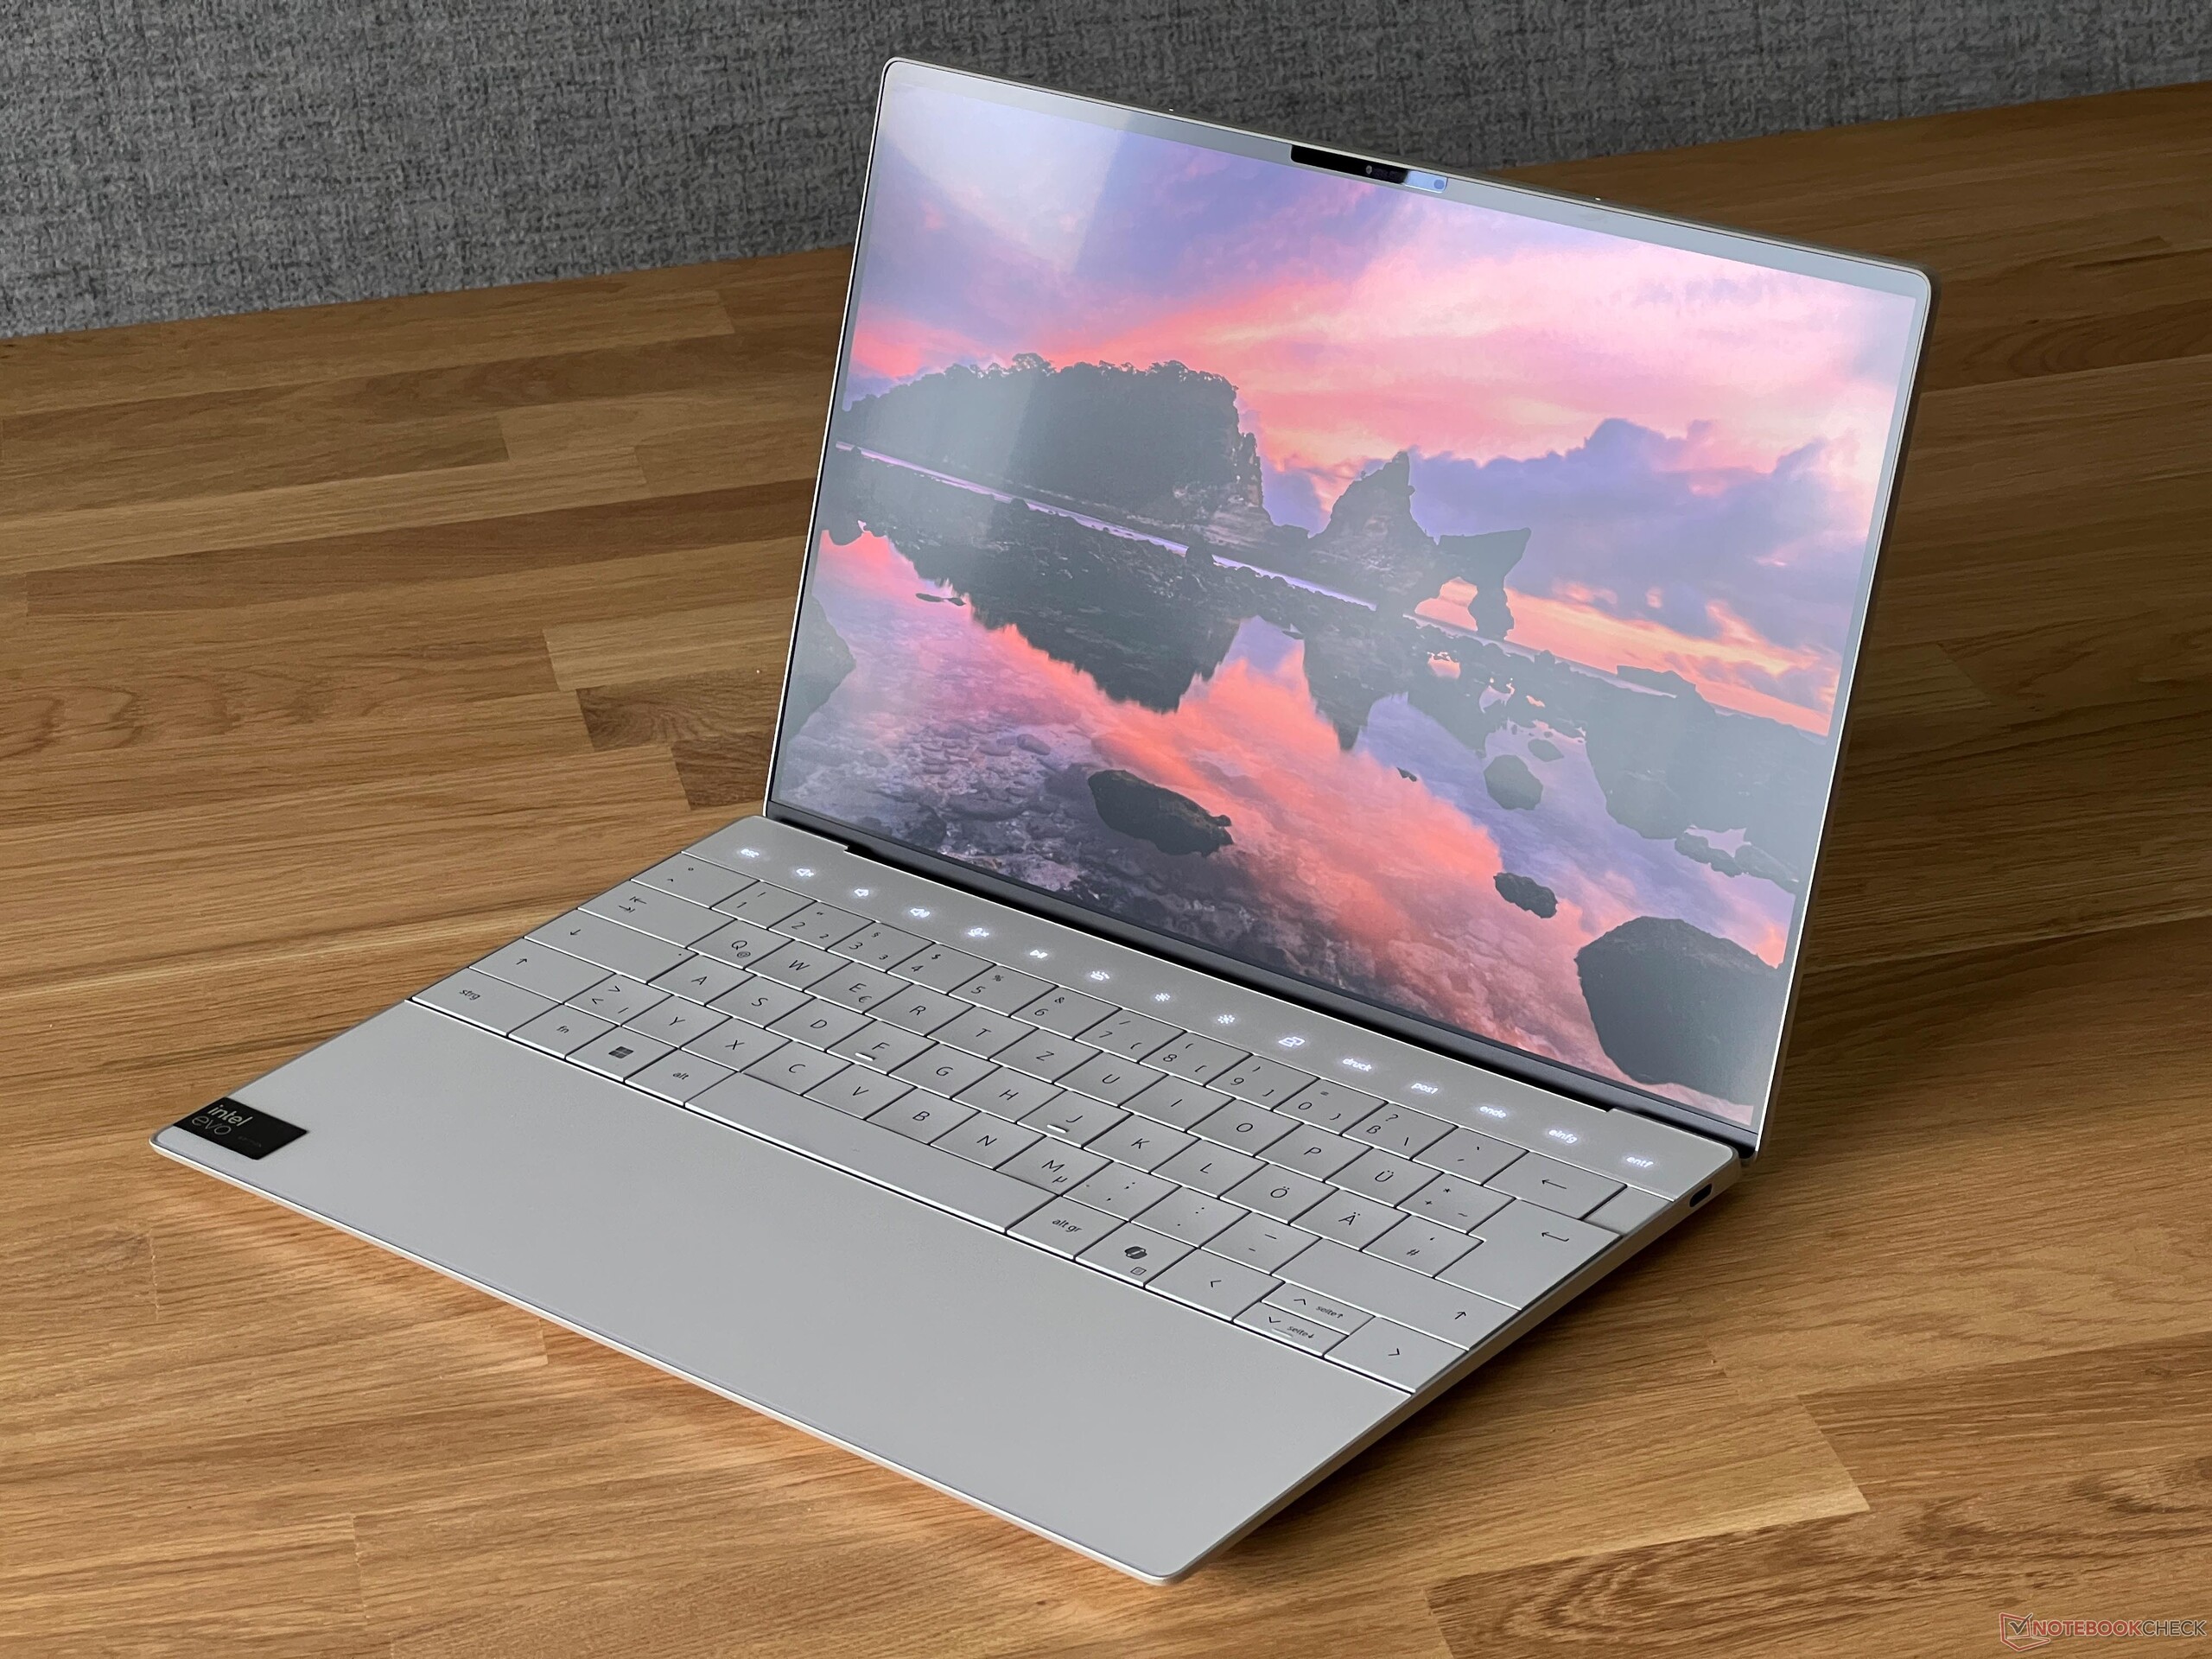
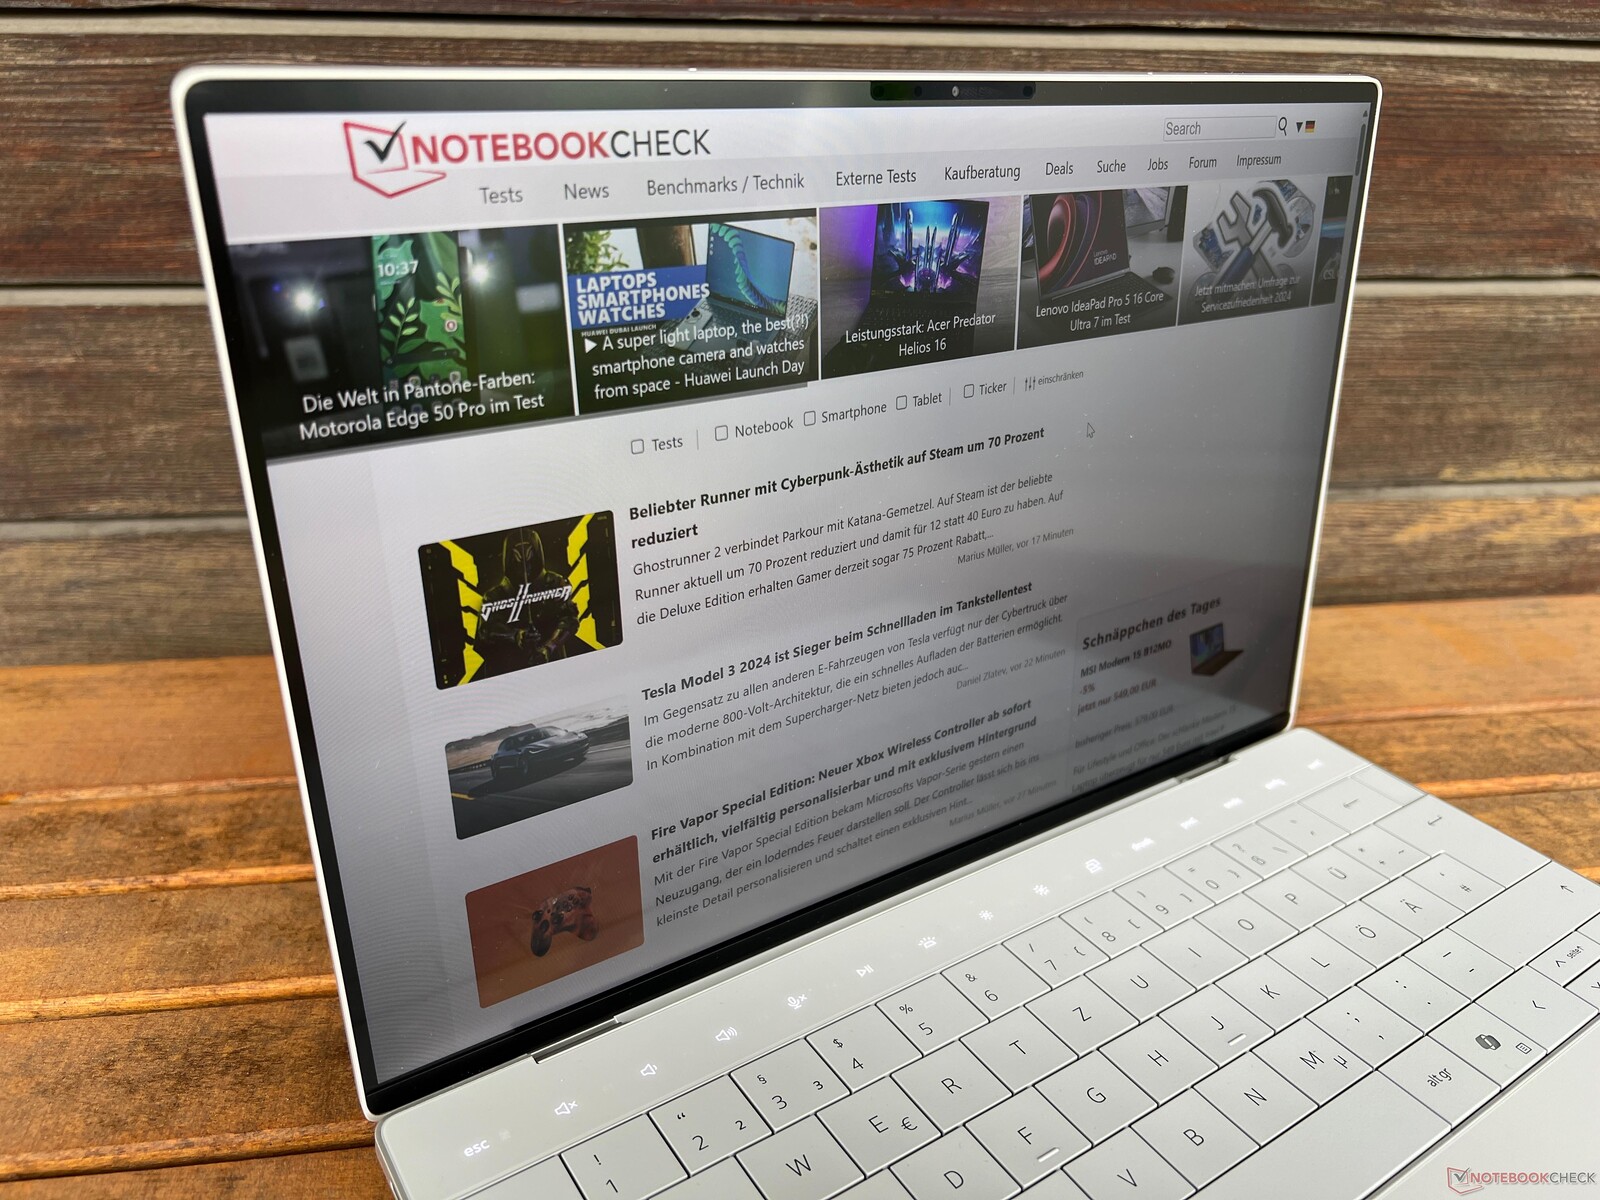
输入设备 - 键盘需要一些时间适应,功能键也很恼人
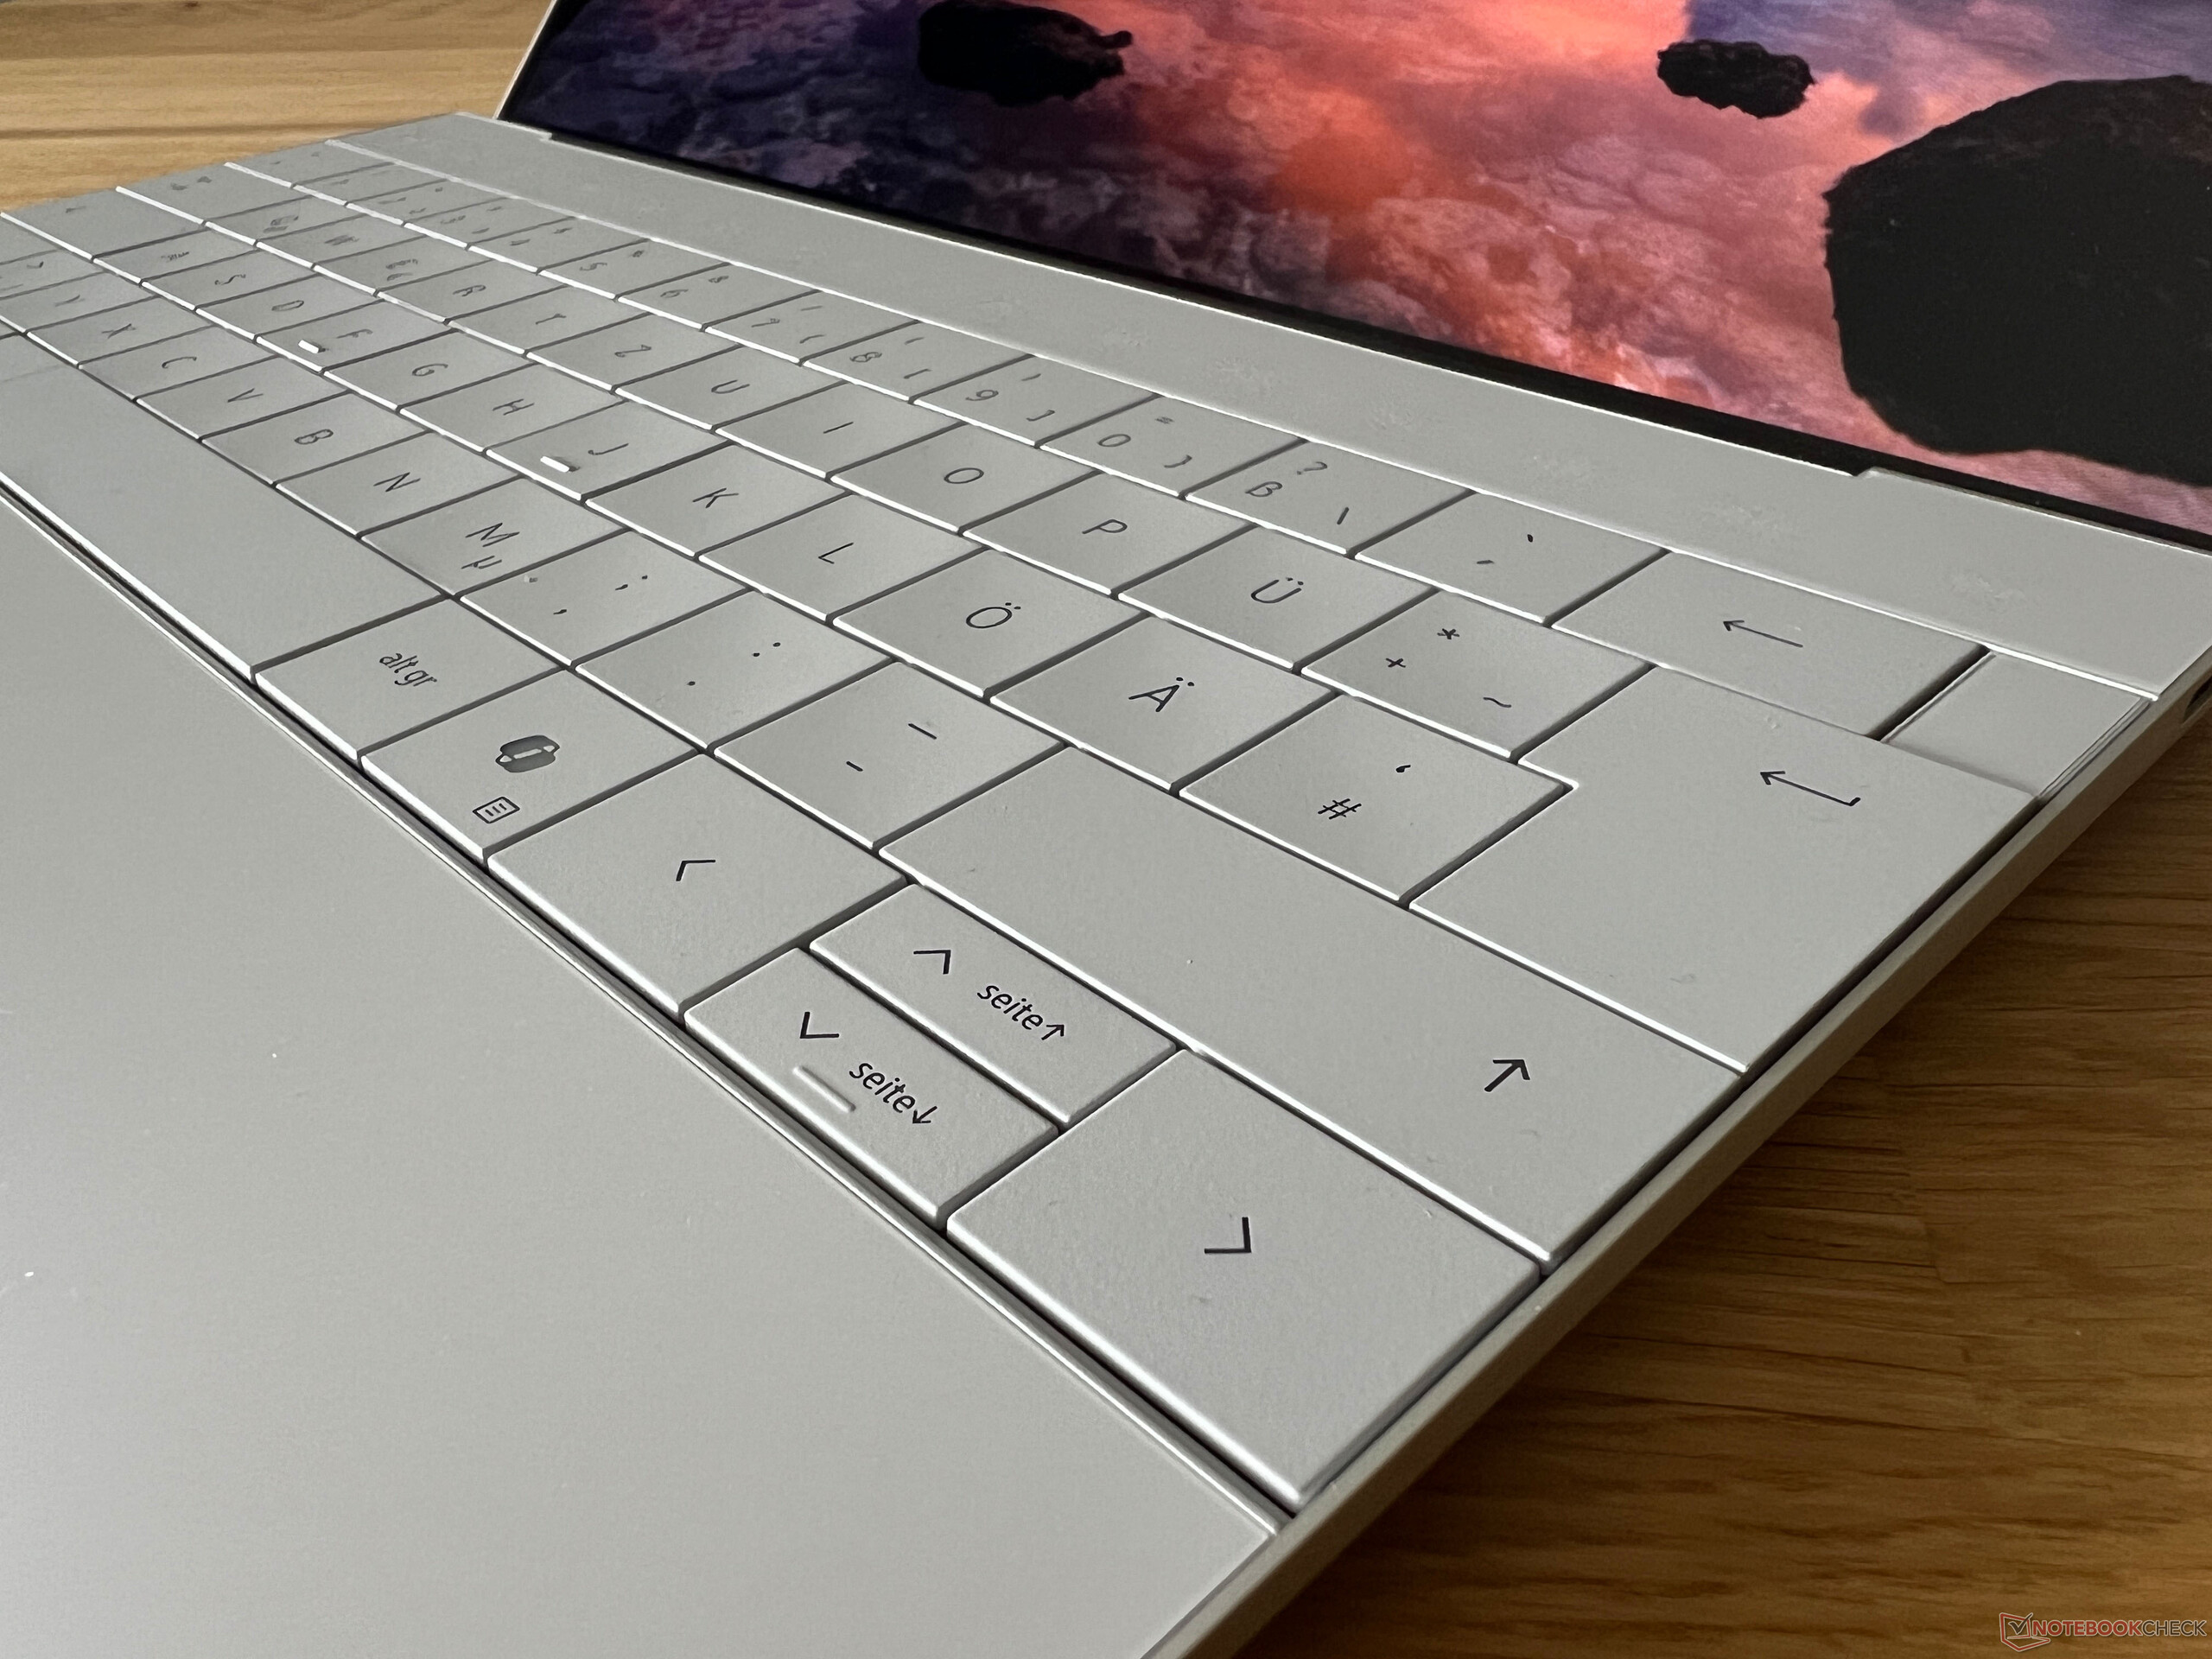
与旧款 XPS 13 Plus 一样,该机型的键盘设计在各个按键之间没有任何间隔。按键本身略微内凹,打字时总体感觉舒适,按键精准。不过,我们也注意到了一些问题,那就是我们经常会不小心按错键,而且你肯定需要适应键盘。我们还发现,垂直方向的小键有点恼人,手指粗大的人几乎无法按到。此外,大键(空格键、回车键)的声音要大得多。电源键(包括指纹扫描仪)位于右上方,也就是你通常认为的 Esc 键所在的位置,这就带来了下一个问题。
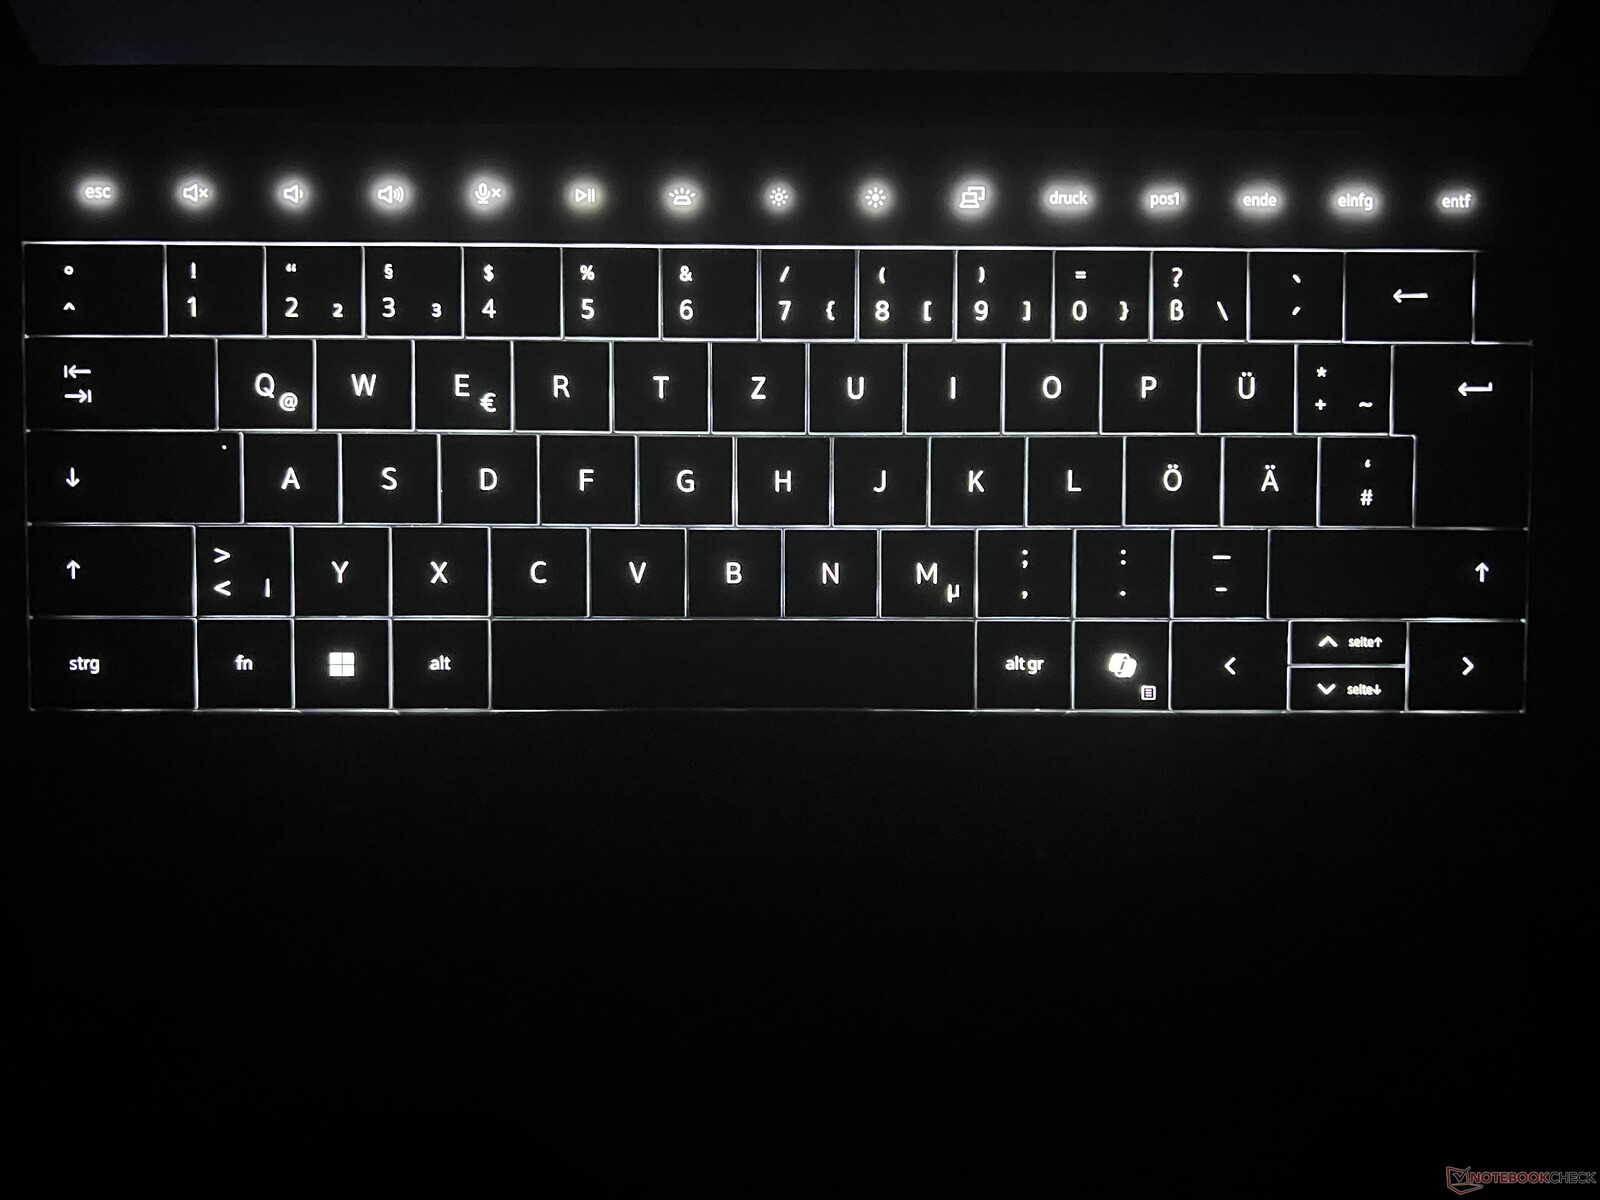
功能键以触摸条的形式安装,实际上并没有为用户带来任何额外的价值,反而让人感到非常恼火。这意味着你甚至不能盲打 Esc 键,每次都得看着按键。背光也是一个问题,因为它在不活动时会立即关闭,而在长时间无输入的视频播放时却不会这样。此外,如果你关闭键盘背光,你就不知道要按哪里,导致用户可能在背光重新开启前按错键。白色背光本身是通过传感器不断调整的,你根本无法改变它的强度--至少我们找不到这样做的选项。传感器也不关心你是否在不久前关闭了背光,因为一旦环境光线条件发生变化,背光就会被重新激活。
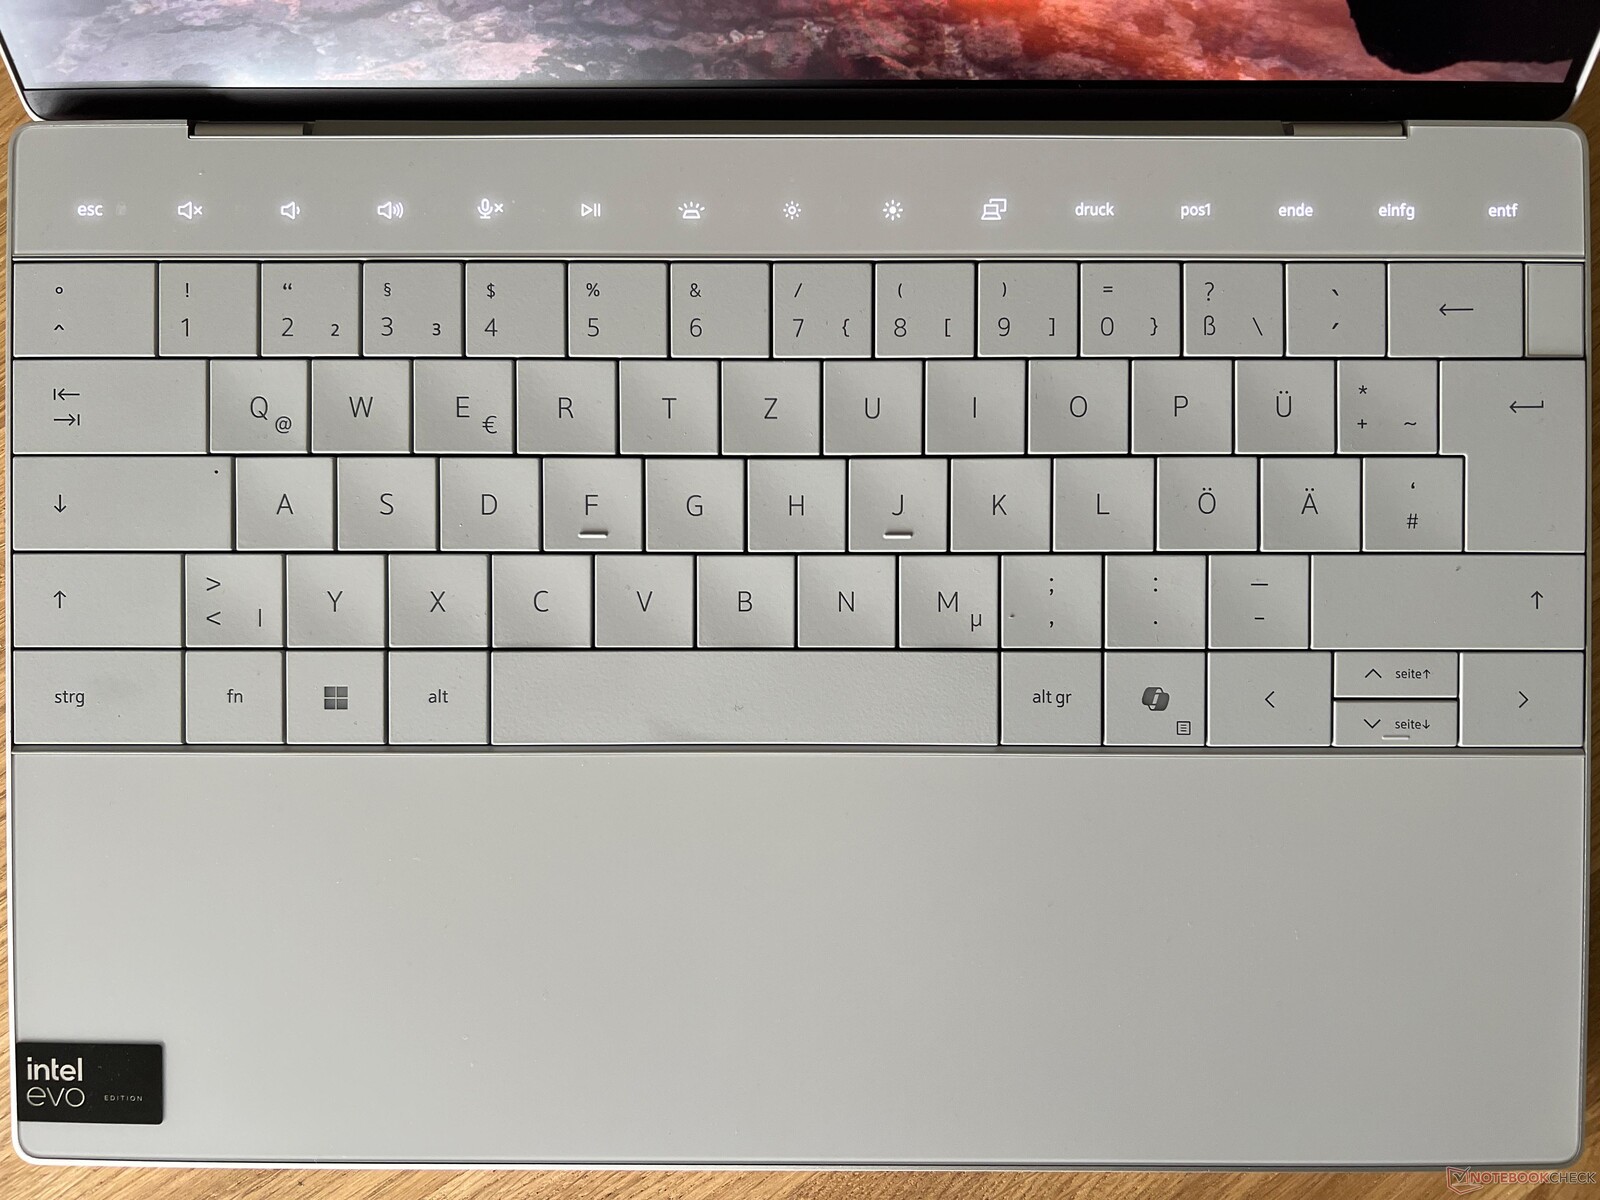
触摸板完全与掌托融为一体,没有明显的界限。触摸板使用了整个掌托的高度,宽度从左 Alt 键的中间一直延伸到新的 Copilot 键下方。总的来说,触摸板运行良好,操作流畅,触控板的点击感也不错。反过来,如果你离开该区域或在实际触摸板区域旁边稍稍开始动作,我们偶尔会遇到问题。不过,与触摸条相比,这只是一个小问题。
显示屏 - 基本型 XPS,刷新率为 120 赫兹
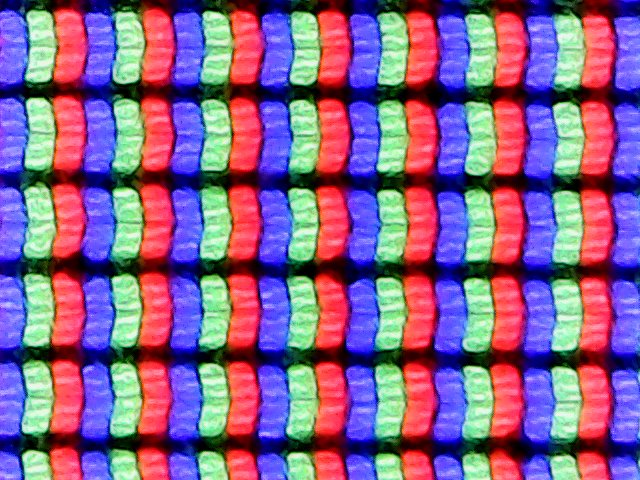
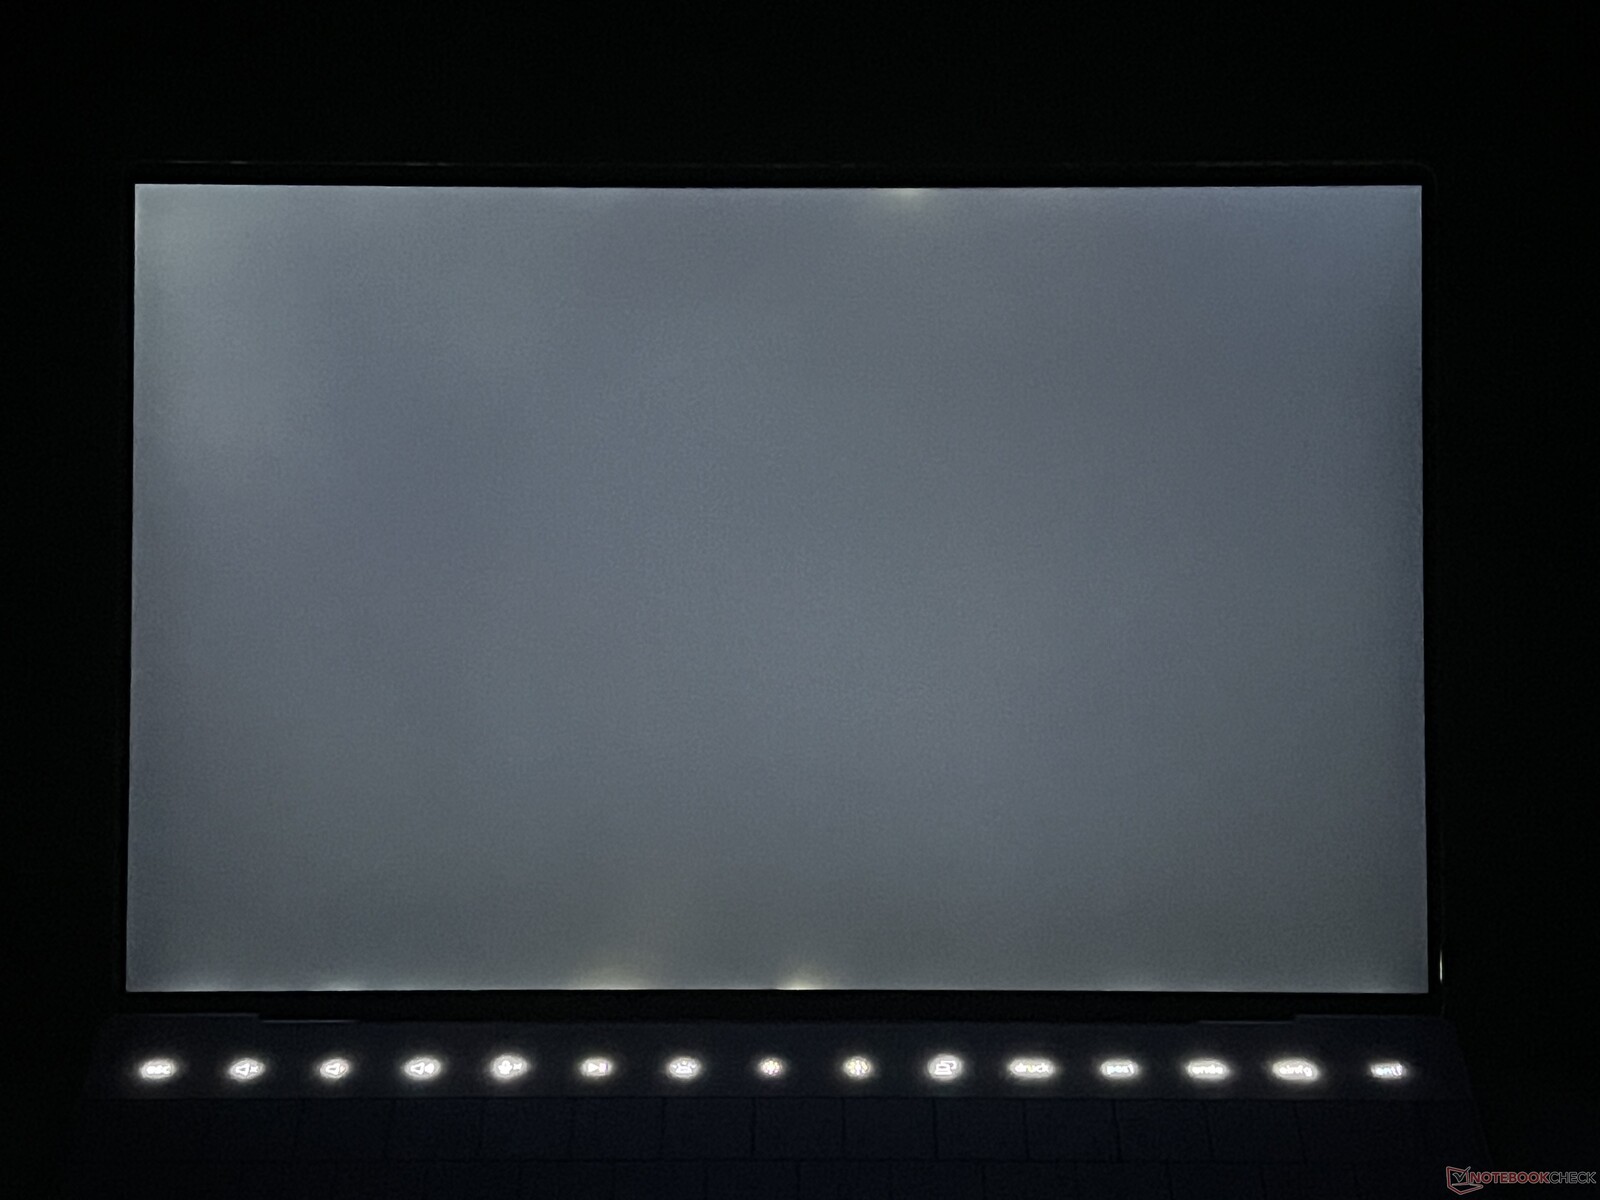
新款 XPS 13 9340 有三种不同的 13.4 英寸 IPS 显示屏可供选择。你可以选择刷新率为 60Hz 的 3K 面板(400 cd/m²,额外收费 300 美元)以及刷新率为 120Hz 的 QHD+ 触摸屏(500 cd/m²,额外收费 300 美元)。不过,我们的测试样品配备的是分辨率为 1,920 x 1,200 的基本面板,不带触摸功能。主观而言,较高的 120 Hz 频率使其画质受益匪浅,动作看起来非常流畅。此外,内容描绘足够清晰,但色彩看起来不如 OLED 面板鲜艳。此外,浅色区域看起来有些颗粒感。显示屏不使用 PWM 闪烁,但响应时间有点慢。背光出血问题不大,亮度可通过传感器自动调节。
戴尔标称亮度为 500 cd/m²,但我们的测试样品并未达到这一水平。我们测得的最高亮度为 429 cd/m²,平均亮度略高于 400 cd/m²。它的黑色值为 0.28,还算不错,至少可以达到约 1,500:1 的很好的最大对比度。另一个问题是,它的最低亮度几乎为 45 cd/m²,实在太高了。
| |||||||||||||||||||||||||
Brightness Distribution: 90 %
Center on Battery: 429 cd/m²
Contrast: 1532:1 (Black: 0.28 cd/m²)
ΔE ColorChecker Calman: 2.6 | ∀{0.5-29.43 Ø4.75}
calibrated: 1.4
ΔE Greyscale Calman: 4 | ∀{0.09-98 Ø5}
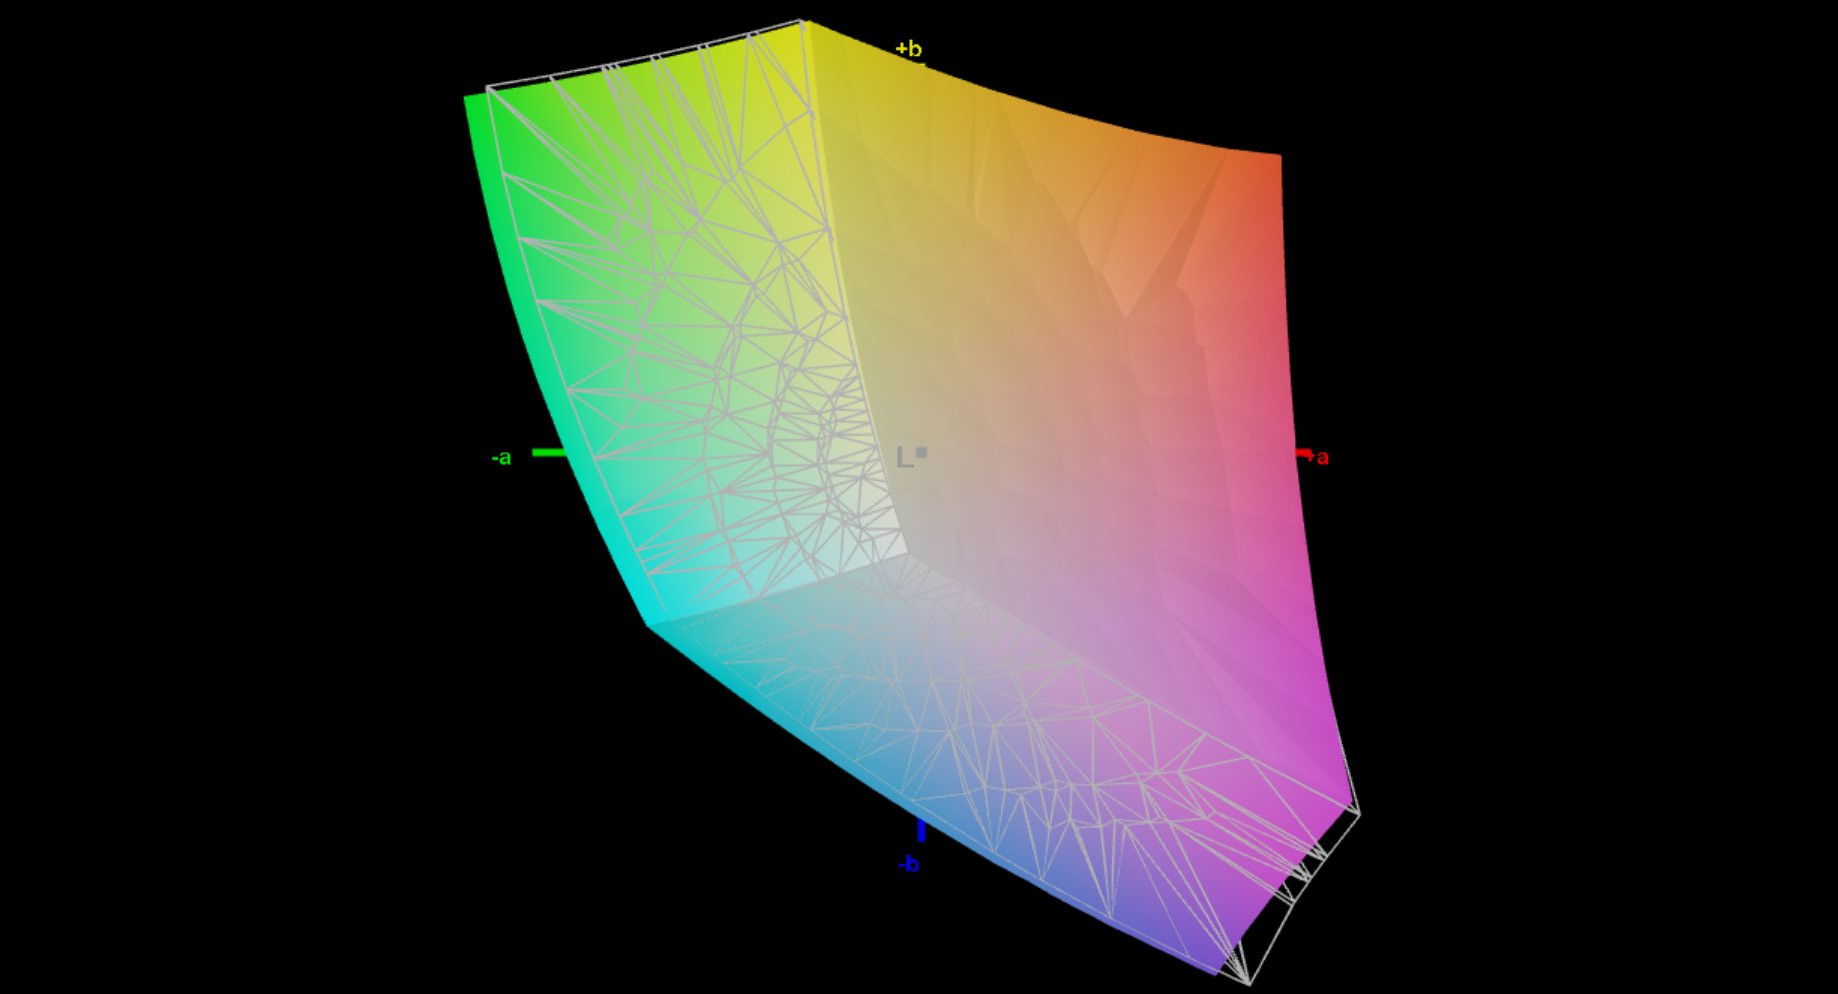
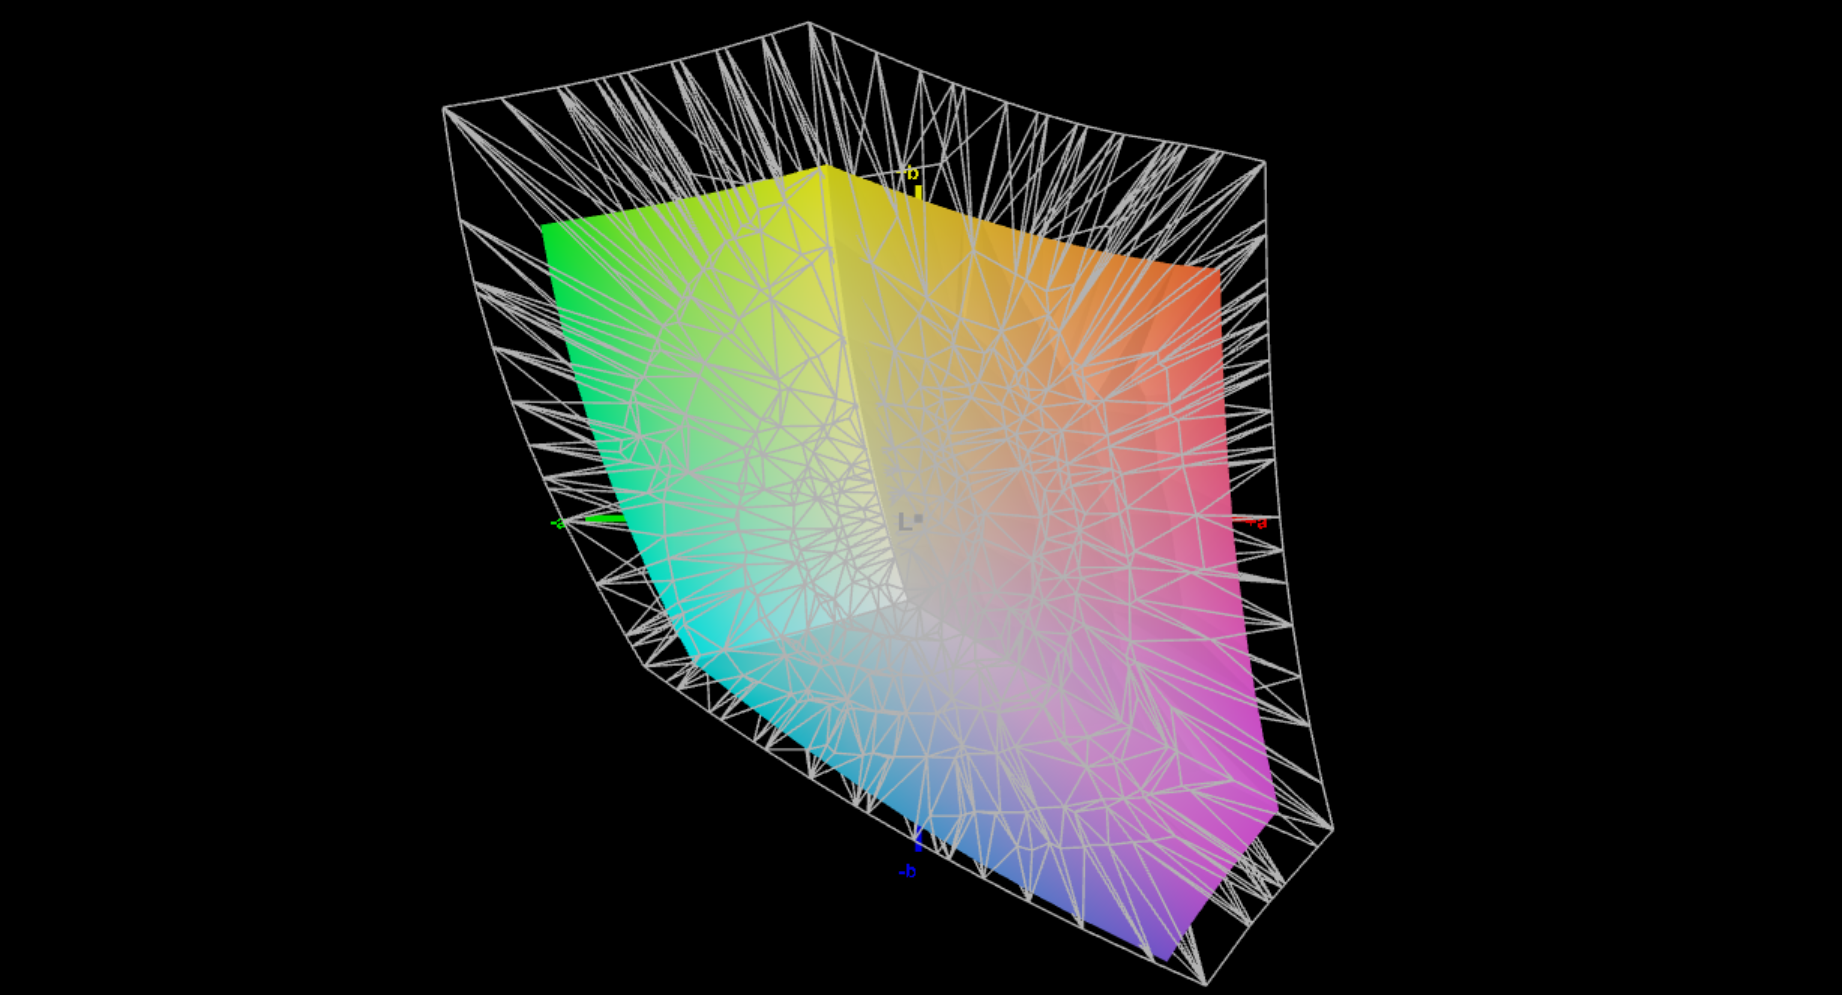
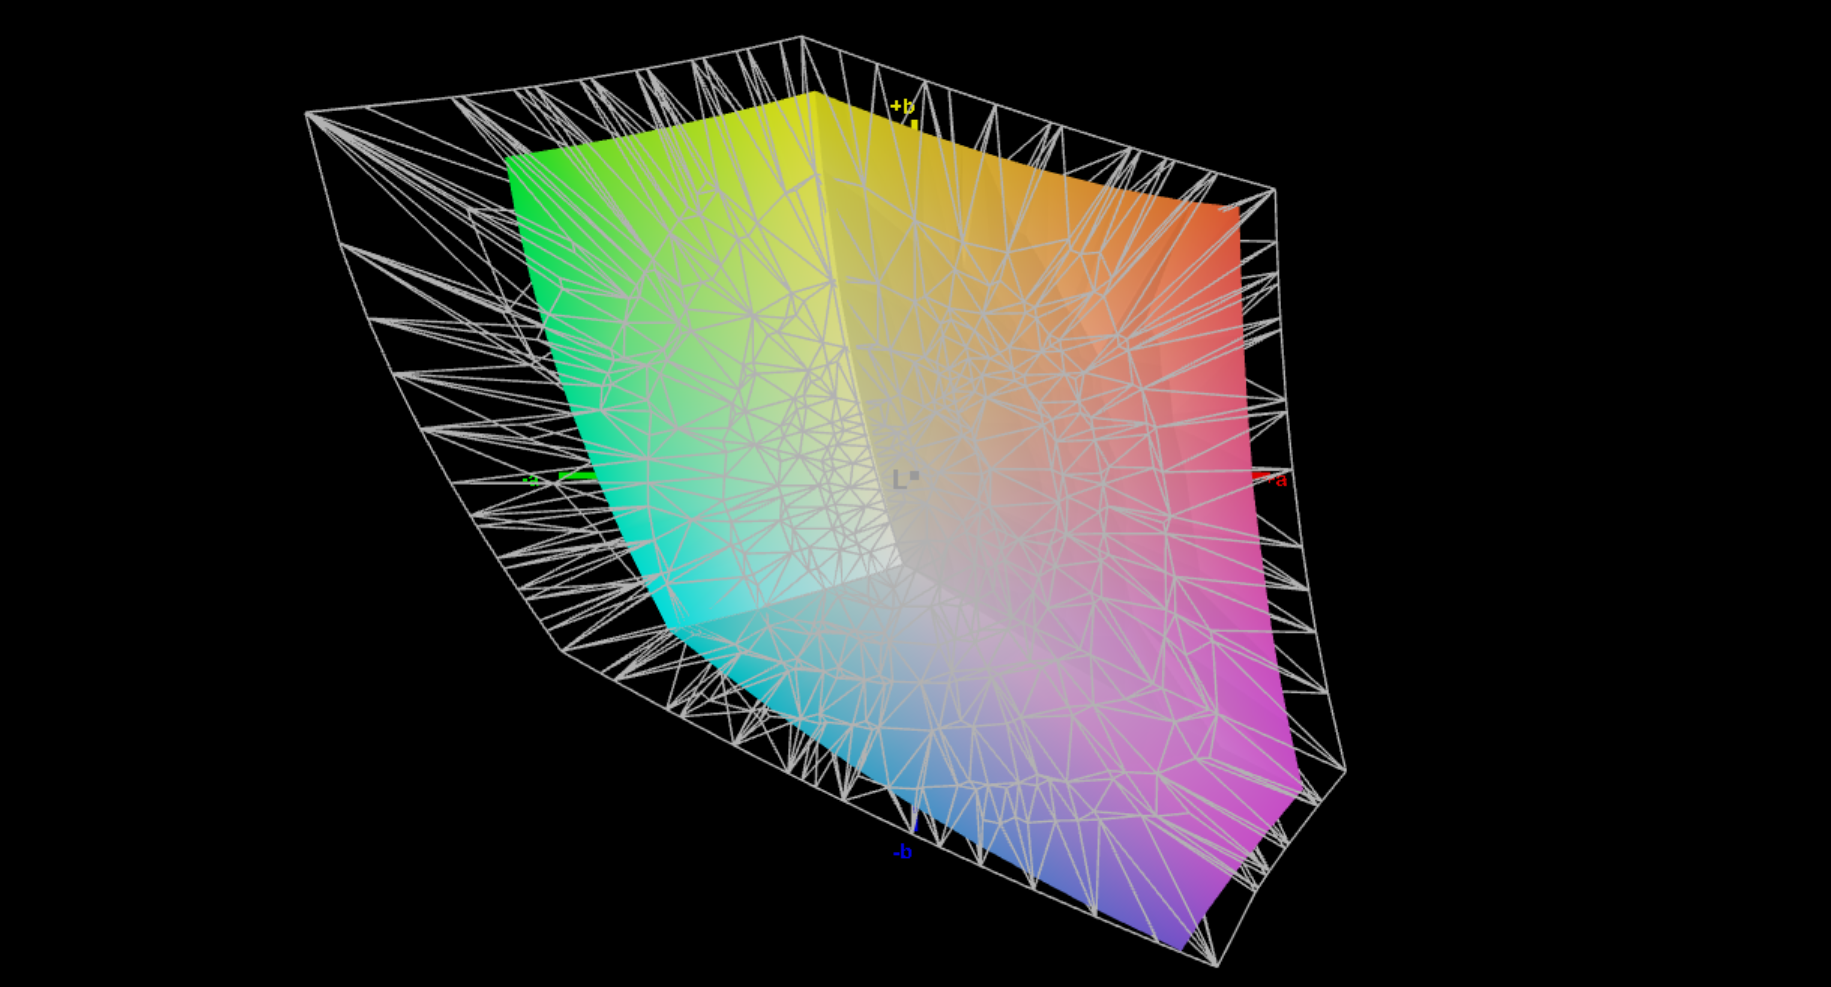
71.7% AdobeRGB 1998 (Argyll 3D)
97.8% sRGB (Argyll 3D)
69.4% Display P3 (Argyll 3D)
Gamma: 2.23
CCT: 7332 K
| Dell XPS 13 9340 Core Ultra 7 SHP1593, IPS, 1920x1200, 13.4" | Apple MacBook Air 13 M3 10C GPU IPS, 2560x1664, 13.6" | Asus ZenBook S13 OLED UX5304 SDC417B, OLED, 2880x1800, 13.3" | Lenovo ThinkPad Z13 Gen 2 ATNA33AA02-0, OLED, 2880x1800, 13.3" | HP Dragonfly G4 Chi Mei CMN13C0, IPS, 1920x1280, 13.5" | Dell XPS 13 Plus 9320 Core i7-1360P Samsung 134XK04, OLED, 3456x2160, 13.4" | |
|---|---|---|---|---|---|---|
| Display | 22% | 27% | 27% | -1% | 27% | |
| Display P3 Coverage (%) | 69.4 | 98.4 42% | 99.7 44% | 99.7 44% | 68.4 -1% | 99.7 44% |
| sRGB Coverage (%) | 97.8 | 99.9 2% | 100 2% | 100 2% | 98.3 1% | 100 2% |
| AdobeRGB 1998 Coverage (%) | 71.7 | 87.9 23% | 96.9 35% | 97.3 36% | 70.4 -2% | 96.8 35% |
| Response Times | 11% | 95% | 94% | -13% | 94% | |
| Response Time Grey 50% / Grey 80% * (ms) | 43.2 ? | 34.5 ? 20% | 2 ? 95% | 2.1 ? 95% | 48.8 ? -13% | 2.18 ? 95% |
| Response Time Black / White * (ms) | 27.6 ? | 27.2 ? 1% | 1.6 ? 94% | 2.2 ? 92% | 31.3 ? -13% | 2.08 ? 92% |
| PWM Frequency (Hz) | 240 ? | 60.1 ? | 238.6 ? | |||
| Screen | 17% | 30% | 29% | 14% | -39% | |
| Brightness middle (cd/m²) | 429 | 525 22% | 361 -16% | 372 -13% | 408.8 -5% | 361.7 -16% |
| Brightness (cd/m²) | 407 | 506 24% | 365 -10% | 375 -8% | 399 -2% | 367 -10% |
| Brightness Distribution (%) | 90 | 92 2% | 98 9% | 99 10% | 90 0% | 96 7% |
| Black Level * (cd/m²) | 0.28 | 0.42 -50% | 0.32 -14% | |||
| Contrast (:1) | 1532 | 1250 -18% | 1278 -17% | |||
| Colorchecker dE 2000 * | 2.6 | 1.4 46% | 1.2 54% | 0.88 66% | 2.02 22% | 4.83 -86% |
| Colorchecker dE 2000 max. * | 6.6 | 2.8 58% | 1.9 71% | 3.22 51% | 3.84 42% | 9.34 -42% |
| Colorchecker dE 2000 calibrated * | 1.4 | 0.61 56% | 3.97 -184% | |||
| Greyscale dE 2000 * | 4 | 2 50% | 1.2 70% | 1.2 70% | 2.3 43% | 1.8 55% |
| Gamma | 2.23 99% | 2.2 100% | 2.27 97% | 2.18 101% | 2.2 100% | 2.33 94% |
| CCT | 7332 89% | 6876 95% | 6486 100% | 6326 103% | 6203 105% | 6438 101% |
| Total Average (Program / Settings) | 17% /
17% | 51% /
41% | 50% /
40% | 0% /
7% | 27% /
-1% |
* ... smaller is better
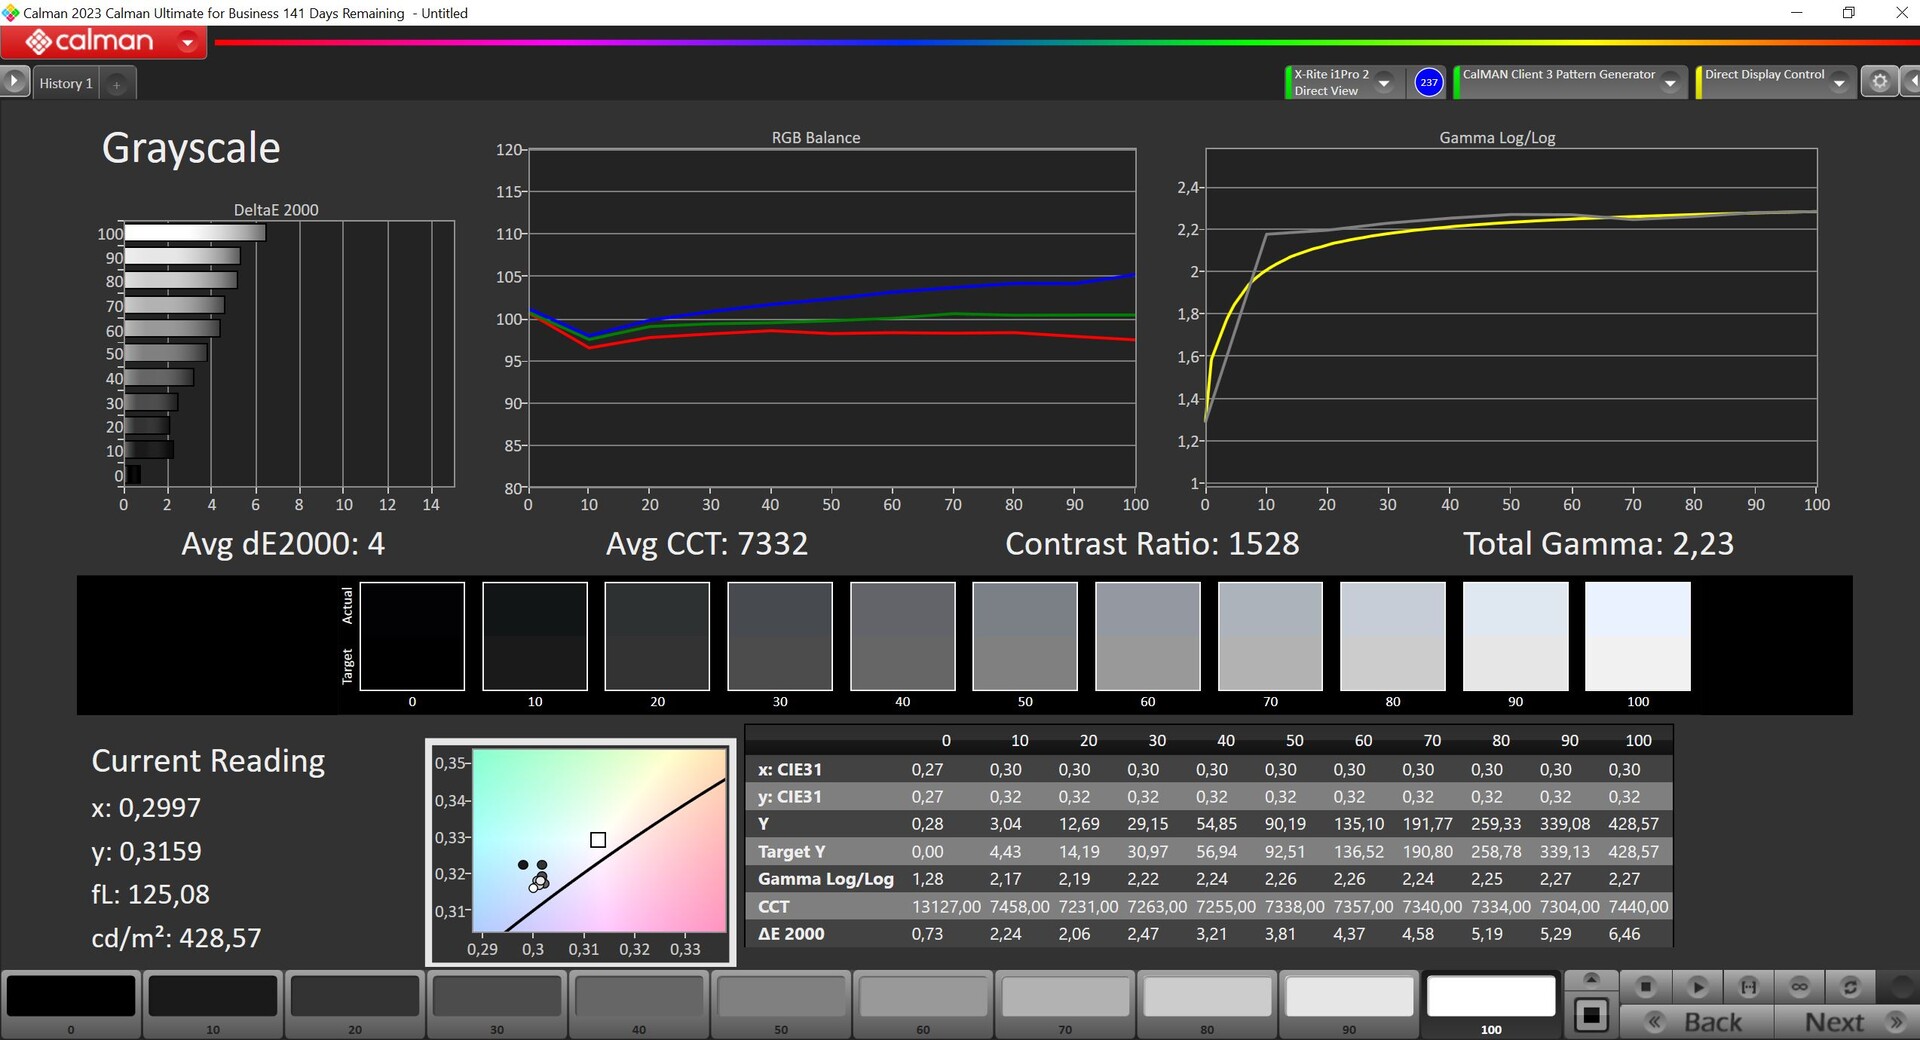
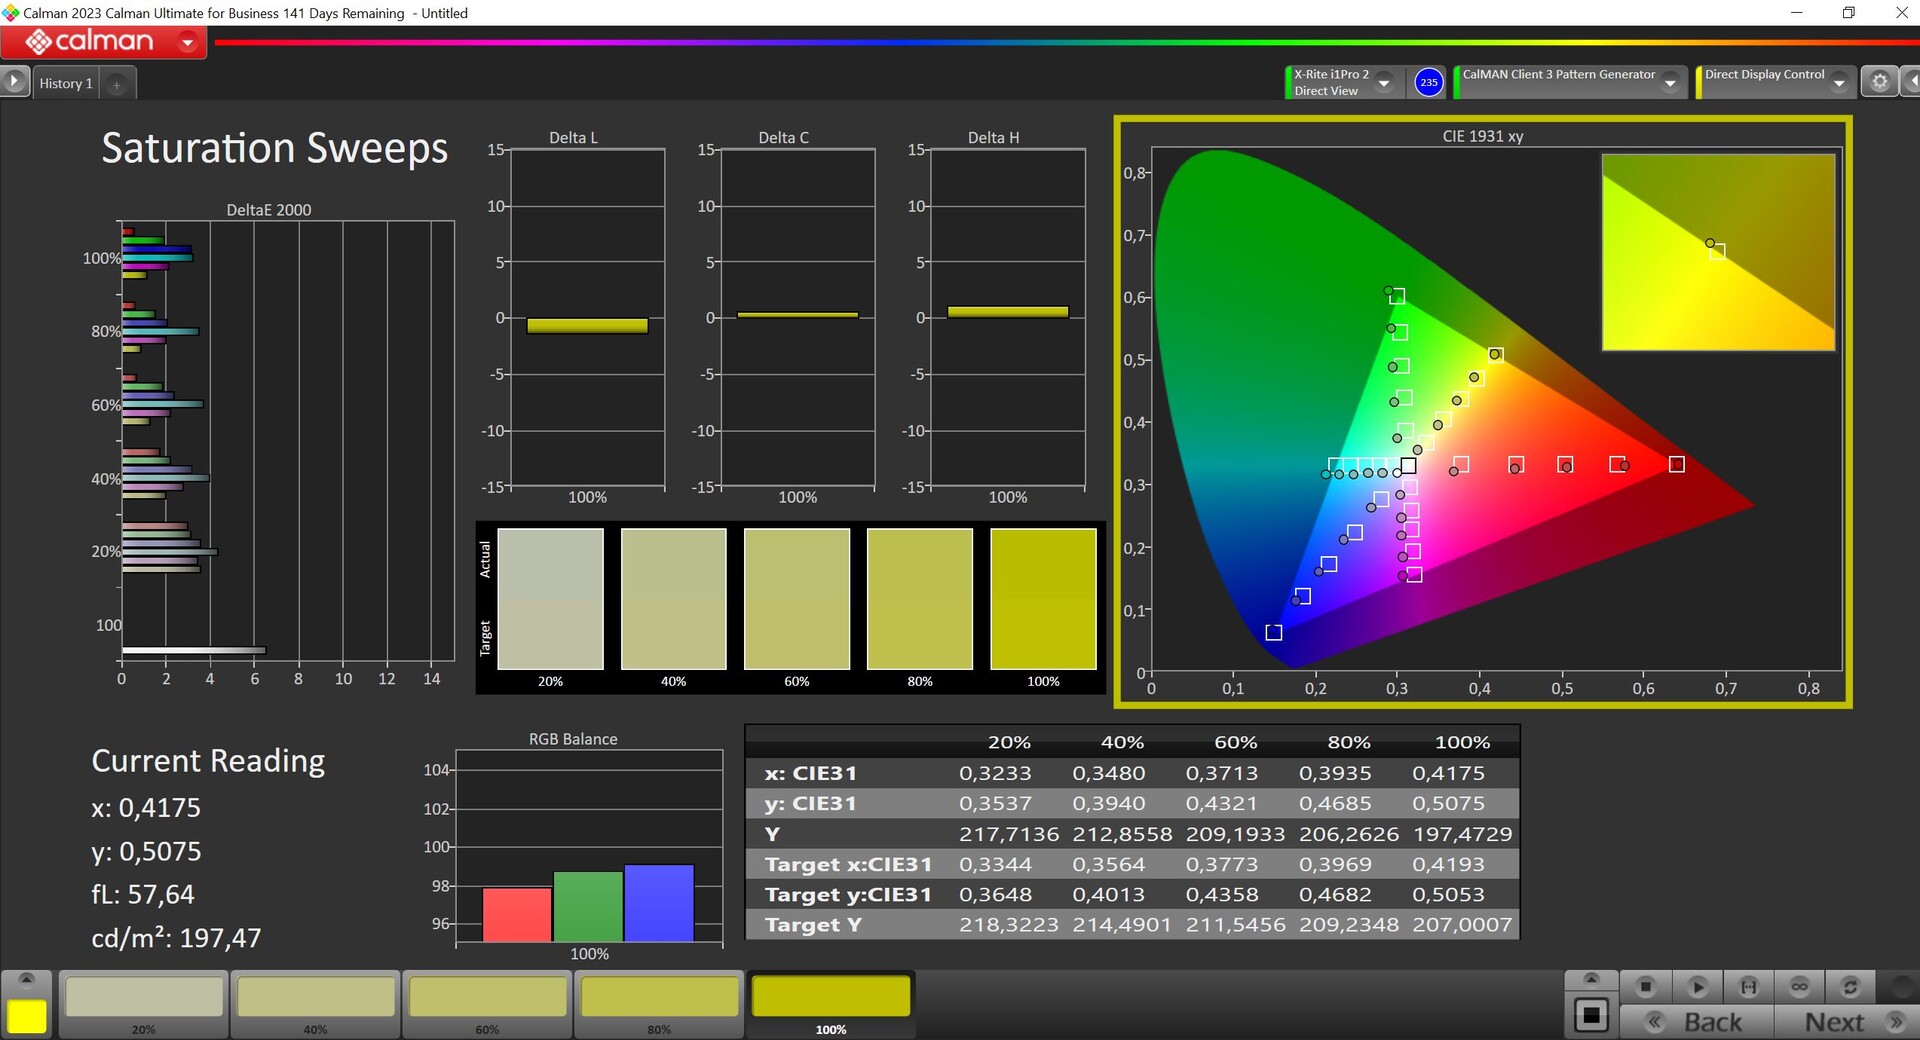
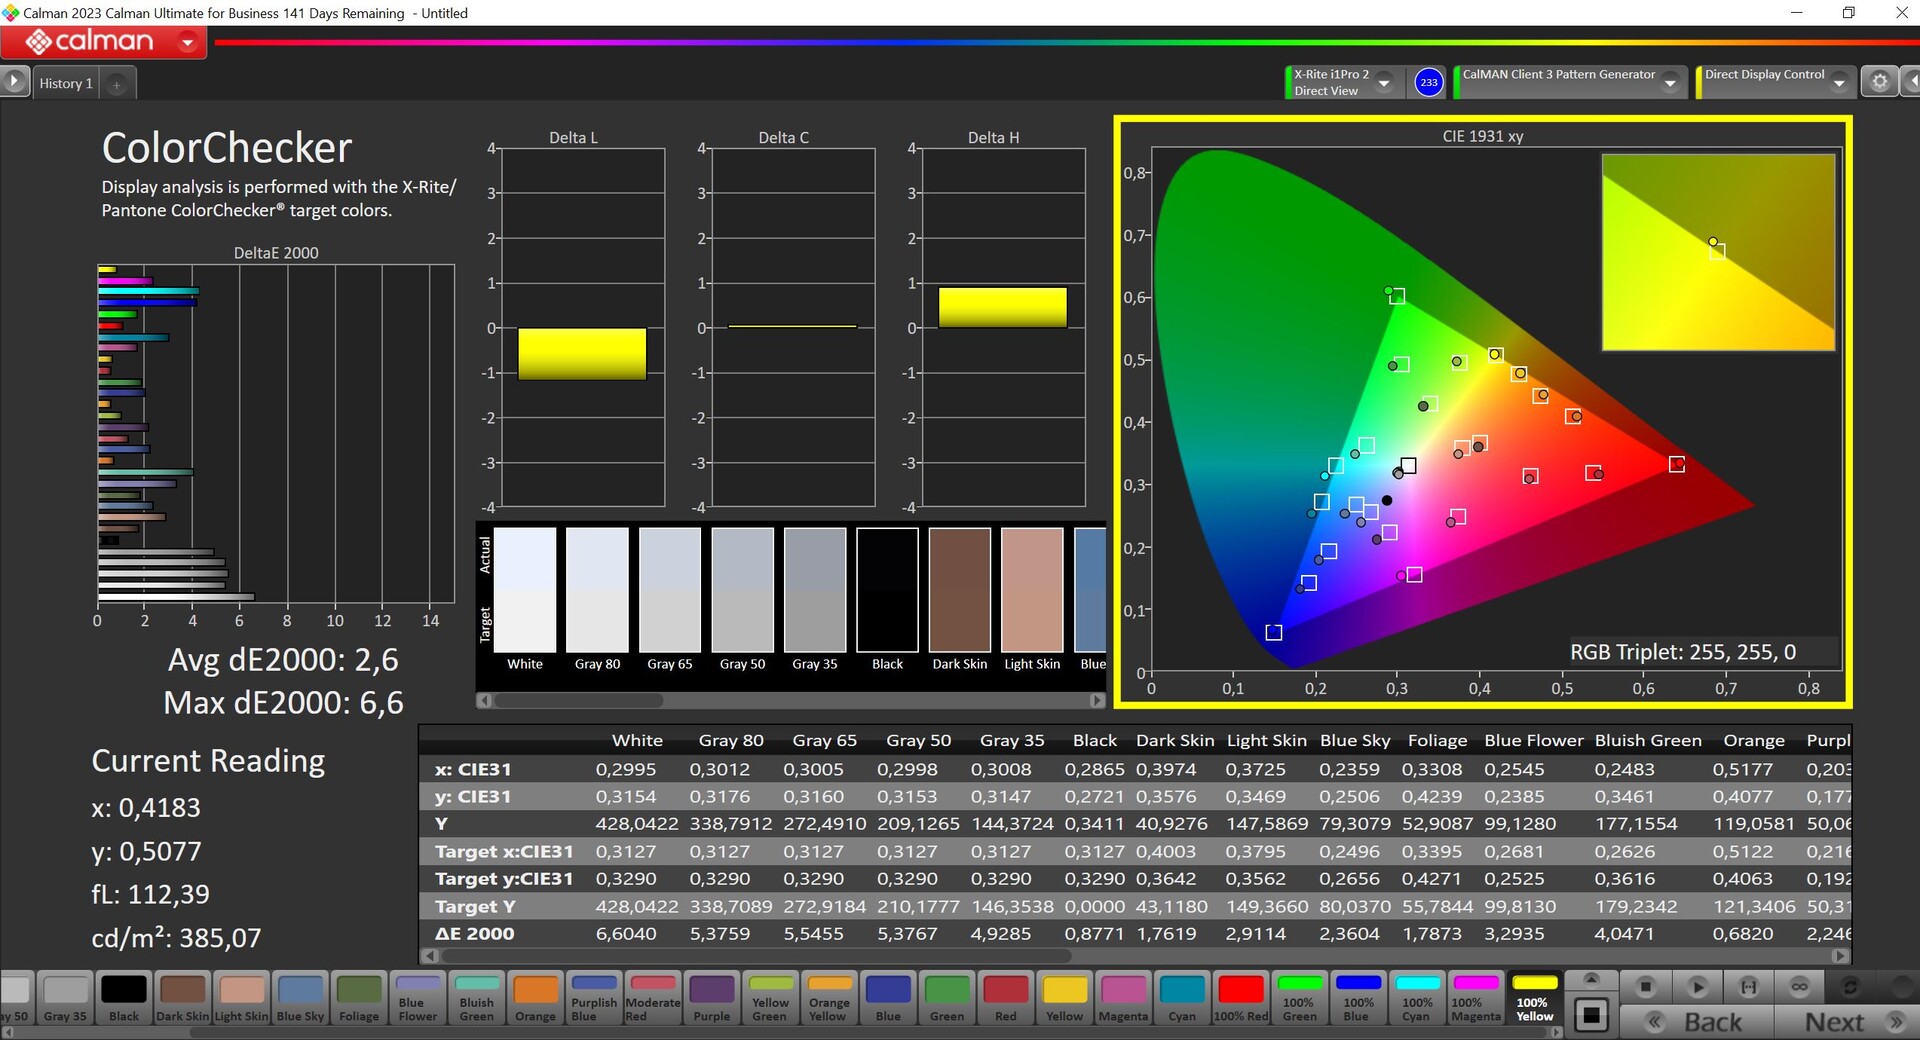
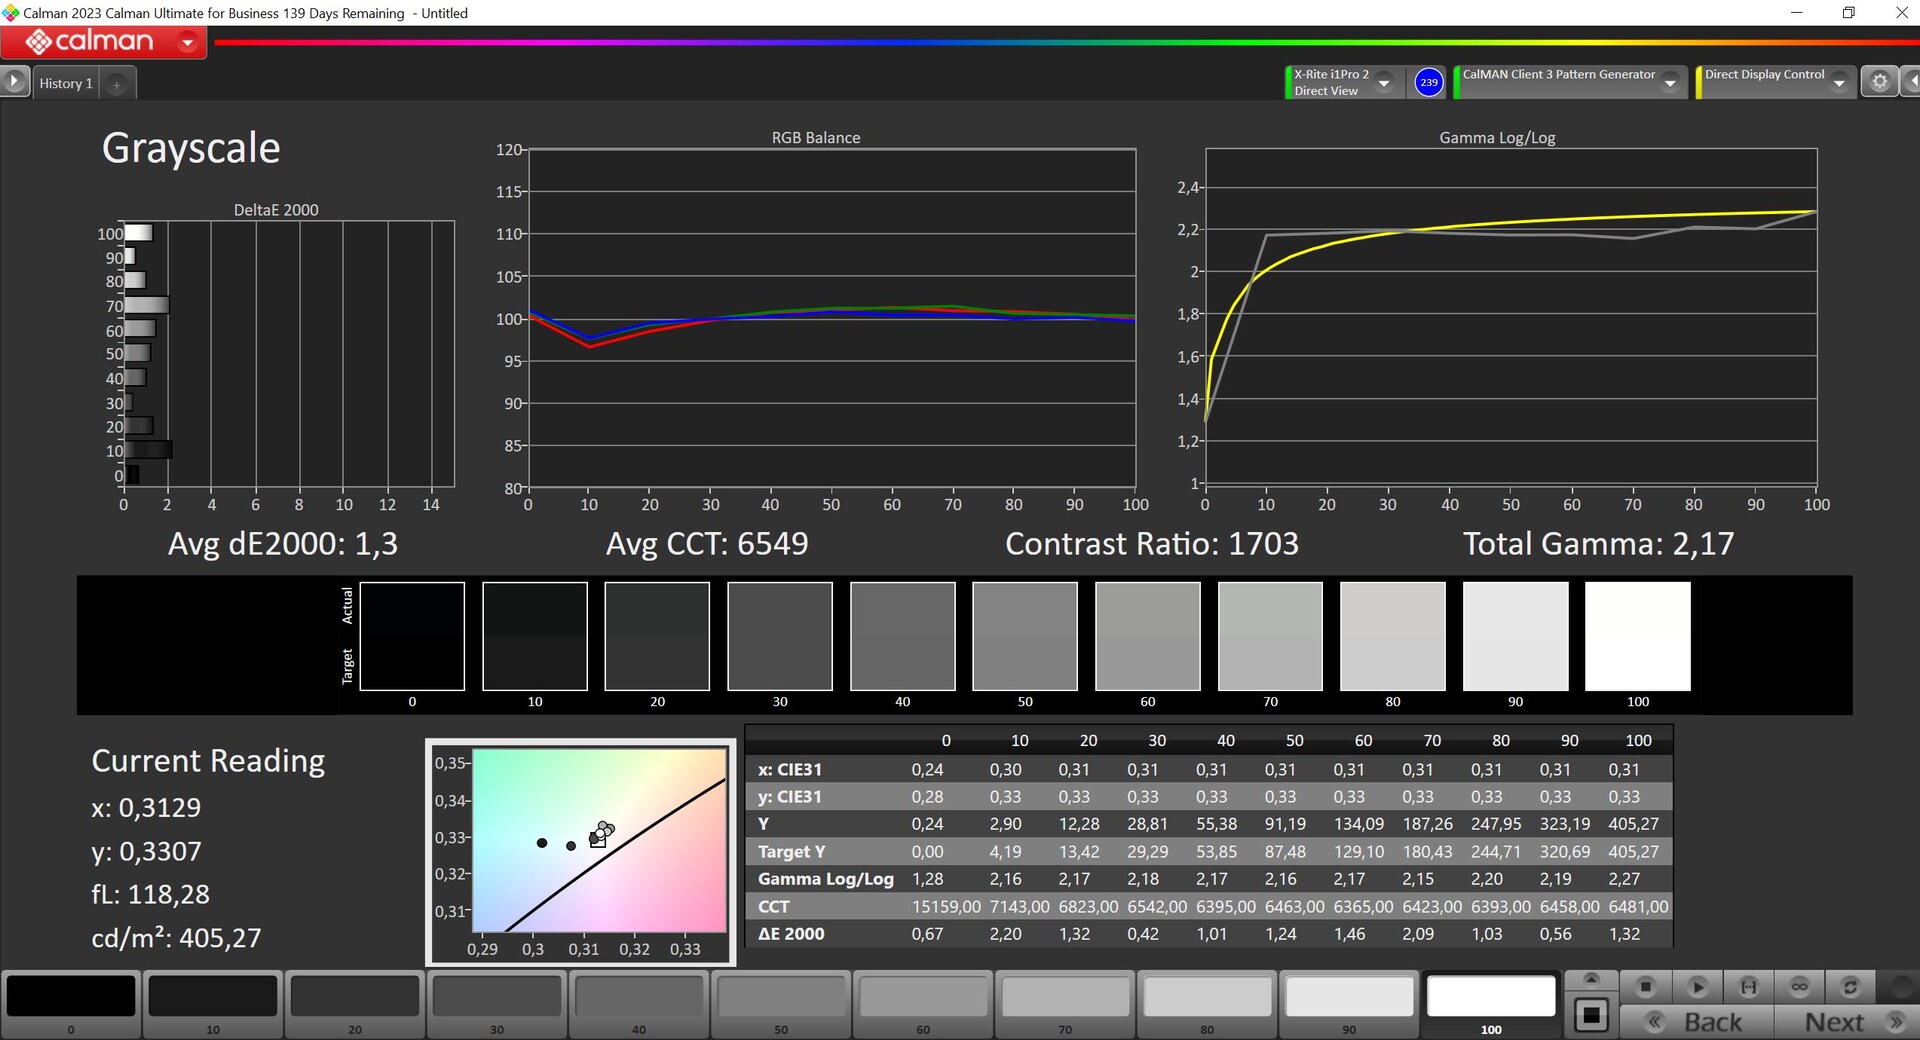

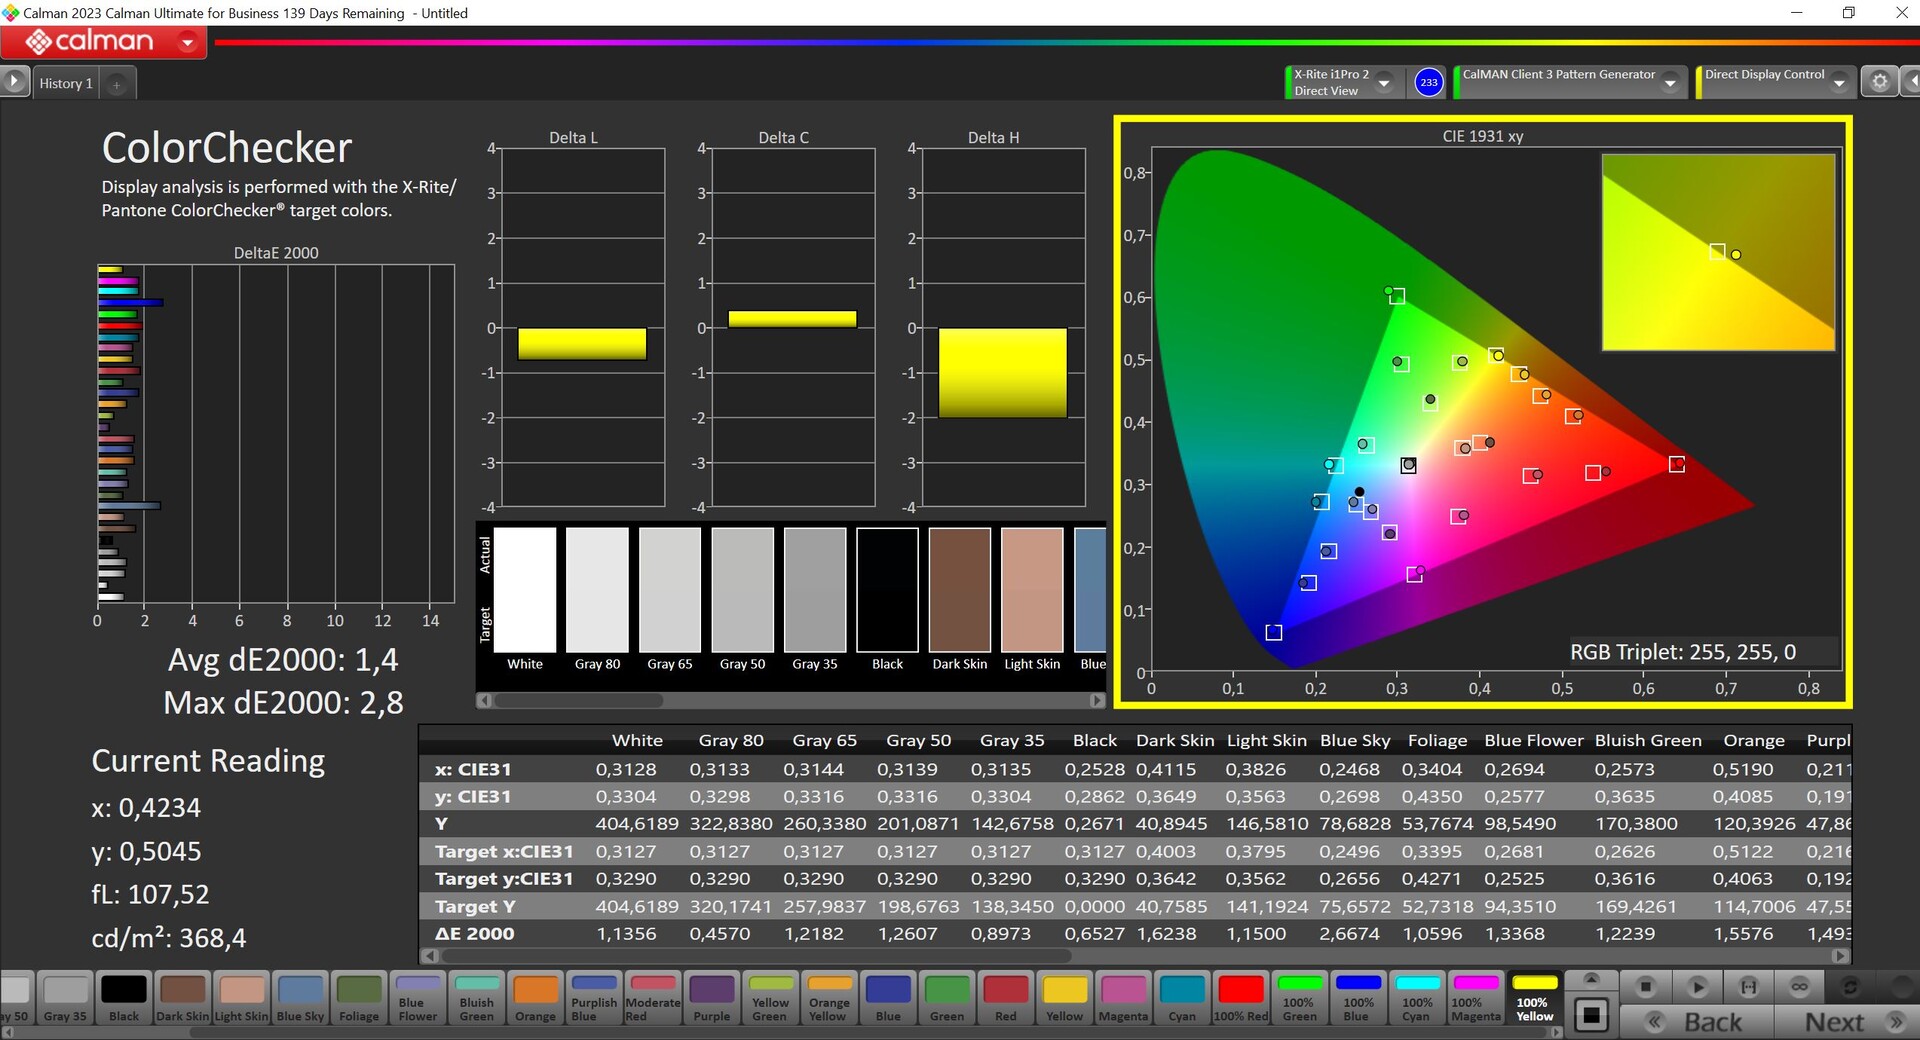
我们使用专业的 CalMAN 软件(X-Rite i1 Pro 2)对面板进行了测量,结果发现其校准效果并不是特别好。我们注意到它的色调偏蓝,色温过低。此外,它的灰度偏差和许多色彩偏差都超过了 3 的目标值。使用我们自己的校准软件(可在上面免费下载配置文件),我们可以大大改善它的显示效果,但屏幕的最大亮度因此降低了约 25 cd/m²。小的 sRGB 色彩空间几乎完全覆盖,因此你也可以使用该面板编辑图片。
Display Response Times
| ↔ Response Time Black to White | ||
|---|---|---|
| 27.6 ms ... rise ↗ and fall ↘ combined | ↗ 16 ms rise | 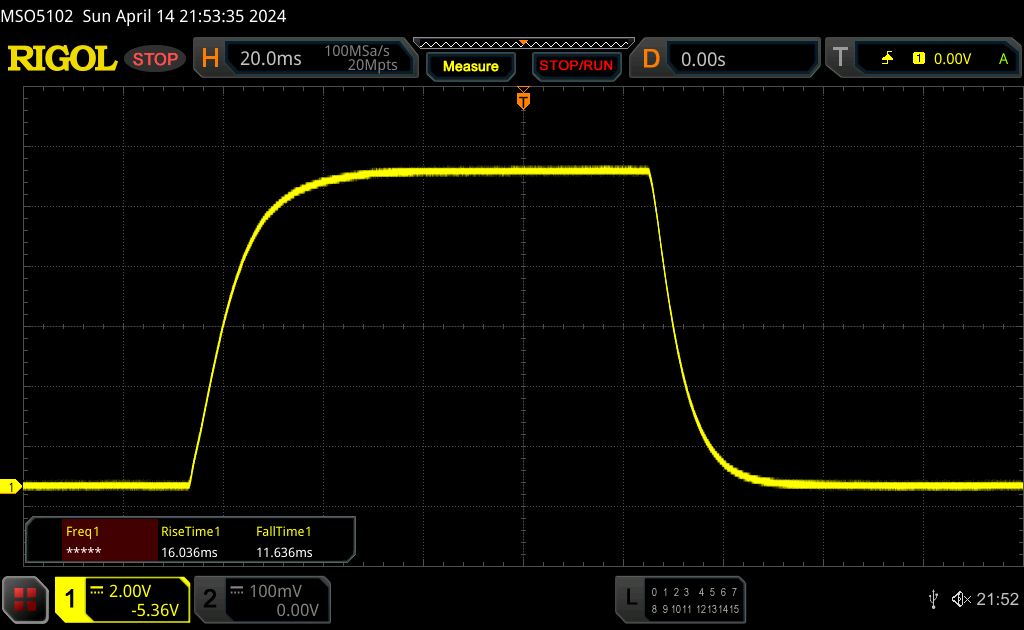 |
| ↘ 11.6 ms fall | ||
| The screen shows relatively slow response rates in our tests and may be too slow for gamers. In comparison, all tested devices range from 0.1 (minimum) to 240 (maximum) ms. » 70 % of all devices are better. This means that the measured response time is worse than the average of all tested devices (20 ms). | ||
| ↔ Response Time 50% Grey to 80% Grey | ||
| 43.2 ms ... rise ↗ and fall ↘ combined | ↗ 21.1 ms rise | 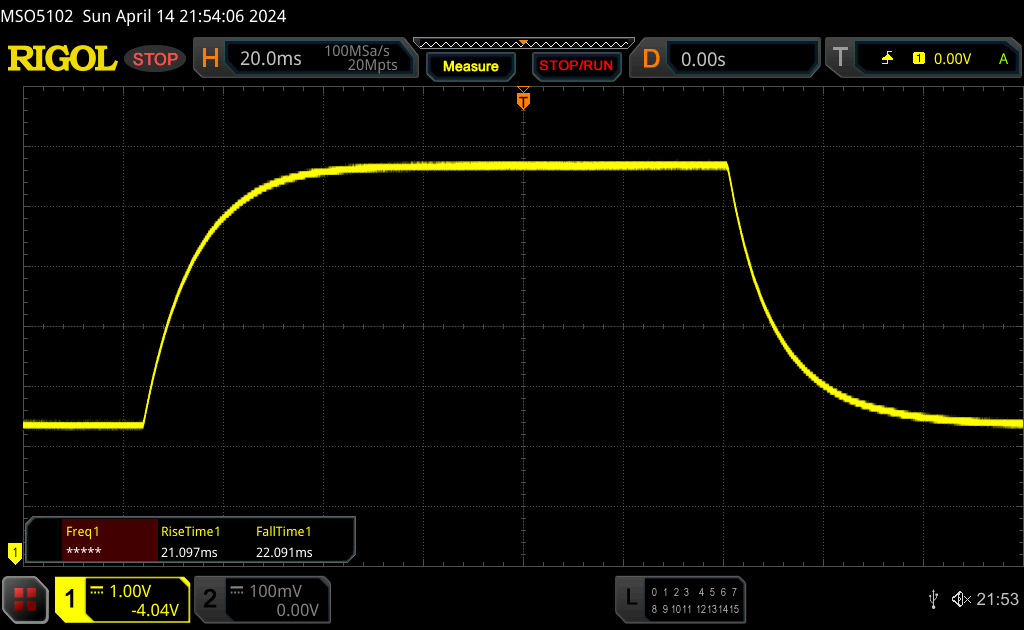 |
| ↘ 22.1 ms fall | ||
| The screen shows slow response rates in our tests and will be unsatisfactory for gamers. In comparison, all tested devices range from 0.165 (minimum) to 636 (maximum) ms. » 72 % of all devices are better. This means that the measured response time is worse than the average of all tested devices (31.3 ms). | ||
Screen Flickering / PWM (Pulse-Width Modulation)
| Screen flickering / PWM not detected |  | ||
In comparison: 53 % of all tested devices do not use PWM to dim the display. If PWM was detected, an average of 7946 (minimum: 5 - maximum: 343500) Hz was measured. | |||
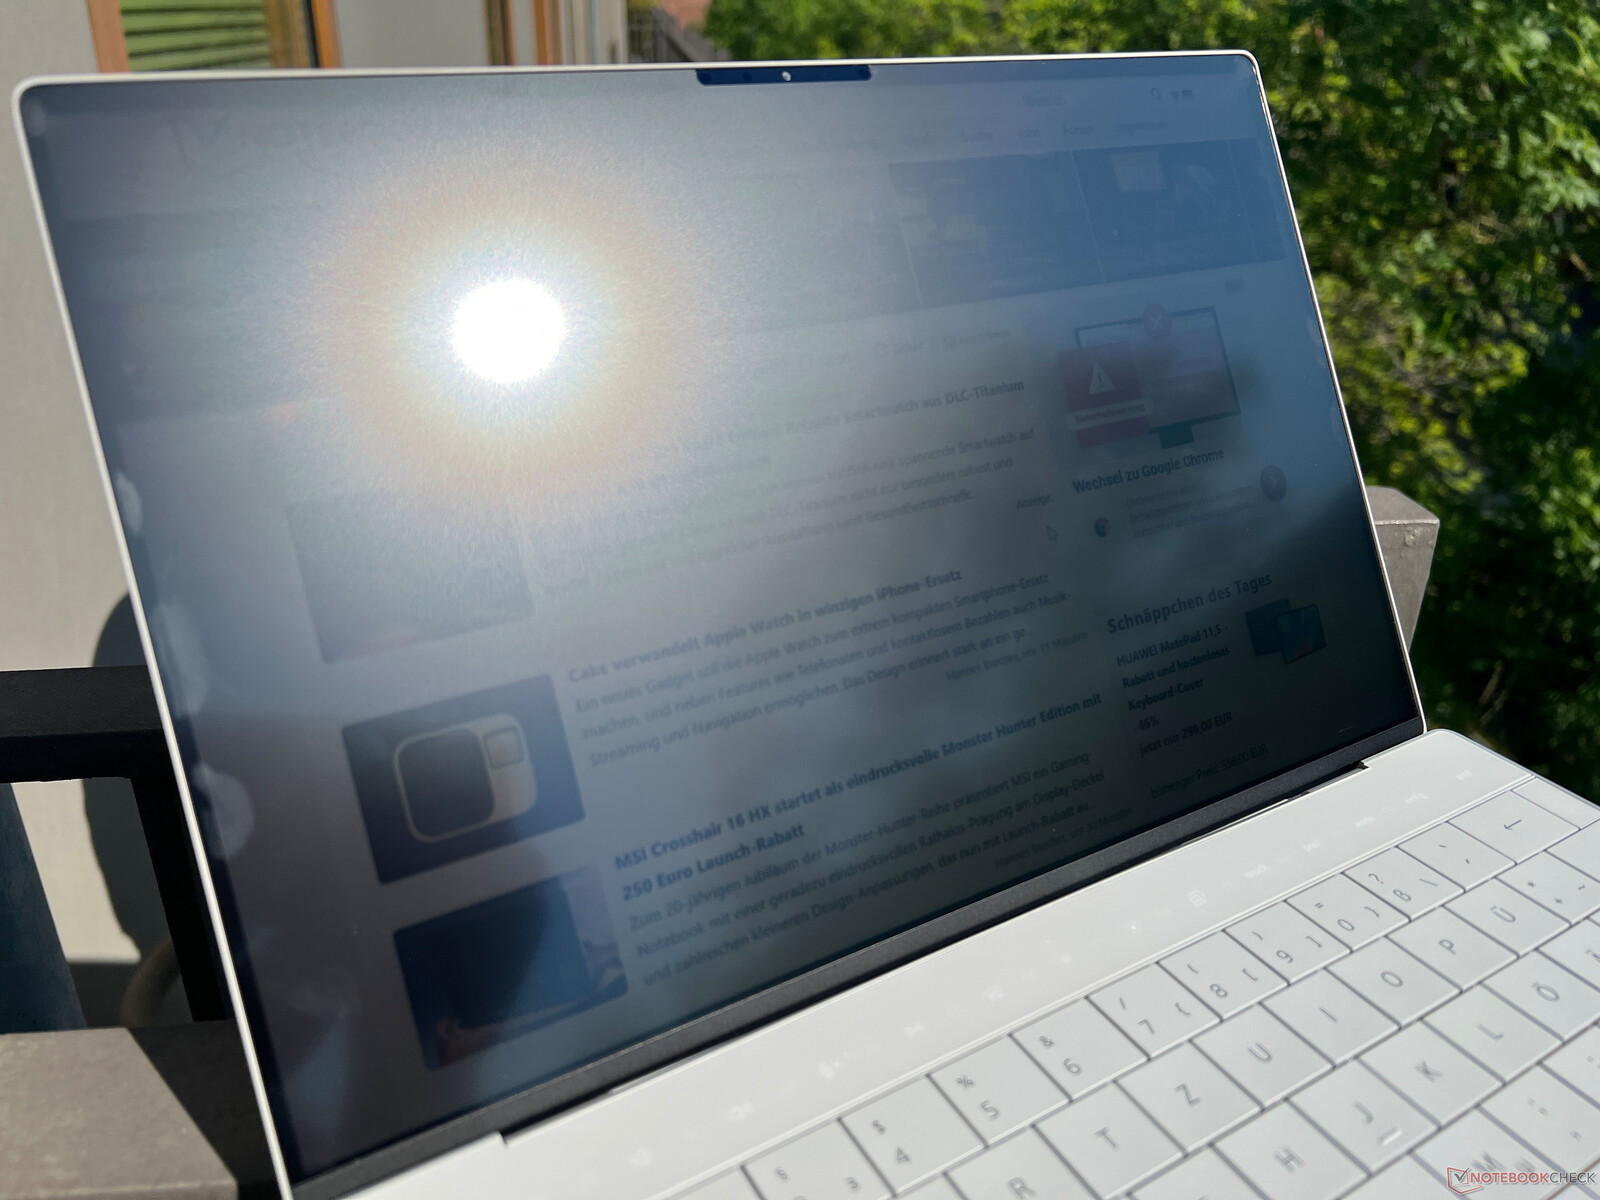
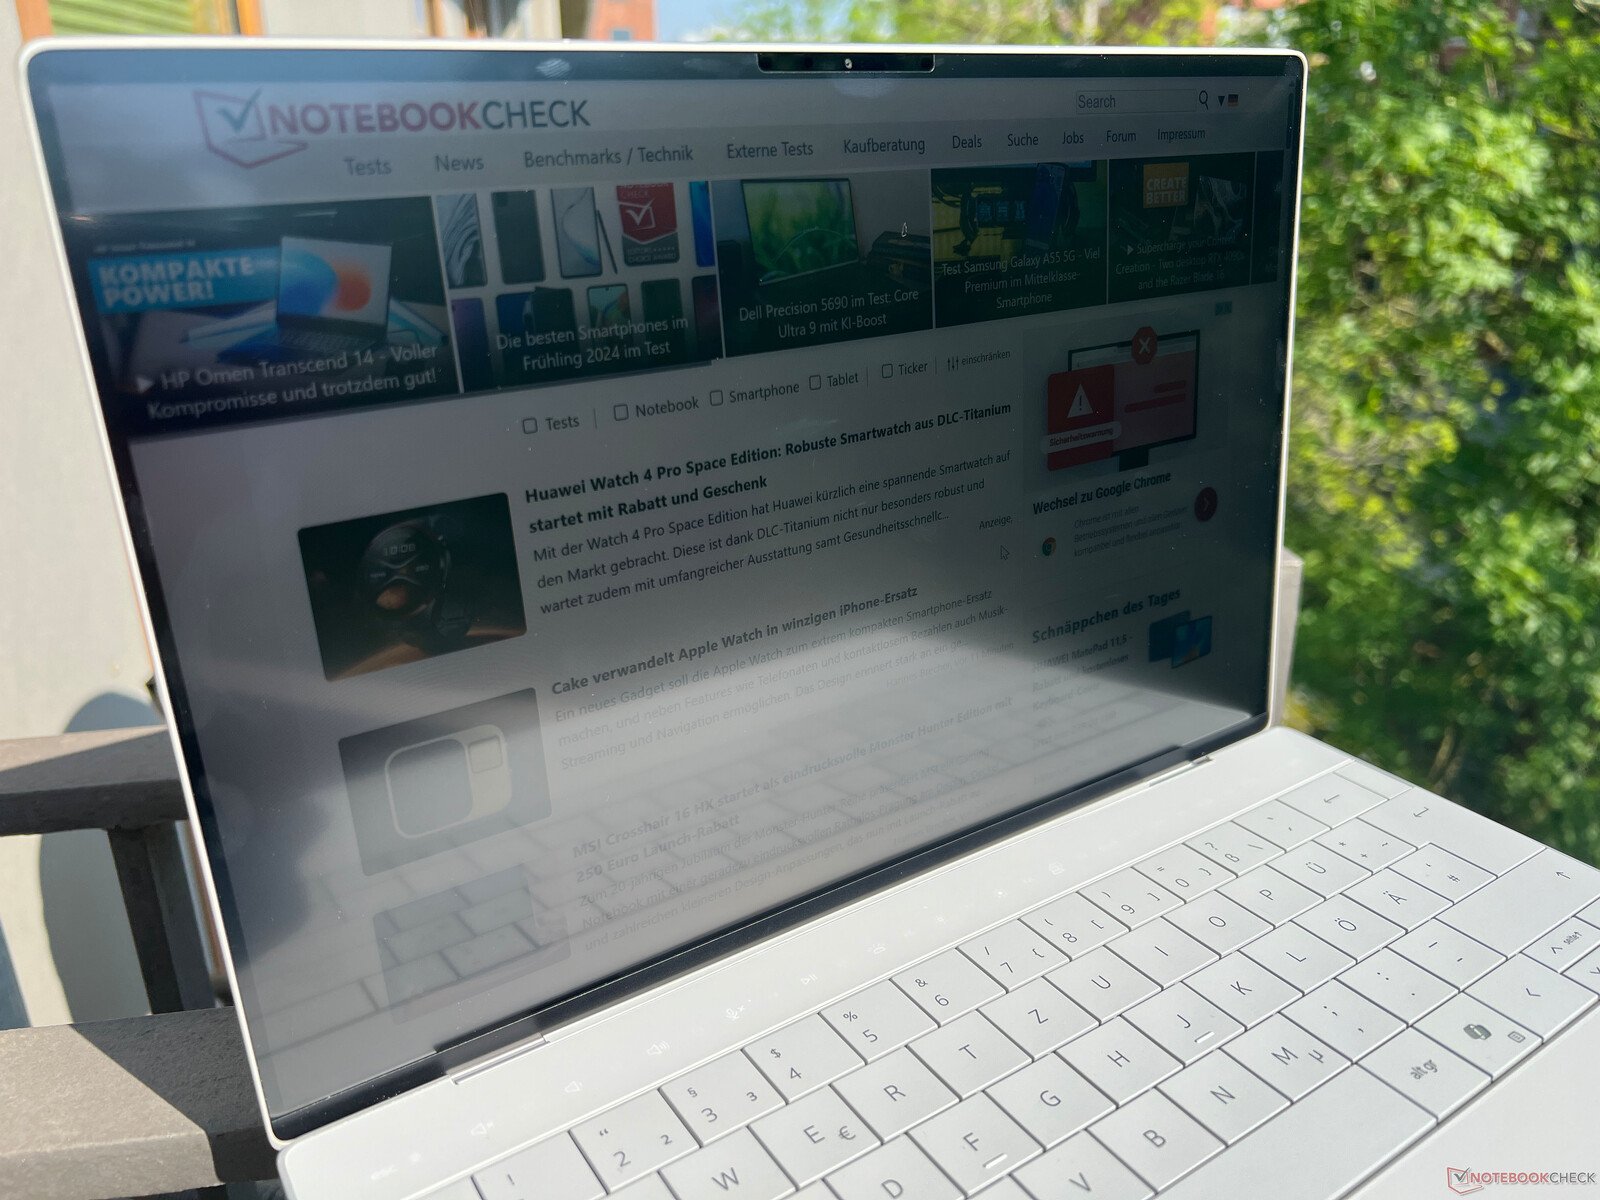

一般来说,哑光面板在室外使用很有帮助,但在明亮的日子里,操作会略显受限。面板需要更加明亮,才能确保舒适的操作体验。视角稳定性不错。

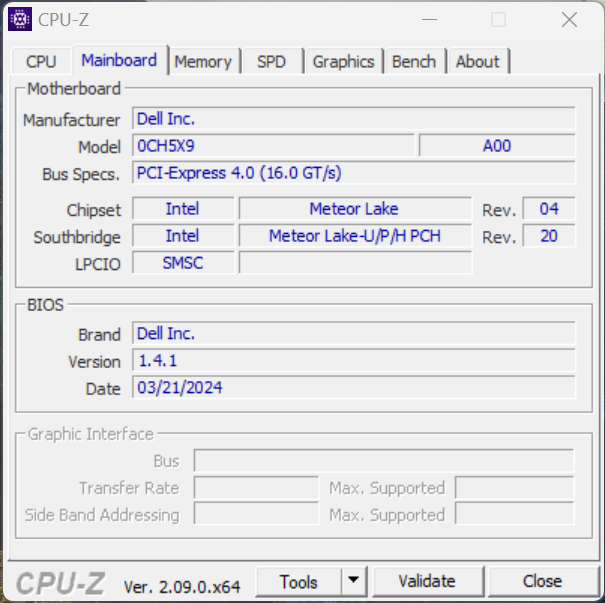
性能 - XPS 13 最高配备 64GB 内存
戴尔只提供配备英特尔流星湖处理器(Core Ultra 5/7)的新款 XPS 13 9340,没有专用显卡。内存有 8、16、32 或 64 GB 可供选择(8 GB 仅适用于酷睿至尊 7 155H,酷睿至尊 5 125H 仅适用于 16 GB)。
测试条件
MyDell 软件提供多种性能模式,但无法通过组合键进行切换。我们在以下测试中使用了优化模式。
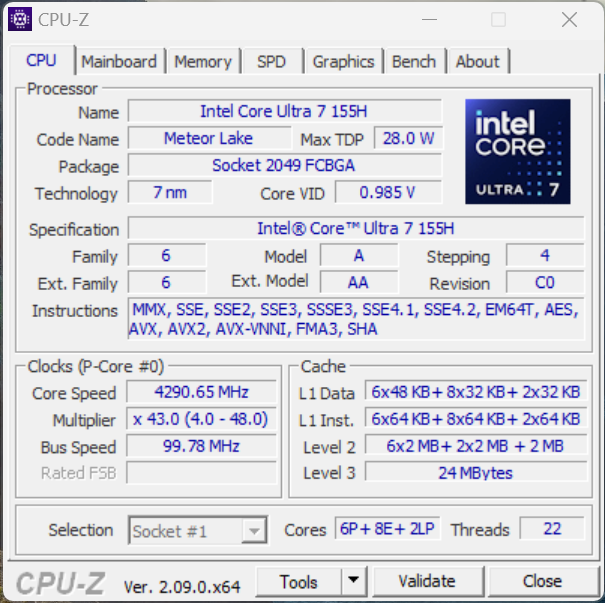
处理器 - Core Ultra 7 155H
酷睿至尊 7 155H 酷睿至强 7 155H属于英特尔目前的 "流星湖 "一代,是老一代 酷睿 i7-13700H.在 XPS 13 中,该处理器在短时间内的最大功耗为 45 瓦,但在连续负载情况下,5 分钟后的功耗约为 24 瓦(性能降低约 40%)。在开始的多核测试中,它的性能还算不错,但与旧版的 酷睿 i7-1360P少了两个性能核心。此外,其单核性能也不如旧款 XPS 13。Apple's M3 SoC在单核测试中也快了很多,但在多核测试中却慢了下来。在电池使用中,该处理器的功耗可以在短时间内达到 42 瓦,然后立即降至 20 瓦。这意味着在远离电源插座的情况下,其多核性能降低了约 43%。更多 CPU 基准测试可在 我们的技术部分.
Cinebench R15 Multi continuous test
Cinebench R23: Multi Core | Single Core
Cinebench R20: CPU (Multi Core) | CPU (Single Core)
Cinebench R15: CPU Multi 64Bit | CPU Single 64Bit
Blender: v2.79 BMW27 CPU
7-Zip 18.03: 7z b 4 | 7z b 4 -mmt1
Geekbench 6.6: Multi-Core | Single-Core
Geekbench 5.5: Multi-Core | Single-Core
HWBOT x265 Benchmark v2.2: 4k Preset
LibreOffice : 20 Documents To PDF
R Benchmark 2.5: Overall mean
| CPU Performance rating | |
| Average Intel Core Ultra 7 155H | |
| Lenovo ThinkPad Z13 Gen 2 | |
| Apple MacBook Air 13 M3 10C GPU -9! | |
| Dell XPS 13 9340 Core Ultra 7 | |
| Dell XPS 13 Plus 9320 Core i7-1360P -2! | |
| Average of class Subnotebook | |
| HP Dragonfly G4 -2! | |
| Asus ZenBook S13 OLED UX5304 -2! | |
| Cinebench R23 / Multi Core | |
| Average Intel Core Ultra 7 155H (9769 - 19007, n=52) | |
| Lenovo ThinkPad Z13 Gen 2 | |
| Dell XPS 13 9340 Core Ultra 7 | |
| Average of class Subnotebook (1555 - 21812, n=64, last 2 years) | |
| Dell XPS 13 Plus 9320 Core i7-1360P | |
| Apple MacBook Air 13 M3 10C GPU | |
| HP Dragonfly G4 | |
| Asus ZenBook S13 OLED UX5304 | |
| Cinebench R23 / Single Core | |
| Apple MacBook Air 13 M3 10C GPU | |
| HP Dragonfly G4 | |
| Dell XPS 13 Plus 9320 Core i7-1360P | |
| Asus ZenBook S13 OLED UX5304 | |
| Average Intel Core Ultra 7 155H (1496 - 1815, n=52) | |
| Lenovo ThinkPad Z13 Gen 2 | |
| Average of class Subnotebook (358 - 2165, n=65, last 2 years) | |
| Dell XPS 13 9340 Core Ultra 7 | |
| Cinebench R20 / CPU (Multi Core) | |
| Average Intel Core Ultra 7 155H (3798 - 7409, n=50) | |
| Lenovo ThinkPad Z13 Gen 2 | |
| Dell XPS 13 9340 Core Ultra 7 | |
| Average of class Subnotebook (579 - 8541, n=61, last 2 years) | |
| Dell XPS 13 Plus 9320 Core i7-1360P | |
| HP Dragonfly G4 | |
| Asus ZenBook S13 OLED UX5304 | |
| Cinebench R20 / CPU (Single Core) | |
| Dell XPS 13 Plus 9320 Core i7-1360P | |
| HP Dragonfly G4 | |
| Asus ZenBook S13 OLED UX5304 | |
| Lenovo ThinkPad Z13 Gen 2 | |
| Average Intel Core Ultra 7 155H (601 - 696, n=50) | |
| Dell XPS 13 9340 Core Ultra 7 | |
| Average of class Subnotebook (128 - 826, n=61, last 2 years) | |
| Cinebench R15 / CPU Multi 64Bit | |
| Average Intel Core Ultra 7 155H (1932 - 2880, n=56) | |
| Dell XPS 13 9340 Core Ultra 7 | |
| Lenovo ThinkPad Z13 Gen 2 | |
| Average of class Subnotebook (327 - 3345, n=61, last 2 years) | |
| Dell XPS 13 Plus 9320 Core i7-1360P | |
| Asus ZenBook S13 OLED UX5304 | |
| HP Dragonfly G4 | |
| Cinebench R15 / CPU Single 64Bit | |
| Dell XPS 13 Plus 9320 Core i7-1360P | |
| Lenovo ThinkPad Z13 Gen 2 | |
| HP Dragonfly G4 | |
| Average of class Subnotebook (72.4 - 322, n=61, last 2 years) | |
| Dell XPS 13 9340 Core Ultra 7 | |
| Average Intel Core Ultra 7 155H (99.6 - 268, n=52) | |
| Asus ZenBook S13 OLED UX5304 | |
| Blender / v2.79 BMW27 CPU | |
| Apple MacBook Air 13 M3 10C GPU | |
| Asus ZenBook S13 OLED UX5304 | |
| Asus ZenBook S13 OLED UX5304 | |
| HP Dragonfly G4 | |
| Average of class Subnotebook (159 - 2271, n=62, last 2 years) | |
| Dell XPS 13 Plus 9320 Core i7-1360P | |
| Dell XPS 13 9340 Core Ultra 7 | |
| Lenovo ThinkPad Z13 Gen 2 | |
| Average Intel Core Ultra 7 155H (175 - 381, n=47) | |
| 7-Zip 18.03 / 7z b 4 | |
| Average Intel Core Ultra 7 155H (41739 - 70254, n=50) | |
| Lenovo ThinkPad Z13 Gen 2 | |
| Dell XPS 13 9340 Core Ultra 7 | |
| Dell XPS 13 Plus 9320 Core i7-1360P | |
| Average of class Subnotebook (11668 - 77867, n=62, last 2 years) | |
| HP Dragonfly G4 | |
| Asus ZenBook S13 OLED UX5304 | |
| 7-Zip 18.03 / 7z b 4 -mmt1 | |
| HP Dragonfly G4 | |
| Asus ZenBook S13 OLED UX5304 | |
| Lenovo ThinkPad Z13 Gen 2 | |
| Dell XPS 13 Plus 9320 Core i7-1360P | |
| Average of class Subnotebook (2643 - 6442, n=63, last 2 years) | |
| Dell XPS 13 9340 Core Ultra 7 | |
| Average Intel Core Ultra 7 155H (4594 - 5621, n=50) | |
| Geekbench 6.6 / Multi-Core | |
| Average Intel Core Ultra 7 155H (7732 - 13656, n=55) | |
| Average of class Subnotebook (2244 - 17489, n=73, last 2 years) | |
| Lenovo ThinkPad Z13 Gen 2 | |
| Apple MacBook Air 13 M3 10C GPU | |
| Dell XPS 13 9340 Core Ultra 7 | |
| Geekbench 6.6 / Single-Core | |
| Apple MacBook Air 13 M3 10C GPU | |
| Average of class Subnotebook (960 - 4195, n=67, last 2 years) | |
| Lenovo ThinkPad Z13 Gen 2 | |
| Dell XPS 13 9340 Core Ultra 7 | |
| Average Intel Core Ultra 7 155H (1901 - 2473, n=52) | |
| Geekbench 5.5 / Multi-Core | |
| Average Intel Core Ultra 7 155H (10017 - 13556, n=52) | |
| Dell XPS 13 9340 Core Ultra 7 | |
| Lenovo ThinkPad Z13 Gen 2 | |
| Dell XPS 13 Plus 9320 Core i7-1360P | |
| Apple MacBook Air 13 M3 10C GPU | |
| Average of class Subnotebook (2557 - 17218, n=54, last 2 years) | |
| HP Dragonfly G4 | |
| Asus ZenBook S13 OLED UX5304 | |
| Geekbench 5.5 / Single-Core | |
| Apple MacBook Air 13 M3 10C GPU | |
| HP Dragonfly G4 | |
| Average of class Subnotebook (726 - 2132, n=54, last 2 years) | |
| Lenovo ThinkPad Z13 Gen 2 | |
| Dell XPS 13 Plus 9320 Core i7-1360P | |
| Asus ZenBook S13 OLED UX5304 | |
| Dell XPS 13 9340 Core Ultra 7 | |
| Average Intel Core Ultra 7 155H (1462 - 1824, n=52) | |
| HWBOT x265 Benchmark v2.2 / 4k Preset | |
| Lenovo ThinkPad Z13 Gen 2 | |
| Average Intel Core Ultra 7 155H (9.93 - 21.2, n=50) | |
| Dell XPS 13 9340 Core Ultra 7 | |
| Dell XPS 13 Plus 9320 Core i7-1360P | |
| Average of class Subnotebook (0.97 - 25.1, n=61, last 2 years) | |
| HP Dragonfly G4 | |
| Asus ZenBook S13 OLED UX5304 | |
| LibreOffice / 20 Documents To PDF | |
| Average of class Subnotebook (38.5 - 220, n=60, last 2 years) | |
| Average Intel Core Ultra 7 155H (37.5 - 79.2, n=49) | |
| Lenovo ThinkPad Z13 Gen 2 | |
| Dell XPS 13 9340 Core Ultra 7 | |
| Asus ZenBook S13 OLED UX5304 | |
| Dell XPS 13 Plus 9320 Core i7-1360P | |
| HP Dragonfly G4 | |
| R Benchmark 2.5 / Overall mean | |
| Average of class Subnotebook (0.403 - 1.456, n=62, last 2 years) | |
| Dell XPS 13 9340 Core Ultra 7 | |
| Average Intel Core Ultra 7 155H (0.4457 - 0.53, n=49) | |
| Lenovo ThinkPad Z13 Gen 2 | |
| Asus ZenBook S13 OLED UX5304 | |
| Dell XPS 13 Plus 9320 Core i7-1360P | |
| HP Dragonfly G4 | |
* ... smaller is better
AIDA64: FP32 Ray-Trace | FPU Julia | CPU SHA3 | CPU Queen | FPU SinJulia | FPU Mandel | CPU AES | CPU ZLib | FP64 Ray-Trace | CPU PhotoWorxx
| Performance rating | |
| Lenovo ThinkPad Z13 Gen 2 | |
| Average Intel Core Ultra 7 155H | |
| Dell XPS 13 9340 Core Ultra 7 | |
| Average of class Subnotebook | |
| Dell XPS 13 Plus 9320 Core i7-1360P | |
| HP Dragonfly G4 | |
| Asus ZenBook S13 OLED UX5304 | |
| AIDA64 / FP32 Ray-Trace | |
| Lenovo ThinkPad Z13 Gen 2 | |
| Average of class Subnotebook (1135 - 32888, n=62, last 2 years) | |
| Average Intel Core Ultra 7 155H (6670 - 18470, n=50) | |
| Dell XPS 13 9340 Core Ultra 7 | |
| Dell XPS 13 Plus 9320 Core i7-1360P | |
| HP Dragonfly G4 | |
| Asus ZenBook S13 OLED UX5304 | |
| AIDA64 / FPU Julia | |
| Lenovo ThinkPad Z13 Gen 2 | |
| Average Intel Core Ultra 7 155H (40905 - 93181, n=50) | |
| Dell XPS 13 9340 Core Ultra 7 | |
| Average of class Subnotebook (5218 - 123315, n=62, last 2 years) | |
| Dell XPS 13 Plus 9320 Core i7-1360P | |
| HP Dragonfly G4 | |
| Asus ZenBook S13 OLED UX5304 | |
| AIDA64 / CPU SHA3 | |
| Lenovo ThinkPad Z13 Gen 2 | |
| Average Intel Core Ultra 7 155H (1940 - 4436, n=50) | |
| Average of class Subnotebook (444 - 5287, n=62, last 2 years) | |
| Dell XPS 13 9340 Core Ultra 7 | |
| Dell XPS 13 Plus 9320 Core i7-1360P | |
| HP Dragonfly G4 | |
| Asus ZenBook S13 OLED UX5304 | |
| AIDA64 / CPU Queen | |
| Lenovo ThinkPad Z13 Gen 2 | |
| Dell XPS 13 Plus 9320 Core i7-1360P | |
| Average Intel Core Ultra 7 155H (64698 - 94181, n=50) | |
| Dell XPS 13 9340 Core Ultra 7 | |
| HP Dragonfly G4 | |
| Asus ZenBook S13 OLED UX5304 | |
| Average of class Subnotebook (10579 - 115682, n=61, last 2 years) | |
| AIDA64 / FPU SinJulia | |
| Lenovo ThinkPad Z13 Gen 2 | |
| Average Intel Core Ultra 7 155H (5639 - 10647, n=50) | |
| Dell XPS 13 9340 Core Ultra 7 | |
| Average of class Subnotebook (744 - 18418, n=62, last 2 years) | |
| Dell XPS 13 Plus 9320 Core i7-1360P | |
| HP Dragonfly G4 | |
| Asus ZenBook S13 OLED UX5304 | |
| AIDA64 / FPU Mandel | |
| Lenovo ThinkPad Z13 Gen 2 | |
| Average Intel Core Ultra 7 155H (18236 - 47685, n=50) | |
| Average of class Subnotebook (3341 - 65433, n=62, last 2 years) | |
| Dell XPS 13 9340 Core Ultra 7 | |
| Dell XPS 13 Plus 9320 Core i7-1360P | |
| HP Dragonfly G4 | |
| Asus ZenBook S13 OLED UX5304 | |
| AIDA64 / CPU AES | |
| Average Intel Core Ultra 7 155H (45713 - 152179, n=50) | |
| Lenovo ThinkPad Z13 Gen 2 | |
| Dell XPS 13 9340 Core Ultra 7 | |
| Average of class Subnotebook (638 - 124284, n=62, last 2 years) | |
| Dell XPS 13 Plus 9320 Core i7-1360P | |
| HP Dragonfly G4 | |
| Asus ZenBook S13 OLED UX5304 | |
| AIDA64 / CPU ZLib | |
| Average Intel Core Ultra 7 155H (557 - 1250, n=50) | |
| Lenovo ThinkPad Z13 Gen 2 | |
| Dell XPS 13 9340 Core Ultra 7 | |
| Dell XPS 13 Plus 9320 Core i7-1360P | |
| Average of class Subnotebook (164.9 - 1379, n=62, last 2 years) | |
| HP Dragonfly G4 | |
| Asus ZenBook S13 OLED UX5304 | |
| AIDA64 / FP64 Ray-Trace | |
| Lenovo ThinkPad Z13 Gen 2 | |
| Average of class Subnotebook (610 - 17495, n=62, last 2 years) | |
| Average Intel Core Ultra 7 155H (3569 - 9802, n=50) | |
| Dell XPS 13 9340 Core Ultra 7 | |
| Dell XPS 13 Plus 9320 Core i7-1360P | |
| HP Dragonfly G4 | |
| Asus ZenBook S13 OLED UX5304 | |
| AIDA64 / CPU PhotoWorxx | |
| Dell XPS 13 9340 Core Ultra 7 | |
| Dell XPS 13 Plus 9320 Core i7-1360P | |
| Average Intel Core Ultra 7 155H (32719 - 54223, n=50) | |
| Average of class Subnotebook (6569 - 64588, n=62, last 2 years) | |
| Asus ZenBook S13 OLED UX5304 | |
| Lenovo ThinkPad Z13 Gen 2 | |
| HP Dragonfly G4 | |
系统性能
XPS 13 在日常使用中反应灵敏,基准测试结果也不错。在测试过程中,我们没有发现任何稳定性问题。
CrossMark: Overall | Productivity | Creativity | Responsiveness
WebXPRT 3: Overall
WebXPRT 4: Overall
Mozilla Kraken 1.1: Total
| PCMark 10 / Score | |
| Lenovo ThinkPad Z13 Gen 2 | |
| Average of class Subnotebook (4920 - 8424, n=49, last 2 years) | |
| Average Intel Core Ultra 7 155H, Intel Arc 8-Core iGPU (4809 - 7529, n=34) | |
| Dell XPS 13 9340 Core Ultra 7 | |
| Dell XPS 13 Plus 9320 Core i7-1360P | |
| HP Dragonfly G4 | |
| Asus ZenBook S13 OLED UX5304 | |
| PCMark 10 / Essentials | |
| Dell XPS 13 Plus 9320 Core i7-1360P | |
| Lenovo ThinkPad Z13 Gen 2 | |
| HP Dragonfly G4 | |
| Dell XPS 13 9340 Core Ultra 7 | |
| Asus ZenBook S13 OLED UX5304 | |
| Average Intel Core Ultra 7 155H, Intel Arc 8-Core iGPU (7605 - 11289, n=34) | |
| Average of class Subnotebook (8552 - 11406, n=49, last 2 years) | |
| PCMark 10 / Productivity | |
| Lenovo ThinkPad Z13 Gen 2 | |
| Average of class Subnotebook (5435 - 16132, n=49, last 2 years) | |
| Average Intel Core Ultra 7 155H, Intel Arc 8-Core iGPU (6042 - 10591, n=34) | |
| Dell XPS 13 9340 Core Ultra 7 | |
| Dell XPS 13 Plus 9320 Core i7-1360P | |
| HP Dragonfly G4 | |
| Asus ZenBook S13 OLED UX5304 | |
| PCMark 10 / Digital Content Creation | |
| Average of class Subnotebook (5722 - 12442, n=49, last 2 years) | |
| Average Intel Core Ultra 7 155H, Intel Arc 8-Core iGPU (4985 - 10709, n=34) | |
| Lenovo ThinkPad Z13 Gen 2 | |
| Dell XPS 13 9340 Core Ultra 7 | |
| Dell XPS 13 Plus 9320 Core i7-1360P | |
| HP Dragonfly G4 | |
| Asus ZenBook S13 OLED UX5304 | |
| CrossMark / Overall | |
| Apple MacBook Air 13 M3 10C GPU | |
| Dell XPS 13 Plus 9320 Core i7-1360P | |
| Dell XPS 13 9340 Core Ultra 7 | |
| Average Intel Core Ultra 7 155H, Intel Arc 8-Core iGPU (1366 - 1903, n=34) | |
| HP Dragonfly G4 | |
| Average of class Subnotebook (365 - 2356, n=64, last 2 years) | |
| Asus ZenBook S13 OLED UX5304 | |
| Lenovo ThinkPad Z13 Gen 2 | |
| CrossMark / Productivity | |
| Apple MacBook Air 13 M3 10C GPU | |
| Dell XPS 13 Plus 9320 Core i7-1360P | |
| HP Dragonfly G4 | |
| Dell XPS 13 9340 Core Ultra 7 | |
| Average Intel Core Ultra 7 155H, Intel Arc 8-Core iGPU (1291 - 1798, n=33) | |
| Asus ZenBook S13 OLED UX5304 | |
| Average of class Subnotebook (364 - 2277, n=64, last 2 years) | |
| Lenovo ThinkPad Z13 Gen 2 | |
| CrossMark / Creativity | |
| Apple MacBook Air 13 M3 10C GPU | |
| Dell XPS 13 Plus 9320 Core i7-1360P | |
| Dell XPS 13 9340 Core Ultra 7 | |
| Lenovo ThinkPad Z13 Gen 2 | |
| Average Intel Core Ultra 7 155H, Intel Arc 8-Core iGPU (1519 - 1929, n=33) | |
| Average of class Subnotebook (372 - 2743, n=64, last 2 years) | |
| HP Dragonfly G4 | |
| Asus ZenBook S13 OLED UX5304 | |
| CrossMark / Responsiveness | |
| Dell XPS 13 Plus 9320 Core i7-1360P | |
| Average Intel Core Ultra 7 155H, Intel Arc 8-Core iGPU (939 - 1802, n=33) | |
| Dell XPS 13 9340 Core Ultra 7 | |
| Asus ZenBook S13 OLED UX5304 | |
| HP Dragonfly G4 | |
| Apple MacBook Air 13 M3 10C GPU | |
| Average of class Subnotebook (312 - 1889, n=64, last 2 years) | |
| Lenovo ThinkPad Z13 Gen 2 | |
| WebXPRT 3 / Overall | |
| Apple MacBook Air 13 M3 10C GPU | |
| Average of class Subnotebook (156 - 530, n=61, last 2 years) | |
| Dell XPS 13 Plus 9320 Core i7-1360P | |
| HP Dragonfly G4 | |
| Lenovo ThinkPad Z13 Gen 2 | |
| Asus ZenBook S13 OLED UX5304 | |
| Average Intel Core Ultra 7 155H, Intel Arc 8-Core iGPU (252 - 299, n=34) | |
| Dell XPS 13 9340 Core Ultra 7 | |
| WebXPRT 4 / Overall | |
| Apple MacBook Air 13 M3 10C GPU | |
| Average of class Subnotebook (132 - 378, n=66, last 2 years) | |
| Dell XPS 13 Plus 9320 Core i7-1360P | |
| HP Dragonfly G4 | |
| Dell XPS 13 9340 Core Ultra 7 | |
| Asus ZenBook S13 OLED UX5304 | |
| Average Intel Core Ultra 7 155H, Intel Arc 8-Core iGPU (166.4 - 309, n=29) | |
| Lenovo ThinkPad Z13 Gen 2 | |
| Mozilla Kraken 1.1 / Total | |
| Lenovo ThinkPad Z13 Gen 2 | |
| Average Intel Core Ultra 7 155H, Intel Arc 8-Core iGPU (517 - 614, n=35) | |
| Dell XPS 13 9340 Core Ultra 7 | |
| Asus ZenBook S13 OLED UX5304 | |
| Dell XPS 13 Plus 9320 Core i7-1360P | |
| HP Dragonfly G4 | |
| Average of class Subnotebook (234 - 1104, n=66, last 2 years) | |
| Apple MacBook Air 13 M3 10C GPU | |
* ... smaller is better
| PCMark 10 Score | 6555 points | |
Help | ||
| AIDA64 / Memory Copy | |
| Dell XPS 13 9340 Core Ultra 7 | |
| Average of class Subnotebook (14554 - 109734, n=62, last 2 years) | |
| Average Intel Core Ultra 7 155H (62397 - 96791, n=50) | |
| Dell XPS 13 Plus 9320 Core i7-1360P | |
| Lenovo ThinkPad Z13 Gen 2 | |
| Asus ZenBook S13 OLED UX5304 | |
| HP Dragonfly G4 | |
| AIDA64 / Memory Read | |
| Dell XPS 13 9340 Core Ultra 7 | |
| Average of class Subnotebook (15948 - 127174, n=62, last 2 years) | |
| Average Intel Core Ultra 7 155H (60544 - 90647, n=50) | |
| Dell XPS 13 Plus 9320 Core i7-1360P | |
| Lenovo ThinkPad Z13 Gen 2 | |
| Asus ZenBook S13 OLED UX5304 | |
| HP Dragonfly G4 | |
| AIDA64 / Memory Write | |
| Lenovo ThinkPad Z13 Gen 2 | |
| Dell XPS 13 Plus 9320 Core i7-1360P | |
| Average of class Subnotebook (15709 - 117898, n=62, last 2 years) | |
| Dell XPS 13 9340 Core Ultra 7 | |
| Average Intel Core Ultra 7 155H (58692 - 93451, n=50) | |
| Asus ZenBook S13 OLED UX5304 | |
| HP Dragonfly G4 | |
| AIDA64 / Memory Latency | |
| Average Intel Core Ultra 7 155H (116.2 - 233, n=50) | |
| Lenovo ThinkPad Z13 Gen 2 | |
| Dell XPS 13 9340 Core Ultra 7 | |
| Average of class Subnotebook (6.8 - 187.8, n=61, last 2 years) | |
| Dell XPS 13 Plus 9320 Core i7-1360P | |
| HP Dragonfly G4 | |
| Asus ZenBook S13 OLED UX5304 | |
* ... smaller is better
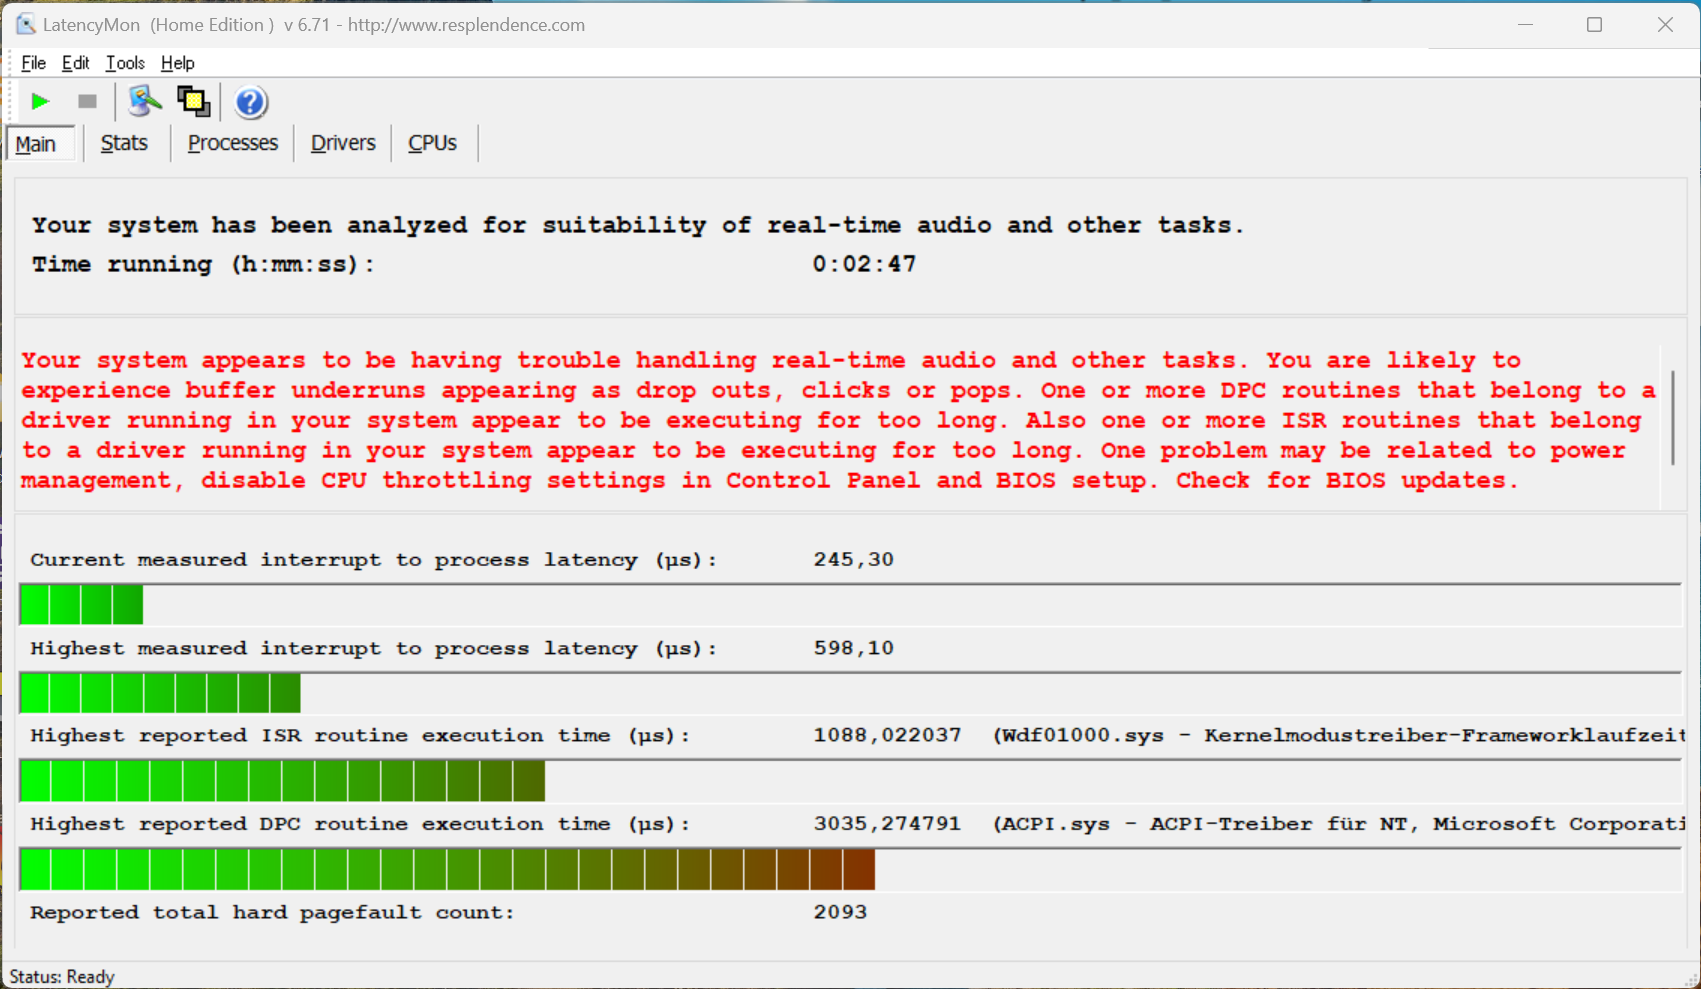
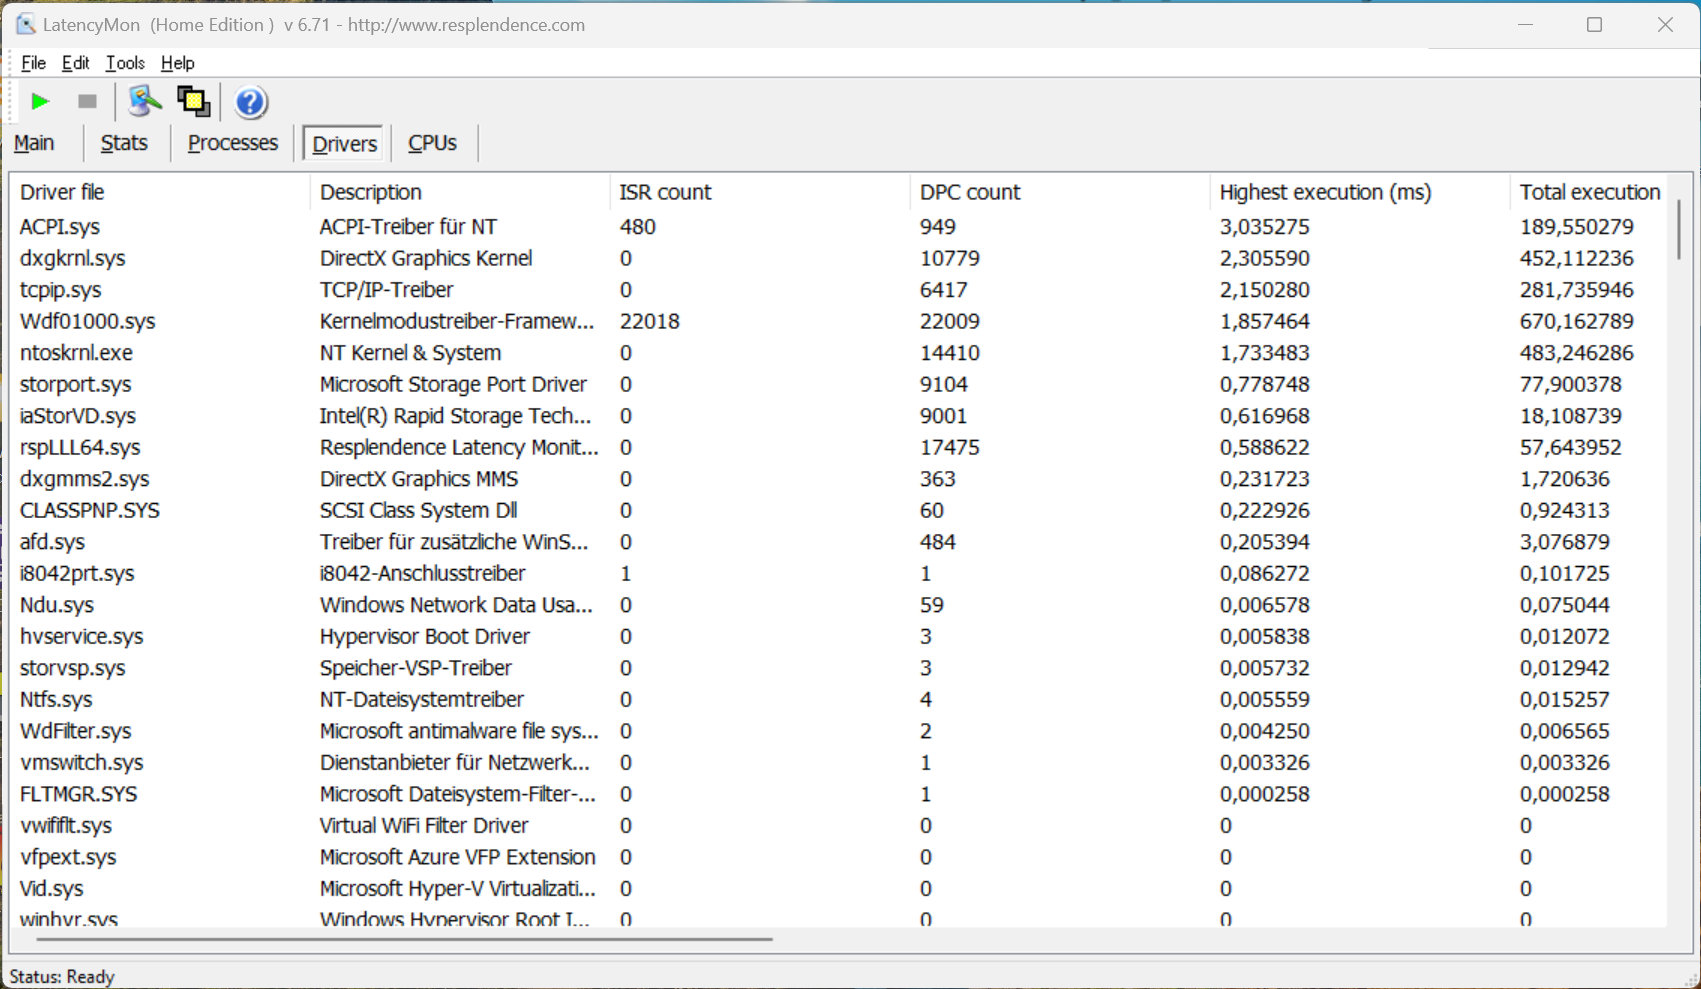
DPC 延迟
在我们的标准化延迟测试(网上冲浪、4K YouTube 播放、CPU 负载)中,使用当前 BIOS 版本的测试设备在使用实时音频应用程序时没有显示出任何限制。虽然有一个驱动程序出现了偏差,但重要的 "中断到进程延迟 "值非常低。
| DPC Latencies / LatencyMon - interrupt to process latency (max), Web, Youtube, Prime95 | |
| Dell XPS 13 Plus 9320 Core i7-1360P | |
| Lenovo ThinkPad Z13 Gen 2 | |
| Asus ZenBook S13 OLED UX5304 | |
| HP Dragonfly G4 | |
| Dell XPS 13 9340 Core Ultra 7 | |
* ... smaller is better
存储设备
我们的测试设备配备了 PCIe 4.0 SSD Micron 2550,容量为 512 GB,其中 371 GB 在初始启动后仍可自由使用。其传输速率完全正常,最高超过 4 GB/s,即使在长时间负载的情况下,性能也没有明显下降。更多固态硬盘基准测试 这里.

* ... smaller is better
Reading continuous performance: DiskSpd Read Loop, Queue Depth 8
图形卡
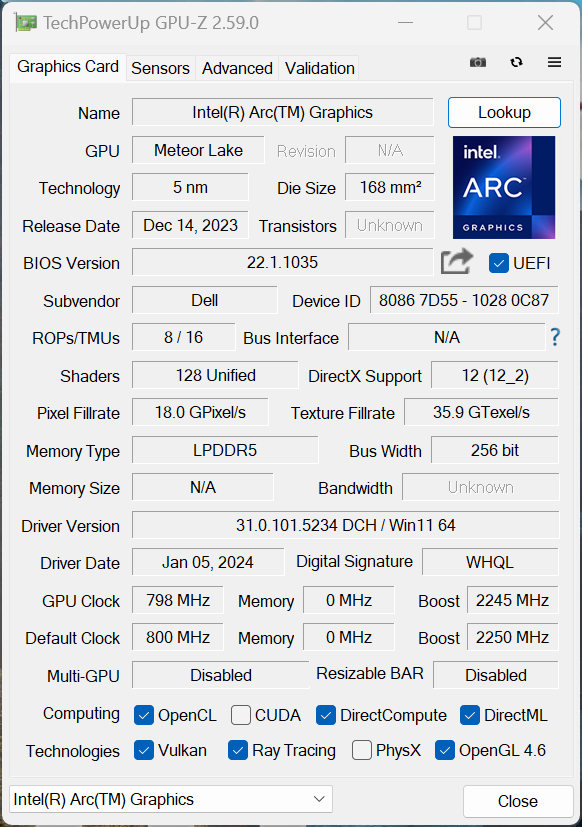
图形计算由全新的 英特尔弧形图形更快的版本,配备 8 个 Xe 内核,与 Core Ultra 7 155H.该图形处理器的性能明显高于旧版的 Iris Xe Graphics G7和 AMD 的快速 Radeon 780M在大多数基准测试中也不落下风。另一方面,在游戏测试中,AMD 的 iGPU 总体上仍处于领先地位;英特尔仍需在驱动程序上下功夫。
原则上,它的游戏性能足以应付许多中高分辨率的老游戏,而且我们还注意到它没有掉帧现象--尽管它的性能并不稳定。在Time Spy 压力测试中,它的性能仅达到 70%,未能通过测试。 Witcher 3我们的测试也显示,几分钟后性能明显下降。在电池模式下,GPU 的性能下降很小(8%)。更多 GPU 基准测试 这里.
| 3DMark 11 Performance | 9575 points | |
| 3DMark Fire Strike Score | 6900 points | |
| 3DMark Time Spy Score | 3106 points | |
Help | ||
* ... smaller is better
| Performance rating - Percent | |
| Average of class Subnotebook | |
| Lenovo ThinkPad Z13 Gen 2 -1! | |
| Dell XPS 13 9340 Core Ultra 7 | |
| Dell XPS 13 Plus 9320 Core i7-1360P | |
| HP Dragonfly G4 | |
| Asus ZenBook S13 OLED UX5304 | |
| The Witcher 3 - 1920x1080 Ultra Graphics & Postprocessing (HBAO+) | |
| Lenovo ThinkPad Z13 Gen 2 | |
| Average of class Subnotebook (13.9 - 34.6, n=21, last 2 years) | |
| Dell XPS 13 9340 Core Ultra 7 | |
| Dell XPS 13 Plus 9320 Core i7-1360P | |
| HP Dragonfly G4 | |
| Asus ZenBook S13 OLED UX5304 | |
| GTA V - 1920x1080 Highest AA:4xMSAA + FX AF:16x | |
| Average of class Subnotebook (10.7 - 32.7, n=58, last 2 years) | |
| Dell XPS 13 9340 Core Ultra 7 | |
| Dell XPS 13 Plus 9320 Core i7-1360P | |
| HP Dragonfly G4 | |
| Asus ZenBook S13 OLED UX5304 | |
| Final Fantasy XV Benchmark - 1920x1080 High Quality | |
| Lenovo ThinkPad Z13 Gen 2 | |
| Dell XPS 13 9340 Core Ultra 7 | |
| Average of class Subnotebook (11.6 - 37.2, n=61, last 2 years) | |
| Dell XPS 13 Plus 9320 Core i7-1360P | |
| HP Dragonfly G4 | |
| Asus ZenBook S13 OLED UX5304 | |
| Strange Brigade - 1920x1080 ultra AA:ultra AF:16 | |
| Average of class Subnotebook (19 - 60.6, n=56, last 2 years) | |
| Lenovo ThinkPad Z13 Gen 2 | |
| Dell XPS 13 9340 Core Ultra 7 | |
| Dell XPS 13 Plus 9320 Core i7-1360P | |
| HP Dragonfly G4 | |
| Asus ZenBook S13 OLED UX5304 | |
| Dota 2 Reborn - 1920x1080 ultra (3/3) best looking | |
| Lenovo ThinkPad Z13 Gen 2 | |
| Average of class Subnotebook (13 - 94.9, n=65, last 2 years) | |
| Dell XPS 13 9340 Core Ultra 7 | |
| Dell XPS 13 Plus 9320 Core i7-1360P | |
| HP Dragonfly G4 | |
| Asus ZenBook S13 OLED UX5304 | |
Witcher 3 FPS diagram
| low | med. | high | ultra | |
|---|---|---|---|---|
| GTA V (2015) | 157.8 | 129.8 | 32.8 | 14.7 |
| The Witcher 3 (2015) | 152 | 89 | 47 | 20.8 |
| Dota 2 Reborn (2015) | 106.2 | 89.8 | 72 | 65.2 |
| Final Fantasy XV Benchmark (2018) | 61.3 | 36.2 | 26.4 | |
| X-Plane 11.11 (2018) | 53 | 40.7 | 30.8 | |
| Far Cry 5 (2018) | 57 | 33 | 30 | 28 |
| Strange Brigade (2018) | 156 | 68 | 54 | 41 |
| F1 23 (2023) | 67.9 | 60.5 | 39.5 | 10.7 |
排放 - 日常使用时通常很安静
噪音排放
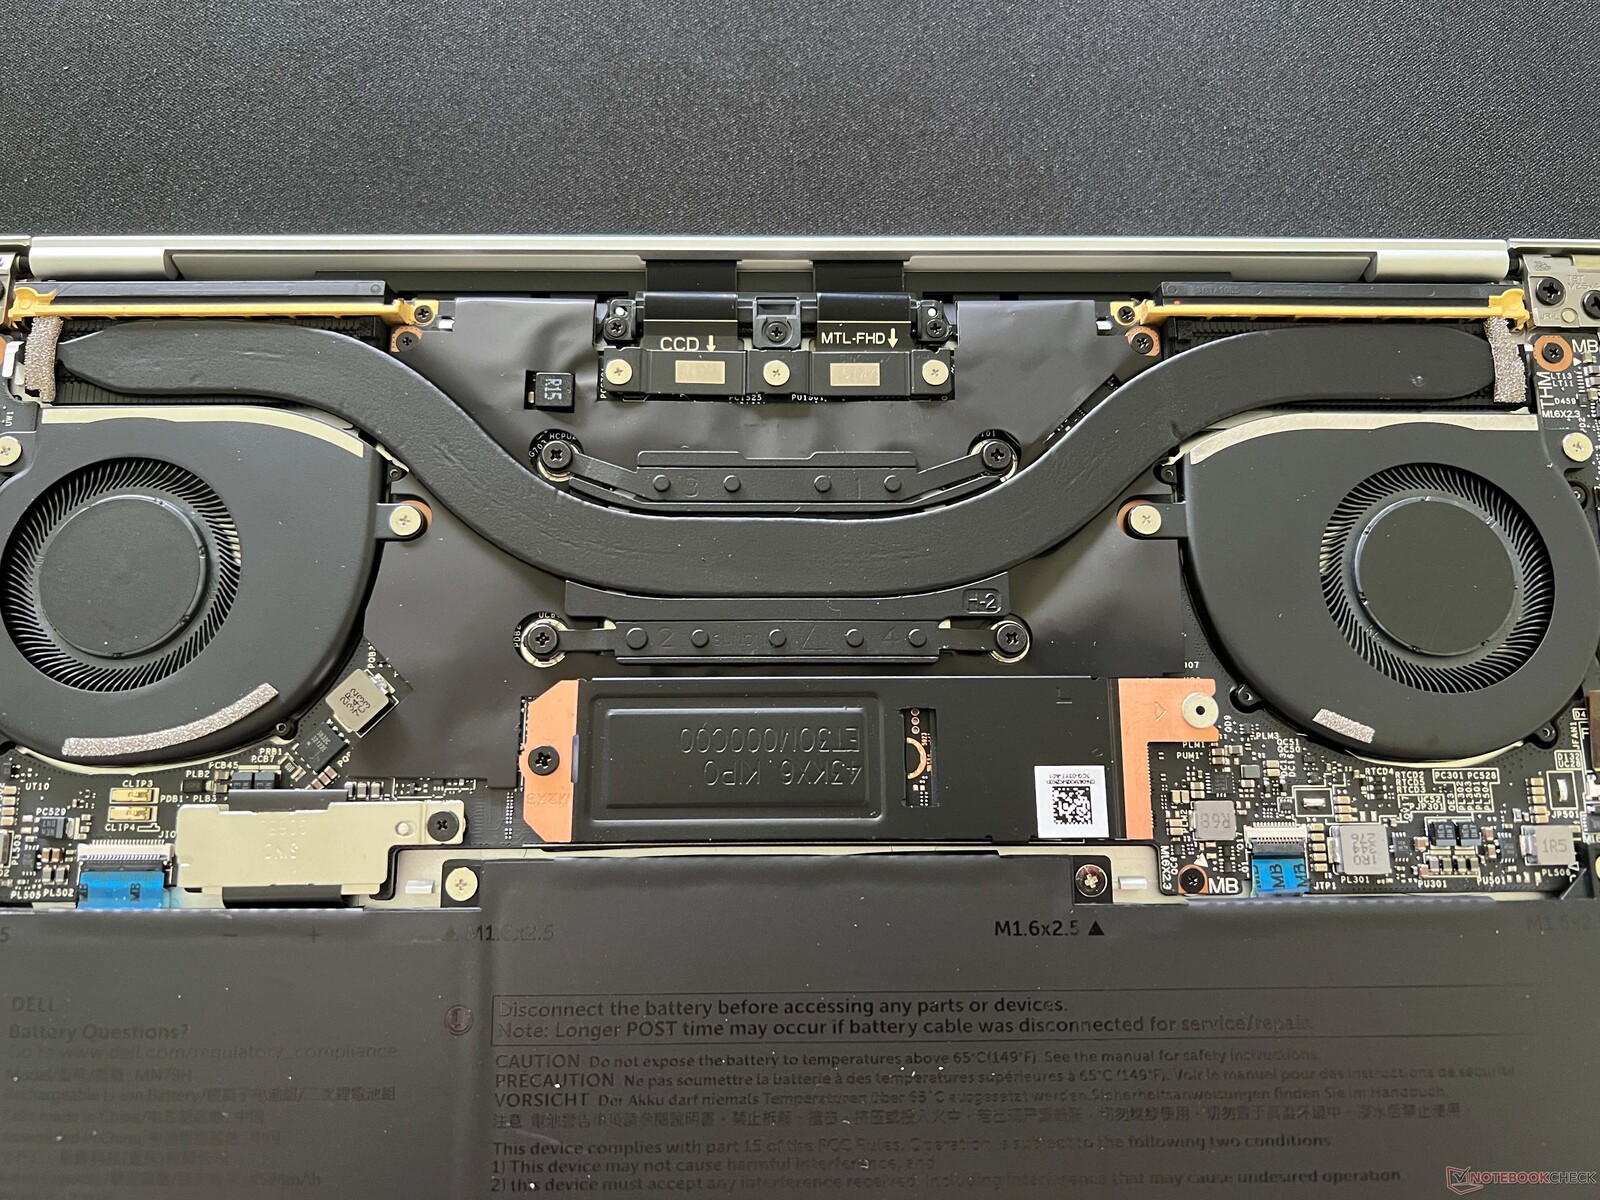
XPS 13 的散热装置由两个风扇和一个热管组成。在空闲模式和执行简单任务时,笔记本电脑通常保持安静或非常安静。一旦你对处理器或 iGPU 提出更高的要求,散热装置就会很快发出声音。我们测得的噪音在 37-42 dB(A)之间,但没有高音噪音。总而言之,XPS 13 在这方面的表现与其前代产品类似,是同类产品中噪音较大的机型之一。在使用可选的性能模式ultra 时,噪音值升至 47 dB(A),而在使用静音模式时,噪音值为 32 dB(A)。我们的测试设备没有发出额外的电子噪音。
Noise level
| Idle |
| 25.1 / 25.1 / 25.1 dB(A) |
| Load |
| 37.4 / 42.5 dB(A) |
 | ||
30 dB silent 40 dB(A) audible 50 dB(A) loud |
||
min: | ||
| Dell XPS 13 9340 Core Ultra 7 Arc 8-Core, Ultra 7 155H, Micron 2550 512GB | Apple MacBook Air 13 M3 10C GPU M3 10-Core GPU, M3, Apple SSD AP0512Z | Asus ZenBook S13 OLED UX5304 Iris Xe G7 96EUs, i7-1355U, Samsung PM9A1 MZVL21T0HCLR | Lenovo ThinkPad Z13 Gen 2 Radeon 780M, R7 PRO 7840U, SK hynix BC901 HFS001TEJ4X164N | HP Dragonfly G4 Iris Xe G7 96EUs, i7-1365U, Micron 3400 MTFDKBA512TFH 512GB | Dell XPS 13 Plus 9320 Core i7-1360P Iris Xe G7 96EUs, i7-1360P, Samsung PM9A1 MZVL2512HCJQ | |
|---|---|---|---|---|---|---|
| Noise | 6% | -1% | 11% | 3% | ||
| off / environment * (dB) | 25.1 | 23.3 7% | 25.1 -0% | 23.3 7% | 23.7 6% | |
| Idle Minimum * (dB) | 25.1 | 23.3 7% | 25.8 -3% | 23.5 6% | 24 4% | |
| Idle Average * (dB) | 25.1 | 23.3 7% | 25.8 -3% | 23.5 6% | 24 4% | |
| Idle Maximum * (dB) | 25.1 | 23.3 7% | 28.3 -13% | 26.8 -7% | 24.4 3% | |
| Load Average * (dB) | 37.4 | 37.7 -1% | 28.3 24% | 27.2 27% | 37 1% | |
| Witcher 3 ultra * (dB) | 42.5 | 40.1 6% | 44.8 -5% | 32.7 23% | 42.1 1% | |
| Load Maximum * (dB) | 42.5 | 40.1 6% | 44.8 -5% | 35 18% | 42 1% |
* ... smaller is better
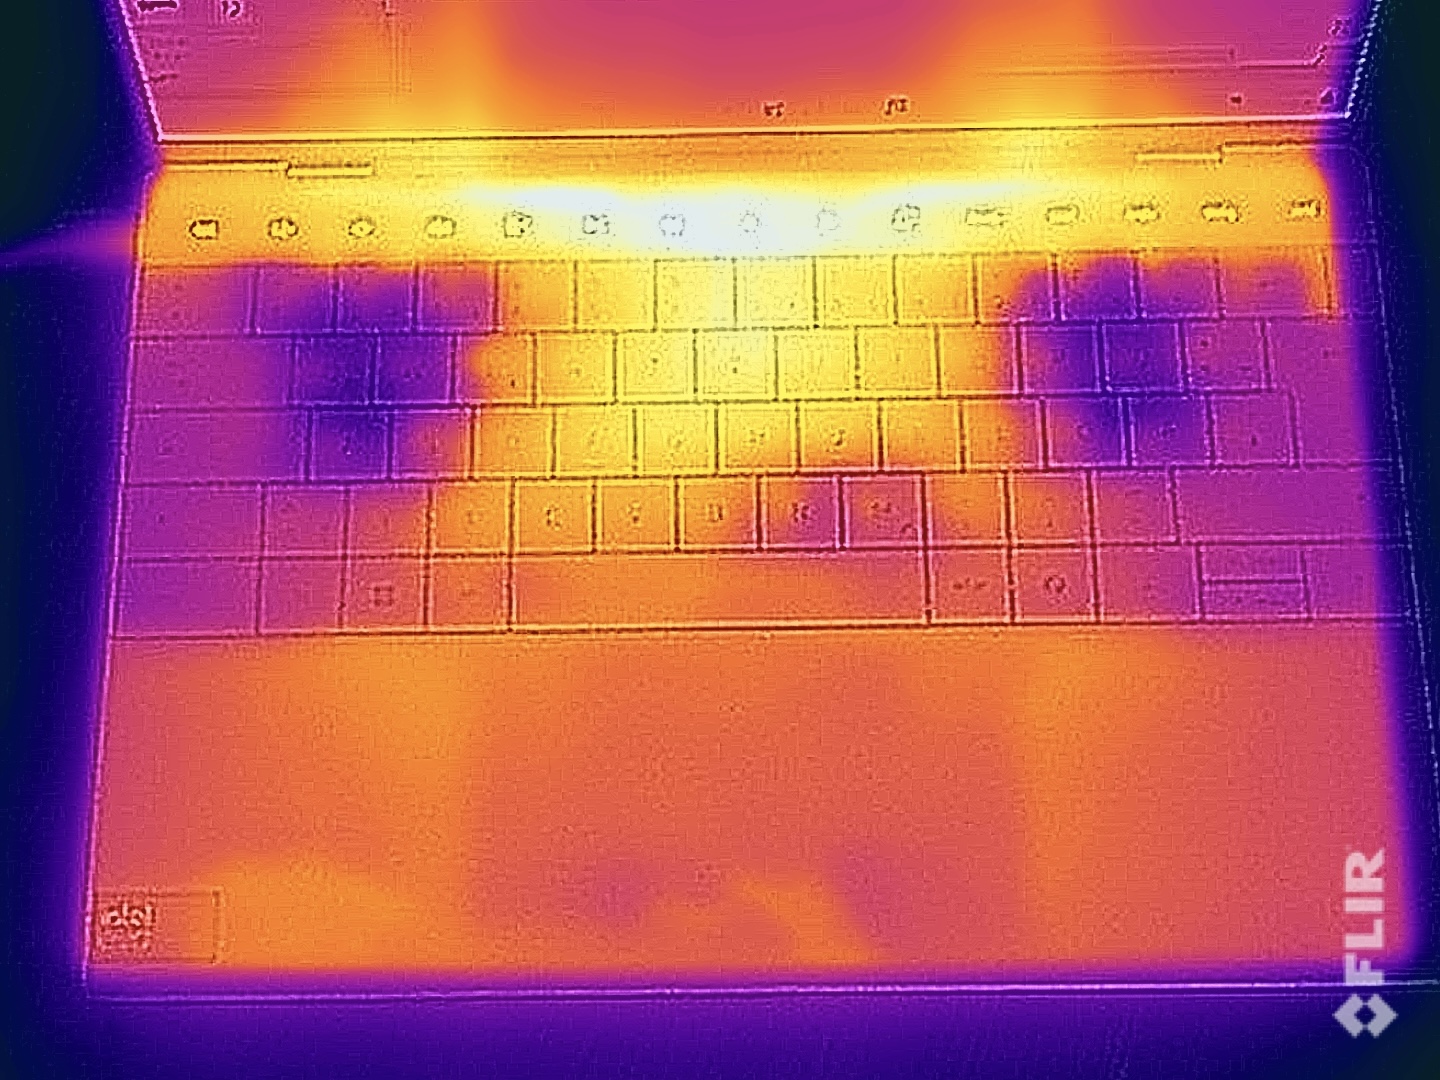
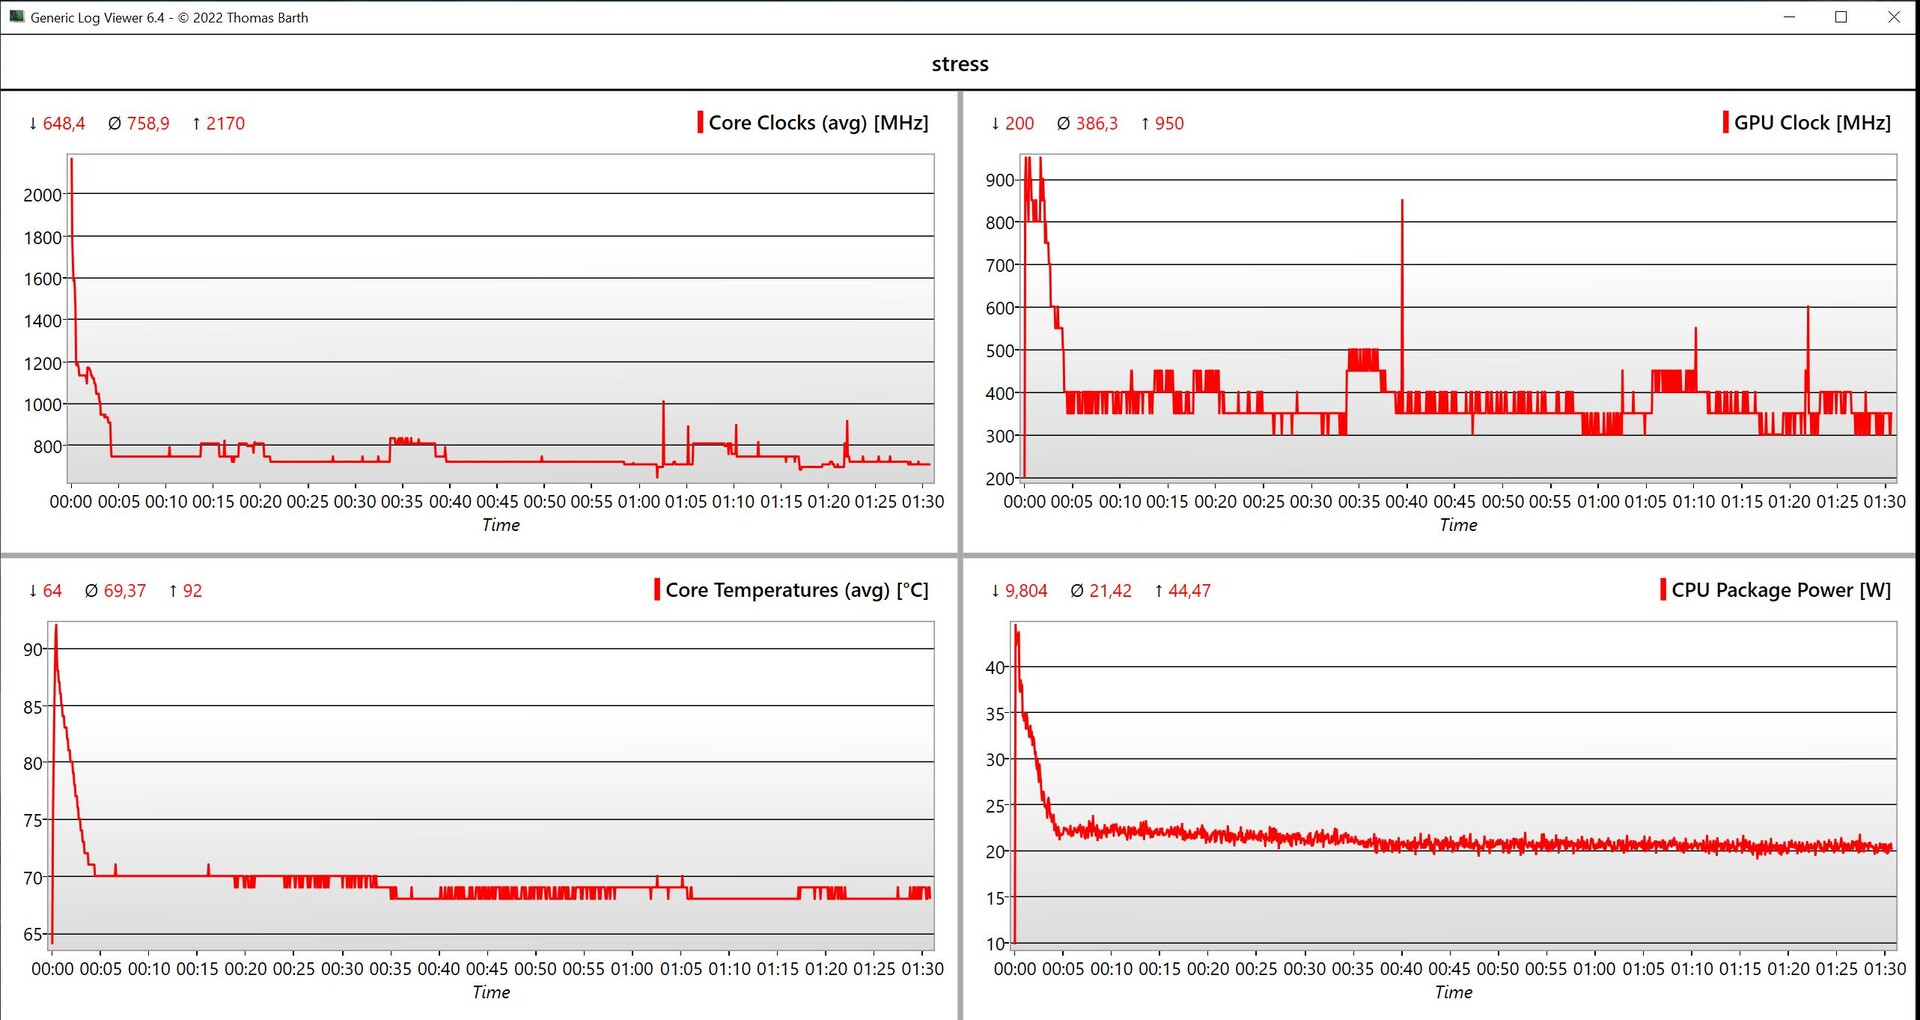
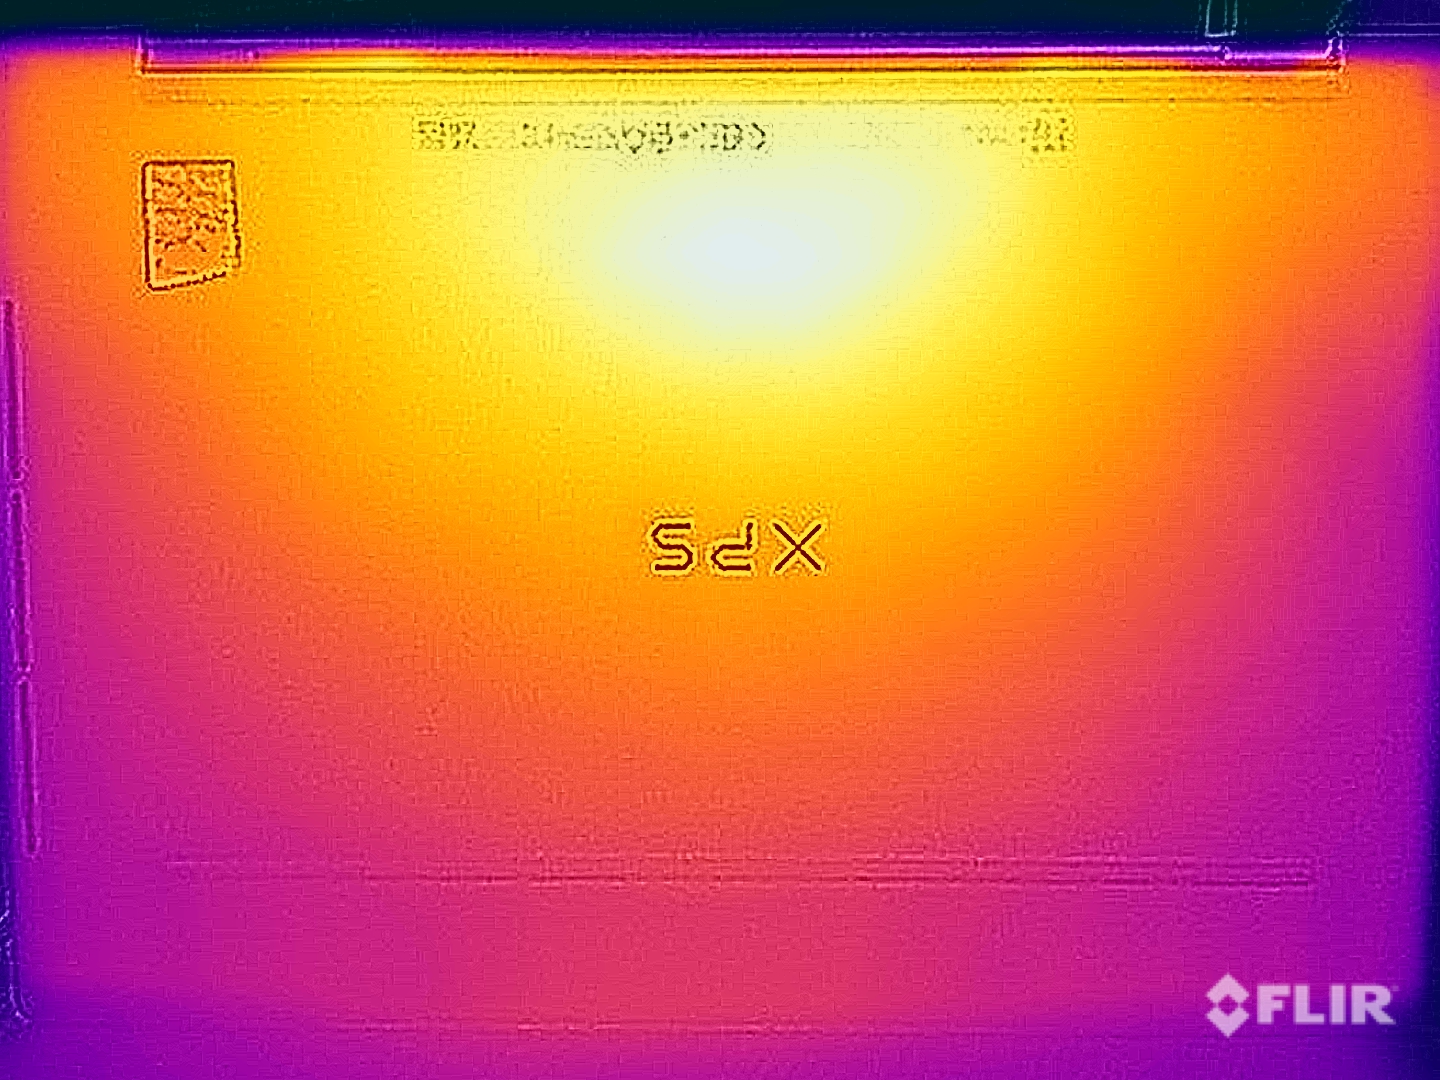
温度
在空闲模式和执行简单任务时,XPS 13 的表面非常凉爽,我们没有发现任何问题。在玩游戏或高负荷工作时,笔记本电脑的底部会明显发热,温度约为 110 °F(44 °C)。不过,在使用该设备时没有任何限制,你也不必担心键盘。只有触摸栏的中间区域温度很高。在压力测试中,处理器的耗电量曾一度高达 45 瓦,然后迅速降至 24 瓦左右。然后,XPS 在这个范围内保持了一段时间,最终在 21 瓦左右趋于平稳。
(±) The maximum temperature on the upper side is 41 °C / 106 F, compared to the average of 35.9 °C / 97 F, ranging from 21.4 to 59 °C for the class Subnotebook.
(±) The bottom heats up to a maximum of 43.5 °C / 110 F, compared to the average of 39.2 °C / 103 F
(+) In idle usage, the average temperature for the upper side is 24.6 °C / 76 F, compared to the device average of 30.8 °C / 87 F.
(±) Playing The Witcher 3, the average temperature for the upper side is 33.3 °C / 92 F, compared to the device average of 30.8 °C / 87 F.
(+) The palmrests and touchpad are reaching skin temperature as a maximum (32.5 °C / 90.5 F) and are therefore not hot.
(-) The average temperature of the palmrest area of similar devices was 28.2 °C / 82.8 F (-4.3 °C / -7.7 F).
| Dell XPS 13 9340 Core Ultra 7 Intel Core Ultra 7 155H, Intel Arc 8-Core iGPU | Apple MacBook Air 13 M3 10C GPU Apple M3, Apple M3 10-Core GPU | Asus ZenBook S13 OLED UX5304 Intel Core i7-1355U, Intel Iris Xe Graphics G7 96EUs | Lenovo ThinkPad Z13 Gen 2 AMD Ryzen 7 PRO 7840U, AMD Radeon 780M | HP Dragonfly G4 Intel Core i7-1365U, Intel Iris Xe Graphics G7 96EUs | Dell XPS 13 Plus 9320 Core i7-1360P Intel Core i7-1360P, Intel Iris Xe Graphics G7 96EUs | |
|---|---|---|---|---|---|---|
| Heat | 4% | -6% | -2% | -3% | -1% | |
| Maximum Upper Side * (°C) | 41 | 44.3 -8% | 43.1 -5% | 46.2 -13% | 38.6 6% | 43.8 -7% |
| Maximum Bottom * (°C) | 43.5 | 43.4 -0% | 45 -3% | 48.4 -11% | 40.4 7% | 44.4 -2% |
| Idle Upper Side * (°C) | 25.3 | 22.3 12% | 27.3 -8% | 23.2 8% | 28.2 -11% | 24 5% |
| Idle Bottom * (°C) | 25.5 | 22.1 13% | 27.8 -9% | 23 10% | 29 -14% | 25.2 1% |
* ... smaller is better
发言人
XPS 配备了带四个扬声器的音响系统,其整体表现相当不错,只是在低音方面有些欠缺。即便如此,扬声器通常也能满足播放背景音乐或 Netflix 流媒体的需要。
Dell XPS 13 9340 Core Ultra 7 audio analysis
(+) | speakers can play relatively loud (83.2 dB)
Bass 100 - 315 Hz
(-) | nearly no bass - on average 17% lower than median
(±) | linearity of bass is average (9.3% delta to prev. frequency)
Mids 400 - 2000 Hz
(+) | balanced mids - only 2.1% away from median
(+) | mids are linear (4.7% delta to prev. frequency)
Highs 2 - 16 kHz
(+) | balanced highs - only 2.5% away from median
(+) | highs are linear (4.6% delta to prev. frequency)
Overall 100 - 16.000 Hz
(+) | overall sound is linear (11.6% difference to median)
Compared to same class
» 12% of all tested devices in this class were better, 3% similar, 84% worse
» The best had a delta of 5%, average was 18%, worst was 53%
Compared to all devices tested
» 8% of all tested devices were better, 2% similar, 90% worse
» The best had a delta of 4%, average was 24%, worst was 134%
Apple MacBook Air 13 M3 10C GPU audio analysis
(+) | speakers can play relatively loud (83.2 dB)
Bass 100 - 315 Hz
(±) | reduced bass - on average 13.3% lower than median
(±) | linearity of bass is average (11.3% delta to prev. frequency)
Mids 400 - 2000 Hz
(+) | balanced mids - only 0.4% away from median
(+) | mids are linear (1.6% delta to prev. frequency)
Highs 2 - 16 kHz
(+) | balanced highs - only 4.5% away from median
(+) | highs are linear (1.9% delta to prev. frequency)
Overall 100 - 16.000 Hz
(+) | overall sound is linear (10.7% difference to median)
Compared to same class
» 9% of all tested devices in this class were better, 3% similar, 88% worse
» The best had a delta of 5%, average was 18%, worst was 53%
Compared to all devices tested
» 6% of all tested devices were better, 2% similar, 93% worse
» The best had a delta of 4%, average was 24%, worst was 134%
电源管理 - 60 赫兹下运行时间长
耗电量
新款 XPS 13 的最大闲置功耗不到 8 瓦,非常节俭。我们测得的最大功耗为 62.7 瓦,但这已经是 60 瓦电源的极限。笔记本电脑的耗电量可能会在短时间内再次下降,但在此期间电池必须弥补这一差额。在测试过程中,笔记本电脑的耗电量稳定在 37 瓦左右。
| Off / Standby | |
| Idle | |
| Load |
|
Key:
min: | |
| Dell XPS 13 9340 Core Ultra 7 Ultra 7 155H, Arc 8-Core, Micron 2550 512GB, IPS, 1920x1200, 13.4" | Apple MacBook Air 13 M3 10C GPU M3, M3 10-Core GPU, Apple SSD AP0512Z, IPS, 2560x1664, 13.6" | Asus ZenBook S13 OLED UX5304 i7-1355U, Iris Xe G7 96EUs, Samsung PM9A1 MZVL21T0HCLR, OLED, 2880x1800, 13.3" | Lenovo ThinkPad Z13 Gen 2 R7 PRO 7840U, Radeon 780M, SK hynix BC901 HFS001TEJ4X164N, OLED, 2880x1800, 13.3" | HP Dragonfly G4 i7-1365U, Iris Xe G7 96EUs, Micron 3400 MTFDKBA512TFH 512GB, IPS, 1920x1280, 13.5" | Dell XPS 13 Plus 9320 Core i7-1360P i7-1360P, Iris Xe G7 96EUs, Samsung PM9A1 MZVL2512HCJQ, OLED, 3456x2160, 13.4" | Average Intel Arc 8-Core iGPU | Average of class Subnotebook | |
|---|---|---|---|---|---|---|---|---|
| Power Consumption | 18% | -5% | -18% | 0% | -31% | -32% | 1% | |
| Idle Minimum * (Watt) | 3.8 | 1.95 49% | 5.8 -53% | 5.8 -53% | 4.1 -8% | 6.9 -82% | 5.36 ? -41% | 3.9 ? -3% |
| Idle Average * (Watt) | 7 | 8.7 -24% | 8.5 -21% | 6.2 11% | 7.5 -7% | 7.4 -6% | 8.53 ? -22% | 6.91 ? 1% |
| Idle Maximum * (Watt) | 7.3 | 8.9 -22% | 8.8 -21% | 12.7 -74% | 8.2 -12% | 13.6 -86% | 11.8 ? -62% | 8.24 ? -13% |
| Load Average * (Watt) | 52.6 | 34.3 35% | 35.1 33% | 27.2 48% | 35.5 33% | 43.5 17% | 53.7 ? -2% | 42.1 ? 20% |
| Witcher 3 ultra * (Watt) | 38.3 | 28.6 25% | 27.6 28% | 54.1 -41% | 37.5 2% | 48 -25% | ||
| Load Maximum * (Watt) | 62.7 | 35.4 44% | 59.5 5% | 61.4 2% | 66.5 -6% | 63.3 -1% | 84.4 ? -35% | 64.2 ? -2% |
* ... smaller is better
Power consumption Witcher 3 / stress test
Power consumption with external monitor
运行时间
该设备的 55 瓦时电池可提供良好的运行时间。在 150 cd/m²(相当于测试设备最大亮度的 51%)的 WLAN 测试中,我们测得 60 Hz 下的运行时间接近 13 小时(120 Hz 下略低于 11 小时),这意味着 XPS 13 的运行时间仅次于 MacBook Air 13 M3 和惠普 Dragonfly G4。采用高分辨率 OLED 面板的旧款 XPS 13 仅能使用 7 个多小时。在最大亮度下,WLAN 测试仍然持续了近 9 个小时(60 Hz),更高的刷新率对测试结果几乎没有影响(120 Hz 时仅减少了 10 分钟)。在 150 cd/m² 的视频测试中,采用磁贴设计的全新 Meteor Lake 处理器再次崭露头角,SoC 磁贴上的两个高效内核完成了所有工作。结果是出色的 17.5 小时,甚至险胜 MacBook Air 13。在最糟糕的情况下,这款笔记本电脑只需 2 个多小时即可耗尽。
您可以选择不同的充电模式,使用标准设置,在设备打开的情况下,从零开始为电池充电需要 2.5 小时(95 分钟后达到 80%)。使用快速模式,充电时间可缩短到 2 小时以内(64 分钟后可充满 80%的电量)。
| Dell XPS 13 9340 Core Ultra 7 Ultra 7 155H, Arc 8-Core, 55 Wh | Apple MacBook Air 13 M3 10C GPU M3, M3 10-Core GPU, 52.6 Wh | Asus ZenBook S13 OLED UX5304 i7-1355U, Iris Xe G7 96EUs, 63 Wh | Lenovo ThinkPad Z13 Gen 2 R7 PRO 7840U, Radeon 780M, 51.5 Wh | HP Dragonfly G4 i7-1365U, Iris Xe G7 96EUs, 68 Wh | Dell XPS 13 Plus 9320 Core i7-1360P i7-1360P, Iris Xe G7 96EUs, 55 Wh | Average of class Subnotebook | |
|---|---|---|---|---|---|---|---|
| Battery runtime | 17% | -8% | -39% | 35% | -43% | -5% | |
| H.264 (h) | 17.6 | 17.4 -1% | 13.8 -22% | 15.8 ? -10% | |||
| WiFi v1.3 (h) | 12.8 | 15.2 19% | 11.3 -12% | 7.8 -39% | 15.9 24% | 7.3 -43% | 13.7 ? 7% |
| Load (h) | 2.2 | 2.9 32% | 2.4 9% | 3.2 45% | 1.933 ? -12% |
Pros
Cons
评语:XPS 13 依然是一款小巧的产品,但基本的显示屏和触摸栏令人失望

新款 XPS 13 采用了旧款 XPS 13 Plus 的设计,与戴尔目前在较大的 XPS 14 和 XPS 16 上采用的设计相同。特别是与厚重的 XPS 14 相比,13 英寸机型给人的感觉非常小巧,加上纤细的边框,它也是同类产品中最薄的机型之一。在质量方面,我们几乎没有什么可抱怨的,不过,1.2 千克的重量并不算特别轻。它的另一个优点是电池续航时间长,至少在配备基本显示屏的情况下是如此。
这也是 XPS 13 比较困难的地方,因为它的基本面板并不令人印象深刻。虽然哑光 IPS 面板的画面看起来不错,120Hz 的刷新率也有助于移动,但在我们的测试中,测试设备的面板显然没有达到制造商标称的 500 cd/m² 亮度,而且它的校准也不是很好(在交付状态下呈蓝色)。更高的亮度值在室外会更有帮助。它的连接情况也同样棘手,因为它只有 2x USB-C。内存无法升级,但至少可以选择最大 64 GB 内存的 XPS。
XPS 13 9340 以其小巧的体积和较长的运行时间给人留下了深刻印象--至少与基本显示屏结合使用时是如此。不过,它的连接选项少得可怜,而且带有功能键的触摸栏也令人讨厌。
这款笔记本电脑的输入设备问题更多一些。无框触摸板在实际使用中效果不错,但键盘的问题更大。由于键盘设计在按键之间没有任何空隙,你根本无法很好地感觉按键,从而导致很多意外的输入错误。除此以外,键盘的打字手感其实还不错。此外,键盘背光的强度无法调节,在光线发生微小变化时,无论你是否愿意,传感器都会启动背光。反过来,我们也不能对该设备的触摸栏说什么好话,因为它在日常使用中实在令人讨厌。你不能盲目地使用它,在背光关闭的情况下,你无法分辨哪个键是哪个键(经常会导致你按错键),而且在我们的测试过程中,播放视频时功能键会一直亮着,这让人非常恼火。
新款流星湖处理器的 CPU 性能仅在短时间内优于前代产品。图形性能也有所提升,但并不稳定--比如在玩游戏时。即便如此,它的性能当然完全可以胜任日常任务。不过,与竞争对手相比,新款 XPS 13 并不轻松。它的主要竞争对手之一是 MacBook AirMacBook Air 凭借其被动散热和更多的端口继续给人留下深刻印象。新款 ThinkPad Z13配备 AMD 处理器,性能更高、更稳定。此外,我们目前正在测试新款 ThinkBook 13x G4,它是 XPS 13 的另一个竞争对手,拥有高分辨率 IPS 显示屏。
价格和供应情况
新款 XPS 13 9340 可通过戴尔网站直接购买。基本型号的起价为 1,149 美元。
Dell XPS 13 9340 Core Ultra 7
- 05/14/2024 v7 (old)
Andreas Osthoff
Transparency
The selection of devices to be reviewed is made by our editorial team. The test sample was provided to the author as a loan by the manufacturer or retailer for the purpose of this review. The lender had no influence on this review, nor did the manufacturer receive a copy of this review before publication. There was no obligation to publish this review. As an independent media company, Notebookcheck is not subjected to the authority of manufacturers, retailers or publishers.
This is how Notebookcheck is testing
Every year, Notebookcheck independently reviews hundreds of laptops and smartphones using standardized procedures to ensure that all results are comparable. We have continuously developed our test methods for around 20 years and set industry standards in the process. In our test labs, high-quality measuring equipment is utilized by experienced technicians and editors. These tests involve a multi-stage validation process. Our complex rating system is based on hundreds of well-founded measurements and benchmarks, which maintains objectivity. Further information on our test methods can be found here.
Price comparison

