

HP ZBook Ultra G1a 14 评测:功能强大的 MacBook Pro 替代品,工作游戏两不误
AMD Ryzen AI Max 不是闹着玩的。
惠普说他们最新的 ZBook 是 "世界上最快的 14 英寸工作站 PC",这话一点也不夸张。Ryzen AI Max+ 395 在专业台式机和迷你 PC 上运行良好,但在轻薄的 14 英寸外形上,它的表现更令人印象深刻。Allen Ngo, 👁 Allen Ngo (translated by DeepL / Ninh Duy) Published 🇺🇸 🇫🇷 ...
结论 - AMD 力挽狂澜
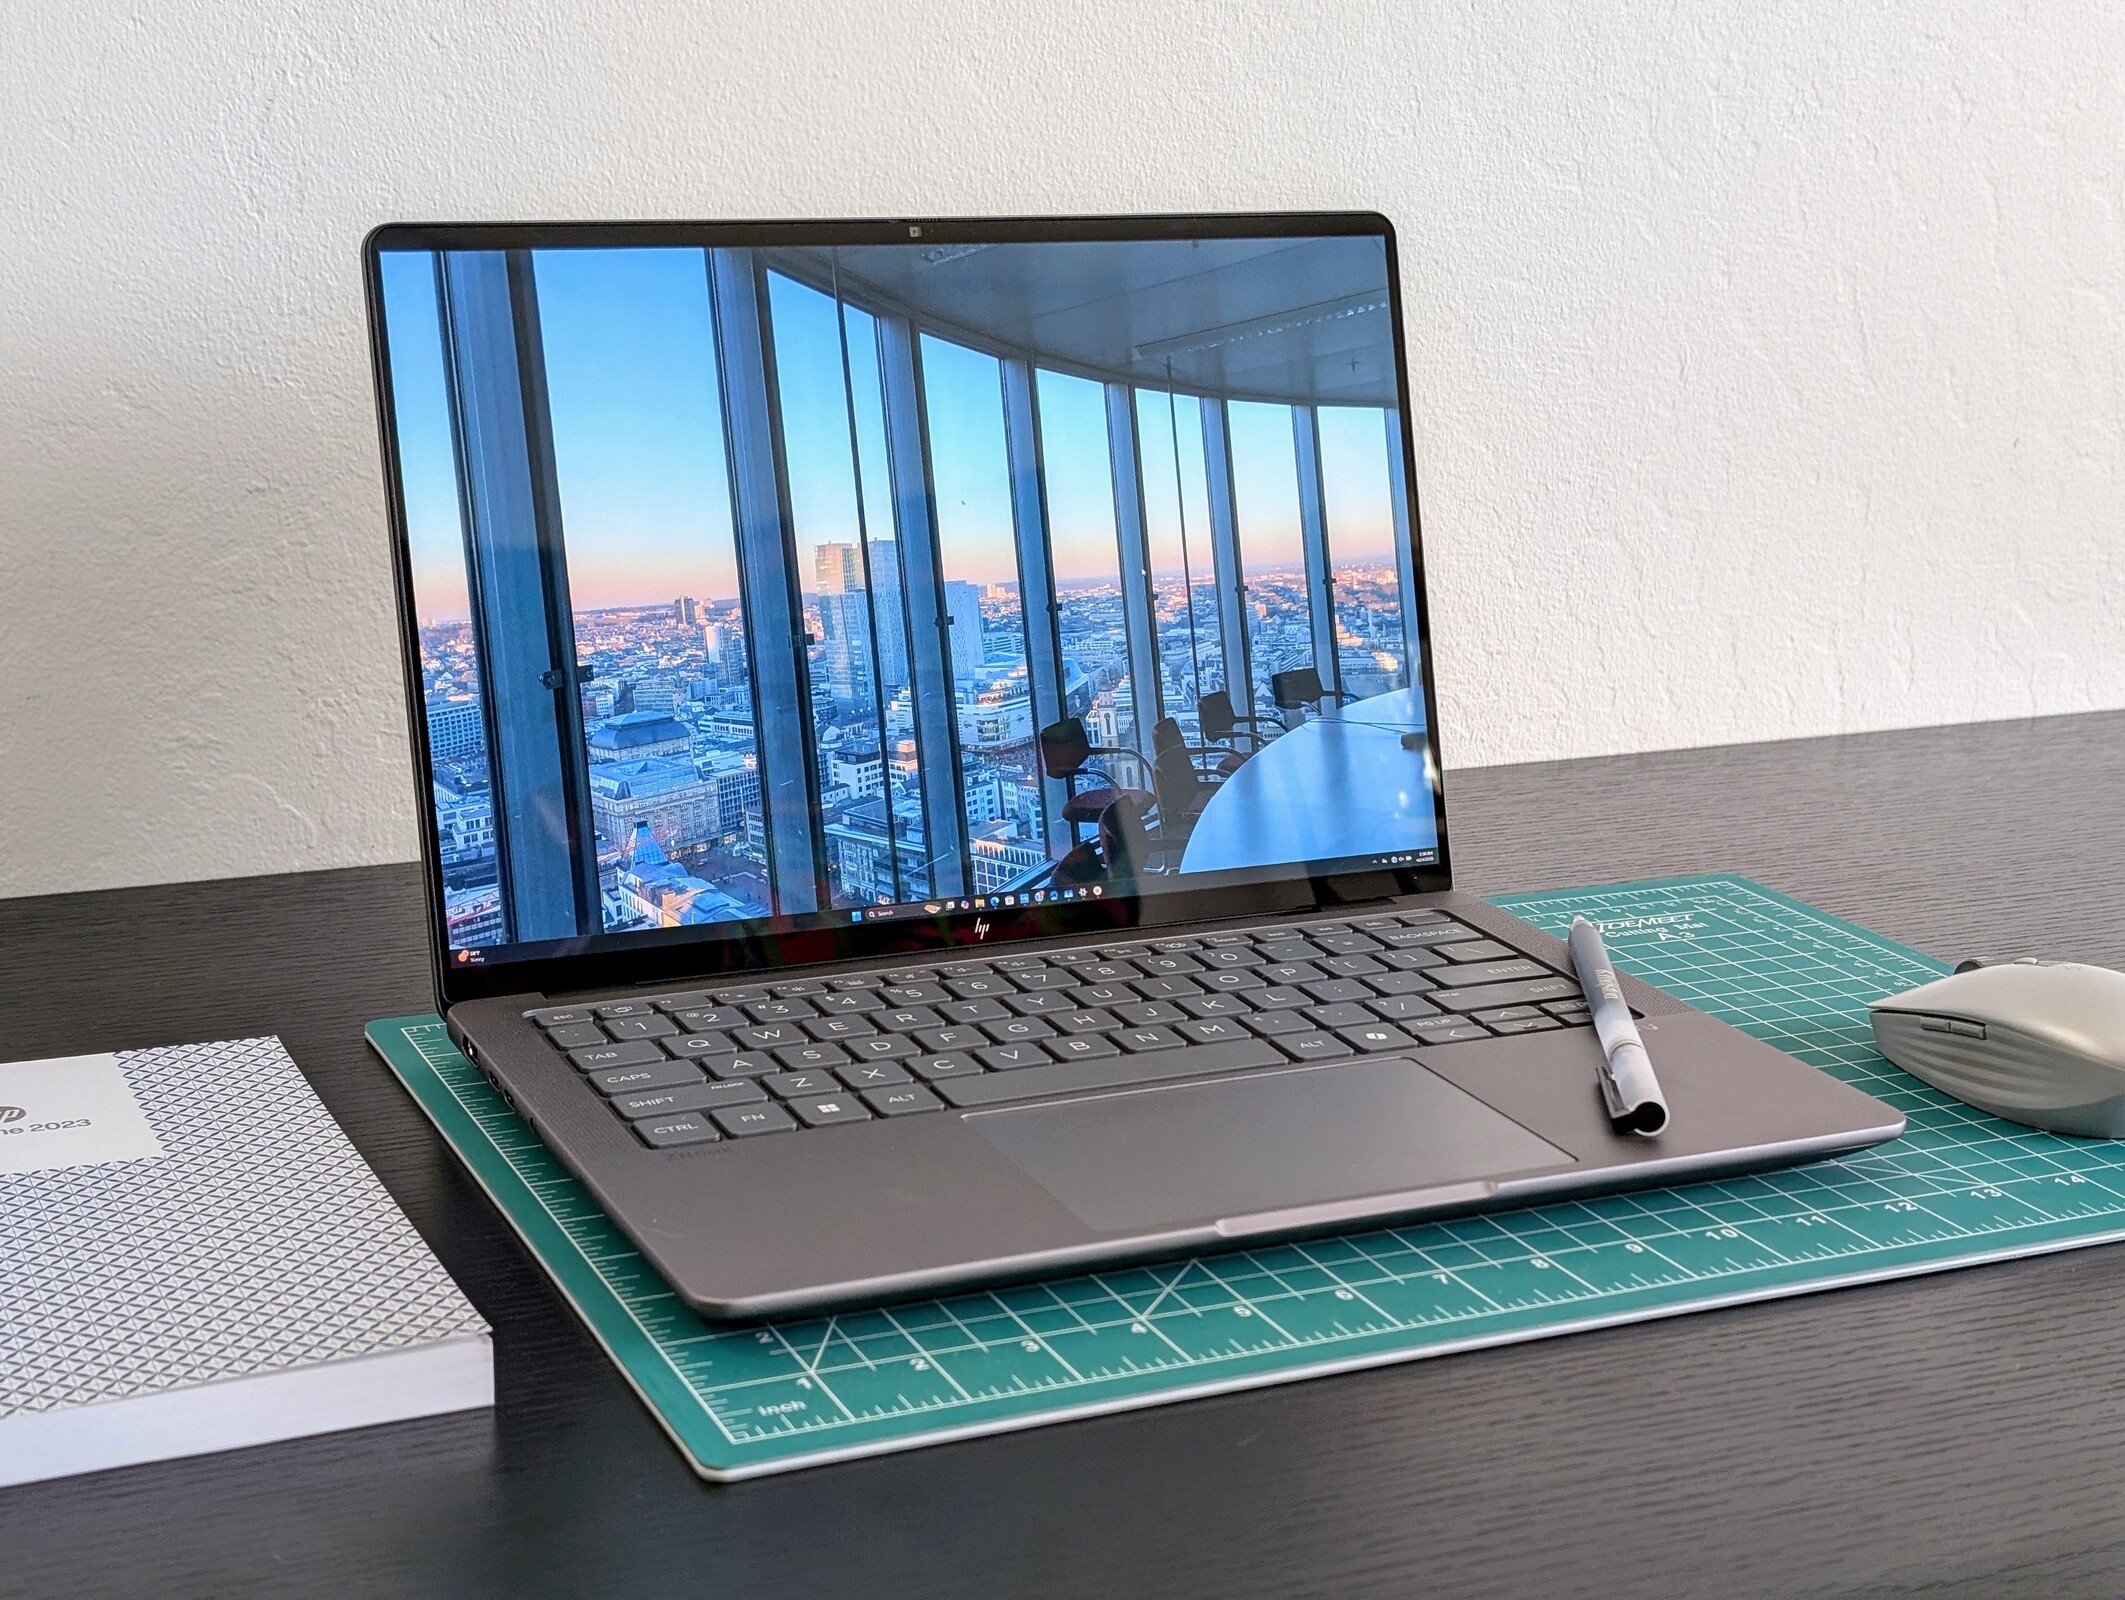
ZBook Ultra G1a 14 的问世得益于独特的 Ryzen AI Max 系列。专门的 Zen 5 CPU 集成了 Radeon 8060S 图形处理器和高达 128 GB 的内存,在 14 英寸的外形尺寸下实现了极高的性能。单位体积性能密集,很容易成为该机型的最强优势。令人印象深刻的 120 Hz OLED 触摸屏和专业的 ZBook 设计使整套配置更加完美。
在如此小巧的机身内集成如此强大的性能也有其缺点。内存是固定的,不支持 ECC,存储空间仅限于单个硬盘,电池续航时间在同类产品中稍短。在使用电池时,整体性能会有所下降,而交流适配器也因内部要求较高而比预期的要大。
如果专业人士需要一款便于旅行的 14 英寸工作主力机,而又不想牺牲太多性能,ZBook Ultra G1a 14 将是一个不错的选择。要想获得更强大的性能,用户必须开始考虑 15 英寸或更大的替代产品配备 RTX 4000 Ada 或更高显卡。
Pros
Cons
- $1,049.00HP ZBook Firefly G11 14” AI-Ready Mobile Workstation IPS WUXGA (Intel Ultra 7 155U 12-Core, 64GB DDR5, 1TB SSD, Backlit KYB, Fingerprint, 2 Thunderbolt 4, WiFi 6E, 5MP Cam, Win 11 Pro) w/MAJ Deskpad
- $1,249.99HP ZBook Firefly G11 Mobile Workstation (14" FHD+, NVIDIA RTX 500, Intel Core Ultra 7 155H, 32GB DDR5 RAM, 1TB SSD) AI Copilot Laptop for Engineer, Designer, IST Hub, Backlit, Fingerprint, Win 11 Pro
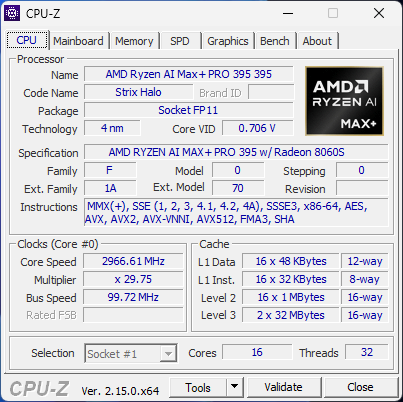
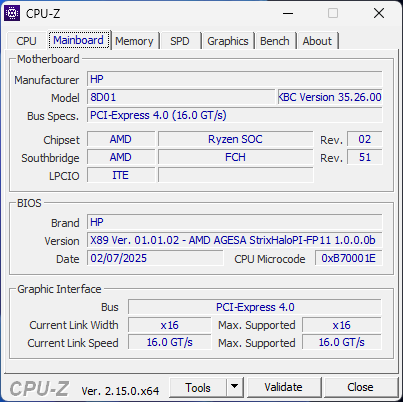
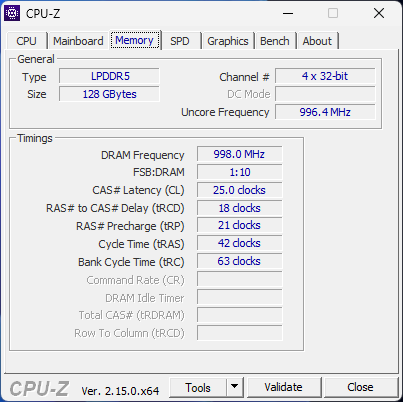
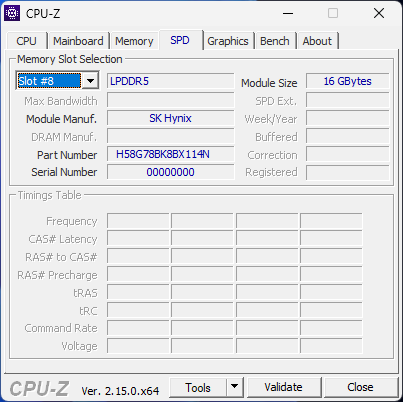
不要与面向办公的 EliteBook X G1a 14ZBook Ultra G1a 14 是首批采用 AMD Ryzen AI Max+ Pro 395 处理器和集成 Radeon 8060S 图形处理器的笔记本电脑之一。此外,它还配备了 128 GB 快速 LPDDR5X-8533 内存,这在 14 英寸工作站中是闻所未闻的。该机型与 ZBook Firefly 14不同,后者尺寸稍大,仅配备英特尔和 Nvidia 选项。
我们的测试机是高端配置,配备 Ryzen AI Max+ Pro 395 处理器、Radeon 8060S GPU 和 2.8K OLED 120 Hz 触摸屏,零售价约为 4000 美元。较少的 SKU 可能配备非 Pro 的 Ryzen AI Max 380、Radeon 8040S 或 1200p IPS 显示屏,起价较低。
ZBook Ultra G1a 14 的替代产品包括其他 14 英寸专业笔记本电脑,如 戴尔Precision 5490以及 ThinkPad P14 系列或 MacBook Pro 14.
更多惠普评测:
规格
案例
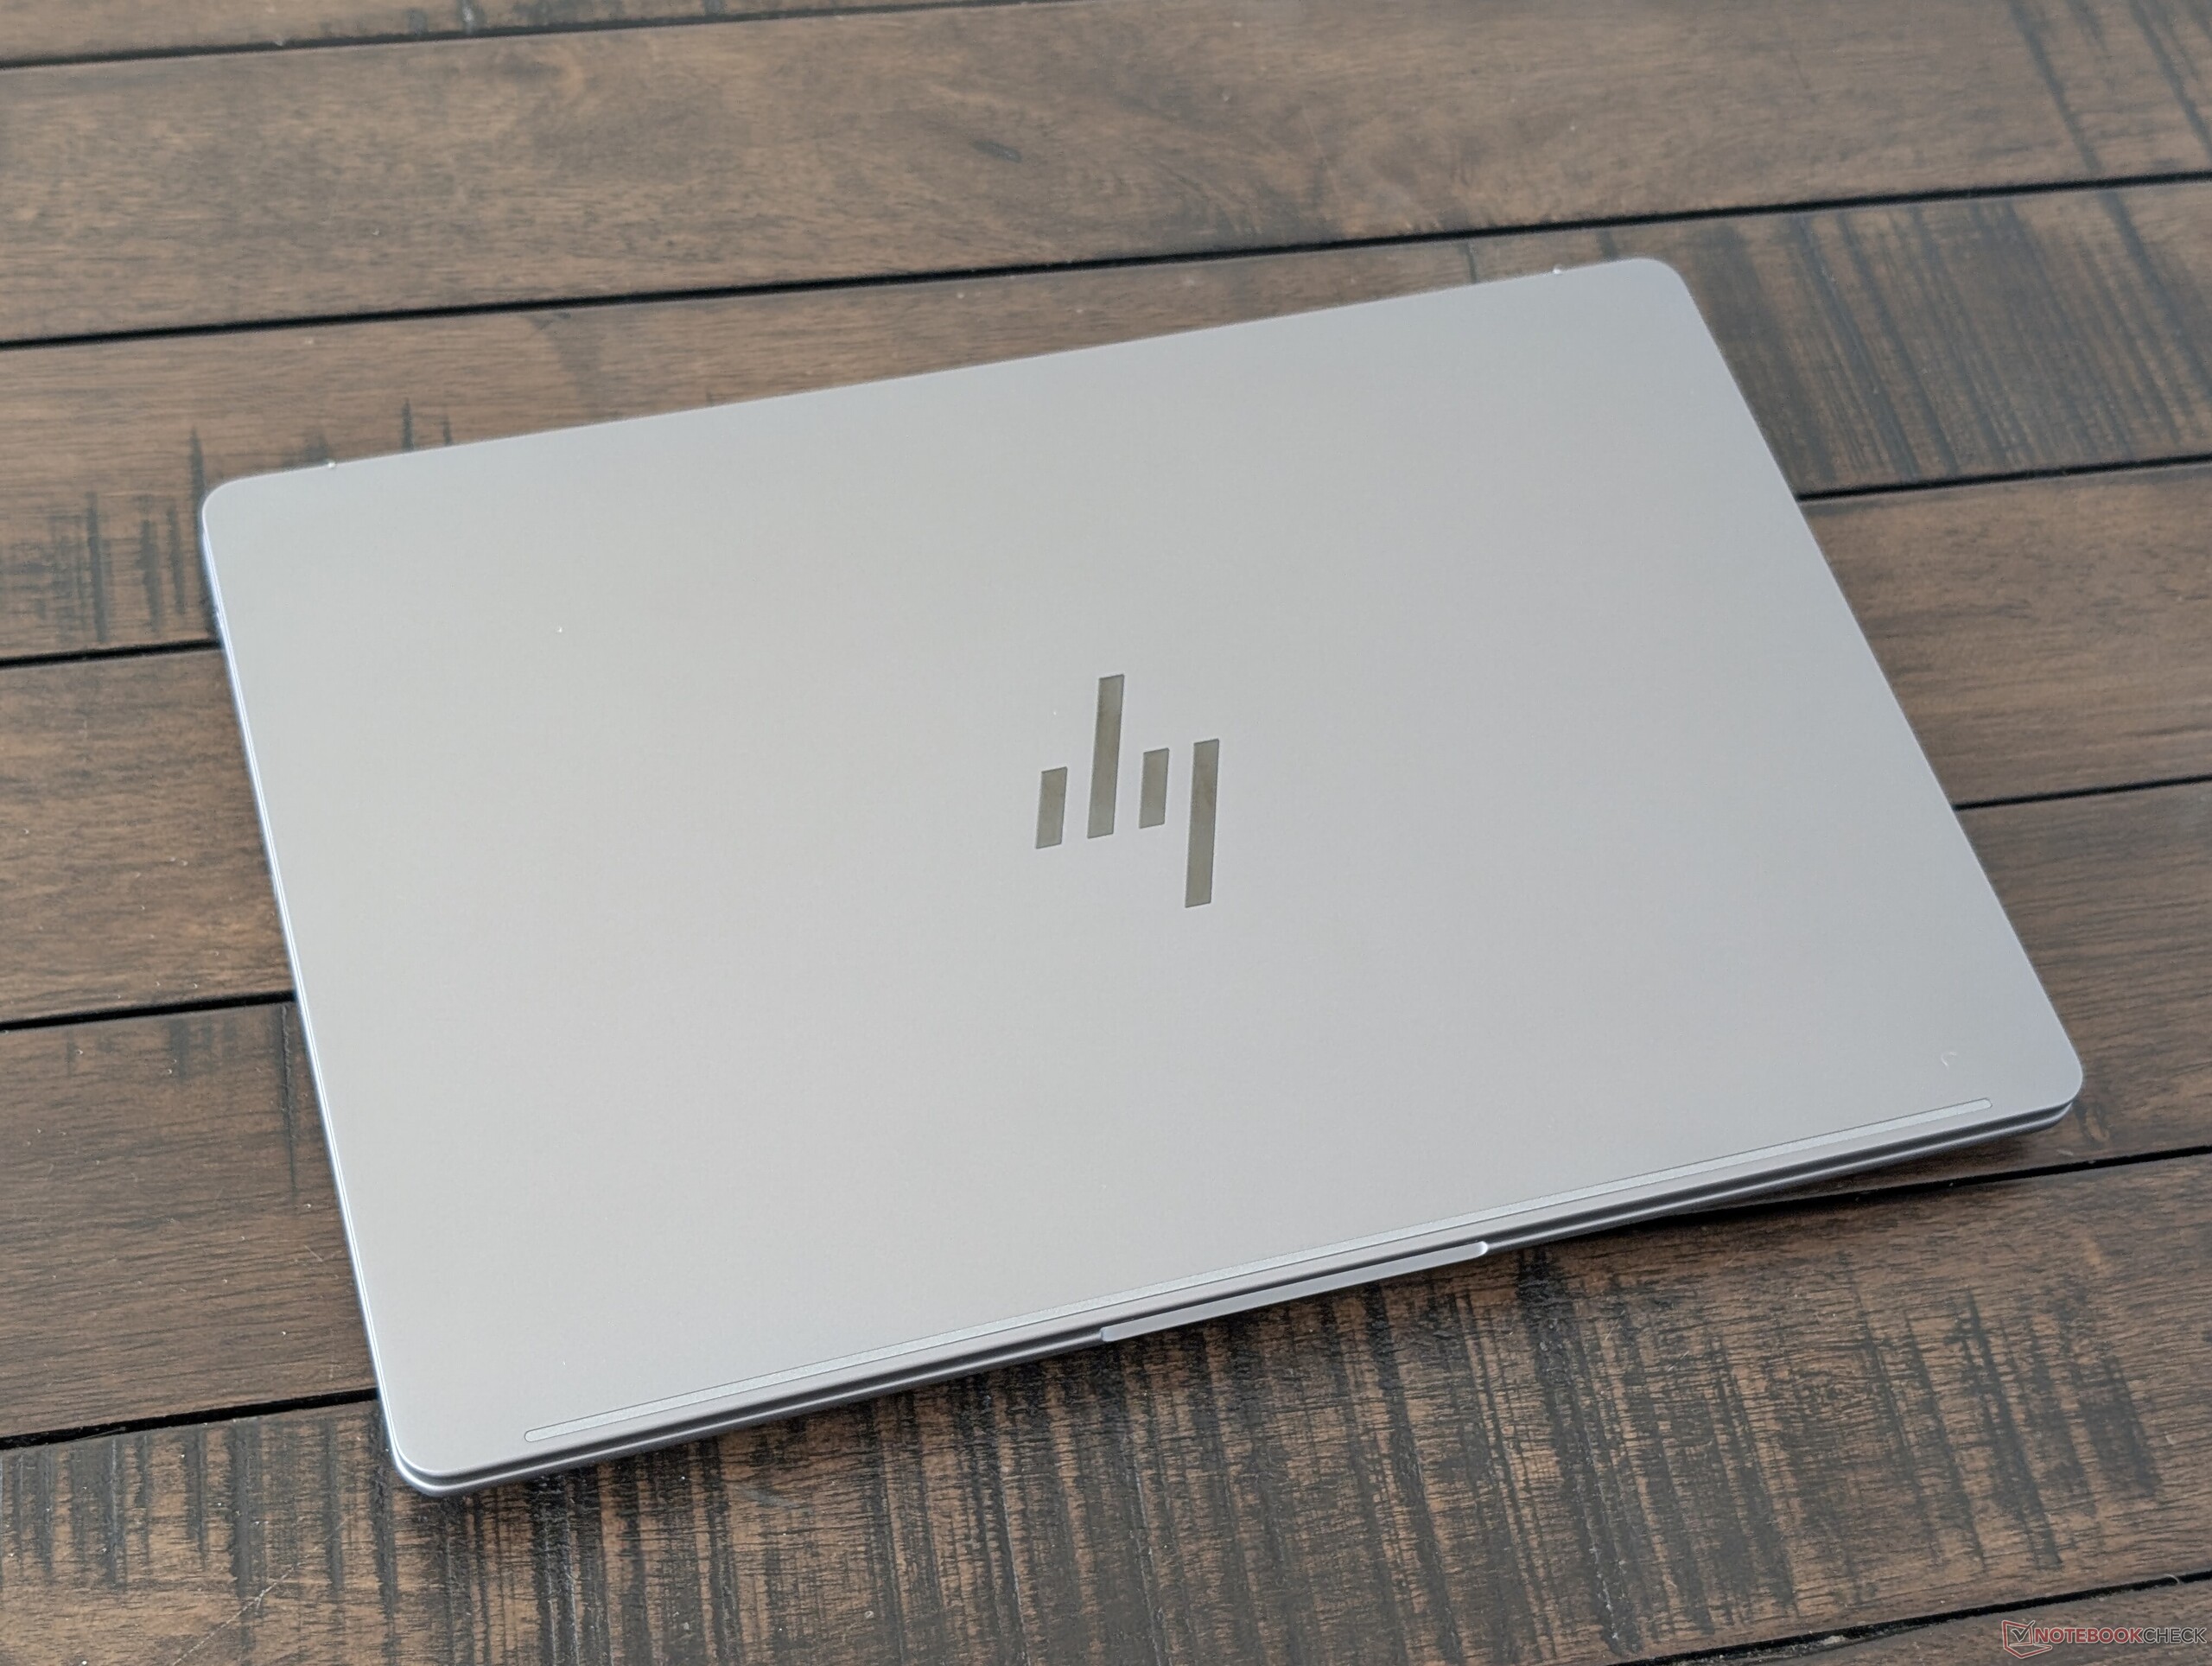
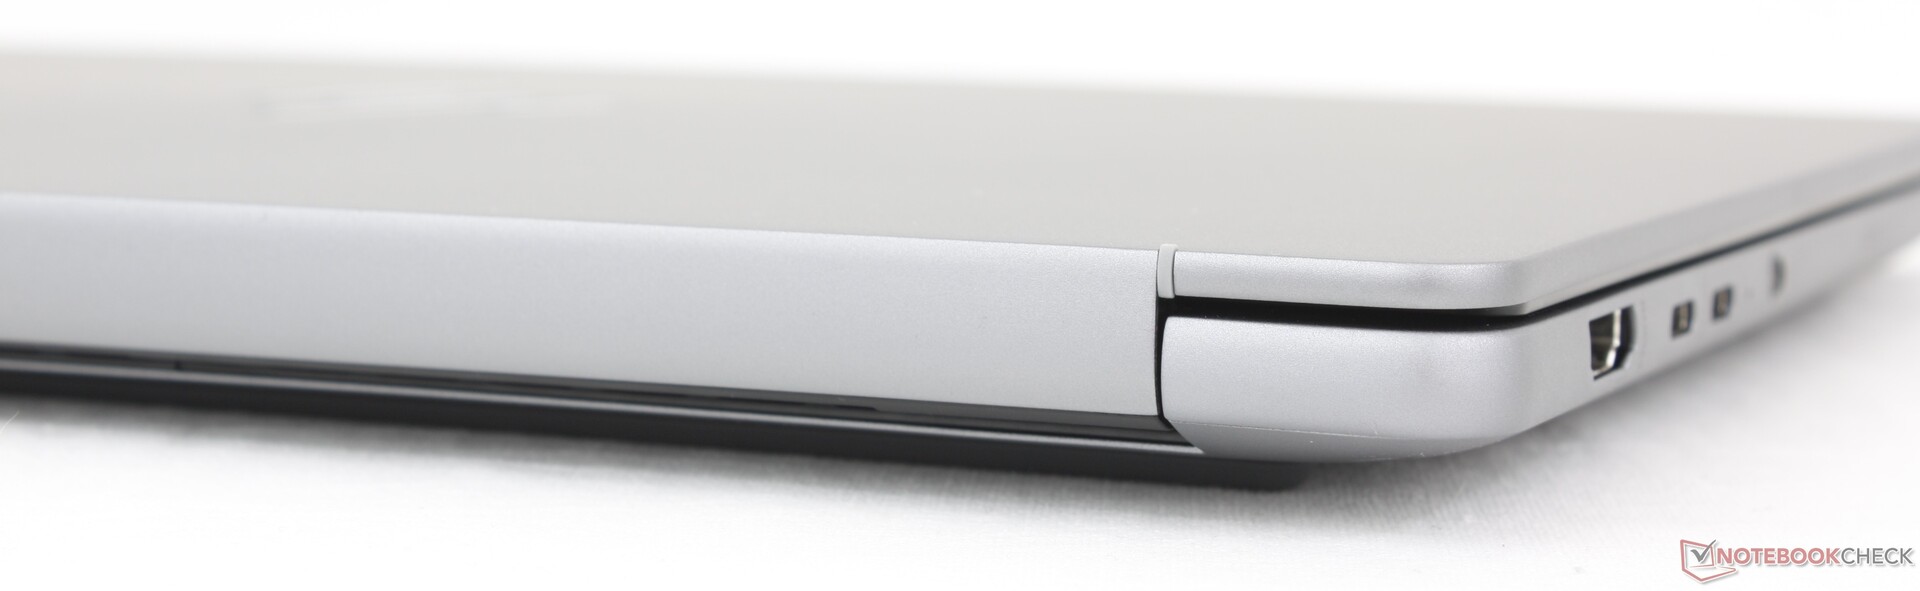
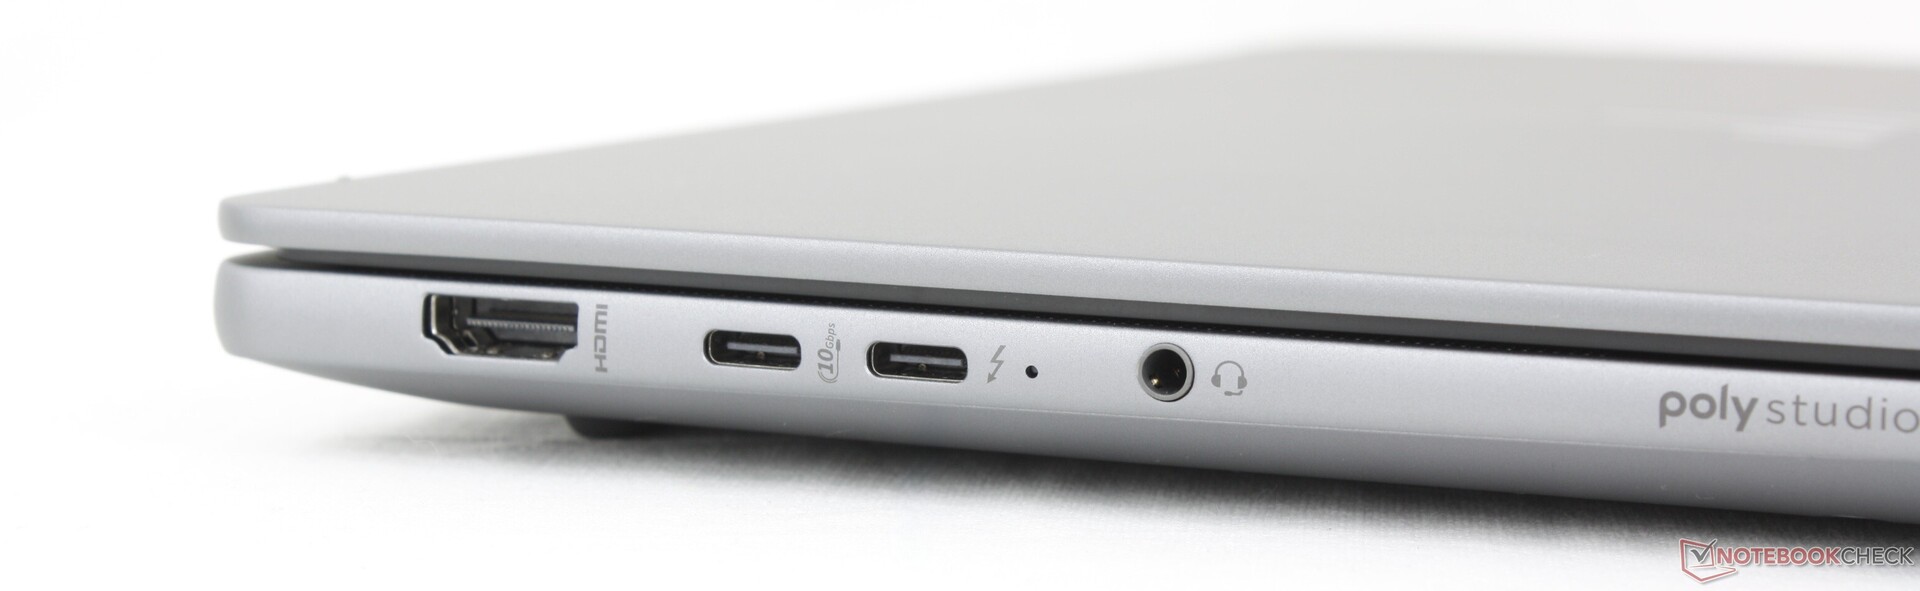
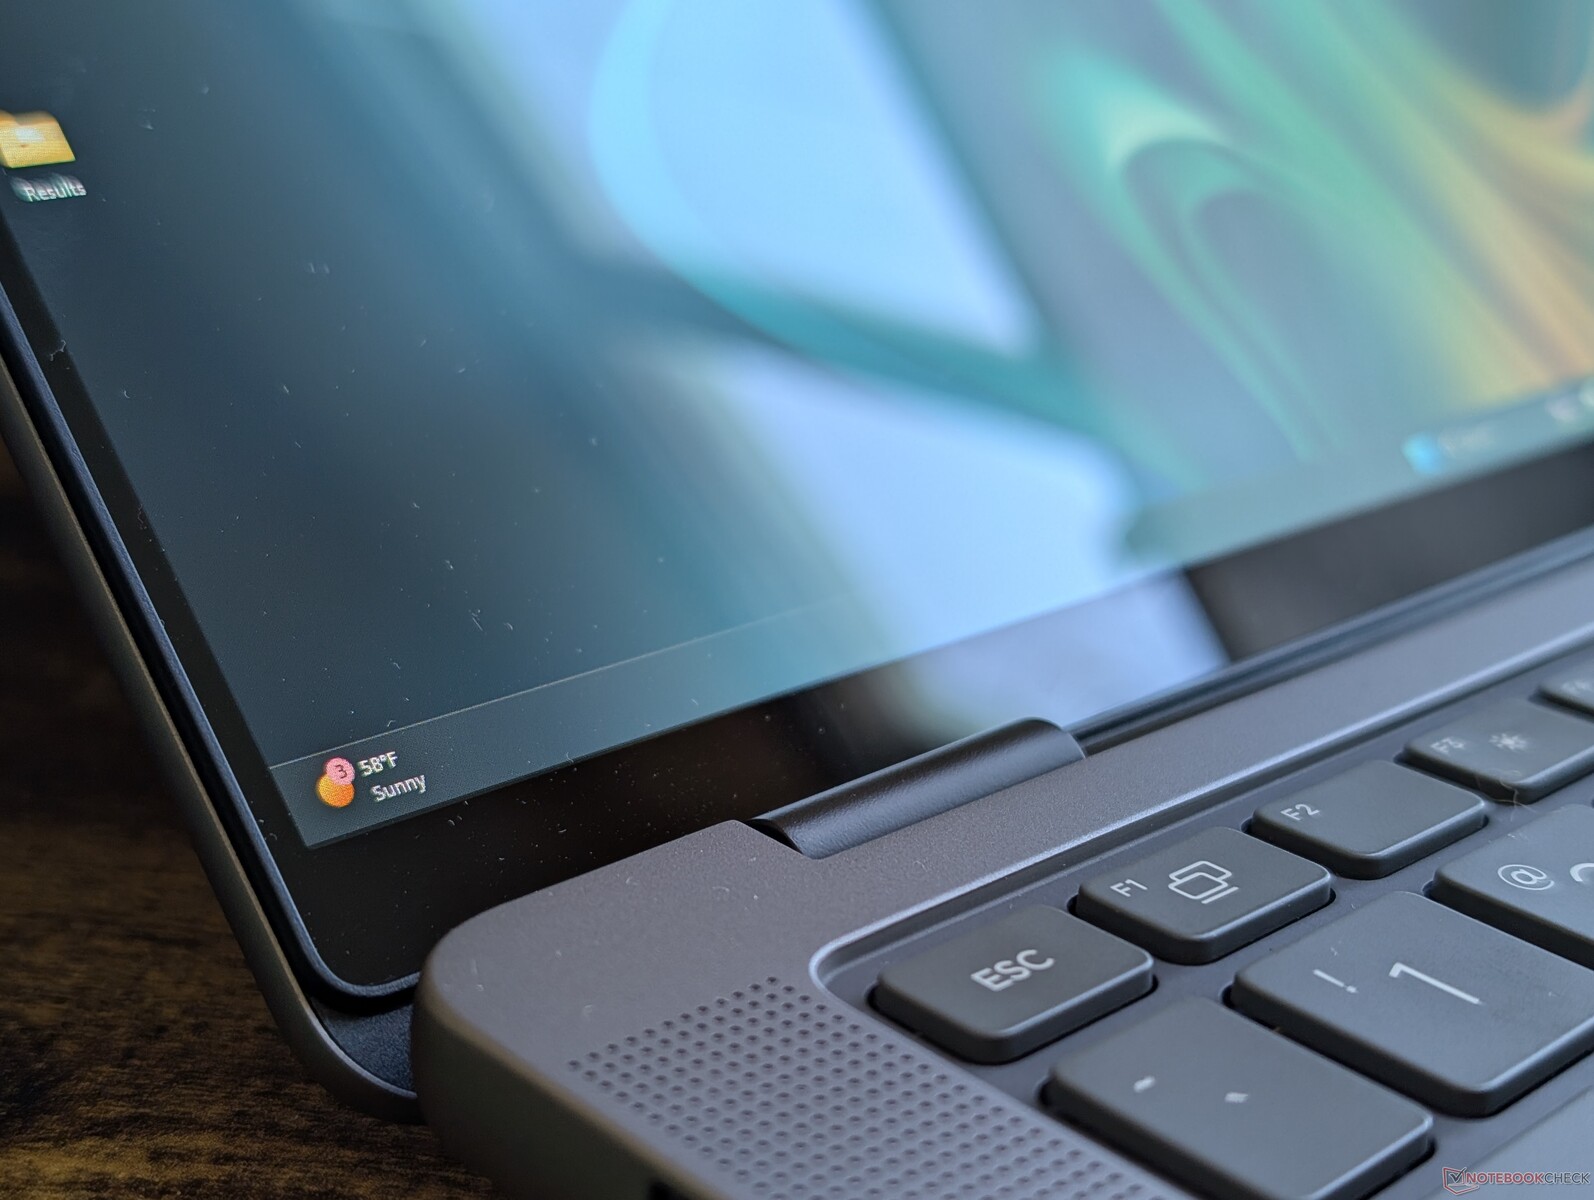
外部功能和尺寸与 EliteBook X G1a 14A 几乎是 1:1。 EliteBook X G1a 14.两款机型甚至共享相同的端口、键盘、点击板尺寸和 Poly Studio 四扬声器。区分 ZBook 机型和 EliteBook 机型最简单的方法可能就是 ZBook 的深灰色调。
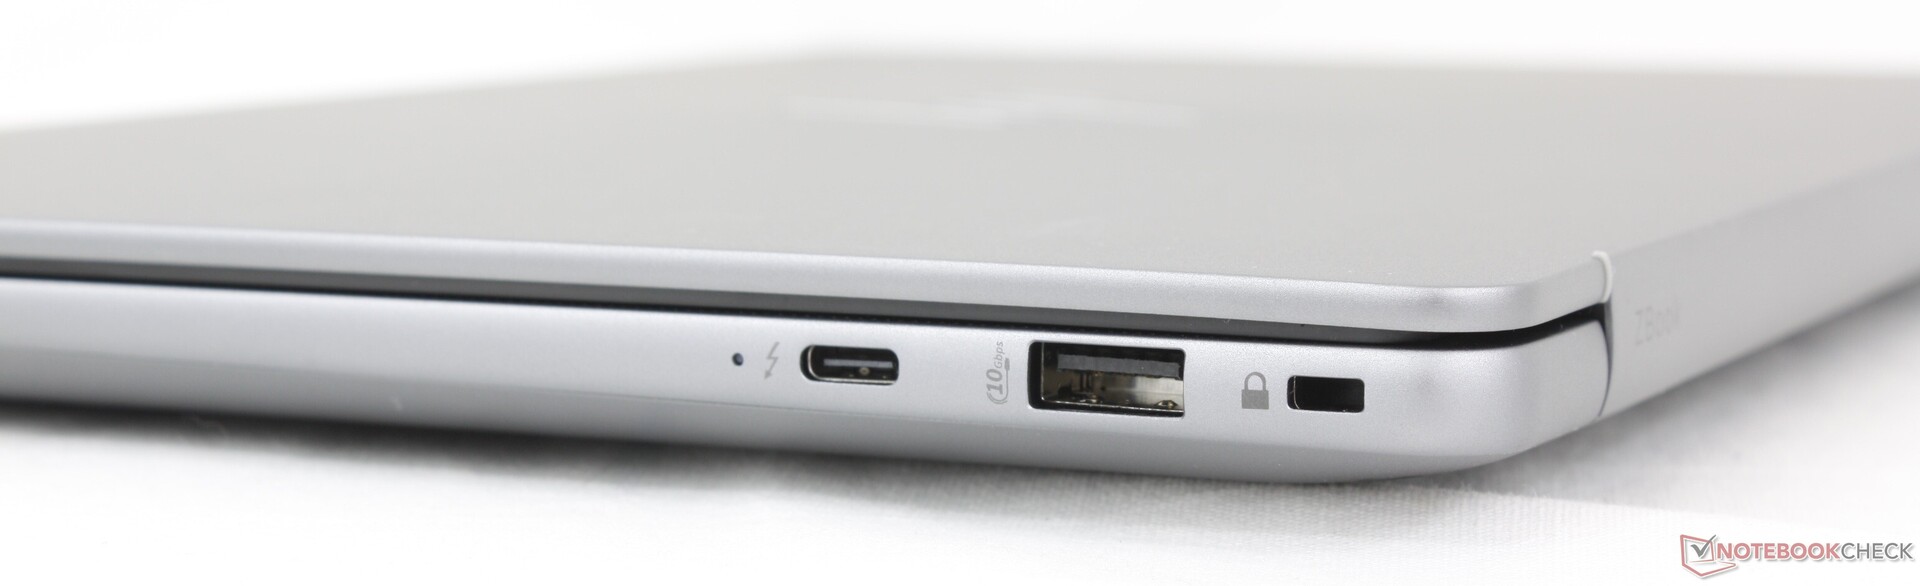
连接性
交流
网络摄像头
标配 500 万像素网络摄像头,带红外和物理快门。


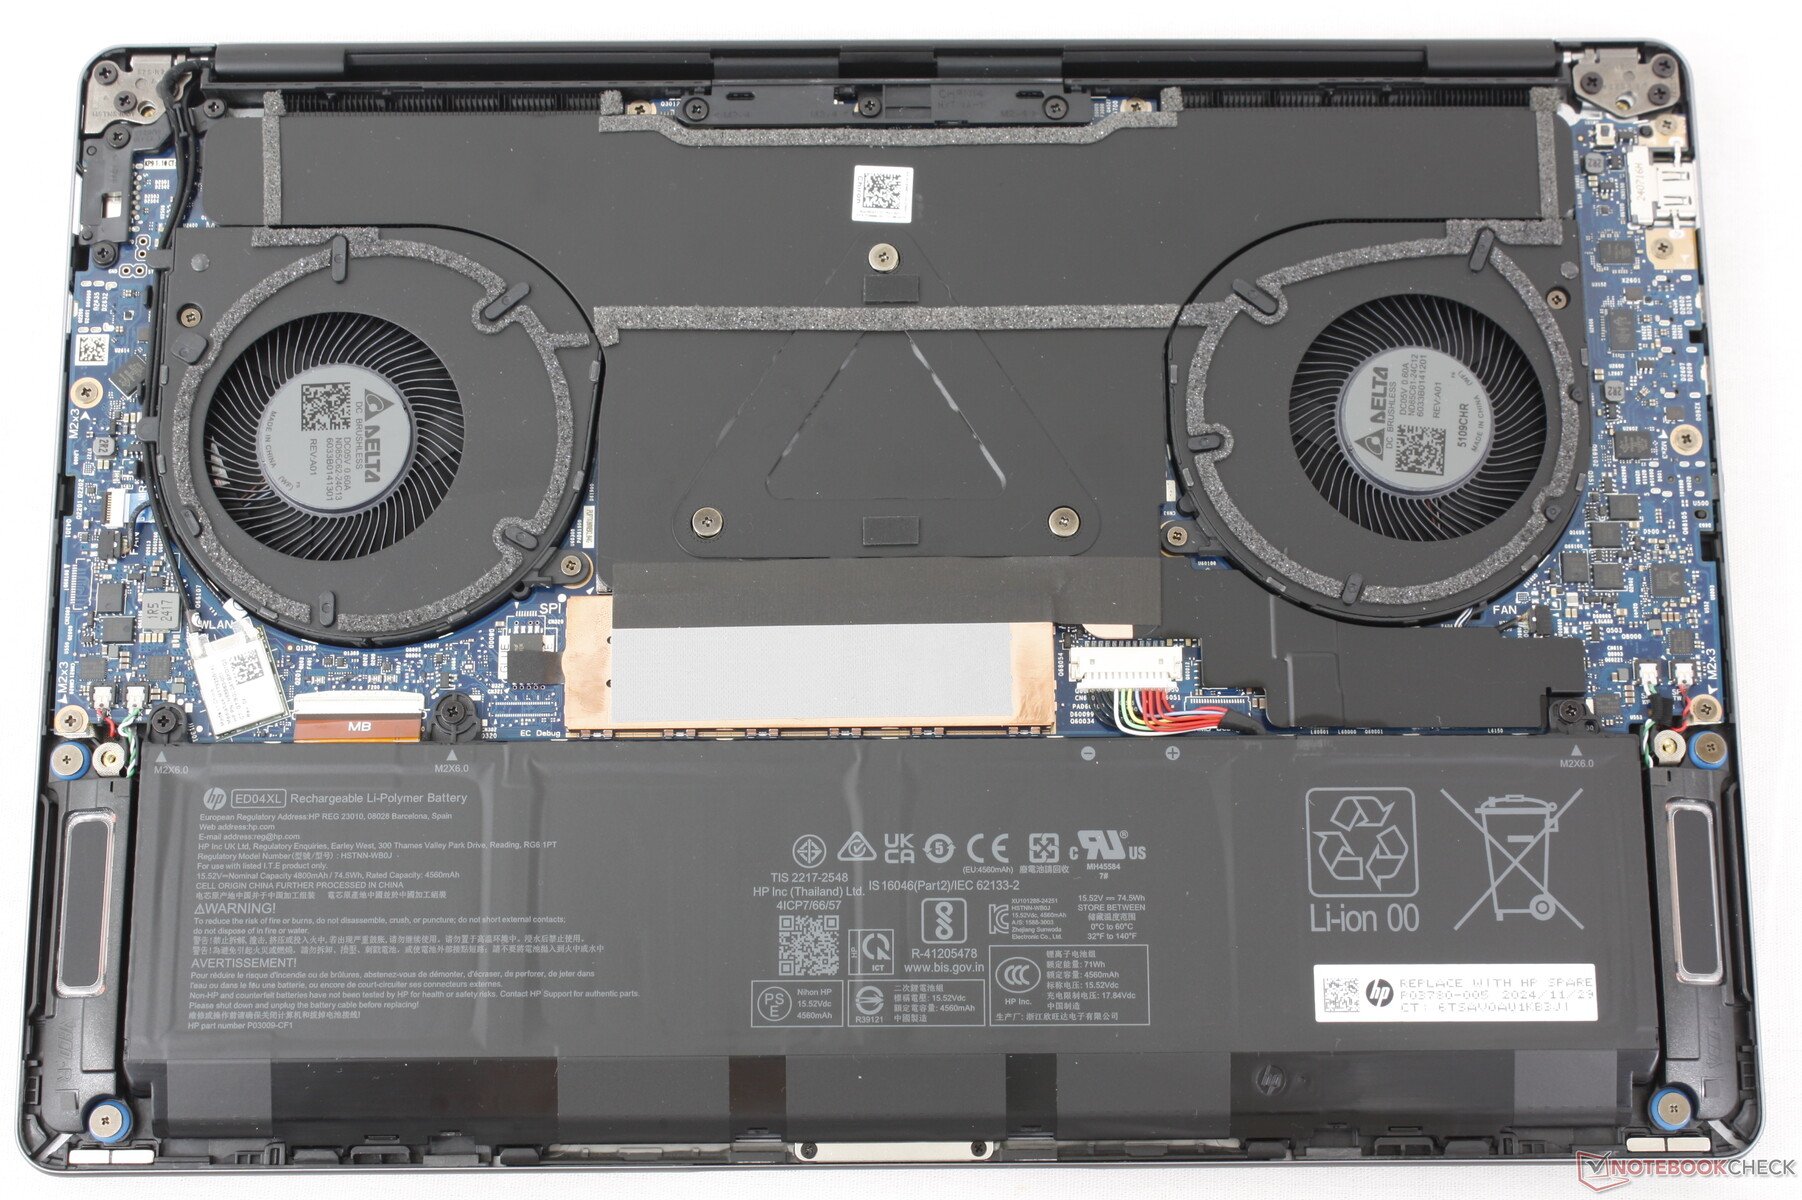
维护
维修时只需从底板上卸下四颗十字螺丝。由于内存和无线局域网是焊接在一起的,因此升级受到限制。没有空间安装第二个固态硬盘。
可持续性
在生产过程中,惠普为该机型的不同组件整合了 80% 的回收铝、65% 的回收塑料、30% 的回收海洋塑料、50% 的回收铜和 20% 的回收烹饪油。同时,惠普的包装也是 100% 的可持续发展材料,只有交流适配器上有一点塑料包装。
配件和保修
零售包装盒内除了交流适配器和文件外,没有任何其他附件。作为一款高端 ZBook 机型,制造商提供三年标准保修。
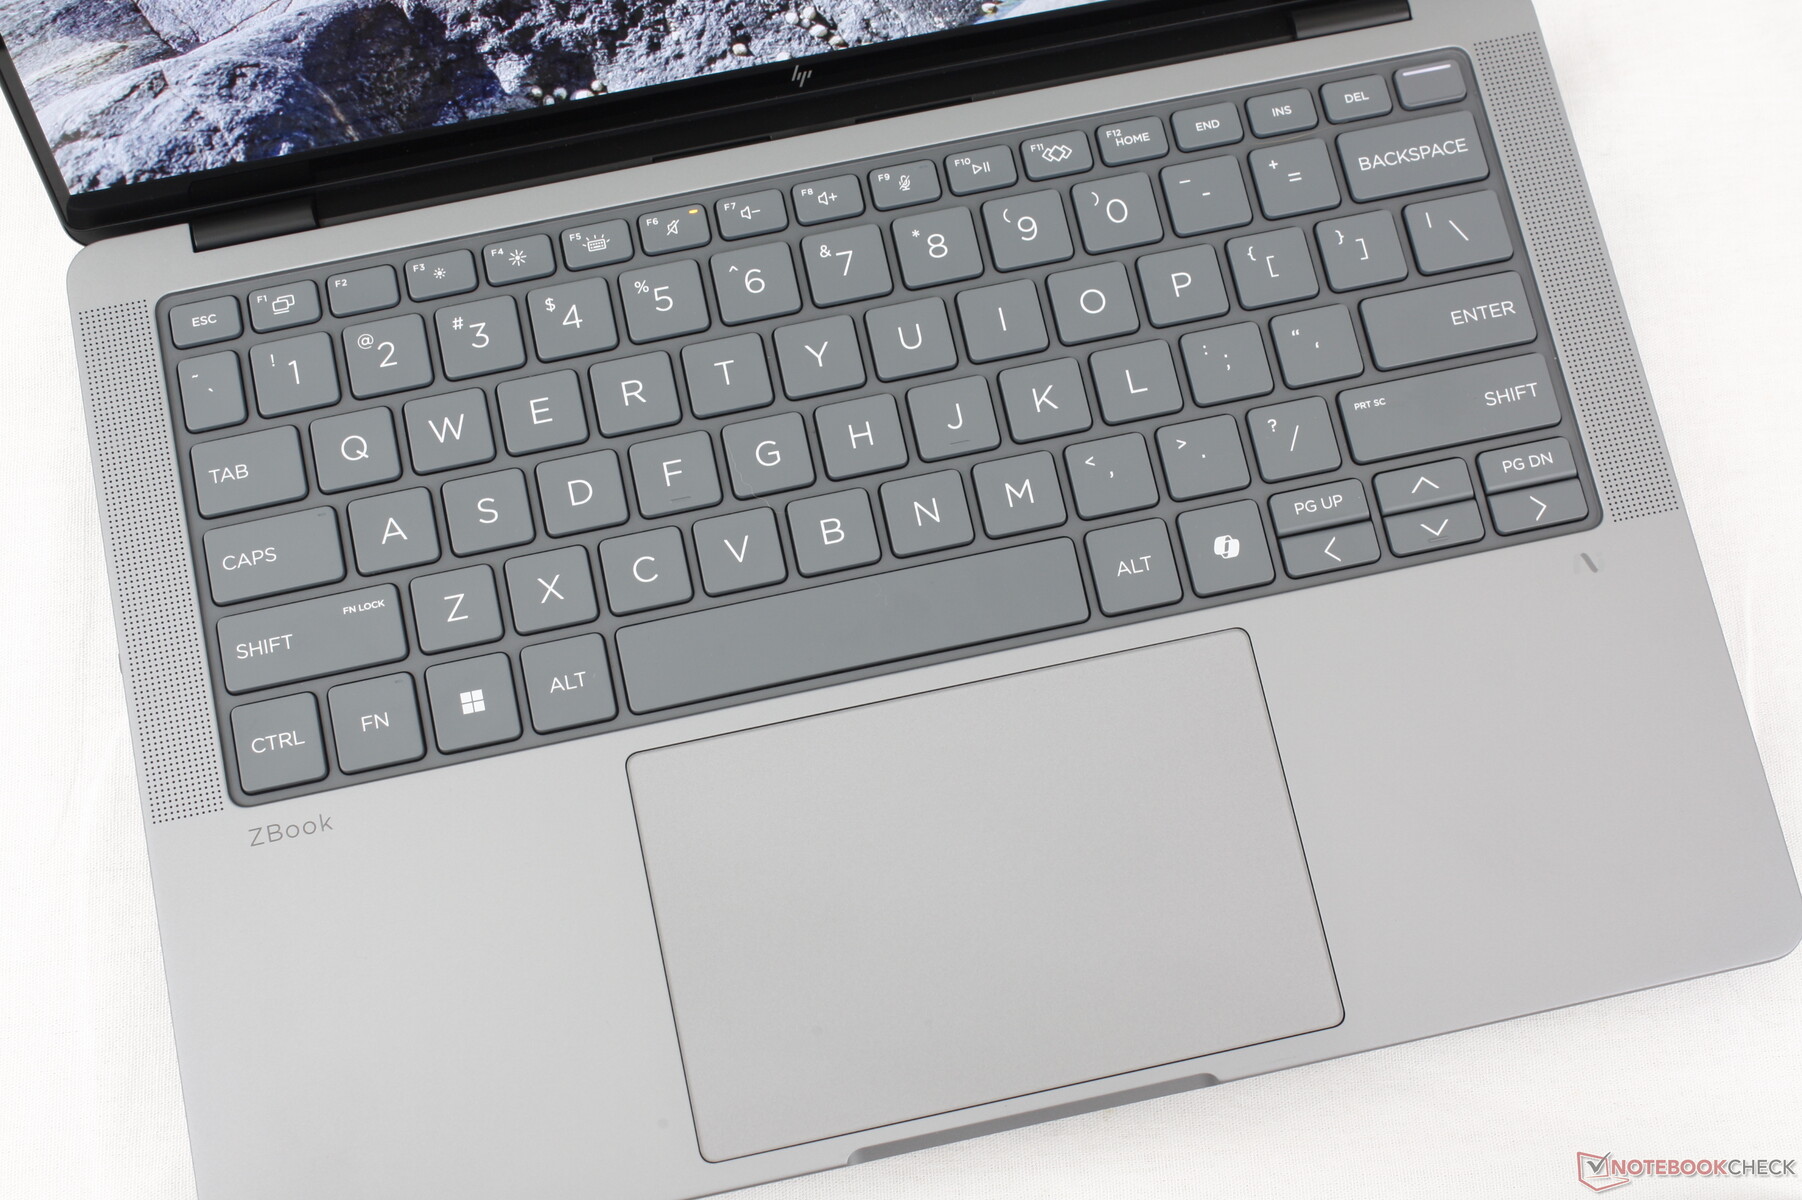
输入设备
键盘和触摸板
输入体验与 EliteBook X G1a 14 相似,这并不是一件坏事,因为我们通常认为惠普 Elite 机型的键盘是所有专业笔记本电脑中最好的。不过,空格键感觉比键盘上的其他按键更软、更安静,而方向键仍然像以前一样拥挤。在原本舒适的布局上,这些都是小瑕疵。
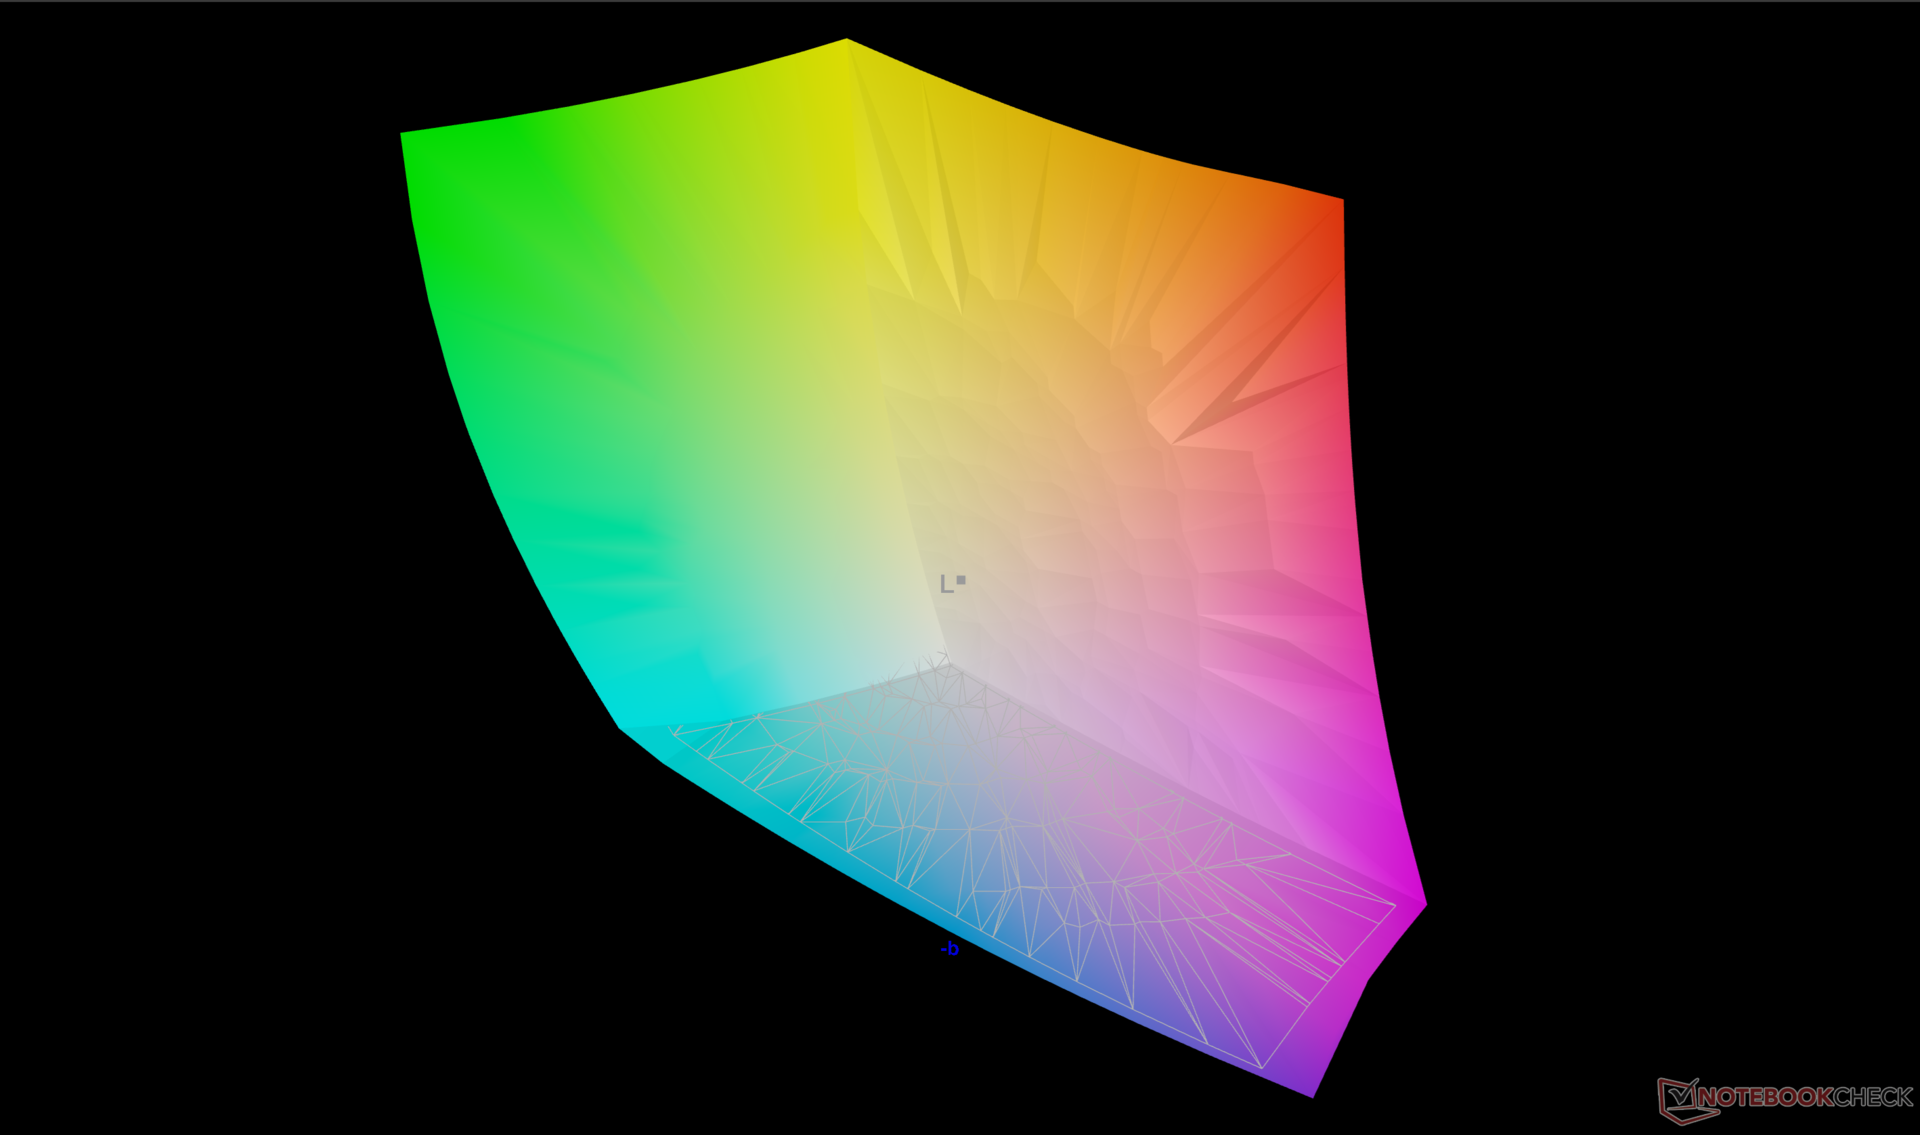
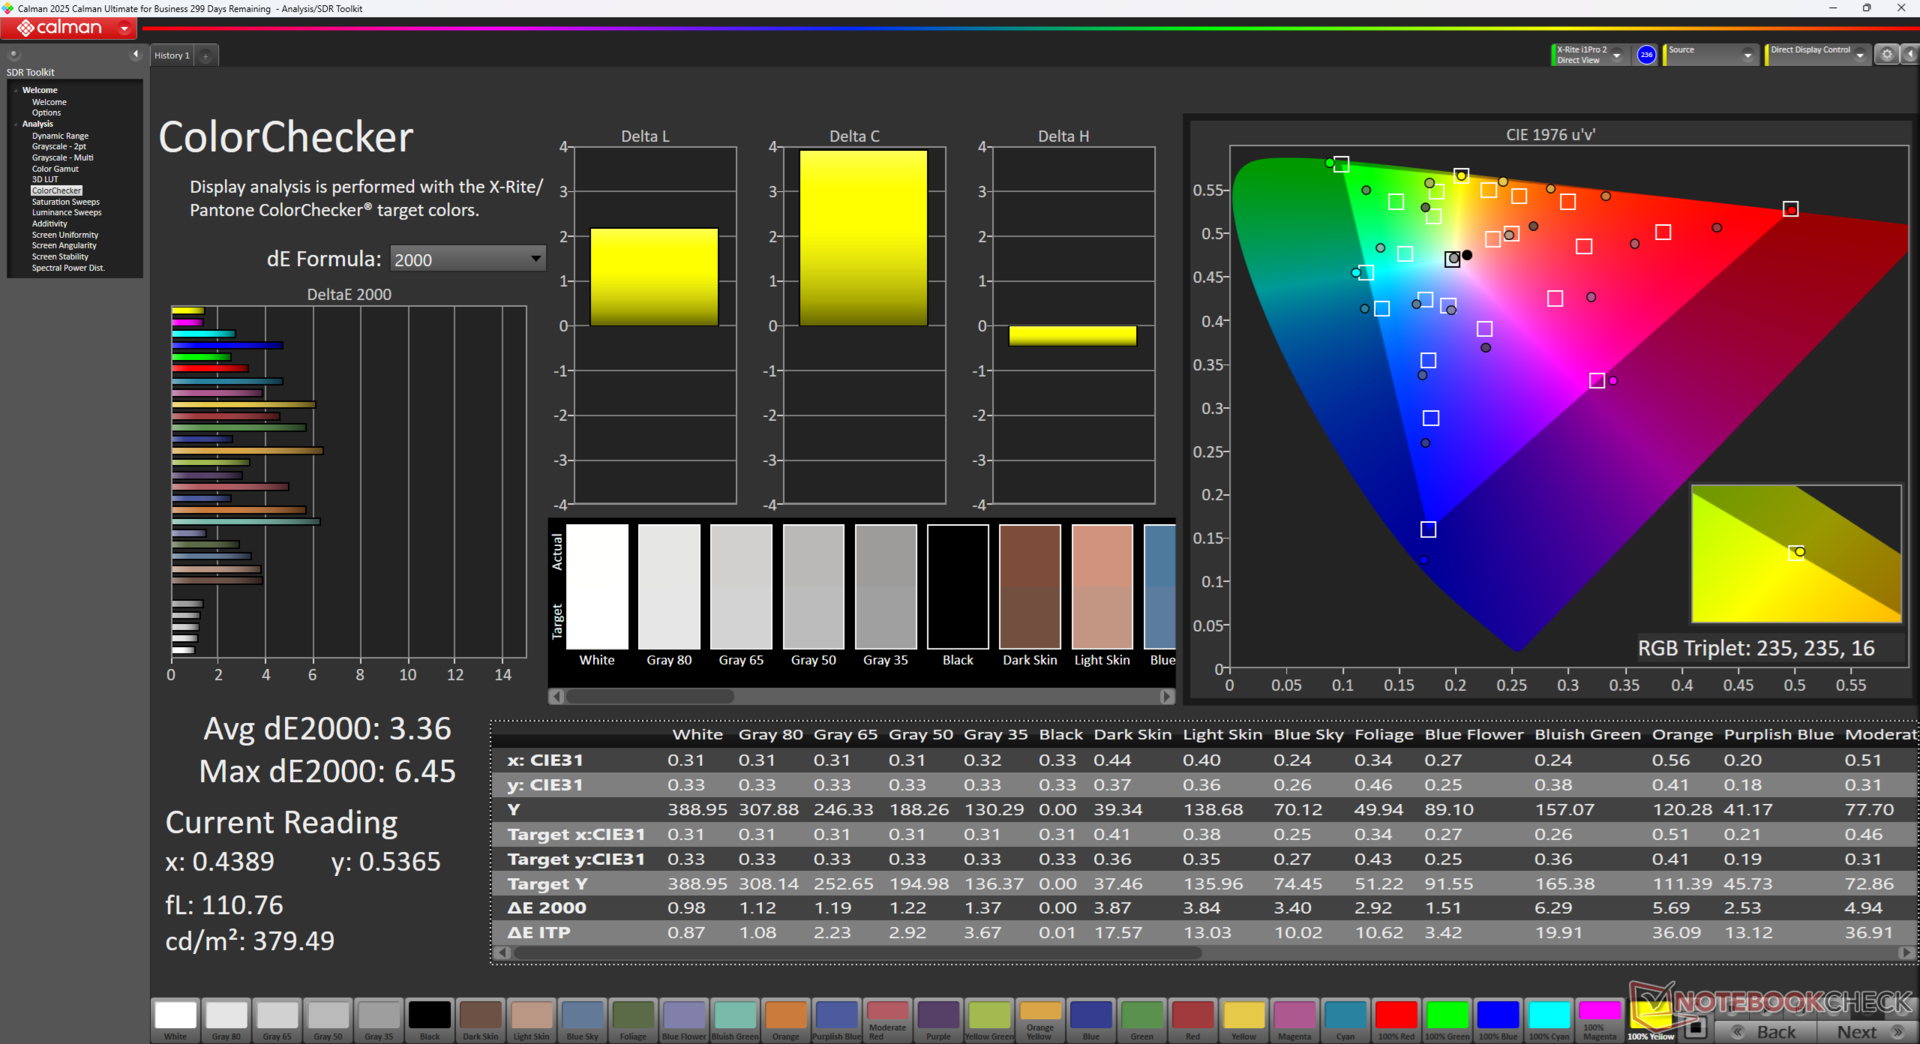
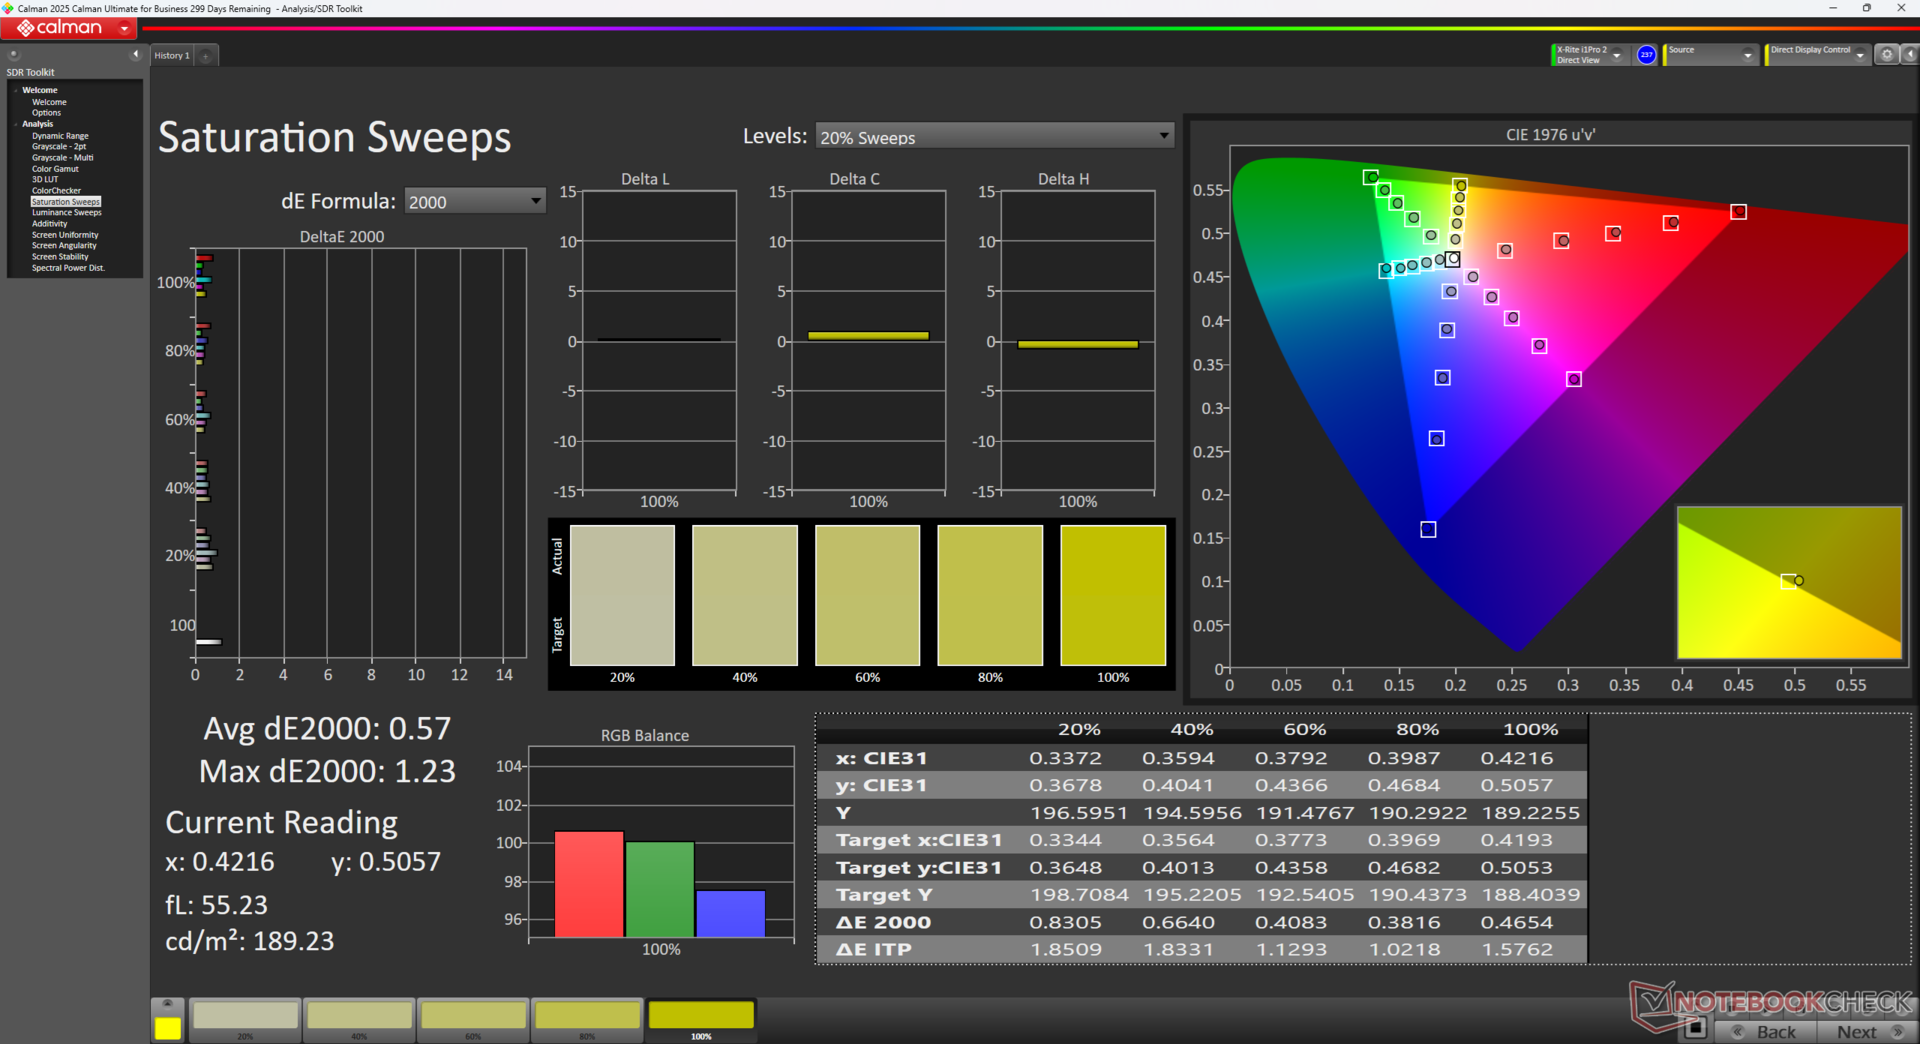
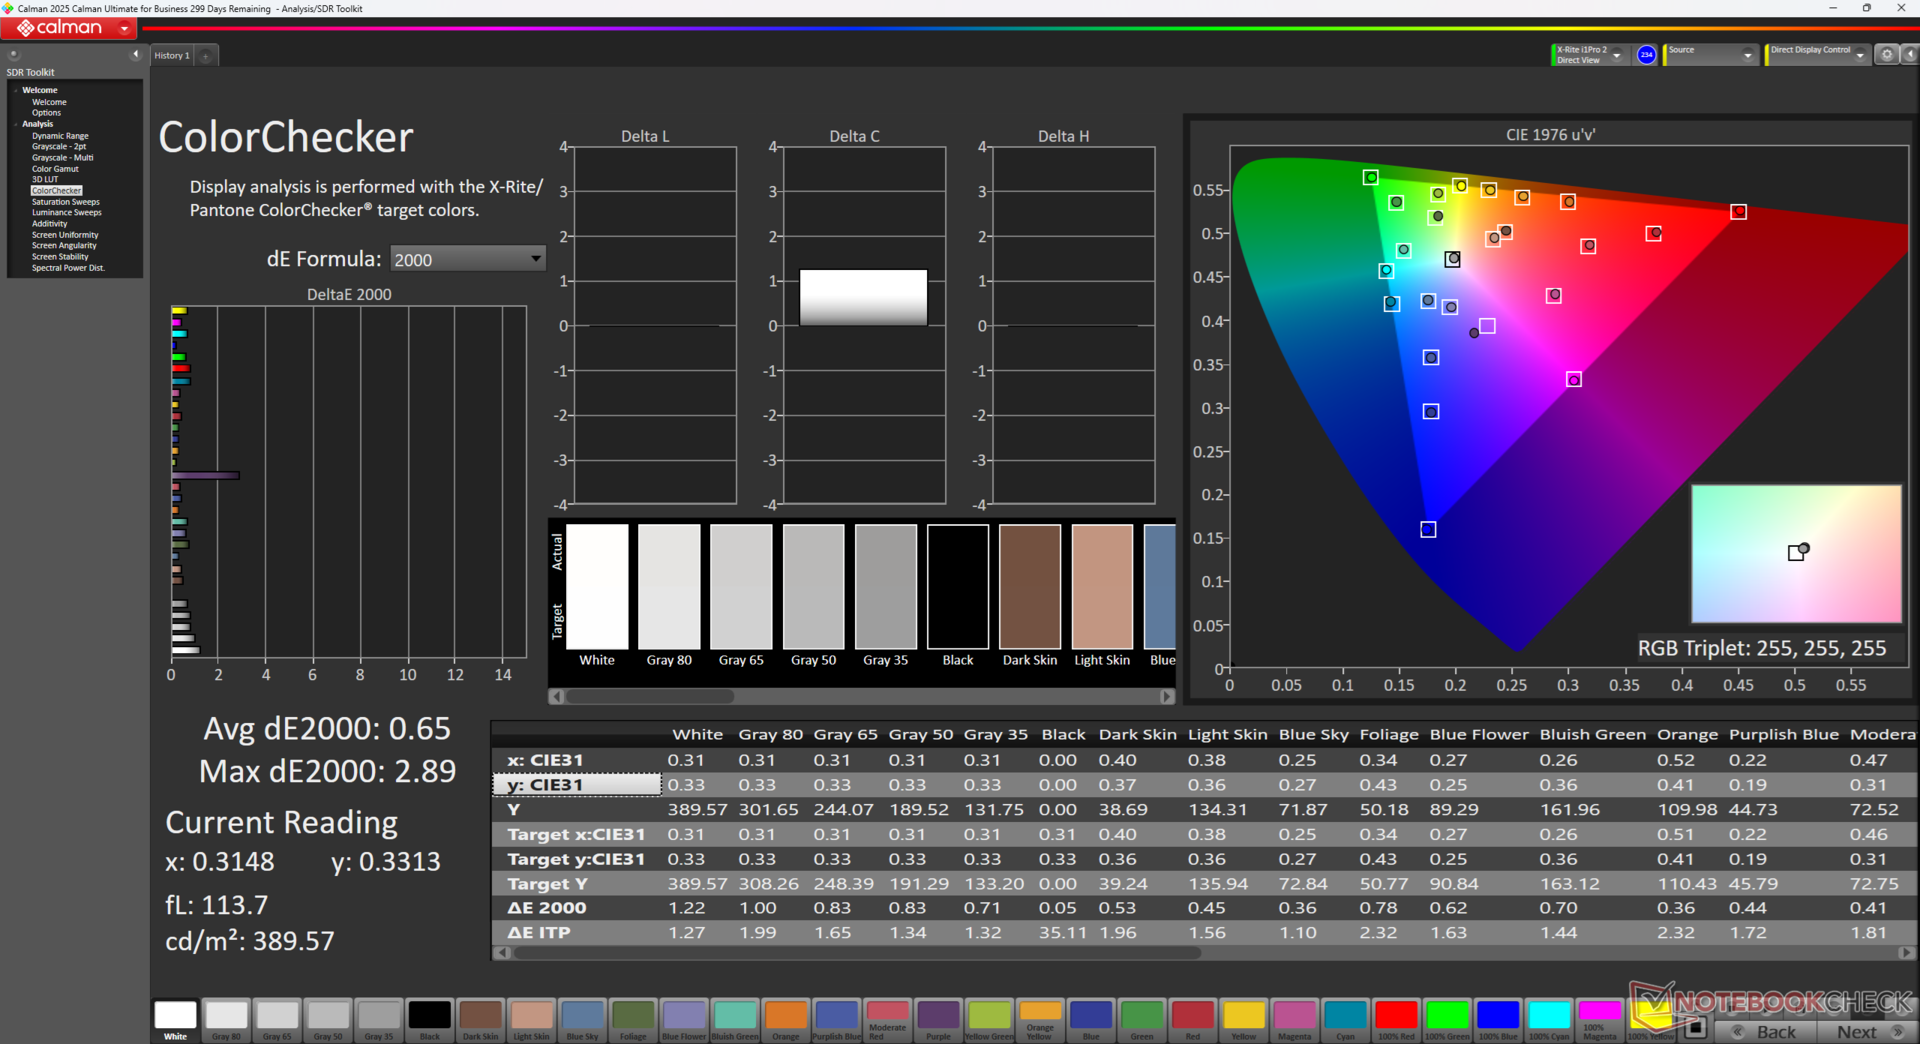
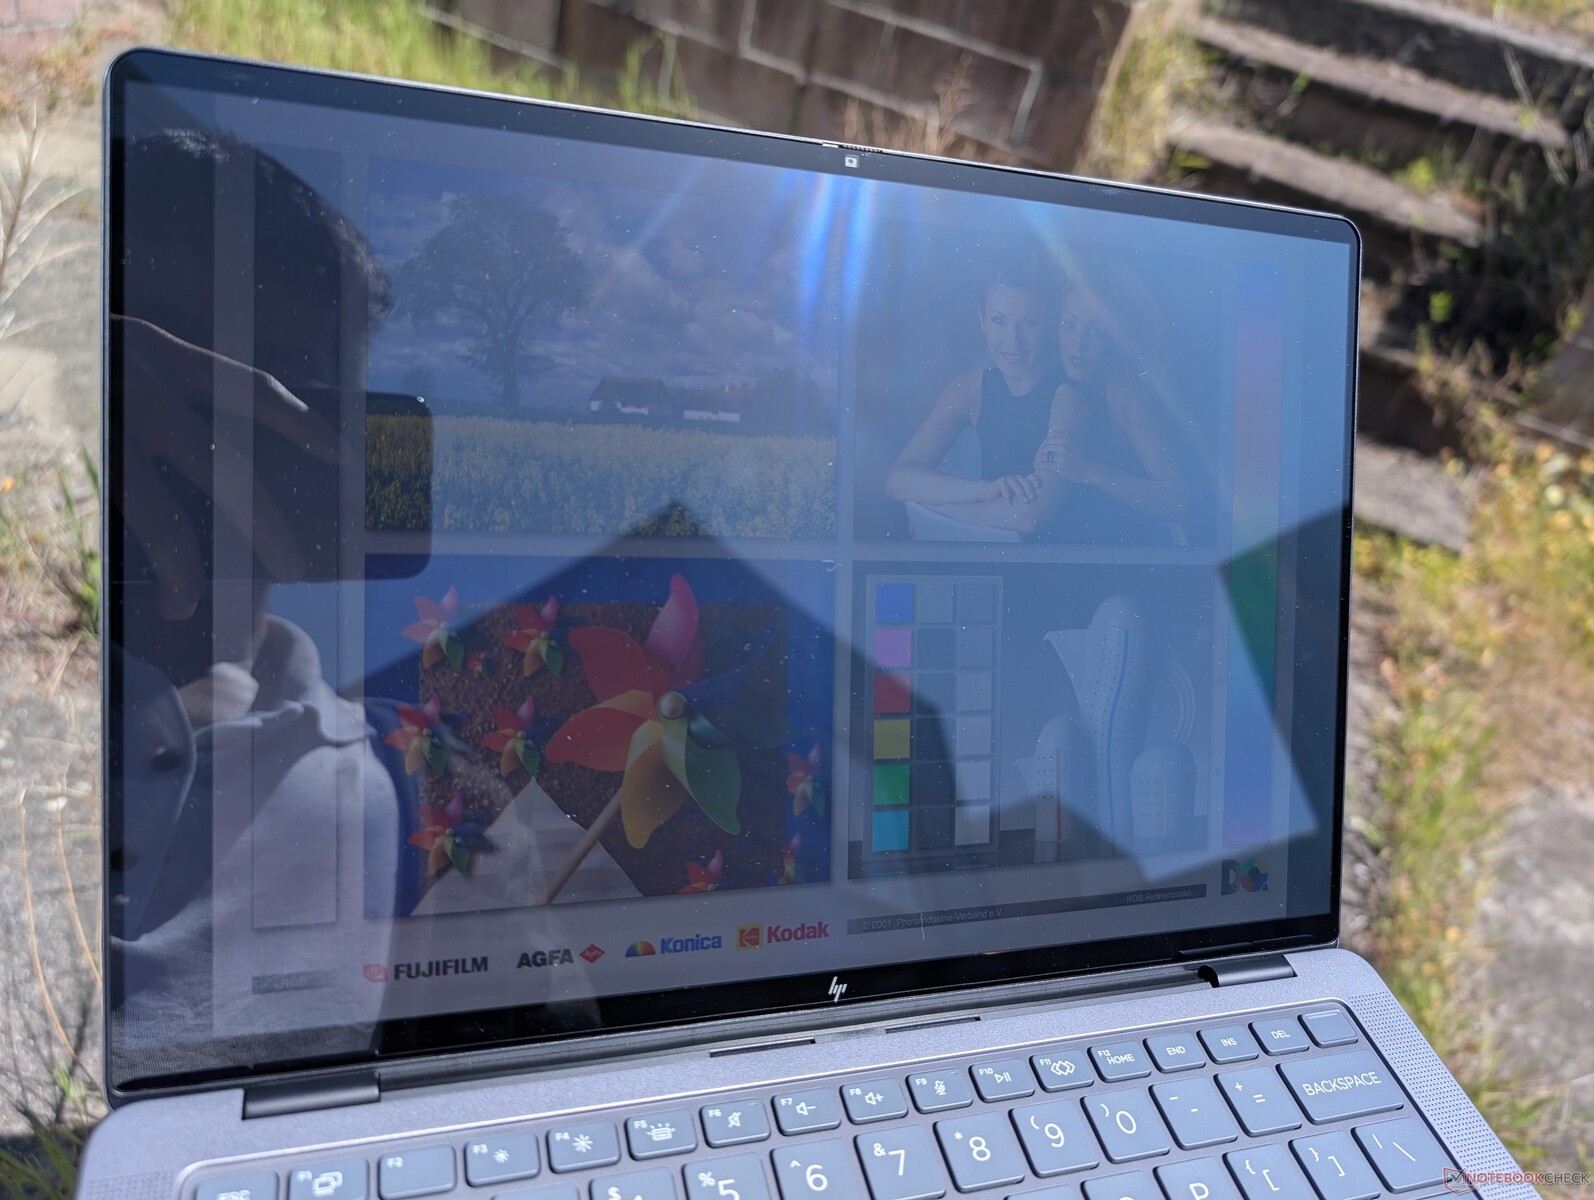
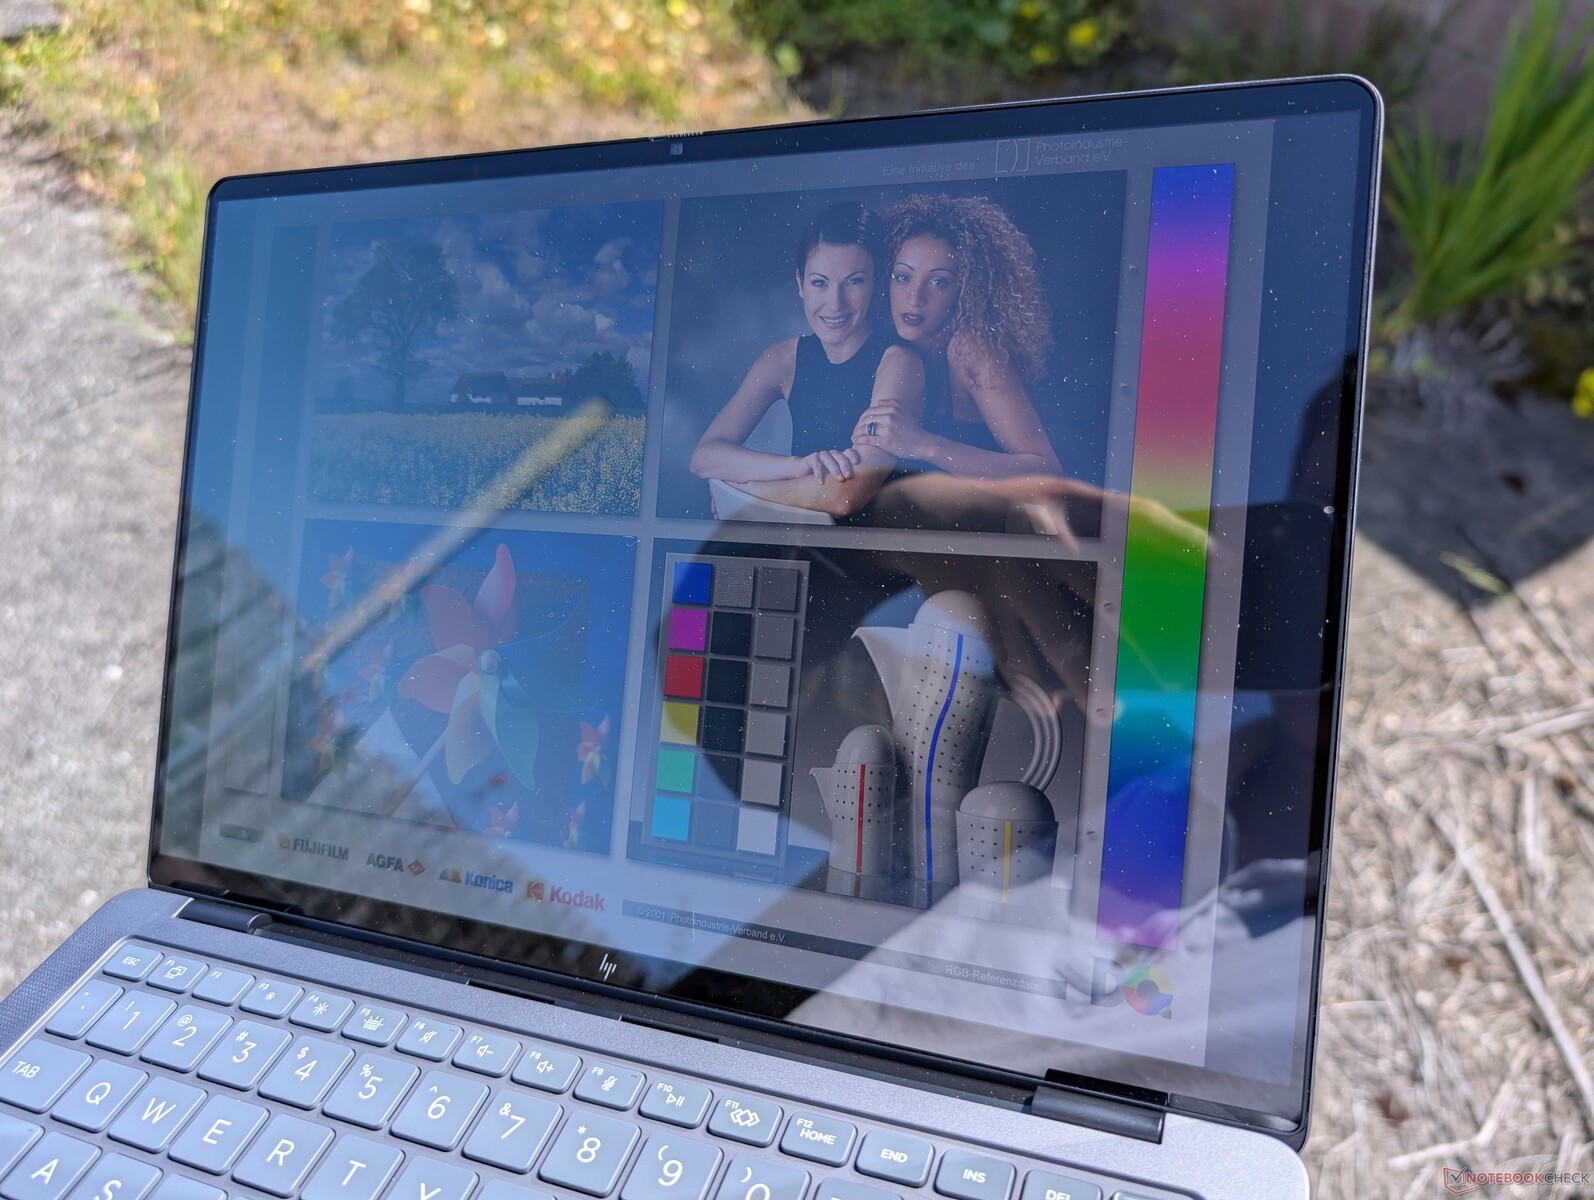
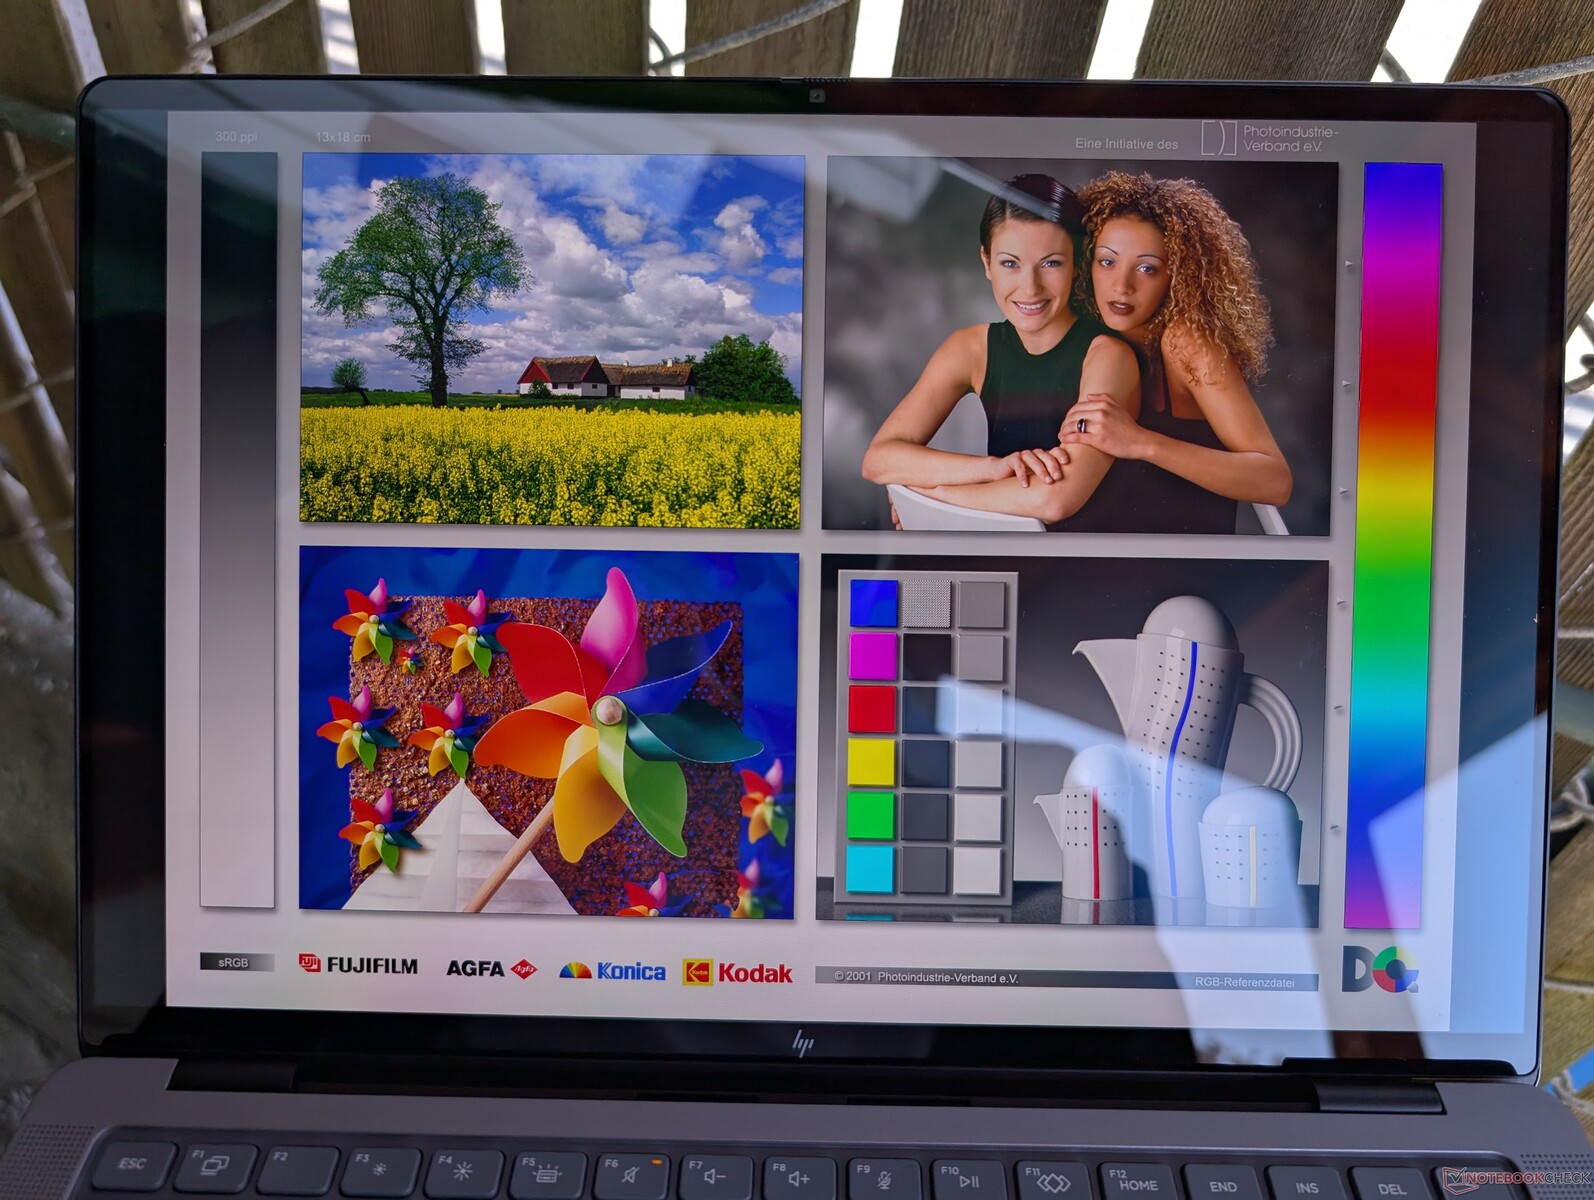
显示屏
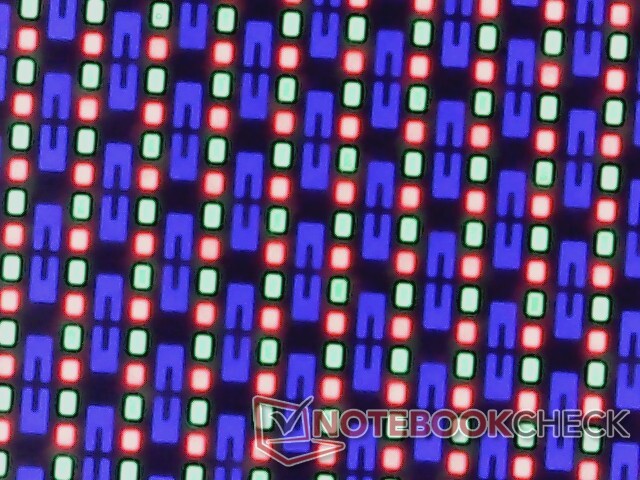
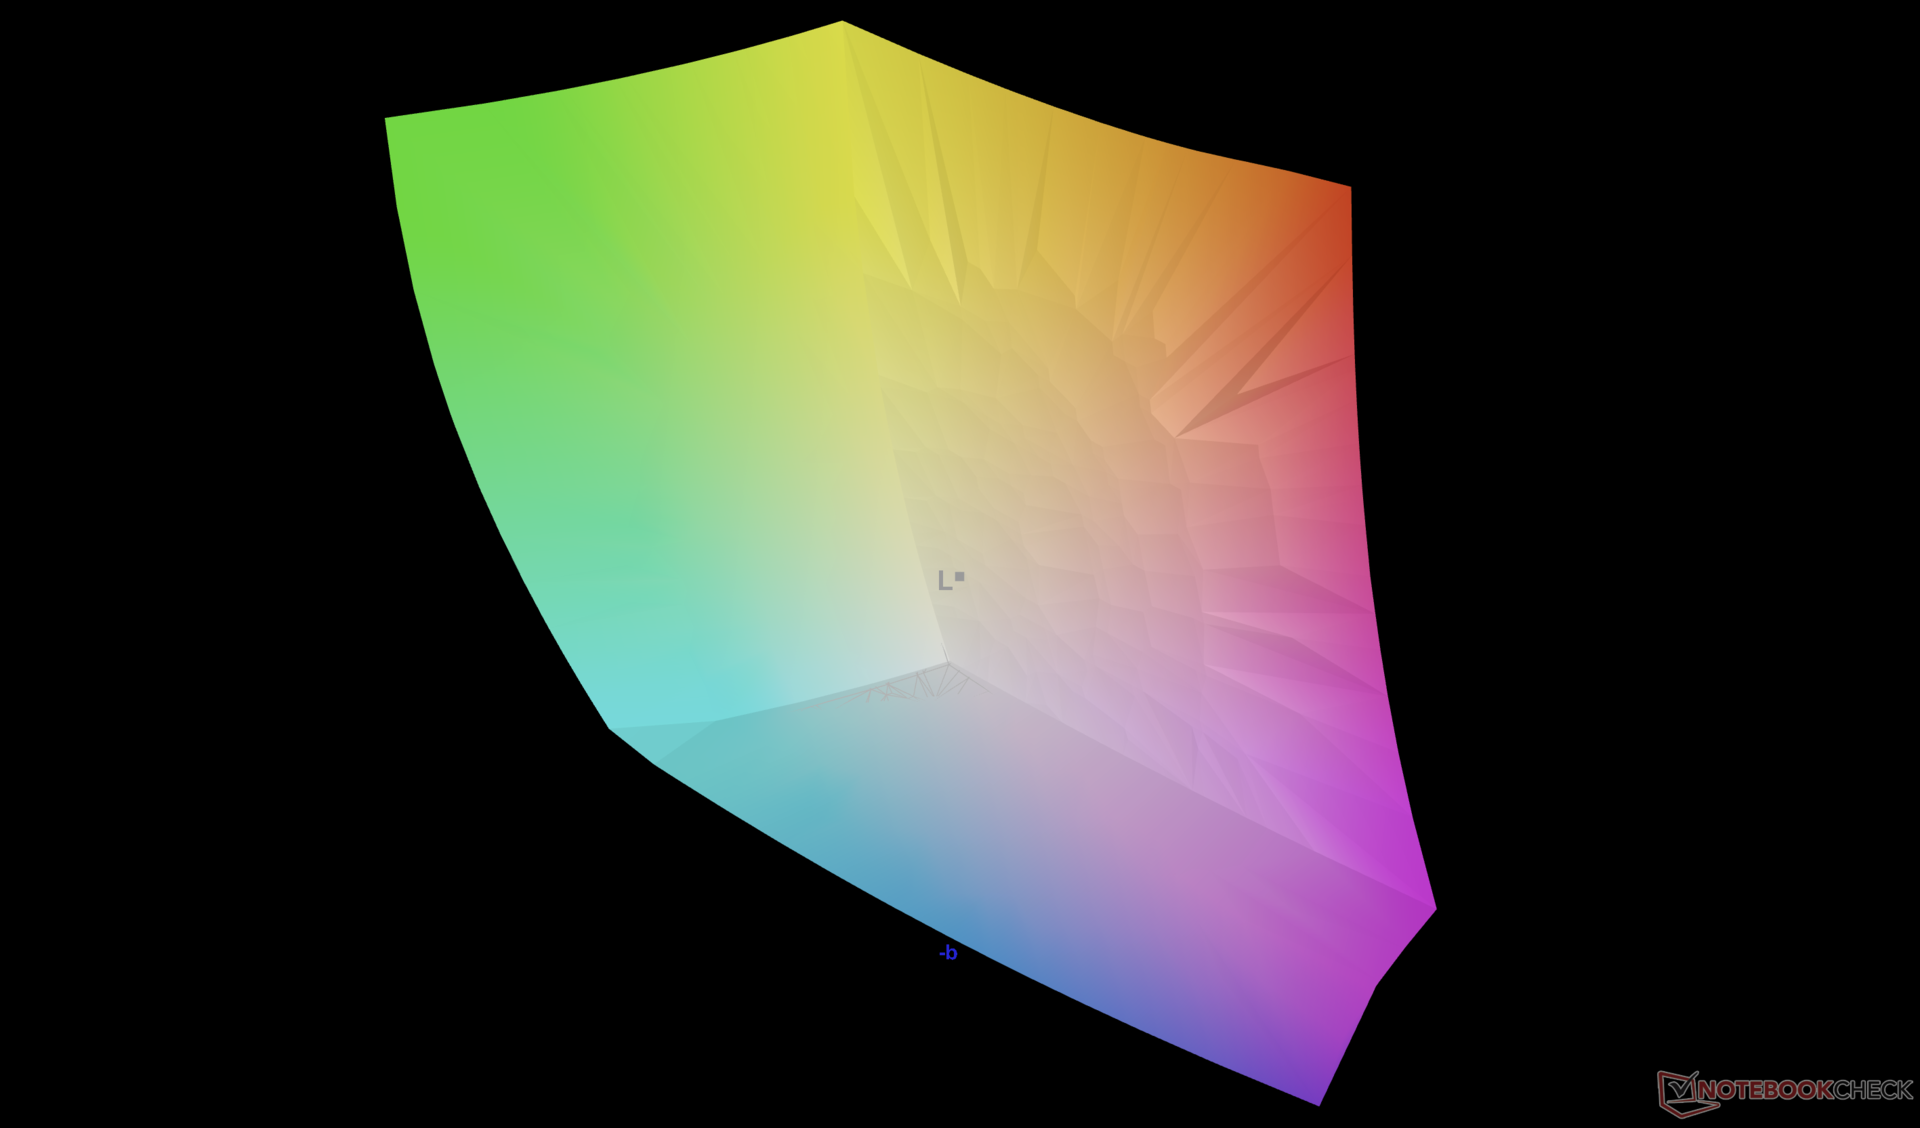
OLED 触摸屏支持 120 Hz 频率,并根据 P3 标准进行了良好的校准。不过,它的亮度并不特别高,最高只有 400 尼特,而 MacBook Pro 14 则超过 600 尼特或 450 尼特。 MacBook Pro 14 或 Book Firefly 14 G11 分别超过 600 尼特或 450 尼特。
不支持 HDR 和自适应同步。
| |||||||||||||||||||||||||
Brightness Distribution: 99 %
Center on Battery: 384.7 cd/m²
Contrast: ∞:1 (Black: 0 cd/m²)
ΔE Color 3.36 | 0.5-29.43 Ø4.87, calibrated: 0.65
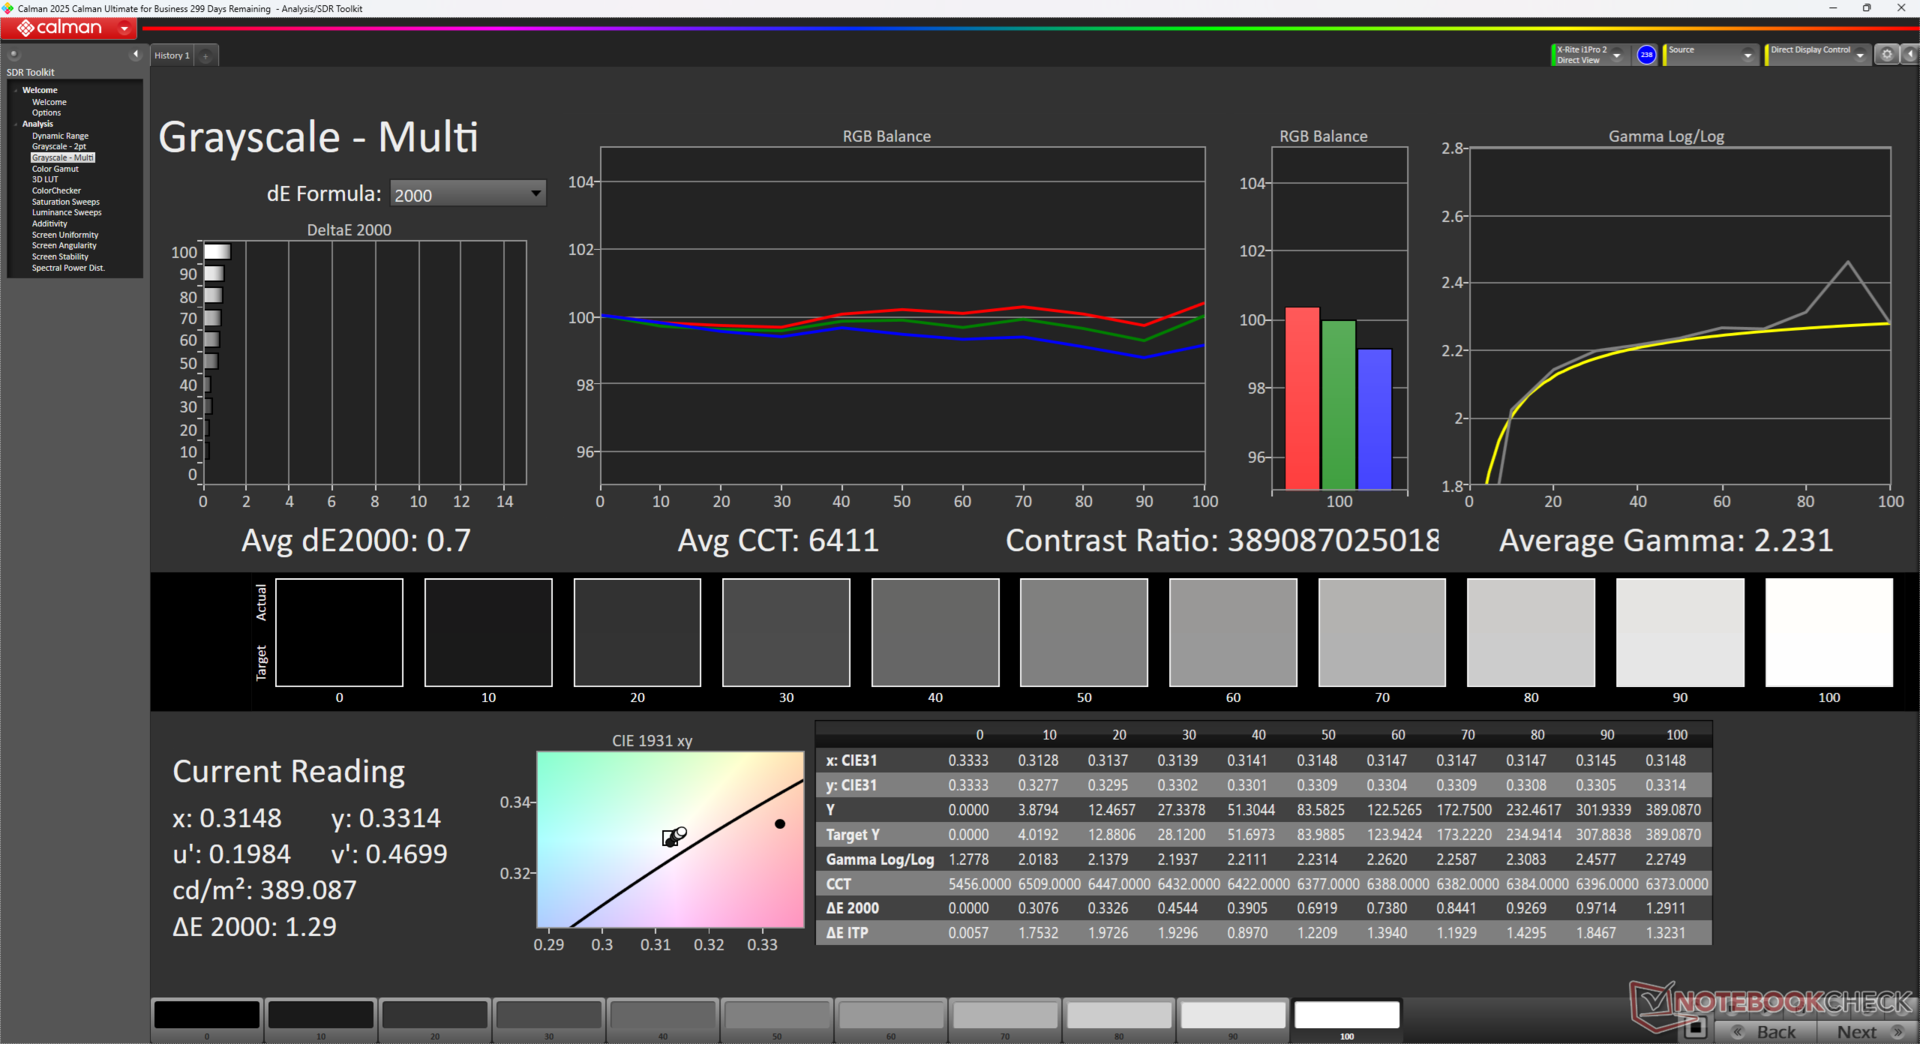
ΔE Greyscale 1 | 0.5-98 Ø5.1
95.6% AdobeRGB 1998 (Argyll 2.2.0 3D)
100% sRGB (Argyll 2.2.0 3D)
99.7% Display P3 (Argyll 2.2.0 3D)
Gamma: 2.26
| HP ZBook Ultra G1a 14 Samsung SDC41B3, OLED, 2880x1800, 14", 120 Hz | HP ZBook Firefly 14 G11 AUO6DA8, IPS, 2560x1600, 14", 120 Hz | Lenovo ThinkPad X1 Carbon Gen 13 21NS0010GE ATNA40YK20-0, OLED, 2880x1800, 14", 120 Hz | Dell Precision 5000 5490 AU Optronics B140QAN, IPS, 2560x1600, 14", 60 Hz | Asus ExpertBook P5 P5405-NZ0102X NE140QDM-NX4, IPS LED, 2560x1600, 14", 144 Hz | Apple MacBook Pro 14 2024 M4 Pro MiniLED, 3024x1964, 14.2", 120 Hz | |
|---|---|---|---|---|---|---|
| Display | -3% | 1% | -12% | -19% | -2% | |
| Display P3 Coverage | 99.7 | 98.9 -1% | 99.5 0% | 79.7 -20% | 70.8 -29% | 99.6 0% |
| sRGB Coverage | 100 | 99.9 0% | 100 0% | 100 0% | 98 -2% | 100 0% |
| AdobeRGB 1998 Coverage | 95.6 | 86.6 -9% | 97.1 2% | 79.5 -17% | 71.6 -25% | 89 -7% |
| Response Times | -966% | -98% | -4331% | -2990% | -4060% | |
| Response Time Grey 50% / Grey 80% * | 0.94 ? | 12.3 ? -1209% | 2.4 ? -155% | 52.3 ? -5464% | 36.3 ? -3762% | 77.2 ? -8113% |
| Response Time Black / White * | 1.01 ? | 8.3 ? -722% | 1.9 ? -88% | 33.3 ? -3197% | 23.4 ? -2217% | 71.6 ? -6989% |
| PWM Frequency | 492.6 | 240 ? -51% | 14880 ? 2921% | |||
| Screen | 20% | -118% | -2% | -97% | 50% | |
| Brightness middle | 384.7 | 554.1 44% | 407 6% | 485.1 26% | 457 19% | 638 66% |
| Brightness | 387 | 540 40% | 410 6% | 471 22% | 457 18% | 621 60% |
| Brightness Distribution | 99 | 93 -6% | 99 0% | 90 -9% | 95 -4% | 95 -4% |
| Black Level * | 0.58 | 0.38 | 0.12 | |||
| Colorchecker dE 2000 * | 3.36 | 2.54 24% | 4.9 -46% | 2.15 36% | 4.9 -46% | 0.6 82% |
| Colorchecker dE 2000 max. * | 6.45 | 4.99 23% | 9.1 -41% | 5.39 16% | 8.5 -32% | 1.4 78% |
| Colorchecker dE 2000 calibrated * | 0.65 | 0.56 14% | 4.7 -623% | 0.67 -3% | 1.7 -162% | |
| Greyscale dE 2000 * | 1 | 1 -0% | 2.3 -130% | 2 -100% | 5.7 -470% | 0.8 20% |
| Gamma | 2.26 97% | 2.3 96% | 2.26 97% | 2.3 96% | 2.25 98% | 2.22 99% |
| CCT | 6380 102% | 6556 99% | 6310 103% | 6826 95% | 7647 85% | 6430 101% |
| Contrast | 955 | 1277 | 3808 | |||
| Total Average (Program / Settings) | -316% /
-150% | -72% /
-86% | -1448% /
-726% | -1035% /
-559% | -1337% /
-991% |
* ... smaller is better


Display Response Times
| ↔ Response Time Black to White | ||
|---|---|---|
| 1.01 ms ... rise ↗ and fall ↘ combined | ↗ 0.46 ms rise | 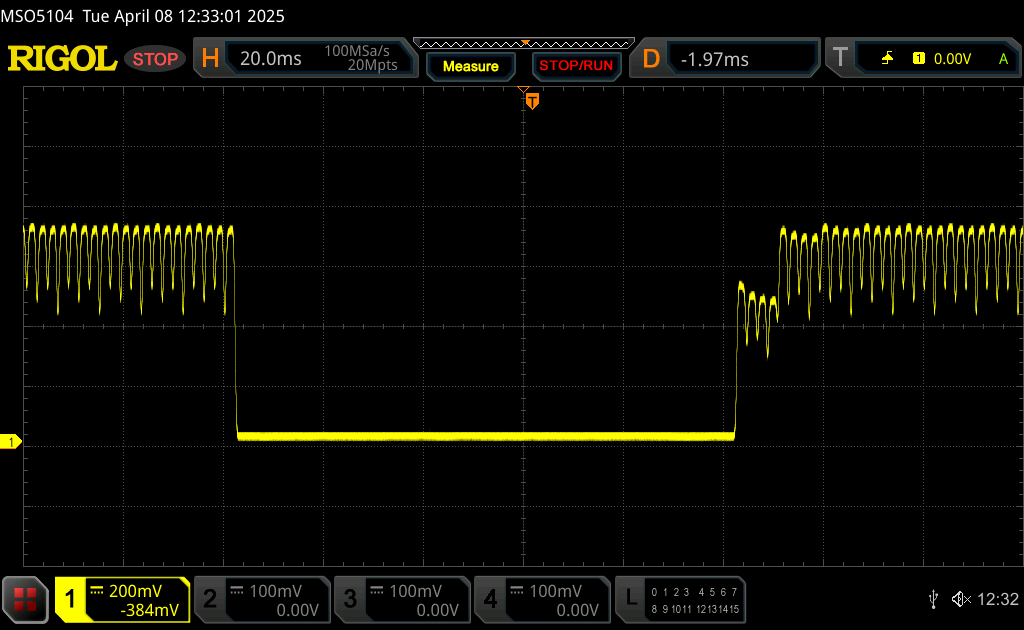 |
| ↘ 0.55 ms fall | ||
| The screen shows very fast response rates in our tests and should be very well suited for fast-paced gaming. In comparison, all tested devices range from 0.1 (minimum) to 240 (maximum) ms. » 2 % of all devices are better. This means that the measured response time is better than the average of all tested devices (20.8 ms). | ||
| ↔ Response Time 50% Grey to 80% Grey | ||
| 0.94 ms ... rise ↗ and fall ↘ combined | ↗ 0.53 ms rise | 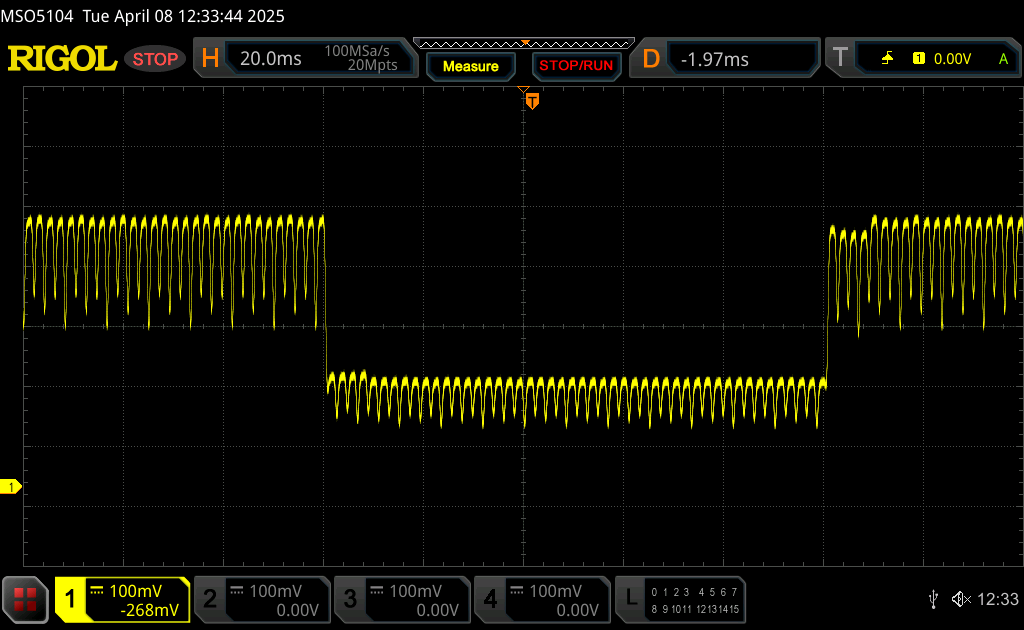 |
| ↘ 0.41 ms fall | ||
| The screen shows very fast response rates in our tests and should be very well suited for fast-paced gaming. In comparison, all tested devices range from 0.165 (minimum) to 636 (maximum) ms. » 2 % of all devices are better. This means that the measured response time is better than the average of all tested devices (32.5 ms). | ||
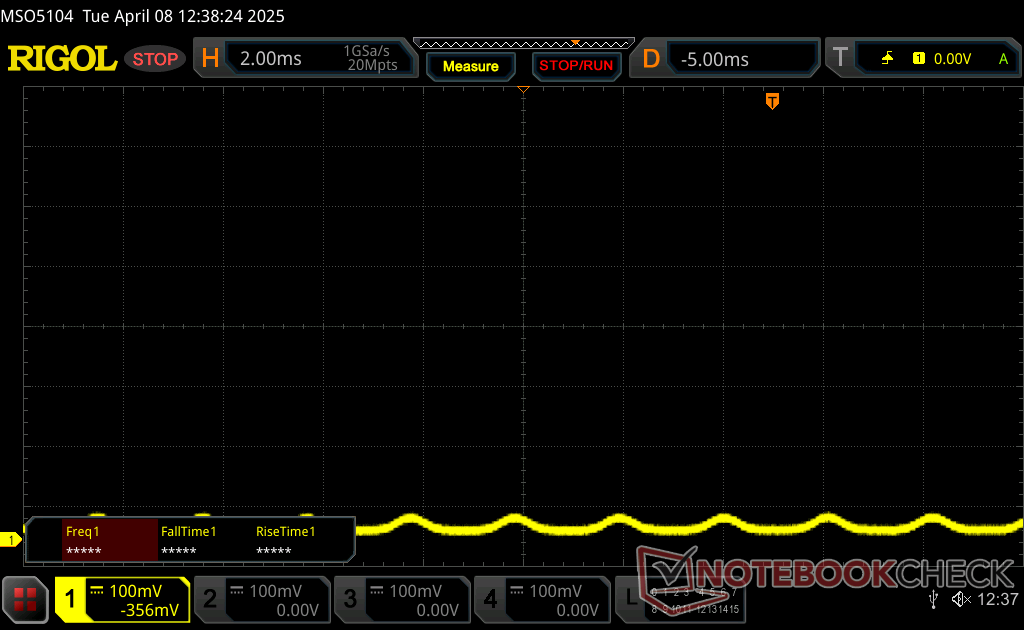
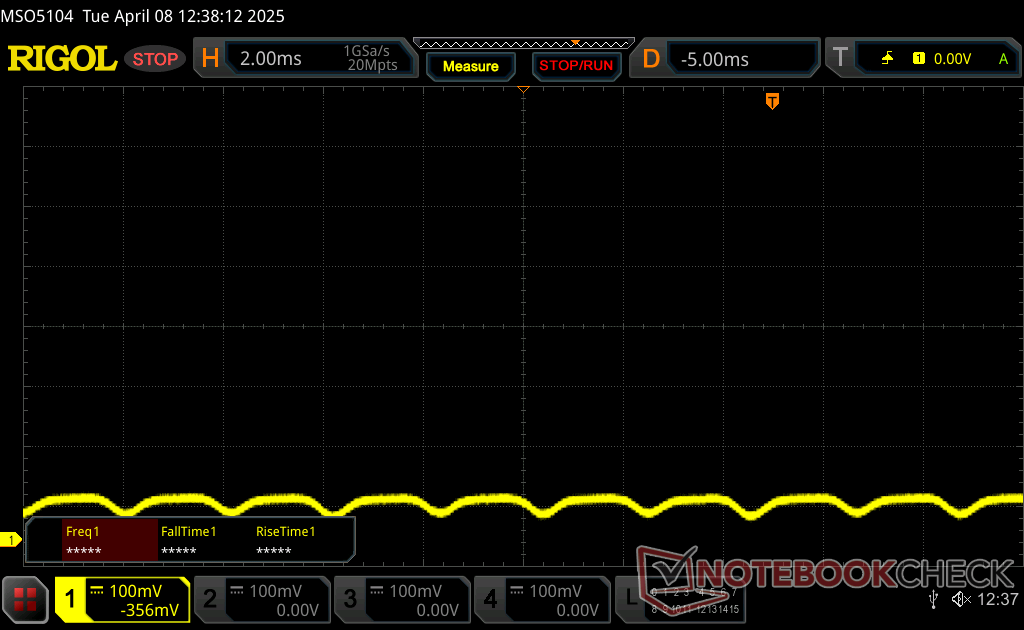
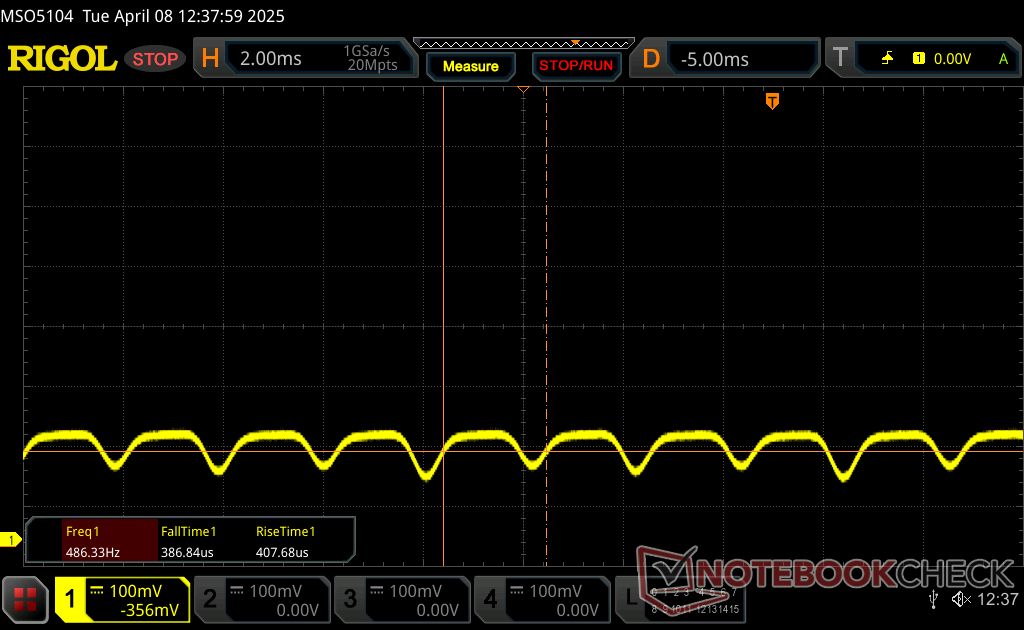
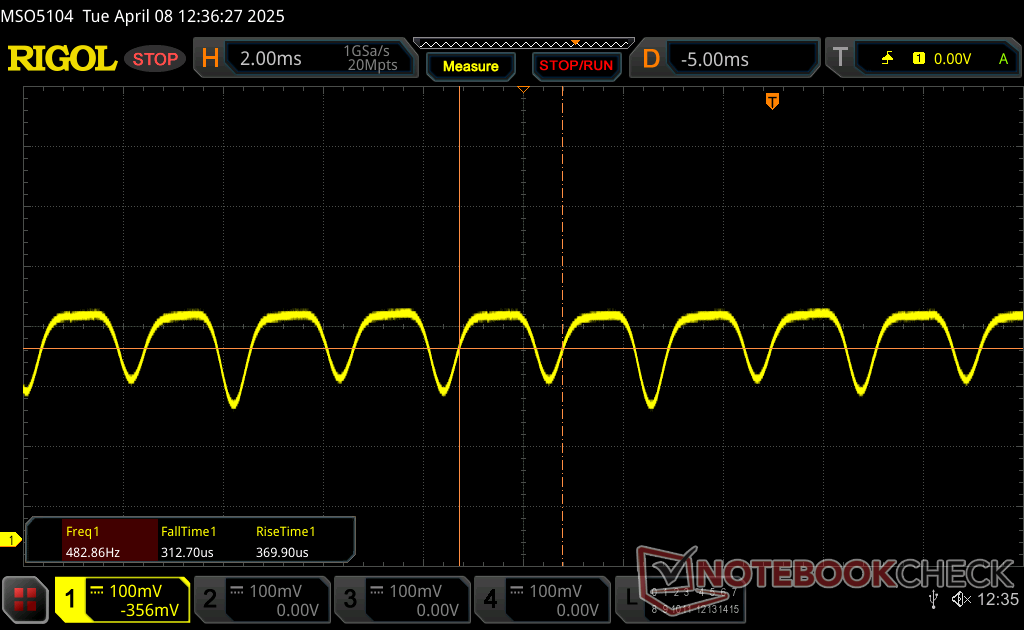
Screen Flickering / PWM (Pulse-Width Modulation)
| Screen flickering / PWM detected | 492.6 Hz Amplitude: 43 % | 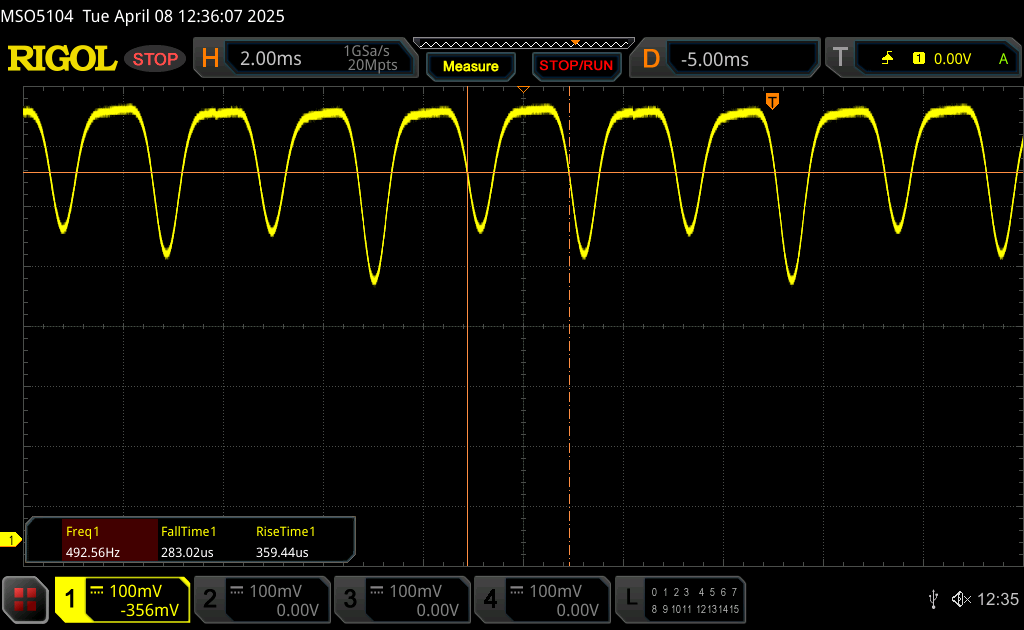 | |
The display backlight flickers at 492.6 Hz (worst case, e.g., utilizing PWM) . The frequency of 492.6 Hz is relatively high, so most users sensitive to PWM should not notice any flickering. However, there are reports that some users are still sensitive to PWM at 500 Hz and above, so be aware. In comparison: 53 % of all tested devices do not use PWM to dim the display. If PWM was detected, an average of 8516 (minimum: 5 - maximum: 343500) Hz was measured. | |||
改变!
视角:描述实际使用中的视角(对移动使用很重要,在膝上使用? 添加一张照片进行比较(NBC 参考图片,最大显示亮度,暗室,所有图片的光圈和快门速度相同,所有方向 45° 梯度)
性能
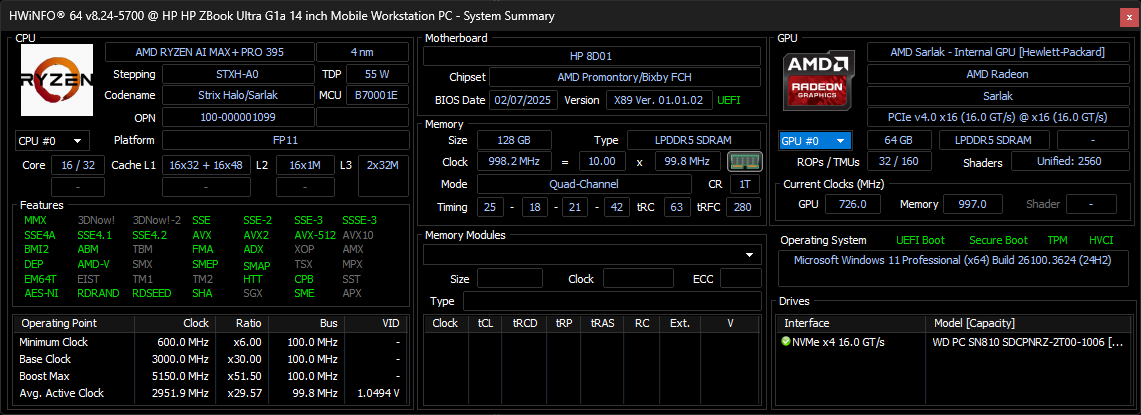
测试条件
在运行以下基准测试之前,我们将 Windows 和 MyHP 都设置为高性能模式。
焊接 RAM 可在系统 RAM 和视频 RAM 之间进行配置,详见 此处.
处理器
处理器的原始性能 Ryzen AI Max+ PRO 395是所有 14 英寸工作站电脑中速度最快的之一,甚至是**快的。它的性能超过了 Core Ultra 9 185H在多线程工作负载方面,它比竞争对手Precision 5470 中的 Core Ultra 9 185H 高出约 80%,同时与 14 核的 Apple M4 Pro.不过,单线程性能一般,因此在某些情况下仍会输给Apple 旗舰产品。
在负载情况下,性能的可持续性非常出色,比 14 英寸机型预期的要好。
Cinebench R15 Multi Loop
Cinebench 2024: CPU Multi Core | CPU Single Core
Cinebench R23: Multi Core | Single Core
Cinebench R20: CPU (Multi Core) | CPU (Single Core)
Cinebench R15: CPU Multi 64Bit | CPU Single 64Bit
Blender: v2.79 BMW27 CPU
7-Zip 18.03: 7z b 4 | 7z b 4 -mmt1
Geekbench 6.4: Multi-Core | Single-Core
Geekbench 5.5: Multi-Core | Single-Core
HWBOT x265 Benchmark v2.2: 4k Preset
LibreOffice : 20 Documents To PDF
R Benchmark 2.5: Overall mean
| Cinebench 2024 / CPU Single Core | |
| Apple MacBook Pro 14 2024 M4 Pro | |
| Xiaomi RedmiBook Pro 14 2025 | |
| Lenovo ThinkPad X1 Carbon Gen 13 21NS0010GE | |
| Asus ROG Flow Z13 GZ302EA-RU073W | |
| Lenovo Yoga Pro 7 14ASP G9 | |
| HP ZBook Ultra G1a 14 | |
| Average AMD Ryzen AI Max+ PRO 395 (n=1) | |
| Asus Zenbook 14 OLED UM3406HA | |
| Lenovo Yoga 7 2-in-1 14AHP9 Arctic Grey | |
Cinebench 2024: CPU Multi Core | CPU Single Core
Cinebench R23: Multi Core | Single Core
Cinebench R20: CPU (Multi Core) | CPU (Single Core)
Cinebench R15: CPU Multi 64Bit | CPU Single 64Bit
Blender: v2.79 BMW27 CPU
7-Zip 18.03: 7z b 4 | 7z b 4 -mmt1
Geekbench 6.4: Multi-Core | Single-Core
Geekbench 5.5: Multi-Core | Single-Core
HWBOT x265 Benchmark v2.2: 4k Preset
LibreOffice : 20 Documents To PDF
R Benchmark 2.5: Overall mean
* ... smaller is better
AIDA64: FP32 Ray-Trace | FPU Julia | CPU SHA3 | CPU Queen | FPU SinJulia | FPU Mandel | CPU AES | CPU ZLib | FP64 Ray-Trace | CPU PhotoWorxx
| Performance Rating | |
| HP ZBook Ultra G1a 14 | |
| Average AMD Ryzen AI Max+ PRO 395 | |
| Dell Precision 5000 5490 | |
| HP ZBook Firefly 14 G11 | |
| Asus ExpertBook P5 P5405-NZ0102X | |
| Lenovo ThinkPad X1 Carbon Gen 13 21NS0010GE | |
| AIDA64 / FP32 Ray-Trace | |
| HP ZBook Ultra G1a 14 | |
| Average AMD Ryzen AI Max+ PRO 395 (n=1) | |
| Dell Precision 5000 5490 | |
| Asus ExpertBook P5 P5405-NZ0102X | |
| HP ZBook Firefly 14 G11 | |
| Lenovo ThinkPad X1 Carbon Gen 13 21NS0010GE | |
| AIDA64 / FPU Julia | |
| HP ZBook Ultra G1a 14 | |
| Average AMD Ryzen AI Max+ PRO 395 (n=1) | |
| Dell Precision 5000 5490 | |
| Asus ExpertBook P5 P5405-NZ0102X | |
| Lenovo ThinkPad X1 Carbon Gen 13 21NS0010GE | |
| HP ZBook Firefly 14 G11 | |
| AIDA64 / CPU SHA3 | |
| HP ZBook Ultra G1a 14 | |
| Average AMD Ryzen AI Max+ PRO 395 (n=1) | |
| Dell Precision 5000 5490 | |
| Asus ExpertBook P5 P5405-NZ0102X | |
| Lenovo ThinkPad X1 Carbon Gen 13 21NS0010GE | |
| HP ZBook Firefly 14 G11 | |
| AIDA64 / CPU Queen | |
| HP ZBook Ultra G1a 14 | |
| Average AMD Ryzen AI Max+ PRO 395 (n=1) | |
| Dell Precision 5000 5490 | |
| HP ZBook Firefly 14 G11 | |
| Asus ExpertBook P5 P5405-NZ0102X | |
| Lenovo ThinkPad X1 Carbon Gen 13 21NS0010GE | |
| AIDA64 / FPU SinJulia | |
| HP ZBook Ultra G1a 14 | |
| Average AMD Ryzen AI Max+ PRO 395 (n=1) | |
| Dell Precision 5000 5490 | |
| HP ZBook Firefly 14 G11 | |
| Asus ExpertBook P5 P5405-NZ0102X | |
| Lenovo ThinkPad X1 Carbon Gen 13 21NS0010GE | |
| AIDA64 / FPU Mandel | |
| HP ZBook Ultra G1a 14 | |
| Average AMD Ryzen AI Max+ PRO 395 (n=1) | |
| Dell Precision 5000 5490 | |
| Asus ExpertBook P5 P5405-NZ0102X | |
| Lenovo ThinkPad X1 Carbon Gen 13 21NS0010GE | |
| HP ZBook Firefly 14 G11 | |
| AIDA64 / CPU AES | |
| HP ZBook Ultra G1a 14 | |
| Average AMD Ryzen AI Max+ PRO 395 (n=1) | |
| Dell Precision 5000 5490 | |
| HP ZBook Firefly 14 G11 | |
| Asus ExpertBook P5 P5405-NZ0102X | |
| Lenovo ThinkPad X1 Carbon Gen 13 21NS0010GE | |
| AIDA64 / CPU ZLib | |
| HP ZBook Ultra G1a 14 | |
| Average AMD Ryzen AI Max+ PRO 395 (n=1) | |
| Dell Precision 5000 5490 | |
| HP ZBook Firefly 14 G11 | |
| Asus ExpertBook P5 P5405-NZ0102X | |
| Lenovo ThinkPad X1 Carbon Gen 13 21NS0010GE | |
| AIDA64 / FP64 Ray-Trace | |
| HP ZBook Ultra G1a 14 | |
| Average AMD Ryzen AI Max+ PRO 395 (n=1) | |
| Dell Precision 5000 5490 | |
| Asus ExpertBook P5 P5405-NZ0102X | |
| HP ZBook Firefly 14 G11 | |
| Lenovo ThinkPad X1 Carbon Gen 13 21NS0010GE | |
| AIDA64 / CPU PhotoWorxx | |
| HP ZBook Ultra G1a 14 | |
| Average AMD Ryzen AI Max+ PRO 395 (n=1) | |
| Asus ExpertBook P5 P5405-NZ0102X | |
| Lenovo ThinkPad X1 Carbon Gen 13 21NS0010GE | |
| Dell Precision 5000 5490 | |
| HP ZBook Firefly 14 G11 | |
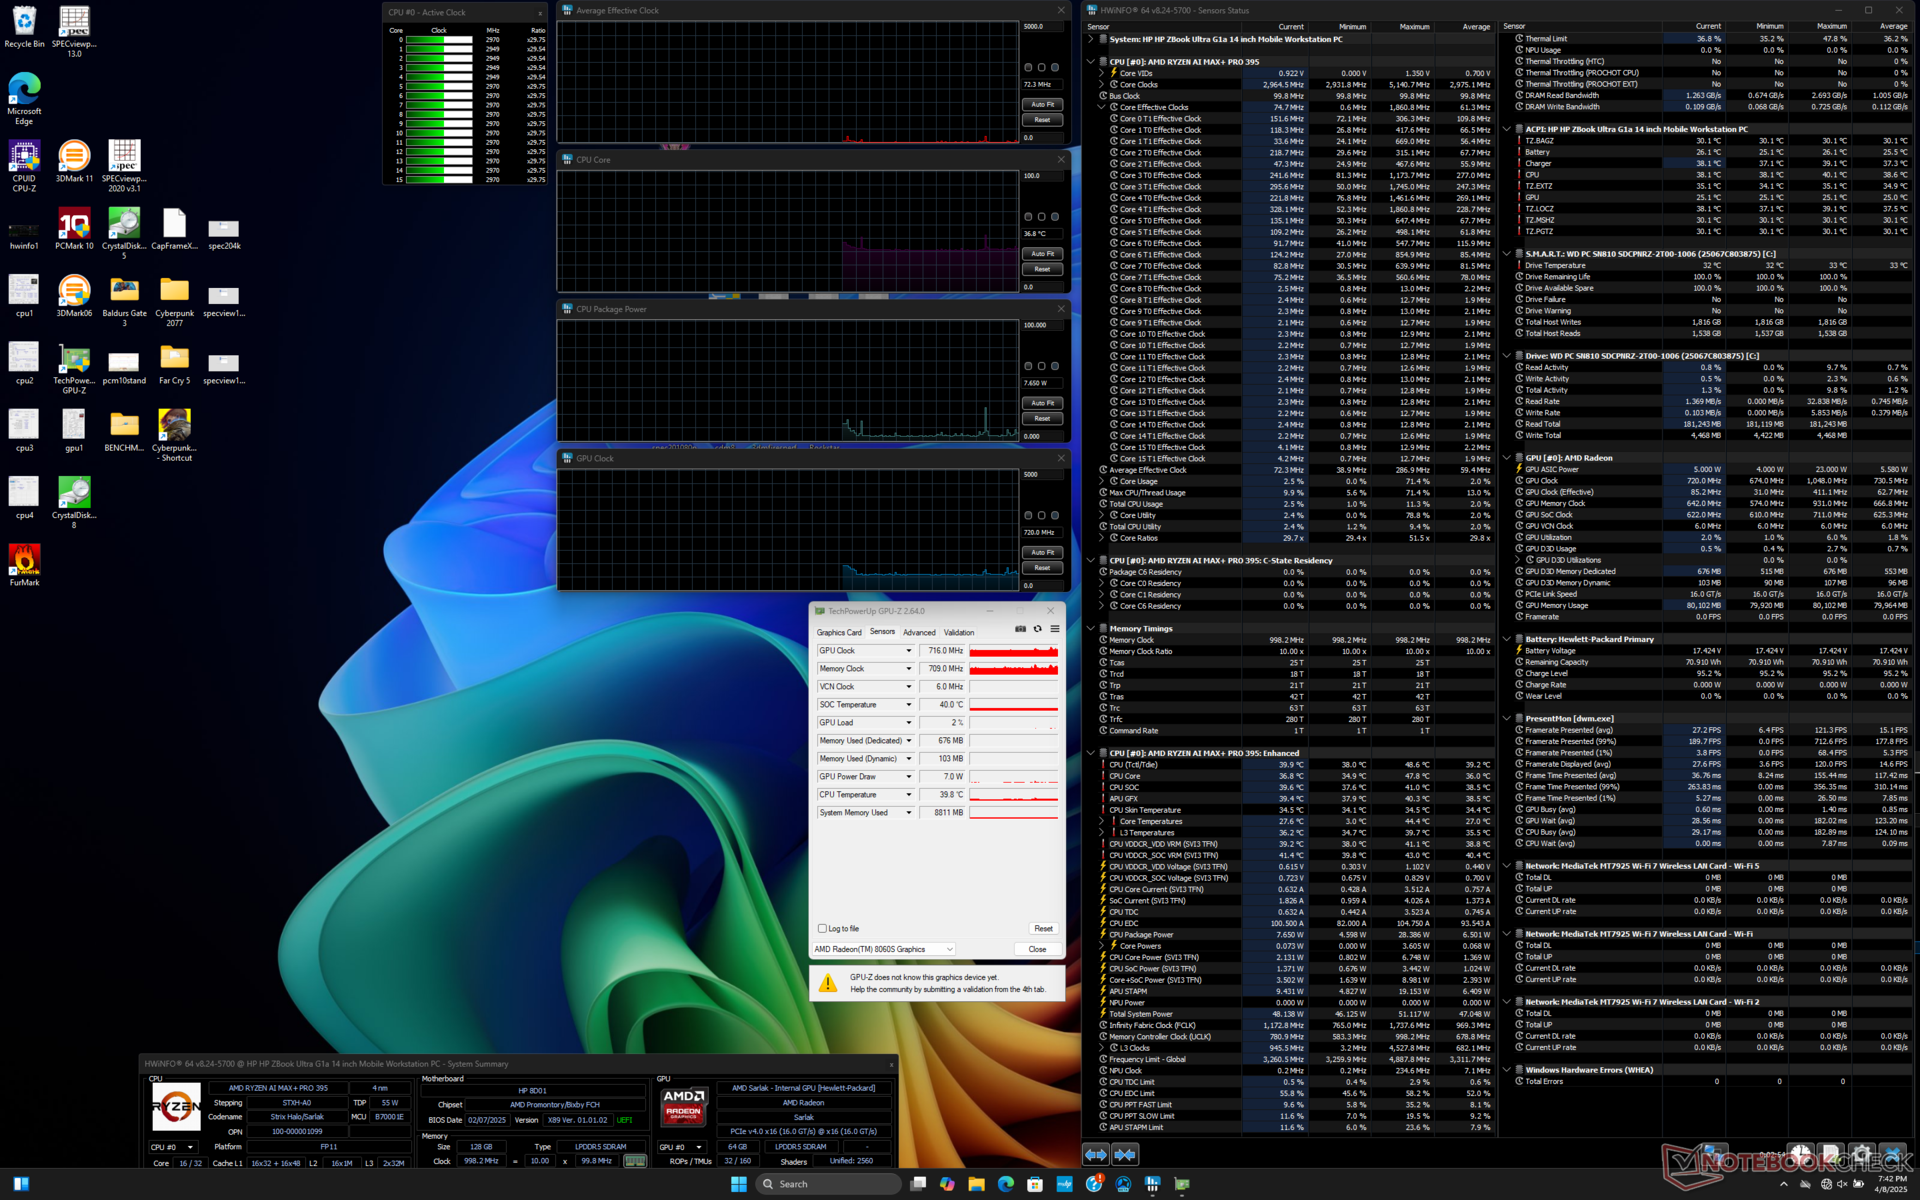
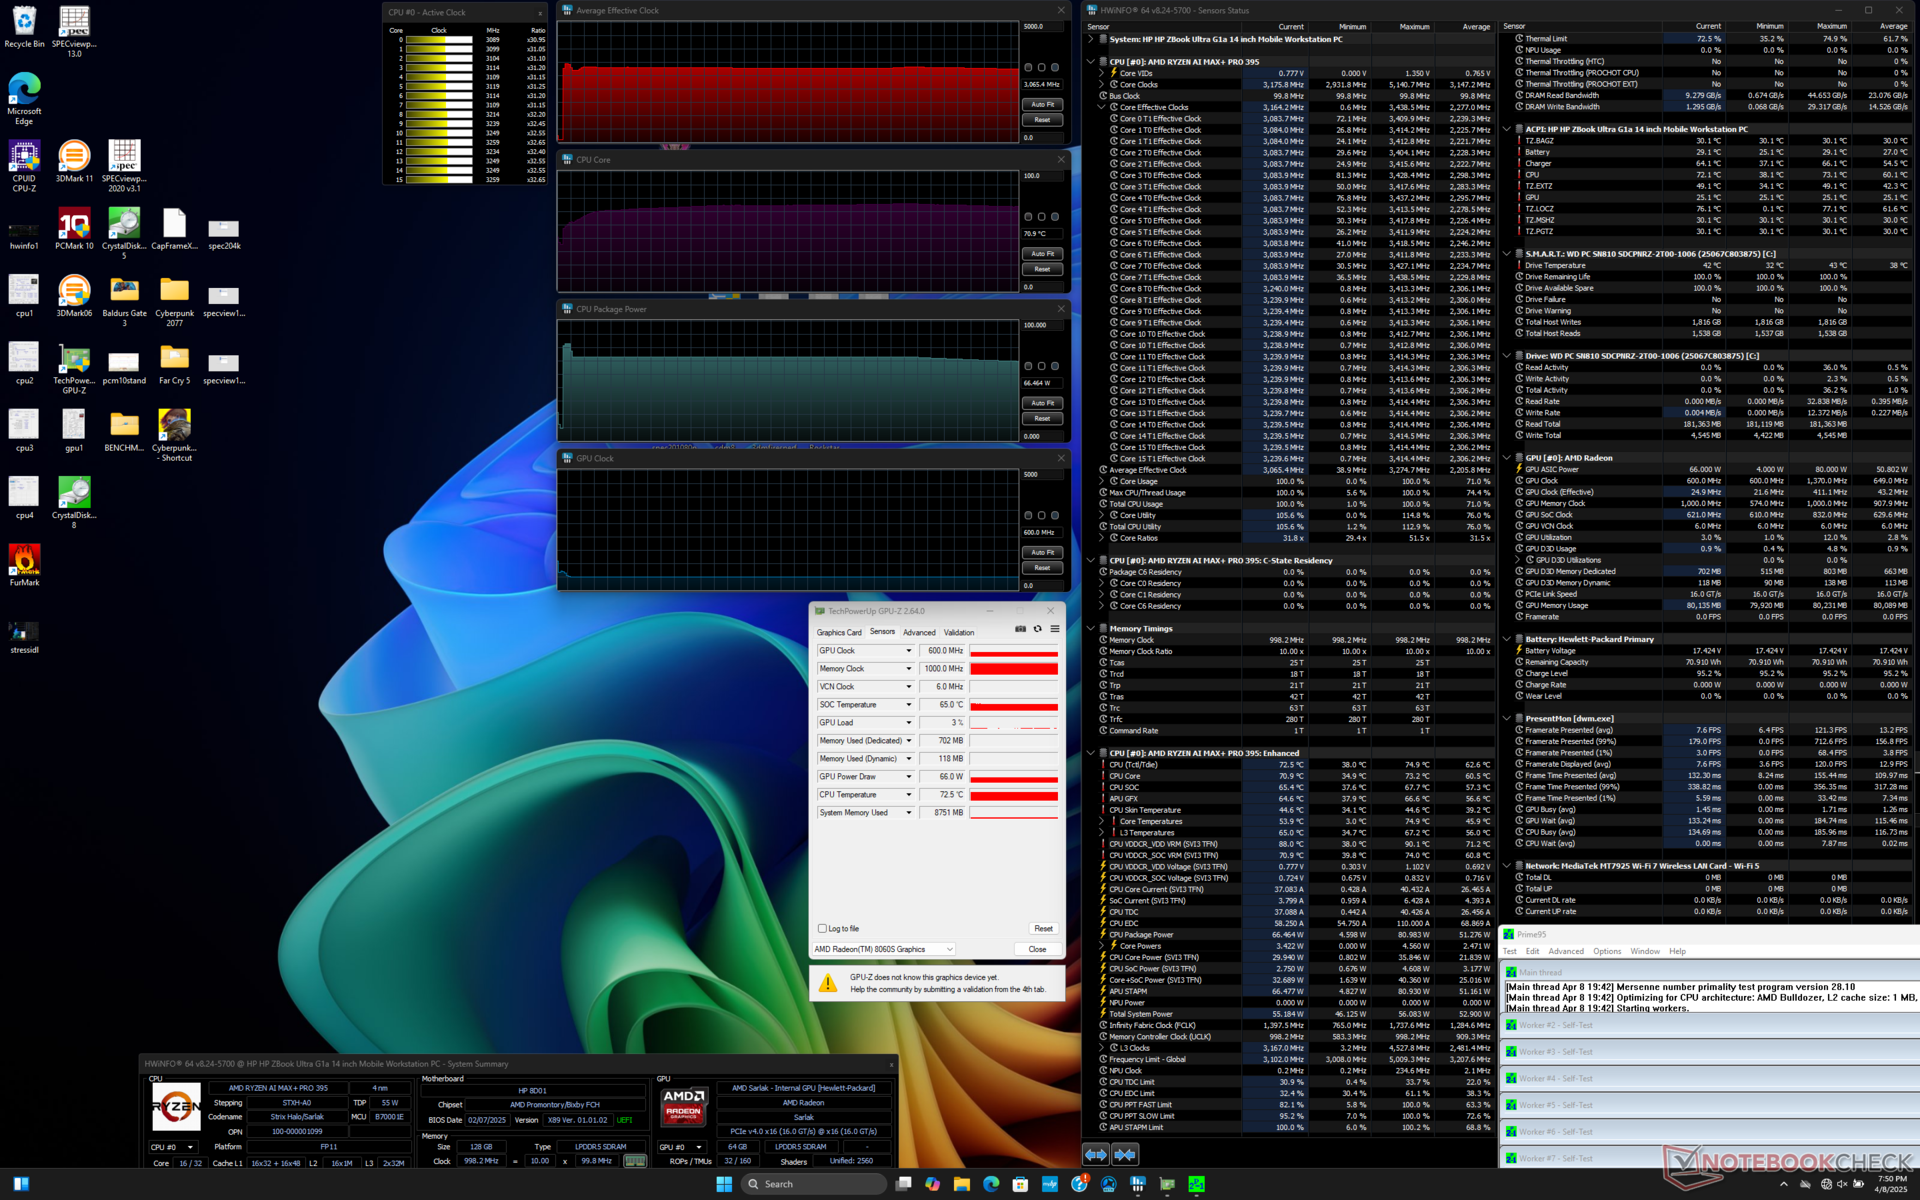
压力测试
当启动 Prime95 压力测试时,CPU 会在短短几秒钟内提升至 3.3 GHz 和 81 W,然后下降并稳定在 3.1 GHz、66 W 和 71 C。

| CPU 平均时钟 (GHz) | GPU 时钟 (MHz) | CPU 平均温度 (°C) | |
| 系统闲置 | -- | -- | 37 |
| Prime95 压力 | 3.1 | -- | 71 |
| Prime95 + FurMark Stress | 2.2 | 670 | 61 |
| 赛博朋克 2077》压力 | 0.9 | 2107 | 64 |
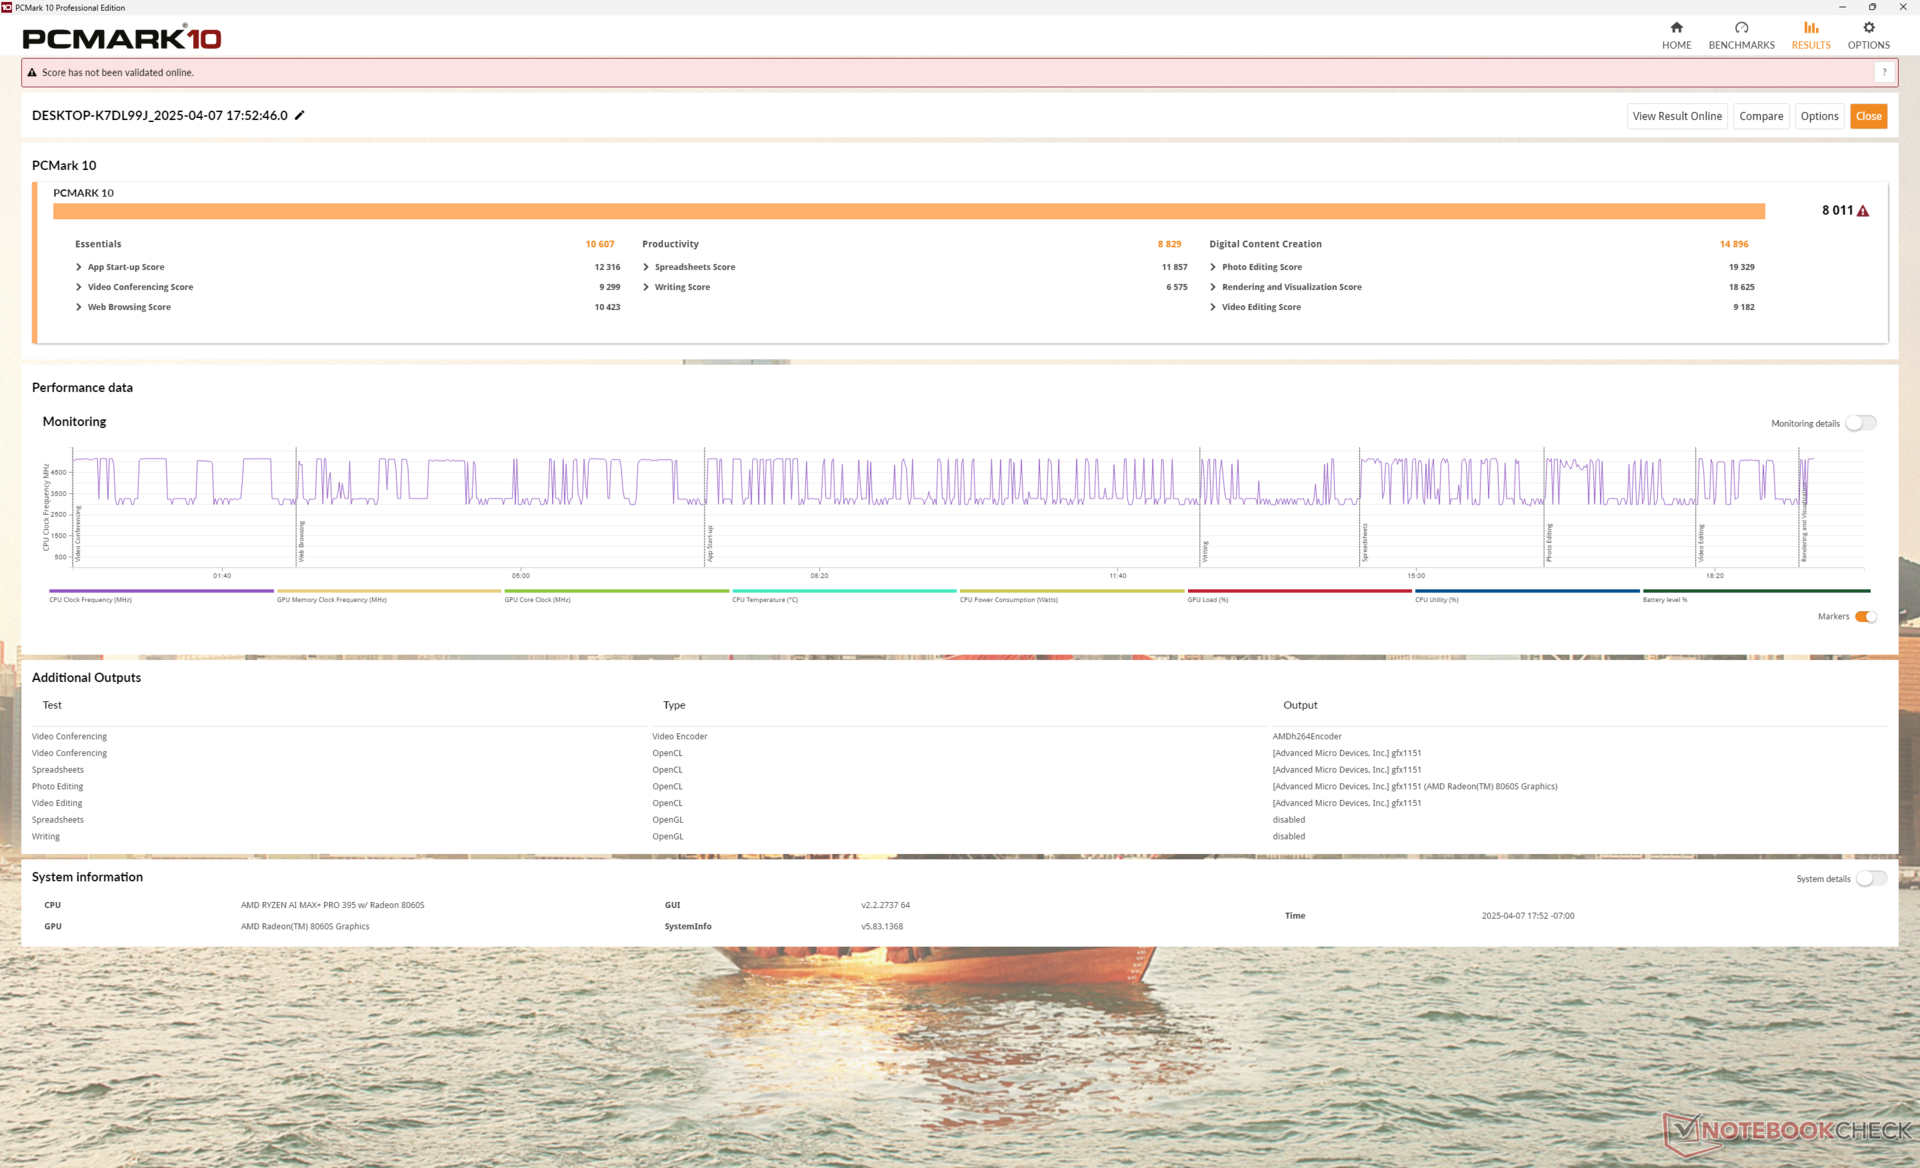
系统性能
CrossMark: Overall | Productivity | Creativity | Responsiveness
WebXPRT 3: Overall
WebXPRT 4: Overall
Mozilla Kraken 1.1: Total
| PCMark 10 / Score | |
| HP ZBook Ultra G1a 14 | |
| Average AMD Ryzen AI Max+ PRO 395, AMD Radeon RX 8060S (n=1) | |
| Dell Precision 5000 5490 | |
| Lenovo ThinkPad X1 Carbon Gen 13 21NS0010GE | |
| Asus ExpertBook P5 P5405-NZ0102X | |
| HP ZBook Firefly 14 G11 | |
| PCMark 10 / Essentials | |
| Dell Precision 5000 5490 | |
| HP ZBook Ultra G1a 14 | |
| Average AMD Ryzen AI Max+ PRO 395, AMD Radeon RX 8060S (n=1) | |
| Lenovo ThinkPad X1 Carbon Gen 13 21NS0010GE | |
| HP ZBook Firefly 14 G11 | |
| Asus ExpertBook P5 P5405-NZ0102X | |
| PCMark 10 / Productivity | |
| HP ZBook Firefly 14 G11 | |
| Dell Precision 5000 5490 | |
| Lenovo ThinkPad X1 Carbon Gen 13 21NS0010GE | |
| Asus ExpertBook P5 P5405-NZ0102X | |
| HP ZBook Ultra G1a 14 | |
| Average AMD Ryzen AI Max+ PRO 395, AMD Radeon RX 8060S (n=1) | |
| PCMark 10 / Digital Content Creation | |
| HP ZBook Ultra G1a 14 | |
| Average AMD Ryzen AI Max+ PRO 395, AMD Radeon RX 8060S (n=1) | |
| Dell Precision 5000 5490 | |
| Lenovo ThinkPad X1 Carbon Gen 13 21NS0010GE | |
| Asus ExpertBook P5 P5405-NZ0102X | |
| HP ZBook Firefly 14 G11 | |
| CrossMark / Overall | |
| Apple MacBook Pro 14 2024 M4 Pro | |
| HP ZBook Ultra G1a 14 | |
| Average AMD Ryzen AI Max+ PRO 395, AMD Radeon RX 8060S (n=1) | |
| Dell Precision 5000 5490 | |
| Lenovo ThinkPad X1 Carbon Gen 13 21NS0010GE | |
| HP ZBook Firefly 14 G11 | |
| Asus ExpertBook P5 P5405-NZ0102X | |
| CrossMark / Productivity | |
| Apple MacBook Pro 14 2024 M4 Pro | |
| Lenovo ThinkPad X1 Carbon Gen 13 21NS0010GE | |
| Dell Precision 5000 5490 | |
| HP ZBook Ultra G1a 14 | |
| Average AMD Ryzen AI Max+ PRO 395, AMD Radeon RX 8060S (n=1) | |
| Asus ExpertBook P5 P5405-NZ0102X | |
| HP ZBook Firefly 14 G11 | |
| CrossMark / Creativity | |
| Apple MacBook Pro 14 2024 M4 Pro | |
| HP ZBook Ultra G1a 14 | |
| Average AMD Ryzen AI Max+ PRO 395, AMD Radeon RX 8060S (n=1) | |
| Dell Precision 5000 5490 | |
| Lenovo ThinkPad X1 Carbon Gen 13 21NS0010GE | |
| HP ZBook Firefly 14 G11 | |
| Asus ExpertBook P5 P5405-NZ0102X | |
| CrossMark / Responsiveness | |
| Apple MacBook Pro 14 2024 M4 Pro | |
| HP ZBook Ultra G1a 14 | |
| Average AMD Ryzen AI Max+ PRO 395, AMD Radeon RX 8060S (n=1) | |
| Dell Precision 5000 5490 | |
| HP ZBook Firefly 14 G11 | |
| Lenovo ThinkPad X1 Carbon Gen 13 21NS0010GE | |
| Asus ExpertBook P5 P5405-NZ0102X | |
| WebXPRT 3 / Overall | |
| Apple MacBook Pro 14 2024 M4 Pro | |
| HP ZBook Firefly 14 G11 | |
| Dell Precision 5000 5490 | |
| Asus ExpertBook P5 P5405-NZ0102X | |
| HP ZBook Ultra G1a 14 | |
| Average AMD Ryzen AI Max+ PRO 395, AMD Radeon RX 8060S (n=1) | |
| WebXPRT 4 / Overall | |
| Apple MacBook Pro 14 2024 M4 Pro | |
| Lenovo ThinkPad X1 Carbon Gen 13 21NS0010GE | |
| Dell Precision 5000 5490 | |
| Asus ExpertBook P5 P5405-NZ0102X | |
| HP ZBook Firefly 14 G11 | |
| HP ZBook Ultra G1a 14 | |
| Average AMD Ryzen AI Max+ PRO 395, AMD Radeon RX 8060S (n=1) | |
| Mozilla Kraken 1.1 / Total | |
| Dell Precision 5000 5490 | |
| HP ZBook Firefly 14 G11 | |
| Asus ExpertBook P5 P5405-NZ0102X | |
| Lenovo ThinkPad X1 Carbon Gen 13 21NS0010GE | |
| HP ZBook Ultra G1a 14 | |
| Average AMD Ryzen AI Max+ PRO 395, AMD Radeon RX 8060S (n=1) | |
| Apple MacBook Pro 14 2024 M4 Pro | |
* ... smaller is better
| PCMark 10 Score | 8011 points | |
Help | ||
| AIDA64 / Memory Copy | |
| HP ZBook Ultra G1a 14 | |
| Average AMD Ryzen AI Max+ PRO 395 (n=1) | |
| Asus ExpertBook P5 P5405-NZ0102X | |
| Lenovo ThinkPad X1 Carbon Gen 13 21NS0010GE | |
| Dell Precision 5000 5490 | |
| HP ZBook Firefly 14 G11 | |
| AIDA64 / Memory Read | |
| HP ZBook Ultra G1a 14 | |
| Average AMD Ryzen AI Max+ PRO 395 (n=1) | |
| Asus ExpertBook P5 P5405-NZ0102X | |
| Lenovo ThinkPad X1 Carbon Gen 13 21NS0010GE | |
| Dell Precision 5000 5490 | |
| HP ZBook Firefly 14 G11 | |
| AIDA64 / Memory Write | |
| HP ZBook Ultra G1a 14 | |
| Average AMD Ryzen AI Max+ PRO 395 (n=1) | |
| Asus ExpertBook P5 P5405-NZ0102X | |
| Lenovo ThinkPad X1 Carbon Gen 13 21NS0010GE | |
| Dell Precision 5000 5490 | |
| HP ZBook Firefly 14 G11 | |
| AIDA64 / Memory Latency | |
| HP ZBook Ultra G1a 14 | |
| Average AMD Ryzen AI Max+ PRO 395 (n=1) | |
| Dell Precision 5000 5490 | |
| HP ZBook Firefly 14 G11 | |
| Lenovo ThinkPad X1 Carbon Gen 13 21NS0010GE | |
| Asus ExpertBook P5 P5405-NZ0102X | |
* ... smaller is better
DPC 延迟
LatencyMon 仅在打开我们主页的多个浏览器标签时显示出轻微的 DPC 问题。以 60 FPS 播放 4K 视频时也很流畅,没有掉帧记录。
有趣的是,在同时运行 LatencyMon 时播放 4K60 内容会出现问题。掉帧率会直线上升,系统也会无缘无故变得迟缓。停止 LatencyMon 可以解决这个问题。当开始出现卡顿时,程序会报告一个与 DirectX 内核有关的潜在问题。
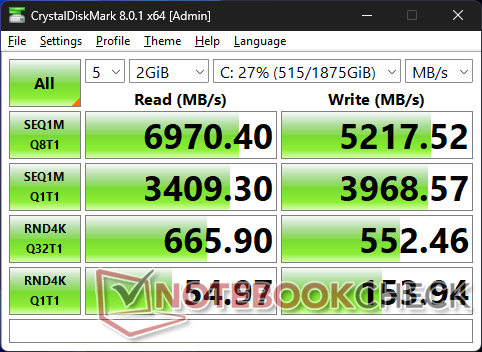
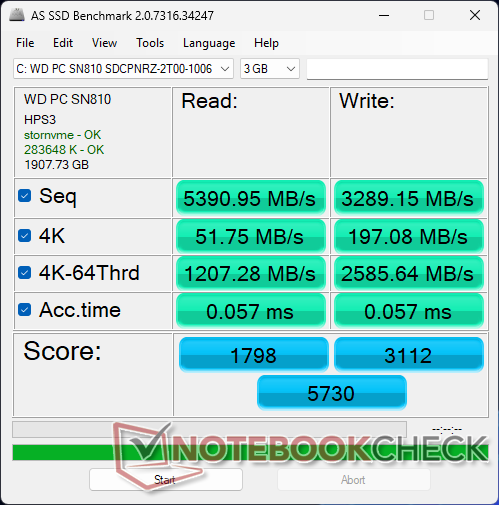
存储设备
WD SN810 WD SN810ZBook Ultra G1a 14 中的 PCIe4 NVMe 固态硬盘没有出现我们在惠普 ZBook Firefly 14 G11 上观察到的性能节流问题。

| Drive Performance Rating - Percent | |
| HP ZBook Ultra G1a 14 | |
| Lenovo ThinkPad X1 Carbon Gen 13 21NS0010GE | |
| Dell Precision 5000 5490 | |
| HP ZBook Firefly 14 G11 | |
| Asus ExpertBook P5 P5405-NZ0102X | |
* ... smaller is better
Disk Throttling: DiskSpd Read Loop, Queue Depth 8
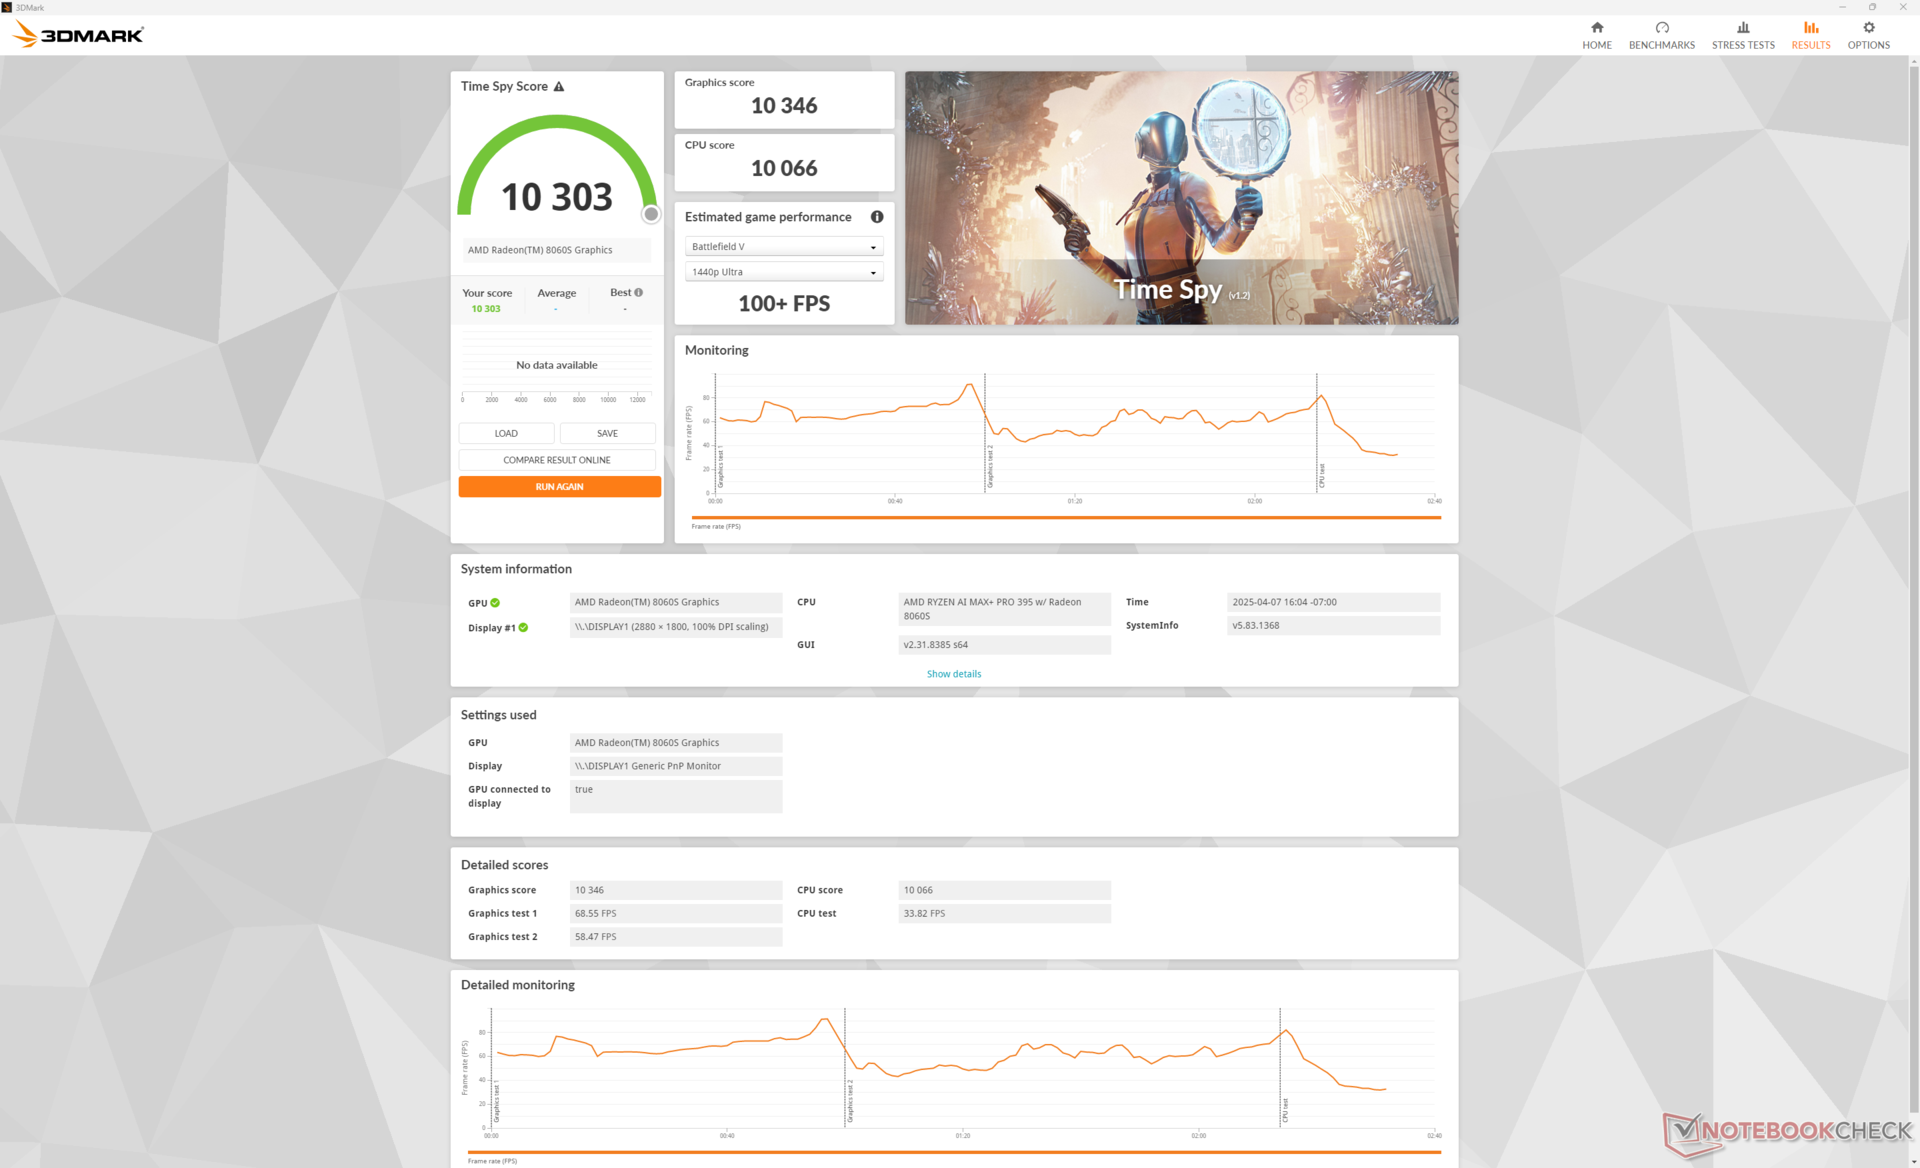
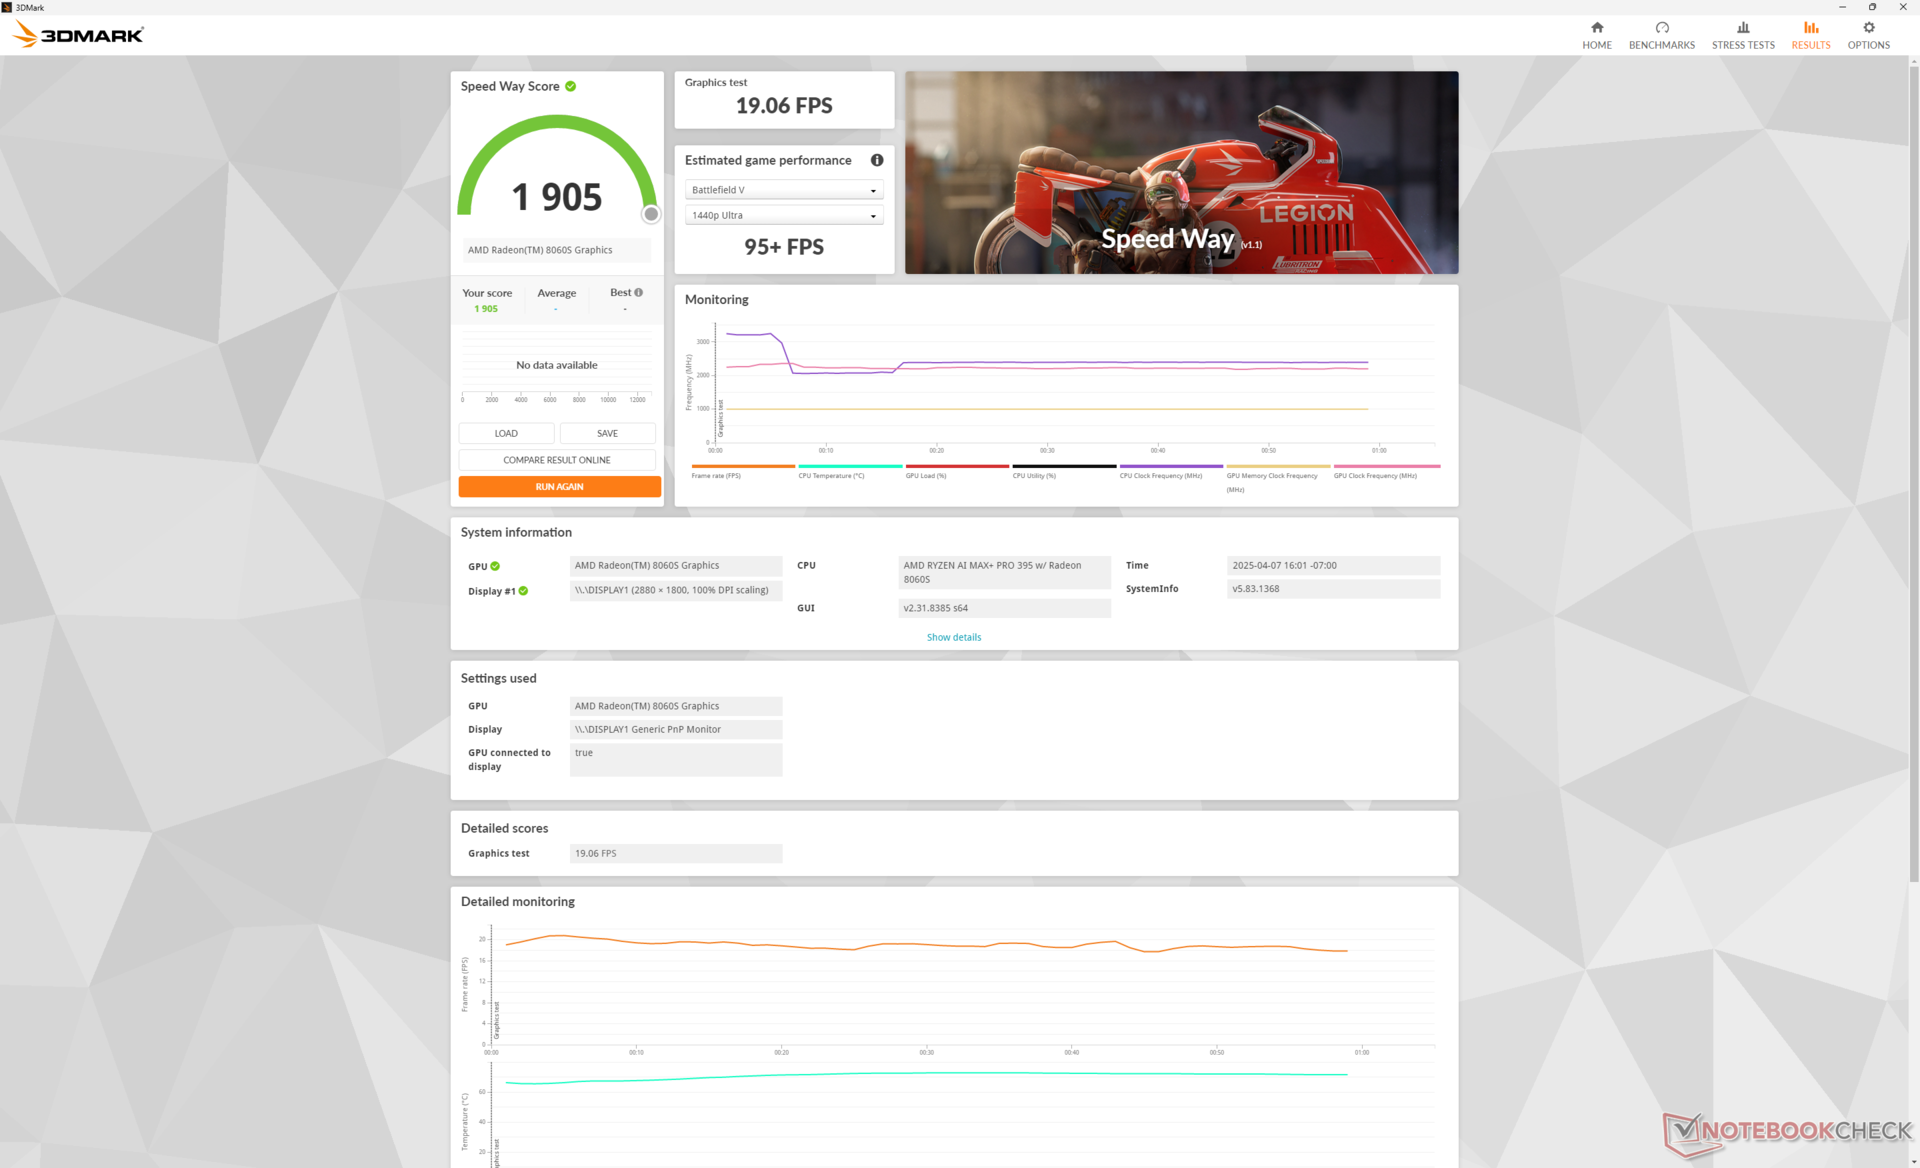
图形处理器性能
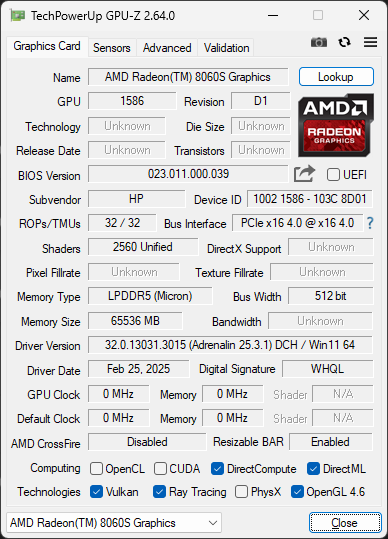
迚ケ谿オ譎る俣 Radeon RX 8060S介于独立 RTX 3000 Ada和 RTX 4000 Ada之间。如果考虑到 AMD 解决方案是集成的,那么从每体积性能或每瓦特性能的角度来看,这已经是相当了不起的成就了。据我们所知,目前还没有主要的 14 英寸工作站配备 RTX 4000 Ada 选项,这也印证了惠普 "全球最快 14 英寸工作站 "的说法。
| 电源配置文件 | 图形得分 | 物理得分 | 综合得分 |
| 性能模式 | 27659 | 32559 | 10555 |
| 均衡模式 | 25972 (-6%) | 31510 (-3%) | 9739 (-8%) |
| 电池电量 | 20915 (-24%) | 25705 (-21%) | 6915 (-35%) |
遗憾的是,根据我们在上表Fire Strike 中得出的结果,如果使用电池供电,即使设置为高性能模式,性能也会降低高达 25% 至 35%。
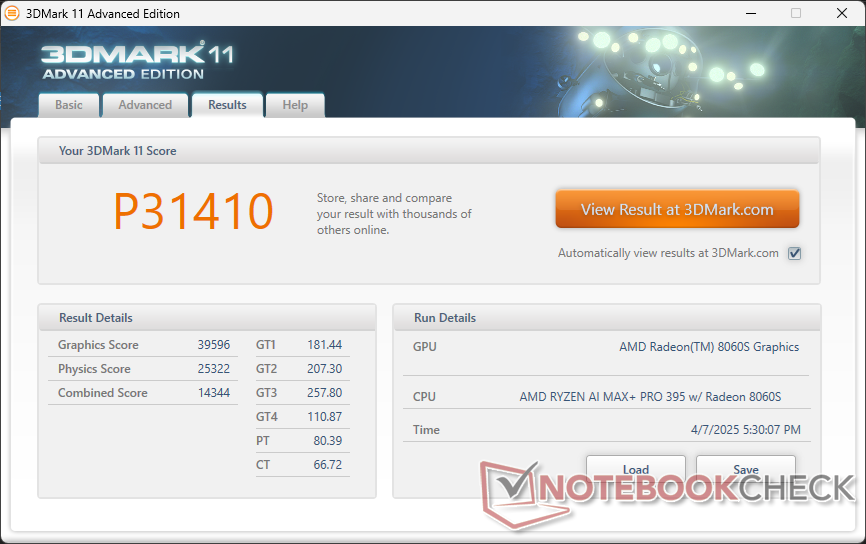

| 3DMark 11 Performance | 31410 points | |
| 3DMark Cloud Gate Standard Score | 66462 points | |
| 3DMark Fire Strike Score | 24273 points | |
| 3DMark Time Spy Score | 10303 points | |
Help | ||
* ... smaller is better
游戏性能
集成的 Radeon 8060S 与独立的 GeForce RTX 4050最接近。请记住,游戏并不是 ZBook 的主要功能。
| F1 22 | |
| 1280x720 Ultra Low Preset AA:T AF:16x | |
| HP ZBook Ultra G1a 14 | |
| Average AMD Radeon RX 8060S (n=1) | |
| Dell Precision 5000 5490 | |
| HP ZBook Firefly 14 G11 | |
| HP EliteBook x360 1040 G11 | |
| 1920x1080 Low Preset AA:T AF:16x | |
| HP ZBook Ultra G1a 14 | |
| Average AMD Radeon RX 8060S (n=1) | |
| Dell Precision 5000 5490 | |
| HP ZBook Firefly 14 G11 | |
| HP EliteBook x360 1040 G11 | |
| 1920x1080 Medium Preset AA:T AF:16x | |
| HP ZBook Ultra G1a 14 | |
| Average AMD Radeon RX 8060S (n=1) | |
| Dell Precision 5000 5490 | |
| HP ZBook Firefly 14 G11 | |
| HP EliteBook x360 1040 G11 | |
| 1920x1080 High Preset AA:T AF:16x | |
| HP ZBook Ultra G1a 14 | |
| Average AMD Radeon RX 8060S (n=1) | |
| Dell Precision 5000 5490 | |
| HP ZBook Firefly 14 G11 | |
| HP EliteBook x360 1040 G11 | |
| 1920x1080 Ultra High Preset AA:T AF:16x | |
| HP ZBook Ultra G1a 14 | |
| Average AMD Radeon RX 8060S (n=1) | |
| Dell Precision 5000 5490 | |
| HP ZBook Firefly 14 G11 | |
| Tiny Tina's Wonderlands | |
| 1280x720 Lowest Preset (DX12) | |
| HP ZBook Ultra G1a 14 | |
| Average AMD Radeon RX 8060S (n=1) | |
| HP ZBook Firefly 14 G11 | |
| HP EliteBook x360 1040 G11 | |
| 1920x1080 Low Preset (DX12) | |
| Average AMD Radeon RX 8060S (n=1) | |
| HP ZBook Ultra G1a 14 | |
| Dell Precision 5000 5490 | |
| HP ZBook Firefly 14 G11 | |
| HP EliteBook x360 1040 G11 | |
| 1920x1080 Medium Preset (DX12) | |
| HP ZBook Ultra G1a 14 | |
| Average AMD Radeon RX 8060S (n=1) | |
| Dell Precision 5000 5490 | |
| HP ZBook Firefly 14 G11 | |
| HP EliteBook x360 1040 G11 | |
| 1920x1080 High Preset (DX12) | |
| HP ZBook Ultra G1a 14 | |
| Average AMD Radeon RX 8060S (n=1) | |
| Dell Precision 5000 5490 | |
| HP ZBook Firefly 14 G11 | |
| HP EliteBook x360 1040 G11 | |
| 1920x1080 Badass Preset (DX12) | |
| HP ZBook Ultra G1a 14 | |
| Average AMD Radeon RX 8060S (n=1) | |
| Dell Precision 5000 5490 | |
| HP ZBook Firefly 14 G11 | |
| HP EliteBook x360 1040 G11 | |
Cyberpunk 2077 ultra FPS Chart
| low | med. | high | ultra | |
|---|---|---|---|---|
| GTA V (2015) | 184.4 | 177.7 | 164.3 | 86.6 |
| Dota 2 Reborn (2015) | 210 | 177.2 | 147.7 | 133.1 |
| Final Fantasy XV Benchmark (2018) | 192.9 | 122.6 | 84.8 | |
| X-Plane 11.11 (2018) | 109.5 | 66.4 | 57.2 | |
| Far Cry 5 (2018) | 116 | 96 | 95 | 92 |
| Strange Brigade (2018) | 491 | 218 | 188.6 | 171 |
| Tiny Tina's Wonderlands (2022) | 220.5 | 162.3 | 110.2 | 90 |
| F1 22 (2022) | 250 | 239 | 185.1 | 57.4 |
| Baldur's Gate 3 (2023) | 139.6 | 118.3 | 101.2 | 99.4 |
| Cyberpunk 2077 2.2 Phantom Liberty (2023) | 135.4 | 111.5 | 90.2 | 80.7 |
| Monster Hunter Wilds (2025) | 55.8 | 47 | 34.5 |
排放量
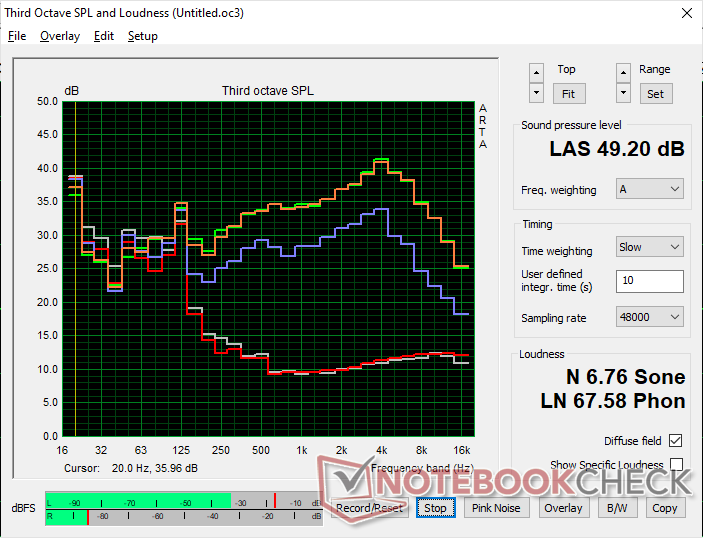
系统噪音
在运行 Excel 或浏览器等要求不高的负载时,风扇在 24 dB(A) 的背景噪音下保持安静,噪音约为 28 dB(A)。然而,一旦引入更高的负载,风扇的噪音就会相对较快升高,与Precision 5490 一样达到近 50 dB(A)。
Noise Level
| Idle |
| 23.9 / 23.9 / 26.8 dB(A) |
| Load |
| 42.2 / 49.2 dB(A) |
 | ||
30 dB silent 40 dB(A) audible 50 dB(A) loud |
||
min: | ||
| HP ZBook Ultra G1a 14 Radeon RX 8060S, Ryzen AI Max+ PRO 395, WDC PC SN810 2TB | HP ZBook Firefly 14 G11 RTX A500 Laptop GPU, Ultra 7 165H, Kioxia XG8 KXG80ZNV512G | Lenovo ThinkPad X1 Carbon Gen 13 21NS0010GE Arc 140V, Core Ultra 7 258V, SK hynix PCB01 HFS001TFM9X179N GL | Dell Precision 5000 5490 NVIDIA RTX 3000 Ada Generation Laptop GPU, Ultra 9 185H, Kioxia XG8 KXG80ZNV1T02 | Asus ExpertBook P5 P5405-NZ0102X Arc 140V, Core Ultra 7 258V, Western Digital PC SN5000S SDEQNSJ-1T00 | Apple MacBook Pro 14 2024 M4 Pro M4 Pro 20-Core GPU, M4 Pro (14 cores), Apple SSD AP2048Z | |
|---|---|---|---|---|---|---|
| Noise | 3% | 12% | 3% | 15% | 8% | |
| off / environment * | 23.9 | 24.3 -2% | 23.2 3% | 22.8 5% | 24.1 -1% | 23.9 -0% |
| Idle Minimum * | 23.9 | 24.6 -3% | 23.2 3% | 23.8 -0% | 24.1 -1% | 23.9 -0% |
| Idle Average * | 23.9 | 25.2 -5% | 23.2 3% | 23.8 -0% | 24.1 -1% | 23.9 -0% |
| Idle Maximum * | 26.8 | 26.8 -0% | 23.2 13% | 24.7 8% | 24.1 10% | 23.9 11% |
| Load Average * | 42.2 | 38.9 8% | 29.9 29% | 38.9 8% | 31.2 26% | 30.2 28% |
| Cyberpunk 2077 ultra * | 49.1 | 41.8 15% | 43.3 12% | 31.7 35% | 44.5 9% | |
| Load Maximum * | 49.2 | 45.8 7% | 40.5 18% | 51.4 -4% | 31.2 37% | 44.5 10% |
| Witcher 3 ultra * | 49.9 |
* ... smaller is better
温度
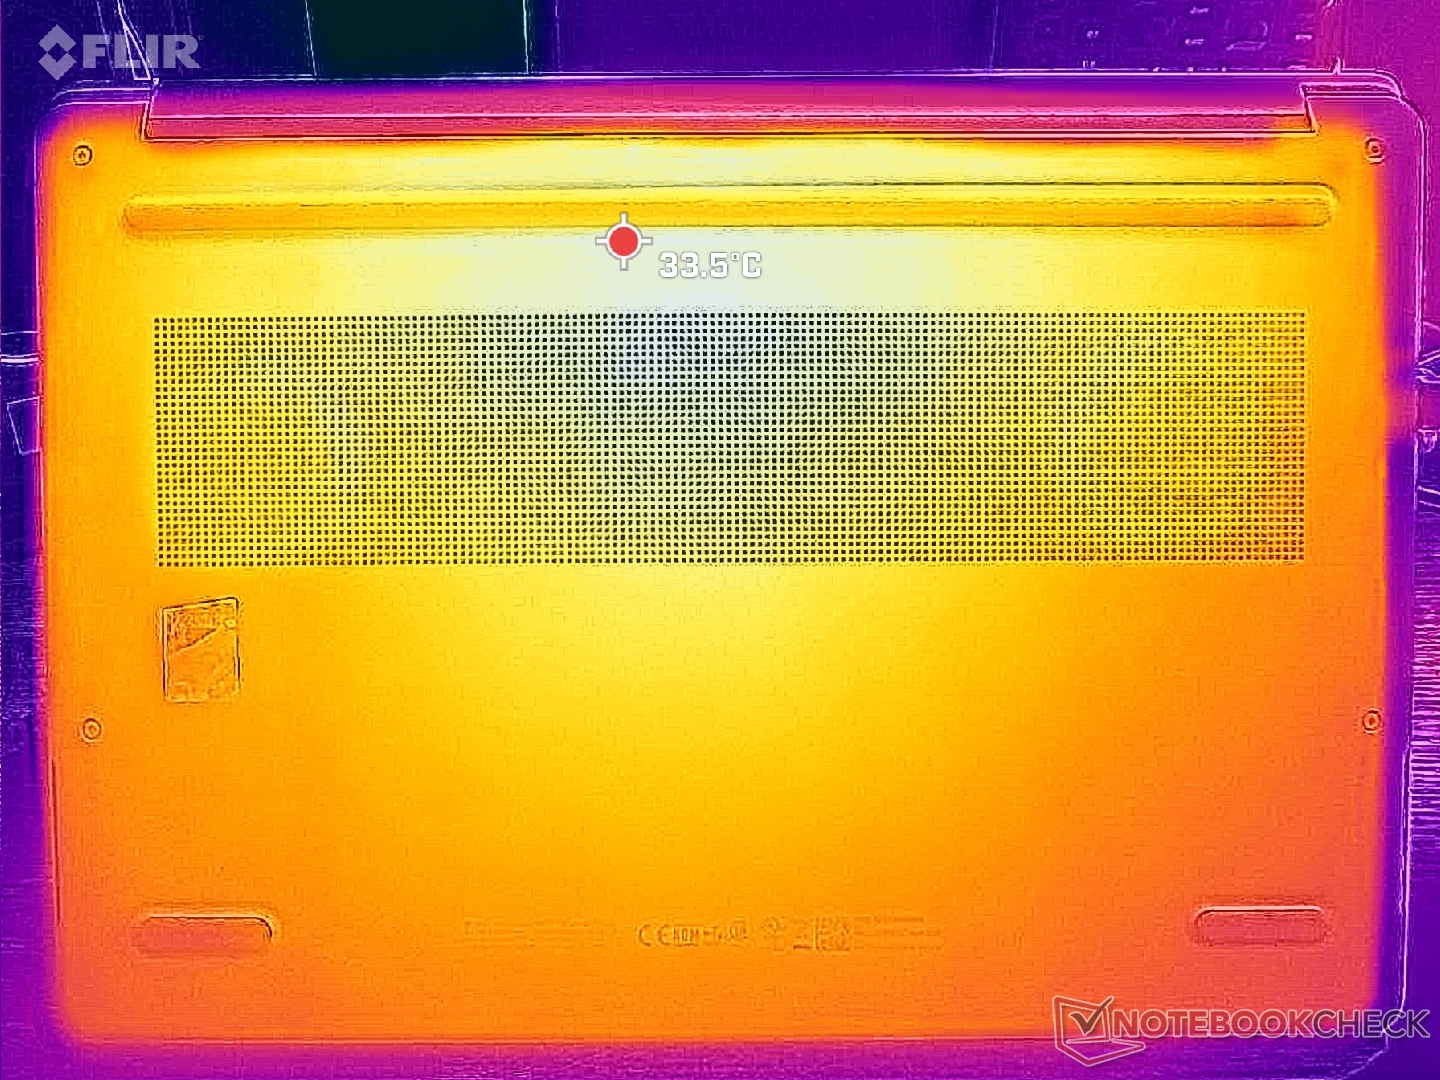
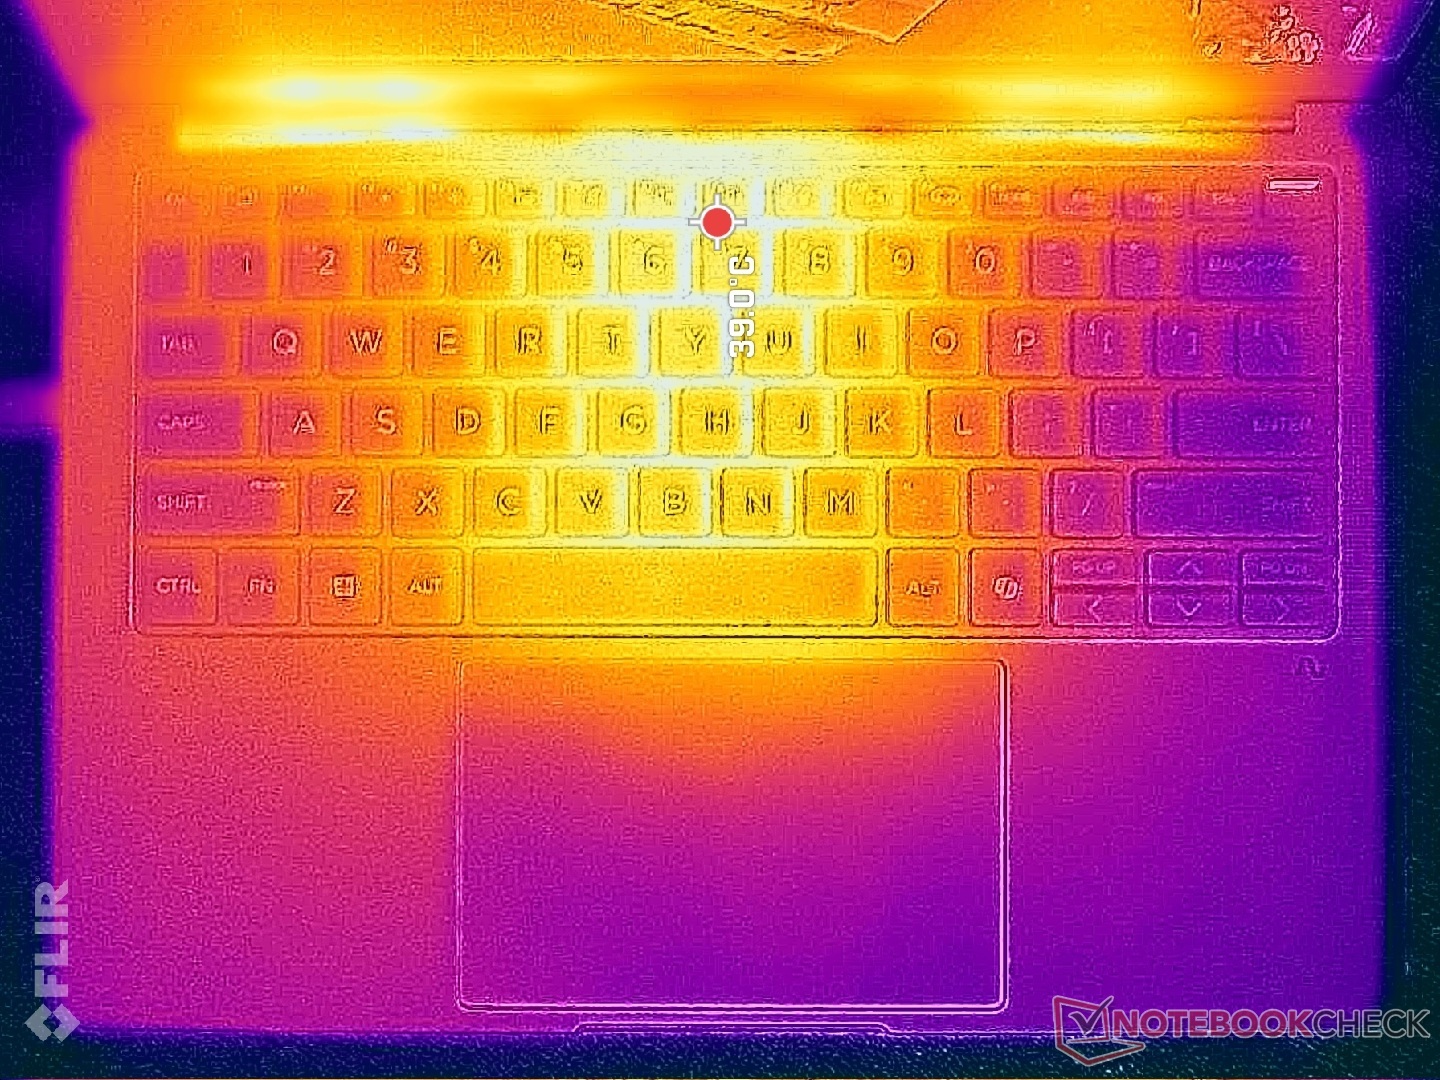
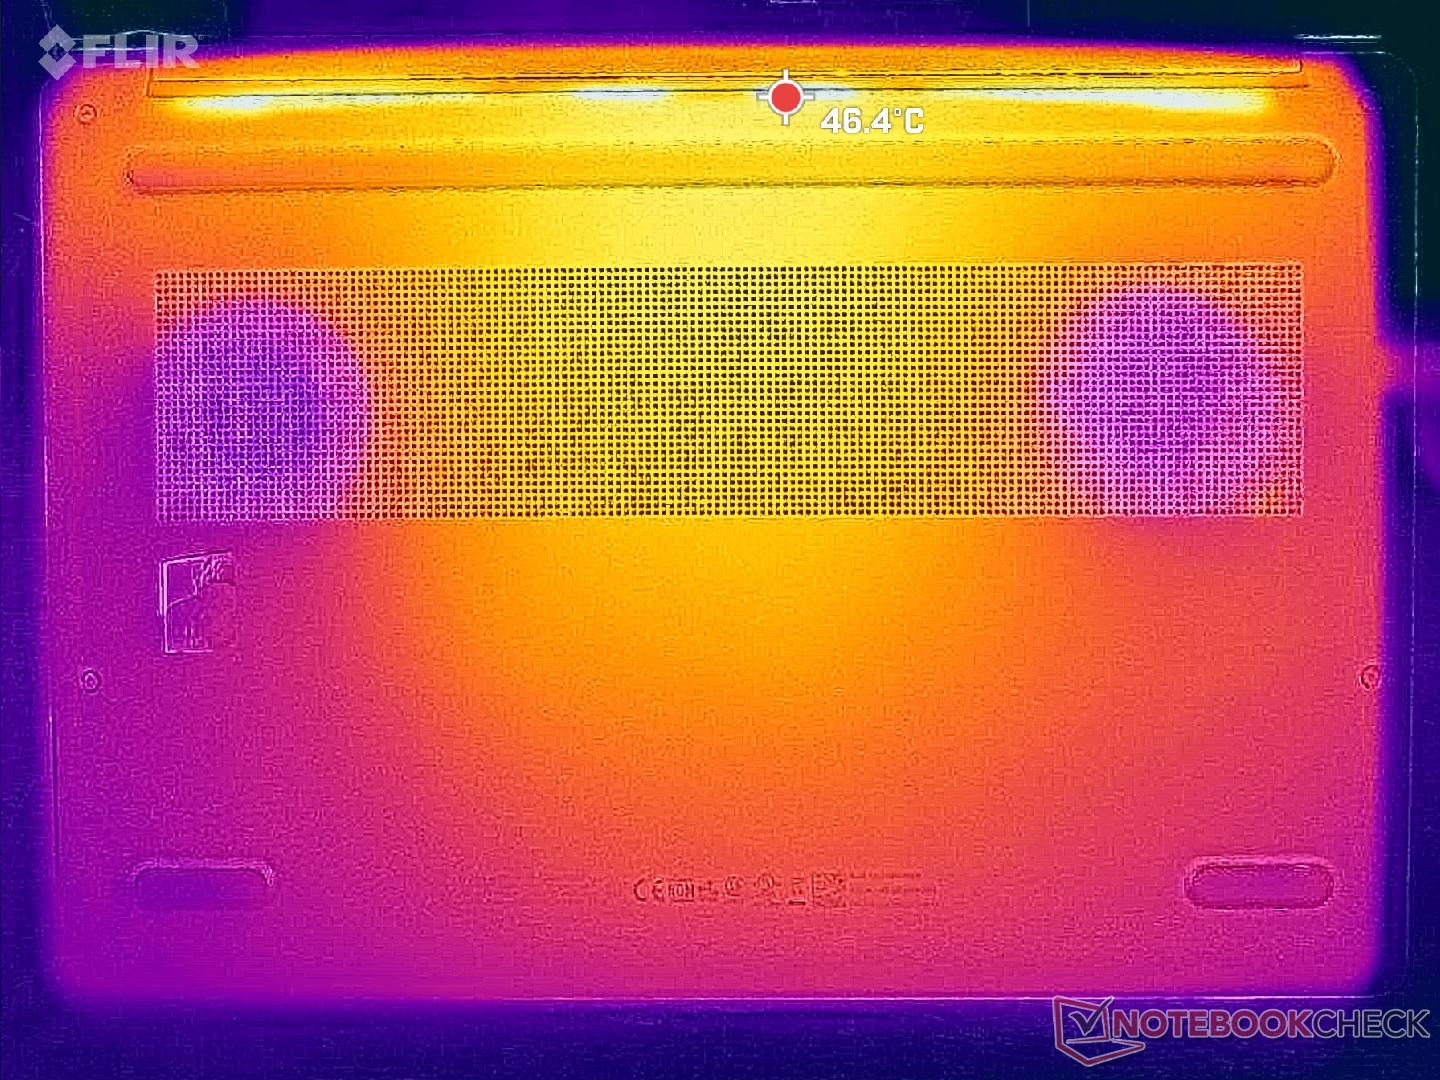
运行苛刻负载时的平均表面温度比 戴尔Precision 5490但比 MacBook Pro 14 低。虽然热点位于键盘中心,但由于内部结构密集,外形小巧,掌托也会明显变热。
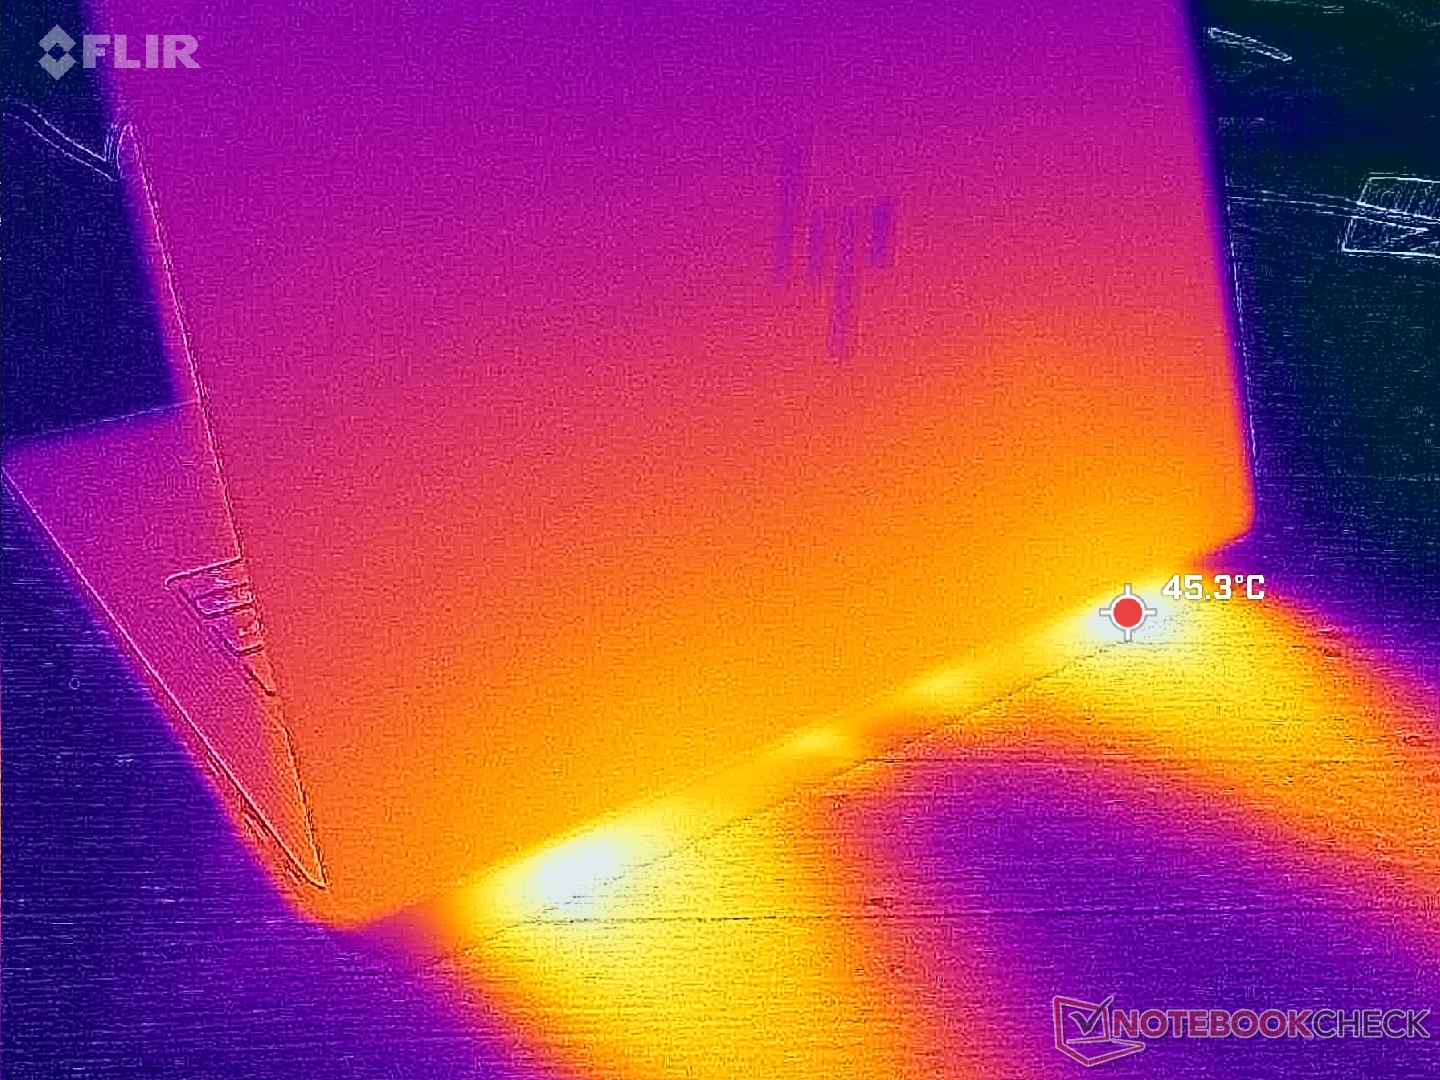
(±) The maximum temperature on the upper side is 41.4 °C / 107 F, compared to the average of 38.2 °C / 101 F, ranging from 22.2 to 69.8 °C for the class Workstation.
(+) The bottom heats up to a maximum of 36.6 °C / 98 F, compared to the average of 41.2 °C / 106 F
(±) In idle usage, the average temperature for the upper side is 32.5 °C / 91 F, compared to the device average of 32 °C / 90 F.
(+) The palmrests and touchpad are reaching skin temperature as a maximum (32 °C / 89.6 F) and are therefore not hot.
(-) The average temperature of the palmrest area of similar devices was 27.8 °C / 82 F (-4.2 °C / -7.6 F).

| HP ZBook Ultra G1a 14 AMD Ryzen AI Max+ PRO 395, AMD Radeon RX 8060S | HP ZBook Firefly 14 G11 Intel Core Ultra 7 165H, NVIDIA RTX A500 Laptop GPU | Lenovo ThinkPad X1 Carbon Gen 13 21NS0010GE Intel Core Ultra 7 258V, Intel Arc Graphics 140V | Dell Precision 5000 5490 Intel Core Ultra 9 185H, NVIDIA RTX 3000 Ada Generation Laptop GPU | Asus ExpertBook P5 P5405-NZ0102X Intel Core Ultra 7 258V, Intel Arc Graphics 140V | Apple MacBook Pro 14 2024 M4 Pro Apple M4 Pro (14 cores), Apple M4 Pro 20-Core GPU | |
|---|---|---|---|---|---|---|
| Heat | -2% | 6% | 2% | 8% | 9% | |
| Maximum Upper Side * | 41.4 | 42.8 -3% | 42.3 -2% | 43.2 -4% | 41.6 -0% | 47.3 -14% |
| Maximum Bottom * | 36.6 | 44 -20% | 40.1 -10% | 38.4 -5% | 43.2 -18% | 44.2 -21% |
| Idle Upper Side * | 34 | 30.6 10% | 27.3 20% | 31.6 7% | 25.7 24% | 22.1 35% |
| Idle Bottom * | 33.6 | 31.4 7% | 28.3 16% | 30.6 9% | 25.3 25% | 22.1 34% |
* ... smaller is better
发言人
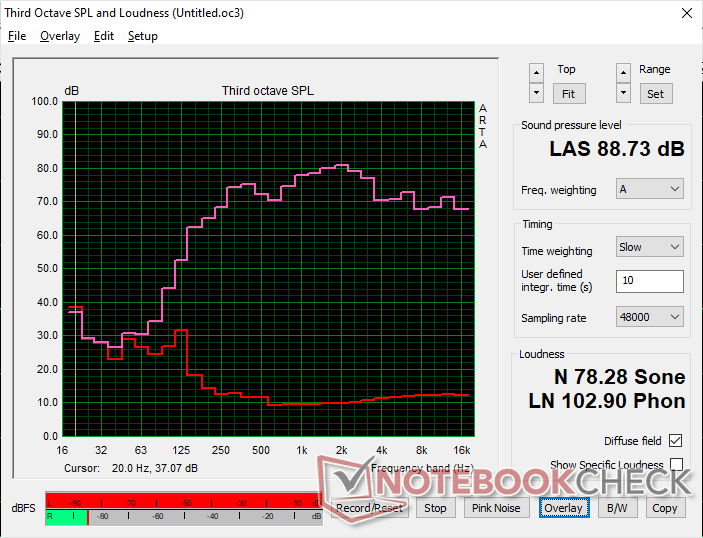
HP ZBook Ultra G1a 14 audio analysis
(+) | speakers can play relatively loud (88.7 dB)
Bass 100 - 315 Hz
(±) | reduced bass - on average 11.8% lower than median
(±) | linearity of bass is average (11% delta to prev. frequency)
Mids 400 - 2000 Hz
(+) | balanced mids - only 4.5% away from median
(+) | mids are linear (3.4% delta to prev. frequency)
Highs 2 - 16 kHz
(+) | balanced highs - only 3.4% away from median
(+) | highs are linear (4.3% delta to prev. frequency)
Overall 100 - 16.000 Hz
(+) | overall sound is linear (10.4% difference to median)
Compared to same class
» 6% of all tested devices in this class were better, 4% similar, 90% worse
» The best had a delta of 7%, average was 18%, worst was 35%
Compared to all devices tested
» 4% of all tested devices were better, 1% similar, 94% worse
» The best had a delta of 4%, average was 24%, worst was 134%
Apple MacBook Pro 16 2021 M1 Pro audio analysis
(+) | speakers can play relatively loud (84.7 dB)
Bass 100 - 315 Hz
(+) | good bass - only 3.8% away from median
(+) | bass is linear (5.2% delta to prev. frequency)
Mids 400 - 2000 Hz
(+) | balanced mids - only 1.3% away from median
(+) | mids are linear (2.1% delta to prev. frequency)
Highs 2 - 16 kHz
(+) | balanced highs - only 1.9% away from median
(+) | highs are linear (2.7% delta to prev. frequency)
Overall 100 - 16.000 Hz
(+) | overall sound is linear (4.6% difference to median)
Compared to same class
» 0% of all tested devices in this class were better, 0% similar, 100% worse
» The best had a delta of 5%, average was 18%, worst was 45%
Compared to all devices tested
» 0% of all tested devices were better, 0% similar, 100% worse
» The best had a delta of 4%, average was 24%, worst was 134%
能源管理
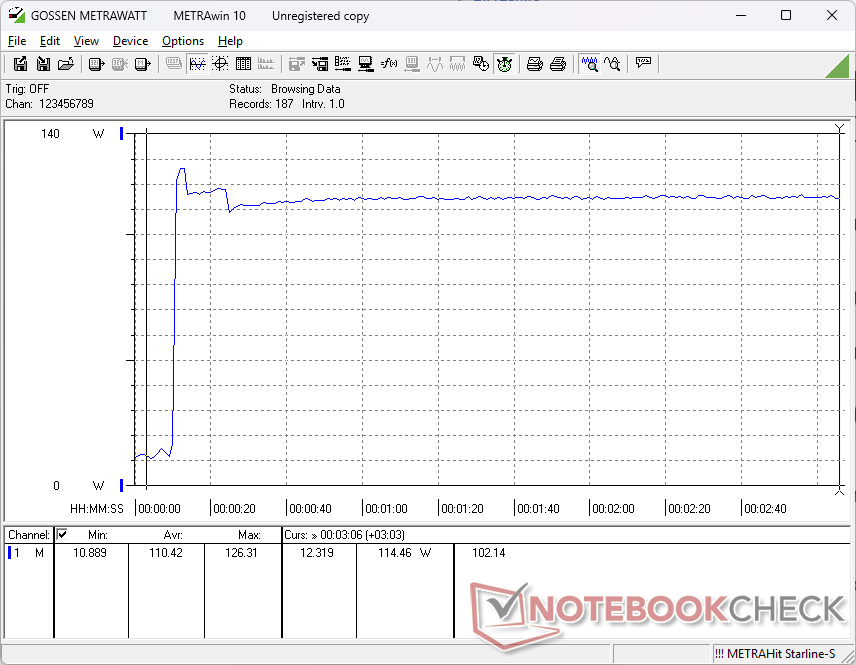
耗电量
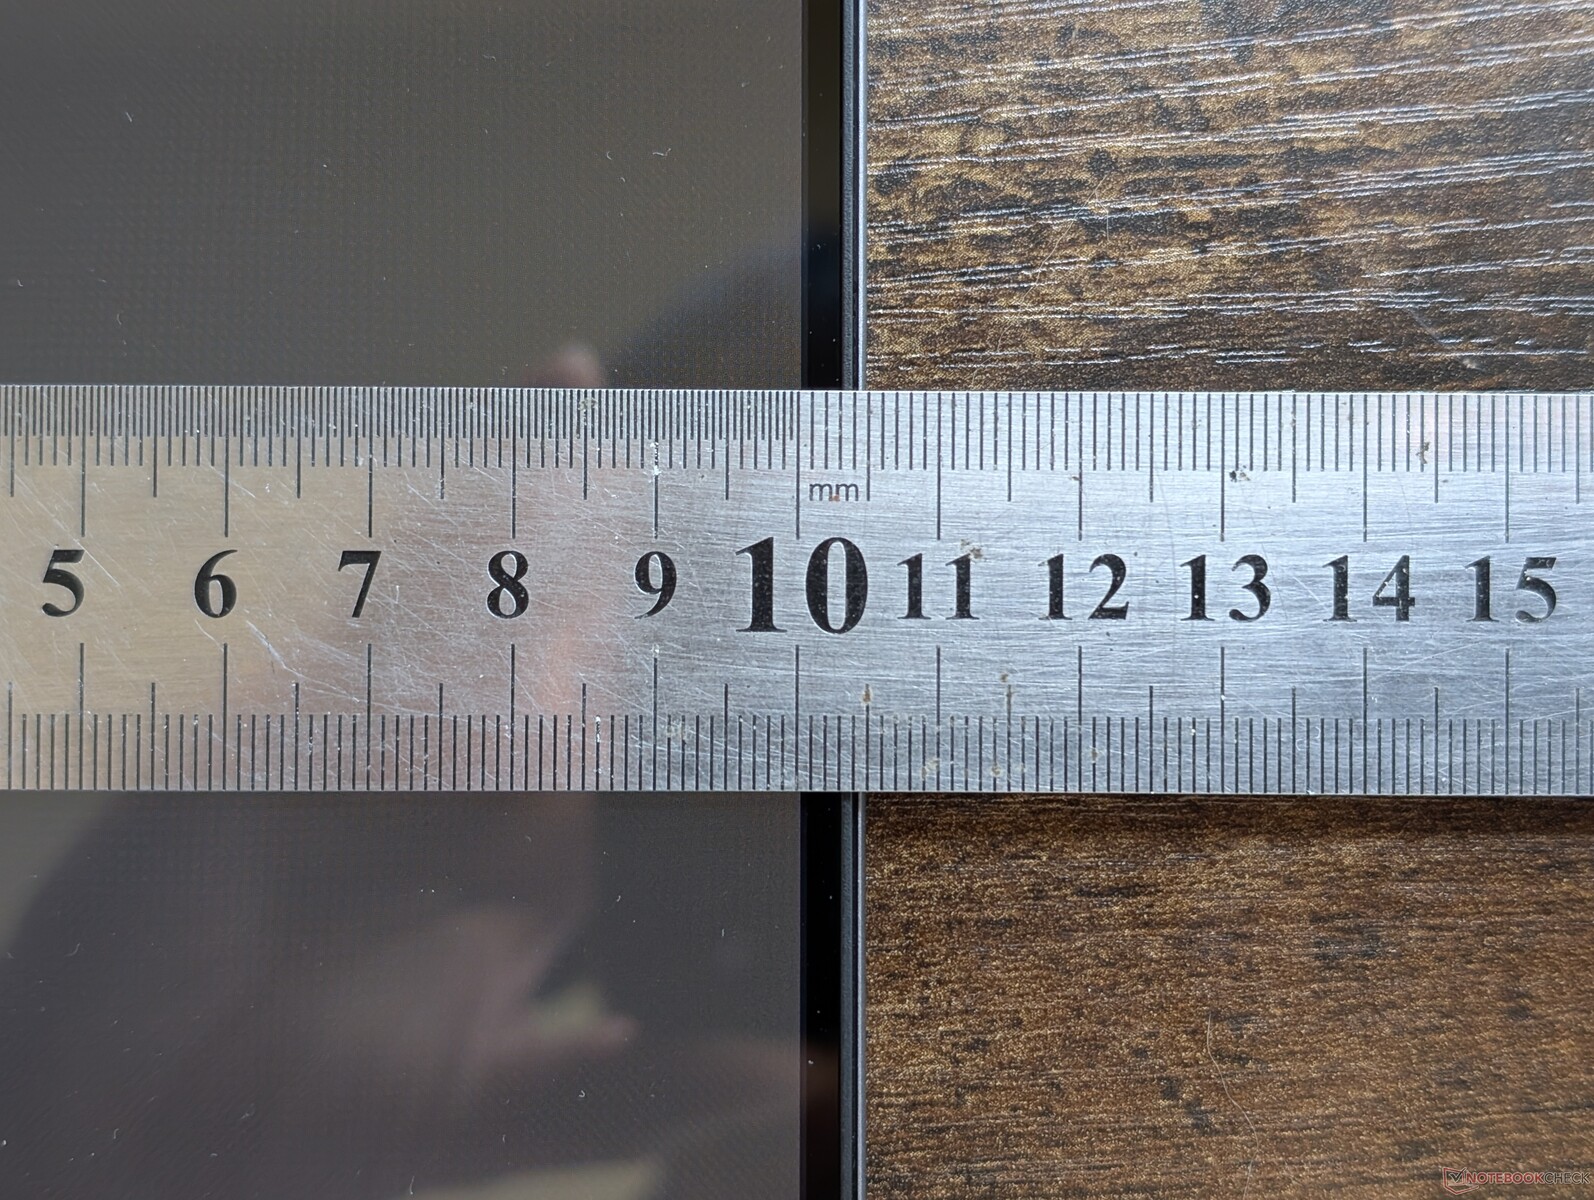
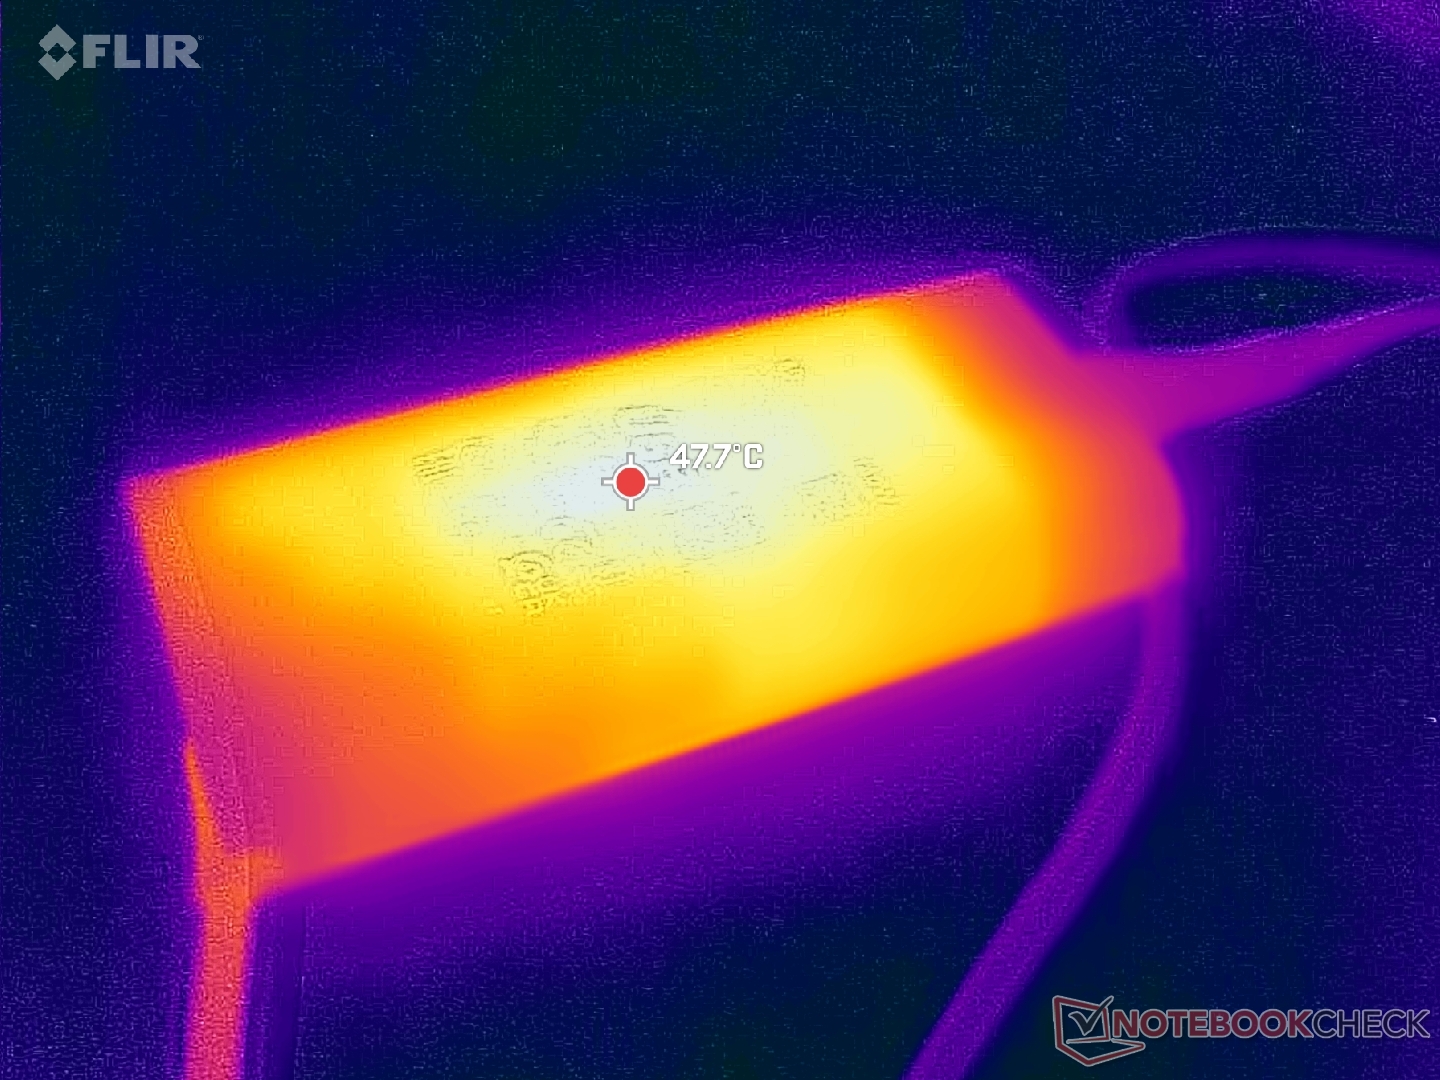
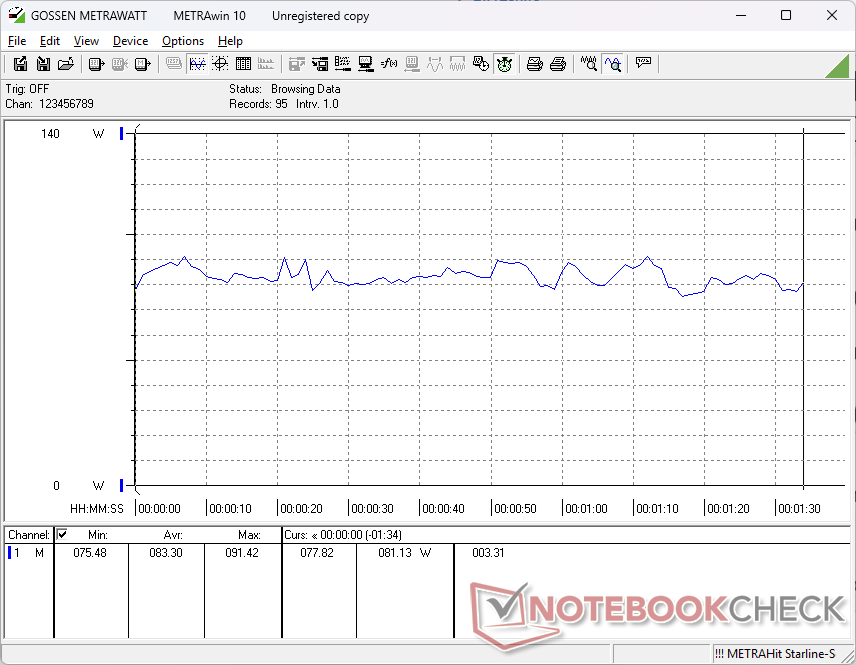
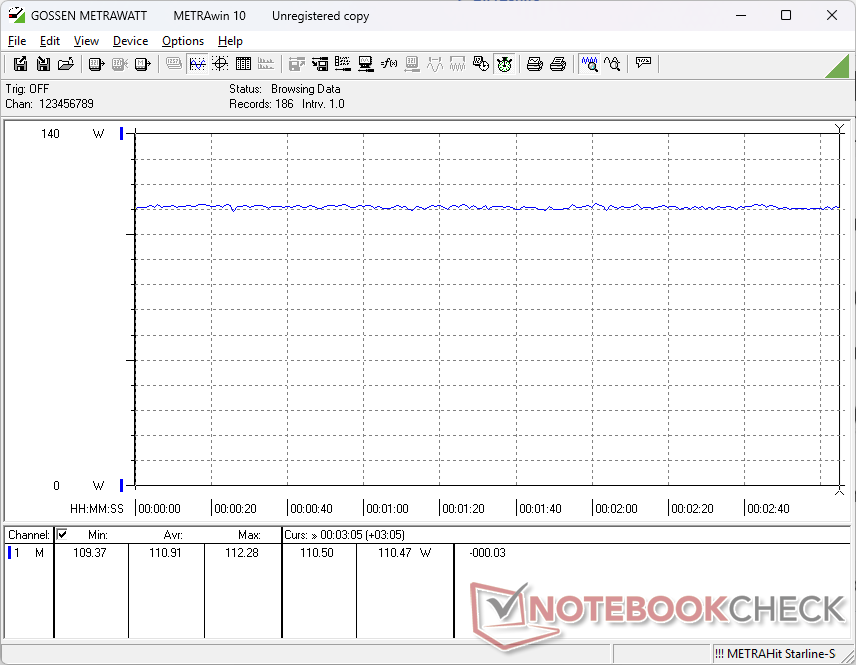
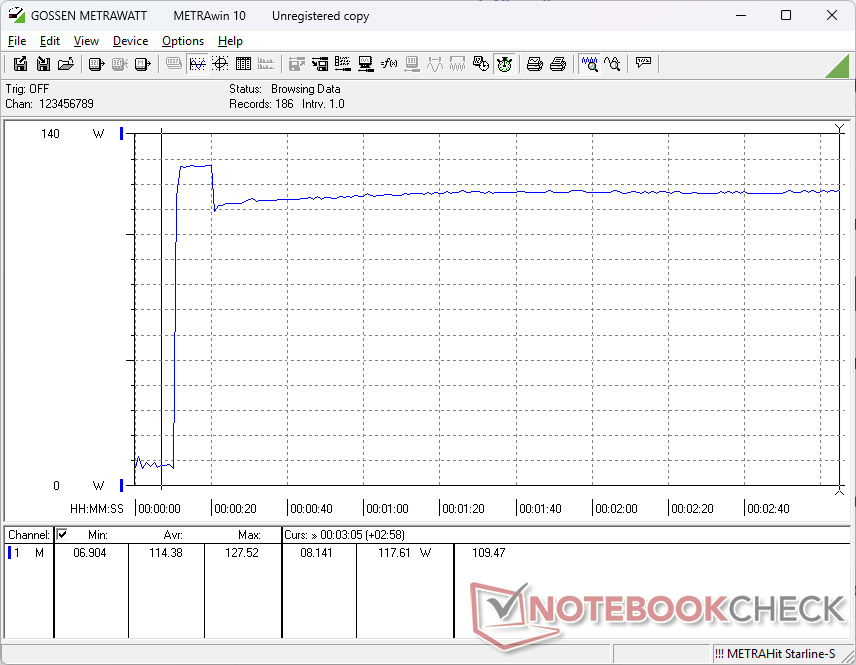
快速的性能并不是免费的,因为惠普对 14 英寸外形尺寸的要求相当高,下面的对比图表就是例证。这一点从厚重(约 14 x 6.5 x 2.8 厘米)的 140 W USB-C 交流适配器上也可见一斑,而大多数 14 英寸笔记本电脑都配备了更小更轻的适配器。
| Off / Standby | |
| Idle | |
| Load |
|
Key:
min: | |
| HP ZBook Ultra G1a 14 Ryzen AI Max+ PRO 395, Radeon RX 8060S, WDC PC SN810 2TB, OLED, 2880x1800, 14" | HP ZBook Firefly 14 G11 Ultra 7 165H, RTX A500 Laptop GPU, Kioxia XG8 KXG80ZNV512G, IPS, 2560x1600, 14" | Lenovo ThinkPad X1 Carbon Gen 13 21NS0010GE Core Ultra 7 258V, Arc 140V, SK hynix PCB01 HFS001TFM9X179N GL, OLED, 2880x1800, 14" | Dell Precision 5000 5490 Ultra 9 185H, NVIDIA RTX 3000 Ada Generation Laptop GPU, Kioxia XG8 KXG80ZNV1T02, IPS, 2560x1600, 14" | Asus ExpertBook P5 P5405-NZ0102X Core Ultra 7 258V, Arc 140V, Western Digital PC SN5000S SDEQNSJ-1T00, IPS LED, 2560x1600, 14" | Apple MacBook Pro 14 2024 M4 Pro M4 Pro (14 cores), M4 Pro 20-Core GPU, Apple SSD AP2048Z, MiniLED, 3024x1964, 14.2" | |
|---|---|---|---|---|---|---|
| Power Consumption | 12% | 53% | -32% | 40% | 19% | |
| Idle Minimum * | 6.9 | 6.6 4% | 4.7 32% | 11.1 -61% | 3.9 43% | 2.17 69% |
| Idle Average * | 7.7 | 12.7 -65% | 5.7 26% | 14.8 -92% | 8.9 -16% | 10.9 -42% |
| Idle Maximum * | 14.7 | 13.3 10% | 6.1 59% | 16.5 -12% | 9.6 35% | 11 25% |
| Load Average * | 83.3 | 67 20% | 29.8 64% | 70.1 16% | 43.4 48% | 74.3 11% |
| Cyberpunk 2077 ultra external monitor * | 110.5 | 58.1 47% | 34.1 69% | 41.8 62% | 80.5 27% | |
| Cyberpunk 2077 ultra * | 110.9 | 63.4 43% | 35.3 68% | 42.8 61% | ||
| Load Maximum * | 126.3 | 94.9 25% | 60.1 52% | 137.5 -9% | 64.1 49% | 98.1 22% |
| Witcher 3 ultra * | 93.1 |
* ... smaller is better
Power Consumption Cyberpunk / Stress Test
Power Consumption external Monitor
电池寿命
总体运行时间比许多 14 英寸笔记本电脑短,部分原因是上文提到的消耗水平普遍较高。
| HP ZBook Ultra G1a 14 Ryzen AI Max+ PRO 395, Radeon RX 8060S, 74.5 Wh | HP ZBook Firefly 14 G11 Ultra 7 165H, RTX A500 Laptop GPU, 56 Wh | Lenovo ThinkPad X1 Carbon Gen 13 21NS0010GE Core Ultra 7 258V, Arc 140V, 57 Wh | Dell Precision 5000 5490 Ultra 9 185H, NVIDIA RTX 3000 Ada Generation Laptop GPU, 72 Wh | Asus ExpertBook P5 P5405-NZ0102X Core Ultra 7 258V, Arc 140V, 63 Wh | Apple MacBook Pro 14 2024 M4 Pro M4 Pro (14 cores), M4 Pro 20-Core GPU, 72.6 Wh | |
|---|---|---|---|---|---|---|
| Battery Runtime | 23% | 56% | 56% | 131% | 125% | |
| WiFi v1.3 | 421 | 517 23% | 658 56% | 658 56% | 973 131% | 947 125% |
| Cyberpunk 2077 ultra 150cd | 94 | |||||
| Load | 86 | 173 | ||||
| H.264 | 1186 |
笔记本检查评级
HP ZBook Ultra G1a 14
- 04/11/2025 v8
Allen Ngo
 Total Sustainability Score:
 Potential Competitors in Comparison
Image | Model / Review | Price | Weight | Height | Display |
|---|---|---|---|---|---|
1. 87.4%  | HP ZBook Ultra G1a 14 AMD Ryzen AI Max+ PRO 395 ⎘ AMD Radeon RX 8060S ⎘ 128 GB Memory, 2048 GB SSD | Amazon: 1. $1,099.00 HP ZBook 14 Firefly G11 (Lat... 2. $1,049.00 HP ZBook Firefly G11 14” A... 3. $1,249.99 HP ZBook Firefly G11 Mobile ... List Price: 4000 USD | 1.6 kg | 18.5 mm | 14.00" 2880x1800 243 PPI OLED |
Transparency
The selection of devices to be reviewed is made by our editorial team. The test sample was provided to the author as a loan by the manufacturer or retailer for the purpose of this review. The lender had no influence on this review, nor did the manufacturer receive a copy of this review before publication. There was no obligation to publish this review. We never accept compensation or payment in return for our reviews. As an independent media company, Notebookcheck is not subjected to the authority of manufacturers, retailers or publishers.
This is how Notebookcheck is testing
Every year, Notebookcheck independently reviews hundreds of laptops and smartphones using standardized procedures to ensure that all results are comparable. We have continuously developed our test methods for around 20 years and set industry standards in the process. In our test labs, high-quality measuring equipment is utilized by experienced technicians and editors. These tests involve a multi-stage validation process. Our complex rating system is based on hundreds of well-founded measurements and benchmarks, which maintains objectivity. Further information on our test methods can be found here.

