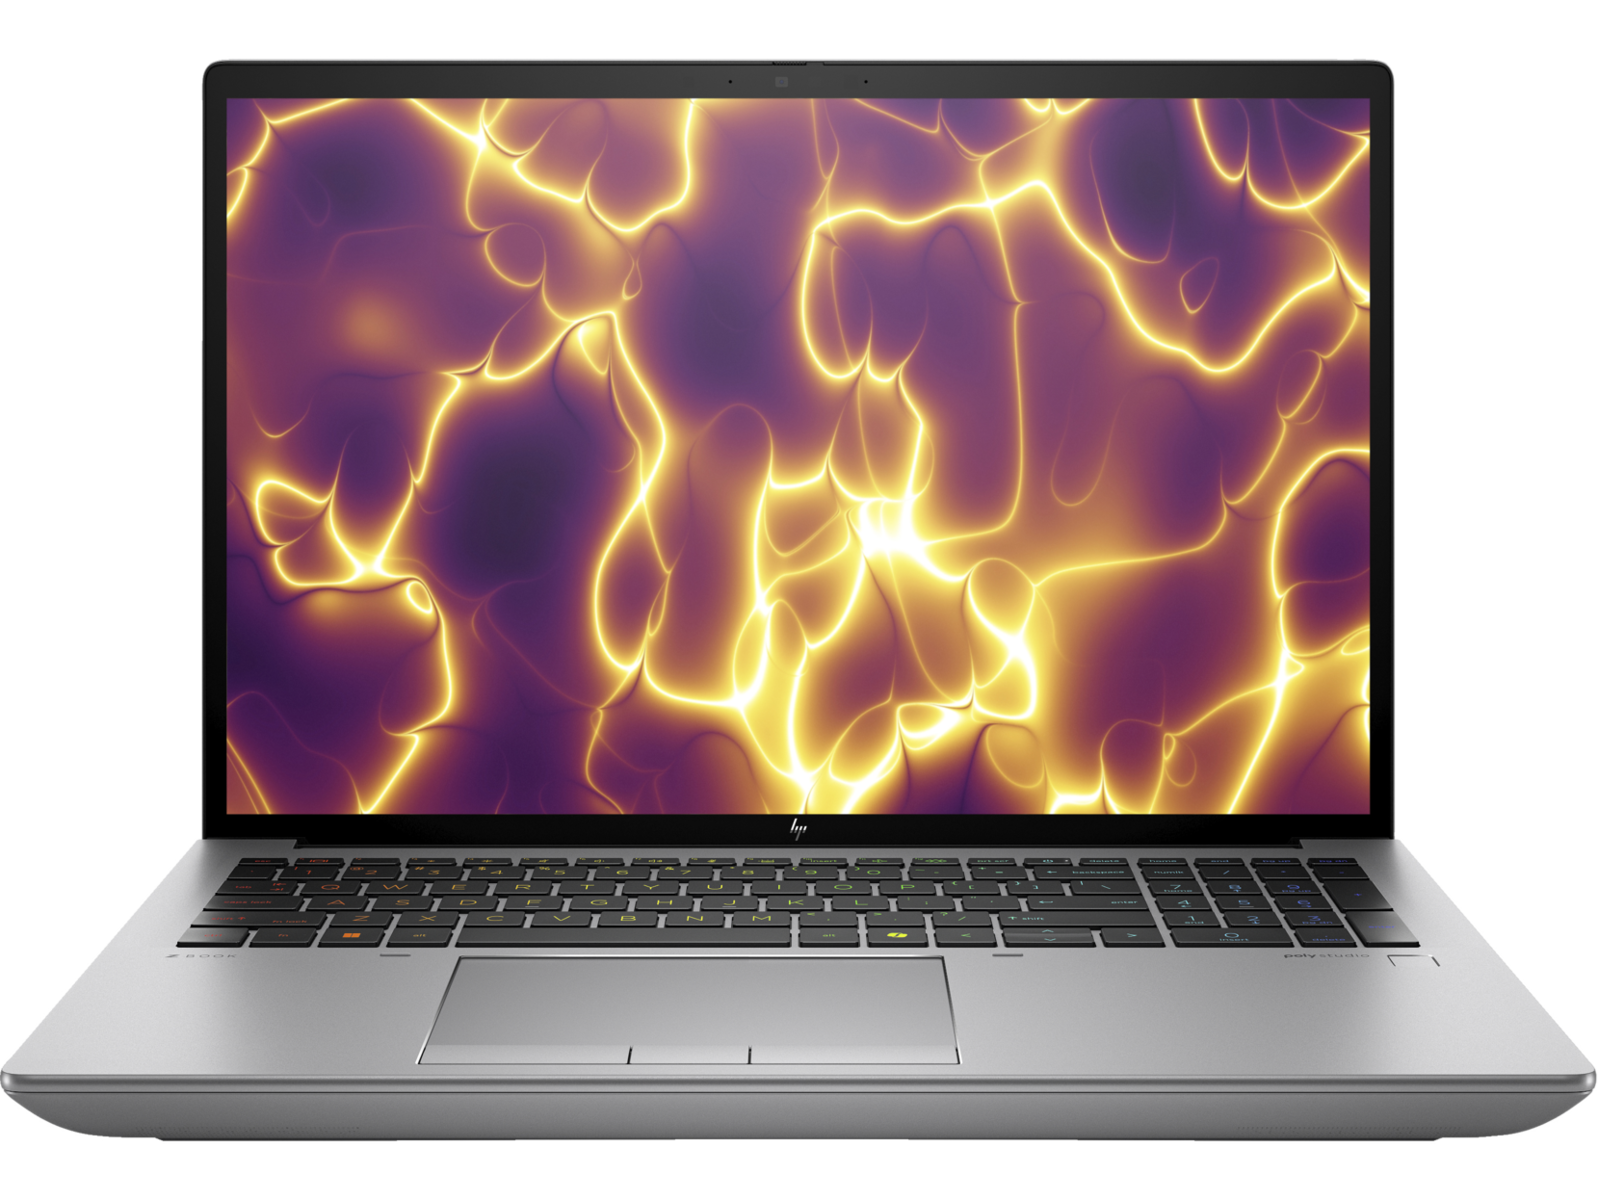
Nvidia RTX 3500 Ada 性能首次亮相:惠普 ZBook Fury 16 G11 工作站评测
2024 ZBook Fury 16 G11 继承了 2023 Fury 16 G10将 Raptor Lake-HX CPU 替换为更新的 Raptor Lake-HX Refresh 选项。除此之外,机箱与 Fury 16 G10 或 Fury 16 G9 保持一致,许多可配置选项也是如此。我们建议您查看我们对 Fury 16 G9了解该机型的更多物理特性。
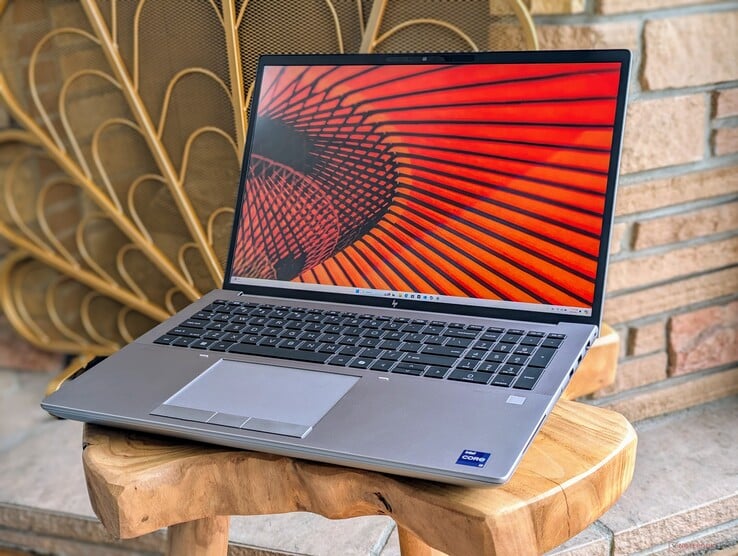
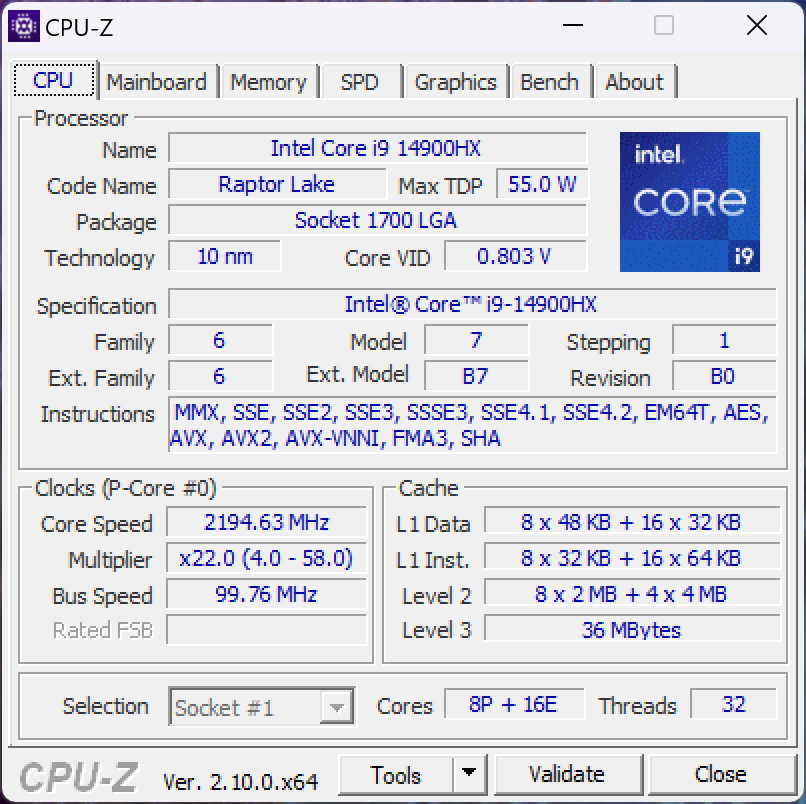
我们的测试机是中高档配置,配备酷睿 i9-14900HX CPU、RTX 3500 Ada GPU 和 120 Hz 3840 x 2400 IPS 显示屏,售价约为 3300 美元。其他 SKU 从酷睿 i5-13600HX 到 RTX 5000 Ada 和 2400p OLED 触摸屏。没有流星湖处理器可供选择。
ZBook Fury 16 G11 的竞争对手包括其他 16 英寸工作站,如 戴尔Precision 5690, 联想 ThinkPad P16 G2或 华硕 ProArt Studiobook 16.
更多惠普评论:
潜在的竞争对手比较
Rating | Version | Date | Model | Weight | Height | Size | Resolution | Price |
|---|---|---|---|---|---|---|---|---|
| 85.9 % | v8 | 08 / 2024 | HP ZBook Fury 16 G11 i9-14900HX, RTX 3500 Ada Generation Laptop | 2.6 kg | 28.5 mm | 16.00" | 3840x2400 | |
| 92.3 % v7 (old) | v7 (old) | 09 / 2023 | HP ZBook Fury 16 G10 i9-13950HX, RTX 5000 Ada Generation Laptop | 2.6 kg | 28.5 mm | 16.00" | 3840x2400 | |
| 91 % v7 (old) | v7 (old) | 06 / 2023 | HP ZBook Fury 16 G9 i9-12950HX, RTX A5500 Laptop GPU | 2.6 kg | 28.5 mm | 16.00" | 3840x2400 | |
| 88.3 % v7 (old) | v7 (old) | 05 / 2024 | Dell Precision 5690 Ultra 9 185H, RTX 5000 Ada Generation Laptop | 2.3 kg | 22.17 mm | 16.00" | 3840x2400 | |
| 90.2 % v7 (old) | v7 (old) | 03 / 2024 | Lenovo ThinkPad P16 G2 21FA000FGE i7-13700HX, RTX 2000 Ada Generation Laptop | 3 kg | 30.23 mm | 16.00" | 2560x1600 | |
| 90.1 % v7 (old) | v7 (old) | 12 / 2023 | Lenovo ThinkPad P1 G6 21FV001KUS i7-13800H, GeForce RTX 4080 Laptop GPU | 1.9 kg | 17.5 mm | 16.00" | 3480x2400 | |
| 86.1 % v7 (old) | v7 (old) | 06 / 2023 | Asus ProArt Studiobook 16 OLED H7604 i9-13980HX, GeForce RTX 4070 Laptop GPU | 2.4 kg | 23.9 mm | 16.00" | 3200x2000 |
案例
将 ZBook Fury 16 G11 与早期产品区分开来的简单方法是查看键盘上的 Co-Pilot 键。除此以外,机身设计与以前相同。

连接性


SD 读卡器
| SD Card Reader | |
| average JPG Copy Test (av. of 3 runs) | |
| Lenovo ThinkPad P1 G6 21FV001KUS (Toshiba Exceria Pro SDXC 64 GB UHS-II) | |
| HP ZBook Fury 16 G11 (Toshiba Exceria Pro SDXC 64 GB UHS-II) | |
| HP ZBook Fury 16 G10 (Toshiba Exceria Pro SDXC 64 GB UHS-II) | |
| HP ZBook Fury 16 G9 (PNY EliteX-PRO60) | |
| Asus ProArt Studiobook 16 OLED H7604 (Angelibird AV Pro V60) | |
| Lenovo ThinkPad P16 G2 21FA000FGE | |
| maximum AS SSD Seq Read Test (1GB) | |
| HP ZBook Fury 16 G11 (Toshiba Exceria Pro SDXC 64 GB UHS-II) | |
| Lenovo ThinkPad P1 G6 21FV001KUS (Toshiba Exceria Pro SDXC 64 GB UHS-II) | |
| HP ZBook Fury 16 G10 (Toshiba Exceria Pro SDXC 64 GB UHS-II) | |
| HP ZBook Fury 16 G9 (PNY EliteX-PRO60) | |
| Lenovo ThinkPad P16 G2 21FA000FGE | |
| Asus ProArt Studiobook 16 OLED H7604 (Angelibird AV Pro V60) | |
交流
无线局域网已从英特尔 AX211 升级到 BE200,以适当支持 Wi-Fi 7。但实际上,大多数用户仍将连接到 Wi-Fi 6 或 6E 接入点。
网络摄像头


维护
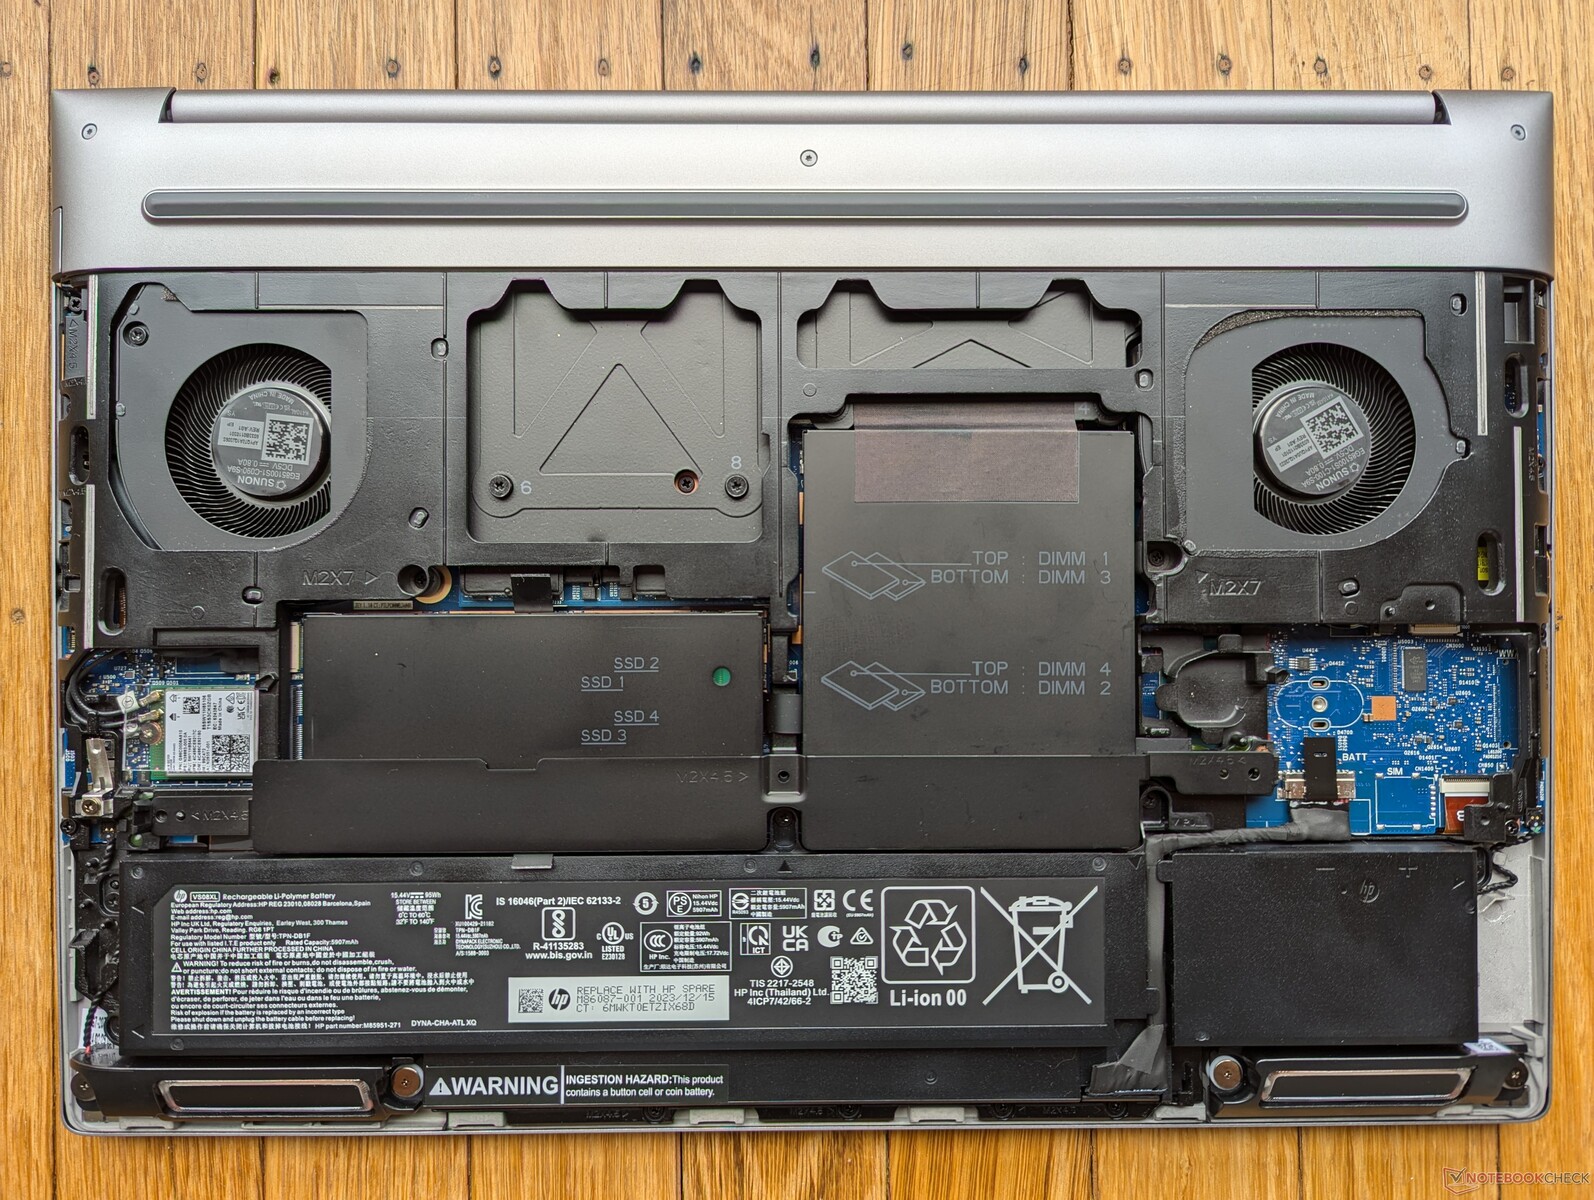
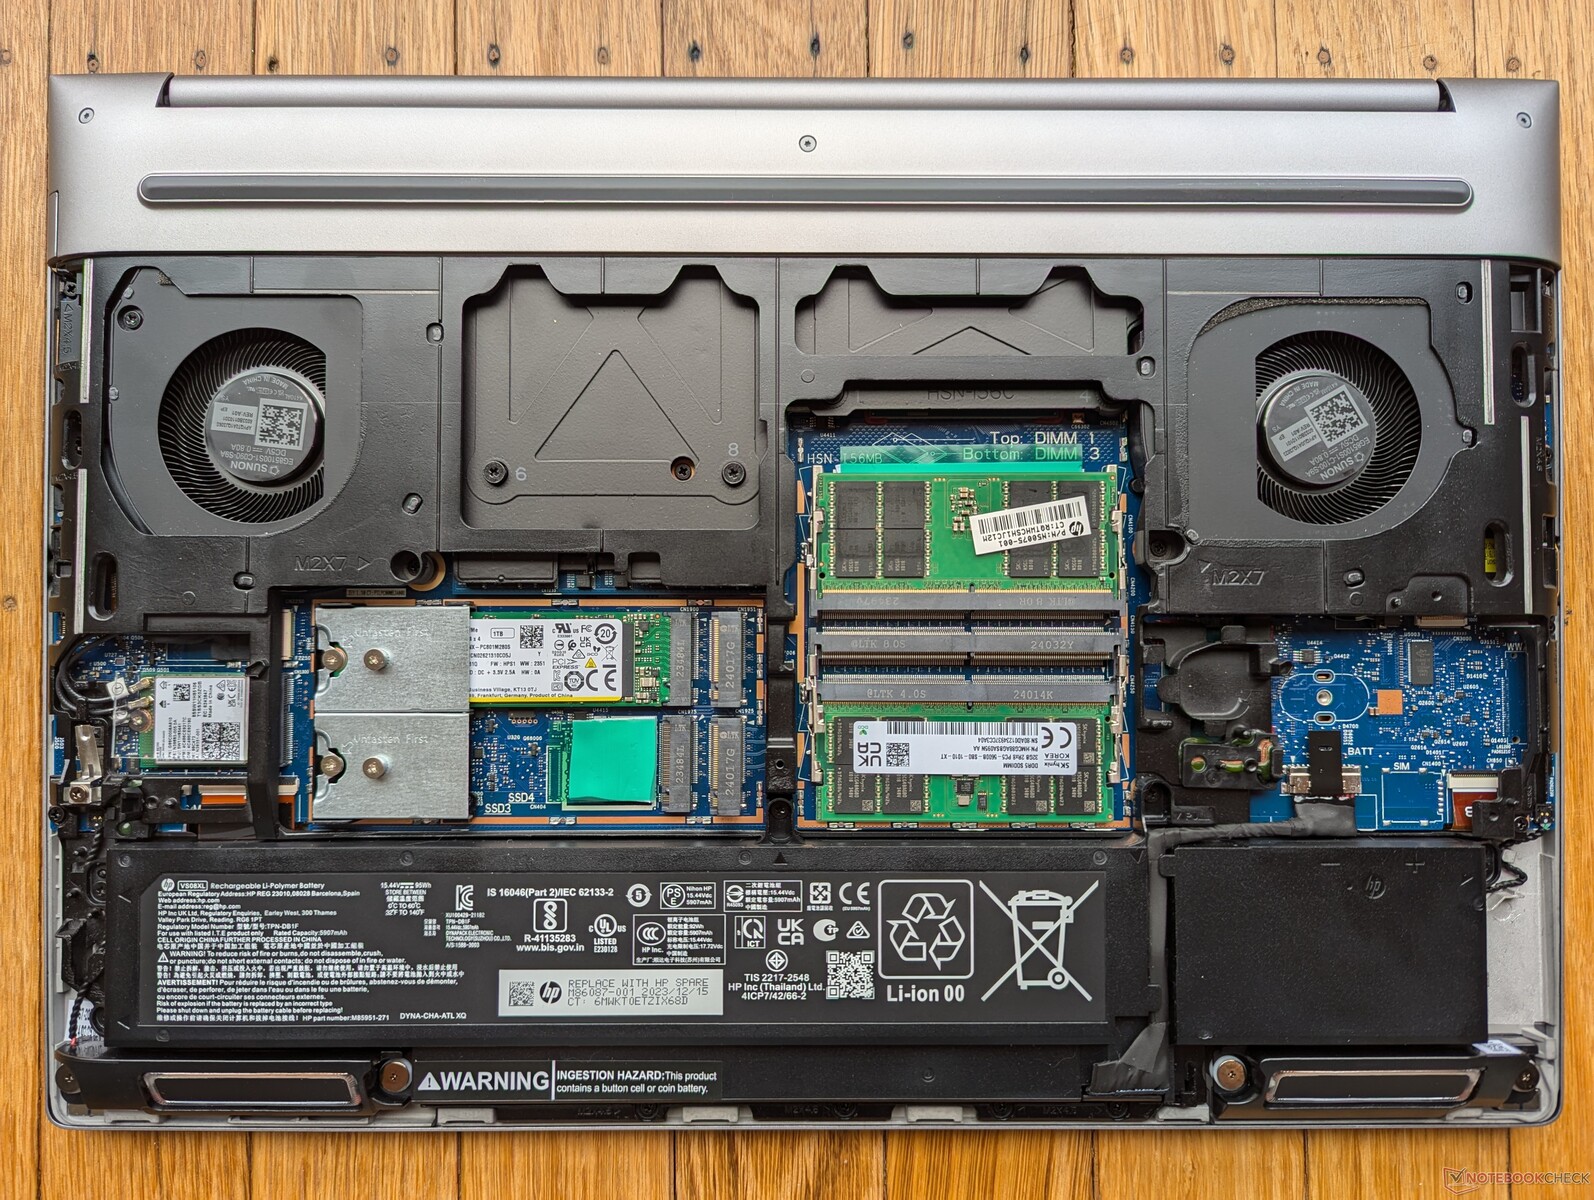
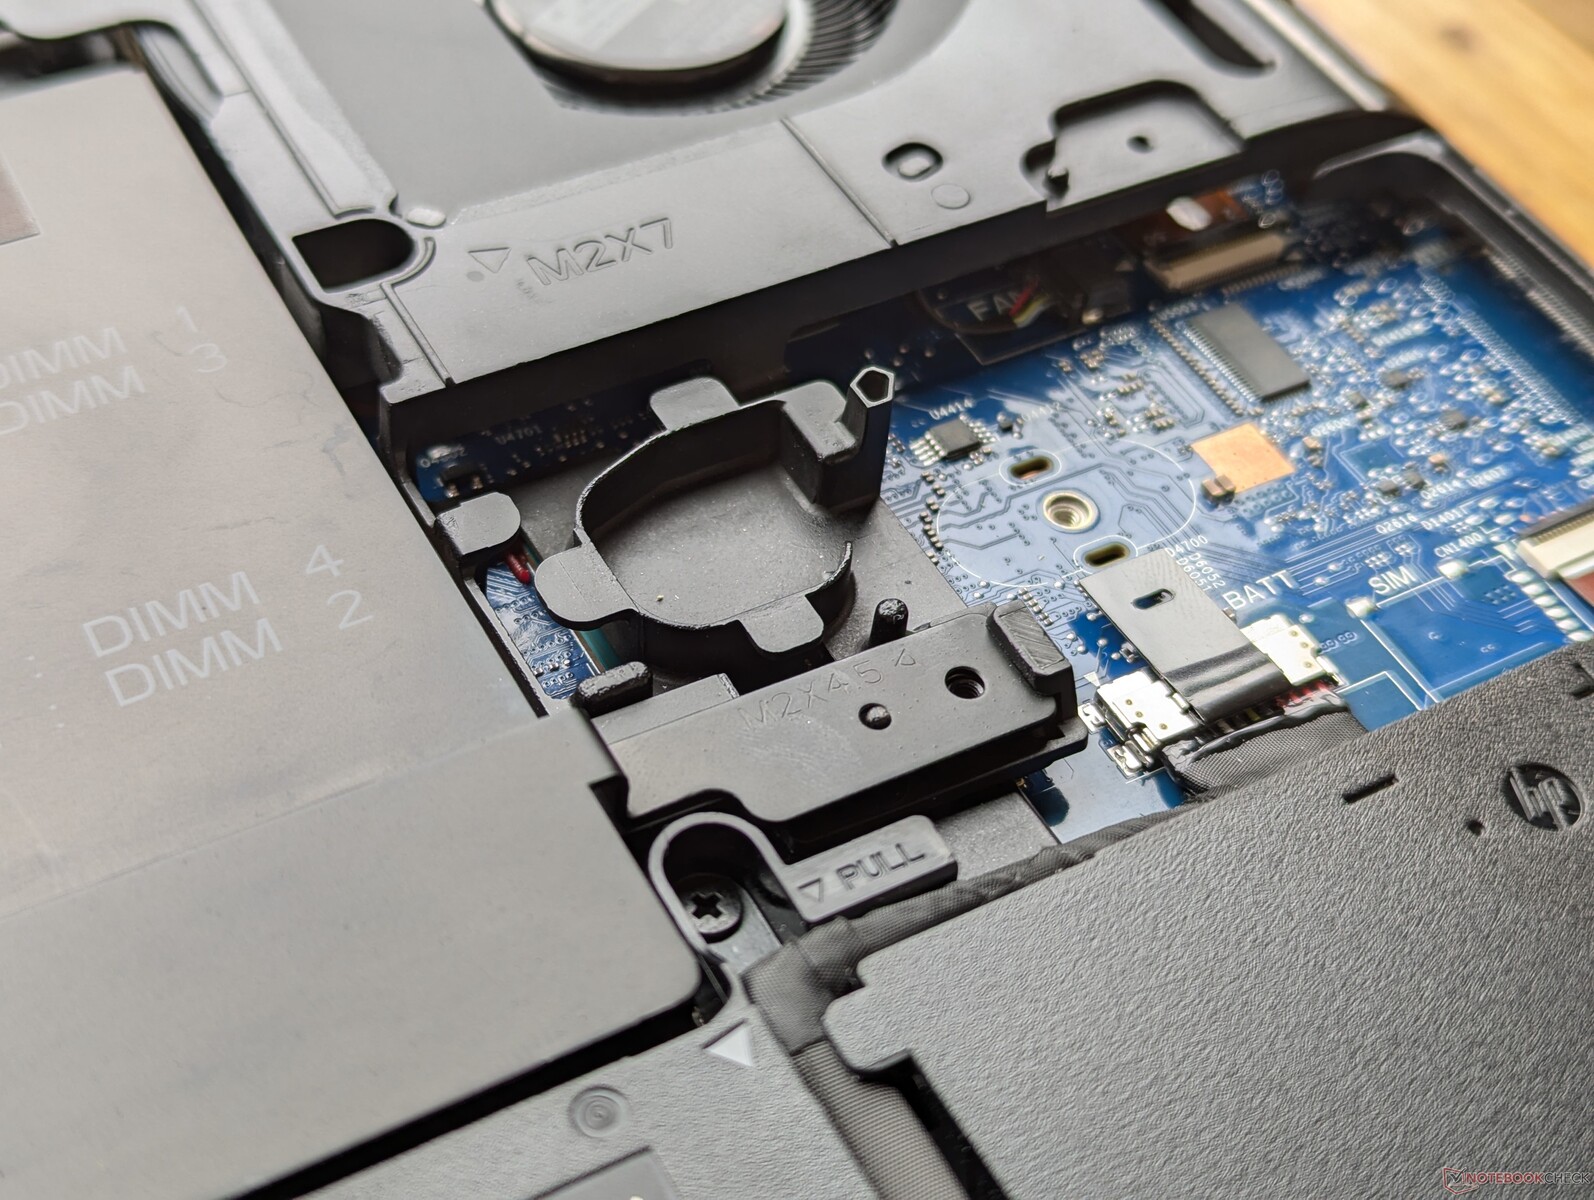
惠普自去年早些时候推出 G9 机型以来,就一直宣称其 Fury 16 系列无需工具即可进行维修。虽然底板无需任何工具即可轻松滑落,但内存和 SODIMM 模块仍然受到铝盖的保护,需要用螺丝刀才能取下。在 G11 机型上,这个铝盖经过了重新设计,用锁扣代替了螺丝,这意味着用户现在无需任何工具即可安装内存模块。
不过,固态硬盘仍用螺丝固定在主板上,因此在更换硬盘时仍需要使用螺丝刀。该系统最多可支持四个固态硬盘和四个内存模块。

可持续性
包装完全可回收,主要由纸张组成。交流适配器是唯一使用塑料包装的物品。
配件和保修
零售包装盒中除了交流适配器和文件外,没有任何其他附件。如果在美国购买,制造商提供三年标准保修。
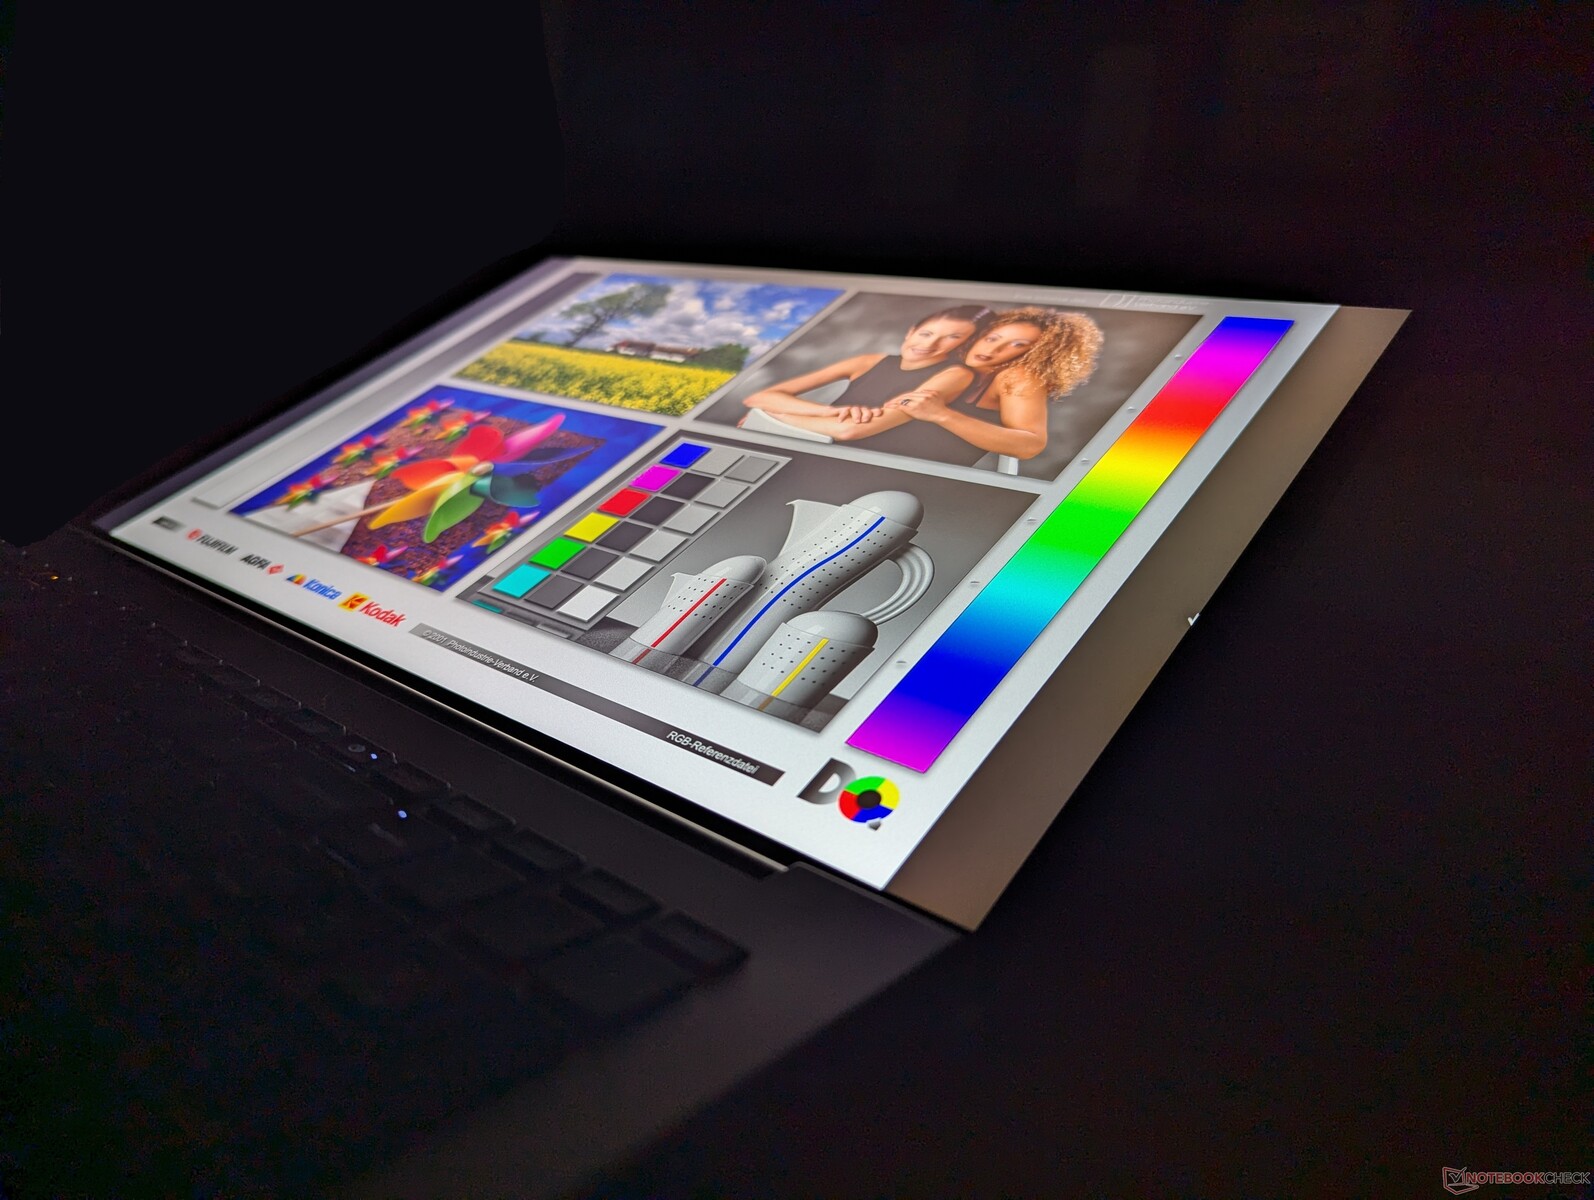
显示屏
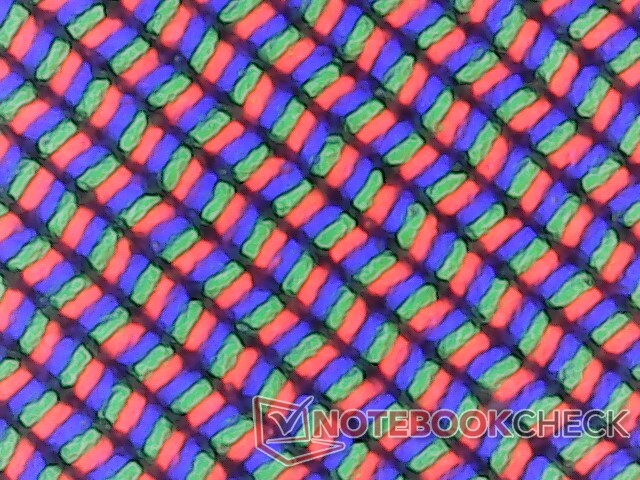
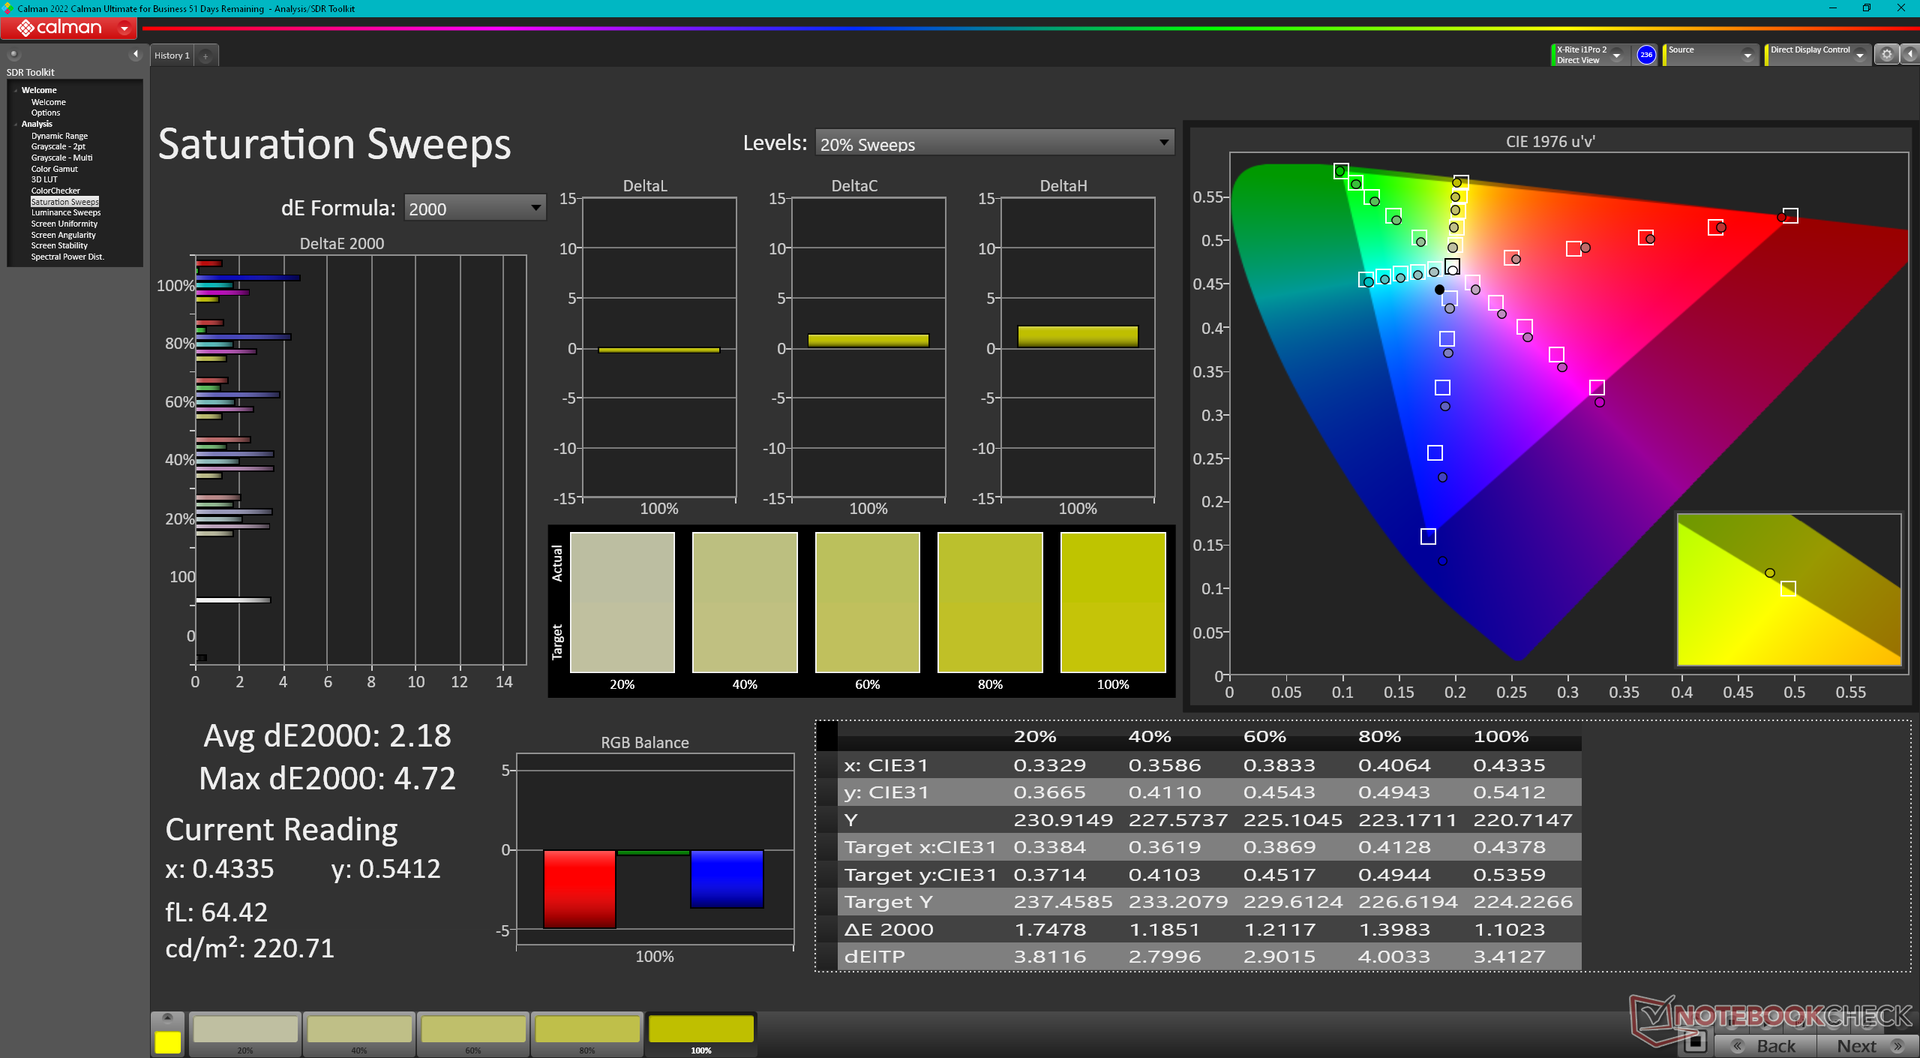
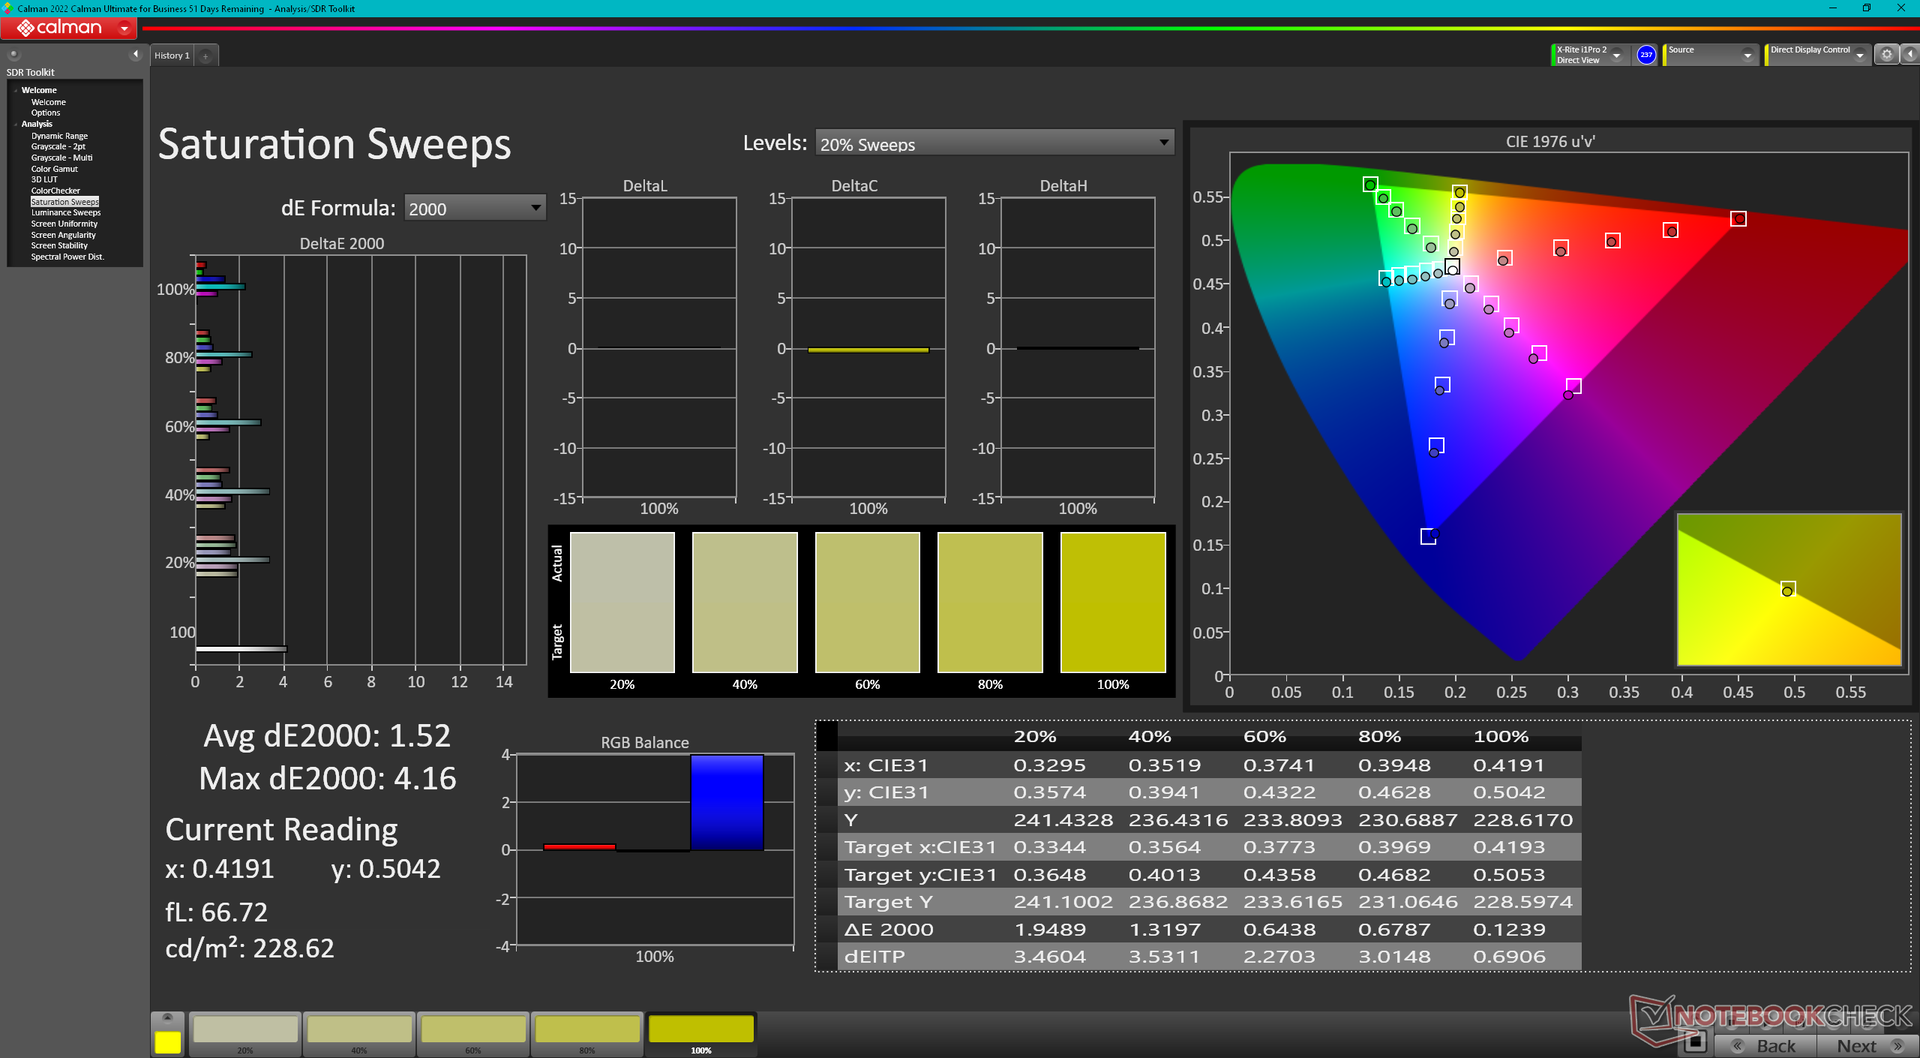
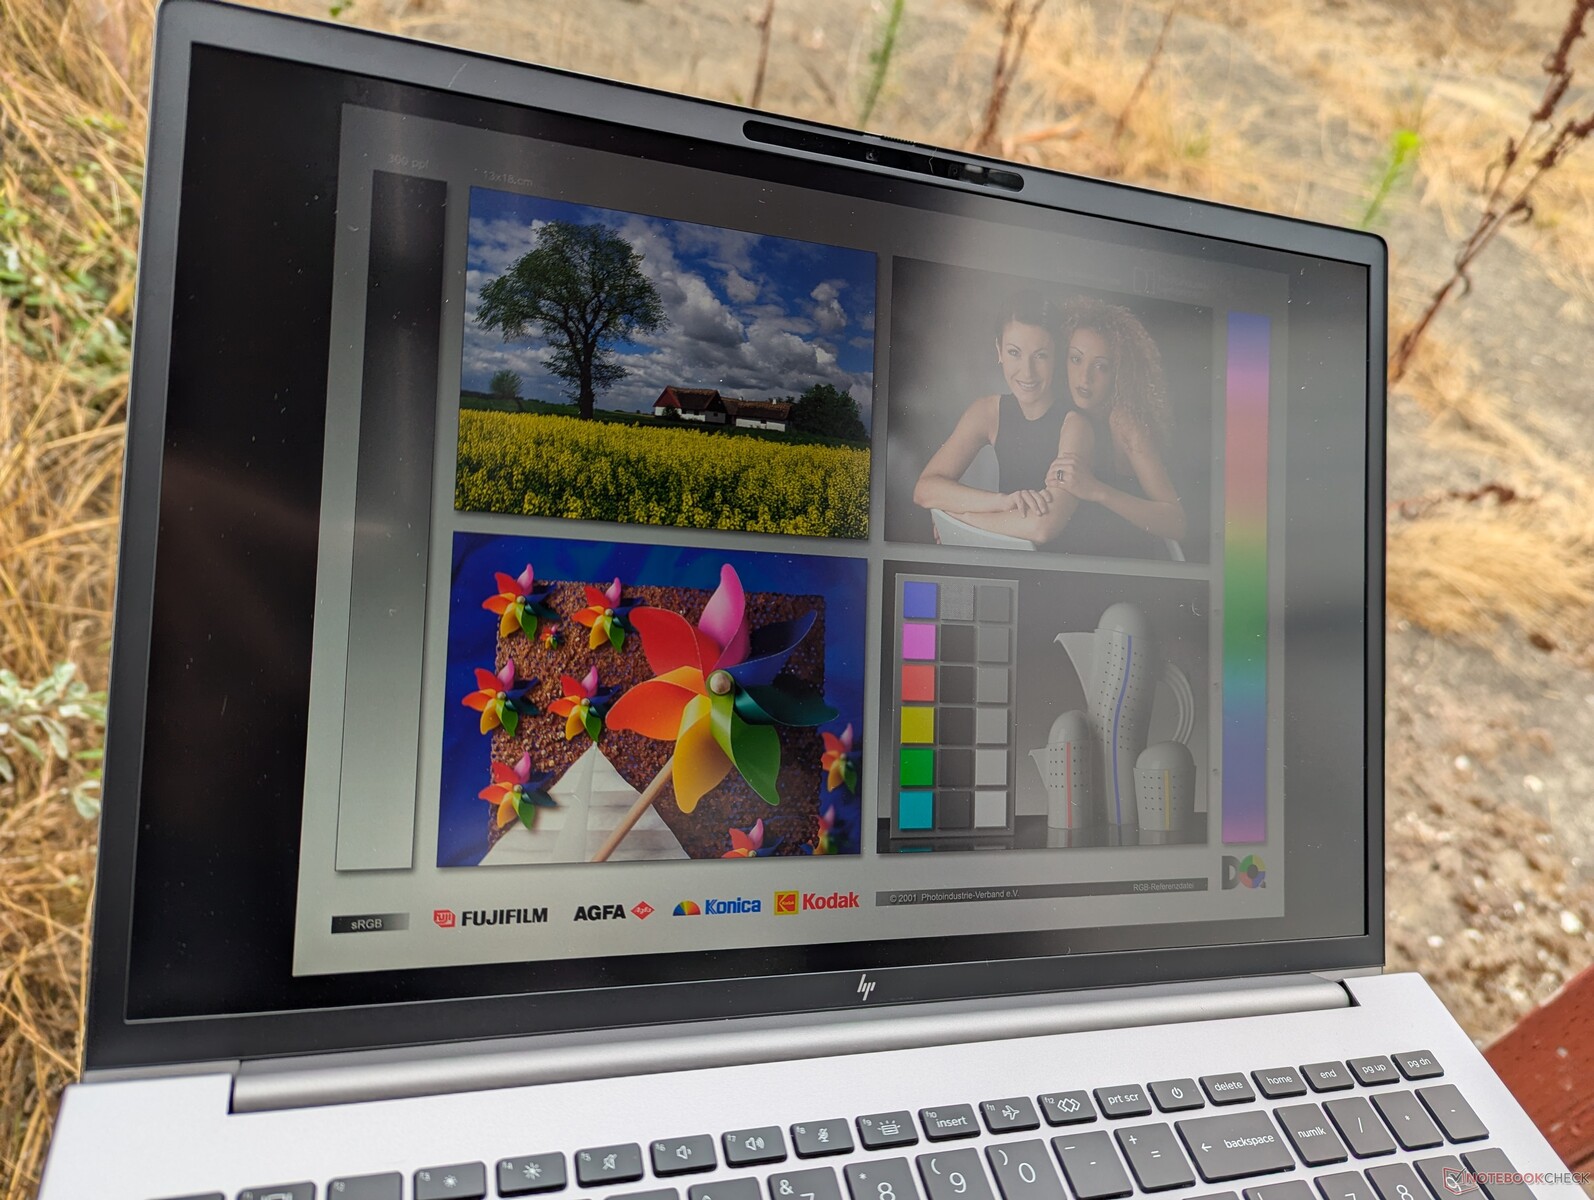
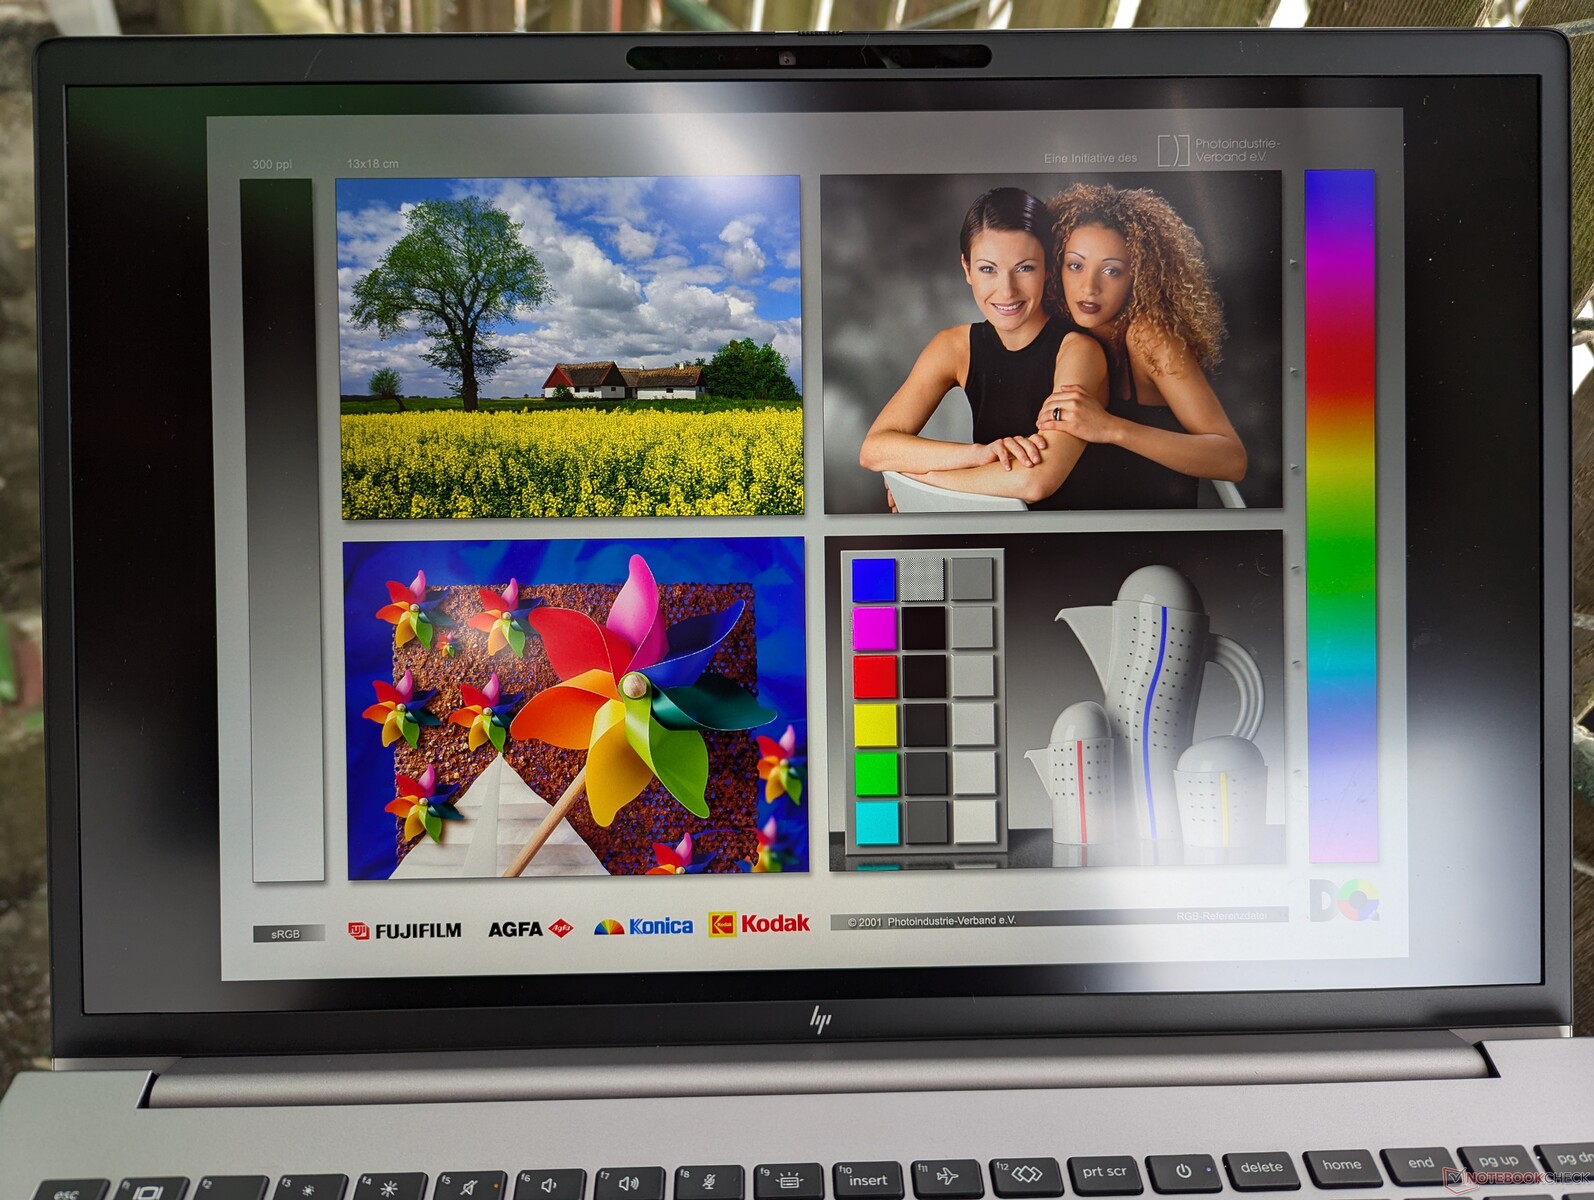
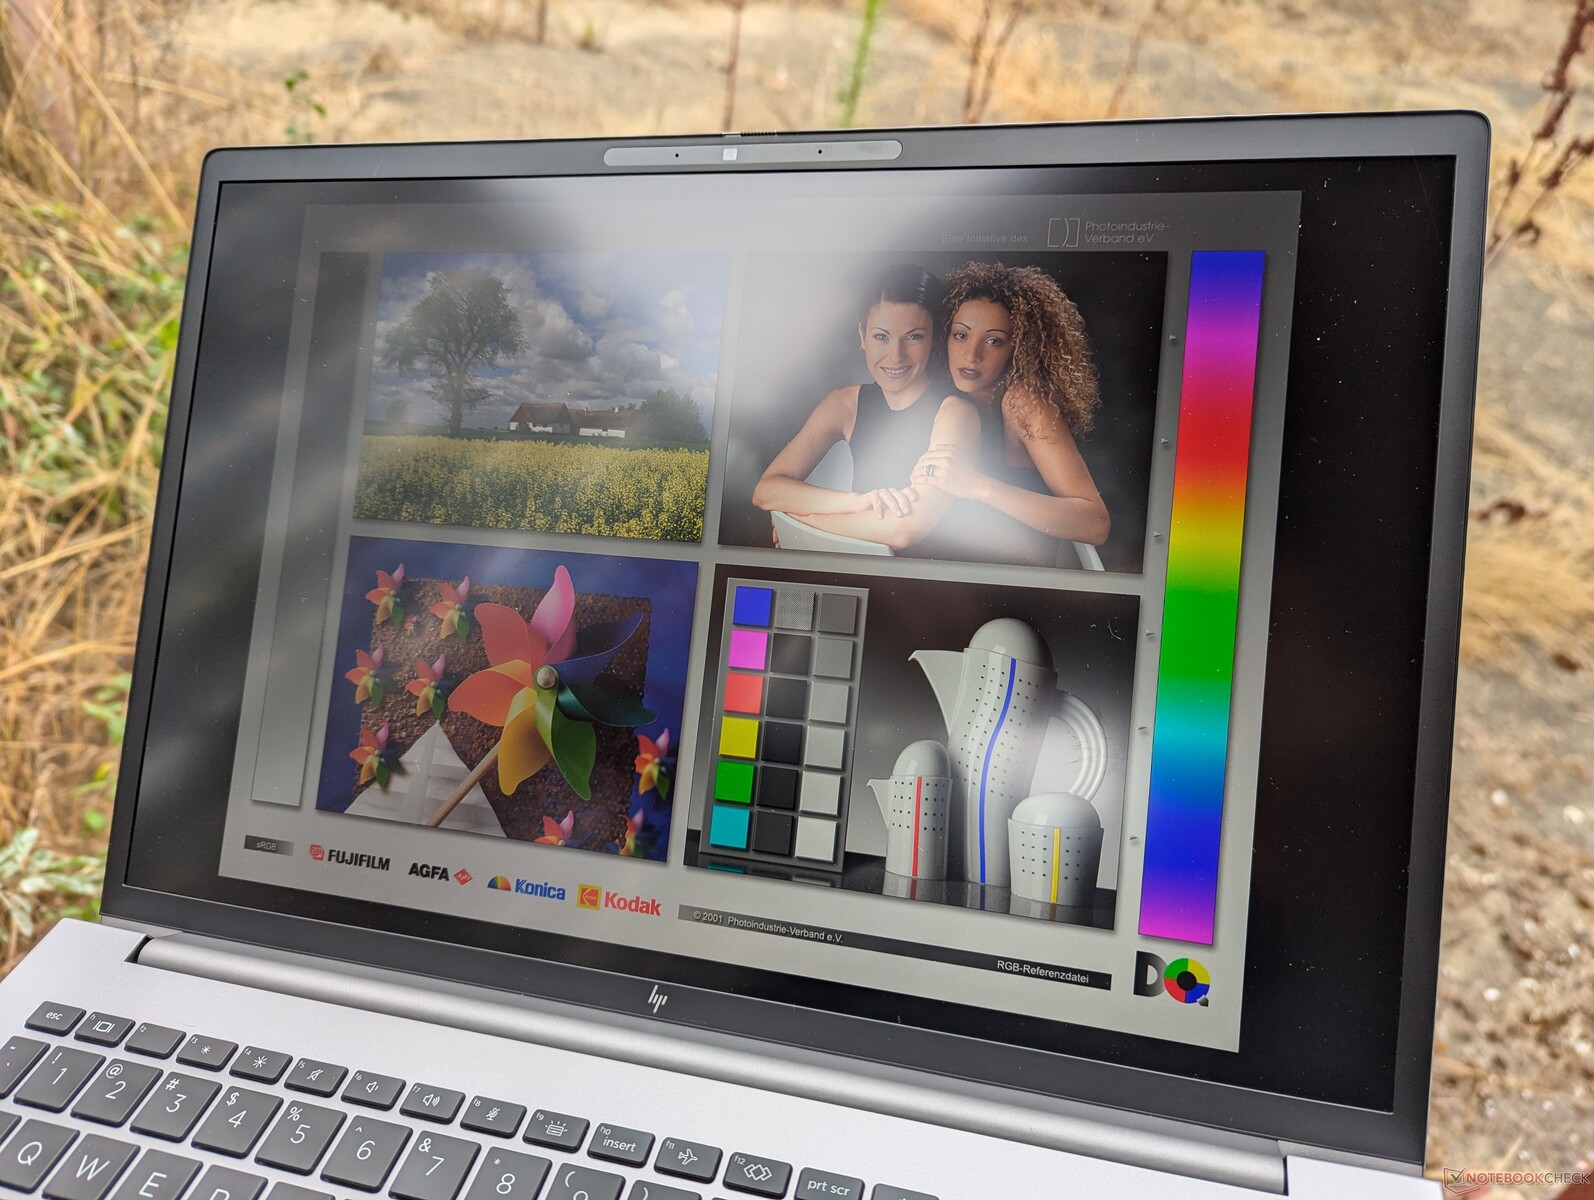
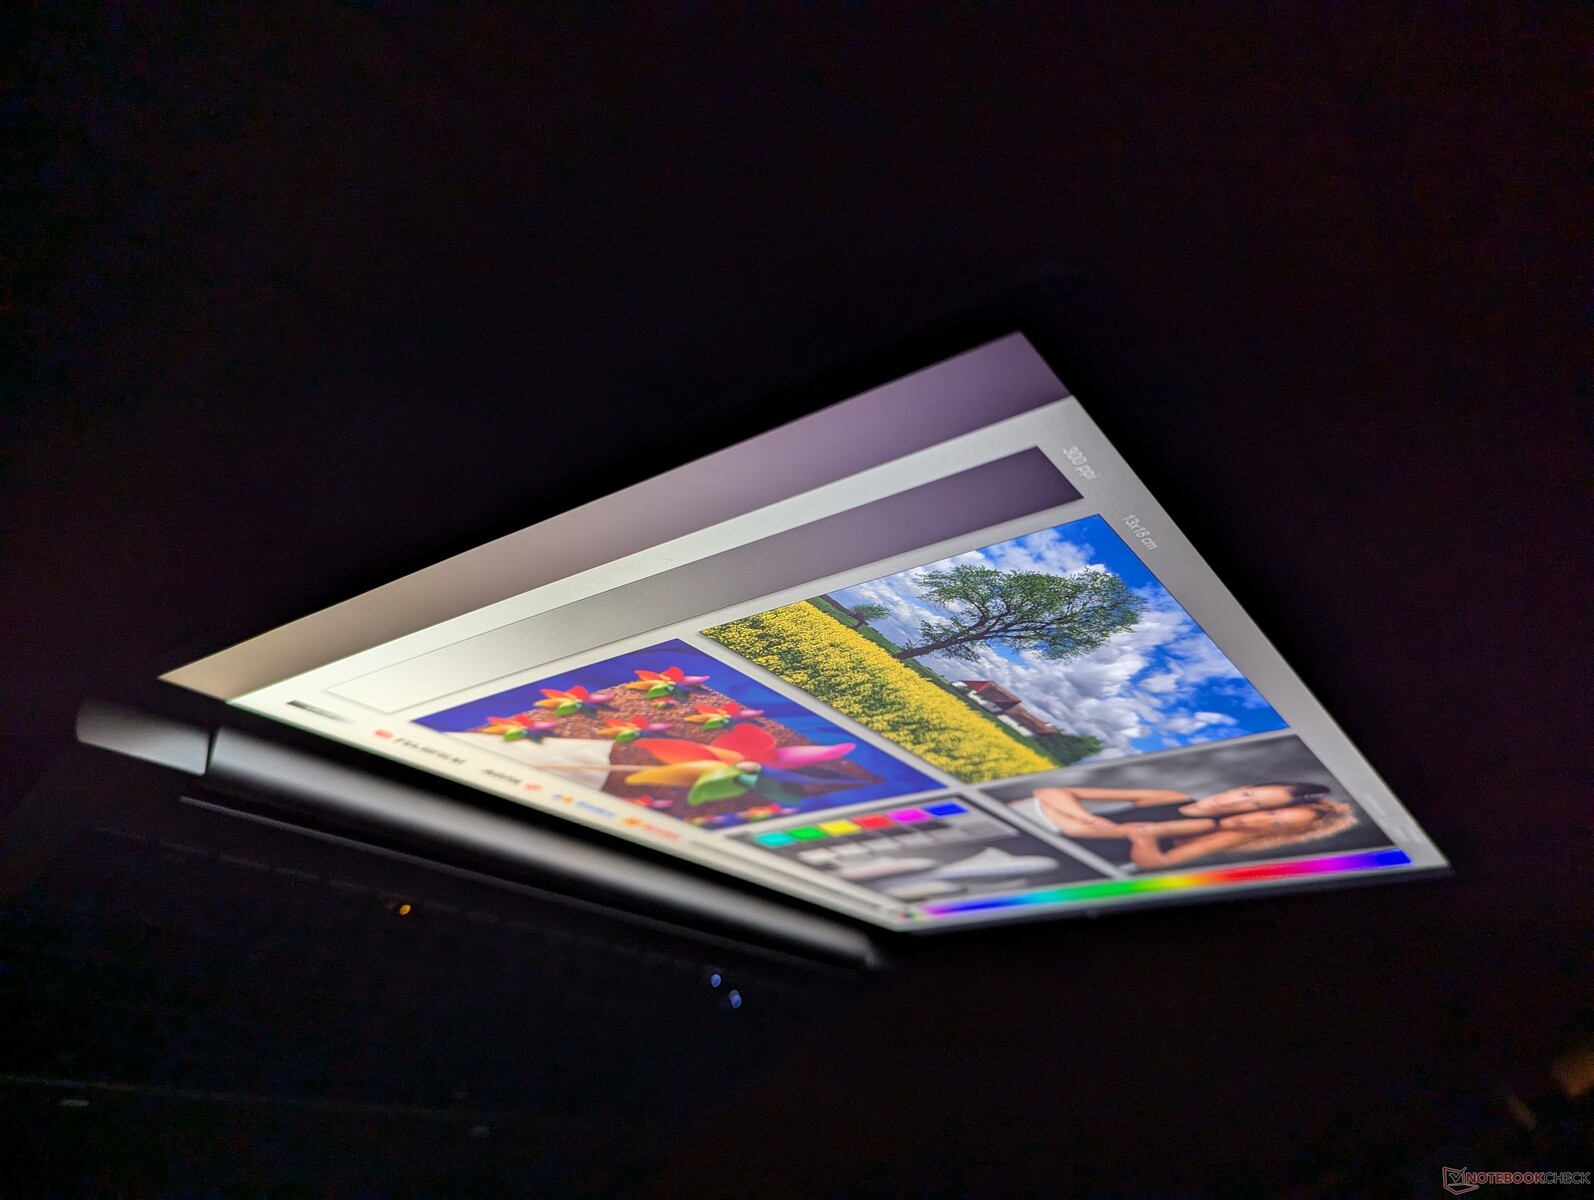
有以下五种显示屏可供选择。我们的特定测试装置配备了黑体面板。
- 3840 x 2400,OLED,触摸屏,亮面,400 尼特,100% DCI-P3,60 赫兹
- 3840 x 2400,IPS,非触摸屏,哑光,500 尼特,100% DCI-P3,120 赫兹
- 1920 x 1200,IPS,非触摸,雾面,400 尼特,100% sRGB,60 赫兹
- 1920 x 1200,IPS,非触摸,雾面,1000 尼特,100% sRGB,60 赫兹,Sure View Integrated
- 1920 x 1200,IPS,触摸屏,亮面,400 尼特,100% sRGB,60 赫兹
这块特殊的面板恰好与我们的 ZBook Fury 16 G10 的出厂面板相同,因此视觉体验保持一致。打算在户外使用笔记本电脑的买家可能会考虑 1000 尼特的选项,但遗憾的是,这种面板与 Sure View 绑定,大大限制了可视角度,使屏幕难以与他人分享。与此同时,OLED 显示屏将为数字艺术家和多媒体编辑应用提供更出色的黑度,但它的光泽覆盖和微弱的 60 Hz 刷新率可能会让人望而却步。
在我们配置的面板上,Windows 动态刷新率仅支持到 60 Hz。

| |||||||||||||||||||||||||
Brightness Distribution: 83 %
Center on Battery: 457.6 cd/m²
Contrast: 1064:1 (Black: 0.43 cd/m²)
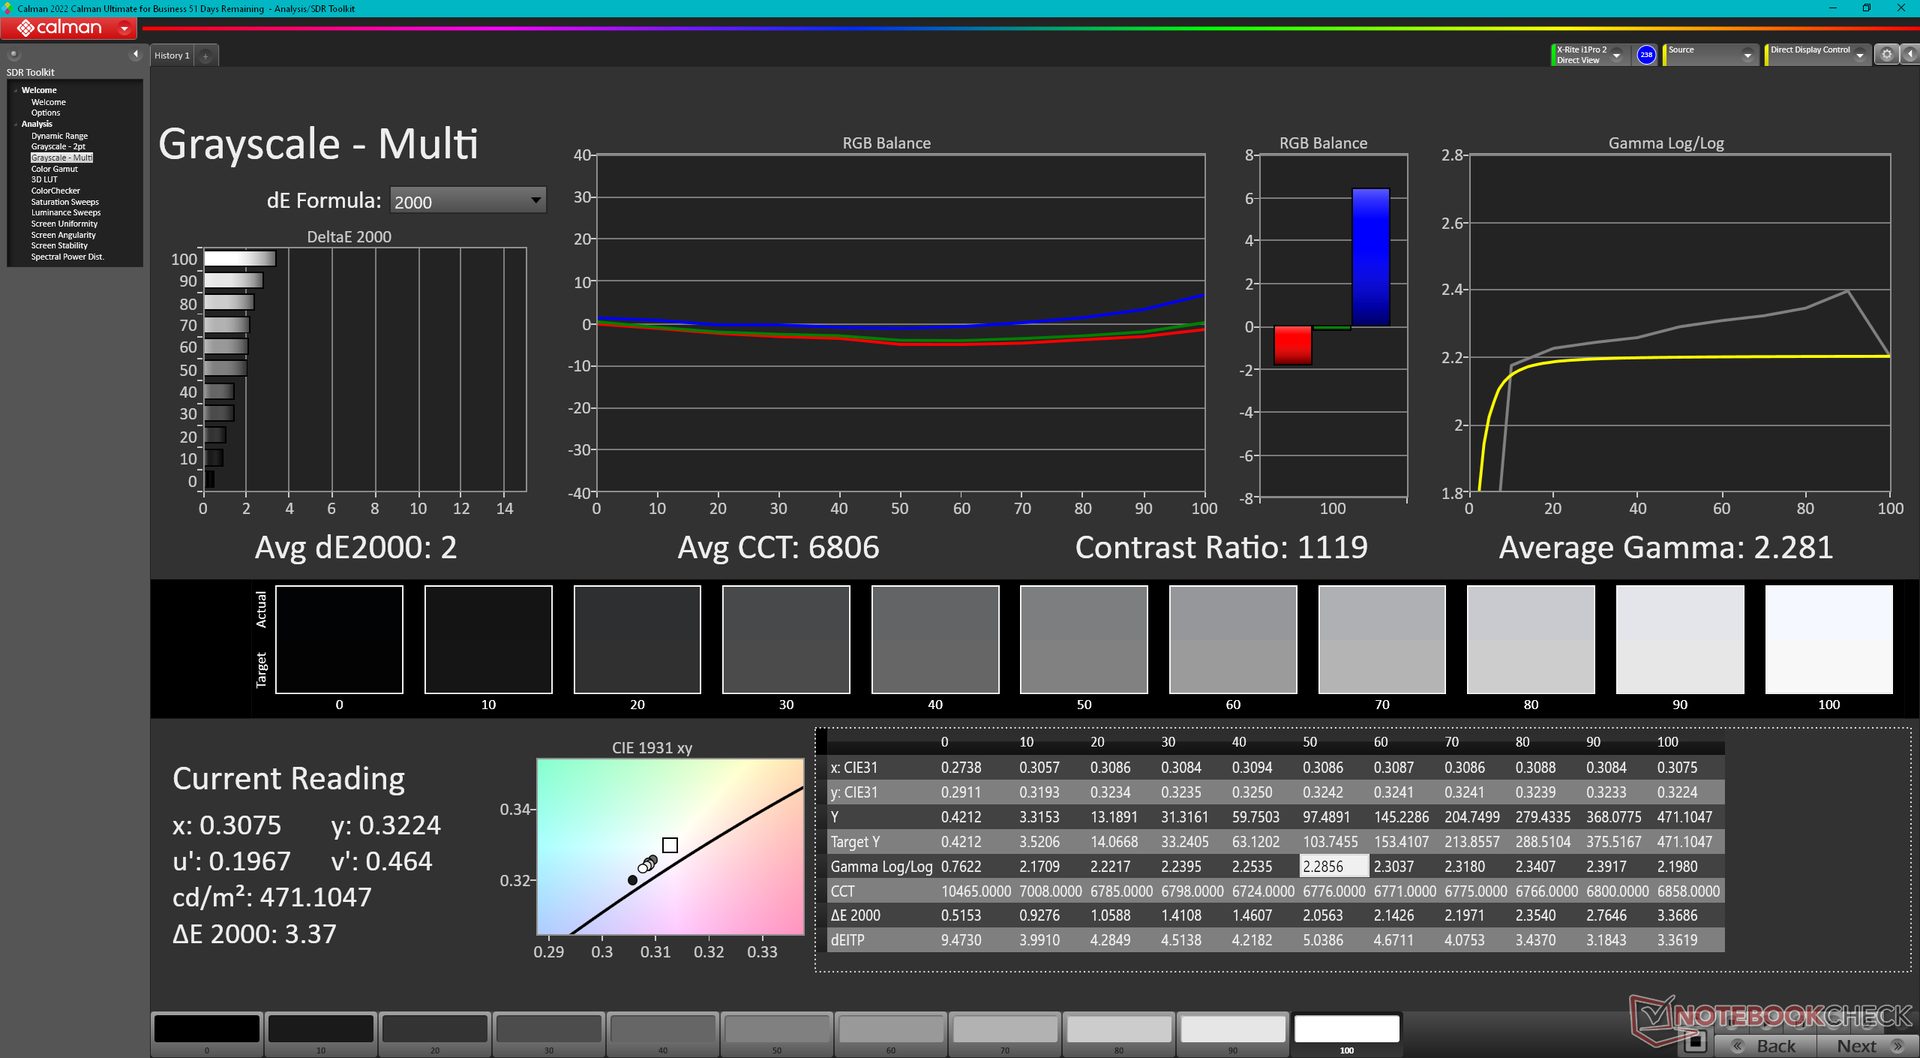
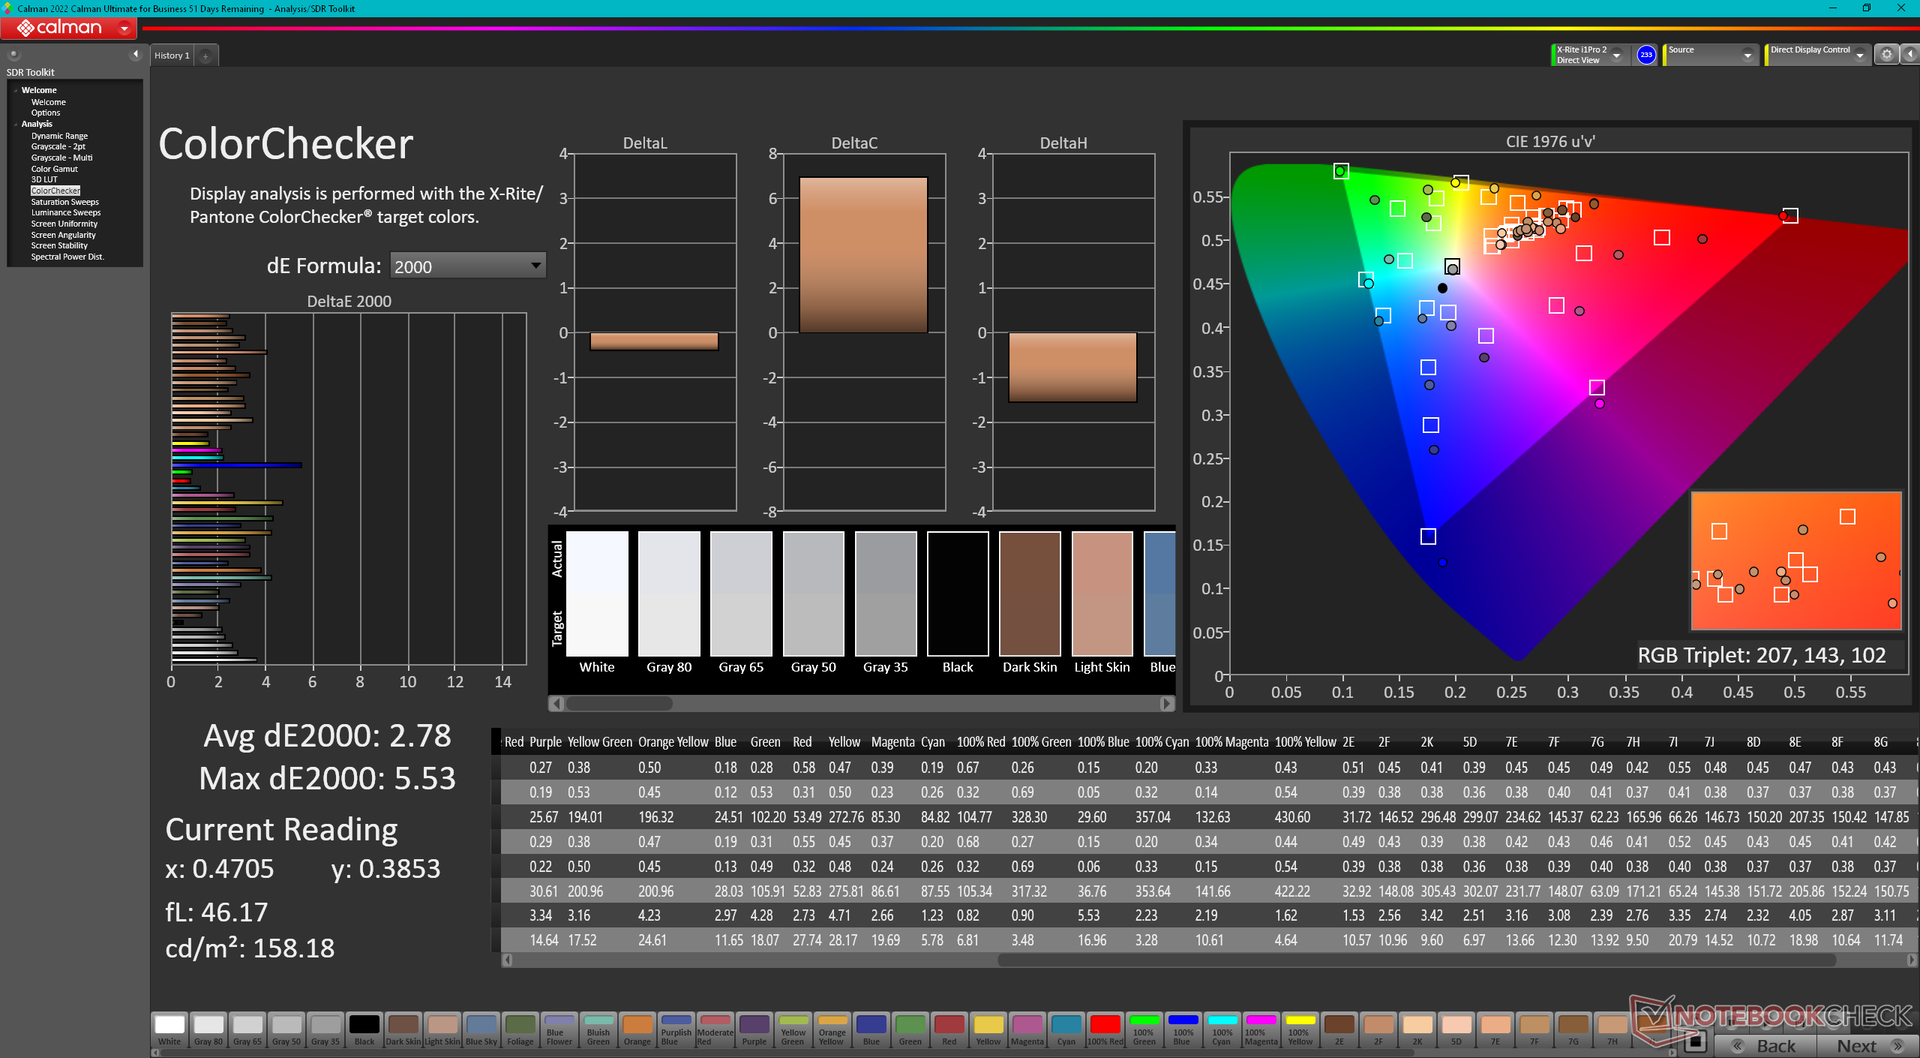
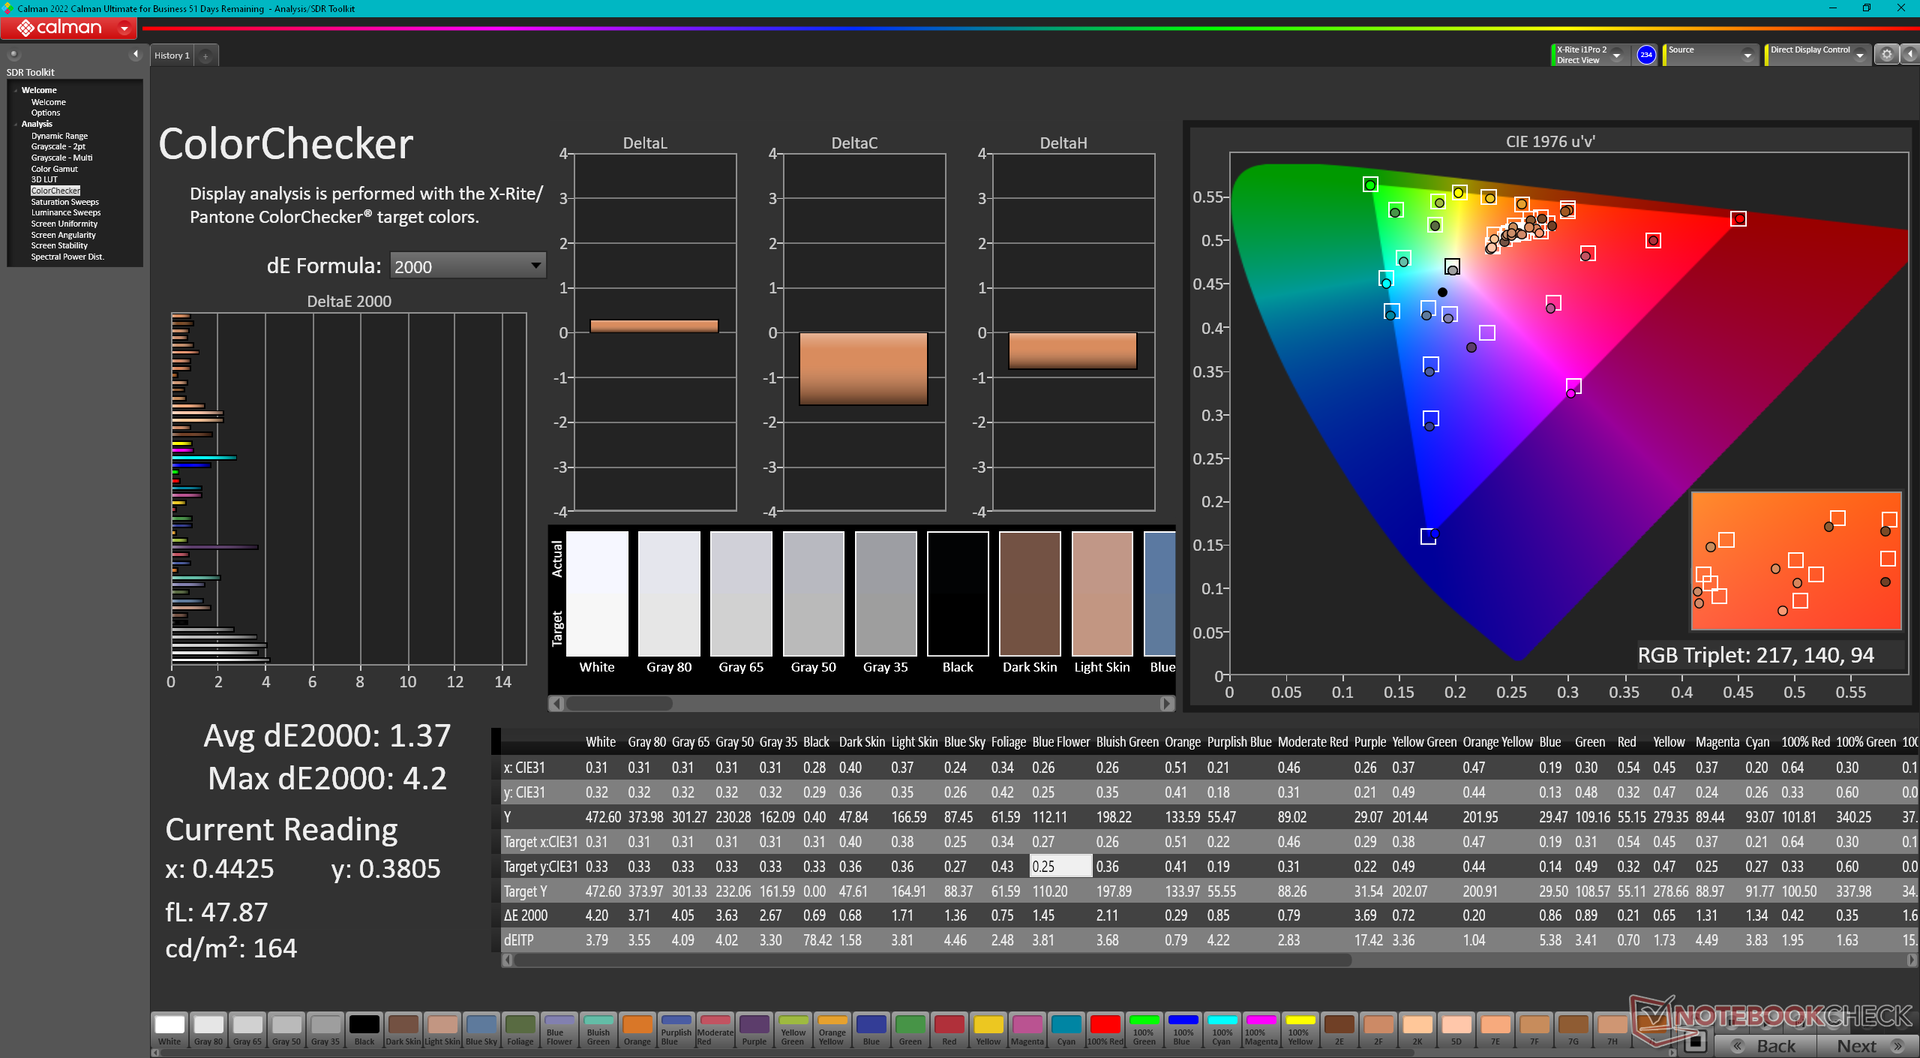
ΔE ColorChecker Calman: 2.78 | ∀{0.5-29.43 Ø4.73}
calibrated: 1.37
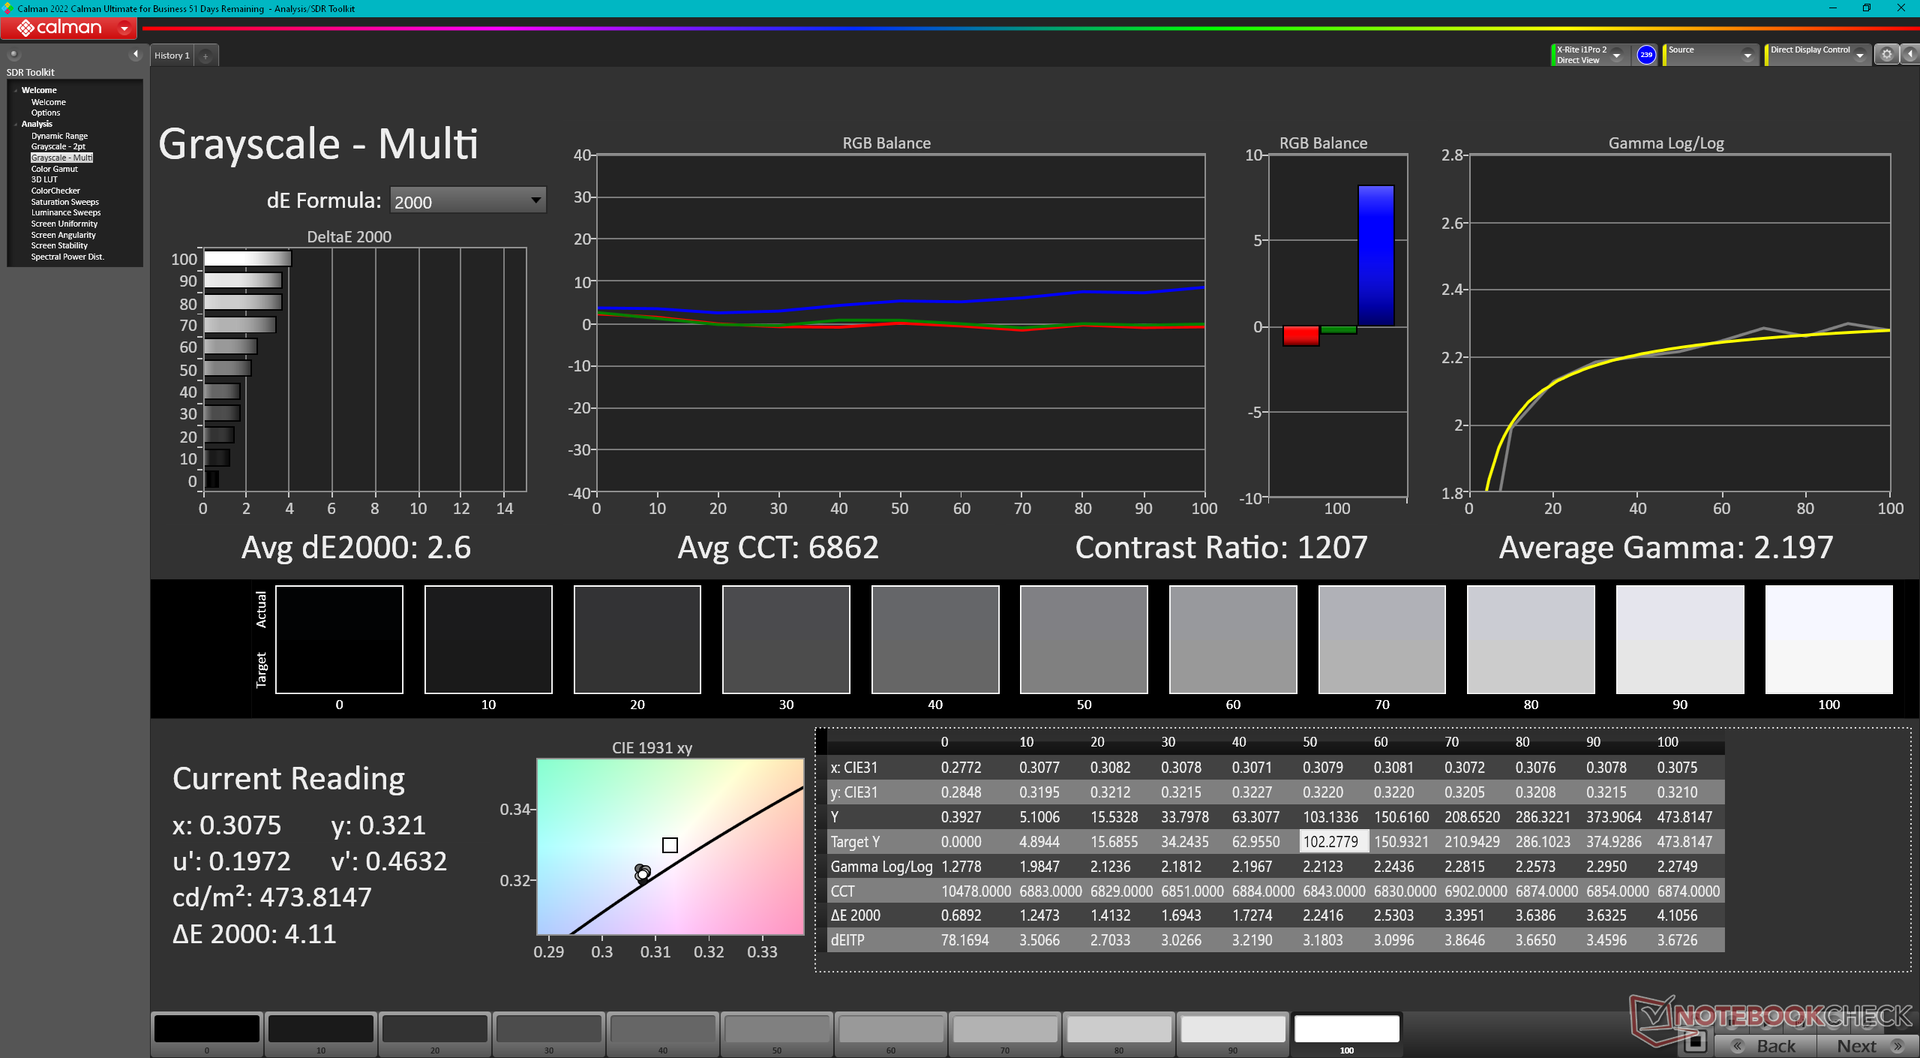
ΔE Greyscale Calman: 2 | ∀{0.09-98 Ø4.97}
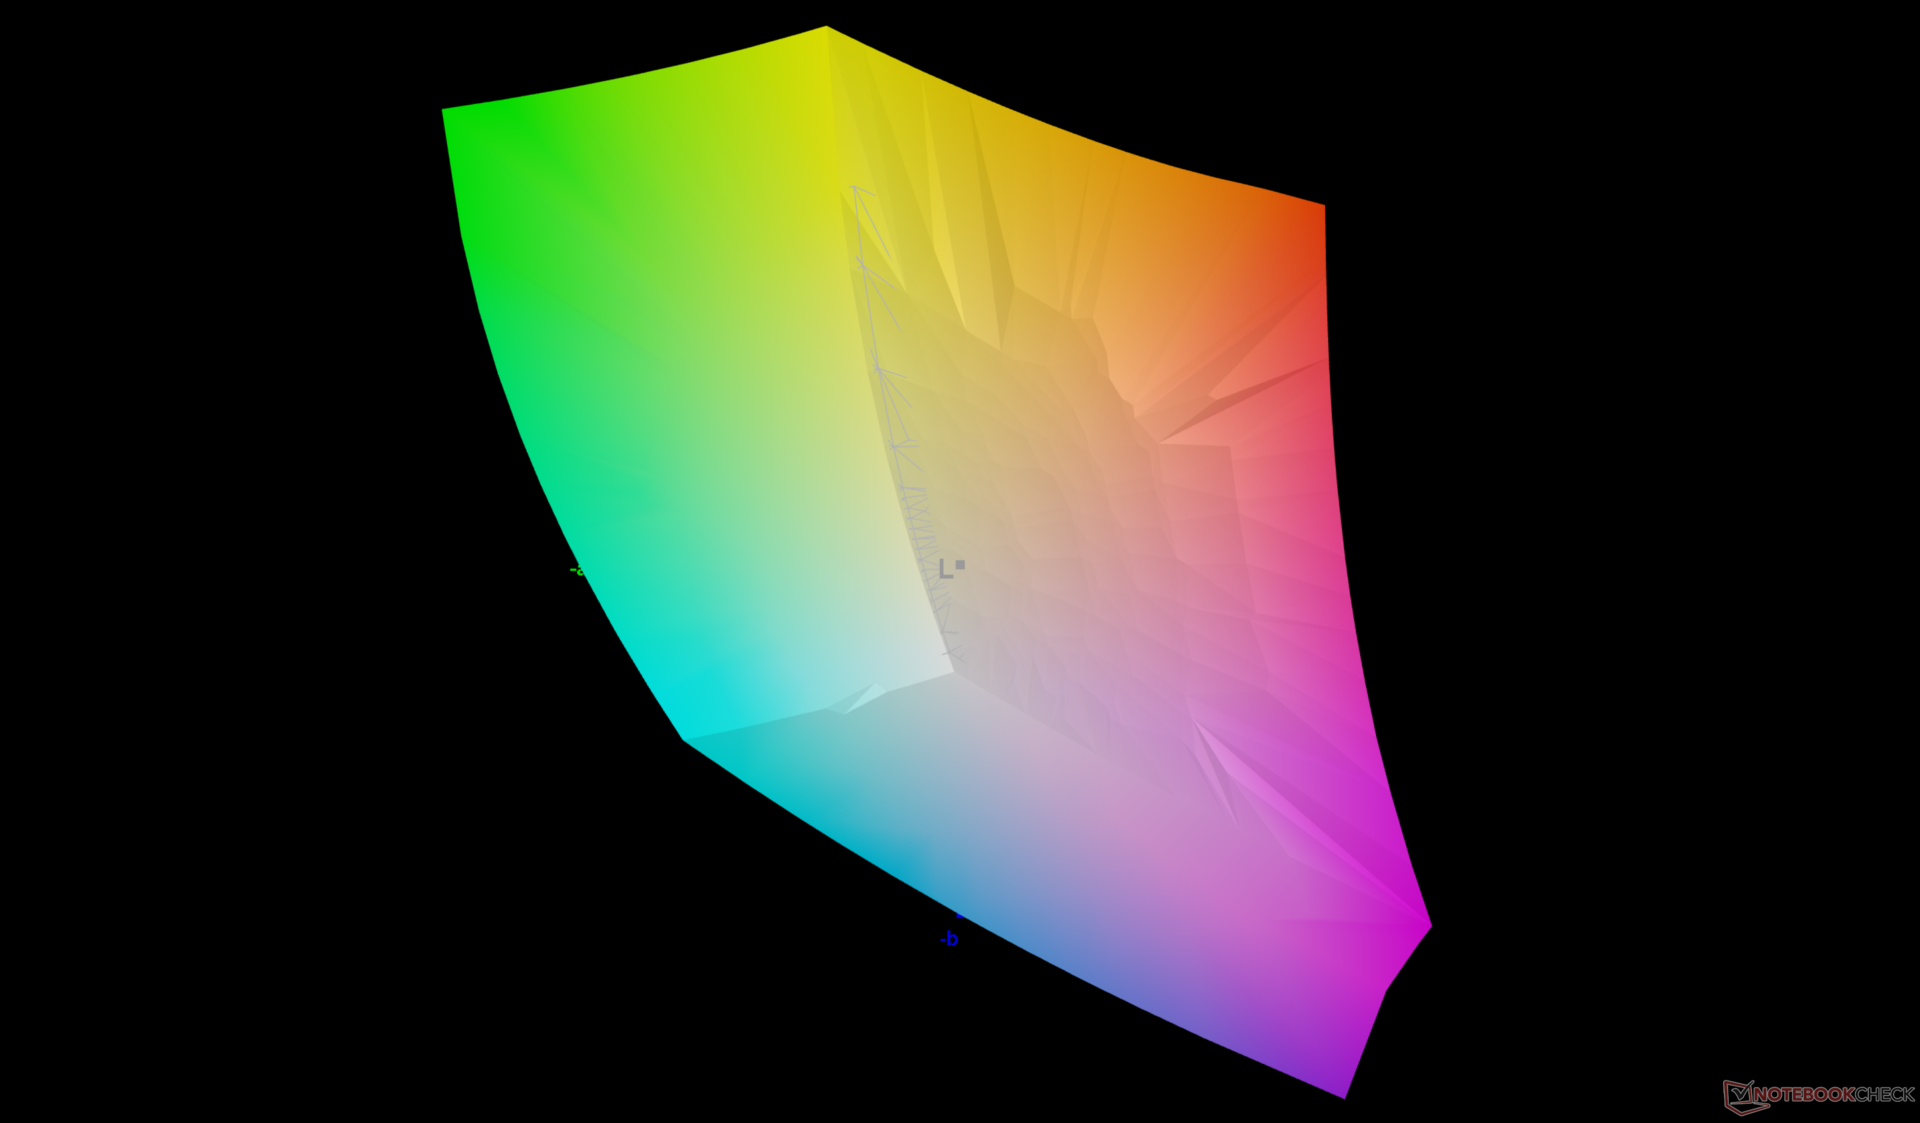
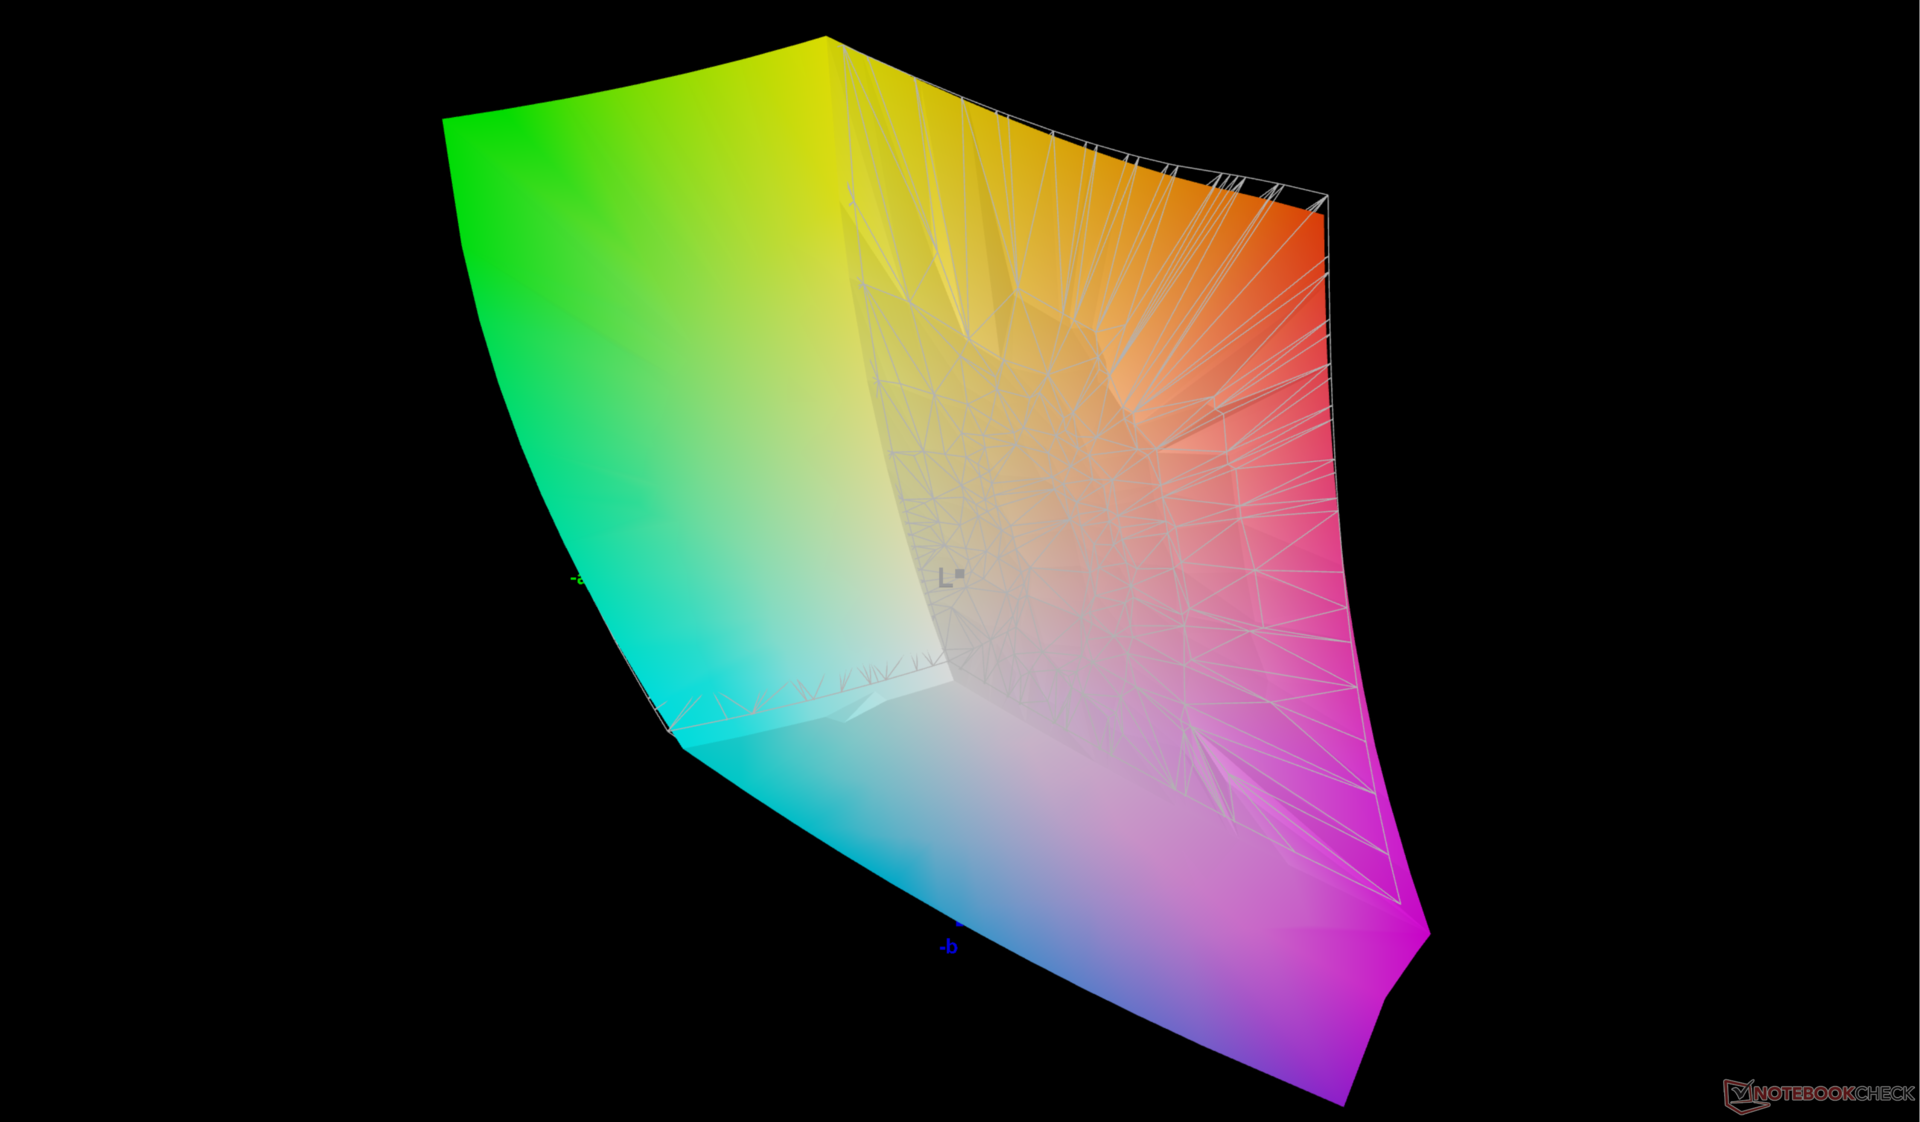
86% AdobeRGB 1998 (Argyll 3D)
99.9% sRGB (Argyll 3D)
98.4% Display P3 (Argyll 3D)
Gamma: 2.28
CCT: 6806 K
| HP ZBook Fury 16 G11 AUO87A8, IPS, 3840x2400, 16", 120 Hz | HP ZBook Fury 16 G10 AUO87A8, IPS, 3840x2400, 16", 120 Hz | HP ZBook Fury 16 G9 BOE0A52, IPS, 3840x2400, 16", 60 Hz | Dell Precision 5690 Samsung 160YV03, OLED, 3840x2400, 16", 60 Hz | Lenovo ThinkPad P16 G2 21FA000FGE MNG007DA1-9, IPS LED, 2560x1600, 16", 165 Hz | Lenovo ThinkPad P1 G6 21FV001KUS Samsung ATNA60YV04-0, OLED, 3480x2400, 16", 60 Hz | Asus ProArt Studiobook 16 OLED H7604 ATNA60BX01-1, OLED, 3200x2000, 16", 120 Hz | |
|---|---|---|---|---|---|---|---|
| Display | 0% | -0% | 4% | -15% | 5% | 2% | |
| Display P3 Coverage (%) | 98.4 | 98 0% | 97.4 -1% | 99.8 1% | 71 -28% | 99.8 1% | 99.6 1% |
| sRGB Coverage (%) | 99.9 | 99.9 0% | 99.9 0% | 100 0% | 99.2 -1% | 100 0% | 100 0% |
| AdobeRGB 1998 Coverage (%) | 86 | 86.2 0% | 86.3 0% | 96.6 12% | 73.2 -15% | 97.9 14% | 89.4 4% |
| Response Times | -9% | -11% | 83% | -16% | 82% | 93% | |
| Response Time Grey 50% / Grey 80% * (ms) | 11.4 ? | 11.9 ? -4% | 13.7 ? -20% | 1.7 ? 85% | 12.8 ? -12% | 1.69 ? 85% | 0.59 ? 95% |
| Response Time Black / White * (ms) | 8.4 ? | 9.6 ? -14% | 8.6 ? -2% | 1.7 ? 80% | 10.1 ? -20% | 1.73 ? 79% | 0.79 ? 91% |
| PWM Frequency (Hz) | 60 ? | 60 ? | 240 ? | ||||
| Screen | 19% | -25% | -8% | -7% | 19% | 179% | |
| Brightness middle (cd/m²) | 457.6 | 514.6 12% | 530.5 16% | 348.1 -24% | 510 11% | 375.1 -18% | 349 -24% |
| Brightness (cd/m²) | 466 | 495 6% | 476 2% | 351 -25% | 517 11% | 379 -19% | 350 -25% |
| Brightness Distribution (%) | 83 | 90 8% | 83 0% | 97 17% | 89 7% | 98 18% | 95 14% |
| Black Level * (cd/m²) | 0.43 | 0.46 -7% | 0.57 -33% | 0.37 14% | 0.02 95% | ||
| Contrast (:1) | 1064 | 1119 5% | 931 -12% | 1378 30% | 17450 1540% | ||
| Colorchecker dE 2000 * | 2.78 | 2.4 14% | 2.26 19% | 4.18 -50% | 2.6 6% | 1.16 58% | 2.1 24% |
| Colorchecker dE 2000 max. * | 5.53 | 4.86 12% | 6.68 -21% | 5.2 6% | 2.94 47% | 5.5 1% | |
| Colorchecker dE 2000 calibrated * | 1.37 | 0.4 71% | 4.73 -245% | 0.97 29% | 2.3 -68% | 2.1 -53% | |
| Greyscale dE 2000 * | 2 | 1 50% | 1 50% | 1.7 15% | 3.6 -80% | 1.4 30% | 1.2 40% |
| Gamma | 2.28 96% | 2.3 96% | 2.28 96% | 2.2 100% | 2.26 97% | 2.2 100% | 2.19 100% |
| CCT | 6806 96% | 6553 99% | 6543 99% | 6198 105% | 5969 109% | 6325 103% | 6545 99% |
| Total Average (Program / Settings) | 3% /
11% | -12% /
-17% | 26% /
10% | -13% /
-10% | 35% /
27% | 91% /
129% |
* ... smaller is better
显示屏根据 P3 标准校准良好,平均 deltaE 灰度值和色彩值分别仅为 2 和 2.18。使用我们的 X-Rite 色差计对面板进行进一步校准,只能略微提高准确度,对大多数用户来说基本没有必要。
Display Response Times
| ↔ Response Time Black to White | ||
|---|---|---|
| 8.4 ms ... rise ↗ and fall ↘ combined | ↗ 4.7 ms rise | 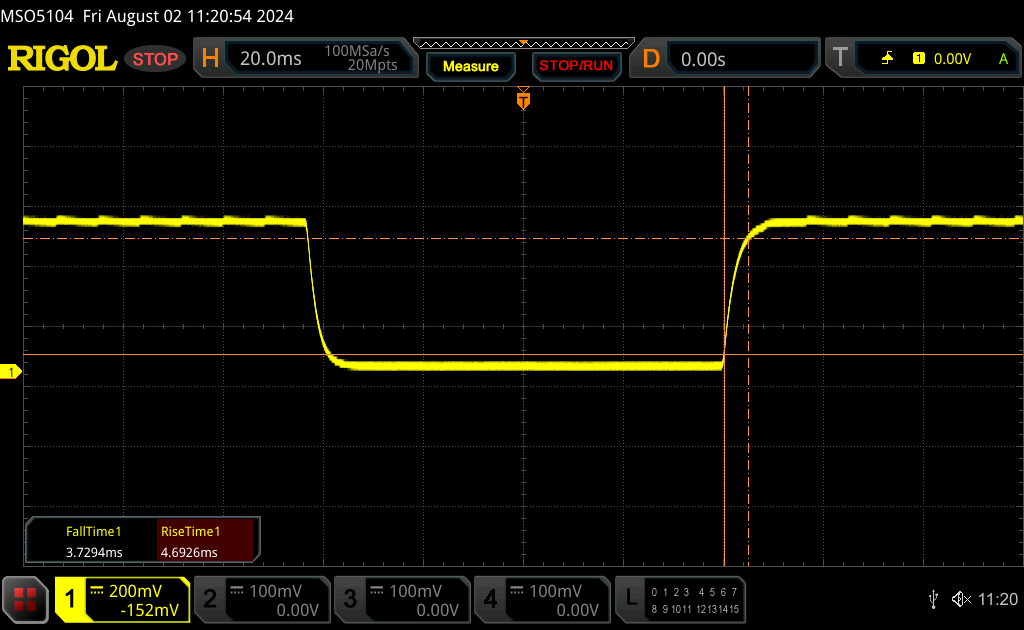 |
| ↘ 3.7 ms fall | ||
| The screen shows fast response rates in our tests and should be suited for gaming. In comparison, all tested devices range from 0.1 (minimum) to 240 (maximum) ms. » 24 % of all devices are better. This means that the measured response time is better than the average of all tested devices (19.9 ms). | ||
| ↔ Response Time 50% Grey to 80% Grey | ||
| 11.4 ms ... rise ↗ and fall ↘ combined | ↗ 5.3 ms rise | 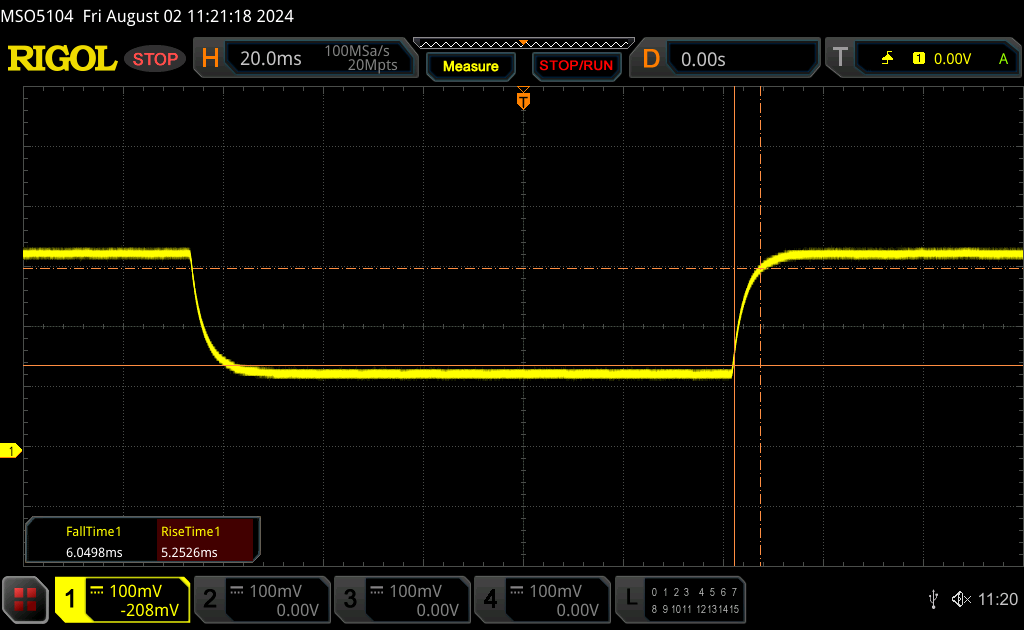 |
| ↘ 6.1 ms fall | ||
| The screen shows good response rates in our tests, but may be too slow for competitive gamers. In comparison, all tested devices range from 0.165 (minimum) to 636 (maximum) ms. » 25 % of all devices are better. This means that the measured response time is better than the average of all tested devices (31.1 ms). | ||
Screen Flickering / PWM (Pulse-Width Modulation)
| Screen flickering / PWM not detected | 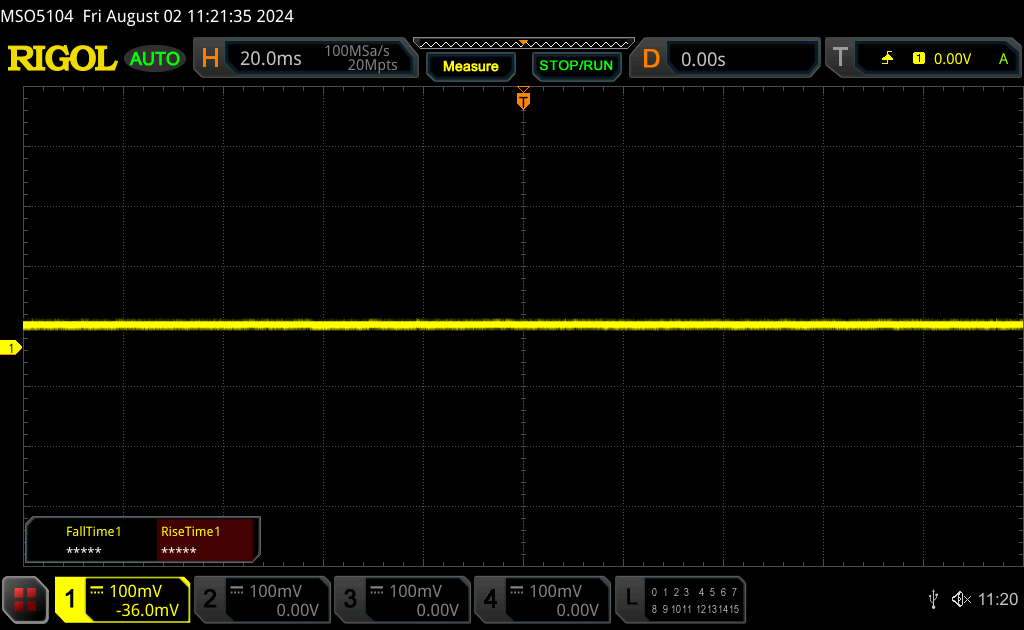 | ||
In comparison: 52 % of all tested devices do not use PWM to dim the display. If PWM was detected, an average of 7784 (minimum: 5 - maximum: 343500) Hz was measured. | |||

性能 - 更高的涡轮增压潜力
测试条件
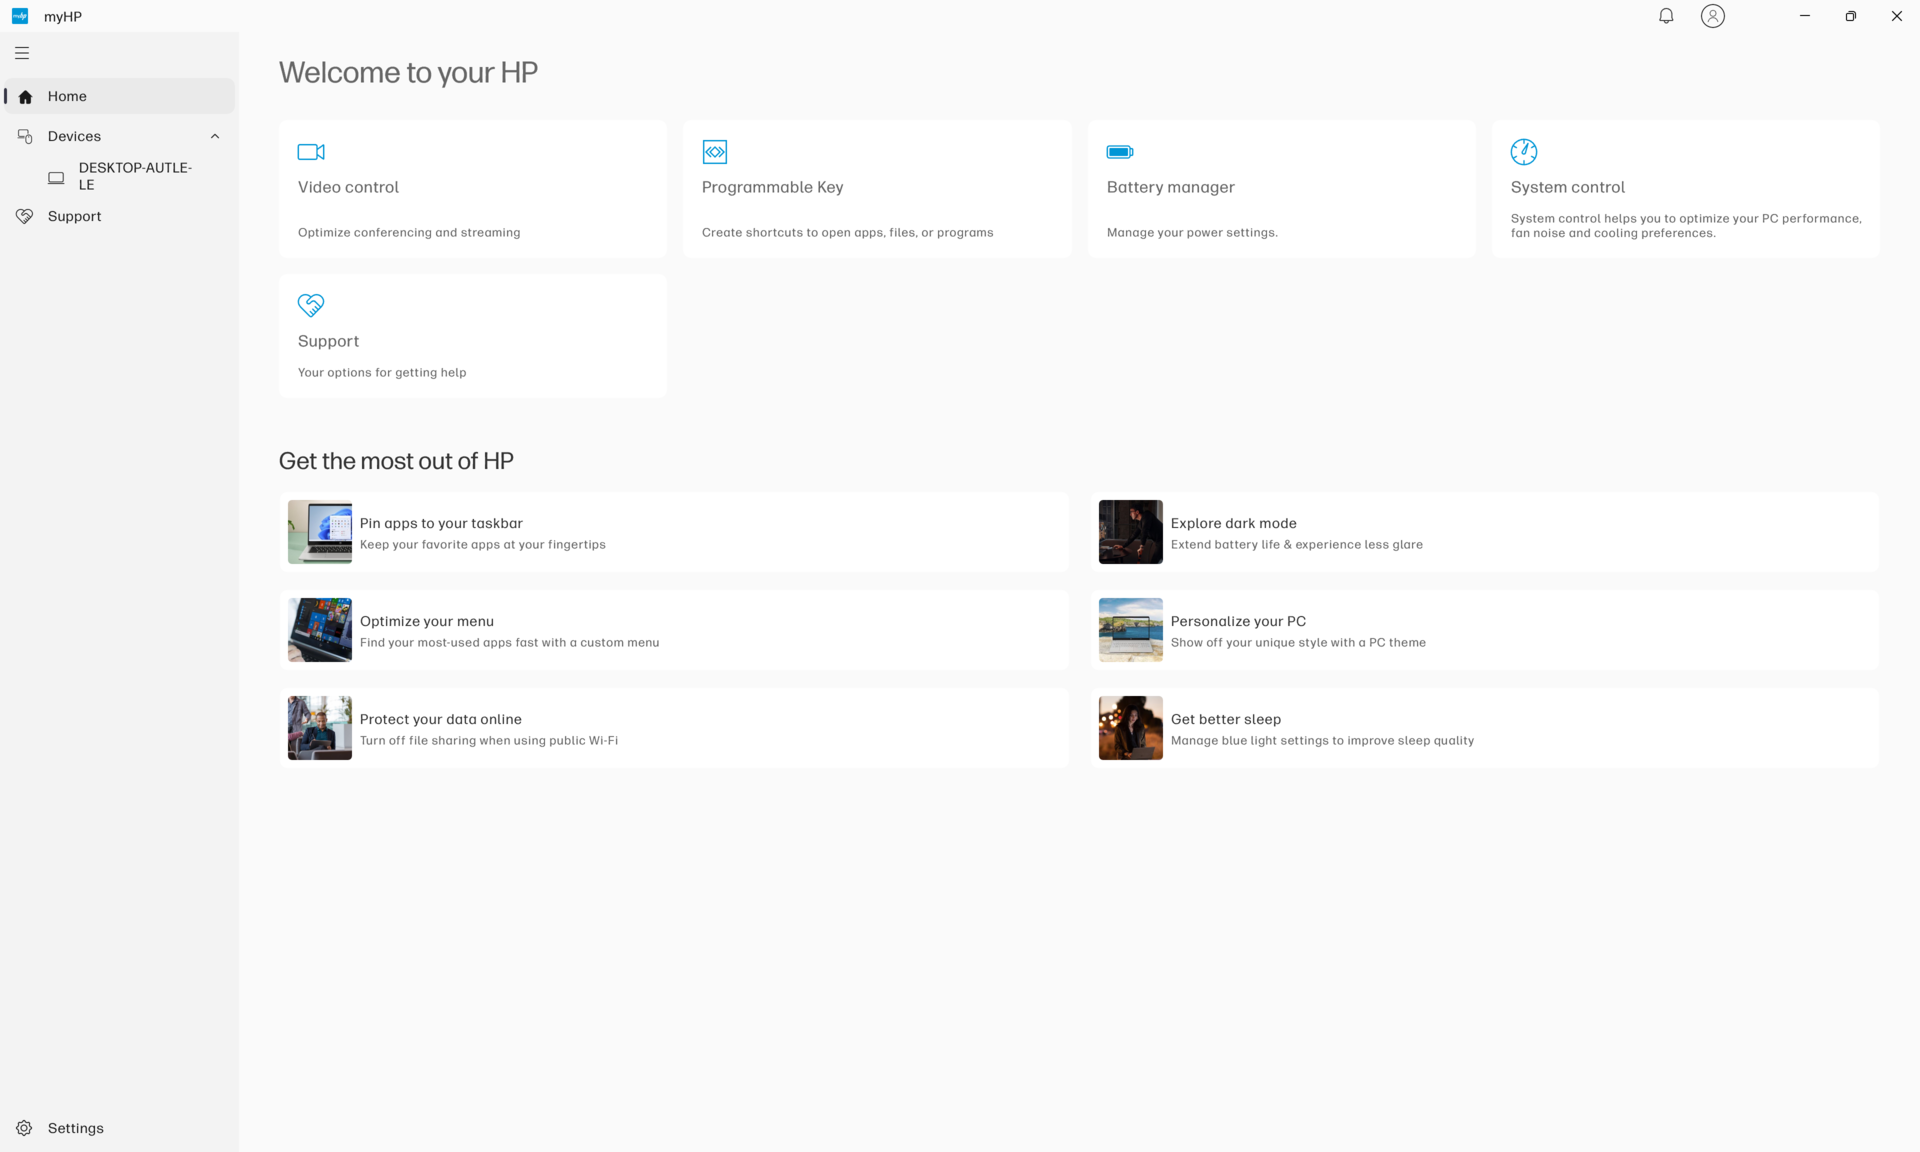
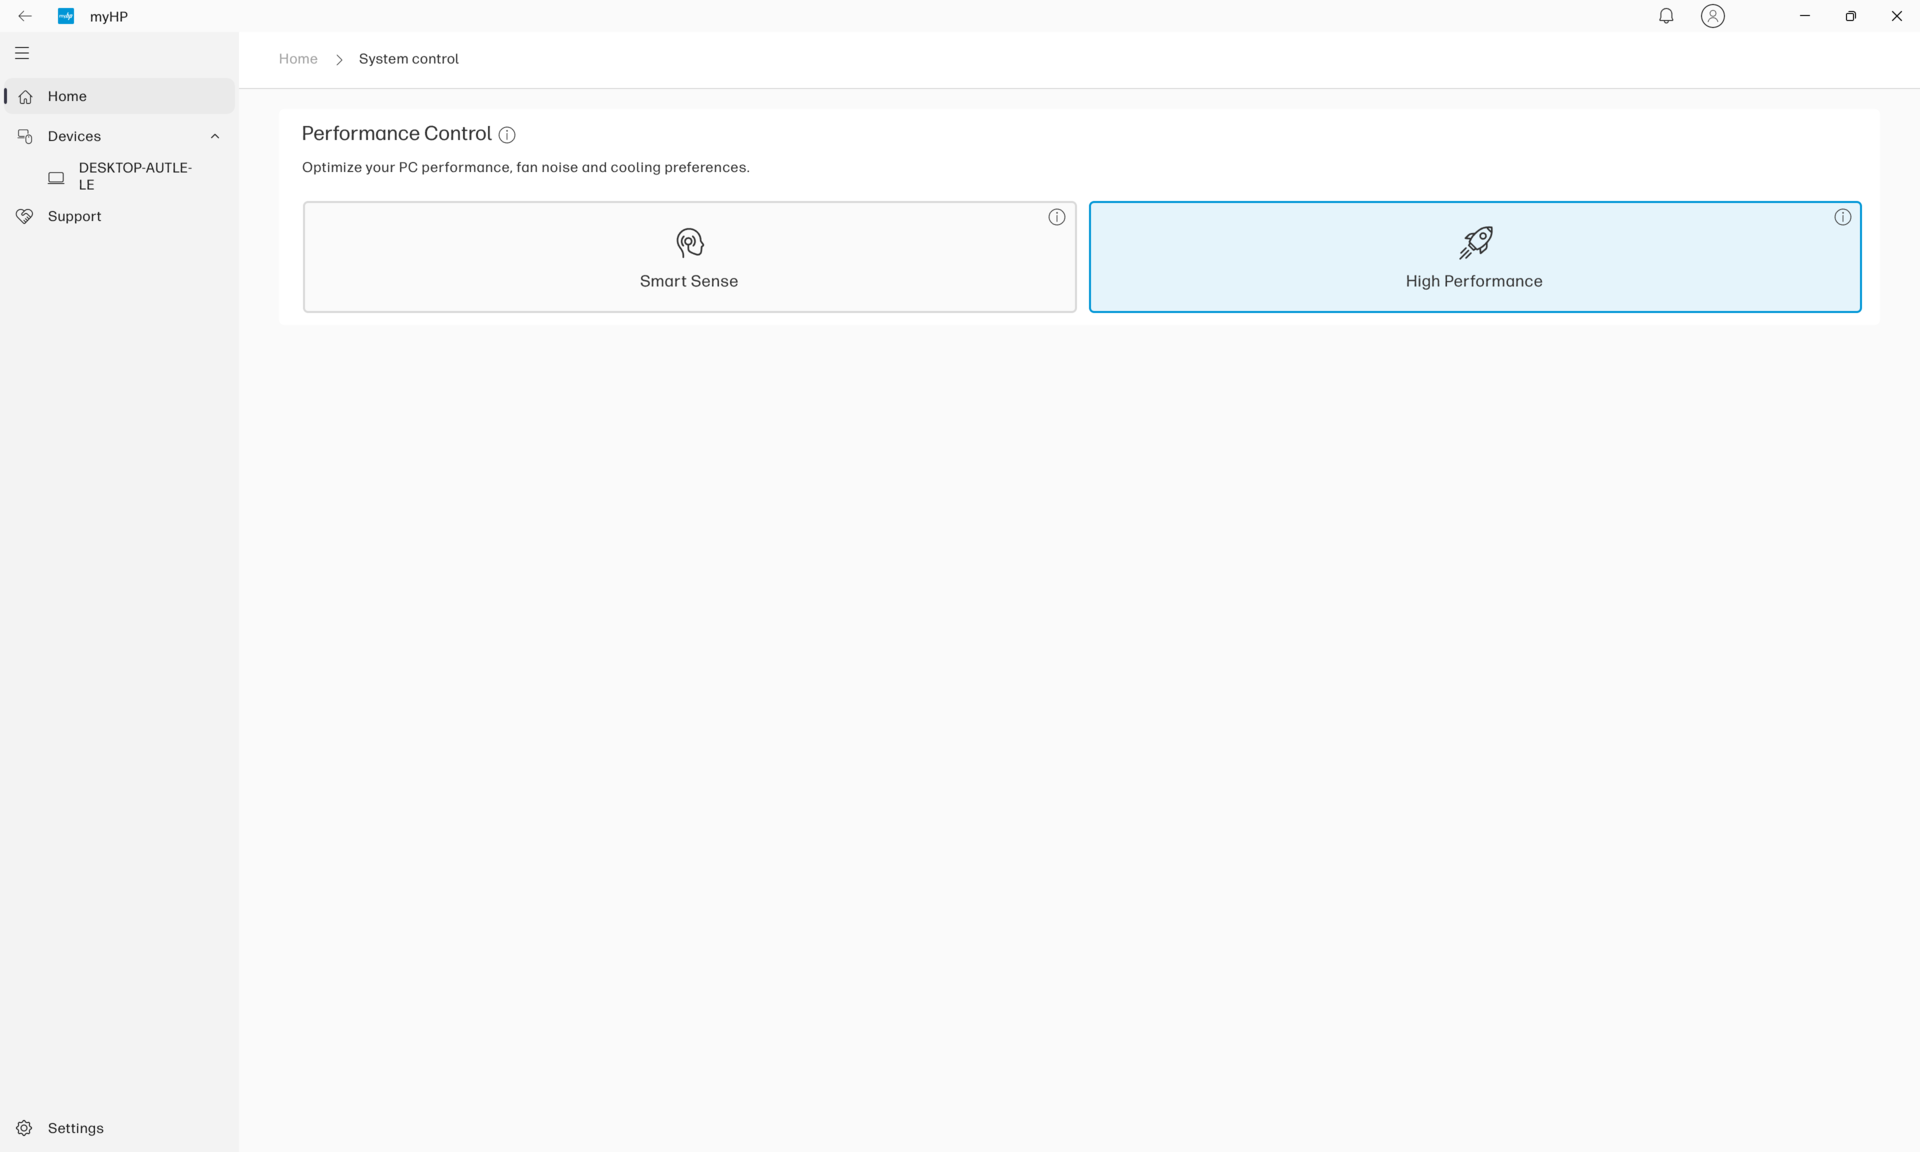
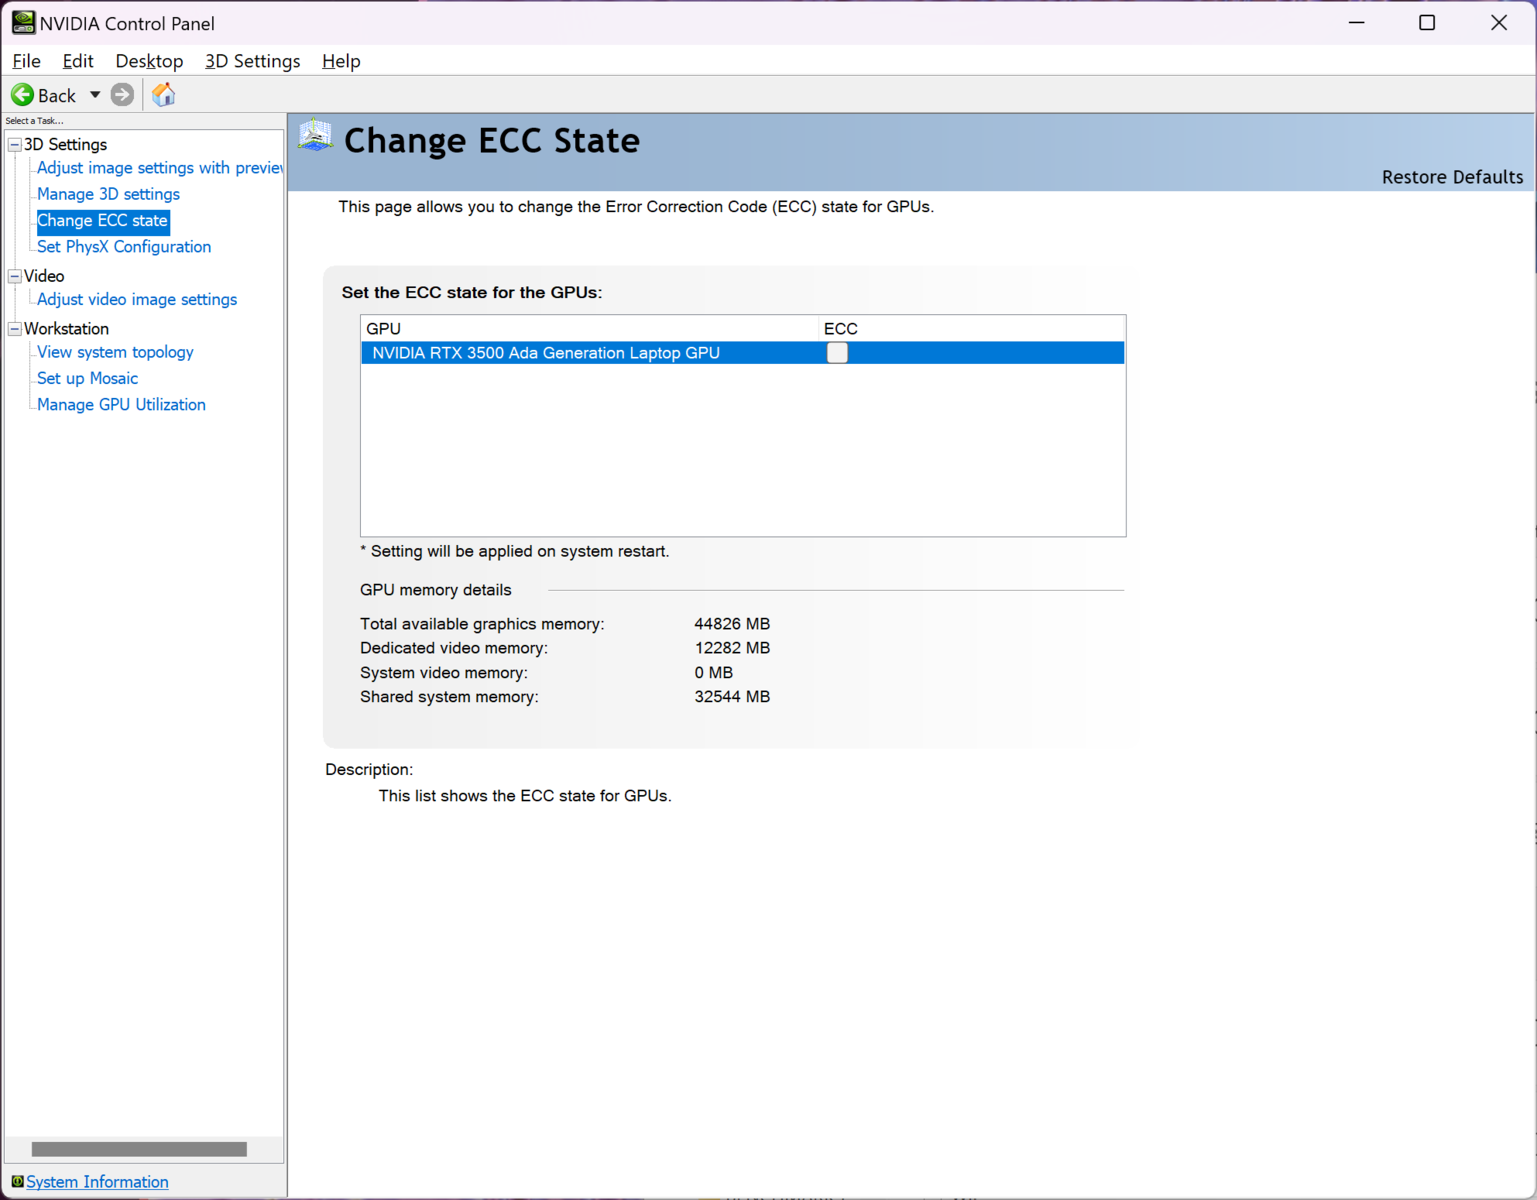
在运行以下基准测试之前,我们将 Windows 和 MyHP 都设置为性能模式。我们还通过 Nvidia 控制面板禁用了 GPU ECC 模式。
处理器
从 酷睿 i9-12950HX跳转到 酷睿 i9-13950HXZBook Fury 16 G10 的酷睿 i9-13950HX 带来了显著的性能提升。遗憾的是,从 Fury 16 G10 的酷睿 i9-13950HX 跳转到 酷睿 i9-14900HX配置中的酷睿 i9-14900HX。在未考虑任何节流因素的情况下,收益要小得多,约为 10% 至 15%。如下面的 CineBench R15 xT 循环测试结果所示,一旦考虑节流因素,处理器的整体性能将与酷睿 i9-13950HX 基本相同。酷睿 i9-14900HX 采用了与酷睿 i9-13950HX 相同的底层架构,因此可以被视为去年产品的升级版。因此,较高的 Turbo Boost 上限是其相对于旧款处理器的主要优势,即使这些较高的 Turbo Boost 速度只是昙花一现。
联想 联想Legion 9 16IRX9与惠普相同的酷睿 i9-14900HX 处理器,运行速度最多可提高 20%,这很可能是由于它采用了更强大的冷却解决方案,以维持更高的 Turbo Boost 时钟频率。
Cinebench R15 Multi Loop
Cinebench R23: Multi Core | Single Core
Cinebench R20: CPU (Multi Core) | CPU (Single Core)
Cinebench R15: CPU Multi 64Bit | CPU Single 64Bit
Blender: v2.79 BMW27 CPU
7-Zip 18.03: 7z b 4 | 7z b 4 -mmt1
Geekbench 6.7: Multi-Core | Single-Core
Geekbench 5.5: Multi-Core | Single-Core
HWBOT x265 Benchmark v2.2: 4k Preset
LibreOffice : 20 Documents To PDF
R Benchmark 2.5: Overall mean
| Geekbench 6.7 / Multi-Core | |
| Average Intel Core i9-14900HX (13158 - 19665, n=37) | |
| HP ZBook Fury 16 G10 | |
| HP ZBook Fury 16 G11 | |
| Dell Precision 5000 5680 | |
| Dell Precision 5690 | |
| Lenovo ThinkPad P1 G6 21FV001KUS | |
| Lenovo ThinkPad P1 G6-21FV000DGE | |
| Lenovo ThinkPad P16v G1 AMD | |
| Geekbench 6.7 / Single-Core | |
| Average Intel Core i9-14900HX (2419 - 3129, n=37) | |
| HP ZBook Fury 16 G10 | |
| HP ZBook Fury 16 G11 | |
| Lenovo ThinkPad P1 G6 21FV001KUS | |
| Lenovo ThinkPad P1 G6-21FV000DGE | |
| Dell Precision 5000 5680 | |
| Lenovo ThinkPad P16v G1 AMD | |
| Dell Precision 5690 | |
Cinebench R23: Multi Core | Single Core
Cinebench R20: CPU (Multi Core) | CPU (Single Core)
Cinebench R15: CPU Multi 64Bit | CPU Single 64Bit
Blender: v2.79 BMW27 CPU
7-Zip 18.03: 7z b 4 | 7z b 4 -mmt1
Geekbench 6.7: Multi-Core | Single-Core
Geekbench 5.5: Multi-Core | Single-Core
HWBOT x265 Benchmark v2.2: 4k Preset
LibreOffice : 20 Documents To PDF
R Benchmark 2.5: Overall mean
* ... smaller is better
AIDA64: FP32 Ray-Trace | FPU Julia | CPU SHA3 | CPU Queen | FPU SinJulia | FPU Mandel | CPU AES | CPU ZLib | FP64 Ray-Trace | CPU PhotoWorxx
| Performance rating | |
| Asus ProArt Studiobook 16 OLED H7604 | |
| Average Intel Core i9-14900HX | |
| HP ZBook Fury 16 G10 | |
| HP ZBook Fury 16 G11 | |
| Dell Precision 5690 | |
| Lenovo ThinkPad P16 G2 21FA000FGE | |
| HP ZBook Fury 16 G9 | |
| Lenovo ThinkPad P1 G6 21FV001KUS | |
| AIDA64 / FP32 Ray-Trace | |
| Asus ProArt Studiobook 16 OLED H7604 | |
| Average Intel Core i9-14900HX (13098 - 33474, n=36) | |
| HP ZBook Fury 16 G10 | |
| HP ZBook Fury 16 G11 | |
| Dell Precision 5690 | |
| Lenovo ThinkPad P16 G2 21FA000FGE | |
| HP ZBook Fury 16 G9 | |
| Lenovo ThinkPad P1 G6 21FV001KUS | |
| AIDA64 / FPU Julia | |
| Asus ProArt Studiobook 16 OLED H7604 | |
| Average Intel Core i9-14900HX (67573 - 166040, n=36) | |
| HP ZBook Fury 16 G10 | |
| HP ZBook Fury 16 G11 | |
| HP ZBook Fury 16 G9 | |
| Dell Precision 5690 | |
| Lenovo ThinkPad P16 G2 21FA000FGE | |
| Lenovo ThinkPad P1 G6 21FV001KUS | |
| AIDA64 / CPU SHA3 | |
| Asus ProArt Studiobook 16 OLED H7604 | |
| Average Intel Core i9-14900HX (3589 - 7979, n=36) | |
| HP ZBook Fury 16 G10 | |
| HP ZBook Fury 16 G11 | |
| Dell Precision 5690 | |
| Lenovo ThinkPad P16 G2 21FA000FGE | |
| HP ZBook Fury 16 G9 | |
| Lenovo ThinkPad P1 G6 21FV001KUS | |
| AIDA64 / CPU Queen | |
| Average Intel Core i9-14900HX (118405 - 148966, n=36) | |
| HP ZBook Fury 16 G11 | |
| Asus ProArt Studiobook 16 OLED H7604 | |
| HP ZBook Fury 16 G10 | |
| Lenovo ThinkPad P1 G6 21FV001KUS | |
| Lenovo ThinkPad P16 G2 21FA000FGE | |
| HP ZBook Fury 16 G9 | |
| Dell Precision 5690 | |
| AIDA64 / FPU SinJulia | |
| Asus ProArt Studiobook 16 OLED H7604 | |
| Average Intel Core i9-14900HX (10475 - 18517, n=36) | |
| HP ZBook Fury 16 G11 | |
| HP ZBook Fury 16 G10 | |
| Lenovo ThinkPad P16 G2 21FA000FGE | |
| HP ZBook Fury 16 G9 | |
| Dell Precision 5690 | |
| Lenovo ThinkPad P1 G6 21FV001KUS | |
| AIDA64 / FPU Mandel | |
| Asus ProArt Studiobook 16 OLED H7604 | |
| Average Intel Core i9-14900HX (32543 - 83662, n=36) | |
| HP ZBook Fury 16 G10 | |
| HP ZBook Fury 16 G11 | |
| Dell Precision 5690 | |
| HP ZBook Fury 16 G9 | |
| Lenovo ThinkPad P16 G2 21FA000FGE | |
| Lenovo ThinkPad P1 G6 21FV001KUS | |
| AIDA64 / CPU ZLib | |
| Asus ProArt Studiobook 16 OLED H7604 | |
| Average Intel Core i9-14900HX (1054 - 2292, n=36) | |
| HP ZBook Fury 16 G11 | |
| HP ZBook Fury 16 G10 | |
| Dell Precision 5690 | |
| HP ZBook Fury 16 G9 | |
| Lenovo ThinkPad P1 G6 21FV001KUS | |
| Lenovo ThinkPad P16 G2 21FA000FGE | |
| AIDA64 / FP64 Ray-Trace | |
| Asus ProArt Studiobook 16 OLED H7604 | |
| Average Intel Core i9-14900HX (6809 - 18349, n=36) | |
| HP ZBook Fury 16 G10 | |
| HP ZBook Fury 16 G11 | |
| Lenovo ThinkPad P16 G2 21FA000FGE | |
| Dell Precision 5690 | |
| Lenovo ThinkPad P1 G6 21FV001KUS | |
| HP ZBook Fury 16 G9 | |
| AIDA64 / CPU PhotoWorxx | |
| Dell Precision 5690 | |
| Asus ProArt Studiobook 16 OLED H7604 | |
| Average Intel Core i9-14900HX (23903 - 54702, n=36) | |
| HP ZBook Fury 16 G10 | |
| HP ZBook Fury 16 G9 | |
| HP ZBook Fury 16 G11 | |
| Lenovo ThinkPad P16 G2 21FA000FGE | |
| Lenovo ThinkPad P1 G6 21FV001KUS | |
压力测试
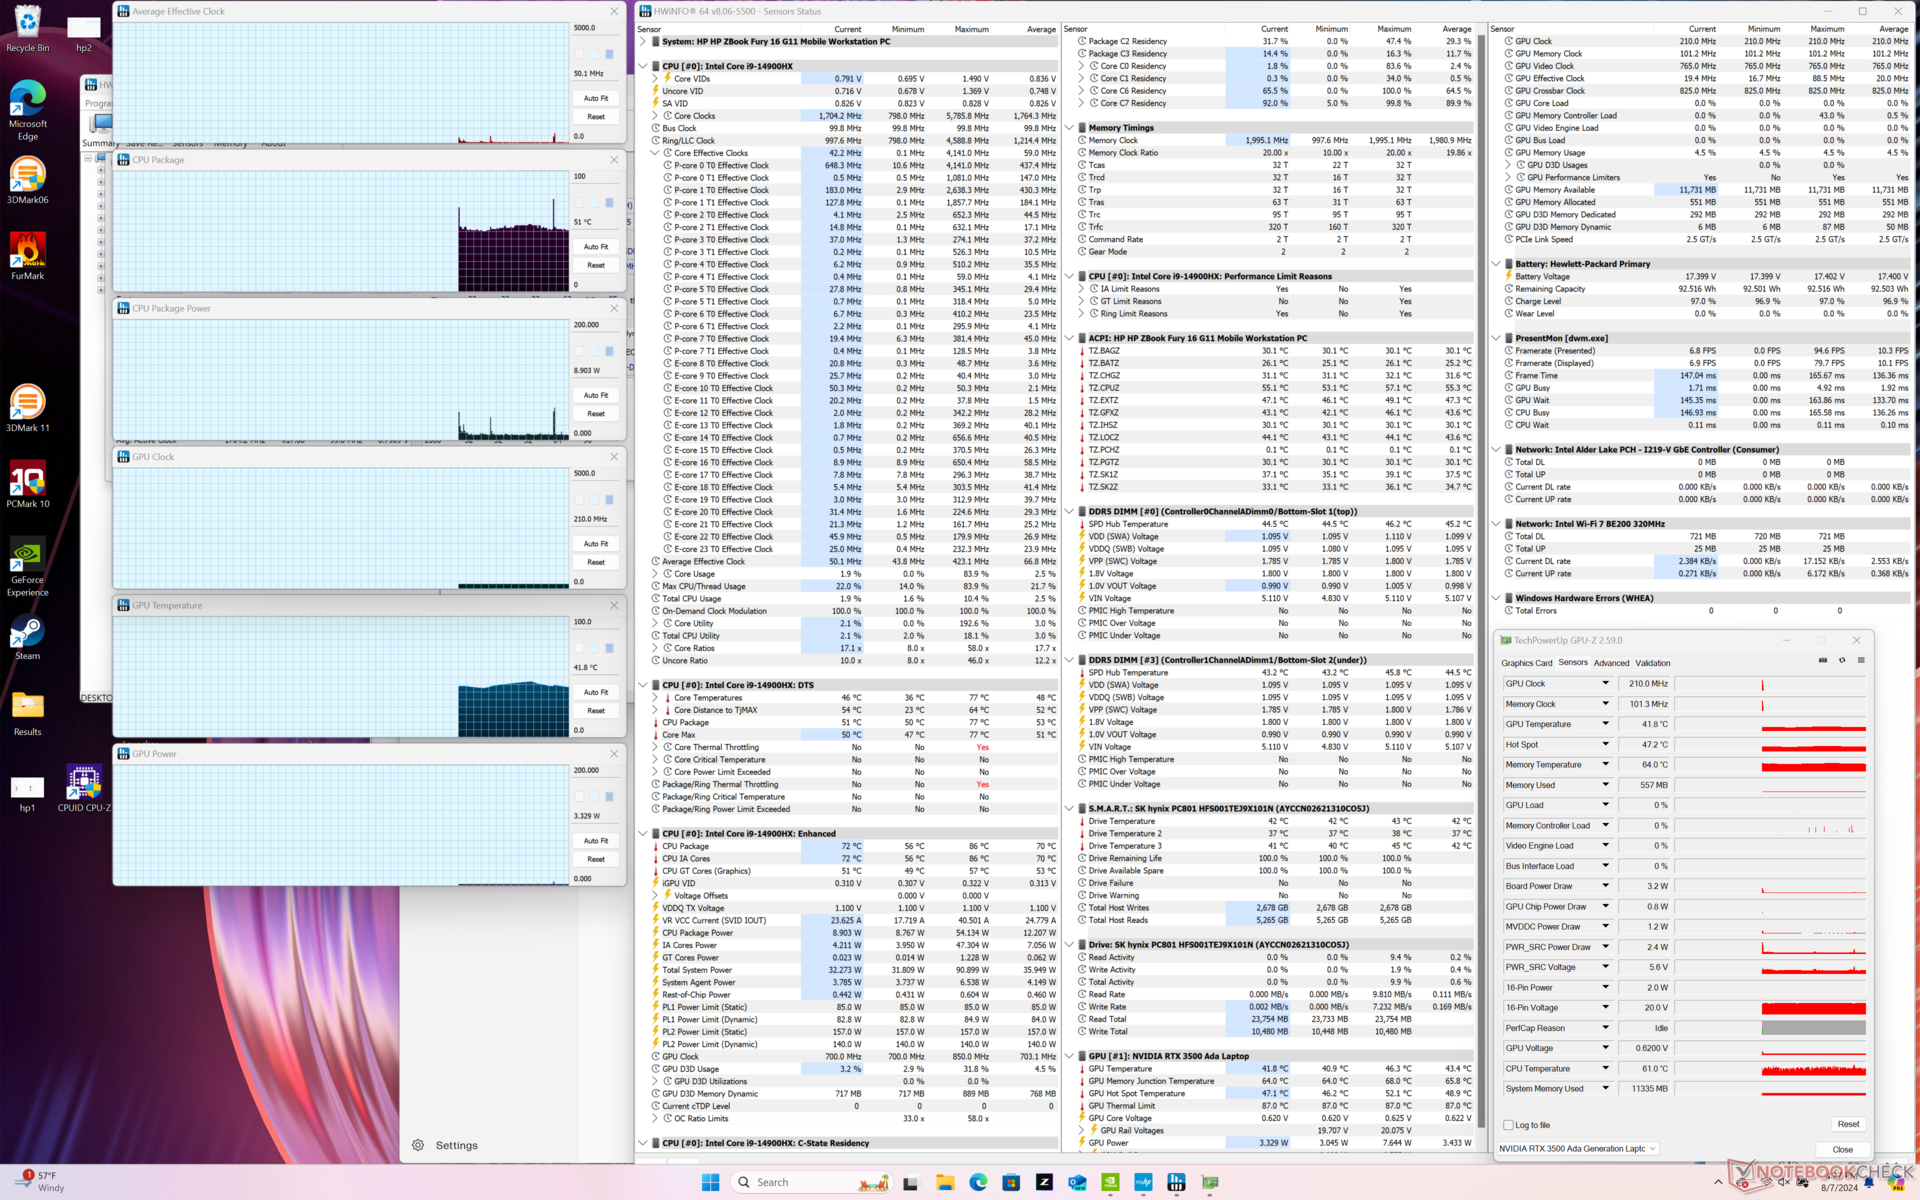
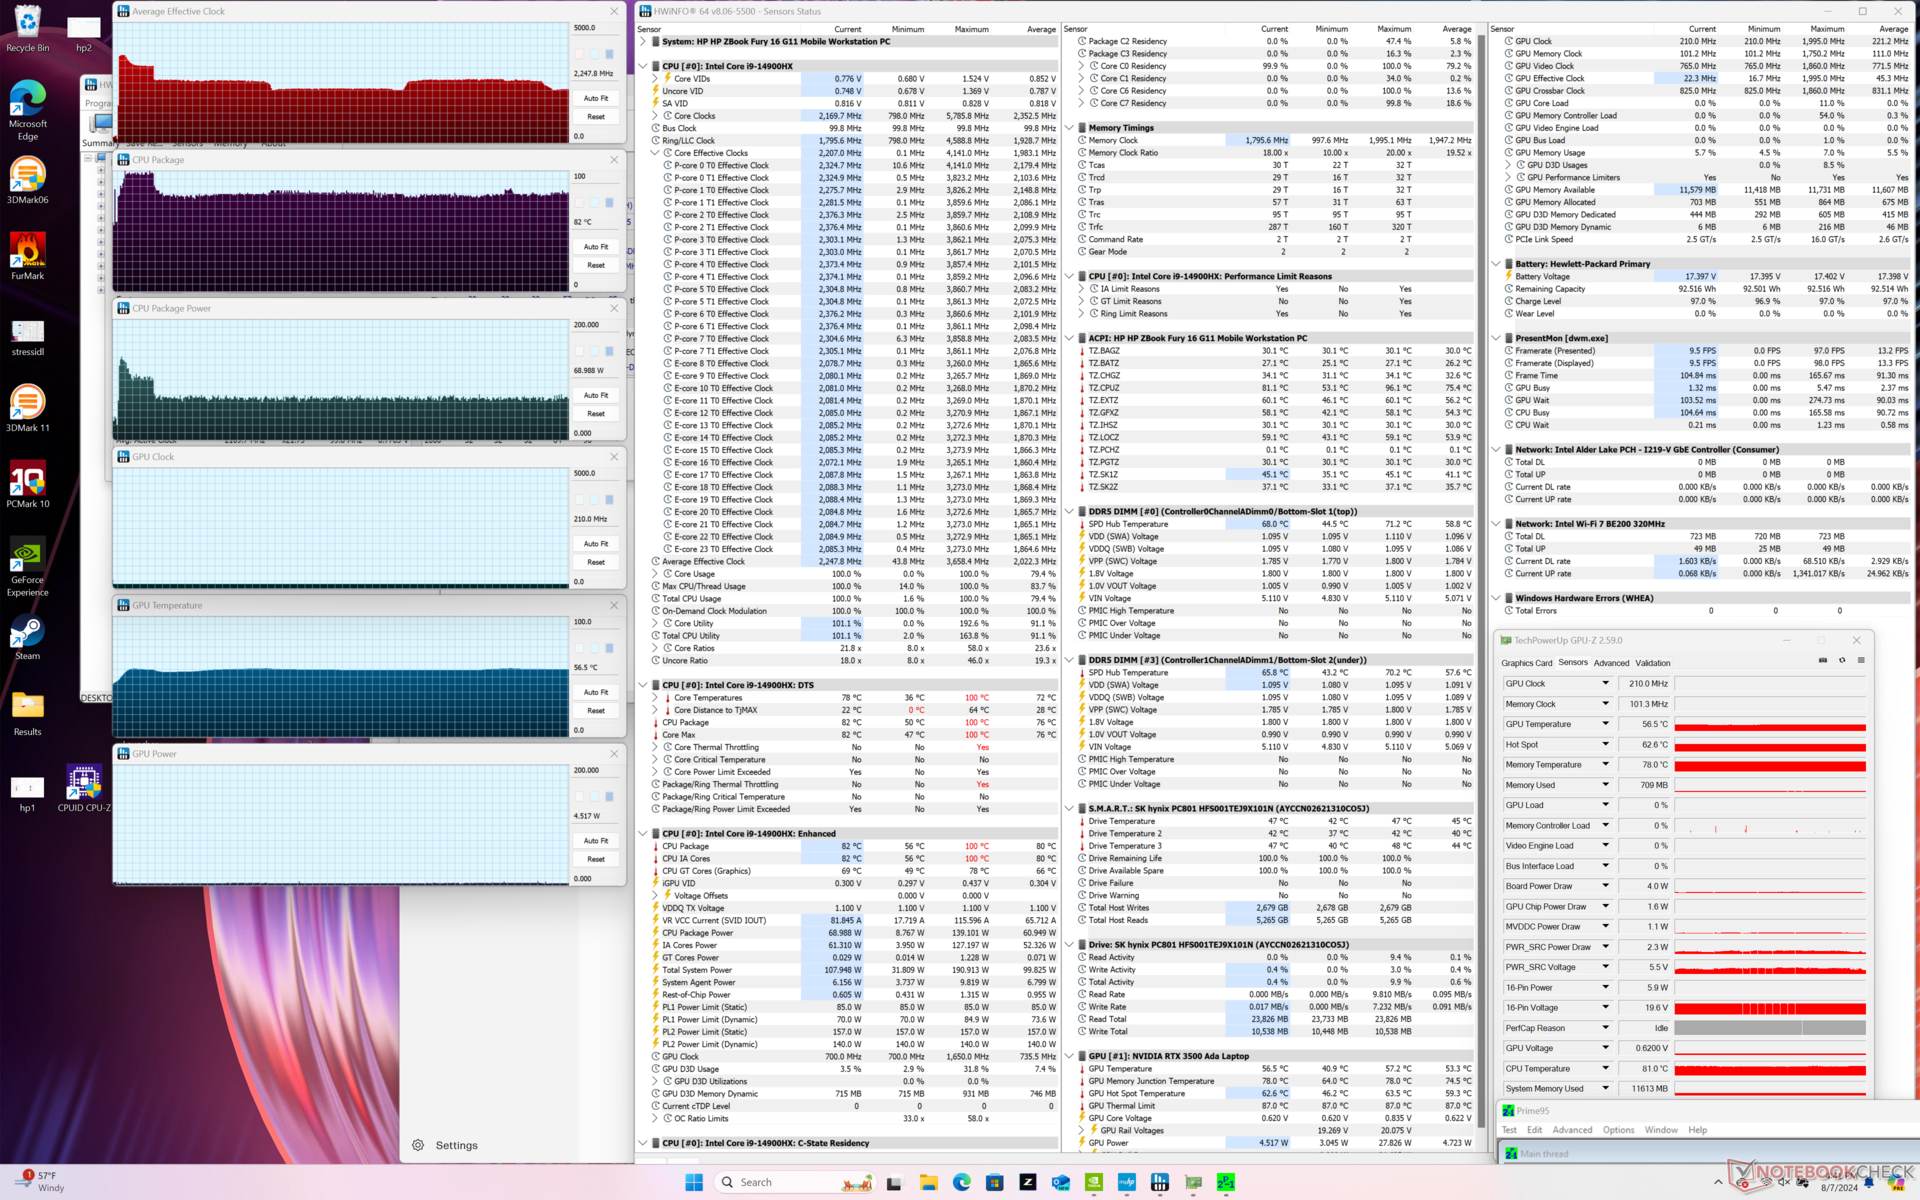
当运行 Prime95 对 CPU 施加压力时,核心时钟频率和封装功耗将分别飙升至 3.7 GHz 和 139 W,最多只能持续一分钟,核心温度也将飙升至 99 C。随着时间的推移,性能相对急剧下降,导致上述 CineBench R15 xT 循环分数逐渐降低。
在运行游戏等高负载时,CPU 和 GPU 的温度将稳定在与我们去年在 ZBook Fury 16 G10 上记录的读数几乎相同的水平,尽管它们的性能存在差异。
| 平均 CPU 时钟 (GHz) | GPU 时钟 (MHz) | 平均 CPU 温度 (°C) | 平均 GPU 温度(°C) | |
| 系统闲置 | -- | -- | 51 | 42 |
| Prime95 压力 | 2.2 - 2.6 | -- | 82 | 57 |
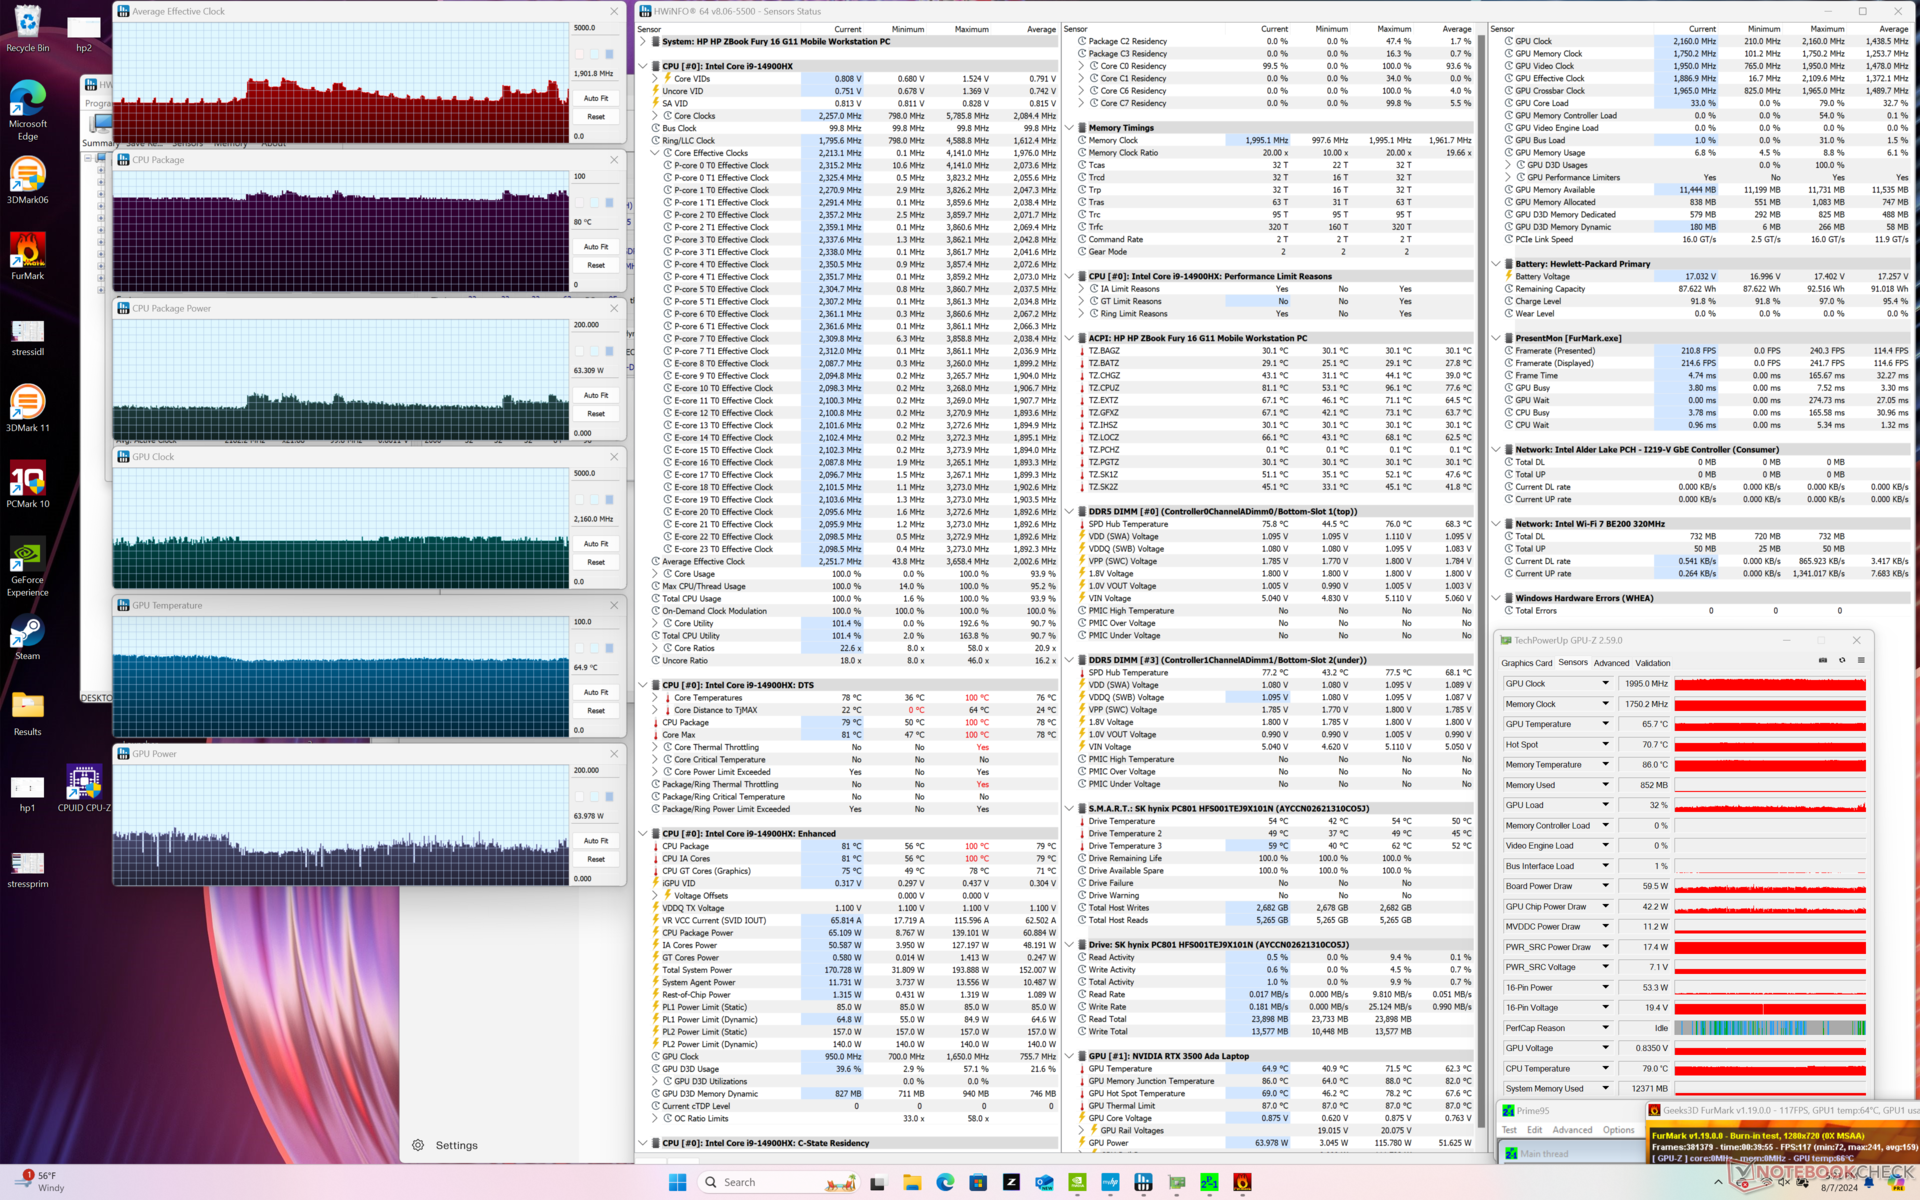
| Prime95 + FurMark 压力 | 1.8 | 1995 | 81 | 65 |
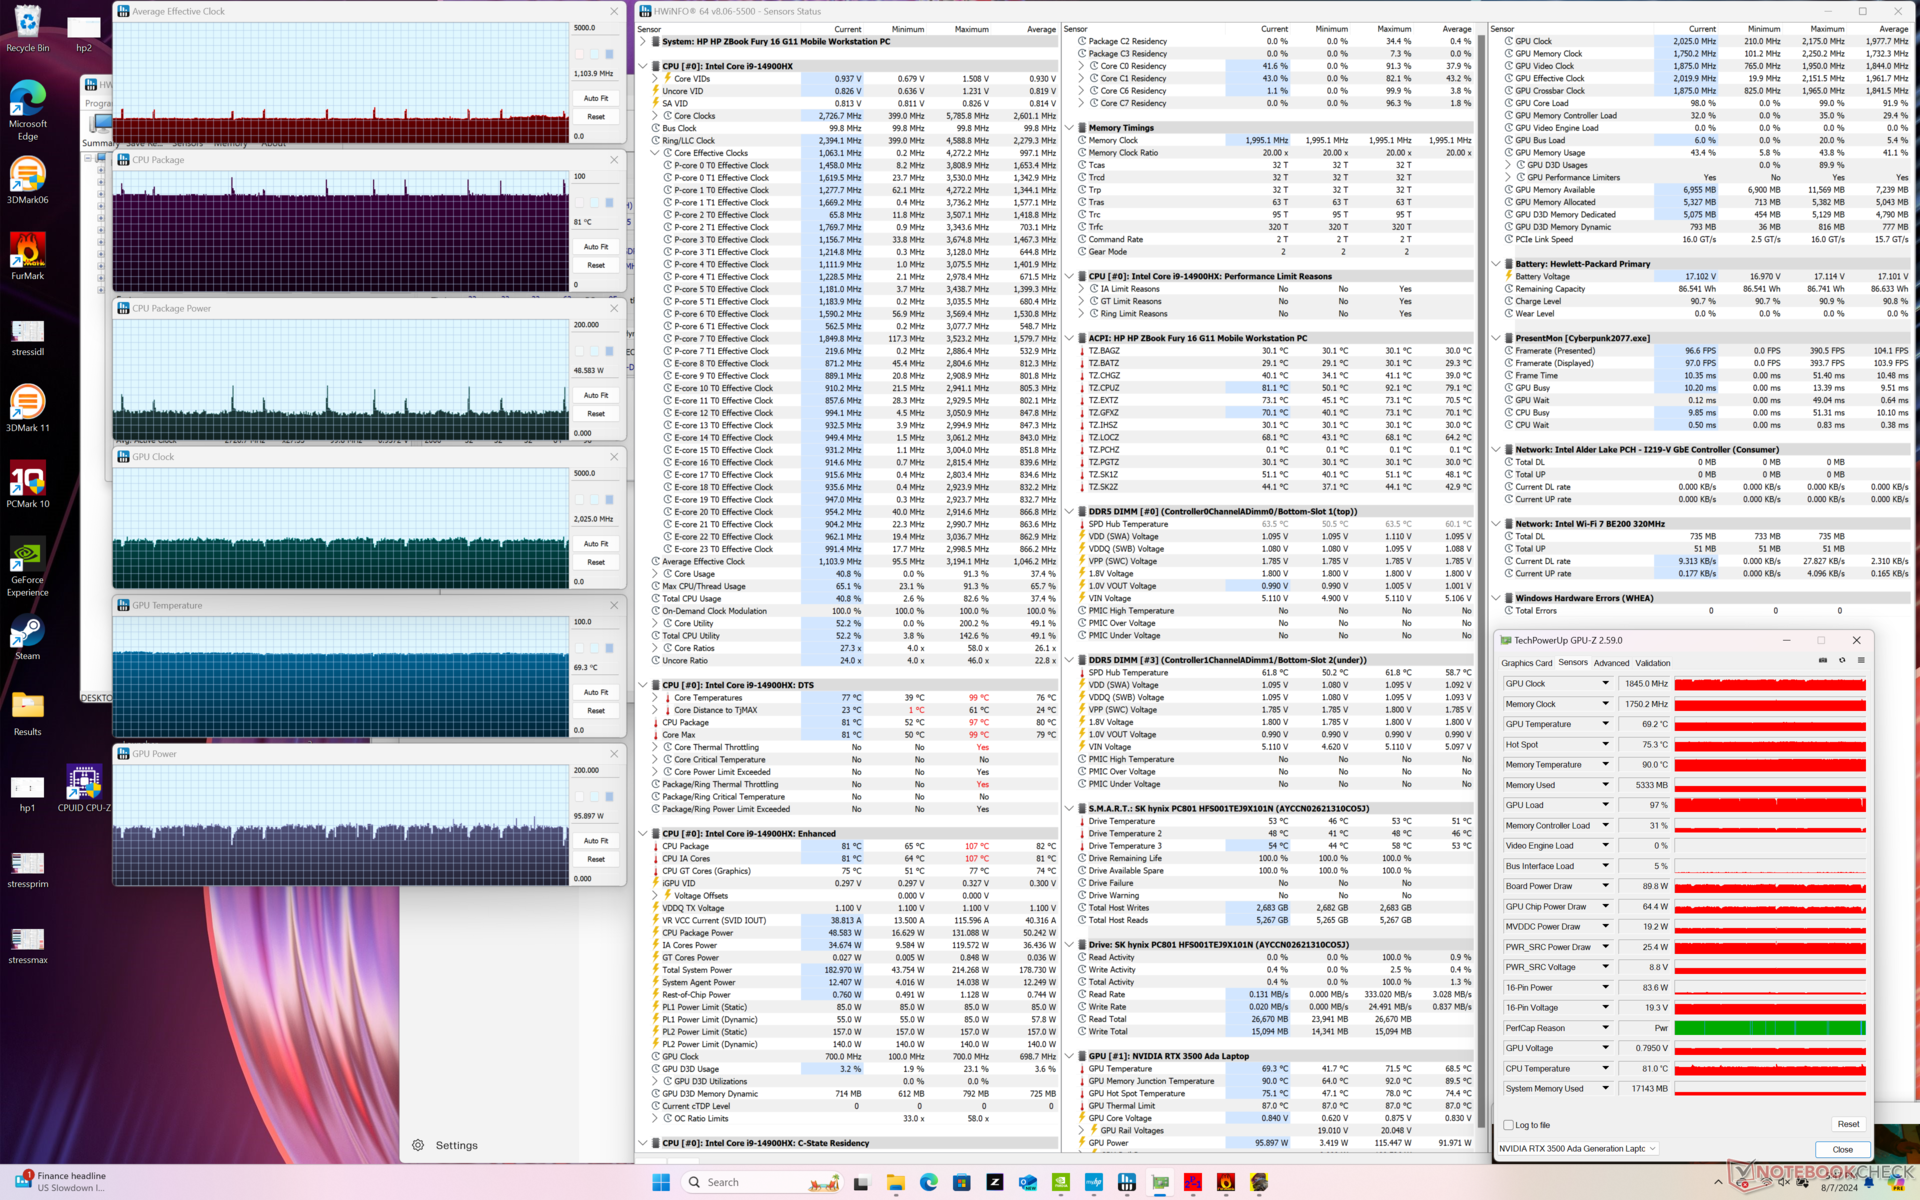
| 赛博朋克 2077》压力 | 1.1 | 1845 | 81 | 69 |
系统性能
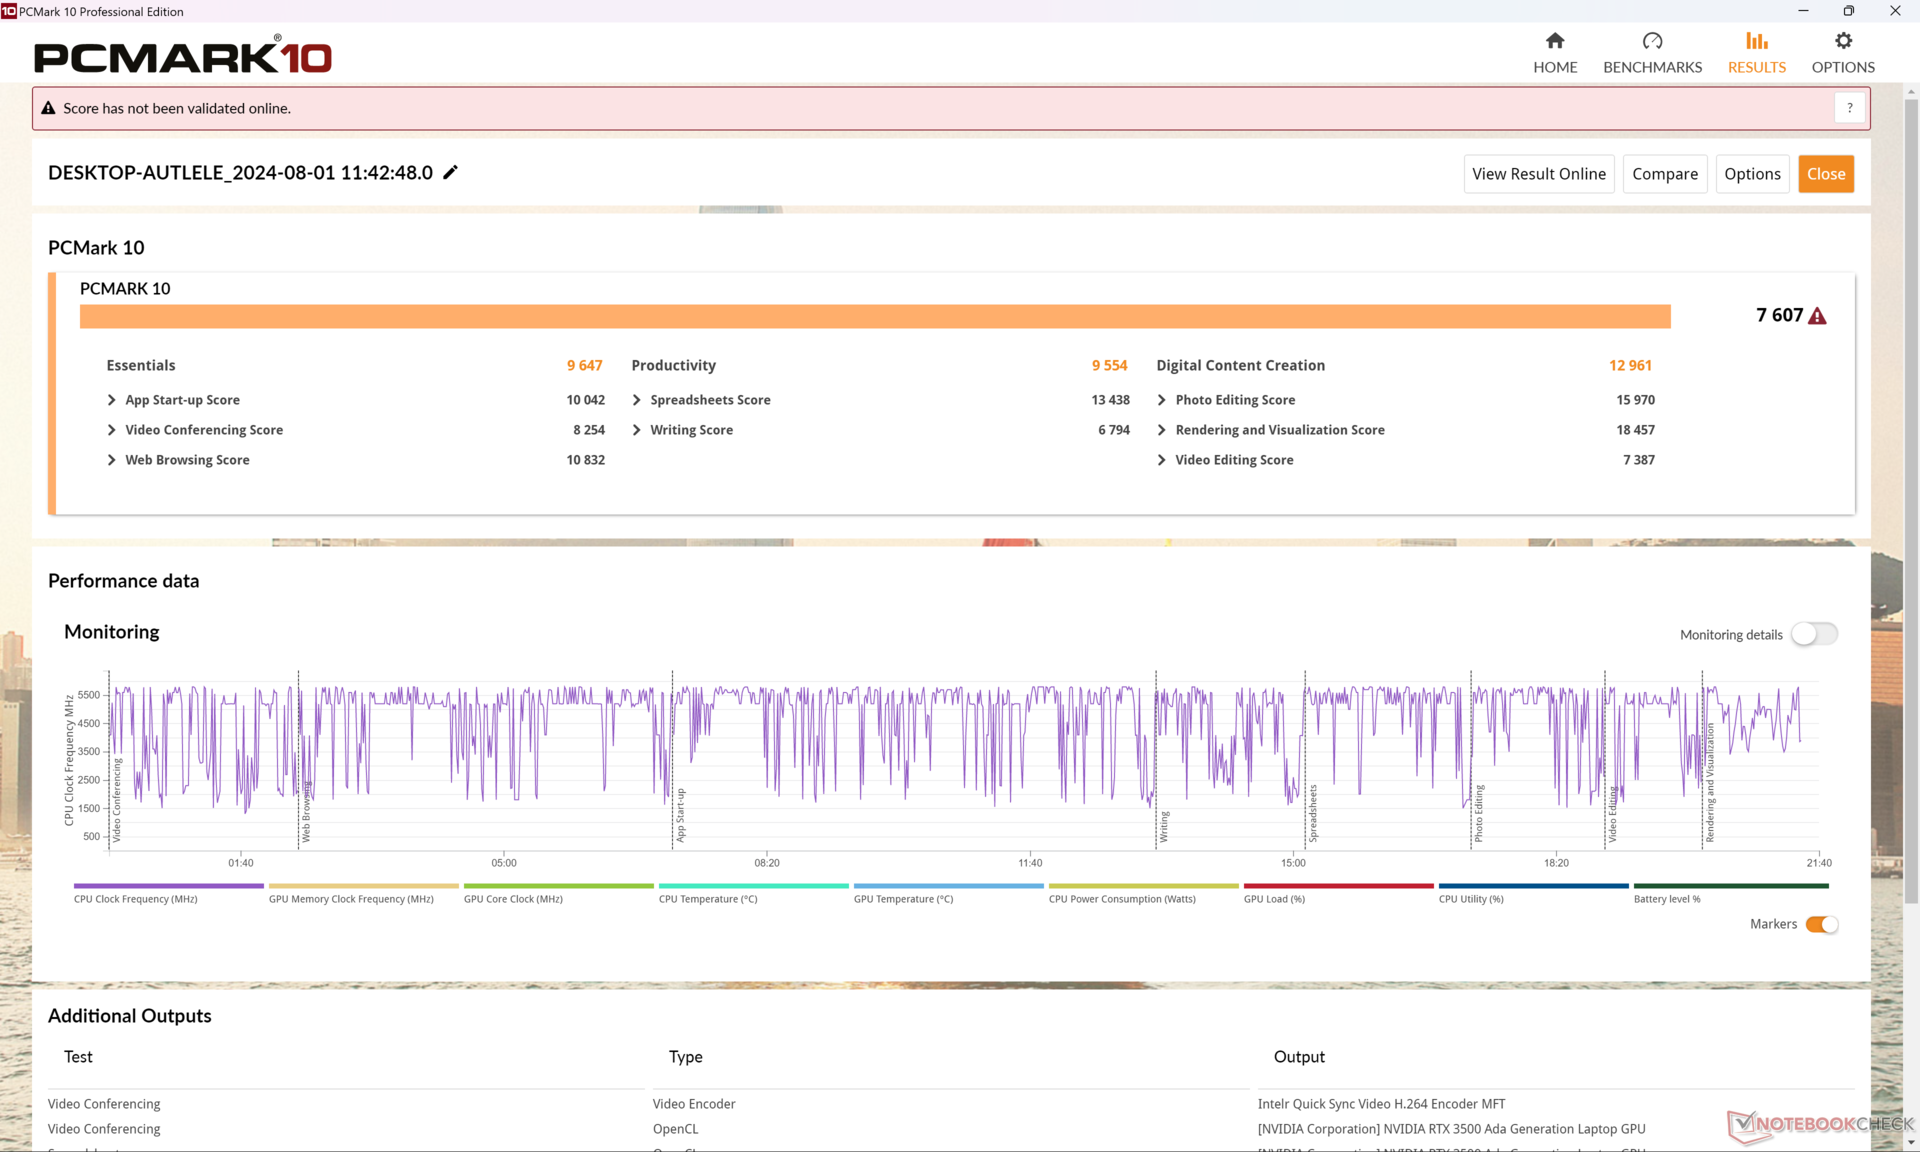
PCMark 的结果与我们在去年的 ZBook Fury 16 G10 上记录的结果类似,表明 ZBook Fury 16 G11 在运行大多数日常任务时不会比其前代产品更快。
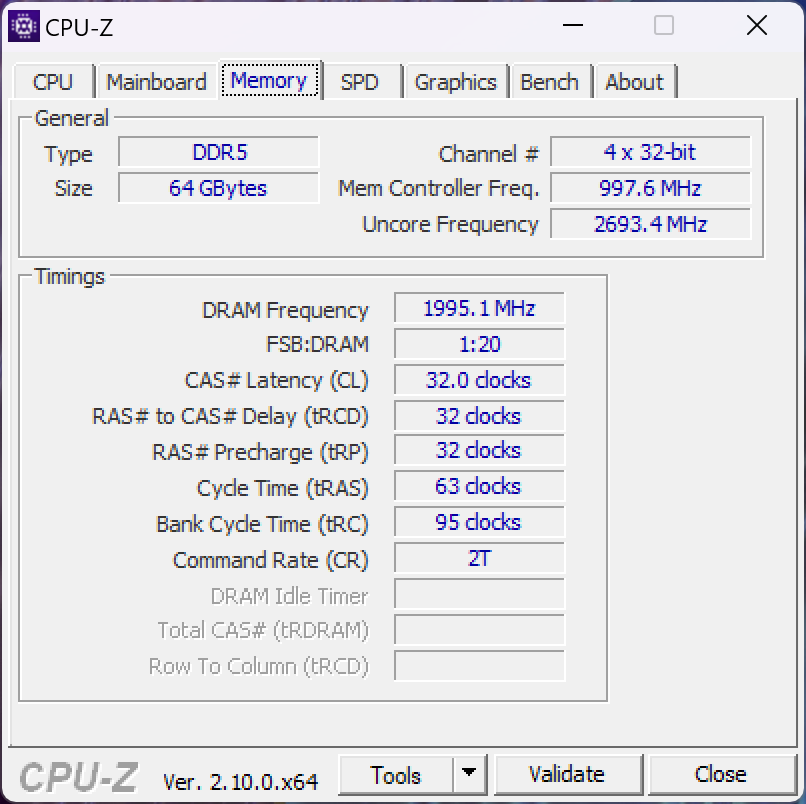
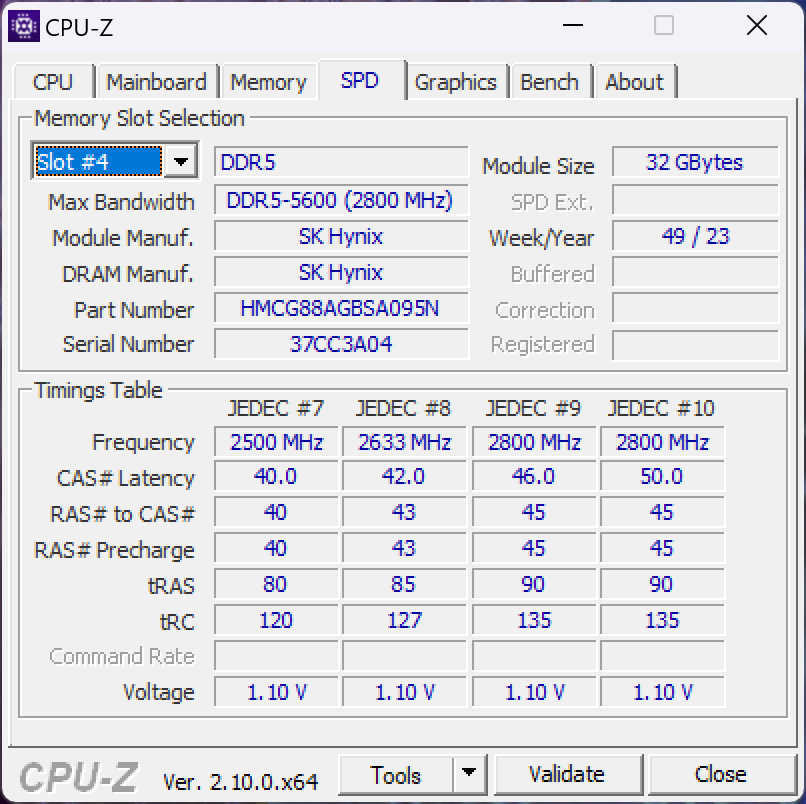
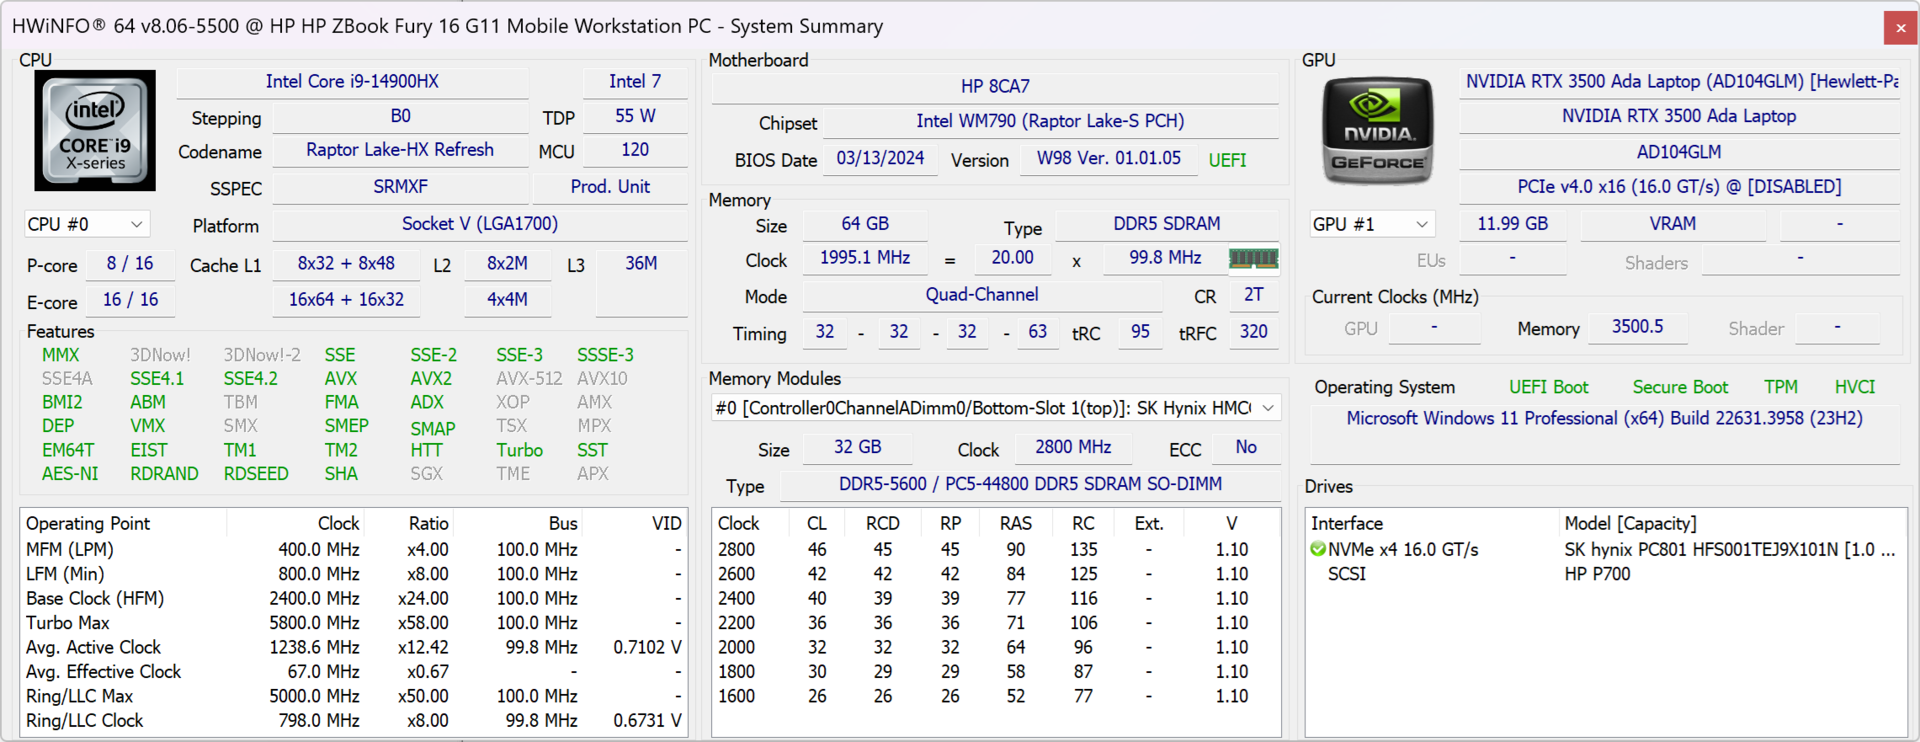
请注意,由于 SODIMM 标准的限制,如果配置 128GB 内存,最大内存速度将被限制在 4000 MT/s。该机型同时支持 ECC 内存和非 ECC 内存。
CrossMark: Overall | Productivity | Creativity | Responsiveness
WebXPRT 3: Overall
WebXPRT 4: Overall
Mozilla Kraken 1.1: Total
| PCMark 10 / Score | |
| HP ZBook Fury 16 G10 | |
| Dell Precision 5690 | |
| Lenovo ThinkPad P1 G6 21FV001KUS | |
| HP ZBook Fury 16 G11 | |
| Average Intel Core i9-14900HX, NVIDIA RTX 3500 Ada Generation Laptop (n=1) | |
| Asus ProArt Studiobook 16 OLED H7604 | |
| Lenovo ThinkPad P16 G2 21FA000FGE | |
| HP ZBook Fury 16 G9 | |
| PCMark 10 / Essentials | |
| Lenovo ThinkPad P1 G6 21FV001KUS | |
| HP ZBook Fury 16 G10 | |
| Dell Precision 5690 | |
| Lenovo ThinkPad P16 G2 21FA000FGE | |
| HP ZBook Fury 16 G9 | |
| Asus ProArt Studiobook 16 OLED H7604 | |
| HP ZBook Fury 16 G11 | |
| Average Intel Core i9-14900HX, NVIDIA RTX 3500 Ada Generation Laptop (n=1) | |
| PCMark 10 / Productivity | |
| Dell Precision 5690 | |
| Lenovo ThinkPad P1 G6 21FV001KUS | |
| Asus ProArt Studiobook 16 OLED H7604 | |
| HP ZBook Fury 16 G11 | |
| Average Intel Core i9-14900HX, NVIDIA RTX 3500 Ada Generation Laptop (n=1) | |
| Lenovo ThinkPad P16 G2 21FA000FGE | |
| HP ZBook Fury 16 G10 | |
| HP ZBook Fury 16 G9 | |
| PCMark 10 / Digital Content Creation | |
| HP ZBook Fury 16 G10 | |
| HP ZBook Fury 16 G11 | |
| Average Intel Core i9-14900HX, NVIDIA RTX 3500 Ada Generation Laptop (n=1) | |
| Lenovo ThinkPad P1 G6 21FV001KUS | |
| Dell Precision 5690 | |
| Asus ProArt Studiobook 16 OLED H7604 | |
| Lenovo ThinkPad P16 G2 21FA000FGE | |
| HP ZBook Fury 16 G9 | |
| CrossMark / Overall | |
| Asus ProArt Studiobook 16 OLED H7604 | |
| HP ZBook Fury 16 G11 | |
| Average Intel Core i9-14900HX, NVIDIA RTX 3500 Ada Generation Laptop (n=1) | |
| HP ZBook Fury 16 G10 | |
| HP ZBook Fury 16 G9 | |
| Lenovo ThinkPad P16 G2 21FA000FGE | |
| Lenovo ThinkPad P1 G6 21FV001KUS | |
| Dell Precision 5690 | |
| CrossMark / Productivity | |
| Asus ProArt Studiobook 16 OLED H7604 | |
| HP ZBook Fury 16 G11 | |
| Average Intel Core i9-14900HX, NVIDIA RTX 3500 Ada Generation Laptop (n=1) | |
| HP ZBook Fury 16 G10 | |
| HP ZBook Fury 16 G9 | |
| Dell Precision 5690 | |
| Lenovo ThinkPad P1 G6 21FV001KUS | |
| Lenovo ThinkPad P16 G2 21FA000FGE | |
| CrossMark / Creativity | |
| Asus ProArt Studiobook 16 OLED H7604 | |
| HP ZBook Fury 16 G11 | |
| Average Intel Core i9-14900HX, NVIDIA RTX 3500 Ada Generation Laptop (n=1) | |
| Lenovo ThinkPad P16 G2 21FA000FGE | |
| HP ZBook Fury 16 G9 | |
| HP ZBook Fury 16 G10 | |
| Lenovo ThinkPad P1 G6 21FV001KUS | |
| Dell Precision 5690 | |
| CrossMark / Responsiveness | |
| Asus ProArt Studiobook 16 OLED H7604 | |
| HP ZBook Fury 16 G11 | |
| Average Intel Core i9-14900HX, NVIDIA RTX 3500 Ada Generation Laptop (n=1) | |
| HP ZBook Fury 16 G10 | |
| HP ZBook Fury 16 G9 | |
| Dell Precision 5690 | |
| Lenovo ThinkPad P1 G6 21FV001KUS | |
| Lenovo ThinkPad P16 G2 21FA000FGE | |
| WebXPRT 3 / Overall | |
| HP ZBook Fury 16 G10 | |
| Asus ProArt Studiobook 16 OLED H7604 | |
| Lenovo ThinkPad P16 G2 21FA000FGE | |
| HP ZBook Fury 16 G11 | |
| Average Intel Core i9-14900HX, NVIDIA RTX 3500 Ada Generation Laptop (n=1) | |
| Lenovo ThinkPad P1 G6 21FV001KUS | |
| HP ZBook Fury 16 G9 | |
| Dell Precision 5690 | |
| WebXPRT 4 / Overall | |
| HP ZBook Fury 16 G11 | |
| Average Intel Core i9-14900HX, NVIDIA RTX 3500 Ada Generation Laptop (n=1) | |
| HP ZBook Fury 16 G10 | |
| Asus ProArt Studiobook 16 OLED H7604 | |
| Lenovo ThinkPad P1 G6 21FV001KUS | |
| HP ZBook Fury 16 G9 | |
| Dell Precision 5690 | |
| Mozilla Kraken 1.1 / Total | |
| Dell Precision 5690 | |
| HP ZBook Fury 16 G9 | |
| Lenovo ThinkPad P16 G2 21FA000FGE | |
| Lenovo ThinkPad P1 G6 21FV001KUS | |
| HP ZBook Fury 16 G10 | |
| HP ZBook Fury 16 G11 | |
| Average Intel Core i9-14900HX, NVIDIA RTX 3500 Ada Generation Laptop (n=1) | |
| Asus ProArt Studiobook 16 OLED H7604 | |
* ... smaller is better
| PCMark 10 Score | 7607 points | |
Help | ||
| AIDA64 / Memory Copy | |
| Dell Precision 5690 | |
| Average Intel Core i9-14900HX (38028 - 83392, n=36) | |
| Asus ProArt Studiobook 16 OLED H7604 | |
| HP ZBook Fury 16 G10 | |
| HP ZBook Fury 16 G9 | |
| HP ZBook Fury 16 G11 | |
| Lenovo ThinkPad P16 G2 21FA000FGE | |
| Lenovo ThinkPad P1 G6 21FV001KUS | |
| AIDA64 / Memory Read | |
| Dell Precision 5690 | |
| Average Intel Core i9-14900HX (43306 - 87568, n=36) | |
| Asus ProArt Studiobook 16 OLED H7604 | |
| HP ZBook Fury 16 G10 | |
| HP ZBook Fury 16 G11 | |
| HP ZBook Fury 16 G9 | |
| Lenovo ThinkPad P16 G2 21FA000FGE | |
| Lenovo ThinkPad P1 G6 21FV001KUS | |
| AIDA64 / Memory Write | |
| Dell Precision 5690 | |
| Average Intel Core i9-14900HX (37146 - 80589, n=36) | |
| Asus ProArt Studiobook 16 OLED H7604 | |
| HP ZBook Fury 16 G10 | |
| HP ZBook Fury 16 G9 | |
| Lenovo ThinkPad P16 G2 21FA000FGE | |
| HP ZBook Fury 16 G11 | |
| Lenovo ThinkPad P1 G6 21FV001KUS | |
| AIDA64 / Memory Latency | |
| Dell Precision 5690 | |
| HP ZBook Fury 16 G10 | |
| Lenovo ThinkPad P16 G2 21FA000FGE | |
| HP ZBook Fury 16 G11 | |
| HP ZBook Fury 16 G9 | |
| Asus ProArt Studiobook 16 OLED H7604 | |
| Lenovo ThinkPad P1 G6 21FV001KUS | |
| Average Intel Core i9-14900HX (76.1 - 105, n=36) | |
* ... smaller is better
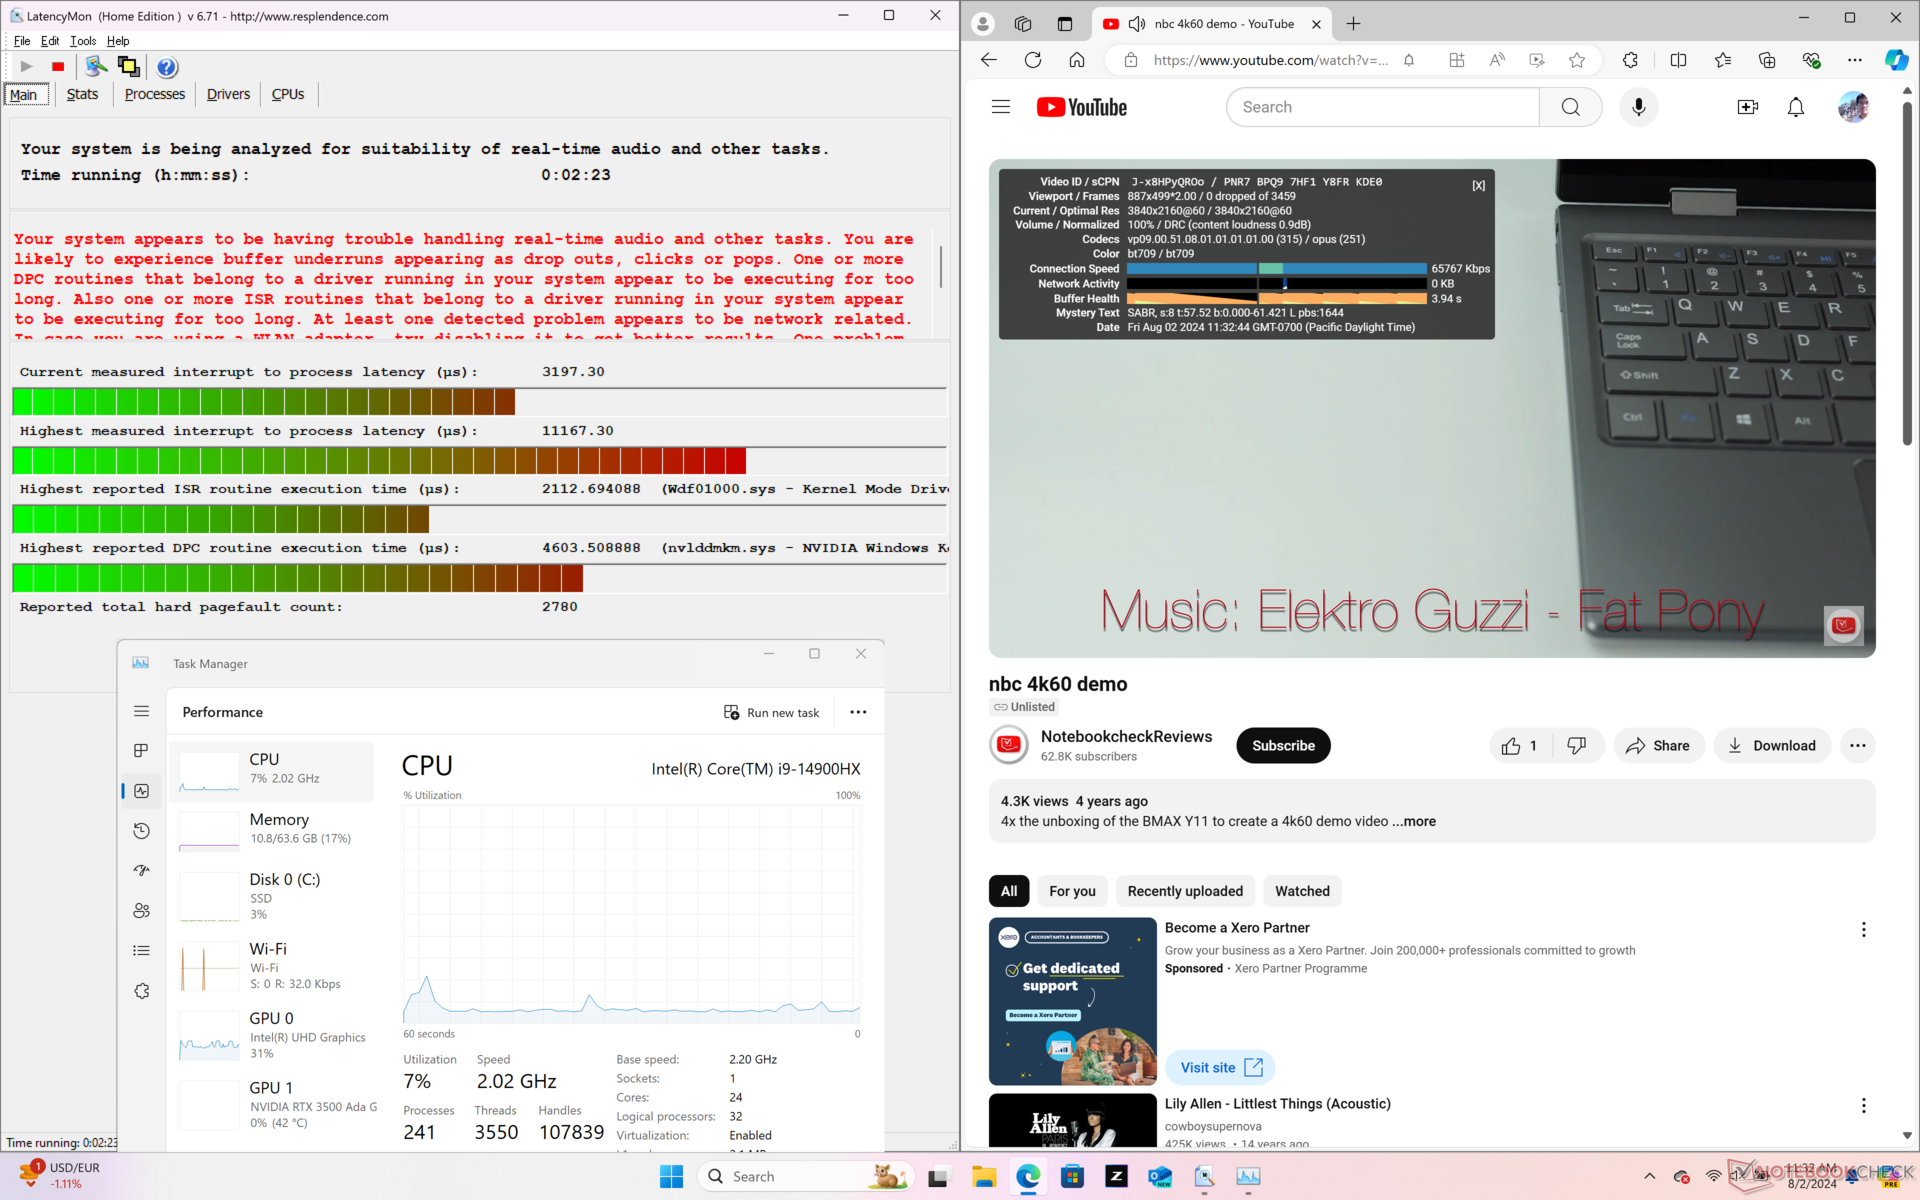
DPC 延迟
在打开我们主页的多个浏览器标签页时,LatencyMon 显示了 DPC 问题。在其他方面,以 60 FPS 播放 4K 视频也非常完美,没有掉帧记录。

| DPC Latencies / LatencyMon - interrupt to process latency (max), Web, Youtube, Prime95 | |
| HP ZBook Fury 16 G11 | |
| HP ZBook Fury 16 G10 | |
| HP ZBook Fury 16 G9 | |
| Asus ProArt Studiobook 16 OLED H7604 | |
| Lenovo ThinkPad P1 G6 21FV001KUS | |
| Lenovo ThinkPad P16 G2 21FA000FGE | |
| Dell Precision 5690 | |
* ... smaller is better
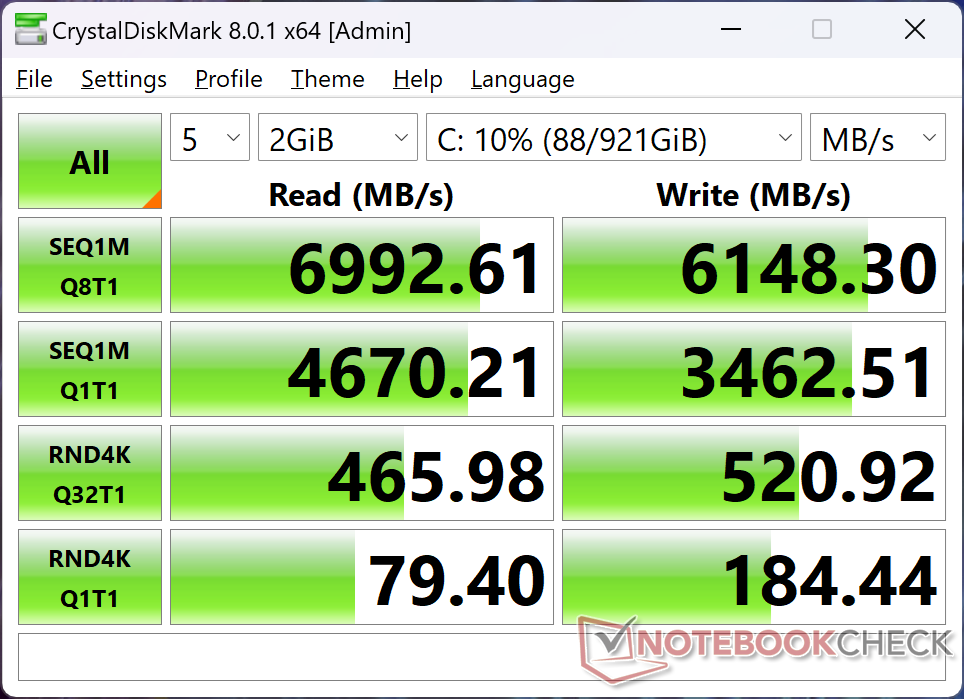
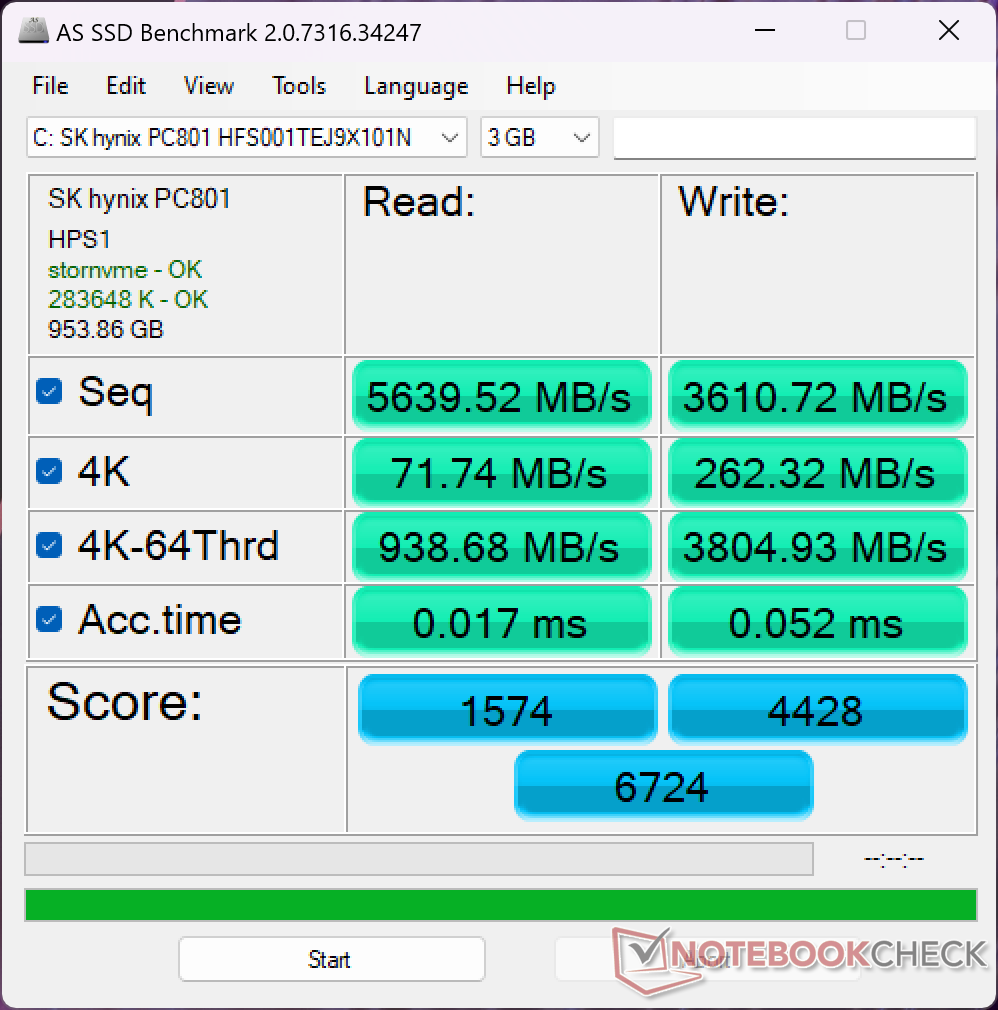
存储设备
我们的测试设备配备了相同的 1 TB SK Hynix PC801 HFS001TEJ9X101NPCIe4 M.2 固态硬盘。不幸的是,该硬盘也存在同样的性能节流问题。如下图所示,在循环运行 DiskSpd 时,传输速率一开始会非常高,接近 7000 MB/s,几分钟后就会降至 3400 MB/s。这可能是硬盘散热不足造成的,但这也许是支持比其他大多数笔记本电脑更多独立硬盘的代价。

* ... smaller is better
Disk Throttling: DiskSpd Read Loop, Queue Depth 8
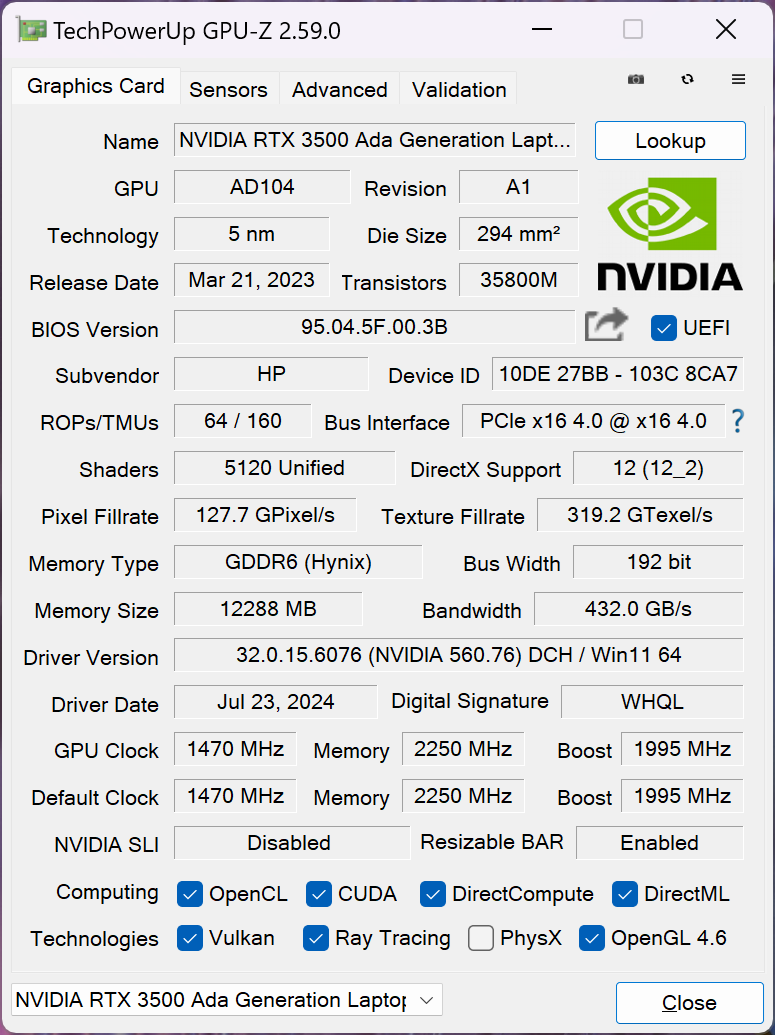
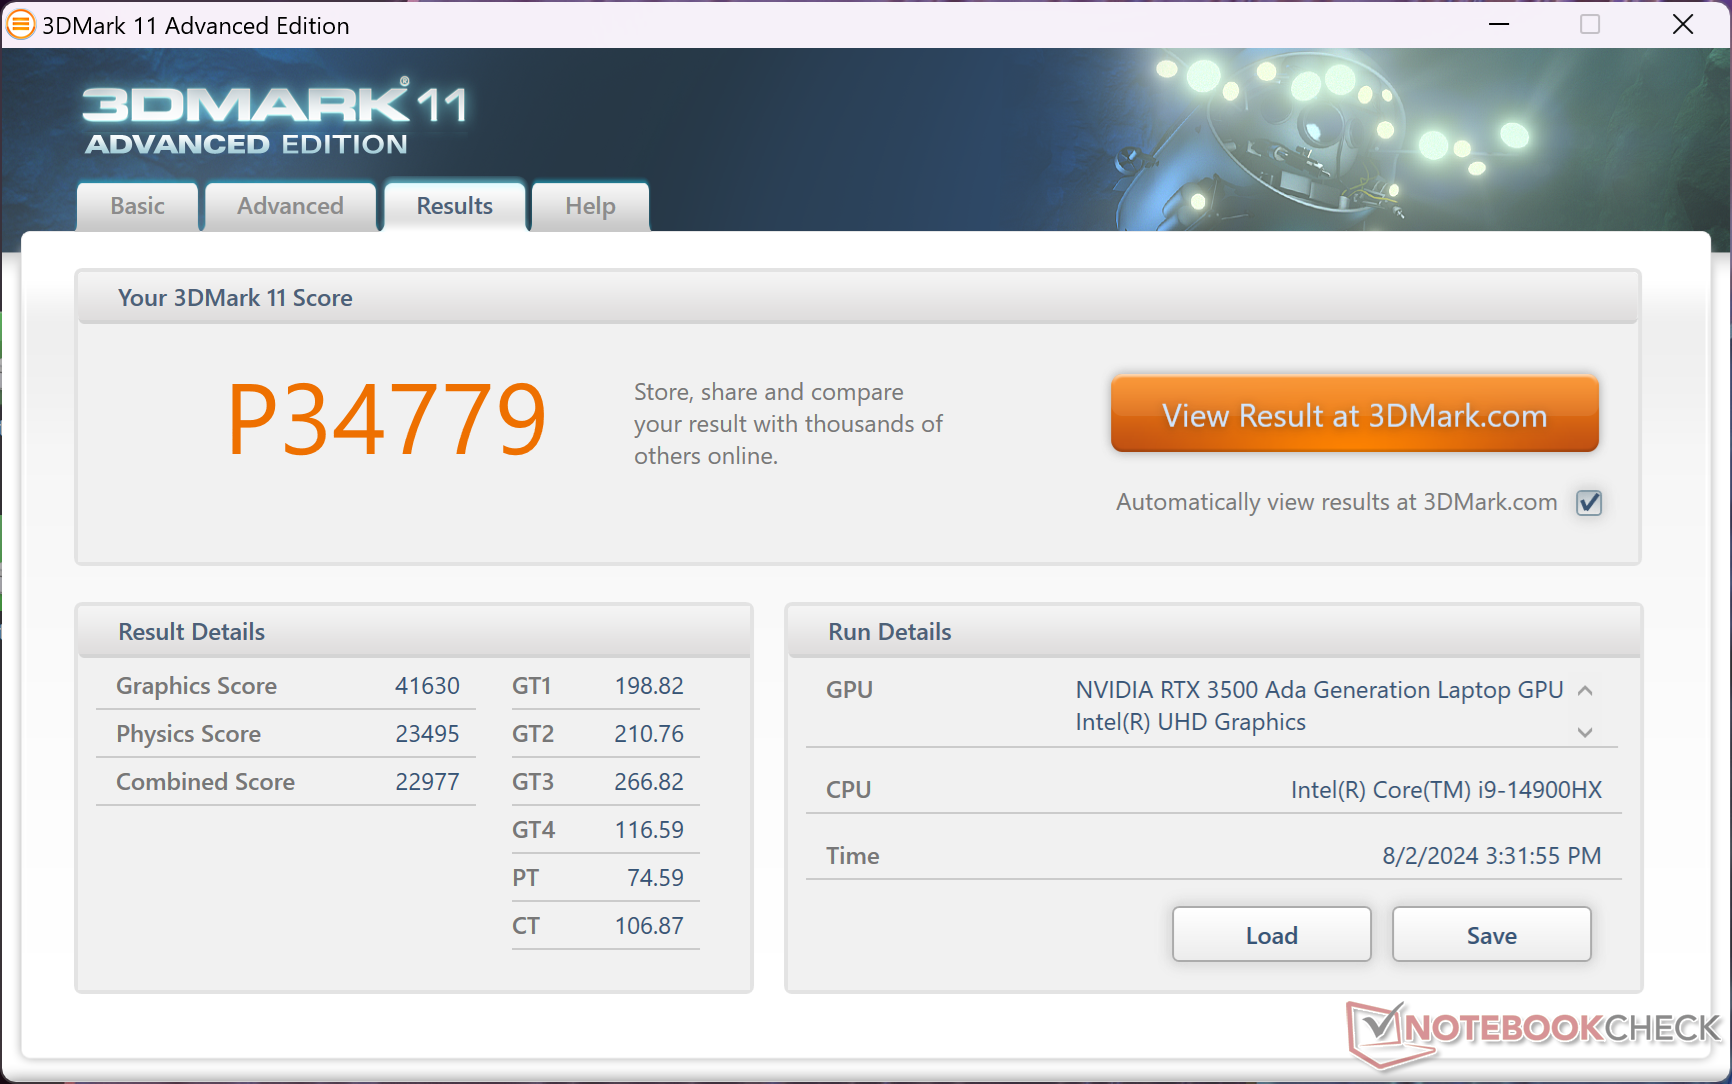
图形处理器性能
用户可以期待 RTX 3500 Ada的性能大约比 RTX 5000 Ada.由于 Nvidia 尚未推出新一代移动 GPU,因此 ZBook Fury 16 G11 所配备的 GPU 选件与去年的型号相同,性能没有显著提升。RTA 5000 Ada 仍是目前最快的移动工作站 GPU。
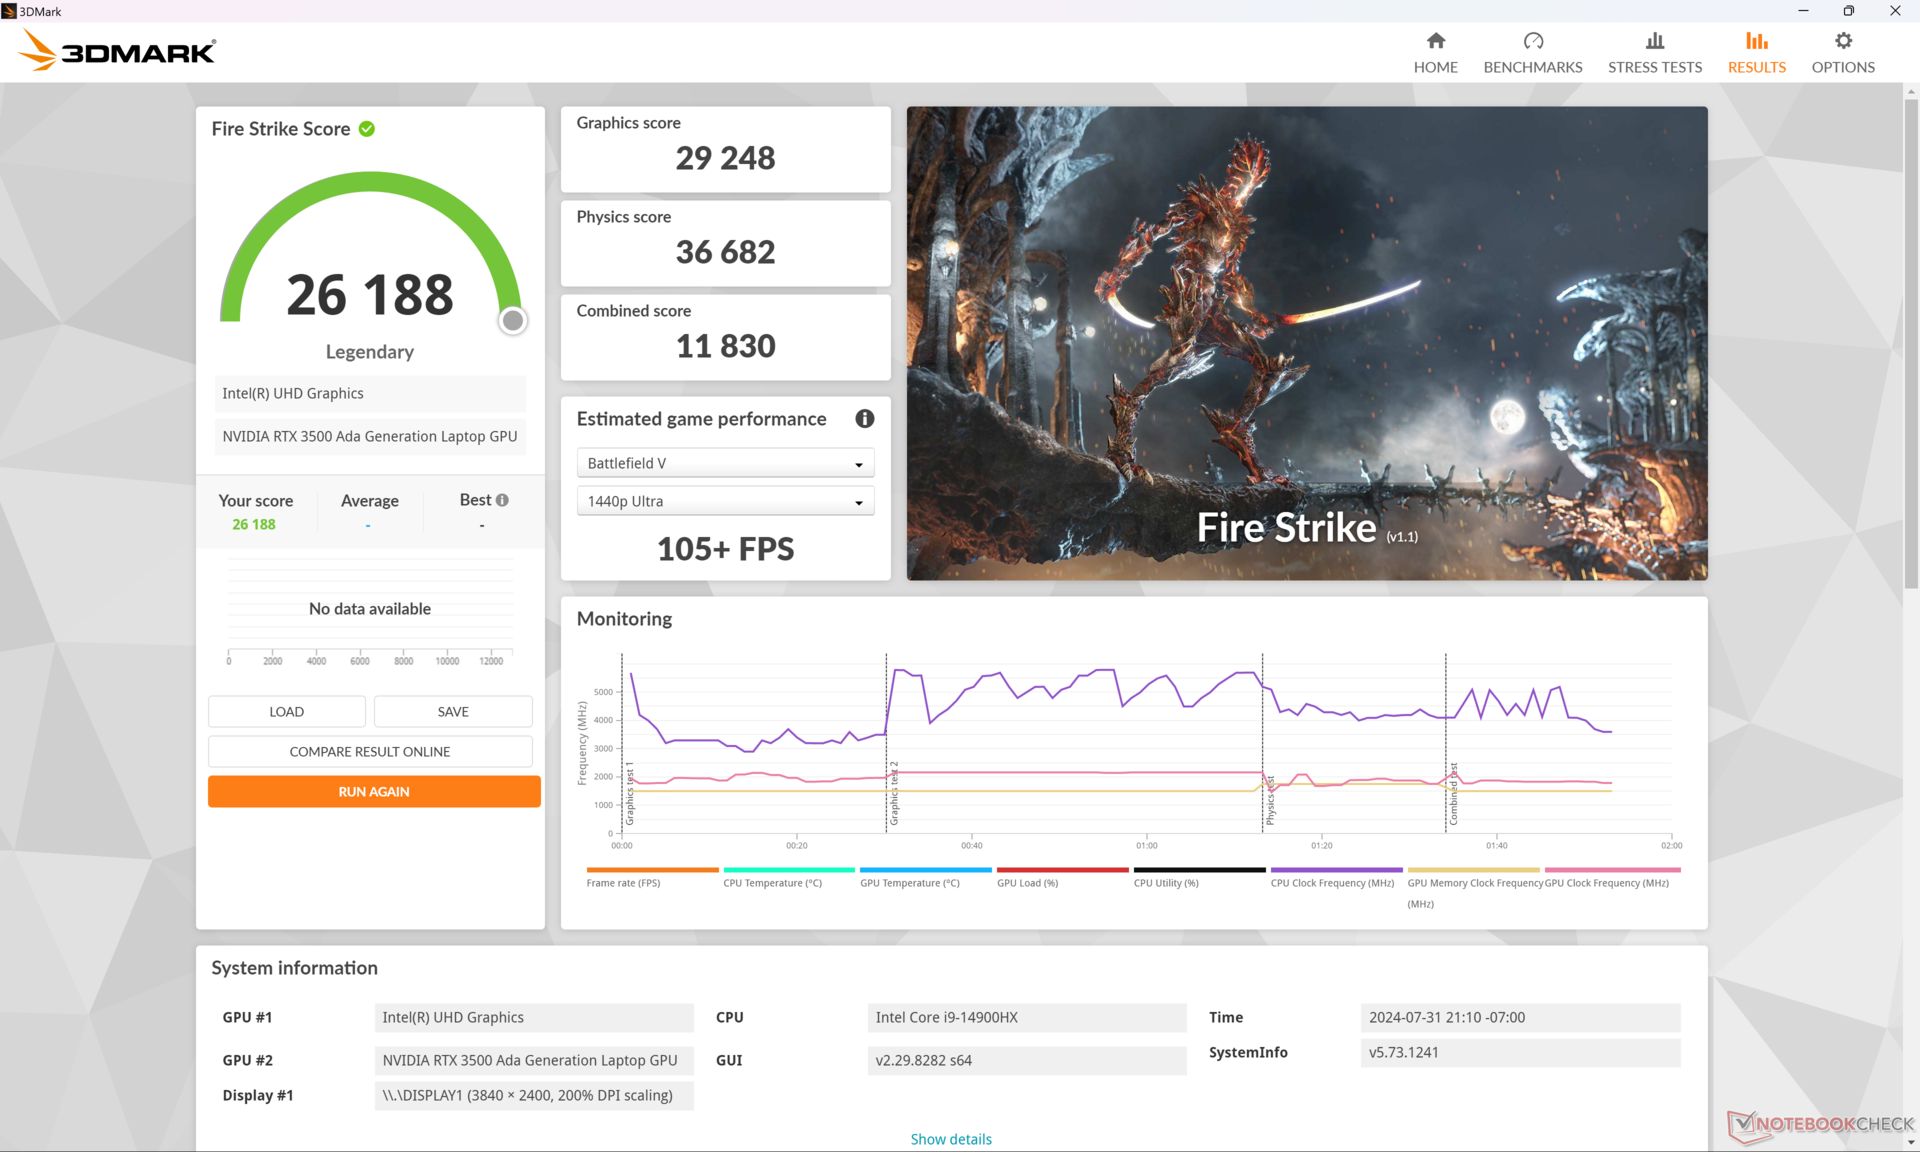
| 电源配置文件 | 图形得分 | 物理得分 | 综合得分 |
| 性能模式 | 29248 | 36682 | 11830 |
| 均衡模式 | 28214 (-4%) | 33094 (-10%) | 10246 (-13%) |
| 电池电量 | 16618 (-43%) | 25118 (-32%) | 4101 (-65%) |
如Fire Strike 上表所示,在平衡模式而非性能模式下运行,性能最多会受到 10% 至 15% 的影响。如果使用电池供电,性能差距会更大,这也是大多数高性能笔记本电脑的预期。
| 3DMark Performance rating - Percent | |
| HP ZBook Fury 16 G10 -2! | |
| Dell Precision 5690 -2! | |
| Dell Precision 5000 5680 -2! | |
| HP ZBook Fury 16 G11 | |
| Average NVIDIA RTX 3500 Ada Generation Laptop | |
| Lenovo ThinkPad P1 G6 21FV001KUS -2! | |
| Lenovo ThinkPad P1 G6-21FV000DGE -17! | |
| HP ZBook Fury 16 G9 -2! | |
| Lenovo ThinkPad P16 G2 21FA000FGE -17! | |
| MSI CreatorPro Z16P B12UKST -17! | |
| Asus ProArt Studiobook 16 OLED H7604 -17! | |
| Asus ExpertBook B6 Flip B6602FC2 -17! | |
| Lenovo ThinkPad P1 G4-20Y4S0KS00 -10! | |
| Lenovo ThinkPad P16v G1 AMD -17! | |
| 3DMark 11 Performance | 34779 points | |
| 3DMark Fire Strike Score | 26188 points | |
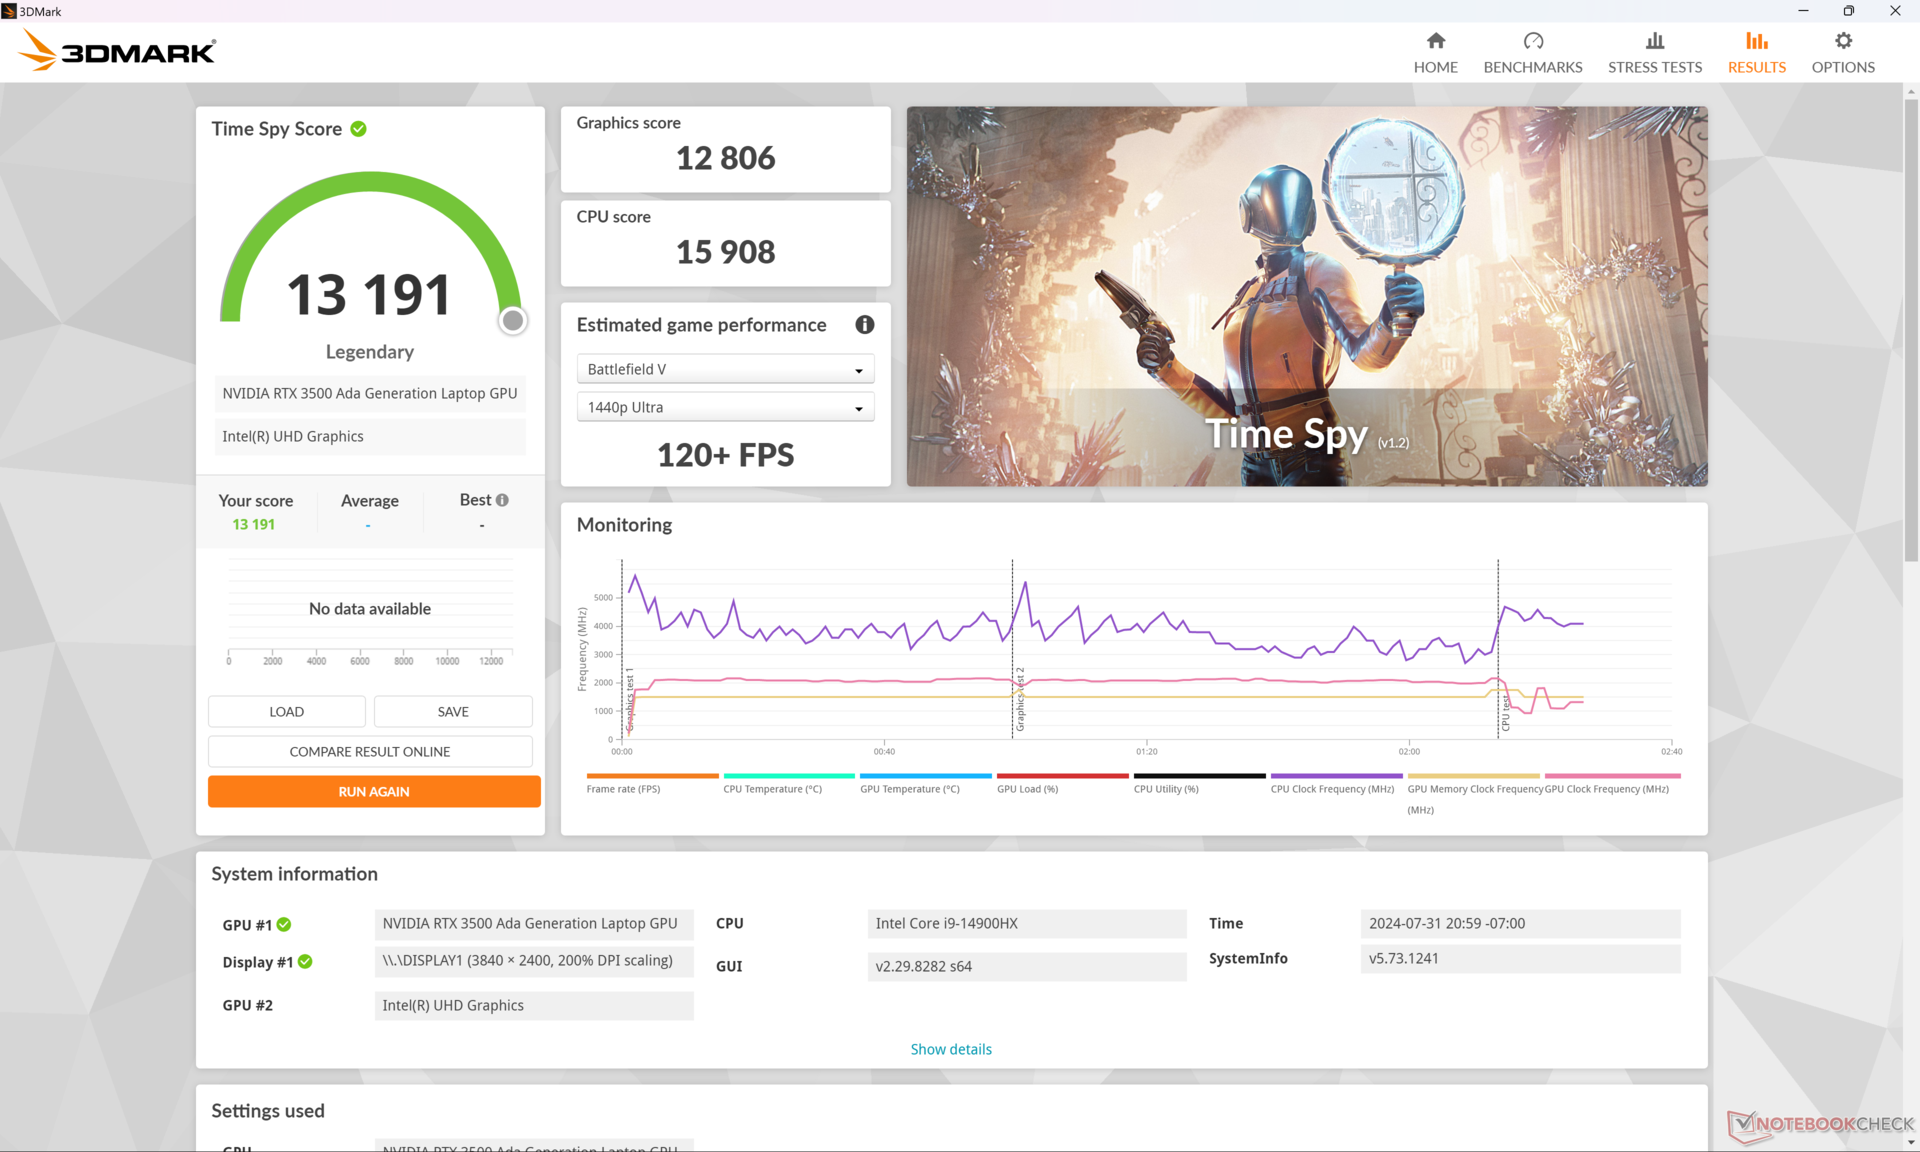
| 3DMark Time Spy Score | 13191 points | |
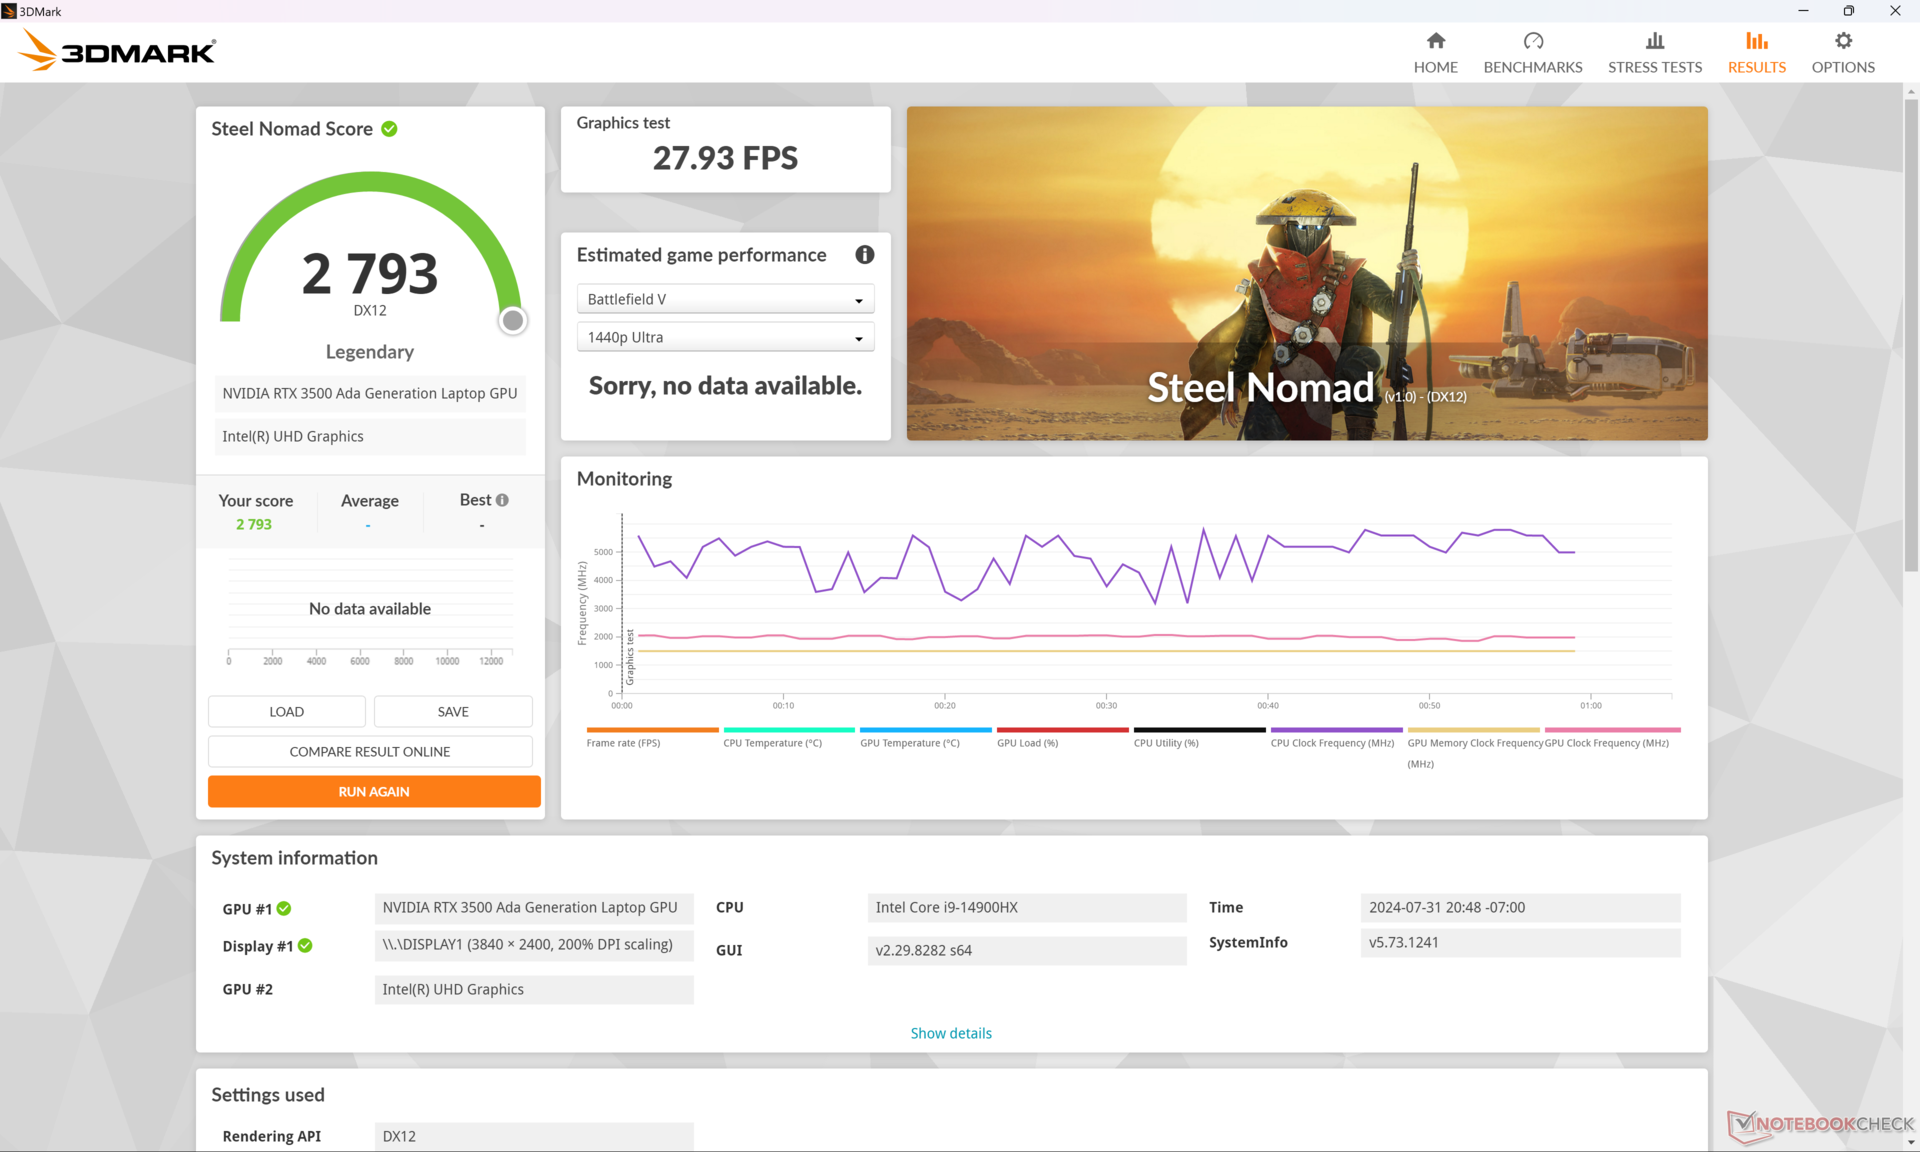
| 3DMark Steel Nomad Score | 2793 points | |
Help | ||
* ... smaller is better
游戏性能
虽然 RTX 3500 Ada 并非为游戏而设计,但其性能略高于 移动GeForce RTX 4070但低于移动 RTX 4080,尤其是在统一流水线、张量内核和内存带宽方面。不过,随着时间的推移,性能可能会逐渐减慢,因为 GPU 的提升速度并不是无限的。以《赛博朋克 2077》(Cyberpunk 2077)为例,在 1080p 超高设置下空闲运行时,性能一开始会略高于 70 FPS,然后在 30 分钟后逐渐下降到 60 FPS 左右,如下图所示。
| Performance rating - Percent | |
| HP ZBook Fury 16 G10 -2! | |
| Lenovo ThinkPad P1 G6 21FV001KUS -1! | |
| HP ZBook Fury 16 G11 | |
| Asus ProArt Studiobook 16 OLED H7604 -1! | |
| Dell Precision 5690 -1! | |
| HP ZBook Fury 16 G9 -1! | |
| Lenovo ThinkPad P16 G2 21FA000FGE -1! | |
| GTA V - 1920x1080 Highest AA:4xMSAA + FX AF:16x | |
| Asus ProArt Studiobook 16 OLED H7604 | |
| Lenovo ThinkPad P1 G6 21FV001KUS | |
| HP ZBook Fury 16 G9 | |
| HP ZBook Fury 16 G11 | |
| Lenovo ThinkPad P16 G2 21FA000FGE | |
| Final Fantasy XV Benchmark - 1920x1080 High Quality | |
| HP ZBook Fury 16 G10 | |
| Lenovo ThinkPad P1 G6 21FV001KUS | |
| Dell Precision 5690 | |
| HP ZBook Fury 16 G11 | |
| Asus ProArt Studiobook 16 OLED H7604 | |
| HP ZBook Fury 16 G9 | |
| Lenovo ThinkPad P16 G2 21FA000FGE | |
| Strange Brigade - 1920x1080 ultra AA:ultra AF:16 | |
| HP ZBook Fury 16 G10 | |
| Dell Precision 5690 | |
| HP ZBook Fury 16 G11 | |
| HP ZBook Fury 16 G9 | |
| Lenovo ThinkPad P16 G2 21FA000FGE | |
| Asus ProArt Studiobook 16 OLED H7604 | |
| Dota 2 Reborn - 1920x1080 ultra (3/3) best looking | |
| Asus ProArt Studiobook 16 OLED H7604 | |
| HP ZBook Fury 16 G10 | |
| HP ZBook Fury 16 G11 | |
| HP ZBook Fury 16 G9 | |
| Lenovo ThinkPad P16 G2 21FA000FGE | |
| Lenovo ThinkPad P1 G6 21FV001KUS | |
| Dell Precision 5690 | |
| Cyberpunk 2077 - 1920x1080 Ultra Preset (FSR off) | |
| Dell Precision 5690 | |
| Lenovo ThinkPad P1 G6 21FV001KUS | |
| HP ZBook Fury 16 G11 | |
| Baldur's Gate 3 | |
| 1920x1080 Ultra Preset AA:T | |
| Dell Precision 5690 | |
| Lenovo ThinkPad P1 G6 21FV001KUS | |
| HP ZBook Fury 16 G11 | |
| Average NVIDIA RTX 3500 Ada Generation Laptop (n=1) | |
| 2560x1440 Ultra Preset AA:T | |
| Dell Precision 5690 | |
| Lenovo ThinkPad P1 G6 21FV001KUS | |
| HP ZBook Fury 16 G11 | |
| Average NVIDIA RTX 3500 Ada Generation Laptop (n=1) | |
| 3840x2160 Ultra Preset AA:T | |
| Dell Precision 5690 | |
| Lenovo ThinkPad P1 G6 21FV001KUS | |
| HP ZBook Fury 16 G11 | |
| Average NVIDIA RTX 3500 Ada Generation Laptop (n=1) | |
Cyberpunk 2077 ultra FPS Chart
| low | med. | high | ultra | QHD | 4K | |
|---|---|---|---|---|---|---|
| GTA V (2015) | 184.3 | 181 | 170.1 | 115.5 | 97.5 | 59.6 |
| Dota 2 Reborn (2015) | 201 | 177.7 | 162.1 | 153.9 | 134.4 | |
| Final Fantasy XV Benchmark (2018) | 200 | 167.6 | 128.9 | 97.5 | 54.2 | |
| X-Plane 11.11 (2018) | 144.6 | 137.8 | 110.9 | 92.7 | ||
| Far Cry 5 (2018) | 133 | 135 | 127 | 109 | 62 | |
| Strange Brigade (2018) | 411 | 296 | 235 | 223 | 159.2 | 78.6 |
| Tiny Tina's Wonderlands (2022) | 232.5 | 195.4 | 137.9 | 109.3 | 74.4 | 41.6 |
| F1 22 (2022) | 228 | 223 | 182.8 | 72.9 | 48.3 | 24 |
| Baldur's Gate 3 (2023) | 164.8 | 136.2 | 118.6 | 117.3 | 80.2 | 41.2 |
| Cyberpunk 2077 (2023) | 121.2 | 113.1 | 101.8 | 90.3 | 60.2 | 21.3 |
排放量
系统噪音
风扇的噪音和表现与我们在去年的机型上记录到的情况基本相同,只是在运行较高负载时噪音稍大一些。在桌面上空转时,即使设置为平衡模式且没有运行应用程序,风扇偶尔也会出现脉冲。更糟糕的是,我们的特定设备在整个测试期间都存在明显的线圈啸叫。
Noise level
| Idle |
| 23.2 / 23.2 / 29.5 dB(A) |
| Load |
| 43 / 48.2 dB(A) |
 | ||
30 dB silent 40 dB(A) audible 50 dB(A) loud |
||
min: | ||
| HP ZBook Fury 16 G11 RTX 3500 Ada Generation Laptop, i9-14900HX, SK hynix PC801 HFS001TEJ9X101N | HP ZBook Fury 16 G10 RTX 5000 Ada Generation Laptop, i9-13950HX, SK hynix PC801 HFS001TEJ9X101N | HP ZBook Fury 16 G9 RTX A5500 Laptop GPU, i9-12950HX, Micron 3400 1TB MTFDKBA1T0TFH | Dell Precision 5690 RTX 5000 Ada Generation Laptop, Ultra 9 185H, 2x Samsung PM9A1 1TB (RAID 0) | Lenovo ThinkPad P16 G2 21FA000FGE RTX 2000 Ada Generation Laptop, i7-13700HX, SK hynix PC801 HFS001TEJ9X162N | Lenovo ThinkPad P1 G6 21FV001KUS GeForce RTX 4080 Laptop GPU, i7-13800H, Kioxia XG8 KXG8AZNV1T02 | Asus ProArt Studiobook 16 OLED H7604 GeForce RTX 4070 Laptop GPU, i9-13980HX, Phison EM2804TBMTCB47 | |
|---|---|---|---|---|---|---|---|
| Noise | 3% | 4% | -3% | -4% | 9% | -5% | |
| off / environment * (dB) | 23.2 | 22.9 1% | 22.6 3% | 23.4 -1% | 23.5 -1% | 22.5 3% | 24.5 -6% |
| Idle Minimum * (dB) | 23.2 | 22.9 1% | 22.7 2% | 23.6 -2% | 23.5 -1% | 22.5 3% | 24.5 -6% |
| Idle Average * (dB) | 23.2 | 22.9 1% | 22.7 2% | 24.9 -7% | 29.2 -26% | 22.5 3% | 24.5 -6% |
| Idle Maximum * (dB) | 29.5 | 28.5 3% | 28.8 2% | 30.9 -5% | 29.5 -0% | 22.5 24% | 24.5 17% |
| Load Average * (dB) | 43 | 40.6 6% | 36.2 16% | 40.4 6% | 32.7 24% | 28.7 33% | 47.6 -11% |
| Cyberpunk 2077 ultra * (dB) | 48.2 | ||||||
| Load Maximum * (dB) | 48.2 | 45.8 5% | 49.3 -2% | 51.9 -8% | 56.6 -17% | 54.4 -13% | 56.7 -18% |
| Witcher 3 ultra * (dB) | 44.1 | 49.5 | 48.3 | 50.6 | 47.5 | 55.9 |
* ... smaller is better
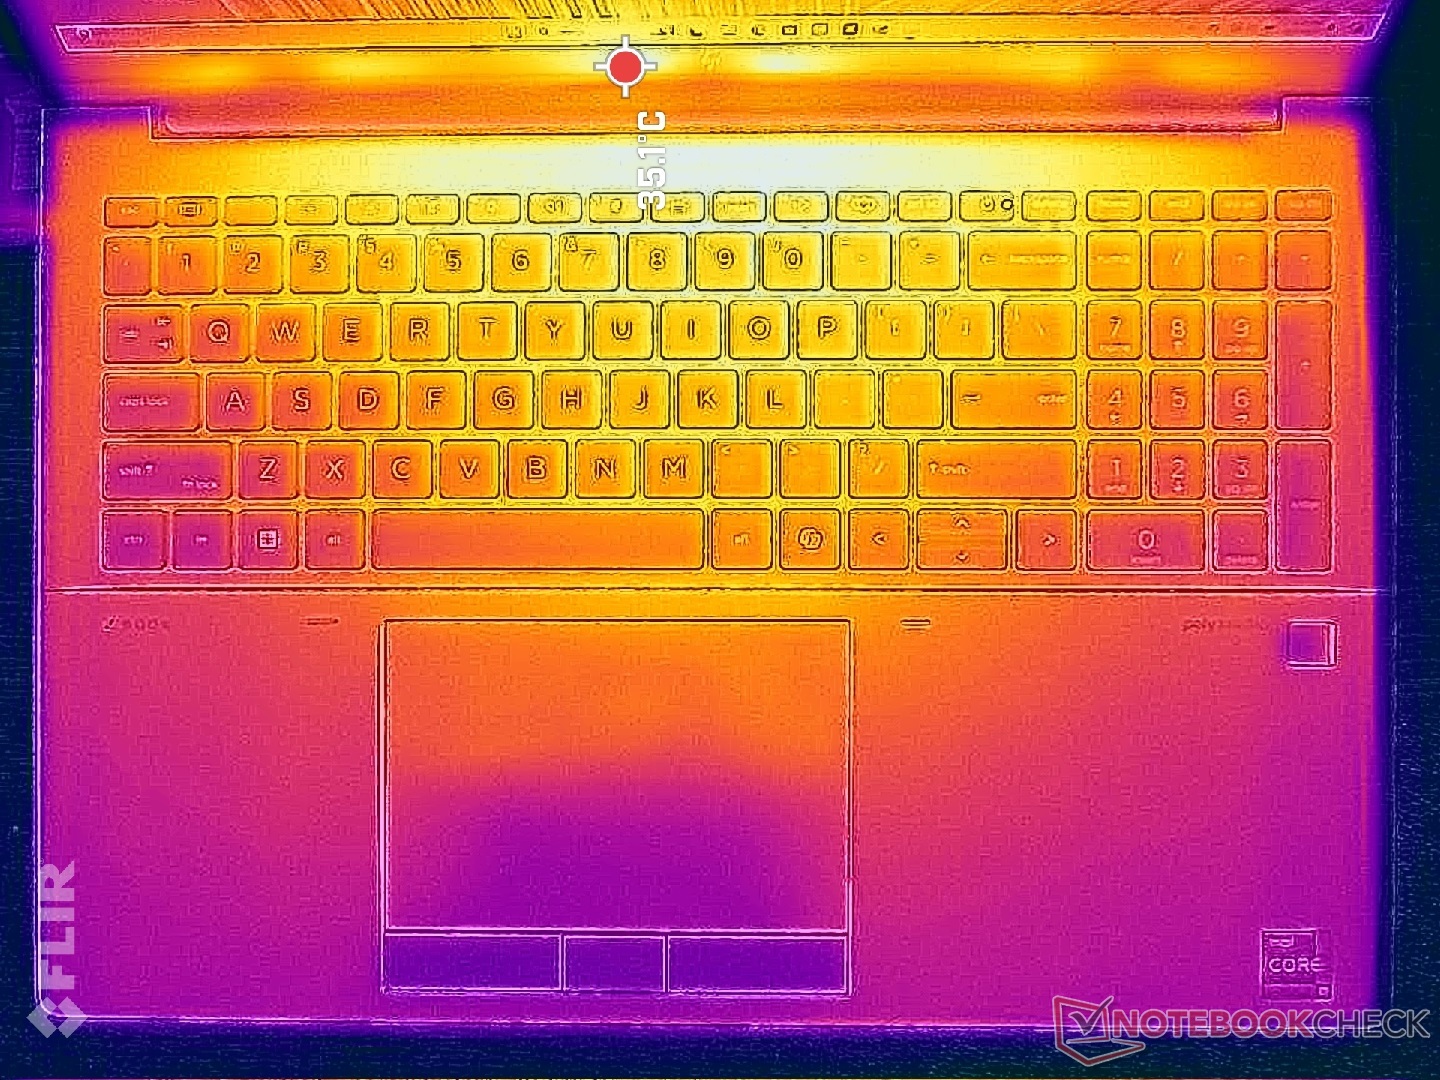
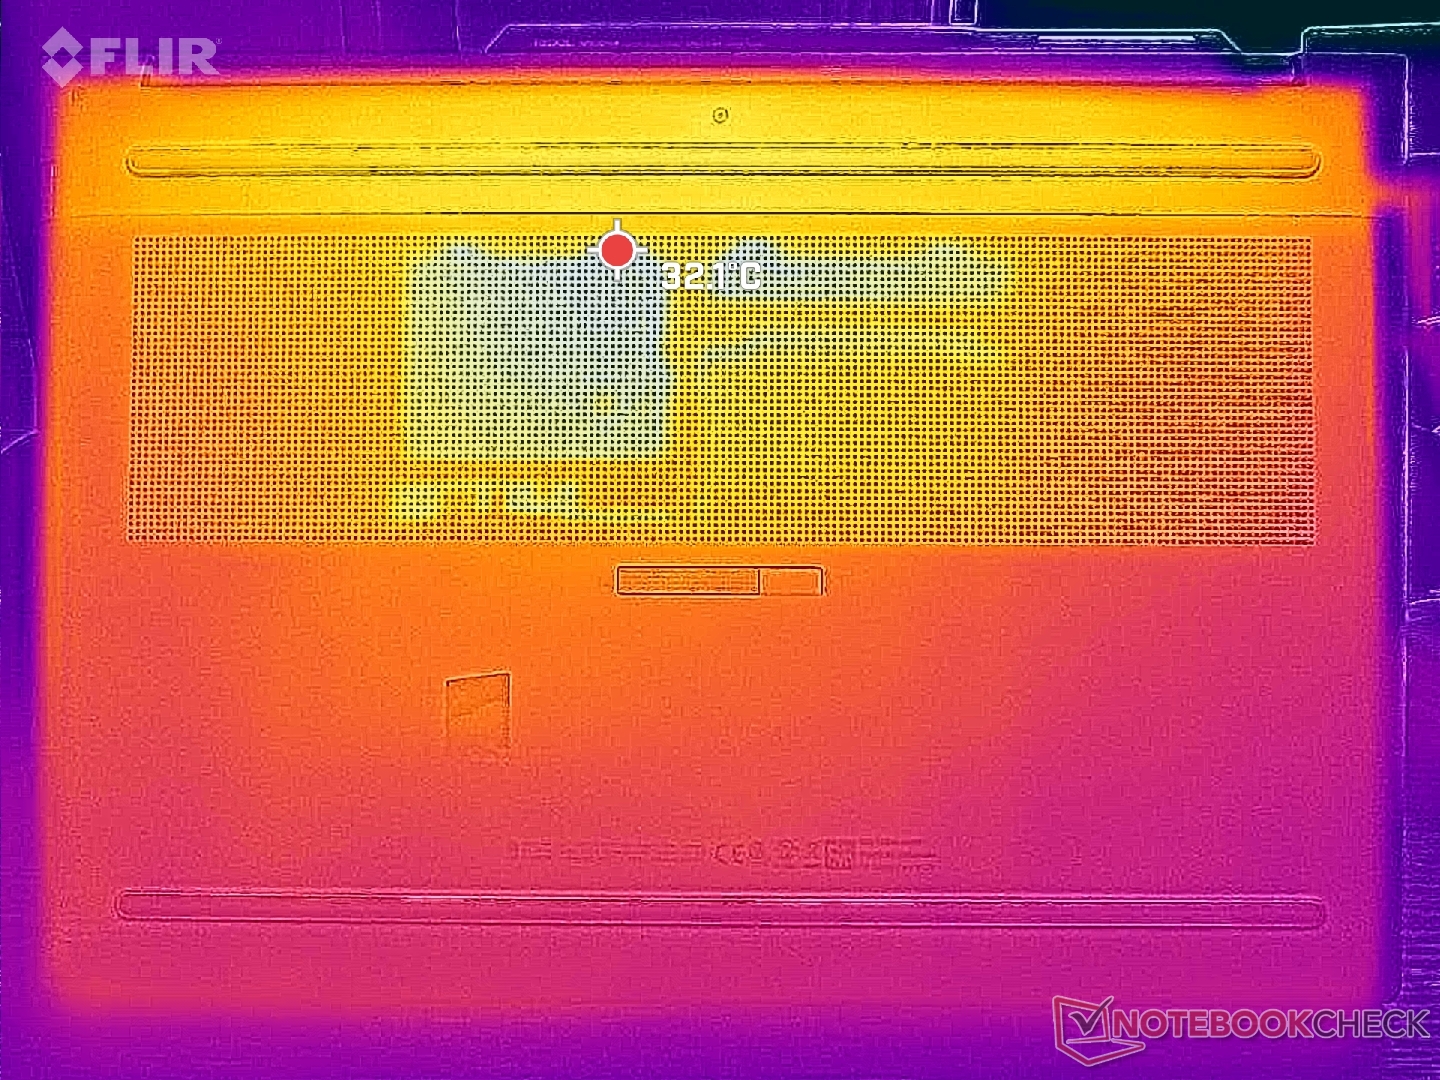
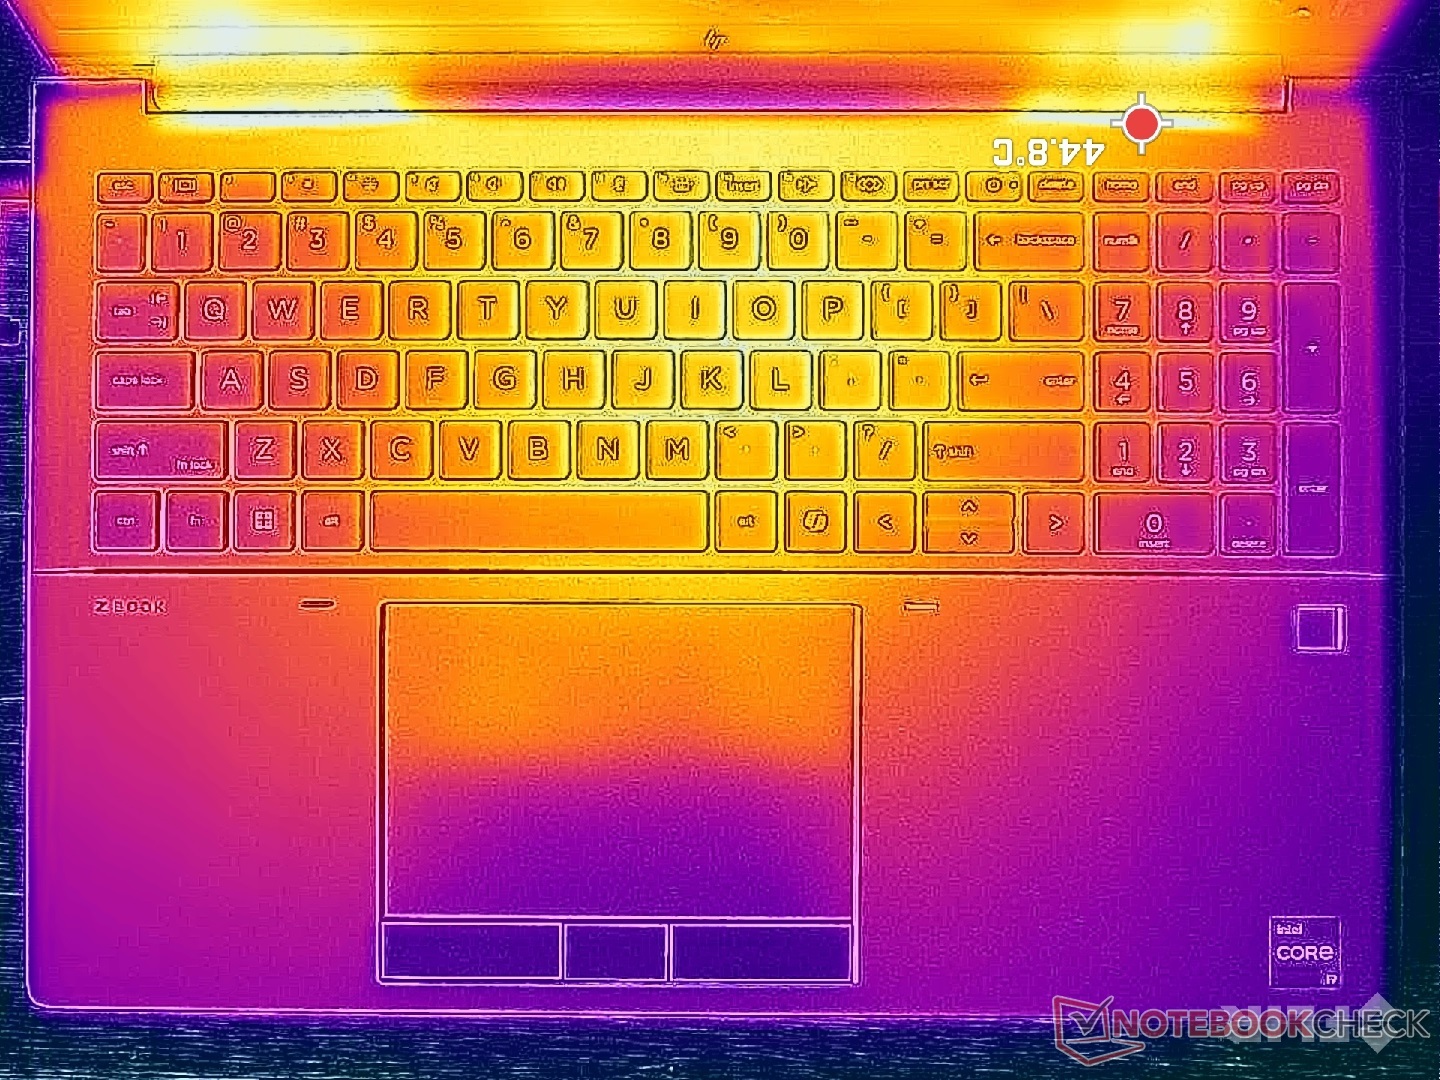
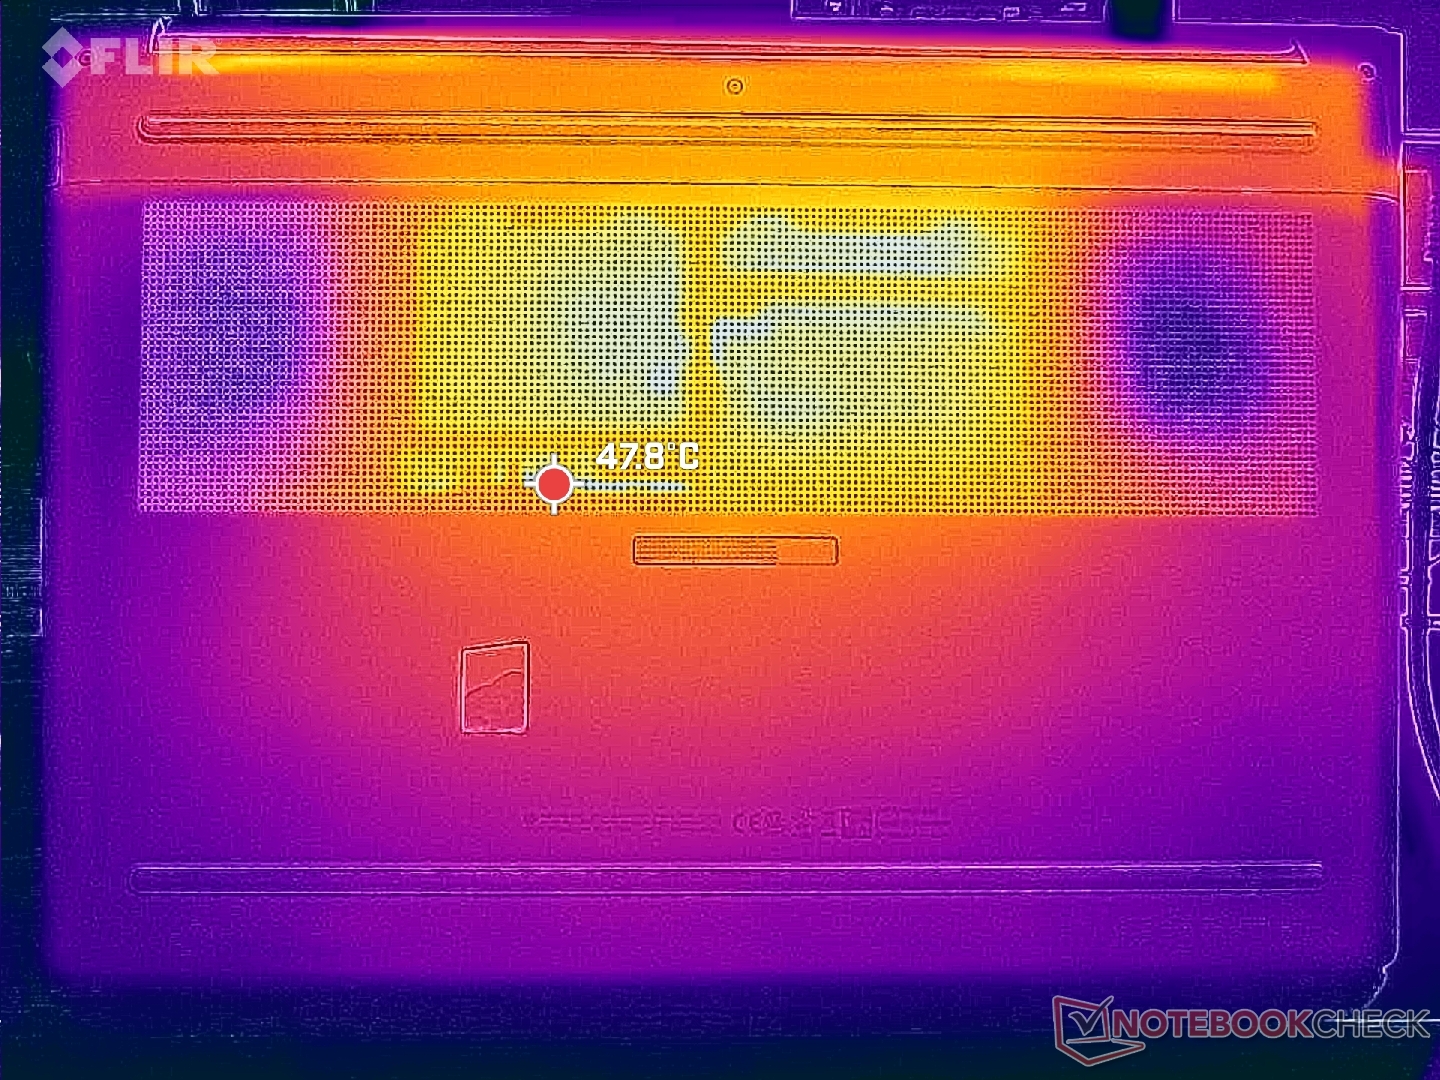
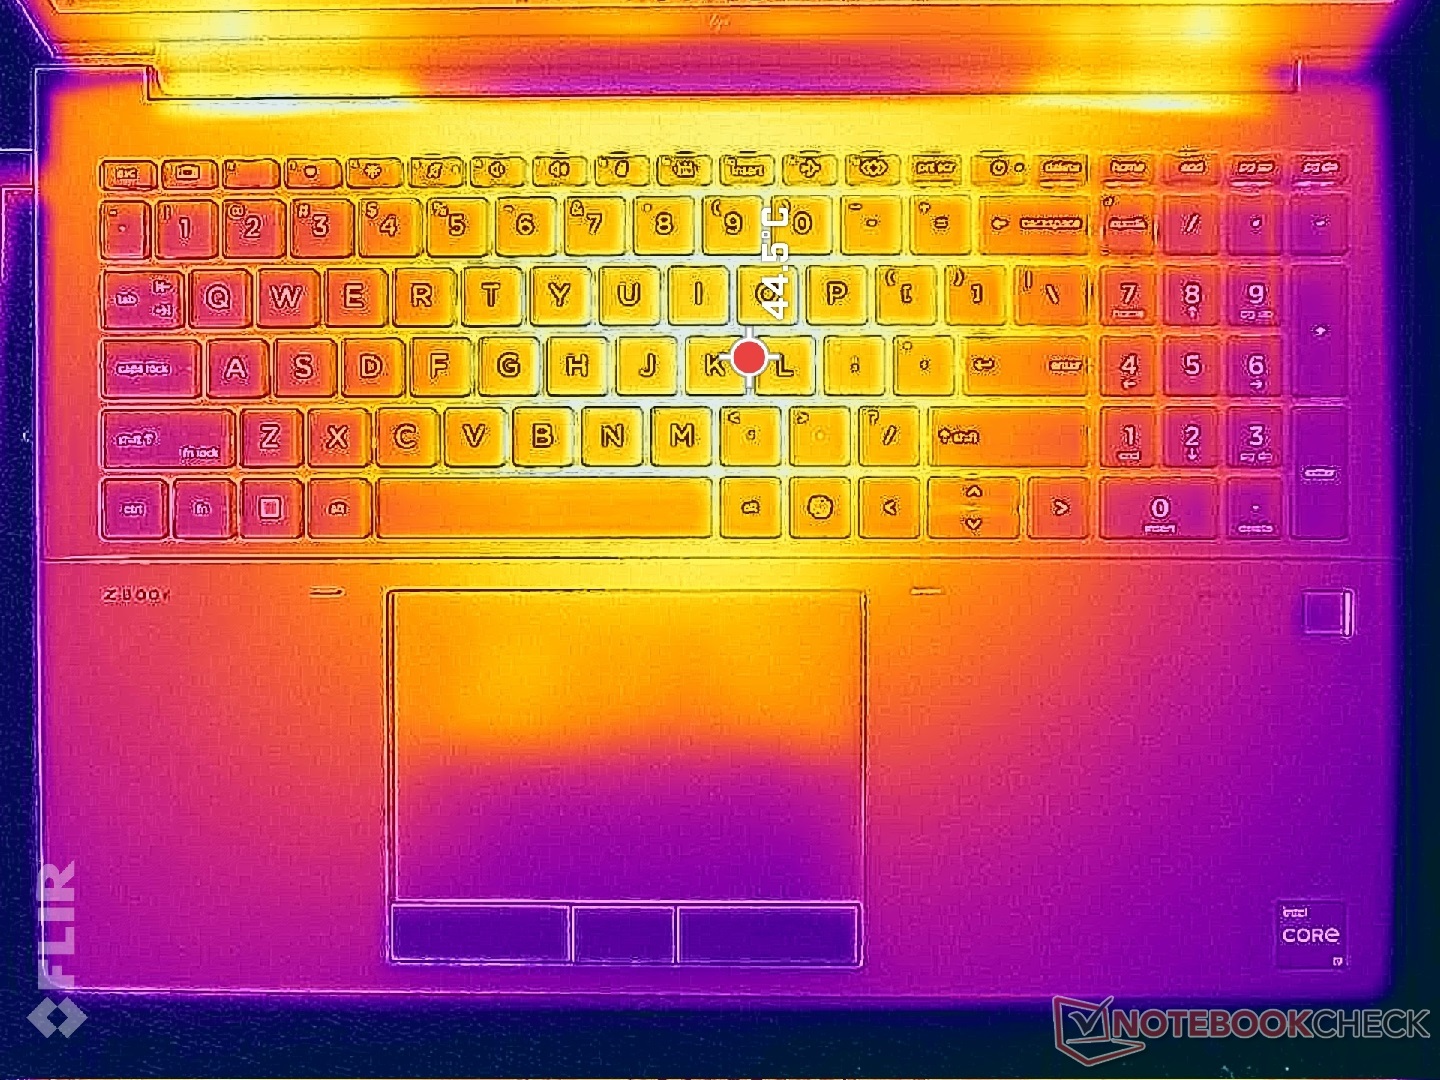
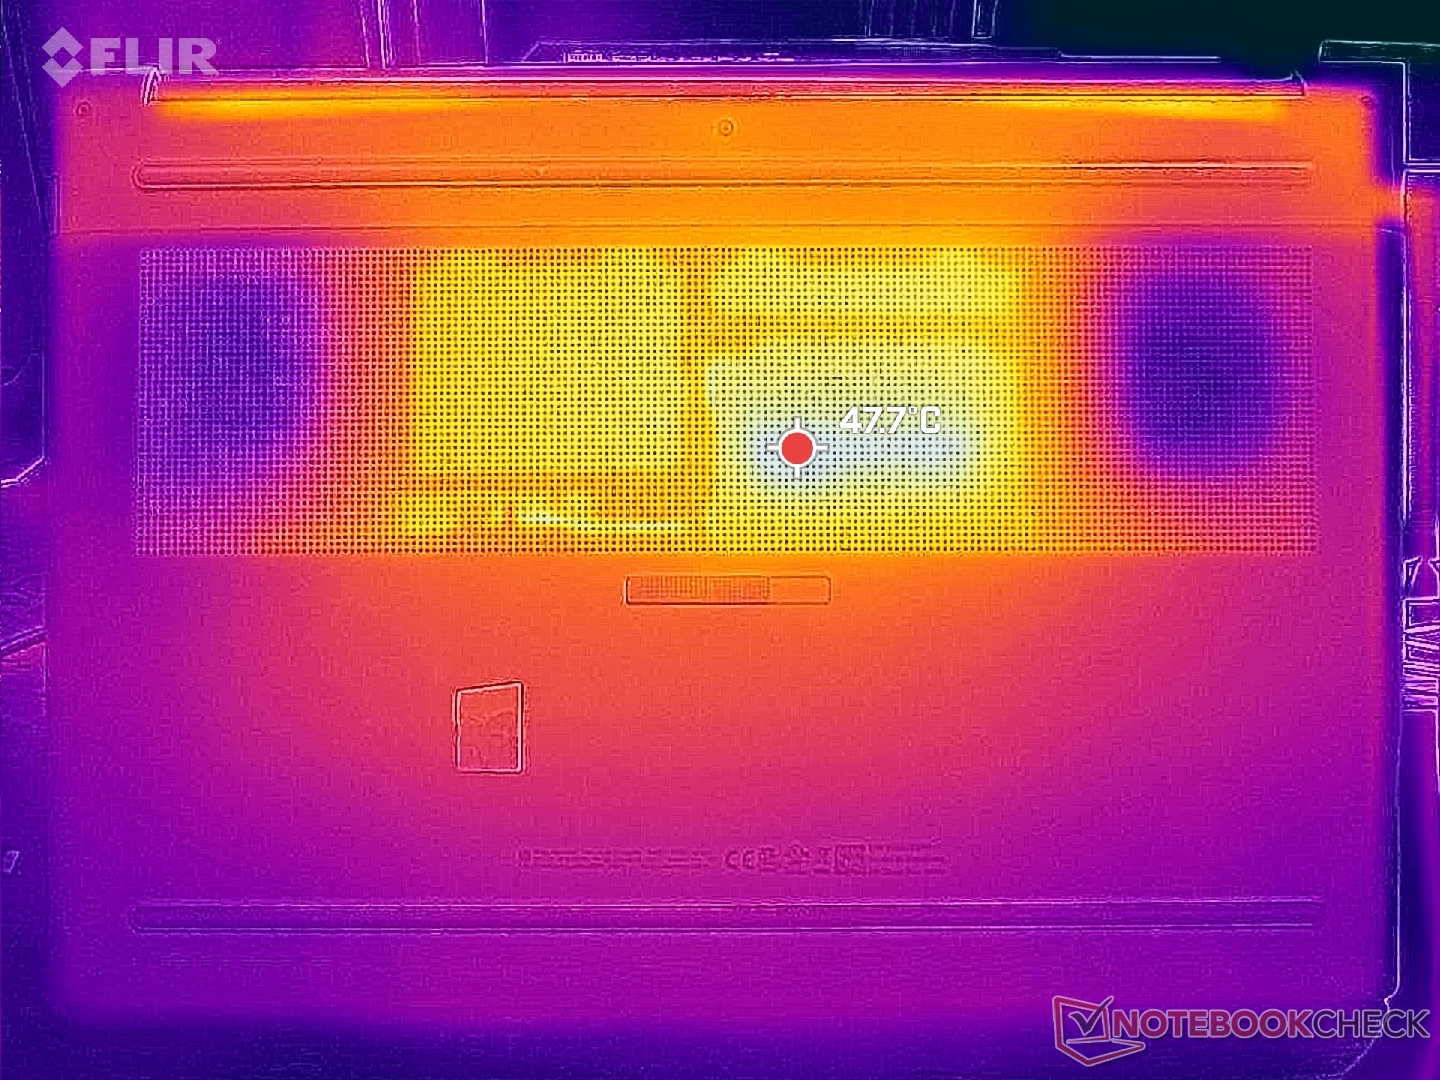
温度
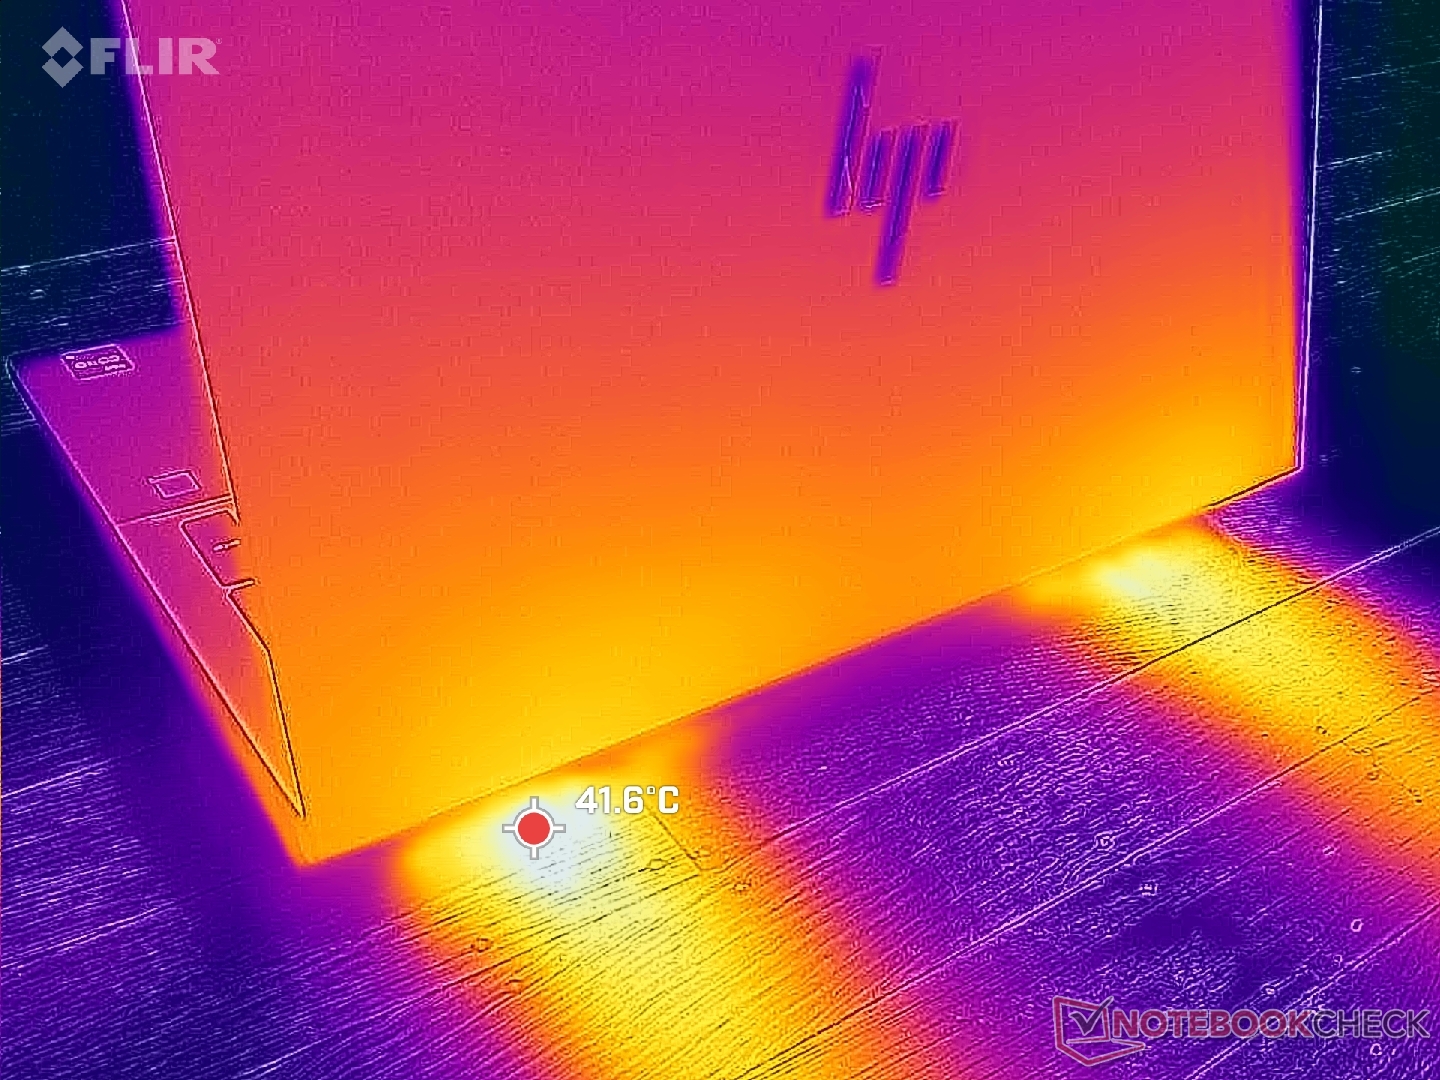
(±) The maximum temperature on the upper side is 42.2 °C / 108 F, compared to the average of 38.2 °C / 101 F, ranging from 22.2 to 69.8 °C for the class Workstation.
(-) The bottom heats up to a maximum of 48 °C / 118 F, compared to the average of 41.1 °C / 106 F
(±) In idle usage, the average temperature for the upper side is 33.8 °C / 93 F, compared to the device average of 32 °C / 90 F.
(-) 3: The average temperature for the upper side is 38.5 °C / 101 F, compared to the average of 32 °C / 90 F for the class Workstation.
(±) The palmrests and touchpad can get very hot to the touch with a maximum of 37.6 °C / 99.7 F.
(-) The average temperature of the palmrest area of similar devices was 27.8 °C / 82 F (-9.8 °C / -17.7 F).
| HP ZBook Fury 16 G11 Intel Core i9-14900HX, NVIDIA RTX 3500 Ada Generation Laptop | HP ZBook Fury 16 G10 Intel Core i9-13950HX, NVIDIA RTX 5000 Ada Generation Laptop | HP ZBook Fury 16 G9 Intel Core i9-12950HX, NVIDIA RTX A5500 Laptop GPU | Dell Precision 5690 Intel Core Ultra 9 185H, NVIDIA RTX 5000 Ada Generation Laptop | Lenovo ThinkPad P16 G2 21FA000FGE Intel Core i7-13700HX, NVIDIA RTX 2000 Ada Generation Laptop | Lenovo ThinkPad P1 G6 21FV001KUS Intel Core i7-13800H, NVIDIA GeForce RTX 4080 Laptop GPU | Asus ProArt Studiobook 16 OLED H7604 Intel Core i9-13980HX, NVIDIA GeForce RTX 4070 Laptop GPU | |
|---|---|---|---|---|---|---|---|
| Heat | 3% | 10% | 13% | 15% | 4% | 3% | |
| Maximum Upper Side * (°C) | 42.2 | 44.8 -6% | 43.2 -2% | 46.6 -10% | 47.2 -12% | 42 -0% | 44.1 -5% |
| Maximum Bottom * (°C) | 48 | 50 -4% | 50.4 -5% | 33 31% | 39.5 18% | 45.2 6% | 48 -0% |
| Idle Upper Side * (°C) | 37 | 34.4 7% | 28.6 23% | 32.4 12% | 28.1 24% | 33 11% | 32.7 12% |
| Idle Bottom * (°C) | 36.8 | 31.8 14% | 28.2 23% | 29.4 20% | 25.3 31% | 37 -1% | 34.9 5% |
* ... smaller is better
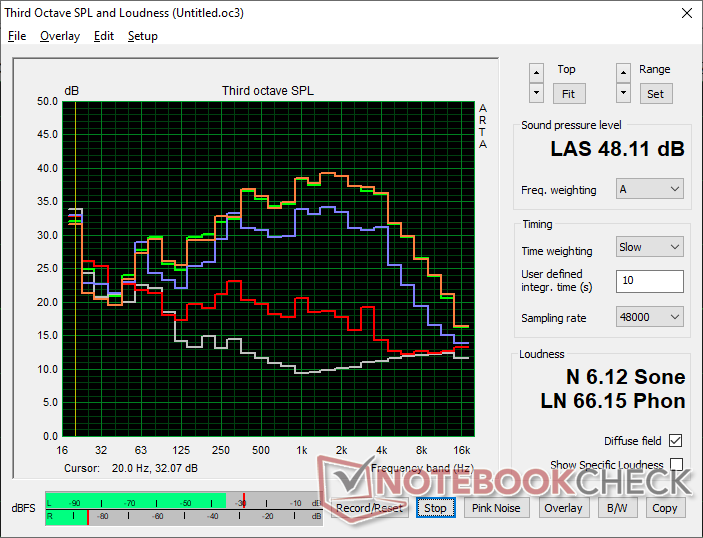
发言人
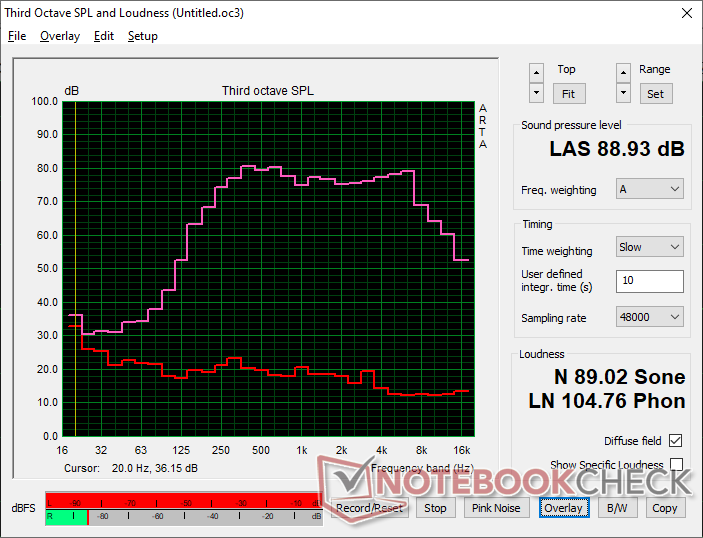
HP ZBook Fury 16 G11 audio analysis
(+) | speakers can play relatively loud (88.9 dB)
Bass 100 - 315 Hz
(±) | reduced bass - on average 13.3% lower than median
(±) | linearity of bass is average (11.2% delta to prev. frequency)
Mids 400 - 2000 Hz
(+) | balanced mids - only 2.2% away from median
(+) | mids are linear (3.2% delta to prev. frequency)
Highs 2 - 16 kHz
(+) | balanced highs - only 3.7% away from median
(+) | highs are linear (4.6% delta to prev. frequency)
Overall 100 - 16.000 Hz
(+) | overall sound is linear (12.9% difference to median)
Compared to same class
» 21% of all tested devices in this class were better, 6% similar, 72% worse
» The best had a delta of 7%, average was 17%, worst was 35%
Compared to all devices tested
» 12% of all tested devices were better, 3% similar, 85% worse
» The best had a delta of 4%, average was 24%, worst was 134%
Apple MacBook Pro 16 2021 M1 Pro audio analysis
(+) | speakers can play relatively loud (84.7 dB)
Bass 100 - 315 Hz
(+) | good bass - only 3.8% away from median
(+) | bass is linear (5.2% delta to prev. frequency)
Mids 400 - 2000 Hz
(+) | balanced mids - only 1.3% away from median
(+) | mids are linear (2.1% delta to prev. frequency)
Highs 2 - 16 kHz
(+) | balanced highs - only 1.9% away from median
(+) | highs are linear (2.7% delta to prev. frequency)
Overall 100 - 16.000 Hz
(+) | overall sound is linear (4.6% difference to median)
Compared to same class
» 0% of all tested devices in this class were better, 0% similar, 100% worse
» The best had a delta of 5%, average was 17%, worst was 45%
Compared to all devices tested
» 0% of all tested devices were better, 0% similar, 100% worse
» The best had a delta of 4%, average was 24%, worst was 134%
能源管理
耗电量
系统在台式机上空转时的效率比我们的 ZBook Fury 16 G10配置的效率更高。否则,在运行要求更高的负载(如游戏)时,即使我们两个例子中配置的 GPU 不同,消耗也几乎相同。因此,与我们的中端 RTX 3500 Ada 相比,选择更高端的 GPU 配置时,每瓦性能会更高。
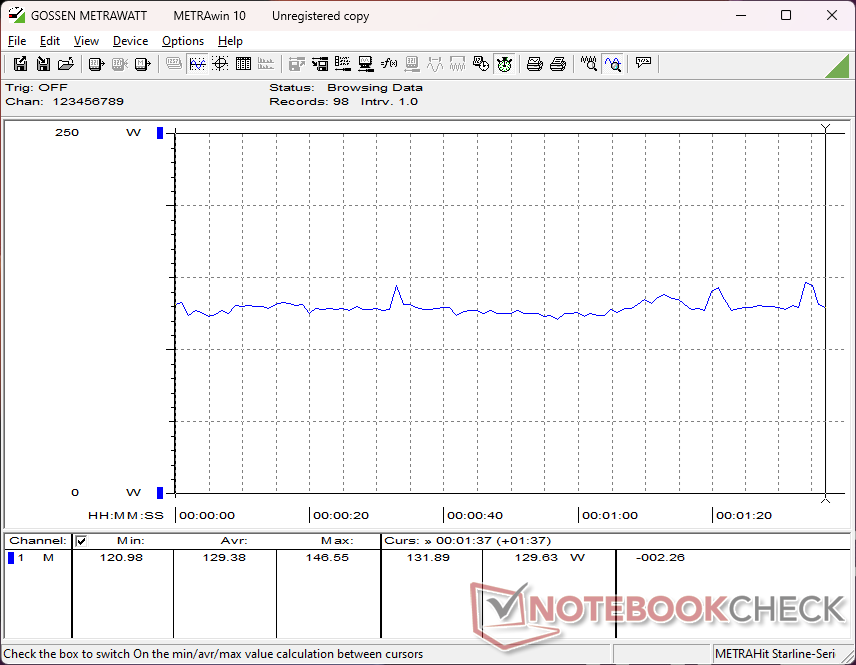
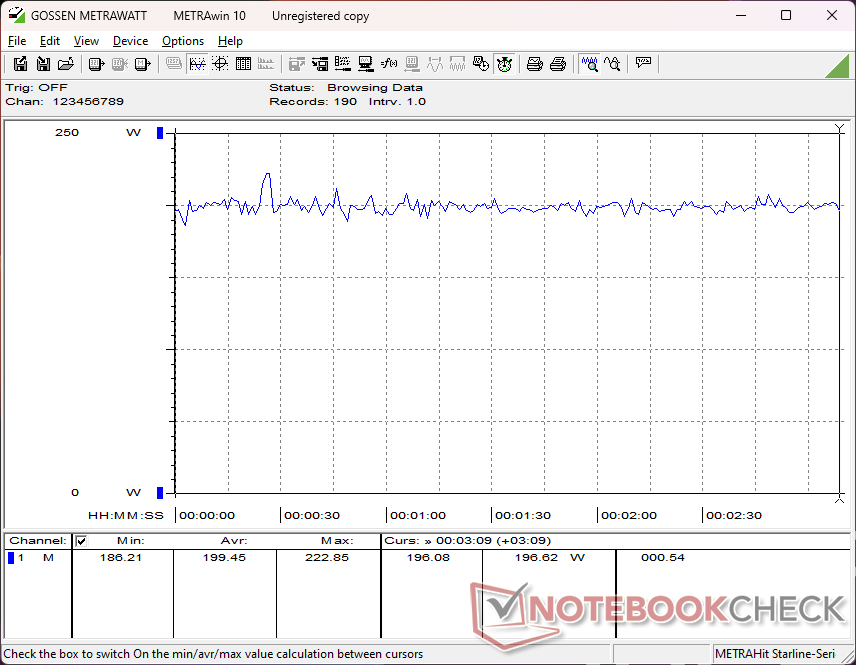
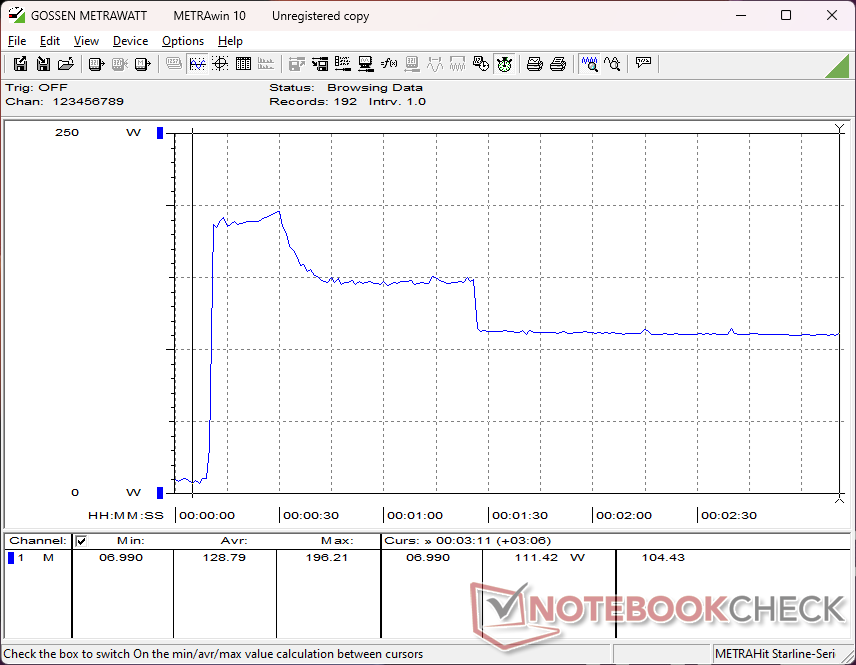
运行 Prime95 或 CineBench R15 xT 时,由于酷睿 i9-14900HX 处理器具有更高的 Turbo Boost 潜能,我们的设备与去年的型号相比,功耗明显更高。不过,一分钟左右后,耗电量就会下降,几乎与我们在去年机型上测得的耗电量一致,如下图所示,这与上文的 CineBench R15 xT 循环观察结果一致。因此,较高的初始 Turbo Boost 潜力是较新的 酷睿 i9-14900HX与老款酷睿 i9-13950HX 之间的关键优势。
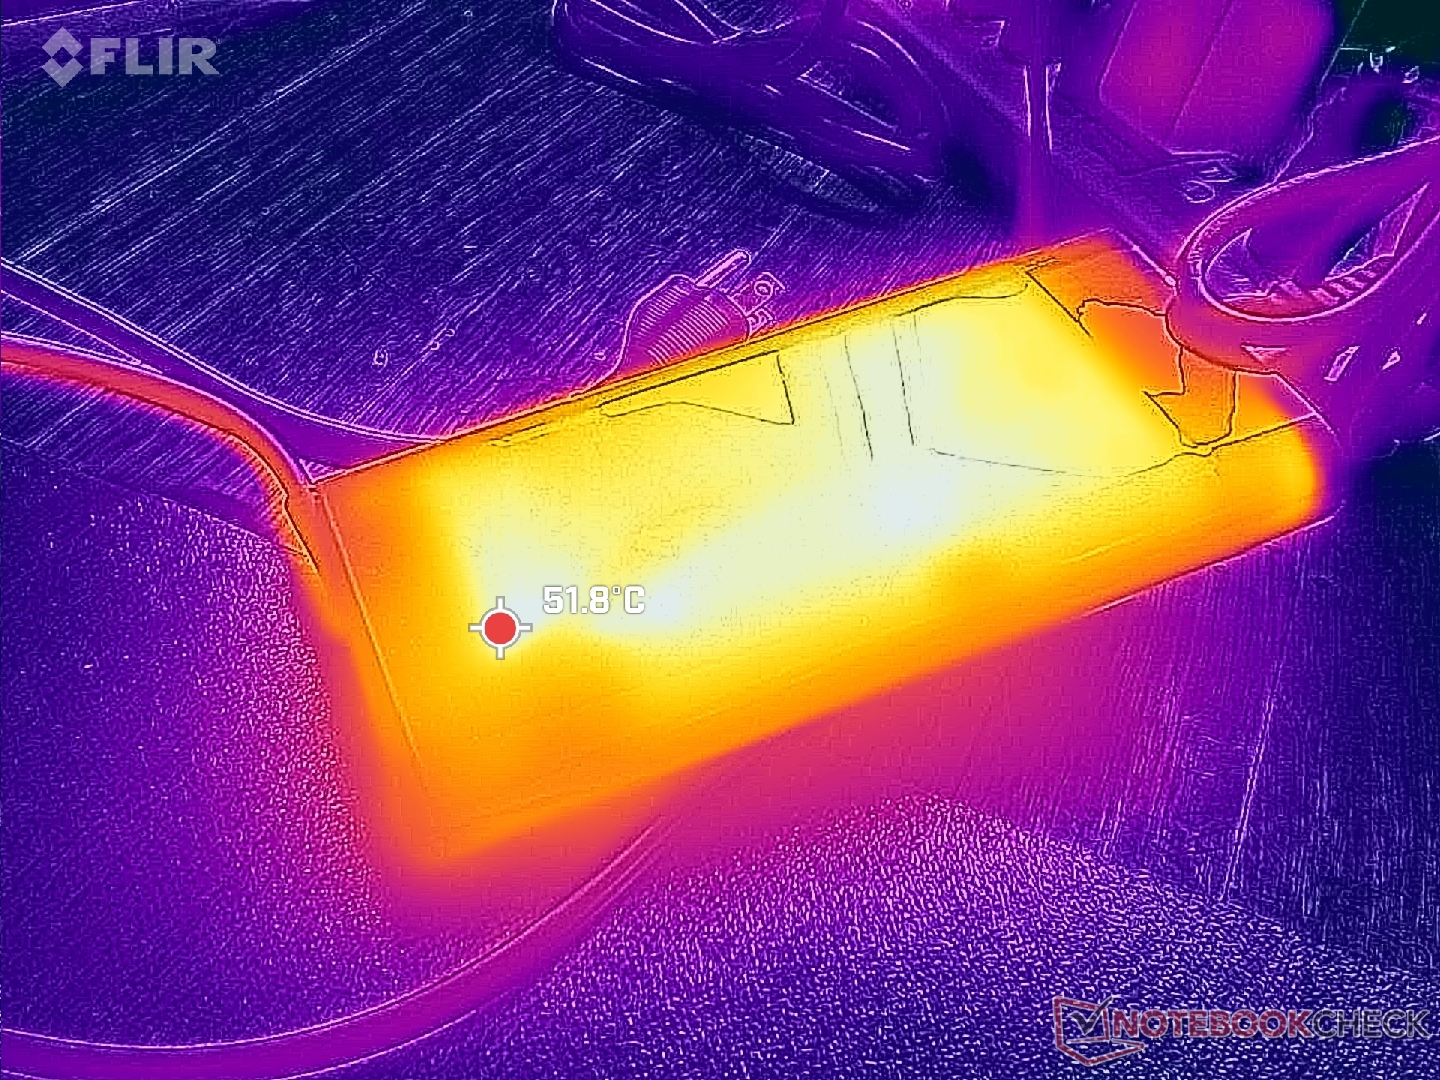
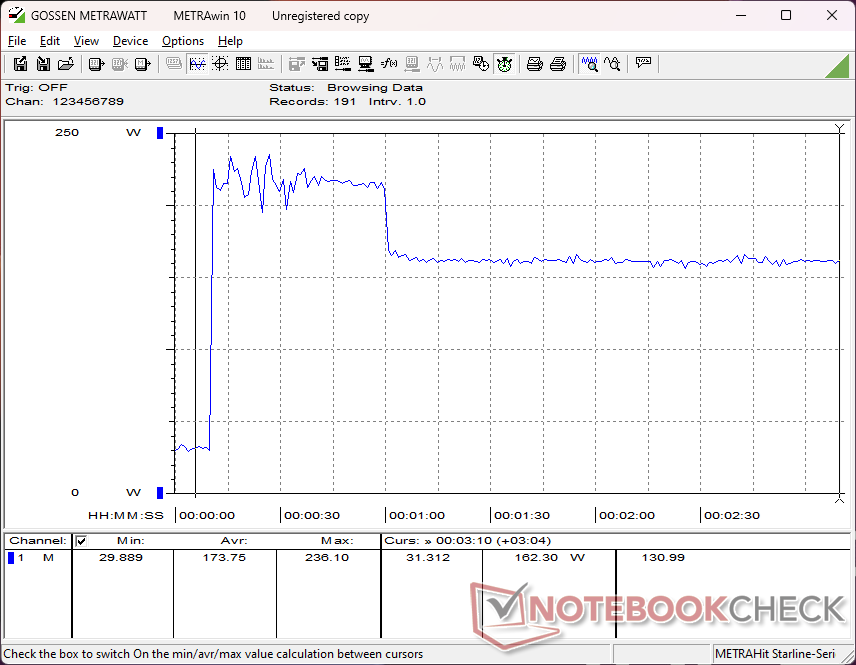
当 CPU 和 GPU 的使用率均为 100% 时,我们可以记录到 230 W AC 适配器(约 18 x 8.8 x 2.5 厘米)的最大消耗功率为 236 W。
| Off / Standby | |
| Idle | |
| Load |
|
Key:
min: | |
| HP ZBook Fury 16 G11 i9-14900HX, RTX 3500 Ada Generation Laptop, SK hynix PC801 HFS001TEJ9X101N, IPS, 3840x2400, 16" | HP ZBook Fury 16 G10 i9-13950HX, RTX 5000 Ada Generation Laptop, SK hynix PC801 HFS001TEJ9X101N, IPS, 3840x2400, 16" | HP ZBook Fury 16 G9 i9-12950HX, RTX A5500 Laptop GPU, Micron 3400 1TB MTFDKBA1T0TFH, IPS, 3840x2400, 16" | Dell Precision 5690 Ultra 9 185H, RTX 5000 Ada Generation Laptop, 2x Samsung PM9A1 1TB (RAID 0), OLED, 3840x2400, 16" | Lenovo ThinkPad P16 G2 21FA000FGE i7-13700HX, RTX 2000 Ada Generation Laptop, SK hynix PC801 HFS001TEJ9X162N, IPS LED, 2560x1600, 16" | Lenovo ThinkPad P1 G6 21FV001KUS i7-13800H, GeForce RTX 4080 Laptop GPU, Kioxia XG8 KXG8AZNV1T02, OLED, 3480x2400, 16" | Asus ProArt Studiobook 16 OLED H7604 i9-13980HX, GeForce RTX 4070 Laptop GPU, Phison EM2804TBMTCB47, OLED, 3200x2000, 16" | |
|---|---|---|---|---|---|---|---|
| Power Consumption | -34% | -77% | -1% | 4% | 7% | -24% | |
| Idle Minimum * (Watt) | 8.6 | 15.3 -78% | 19.5 -127% | 7.9 8% | 9.3 -8% | 8 7% | 12.8 -49% |
| Idle Average * (Watt) | 14.8 | 18.2 -23% | 29 -96% | 12 19% | 14.1 5% | 9.5 36% | 19.9 -34% |
| Idle Maximum * (Watt) | 15.7 | 28 -78% | 40.7 -159% | 28.6 -82% | 15.5 1% | 23.7 -51% | 20.3 -29% |
| Load Average * (Watt) | 129.4 | 137.9 -7% | 142.1 -10% | 98.8 24% | 133.6 -3% | 97.2 25% | 131.4 -2% |
| Cyberpunk 2077 ultra external monitor * (Watt) | 192.6 | ||||||
| Cyberpunk 2077 ultra * (Watt) | 199.4 | ||||||
| Load Maximum * (Watt) | 236.1 | 202 14% | 224.4 5% | 174.8 26% | 179.6 24% | 197.2 16% | 246.8 -5% |
| Witcher 3 ultra * (Watt) | 189.4 | 188.6 | 144.5 | 144.9 | 144 | 196.5 |
* ... smaller is better
Power Consumption Cyberpunk / Stress Test
Power Consumption external Monitor
电池寿命
由于 Raptor Lake-HX Refresh CPU 的 Turbo Boost 上限较高,运行时间与去年的 ZBook Fury 16 G11 非常相似,甚至略有缩短。Precision 5690 或 ThinkPad P16 G2 等竞争机型的续航时间相比之下至少要长一个小时左右。
使用附带的桶装交流适配器从空闲状态充电到满电状态的时间相对较短,仅为 60 多分钟。
| HP ZBook Fury 16 G11 i9-14900HX, RTX 3500 Ada Generation Laptop, 95 Wh | HP ZBook Fury 16 G10 i9-13950HX, RTX 5000 Ada Generation Laptop, 95 Wh | HP ZBook Fury 16 G9 i9-12950HX, RTX A5500 Laptop GPU, 95 Wh | Dell Precision 5690 Ultra 9 185H, RTX 5000 Ada Generation Laptop, 98 Wh | Lenovo ThinkPad P16 G2 21FA000FGE i7-13700HX, RTX 2000 Ada Generation Laptop, 94 Wh | Lenovo ThinkPad P1 G6 21FV001KUS i7-13800H, GeForce RTX 4080 Laptop GPU, 90 Wh | Asus ProArt Studiobook 16 OLED H7604 i9-13980HX, GeForce RTX 4070 Laptop GPU, 90 Wh | |
|---|---|---|---|---|---|---|---|
| Battery runtime | 9% | -10% | 37% | 28% | -37% | -16% | |
| WiFi v1.3 (h) | 6.7 | 7.3 9% | 6 -10% | 9.2 37% | 8.6 28% | 4.2 -37% | 5.6 -16% |
| Reader / Idle (h) | 5.3 | ||||||
| Load (h) | 1.2 | 1.1 | |||||
| H.264 (h) | 6 |
Pros
Cons
评语 - 强劲的设计被有限的涡轮增压所拖累
我们喜欢 ZBook Fury 16 G11 的设计。虽然它与 Fury 16 G9 保持一致,但其易于维护、广泛的可配置选项、支持 ECC 内存以及舒适的键盘和触摸板都符合工作站用户的要求。
相反,ZBook Fury 16 G11 的主要问题在于其性能。当其他笔记本电脑如 联想Legion 9 16IRX9一样的酷睿 i9-14900HX 处理器比我们的 ZBook 快 20%,那么惠普的散热解决方案肯定需要升级,以便在更长时间内支持更高的 Turbo Boost 速度。同样,M.2 固态硬盘也可以从散热器中受益,因为它们在受压时也会出现节流。这些限制因素削弱了酷睿 i9 CPU 和 PCIe4 固态硬盘的优势,因为它们有可能在戴尔或联想的竞争机型上发挥更快的性能。
与去年的 ZBook Fury G10 相比,ZBook Fury 16 G11 只是一个小更新。虽然它的外观和手感依然出色,但在使用较多的情况下,性能往往会有所下降。
最后,有点遗憾的是,该机型没有提供 Meteor Lake 选项,无法进行本地 AI 加速。当然,这样的功能可能只会吸引一小部分工作站用户,但它有助于进一步区分 Fury 16 G11 和 Fury 16 G10。使用刚满一年的Fury 16 G10的性能和功能与最新的 Fury 16 G11 基本相同。
价格和供应情况
目前,ZBook Fury 16 G11 配置酷睿i9-14900HX和 RTX 3500 Ada 的出货价约为 3400 美元,如果完全配置 RTX 5000 Ada,出货价将超过 5500 美元。
HP ZBook Fury 16 G11
- 08/12/2024 v8
Allen Ngo
 Total Sustainability Score:
 Transparency
The selection of devices to be reviewed is made by our editorial team. The test sample was provided to the author as a loan by the manufacturer or retailer for the purpose of this review. The lender had no influence on this review, nor did the manufacturer receive a copy of this review before publication. There was no obligation to publish this review. As an independent media company, Notebookcheck is not subjected to the authority of manufacturers, retailers or publishers.
This is how Notebookcheck is testing
Every year, Notebookcheck independently reviews hundreds of laptops and smartphones using standardized procedures to ensure that all results are comparable. We have continuously developed our test methods for around 20 years and set industry standards in the process. In our test labs, high-quality measuring equipment is utilized by experienced technicians and editors. These tests involve a multi-stage validation process. Our complex rating system is based on hundreds of well-founded measurements and benchmarks, which maintains objectivity. Further information on our test methods can be found here.
Price comparison

