

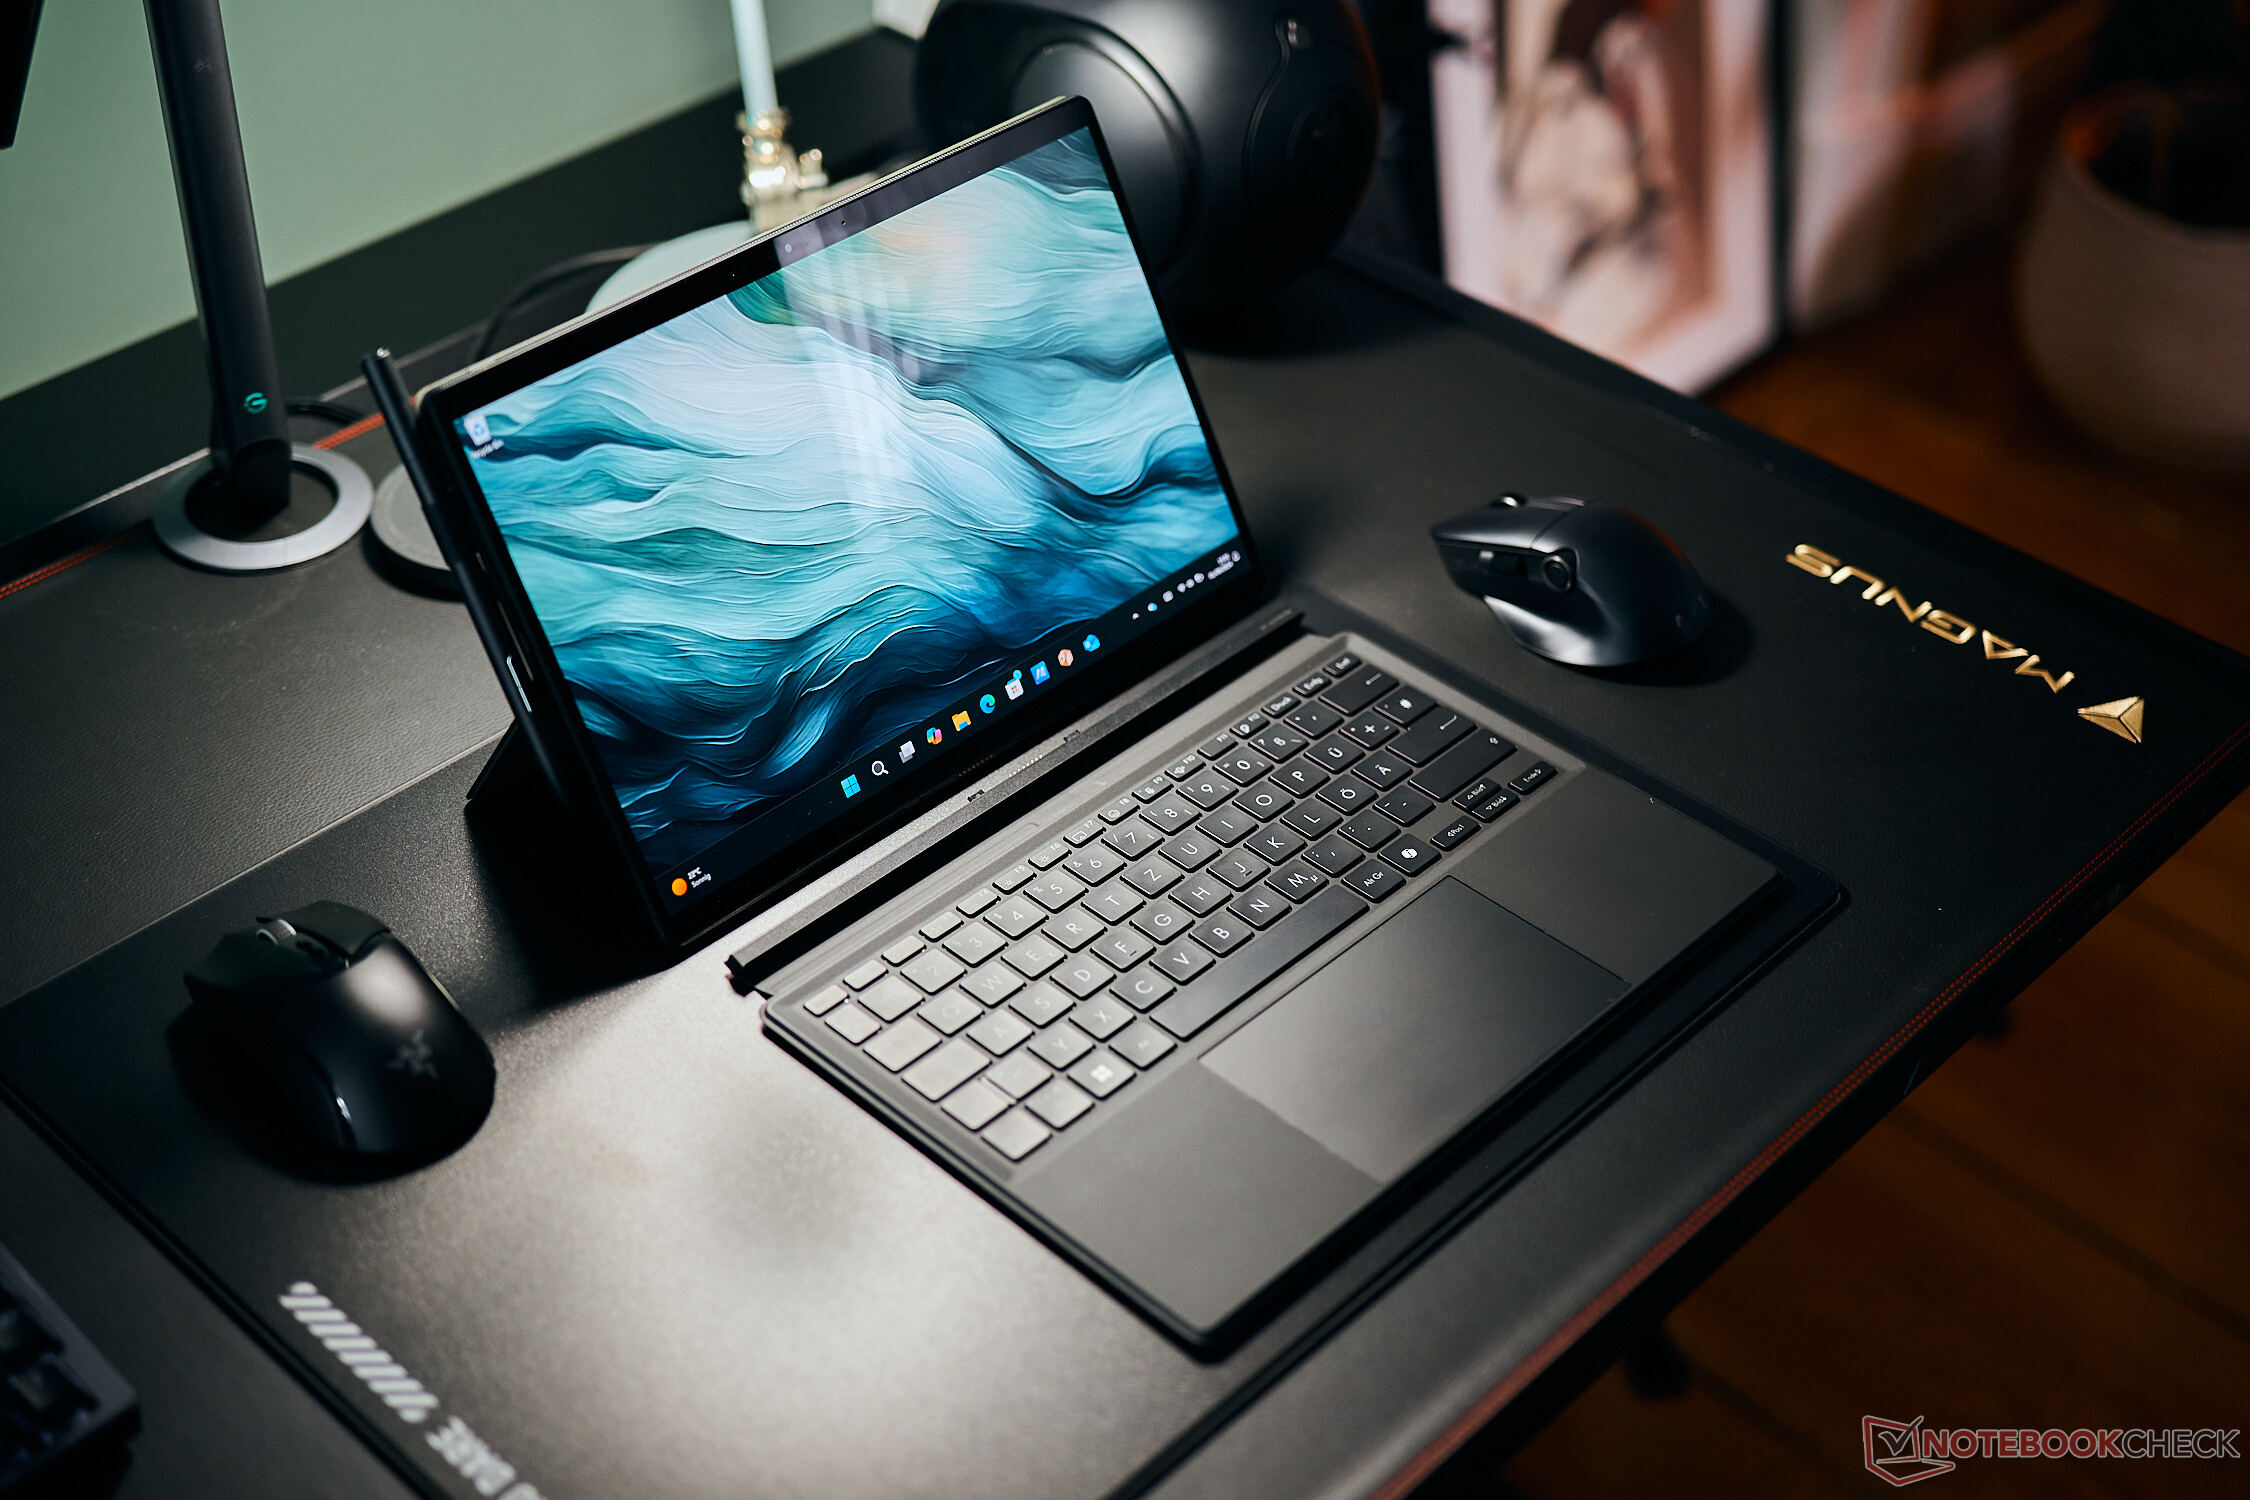
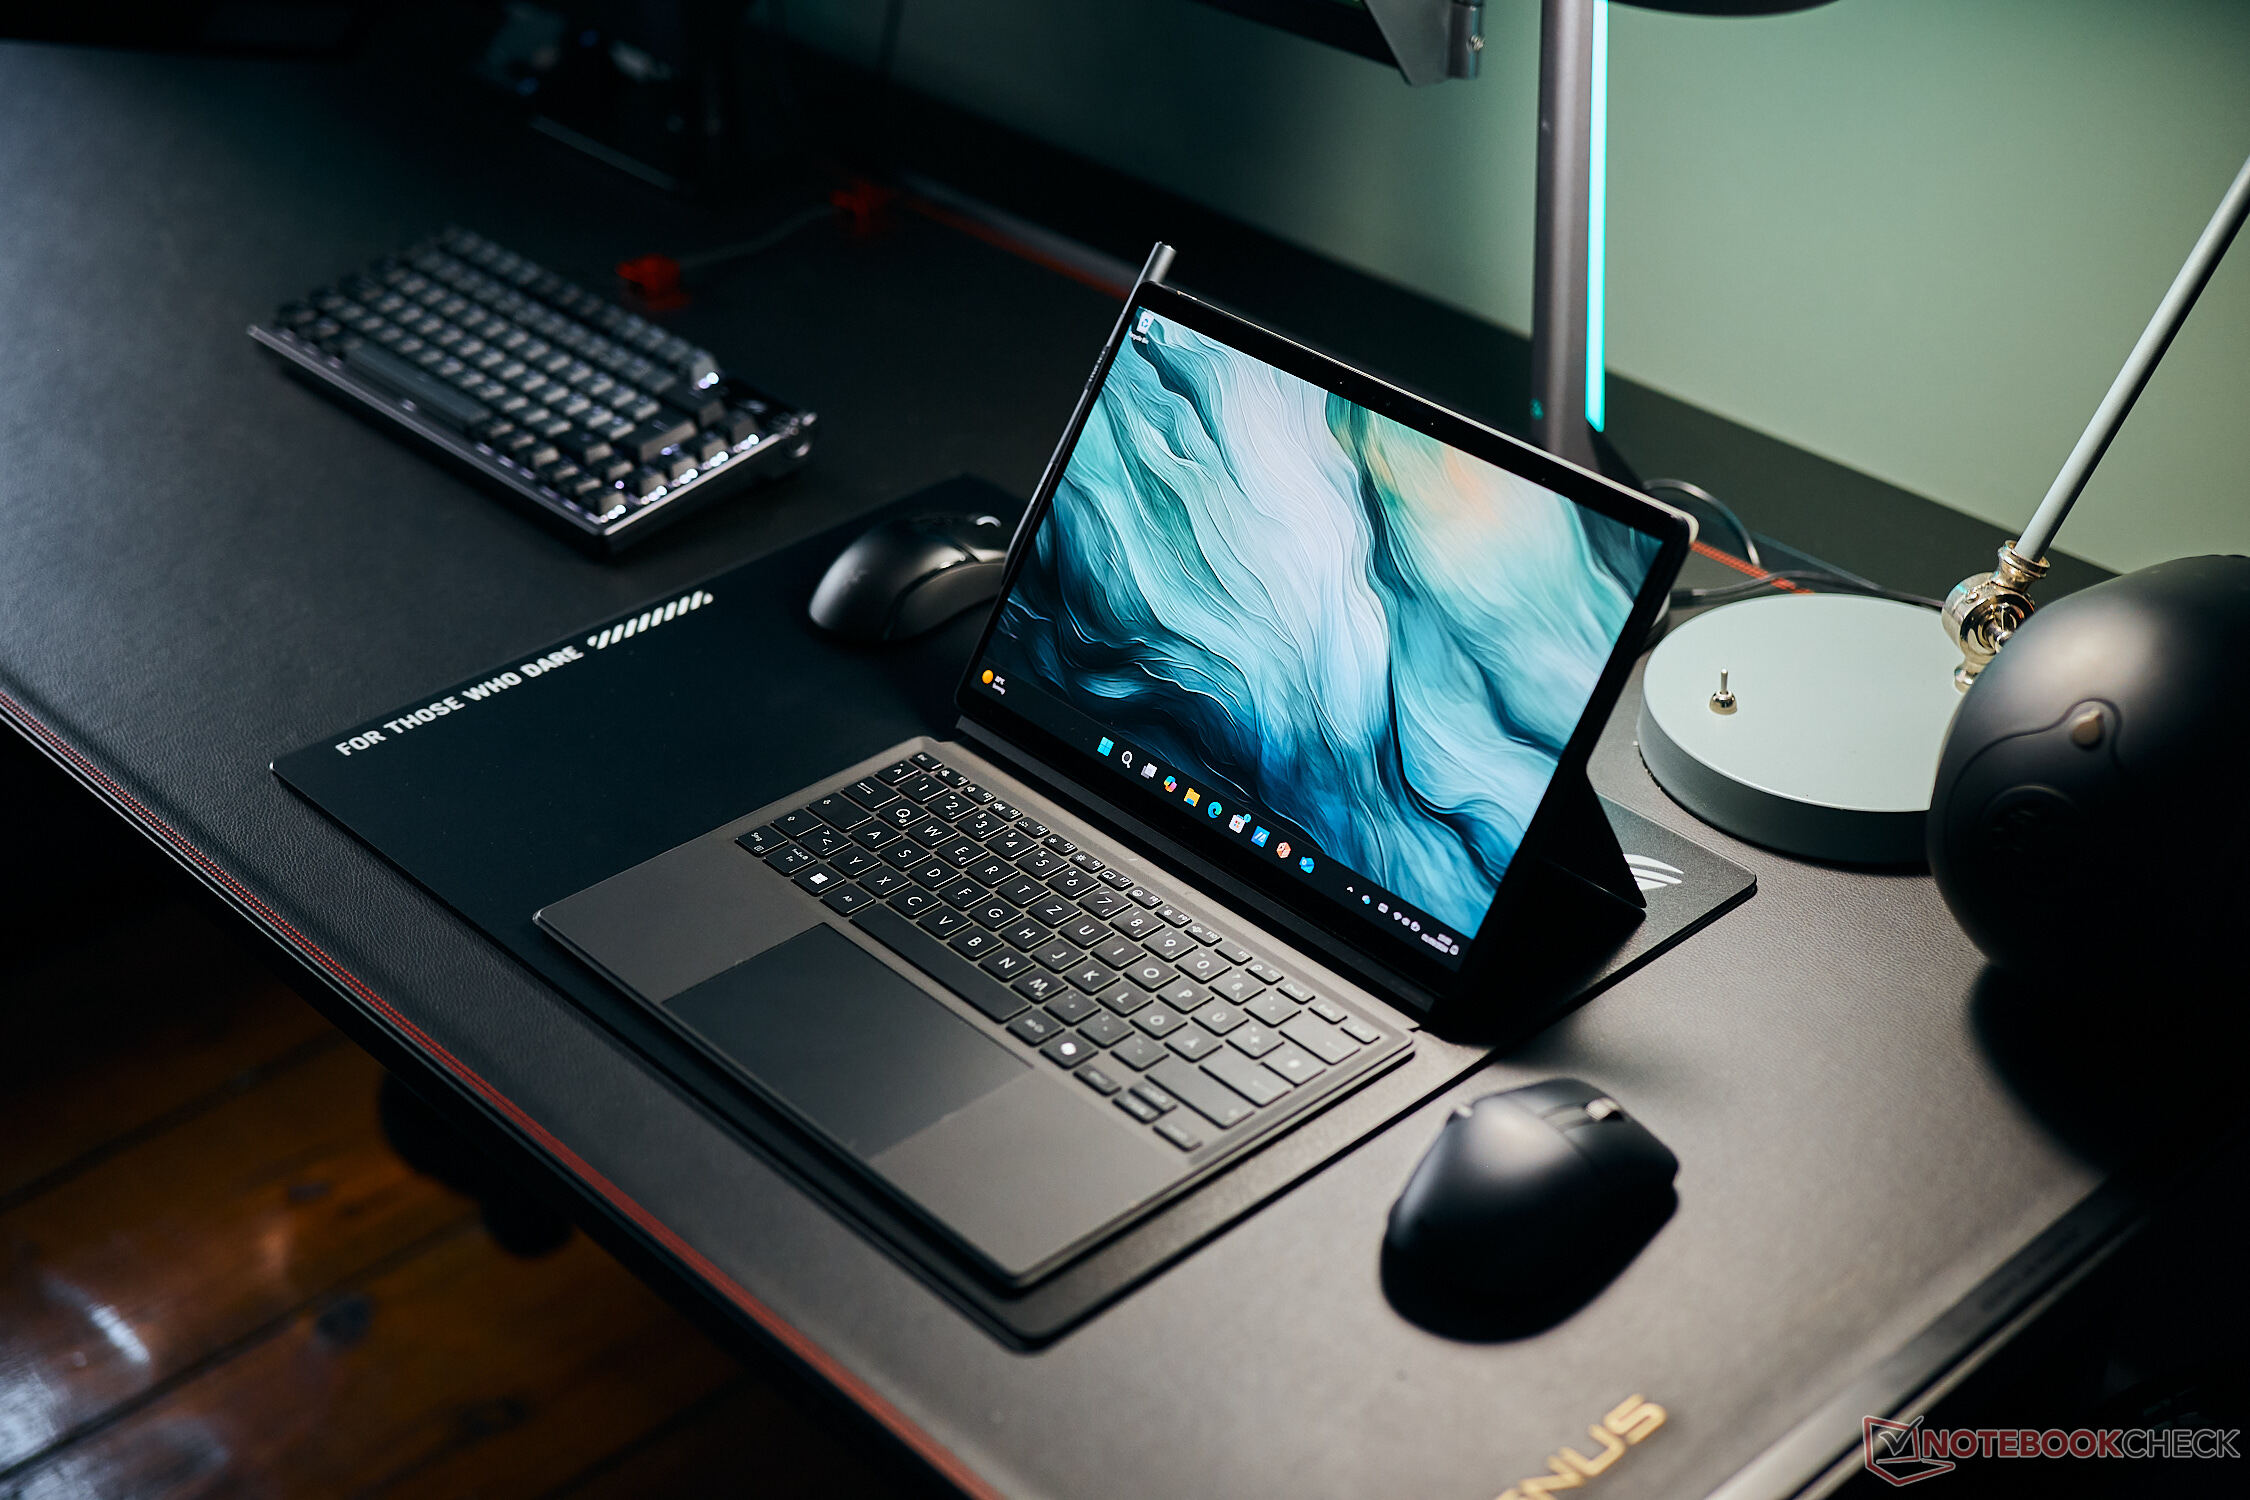
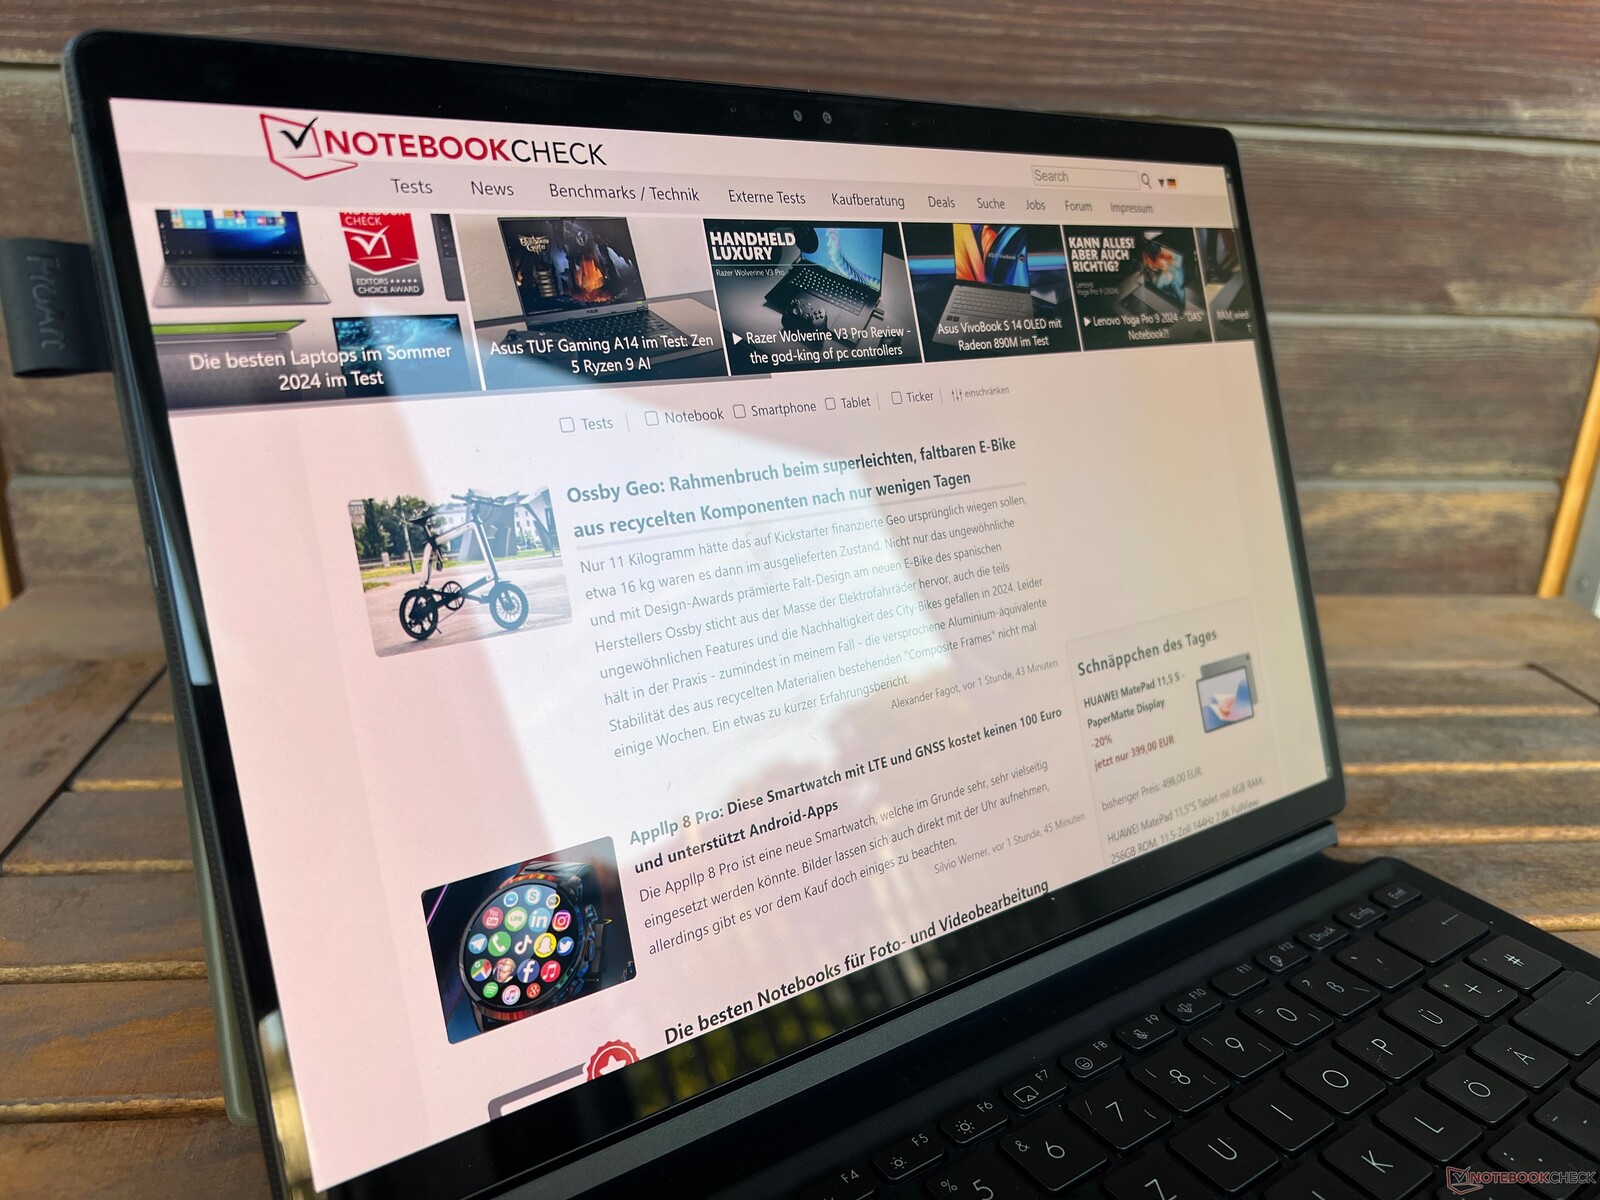
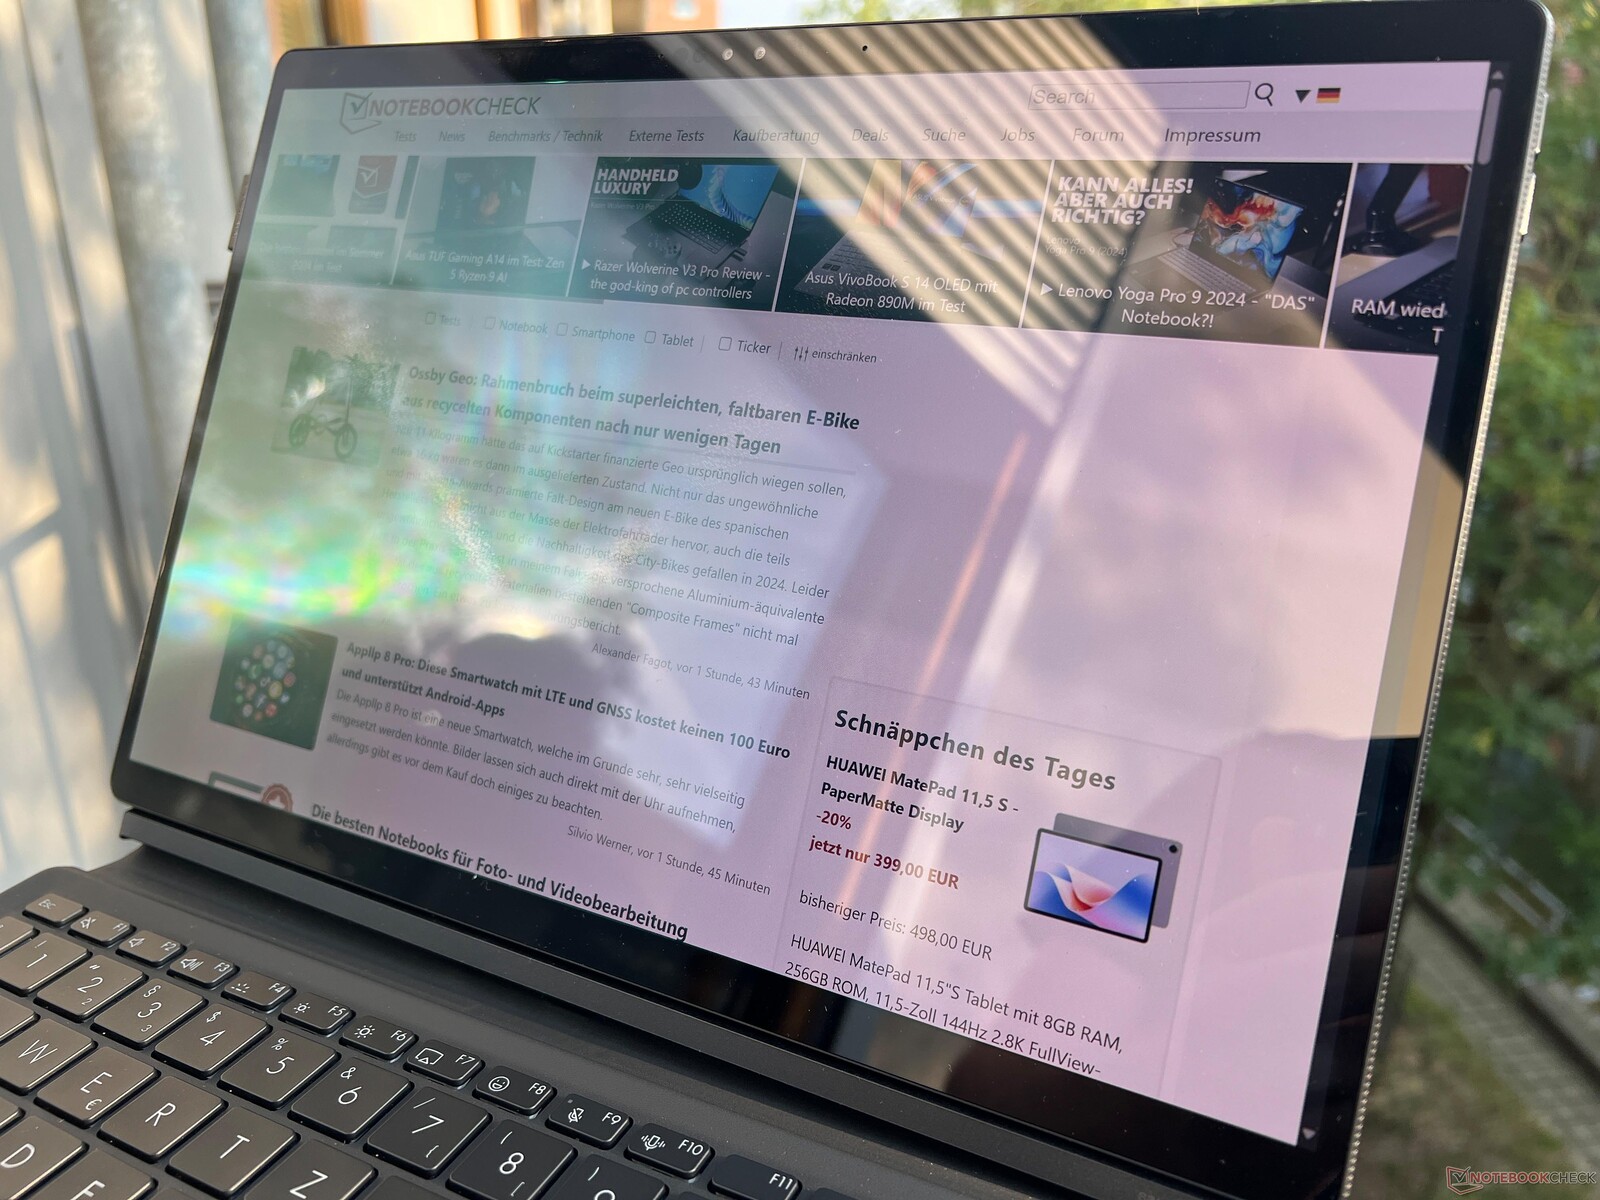
华硕的 ProArt 系列产品专门面向内容创作者,他们希望能够随时随地进行创作,而且在这样做的时候,不必放弃触摸屏,例如使用笔输入。在对大型 ProArt P16和紧凑型 ProArt PX13(都采用了最新的 AMD 处理器)之后,现在我们来看看该系列的第三款产品,即 ProArt PZ13。
这款设备是一款带可拆卸键盘的可转换设备,除其他功能外,它还能更好地保护设备免受外界环境的影响。它的处理器选择尤其有趣,因为它使用了新型 8 核 高通骁龙 X PlusARM 处理器,从而确保了较长的运行时间和充足的电力。除此之外,这款 13.3 英寸设备的 OLED 触摸屏只能以 60 Hz 的频率运行,这与其他 ProArt 机型相同。目前,你可以以 1,099.99 美元的价格购买配备 16 GB 内存和 1 TB SSD 的机型,其中包括带键盘的两件式保护套和华硕触控笔 2.0。
潜在的竞争对手比较
Rating | Version | Date | Model | Weight | Height | Size | Resolution | Price |
|---|---|---|---|---|---|---|---|---|
| 85.3 % | v8 | 09 / 2024 | Asus ProArt PZ13 HT5306 SD X Plus X1P-42-100, Adreno X1-45 1.7 TFLOPS | 874 g | 9 mm | 13.30" | 2880x1800 | |
| 85.7 % v7 (old) | v7 (old) | 04 / 2024 | Minisforum V3 R7 8840U, Radeon 780M | 928 g | 9.8 mm | 14.00" | 2560x1600 | |
| 82.5 % | v8 | 07 / 2024 | Microsoft Surface Pro OLED Copilot+ SD X Elite X1E-80-100, Adreno X1-85 3.8 TFLOPS | 870 g | 9.3 mm | 13.00" | 2880x1920 | |
| 80.7 % | v8 | 08 / 2024 | Microsoft Surface Pro Copilot+ SD X Plus X1P-64-100, Adreno X1-85 3.8 TFLOPS | 872 g | 9.3 mm | 13.00" | 2880x1920 | |
| 89.2 % | v8 | 07 / 2024 | Apple iPad Pro 13 2024 M4 (10 cores), M4 10-Core GPU | 579 g | 5.1 mm | 13.00" | 2752x2064 | |
| 89.1 % v7 (old) | v7 (old) | 04 / 2023 | Asus ROG Flow Z13 GZ301V i9-13900H, NVIDIA GeForce RTX 4060 Laptop GPU | 1.6 kg | 14.2 mm | 13.40" | 2560x1600 |
请注意:我们最近更新了评级系统,第 8 版的结果无法与第 7 版的结果进行比较。更多信息 请点击此处.
外壳 - 通过 IP52 认证的平板电脑
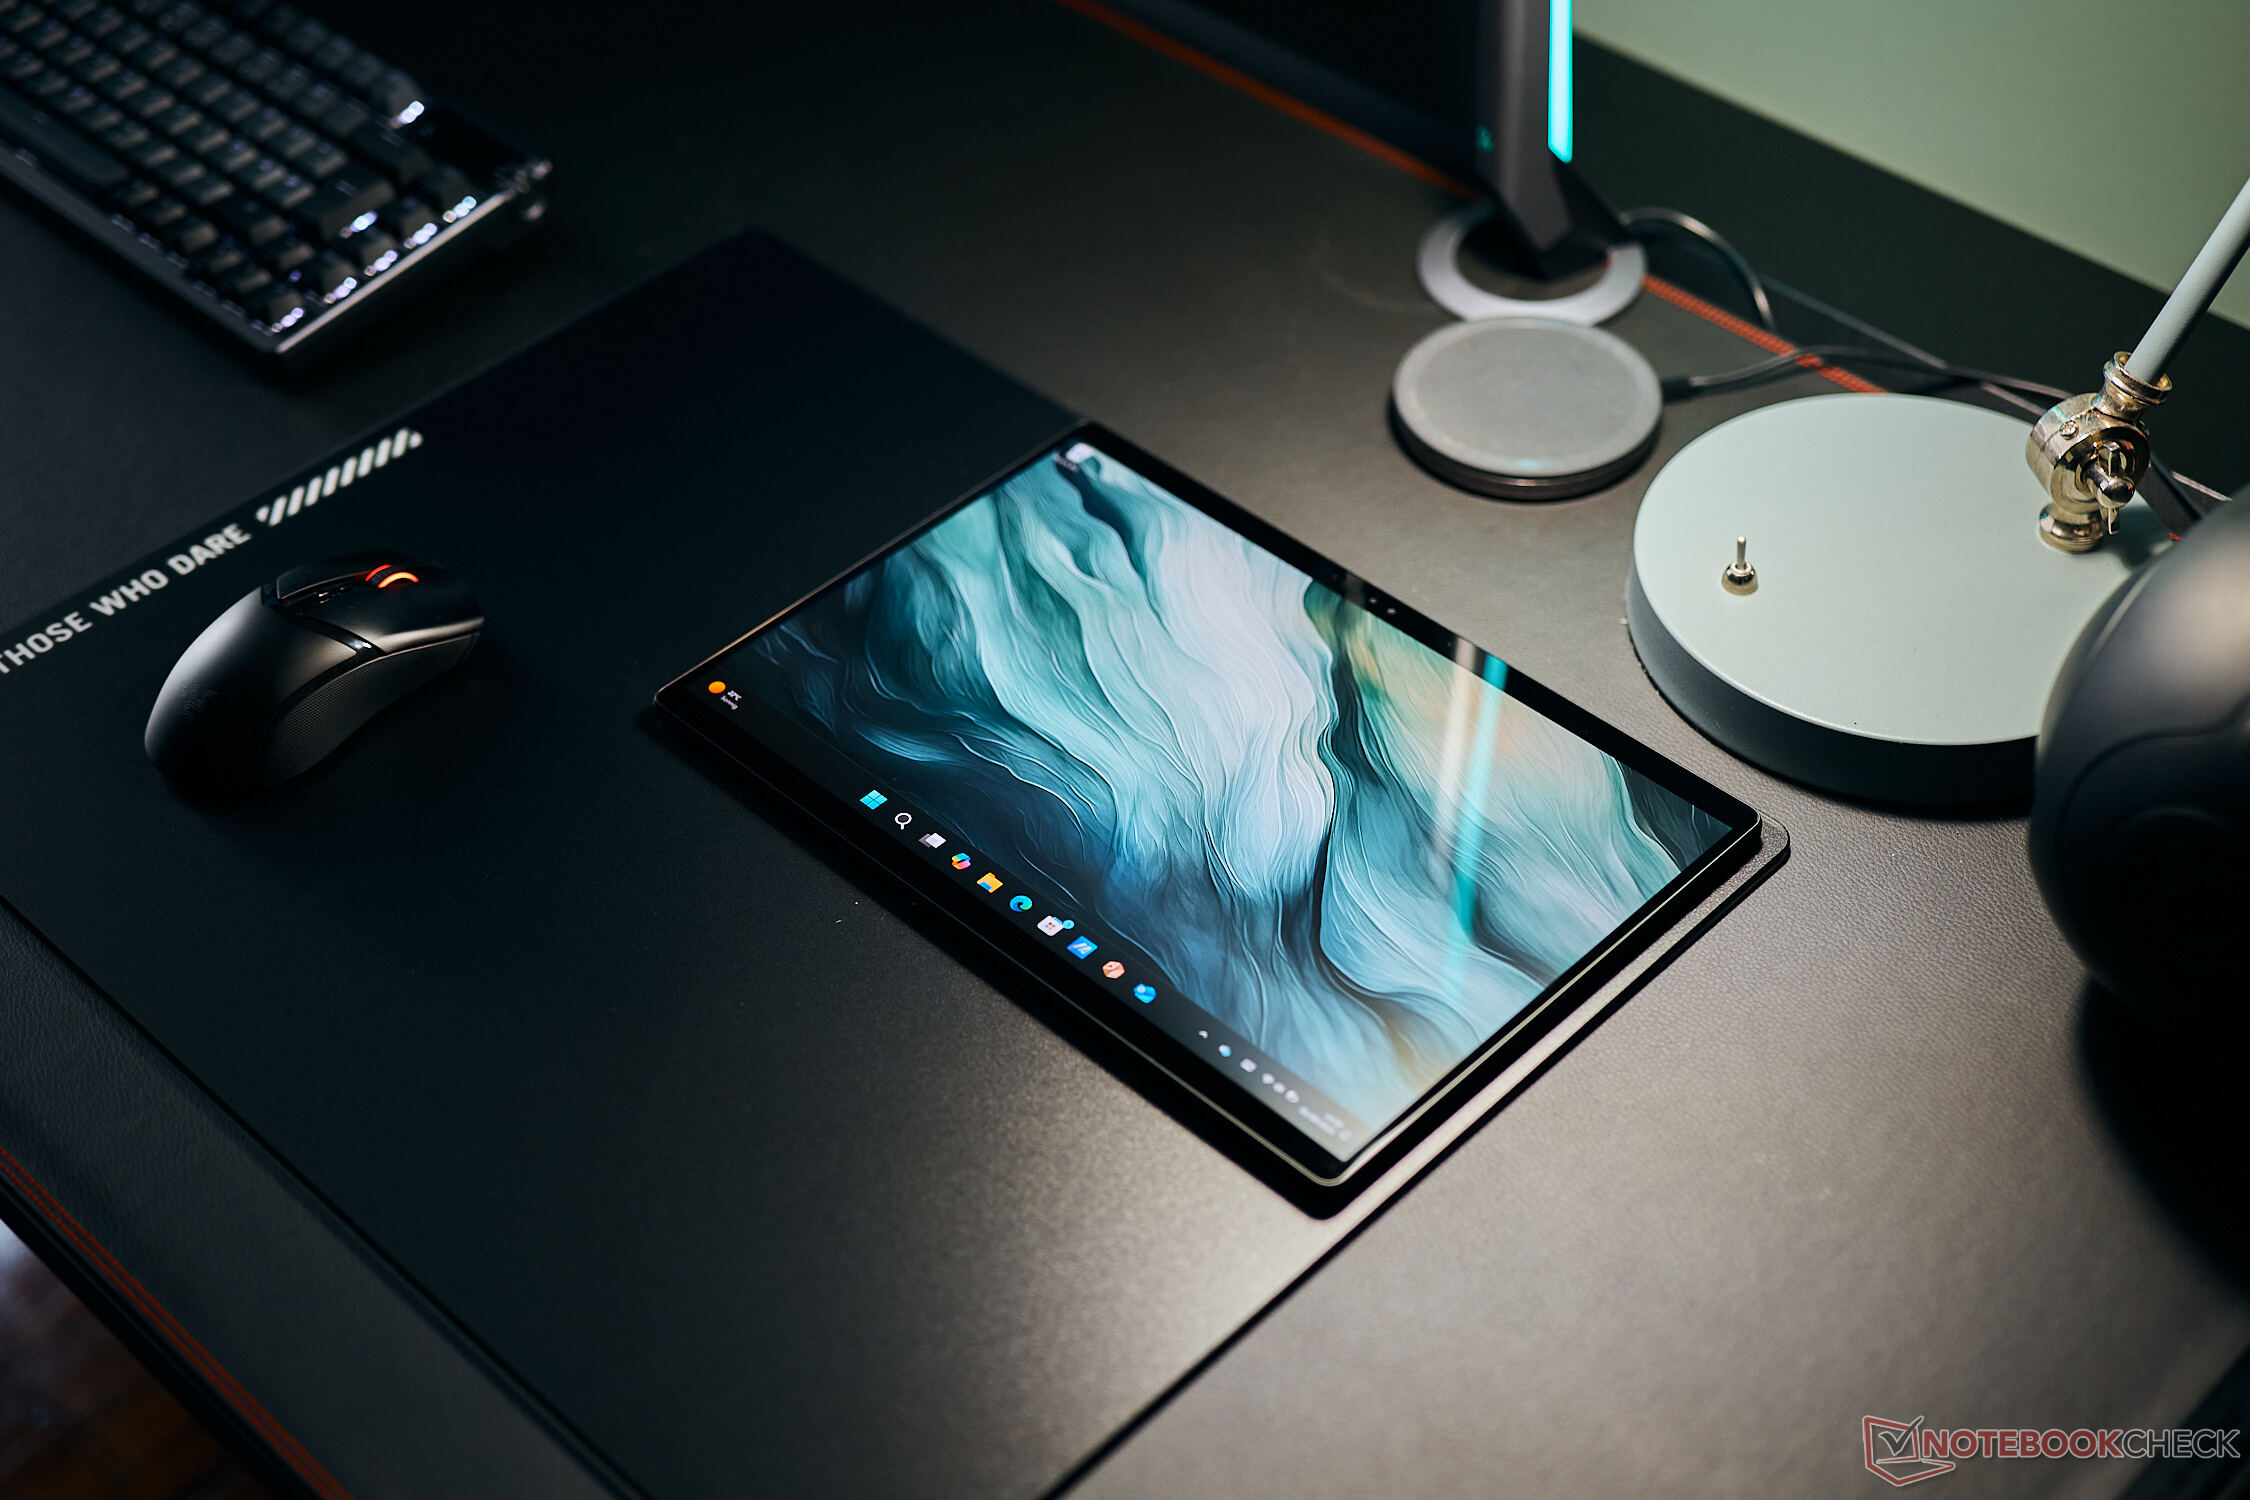
ProArt PZ13 本质上是一款黑色背面的 Windows 平板电脑。它的厚度也相对较厚,仅为 9 毫米,这也为它带来了非常优质、稳定的手感。该设备不会被扭曲,我们也没有注意到它发出吱吱嘎嘎的声音。它的黑色机背设计乍看之下有些乏味,但其中也有不少细节,比如屏幕四周斜面上的图案,这应该会让人联想到高品质的相机。它的金属结构完美无瑕。
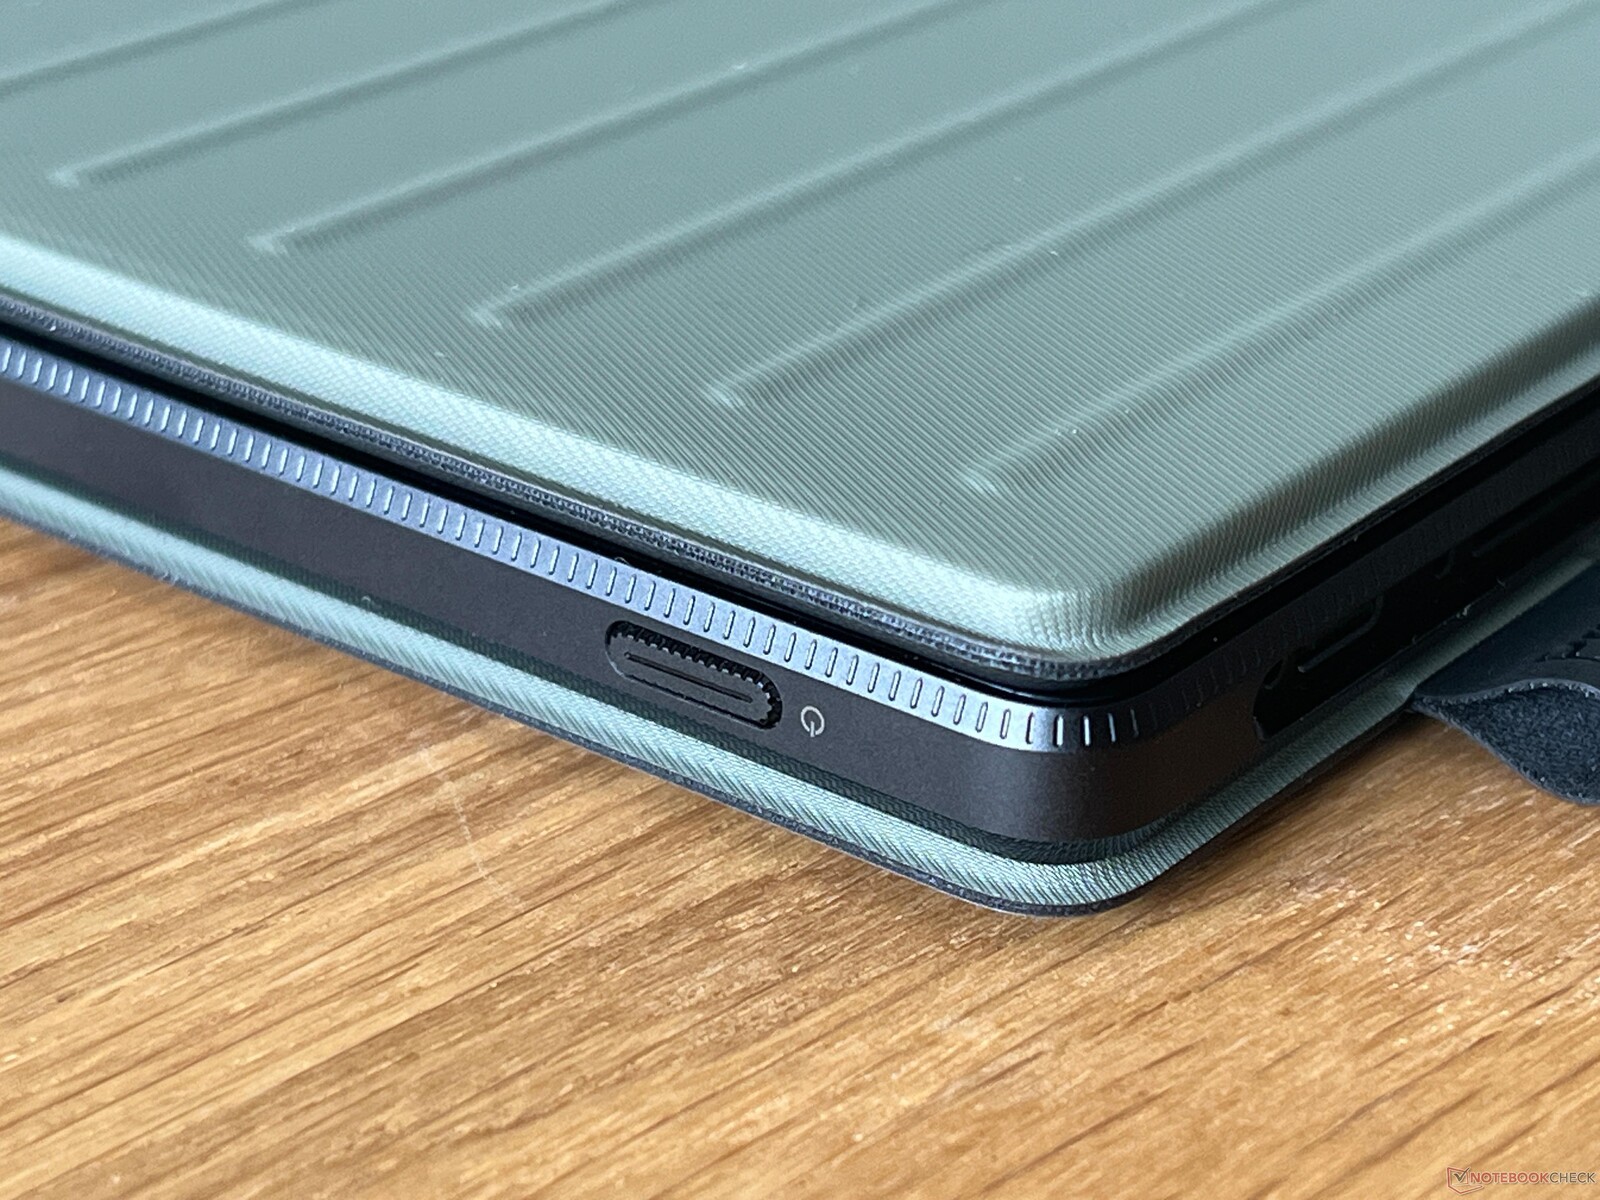
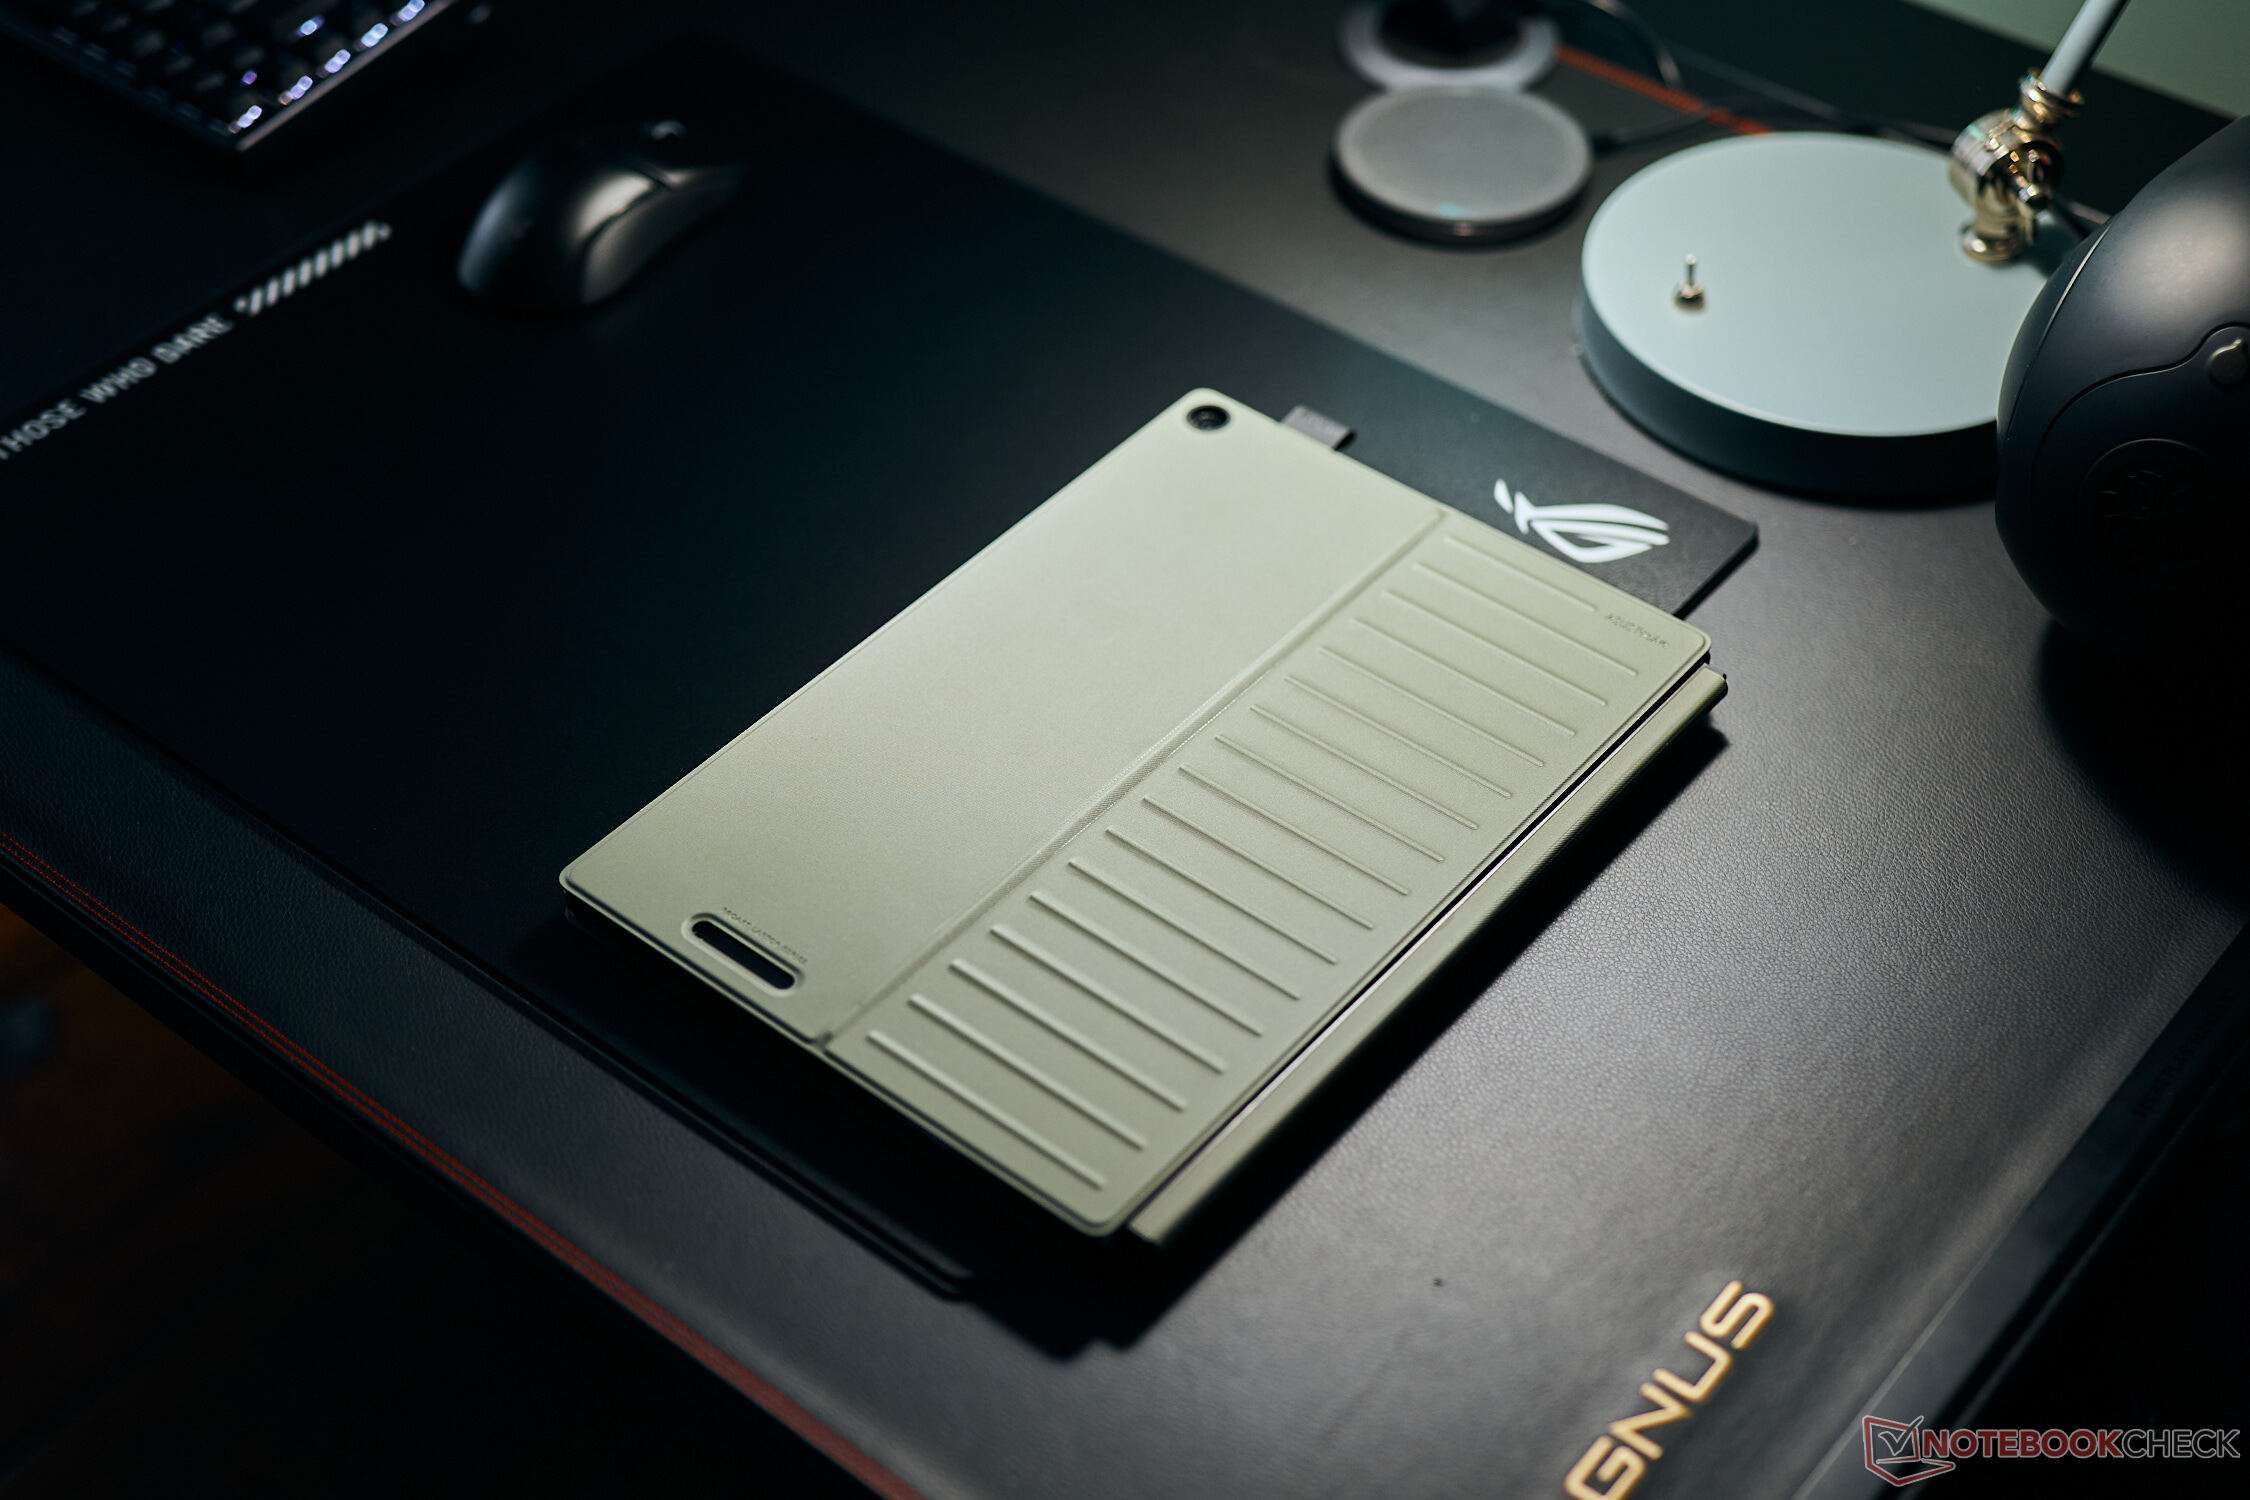
根据华硕的说法,PZ13 通过了 IP52 认证,具有更强的防尘、防水、防极端温度(-30 至 70 °C)和防震功能。例如,风扇出风口安装了一个额外的过滤器,可以防止灰尘进入,三个接口中有两个被橡胶盖板封闭。
这两个盖子采用了苔绿色的配色,为机身增添了几分色彩。盖子的一部分通过磁力吸附在平板电脑背面,有一个用于后置摄像头和风扇出风口的孔。此外,它还可以用作脚架,这是平板电脑本身不具备的功能。此外,它还为附带的触控笔提供了一个标签。后盖的坚固程度令人惊讶,你可以通过脚架将平板电脑抬起。键盘盖的厚度为 6 毫米,也相当厚实和稳定。它通过底部的磁铁和小针与平板电脑连接。此外,两个盖子都能保护外壳,防止刮伤和损坏。
平板电脑本身的厚度为 9 毫米,重 874 克。加上两个盖子,厚度为 17 毫米,重量超过 1.5 千克,比很多笔记本电脑都重。65 瓦的电源额外增加了 223 克。
连接性 - USB 4 和 Wi-Fi 7
ProArt PZ13 的连接功能非常有限,只有两个 USB-C 端口(USB 4.0)和一个全功能读卡器。所有端口都在左上方,一个 USB 端口和读卡器位于橡胶盖下面。没有 3.5 毫米音频接口。
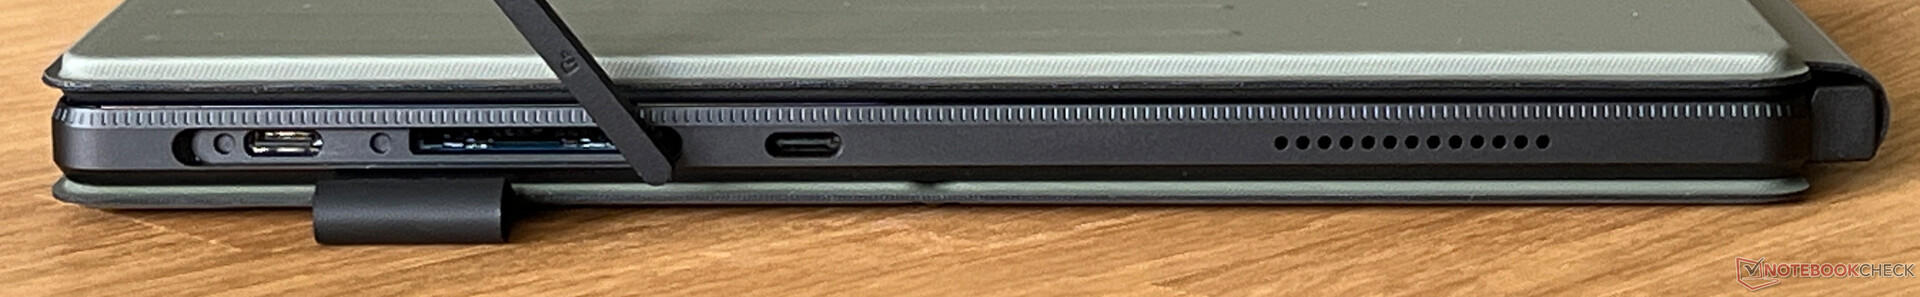
SD 读卡器
ProArt PZ13 配备了一个功能齐全的 SD 读卡器,其供货范围还包括一个 microSD 卡适配器。结合我们的参考卡,其最大传输速率超过 210 MB/s,复制图像时约为 200 MB/s,总的来说效果非常好。
| SD Card Reader | |
| average JPG Copy Test (av. of 3 runs) | |
| Minisforum V3 (AV Pro SD microSD 128 GB V60) | |
| Asus ProArt PZ13 HT5306 (Angelbird AV Pro V60) | |
| Asus ROG Flow Z13 GZ301V | |
| Average of class Convertible (22.4 - 209, n=28, last 2 years) | |
| maximum AS SSD Seq Read Test (1GB) | |
| Minisforum V3 (AV Pro SD microSD 128 GB V60) | |
| Asus ProArt PZ13 HT5306 (Angelbird AV Pro V60) | |
| Asus ROG Flow Z13 GZ301V | |
| Average of class Convertible (25.2 - 263, n=27, last 2 years) | |
交流
小型 Snapdragon X Plus 处理器配备了与更昂贵的高通芯片相同的 WLAN 模块。除蓝牙 5.4 外,FastConnect 7800 还支持 Wi-Fi 7,但遗憾的是我们还无法对其进行测试。结合华硕的参考路由器,我们测得的接收速率非常好,而发送性能可能会更好一些。不过,我们在测试期间从未遇到过任何信号质量问题。
目前,PZ13 还没有 5G 版本,但实际上它已经注定要使用 5G 技术。微软的新 Surface Pro(同样采用 ARM CPU)将于今年晚些时候发布 5G 版本。Apple's iPad Pro 13在这种情况下具有明显的优势,即使其 5G 调制解调器的价格为 200 美元。
| Networking | |
| Asus ProArt PZ13 HT5306 | |
| iperf3 transmit AXE11000 | |
| iperf3 receive AXE11000 | |
| Minisforum V3 | |
| iperf3 transmit AXE11000 | |
| iperf3 receive AXE11000 | |
| iperf3 transmit AXE11000 6GHz | |
| iperf3 receive AXE11000 6GHz | |
| Microsoft Surface Pro OLED Copilot+ | |
| iperf3 transmit AXE11000 | |
| iperf3 receive AXE11000 | |
| Apple iPad Pro 13 2024 | |
| iperf3 transmit AXE11000 | |
| iperf3 receive AXE11000 | |
| iperf3 transmit AXE11000 6GHz | |
| iperf3 receive AXE11000 6GHz | |
| Asus ROG Flow Z13 GZ301V | |
| iperf3 transmit AXE11000 6GHz | |
| iperf3 receive AXE11000 6GHz | |
网络摄像头
PZ13 配备了两个摄像头。除了 500 万像素的前置摄像头(+IR 用于人脸识别)外,背面还有一个 1300 万像素的传感器。最重要的是,它的图像清晰度明显优于一般的 1080p 机型,而且还支持 Windows Studio 特效。此外,还有三个麦克风可用于清晰的语音录制。


维护
用户无法打开 PZ13 的外壳,也不提供任何维护选项。
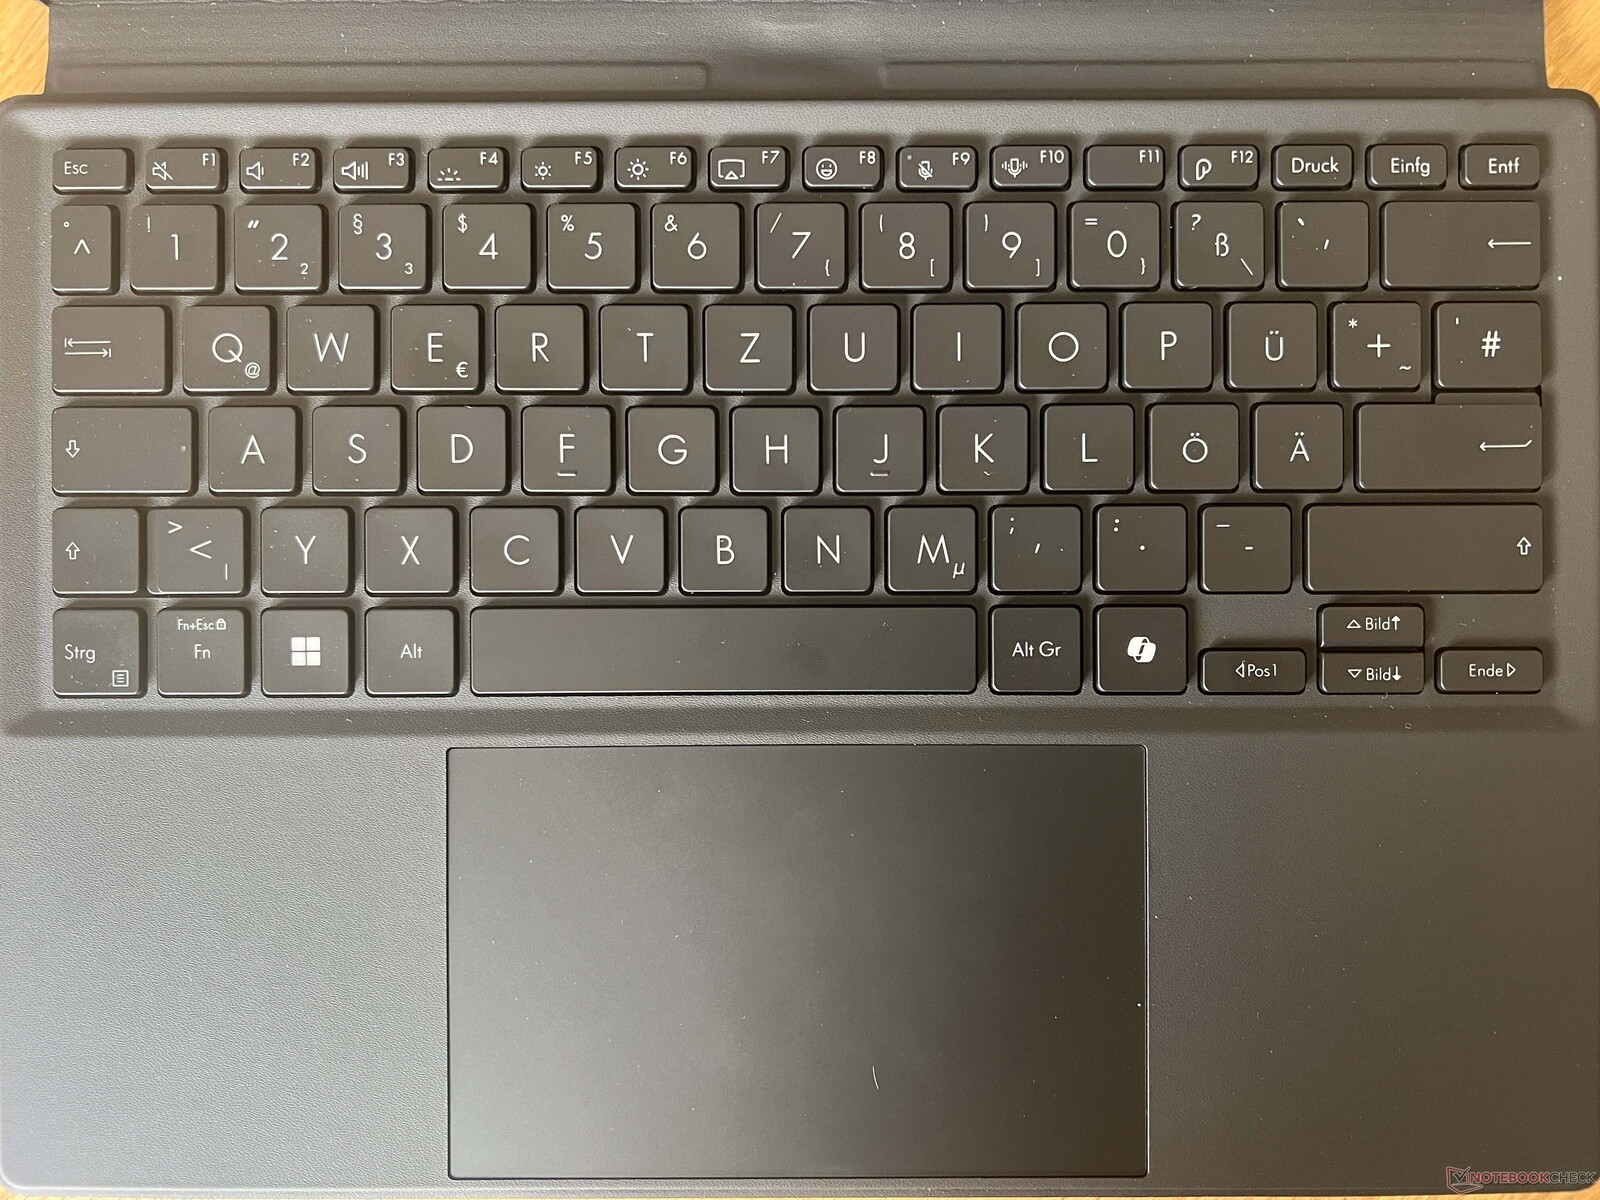
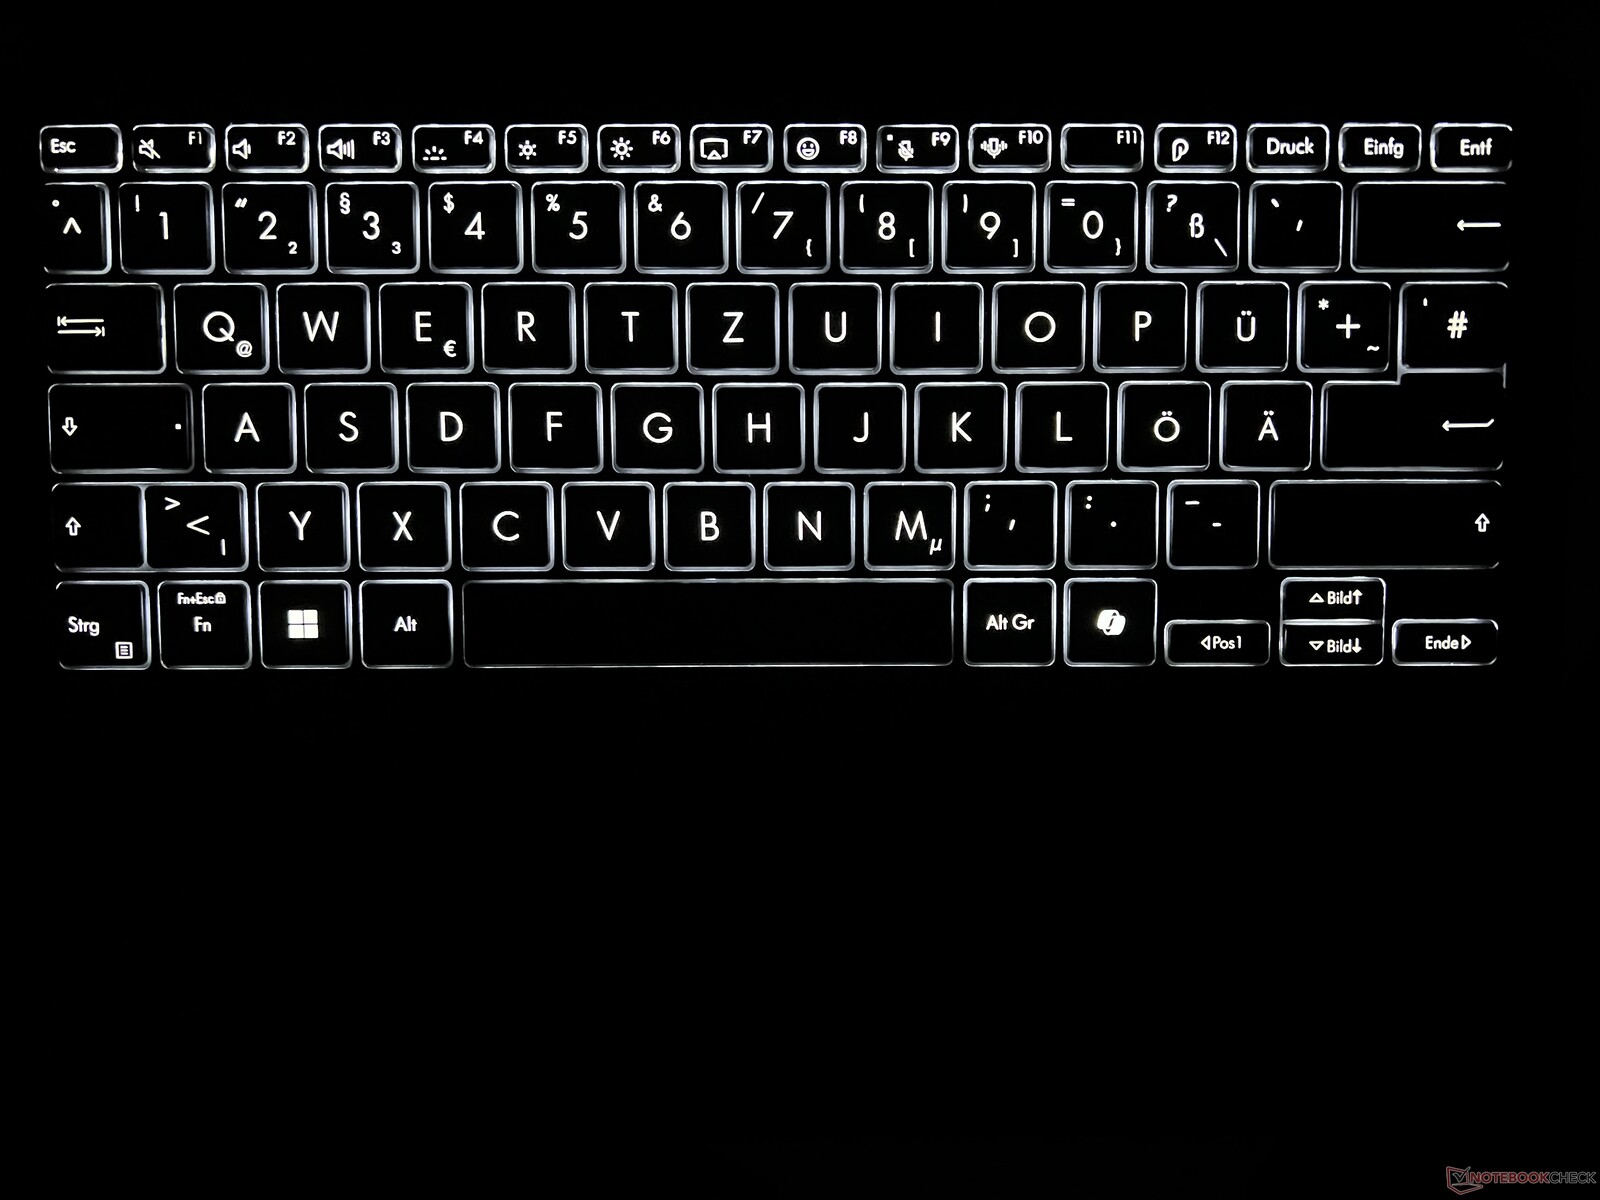
输入设备 - 行程为 1.35 毫米的键盘
显示屏 - 3K OLED,60 Hz
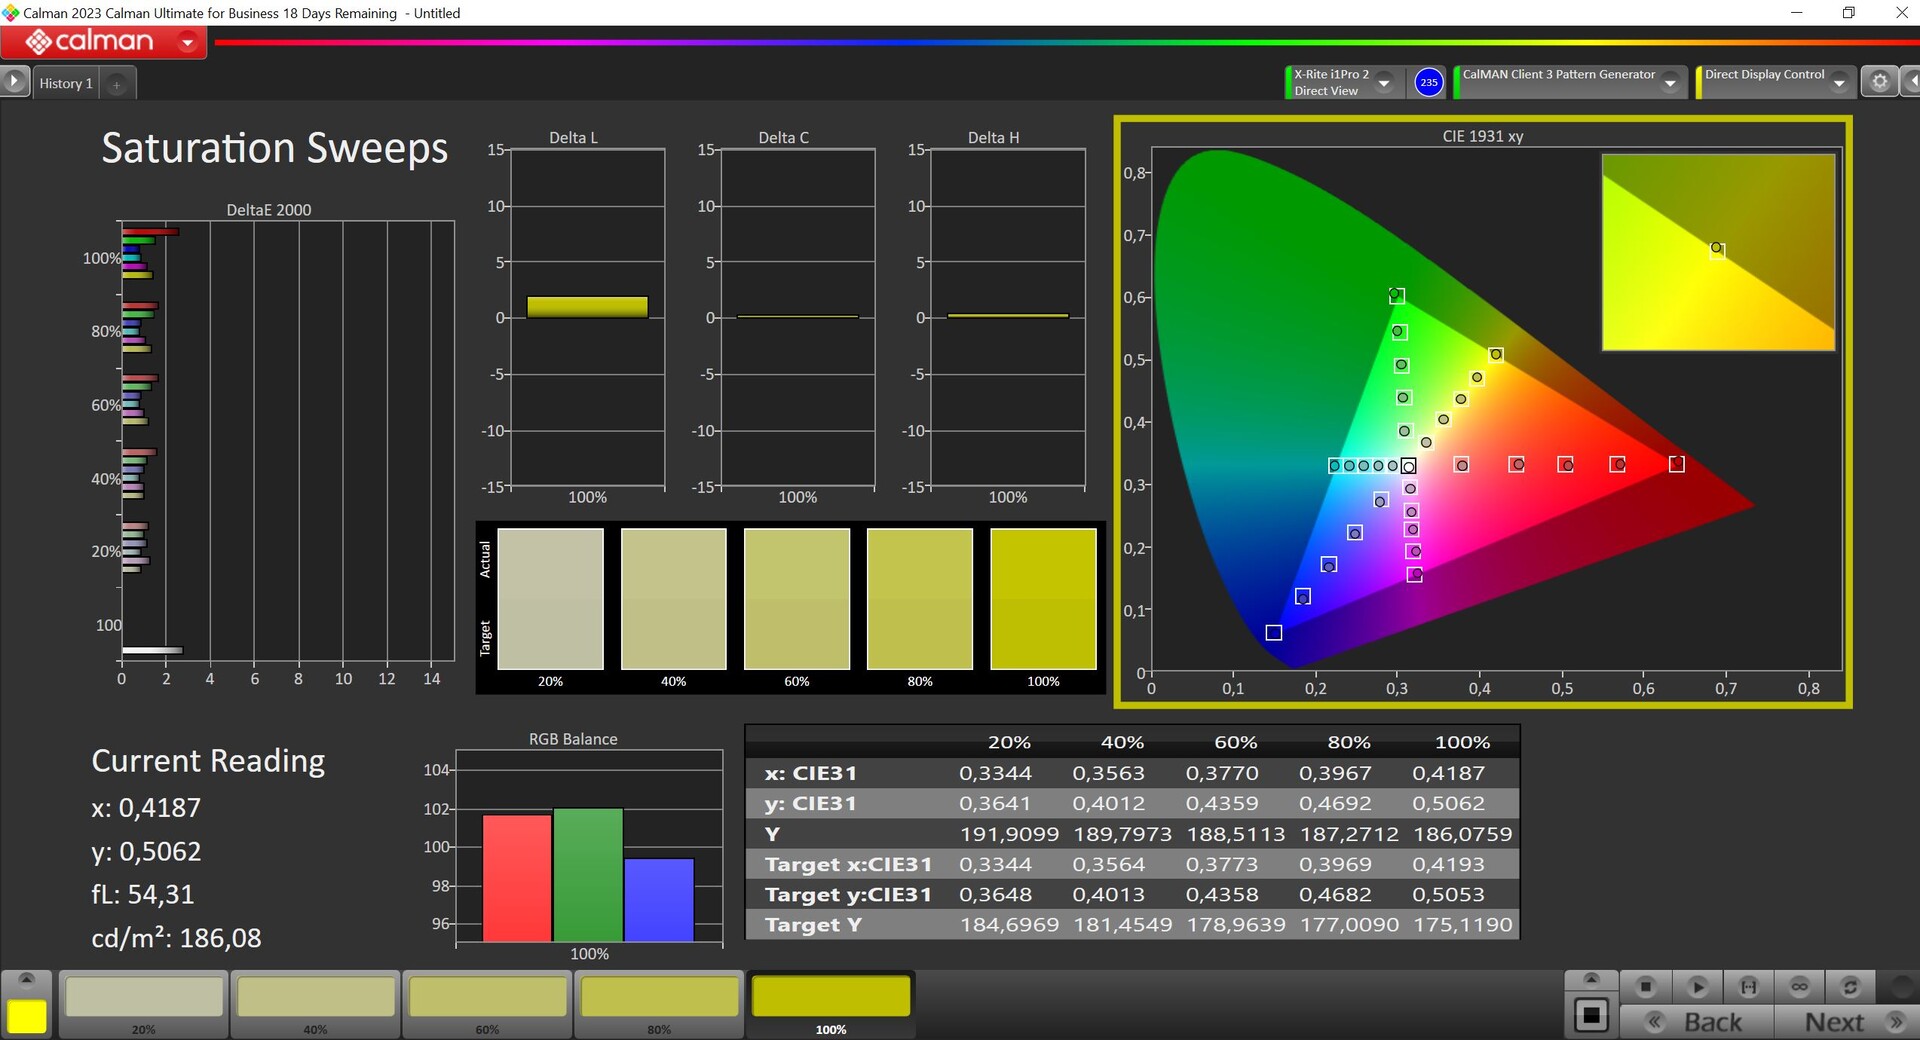
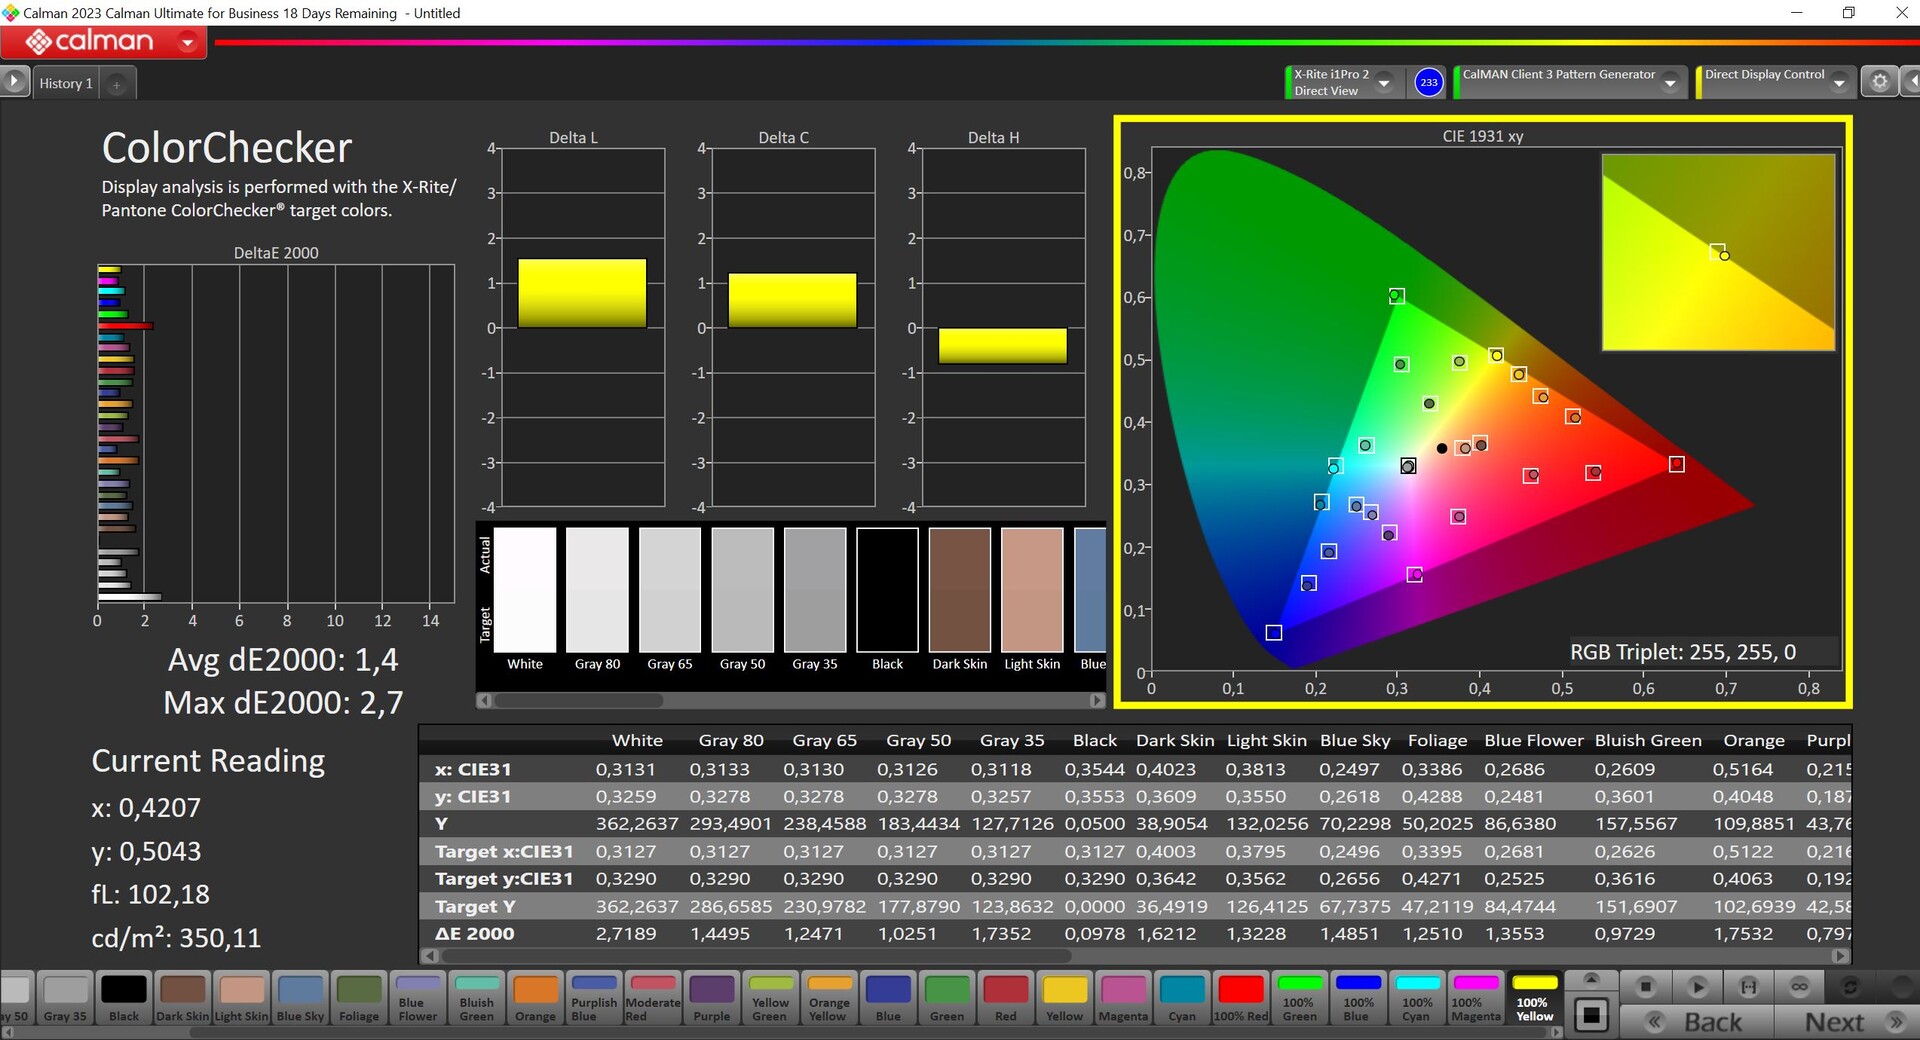
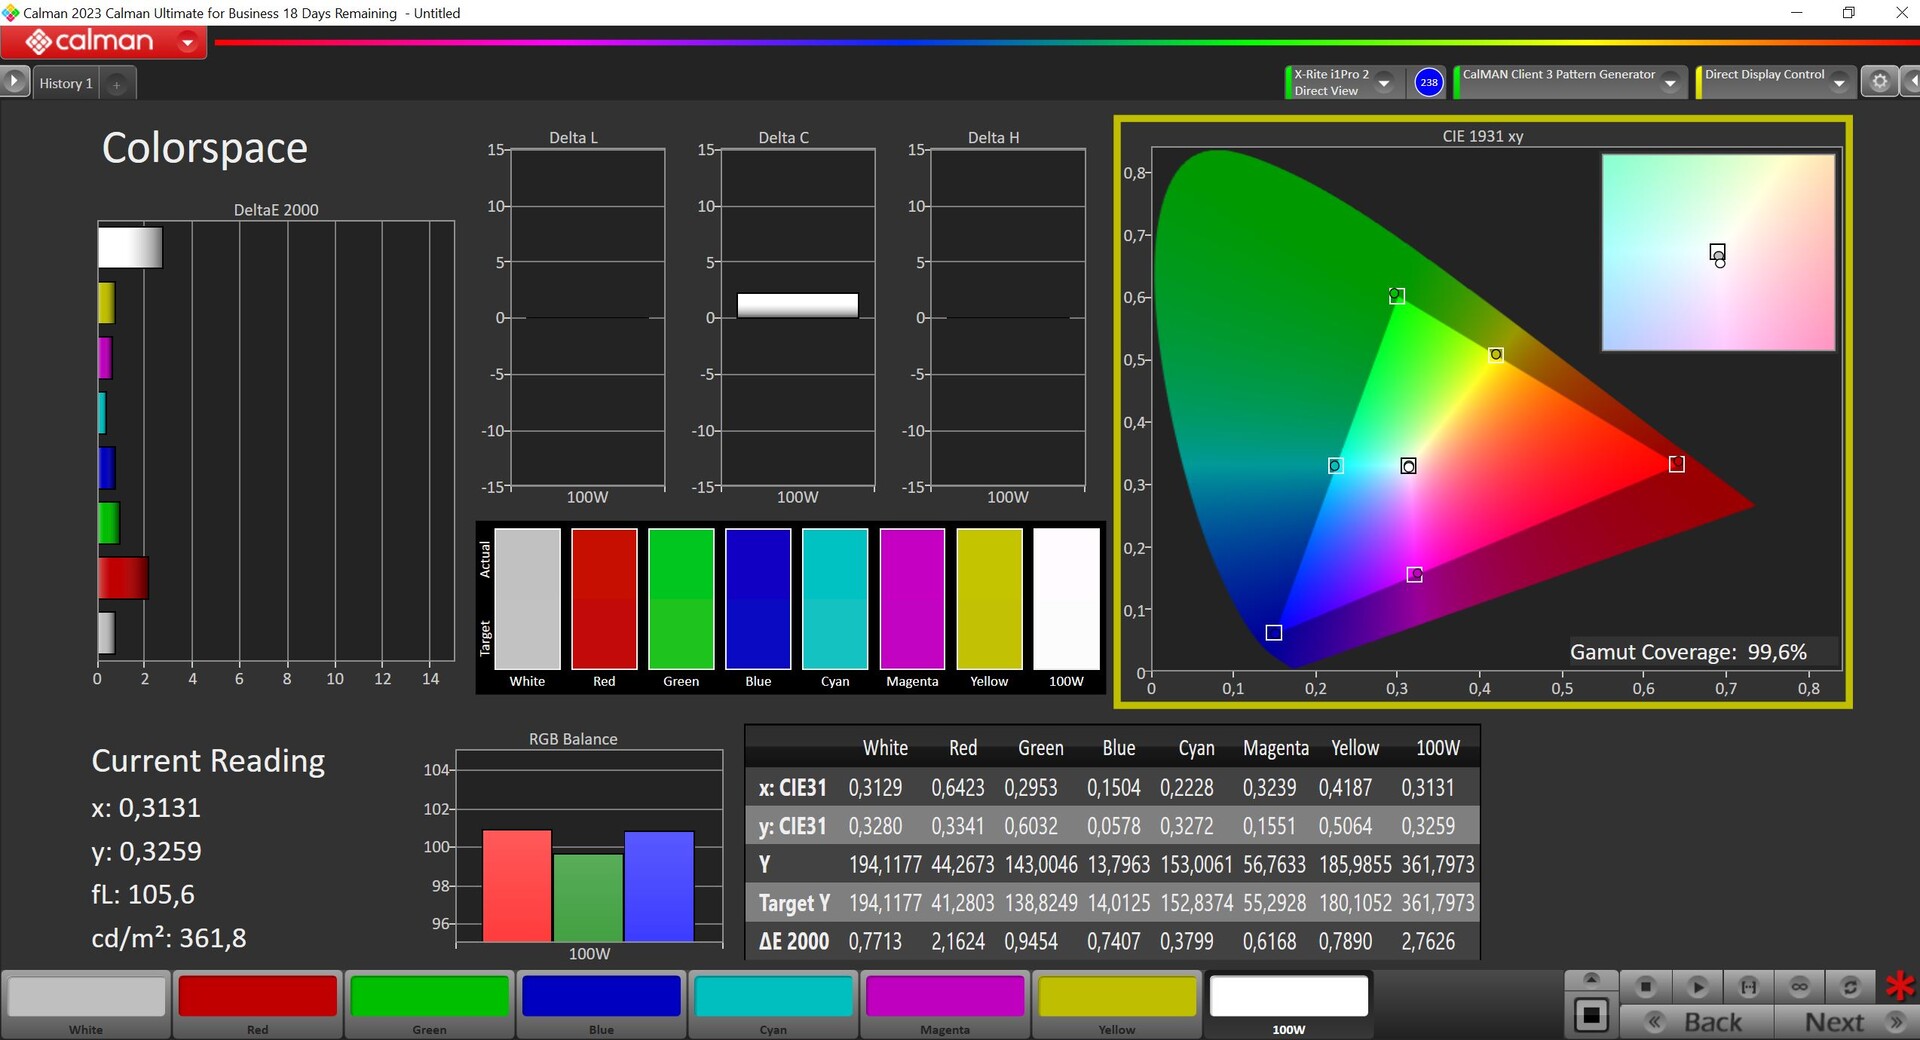
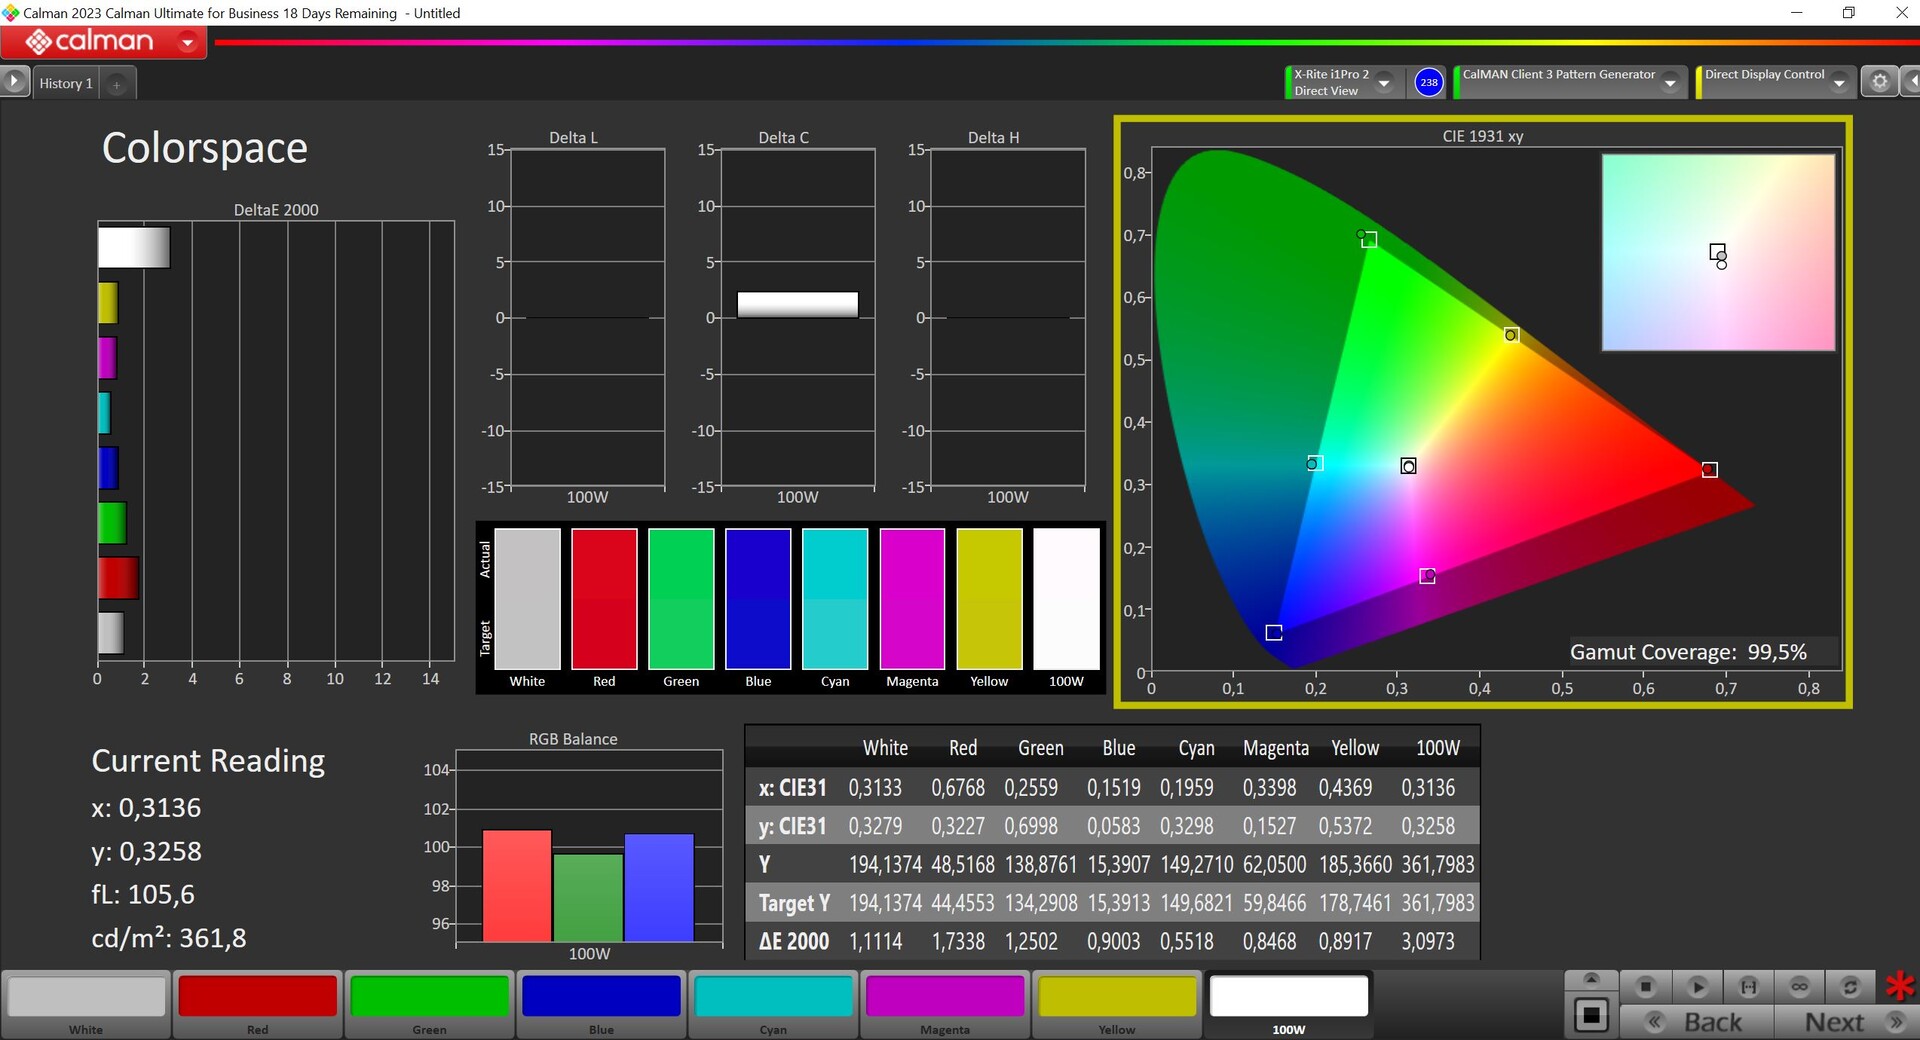
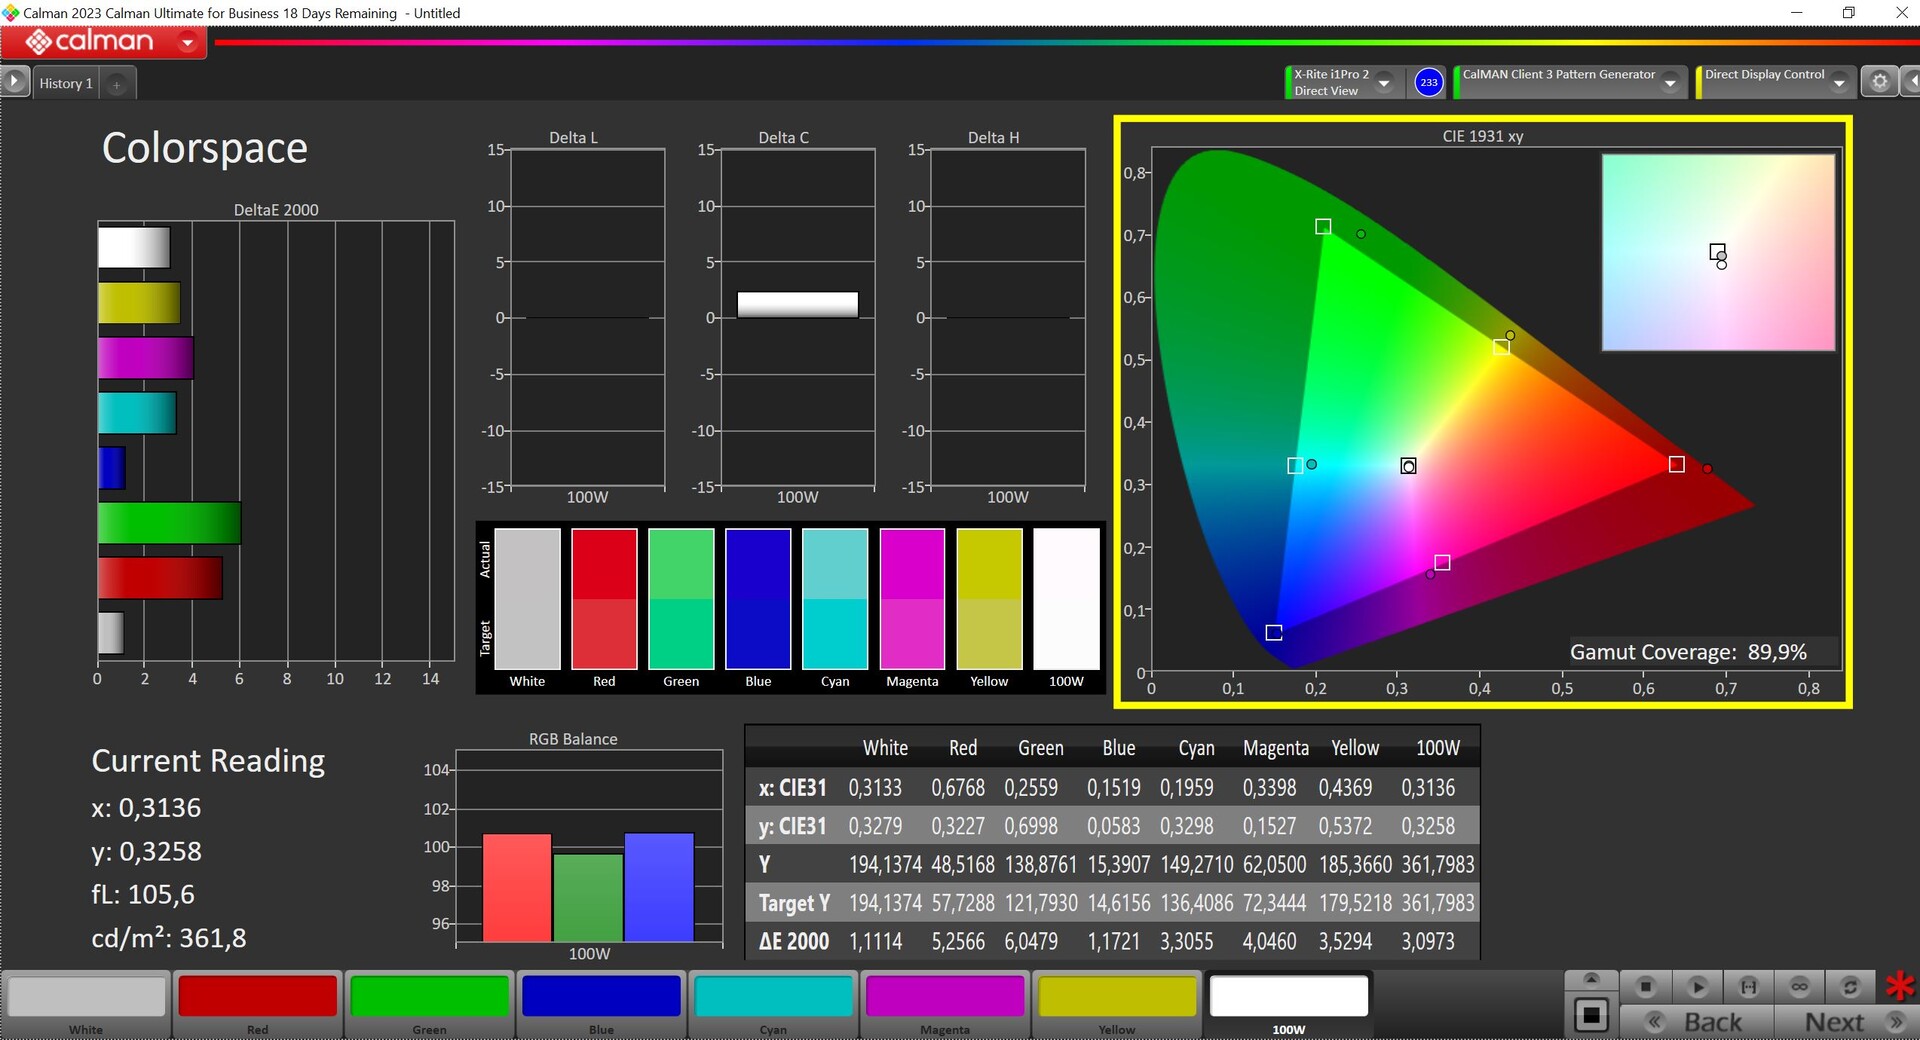
与当前其他两款 ProArt 设备一样,华硕在 PZ13 上安装了一块高分辨率 OLED 触摸屏(2880 x 1800 像素,16:10),但遗憾的是其刷新率仅为 60 Hz。因此,动作看起来并不像在高频率屏幕上那样如天鹅绒般顺滑。从主观上看,光线表面的颗粒感也对画质造成了轻微的负面影响。色彩看起来超级鲜艳,用户可以享受到深邃的黑色和快速的响应时间。面板的亮度和色温可通过传感器根据环境光线条件自动调节。
在 SDR 工作模式下,其最大亮度为 363 cd/m²,由于黑色值较低,该显示屏拥有非常高的对比度。这个数值并不差,但现在市场上已经有很多亮度更高的 OLED 面板。在 HDR 工作模式下,我们注意到在显示小图像摘录时最高亮度为 605 cd/m²,在几乎全白的屏幕上最高亮度为 549 cd/m²。
| |||||||||||||||||||||||||
Brightness Distribution: 99 %
Center on Battery: 362 cd/m²
Contrast: 36200:1 (Black: 0.01 cd/m²)
ΔE Color 1.5 | 0.5-29.43 Ø4.87
ΔE Greyscale 1.6 | 0.5-98 Ø5.1
89.9% AdobeRGB 1998 (Argyll 2.2.0 3D)
99.6% sRGB (Argyll 2.2.0 3D)
99.5% Display P3 (Argyll 2.2.0 3D)
Gamma: 2.12
| Asus ProArt PZ13 HT5306 ATNA33AA08-0, OLED, 2880x1800, 13.3", 60 Hz | Minisforum V3 BOE, NE140QDM-NY1, IPS, 2560x1600, 14", 165 Hz | Microsoft Surface Pro OLED Copilot+ ATNA30DW01-1, OLED, 2880x1920, 13", 120 Hz | Microsoft Surface Pro Copilot+ LP129WT342166, IPS, 2880x1920, 13", 120 Hz | Apple iPad Pro 13 2024 Tandem OLED, 2752x2064, 13", 120 Hz | Asus ROG Flow Z13 GZ301V TL134ADXP01-0, IPS, 2560x1600, 13.4", 165 Hz | |
|---|---|---|---|---|---|---|
| Display | -2% | -0% | -9% | -3% | ||
| Display P3 Coverage | 99.5 | 97.7 -2% | 98.9 -1% | 83.4 -16% | 97 -3% | |
| sRGB Coverage | 99.6 | 99.8 0% | 99.4 0% | 99.7 0% | 99.9 0% | |
| AdobeRGB 1998 Coverage | 89.9 | 85.4 -5% | 89.5 0% | 79.4 -12% | 85.3 -5% | |
| Response Times | -508% | 79% | -1824% | -23% | -342% | |
| Response Time Grey 50% / Grey 80% * | 1.54 ? | 10 ? -549% | 0.32 ? 79% | 39.6 ? -2471% | 3.39 ? -120% | 6.5 ? -322% |
| Response Time Black / White * | 1.41 ? | 8 ? -467% | 0.58 ? 59% | 18 ? -1177% | 0.69 ? 51% | 6.5 ? -361% |
| PWM Frequency | 240 ? | 480 ? 100% | 240 0% | |||
| Screen | -651% | -12% | -687% | 66% | -555% | |
| Brightness middle | 362 | 512 41% | 580 60% | 585 62% | 1000 176% | 537 48% |
| Brightness | 364 | 495 36% | 581 60% | 574 58% | 1010 177% | 511 40% |
| Brightness Distribution | 99 | 91 -8% | 99 0% | 89 -10% | 98 -1% | 88 -11% |
| Black Level * | 0.01 | 0.48 -4700% | 0.04 -300% | 0.56 -5500% | 0.45 -4400% | |
| Contrast | 36200 | 1067 -97% | 14500 -60% | 1045 -97% | 1193 -97% | |
| Colorchecker dE 2000 * | 1.5 | 4.32 -188% | 0.7 53% | 1.3 13% | 1 33% | 1.49 1% |
| Colorchecker dE 2000 max. * | 3.1 | 7.04 -127% | 2.1 32% | 3 3% | 2.5 19% | 3.68 -19% |
| Greyscale dE 2000 * | 1.6 | 4.22 -164% | 0.6 62% | 2 -25% | 1.7 -6% | 1.66 -4% |
| Gamma | 2.12 104% | 2.31 95% | 2.16 102% | 2.18 101% | 2.21 100% | 2.43 91% |
| CCT | 6514 100% | 6770 96% | 6484 100% | 6914 94% | 6661 98% | 6772 96% |
| Colorchecker dE 2000 calibrated * | 4.17 | 1.12 | ||||
| Total Average (Program / Settings) | -387% /
-479% | 22% /
10% | -840% /
-706% | 22% /
37% | -300% /
-395% |
* ... smaller is better

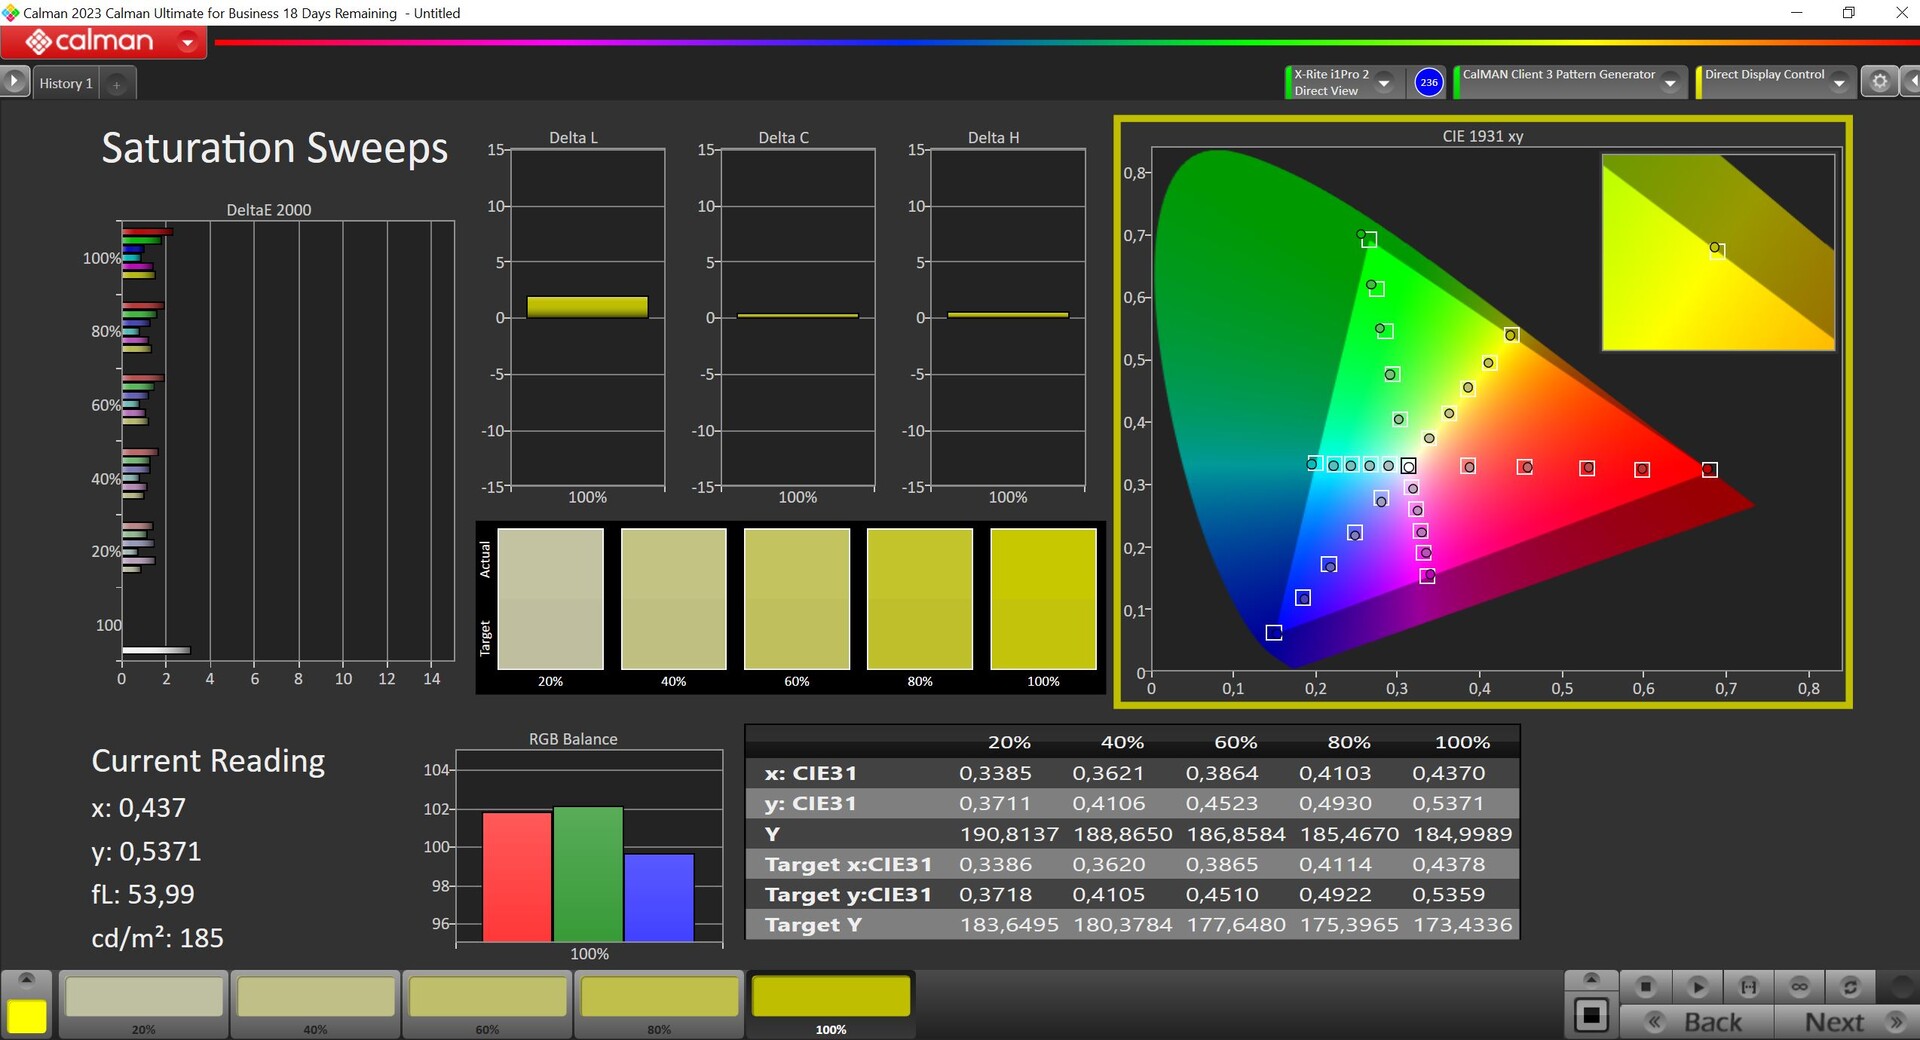
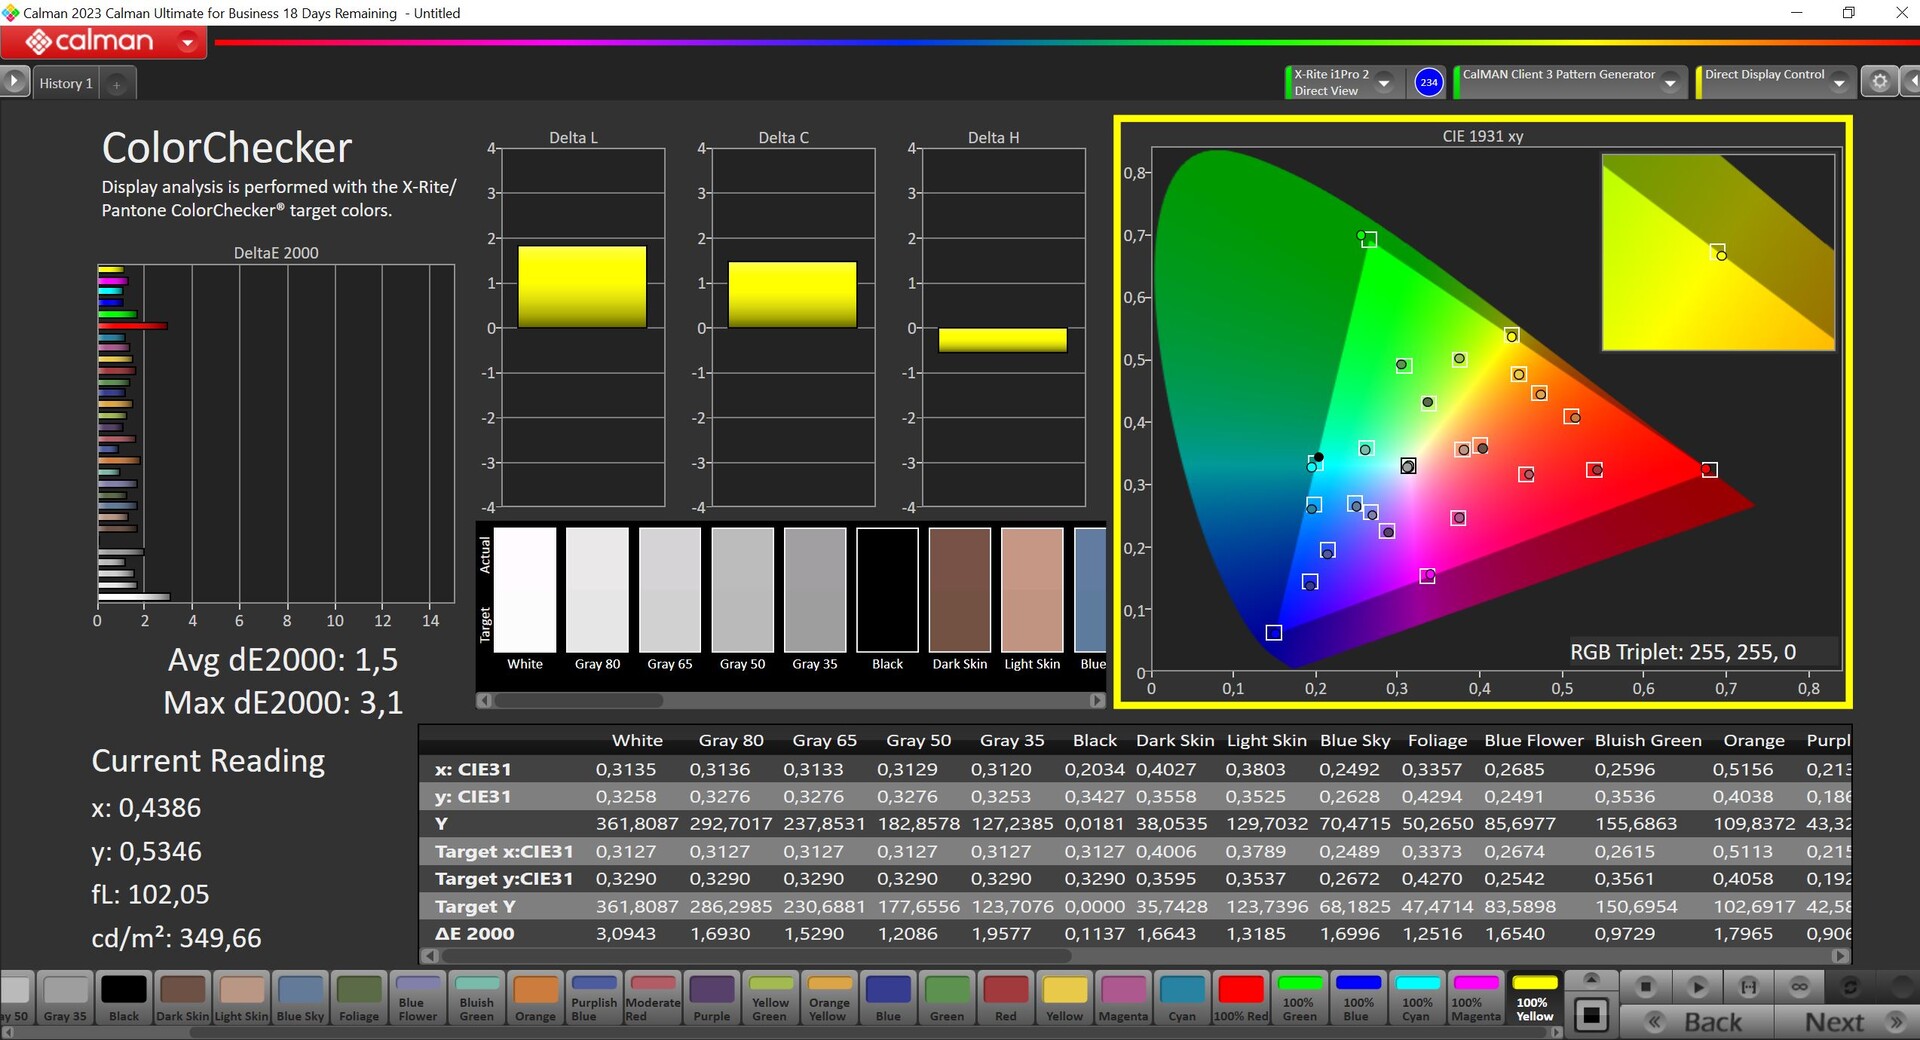
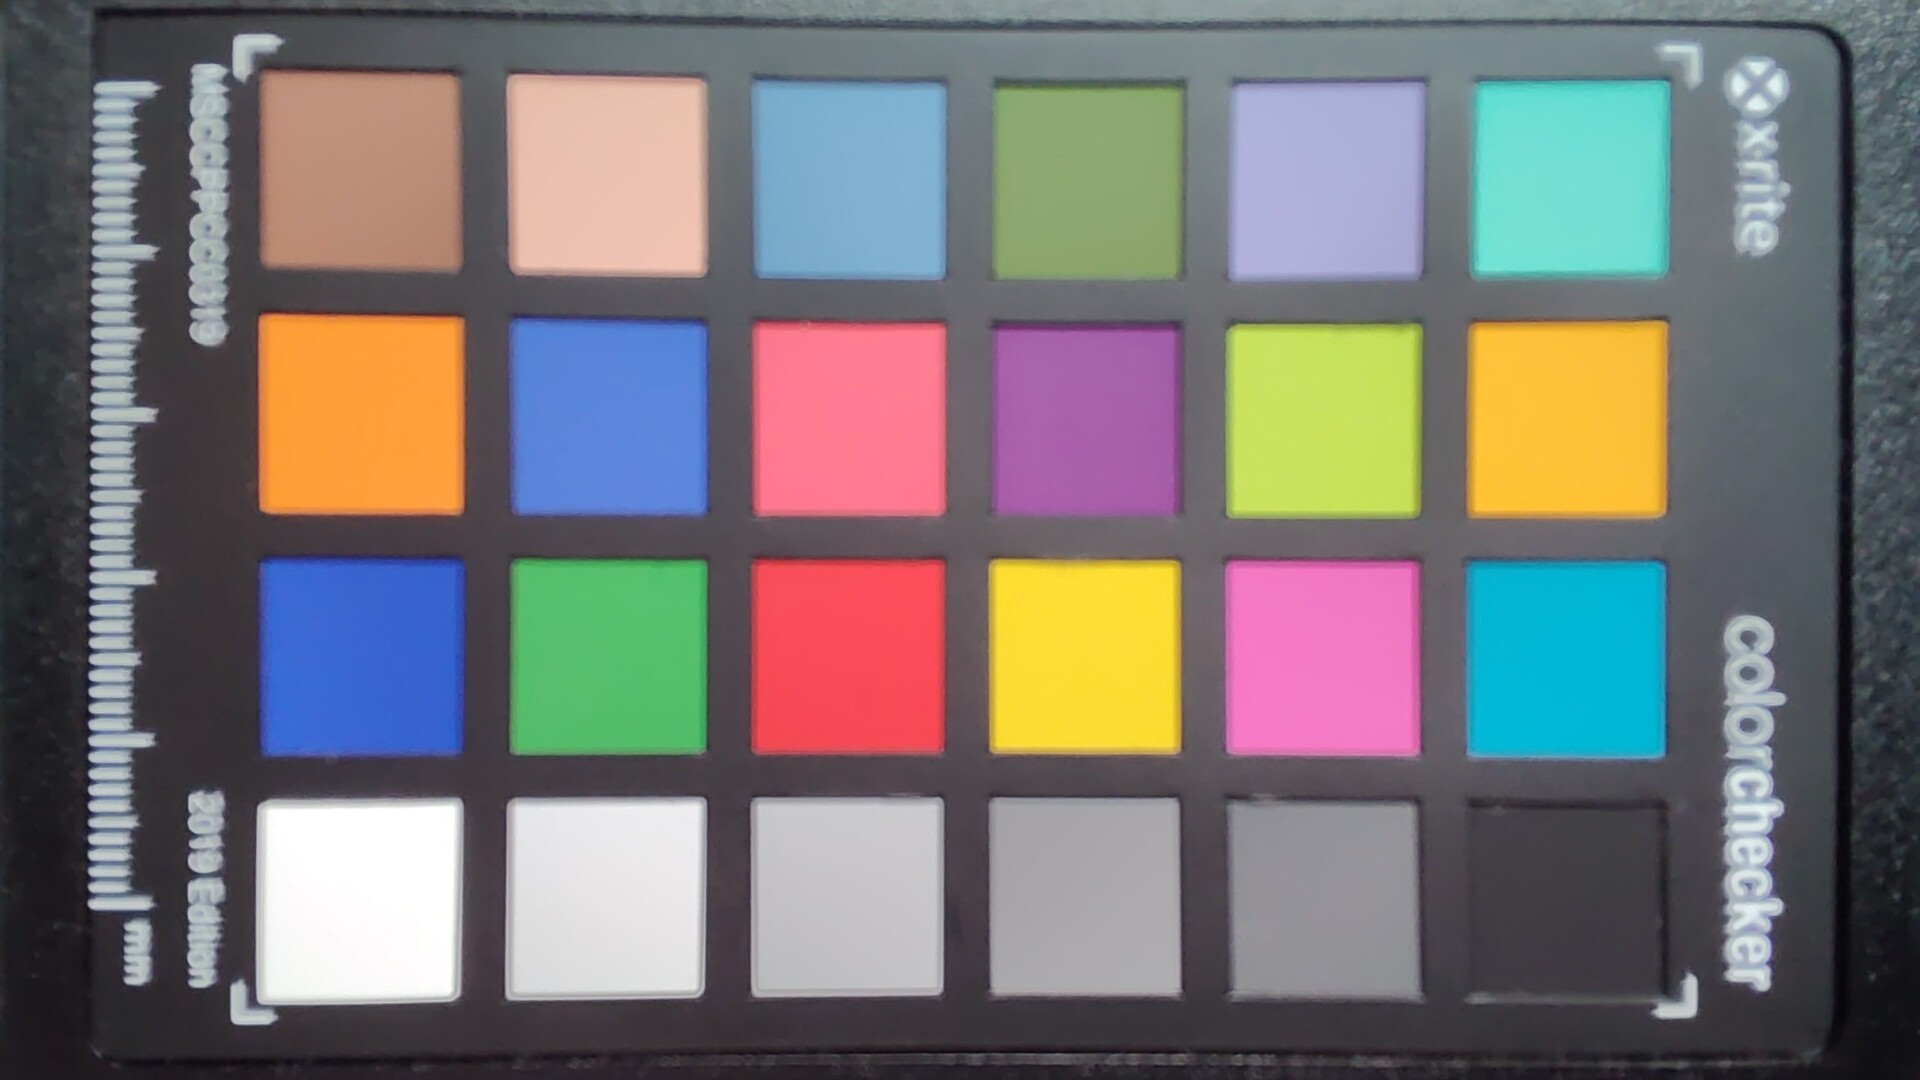
我们使用专业的 CalMAN 软件(X-Rite i1 Pro 2)对面板进行了分析,像往常一样,有多种不同的色彩配置文件可供选择。原生色彩配置文件适合日常使用,但会使色彩过度饱和。因此,要获得最准确的色彩描绘,您应该选择显示 P3 配置文件。如果你喜欢编辑照片,还可以选择精确的 sRGB 模式。屏幕完全覆盖 sRGB 色彩空间和 P3 空间。

Display Response Times
| ↔ Response Time Black to White | ||
|---|---|---|
| 1.41 ms ... rise ↗ and fall ↘ combined | ↗ 0.76 ms rise | 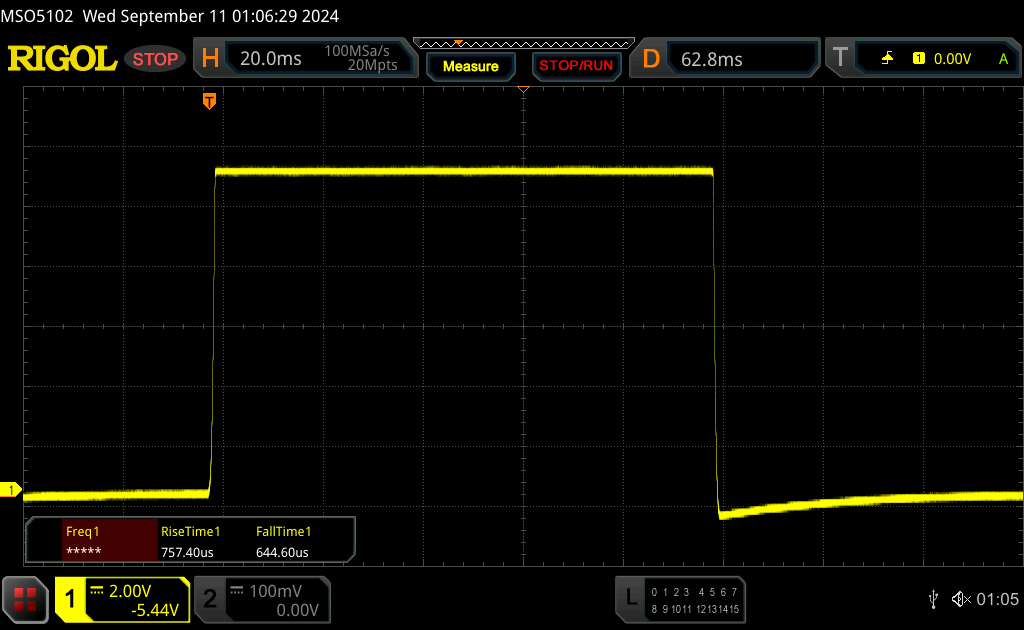 |
| ↘ 0.65 ms fall | ||
| The screen shows very fast response rates in our tests and should be very well suited for fast-paced gaming. In comparison, all tested devices range from 0.1 (minimum) to 240 (maximum) ms. » 6 % of all devices are better. This means that the measured response time is better than the average of all tested devices (20.8 ms). | ||
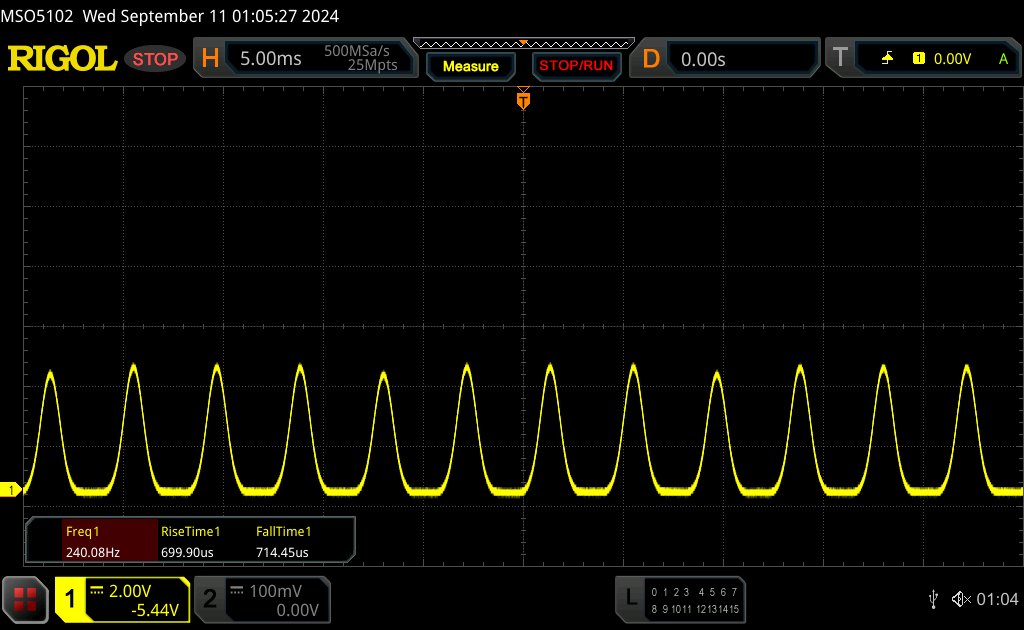
| ↔ Response Time 50% Grey to 80% Grey | ||
| 1.54 ms ... rise ↗ and fall ↘ combined | ↗ 0.83 ms rise | 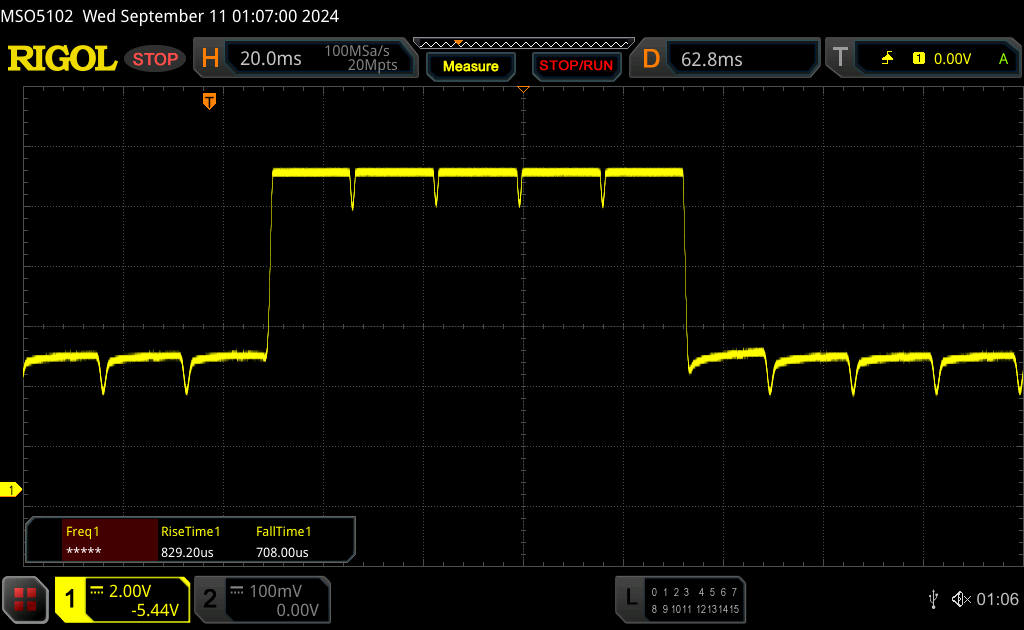 |
| ↘ 0.71 ms fall | ||
| The screen shows very fast response rates in our tests and should be very well suited for fast-paced gaming. In comparison, all tested devices range from 0.165 (minimum) to 636 (maximum) ms. » 5 % of all devices are better. This means that the measured response time is better than the average of all tested devices (32.5 ms). | ||
Screen Flickering / PWM (Pulse-Width Modulation)
| Screen flickering / PWM detected | 240 Hz Amplitude: 67 % | ≤ 50 % brightness setting | 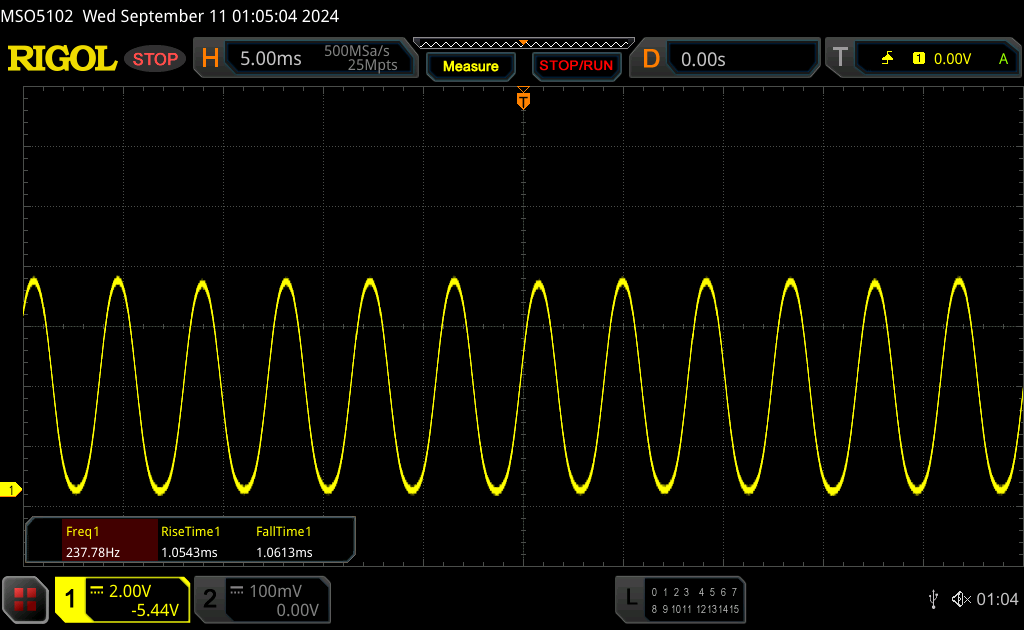 |
The display backlight flickers at 240 Hz (worst case, e.g., utilizing PWM) Flickering detected at a brightness setting of 50 % and below. There should be no flickering or PWM above this brightness setting. The frequency of 240 Hz is relatively low, so sensitive users will likely notice flickering and experience eyestrain at the stated brightness setting and below. In comparison: 53 % of all tested devices do not use PWM to dim the display. If PWM was detected, an average of 8516 (minimum: 5 - maximum: 343500) Hz was measured. | |||
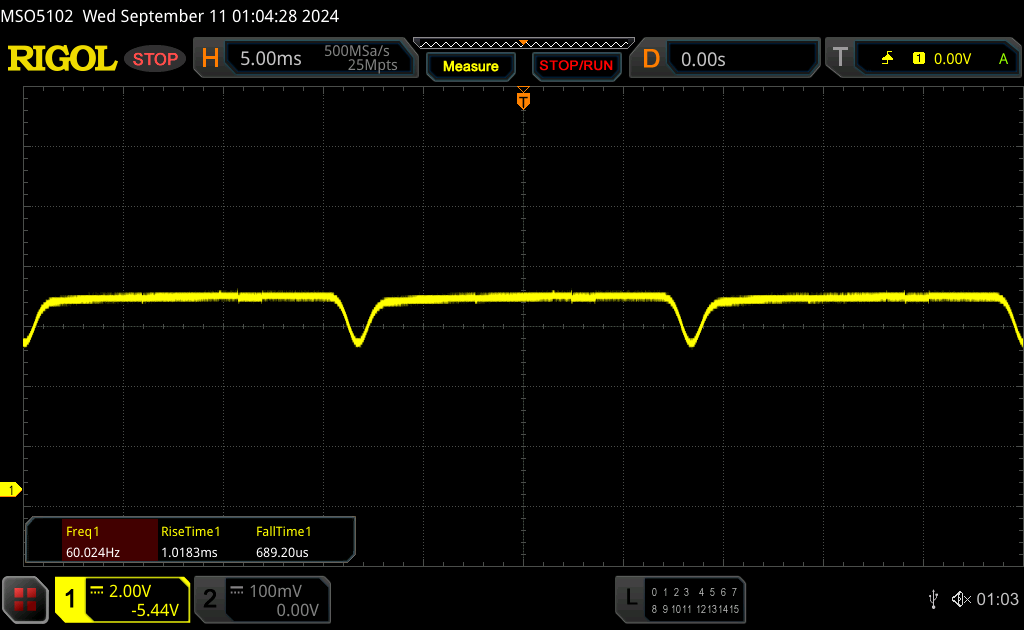
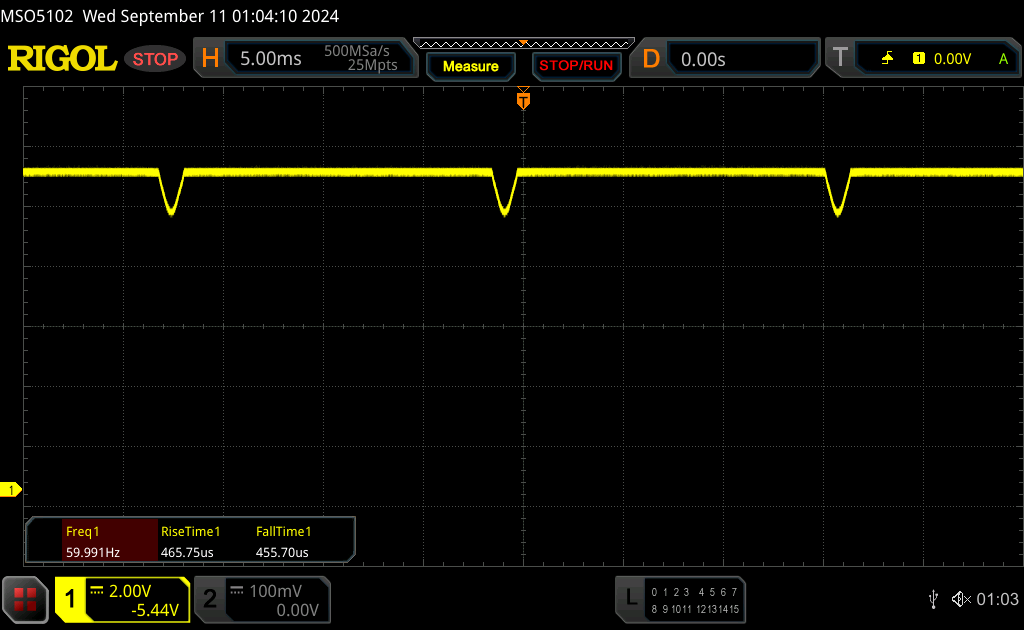
OLED 面板采用 60 赫兹直流调光,亮度可达 50%。在这种情况下,振幅非常小,因此在使用过程中不会出现问题。亮度低于 50%时,则采用 240 Hz 的常规 PWM 闪烁,振幅明显更大,可能对人体造成更严重的伤害。华硕提供了 "无闪烁 OLED 调光 "功能,其中直流调光在低亮度水平下也能工作。
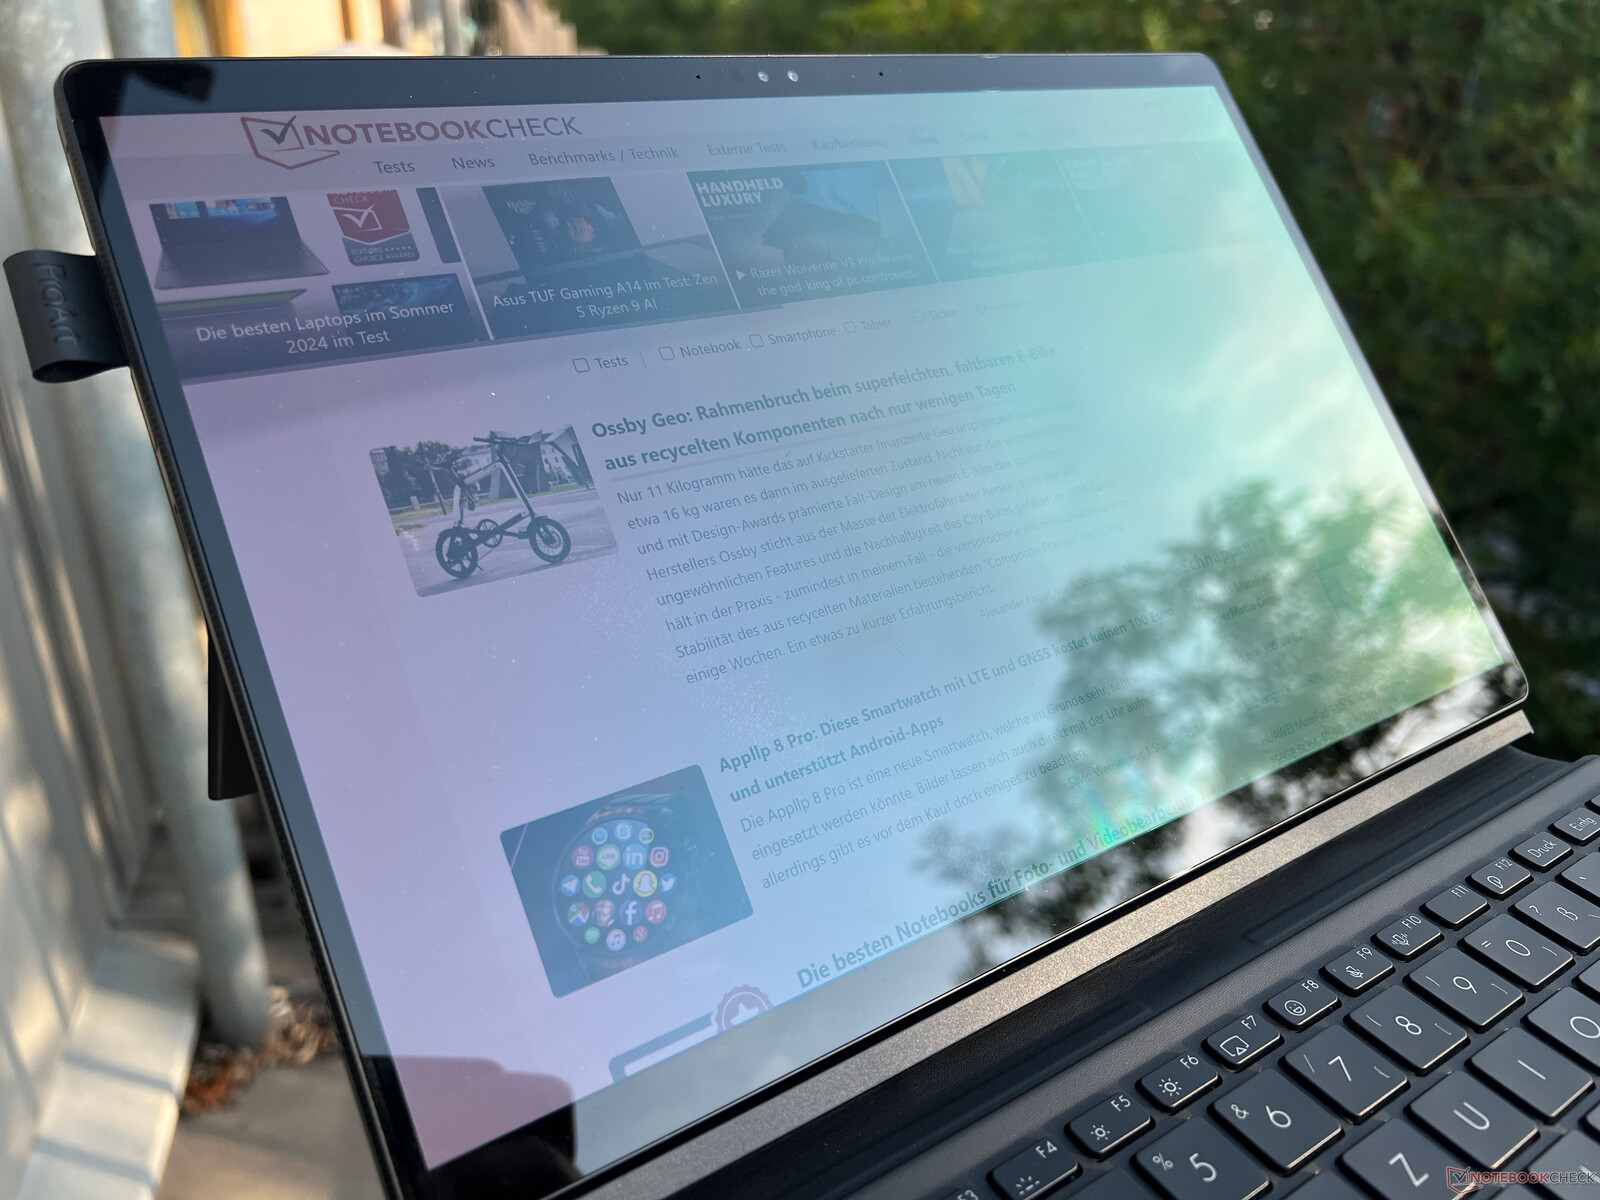
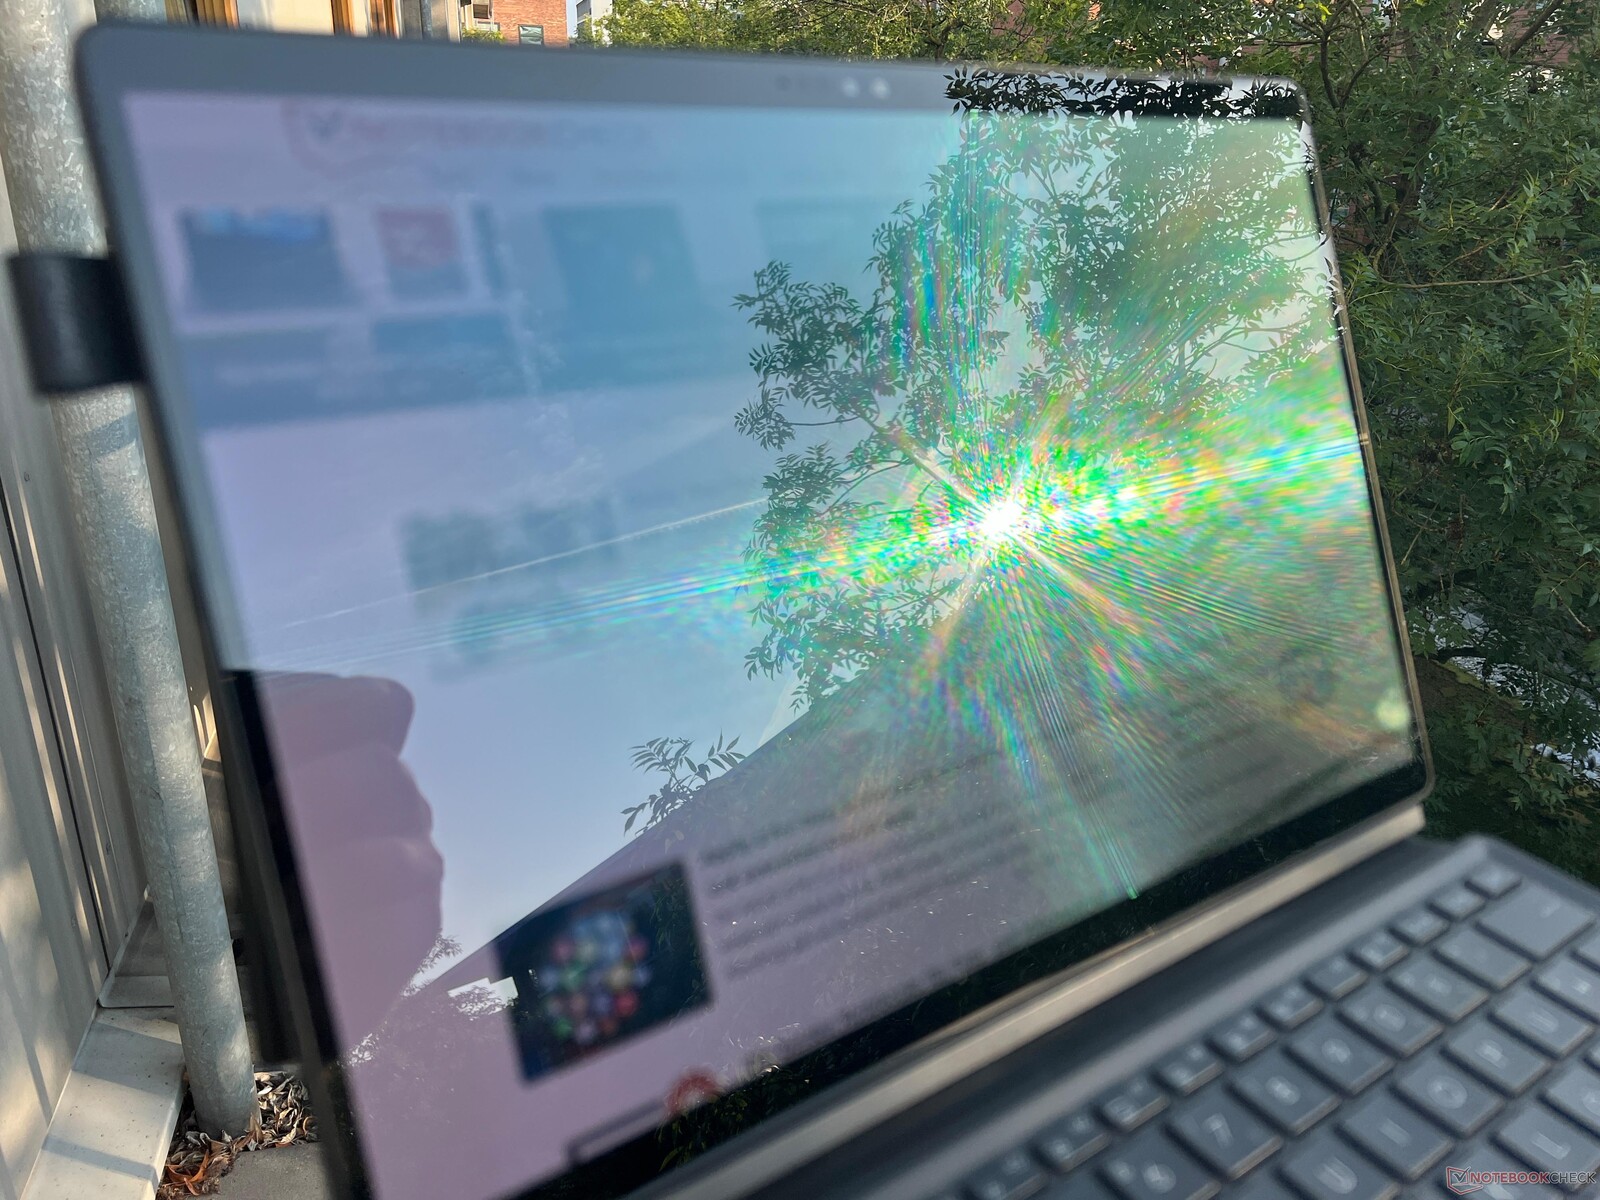
在室外,闪亮的触摸屏反光会成为一个问题,因此应尽量避免光源直射身后。除了在广角时会有轻微的蓝色光泽(OLED 的正常现象)外,其视角稳定性非常好。

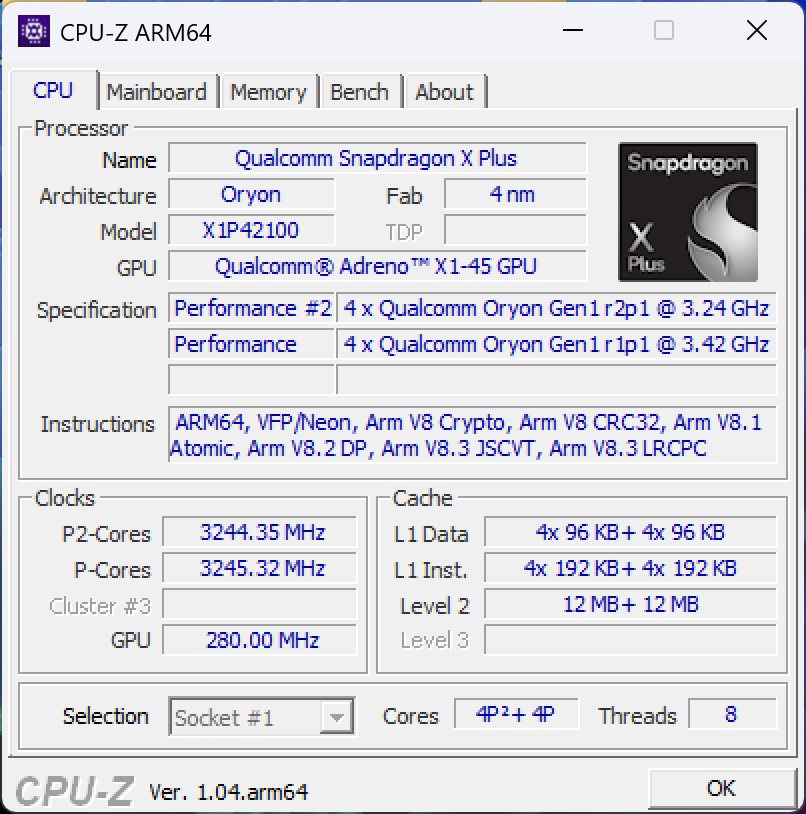
性能 - Snapdragon X Plus
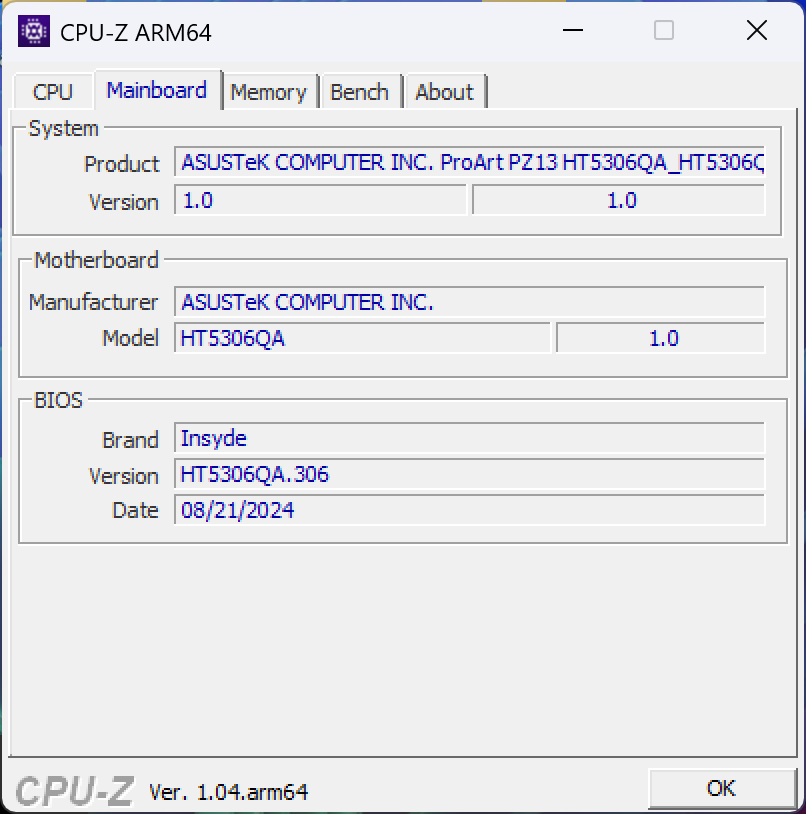
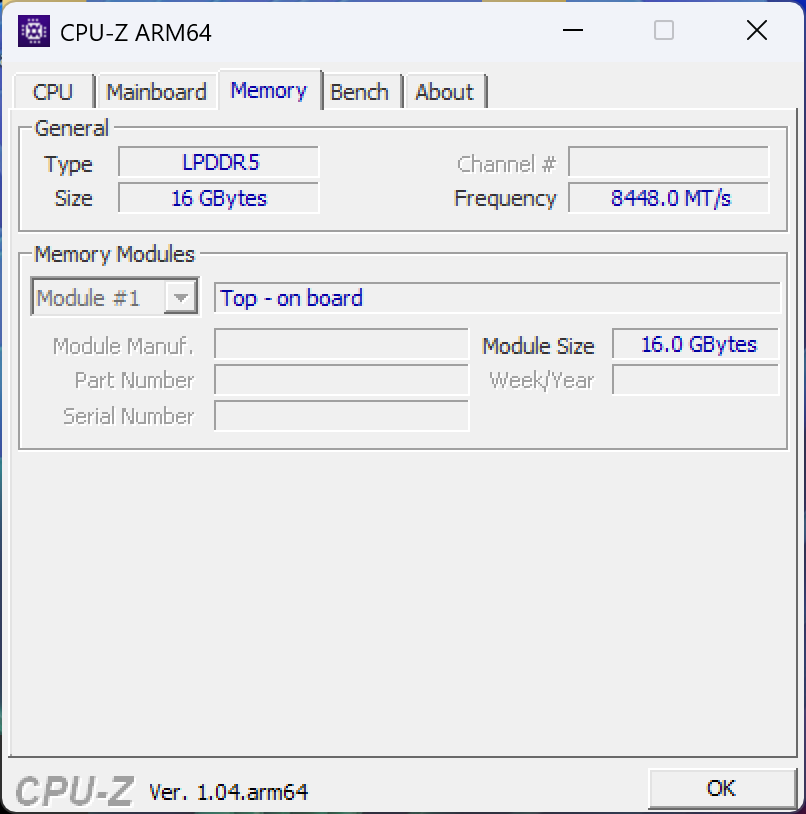
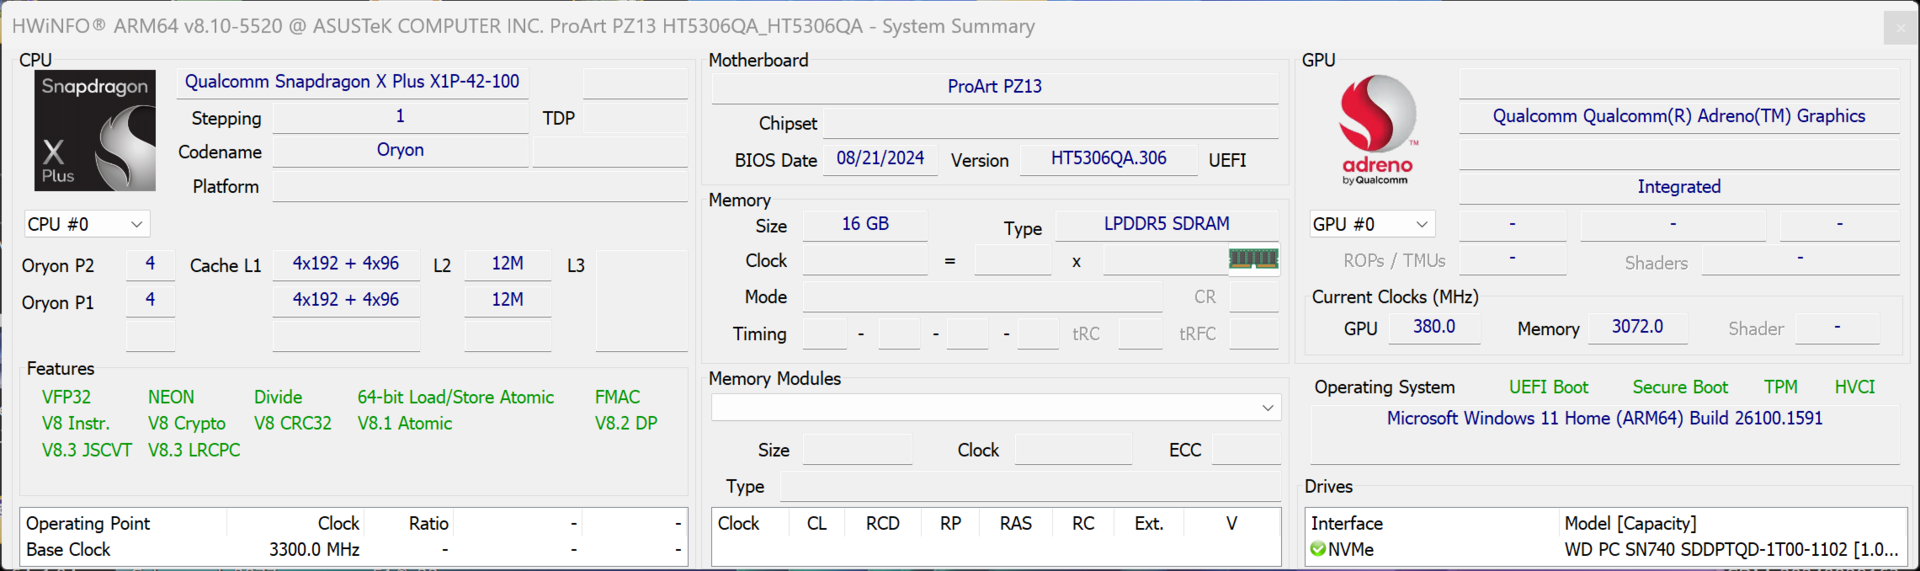
ProArt PZ13 只有一种配置。新的 8 核骁龙 X Plus 与无法升级的 16 GB 内存(LPDDR5x-8448)相结合。
测试条件
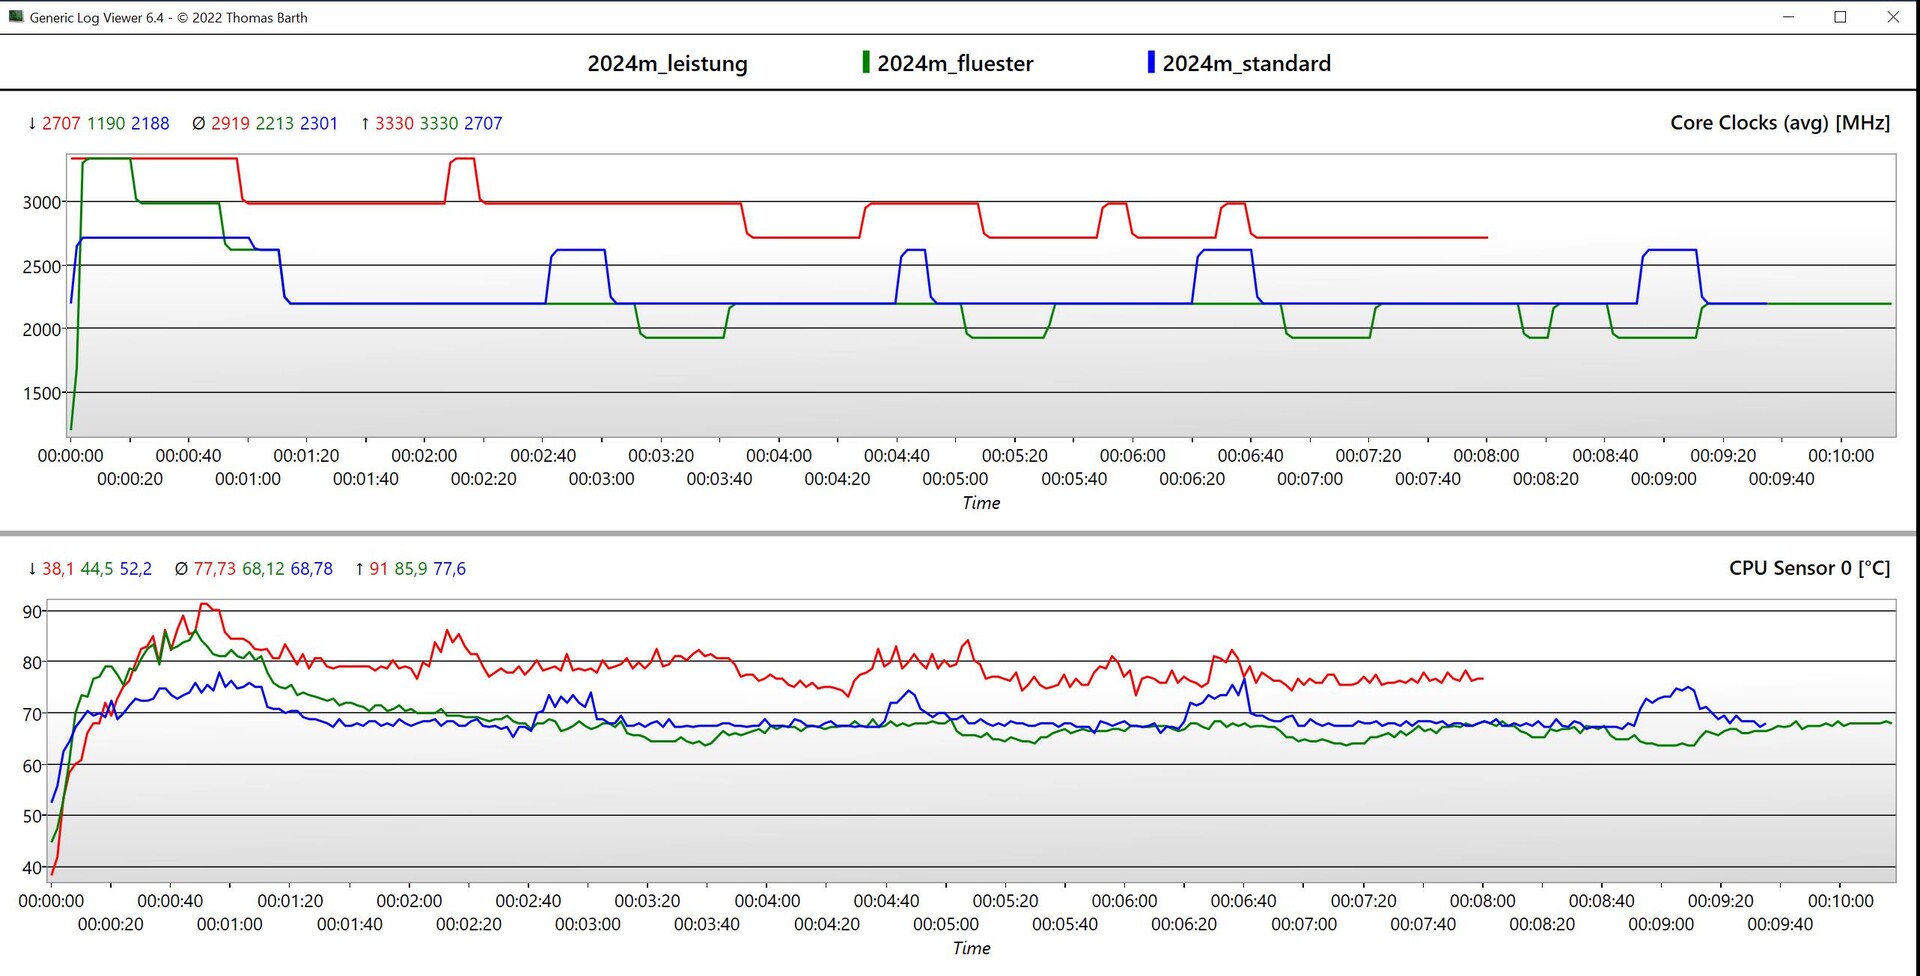
预装的 ProArt Creator 集线器共有三种风扇配置文件:低声、标准 和 高性能。下表提供了不同配置文件的概览。我们无法获得准确的 TDP 值,但根据配置文件的不同,SoC 的功耗应在 15-25 瓦之间。
| 风扇配置文件 | Cinebench 2024 Multi | 3DMark Steel Nomad Light | 最大风扇噪音排放 |
|---|---|---|---|
| Whisper | 534 分 | 1,145 分 | 30.6 dB(A) |
| 标准 | 556 分 | 1,148 分 | 40 dB(A) |
| 性能 | 685 分 | 1,151 分 | 44.8 dB(A) |
我们使用模式标准进行了基准测试和测量。风扇配置文件性能在电池运行时不可用。
处理器 - X1P-42-100
ProArt PZ13 配备了全新的 8 核骁龙 X Plus (X1P-42-100),我们最近已经在 华硕 Vivobook S 15.它是目前高通公司骁龙 X 系列中速度最慢的芯片。这款 ARM 处理器有 8 个内核,最高主频为 3.2 GHz,单核涡轮增压主频为 3.4 GHz。更多技术细节请参阅我们的 分析文章。
总体而言,它的单核性能与小型骁龙 X Elite(X1E-78-100)等更昂贵的骁龙机型相当,总体表现相当不错。Surface Pro OLED Surface Pro OLED采用 X1E-80-100(主频提升 4GHz)的 Surface Pro OLED 则快 14-21%,具体取决于测试结果和Apple 的被动冷却 M4 SoC。 iPad Pro在 Geekbench 单项测试中,iPad Pro 的被动散热 M4 SoC 比其高出 58%,这完全是两个不同的级别。
在多核测试中,ProArt PZ13 只能排在最后一位,但对于大多数应用来说,这已经足够了。下图显示了不同风扇配置文件的时钟频率。在性能模式下,它的平均时钟频率为 2.9 GHz;在标准模式下,我们测得的时钟频率为 2.3 GHz;在耳语模式下,它的时钟频率为 2.2 GHz。
| Cinebench 2024 / CPU Multi Core | |
| Microsoft Surface Pro OLED Copilot+ | |
| Microsoft Surface Pro Copilot+ | |
| Minisforum V3 | |
| Asus ProArt PZ13 HT5306 | |
| Cinebench 2024 / CPU Single Core | |
| Microsoft Surface Pro OLED Copilot+ | |
| Microsoft Surface Pro Copilot+ | |
| Asus ProArt PZ13 HT5306 | |
| Minisforum V3 | |
| Geekbench 6.4 / Multi-Core | |
| Apple iPad Pro 13 2024 | |
| Microsoft Surface Pro OLED Copilot+ | |
| Microsoft Surface Pro Copilot+ | |
| Minisforum V3 | |
| Asus ProArt PZ13 HT5306 | |
| Geekbench 6.4 / Single-Core | |
| Apple iPad Pro 13 2024 | |
| Microsoft Surface Pro OLED Copilot+ | |
| Minisforum V3 | |
| Microsoft Surface Pro Copilot+ | |
| Asus ProArt PZ13 HT5306 | |
除了本机测试外,我们还进行了所有常用的 CPU 基准测试,但这些测试都必须在 Snapdragon 设备上进行模拟。这样做的代价是性能下降,这就是为什么 PZ13 在对比表中排名垫底的原因。此外,它的多核性能并不稳定,必须面对约 25% 的不足。在电池工作状态下,其性能没有进一步下降。更多 CPU 基准测试可在 我们的技术部分。
Cinebench R15 Multi continuous test
Cinebench R23: Multi Core | Single Core
Cinebench R20: CPU (Multi Core) | CPU (Single Core)
Cinebench R15: CPU Multi 64Bit | CPU Single 64Bit
Blender: v2.79 BMW27 CPU
7-Zip 18.03: 7z b 4 | 7z b 4 -mmt1
HWBOT x265 Benchmark v2.2: 4k Preset
LibreOffice : 20 Documents To PDF
R Benchmark 2.5: Overall mean
| CPU Performance Rating | |
| Asus ROG Flow Z13 GZ301V | |
| Minisforum V3 | |
| Average of class Convertible | |
| Microsoft Surface Pro OLED Copilot+ | |
| Microsoft Surface Pro Copilot+ | |
| Average Qualcomm Snapdragon X Plus X1P-42-100 | |
| Asus ProArt PZ13 HT5306 | |
| Cinebench R23 / Multi Core | |
| Asus ROG Flow Z13 GZ301V | |
| Minisforum V3 | |
| Average of class Convertible (2949 - 29063, n=64, last 2 years) | |
| Microsoft Surface Pro OLED Copilot+ | |
| Microsoft Surface Pro Copilot+ | |
| Average Qualcomm Snapdragon X Plus X1P-42-100 (6442 - 8284, n=5) | |
| Asus ProArt PZ13 HT5306 | |
| Cinebench R23 / Single Core | |
| Asus ROG Flow Z13 GZ301V | |
| Minisforum V3 | |
| Average of class Convertible (914 - 2163, n=64, last 2 years) | |
| Microsoft Surface Pro OLED Copilot+ | |
| Microsoft Surface Pro Copilot+ | |
| Average Qualcomm Snapdragon X Plus X1P-42-100 (1104 - 1128, n=5) | |
| Asus ProArt PZ13 HT5306 | |
| Cinebench R20 / CPU (Multi Core) | |
| Asus ROG Flow Z13 GZ301V | |
| Minisforum V3 | |
| Average of class Convertible (1124 - 11357, n=63, last 2 years) | |
| Microsoft Surface Pro OLED Copilot+ | |
| Microsoft Surface Pro Copilot+ | |
| Average Qualcomm Snapdragon X Plus X1P-42-100 (2361 - 3097, n=5) | |
| Asus ProArt PZ13 HT5306 | |
| Cinebench R20 / CPU (Single Core) | |
| Asus ROG Flow Z13 GZ301V | |
| Minisforum V3 | |
| Average of class Convertible (348 - 827, n=63, last 2 years) | |
| Microsoft Surface Pro OLED Copilot+ | |
| Microsoft Surface Pro Copilot+ | |
| Average Qualcomm Snapdragon X Plus X1P-42-100 (406 - 425, n=5) | |
| Asus ProArt PZ13 HT5306 | |
| Cinebench R15 / CPU Multi 64Bit | |
| Asus ROG Flow Z13 GZ301V | |
| Microsoft Surface Pro OLED Copilot+ | |
| Minisforum V3 | |
| Microsoft Surface Pro Copilot+ | |
| Average of class Convertible (478 - 4830, n=66, last 2 years) | |
| Average Qualcomm Snapdragon X Plus X1P-42-100 (1383 - 1556, n=5) | |
| Asus ProArt PZ13 HT5306 | |
| Cinebench R15 / CPU Single 64Bit | |
| Asus ROG Flow Z13 GZ301V | |
| Minisforum V3 | |
| Microsoft Surface Pro OLED Copilot+ | |
| Average of class Convertible (149.8 - 317, n=63, last 2 years) | |
| Average Qualcomm Snapdragon X Plus X1P-42-100 (207 - 215, n=5) | |
| Microsoft Surface Pro Copilot+ | |
| Asus ProArt PZ13 HT5306 | |
| Blender / v2.79 BMW27 CPU | |
| Asus ProArt PZ13 HT5306 | |
| Average Qualcomm Snapdragon X Plus X1P-42-100 (399 - 571, n=5) | |
| Microsoft Surface Pro Copilot+ | |
| Average of class Convertible (107 - 1051, n=61, last 2 years) | |
| Microsoft Surface Pro OLED Copilot+ | |
| Minisforum V3 | |
| Asus ROG Flow Z13 GZ301V | |
| 7-Zip 18.03 / 7z b 4 | |
| Asus ROG Flow Z13 GZ301V | |
| Minisforum V3 | |
| Microsoft Surface Pro OLED Copilot+ | |
| Average of class Convertible (12977 - 121368, n=63, last 2 years) | |
| Microsoft Surface Pro Copilot+ | |
| Asus ProArt PZ13 HT5306 | |
| Average Qualcomm Snapdragon X Plus X1P-42-100 (29238 - 32811, n=5) | |
| 7-Zip 18.03 / 7z b 4 -mmt1 | |
| Asus ROG Flow Z13 GZ301V | |
| Minisforum V3 | |
| Microsoft Surface Pro OLED Copilot+ | |
| Average of class Convertible (3672 - 6540, n=63, last 2 years) | |
| Microsoft Surface Pro Copilot+ | |
| Asus ProArt PZ13 HT5306 | |
| Average Qualcomm Snapdragon X Plus X1P-42-100 (4087 - 4675, n=5) | |
| HWBOT x265 Benchmark v2.2 / 4k Preset | |
| Asus ROG Flow Z13 GZ301V | |
| Minisforum V3 | |
| Average of class Convertible (3.43 - 36.2, n=63, last 2 years) | |
| Microsoft Surface Pro OLED Copilot+ | |
| Microsoft Surface Pro Copilot+ | |
| Average Qualcomm Snapdragon X Plus X1P-42-100 (4.6 - 6.02, n=5) | |
| Asus ProArt PZ13 HT5306 | |
| LibreOffice / 20 Documents To PDF | |
| Asus ProArt PZ13 HT5306 | |
| Average Qualcomm Snapdragon X Plus X1P-42-100 (55.3 - 62.7, n=5) | |
| Microsoft Surface Pro Copilot+ | |
| Minisforum V3 | |
| Microsoft Surface Pro OLED Copilot+ | |
| Average of class Convertible (42.7 - 84.3, n=62, last 2 years) | |
| Asus ROG Flow Z13 GZ301V | |
| R Benchmark 2.5 / Overall mean | |
| Average Qualcomm Snapdragon X Plus X1P-42-100 (0.728 - 0.774, n=5) | |
| Microsoft Surface Pro Copilot+ | |
| Asus ProArt PZ13 HT5306 | |
| Microsoft Surface Pro OLED Copilot+ | |
| Average of class Convertible (0.3985 - 0.84, n=62, last 2 years) | |
| Minisforum V3 | |
| Asus ROG Flow Z13 GZ301V | |
* ... smaller is better
AIDA64: FP32 Ray-Trace | FPU Julia | CPU SHA3 | CPU Queen | FPU SinJulia | FPU Mandel | CPU AES | CPU ZLib | FP64 Ray-Trace | CPU PhotoWorxx
| Performance Rating | |
| Minisforum V3 | |
| Asus ROG Flow Z13 GZ301V | |
| Average of class Convertible | |
| Microsoft Surface Pro OLED Copilot+ | |
| Microsoft Surface Pro Copilot+ | |
| Average Qualcomm Snapdragon X Plus X1P-42-100 | |
| Asus ProArt PZ13 HT5306 | |
| AIDA64 / FP32 Ray-Trace | |
| Minisforum V3 | |
| Asus ROG Flow Z13 GZ301V | |
| Average of class Convertible (2179 - 64158, n=64, last 2 years) | |
| Microsoft Surface Pro Copilot+ | |
| Average Qualcomm Snapdragon X Plus X1P-42-100 (4739 - 6185, n=5) | |
| Asus ProArt PZ13 HT5306 | |
| Microsoft Surface Pro OLED Copilot+ | |
| AIDA64 / FPU Julia | |
| Minisforum V3 | |
| Asus ROG Flow Z13 GZ301V | |
| Average of class Convertible (11392 - 183760, n=63, last 2 years) | |
| Average Qualcomm Snapdragon X Plus X1P-42-100 (14528 - 17585, n=5) | |
| Asus ProArt PZ13 HT5306 | |
| Microsoft Surface Pro OLED Copilot+ | |
| Microsoft Surface Pro Copilot+ | |
| AIDA64 / CPU SHA3 | |
| Minisforum V3 | |
| Asus ROG Flow Z13 GZ301V | |
| Average of class Convertible (797 - 8151, n=63, last 2 years) | |
| Microsoft Surface Pro OLED Copilot+ | |
| Average Qualcomm Snapdragon X Plus X1P-42-100 (2191 - 2614, n=5) | |
| Asus ProArt PZ13 HT5306 | |
| Microsoft Surface Pro Copilot+ | |
| AIDA64 / CPU Queen | |
| Asus ROG Flow Z13 GZ301V | |
| Minisforum V3 | |
| Microsoft Surface Pro OLED Copilot+ | |
| Average of class Convertible (22413 - 145339, n=63, last 2 years) | |
| Microsoft Surface Pro Copilot+ | |
| Average Qualcomm Snapdragon X Plus X1P-42-100 (44346 - 48532, n=5) | |
| Asus ProArt PZ13 HT5306 | |
| AIDA64 / FPU SinJulia | |
| Minisforum V3 | |
| Asus ROG Flow Z13 GZ301V | |
| Average of class Convertible (1120 - 29155, n=63, last 2 years) | |
| Microsoft Surface Pro OLED Copilot+ | |
| Microsoft Surface Pro Copilot+ | |
| Average Qualcomm Snapdragon X Plus X1P-42-100 (1240 - 1502, n=5) | |
| Asus ProArt PZ13 HT5306 | |
| AIDA64 / FPU Mandel | |
| Minisforum V3 | |
| Asus ROG Flow Z13 GZ301V | |
| Average of class Convertible (5749 - 97193, n=63, last 2 years) | |
| Microsoft Surface Pro OLED Copilot+ | |
| Microsoft Surface Pro Copilot+ | |
| Average Qualcomm Snapdragon X Plus X1P-42-100 (8416 - 9929, n=5) | |
| Asus ProArt PZ13 HT5306 | |
| AIDA64 / CPU AES | |
| Asus ROG Flow Z13 GZ301V | |
| Microsoft Surface Pro OLED Copilot+ | |
| Minisforum V3 | |
| Microsoft Surface Pro Copilot+ | |
| Average of class Convertible (21774 - 169089, n=63, last 2 years) | |
| Average Qualcomm Snapdragon X Plus X1P-42-100 (37646 - 45232, n=5) | |
| Asus ProArt PZ13 HT5306 | |
| AIDA64 / CPU ZLib | |
| Asus ROG Flow Z13 GZ301V | |
| Minisforum V3 | |
| Microsoft Surface Pro OLED Copilot+ | |
| Average of class Convertible (218 - 2001, n=63, last 2 years) | |
| Microsoft Surface Pro Copilot+ | |
| Average Qualcomm Snapdragon X Plus X1P-42-100 (478 - 521, n=5) | |
| Asus ProArt PZ13 HT5306 | |
| AIDA64 / FP64 Ray-Trace | |
| Minisforum V3 | |
| Asus ROG Flow Z13 GZ301V | |
| Average of class Convertible (1169 - 34297, n=63, last 2 years) | |
| Microsoft Surface Pro OLED Copilot+ | |
| Average Qualcomm Snapdragon X Plus X1P-42-100 (2262 - 3399, n=5) | |
| Microsoft Surface Pro Copilot+ | |
| Asus ProArt PZ13 HT5306 | |
| AIDA64 / CPU PhotoWorxx | |
| Asus ROG Flow Z13 GZ301V | |
| Average of class Convertible (13761 - 81626, n=63, last 2 years) | |
| Microsoft Surface Pro OLED Copilot+ | |
| Minisforum V3 | |
| Microsoft Surface Pro Copilot+ | |
| Average Qualcomm Snapdragon X Plus X1P-42-100 (31839 - 32139, n=5) | |
| Asus ProArt PZ13 HT5306 | |
系统性能
总而言之,Windows 在 ARM 处理器上运行得非常好,尤其是在使用本地应用程序时,日常使用中不会遇到任何问题。例如,在 IFA 期间,这款可折叠的笔记本电脑就是我们的好伙伴,我们可以完成所有需要做的事情,包括运行 Capture One 和 Adobe Photoshop。即便如此,在购买这款设备之前,你也应该知道它的性能储备是有限的。
除了本地应用程序,您可能还会遇到一些兼容性问题。在最好的情况下,X86 应用程序可以被模拟,这只是以牺牲少量性能为代价。不过,也有可能因为缺少相应的驱动程序,应用程序根本无法启动或配件无法使用。您应该事先了解所需的应用程序是否有 ARM 版本。高通公司本身有一个信息网站微软发表了一篇博客文章博客文章,强调了 ARM 系统带来的限制。
WebXPRT 3: Overall
WebXPRT 4: Overall
Mozilla Kraken 1.1: Total
| CrossMark / Overall | |
| Asus ROG Flow Z13 GZ301V | |
| Apple iPad Pro 13 2024 | |
| Minisforum V3 | |
| Average of class Convertible (524 - 2274, n=63, last 2 years) | |
| Microsoft Surface Pro OLED Copilot+ | |
| Microsoft Surface Pro Copilot+ | |
| Average Qualcomm Snapdragon X Plus X1P-42-100, Qualcomm SD X Adreno X1-45 1.7 TFLOPS (1122 - 1463, n=5) | |
| Asus ProArt PZ13 HT5306 | |
| CrossMark / Productivity | |
| Asus ROG Flow Z13 GZ301V | |
| Apple iPad Pro 13 2024 | |
| Minisforum V3 | |
| Average of class Convertible (554 - 1925, n=63, last 2 years) | |
| Microsoft Surface Pro OLED Copilot+ | |
| Average Qualcomm Snapdragon X Plus X1P-42-100, Qualcomm SD X Adreno X1-45 1.7 TFLOPS (1071 - 1284, n=5) | |
| Microsoft Surface Pro Copilot+ | |
| Asus ProArt PZ13 HT5306 | |
| CrossMark / Creativity | |
| Apple iPad Pro 13 2024 | |
| Asus ROG Flow Z13 GZ301V | |
| Minisforum V3 | |
| Average of class Convertible (550 - 2949, n=63, last 2 years) | |
| Microsoft Surface Pro OLED Copilot+ | |
| Microsoft Surface Pro Copilot+ | |
| Average Qualcomm Snapdragon X Plus X1P-42-100, Qualcomm SD X Adreno X1-45 1.7 TFLOPS (1205 - 1630, n=5) | |
| Asus ProArt PZ13 HT5306 | |
| CrossMark / Responsiveness | |
| Asus ROG Flow Z13 GZ301V | |
| Microsoft Surface Pro OLED Copilot+ | |
| Apple iPad Pro 13 2024 | |
| Minisforum V3 | |
| Average of class Convertible (381 - 1868, n=63, last 2 years) | |
| Average Qualcomm Snapdragon X Plus X1P-42-100, Qualcomm SD X Adreno X1-45 1.7 TFLOPS (1041 - 1563, n=5) | |
| Asus ProArt PZ13 HT5306 | |
| Microsoft Surface Pro Copilot+ | |
| WebXPRT 3 / Overall | |
| Microsoft Surface Pro OLED Copilot+ | |
| Apple iPad Pro 13 2024 | |
| Asus ProArt PZ13 HT5306 | |
| Microsoft Surface Pro Copilot+ | |
| Average Qualcomm Snapdragon X Plus X1P-42-100, Qualcomm SD X Adreno X1-45 1.7 TFLOPS (129.9 - 426, n=5) | |
| Minisforum V3 | |
| Average of class Convertible (171 - 426, n=66, last 2 years) | |
| WebXPRT 4 / Overall | |
| Apple iPad Pro 13 2024 | |
| Microsoft Surface Pro OLED Copilot+ | |
| Asus ROG Flow Z13 GZ301V | |
| Asus ProArt PZ13 HT5306 | |
| Microsoft Surface Pro Copilot+ | |
| Average Qualcomm Snapdragon X Plus X1P-42-100, Qualcomm SD X Adreno X1-45 1.7 TFLOPS (130.3 - 284, n=5) | |
| Minisforum V3 | |
| Average of class Convertible (91.2 - 317, n=62, last 2 years) | |
| Mozilla Kraken 1.1 / Total | |
| Average Qualcomm Snapdragon X Plus X1P-42-100, Qualcomm SD X Adreno X1-45 1.7 TFLOPS (468 - 1145, n=5) | |
| Average of class Convertible (407 - 1089, n=66, last 2 years) | |
| Minisforum V3 | |
| Asus ProArt PZ13 HT5306 | |
| Asus ROG Flow Z13 GZ301V | |
| Microsoft Surface Pro Copilot+ | |
| Microsoft Surface Pro OLED Copilot+ | |
| Apple iPad Pro 13 2024 | |
* ... smaller is better
| AIDA64 / Memory Copy | |
| Average of class Convertible (29473 - 158525, n=63, last 2 years) | |
| Asus ROG Flow Z13 GZ301V | |
| Minisforum V3 | |
| Microsoft Surface Pro Copilot+ | |
| Microsoft Surface Pro OLED Copilot+ | |
| Average Qualcomm Snapdragon X Plus X1P-42-100 (61258 - 62430, n=5) | |
| Asus ProArt PZ13 HT5306 | |
| AIDA64 / Memory Read | |
| Average Qualcomm Snapdragon X Plus X1P-42-100 (123557 - 127282, n=5) | |
| Asus ProArt PZ13 HT5306 | |
| Microsoft Surface Pro Copilot+ | |
| Microsoft Surface Pro OLED Copilot+ | |
| Average of class Convertible (28905 - 126517, n=63, last 2 years) | |
| Asus ROG Flow Z13 GZ301V | |
| Minisforum V3 | |
| AIDA64 / Memory Write | |
| Minisforum V3 | |
| Asus ROG Flow Z13 GZ301V | |
| Average of class Convertible (30110 - 216896, n=63, last 2 years) | |
| Average Qualcomm Snapdragon X Plus X1P-42-100 (46128 - 47845, n=5) | |
| Asus ProArt PZ13 HT5306 | |
| Microsoft Surface Pro Copilot+ | |
| Microsoft Surface Pro OLED Copilot+ | |
| AIDA64 / Memory Latency | |
| Minisforum V3 | |
| Average of class Convertible (7.7 - 173, n=62, last 2 years) | |
| Asus ROG Flow Z13 GZ301V | |
| Microsoft Surface Pro Copilot+ | |
| Average Qualcomm Snapdragon X Plus X1P-42-100 (7 - 7.7, n=2) | |
* ... smaller is better
DPC 延迟
我们无法在骁龙平板电脑上进行延迟测试。不过,我们在播放 4K YouTube 视频时发现了一些个别的掉帧现象。
存储设备
PZ13 内置 PCIe 4.0 固态硬盘,容量为 1 TB,用户在首次启动设备后可自由使用 900 GB。西部数据 SN740 的传输速率约为 5 GB/s,性能非常出色,即使在长时间负载的情况下,我们也只测得了相对较小的波动,日常使用中应该不会注意到。更多固态硬盘基准测试 这里。

* ... smaller is better
Reading continuous performance: DiskSpd Read Loop, Queue Depth 8
图形卡 - Adreno X1-45
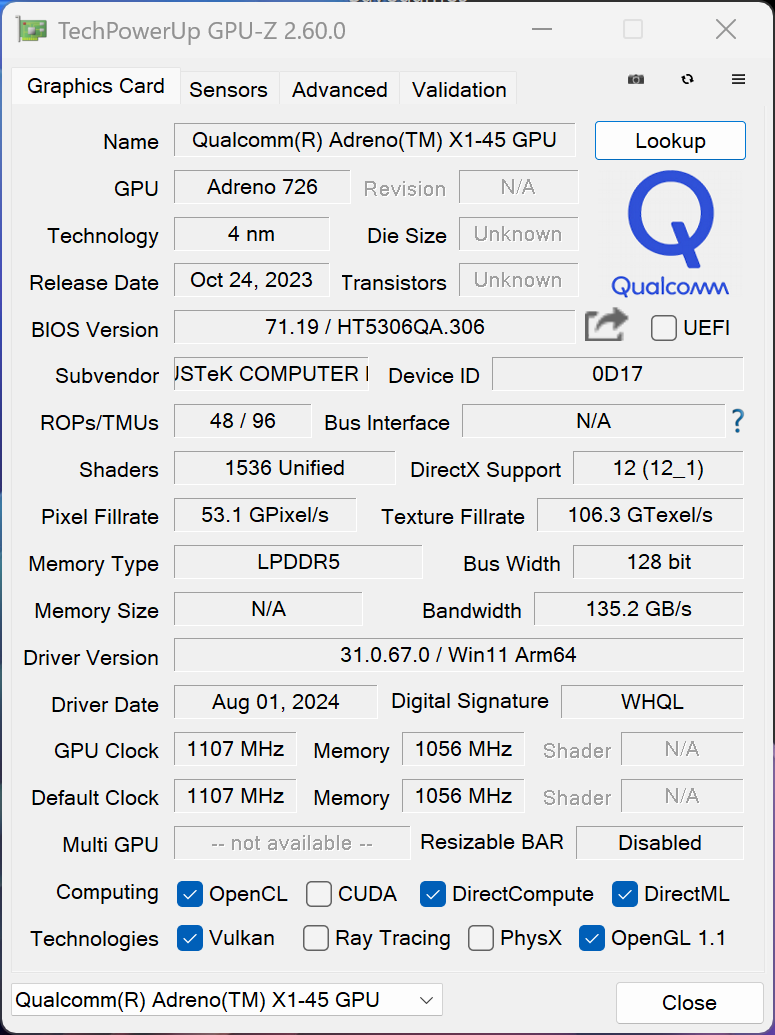
新的骁龙 X Plus 8 核机型配备了性能较弱的 Adreno X1-45有两种性能级别(2.1 或 1.7 TFLOPS)可供选择。小型 X1P-42-100 安装的是速度较慢的 1.7 TFLOPS 版本,GPU 最高时钟频率为 1.107 GHz。总体而言,其性能比 Adreno X1-85 的 3.8 TFLOPS 差 50%,在 GPU 基准测试中,X1-45 排在最后一位。比较一下:iPad iPad Pro 13的 M4 GPU 在 Steel Nomad Light 测试中(在两个系统上均可本机运行)的速度快三倍多。
那么,这对日常使用意味着什么呢?其实,一开始并没有什么意义,因为它的性能仍然足以完成基本任务,包括播放高分辨率视频。由于兼容性问题,骁龙 X Elite 芯片的游戏性能本来就是个问题,而新的骁龙 X Plus 和 X1-45 GPU 则进一步加剧了这一情况。即使是低细节的老游戏,我们有时也会遇到帧数明显下降的问题,因此在这款设备上玩游戏毫无乐趣可言。许多游戏根本无法启动。
至少,在长时间负载和电池模式下,它的图形性能仍能保持稳定。更多 GPU 基准测试请访问移动显示芯片——基准测试成绩列表 。
| 3DMark 11 Performance | 4440 points | |
| 3DMark Fire Strike Score | 3612 points | |
| 3DMark Time Spy Score | 985 points | |
| 3DMark Steel Nomad Score | 233 points | |
| 3DMark Steel Nomad Light Score | 1148 points | |
Help | ||
| Blender / v3.3 Classroom CPU | |
| Asus ProArt PZ13 HT5306 | |
| Average Qualcomm SD X Adreno X1-45 1.7 TFLOPS (711 - 1055, n=6) | |
| Microsoft Surface Pro Copilot+ | |
| Average of class Convertible (163 - 2067, n=64, last 2 years) | |
| Microsoft Surface Pro OLED Copilot+ | |
| Minisforum V3 | |
| Asus ROG Flow Z13 GZ301V | |
| Blender / v3.3 Classroom OPTIX/RTX | |
| Asus ROG Flow Z13 GZ301V | |
| Average of class Convertible (23 - 31, n=3, last 2 years) | |
| Blender / v3.3 Classroom CUDA | |
| Asus ROG Flow Z13 GZ301V | |
| Average of class Convertible (37 - 54, n=3, last 2 years) | |
* ... smaller is better
| Performance Rating - Percent | |
| Asus ROG Flow Z13 GZ301V | |
| Minisforum V3 | |
| Average of class Convertible | |
| Microsoft Surface Pro Copilot+ | |
| Microsoft Surface Pro OLED Copilot+ -1! | |
| Asus ProArt PZ13 HT5306 | |
| The Witcher 3 - 1920x1080 Ultra Graphics & Postprocessing (HBAO+) | |
| Asus ROG Flow Z13 GZ301V | |
| Minisforum V3 | |
| Average of class Convertible (10.2 - 123.3, n=40, last 2 years) | |
| Microsoft Surface Pro Copilot+ | |
| Microsoft Surface Pro OLED Copilot+ | |
| Asus ProArt PZ13 HT5306 | |
| GTA V - 1920x1080 Highest Settings possible AA:4xMSAA + FX AF:16x | |
| Asus ROG Flow Z13 GZ301V | |
| Minisforum V3 | |
| Microsoft Surface Pro Copilot+ | |
| Average of class Convertible (7.14 - 114.3, n=53, last 2 years) | |
| Asus ProArt PZ13 HT5306 | |
| Final Fantasy XV Benchmark - 1920x1080 High Quality | |
| Asus ROG Flow Z13 GZ301V | |
| Minisforum V3 | |
| Average of class Convertible (4.48 - 107.1, n=64, last 2 years) | |
| Microsoft Surface Pro Copilot+ | |
| Microsoft Surface Pro OLED Copilot+ | |
| Asus ProArt PZ13 HT5306 | |
| Dota 2 Reborn - 1920x1080 ultra (3/3) best looking | |
| Asus ROG Flow Z13 GZ301V | |
| Minisforum V3 | |
| Average of class Convertible (18.8 - 158.3, n=64, last 2 years) | |
| Microsoft Surface Pro OLED Copilot+ | |
| Asus ProArt PZ13 HT5306 | |
| Microsoft Surface Pro Copilot+ | |
Cyberpunk 2077 ultra FPS diagram
| low | med. | high | ultra | |
|---|---|---|---|---|
| GTA V (2015) | 94.4 | 88 | 33.4 | 14.3 |
| The Witcher 3 (2015) | 65 | 39 | 22 | 11 |
| Dota 2 Reborn (2015) | 85 | 67.1 | 55 | 47.8 |
| Final Fantasy XV Benchmark (2018) | 37.8 | 15 | 9.72 | |
| Far Cry 5 (2018) | 37 | 21 | 19 | 17 |
| Strange Brigade (2018) | 84 | |||
| F1 22 (2022) | 33.1 | 36.6 | 23.3 | 16.4 |
| Cyberpunk 2077 2.2 Phantom Liberty (2023) | 14.4 | 11.2 | 9.57 | 8.2 |
排放物 - 风扇偶尔发出噪音
噪音排放
ProArt PZ13 的噪音排放让我们感到有些惊讶--尤其是与 Vivobook S 15 相比。 Vivobook S 15相比,使用相同骁龙处理器(但功耗限制更高)的 Vivobook S 15 的噪音更大。虽然 Vivobook 在标准模式下也非常安静,但 PZ13 的噪音明显更大,而且风扇启动得更快。在满载情况下,风扇转速也会频繁波动,因此华硕确实应该在这方面做出改进。如果希望尽可能安静,则应使用耳语模式,该模式下平板电脑的性能仍足以应付日常任务。我们的测试设备听不到任何其他电子噪音。
| 风扇简介 | 赛博朋克 2077 | 压力测试 |
|---|---|---|
| Whisper | 26.7 dB(A) | 30.6 dB(A) |
| 标准 | 35.1 dB(A) | 40 dB(A) |
| 性能 | 43.1 dB(A) | 44.8 dB(A) |
Noise Level
| Idle |
| 23.7 / 23.7 / 23.7 dB(A) |
| Load |
| 26.7 / 40 dB(A) |
 | ||
30 dB silent 40 dB(A) audible 50 dB(A) loud |
||
min: | ||
| Asus ProArt PZ13 HT5306 Adreno X1-45 1.7 TFLOPS, SD X Plus X1P-42-100, WD PC SN740 SDDPTQD-1T00 | Minisforum V3 Radeon 780M, R7 8840U, Kingston OM8PGP41024Q-A0 | Microsoft Surface Pro OLED Copilot+ Adreno X1-85 3.8 TFLOPS, SD X Elite X1E-80-100, Samsung PM9B1 1024GB MZVL41T0HBLB | Microsoft Surface Pro Copilot+ Adreno X1-85 3.8 TFLOPS, SD X Plus X1P-64-100, Samsung PM9B1 256GB MZ9L4256HCJQ | Apple iPad Pro 13 2024 M4 10-Core GPU, M4 (10 cores), 1 TB NAND Flash | Asus ROG Flow Z13 GZ301V NVIDIA GeForce RTX 4060 Laptop GPU, i9-13900H, WD PC SN740 SDDPTQD-1T00 | |
|---|---|---|---|---|---|---|
| Noise | -16% | -11% | -4% | -10% | ||
| off / environment * | 23.7 | 25.4 -7% | 23.6 -0% | 23.8 -0% | 24 -1% | |
| Idle Minimum * | 23.7 | 26.7 -13% | 23.6 -0% | 23.8 -0% | 24 -1% | |
| Idle Average * | 23.7 | 31.6 -33% | 23.6 -0% | 23.8 -0% | 24 -1% | |
| Idle Maximum * | 23.7 | 32.5 -37% | 25.2 -6% | 23.8 -0% | 24 -1% | |
| Load Average * | 26.7 | 32.7 -22% | 39 -46% | 23.8 11% | 38.61 -45% | |
| Cyberpunk 2077 ultra * | 35.1 | 39 -11% | 44.7 -27% | |||
| Load Maximum * | 40 | 34 15% | 44.8 -12% | 44.7 -12% | 43.59 -9% | |
| Witcher 3 ultra * | 33.2 | 41.24 |
* ... smaller is better
温度
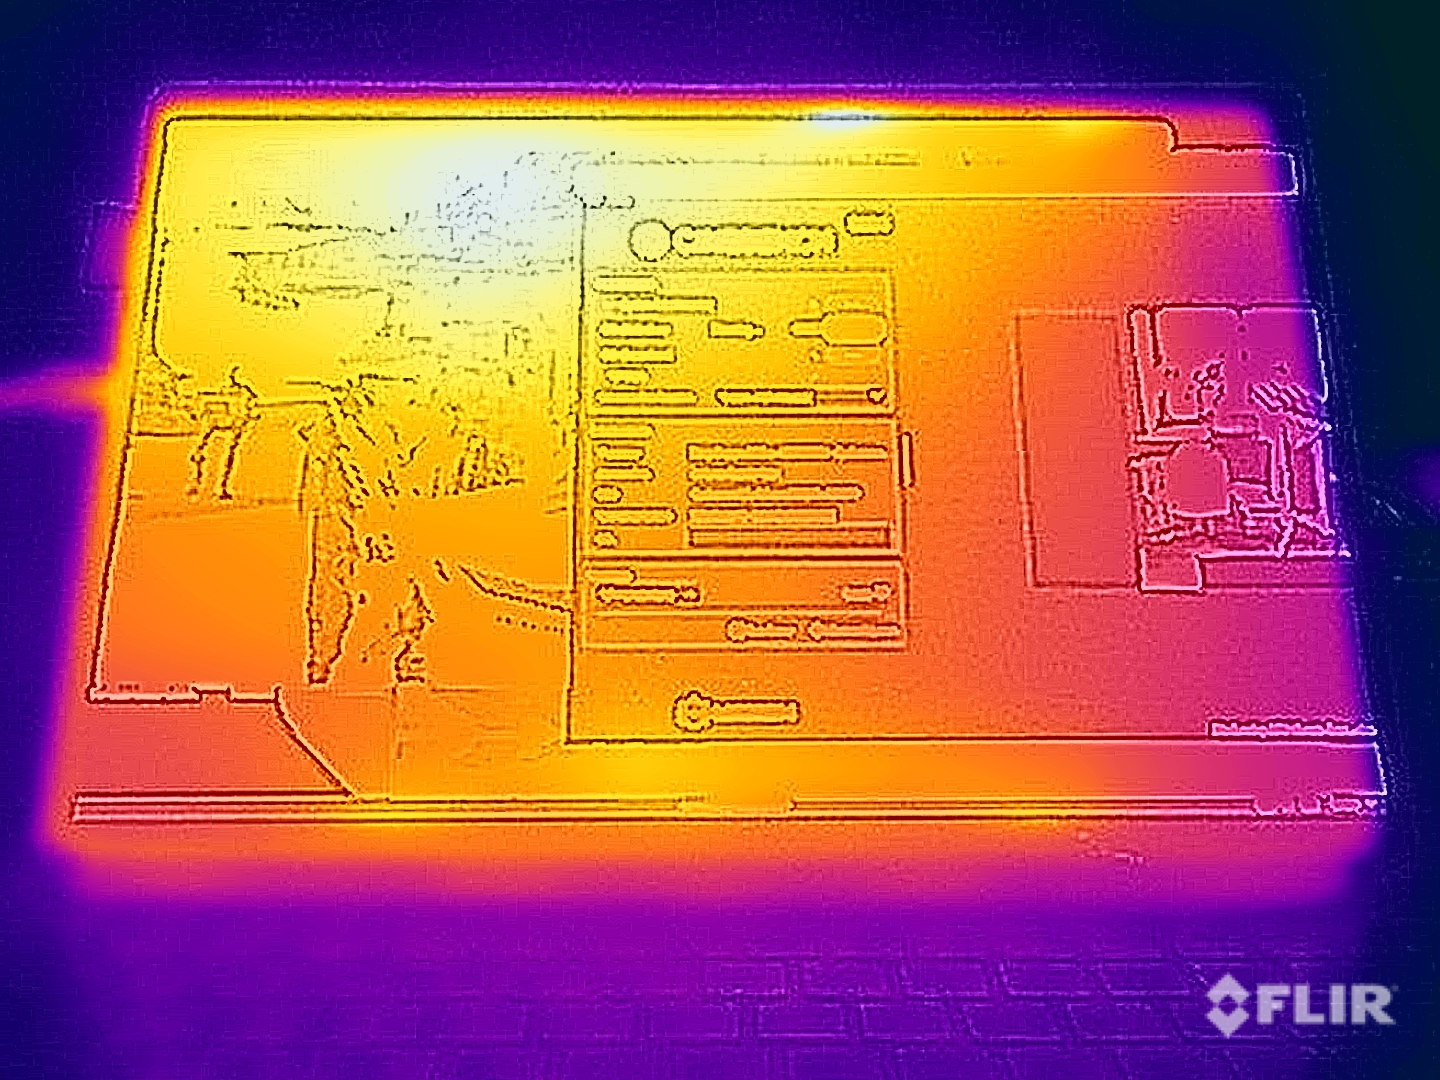
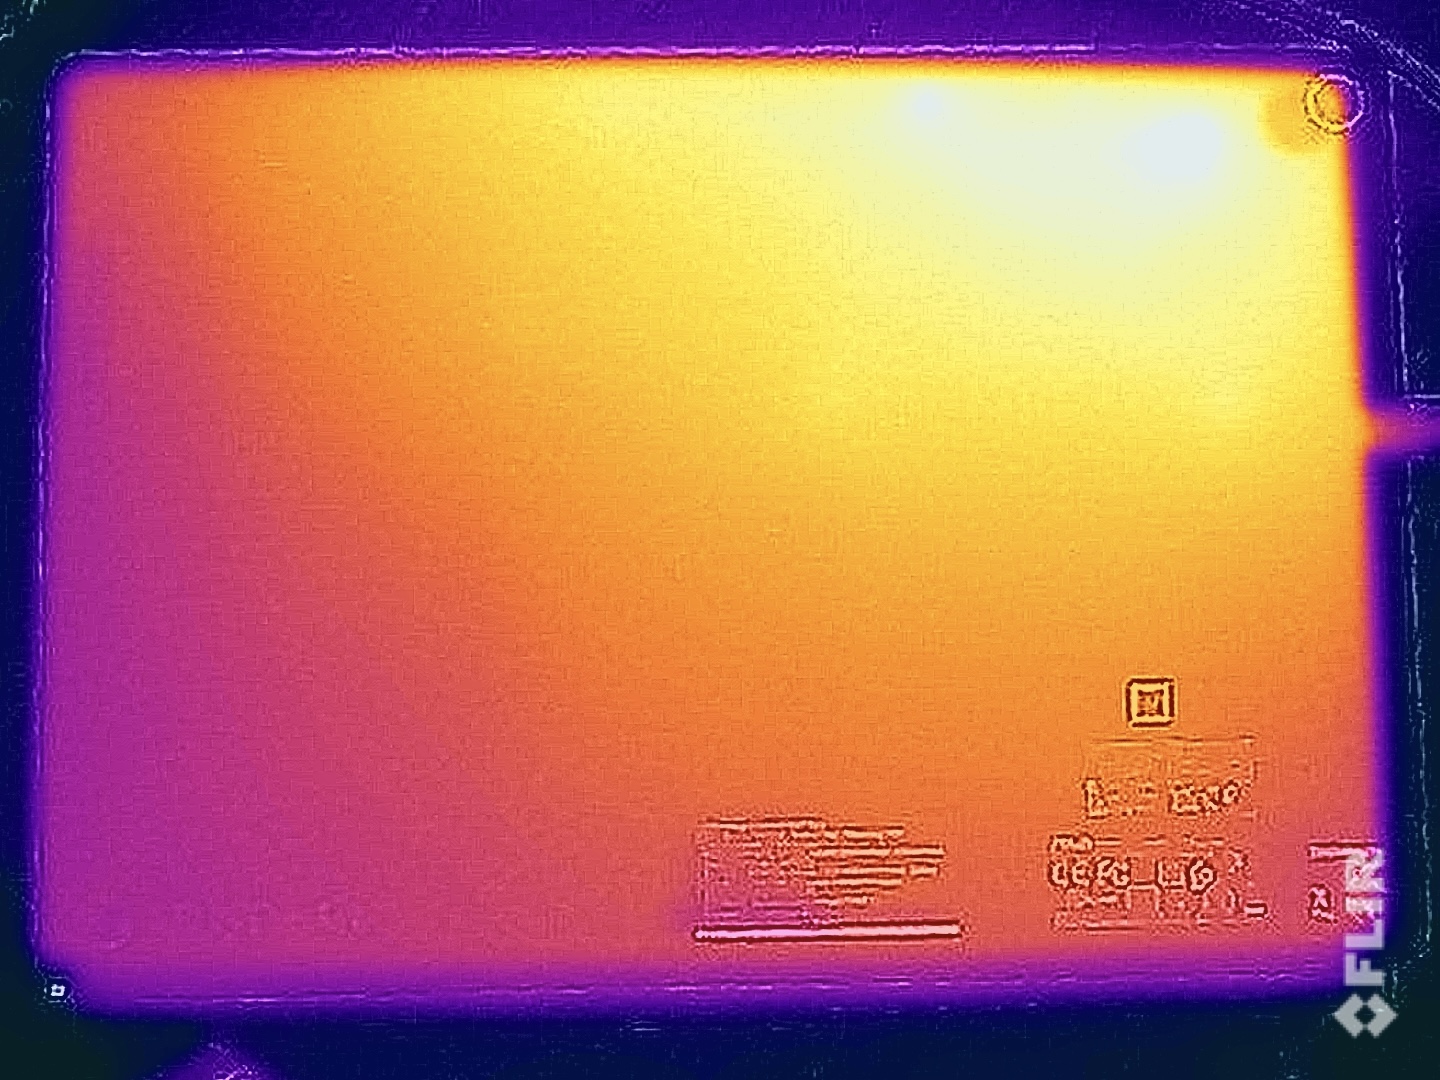
在低负载情况下,设备的表面温度完全不成问题。在较高负荷下,这取决于你如何使用设备。如果只单独使用平板电脑,我们在金属背面测得的 43 °C温度可能会让人有点不舒服,如果你真的把骁龙处理器推向极限的话。不过,只要装上后盖,就不会有问题了。
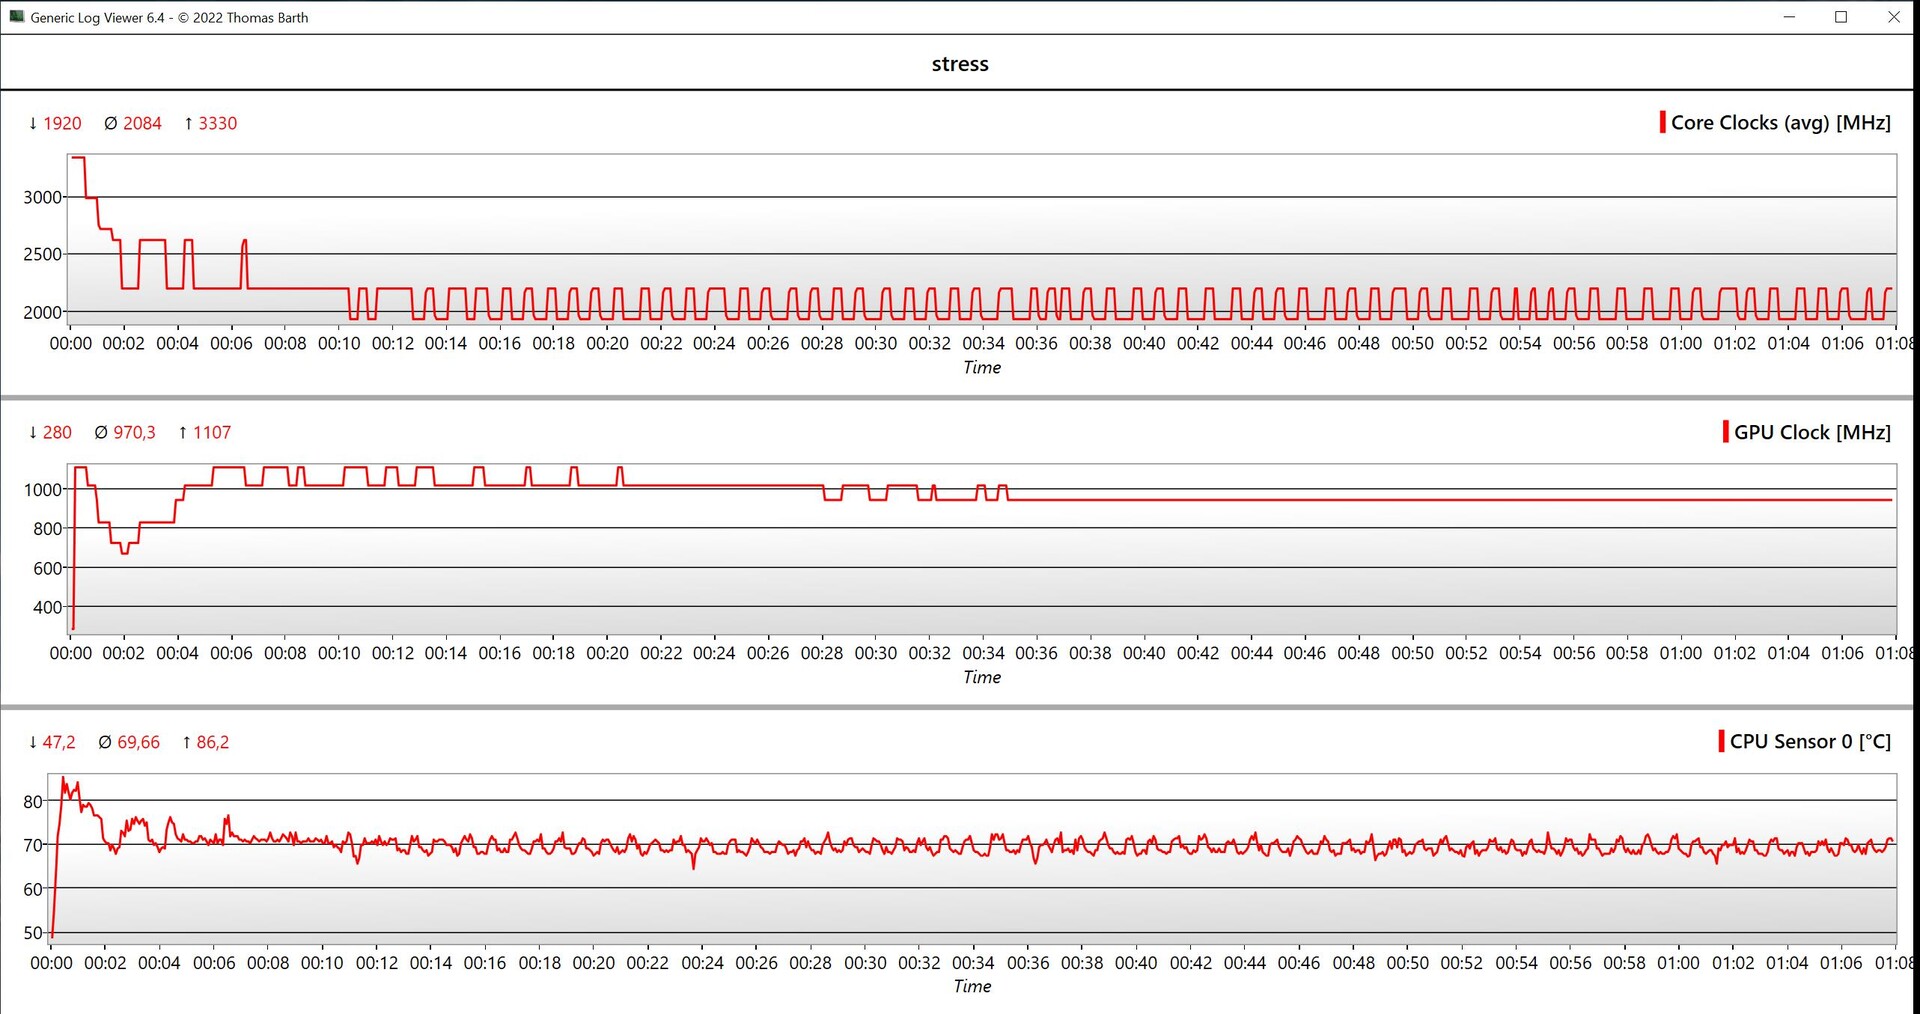
在综合 CPU/GPU 负载的压力测试中,GPU 受到了青睐,但其频率为 970 MHz,无法全速工作。八个处理器内核的平均工作频率约为 2.1 GHz。
(±) The maximum temperature on the upper side is 43.7 °C / 111 F, compared to the average of 35.3 °C / 96 F, ranging from 19.6 to 60 °C for the class Convertible.
(±) The bottom heats up to a maximum of 43.9 °C / 111 F, compared to the average of 36.8 °C / 98 F
(+) In idle usage, the average temperature for the upper side is 27.4 °C / 81 F, compared to the device average of 30.2 °C / 86 F.
(±) 3: The average temperature for the upper side is 37.2 °C / 99 F, compared to the average of 30.2 °C / 86 F for the class Convertible.
(±) The palmrests and touchpad can get very hot to the touch with a maximum of 36.5 °C / 97.7 F.
(-) The average temperature of the palmrest area of similar devices was 28 °C / 82.4 F (-8.5 °C / -15.3 F).
| Asus ProArt PZ13 HT5306 Qualcomm Snapdragon X Plus X1P-42-100, Qualcomm SD X Adreno X1-45 1.7 TFLOPS | Minisforum V3 AMD Ryzen 7 8840U, AMD Radeon 780M | Microsoft Surface Pro OLED Copilot+ Qualcomm Snapdragon X Elite X1E-80-100, Qualcomm SD X Adreno X1-85 3.8 TFLOPS | Microsoft Surface Pro Copilot+ Qualcomm Snapdragon X Plus X1P-64-100, Qualcomm SD X Adreno X1-85 3.8 TFLOPS | Apple iPad Pro 13 2024 Apple M4 (10 cores), Apple M4 10-core GPU | Asus ROG Flow Z13 GZ301V Intel Core i9-13900H, NVIDIA GeForce RTX 4060 Laptop GPU | |
|---|---|---|---|---|---|---|
| Heat | -21% | 3% | 7% | 13% | 1% | |
| Maximum Upper Side * | 43.7 | 50.5 -16% | 43.1 1% | 43.9 -0% | 36.7 16% | 42 4% |
| Maximum Bottom * | 43.9 | 54.8 -25% | 46.3 -5% | 44.9 -2% | 35.7 19% | 47 -7% |
| Idle Upper Side * | 31.9 | 34.9 -9% | 27.5 14% | 26.2 18% | 27.3 14% | 27 15% |
| Idle Bottom * | 27.6 | 36.3 -32% | 26.8 3% | 24.6 11% | 26.4 4% | 30 -9% |
* ... smaller is better
发言人
ProArt PZ13 有两个扬声器,整体音质一般。语音非常容易理解,但在播放音乐或电影时,声音缺乏重点。Surface Pro 在这方面的表现略胜一筹,而Apple iPad Pro 13 在这方面明显领先。
Asus ProArt PZ13 HT5306 audio analysis
(±) | speaker loudness is average but good (79.7 dB)
Bass 100 - 315 Hz
(±) | reduced bass - on average 13% lower than median
(±) | linearity of bass is average (11% delta to prev. frequency)
Mids 400 - 2000 Hz
(+) | balanced mids - only 4.1% away from median
(+) | mids are linear (5.3% delta to prev. frequency)
Highs 2 - 16 kHz
(+) | balanced highs - only 3.1% away from median
(+) | highs are linear (5.1% delta to prev. frequency)
Overall 100 - 16.000 Hz
(±) | linearity of overall sound is average (15.6% difference to median)
Compared to same class
» 25% of all tested devices in this class were better, 3% similar, 72% worse
» The best had a delta of 6%, average was 20%, worst was 57%
Compared to all devices tested
» 21% of all tested devices were better, 4% similar, 74% worse
» The best had a delta of 4%, average was 24%, worst was 134%
Minisforum V3 audio analysis
(±) | speaker loudness is average but good (74.8 dB)
Bass 100 - 315 Hz
(±) | reduced bass - on average 13.5% lower than median
(±) | linearity of bass is average (10.2% delta to prev. frequency)
Mids 400 - 2000 Hz
(+) | balanced mids - only 3.2% away from median
(±) | linearity of mids is average (8.2% delta to prev. frequency)
Highs 2 - 16 kHz
(+) | balanced highs - only 4.6% away from median
(±) | linearity of highs is average (7.8% delta to prev. frequency)
Overall 100 - 16.000 Hz
(±) | linearity of overall sound is average (21.3% difference to median)
Compared to same class
» 55% of all tested devices in this class were better, 12% similar, 33% worse
» The best had a delta of 6%, average was 20%, worst was 57%
Compared to all devices tested
» 57% of all tested devices were better, 7% similar, 36% worse
» The best had a delta of 4%, average was 24%, worst was 134%
Microsoft Surface Pro OLED Copilot+ audio analysis
(+) | speakers can play relatively loud (82.4 dB)
Bass 100 - 315 Hz
(±) | reduced bass - on average 8.9% lower than median
(±) | linearity of bass is average (9.3% delta to prev. frequency)
Mids 400 - 2000 Hz
(±) | higher mids - on average 6.4% higher than median
(+) | mids are linear (3.3% delta to prev. frequency)
Highs 2 - 16 kHz
(+) | balanced highs - only 3.9% away from median
(+) | highs are linear (3.2% delta to prev. frequency)
Overall 100 - 16.000 Hz
(+) | overall sound is linear (13.5% difference to median)
Compared to same class
» 23% of all tested devices in this class were better, 4% similar, 73% worse
» The best had a delta of 7%, average was 21%, worst was 129%
Compared to all devices tested
» 13% of all tested devices were better, 4% similar, 84% worse
» The best had a delta of 4%, average was 24%, worst was 134%
Apple iPad Pro 13 2024 audio analysis
(+) | speakers can play relatively loud (85.3 dB)
Bass 100 - 315 Hz
(±) | reduced bass - on average 5.4% lower than median
(±) | linearity of bass is average (10.5% delta to prev. frequency)
Mids 400 - 2000 Hz
(±) | higher mids - on average 5.9% higher than median
(+) | mids are linear (4.2% delta to prev. frequency)
Highs 2 - 16 kHz
(+) | balanced highs - only 2.7% away from median
(+) | highs are linear (5.3% delta to prev. frequency)
Overall 100 - 16.000 Hz
(+) | overall sound is linear (10% difference to median)
Compared to same class
» 4% of all tested devices in this class were better, 2% similar, 93% worse
» The best had a delta of 7%, average was 21%, worst was 129%
Compared to all devices tested
» 4% of all tested devices were better, 1% similar, 95% worse
» The best had a delta of 4%, average was 24%, worst was 134%
Asus ROG Flow Z13 GZ301V audio analysis
(±) | speaker loudness is average but good (78.64 dB)
Bass 100 - 315 Hz
(-) | nearly no bass - on average 17.5% lower than median
(±) | linearity of bass is average (7.5% delta to prev. frequency)
Mids 400 - 2000 Hz
(+) | balanced mids - only 2.9% away from median
(+) | mids are linear (5.8% delta to prev. frequency)
Highs 2 - 16 kHz
(+) | balanced highs - only 1.8% away from median
(+) | highs are linear (4.8% delta to prev. frequency)
Overall 100 - 16.000 Hz
(±) | linearity of overall sound is average (15% difference to median)
Compared to same class
» 30% of all tested devices in this class were better, 6% similar, 64% worse
» The best had a delta of 6%, average was 18%, worst was 132%
Compared to all devices tested
» 19% of all tested devices were better, 4% similar, 77% worse
» The best had a delta of 4%, average was 24%, worst was 134%
电源管理 - 超长电池运行时间
耗电量
PZ13 只需要很少的功率,尤其是在空闲模式下--我们注意到最大功率为 6.1 瓦。不过,与 Surface Pro(拥有亮度更高的 120-Hz OLED)相比,这绝不是创纪录的数值。在负载情况下,它的功率曾一度达到 60 瓦,考虑到骁龙 X Plus 的体积,这已经是相当大的功率了。在接下来的压力测试过程中,耗电量在 30-40 瓦之间波动。因此,附带的 65 瓦电源在体积上已经足够。不过,0.94 瓦的待机功耗还是太高了。
| Off / Standby | |
| Idle | |
| Load |
|
Key:
min: | |
| Asus ProArt PZ13 HT5306 SD X Plus X1P-42-100, Adreno X1-45 1.7 TFLOPS, WD PC SN740 SDDPTQD-1T00, OLED, 2880x1800, 13.3" | Minisforum V3 R7 8840U, Radeon 780M, Kingston OM8PGP41024Q-A0, IPS, 2560x1600, 14" | Microsoft Surface Pro OLED Copilot+ SD X Elite X1E-80-100, Adreno X1-85 3.8 TFLOPS, Samsung PM9B1 1024GB MZVL41T0HBLB, OLED, 2880x1920, 13" | Microsoft Surface Pro Copilot+ SD X Plus X1P-64-100, Adreno X1-85 3.8 TFLOPS, Samsung PM9B1 256GB MZ9L4256HCJQ, IPS, 2880x1920, 13" | Apple iPad Pro 13 2024 M4 (10 cores), M4 10-Core GPU, 1 TB NAND Flash, Tandem OLED, 2752x2064, 13" | Asus ROG Flow Z13 GZ301V i9-13900H, NVIDIA GeForce RTX 4060 Laptop GPU, WD PC SN740 SDDPTQD-1T00, IPS, 2560x1600, 13.4" | Average Qualcomm SD X Adreno X1-45 1.7 TFLOPS | Average of class Convertible | |
|---|---|---|---|---|---|---|---|---|
| Power Consumption | -179% | -20% | -40% | 36% | -209% | -7% | -74% | |
| Idle Minimum * | 3.5 | 10.1 -189% | 2.8 20% | 1.9 46% | 1.94 45% | 8.5 -143% | 3.45 ? 1% | 4.82 ? -38% |
| Idle Average * | 5.3 | 16.9 -219% | 3.9 26% | 9.2 -74% | 5.02 5% | 12.4 -134% | 5.62 ? -6% | 7.74 ? -46% |
| Idle Maximum * | 6.1 | 20.6 -238% | 4.9 20% | 9.5 -56% | 5.05 17% | 13.3 -118% | 7.37 ? -21% | 10.3 ? -69% |
| Load Average * | 14.9 | 51.7 -247% | 34.3 -130% | 29.6 -99% | 8.71 42% | 93 -524% | 15.6 ? -5% | 45.4 ? -205% |
| Cyberpunk 2077 ultra * | 23.1 | 35.8 -55% | 39.5 -71% | |||||
| Cyberpunk 2077 ultra external monitor * | 23.5 | 36 -53% | 37.4 -59% | |||||
| Load Maximum * | 59.9 | 61.2 -2% | 41.2 31% | 40.7 32% | 16.93 72% | 135 -125% | 60.8 ? -2% | 67.5 ? -13% |
| Witcher 3 ultra * | 55.4 | 87.8 |
* ... smaller is better
Power consumption Cyberpunk / stress test
Power consumption with external monitor
运行时间
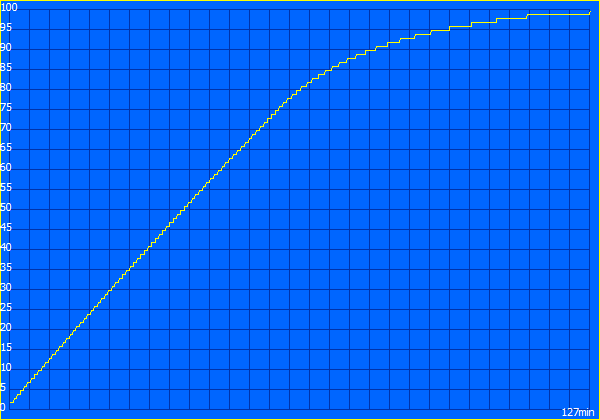
华硕为这款平板电脑配备了 70 Wh 的电池,与 Snapdragon SoC 相结合,确保了良好的运行时间,几乎超越了所有竞争对手。在 150 cd/m²(相当于测试设备最大 SDR 亮度的 66%)的 WLAN 测试中,我们测得的运行时间刚刚超过 14 小时。在这方面,对比设备都无法跟上,但它们的电池容量也明显较低。在全亮度状态下,无线局域网测试仍可持续近 9.5 小时,视频播放可持续近 18.5 小时。在满负荷状态下,可使用约 2.5 小时。在设备开启的情况下,充满电需要 127 分钟,大约一小时后可恢复 80% 的电量。
| Asus ProArt PZ13 HT5306 SD X Plus X1P-42-100, Adreno X1-45 1.7 TFLOPS, 70 Wh | Minisforum V3 R7 8840U, Radeon 780M, 50.82 Wh | Microsoft Surface Pro OLED Copilot+ SD X Elite X1E-80-100, Adreno X1-85 3.8 TFLOPS, 53 Wh | Microsoft Surface Pro Copilot+ SD X Plus X1P-64-100, Adreno X1-85 3.8 TFLOPS, 47 Wh | Apple iPad Pro 13 2024 M4 (10 cores), M4 10-Core GPU, 38.99 Wh | Asus ROG Flow Z13 GZ301V i9-13900H, NVIDIA GeForce RTX 4060 Laptop GPU, 56 Wh | Average of class Convertible | |
|---|---|---|---|---|---|---|---|
| Battery Runtime | -40% | -22% | -29% | 38% | -66% | -23% | |
| H.264 | 1105 | 953 -14% | 841 -24% | 1174 6% | 284 -74% | 898 ? -19% | |
| WiFi v1.3 | 851 | 352 -59% | 665 -22% | 662 -22% | 752 -12% | 298 -65% | 628 ? -26% |
| Load | 149 | 119 -20% | 104 -30% | 89 -40% | 326 119% | 61 -59% | 113.2 ? -24% |
| Witcher 3 ultra | 50 | 90 ? |
Pros
Cons
结论:户外敞篷车,动力强劲,但没有 5G 功能

与两款笔记本电脑同类产品一样,新款 ProArt PZ13 的销售对象也是相当小的一群人。这是一款带有可拆卸键盘的平板电脑,主要面向那些希望随时随地编辑媒体的创意用户。坚固的外壳以及对外界环境(温度、水、灰尘等)的更好保护使其成为可能。与此同时,摄影师还可以期待快速、功能齐全的 SD 读卡器、支持手写笔的高分辨率 OLED 屏幕、sRGB/P3 的精确色彩配置文件以及两个 USB-C 端口(允许连接外置硬盘)。
我们并不完全清楚采用新的骁龙 X Plus 处理器的决定,因为它的多核性能和 GPU 性能比新的骁龙 X Elite 芯片弱很多,而后者在微软 Surface Pro 上运行得非常好。 微软 Surface Pro为例。它的性能足以胜任简单的任务,但如果考虑到其 1099.99 美元的最高售价,那么最慢的高通处理器就不完全适合这款产品了。同样遗憾的是,这款平板电脑没有 5G 版本,而 5G 版本本应特别适合这一概念。
新款华硕 ProArt PZ13 是一款有趣的可转换平板电脑,适合那些希望在恶劣条件下工作的创意用户。虽然它的运行时间很棒,但新的骁龙 X Plus 的性能储备有限,而且没有使用 5G 的选项。
还有一点值得批评的是该平板电脑的显示屏,因为它和其他两款 ProArt 型号一样,也只采用了频率为 60Hz 的 OLED 面板。同时,光线表面看起来有点颗粒感,而且设备在安装了两个盖子后更厚更重了。不过,如果你想利用它更强的耐用性,那么你应该可以接受这种妥协。它的运行时间总体上很不错,这主要归功于它的大容量电池。我们也不太喜欢它没有任何维护选项。此外,由于骁龙芯片较小,平板电脑的风扇启动相对较快。
我们已经提到了它的价格,1099.99 美元的价格确实很高。但如果把它的价格与 OLED 版 Surface Pro 的价格相比,再考虑到这款平板电脑还附带了一个不错的键盘盖和一支触控笔,那么它的高价就又显得合理了一些。
iPad Apple iPad Pro 13配备 M4 处理器,性能更强,显示屏更好(可选雾面显示屏)。此外,这款Apple 平板电脑还有保护套可供选择,让你在户外也能很好地使用它。不过,最大的优势是你还可以选择 5G 调制解调器。当然,与 Windows 相比,iPadOS 有更多限制,但Apple 设备上仍有大量优秀的应用程序。公平地说,你也必须承认,iPad 的价格与 Windows 完全不同:1 TB 版本起价 1899 美元,不含 5G 或任何配件。
价格和供应情况
新款 ProArt PZ13 可通过百思买购买,售价1,099.99 美元。
请注意:我们最近更新了评级系统,第 8 版的结果无法与第 7 版的结果进行比较。更多信息 请点击此处.
Asus ProArt PZ13 HT5306
- 09/11/2024 v8
Andreas Osthoff
 Total Sustainability Score:
 Transparency
The selection of devices to be reviewed is made by our editorial team. The test sample was provided to the author as a loan by the manufacturer or retailer for the purpose of this review. The lender had no influence on this review, nor did the manufacturer receive a copy of this review before publication. There was no obligation to publish this review. We never accept compensation or payment in return for our reviews. As an independent media company, Notebookcheck is not subjected to the authority of manufacturers, retailers or publishers.
This is how Notebookcheck is testing
Every year, Notebookcheck independently reviews hundreds of laptops and smartphones using standardized procedures to ensure that all results are comparable. We have continuously developed our test methods for around 20 years and set industry standards in the process. In our test labs, high-quality measuring equipment is utilized by experienced technicians and editors. These tests involve a multi-stage validation process. Our complex rating system is based on hundreds of well-founded measurements and benchmarks, which maintains objectivity. Further information on our test methods can be found here.
Price comparison

