

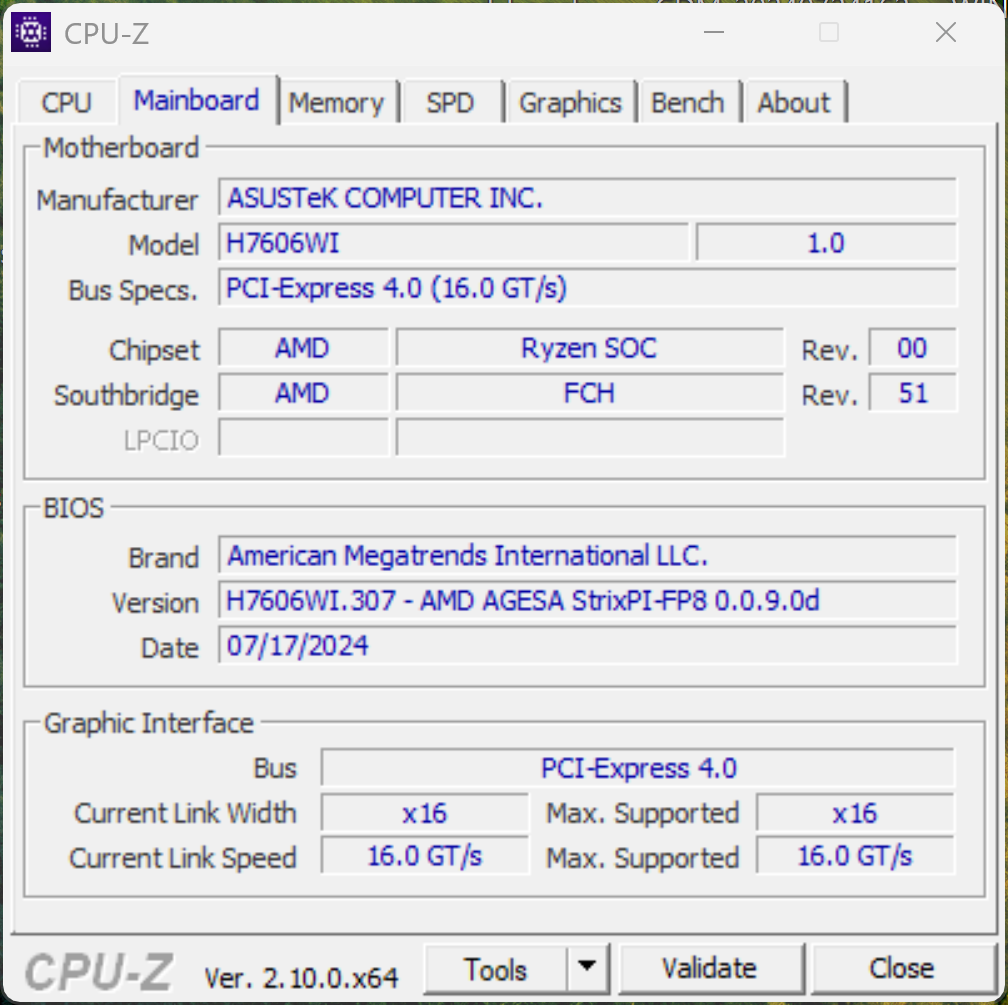
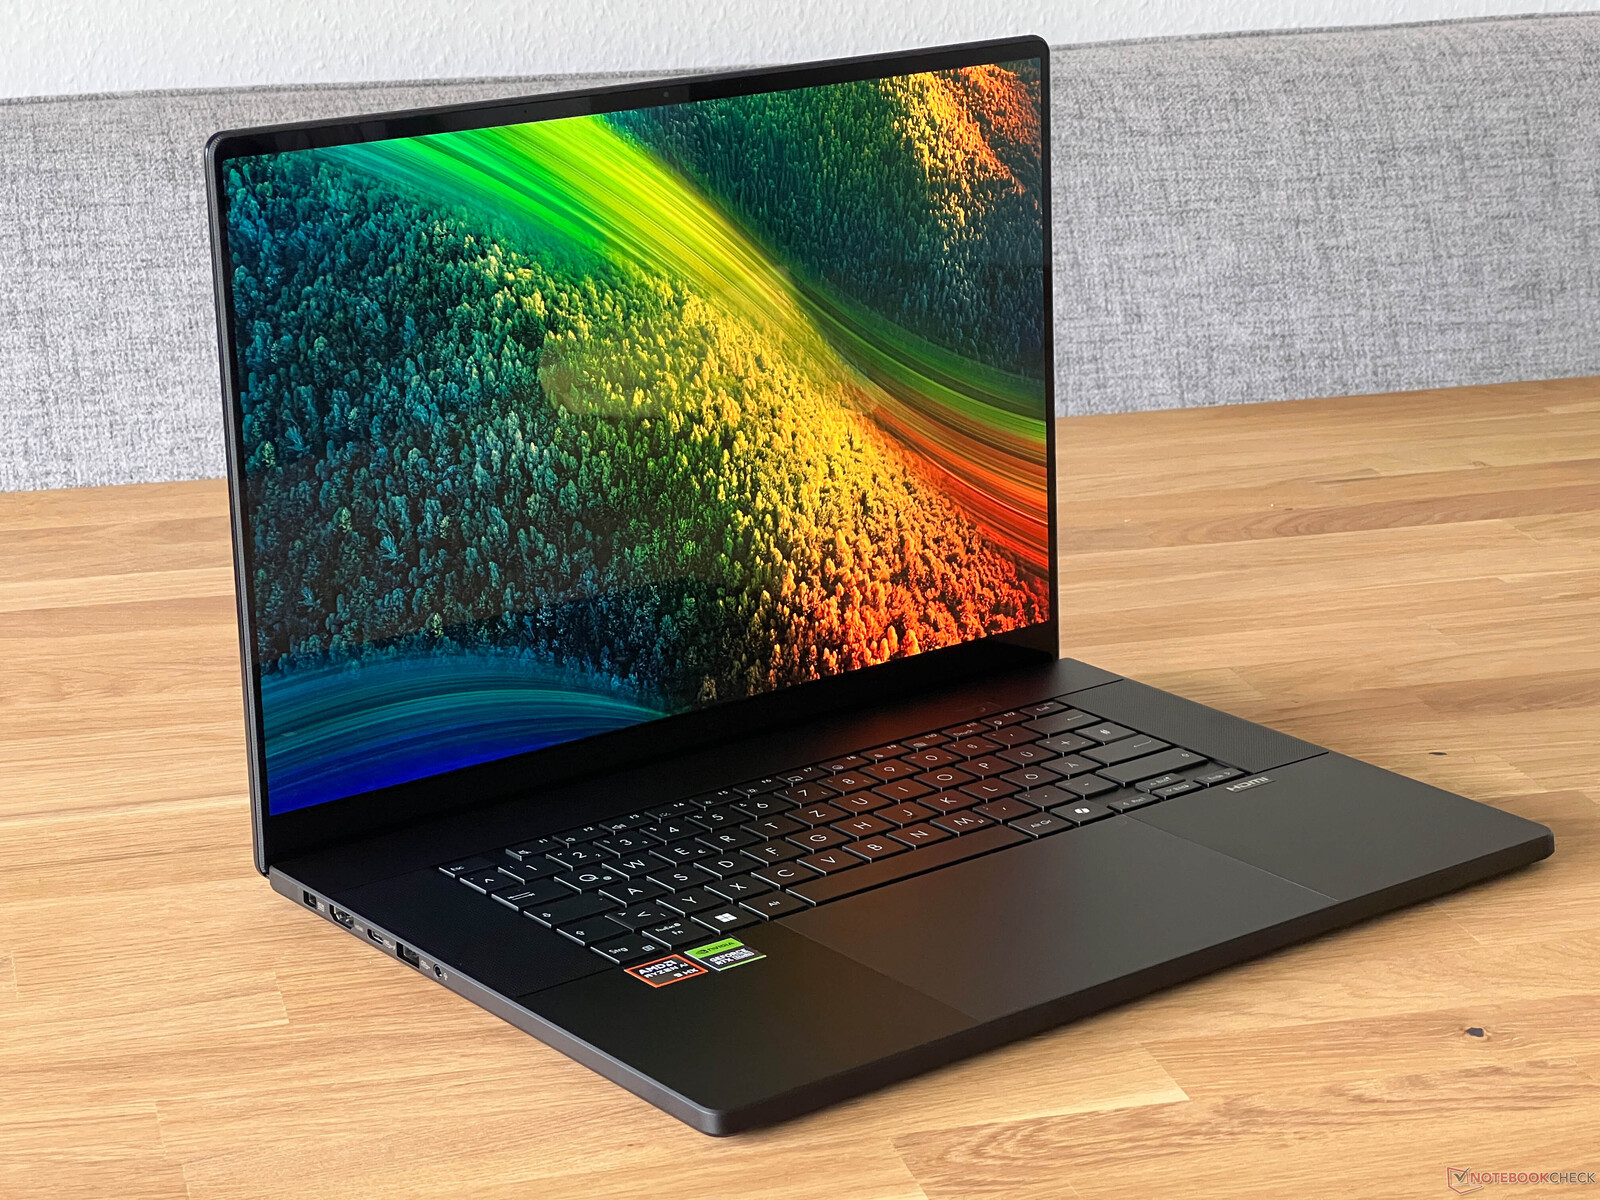
华硕 ProArt P16 笔记本电脑评测 - AMD Zen 5 与 RTX 4070 笔记本电脑和 4K OLED 的完美结合
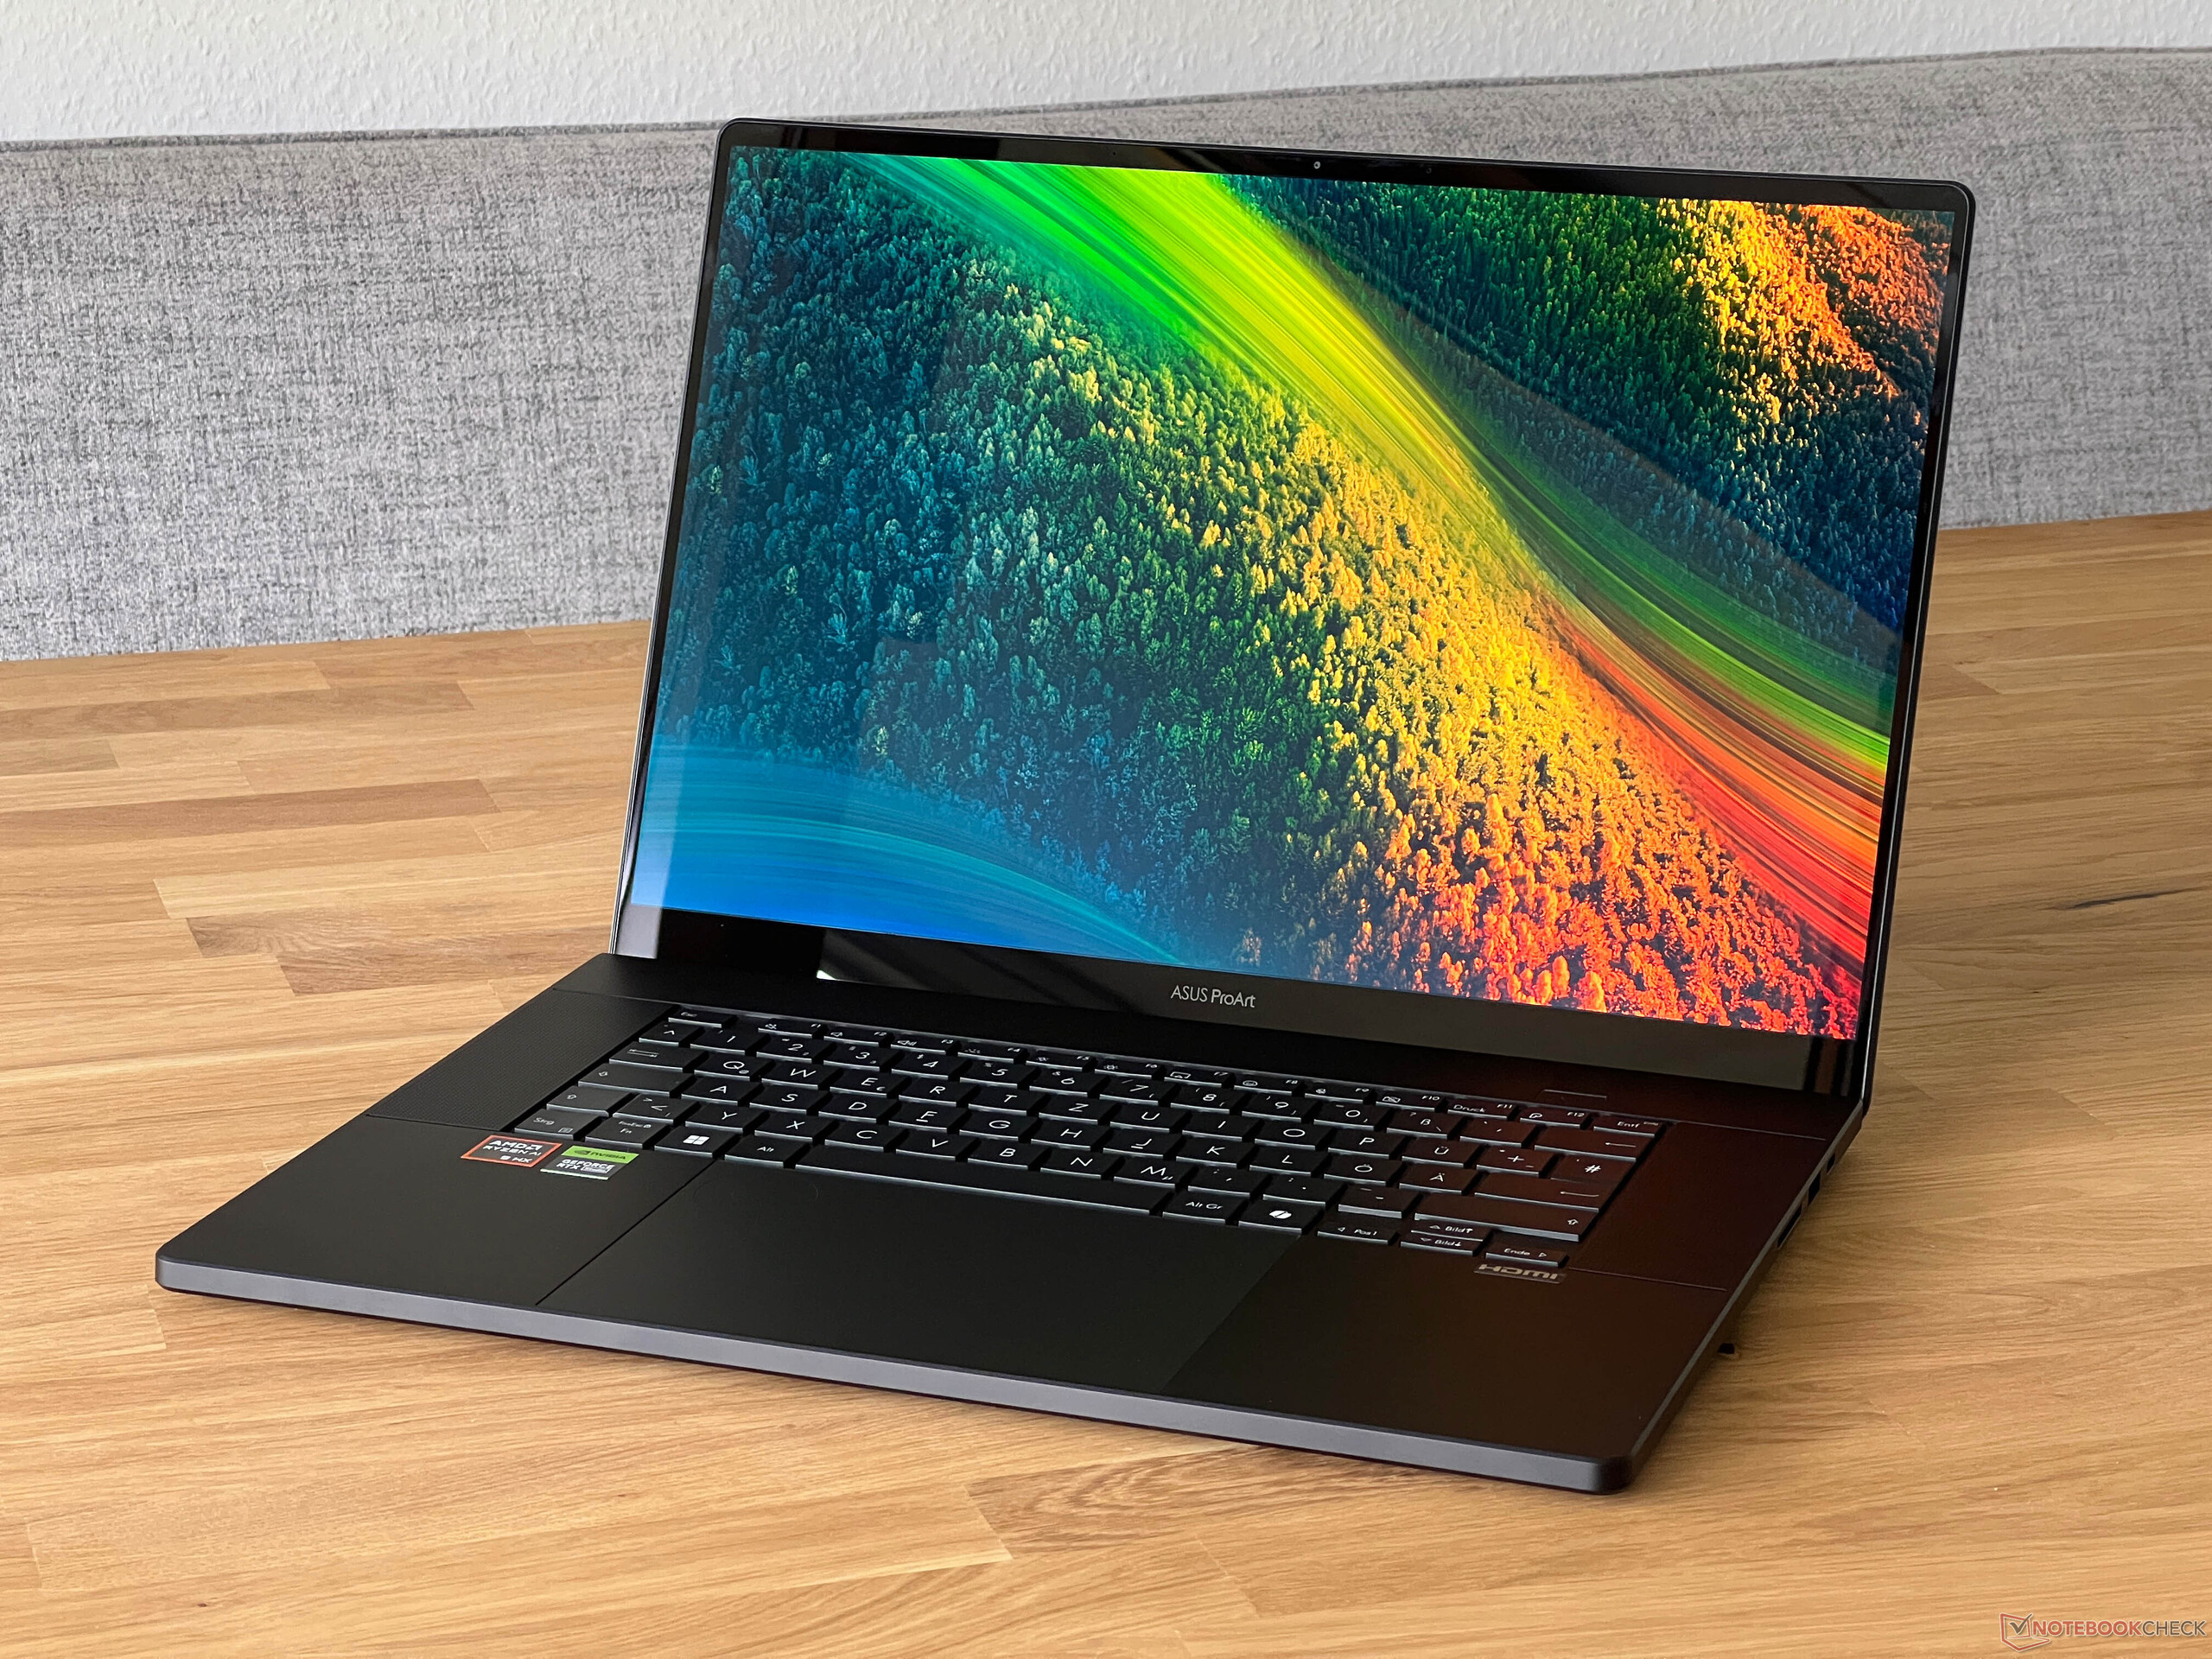
除了 13.3 英寸的二合一 ProArt PX13(点击此处进行广泛评测在此进行了广泛评测)之外,华硕还为内容创作者推出了一款更大的 16 英寸笔记本电脑 ProArt 16。它结合了现代 AMD Zen 5 处理器和 Nvidia 专用 GPU 以及高分辨率 4K OLED 触摸屏。然而,与小型 PX13 不同的是,新款 P16 面临着几款规格相似的竞争设备。新款 ProArt P16 是否提供了足够多的功能,以从其他功能强大的多媒体笔记本电脑中脱颖而出?
我们的评测设备是高端型号,配备了 AMD Ryzen AI 9 HX 370、64 GB 内存、Nvidia GeForce RTX 4070 笔记本电脑1 TB 固态硬盘(零售版本为 2 TB 固态硬盘)和 4K OLED,建议零售价为 2,699 美元。从 32 GB 内存(建议零售价:2299 美元)升级到 64 GB 内存则需要 400 美元。配备 Ryzen AI 9 365、24 GB 内存、1 TB SSD 和 GeForce RTX 4050 笔记本电脑为 1899 美元。
潜在的竞争对手比较
Rating | Version | Date | Model | Weight | Height | Size | Resolution | Price |
|---|---|---|---|---|---|---|---|---|
| 87.8 % | v8 | 08 / 2024 | Asus ProArt P16 H7606WI Ryzen AI 9 HX 370, NVIDIA GeForce RTX 4070 Laptop GPU | 1.8 kg | 17.3 mm | 16.00" | 3840x2400 | |
| 81.2 % | v8 | 07 / 2024 | SCHENKER XMG Pro 16 Studio (Mid 24) i9-14900HX, NVIDIA GeForce RTX 4070 Laptop GPU | 2.3 kg | 19.9 mm | 16.00" | 2560x1600 | |
| 88.7 % v7 (old) | v7 (old) | 04 / 2024 | Lenovo Yoga Pro 9 16IMH9 Ultra 9 185H, NVIDIA GeForce RTX 4070 Laptop GPU | 2.1 kg | 18.3 mm | 16.00" | 3200x2000 | |
| 88.6 % v7 (old) | v7 (old) | 04 / 2024 | Dell XPS 16 9640 Ultra 7 155H, NVIDIA GeForce RTX 4070 Laptop GPU | 2.3 kg | 18.7 mm | 16.30" | 3840x2400 | |
| 92.3 % v7 (old) | v7 (old) | 02 / 2024 | Asus ROG Zephyrus G16 2024 GU605M Ultra 7 155H, NVIDIA GeForce RTX 4070 Laptop GPU | 1.8 kg | 16.4 mm | 16.00" | 2560x1600 | |
| 93.2 % v7 (old) | v7 (old) | 11 / 2023 | Apple MacBook Pro 16 2023 M3 Max Apple M3 Max 16-Core, M3 Max 40-Core GPU | 2.1 kg | 16.9 mm | 16.00" | 3456x2234 | |
| 90.5 % v7 (old) | v7 (old) | 11 / 2023 | Asus Zenbook Pro 16X UX7602BZ-MY005W i9-13905H, NVIDIA GeForce RTX 4080 Laptop GPU | 2.4 kg | 17.8 mm | 16.00" | 3200x2000 |
注:我们最近更新了评级系统,第 8 版的结果与第 7 版的结果不具可比性。更多信息 此处.
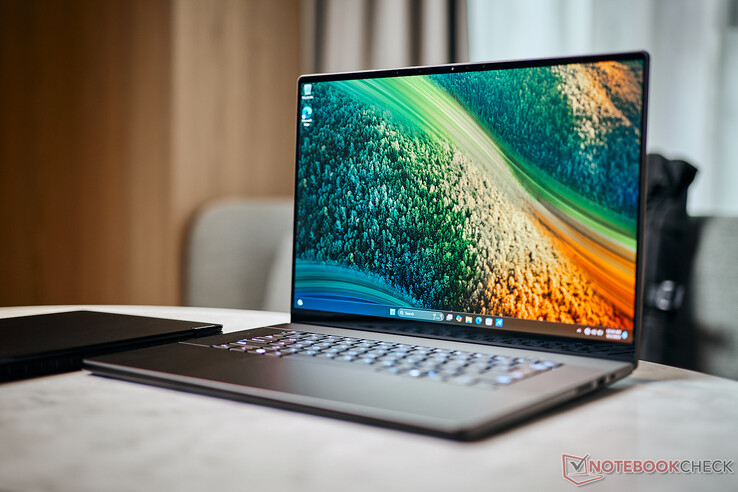
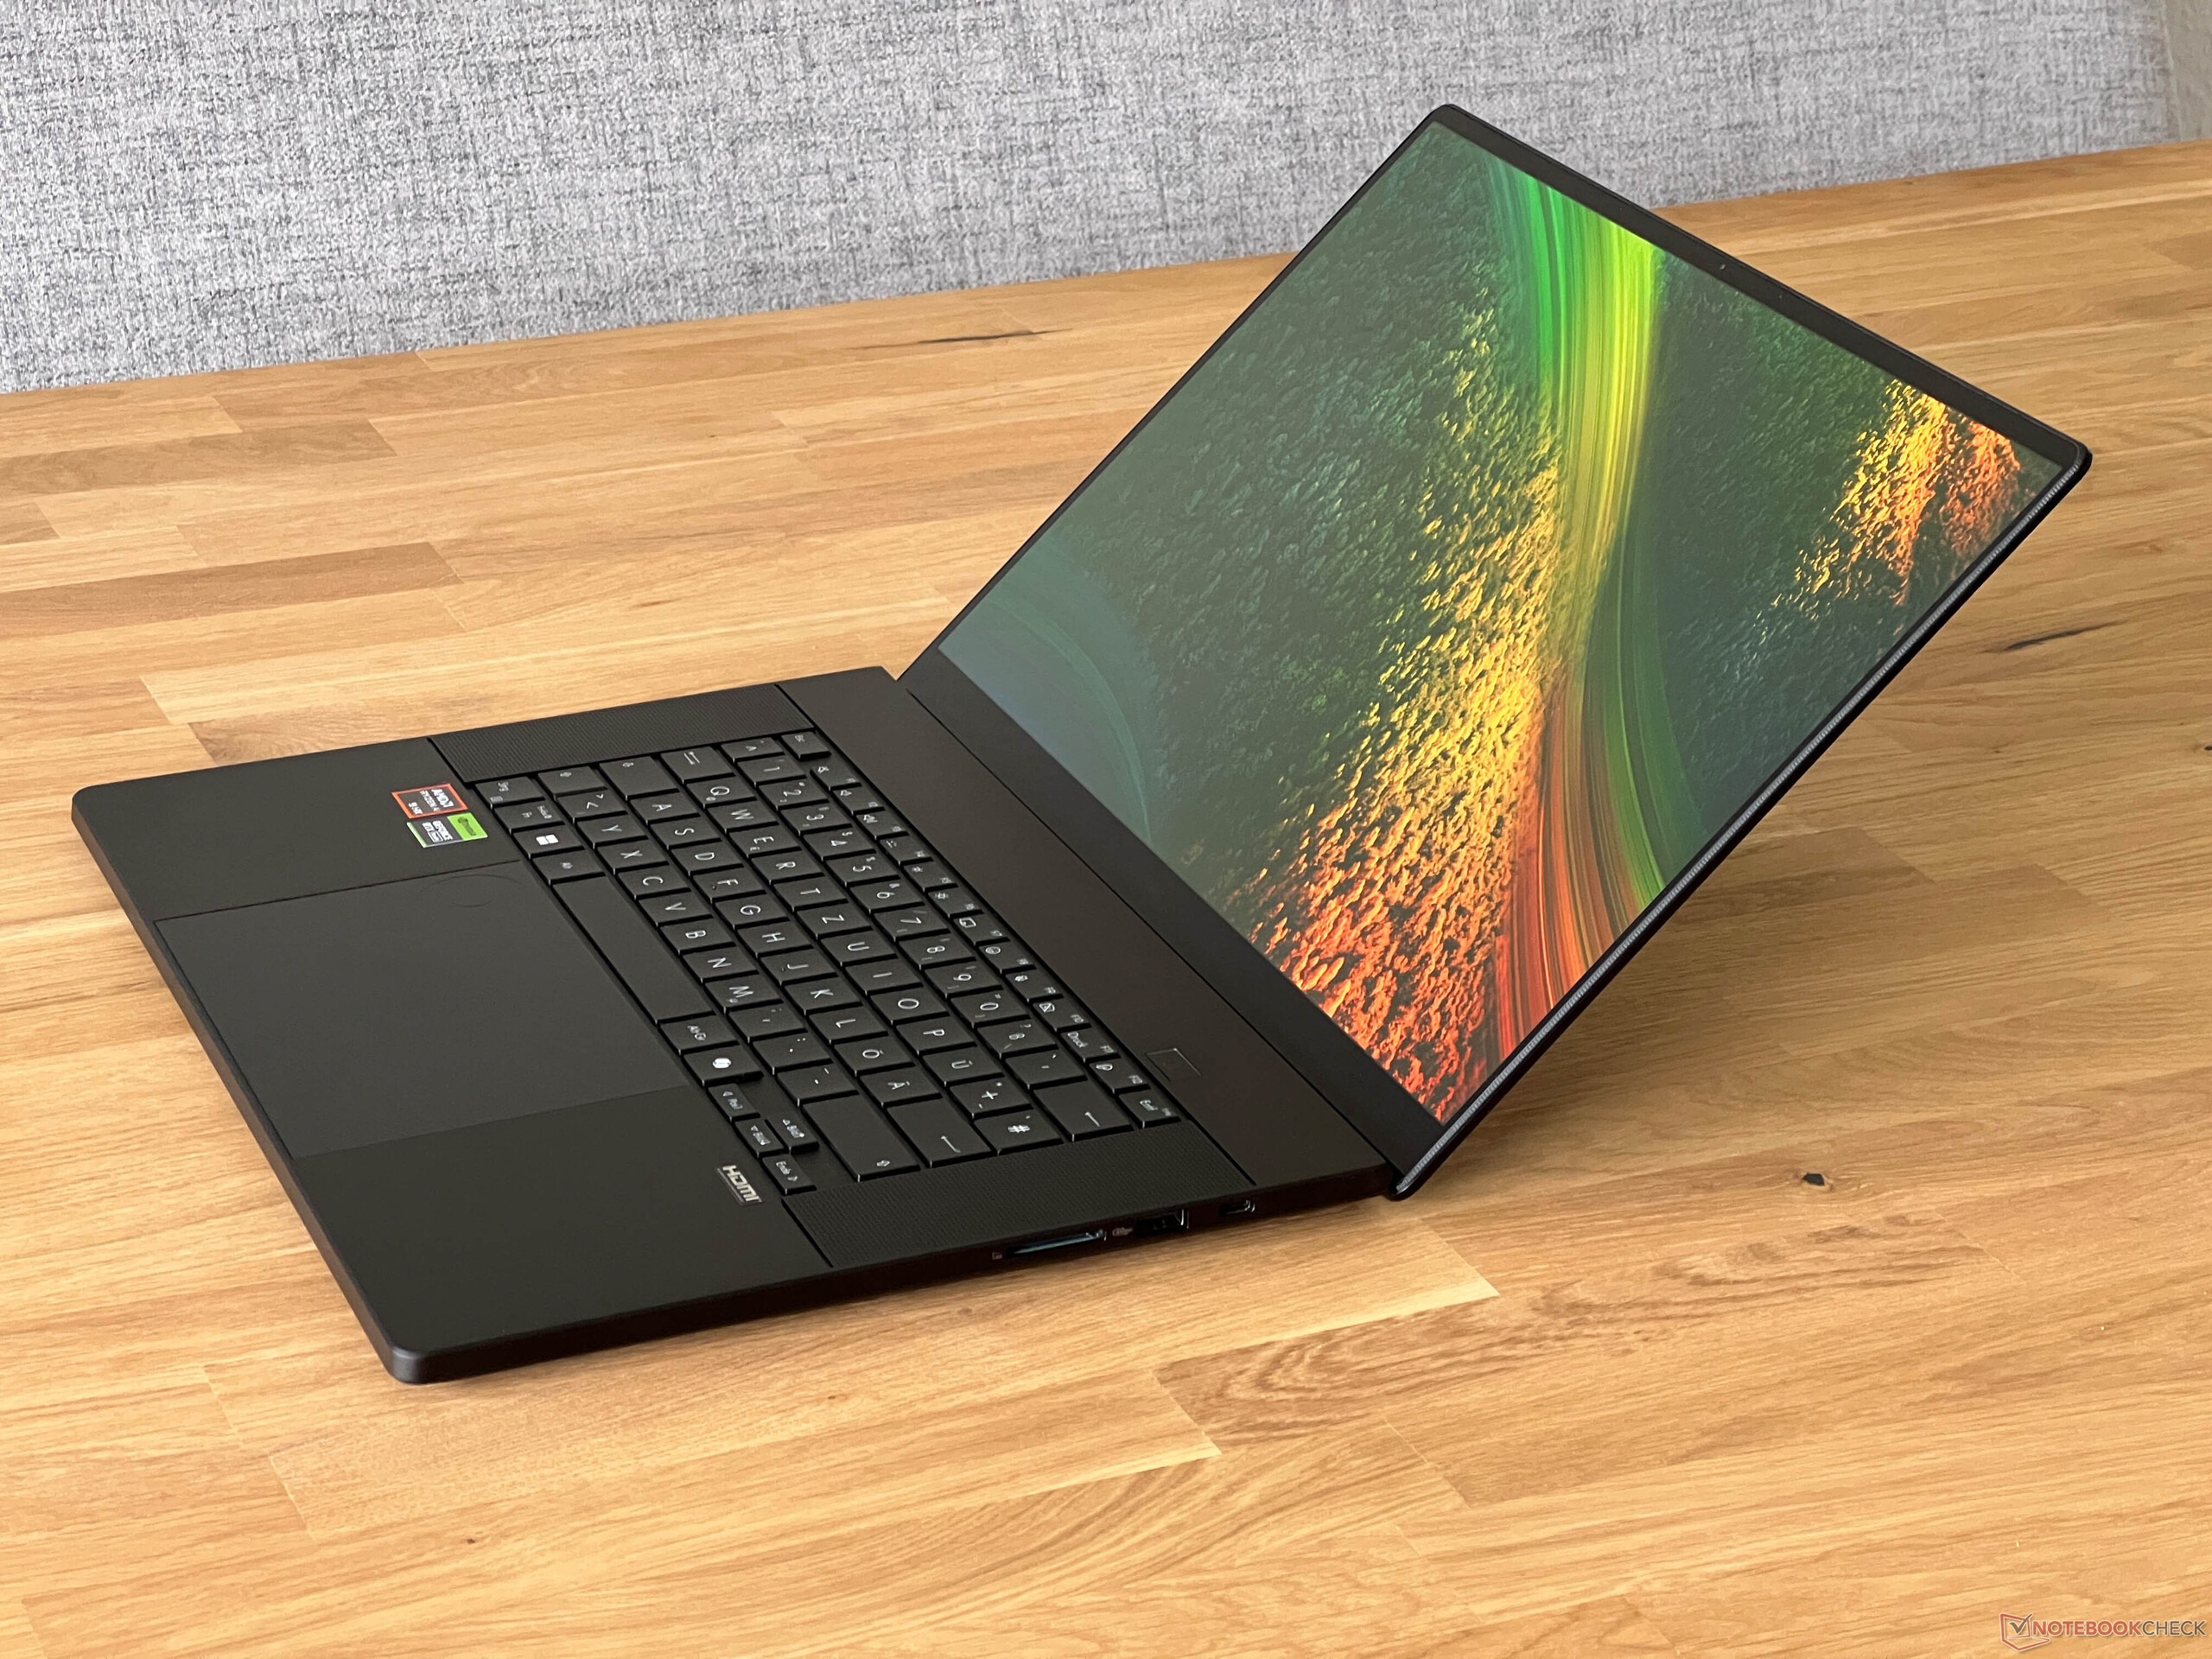
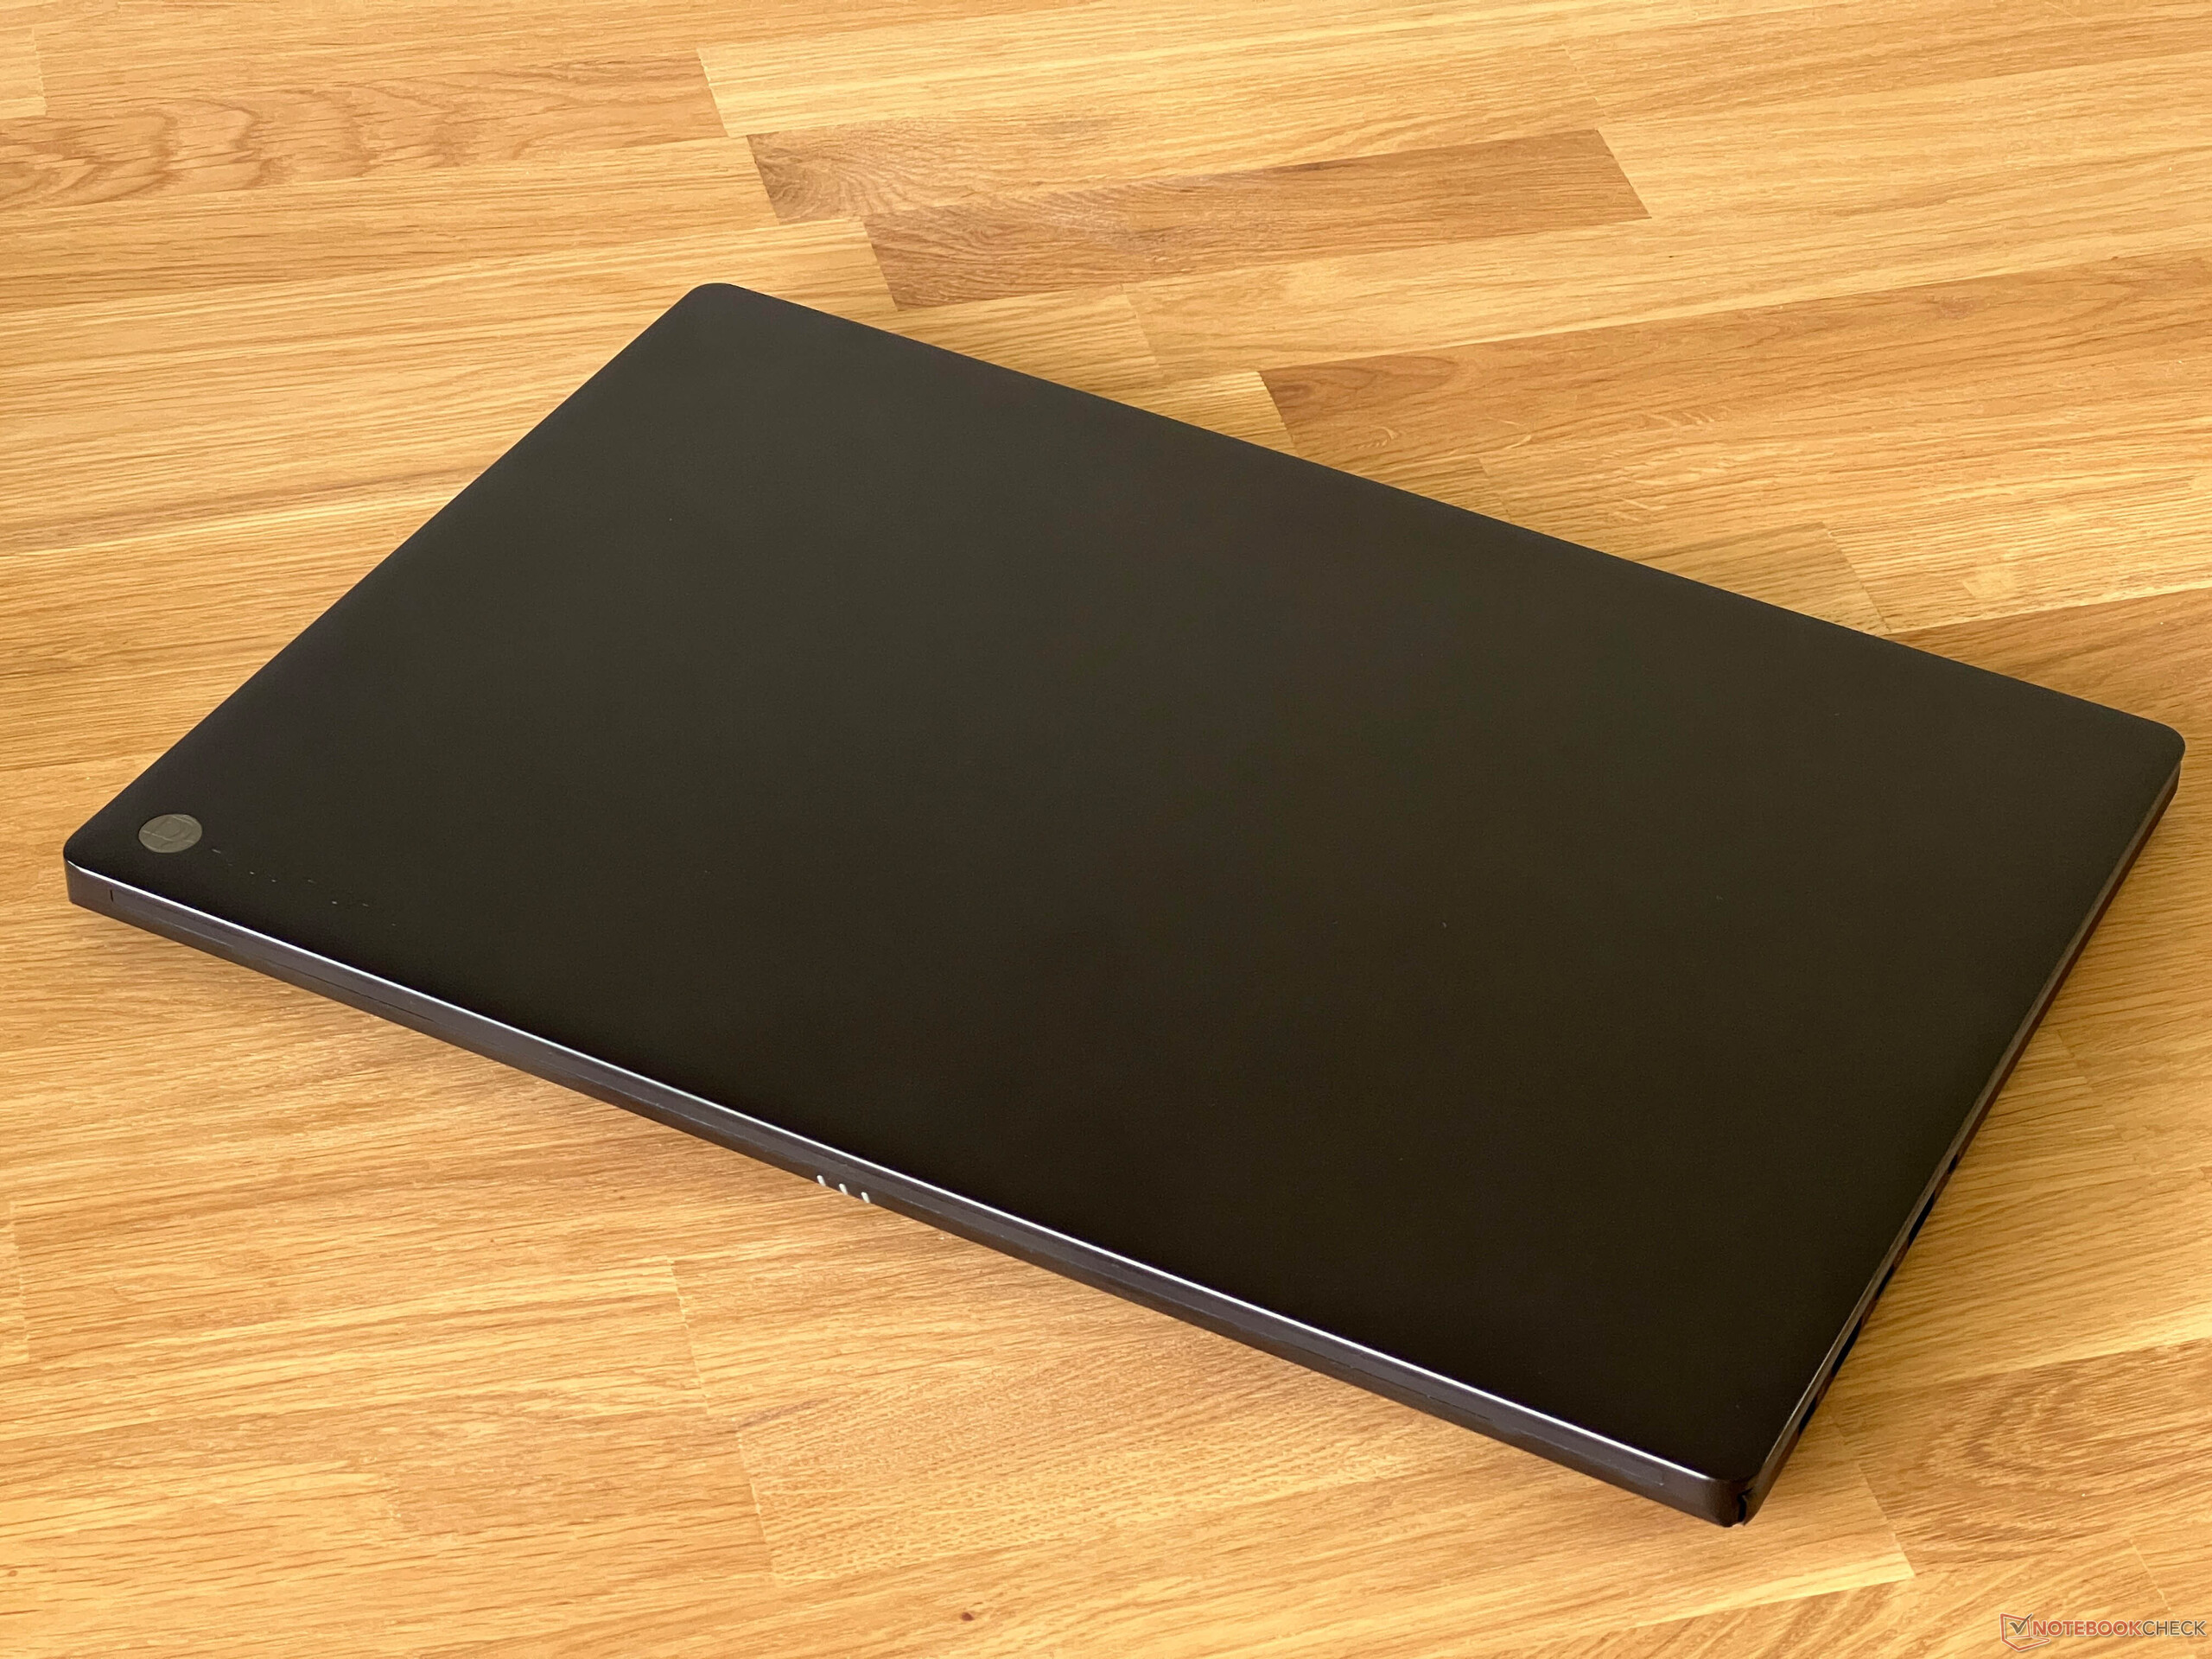
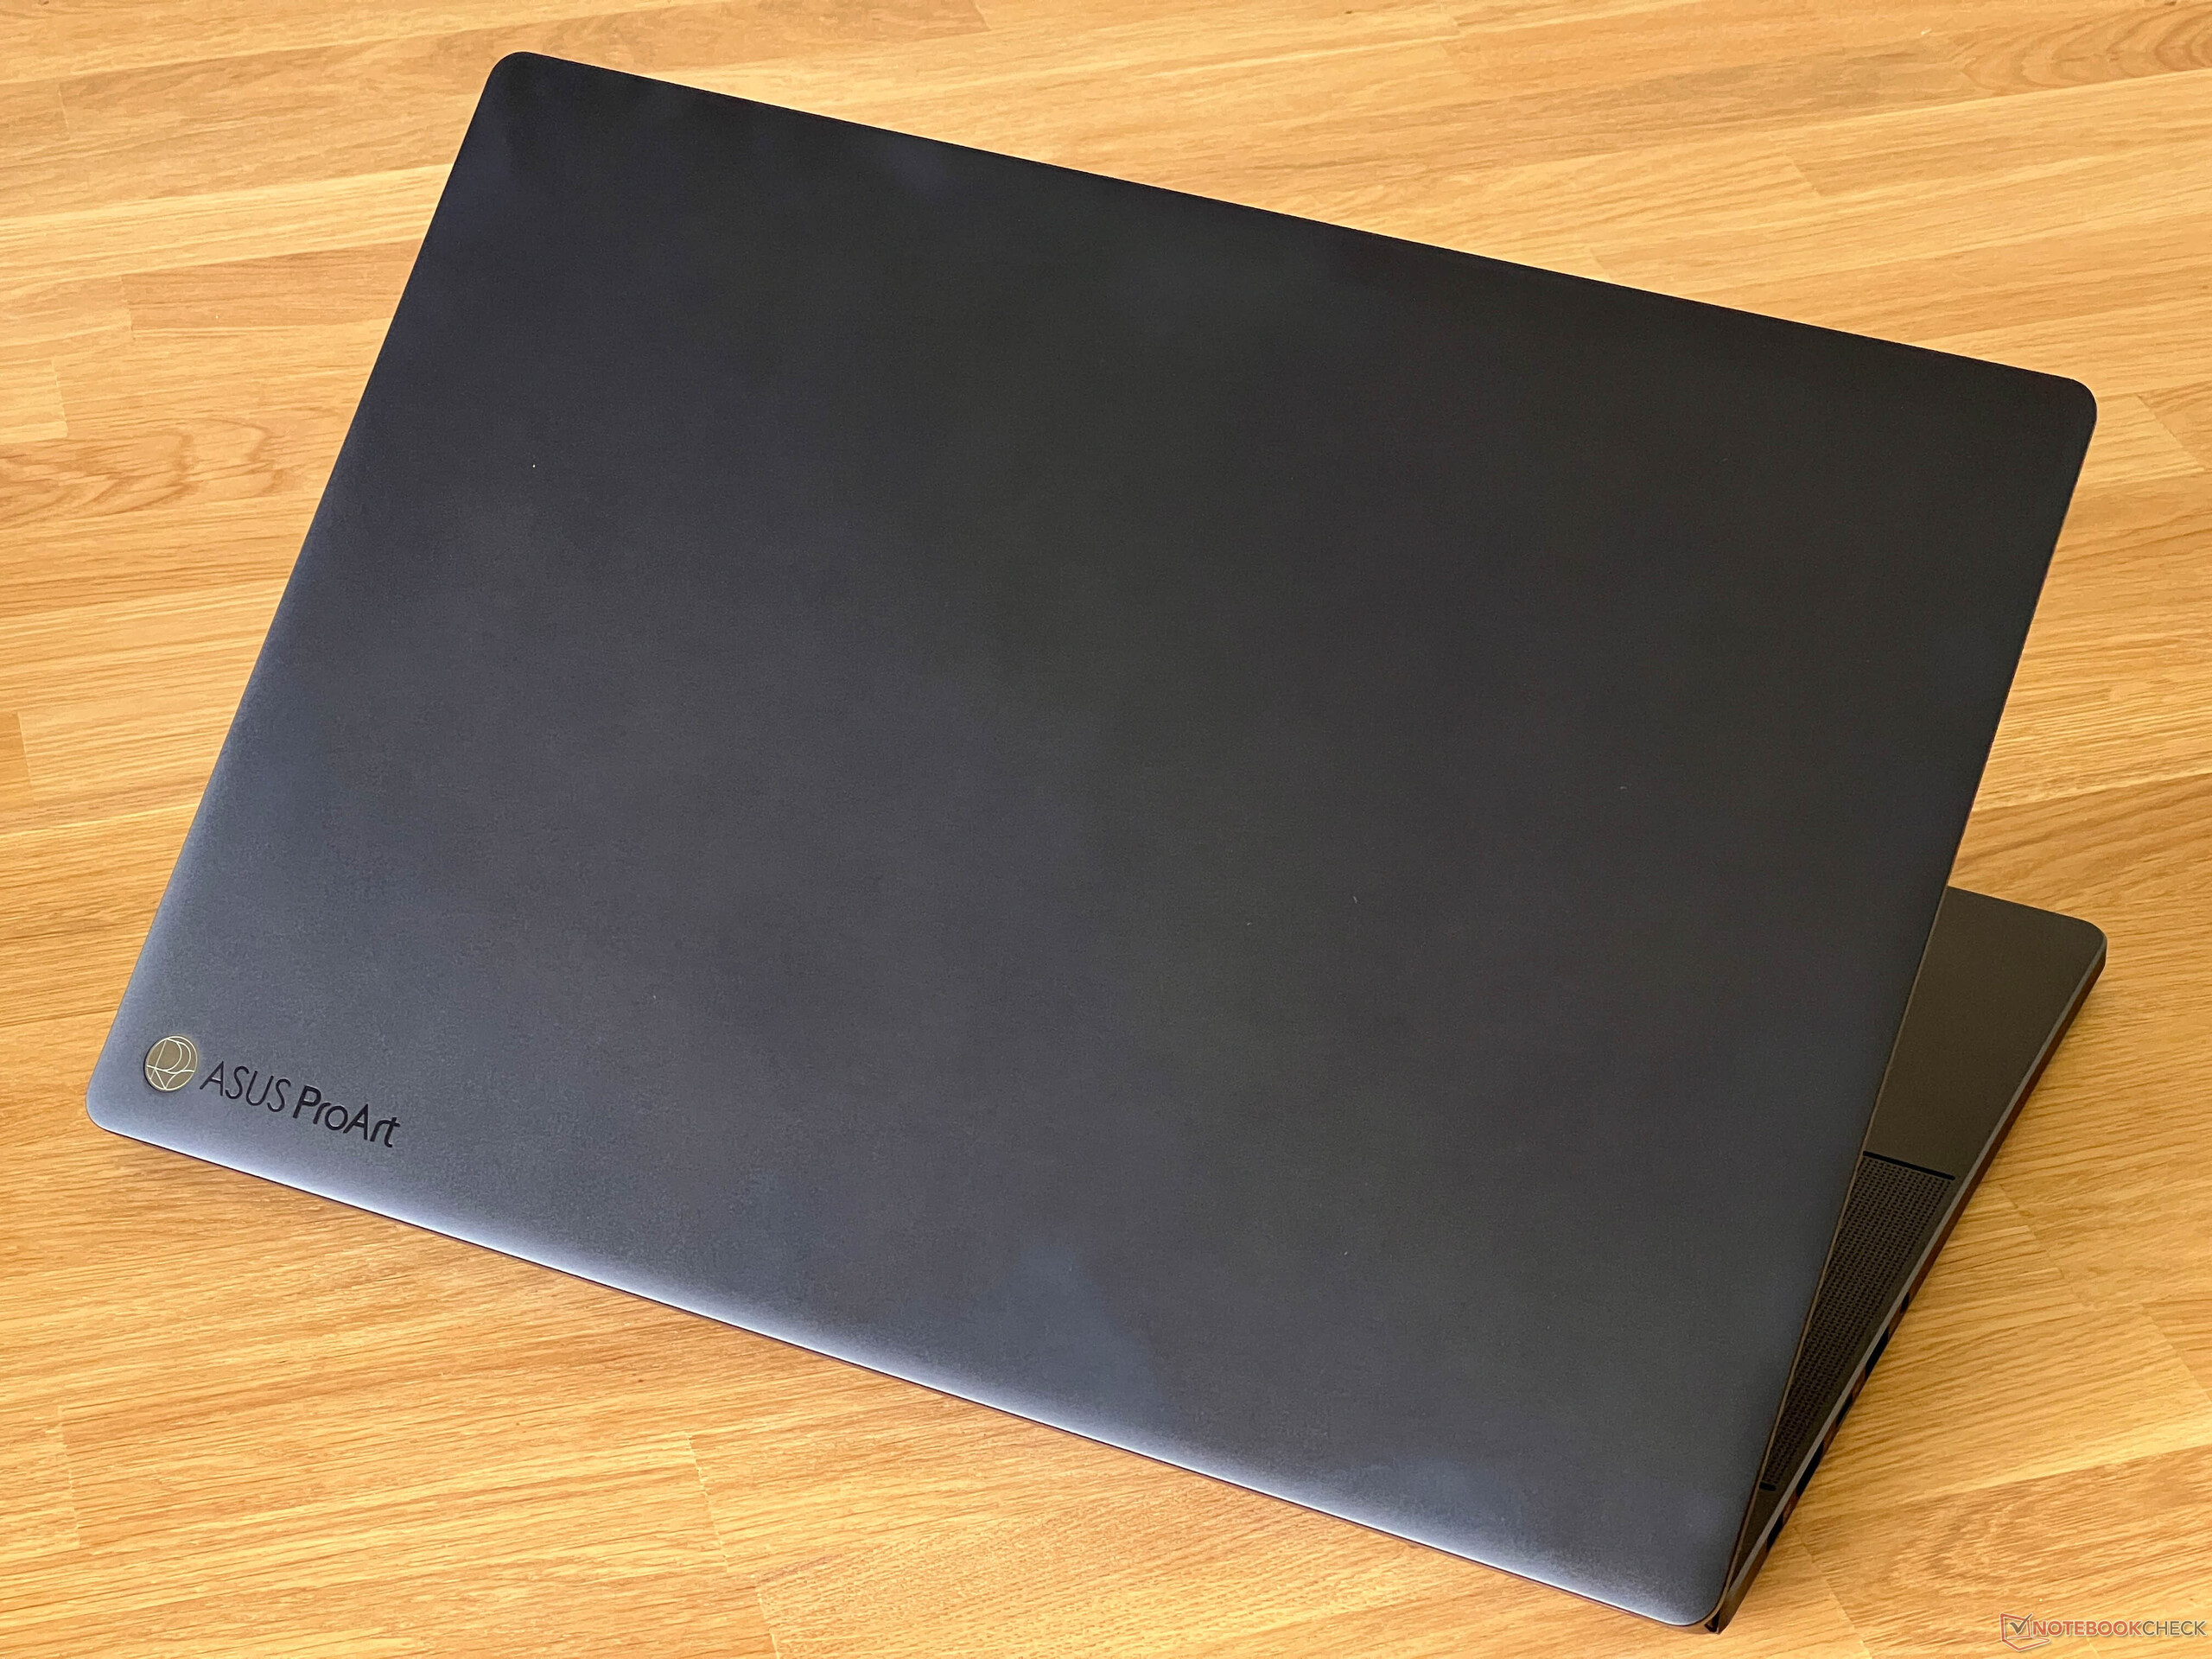
外壳 - 与 ROG Zephyrus G16 一样采用铝制一体成型机身
黑色铝合金一体成型机身与 ROG Zephyrus G16不过,ProArt 没有配备机箱的 LED 灯。只要打开屏幕盖,你就会发现键盘布局没有太多变化(缺少了额外的特殊按键,电源按钮的形状也不同),但除此之外,我们几乎只看到了相似之处,包括扬声器盖及其 4,110 个孔。ProArt P16 只有纳米黑一种颜色,容易沾染指纹。
在质量方面,P16 与 Zephyrus G16 也没有太大区别,既有积极的一面,也有消极的一面。积极的方面是出色的稳定性和制造质量,但略微松动的铰链和由此导致的明显的盖子晃动仍然是负面特征。
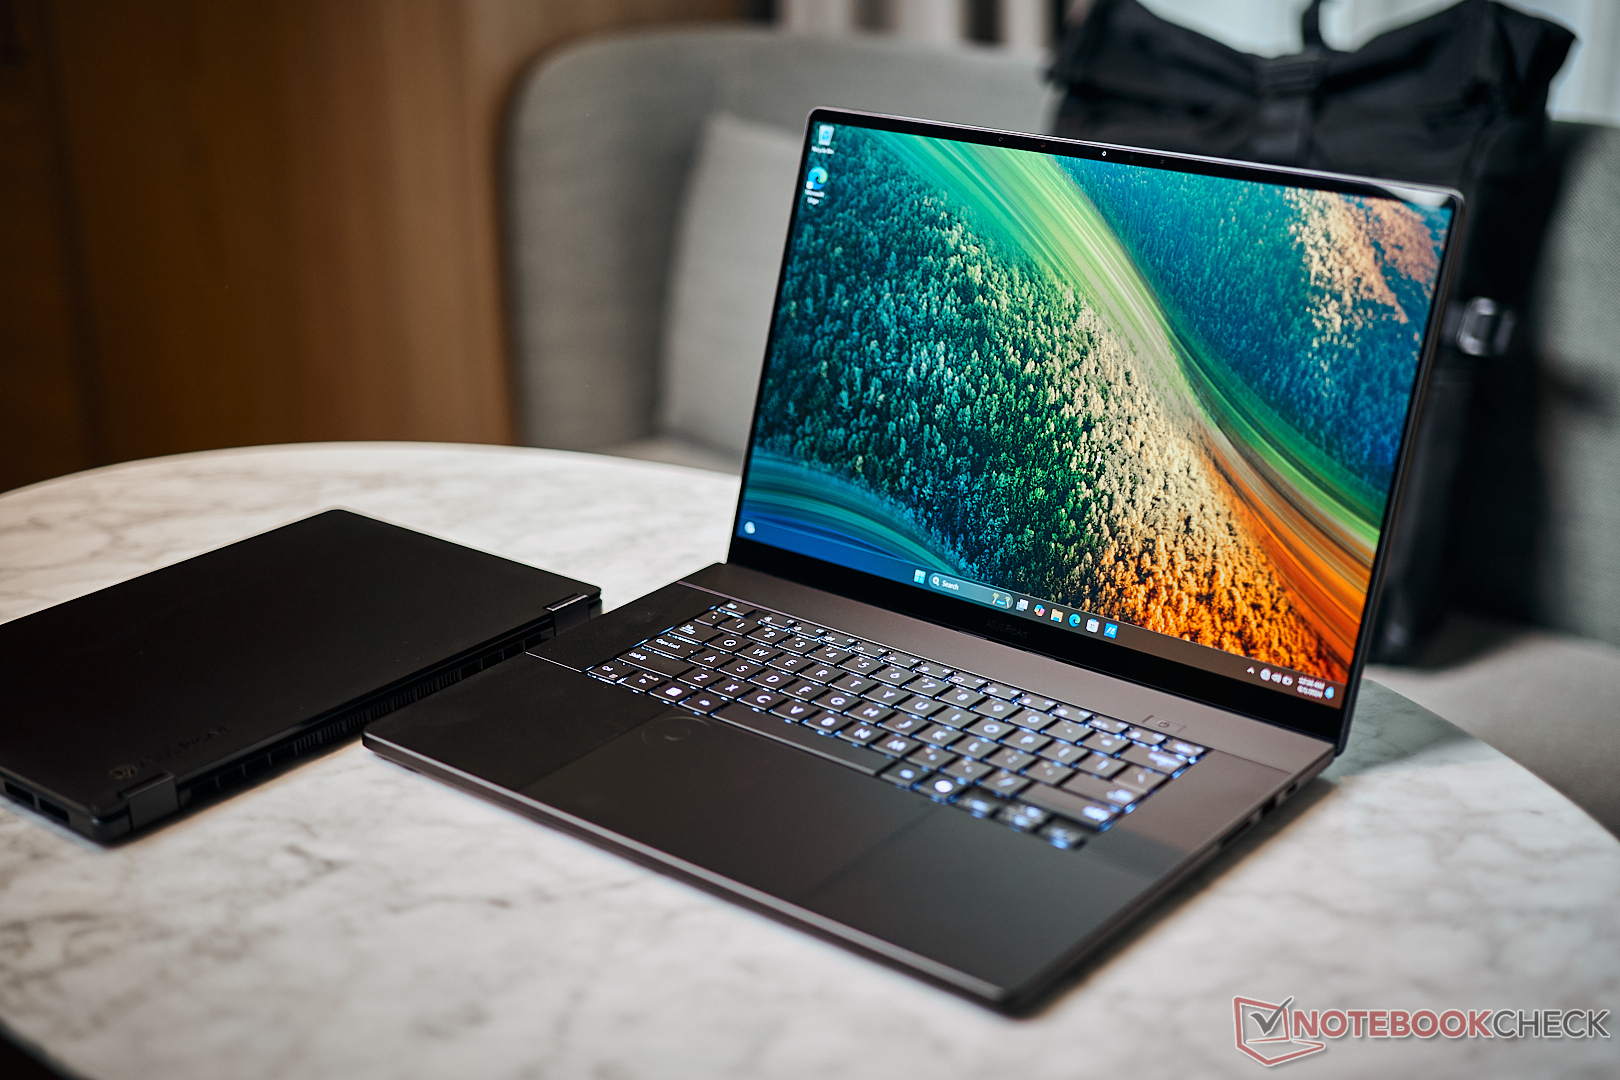
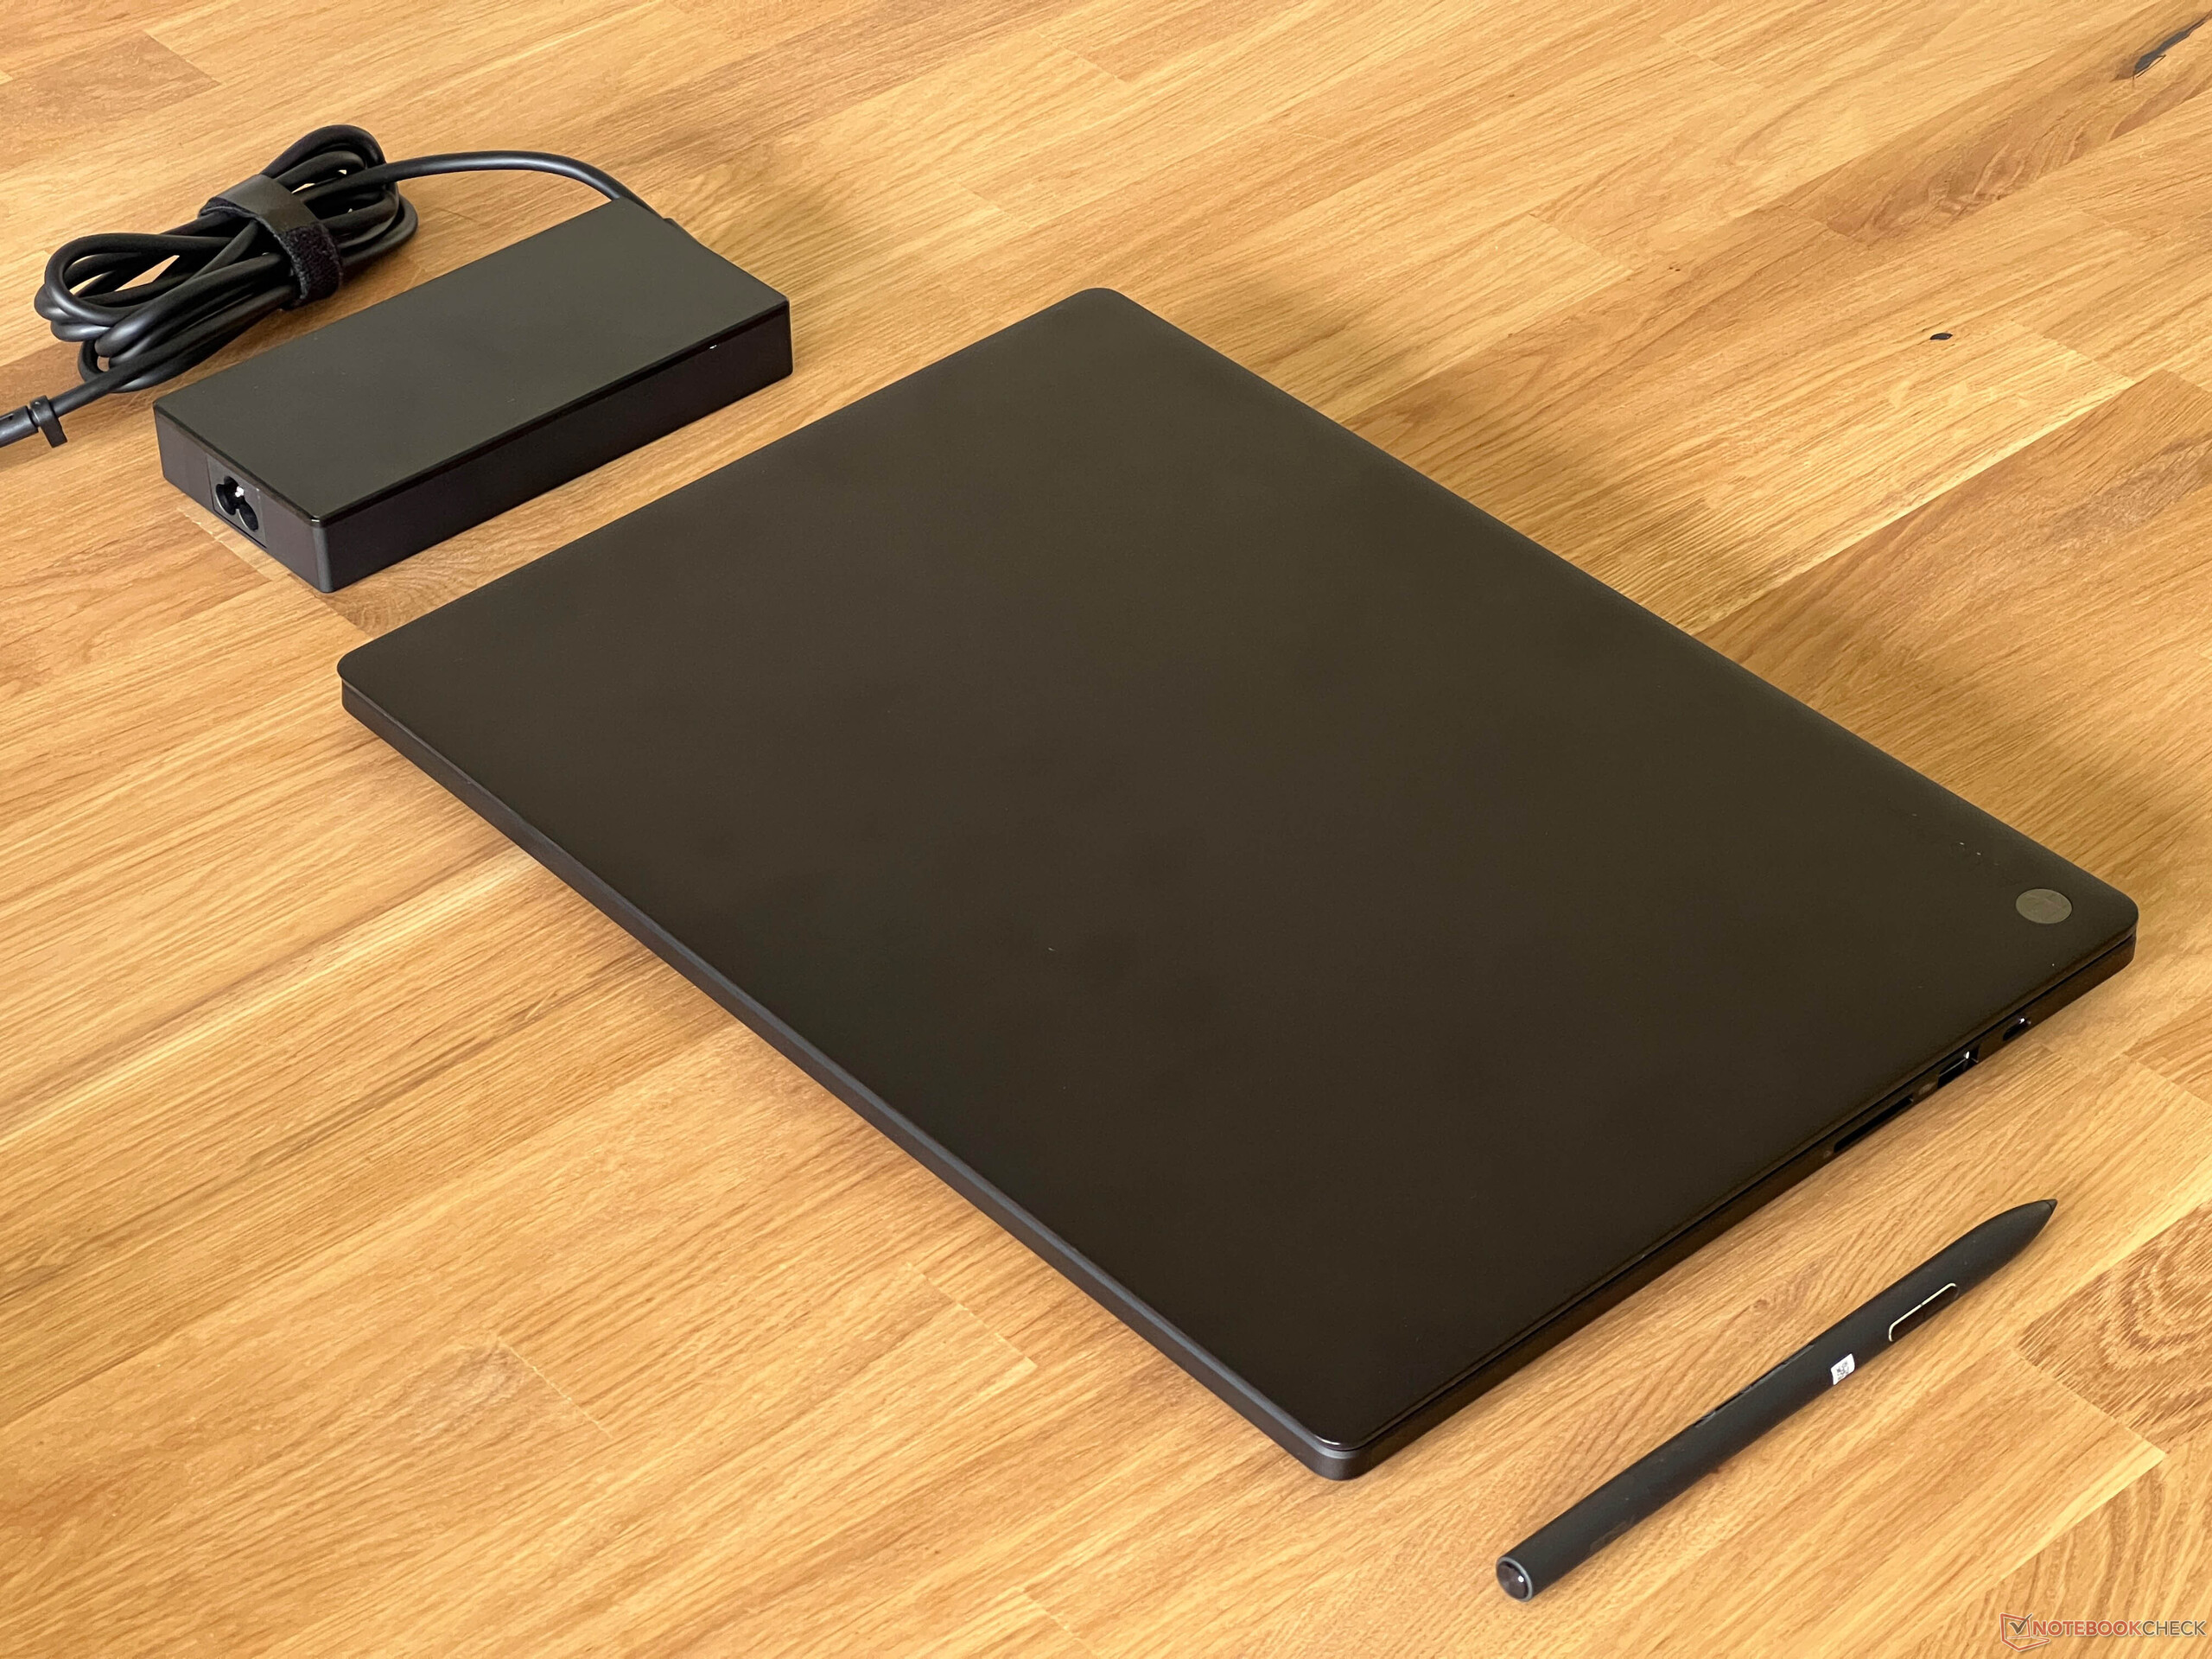
就占地面积而言,ProArt P16 处于中间位置。与 Zenbook Pro 16X 的比较也很有趣,因为这款设备的厚度只有一点点,但重量却达到了 2.4 千克,比新 P16 的 1.8 千克重得多。这也使新 P16 成为我们对比表中最轻的设备,而且距离相当远(还有结构相同的 Zephyrus G16)。200 瓦 PSU 的重量为 588 克。
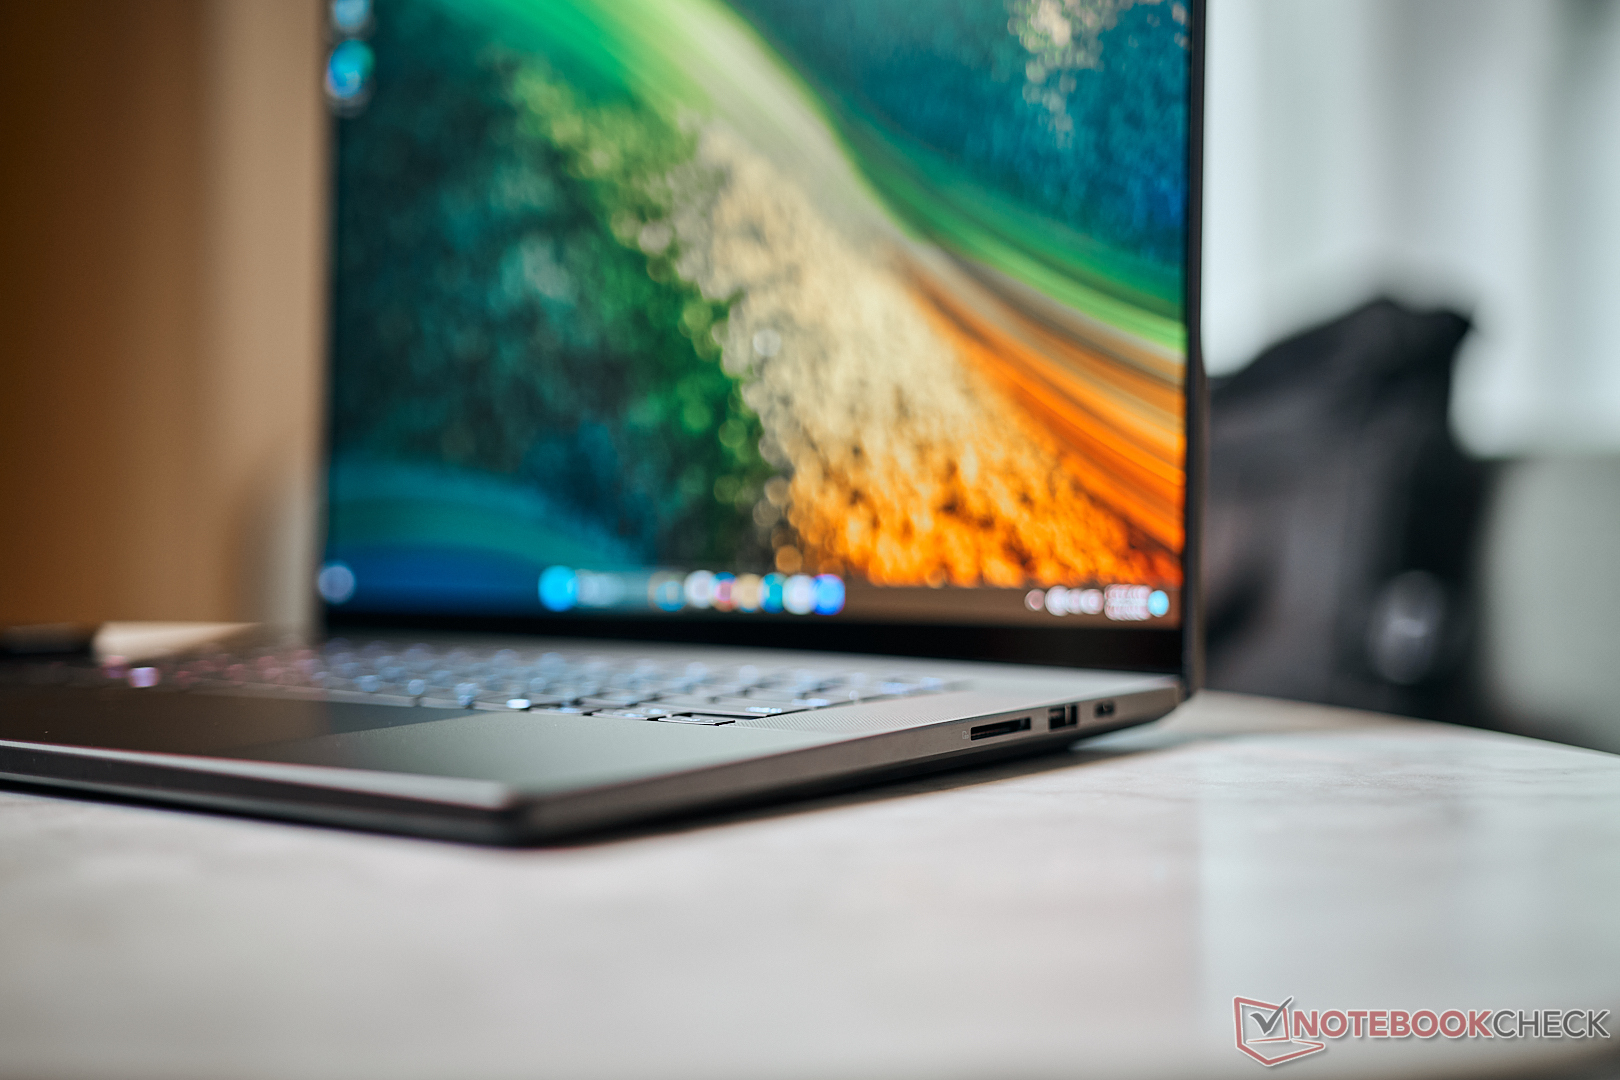
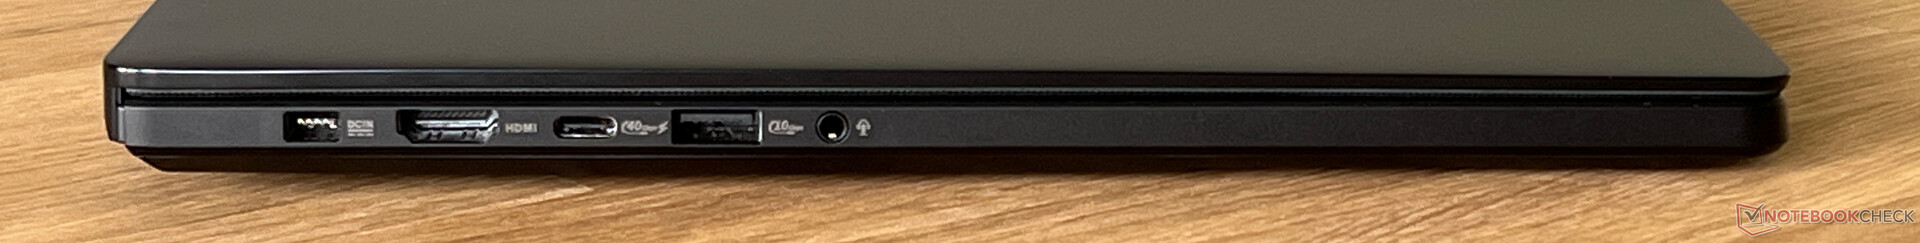
功能 - USB 4 和 Wi-Fi 7
端口位置也与 ROG Zephyrus 相同,但采用 AMD 处理器的 ProArt P16 的 USB 4.0 端口不支持 Thunderbolt 4。不过,所有重要的连接器都在机身上,这意味着日常使用时不会有任何问题。
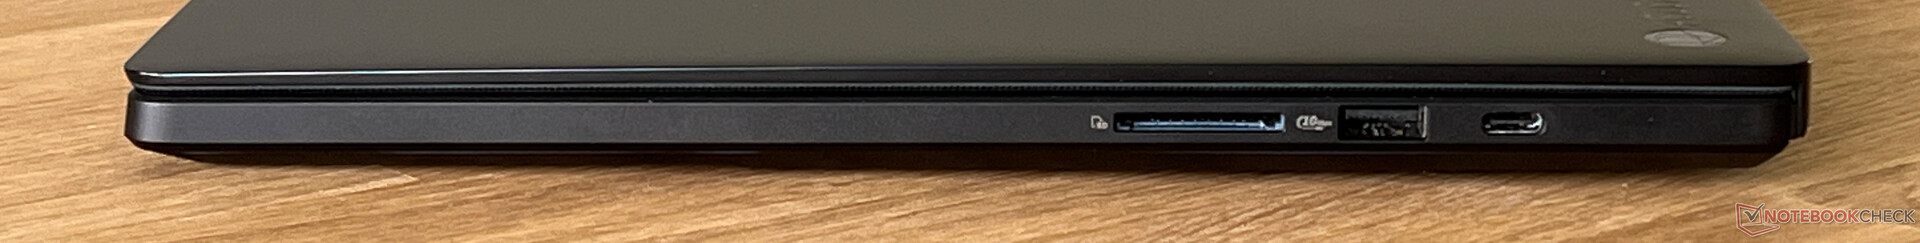
SD 读卡器
右侧的 SD 读卡器虽然不能完全容纳存储卡,但与 Zephyrus 相比,速度有所提高。与我们的参考卡(Angelbird AV Pro V60)搭配使用时,传输速度明显提高,最高可达 254 MB/s,复制数据时也能达到 127 MB/s。
| SD Card Reader | |
| average JPG Copy Test (av. of 3 runs) | |
| Apple MacBook Pro 16 2023 M3 Max (Angelbird AV Pro V60) | |
| Dell XPS 16 9640 (Angelbird AV Pro V60) | |
| Asus ProArt P16 H7606WI (Angelbird AV Pro V60) | |
| Average of class Multimedia (18.4 - 201, n=56, last 2 years) | |
| Asus Zenbook Pro 16X UX7602BZ-MY005W | |
| SCHENKER XMG Pro 16 Studio (Mid 24) (AV PRO microSD 128 GB V60) | |
| Asus ROG Zephyrus G16 2024 GU605M | |
| Lenovo Yoga Pro 9 16IMH9 (Angelbird AV Pro V60) | |
| maximum AS SSD Seq Read Test (1GB) | |
| Asus ProArt P16 H7606WI (Angelbird AV Pro V60) | |
| Apple MacBook Pro 16 2023 M3 Max (Angelbird AV Pro V60) | |
| Dell XPS 16 9640 (Angelbird AV Pro V60) | |
| Average of class Multimedia (25.8 - 266, n=56, last 2 years) | |
| Asus ROG Zephyrus G16 2024 GU605M | |
| Lenovo Yoga Pro 9 16IMH9 (Angelbird AV Pro V60) | |
| SCHENKER XMG Pro 16 Studio (Mid 24) (AV PRO microSD 128 GB V60) | |
| Asus Zenbook Pro 16X UX7602BZ-MY005W | |
交流
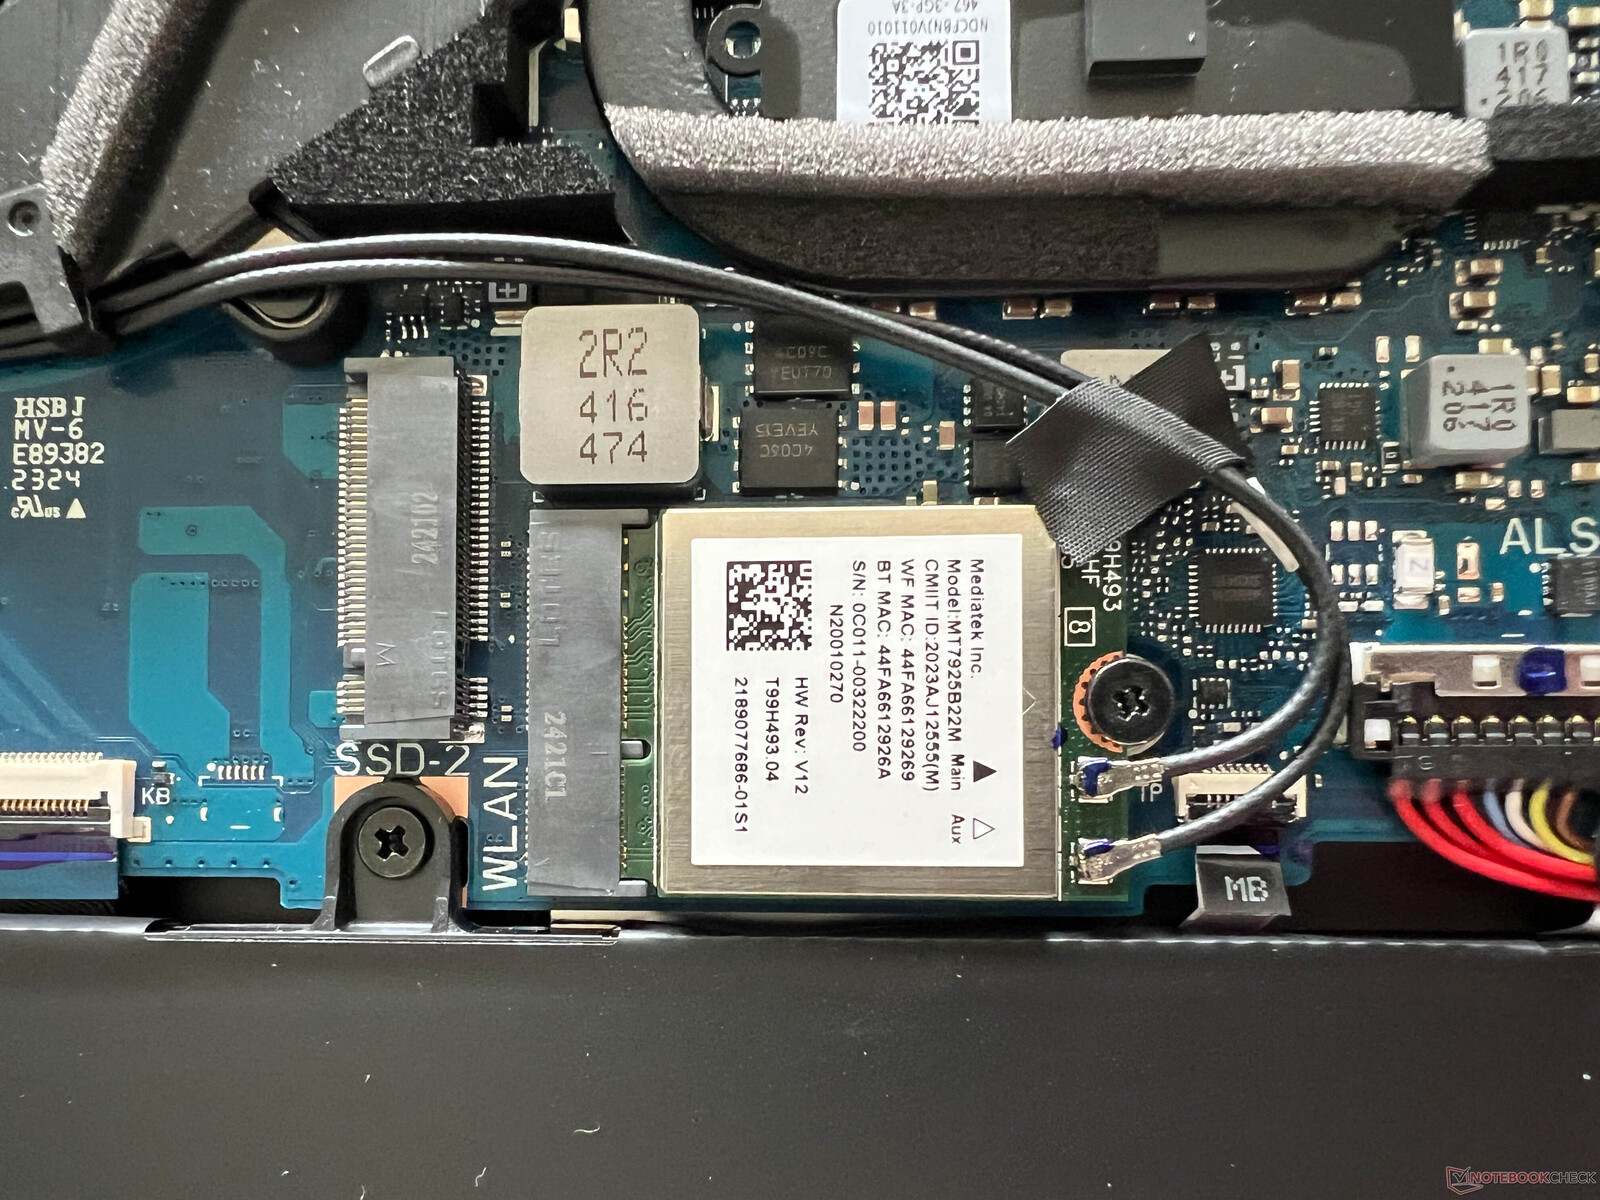
华硕为 ProArt P16 配备了现代联发科(MT7925)Wi-Fi 7 模块,该模块还支持蓝牙 5.4。在华硕参考路由器的配合下,我们记录到了非常高的传输速度,这在目前的笔记本电脑中是数一数二的。在测试过程中,我们也没有遇到任何无线网络连接问题。
| Networking | |
| Asus ProArt P16 H7606WI | |
| iperf3 transmit AXE11000 | |
| iperf3 receive AXE11000 | |
| SCHENKER XMG Pro 16 Studio (Mid 24) | |
| iperf3 transmit AXE11000 | |
| iperf3 receive AXE11000 | |
| Lenovo Yoga Pro 9 16IMH9 | |
| iperf3 transmit AXE11000 | |
| iperf3 receive AXE11000 | |
| Dell XPS 16 9640 | |
| iperf3 transmit AXE11000 | |
| iperf3 receive AXE11000 | |
| Asus ROG Zephyrus G16 2024 GU605M | |
| iperf3 transmit AXE11000 | |
| iperf3 receive AXE11000 | |
| Apple MacBook Pro 16 2023 M3 Max | |
| iperf3 transmit AXE11000 | |
| iperf3 receive AXE11000 | |
| Asus Zenbook Pro 16X UX7602BZ-MY005W | |
| iperf3 transmit AXE11000 | |
| iperf3 receive AXE11000 | |
| iperf3 transmit AXE11000 6GHz | |
| iperf3 receive AXE11000 6GHz | |
网络摄像头
1080p 网络摄像头支持当前的 Windows Studio Effects,但图像质量不是特别好。此外,它还配备了红外模块,可通过 Windows Hello 进行人脸识别。


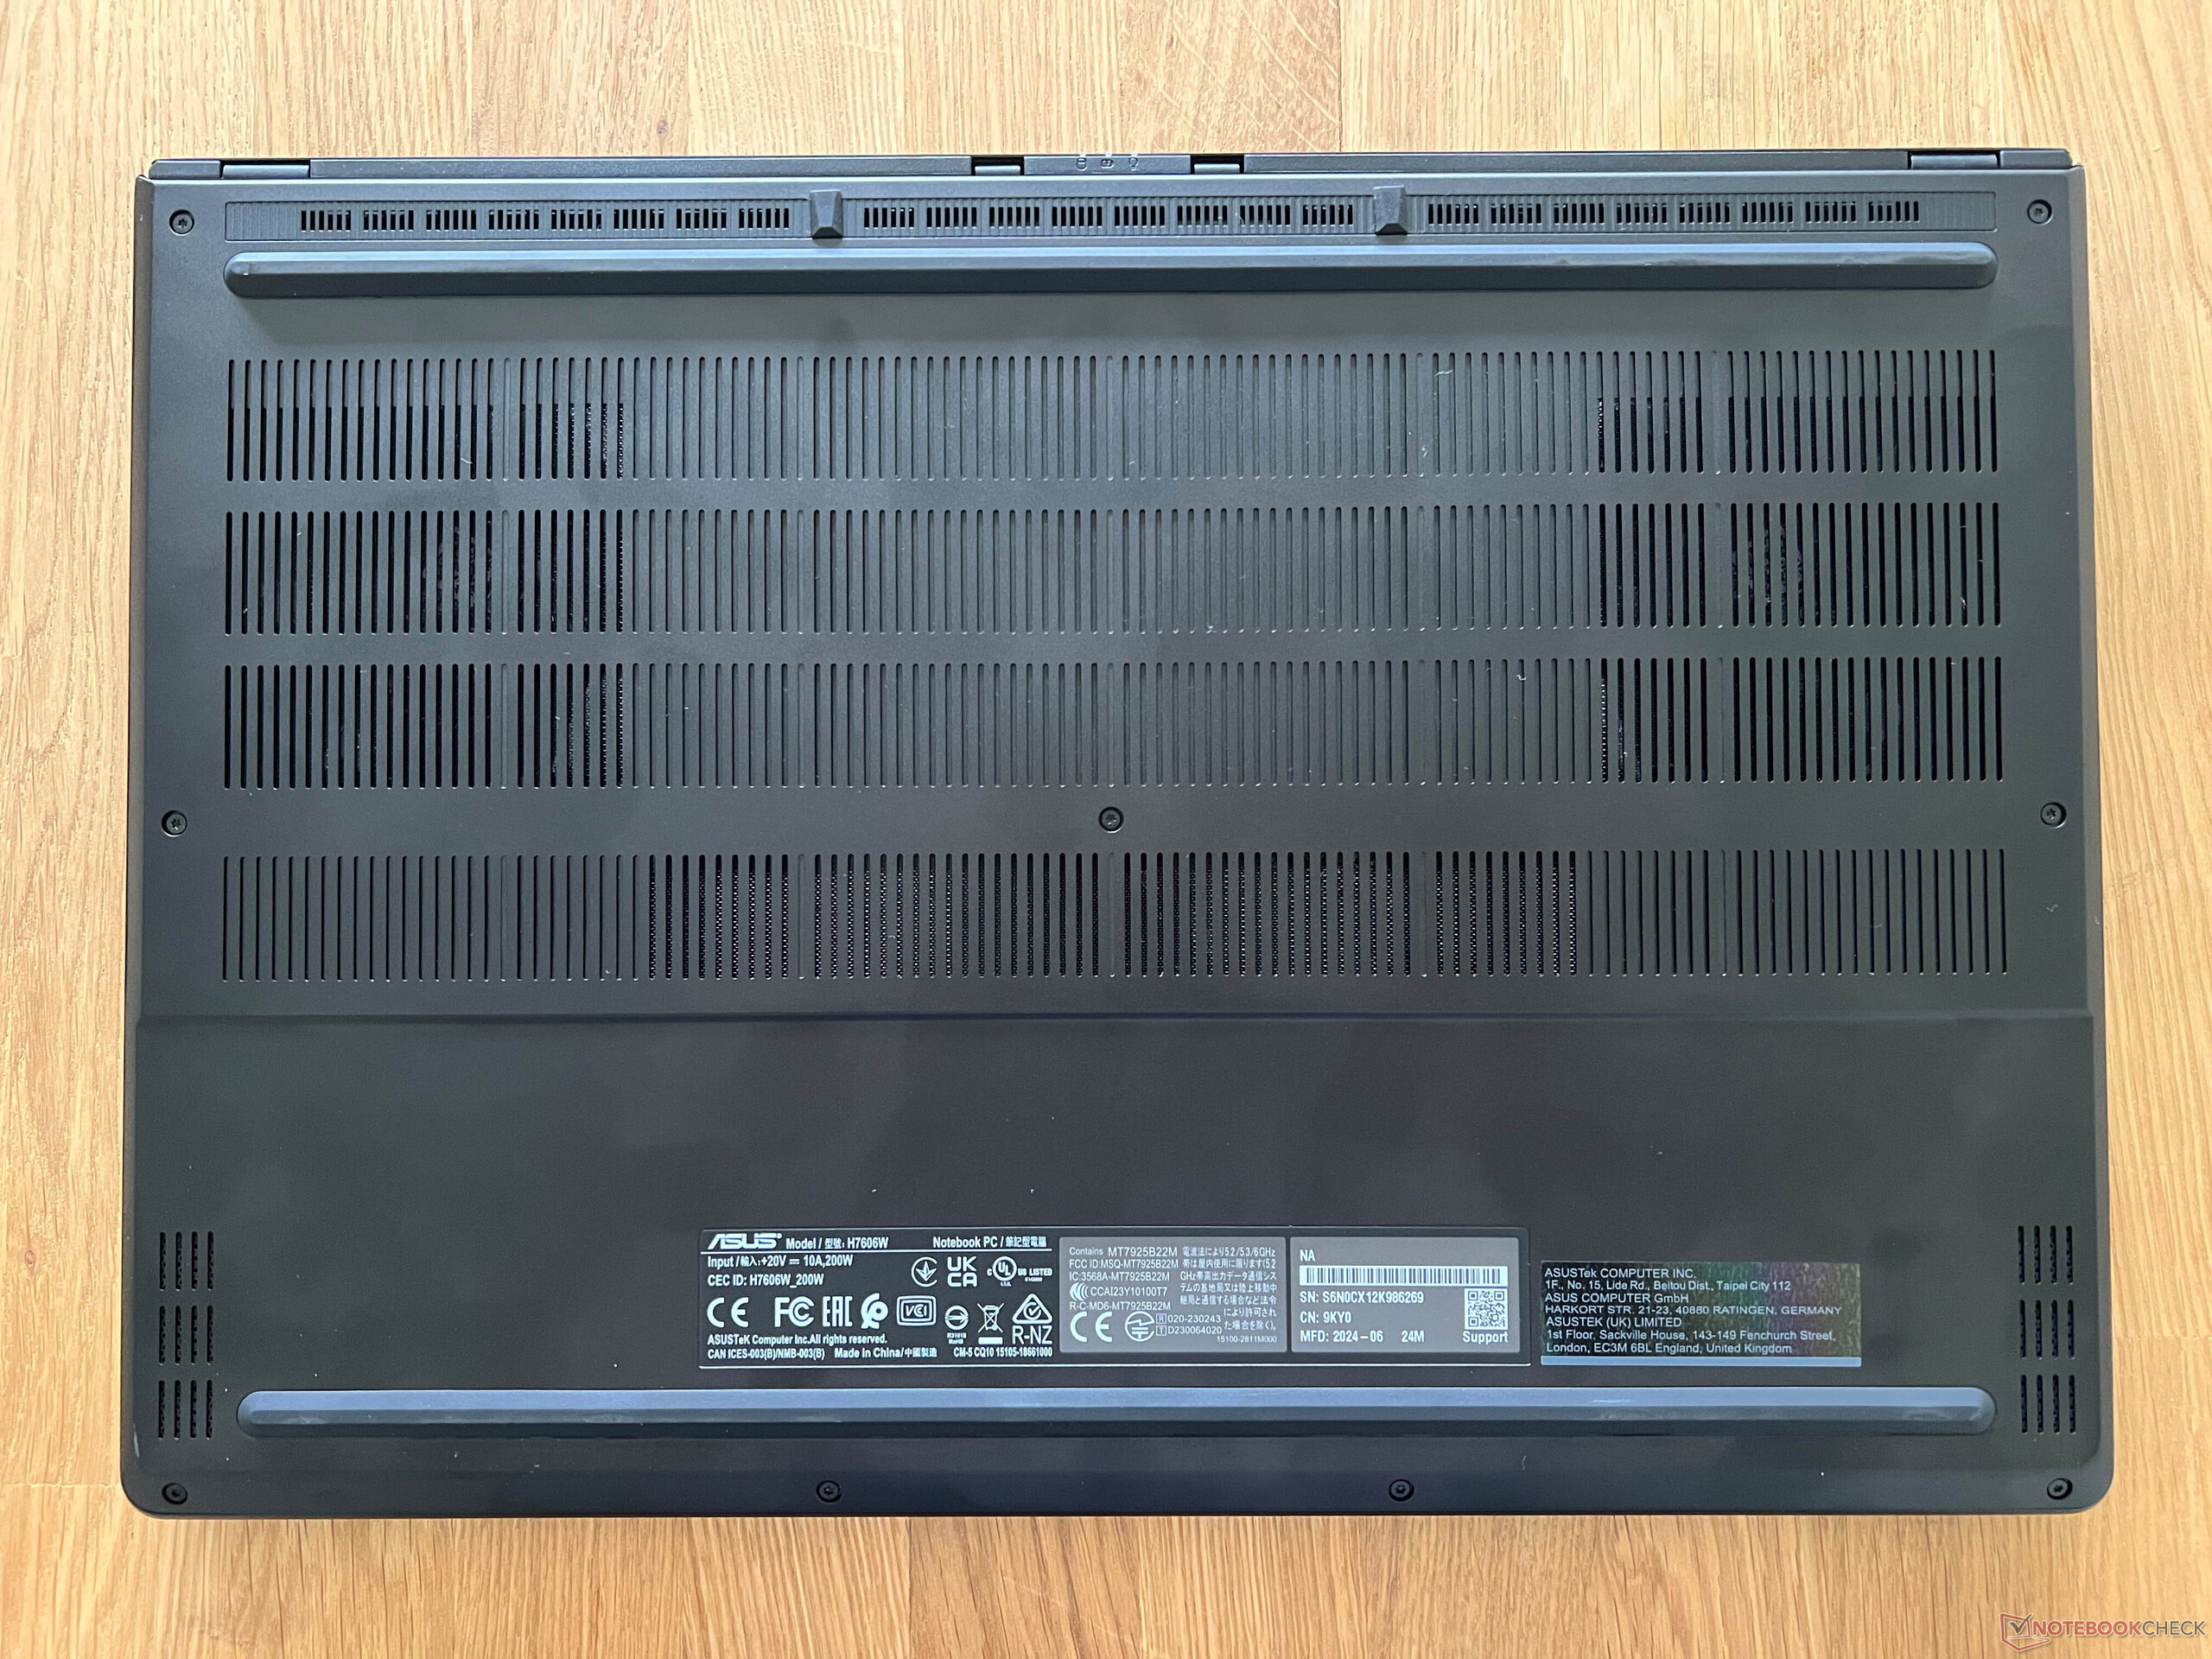
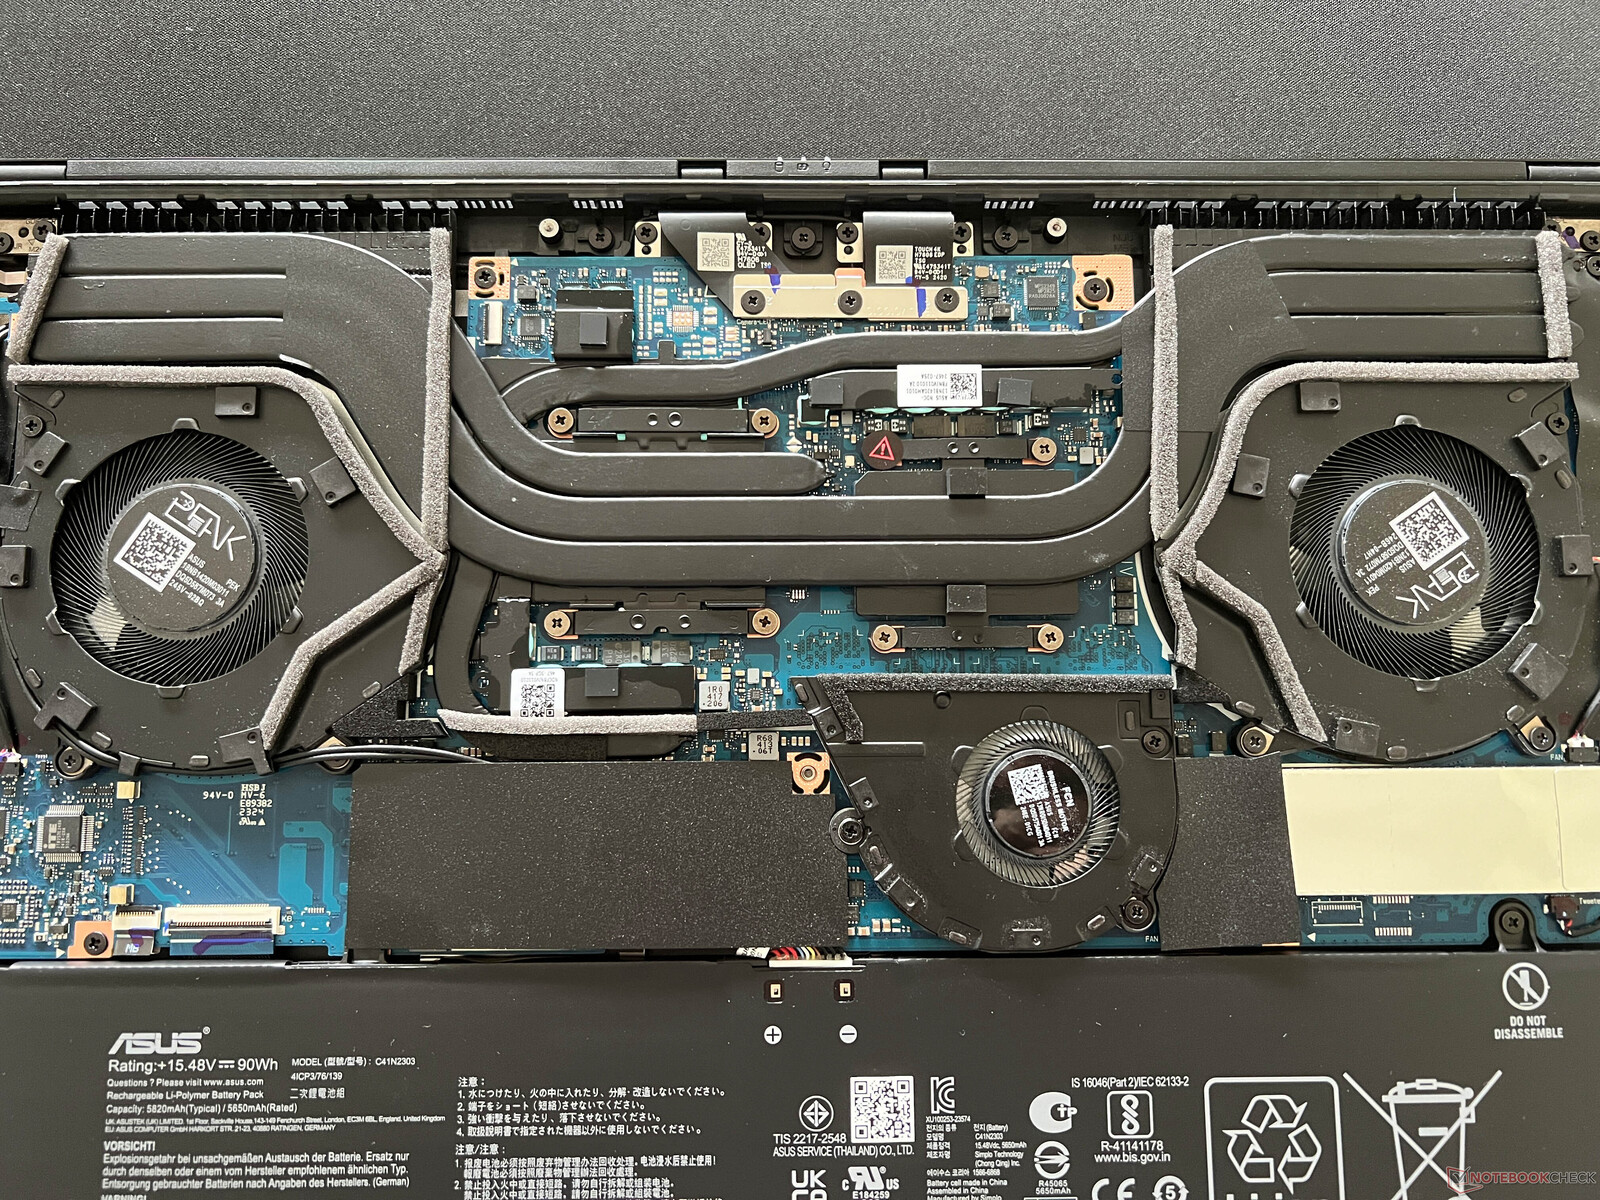
维护
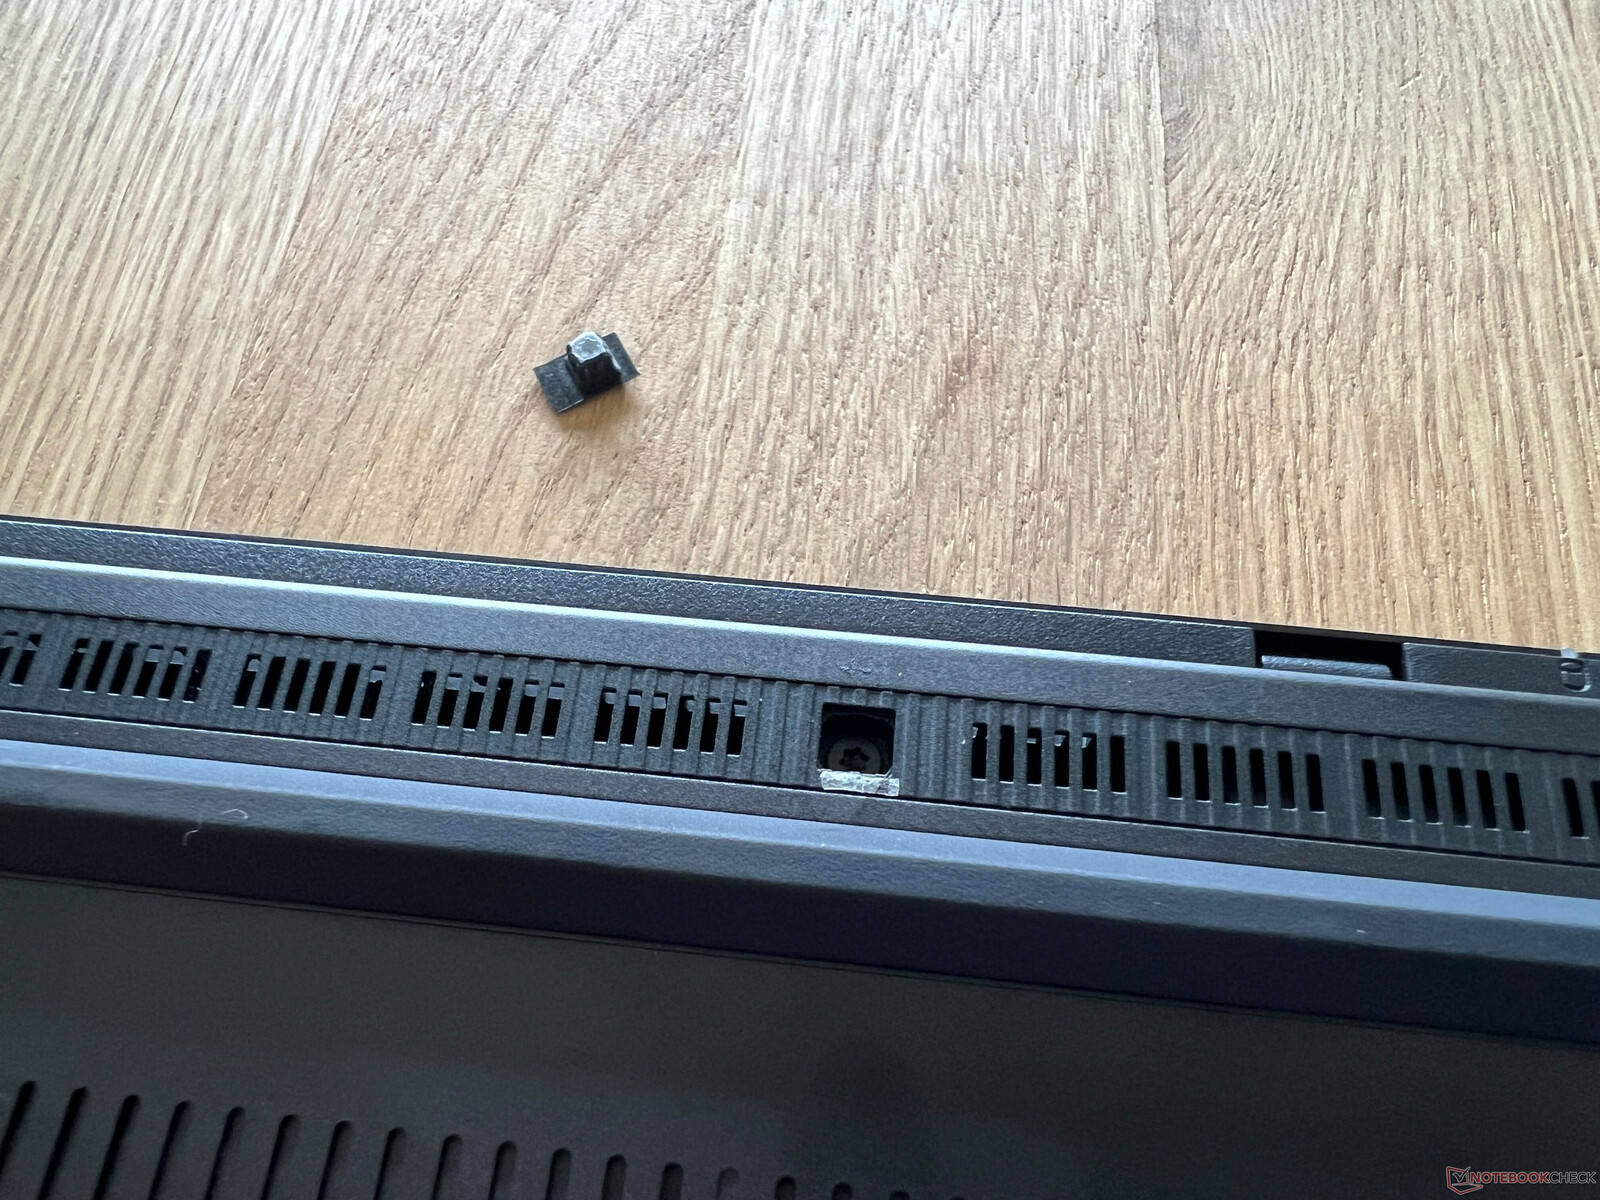
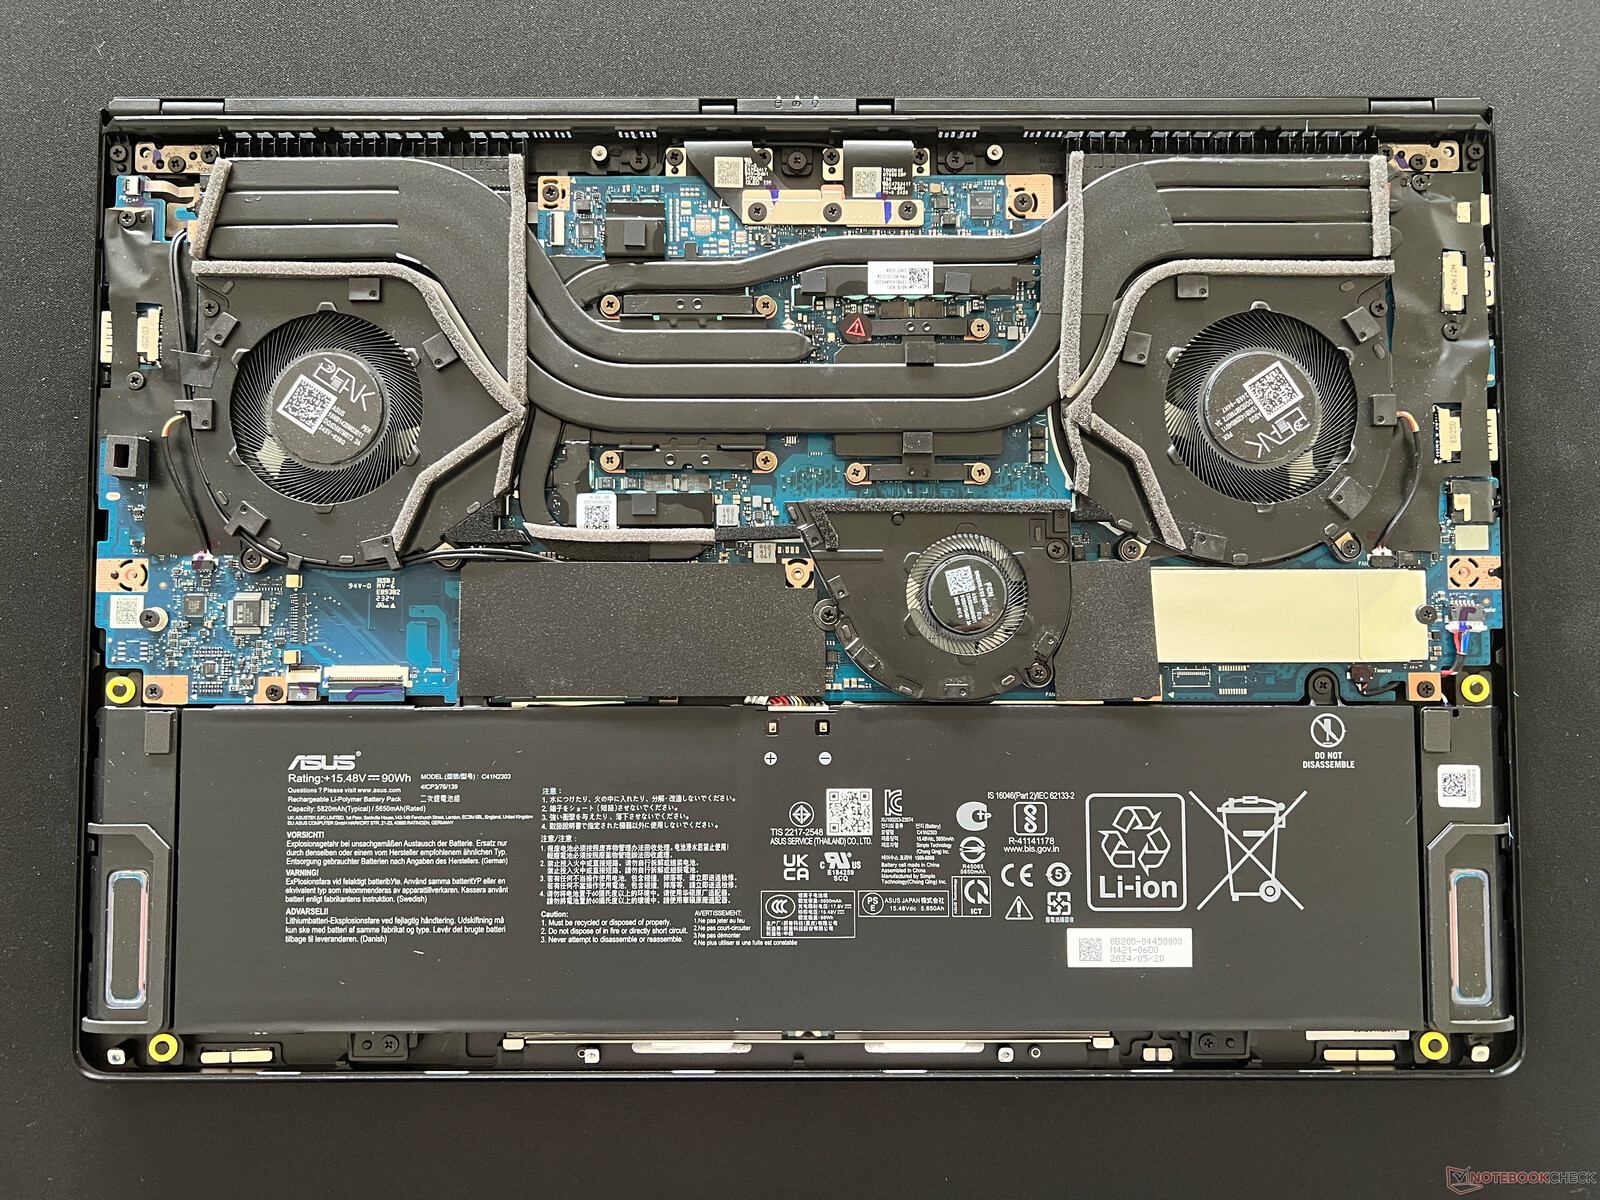
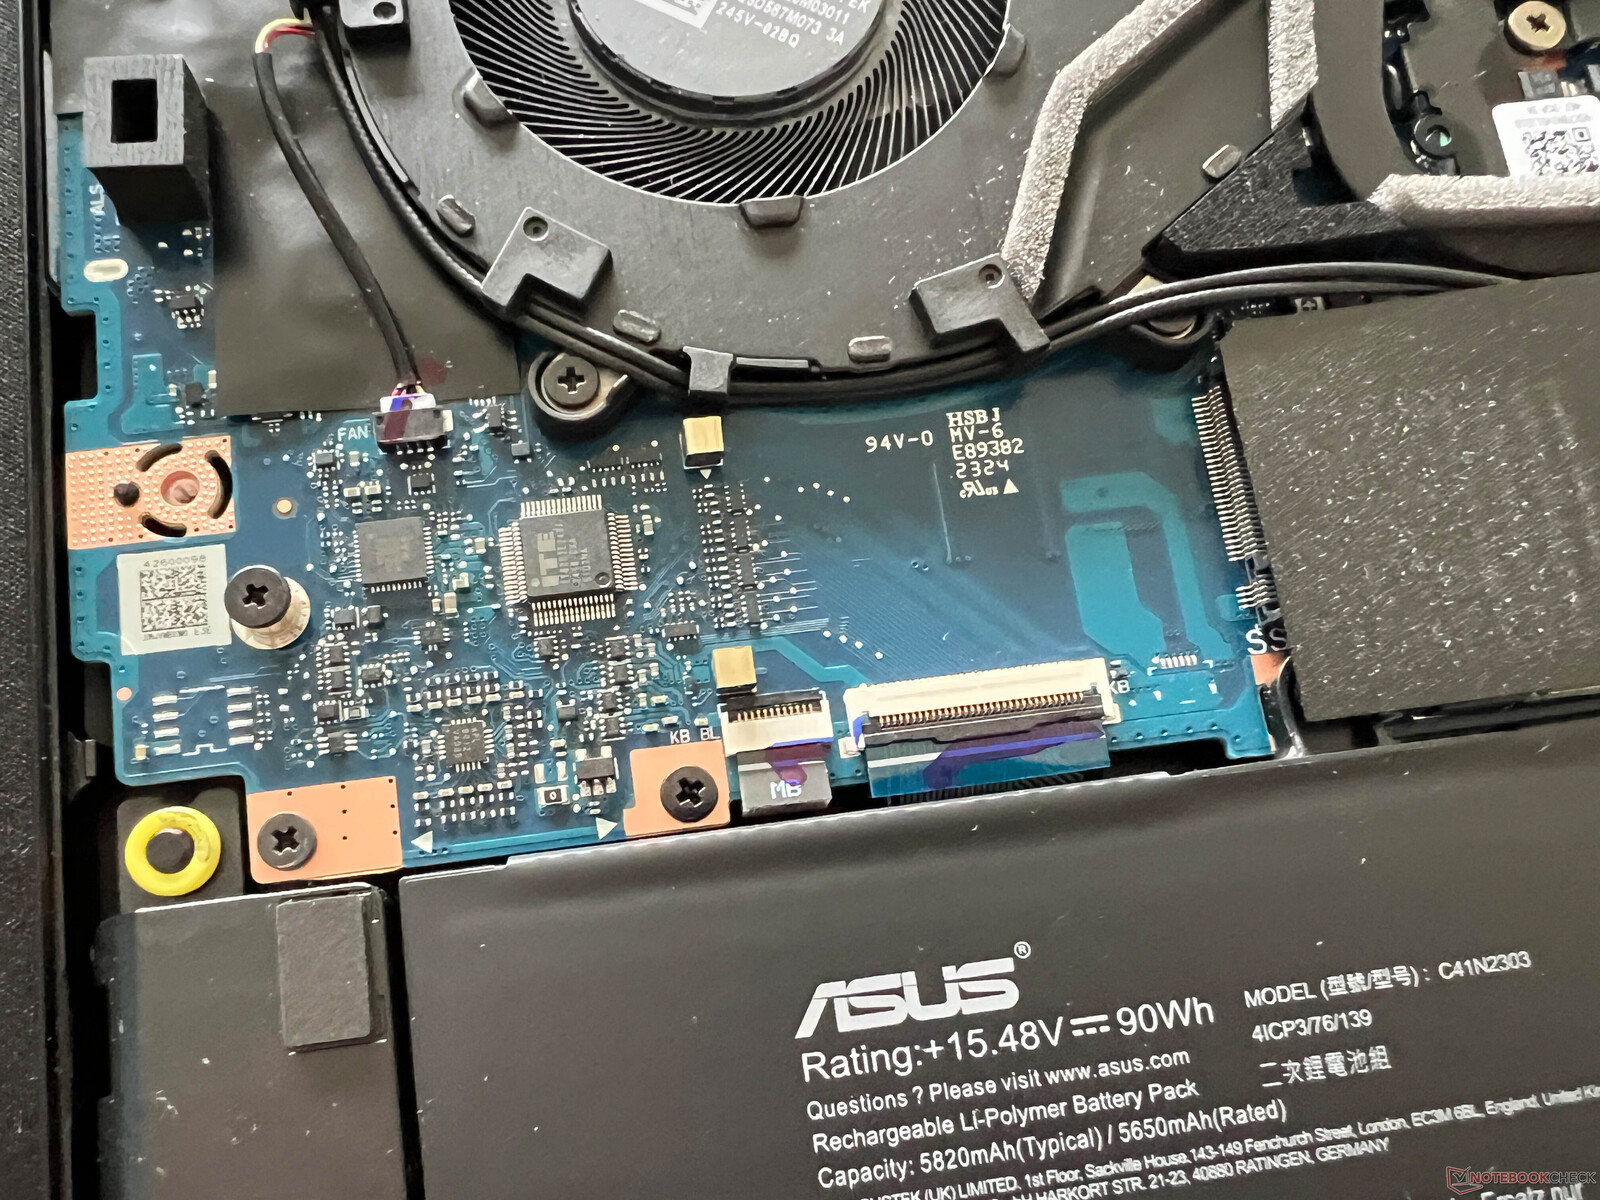
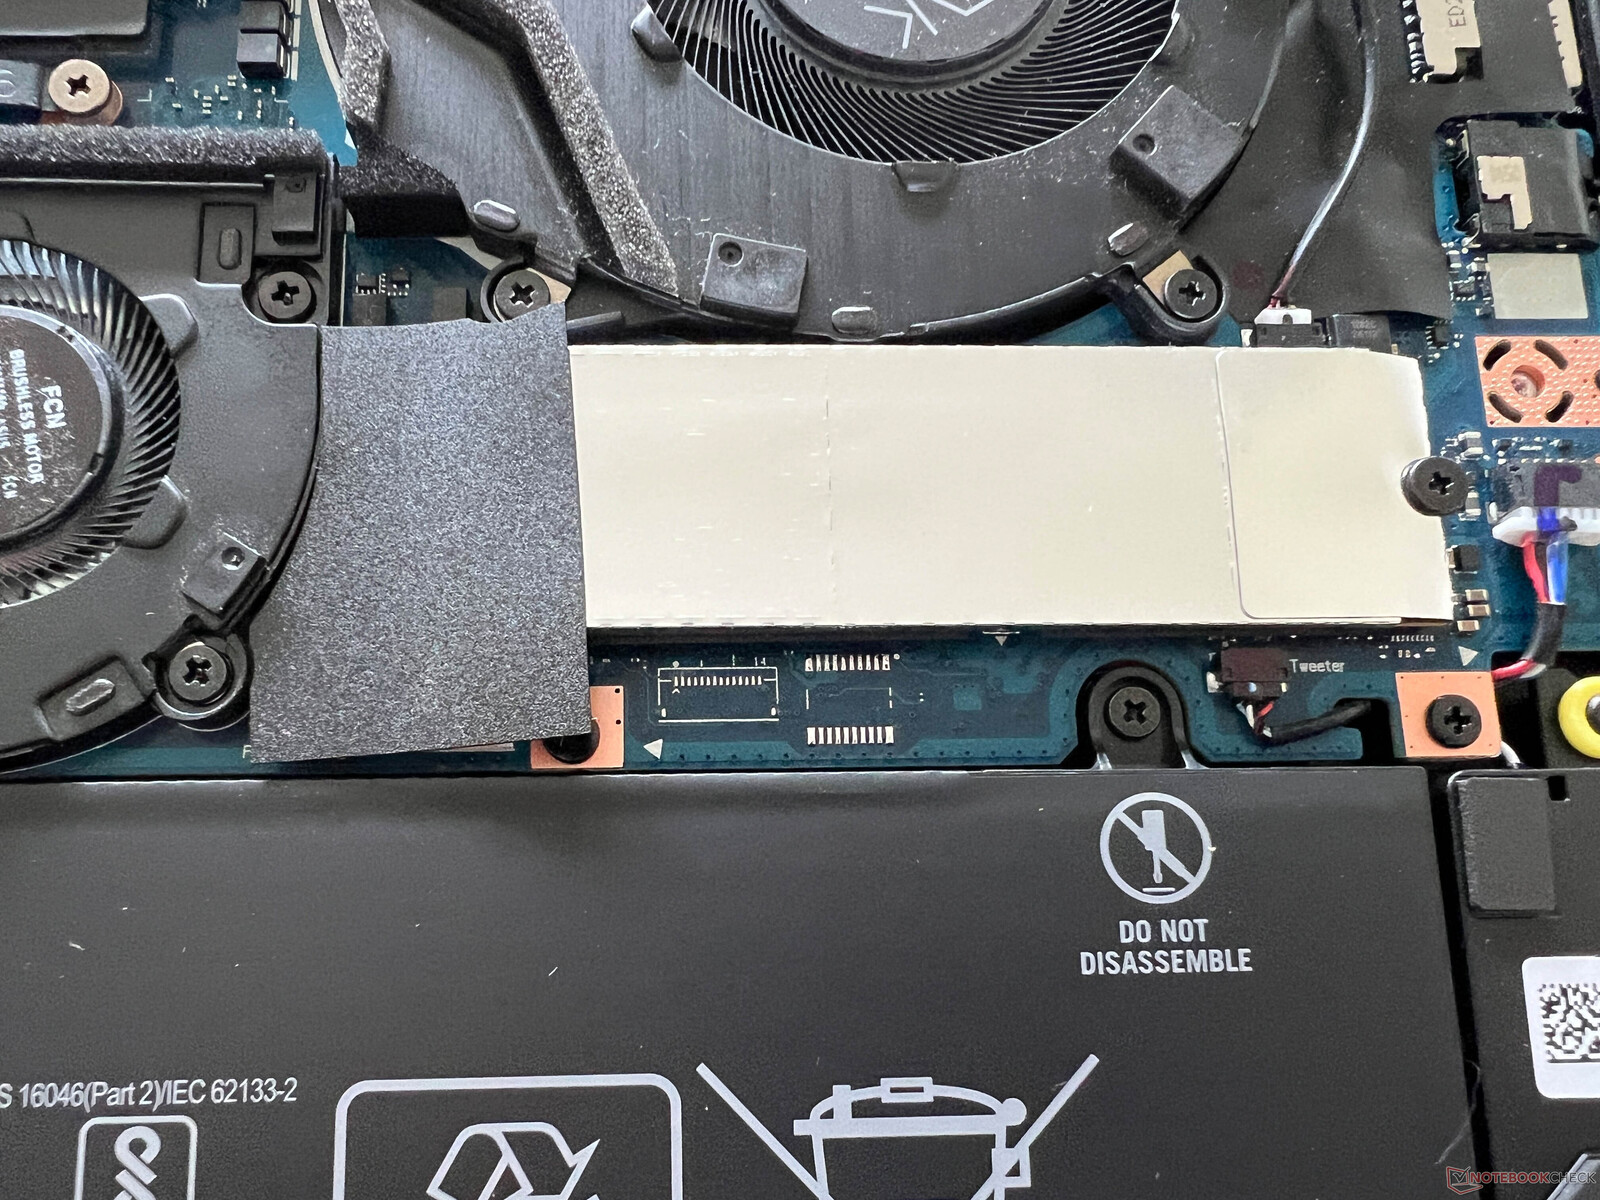
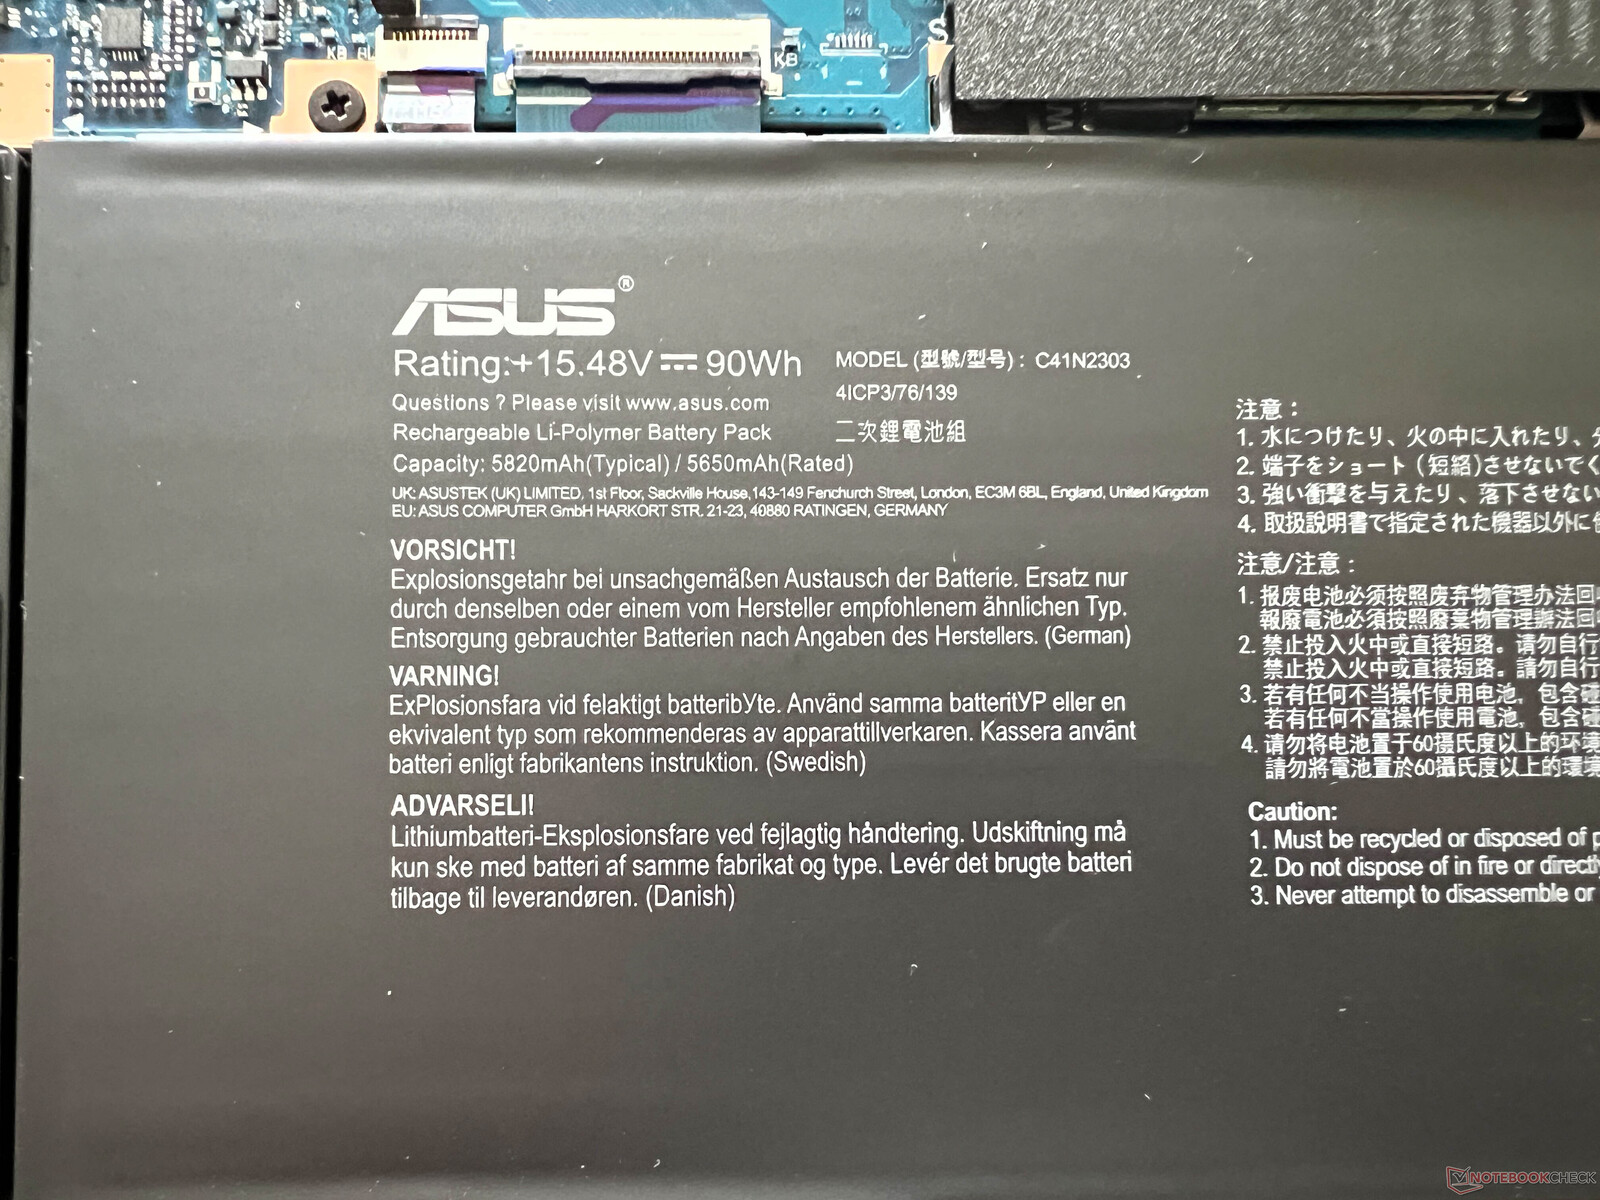
两颗隐藏的螺丝位于胶合橡胶盖下,使元件的接触变得更加困难。与性能较弱的 Zephyrus G16 型号(最高为 RTX 4070 笔记本电脑)一样,该设备采用了传统的散热系统,并增加了第三个小风扇。内存是焊接的,但有两个 M.2 2280 固态硬盘插槽和一个 Wi-Fi 模块,这两个插槽都可以更换。电池采用螺钉固定,如有需要也可更换。
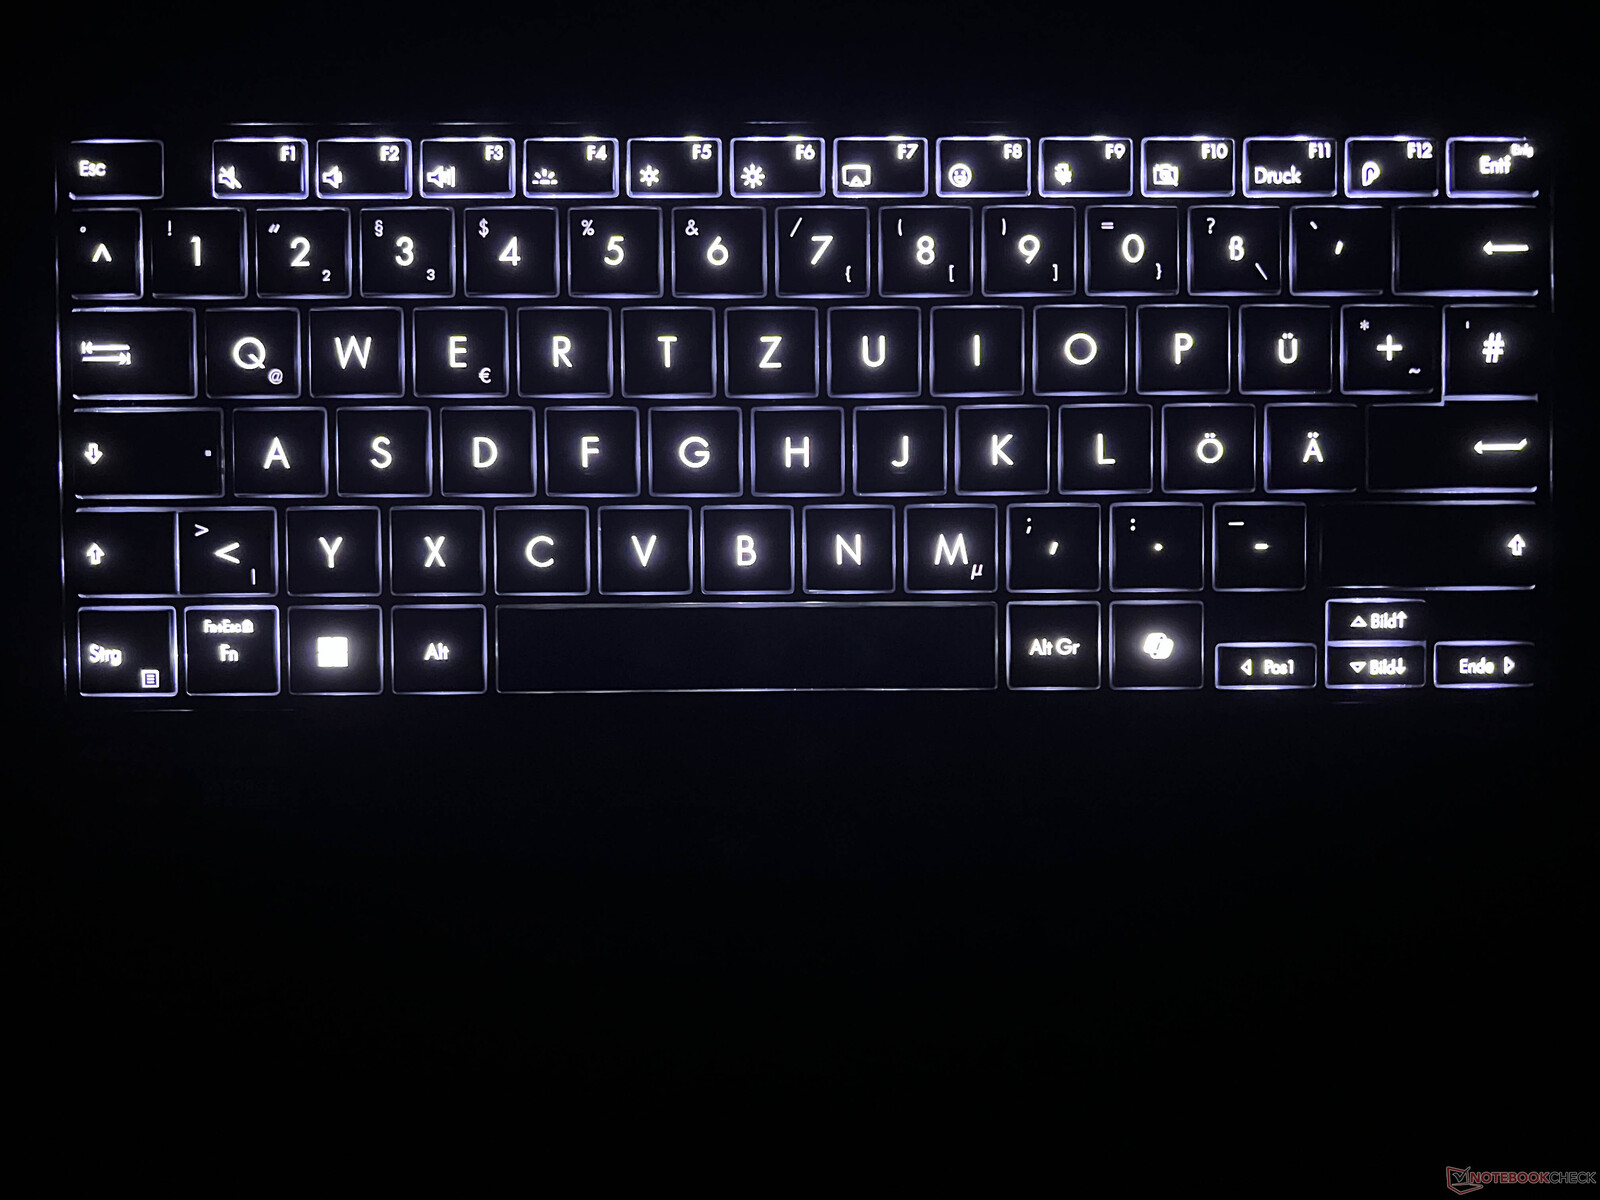
输入设备 - 1.7 毫米键程和 DialPad
除了没有额外的功能键外,键盘与 Zephyrus G16 并无不同,由于 1.7 毫米的键程,它成为笔记本电脑领域最舒适的键盘之一。虽然缺少了 RGB 灯光,但白色灯光仍可通过传感器自动调节。键盘布局并不完美,因为单行回车键和小方向键并不理想。
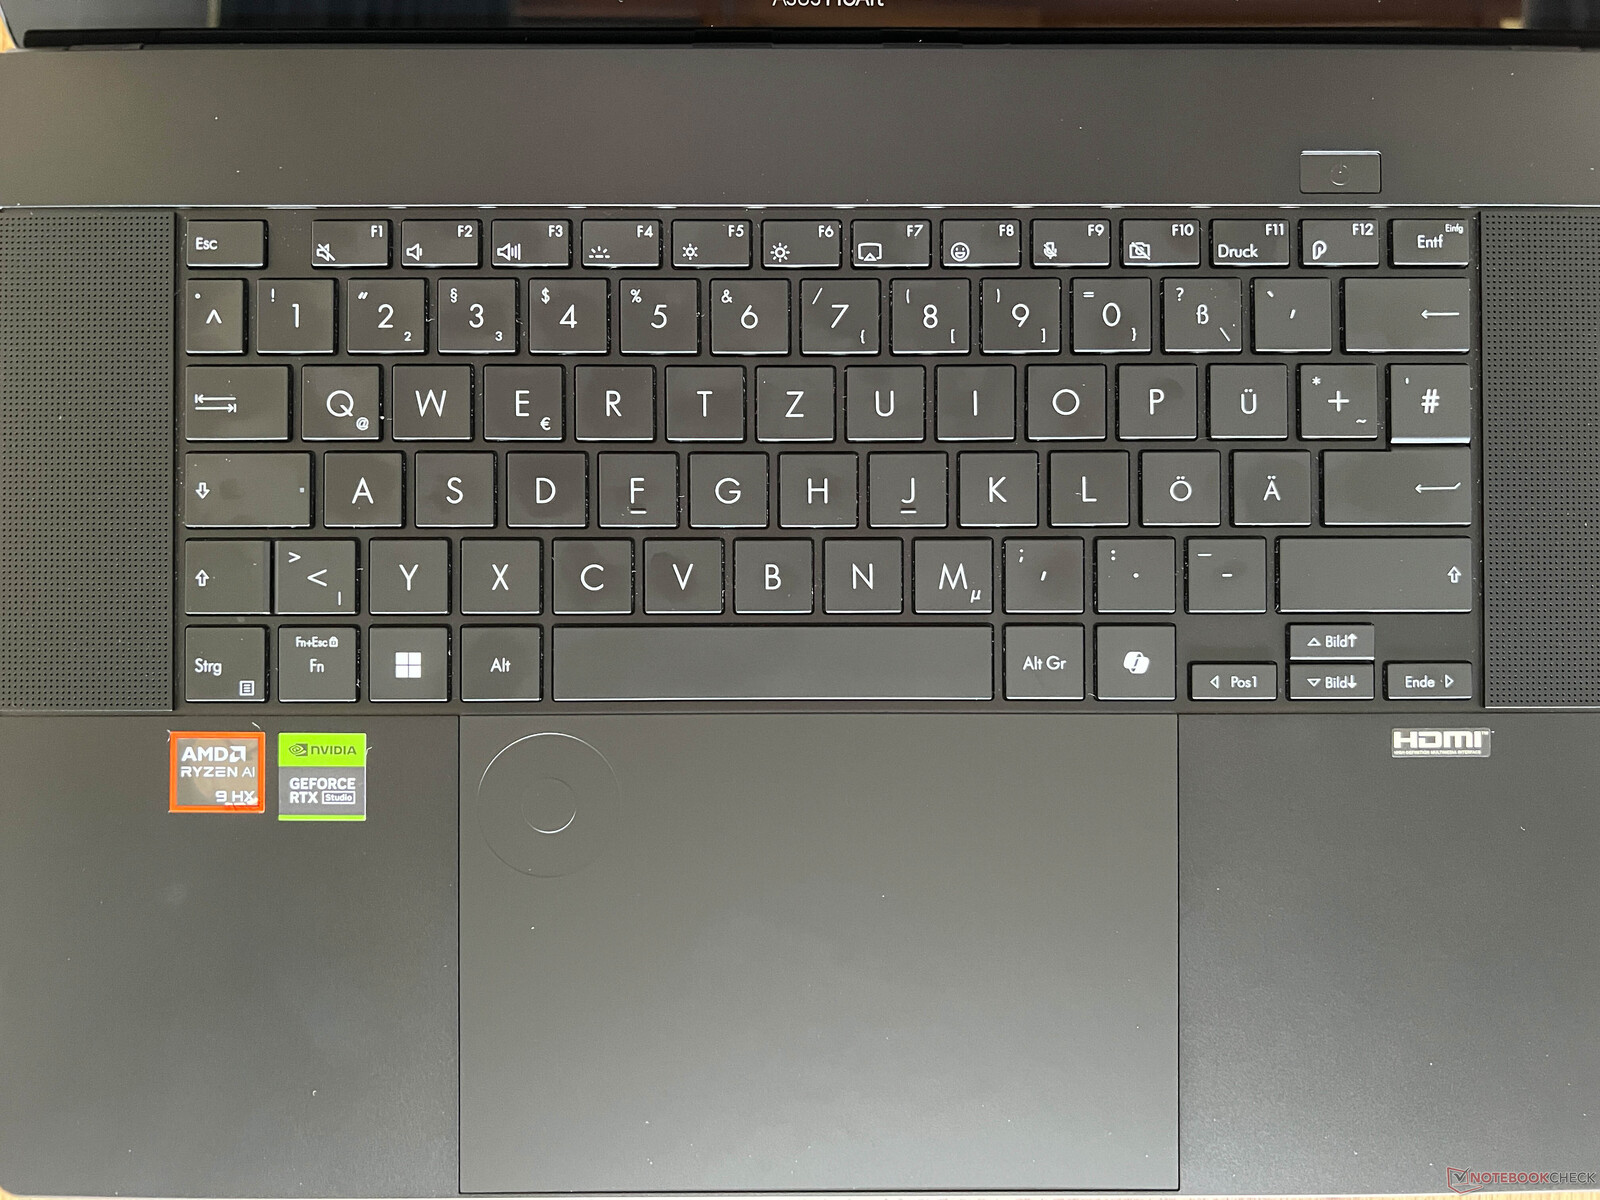
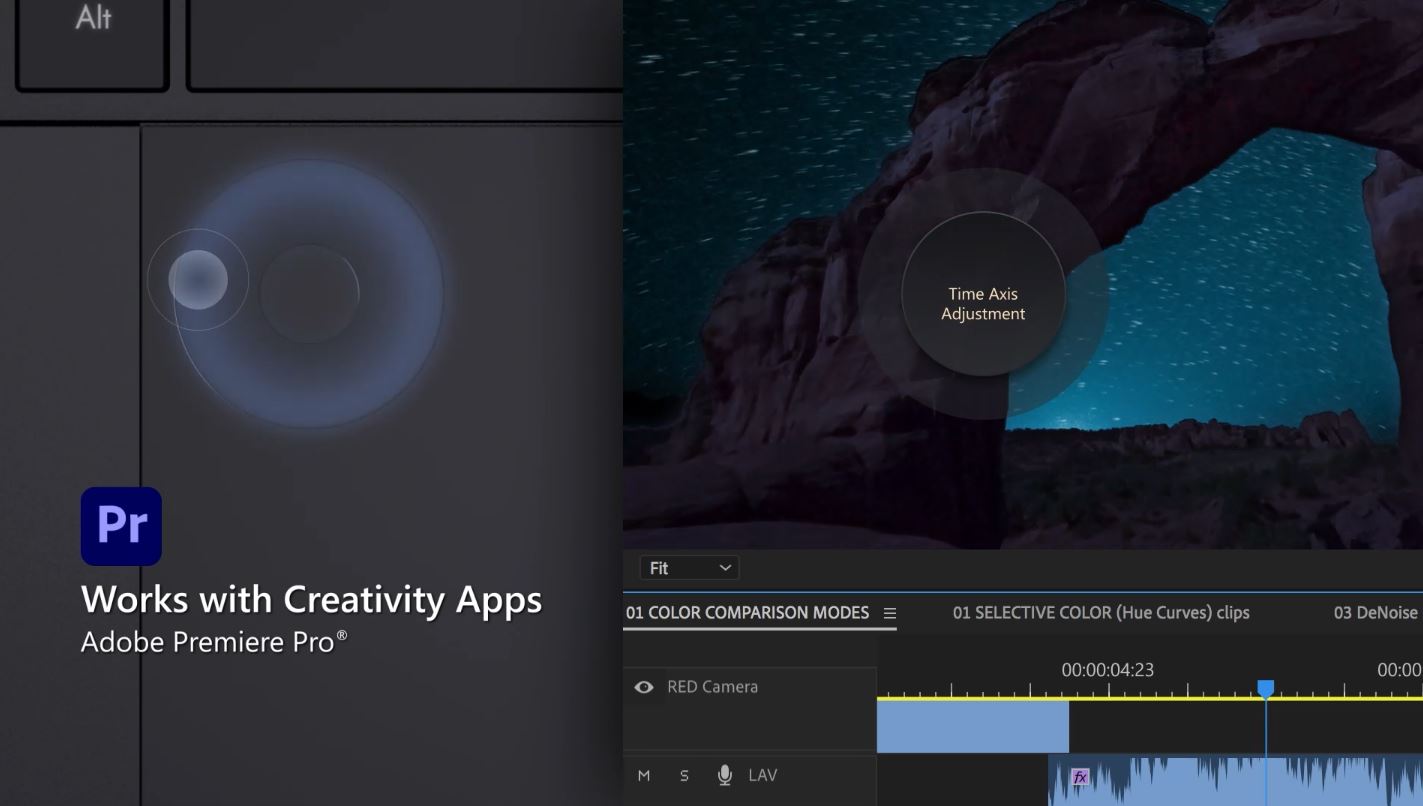
点击板的尺寸为 15 x 9.8 厘米,非常大,光标导航效果非常好。此外,机械点击的声音非常小,给人一种高档的感觉。DialPad 集成在触摸板的左上方,也非常好用。至于它有多大用处,主要取决于你使用拨盘的熟练程度。由于触摸板较大,拨号盘并没有像较小的 ProArt PX13在实际使用中,它并没有像较小的 ProArt PX13 那样让我们感到不便。
当然,ProArt 也有一个电容式触摸屏用于输入,也能顺利操作。随机提供的华硕触控笔 2.0 也能顺利使用,但机壳上没有安装触控笔的地方。
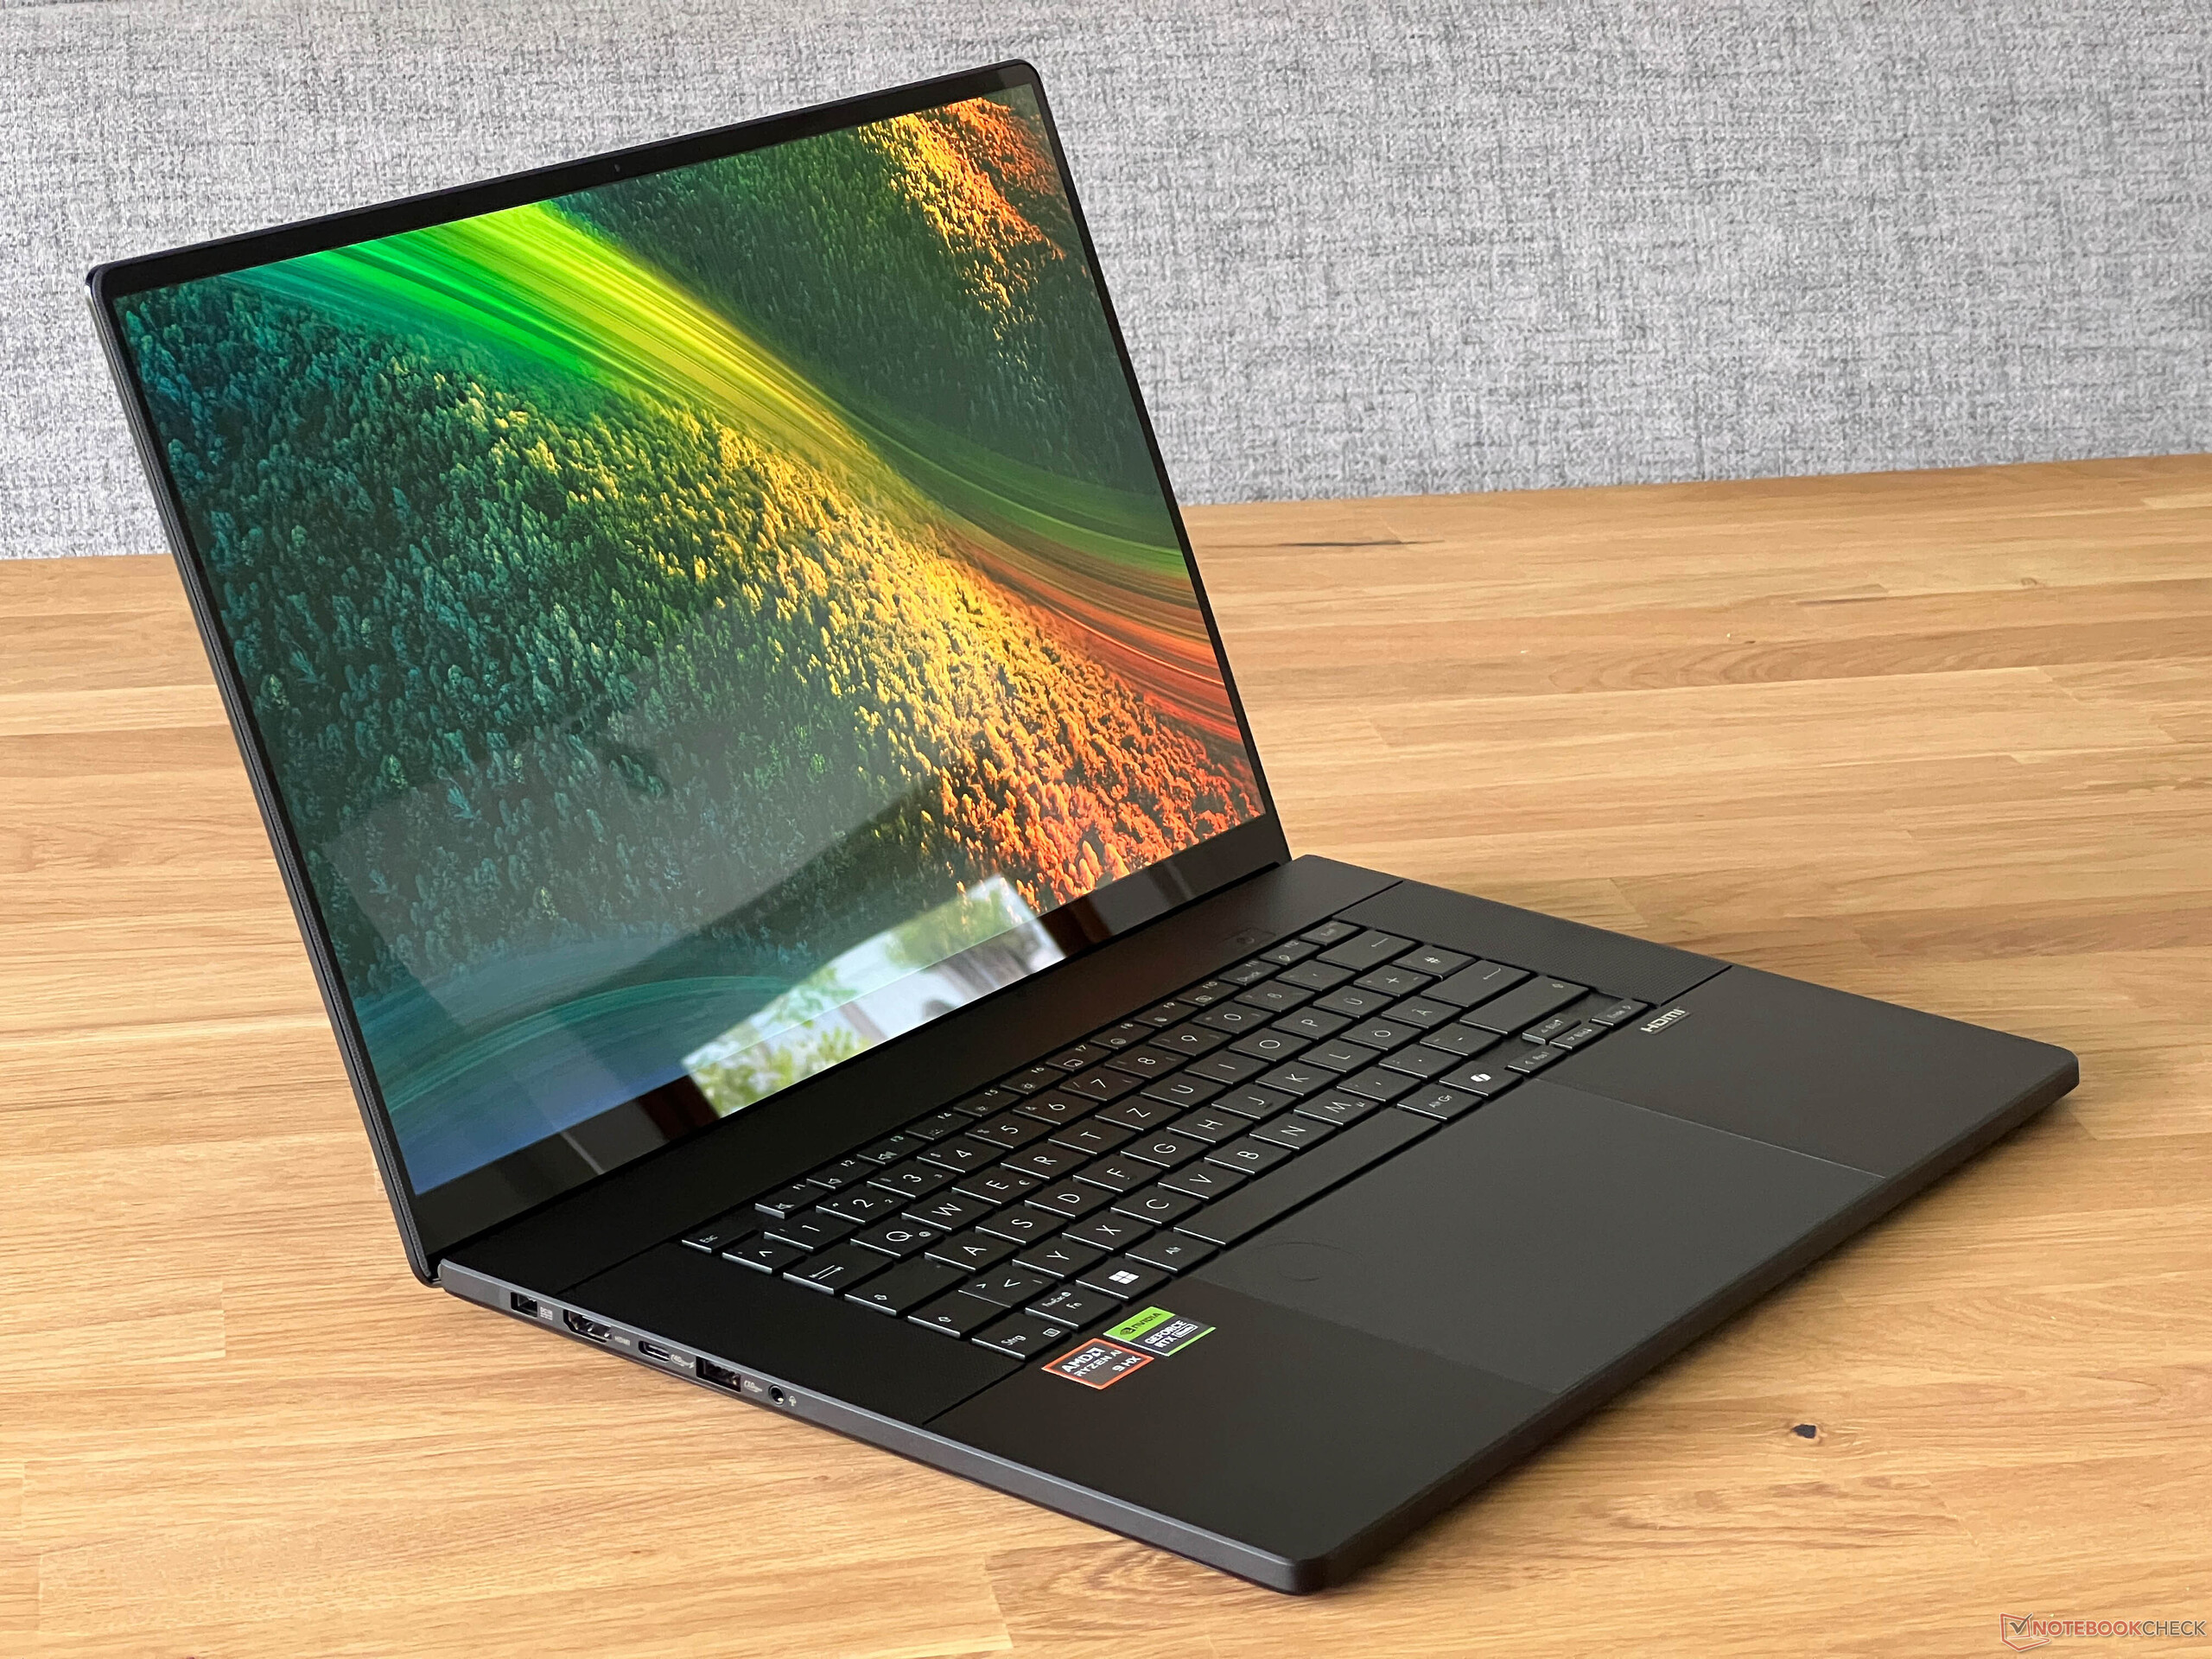
显示屏 - 4K OLED,60 赫兹
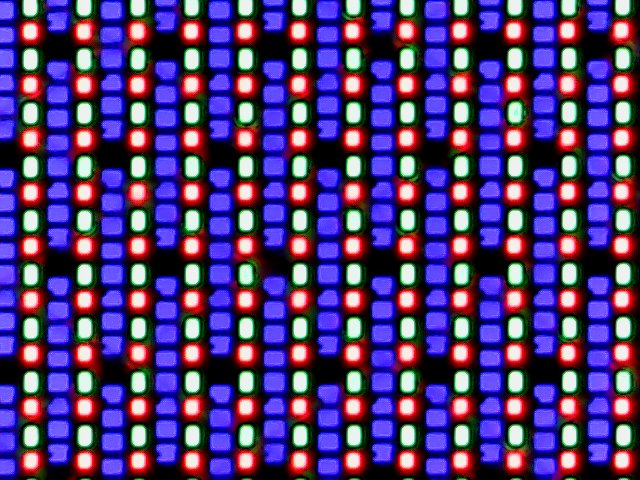
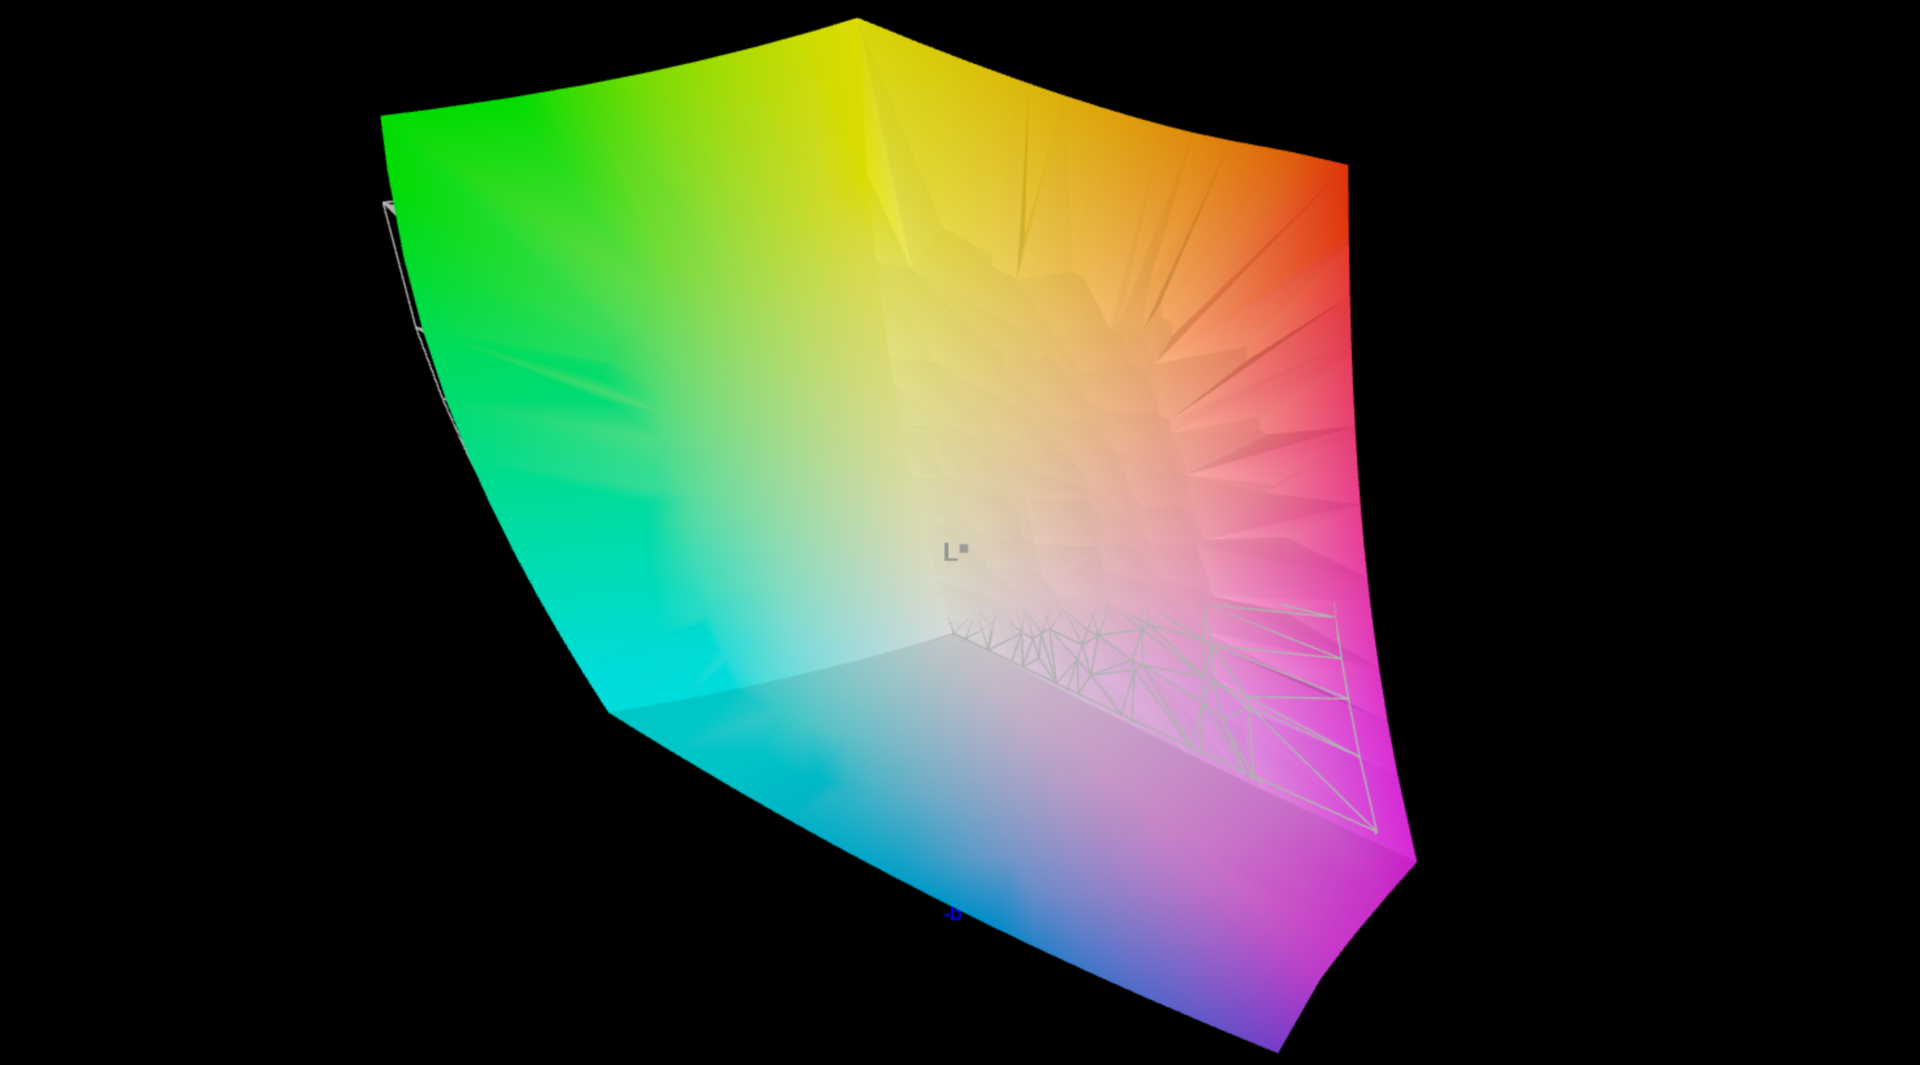
华硕为 ProArt P16 配备了一块分辨率为 3,840 x 2,400 像素、纵横比为 16:10 的 OLED 触摸屏。与 XPS 16 相比,这是同类产品中分辨率最高的,所有内容都非常清晰。不过,明亮的区域会出现轻微的颗粒感(你会感觉屏幕受潮了),但这一问题明显没有 XPS 16 那么明显。 戴尔 XPS 16.最大的问题是频率只有 60 赫兹。这在运动中很明显,尽管分辨率略有提高,但与旧的 Zenbook Pro 16X的 120 Hz OLED(3,200 x 2,000 像素)相比,这是一种倒退。
在 SDR 模式下,面板的平均亮度为 360 cd/m²,再加上较低的黑阶,对比度非常出色。在 HDR 模式下(仍需在 Windows 中手动激活,且色彩配置文件不再起作用),我们在屏幕的一小块区域测得最高亮度为 605 cd/m²,而在几乎全白的图像中仅为 420 cd/m²,这是一个相当低的数字。
| |||||||||||||||||||||||||
Brightness Distribution: 98 %
Center on Battery: 355 cd/m²
Contrast: ∞:1 (Black: 0 cd/m²)
ΔE Color 1.2 | 0.5-29.43 Ø4.87
ΔE Greyscale 1.2 | 0.5-98 Ø5.1
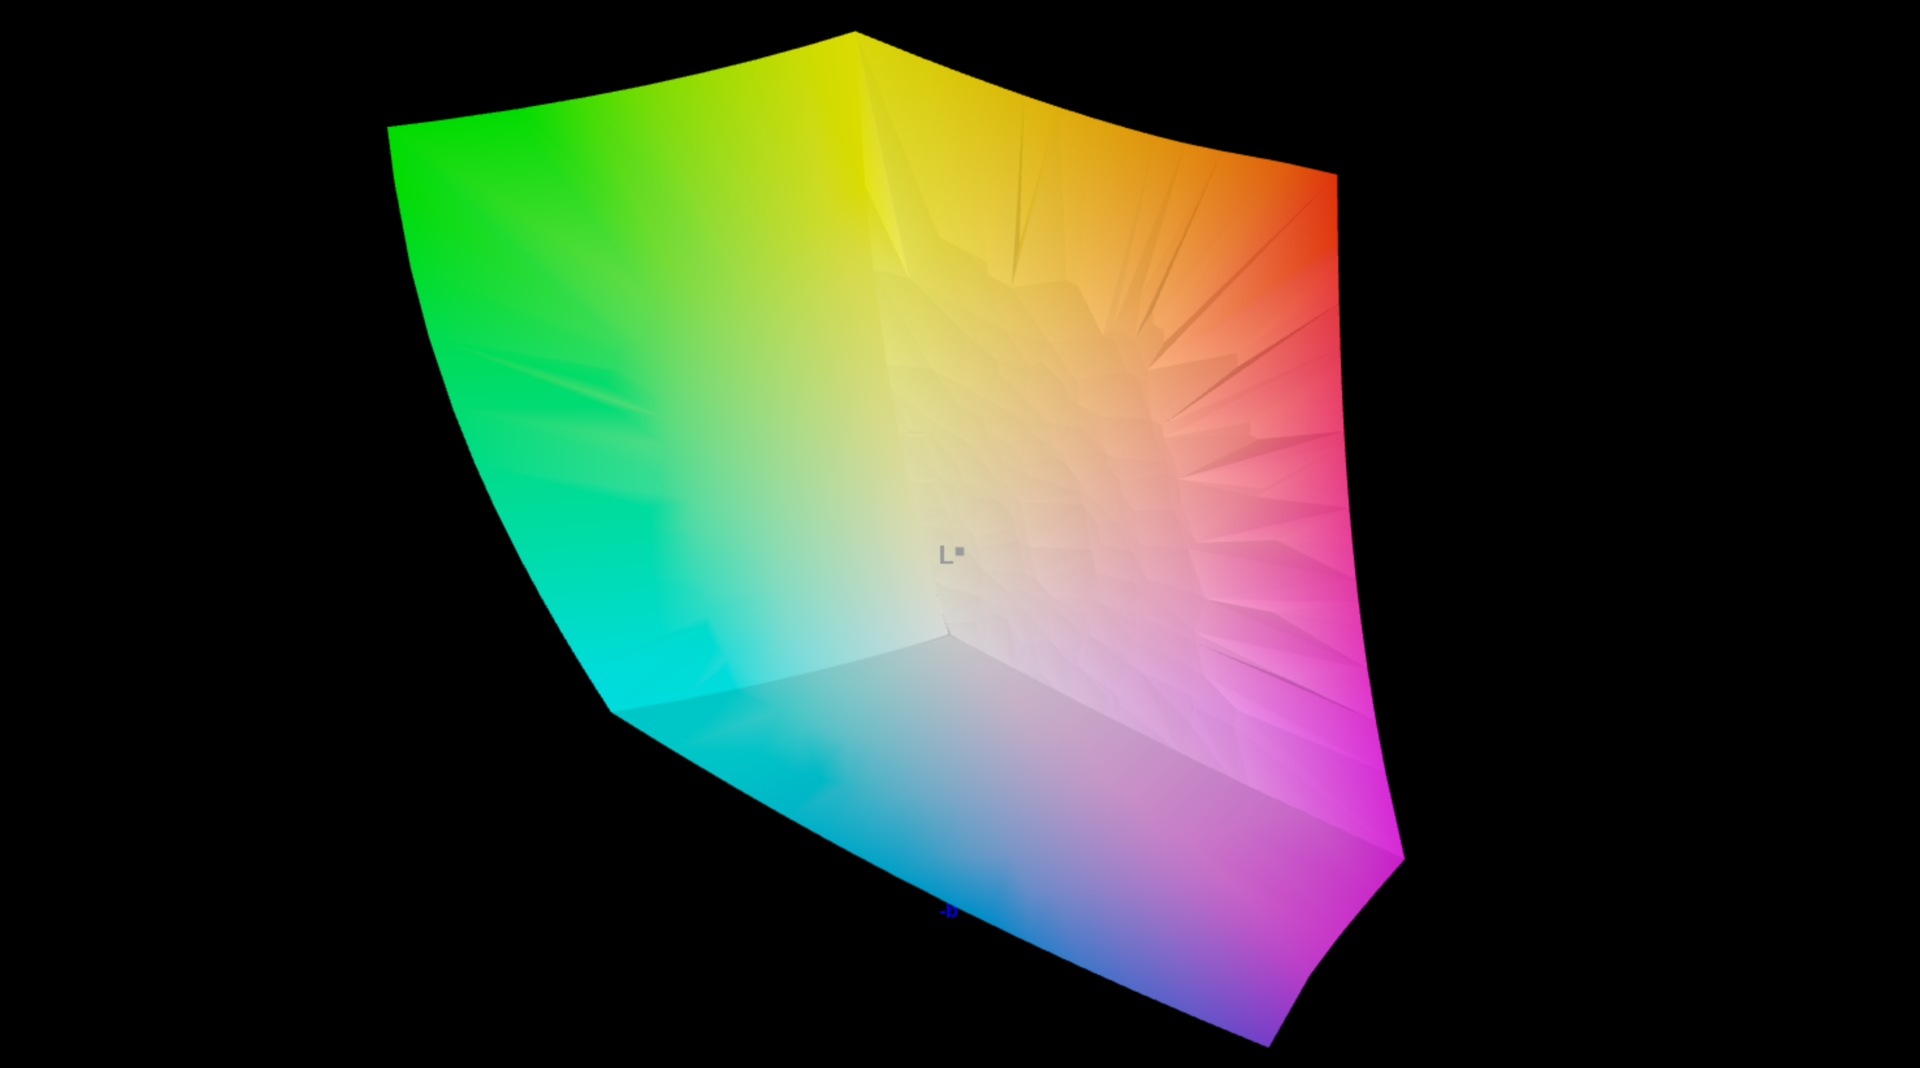
99.1% AdobeRGB 1998 (Argyll 2.2.0 3D)
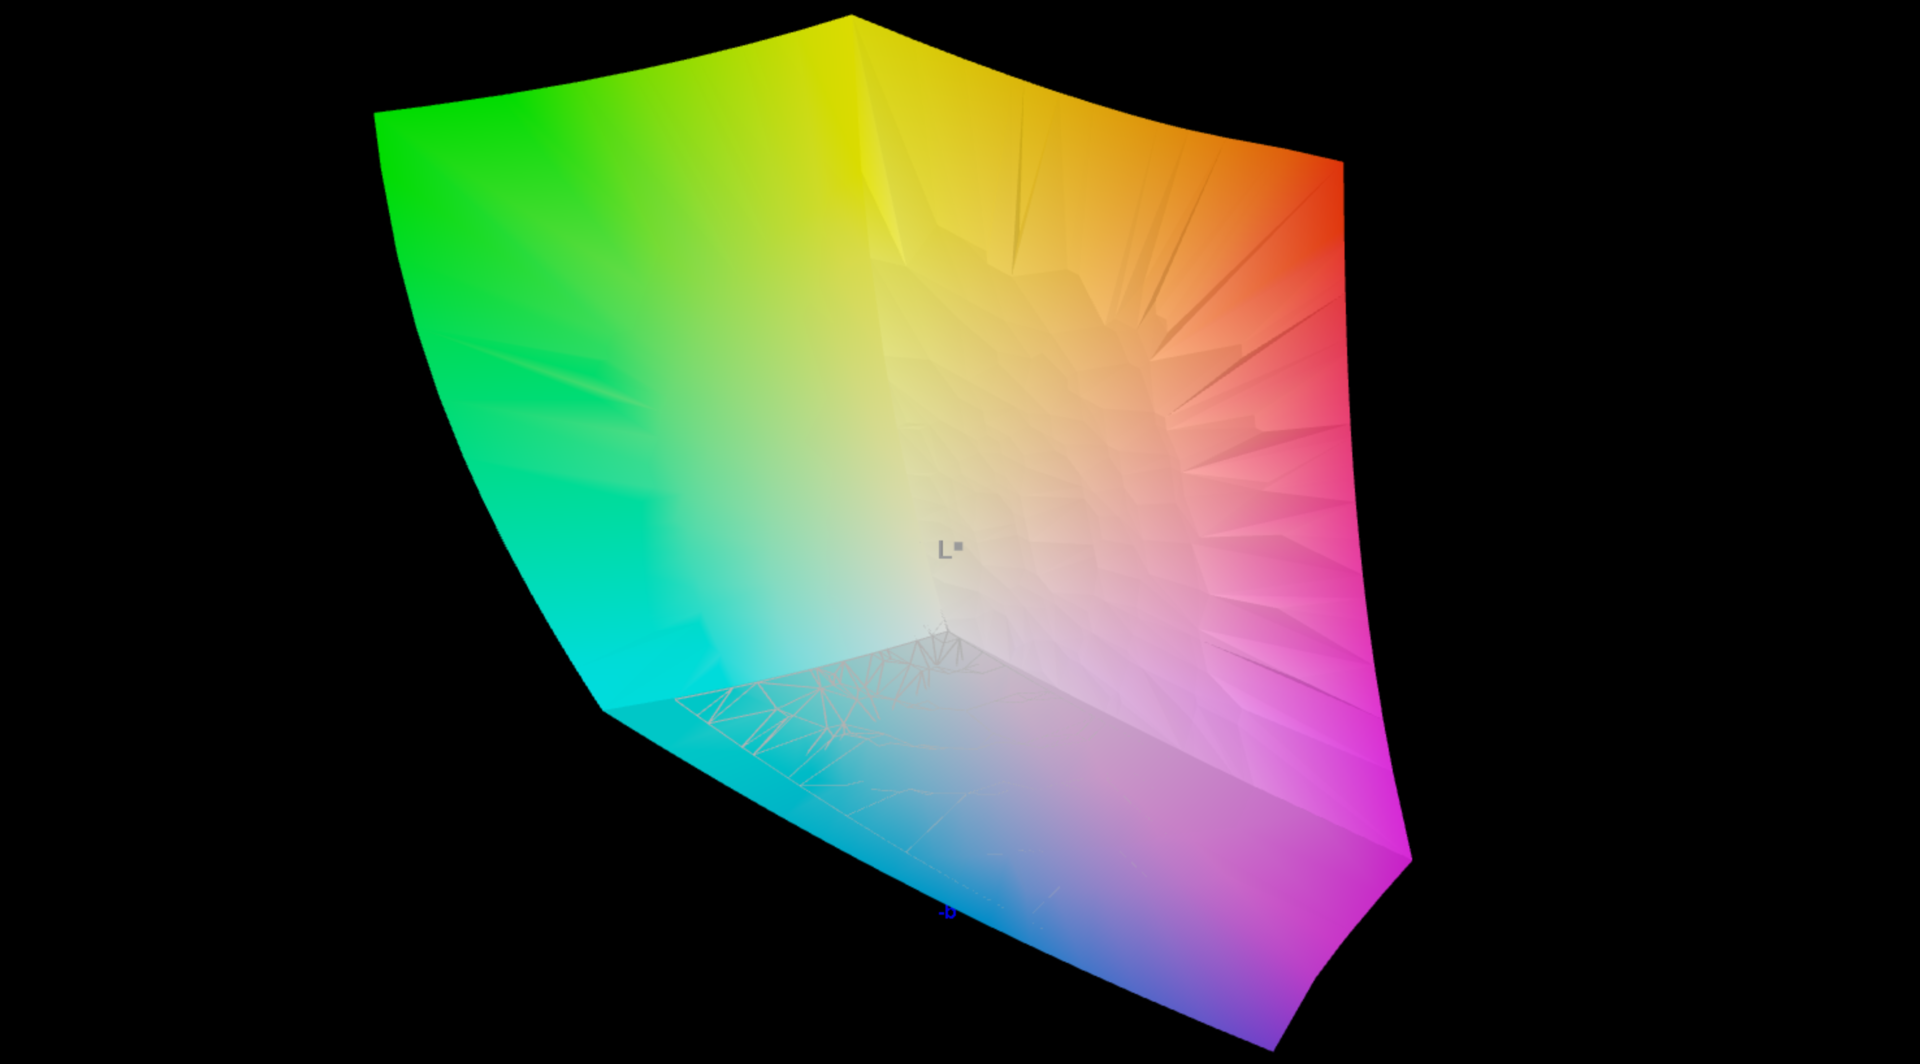
100% sRGB (Argyll 2.2.0 3D)
99.9% Display P3 (Argyll 2.2.0 3D)
Gamma: 2.14
| Asus ProArt P16 H7606WI ATNA60YV02-0, OLED, 3840x2400, 16", 60 Hz | SCHENKER XMG Pro 16 Studio (Mid 24) BOE CQ NE160QDM-NZ1, IPS, 2560x1600, 16", 240 Hz | Lenovo Yoga Pro 9 16IMH9 LEN160-3.2K, Mini-LED, 3200x2000, 16", 165 Hz | Dell XPS 16 9640 SDC4196, OLED, 3840x2400, 16.3", 90 Hz | Asus ROG Zephyrus G16 2024 GU605M ATNA60DL01-0, OLED, 2560x1600, 16", 240 Hz | Apple MacBook Pro 16 2023 M3 Max Mini-LED, 3456x2234, 16", 120 Hz | Asus Zenbook Pro 16X UX7602BZ-MY005W ATNA60BX01-1, OLED, 3200x2000, 16", 120 Hz | |
|---|---|---|---|---|---|---|---|
| Display | -20% | -5% | -4% | -1% | -1% | -1% | |
| Display P3 Coverage | 99.9 | 68.8 -31% | 97 -3% | 98.3 -2% | 99.9 0% | 99.2 -1% | 99.93 0% |
| sRGB Coverage | 100 | 99.5 0% | 99.9 0% | 100 0% | 100 0% | 100 0% | |
| AdobeRGB 1998 Coverage | 99.1 | 70.8 -29% | 86.6 -13% | 87.8 -11% | 96.9 -2% | 97.48 -2% | |
| Response Times | -554% | -216% | 43% | 155% | -474% | -15% | |
| Response Time Grey 50% / Grey 80% * | 1.58 ? | 12.7 ? -704% | 22.2 ? -1305% | 0.82 ? 48% | 0.22 ? 86% | 66.9 ? -4134% | 1.4 ? 11% |
| Response Time Black / White * | 1.25 ? | 6.3 ? -404% | 17 ? -1260% | 0.85 ? 32% | 0.25 ? 80% | 43.6 ? -3388% | 2 ? -60% |
| PWM Frequency | 240 ? | 4840 ? 1917% | 360 ? 50% | 960 ? 300% | 14877 6099% | 250 ? 4% | |
| Screen | -70% | -18% | -21% | -18% | 13% | -61% | |
| Brightness middle | 355 | 416 17% | 651 83% | 366 3% | 416 17% | 630 77% | 331.8 -7% |
| Brightness | 360 | 392 9% | 673 87% | 367 2% | 418 16% | 604 68% | 334 -7% |
| Brightness Distribution | 98 | 86 -12% | 93 -5% | 96 -2% | 96 -2% | 94 -4% | 98 0% |
| Black Level * | 0.38 | 0.22 | 0.07 | ||||
| Colorchecker dE 2000 * | 1.2 | 2.33 -94% | 1.9 -58% | 1.3 -8% | 1.6 -33% | 1.2 -0% | 1.58 -32% |
| Colorchecker dE 2000 max. * | 2.6 | 6.07 -133% | 4.2 -62% | 3.6 -38% | 2.1 19% | 2.8 -8% | 4.23 -63% |
| Greyscale dE 2000 * | 1.2 | 3.7 -208% | 3 -150% | 2.2 -83% | 2.7 -125% | 1.9 -58% | 4.25 -254% |
| Gamma | 2.14 103% | 2.161 102% | 2.18 101% | 2.14 103% | 2.16 102% | 2.29 96% | 2.206 100% |
| CCT | 6526 100% | 7102 92% | 6738 96% | 6680 97% | 6331 103% | 6812 95% | 6249 104% |
| Contrast | 1095 | 2959 | 4740 | ||||
| Colorchecker dE 2000 calibrated * | 1.02 | 0.6 | 1 | 6.66 | |||
| Total Average (Program / Settings) | -215% /
-144% | -80% /
-64% | 6% /
-1% | 45% /
30% | -154% /
-135% | -26% /
-34% |
* ... smaller is better

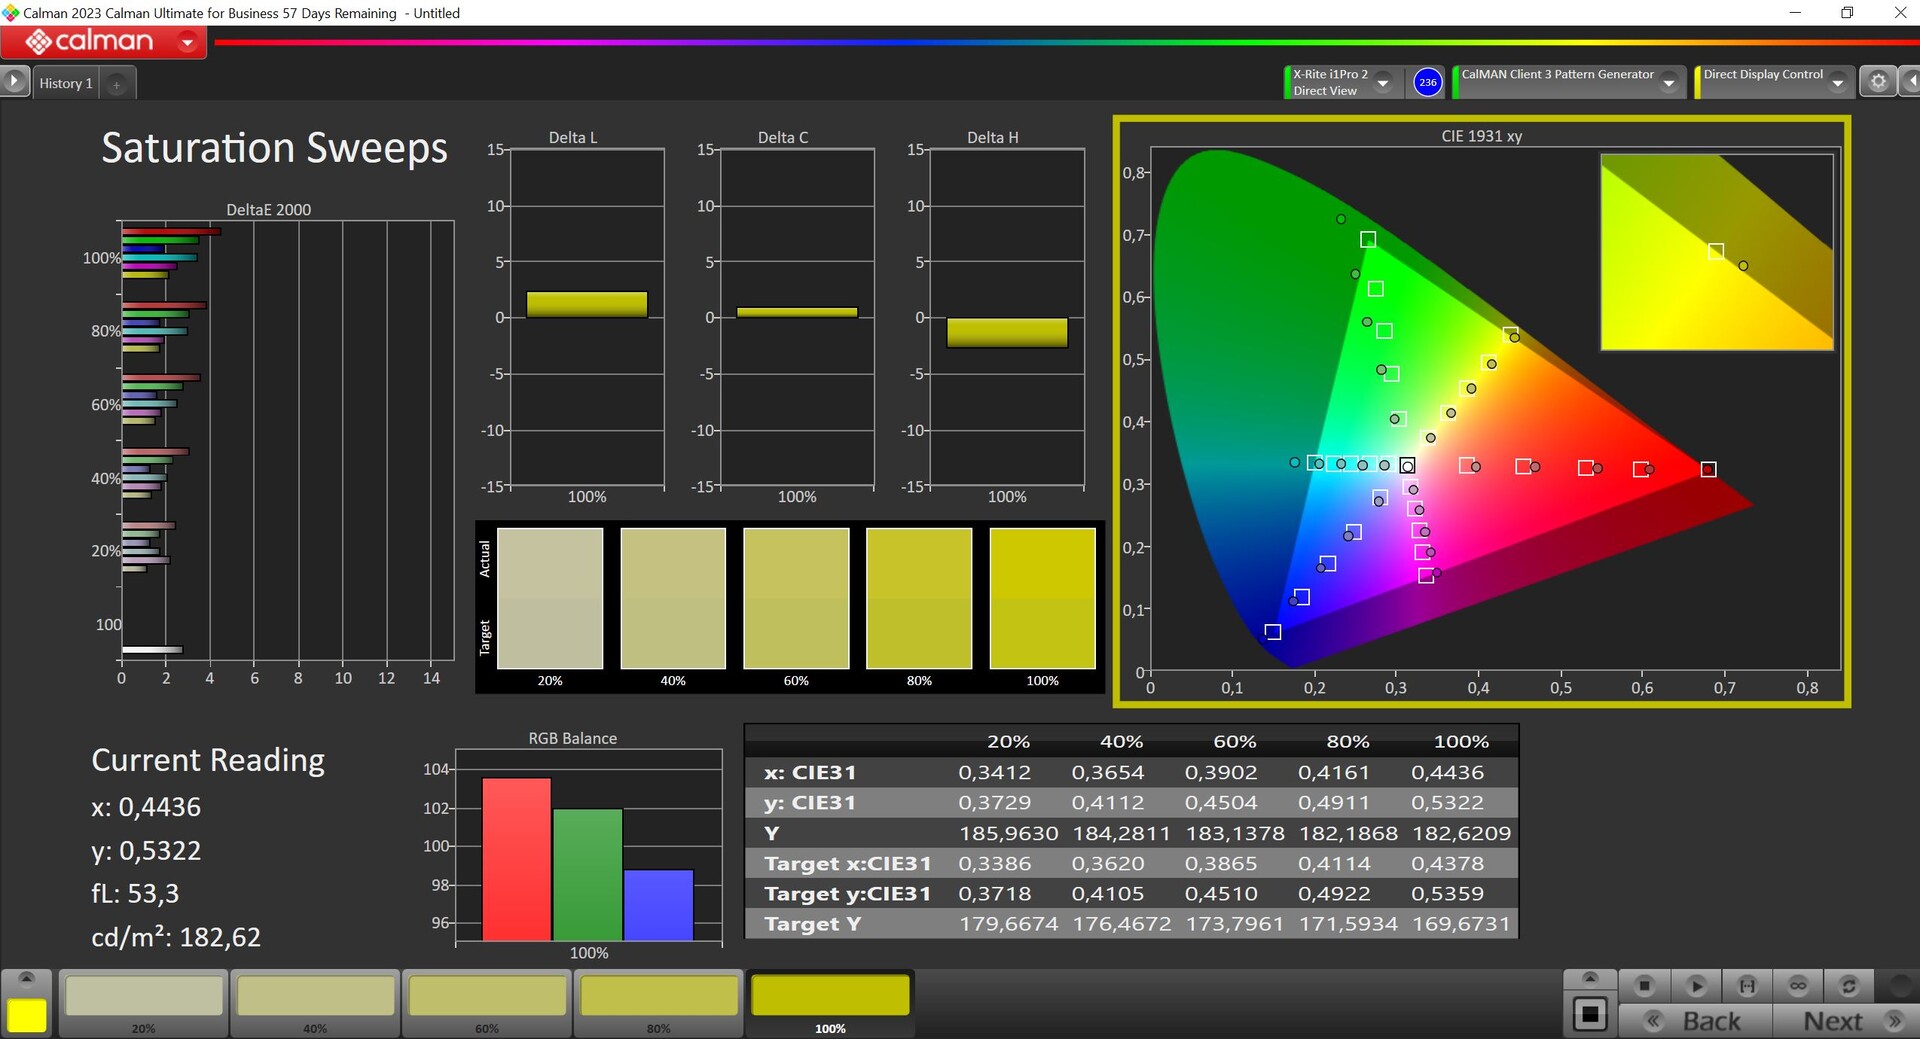

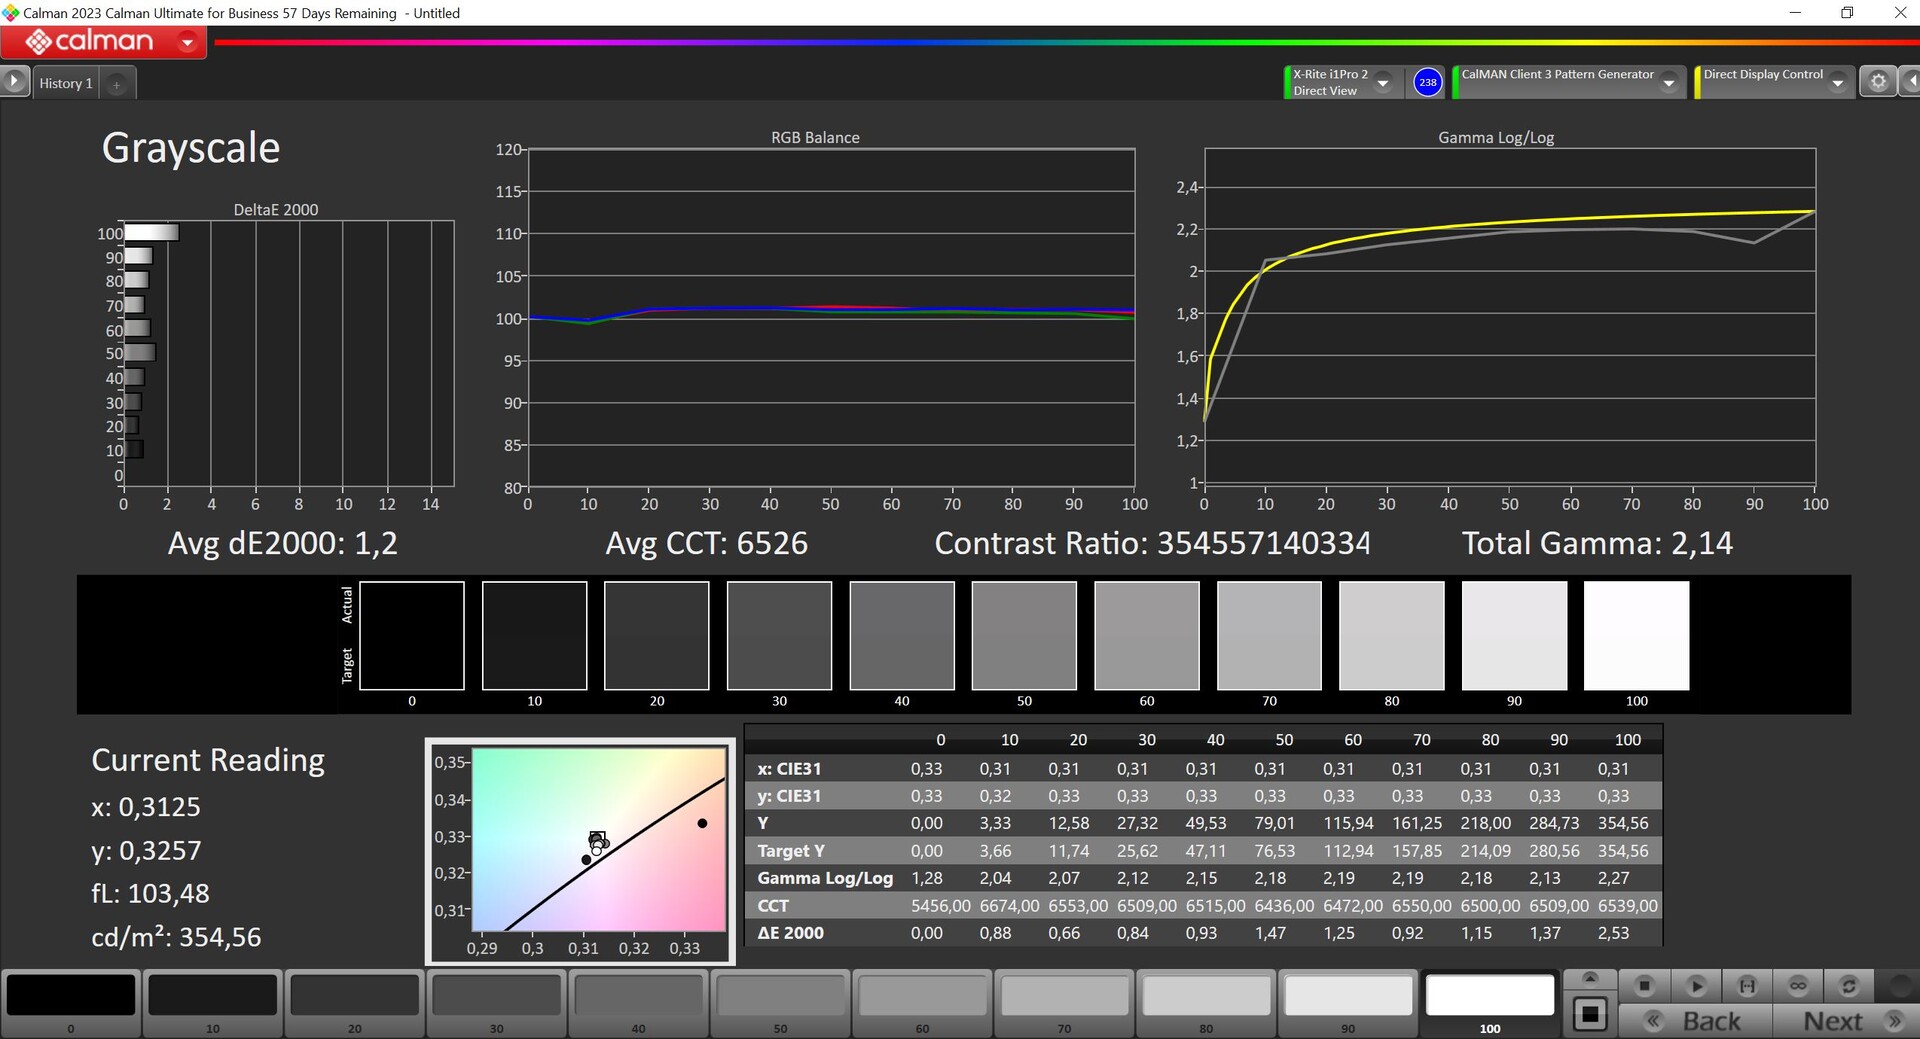
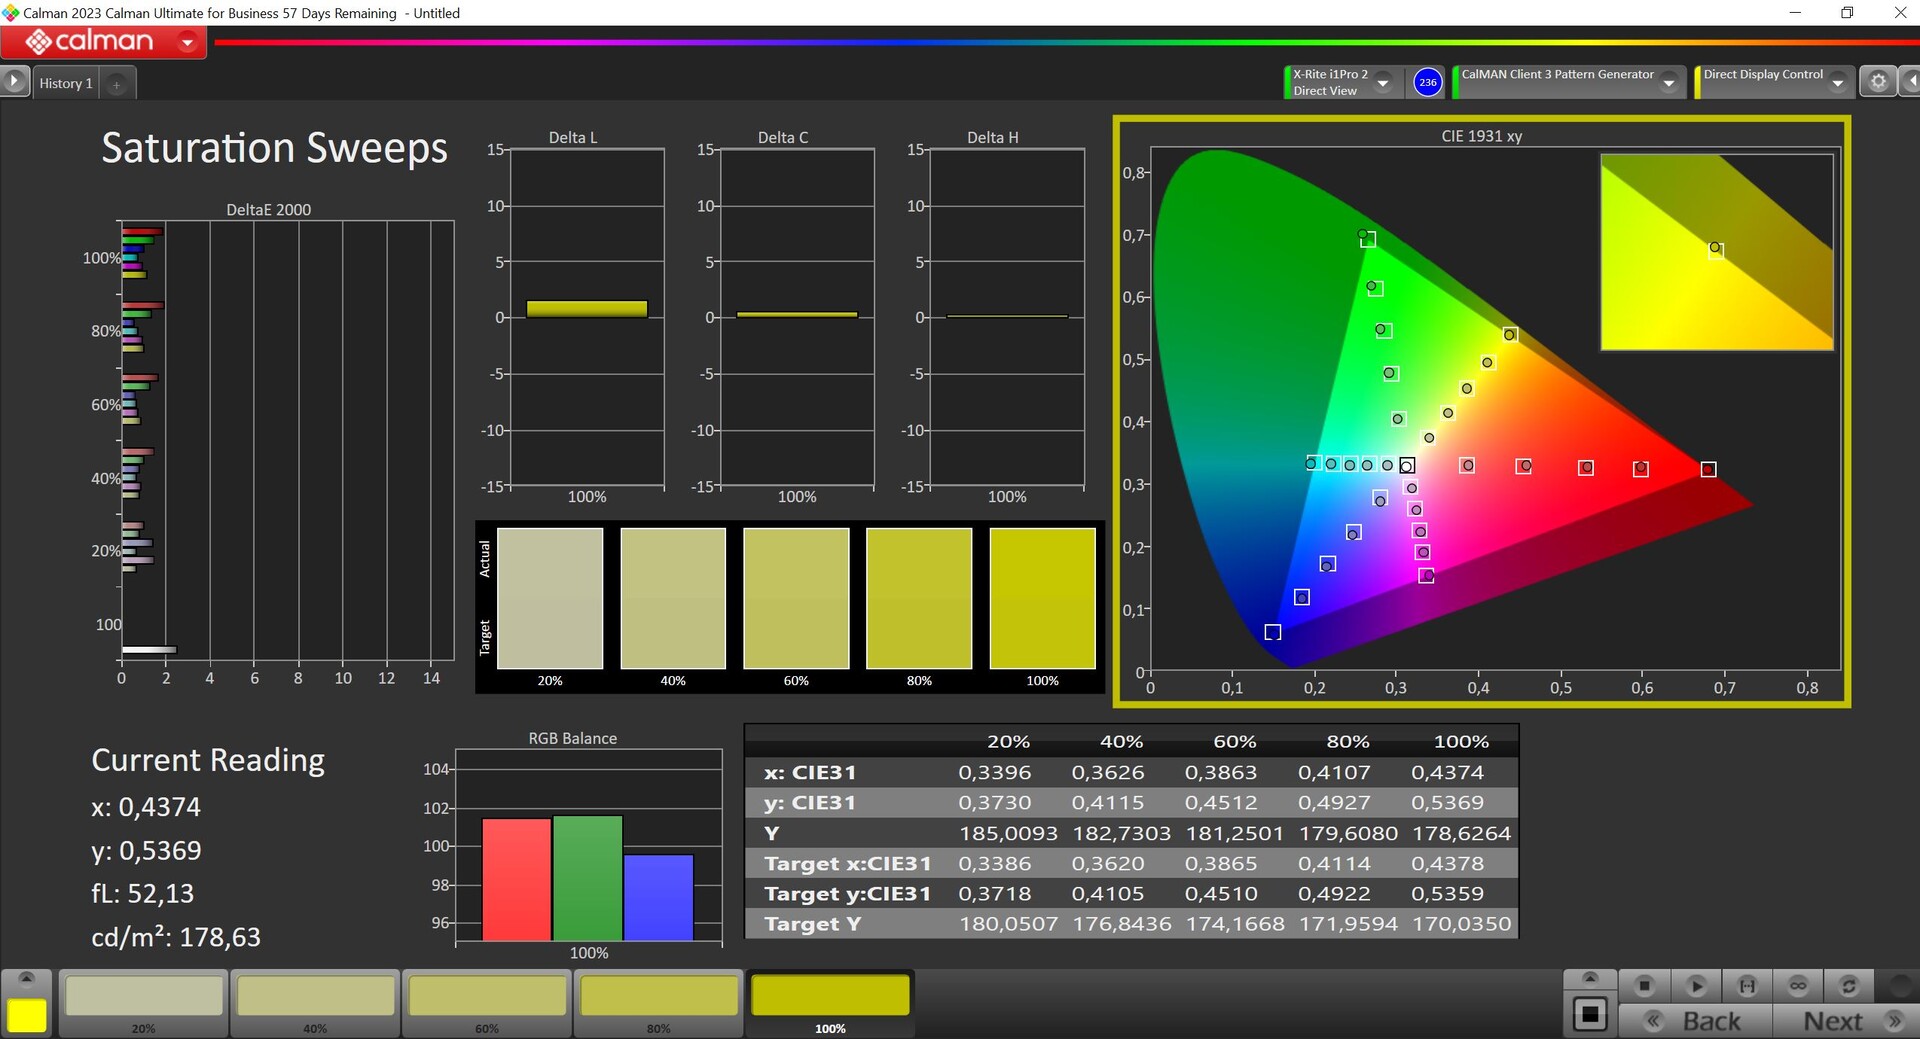
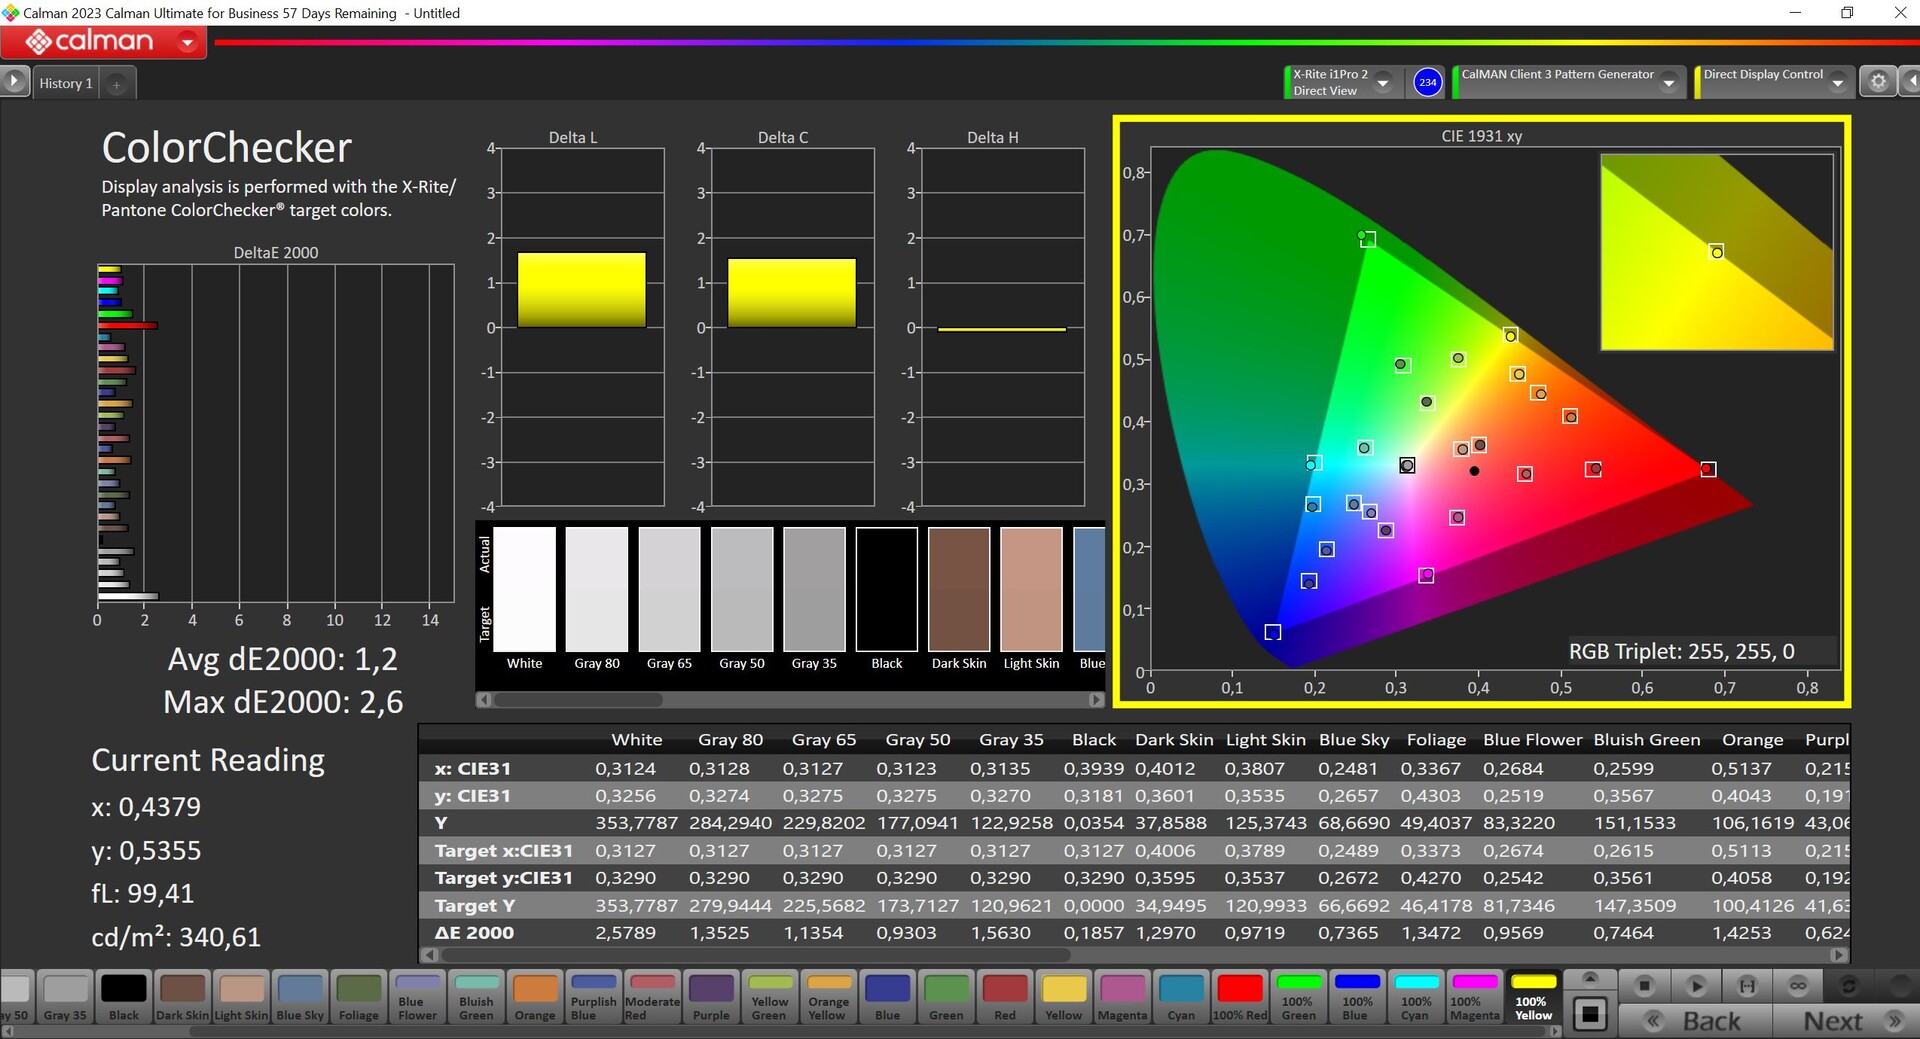
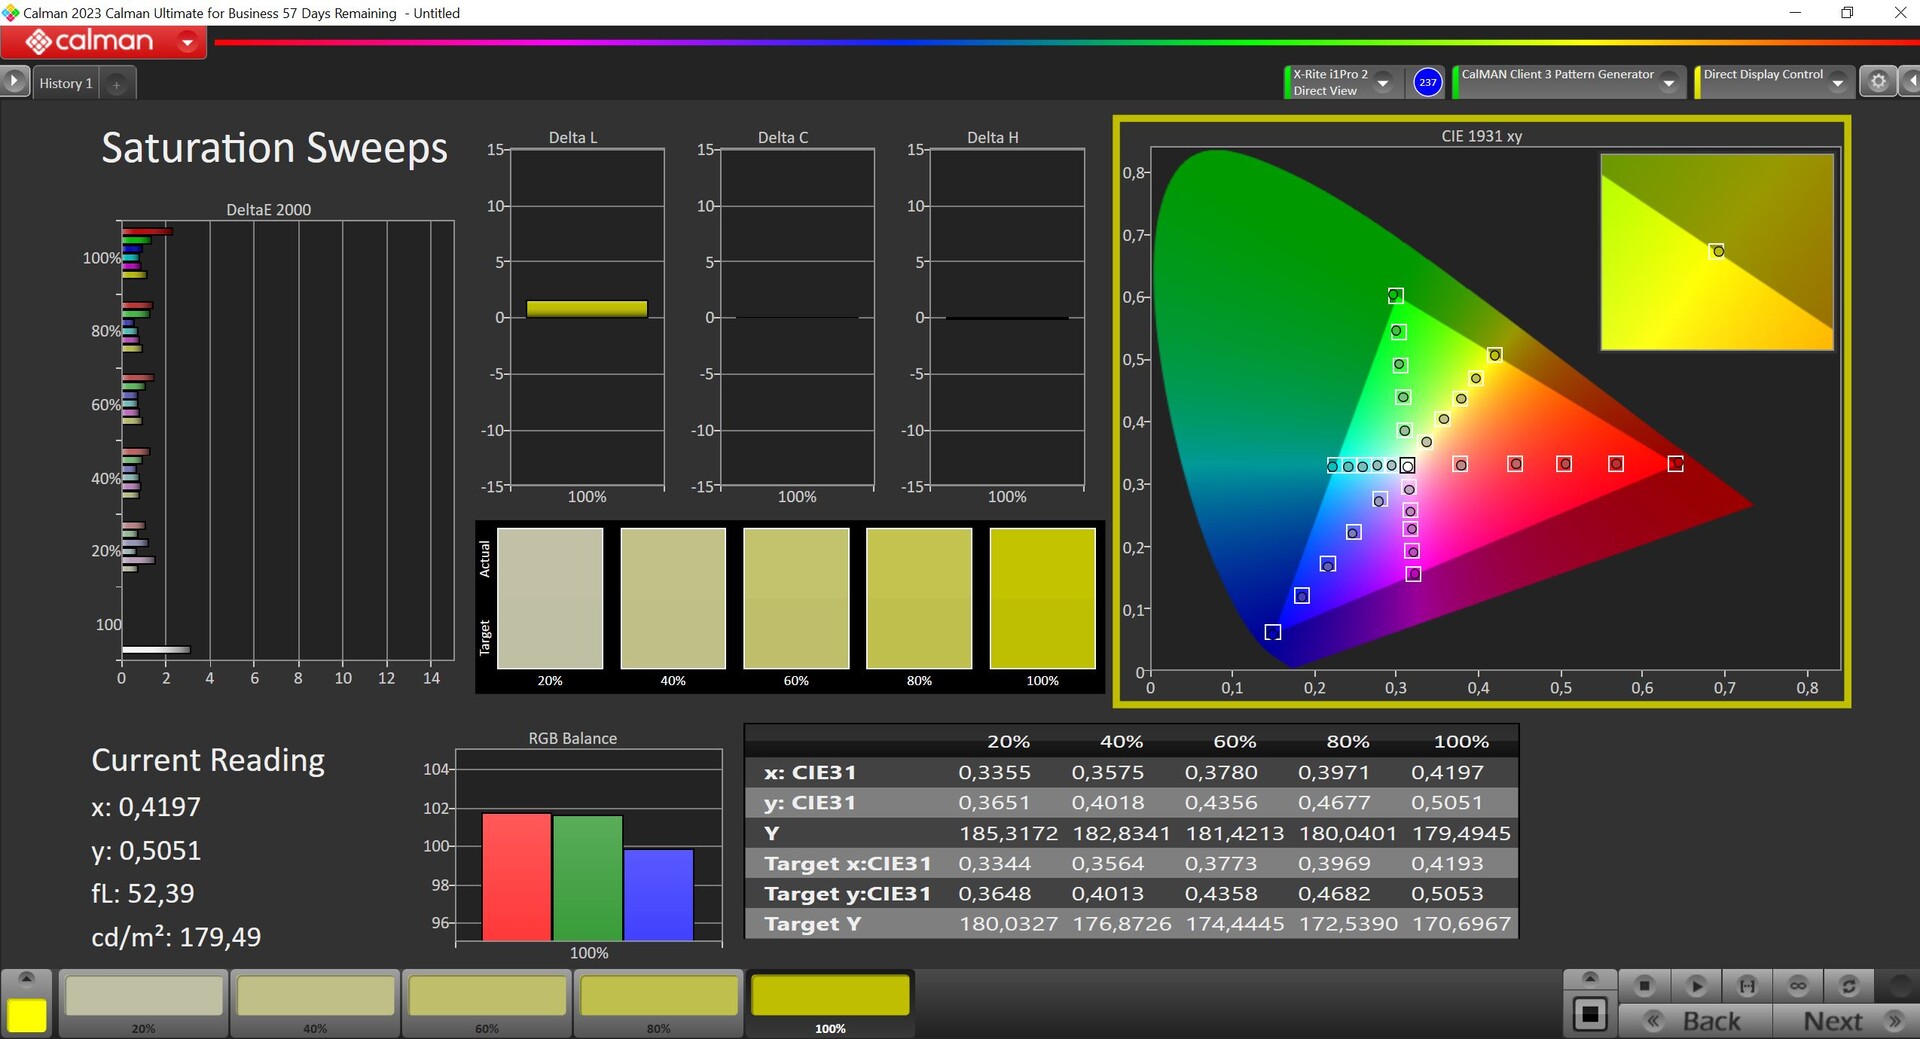
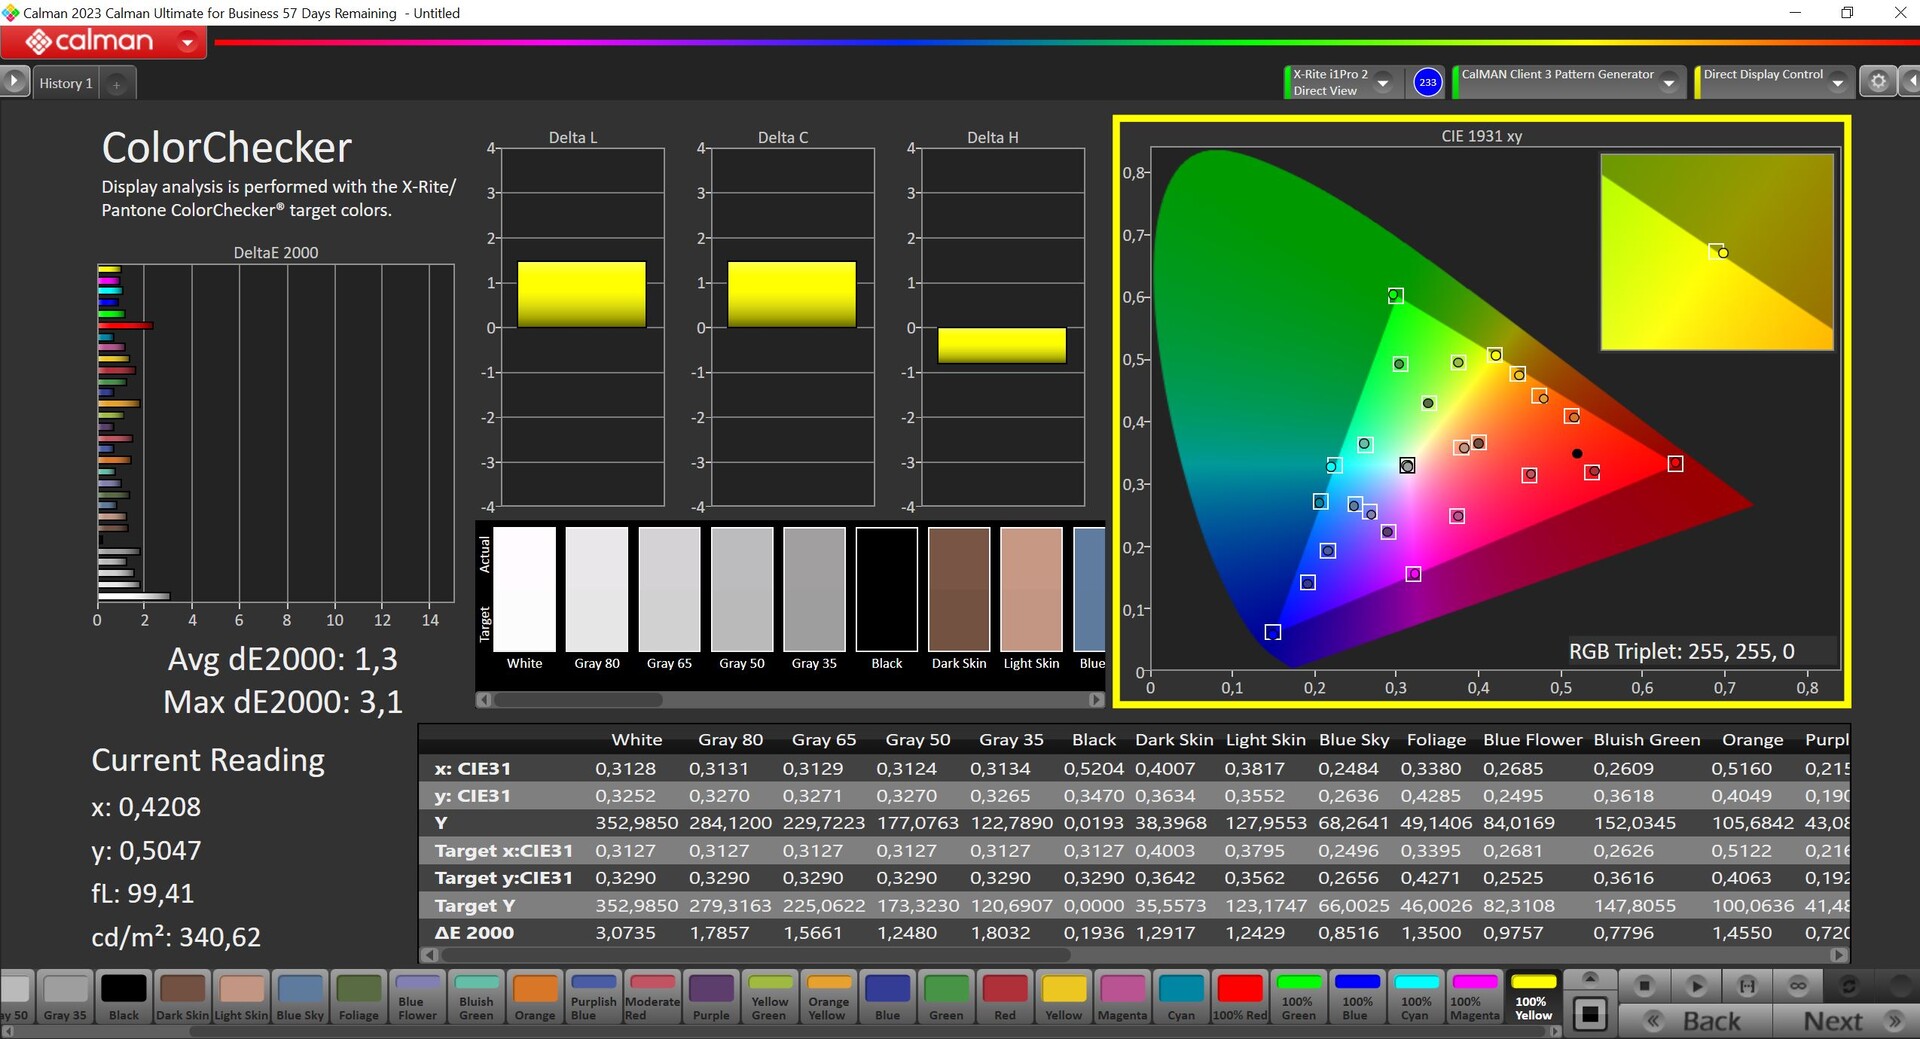
我们使用专业的 CalMAN 软件(X-Rite i1 Pro 2)对面板进行了分析,华硕一如既往地提供了各种色彩配置文件。预装模式为日常工作提供了良好的画面,但色彩略显饱和。在显示 P3 模式下,灰度和色彩偏差都低于重要的 3。同样,sRGB 模式也提供了准确的结果,由于完全覆盖了 sRGB 和 P3 色彩空间,ProArt P16 非常适合编辑图像和视频。通过我们自己的校准,我们能够改善灰度再现,但色彩偏差却增加了,这就是我们不提供可下载配置文件的原因。

Display Response Times
| ↔ Response Time Black to White | ||
|---|---|---|
| 1.25 ms ... rise ↗ and fall ↘ combined | ↗ 0.67 ms rise | 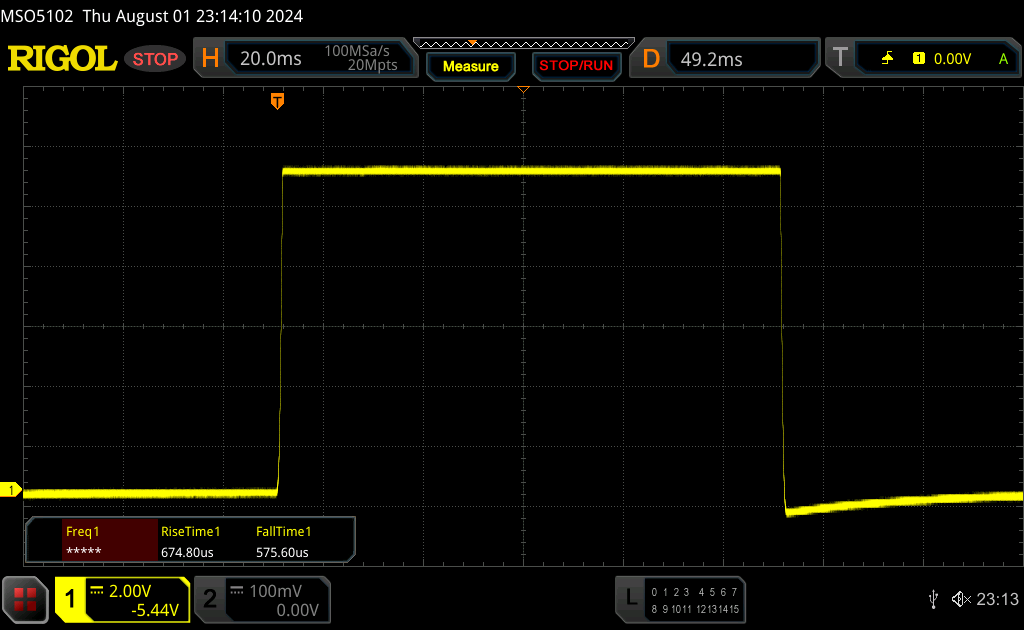 |
| ↘ 0.58 ms fall | ||
| The screen shows very fast response rates in our tests and should be very well suited for fast-paced gaming. In comparison, all tested devices range from 0.1 (minimum) to 240 (maximum) ms. » 5 % of all devices are better. This means that the measured response time is better than the average of all tested devices (20.8 ms). | ||
| ↔ Response Time 50% Grey to 80% Grey | ||
| 1.58 ms ... rise ↗ and fall ↘ combined | ↗ 0.84 ms rise | 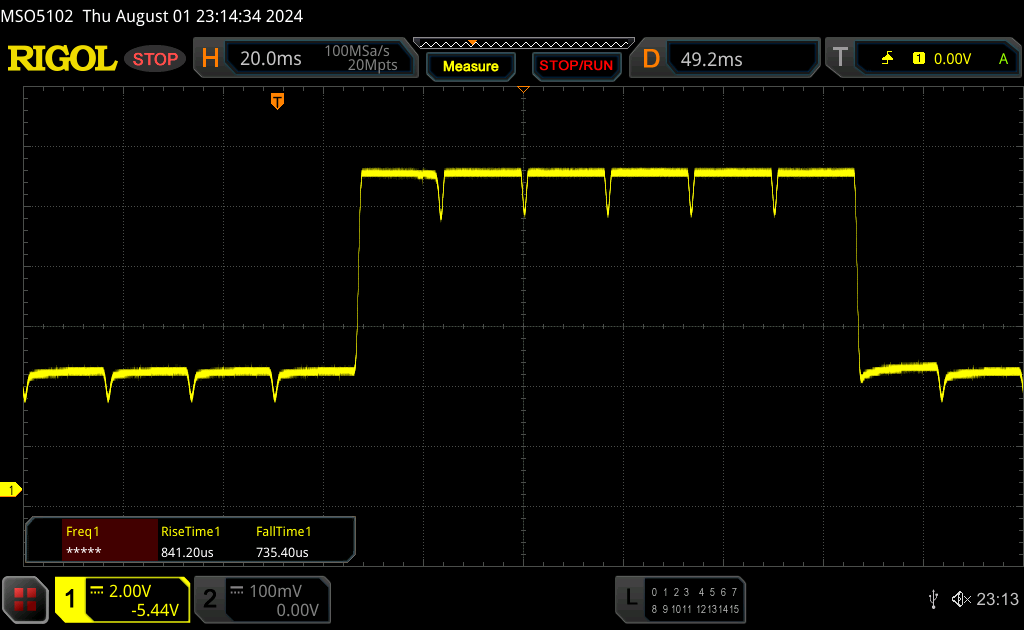 |
| ↘ 0.74 ms fall | ||
| The screen shows very fast response rates in our tests and should be very well suited for fast-paced gaming. In comparison, all tested devices range from 0.165 (minimum) to 636 (maximum) ms. » 5 % of all devices are better. This means that the measured response time is better than the average of all tested devices (32.5 ms). | ||
Screen Flickering / PWM (Pulse-Width Modulation)
| Screen flickering / PWM detected | 240 Hz Amplitude: 36 % | ≤ 52 % brightness setting | 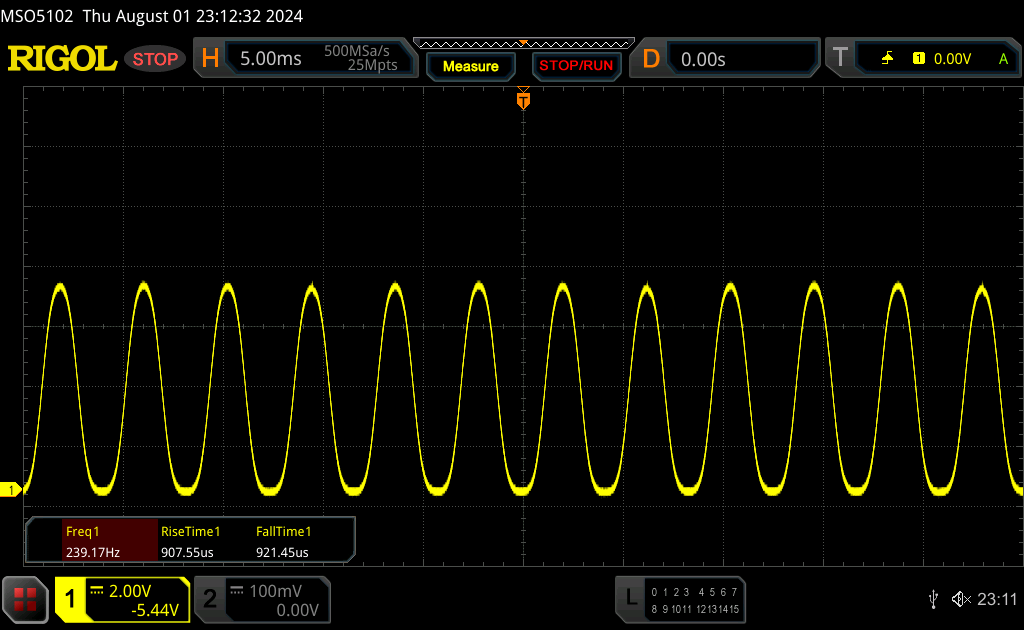 |
| ≤ 93 cd/m² brightness | |||
The display backlight flickers at 240 Hz (worst case, e.g., utilizing PWM) Flickering detected at a brightness setting of 52 % (93 cd/m²) and below. There should be no flickering or PWM above this brightness setting. The frequency of 240 Hz is relatively low, so sensitive users will likely notice flickering and experience eyestrain at the stated brightness setting and below. Flickering occurs at relatively low brightness settings, so extended use at this brightness setting or lower can cause eyestrain. In comparison: 53 % of all tested devices do not use PWM to dim the display. If PWM was detected, an average of 8516 (minimum: 5 - maximum: 343500) Hz was measured. | |||

频率为 60 Hz 的直流调光在亮度低于 53 % 时生效,亮度低于 53 % 时会出现 240 Hz 的闪烁。为了避免进入这一有害区域,华硕在 MyAsus 应用程序中提供了所谓的无闪烁 OLED 调光功能。
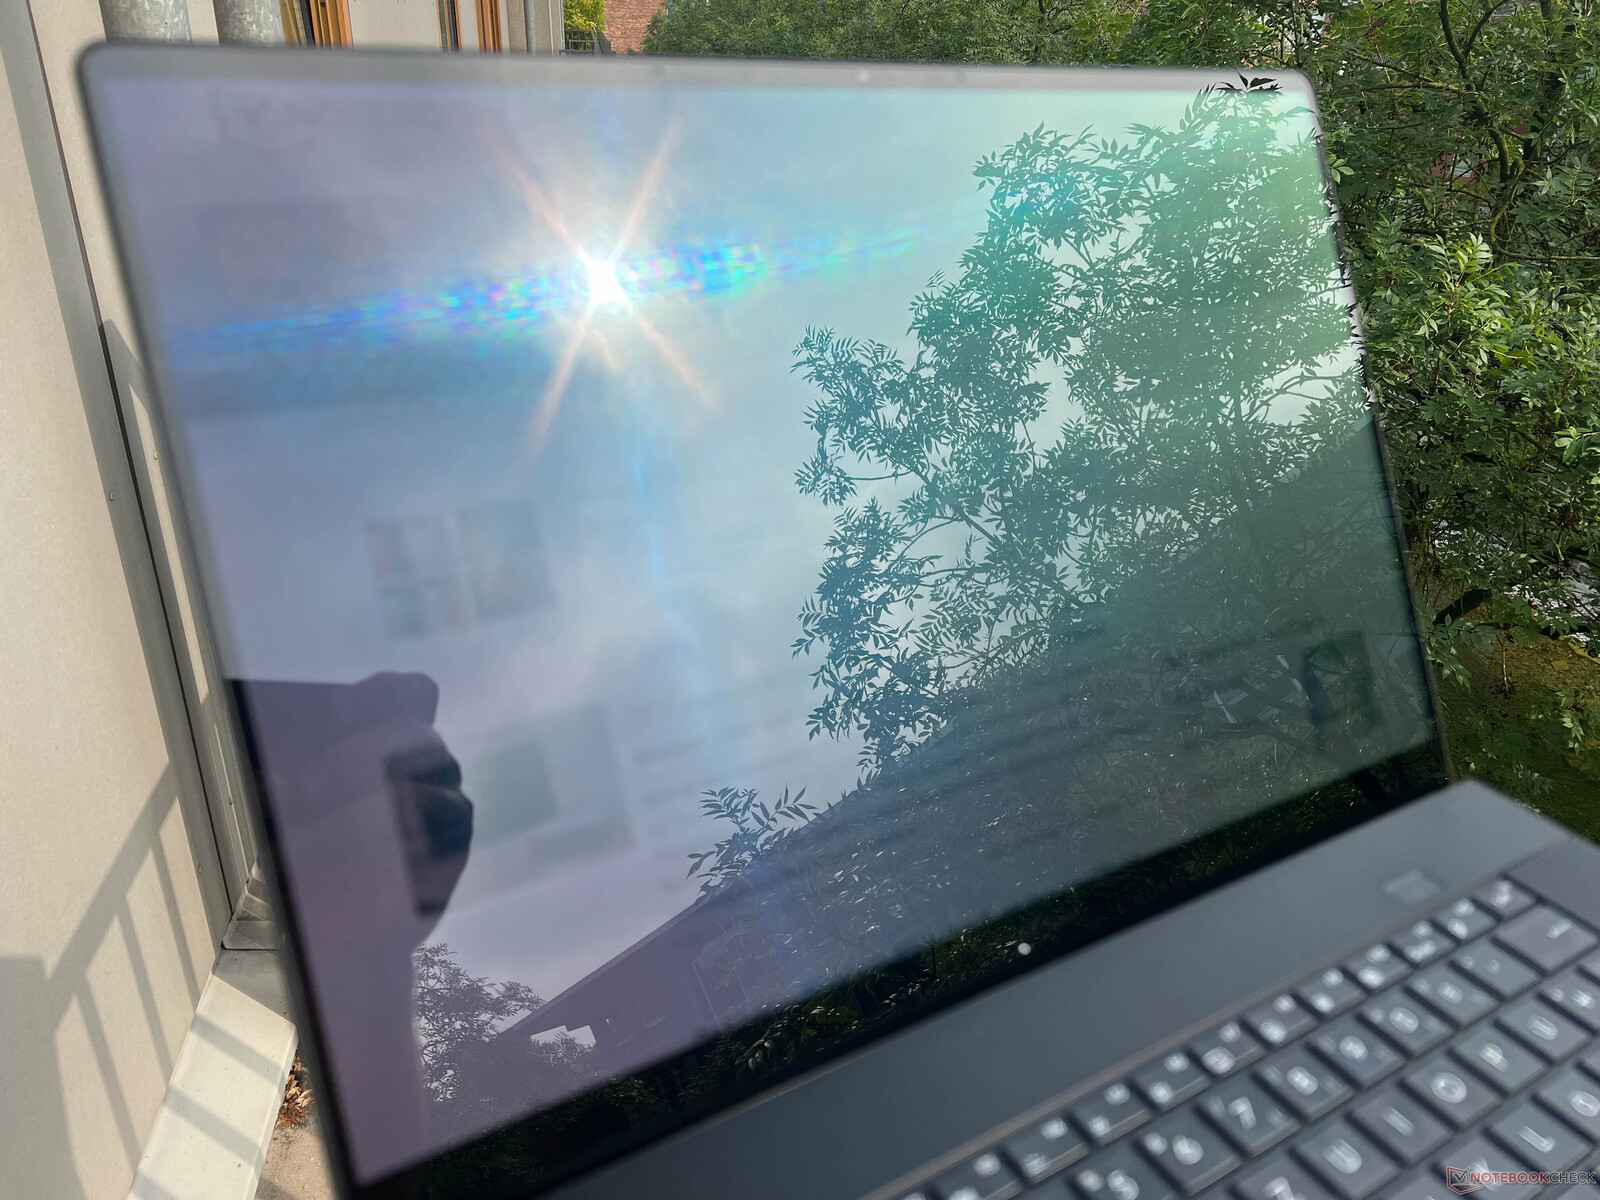

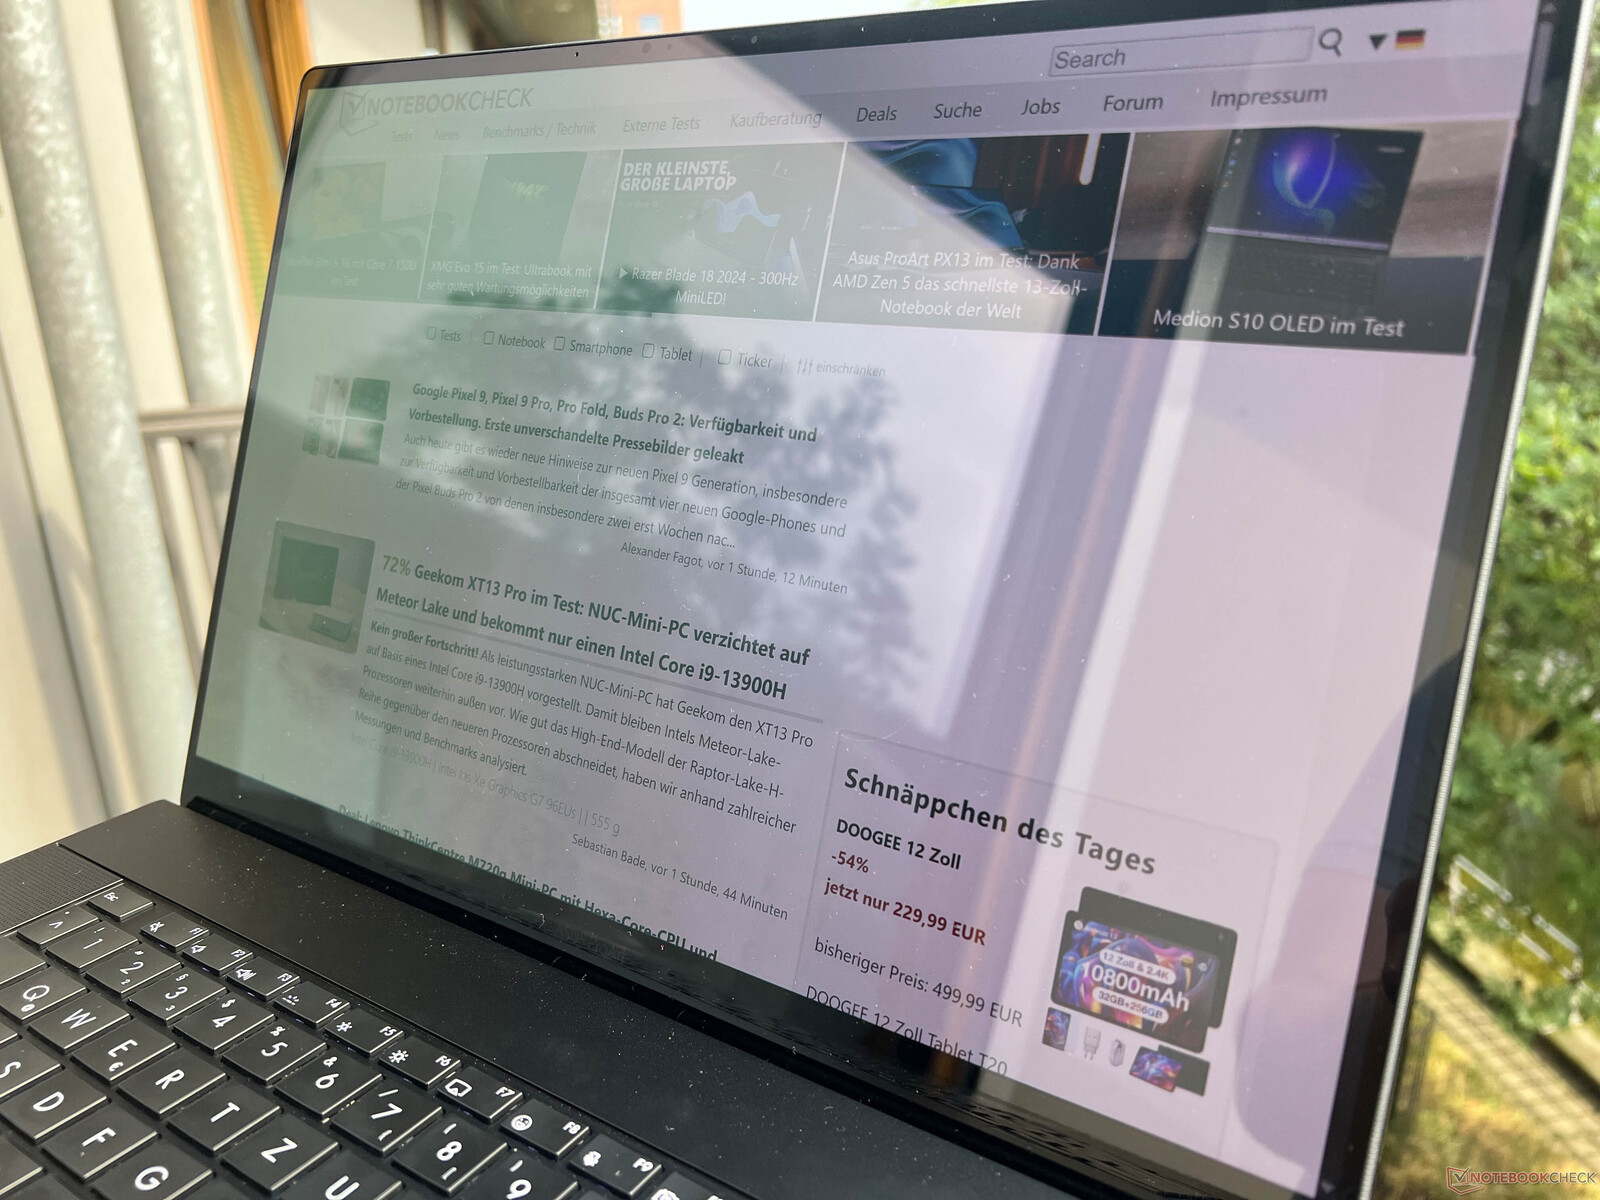
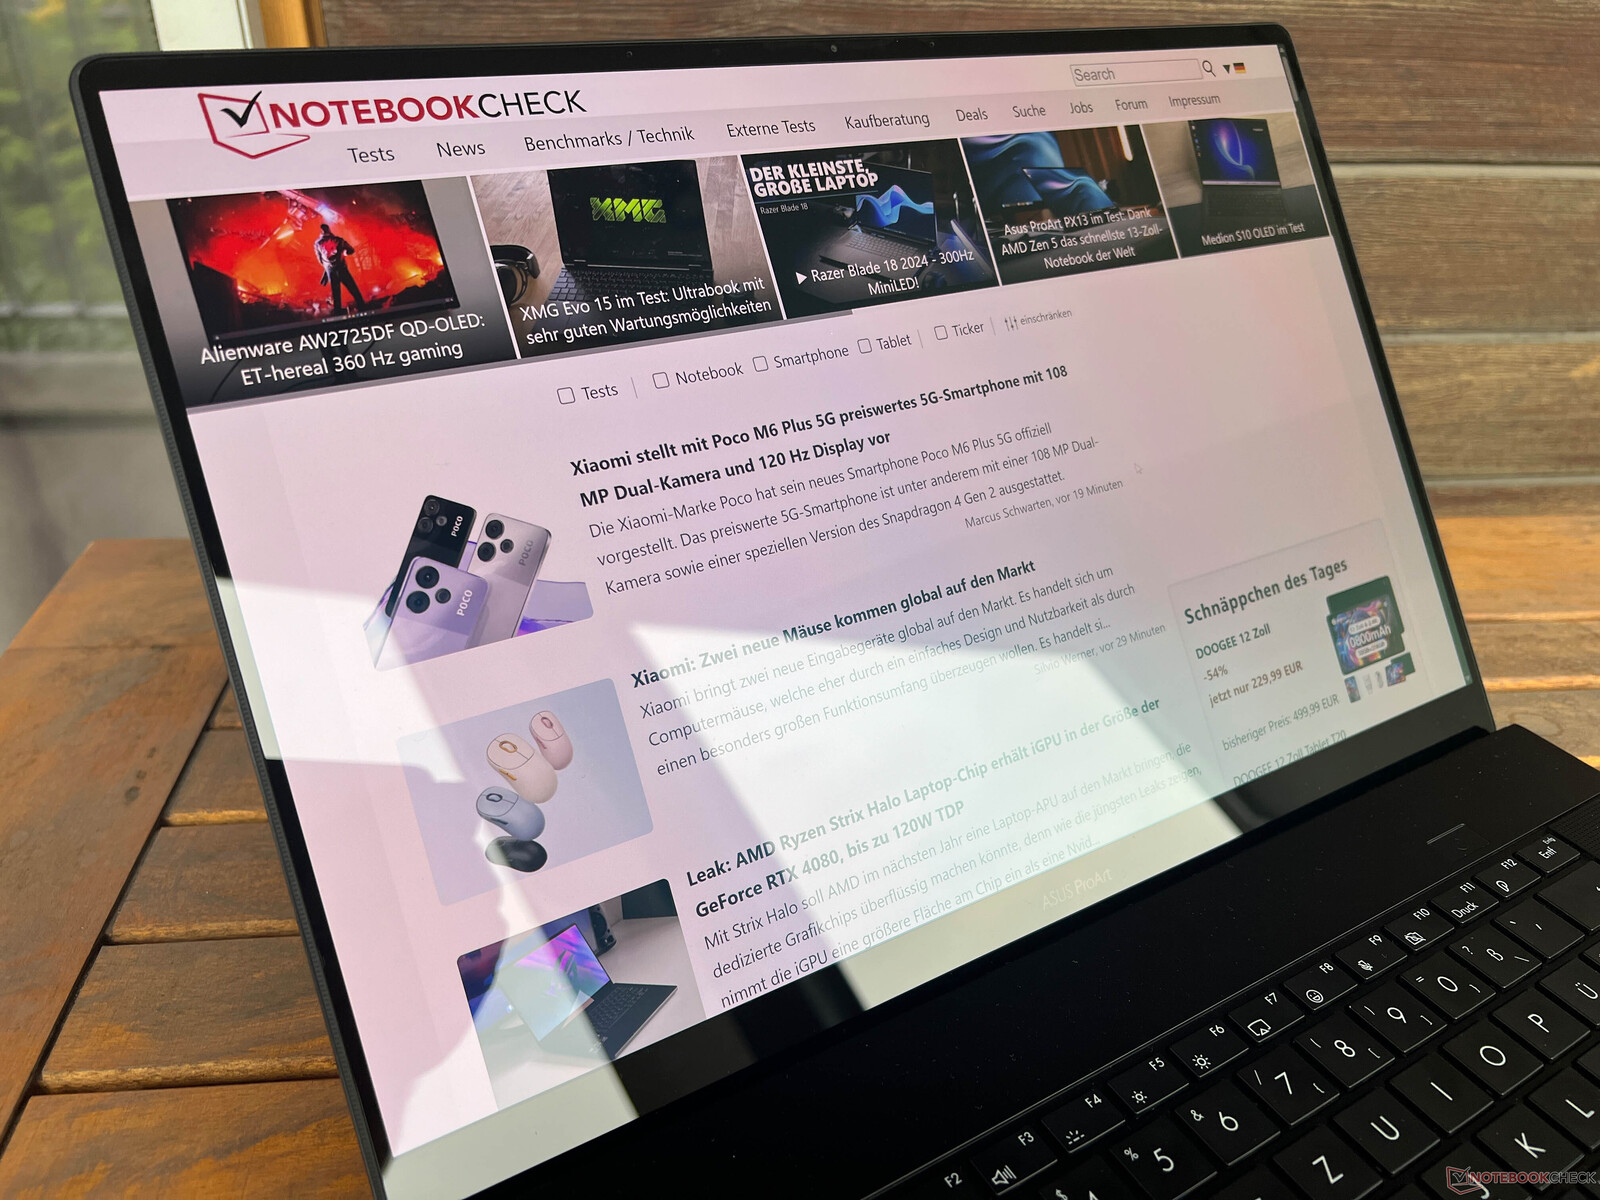
特别是在室外,光洁的触摸屏会出现反光问题。因此,我们建议在树荫下找个合适的地方。视角稳定性非常好。

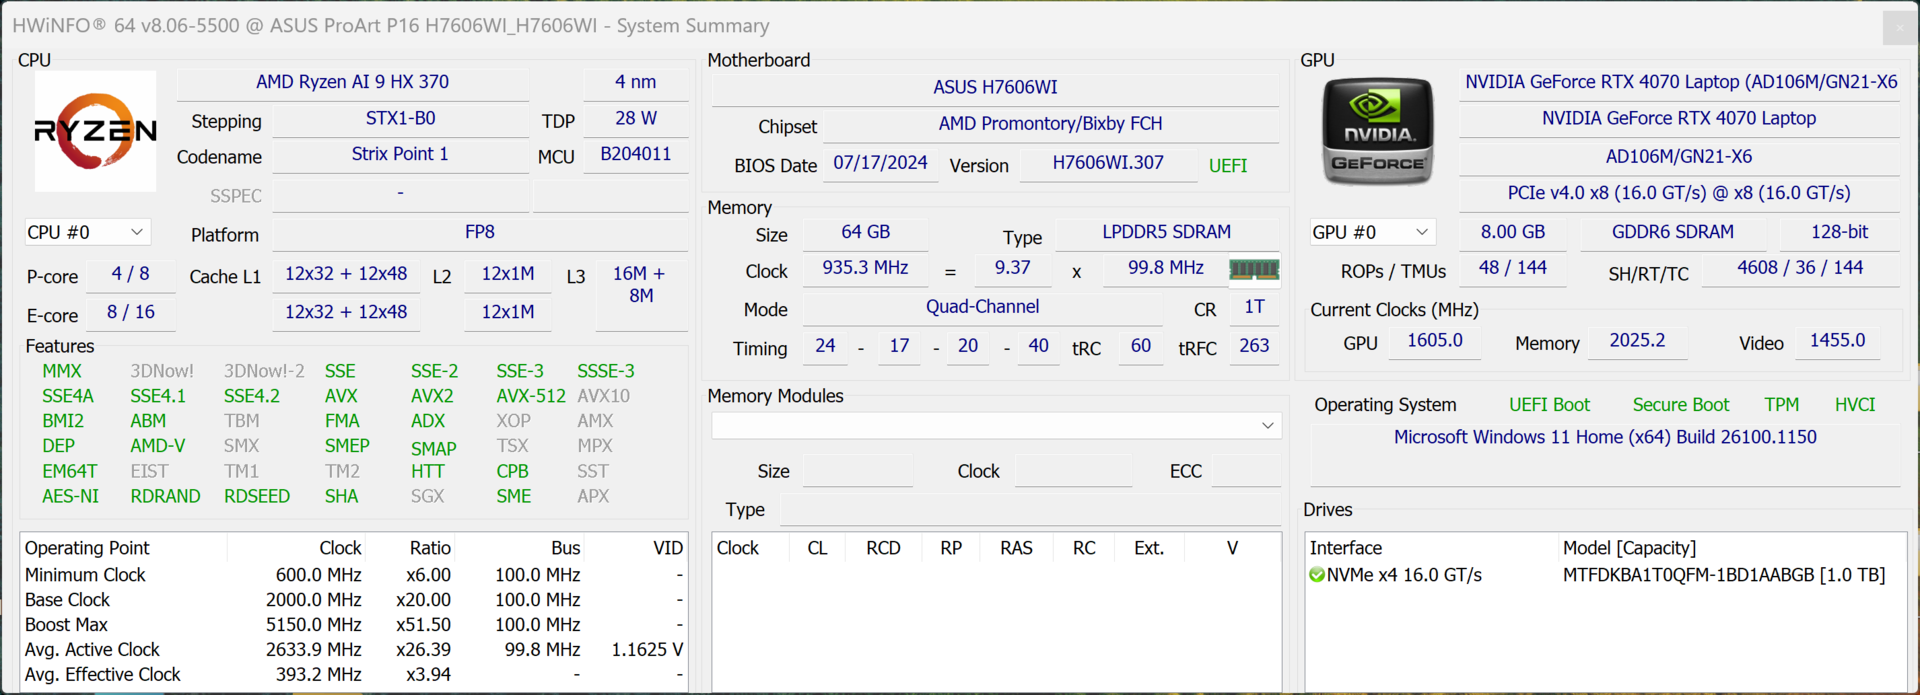
性能 - Zen 5,配备GeForce GPU 和 64 GB 内存
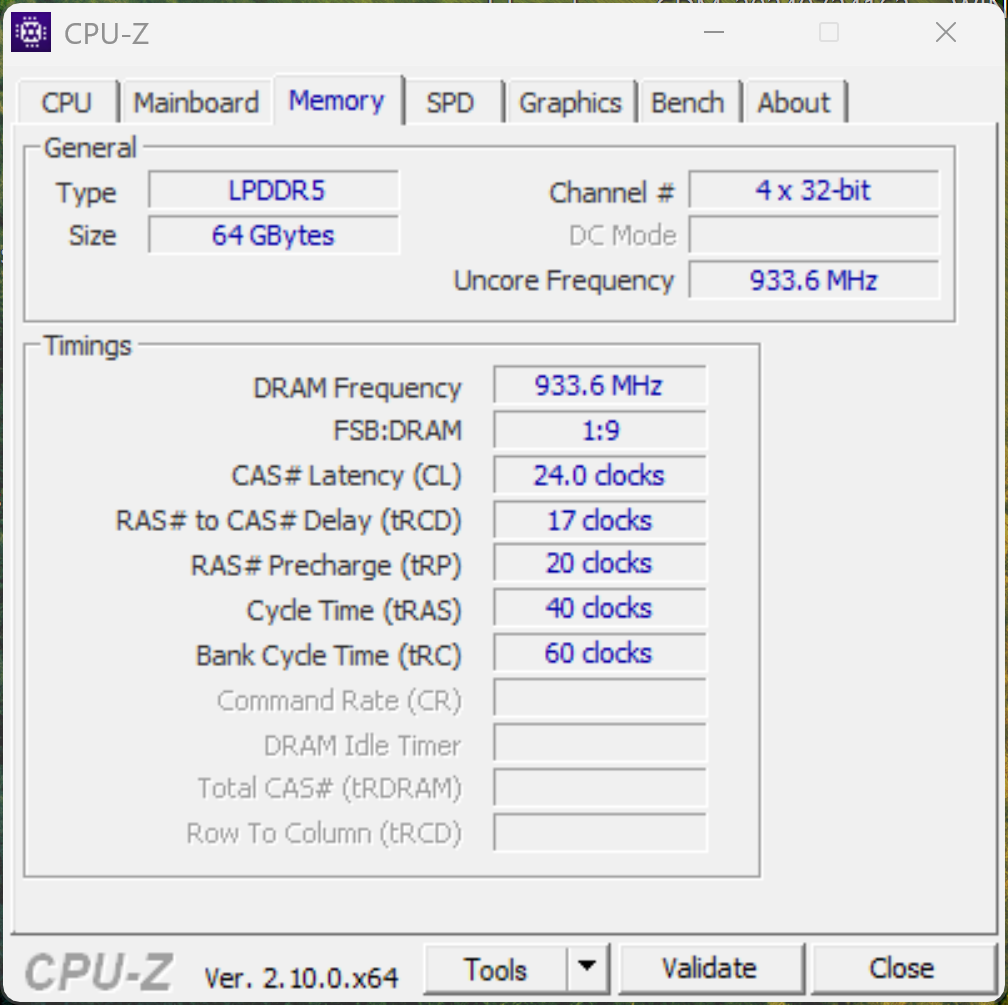
华硕为新款 ProArt P16 提供了两款新的 Ryzen AI 300 移动处理器分别与焊接式 LPDDR5x 7500 内存(24、32 或 64 GB)相结合。此外,我们还有目前 Nvidia 的 Ada Lovelace GPU(RTX 4050/4060/4070 笔记本电脑)。
测试条件
与往常一样,华硕提供三种不同的能源配置文件:低音、标准和性能。在下表中,我们汇总了它们各自的 TDP/TGP 和性能值。按照标准,我们使用性能模式进行了以下基准测试和测量,该模式仅在连接到主电源时可用。
| 能源概况 | TDP | CB R23 Multi | TGP | Time Spy 图形 | CP 2077 QHD/Ultra | 压力测试 | 最大风扇速度 |
|---|---|---|---|---|---|---|---|
| Whisper | 60/55W | 21,046 点 | 60W | 8,749 点 | 34 FPS | CPU:30W GPU:42W |
42.2 dB(A) |
| 标准 | 70/65W | 22,651 分 | 80W | 10,526 分 | 44.2 FPS | CPU:30W GPU:65W |
47.1 dB(A) |
| 性能 | 80W | 23,795 分 | 105W | 11,941 分 | 49.4 FPS | CPU:37W GPU:85W |
53.2 dB(A) |
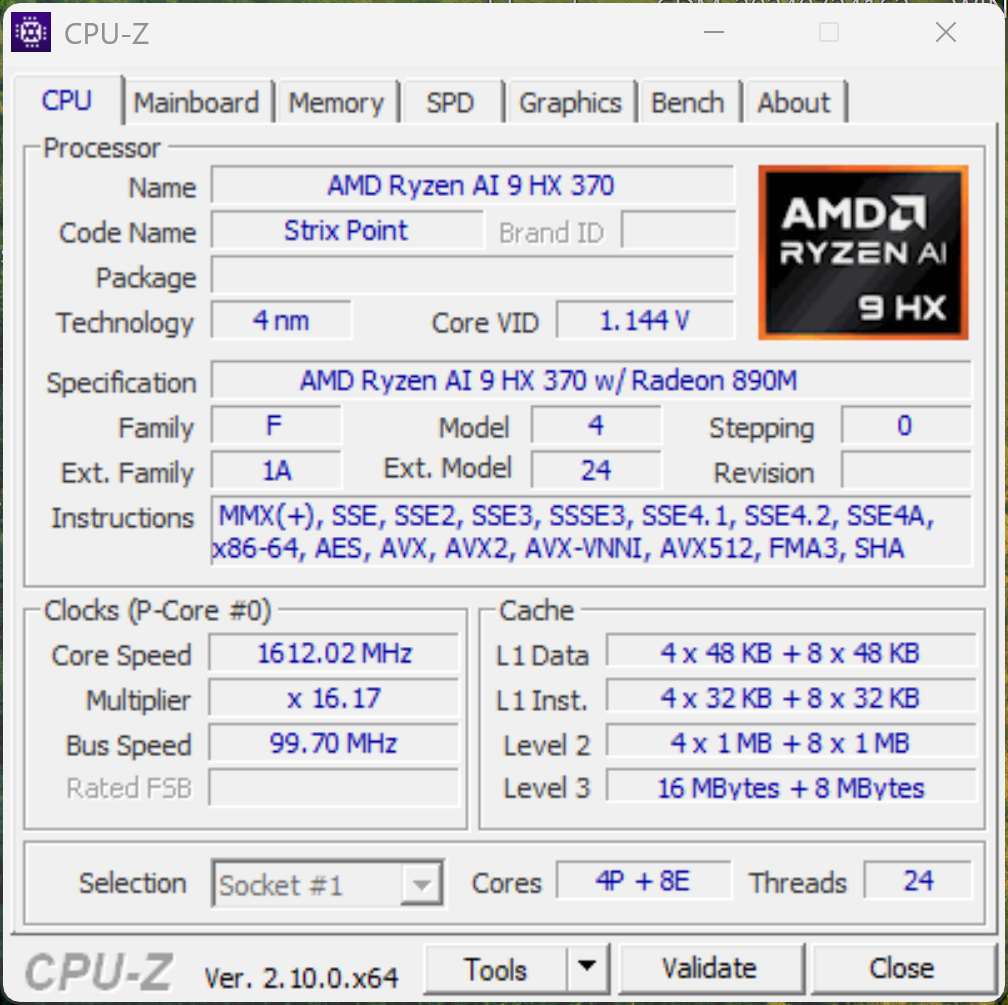
处理器 - Ryzen AI 9 HX 370
新款 AMD Ryzen AI 9 HX 370提供 12 个 Zen 5 内核(24 个线程),最高速度可达 5.1 GHz。更多技术分析,请参阅 我们的 CPU 分析.ProArt P16 处理器的功耗仅为 80 瓦,性能非常高且特别稳定。只有采用 酷睿 i9 14900HX和 Apple M3 Max流星湖芯片的竞争对手,而 Zenbook Pro 16X的 酷睿 i9 13905H则被甩在了后面。在电池模式下,处理器的最大功耗为 70/65 瓦,这只会导致性能略有下降(-7%)。其他 CPU 基准测试见 这里.
Cinebench R15 Multi Continuous Test
Cinebench R23: Multi Core | Single Core
Cinebench R20: CPU (Multi Core) | CPU (Single Core)
Cinebench R15: CPU Multi 64Bit | CPU Single 64Bit
Blender: v2.79 BMW27 CPU
7-Zip 18.03: 7z b 4 | 7z b 4 -mmt1
Geekbench 6.4: Multi-Core | Single-Core
Geekbench 5.5: Multi-Core | Single-Core
HWBOT x265 Benchmark v2.2: 4k Preset
LibreOffice : 20 Documents To PDF
R Benchmark 2.5: Overall mean
| Cinebench 2024 / CPU Multi Core | |
| Apple MacBook Pro 16 2023 M3 Max | |
| SCHENKER XMG Pro 16 Studio (Mid 24) | |
| Asus ProArt P16 H7606WI | |
| Average AMD Ryzen AI 9 HX 370 (621 - 1284, n=24) | |
| Dell XPS 16 9640 | |
| Average of class Multimedia (327 - 2069, n=57, last 2 years) | |
| Asus ROG Zephyrus G16 2024 GU605M | |
| Cinebench 2024 / CPU Single Core | |
| Apple MacBook Pro 16 2023 M3 Max | |
| Average of class Multimedia (72.5 - 178, n=38, last 2 years) | |
| SCHENKER XMG Pro 16 Studio (Mid 24) | |
| Average AMD Ryzen AI 9 HX 370 (113.6 - 121, n=14) | |
| Asus ProArt P16 H7606WI | |
| Dell XPS 16 9640 | |
| Asus ROG Zephyrus G16 2024 GU605M | |
| Cinebench R23 / Multi Core | |
| SCHENKER XMG Pro 16 Studio (Mid 24) | |
| Apple MacBook Pro 16 2023 M3 Max | |
| Asus ProArt P16 H7606WI | |
| Asus Zenbook Pro 16X UX7602BZ-MY005W | |
| Average AMD Ryzen AI 9 HX 370 (10435 - 23805, n=24) | |
| Lenovo Yoga Pro 9 16IMH9 | |
| Dell XPS 16 9640 | |
| Asus ROG Zephyrus G16 2024 GU605M | |
| Average of class Multimedia (4861 - 30789, n=96, last 2 years) | |
| Cinebench R23 / Single Core | |
| SCHENKER XMG Pro 16 Studio (Mid 24) | |
| Asus ProArt P16 H7606WI | |
| Asus Zenbook Pro 16X UX7602BZ-MY005W | |
| Average AMD Ryzen AI 9 HX 370 (1921 - 2049, n=17) | |
| Apple MacBook Pro 16 2023 M3 Max | |
| Lenovo Yoga Pro 9 16IMH9 | |
| Average of class Multimedia (878 - 2290, n=87, last 2 years) | |
| Dell XPS 16 9640 | |
| Asus ROG Zephyrus G16 2024 GU605M | |
| Cinebench R20 / CPU (Multi Core) | |
| SCHENKER XMG Pro 16 Studio (Mid 24) | |
| Asus ProArt P16 H7606WI | |
| Average AMD Ryzen AI 9 HX 370 (6449 - 9250, n=16) | |
| Lenovo Yoga Pro 9 16IMH9 | |
| Asus Zenbook Pro 16X UX7602BZ-MY005W | |
| Dell XPS 16 9640 | |
| Asus ROG Zephyrus G16 2024 GU605M | |
| Apple MacBook Pro 16 2023 M3 Max | |
| Average of class Multimedia (1887 - 11924, n=80, last 2 years) | |
| Cinebench R20 / CPU (Single Core) | |
| Asus ProArt P16 H7606WI | |
| SCHENKER XMG Pro 16 Studio (Mid 24) | |
| Average AMD Ryzen AI 9 HX 370 (753 - 804, n=16) | |
| Lenovo Yoga Pro 9 16IMH9 | |
| Asus ROG Zephyrus G16 2024 GU605M | |
| Average of class Multimedia (341 - 853, n=80, last 2 years) | |
| Dell XPS 16 9640 | |
| Asus Zenbook Pro 16X UX7602BZ-MY005W | |
| Apple MacBook Pro 16 2023 M3 Max | |
| Cinebench R15 / CPU Multi 64Bit | |
| SCHENKER XMG Pro 16 Studio (Mid 24) | |
| Asus ProArt P16 H7606WI | |
| Apple MacBook Pro 16 2023 M3 Max | |
| Average AMD Ryzen AI 9 HX 370 (2498 - 3505, n=16) | |
| Lenovo Yoga Pro 9 16IMH9 | |
| Asus Zenbook Pro 16X UX7602BZ-MY005W | |
| Dell XPS 16 9640 | |
| Asus ROG Zephyrus G16 2024 GU605M | |
| Average of class Multimedia (856 - 5224, n=87, last 2 years) | |
| Cinebench R15 / CPU Single 64Bit | |
| Asus ProArt P16 H7606WI | |
| Average AMD Ryzen AI 9 HX 370 (293 - 315, n=16) | |
| SCHENKER XMG Pro 16 Studio (Mid 24) | |
| Lenovo Yoga Pro 9 16IMH9 | |
| Apple MacBook Pro 16 2023 M3 Max | |
| Asus ROG Zephyrus G16 2024 GU605M | |
| Average of class Multimedia (99.6 - 323, n=82, last 2 years) | |
| Dell XPS 16 9640 | |
| Asus Zenbook Pro 16X UX7602BZ-MY005W | |
| Blender / v2.79 BMW27 CPU | |
| Average of class Multimedia (100 - 557, n=80, last 2 years) | |
| Apple MacBook Pro 16 2023 M3 Max | |
| Asus ROG Zephyrus G16 2024 GU605M | |
| Dell XPS 16 9640 | |
| Asus Zenbook Pro 16X UX7602BZ-MY005W | |
| Lenovo Yoga Pro 9 16IMH9 | |
| Average AMD Ryzen AI 9 HX 370 (140 - 192, n=16) | |
| Asus ProArt P16 H7606WI | |
| SCHENKER XMG Pro 16 Studio (Mid 24) | |
| 7-Zip 18.03 / 7z b 4 | |
| SCHENKER XMG Pro 16 Studio (Mid 24) | |
| Asus ProArt P16 H7606WI | |
| Average AMD Ryzen AI 9 HX 370 (66154 - 83714, n=16) | |
| Lenovo Yoga Pro 9 16IMH9 | |
| Dell XPS 16 9640 | |
| Asus Zenbook Pro 16X UX7602BZ-MY005W | |
| Asus ROG Zephyrus G16 2024 GU605M | |
| Average of class Multimedia (29095 - 130368, n=75, last 2 years) | |
| 7-Zip 18.03 / 7z b 4 -mmt1 | |
| SCHENKER XMG Pro 16 Studio (Mid 24) | |
| Asus ProArt P16 H7606WI | |
| Average AMD Ryzen AI 9 HX 370 (5859 - 6497, n=16) | |
| Average of class Multimedia (3398 - 7545, n=75, last 2 years) | |
| Lenovo Yoga Pro 9 16IMH9 | |
| Asus Zenbook Pro 16X UX7602BZ-MY005W | |
| Dell XPS 16 9640 | |
| Asus ROG Zephyrus G16 2024 GU605M | |
| Geekbench 6.4 / Multi-Core | |
| Apple MacBook Pro 16 2023 M3 Max | |
| SCHENKER XMG Pro 16 Studio (Mid 24) | |
| Asus ProArt P16 H7606WI | |
| Average AMD Ryzen AI 9 HX 370 (11973 - 15671, n=18) | |
| Asus Zenbook Pro 16X UX7602BZ-MY005W | |
| Lenovo Yoga Pro 9 16IMH9 | |
| Dell XPS 16 9640 | |
| Average of class Multimedia (4983 - 25760, n=77, last 2 years) | |
| Asus ROG Zephyrus G16 2024 GU605M | |
| Geekbench 6.4 / Single-Core | |
| Apple MacBook Pro 16 2023 M3 Max | |
| Asus ProArt P16 H7606WI | |
| Average AMD Ryzen AI 9 HX 370 (2780 - 2965, n=18) | |
| SCHENKER XMG Pro 16 Studio (Mid 24) | |
| Average of class Multimedia (1534 - 3927, n=73, last 2 years) | |
| Lenovo Yoga Pro 9 16IMH9 | |
| Dell XPS 16 9640 | |
| Asus ROG Zephyrus G16 2024 GU605M | |
| Asus Zenbook Pro 16X UX7602BZ-MY005W | |
| Geekbench 5.5 / Multi-Core | |
| Apple MacBook Pro 16 2023 M3 Max | |
| SCHENKER XMG Pro 16 Studio (Mid 24) | |
| Asus ProArt P16 H7606WI | |
| Lenovo Yoga Pro 9 16IMH9 | |
| Average AMD Ryzen AI 9 HX 370 (11394 - 15407, n=17) | |
| Asus Zenbook Pro 16X UX7602BZ-MY005W | |
| Dell XPS 16 9640 | |
| Asus ROG Zephyrus G16 2024 GU605M | |
| Average of class Multimedia (4652 - 23059, n=79, last 2 years) | |
| Geekbench 5.5 / Single-Core | |
| Apple MacBook Pro 16 2023 M3 Max | |
| Average AMD Ryzen AI 9 HX 370 (1957 - 2136, n=17) | |
| Asus ProArt P16 H7606WI | |
| SCHENKER XMG Pro 16 Studio (Mid 24) | |
| Lenovo Yoga Pro 9 16IMH9 | |
| Average of class Multimedia (891 - 2555, n=79, last 2 years) | |
| Dell XPS 16 9640 | |
| Asus ROG Zephyrus G16 2024 GU605M | |
| Asus Zenbook Pro 16X UX7602BZ-MY005W | |
| HWBOT x265 Benchmark v2.2 / 4k Preset | |
| SCHENKER XMG Pro 16 Studio (Mid 24) | |
| Average AMD Ryzen AI 9 HX 370 (20.3 - 28.7, n=16) | |
| Asus ProArt P16 H7606WI | |
| Lenovo Yoga Pro 9 16IMH9 | |
| Asus Zenbook Pro 16X UX7602BZ-MY005W | |
| Dell XPS 16 9640 | |
| Asus ROG Zephyrus G16 2024 GU605M | |
| Average of class Multimedia (5.26 - 34.3, n=74, last 2 years) | |
| LibreOffice / 20 Documents To PDF | |
| Asus ProArt P16 H7606WI | |
| Average AMD Ryzen AI 9 HX 370 (46.8 - 66.6, n=16) | |
| Average of class Multimedia (23.9 - 146.7, n=76, last 2 years) | |
| Asus ROG Zephyrus G16 2024 GU605M | |
| Asus Zenbook Pro 16X UX7602BZ-MY005W | |
| SCHENKER XMG Pro 16 Studio (Mid 24) | |
| Dell XPS 16 9640 | |
| Lenovo Yoga Pro 9 16IMH9 | |
| R Benchmark 2.5 / Overall mean | |
| Dell XPS 16 9640 | |
| Asus Zenbook Pro 16X UX7602BZ-MY005W | |
| Average of class Multimedia (0.3604 - 0.947, n=74, last 2 years) | |
| Asus ROG Zephyrus G16 2024 GU605M | |
| Lenovo Yoga Pro 9 16IMH9 | |
| Average AMD Ryzen AI 9 HX 370 (0.3892 - 0.529, n=16) | |
| SCHENKER XMG Pro 16 Studio (Mid 24) | |
| Asus ProArt P16 H7606WI | |
* ... smaller is better
AIDA64: FP32 Ray-Trace | FPU Julia | CPU SHA3 | CPU Queen | FPU SinJulia | FPU Mandel | CPU AES | CPU ZLib | FP64 Ray-Trace | CPU PhotoWorxx
| Performance Rating | |
| Asus ProArt P16 H7606WI -2! | |
| Average AMD Ryzen AI 9 HX 370 | |
| SCHENKER XMG Pro 16 Studio (Mid 24) | |
| Lenovo Yoga Pro 9 16IMH9 | |
| Asus Zenbook Pro 16X UX7602BZ-MY005W | |
| Dell XPS 16 9640 | |
| Asus ROG Zephyrus G16 2024 GU605M | |
| Average of class Multimedia | |
| AIDA64 / FP32 Ray-Trace | |
| Average AMD Ryzen AI 9 HX 370 (24673 - 37654, n=15) | |
| SCHENKER XMG Pro 16 Studio (Mid 24) | |
| Asus Zenbook Pro 16X UX7602BZ-MY005W | |
| Lenovo Yoga Pro 9 16IMH9 | |
| Dell XPS 16 9640 | |
| Asus ROG Zephyrus G16 2024 GU605M | |
| Average of class Multimedia (5121 - 50388, n=73, last 2 years) | |
| AIDA64 / FPU Julia | |
| Asus ProArt P16 H7606WI | |
| Average AMD Ryzen AI 9 HX 370 (95655 - 147937, n=16) | |
| SCHENKER XMG Pro 16 Studio (Mid 24) | |
| Lenovo Yoga Pro 9 16IMH9 | |
| Asus Zenbook Pro 16X UX7602BZ-MY005W | |
| Dell XPS 16 9640 | |
| Asus ROG Zephyrus G16 2024 GU605M | |
| Average of class Multimedia (14528 - 201874, n=74, last 2 years) | |
| AIDA64 / CPU SHA3 | |
| Asus ProArt P16 H7606WI | |
| SCHENKER XMG Pro 16 Studio (Mid 24) | |
| Average AMD Ryzen AI 9 HX 370 (4421 - 5843, n=16) | |
| Lenovo Yoga Pro 9 16IMH9 | |
| Asus Zenbook Pro 16X UX7602BZ-MY005W | |
| Dell XPS 16 9640 | |
| Asus ROG Zephyrus G16 2024 GU605M | |
| Average of class Multimedia (1188 - 8623, n=74, last 2 years) | |
| AIDA64 / CPU Queen | |
| SCHENKER XMG Pro 16 Studio (Mid 24) | |
| Asus ProArt P16 H7606WI | |
| Asus Zenbook Pro 16X UX7602BZ-MY005W | |
| Lenovo Yoga Pro 9 16IMH9 | |
| Asus ROG Zephyrus G16 2024 GU605M | |
| Dell XPS 16 9640 | |
| Average of class Multimedia (21547 - 181505, n=74, last 2 years) | |
| Average AMD Ryzen AI 9 HX 370 (41744 - 99088, n=16) | |
| AIDA64 / FPU SinJulia | |
| Asus ProArt P16 H7606WI | |
| Average AMD Ryzen AI 9 HX 370 (16445 - 19115, n=16) | |
| SCHENKER XMG Pro 16 Studio (Mid 24) | |
| Lenovo Yoga Pro 9 16IMH9 | |
| Asus ROG Zephyrus G16 2024 GU605M | |
| Dell XPS 16 9640 | |
| Asus Zenbook Pro 16X UX7602BZ-MY005W | |
| Average of class Multimedia (1240 - 28794, n=74, last 2 years) | |
| AIDA64 / FPU Mandel | |
| Average AMD Ryzen AI 9 HX 370 (50357 - 79251, n=15) | |
| SCHENKER XMG Pro 16 Studio (Mid 24) | |
| Asus Zenbook Pro 16X UX7602BZ-MY005W | |
| Lenovo Yoga Pro 9 16IMH9 | |
| Dell XPS 16 9640 | |
| Asus ROG Zephyrus G16 2024 GU605M | |
| Average of class Multimedia (9903 - 105740, n=73, last 2 years) | |
| AIDA64 / CPU AES | |
| SCHENKER XMG Pro 16 Studio (Mid 24) | |
| Lenovo Yoga Pro 9 16IMH9 | |
| Dell XPS 16 9640 | |
| Asus ProArt P16 H7606WI | |
| Asus Zenbook Pro 16X UX7602BZ-MY005W | |
| Asus ROG Zephyrus G16 2024 GU605M | |
| Average AMD Ryzen AI 9 HX 370 (67015 - 96781, n=16) | |
| Average of class Multimedia (26066 - 169946, n=74, last 2 years) | |
| AIDA64 / CPU ZLib | |
| SCHENKER XMG Pro 16 Studio (Mid 24) | |
| Asus ProArt P16 H7606WI | |
| Average AMD Ryzen AI 9 HX 370 (1077 - 1530, n=16) | |
| Lenovo Yoga Pro 9 16IMH9 | |
| Dell XPS 16 9640 | |
| Asus Zenbook Pro 16X UX7602BZ-MY005W | |
| Asus ROG Zephyrus G16 2024 GU605M | |
| Average of class Multimedia (440 - 2022, n=74, last 2 years) | |
| AIDA64 / FP64 Ray-Trace | |
| Asus ProArt P16 H7606WI | |
| Average AMD Ryzen AI 9 HX 370 (13665 - 20608, n=16) | |
| SCHENKER XMG Pro 16 Studio (Mid 24) | |
| Asus Zenbook Pro 16X UX7602BZ-MY005W | |
| Lenovo Yoga Pro 9 16IMH9 | |
| Dell XPS 16 9640 | |
| Asus ROG Zephyrus G16 2024 GU605M | |
| Average of class Multimedia (2759 - 26875, n=74, last 2 years) | |
| AIDA64 / CPU PhotoWorxx | |
| Asus Zenbook Pro 16X UX7602BZ-MY005W | |
| Lenovo Yoga Pro 9 16IMH9 | |
| Dell XPS 16 9640 | |
| Asus ROG Zephyrus G16 2024 GU605M | |
| SCHENKER XMG Pro 16 Studio (Mid 24) | |
| Asus ProArt P16 H7606WI | |
| Average AMD Ryzen AI 9 HX 370 (36752 - 51727, n=16) | |
| Average of class Multimedia (12860 - 58844, n=74, last 2 years) | |
系统性能
无论是在日常情况下还是在合成基准测试中,ProArt P16 都是一款速度极快、反应灵敏的系统,可为要求苛刻的任务提供充足的储备。与小型 PX13 不同的是,它可选配 64 GB 内存。在测试过程中,我们无法启动 LatencyMon,在 F1 24 中也出现了蓝屏。不过,我们认为这是驱动程序的问题,并已与 AMD 联系。
CrossMark: Overall | Productivity | Creativity | Responsiveness
WebXPRT 3: Overall
WebXPRT 4: Overall
Mozilla Kraken 1.1: Total
| PCMark 10 / Score | |
| SCHENKER XMG Pro 16 Studio (Mid 24) | |
| Asus Zenbook Pro 16X UX7602BZ-MY005W | |
| Asus ProArt P16 H7606WI | |
| Average AMD Ryzen AI 9 HX 370, NVIDIA GeForce RTX 4070 Laptop GPU (7696 - 7752, n=3) | |
| Lenovo Yoga Pro 9 16IMH9 | |
| Asus ROG Zephyrus G16 2024 GU605M | |
| Dell XPS 16 9640 | |
| Average of class Multimedia (4325 - 8670, n=70, last 2 years) | |
| PCMark 10 / Essentials | |
| Asus Zenbook Pro 16X UX7602BZ-MY005W | |
| Lenovo Yoga Pro 9 16IMH9 | |
| SCHENKER XMG Pro 16 Studio (Mid 24) | |
| Average of class Multimedia (8025 - 12420, n=70, last 2 years) | |
| Dell XPS 16 9640 | |
| Asus ROG Zephyrus G16 2024 GU605M | |
| Asus ProArt P16 H7606WI | |
| Average AMD Ryzen AI 9 HX 370, NVIDIA GeForce RTX 4070 Laptop GPU (9856 - 10144, n=3) | |
| PCMark 10 / Productivity | |
| SCHENKER XMG Pro 16 Studio (Mid 24) | |
| Asus Zenbook Pro 16X UX7602BZ-MY005W | |
| Asus ProArt P16 H7606WI | |
| Average AMD Ryzen AI 9 HX 370, NVIDIA GeForce RTX 4070 Laptop GPU (9713 - 10027, n=3) | |
| Asus ROG Zephyrus G16 2024 GU605M | |
| Dell XPS 16 9640 | |
| Lenovo Yoga Pro 9 16IMH9 | |
| Average of class Multimedia (6089 - 10615, n=70, last 2 years) | |
| PCMark 10 / Digital Content Creation | |
| Asus ProArt P16 H7606WI | |
| Average AMD Ryzen AI 9 HX 370, NVIDIA GeForce RTX 4070 Laptop GPU (12165 - 13205, n=3) | |
| SCHENKER XMG Pro 16 Studio (Mid 24) | |
| Asus Zenbook Pro 16X UX7602BZ-MY005W | |
| Lenovo Yoga Pro 9 16IMH9 | |
| Asus ROG Zephyrus G16 2024 GU605M | |
| Dell XPS 16 9640 | |
| Average of class Multimedia (3651 - 13548, n=70, last 2 years) | |
| CrossMark / Overall | |
| SCHENKER XMG Pro 16 Studio (Mid 24) | |
| Apple MacBook Pro 16 2023 M3 Max | |
| Asus Zenbook Pro 16X UX7602BZ-MY005W | |
| Dell XPS 16 9640 | |
| Asus ProArt P16 H7606WI | |
| Average AMD Ryzen AI 9 HX 370, NVIDIA GeForce RTX 4070 Laptop GPU (1785 - 1794, n=2) | |
| Average of class Multimedia (866 - 2255, n=81, last 2 years) | |
| Asus ROG Zephyrus G16 2024 GU605M | |
| Lenovo Yoga Pro 9 16IMH9 | |
| CrossMark / Productivity | |
| SCHENKER XMG Pro 16 Studio (Mid 24) | |
| Asus Zenbook Pro 16X UX7602BZ-MY005W | |
| Apple MacBook Pro 16 2023 M3 Max | |
| Dell XPS 16 9640 | |
| Average of class Multimedia (913 - 2050, n=81, last 2 years) | |
| Asus ROG Zephyrus G16 2024 GU605M | |
| Lenovo Yoga Pro 9 16IMH9 | |
| Asus ProArt P16 H7606WI | |
| Average AMD Ryzen AI 9 HX 370, NVIDIA GeForce RTX 4070 Laptop GPU (1611 - 1611, n=2) | |
| CrossMark / Creativity | |
| Apple MacBook Pro 16 2023 M3 Max | |
| SCHENKER XMG Pro 16 Studio (Mid 24) | |
| Asus Zenbook Pro 16X UX7602BZ-MY005W | |
| Asus ProArt P16 H7606WI | |
| Average AMD Ryzen AI 9 HX 370, NVIDIA GeForce RTX 4070 Laptop GPU (2212 - 2270, n=2) | |
| Dell XPS 16 9640 | |
| Lenovo Yoga Pro 9 16IMH9 | |
| Average of class Multimedia (907 - 2795, n=81, last 2 years) | |
| Asus ROG Zephyrus G16 2024 GU605M | |
| CrossMark / Responsiveness | |
| SCHENKER XMG Pro 16 Studio (Mid 24) | |
| Dell XPS 16 9640 | |
| Asus Zenbook Pro 16X UX7602BZ-MY005W | |
| Apple MacBook Pro 16 2023 M3 Max | |
| Average of class Multimedia (605 - 2094, n=81, last 2 years) | |
| Asus ROG Zephyrus G16 2024 GU605M | |
| Lenovo Yoga Pro 9 16IMH9 | |
| Average AMD Ryzen AI 9 HX 370, NVIDIA GeForce RTX 4070 Laptop GPU (1225 - 1274, n=2) | |
| Asus ProArt P16 H7606WI | |
| WebXPRT 3 / Overall | |
| Apple MacBook Pro 16 2023 M3 Max | |
| Average of class Multimedia (136.4 - 545, n=81, last 2 years) | |
| SCHENKER XMG Pro 16 Studio (Mid 24) | |
| Asus ProArt P16 H7606WI | |
| Lenovo Yoga Pro 9 16IMH9 | |
| Average AMD Ryzen AI 9 HX 370, NVIDIA GeForce RTX 4070 Laptop GPU (282 - 298, n=2) | |
| Asus ROG Zephyrus G16 2024 GU605M | |
| Dell XPS 16 9640 | |
| WebXPRT 4 / Overall | |
| SCHENKER XMG Pro 16 Studio (Mid 24) | |
| Average of class Multimedia (133.2 - 353, n=75, last 2 years) | |
| Lenovo Yoga Pro 9 16IMH9 | |
| Asus ROG Zephyrus G16 2024 GU605M | |
| Dell XPS 16 9640 | |
| Average AMD Ryzen AI 9 HX 370, NVIDIA GeForce RTX 4070 Laptop GPU (244 - 247, n=2) | |
| Asus ProArt P16 H7606WI | |
| Asus Zenbook Pro 16X UX7602BZ-MY005W | |
| Mozilla Kraken 1.1 / Total | |
| Asus ROG Zephyrus G16 2024 GU605M | |
| Asus Zenbook Pro 16X UX7602BZ-MY005W | |
| Lenovo Yoga Pro 9 16IMH9 | |
| Average of class Multimedia (254 - 1016, n=86, last 2 years) | |
| SCHENKER XMG Pro 16 Studio (Mid 24) | |
| Average AMD Ryzen AI 9 HX 370, NVIDIA GeForce RTX 4070 Laptop GPU (439 - 460, n=2) | |
| Asus ProArt P16 H7606WI | |
| Apple MacBook Pro 16 2023 M3 Max | |
* ... smaller is better
| PCMark 10 Score | 7752 points | |
Help | ||
| AIDA64 / Memory Copy | |
| Lenovo Yoga Pro 9 16IMH9 | |
| Dell XPS 16 9640 | |
| Asus ProArt P16 H7606WI | |
| Asus ROG Zephyrus G16 2024 GU605M | |
| Asus Zenbook Pro 16X UX7602BZ-MY005W | |
| Average AMD Ryzen AI 9 HX 370 (72702 - 93640, n=16) | |
| SCHENKER XMG Pro 16 Studio (Mid 24) | |
| Average of class Multimedia (21158 - 104459, n=74, last 2 years) | |
| AIDA64 / Memory Read | |
| Asus ProArt P16 H7606WI | |
| Average AMD Ryzen AI 9 HX 370 (84635 - 102937, n=16) | |
| Lenovo Yoga Pro 9 16IMH9 | |
| Asus ROG Zephyrus G16 2024 GU605M | |
| SCHENKER XMG Pro 16 Studio (Mid 24) | |
| Dell XPS 16 9640 | |
| Asus Zenbook Pro 16X UX7602BZ-MY005W | |
| Average of class Multimedia (24312 - 125604, n=74, last 2 years) | |
| AIDA64 / Memory Write | |
| Asus Zenbook Pro 16X UX7602BZ-MY005W | |
| Asus ProArt P16 H7606WI | |
| Average AMD Ryzen AI 9 HX 370 (83907 - 108954, n=16) | |
| Lenovo Yoga Pro 9 16IMH9 | |
| Dell XPS 16 9640 | |
| Asus ROG Zephyrus G16 2024 GU605M | |
| SCHENKER XMG Pro 16 Studio (Mid 24) | |
| Average of class Multimedia (23679 - 117933, n=74, last 2 years) | |
| AIDA64 / Memory Latency | |
| Asus ROG Zephyrus G16 2024 GU605M | |
| Dell XPS 16 9640 | |
| Lenovo Yoga Pro 9 16IMH9 | |
| Asus ProArt P16 H7606WI | |
| Average of class Multimedia (7 - 346, n=74, last 2 years) | |
| Average AMD Ryzen AI 9 HX 370 (87.2 - 119.4, n=16) | |
| Asus Zenbook Pro 16X UX7602BZ-MY005W | |
| SCHENKER XMG Pro 16 Studio (Mid 24) | |
* ... smaller is better
DPC 延迟
如前所述,我们的评测设备无法启动 LatencyMon。不过,至少在播放 4K 视频(YouTube)时没有出现掉帧问题。
大容量存储器
我们的评测设备配备的是 1 TB Micron 2400 变体,但首次安装后,用户可使用 879 GB。主 M.2 2280 固态硬盘通过快速 PCIe 4.0 x4 接口连接,但与竞争对手相比,固态硬盘的性能并不特别出色。不过,在较长时间的负载情况下,性能仍然保持稳定。ProArt P16 还提供第二个 M.2 2280 插槽,这意味着存储设备可以轻松升级。不过,第二个插槽只能通过 Pcie 4.0 x2 连接,最高速度限制为 4 GB/s。其他固态硬盘基准测试 这里.

* ... smaller is better
Continuous Performance Read: DiskSpd Read Loop, Queue Depth 8
显卡 -GeForce RTX 4070 笔记本电脑
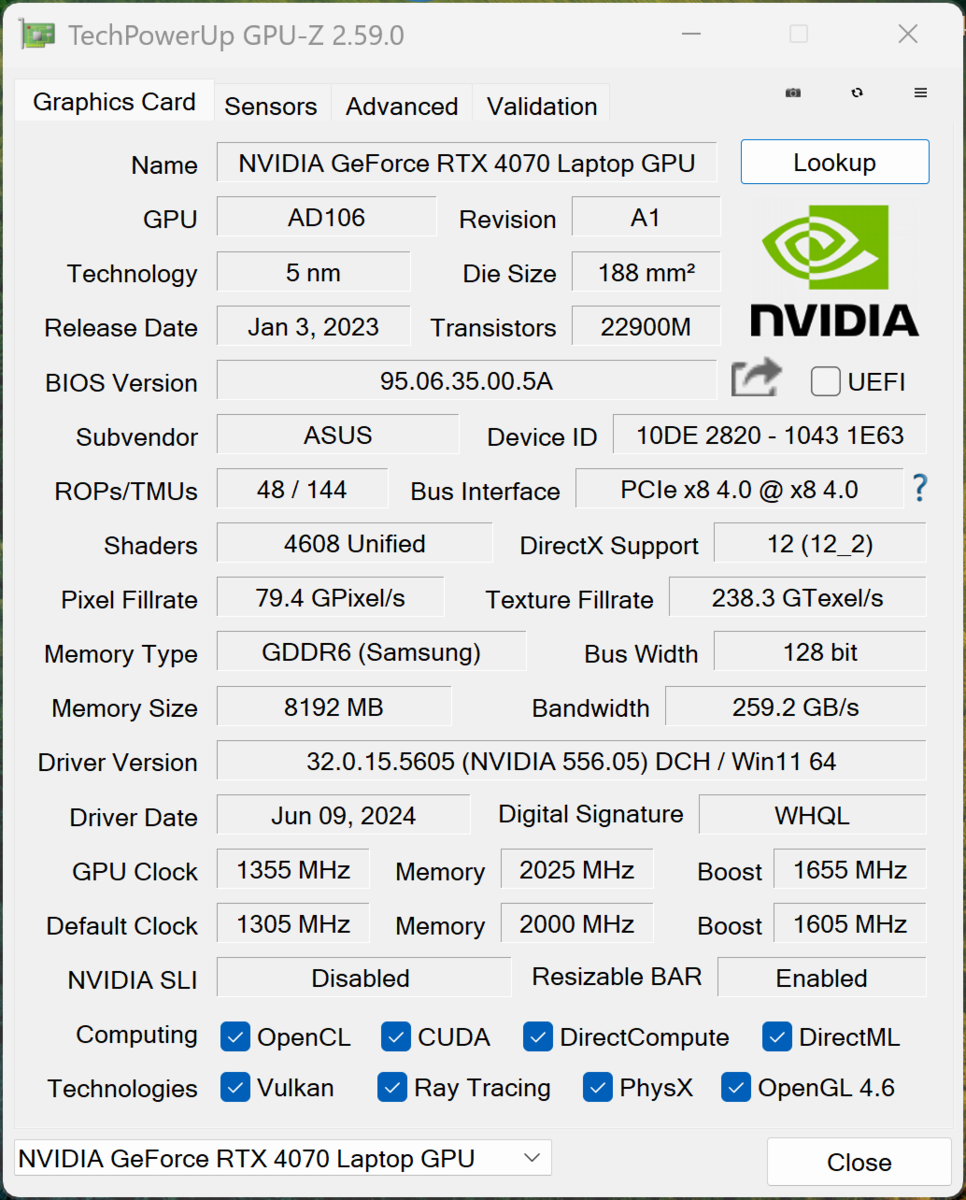
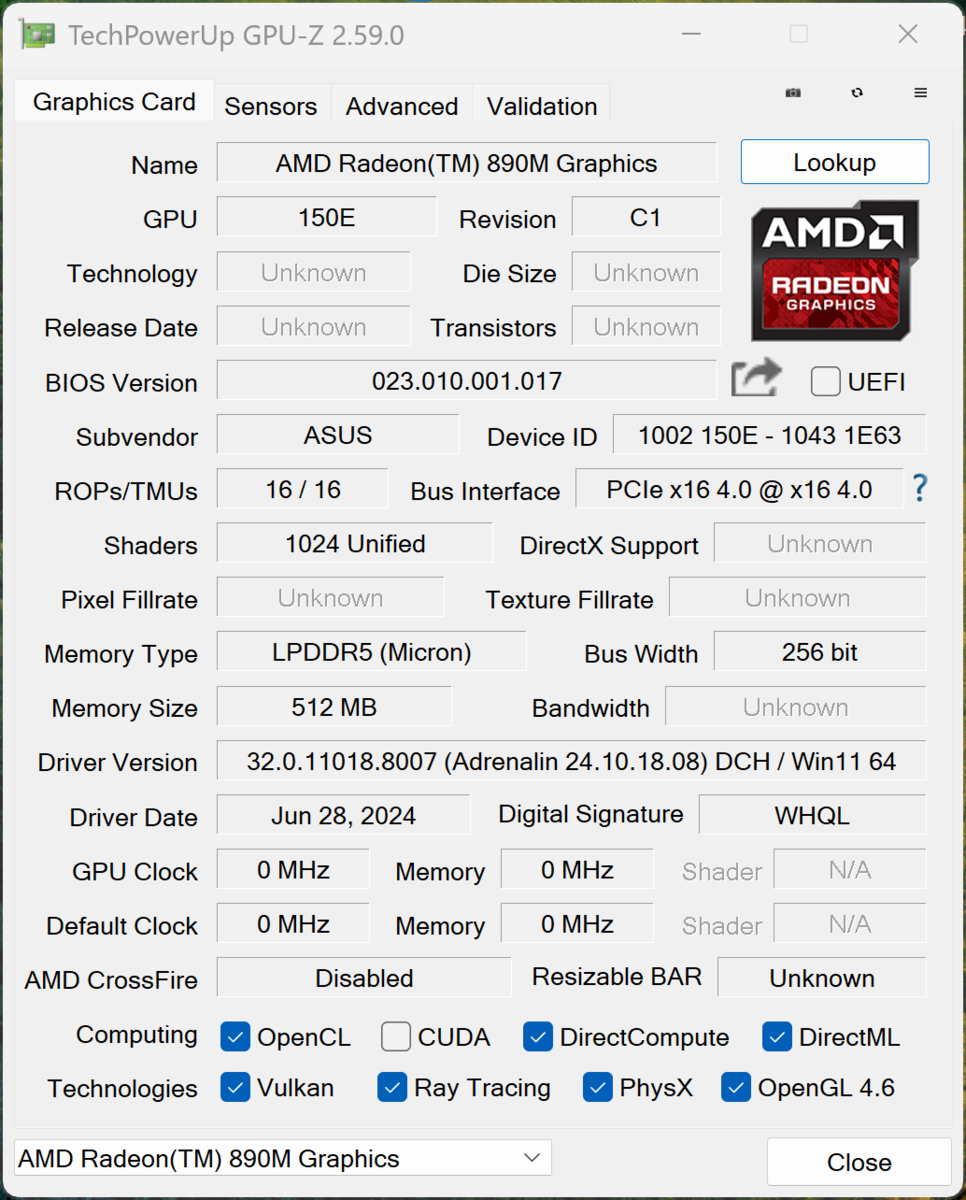
我们的顶级型号 ProArt P16 配备了专用的 GeForce RTX 4070 笔记本电脑.最大功耗为 105 瓦(85 瓦 TGP + 20 瓦 Dynamic Boost),图形切换由标准 Optimus 技术完成。对于要求不高的任务,图形计算由集成的 Radeon 890M.
在 GPU 基准测试中,性能与其他 RTX 4070 竞争对手处于同一水平,但 RTX 4080 笔记本电脑中的 Zenbook Pro 16X(最大功耗为 140 瓦)的速度更快,这是可以理解的。Apple's M3 Max GPUM3 Max GPU 的速度也要快得多,它的优势在于可以访问所有的 RAM,而 RTX 4070 笔记本电脑的 8 GB VRAM 很快就会成为瓶颈,尤其是在编辑视频时。
在连续负载情况下,GPU 保持完全稳定。在电池模式下,RTX 4070 的最大功耗为 42 瓦,这就是为什么在这种情况下 GPU 性能会明显降低(-35%)。其他图形基准测试 这里.
| GFXBench | |
| 3840x2160 4K Aztec Ruins High Tier Offscreen | |
| Apple MacBook Pro 16 2023 M3 Max | |
| Average NVIDIA GeForce RTX 4070 Laptop GPU (123.9 - 127.6, n=2) | |
| Asus ProArt P16 H7606WI | |
| Average of class Multimedia (36.4 - 232, n=16, last 2 years) | |
| 2560x1440 Aztec Ruins High Tier Offscreen | |
| Apple MacBook Pro 16 2023 M3 Max | |
| Average NVIDIA GeForce RTX 4070 Laptop GPU (282 - 289, n=2) | |
| Asus ProArt P16 H7606WI | |
| Average of class Multimedia (73.3 - 516, n=16, last 2 years) | |
| 1920x1080 Aztec Ruins Normal Tier Offscreen | |
| Apple MacBook Pro 16 2023 M3 Max | |
| Average NVIDIA GeForce RTX 4070 Laptop GPU (696 - 736, n=2) | |
| Asus ProArt P16 H7606WI | |
| Average of class Multimedia (178.3 - 1302, n=15, last 2 years) | |
| 3DMark 11 Performance | 33231 points | |
| 3DMark Fire Strike Score | 26198 points | |
| 3DMark Time Spy Score | 11790 points | |
| 3DMark Steel Nomad Score | 2637 points | |
| 3DMark Steel Nomad Light Score | 12189 points | |
Help | ||
| Blender / v3.3 Classroom OPTIX/RTX | |
| Average of class Multimedia (19 - 105, n=39, last 2 years) | |
| SCHENKER XMG Pro 16 Studio (Mid 24) | |
| Asus ROG Zephyrus G16 2024 GU605M | |
| Asus ProArt P16 H7606WI | |
| Average NVIDIA GeForce RTX 4070 Laptop GPU (18 - 30, n=67) | |
| Dell XPS 16 9640 | |
| Lenovo Yoga Pro 9 16IMH9 | |
| Asus Zenbook Pro 16X UX7602BZ-MY005W | |
| Blender / v3.3 Classroom CUDA | |
| Average of class Multimedia (32 - 164, n=39, last 2 years) | |
| Dell XPS 16 9640 | |
| Average NVIDIA GeForce RTX 4070 Laptop GPU (32 - 50, n=66) | |
| Asus ROG Zephyrus G16 2024 GU605M | |
| SCHENKER XMG Pro 16 Studio (Mid 24) | |
| Asus ProArt P16 H7606WI | |
| Lenovo Yoga Pro 9 16IMH9 | |
| Asus Zenbook Pro 16X UX7602BZ-MY005W | |
| Blender / v3.3 Classroom CPU | |
| Average of class Multimedia (160 - 1042, n=80, last 2 years) | |
| Asus ROG Zephyrus G16 2024 GU605M | |
| Dell XPS 16 9640 | |
| Average NVIDIA GeForce RTX 4070 Laptop GPU (158 - 440, n=66) | |
| Lenovo Yoga Pro 9 16IMH9 | |
| Asus Zenbook Pro 16X UX7602BZ-MY005W | |
| SCHENKER XMG Pro 16 Studio (Mid 24) | |
| Asus ProArt P16 H7606WI | |
| Apple MacBook Pro 16 2023 M3 Max | |
| Blender / v3.3 Classroom METAL | |
| Average of class Multimedia (17.8 - 121, n=7, last 2 years) | |
| Apple MacBook Pro 16 2023 M3 Max | |
* ... smaller is better
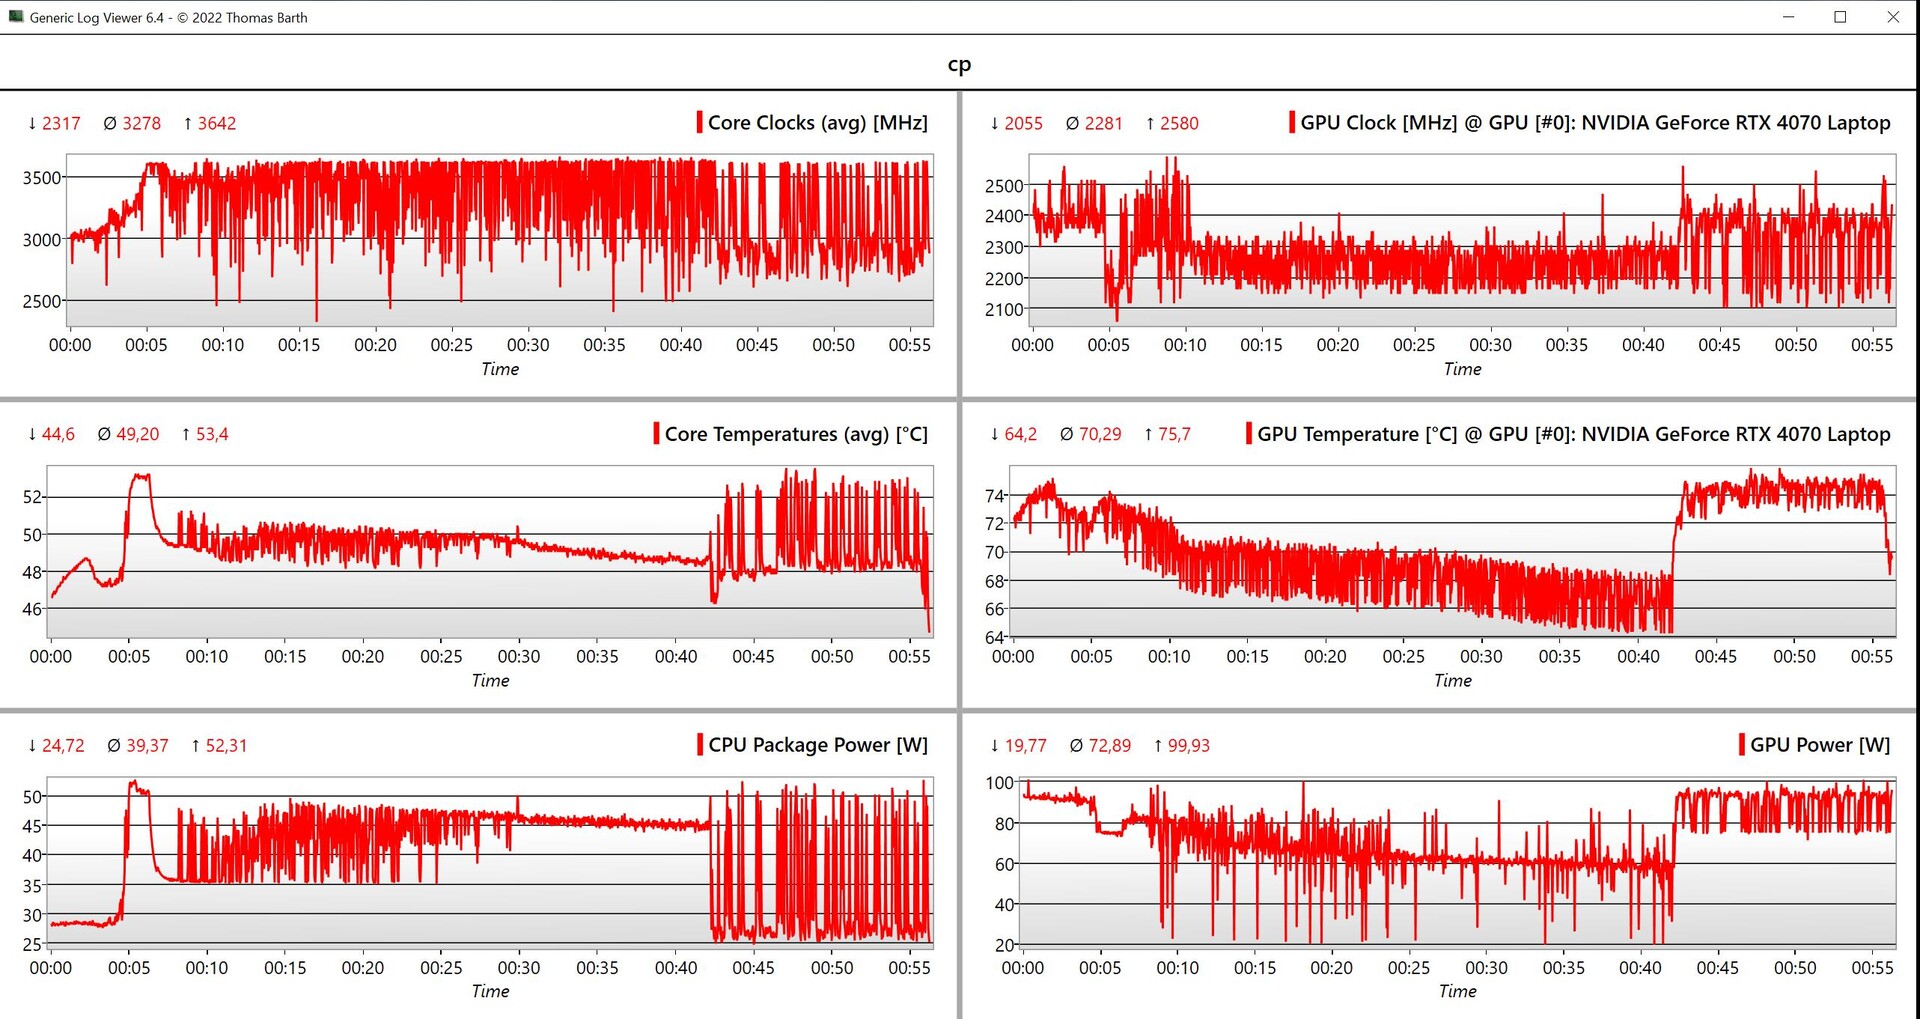
游戏性能
总而言之,ProArt P16 的游戏性能非常出色,达到了 RTX 4070 笔记本电脑应有的水平。即使是当前的游戏,在 QHD 分辨率下也能毫不费力地运行。相比之下,要想获得原生 4K 分辨率,就必须借助 Nvidia 的 DLSS 技术等升采样技术来处理要求较高的游戏。在《赛博朋克》循环中,我们遇到了一个有趣且可重复的问题。虽然图形性能和压力测试(见温度部分)的整体性能完全保持稳定,但在前 42 分钟,《赛博朋克》的游戏性能持续下降。在评估 CPU/GPU 数据时可以清楚地看到这一点,但在 42 分钟后,性能恢复到了起始水平,并保持稳定。我们目前无法解释这种行为,而且在我们的测试中,这种情况只出现在《赛博朋克》中。
| The Witcher 3 - 1920x1080 Ultra Graphics & Postprocessing (HBAO+) | |
| Asus Zenbook Pro 16X UX7602BZ-MY005W | |
| Asus ProArt P16 H7606WI | |
| Lenovo Yoga Pro 9 16IMH9 | |
| Asus ROG Zephyrus G16 2024 GU605M | |
| Dell XPS 16 9640 | |
| Average of class Multimedia (11 - 143.2, n=62, last 2 years) | |
| GTA V - 1920x1080 Highest Settings possible AA:4xMSAA + FX AF:16x | |
| Asus Zenbook Pro 16X UX7602BZ-MY005W | |
| SCHENKER XMG Pro 16 Studio (Mid 24) | |
| Asus ProArt P16 H7606WI | |
| Lenovo Yoga Pro 9 16IMH9 | |
| Dell XPS 16 9640 | |
| Asus ROG Zephyrus G16 2024 GU605M | |
| Average of class Multimedia (9.38 - 141.6, n=77, last 2 years) | |
| Call of Duty Modern Warfare 3 2023 | |
| 1920x1080 Extreme Preset | |
| Asus ProArt P16 H7606WI | |
| Average NVIDIA GeForce RTX 4070 Laptop GPU (92 - 120, n=7) | |
| Asus ROG Zephyrus G16 2024 GU605M | |
| Average of class Multimedia (27 - 120, n=6, last 2 years) | |
| 2560x1440 Extreme Preset | |
| Asus ProArt P16 H7606WI | |
| Average NVIDIA GeForce RTX 4070 Laptop GPU (64 - 83, n=6) | |
| Asus ROG Zephyrus G16 2024 GU605M | |
| Average of class Multimedia (29 - 83, n=3, last 2 years) | |
| Horizon Forbidden West | |
| 1920x1080 Very High Preset AA:T | |
| Lenovo Yoga Pro 9 16IMH9 | |
| Asus ProArt P16 H7606WI | |
| Average NVIDIA GeForce RTX 4070 Laptop GPU (53.2 - 76.7, n=10) | |
| Dell XPS 16 9640 | |
| Average of class Multimedia (12.4 - 65.4, n=5, last 2 years) | |
| 2560x1440 Very High Preset AA:T | |
| Lenovo Yoga Pro 9 16IMH9 | |
| Average NVIDIA GeForce RTX 4070 Laptop GPU (40.3 - 59.1, n=9) | |
| Asus ProArt P16 H7606WI | |
| Average of class Multimedia (40.3 - 56.1, n=3, last 2 years) | |
| Dell XPS 16 9640 | |
Cyberpunk 2077 ultra FPS diagram
| low | med. | high | ultra | QHD | 4K | |
|---|---|---|---|---|---|---|
| GTA V (2015) | 168 | 111.2 | 86.6 | 83.7 | ||
| The Witcher 3 (2015) | 224 | 121 | 88 | 71 | ||
| Dota 2 Reborn (2015) | 165.7 | 151.4 | 148.1 | 141.6 | 129.9 | |
| Final Fantasy XV Benchmark (2018) | 189.3 | 152.9 | 115.3 | 85.3 | 47.2 | |
| X-Plane 11.11 (2018) | 95.2 | 88.7 | 72.3 | 63.4 | ||
| Far Cry 5 (2018) | 147 | 130 | 124 | 115 | 102 | 59 |
| Strange Brigade (2018) | 333 | 270 | 164.5 | 206 | 130 | 68.4 |
| F1 23 (2023) | 192.9 | 197.3 | 188.8 | 70.3 | 41 | 19.6 |
| Baldur's Gate 3 (2023) | 150 | 125.6 | 82.8 | 82.5 | 59.9 | 33.4 |
| Cyberpunk 2077 2.2 Phantom Liberty (2023) | 119.4 | 110 | 94.1 | 80.7 | 49.4 | 20.2 |
| Call of Duty Modern Warfare 3 2023 (2023) | 182 | 164 | 127 | 120 | 83 | 49 |
| Horizon Forbidden West (2024) | 100.2 | 91.5 | 71.8 | 64.4 | 49.9 | 30.4 |
排放 - 优秀的扬声器
噪音排放
散热系统由三个风扇组成,虽然我们在测试 ROG Zephyrus G16 时遇到过控制第三个风扇的问题,但后来这些问题都得到了解决。在性能模式下,噪音几乎无处不在,但在其他两种模式下,无论是空闲运行还是执行要求较高的任务,风扇都经常处于不活动状态。在负载情况下,虽然标准和性能模式的噪音都相当大,但三种模式的噪音差异明显。
| 能量曲线 | 3DMark 06 | 赛博朋克 2077压力测试 |
|---|---|---|
| Whisper | 34 dB(A) | 42.2 dB(A) |
| 标准 | 42.2 dB(A) | 47.1 dB(A) |
| 性能 | 51.3 dB(A) | 53.2 dB(A) |
Noise Level
| Idle |
| 24.4 / 27.7 / 32.3 dB(A) |
| Load |
| 42.2 / 53.2 dB(A) |
 | ||
30 dB silent 40 dB(A) audible 50 dB(A) loud |
||
min: | ||
| Asus ProArt P16 H7606WI NVIDIA GeForce RTX 4070 Laptop GPU, Ryzen AI 9 HX 370, Micron 2400 MTFDKBA1T0QFM | SCHENKER XMG Pro 16 Studio (Mid 24) NVIDIA GeForce RTX 4070 Laptop GPU, i9-14900HX, Samsung 990 Pro 1 TB | Lenovo Yoga Pro 9 16IMH9 NVIDIA GeForce RTX 4070 Laptop GPU, Ultra 9 185H, SK Hynix HFS001TEJ9X115N | Dell XPS 16 9640 NVIDIA GeForce RTX 4070 Laptop GPU, Ultra 7 155H, Kioxia XG8 KXG80ZNV1T02 | Asus ROG Zephyrus G16 2024 GU605M NVIDIA GeForce RTX 4070 Laptop GPU, Ultra 7 155H, WD PC SN560 SDDPNQE-1T00 | Apple MacBook Pro 16 2023 M3 Max M3 Max 40-Core GPU, Apple M3 Max 16-Core, Apple SSD AP8192Z | Asus Zenbook Pro 16X UX7602BZ-MY005W NVIDIA GeForce RTX 4080 Laptop GPU, i9-13905H, Samsung PM9A1 MZVL22T0HBLB | |
|---|---|---|---|---|---|---|---|
| Noise | -8% | 3% | 7% | 7% | 12% | 7% | |
| off / environment * | 24.4 | 25 -2% | 24.3 -0% | 24.5 -0% | 23.9 2% | 23.7 3% | 24.9 -2% |
| Idle Minimum * | 24.4 | 28 -15% | 24.3 -0% | 24.5 -0% | 23.9 2% | 23.7 3% | 24.9 -2% |
| Idle Average * | 27.7 | 31 -12% | 24.3 12% | 24.5 12% | 27.8 -0% | 23.7 14% | 24.9 10% |
| Idle Maximum * | 32.3 | 35 -8% | 25.8 20% | 27.5 15% | 30.1 7% | 23.7 27% | 24.9 23% |
| Load Average * | 42.2 | 52 -23% | 48.1 -14% | 39.6 6% | 34.2 19% | 40.8 3% | 38 10% |
| Cyberpunk 2077 ultra * | 53.2 | 53 -0% | |||||
| Load Maximum * | 53.2 | 52 2% | 53.9 -1% | 49.7 7% | 46.4 13% | 42.8 20% | 51 4% |
| Witcher 3 ultra * | 49.7 | 49.7 | 46.4 | 42.8 |
* ... smaller is better
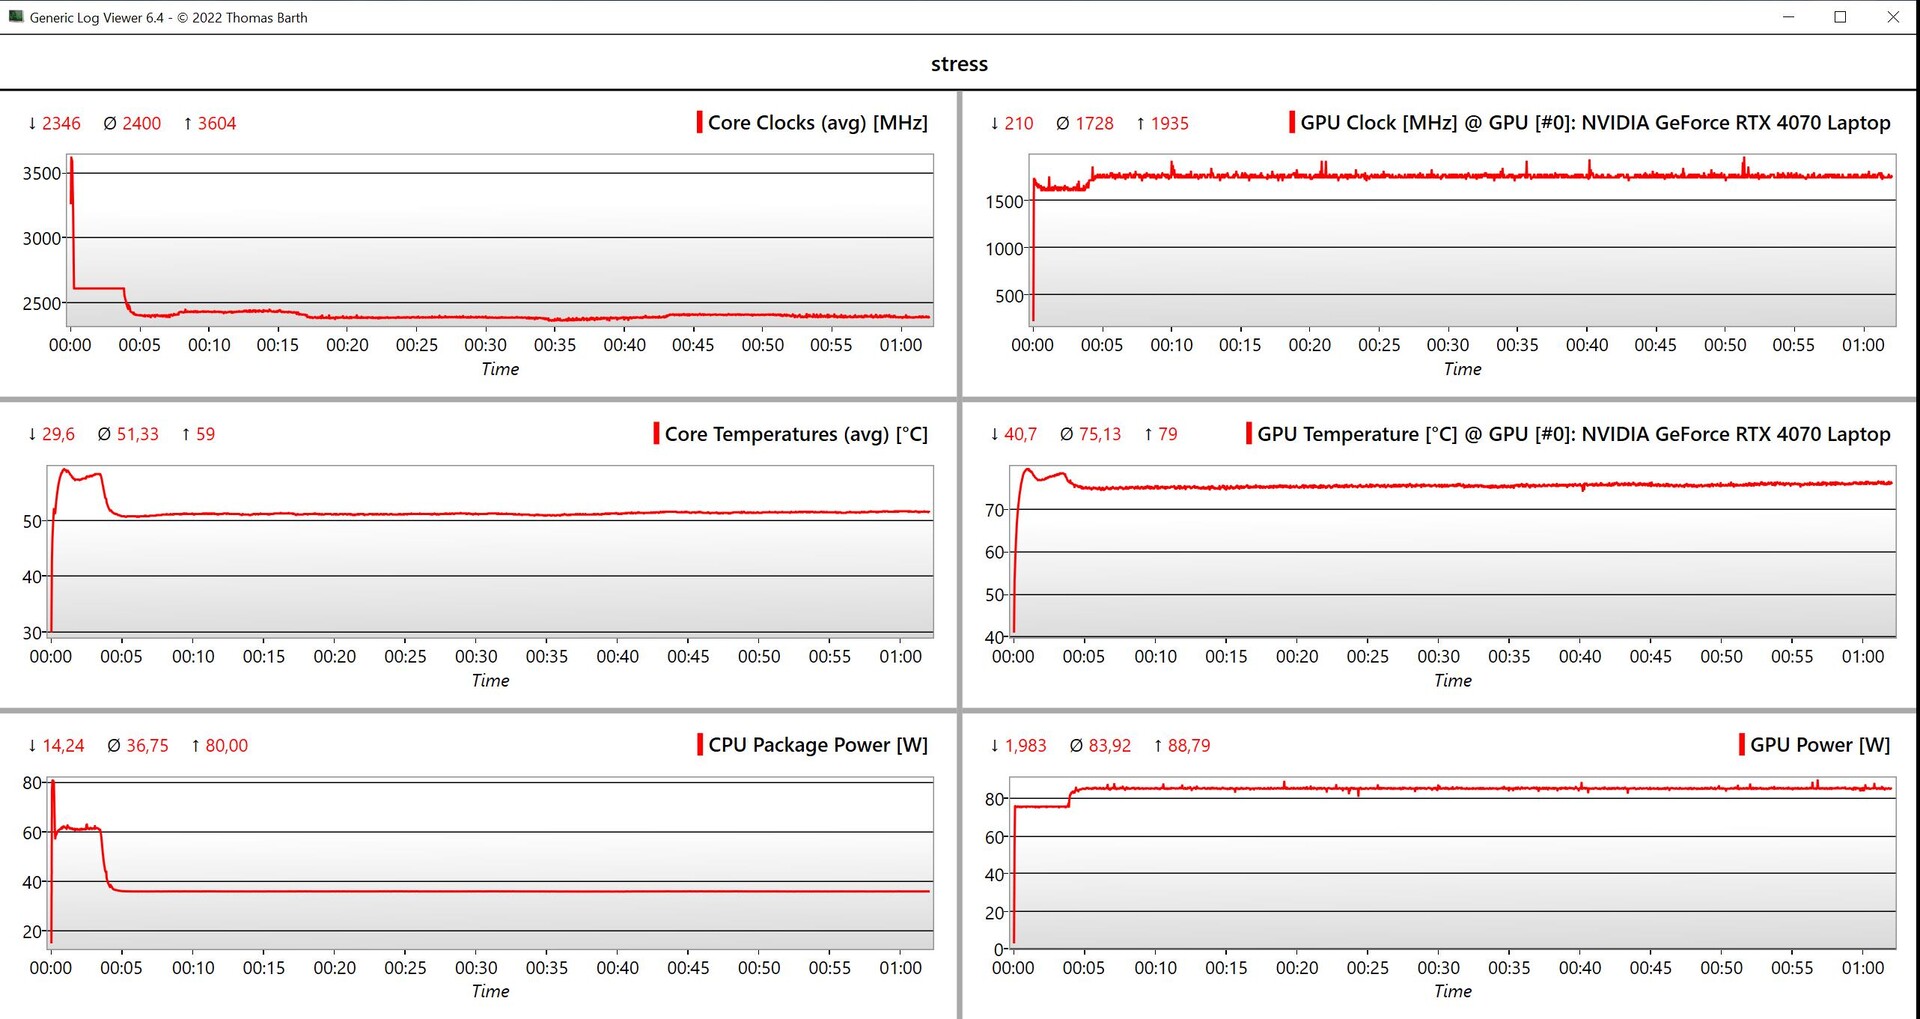
温度
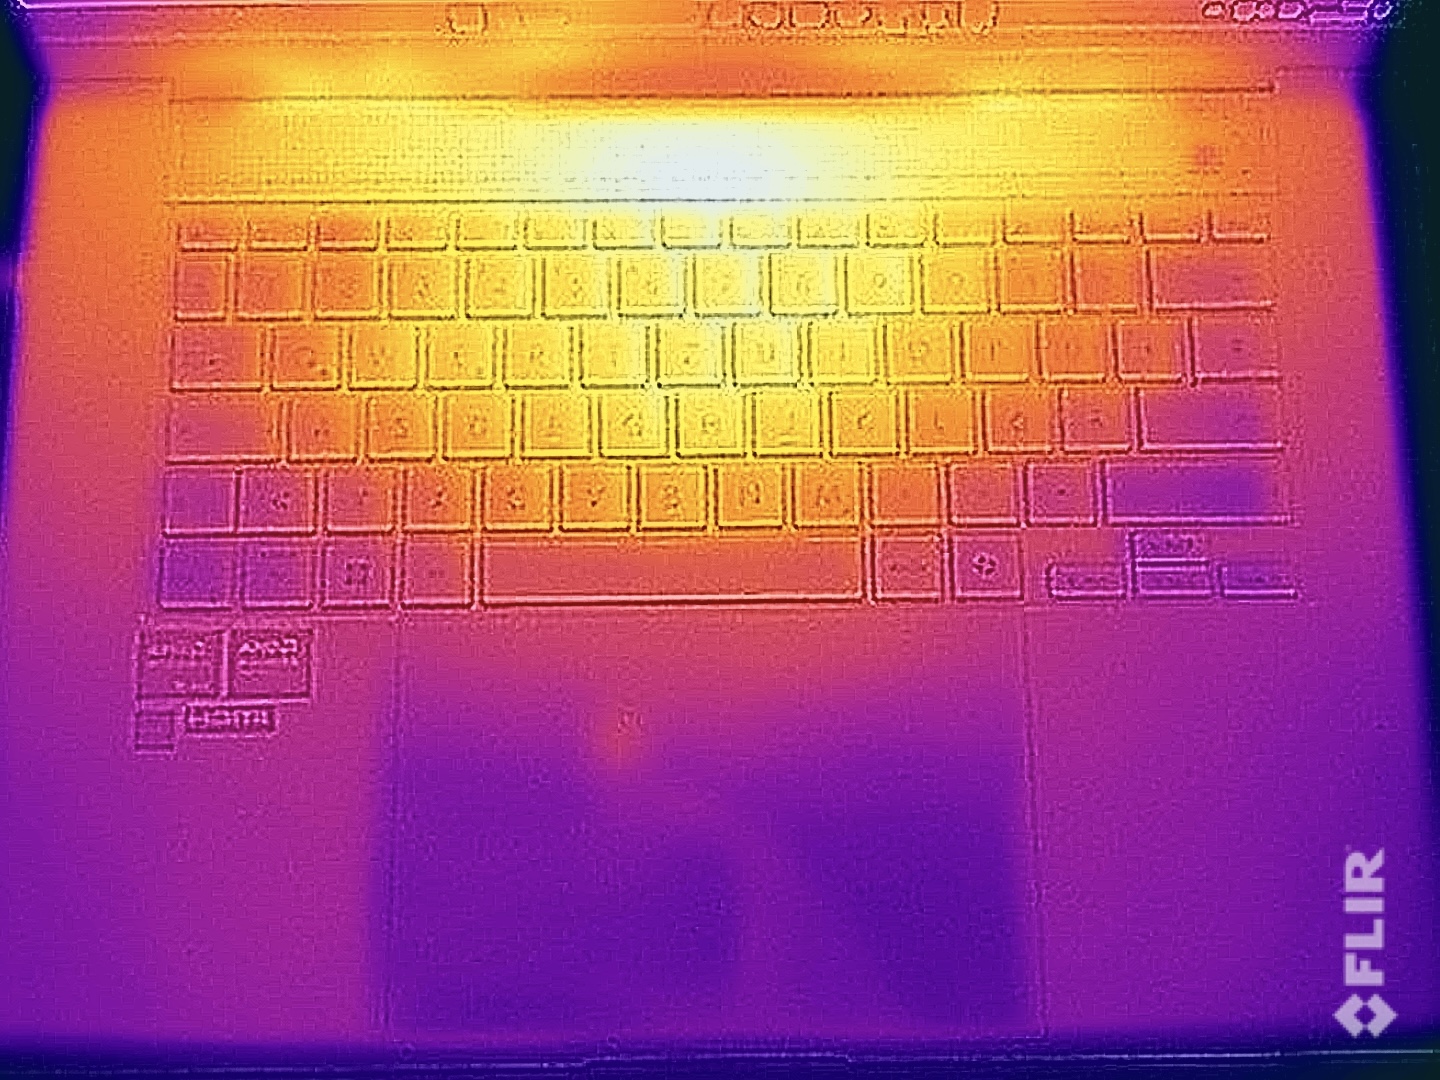
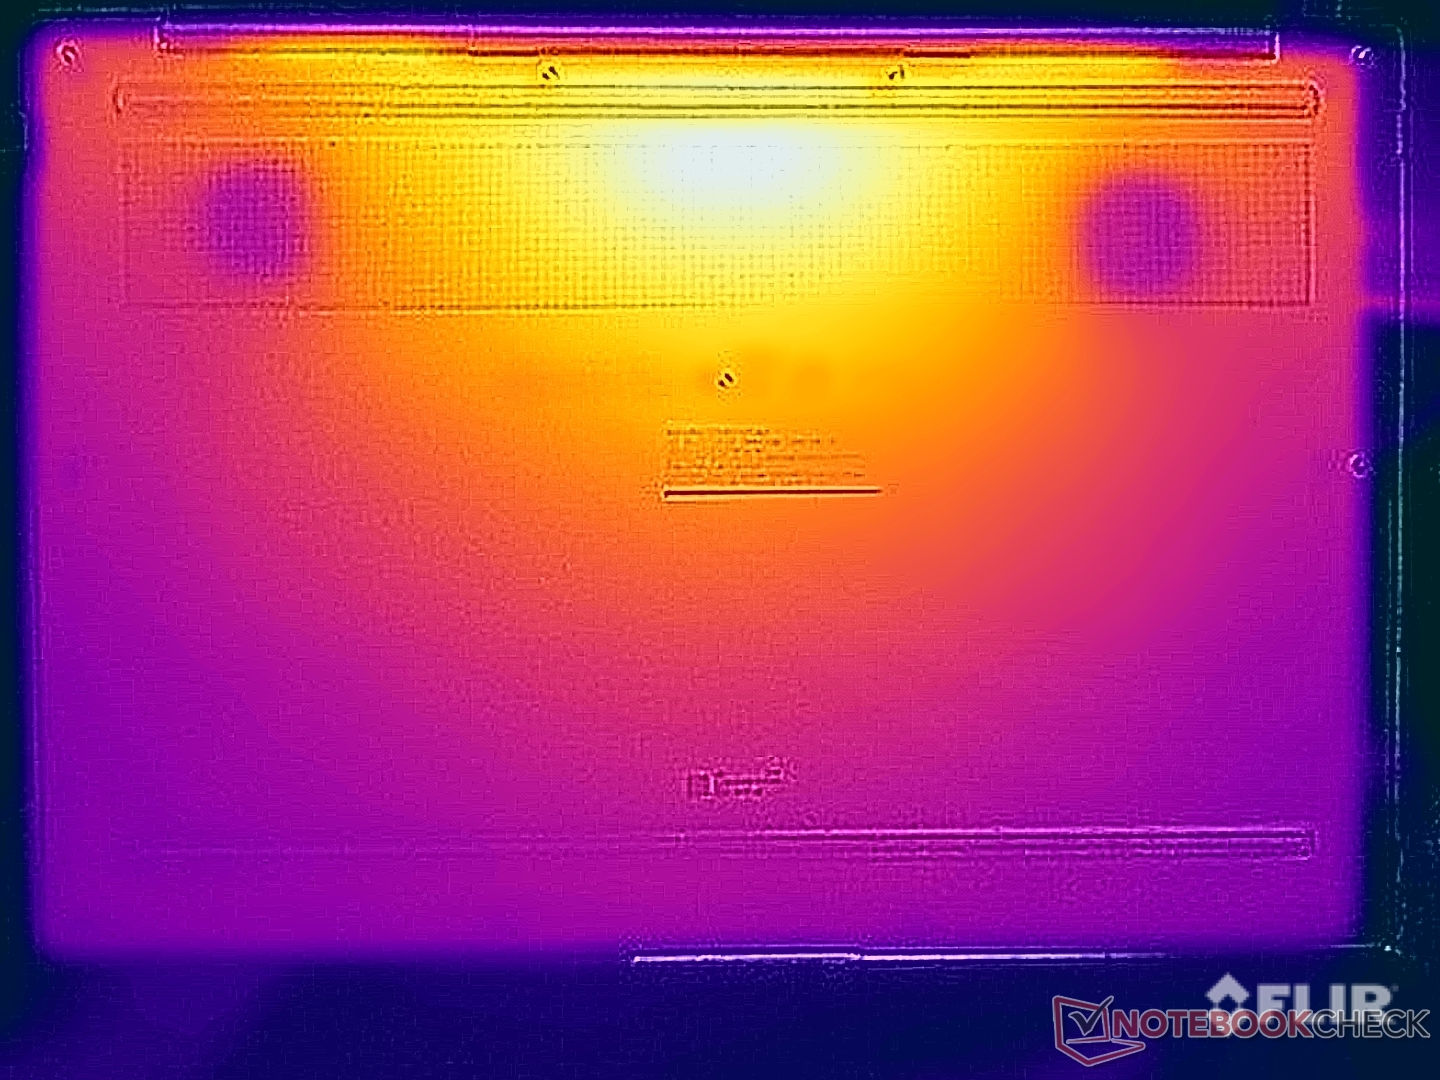
在最快的配置下,ProArt P16 基本上是一款温度相对较高的笔记本电脑,在闲置状态下,我们在大多数地方测得的温度接近 30 °C。不过,这并不是问题,在日常使用中不必担心任何限制。在负载情况下,底座顶部和底部的后部中间区域会出现热点。在这种情况下,应避免将设备放在膝盖上,但正常使用键盘不会有任何问题。
在综合 CPU/GPU 负载的压力测试中,处理器在第一分钟的运行功率为 60 瓦,GPU 为 75 瓦。大约 4 分钟后,处理器稳定在 37 瓦,显卡稳定在 85 瓦。总的来说,这是一个不错的结果,与 Zenbook Pro 16X(45/80 瓦)处于同一水平。
(-) The maximum temperature on the upper side is 46.9 °C / 116 F, compared to the average of 36.9 °C / 98 F, ranging from 21.1 to 71 °C for the class Multimedia.
(-) The bottom heats up to a maximum of 50.9 °C / 124 F, compared to the average of 39.2 °C / 103 F
(+) In idle usage, the average temperature for the upper side is 27.5 °C / 82 F, compared to the device average of 31.3 °C / 88 F.
(±) 3: The average temperature for the upper side is 37 °C / 99 F, compared to the average of 31.3 °C / 88 F for the class Multimedia.
(+) The palmrests and touchpad are reaching skin temperature as a maximum (34 °C / 93.2 F) and are therefore not hot.
(-) The average temperature of the palmrest area of similar devices was 28.8 °C / 83.8 F (-5.2 °C / -9.4 F).
| Asus ProArt P16 H7606WI AMD Ryzen AI 9 HX 370, NVIDIA GeForce RTX 4070 Laptop GPU | SCHENKER XMG Pro 16 Studio (Mid 24) Intel Core i9-14900HX, NVIDIA GeForce RTX 4070 Laptop GPU | Lenovo Yoga Pro 9 16IMH9 Intel Core Ultra 9 185H, NVIDIA GeForce RTX 4070 Laptop GPU | Dell XPS 16 9640 Intel Core Ultra 7 155H, NVIDIA GeForce RTX 4070 Laptop GPU | Asus ROG Zephyrus G16 2024 GU605M Intel Core Ultra 7 155H, NVIDIA GeForce RTX 4070 Laptop GPU | Apple MacBook Pro 16 2023 M3 Max Apple M3 Max 16-Core, Apple M3 Max 40-Core GPU | Asus Zenbook Pro 16X UX7602BZ-MY005W Intel Core i9-13905H, NVIDIA GeForce RTX 4080 Laptop GPU | |
|---|---|---|---|---|---|---|---|
| Heat | -23% | 10% | 14% | 0% | 18% | 22% | |
| Maximum Upper Side * | 46.9 | 51 -9% | 41.7 11% | 39.4 16% | 50.3 -7% | 42.3 10% | 28.2 40% |
| Maximum Bottom * | 50.9 | 66 -30% | 46.3 9% | 36.9 28% | 48 6% | 42 17% | 35.1 31% |
| Idle Upper Side * | 28.9 | 35 -21% | 26.2 9% | 28.2 2% | 28.8 -0% | 22.5 22% | 24.6 15% |
| Idle Bottom * | 30 | 39 -30% | 27.2 9% | 27.4 9% | 29.8 1% | 22.9 24% | 29.4 2% |
* ... smaller is better
发言人
音响系统由 6 个模块组成(4 个低音扬声器,每个 2 瓦;2 个高音扬声器,每个 2 瓦)。该系统在 ROG Zephyrus G16时就已经非常出色了,现在也没有什么变化。根据我们的测量,只有最大音量略有降低。在这方面,ProArt P16 是市场上最好的笔记本电脑之一。
Asus ProArt P16 H7606WI audio analysis
(±) | speaker loudness is average but good (81.4 dB)
Bass 100 - 315 Hz
(+) | good bass - only 3% away from median
(±) | linearity of bass is average (8.3% delta to prev. frequency)
Mids 400 - 2000 Hz
(+) | balanced mids - only 3.5% away from median
(+) | mids are linear (2.5% delta to prev. frequency)
Highs 2 - 16 kHz
(+) | balanced highs - only 3% away from median
(+) | highs are linear (3.6% delta to prev. frequency)
Overall 100 - 16.000 Hz
(+) | overall sound is linear (8.5% difference to median)
Compared to same class
» 6% of all tested devices in this class were better, 2% similar, 92% worse
» The best had a delta of 5%, average was 18%, worst was 45%
Compared to all devices tested
» 2% of all tested devices were better, 1% similar, 98% worse
» The best had a delta of 4%, average was 24%, worst was 134%
SCHENKER XMG Pro 16 Studio (Mid 24) audio analysis
(±) | speaker loudness is average but good (79 dB)
Bass 100 - 315 Hz
(-) | nearly no bass - on average 15.1% lower than median
(±) | linearity of bass is average (13.6% delta to prev. frequency)
Mids 400 - 2000 Hz
(±) | higher mids - on average 5.3% higher than median
(+) | mids are linear (4.4% delta to prev. frequency)
Highs 2 - 16 kHz
(+) | balanced highs - only 4.4% away from median
(+) | highs are linear (4.9% delta to prev. frequency)
Overall 100 - 16.000 Hz
(±) | linearity of overall sound is average (17.7% difference to median)
Compared to same class
» 50% of all tested devices in this class were better, 10% similar, 40% worse
» The best had a delta of 6%, average was 18%, worst was 132%
Compared to all devices tested
» 33% of all tested devices were better, 8% similar, 59% worse
» The best had a delta of 4%, average was 24%, worst was 134%
Lenovo Yoga Pro 9 16IMH9 audio analysis
(+) | speakers can play relatively loud (84.5 dB)
Bass 100 - 315 Hz
(±) | reduced bass - on average 7% lower than median
(±) | linearity of bass is average (7.2% delta to prev. frequency)
Mids 400 - 2000 Hz
(+) | balanced mids - only 3.9% away from median
(+) | mids are linear (4.5% delta to prev. frequency)
Highs 2 - 16 kHz
(+) | balanced highs - only 2.8% away from median
(+) | highs are linear (3.2% delta to prev. frequency)
Overall 100 - 16.000 Hz
(+) | overall sound is linear (8.8% difference to median)
Compared to same class
» 8% of all tested devices in this class were better, 2% similar, 91% worse
» The best had a delta of 5%, average was 18%, worst was 45%
Compared to all devices tested
» 2% of all tested devices were better, 1% similar, 97% worse
» The best had a delta of 4%, average was 24%, worst was 134%
Dell XPS 16 9640 audio analysis
(+) | speakers can play relatively loud (83.4 dB)
Bass 100 - 315 Hz
(±) | reduced bass - on average 11.2% lower than median
(±) | linearity of bass is average (8.9% delta to prev. frequency)
Mids 400 - 2000 Hz
(+) | balanced mids - only 4.5% away from median
(+) | mids are linear (3% delta to prev. frequency)
Highs 2 - 16 kHz
(+) | balanced highs - only 1.4% away from median
(+) | highs are linear (2% delta to prev. frequency)
Overall 100 - 16.000 Hz
(+) | overall sound is linear (10% difference to median)
Compared to same class
» 10% of all tested devices in this class were better, 1% similar, 89% worse
» The best had a delta of 5%, average was 18%, worst was 45%
Compared to all devices tested
» 4% of all tested devices were better, 1% similar, 95% worse
» The best had a delta of 4%, average was 24%, worst was 134%
Asus ROG Zephyrus G16 2024 GU605M audio analysis
(+) | speakers can play relatively loud (83.3 dB)
Bass 100 - 315 Hz
(+) | good bass - only 3.8% away from median
(±) | linearity of bass is average (8.1% delta to prev. frequency)
Mids 400 - 2000 Hz
(+) | balanced mids - only 3.5% away from median
(+) | mids are linear (2.4% delta to prev. frequency)
Highs 2 - 16 kHz
(+) | balanced highs - only 2.2% away from median
(+) | highs are linear (3.7% delta to prev. frequency)
Overall 100 - 16.000 Hz
(+) | overall sound is linear (7.3% difference to median)
Compared to same class
» 1% of all tested devices in this class were better, 0% similar, 99% worse
» The best had a delta of 6%, average was 18%, worst was 132%
Compared to all devices tested
» 1% of all tested devices were better, 0% similar, 99% worse
» The best had a delta of 4%, average was 24%, worst was 134%
Apple MacBook Pro 16 2023 M3 Max audio analysis
(+) | speakers can play relatively loud (84.3 dB)
Bass 100 - 315 Hz
(±) | reduced bass - on average 5% lower than median
(+) | bass is linear (5.6% delta to prev. frequency)
Mids 400 - 2000 Hz
(+) | balanced mids - only 1.2% away from median
(+) | mids are linear (3.1% delta to prev. frequency)
Highs 2 - 16 kHz
(+) | balanced highs - only 2.4% away from median
(+) | highs are linear (2.4% delta to prev. frequency)
Overall 100 - 16.000 Hz
(+) | overall sound is linear (5.3% difference to median)
Compared to same class
» 1% of all tested devices in this class were better, 1% similar, 98% worse
» The best had a delta of 5%, average was 18%, worst was 45%
Compared to all devices tested
» 0% of all tested devices were better, 0% similar, 100% worse
» The best had a delta of 4%, average was 24%, worst was 134%
Asus Zenbook Pro 16X UX7602BZ-MY005W audio analysis
(+) | speakers can play relatively loud (88.5 dB)
Bass 100 - 315 Hz
(±) | reduced bass - on average 9.8% lower than median
(±) | linearity of bass is average (7.7% delta to prev. frequency)
Mids 400 - 2000 Hz
(+) | balanced mids - only 1.6% away from median
(+) | mids are linear (4.5% delta to prev. frequency)
Highs 2 - 16 kHz
(+) | balanced highs - only 2.1% away from median
(+) | highs are linear (3.3% delta to prev. frequency)
Overall 100 - 16.000 Hz
(+) | overall sound is linear (8.1% difference to median)
Compared to same class
» 1% of all tested devices in this class were better, 1% similar, 98% worse
» The best had a delta of 6%, average was 18%, worst was 132%
Compared to all devices tested
» 1% of all tested devices were better, 1% similar, 98% worse
» The best had a delta of 4%, average was 24%, worst was 134%
能源管理 - 比 ROG Zephyrus G16 更有耐力
耗电量
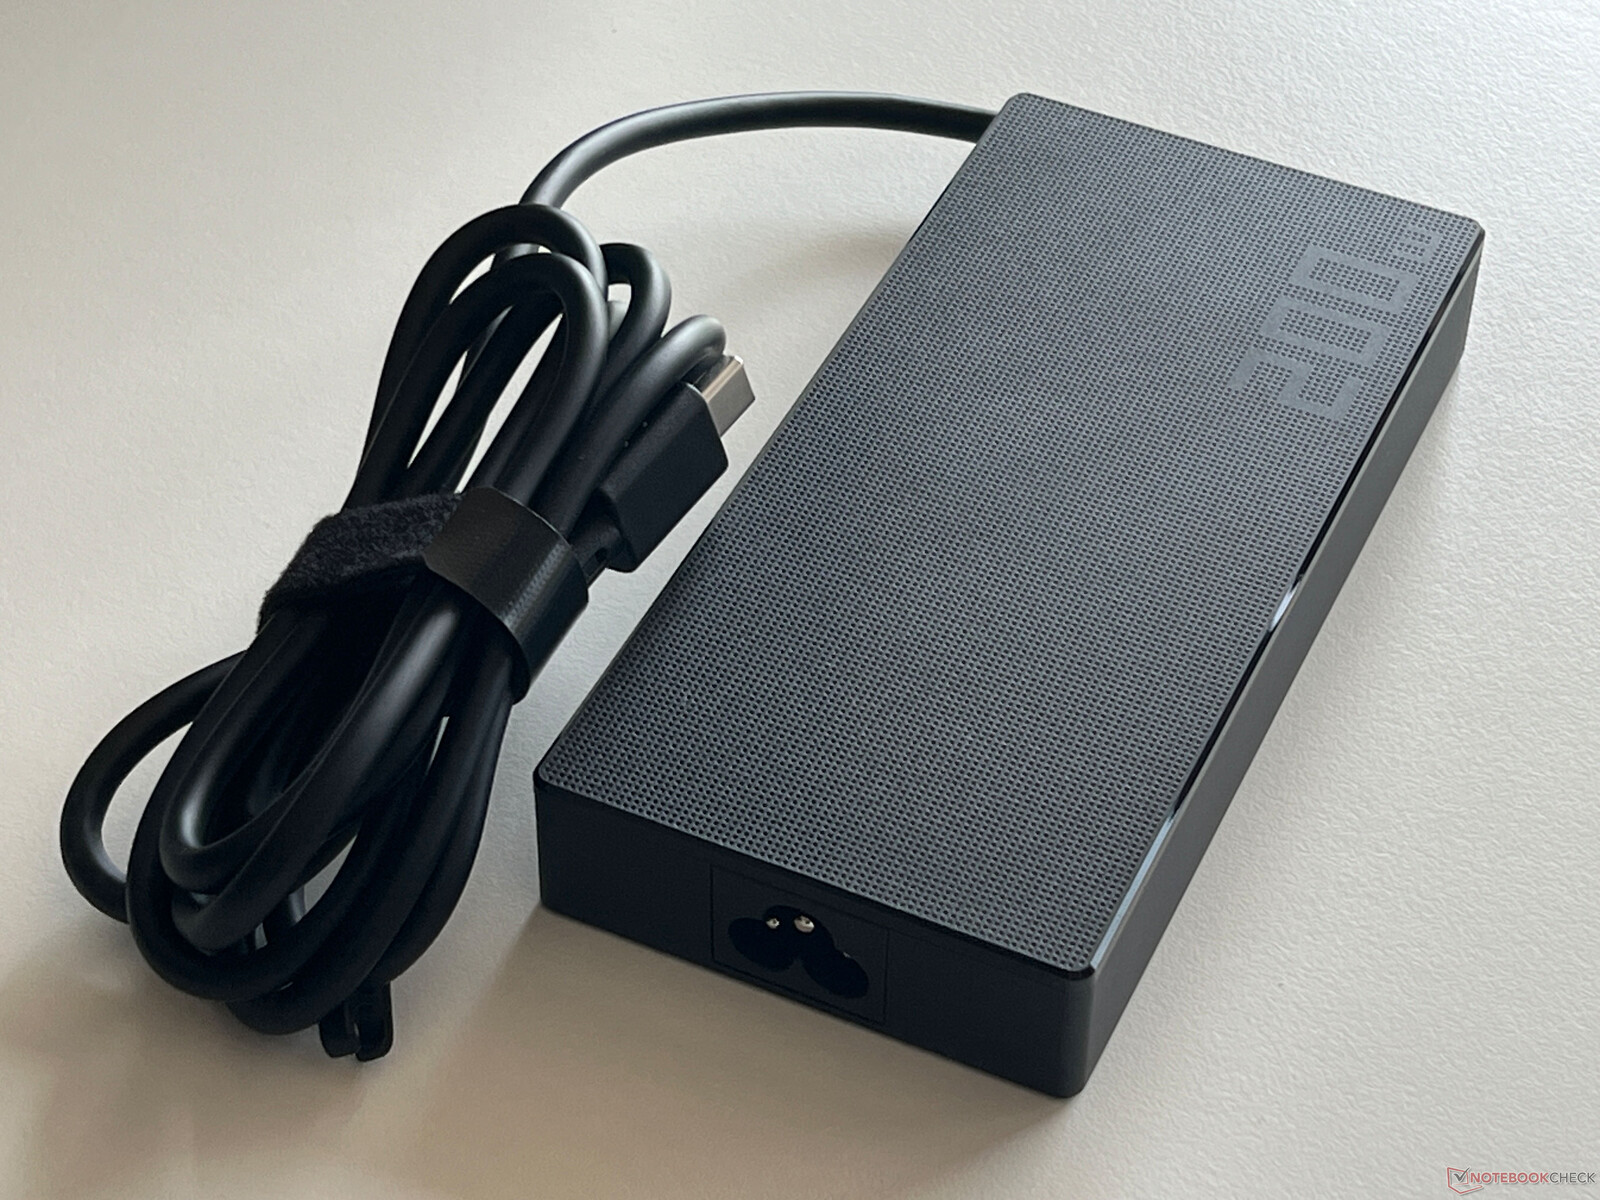
尽管采用了 OLED 面板,ProArt P16 的效率还是相当高的。在空闲和最大 SDR 亮度下运行时,尽管壁纸相对较亮,但我们记录到的最大功耗仅为 11.6 瓦。在游戏时,功耗约为 160 瓦,而在压力测试中,功耗曾一度达到 212.6 瓦。然而,几分钟后,功率迅速下降并稳定在 160 瓦。这说明所提供的 200 瓦电源适配器大小合适。
| Off / Standby | |
| Idle | |
| Load |
|
Key:
min: | |
| Asus ProArt P16 H7606WI Ryzen AI 9 HX 370, NVIDIA GeForce RTX 4070 Laptop GPU, Micron 2400 MTFDKBA1T0QFM, OLED, 3840x2400, 16" | SCHENKER XMG Pro 16 Studio (Mid 24) i9-14900HX, NVIDIA GeForce RTX 4070 Laptop GPU, Samsung 990 Pro 1 TB, IPS, 2560x1600, 16" | Lenovo Yoga Pro 9 16IMH9 Ultra 9 185H, NVIDIA GeForce RTX 4070 Laptop GPU, SK Hynix HFS001TEJ9X115N, Mini-LED, 3200x2000, 16" | Dell XPS 16 9640 Ultra 7 155H, NVIDIA GeForce RTX 4070 Laptop GPU, Kioxia XG8 KXG80ZNV1T02, OLED, 3840x2400, 16.3" | Asus ROG Zephyrus G16 2024 GU605M Ultra 7 155H, NVIDIA GeForce RTX 4070 Laptop GPU, WD PC SN560 SDDPNQE-1T00, OLED, 2560x1600, 16" | Apple MacBook Pro 16 2023 M3 Max Apple M3 Max 16-Core, M3 Max 40-Core GPU, Apple SSD AP8192Z, Mini-LED, 3456x2234, 16" | Asus Zenbook Pro 16X UX7602BZ-MY005W i9-13905H, NVIDIA GeForce RTX 4080 Laptop GPU, Samsung PM9A1 MZVL22T0HBLB, OLED, 3200x2000, 16" | Average NVIDIA GeForce RTX 4070 Laptop GPU | Average of class Multimedia | |
|---|---|---|---|---|---|---|---|---|---|
| Power Consumption | -129% | -50% | 9% | -3% | -14% | -32% | -56% | 7% | |
| Idle Minimum * | 8 | 31 -288% | 10.3 -29% | 7.7 4% | 8.3 -4% | 5.2 35% | 9 -13% | 12.8 ? -60% | 6.86 ? 14% |
| Idle Average * | 9.9 | 33 -233% | 21.9 -121% | 10.3 -4% | 12.5 -26% | 16.9 -71% | 11.9 -20% | 17.8 ? -80% | 11.5 ? -16% |
| Idle Maximum * | 11.6 | 41 -253% | 22.4 -93% | 10.6 9% | 12.8 -10% | 17.2 -48% | 20.5 -77% | 24.3 ? -109% | 13.5 ? -16% |
| Load Average * | 76.9 | 114 -48% | 96.9 -26% | 76.5 1% | 71.3 7% | 90.5 -18% | 93.5 -22% | 96.9 ? -26% | 71.4 ? 7% |
| Cyberpunk 2077 ultra * | 157.7 | 218 -38% | |||||||
| Cyberpunk 2077 ultra external monitor * | 156.6 | 196.8 -26% | |||||||
| Load Maximum * | 212.6 | 250 -18% | 173.8 18% | 138.5 35% | 169.1 20% | 145.2 32% | 267 -26% | 221 ? -4% | 116.6 ? 45% |
| Witcher 3 ultra * | 159.6 | 126.4 | 127.5 | 109 | 195.7 |
* ... smaller is better
Power consumption Cyberpunk / stress test
Power consumption with an external monitor
电池寿命
在我们的 Wi-Fi 测试中,90 Wh 电池的平均运行时间略好于同类产品 Zephyrus G16。在 150 cd/m²(相当于最大 SDR 亮度的 70%)的 Wi-Fi 测试中,我们记录了 8 小时 18 分钟,而在全亮度下则少了约 2 小时(6 小时 23 分钟)。相比之下,在视频测试中,我们感到非常惊讶,因为在 150 cd/m² 的亮度下,运行时间长达 21 个小时,考虑到笔记本电脑的 16 英寸大面板,这已经是非常出色的性能了。在全亮度条件下,HDR 视频可持续运行 5 小时。
打开设备后,完全充电周期仅需 108 分钟,48 分钟后即可获得 80% 的电量。
| Asus ProArt P16 H7606WI Ryzen AI 9 HX 370, NVIDIA GeForce RTX 4070 Laptop GPU, 90 Wh | SCHENKER XMG Pro 16 Studio (Mid 24) i9-14900HX, NVIDIA GeForce RTX 4070 Laptop GPU, 73 Wh | Lenovo Yoga Pro 9 16IMH9 Ultra 9 185H, NVIDIA GeForce RTX 4070 Laptop GPU, 84 Wh | Dell XPS 16 9640 Ultra 7 155H, NVIDIA GeForce RTX 4070 Laptop GPU, 99.5 Wh | Asus ROG Zephyrus G16 2024 GU605M Ultra 7 155H, NVIDIA GeForce RTX 4070 Laptop GPU, 90 Wh | Apple MacBook Pro 16 2023 M3 Max Apple M3 Max 16-Core, M3 Max 40-Core GPU, 99.6 Wh | Asus Zenbook Pro 16X UX7602BZ-MY005W i9-13905H, NVIDIA GeForce RTX 4080 Laptop GPU, 96 Wh | Average of class Multimedia | |
|---|---|---|---|---|---|---|---|---|
| Battery Runtime | -32% | -26% | -7% | -33% | 19% | 10% | -6% | |
| H.264 | 1260 | 692 -45% | 988 -22% | 671 -47% | 1221 -3% | 864 ? -31% | ||
| WiFi v1.3 | 499 | 337 -32% | 526 5% | 629 26% | 435 -13% | 999 100% | 472.8 -5% | 645 ? 29% |
| Load | 116 | 73 -37% | 87 -25% | 71 -39% | 71 -39% | 144 24% | 99 ? -15% |
Pros
Cons
结论 - ProArt P16 是一款折衷的紧凑型动力产品
新款华硕 ProArt P16 基于我们熟悉的游戏/多媒体笔记本电脑,即 ROG Zephyrus G16新款华硕 ProArt P16 基于我们熟悉的游戏/多媒体笔记本电脑 ROG Zephyrus G16,采用了全新的 AMD Zen 5 移动处理器,性能卓越,体积小巧,重量轻,仅重 1.8 千克。Ryzen AI 9 HX 370 的 CPU 性能明显高于 Zephyrus G16 的 Meteor Lake 处理器,但作为一款面向创意用户的笔记本电脑,P16 更像是 Zenbook Pro 16X 的替代品。 Zenbook Pro 16X的替代品,其酷睿 i9 13905H 并没有慢多少,但其 RTX 4080 笔记本电脑的速度简直比 RTX 4070 笔记本电脑ProArt 快得多。这意味着,在 GPU 性能方面,如果你选择这两款笔记本中较轻的一款,你就必须接受退步。
在显示屏方面,与 Zenbook Pro 16X 的 120 Hz、3.2K OLED 面板相比,新的 60 Hz、4K OLED 触摸屏是否有所改进也值得商榷。更高的分辨率是一个优势,色彩准确度也非常好,但在 2024 年面对如此昂贵的设备时,仅仅 60 Hz 的频率已经不能算是最新的了。
华硕 ProArt P16 为那些需要触摸屏且愿意放弃更高频率的创意用户提供了一款相当轻便小巧的强大设备。特别是,64 GB 的顶配版本非常昂贵。
不过,如果你能接受性能上的妥协,你仍然可以得到一台相对轻巧、性能卓越的 16 英寸笔记本电脑,它配备了充足的端口、高级外壳、非常好的输入设备以及出色的音响系统。尽管如此,ROG Zephyrus G16 也同样具备这些优势,这就是你需要决定是否更喜欢触摸屏而不是更高频率的 OLED 屏幕的地方。ProArt 可以安装两个 M.2 2280 固态硬盘,但内存是焊接的。ProArt P16 有 64GB 可选,但与 32GB 相比,价格大幅上涨了 400 美元。ProArt P16 的目标群体相对较小,如果这是你所追求的组合,那就不会出错。
价格和供应情况
全新 ProArt P16 可直接从华硕订购。.
注:我们最近更新了评级系统,第 8 版的结果与第 7 版的结果不具可比性。更多信息 此处.
Asus ProArt P16 H7606WI
- 08/04/2024 v8
Andreas Osthoff
 Total Sustainability Score:
 Transparency
The selection of devices to be reviewed is made by our editorial team. The test sample was provided to the author as a loan by the manufacturer or retailer for the purpose of this review. The lender had no influence on this review, nor did the manufacturer receive a copy of this review before publication. There was no obligation to publish this review. We never accept compensation or payment in return for our reviews. As an independent media company, Notebookcheck is not subjected to the authority of manufacturers, retailers or publishers.
This is how Notebookcheck is testing
Every year, Notebookcheck independently reviews hundreds of laptops and smartphones using standardized procedures to ensure that all results are comparable. We have continuously developed our test methods for around 20 years and set industry standards in the process. In our test labs, high-quality measuring equipment is utilized by experienced technicians and editors. These tests involve a multi-stage validation process. Our complex rating system is based on hundreds of well-founded measurements and benchmarks, which maintains objectivity. Further information on our test methods can be found here.
Price comparison

