

联想 ThinkPad P16 Gen 2 工作站评测:超强图形处理能力
Nvidia RTX 4000 Ada 首次亮相,数据令人印象深刻。
130 瓦 TGP 显卡选项使其成为联想产品组合中速度最快的 16 英寸工作站之一。不过,由于 GPU 要求较高,温度和风扇噪音等方面分别高于平均水平。Allen Ngo (translated by DeepL / Ninh Duy) Published 🇺🇸 🇫🇷 ...
结论 - 权力是有代价的
ThinkPad P16 Gen 2 将性能放在首位,即使这意味着系统更大、更重、更响、更热。如果你能克服这些缺点,那么你会发现它的 130 W RTX 4000 Ada 是移动工作站中的怪兽。
ThinkPad P16 Gen 2 通过 130 瓦 TGP 显卡处理苛刻的工作负载,在大多数其他 16 英寸工作站中脱颖而出。
也许最明显的缺点是,GPU 在承受几分钟的压力后可能会节流约 10%,这表明冷却解决方案无法无限期地满足 GPU 的全部需求。电池续航时间也很短,最多只有几个小时。即便如此,ThinkPad P16 Gen 2 仍是 16 英寸级别中速度最快的工作站之一。
Pros
Cons
Price comparison
潜在的竞争对手比较
Image | Model / Review | Geizhals | Weight | Height | Display |
|---|---|---|---|---|---|
1. 85.9%  | Lenovo ThinkPad P16 Gen 2 Intel Core i7-14700HX ⎘ NVIDIA RTX 4000 Ada Generation Laptop GPU ⎘ 32 GB Memory, 1024 GB SSD | 3.1 kg | 30.23 mm | 16.00" 2560x1600 189 PPI IPS | |
2. 90.2% v7 (old)  | Lenovo ThinkPad P16 G2 21FA000FGE Intel Core i7-13700HX ⎘ NVIDIA RTX 2000 Ada Generation Laptop GPU ⎘ 32 GB Memory, 1024 GB SSD | 3 kg | 30.23 mm | 16.00" 2560x1600 189 PPI IPS LED | |
3. 88.6% v7 (old)  | Lenovo ThinkPad P16s G2 21K9000CGE AMD Ryzen 7 PRO 7840U ⎘ AMD Radeon 780M ⎘ 32 GB Memory, 1024 GB SSD | 1.8 kg | 24.4 mm | 16.00" 3840x2400 283 PPI OLED | |
4. 91% v7 (old)  | Lenovo ThinkPad P16 G1 RTX A5500 Intel Core i9-12950HX ⎘ NVIDIA RTX A5500 Laptop GPU ⎘ 64 GB Memory, 2048 GB SSD | Listenpreis 9000 USD | 3 kg | 30.23 mm | 16.00" 3840x2400 283 PPI IPS |
5. 85.4%  | HP ZBook Power 16 G11 A AMD Ryzen 7 8845HS ⎘ NVIDIA RTX 2000 Ada Generation Laptop GPU ⎘ 64 GB Memory, 2048 GB SSD | 2.2 kg | 22.9 mm | 16.00" 2560x1600 189 PPI IPS | |
6. 88.3% v7 (old)  | Dell Precision 5690 Intel Core Ultra 9 185H ⎘ Nvidia RTX 5000 Ada Generation Laptop GPU ⎘ 32 GB Memory, 2048 GB SSD | 2.3 kg | 22.17 mm | 16.00" 3840x2400 283 PPI OLED |
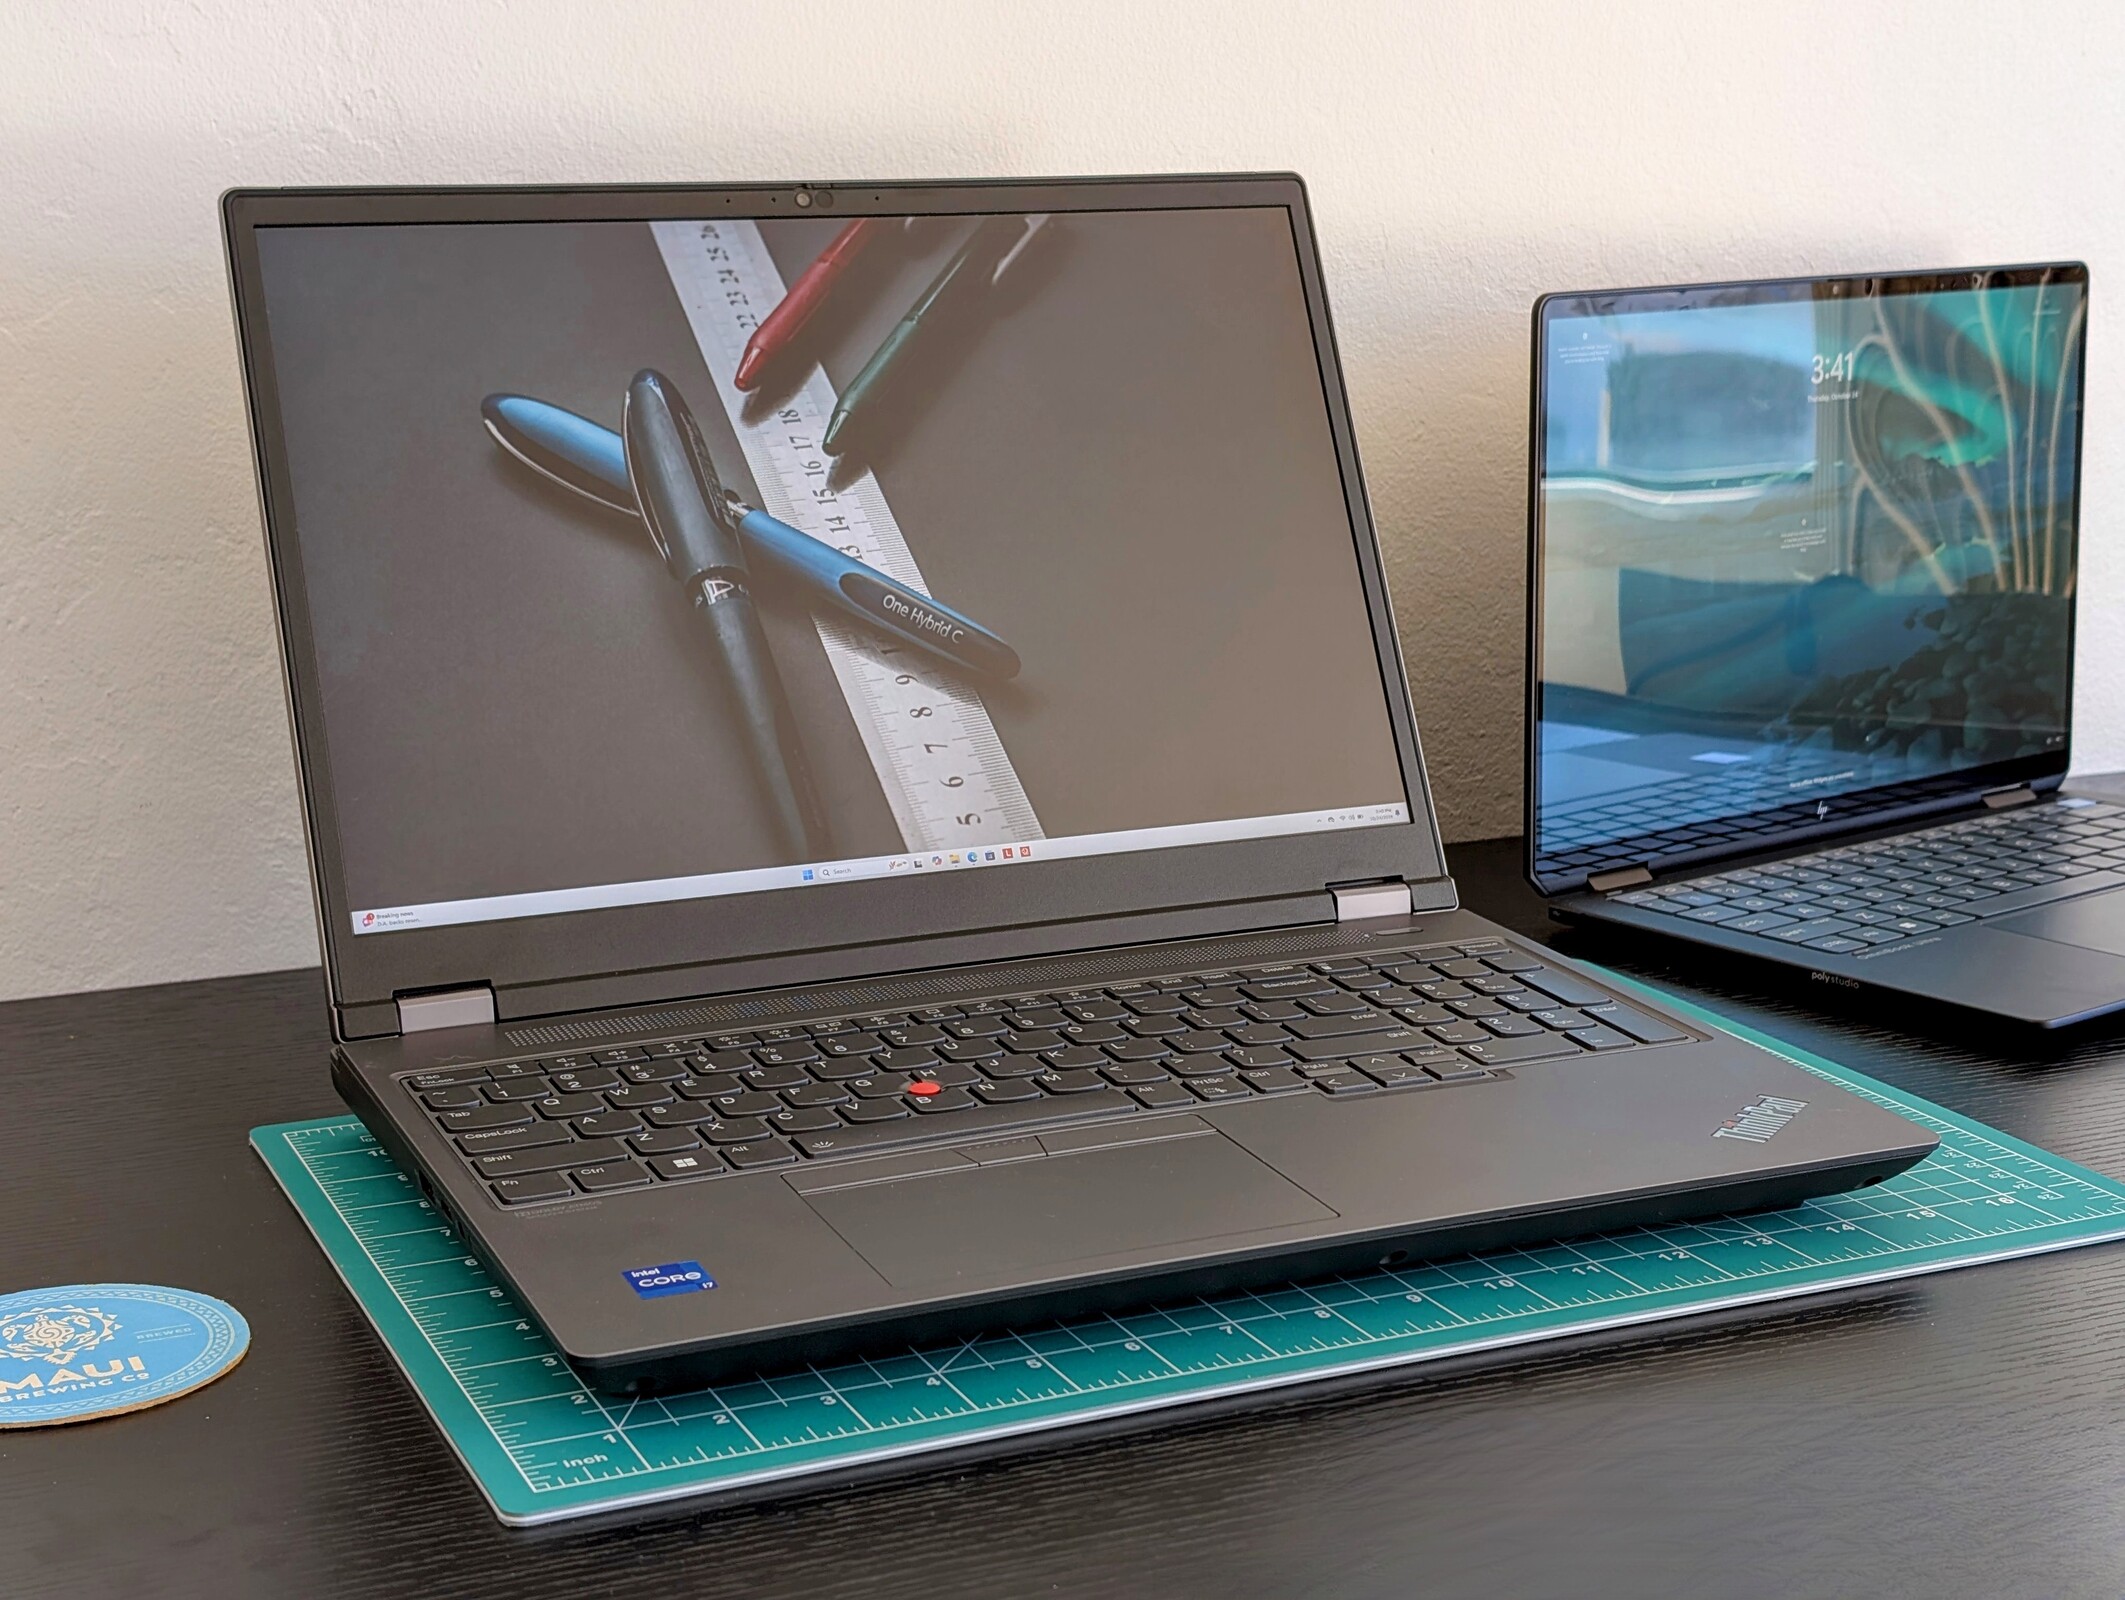
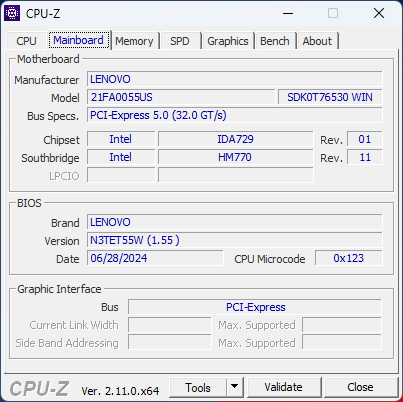
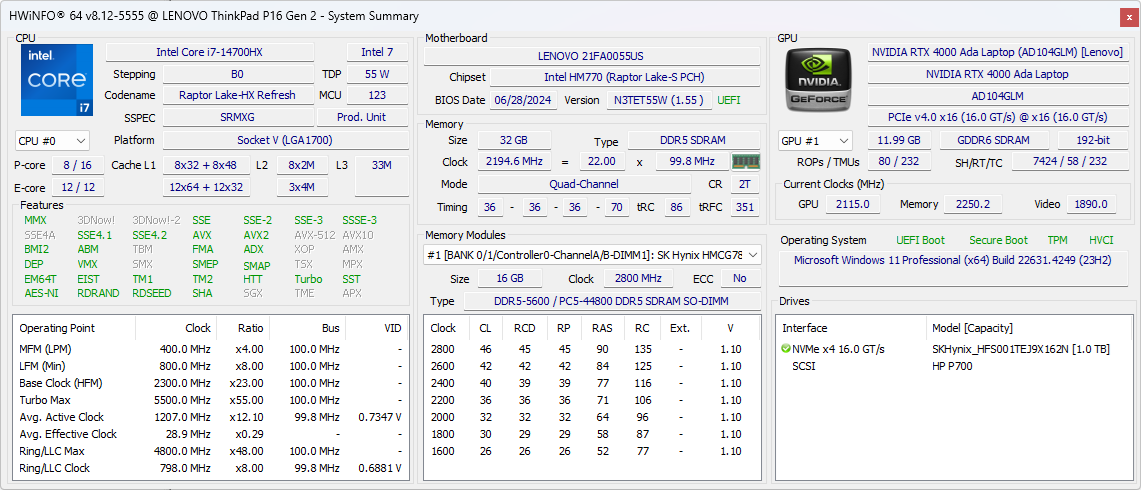
联想将在 2024 年第四季度更新其高端 ThinkPad P16 Gen 2 系列,采用更新的 Raptor Lake-HX Refresh CPU,以取代今年早些时候发布的原有 Raptor Lake-HX 选项。机箱设计保持不变,因此我们在 最初的 ThinkPad P16 Gen 2 评测包括端口。
我们的测试机配备了酷睿 i7-14700HX CPU 和 130 瓦的 Nvidia RTX 4000 Ada GPU,相比之下,我们在第一份 ThinkPad P16 Gen 2 评测中使用的是酷睿 i7-13700HX 和 80 瓦的 RTX 2000。正如我们下面的数据所示,性能提升非常明显。
ThinkPad P16 Gen 2 的竞争对手包括其他高性能 16 英寸移动工作站,如 惠普 ZBook Power 16 G11 A或 戴尔Precision 5690.
更多联想评论:
规格
案例
SD 读卡器
| SD Card Reader | |
| average JPG Copy Test (av. of 3 runs) | |
| HP ZBook Power 16 G11 A (Toshiba Exceria Pro SDXC 64 GB UHS-II) | |
| Lenovo ThinkPad P16 Gen 2 (Toshiba Exceria Pro SDXC 64 GB UHS-II) | |
| Lenovo ThinkPad P16 G1 RTX A5500 (Toshiba Exceria Pro SDXC 64 GB UHS-II) | |
| Lenovo ThinkPad P16 G2 21FA000FGE | |
| maximum AS SSD Seq Read Test (1GB) | |
| HP ZBook Power 16 G11 A (Toshiba Exceria Pro SDXC 64 GB UHS-II) | |
| Lenovo ThinkPad P16 Gen 2 (Toshiba Exceria Pro SDXC 64 GB UHS-II) | |
| Lenovo ThinkPad P16 G2 21FA000FGE | |
| Lenovo ThinkPad P16 G1 RTX A5500 (Toshiba Exceria Pro SDXC 64 GB UHS-II) | |
交流
网络摄像头


维护
可持续性
联想在生产过程中采用了大量可回收材料,包括外盖(A 盖)采用 50% 的可回收铝,键盘面板(C 盖)采用 90% 的镁,键帽、电池组和扬声器采用 >85% 的消费后塑料。
包装不含塑料,可完全回收利用。
配件和保修
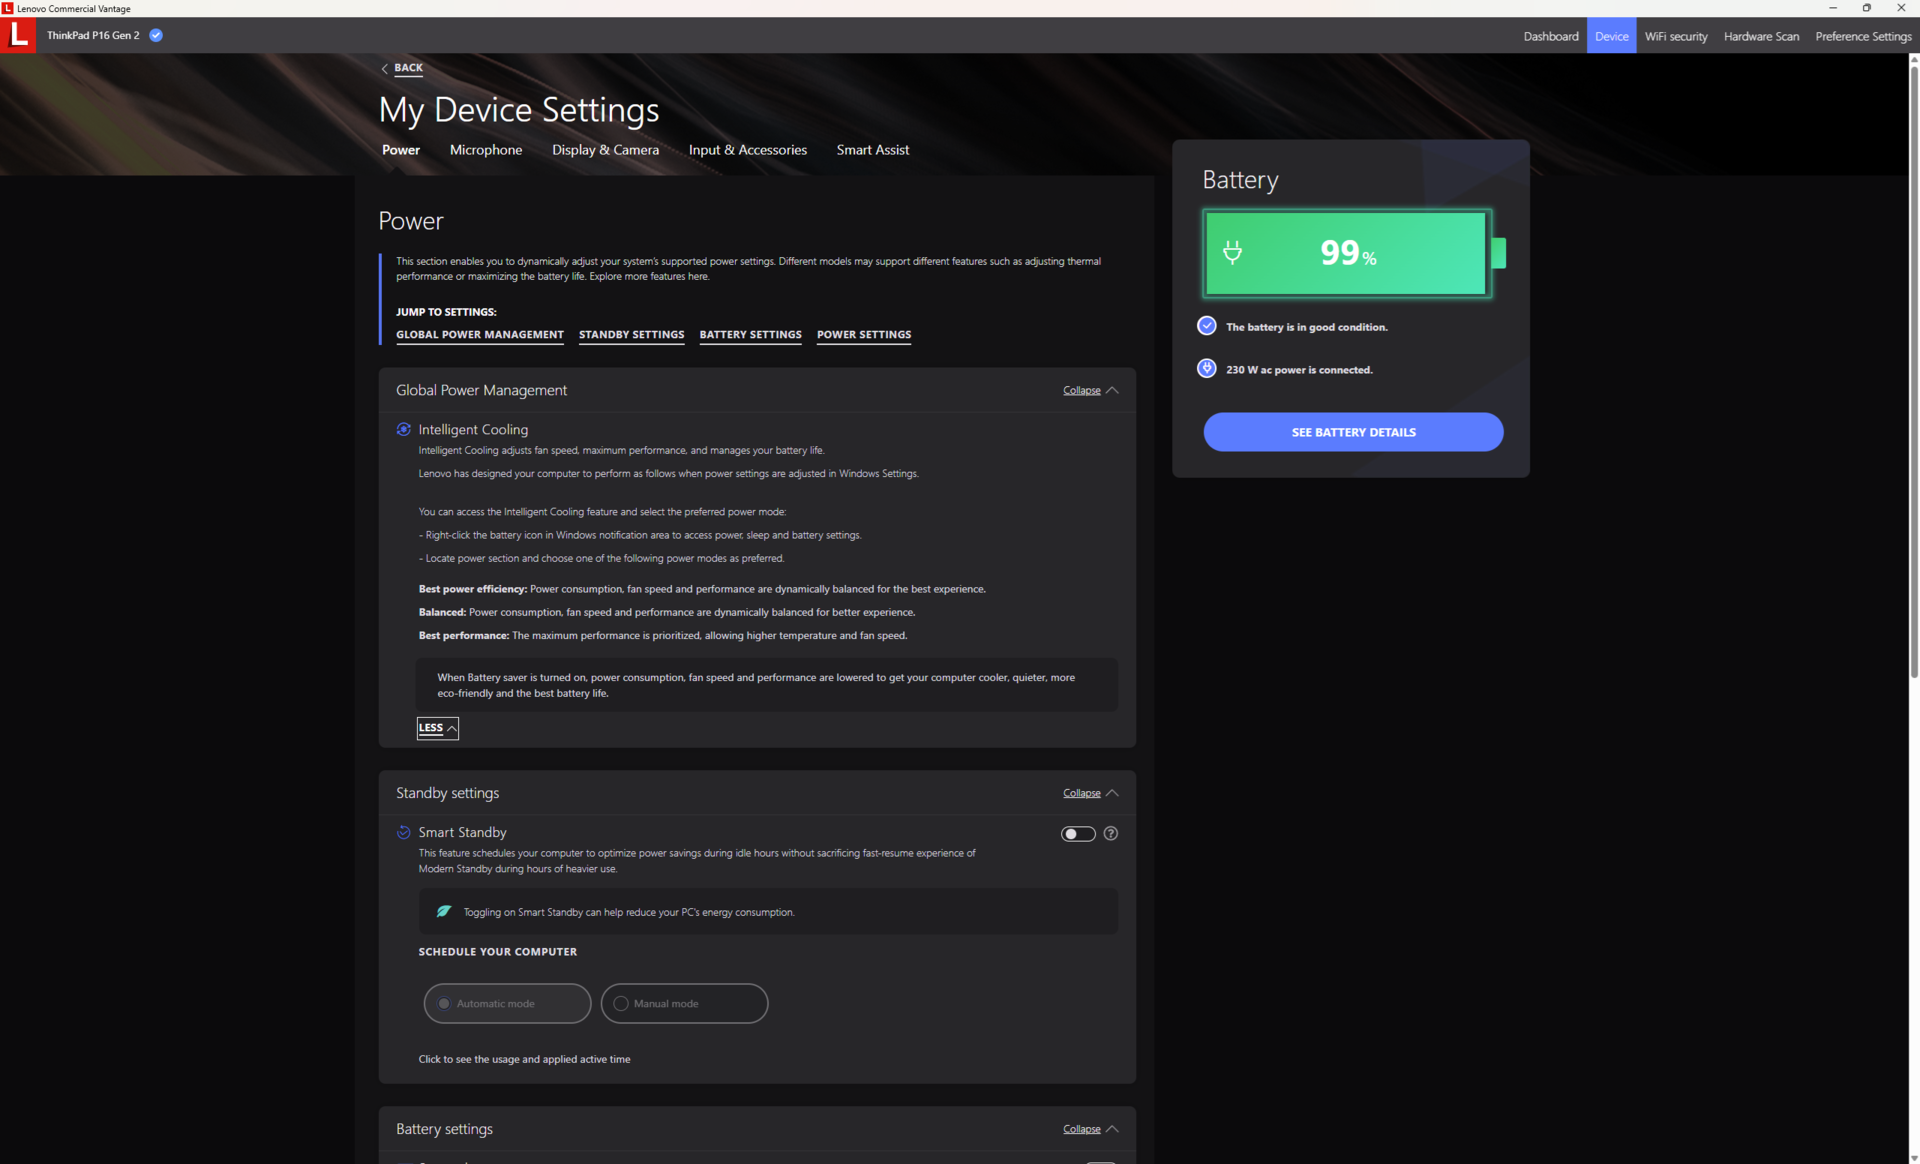
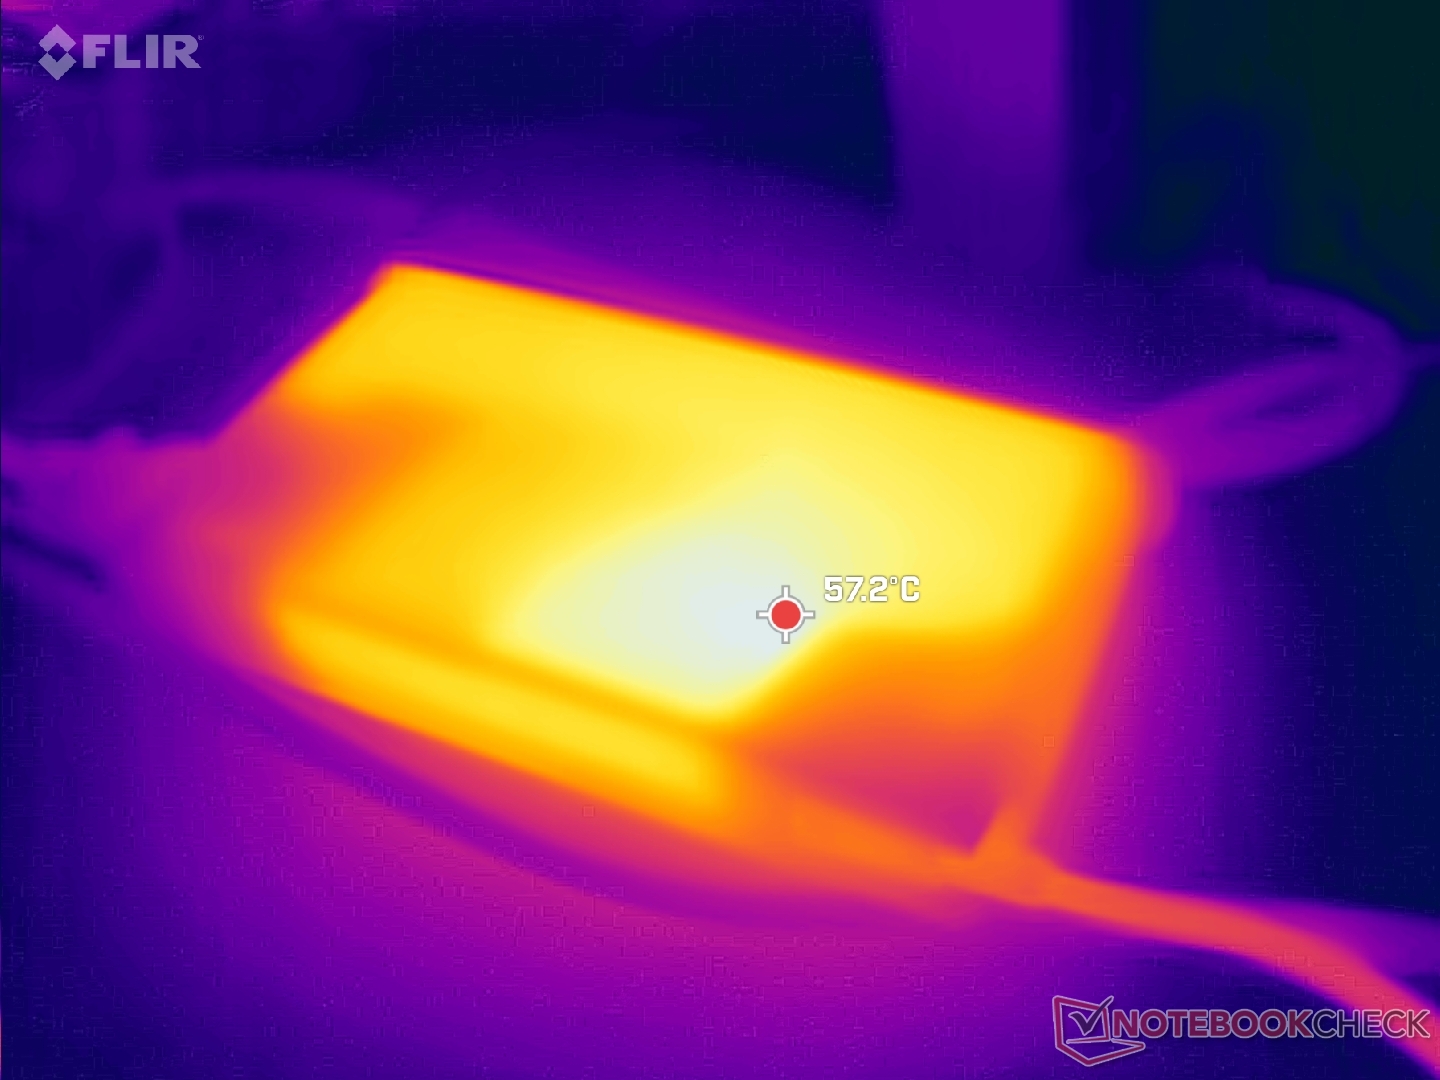
除了交流适配器和文件之外,包装盒中没有其他额外物品。不过,需要注意的是,由于我们对 RTX 4000 Ada GPU 的要求更高,我们的设备配备了更大的 230 W 交流适配器,而不是我们第一台 ThinkPad P16 Gen 2 上的 170 W 适配器。
制造商提供三年标准保修。
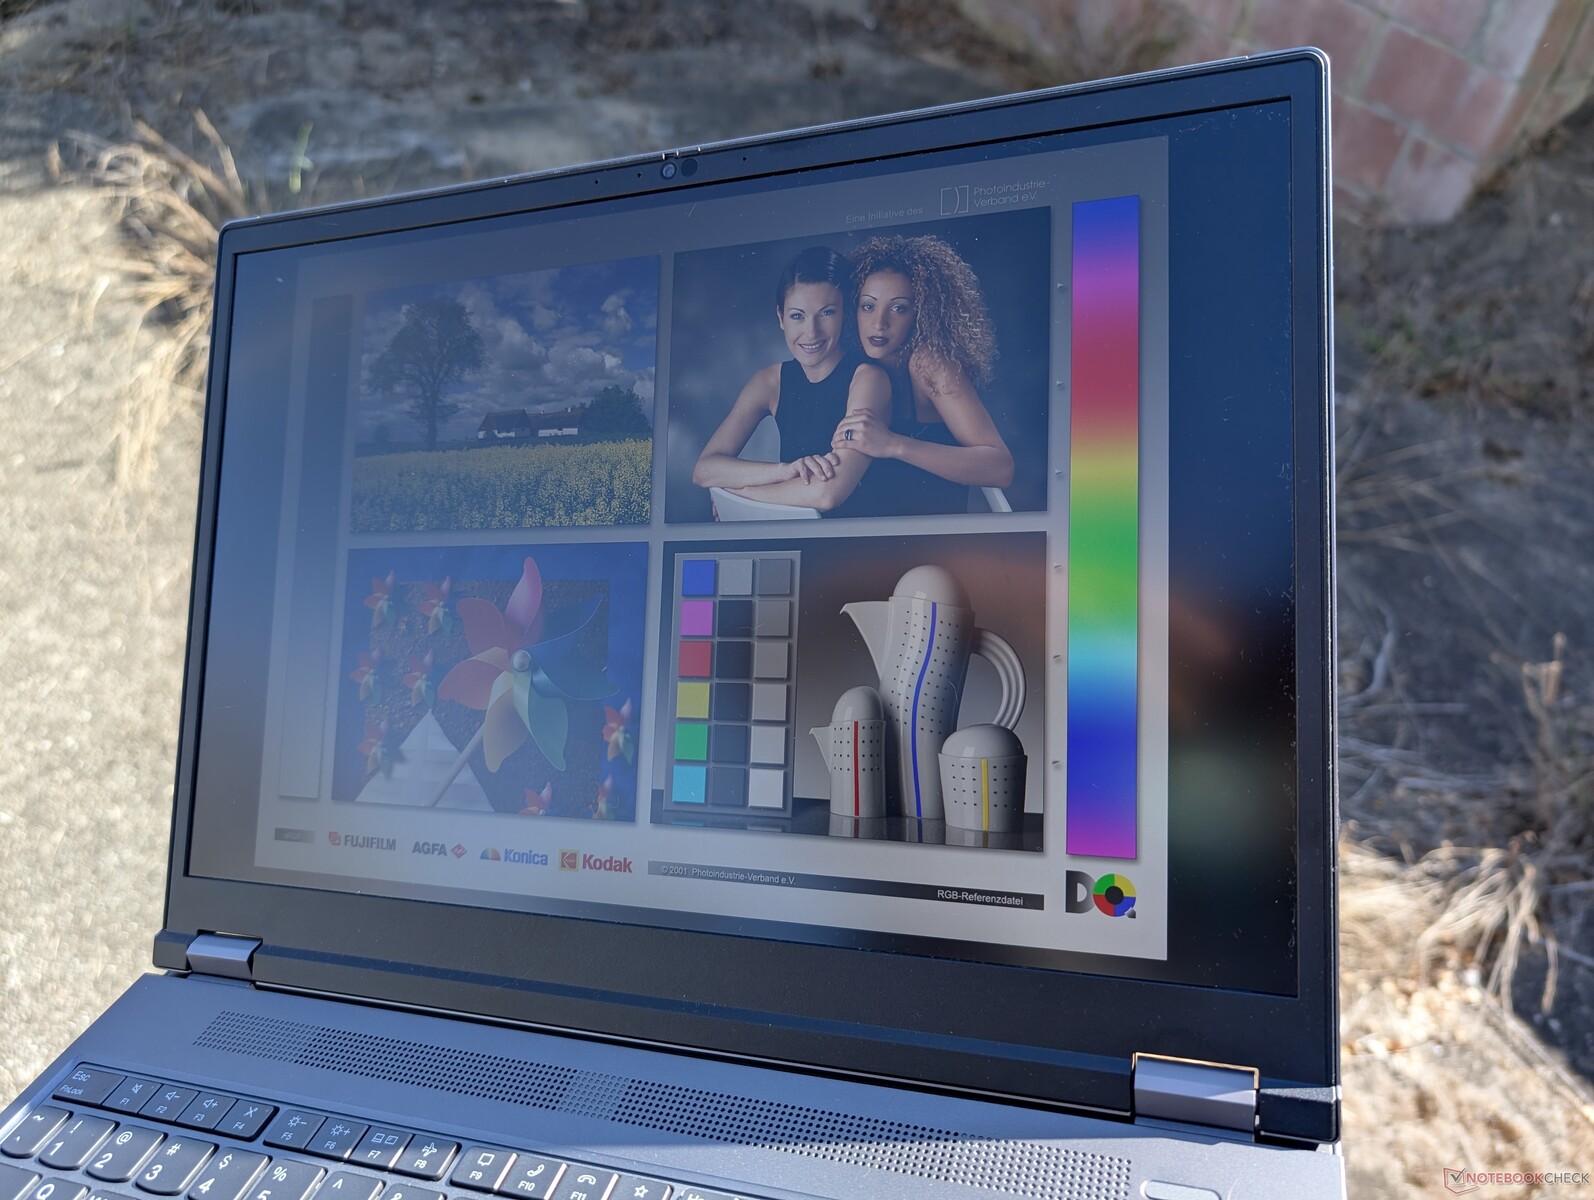
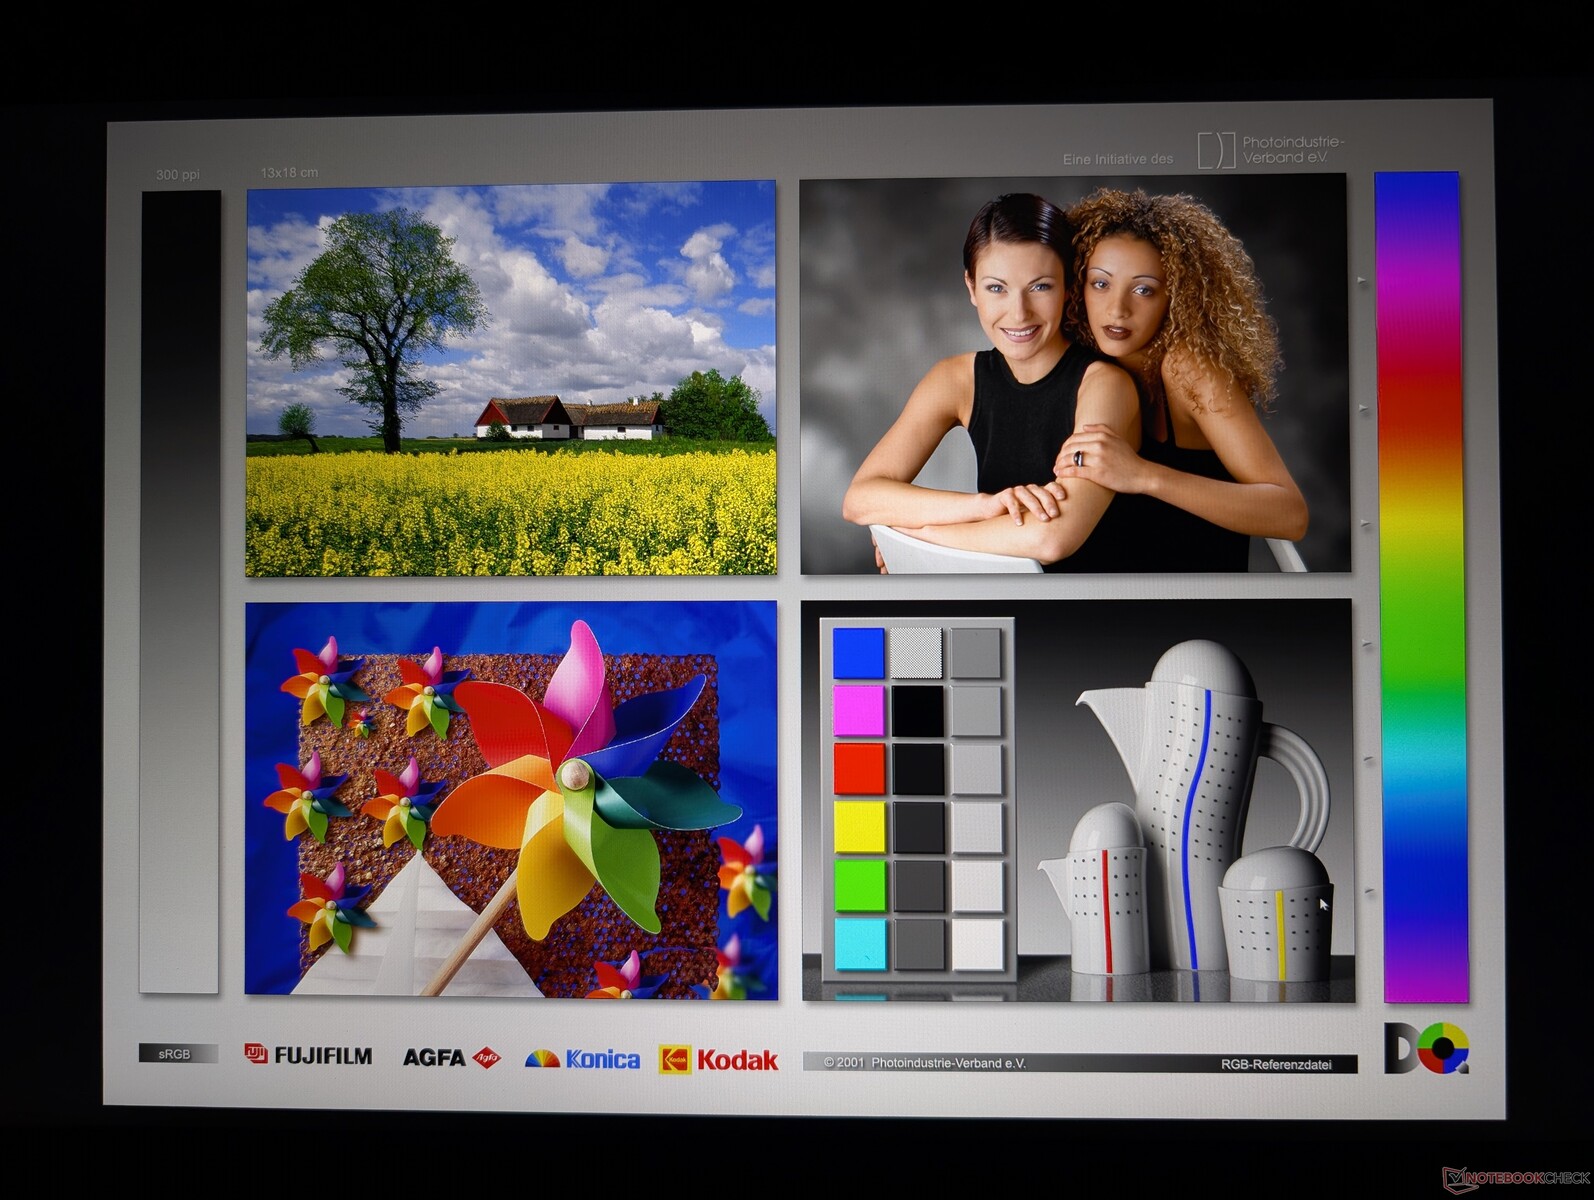
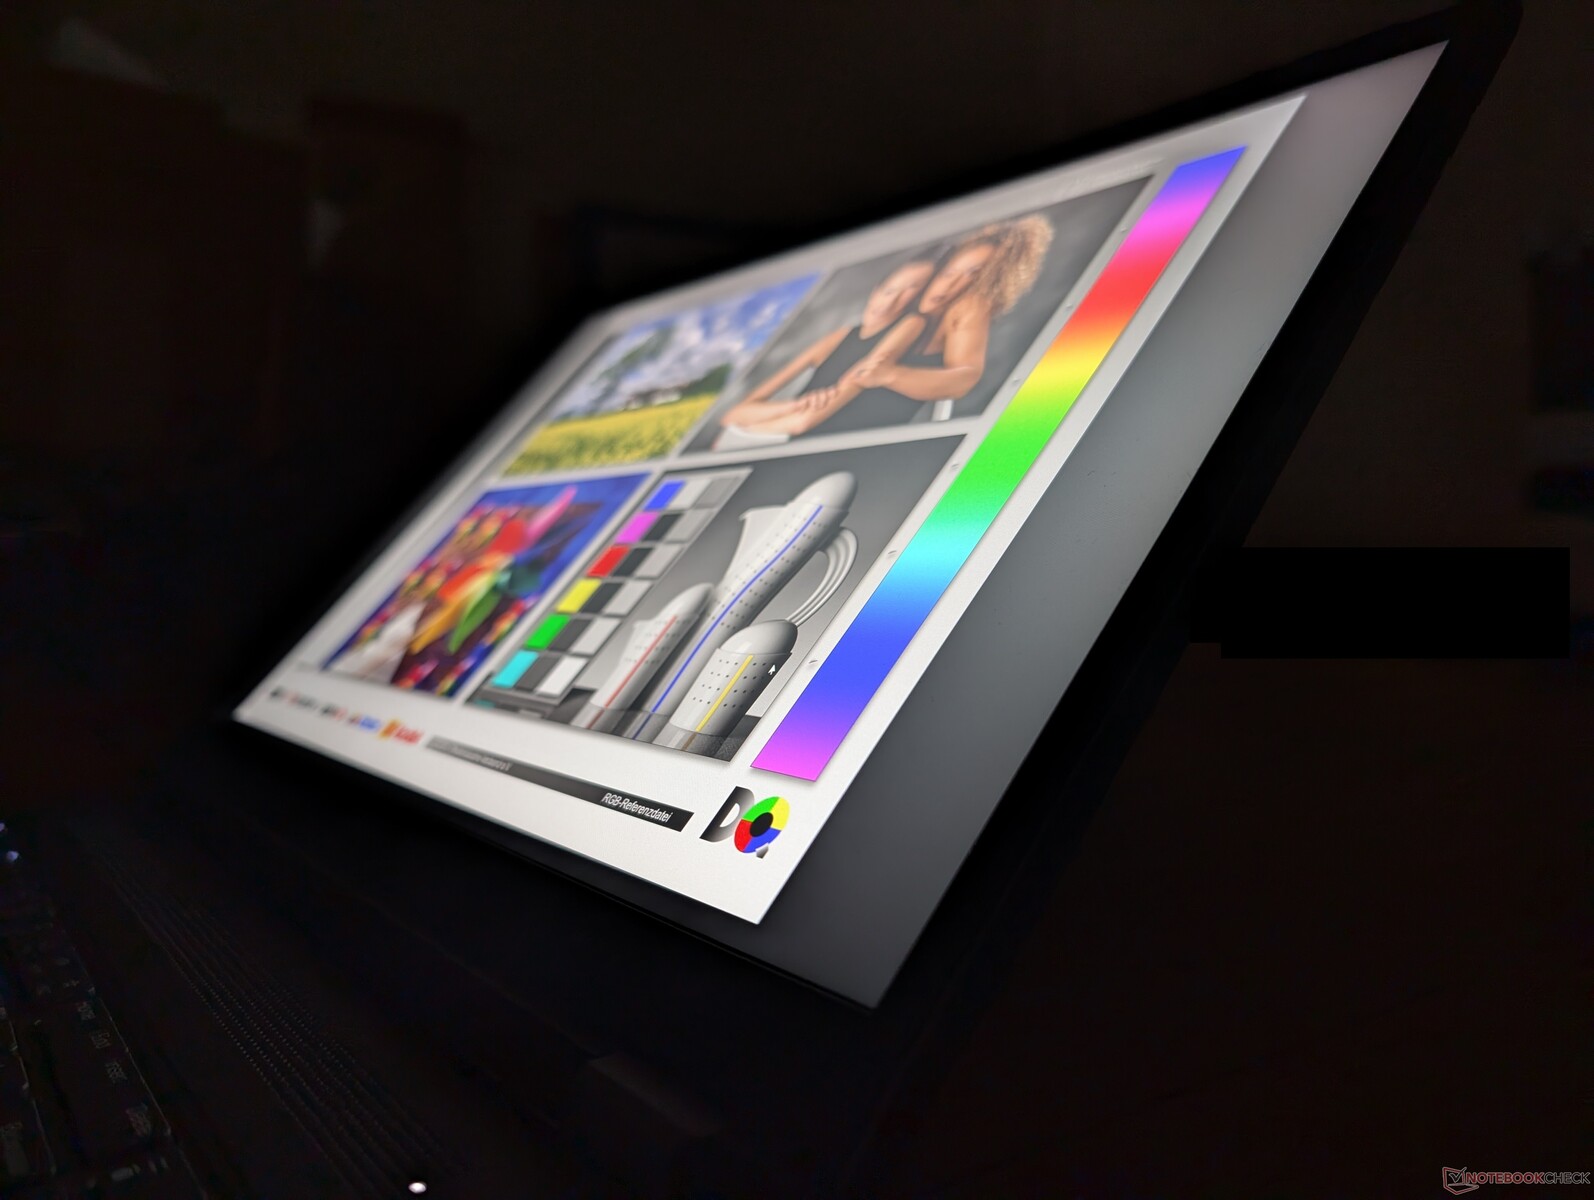
显示屏
有趣的是,与我们第一台 ThinkPad P16 Gen 2 设备(NE160QDM-NY1 与 MNG007DA1-9)上的 1600p165 IPS 面板相比,我们的 1600p165 IPS 面板来自不同的制造商。除此之外,它们的核心属性和亮度几乎完全相同。还有其他显示屏可供选择,包括 2400p OLED 和 1200p IPS。


| |||||||||||||||||||||||||
Brightness Distribution: 89 %
Center on Battery: 531.5 cd/m²
Contrast: 1399:1 (Black: 0.38 cd/m²)
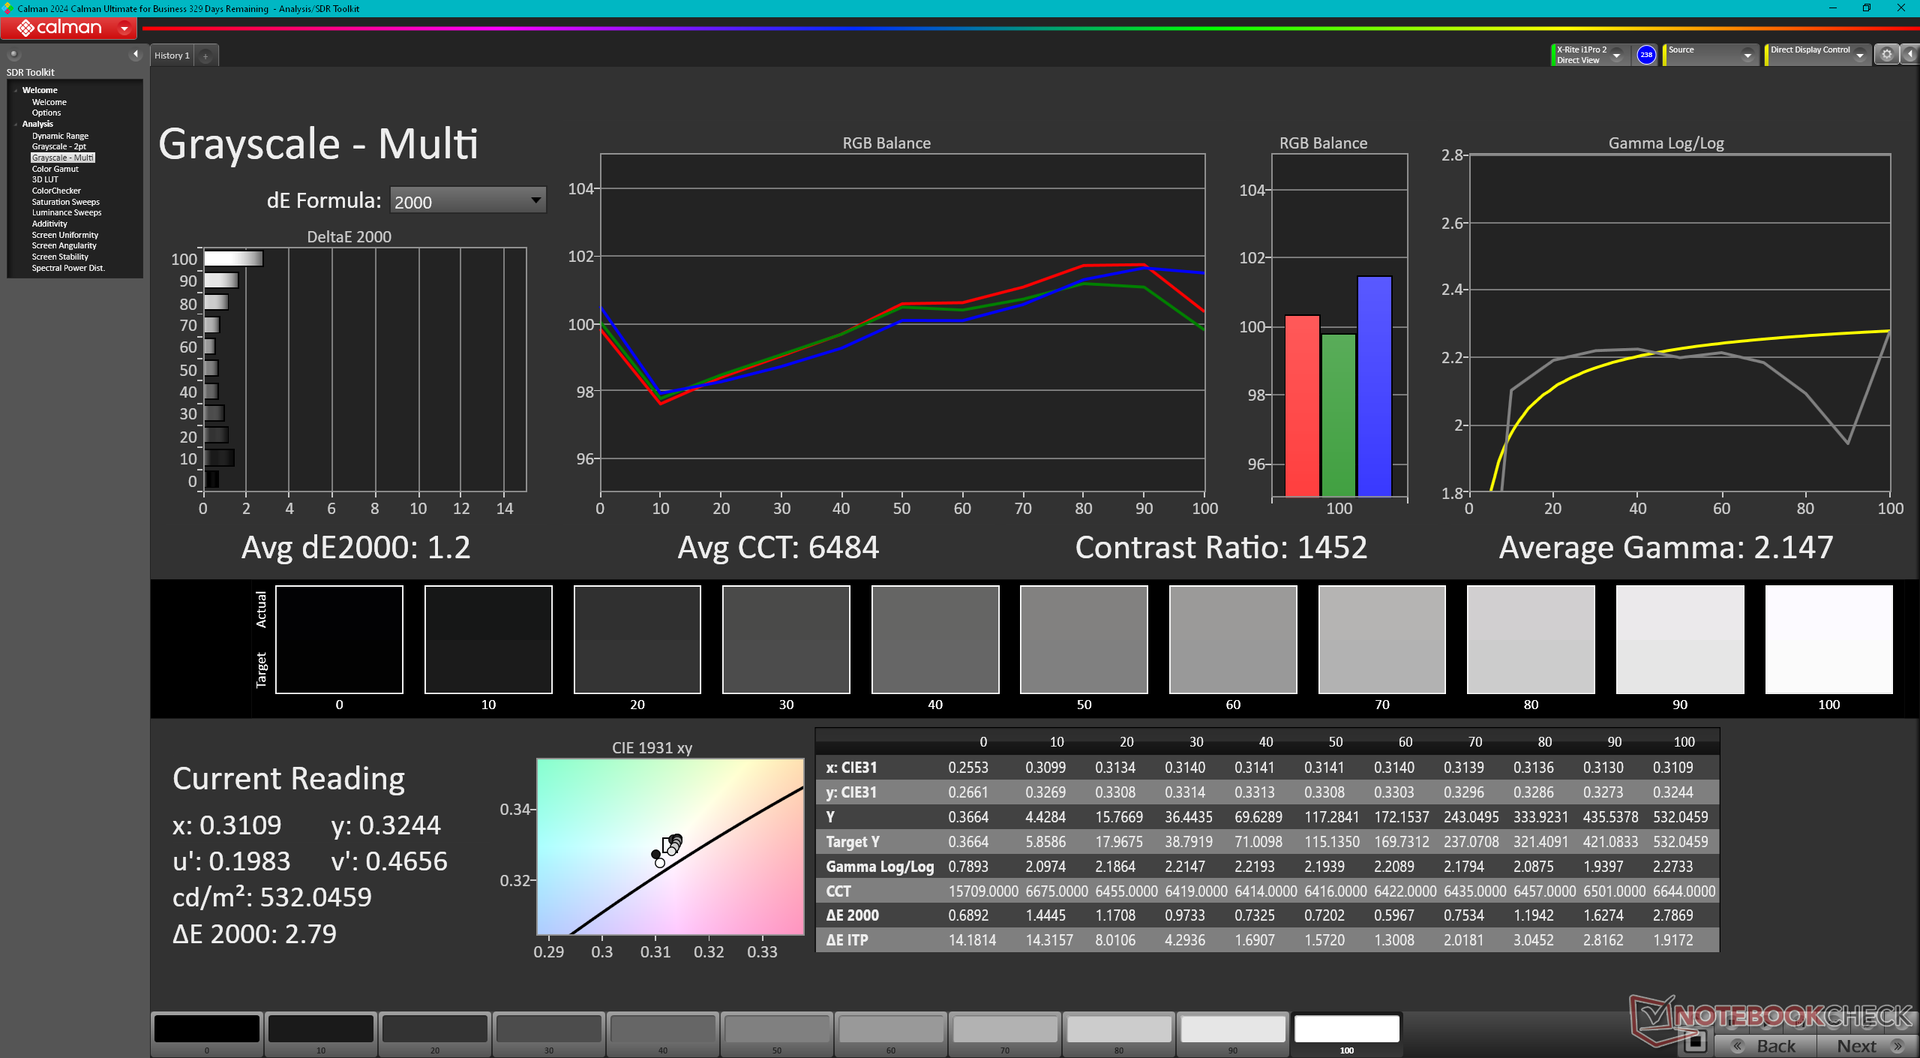
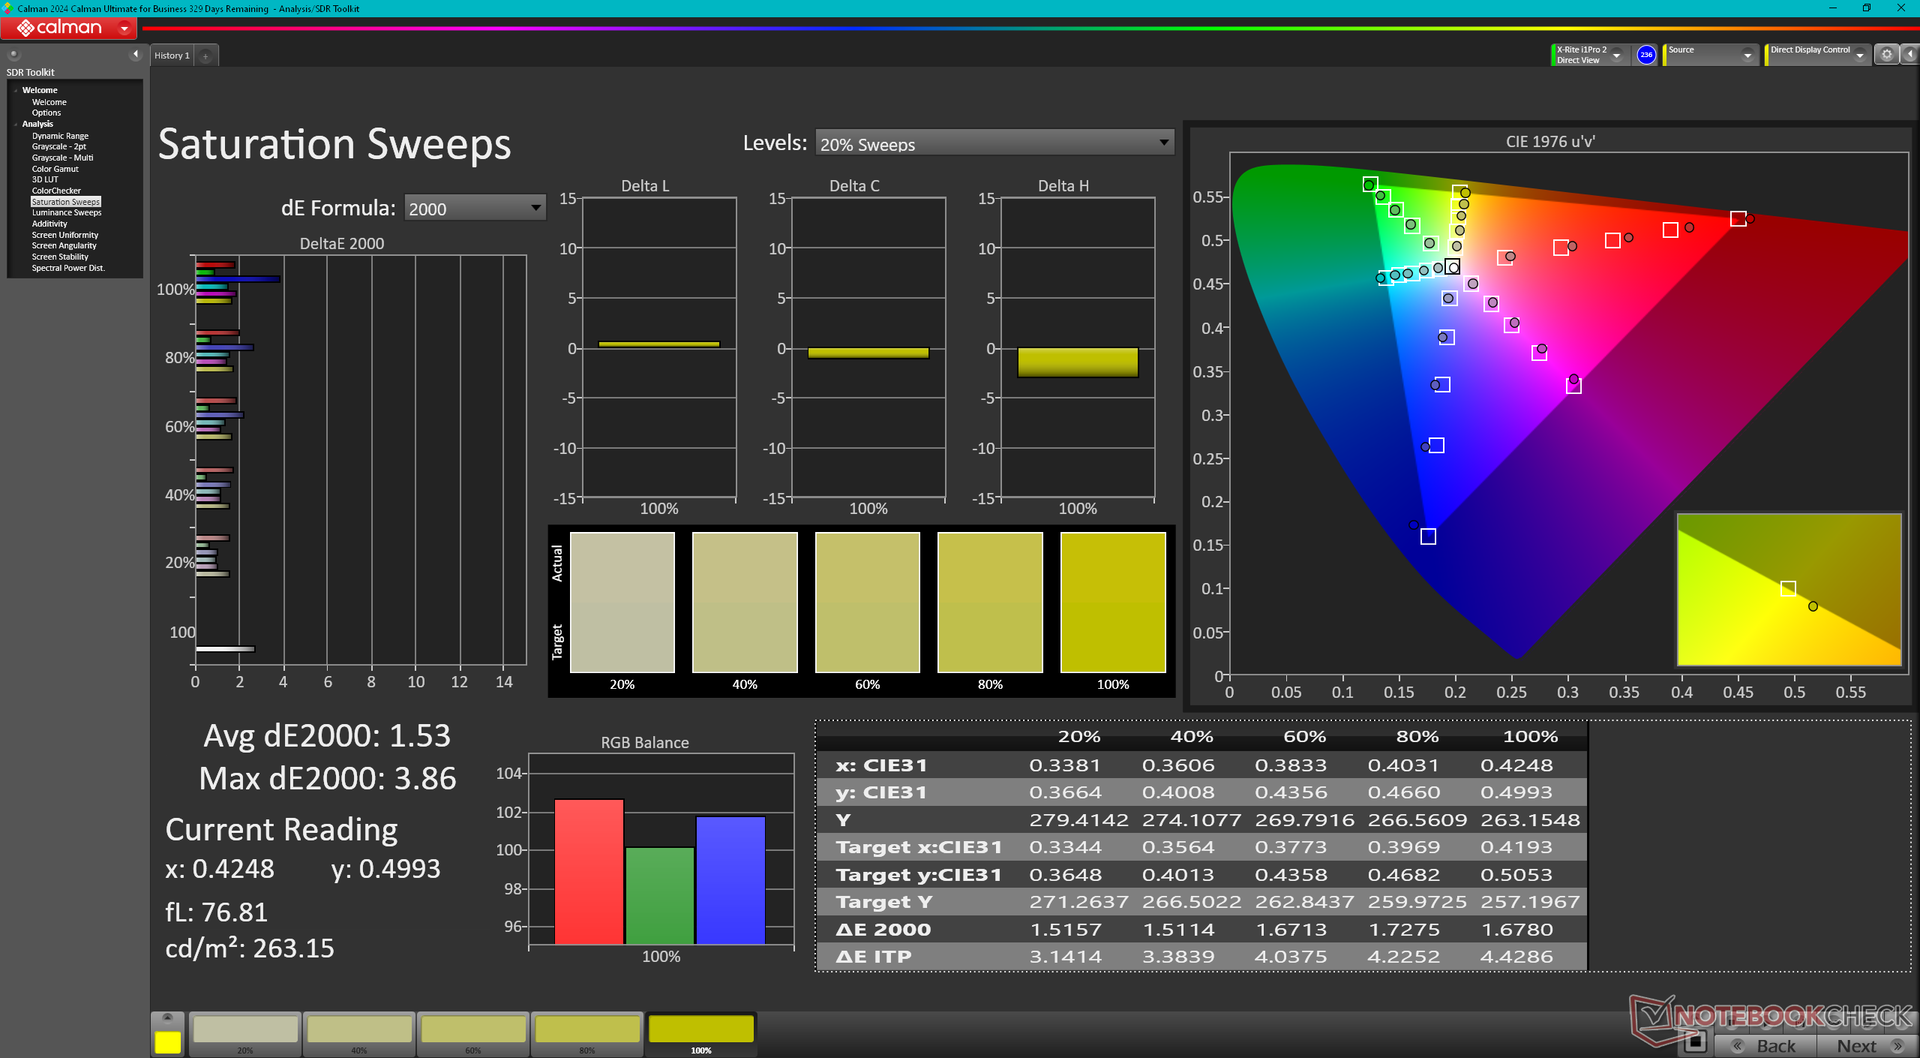
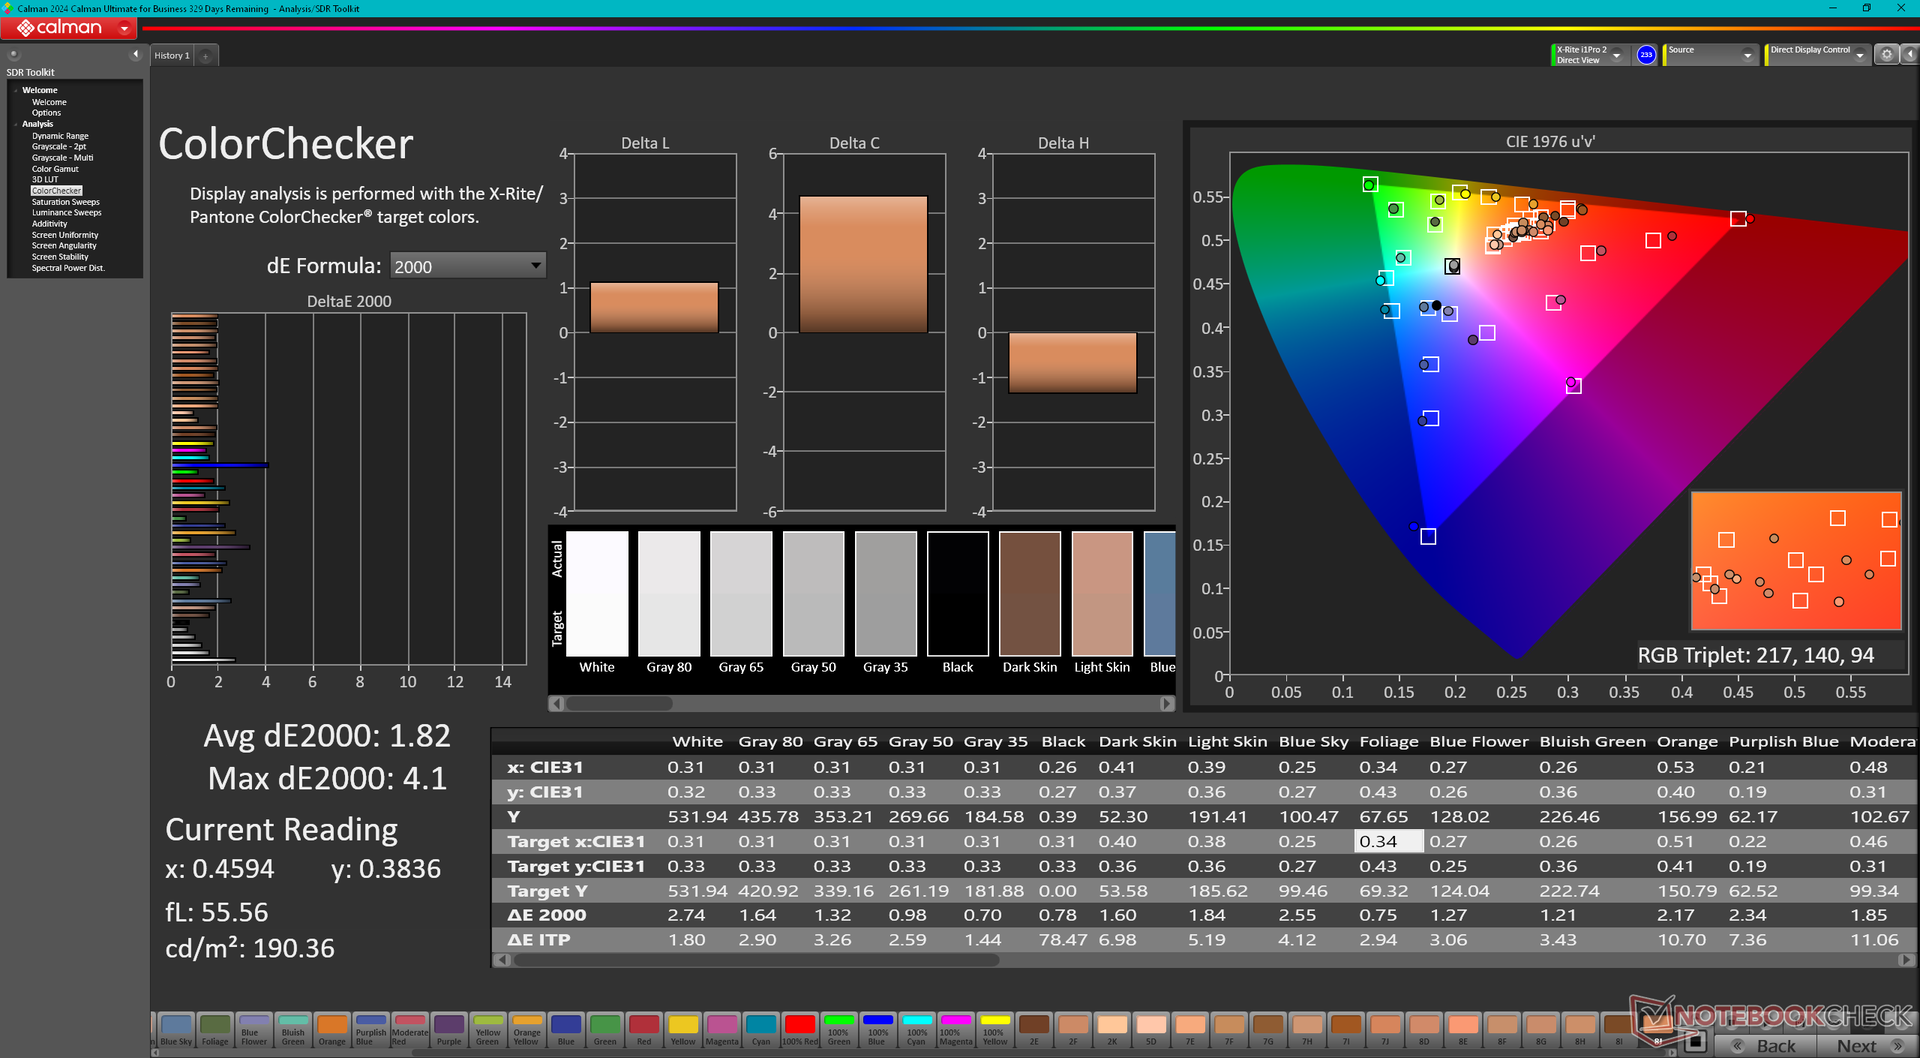
ΔE Color 1.82 | 0.5-29.43 Ø4.87, calibrated: 0.63
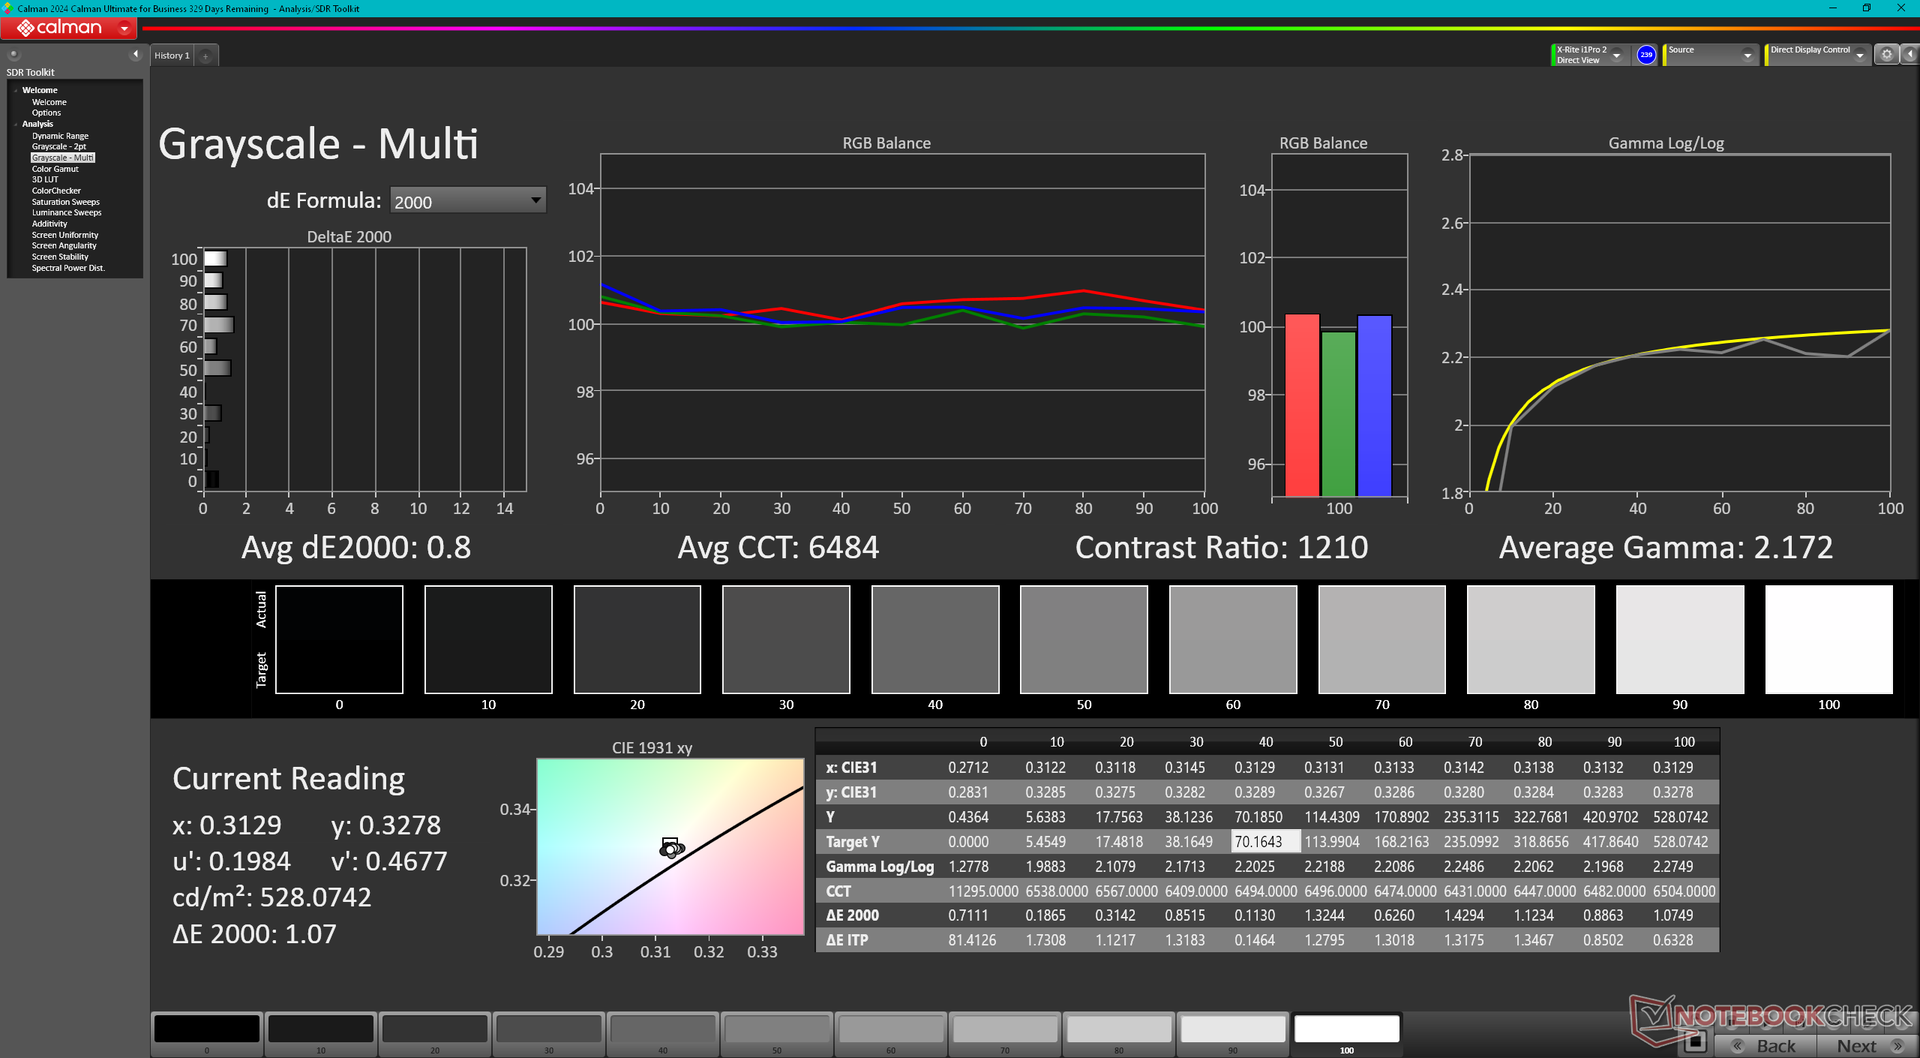
ΔE Greyscale 1.2 | 0.5-98 Ø5.1
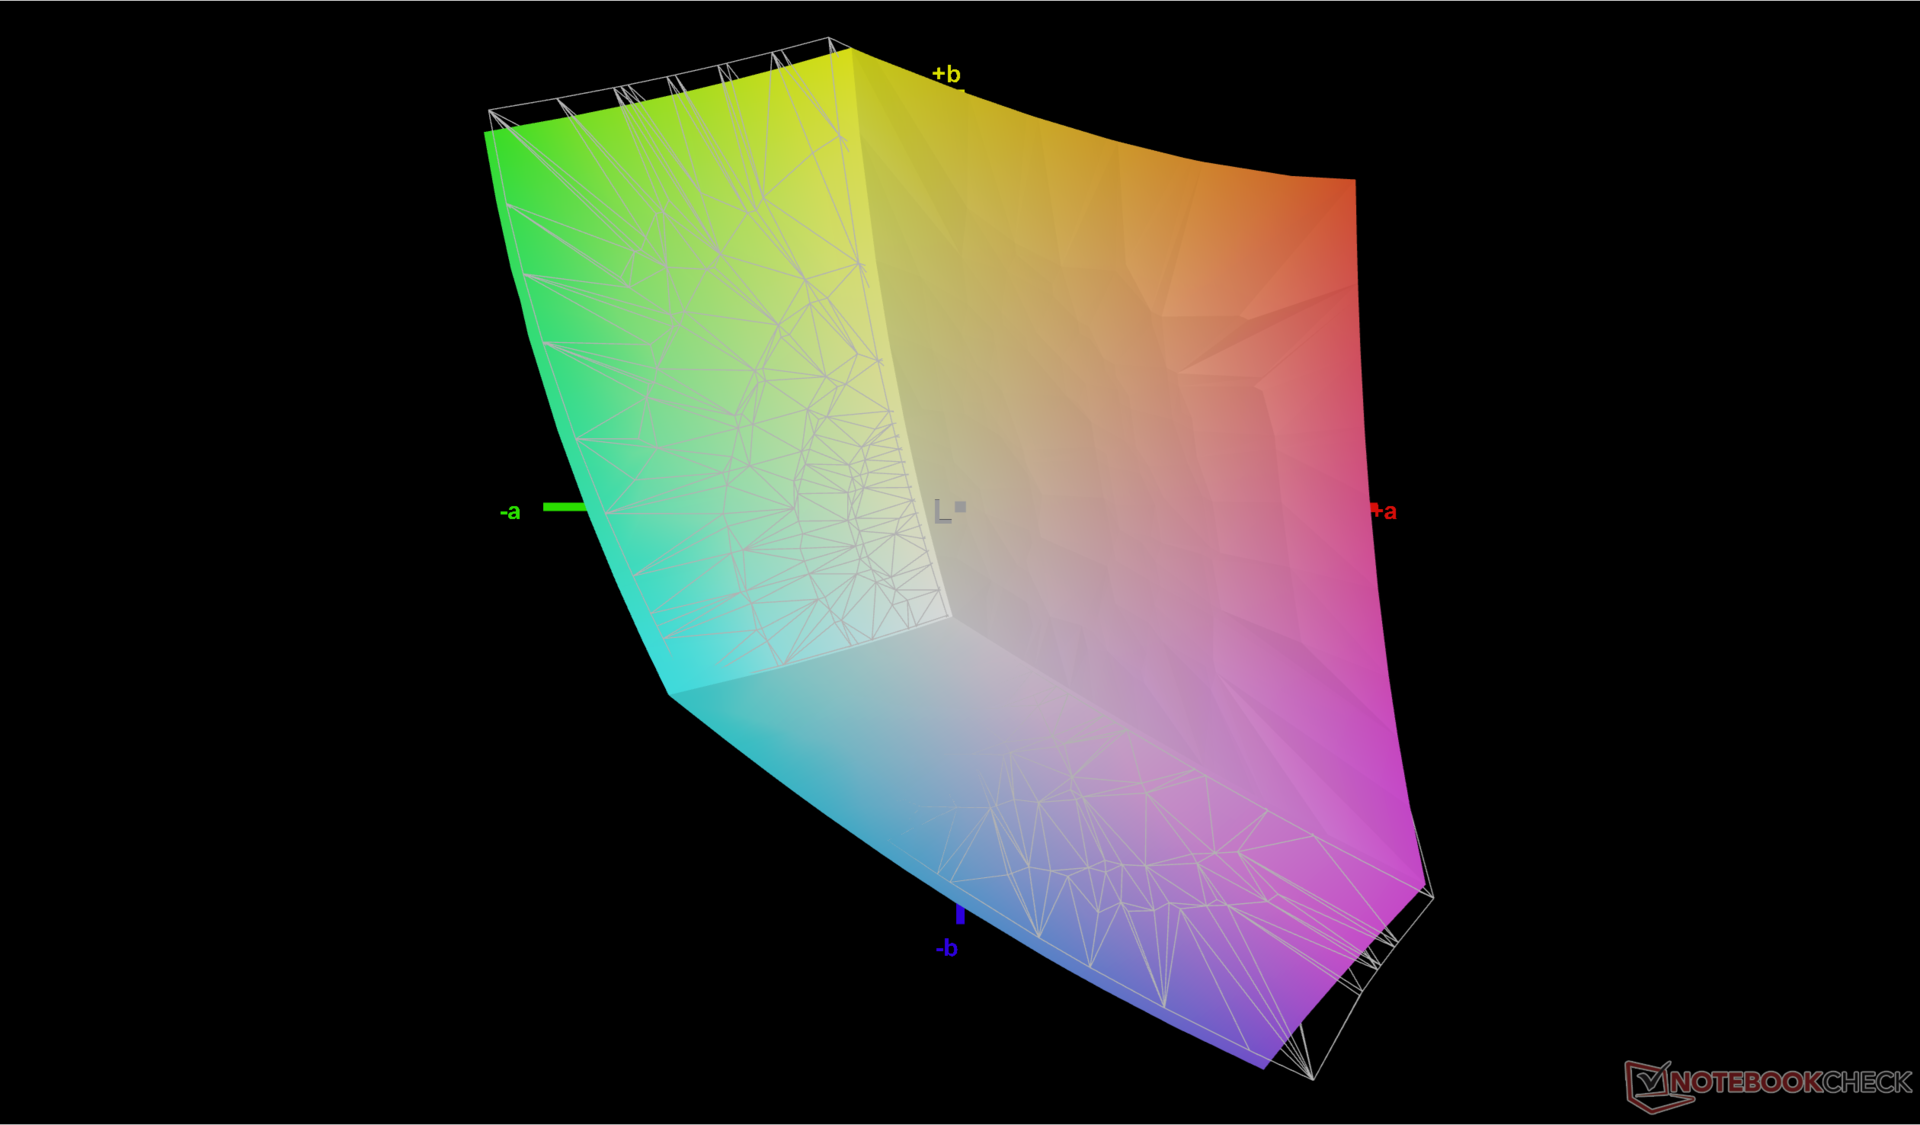
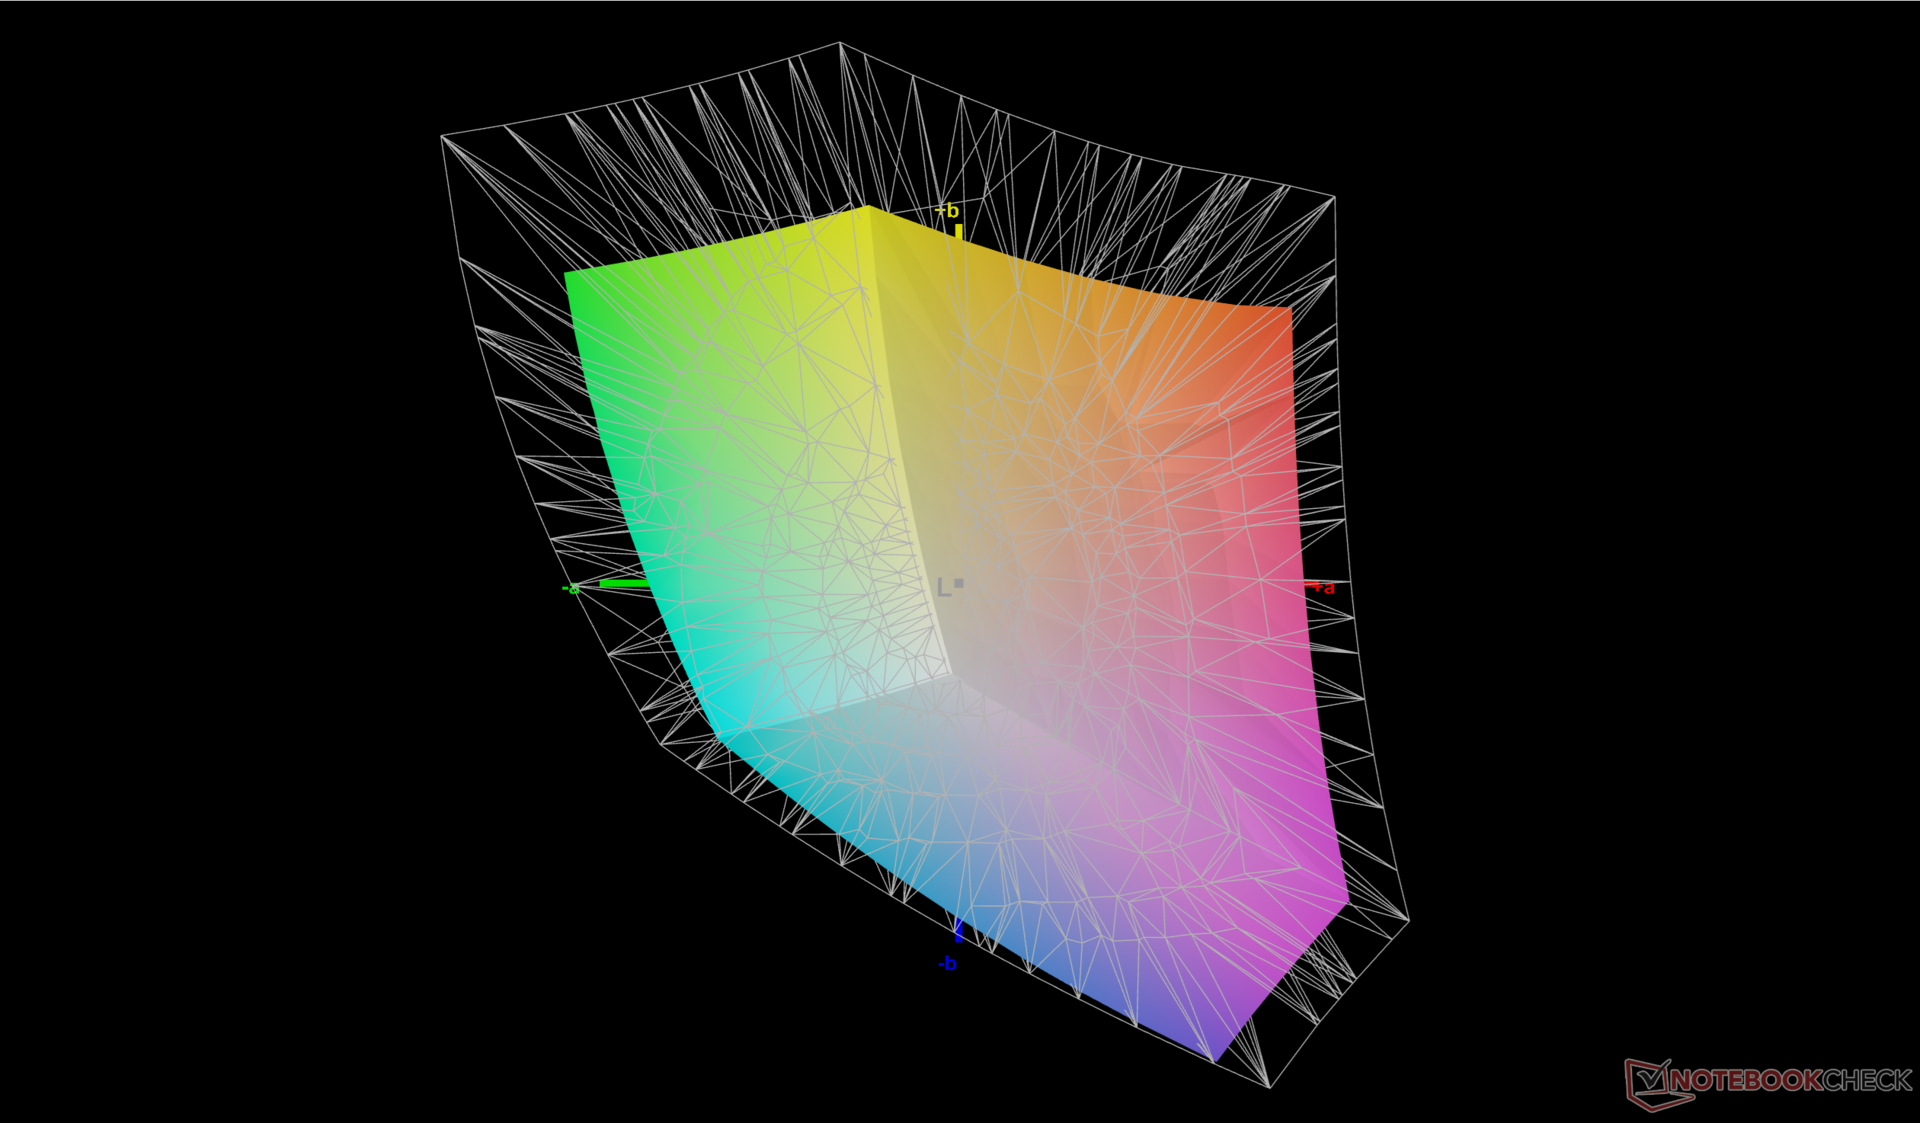
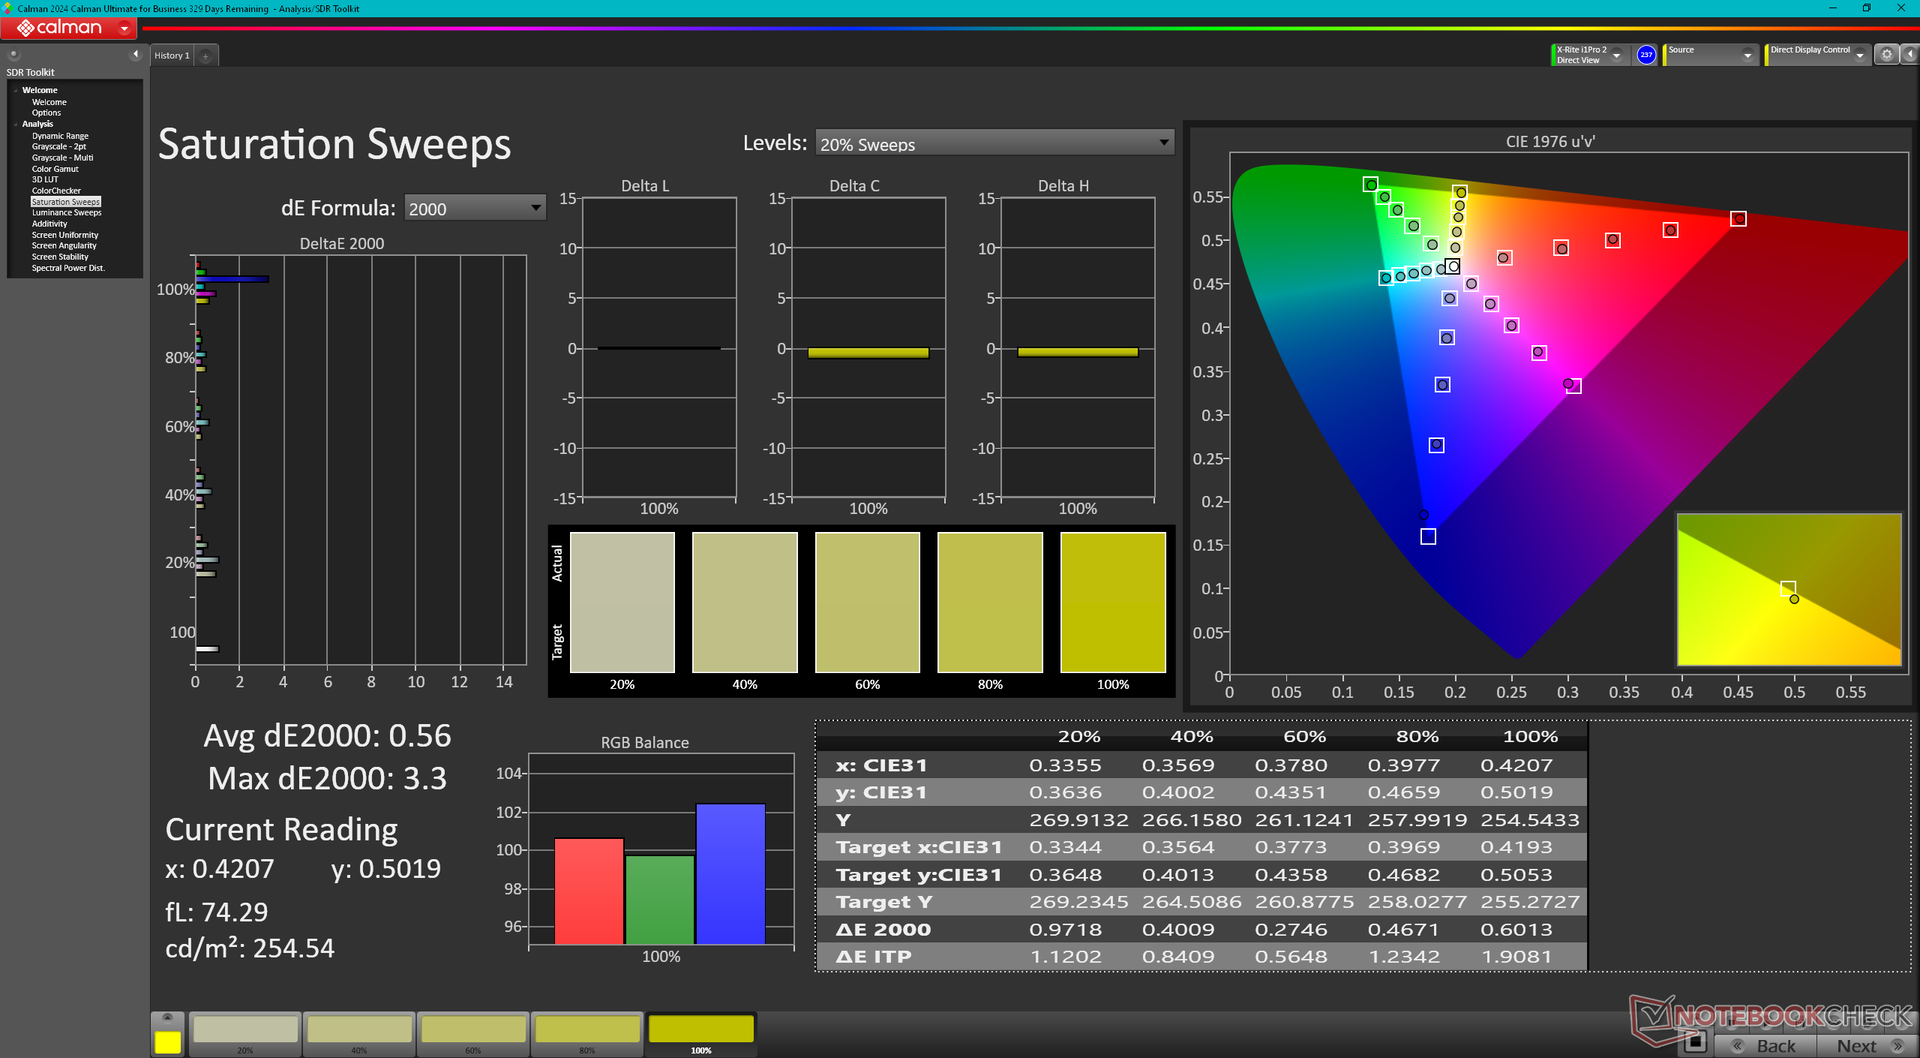
70.6% AdobeRGB 1998 (Argyll 2.2.0 3D)
96.9% sRGB (Argyll 2.2.0 3D)
68.4% Display P3 (Argyll 2.2.0 3D)
Gamma: 2.15
| Lenovo ThinkPad P16 Gen 2 NE160QDM-NY1, IPS, 2560x1600, 16", 165 Hz | Lenovo ThinkPad P16 G2 21FA000FGE MNG007DA1-9, IPS LED, 2560x1600, 16", 165 Hz | Lenovo ThinkPad P16s G2 21K9000CGE ATNA60YV04-0, OLED, 3840x2400, 16", 60 Hz | Lenovo ThinkPad P16 G1 RTX A5500 LP160UQ1-SPB1, IPS, 3840x2400, 16", 60 Hz | HP ZBook Power 16 G11 A AUOA0A9, IPS, 2560x1600, 16", 120 Hz | Dell Precision 5690 Samsung 160YV03, OLED, 3840x2400, 16", 60 Hz | |
|---|---|---|---|---|---|---|
| Display | 3% | 29% | 20% | 1% | 29% | |
| Display P3 Coverage | 68.4 | 71 4% | 99.9 46% | 82.9 21% | 69.1 1% | 99.8 46% |
| sRGB Coverage | 96.9 | 99.2 2% | 100 3% | 98.9 2% | 97.7 1% | 100 3% |
| AdobeRGB 1998 Coverage | 70.6 | 73.2 4% | 96.9 37% | 95.9 36% | 71 1% | 96.6 37% |
| Response Times | 4% | 88% | -248% | 10% | 86% | |
| Response Time Grey 50% / Grey 80% * | 14.1 ? | 12.8 ? 9% | 1.5 ? 89% | 45.6 ? -223% | 13.6 ? 4% | 1.7 ? 88% |
| Response Time Black / White * | 9.9 ? | 10.1 ? -2% | 1.3 ? 87% | 36.8 ? -272% | 8.4 ? 15% | 1.7 ? 83% |
| PWM Frequency | 60 | 60 ? | ||||
| Screen | -59% | -54% | -22% | -52% | -49% | |
| Brightness middle | 531.5 | 510 -4% | 416 -22% | 601.9 13% | 470.7 -11% | 348.1 -35% |
| Brightness | 499 | 517 4% | 421 -16% | 569 14% | 431 -14% | 351 -30% |
| Brightness Distribution | 89 | 89 0% | 98 10% | 77 -13% | 88 -1% | 97 9% |
| Black Level * | 0.38 | 0.37 3% | 0.47 -24% | 0.57 -50% | ||
| Contrast | 1399 | 1378 -2% | 1281 -8% | 826 -41% | ||
| Colorchecker dE 2000 * | 1.82 | 2.6 -43% | 1.3 29% | 2.45 -35% | 2.16 -19% | 4.18 -130% |
| Colorchecker dE 2000 max. * | 4.1 | 5.2 -27% | 2.8 32% | 4.46 -9% | 4.39 -7% | 6.68 -63% |
| Colorchecker dE 2000 calibrated * | 0.63 | 2.3 -265% | 2.9 -360% | 1.37 -117% | 0.97 -54% | |
| Greyscale dE 2000 * | 1.2 | 3.6 -200% | 1.8 -50% | 2.6 -117% | 3.7 -208% | 1.7 -42% |
| Gamma | 2.15 102% | 2.26 97% | 2.25 98% | 2.3 96% | 2.38 92% | 2.2 100% |
| CCT | 6484 100% | 5969 109% | 6574 99% | 6805 96% | 6765 96% | 6198 105% |
| Total Average (Program / Settings) | -17% /
-37% | 21% /
-10% | -83% /
-47% | -14% /
-32% | 22% /
-7% |
* ... smaller is better
显示器根据 sRGB 标准进行了预校准,平均灰度 deltaE 值分别仅为 1.2 和 1.82。因此,大多数情况下无需进行最终用户校准。

Display Response Times
| ↔ Response Time Black to White | ||
|---|---|---|
| 9.9 ms ... rise ↗ and fall ↘ combined | ↗ 5 ms rise | 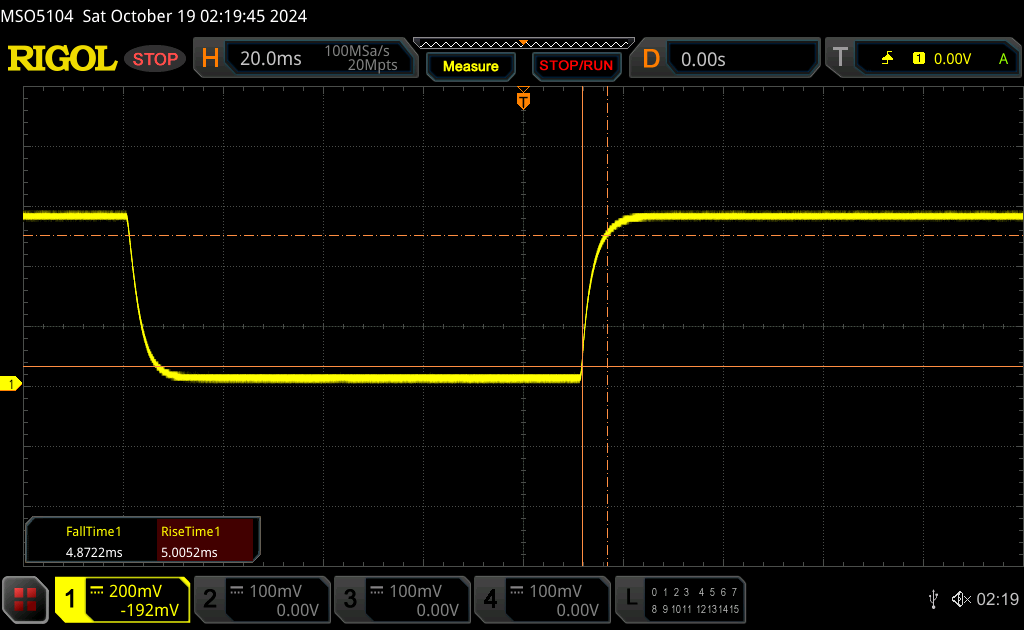 |
| ↘ 4.9 ms fall | ||
| The screen shows fast response rates in our tests and should be suited for gaming. In comparison, all tested devices range from 0.1 (minimum) to 240 (maximum) ms. » 24 % of all devices are better. This means that the measured response time is better than the average of all tested devices (20.8 ms). | ||
| ↔ Response Time 50% Grey to 80% Grey | ||
| 14.1 ms ... rise ↗ and fall ↘ combined | ↗ 6.7 ms rise | 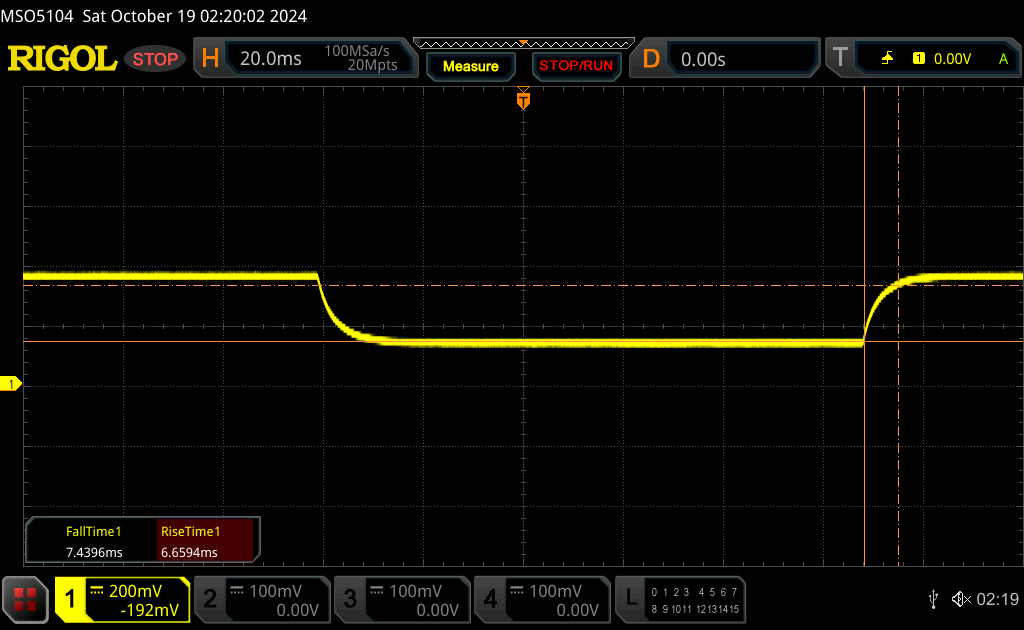 |
| ↘ 7.4 ms fall | ||
| The screen shows good response rates in our tests, but may be too slow for competitive gamers. In comparison, all tested devices range from 0.165 (minimum) to 636 (maximum) ms. » 25 % of all devices are better. This means that the measured response time is better than the average of all tested devices (32.5 ms). | ||
Screen Flickering / PWM (Pulse-Width Modulation)
| Screen flickering / PWM not detected | 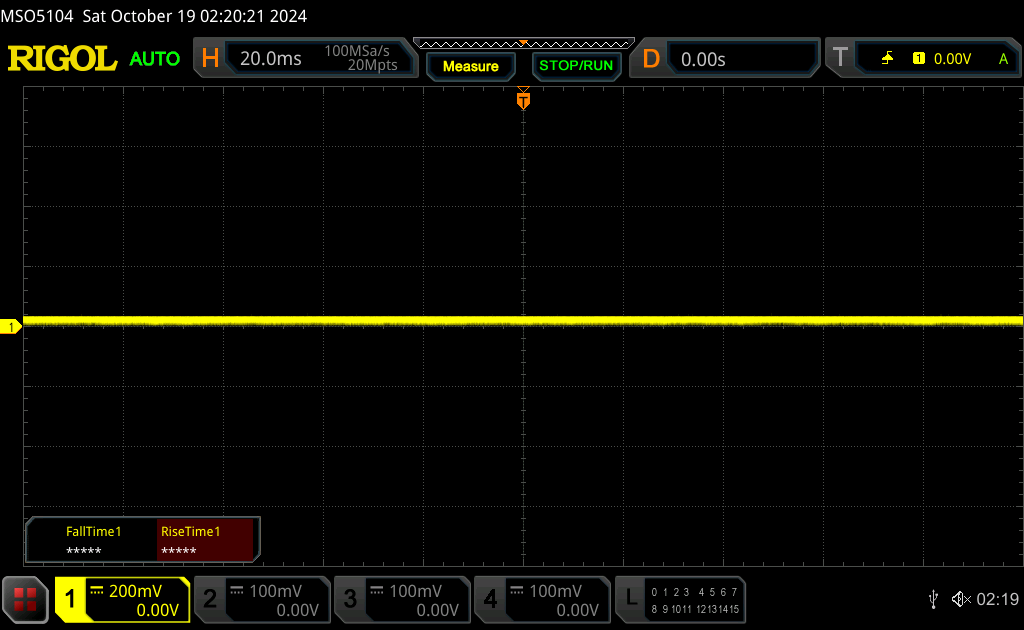 | ||
In comparison: 53 % of all tested devices do not use PWM to dim the display. If PWM was detected, an average of 8516 (minimum: 5 - maximum: 343500) Hz was measured. | |||

性能
测试条件
在运行以下基准测试之前,我们将 Windows 设置为 "性能模式",将 GPU 设置为 "独立模式"。根据 Nvidia 控制面板,系统不支持高级优化。
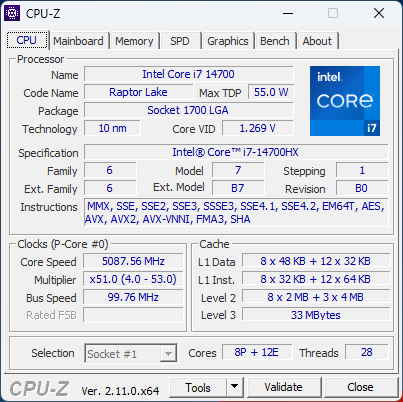
处理器
酷睿 i7-14700HX 酷睿 i7-14700HX比 酷睿 i7-13700HX多线程性能提高了 20% 至 25%。配备 酷睿 i9-13980HX的 SKU 仍可提供比酷睿 I7-14700HX 更快的性能,尽管它是一款较老的处理器。
性能持续性不错,但还可以更好。例如,在循环运行 CineBench R15 xT 时,我们最初的 3930 分仅循环几次就会下降 10%。
Cinebench R15 Multi Loop
Cinebench R23: Multi Core | Single Core
Cinebench R20: CPU (Multi Core) | CPU (Single Core)
Cinebench R15: CPU Multi 64Bit | CPU Single 64Bit
Blender: v2.79 BMW27 CPU
7-Zip 18.03: 7z b 4 | 7z b 4 -mmt1
Geekbench 6.4: Multi-Core | Single-Core
Geekbench 5.5: Multi-Core | Single-Core
HWBOT x265 Benchmark v2.2: 4k Preset
LibreOffice : 20 Documents To PDF
R Benchmark 2.5: Overall mean
| CPU Performance Rating | |
| HP ZBook Fury 16 G11 | |
| Lenovo ThinkPad P16 Gen 2 | |
| Average Intel Core i7-14700HX | |
| Lenovo ThinkPad P16 G1 RTX A5500 -2! | |
| Lenovo ThinkPad P1 G6 21FV001KUS | |
| Lenovo ThinkPad P16 G2 21FA000FGE -2! | |
| Dell Precision 5690 | |
| Lenovo ThinkPad P1 G6-21FV000DGE | |
| Average of class Workstation | |
| Lenovo ThinkPad P1 Gen 7 21KV001SGE | |
| HP ZBook Fury 16 G9 -2! | |
| HP ZBook Power 16 G11 A | |
| MSI CreatorPro Z16P B12UKST -2! | |
| Lenovo ThinkPad P16v G1 AMD | |
| Lenovo ThinkPad P16s G2 21K9000CGE | |
| HP ZBook Firefly 16 G9-6B897EA -2! | |
| Geekbench 6.4 / Multi-Core | |
| Lenovo ThinkPad P16 Gen 2 | |
| Average Intel Core i7-14700HX (14807 - 17562, n=7) | |
| HP ZBook Fury 16 G11 | |
| Dell Precision 5690 | |
| Average of class Workstation (10200 - 16855, n=23, last 2 years) | |
| Lenovo ThinkPad P1 Gen 7 21KV001SGE | |
| Lenovo ThinkPad P1 G6 21FV001KUS | |
| HP ZBook Power 16 G11 A | |
| Lenovo ThinkPad P1 G6-21FV000DGE | |
| Lenovo ThinkPad P16s G2 21K9000CGE | |
| Lenovo ThinkPad P16v G1 AMD | |
| Geekbench 6.4 / Single-Core | |
| HP ZBook Fury 16 G11 | |
| Lenovo ThinkPad P16 Gen 2 | |
| Lenovo ThinkPad P1 G6 21FV001KUS | |
| Average Intel Core i7-14700HX (2378 - 2975, n=7) | |
| Lenovo ThinkPad P1 G6-21FV000DGE | |
| HP ZBook Power 16 G11 A | |
| Average of class Workstation (2352 - 2949, n=23, last 2 years) | |
| Lenovo ThinkPad P16v G1 AMD | |
| Dell Precision 5690 | |
| Lenovo ThinkPad P16s G2 21K9000CGE | |
| Lenovo ThinkPad P1 Gen 7 21KV001SGE | |
Cinebench R23: Multi Core | Single Core
Cinebench R20: CPU (Multi Core) | CPU (Single Core)
Cinebench R15: CPU Multi 64Bit | CPU Single 64Bit
Blender: v2.79 BMW27 CPU
7-Zip 18.03: 7z b 4 | 7z b 4 -mmt1
Geekbench 6.4: Multi-Core | Single-Core
Geekbench 5.5: Multi-Core | Single-Core
HWBOT x265 Benchmark v2.2: 4k Preset
LibreOffice : 20 Documents To PDF
R Benchmark 2.5: Overall mean
* ... smaller is better
AIDA64: FP32 Ray-Trace | FPU Julia | CPU SHA3 | CPU Queen | FPU SinJulia | FPU Mandel | CPU AES | CPU ZLib | FP64 Ray-Trace | CPU PhotoWorxx
| Performance Rating | |
| Lenovo ThinkPad P16 Gen 2 | |
| Average Intel Core i7-14700HX | |
| HP ZBook Power 16 G11 A | |
| Lenovo ThinkPad P16s G2 21K9000CGE | |
| Dell Precision 5690 | |
| Lenovo ThinkPad P16 G1 RTX A5500 | |
| Lenovo ThinkPad P16 G2 21FA000FGE | |
| AIDA64 / FP32 Ray-Trace | |
| HP ZBook Power 16 G11 A | |
| Lenovo ThinkPad P16s G2 21K9000CGE | |
| Average Intel Core i7-14700HX (16932 - 23676, n=7) | |
| Lenovo ThinkPad P16 Gen 2 | |
| Dell Precision 5690 | |
| Lenovo ThinkPad P16 G2 21FA000FGE | |
| Lenovo ThinkPad P16 G1 RTX A5500 | |
| AIDA64 / FPU Julia | |
| HP ZBook Power 16 G11 A | |
| Lenovo ThinkPad P16 Gen 2 | |
| Average Intel Core i7-14700HX (86338 - 116556, n=7) | |
| Lenovo ThinkPad P16s G2 21K9000CGE | |
| Dell Precision 5690 | |
| Lenovo ThinkPad P16 G2 21FA000FGE | |
| Lenovo ThinkPad P16 G1 RTX A5500 | |
| AIDA64 / CPU SHA3 | |
| Lenovo ThinkPad P16 Gen 2 | |
| Average Intel Core i7-14700HX (4008 - 5567, n=7) | |
| HP ZBook Power 16 G11 A | |
| Lenovo ThinkPad P16s G2 21K9000CGE | |
| Dell Precision 5690 | |
| Lenovo ThinkPad P16 G2 21FA000FGE | |
| Lenovo ThinkPad P16 G1 RTX A5500 | |
| AIDA64 / CPU Queen | |
| Lenovo ThinkPad P16 Gen 2 | |
| Average Intel Core i7-14700HX (129836 - 152200, n=7) | |
| HP ZBook Power 16 G11 A | |
| Lenovo ThinkPad P16 G2 21FA000FGE | |
| Lenovo ThinkPad P16 G1 RTX A5500 | |
| Lenovo ThinkPad P16s G2 21K9000CGE | |
| Dell Precision 5690 | |
| AIDA64 / FPU SinJulia | |
| HP ZBook Power 16 G11 A | |
| Lenovo ThinkPad P16s G2 21K9000CGE | |
| Lenovo ThinkPad P16 Gen 2 | |
| Average Intel Core i7-14700HX (11704 - 14434, n=7) | |
| Lenovo ThinkPad P16 G1 RTX A5500 | |
| Lenovo ThinkPad P16 G2 21FA000FGE | |
| Dell Precision 5690 | |
| AIDA64 / FPU Mandel | |
| HP ZBook Power 16 G11 A | |
| Lenovo ThinkPad P16s G2 21K9000CGE | |
| Lenovo ThinkPad P16 Gen 2 | |
| Average Intel Core i7-14700HX (42125 - 58380, n=7) | |
| Dell Precision 5690 | |
| Lenovo ThinkPad P16 G1 RTX A5500 | |
| Lenovo ThinkPad P16 G2 21FA000FGE | |
| AIDA64 / CPU AES | |
| Lenovo ThinkPad P16 Gen 2 | |
| Average Intel Core i7-14700HX (82161 - 113157, n=7) | |
| Dell Precision 5690 | |
| Lenovo ThinkPad P16 G2 21FA000FGE | |
| Lenovo ThinkPad P16 G1 RTX A5500 | |
| HP ZBook Power 16 G11 A | |
| Lenovo ThinkPad P16s G2 21K9000CGE | |
| AIDA64 / CPU ZLib | |
| Lenovo ThinkPad P16 Gen 2 | |
| Average Intel Core i7-14700HX (1177 - 1682, n=7) | |
| Dell Precision 5690 | |
| Lenovo ThinkPad P16 G1 RTX A5500 | |
| Lenovo ThinkPad P16 G2 21FA000FGE | |
| HP ZBook Power 16 G11 A | |
| Lenovo ThinkPad P16s G2 21K9000CGE | |
| AIDA64 / FP64 Ray-Trace | |
| HP ZBook Power 16 G11 A | |
| Lenovo ThinkPad P16s G2 21K9000CGE | |
| Average Intel Core i7-14700HX (9029 - 12928, n=7) | |
| Lenovo ThinkPad P16 Gen 2 | |
| Lenovo ThinkPad P16 G1 RTX A5500 | |
| Lenovo ThinkPad P16 G2 21FA000FGE | |
| Dell Precision 5690 | |
| AIDA64 / CPU PhotoWorxx | |
| Dell Precision 5690 | |
| Average Intel Core i7-14700HX (39151 - 49671, n=7) | |
| Lenovo ThinkPad P16 G1 RTX A5500 | |
| HP ZBook Power 16 G11 A | |
| Lenovo ThinkPad P16 Gen 2 | |
| Lenovo ThinkPad P16s G2 21K9000CGE | |
| Lenovo ThinkPad P16 G2 21FA000FGE | |
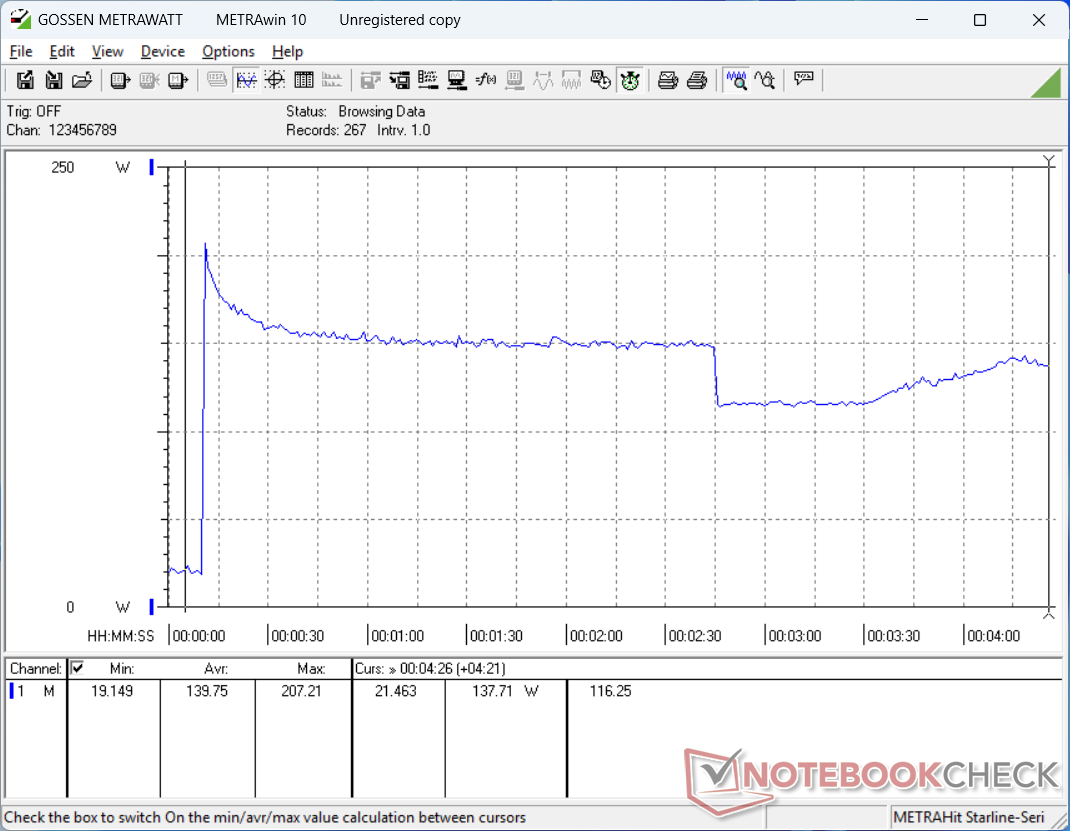
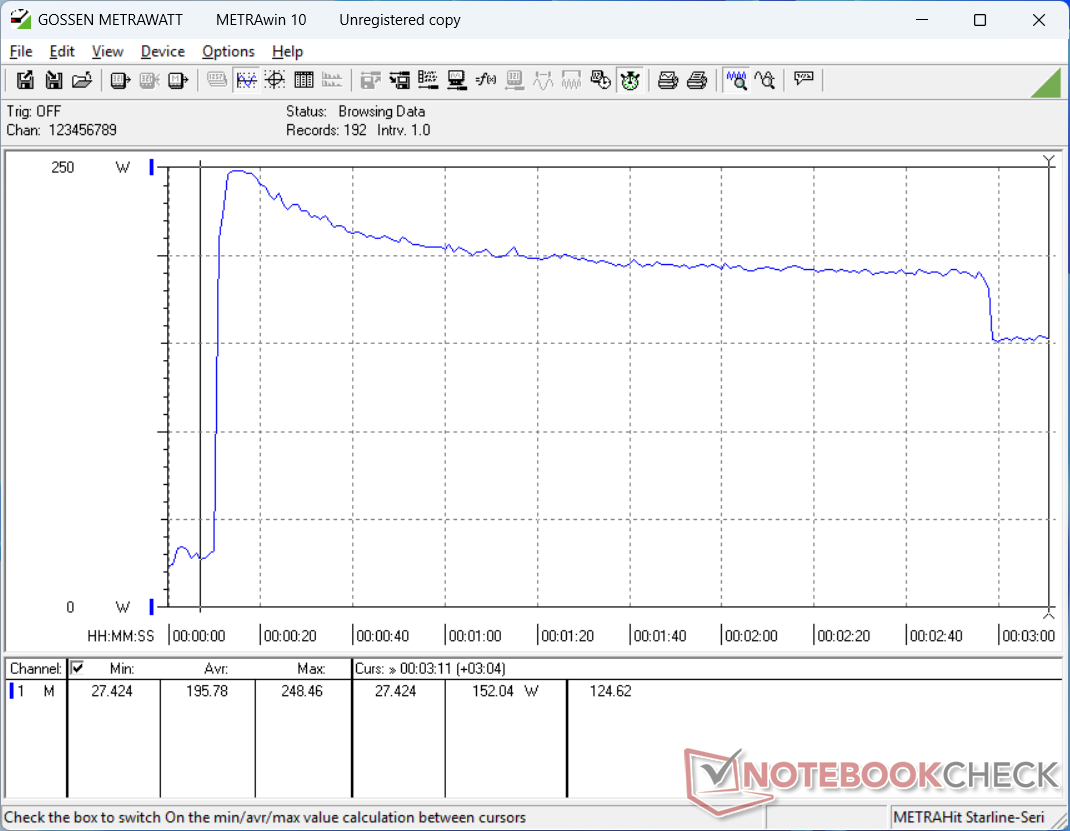
压力测试
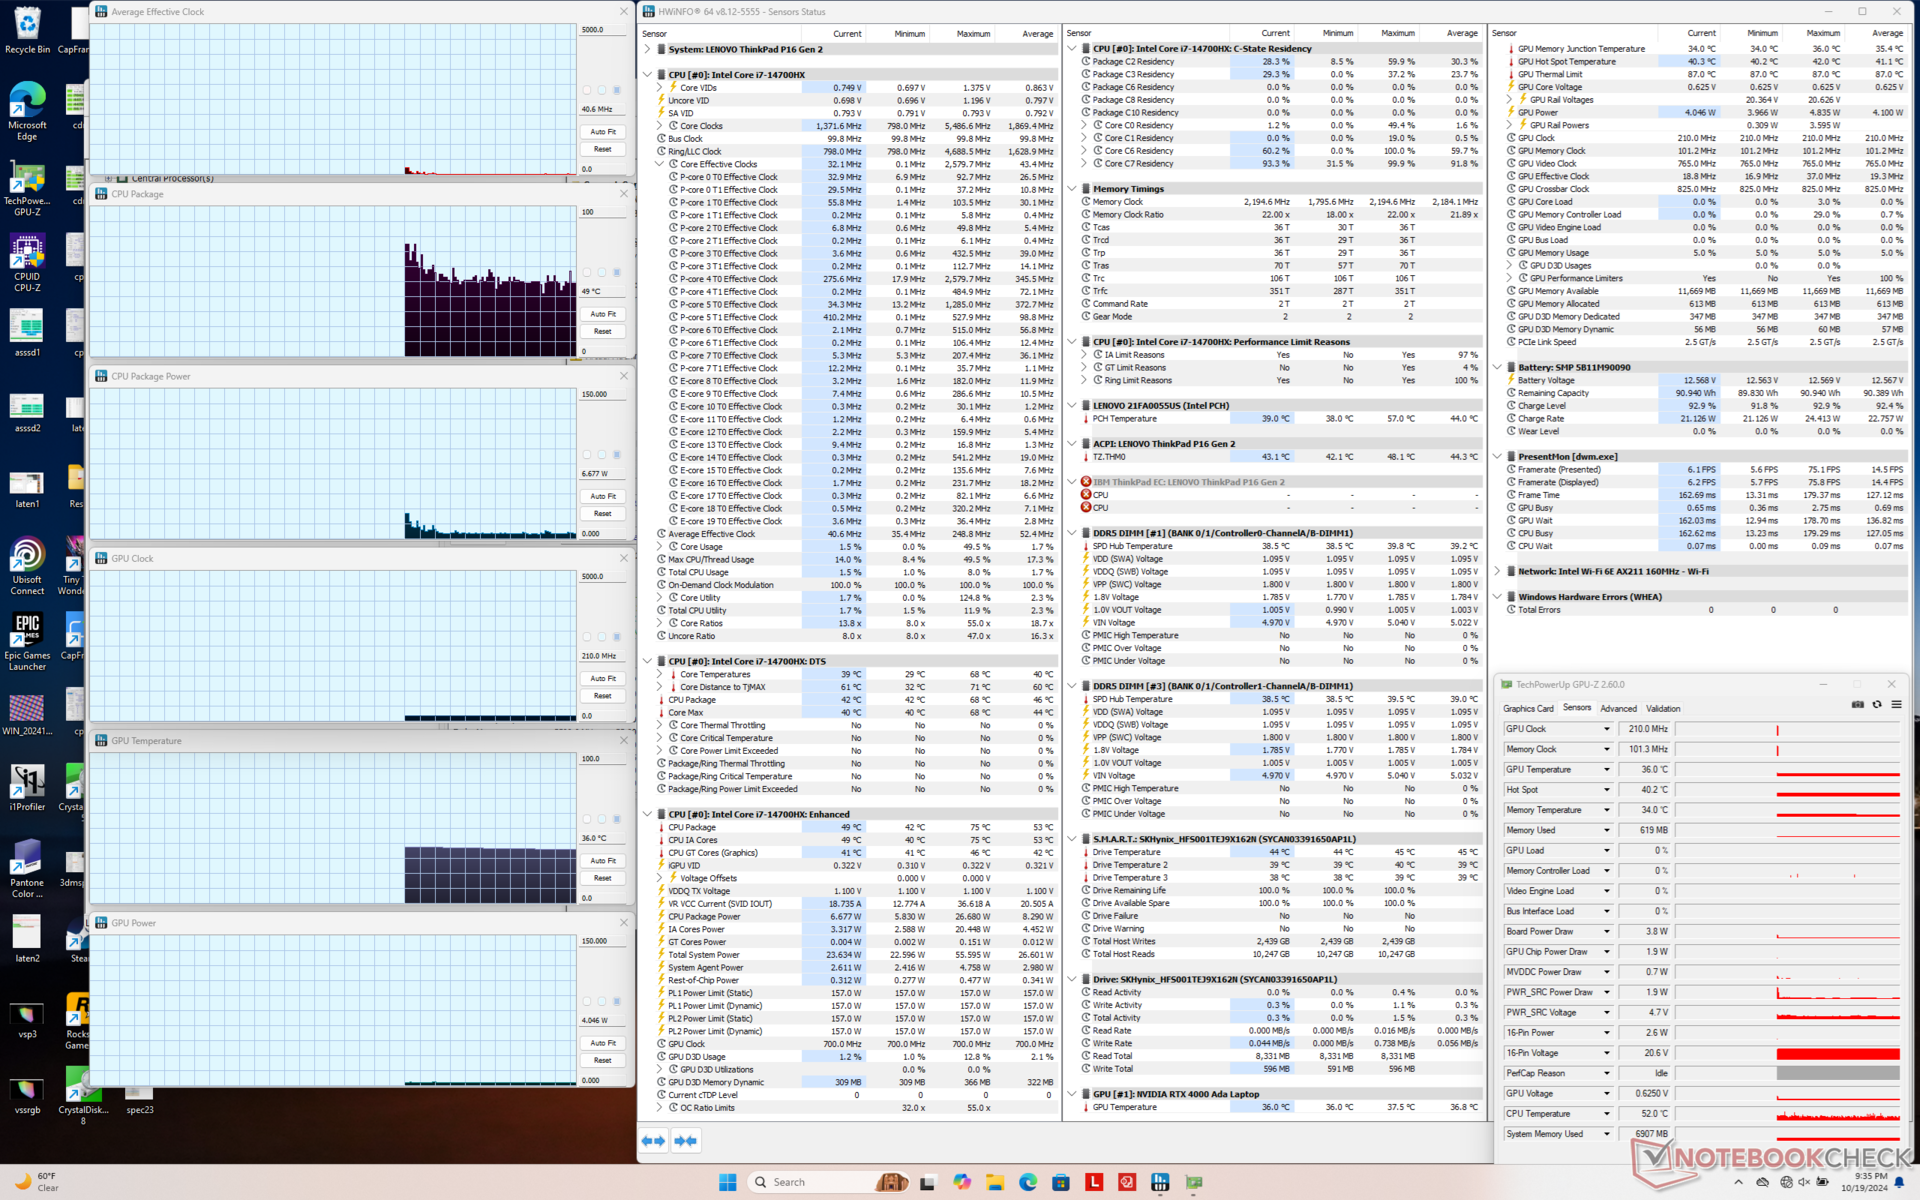
当系统处于紧张状态时,内核温度会很高,导致表面温度很高,这一点在下面的 "温度 "部分会提到。例如,在运行 Prime95 或赛博朋克 2077 时,CPU 的温度会超过 80 摄氏度,有时甚至达到 100 摄氏度。
在性能模式下运行《赛博朋克 2077》时,GPU 板功耗可达到所宣传的 130 W。不过,GPU 的温度会相对较高,超过 85 摄氏度,因此帧速率最终会下降,这在我们的 GPU 性能部分有所提及。如果改用平衡模式进行游戏,核心时钟、内存时钟和主板功耗会进一步下降。
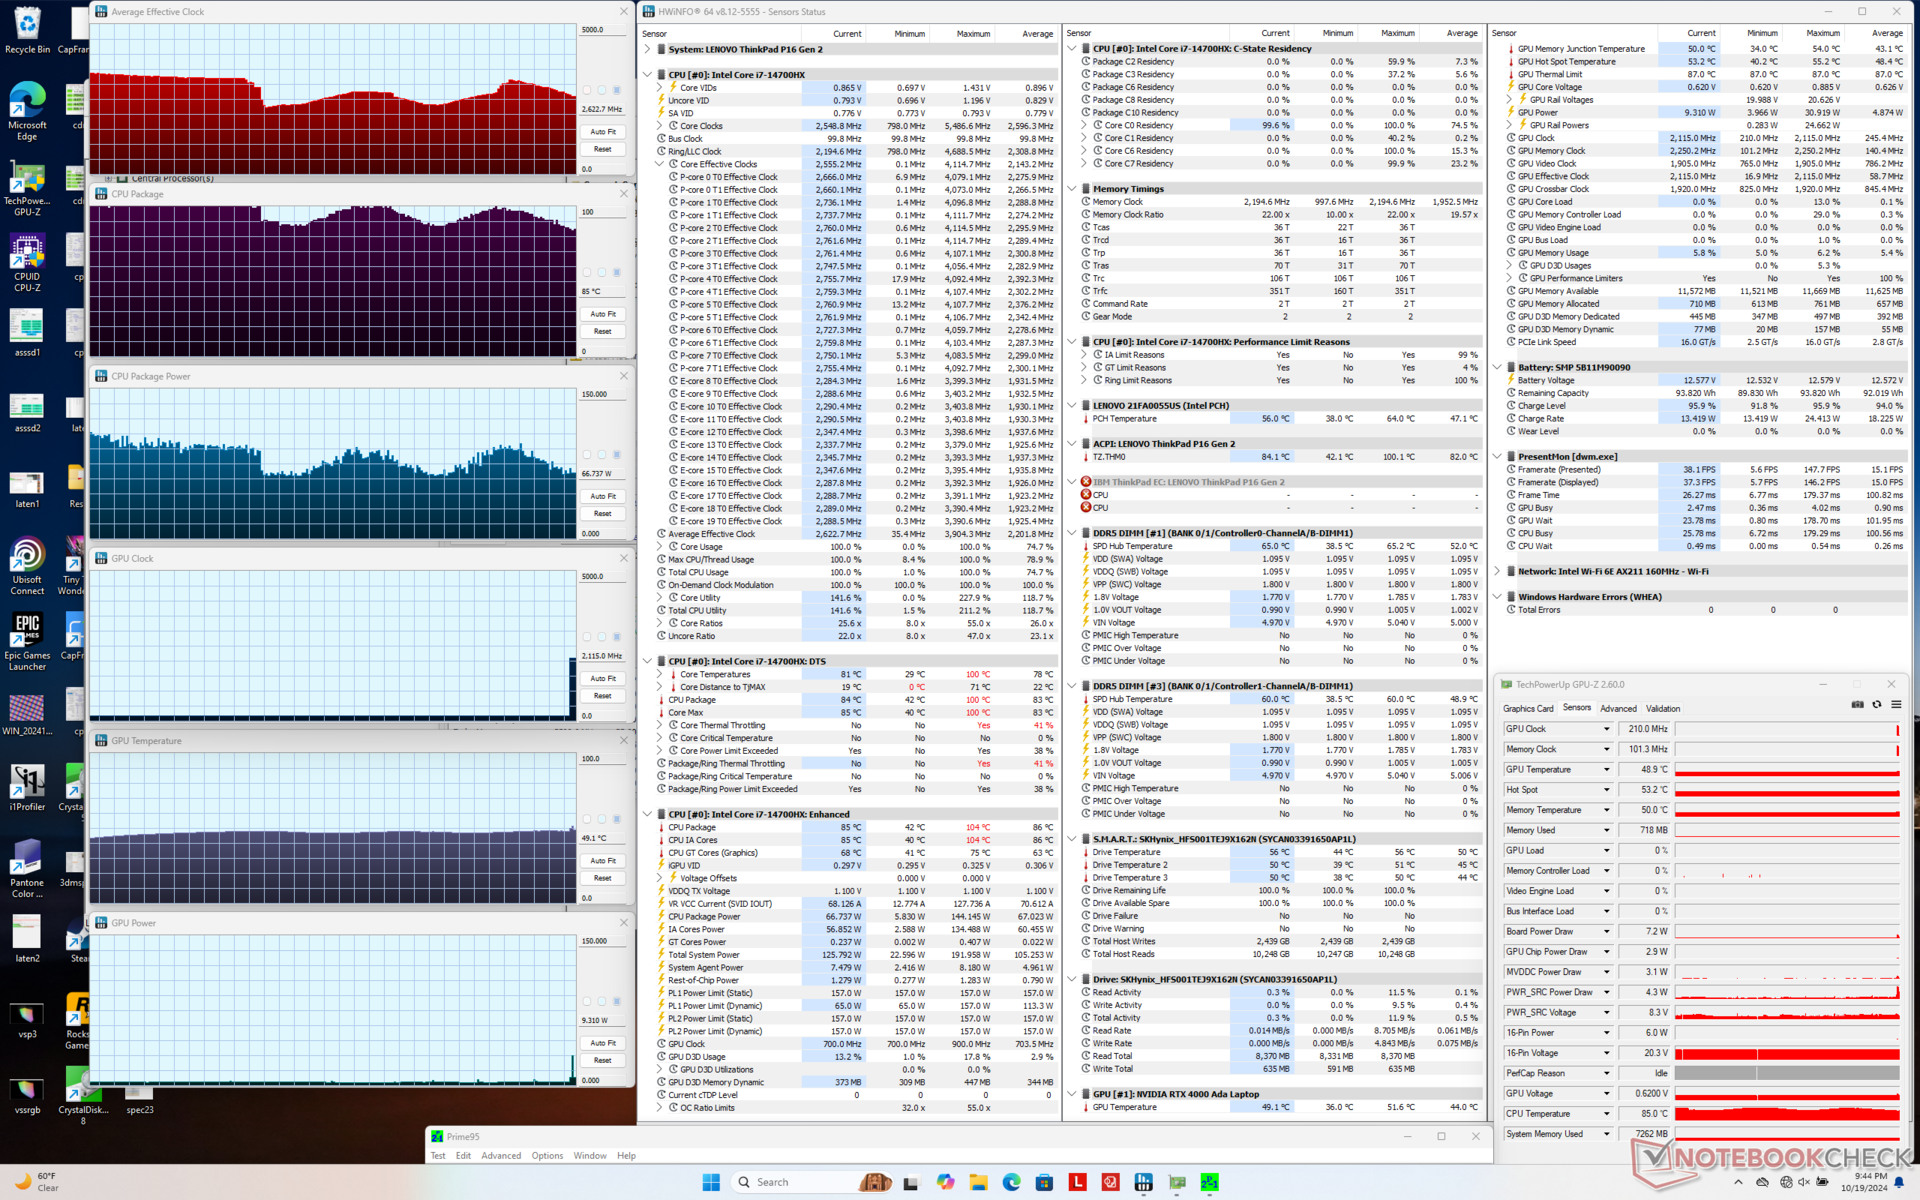
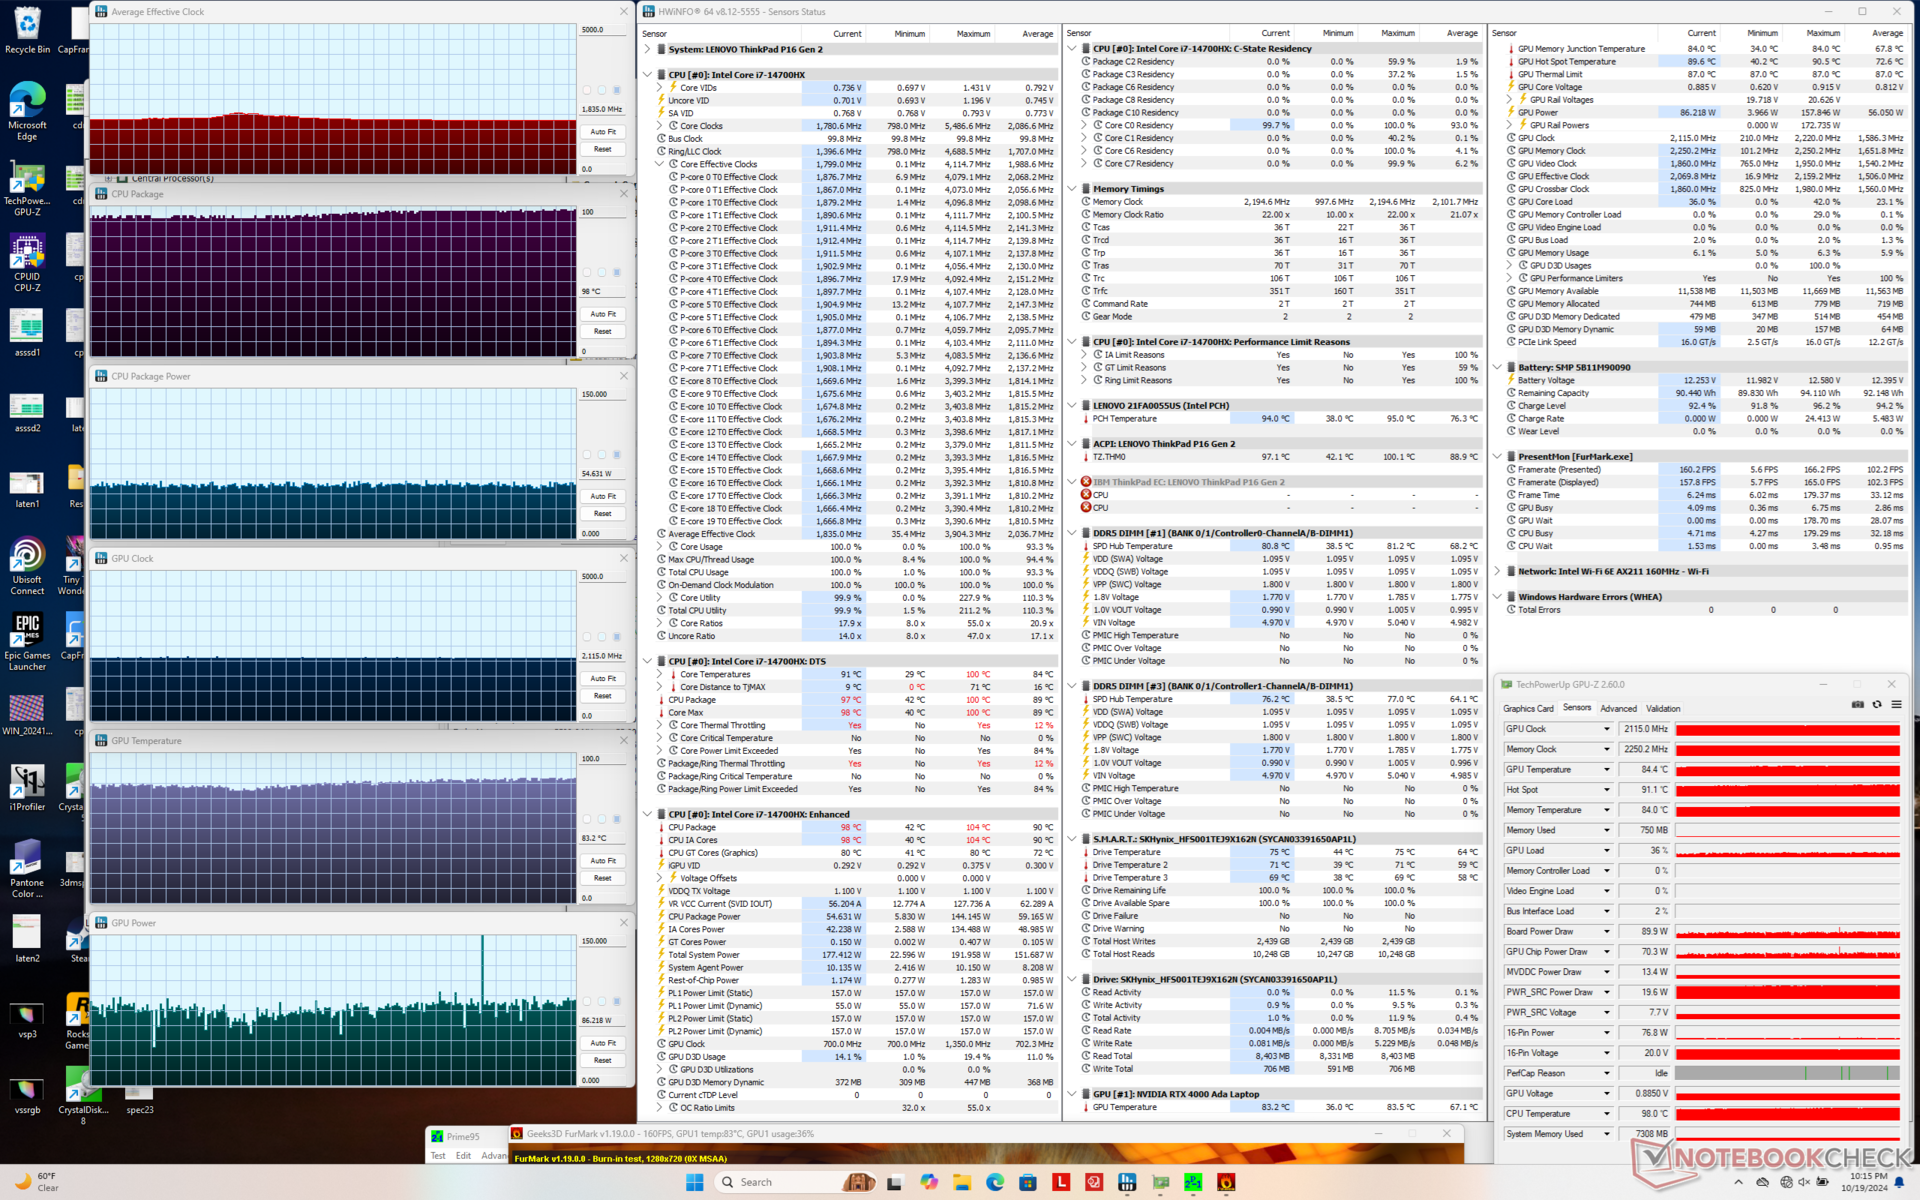
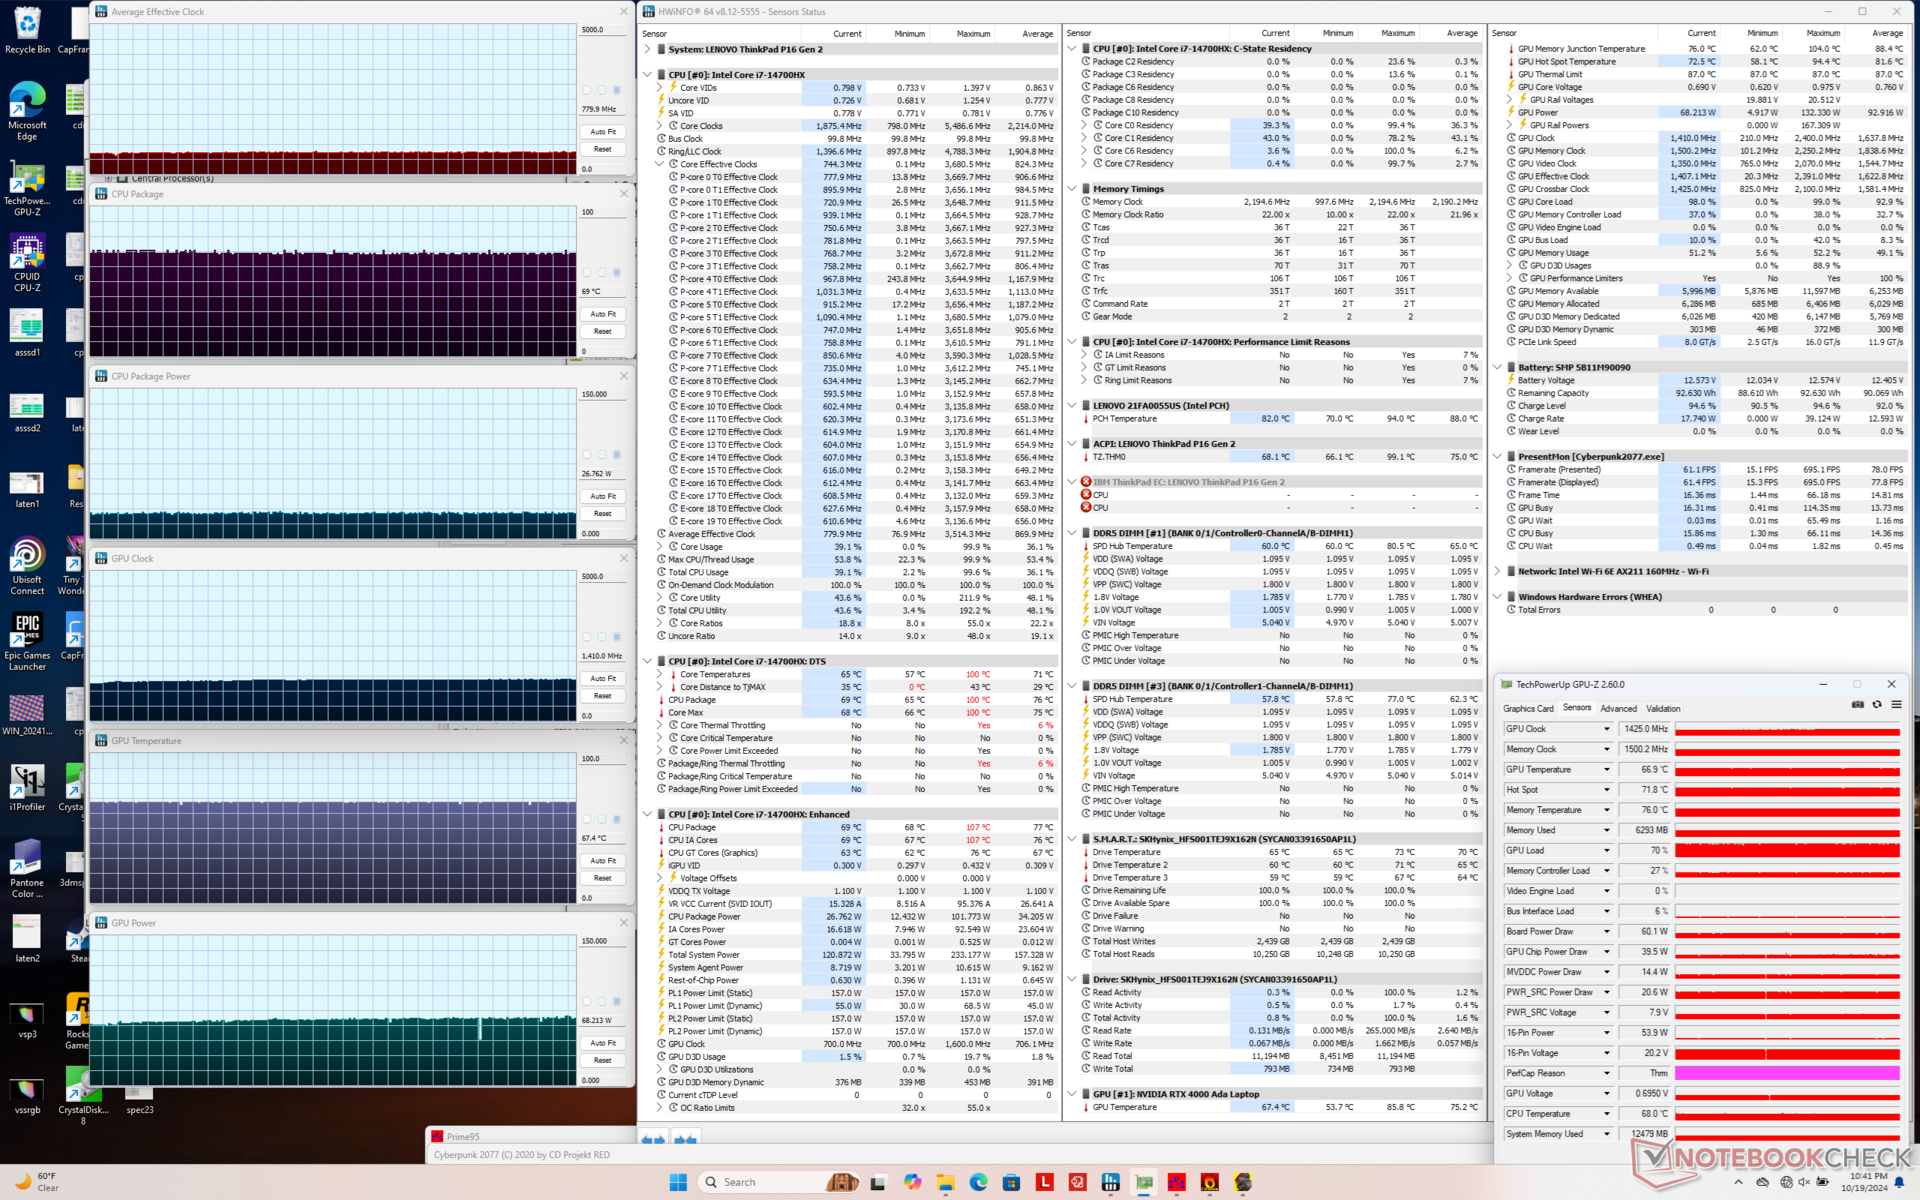
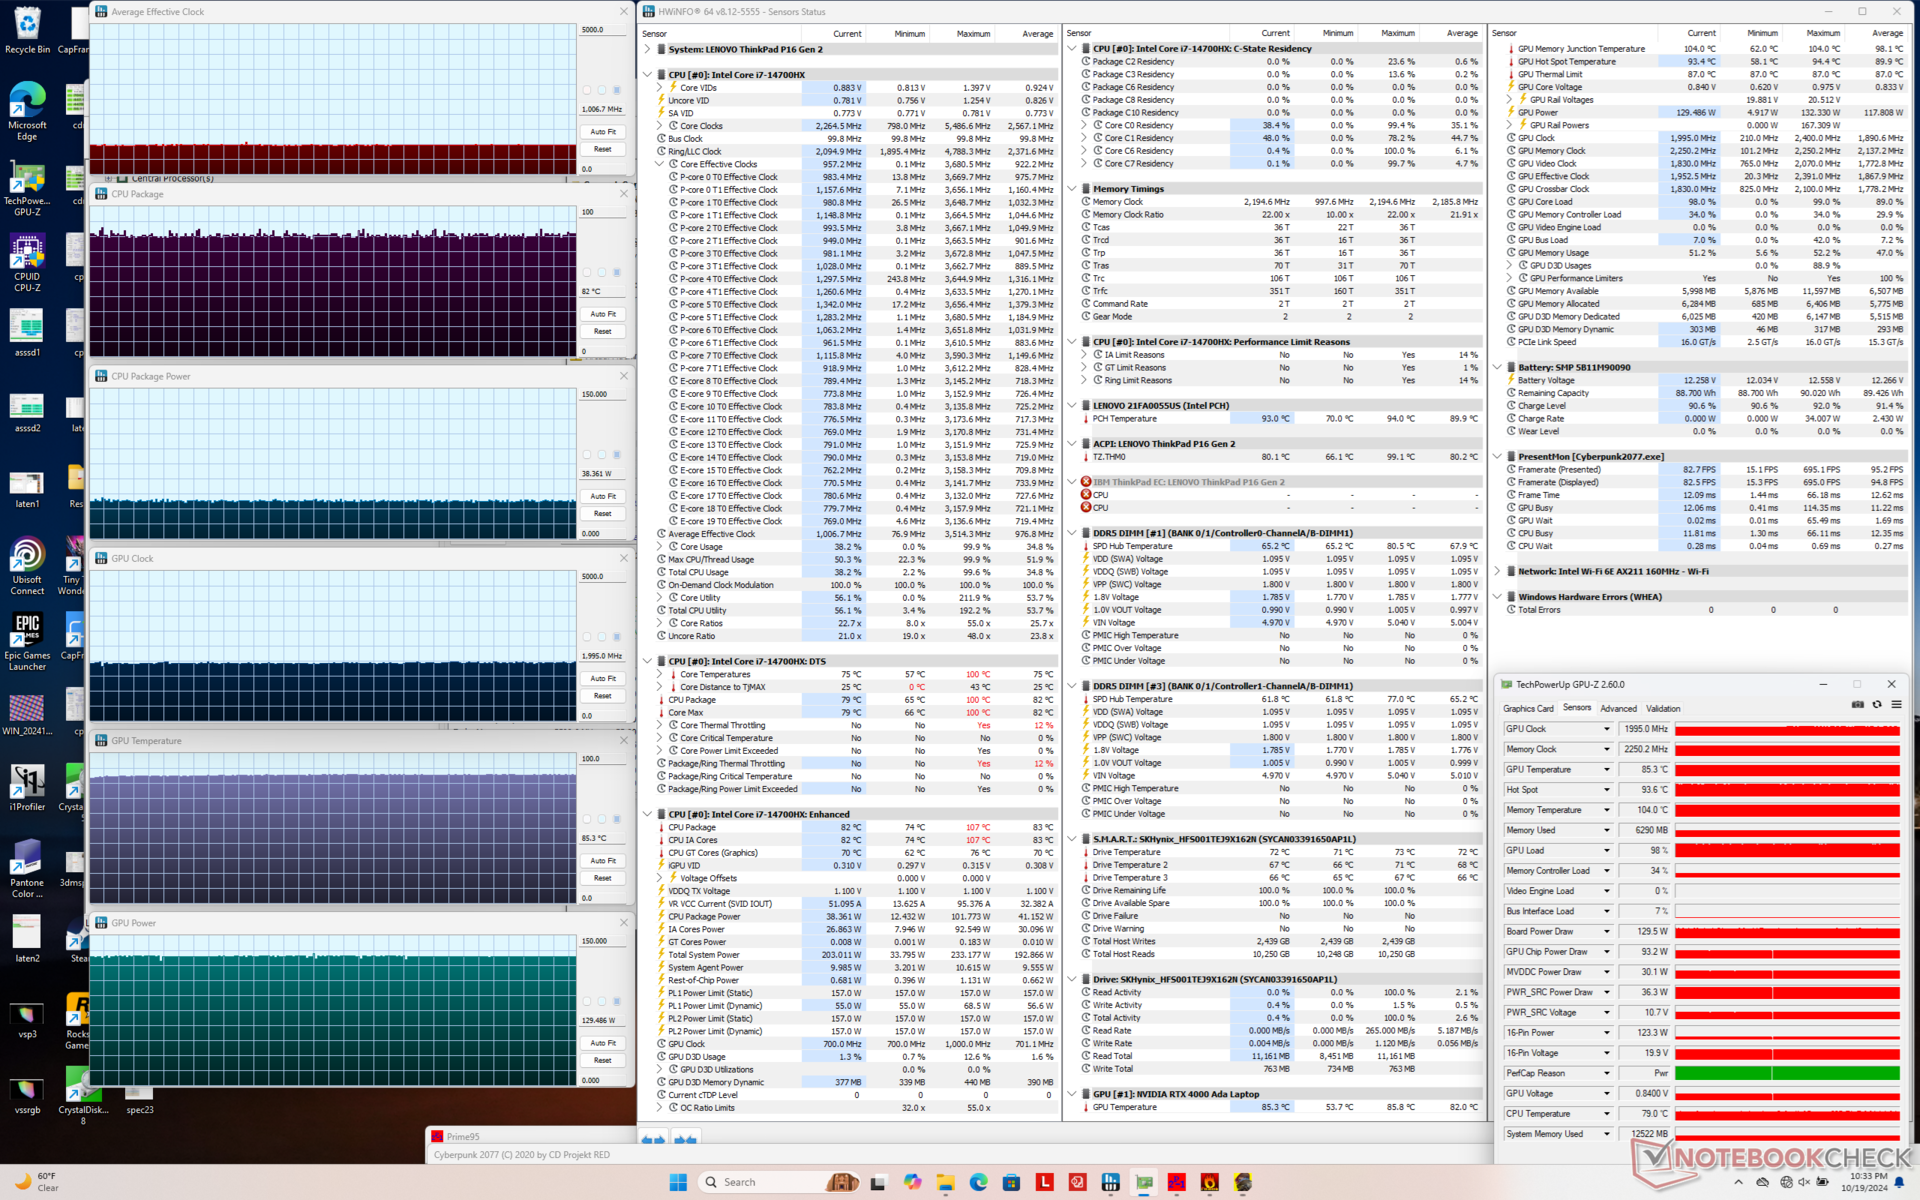
| CPU 时钟 (GHz) | GPU 时钟 (MHz) | CPU 平均温度 (°C) | GPU 平均温度 (°C) | |
| 系统闲置 | -- | -- | 49 | 36 |
| Prime95 压力 | 2.6 - 3.1 | -- | 85 - 100 | 49 |
| Prime95 + FurMark Stress | 1.8 | 2115 | 98 | 83 |
| 赛博朋克 2077》压力(平衡模式) | 0.8 | 1425 | 69 | 67 |
| 赛博朋克 2077》压力(性能模式) | 1.0 | 1995 | 82 | 85 |
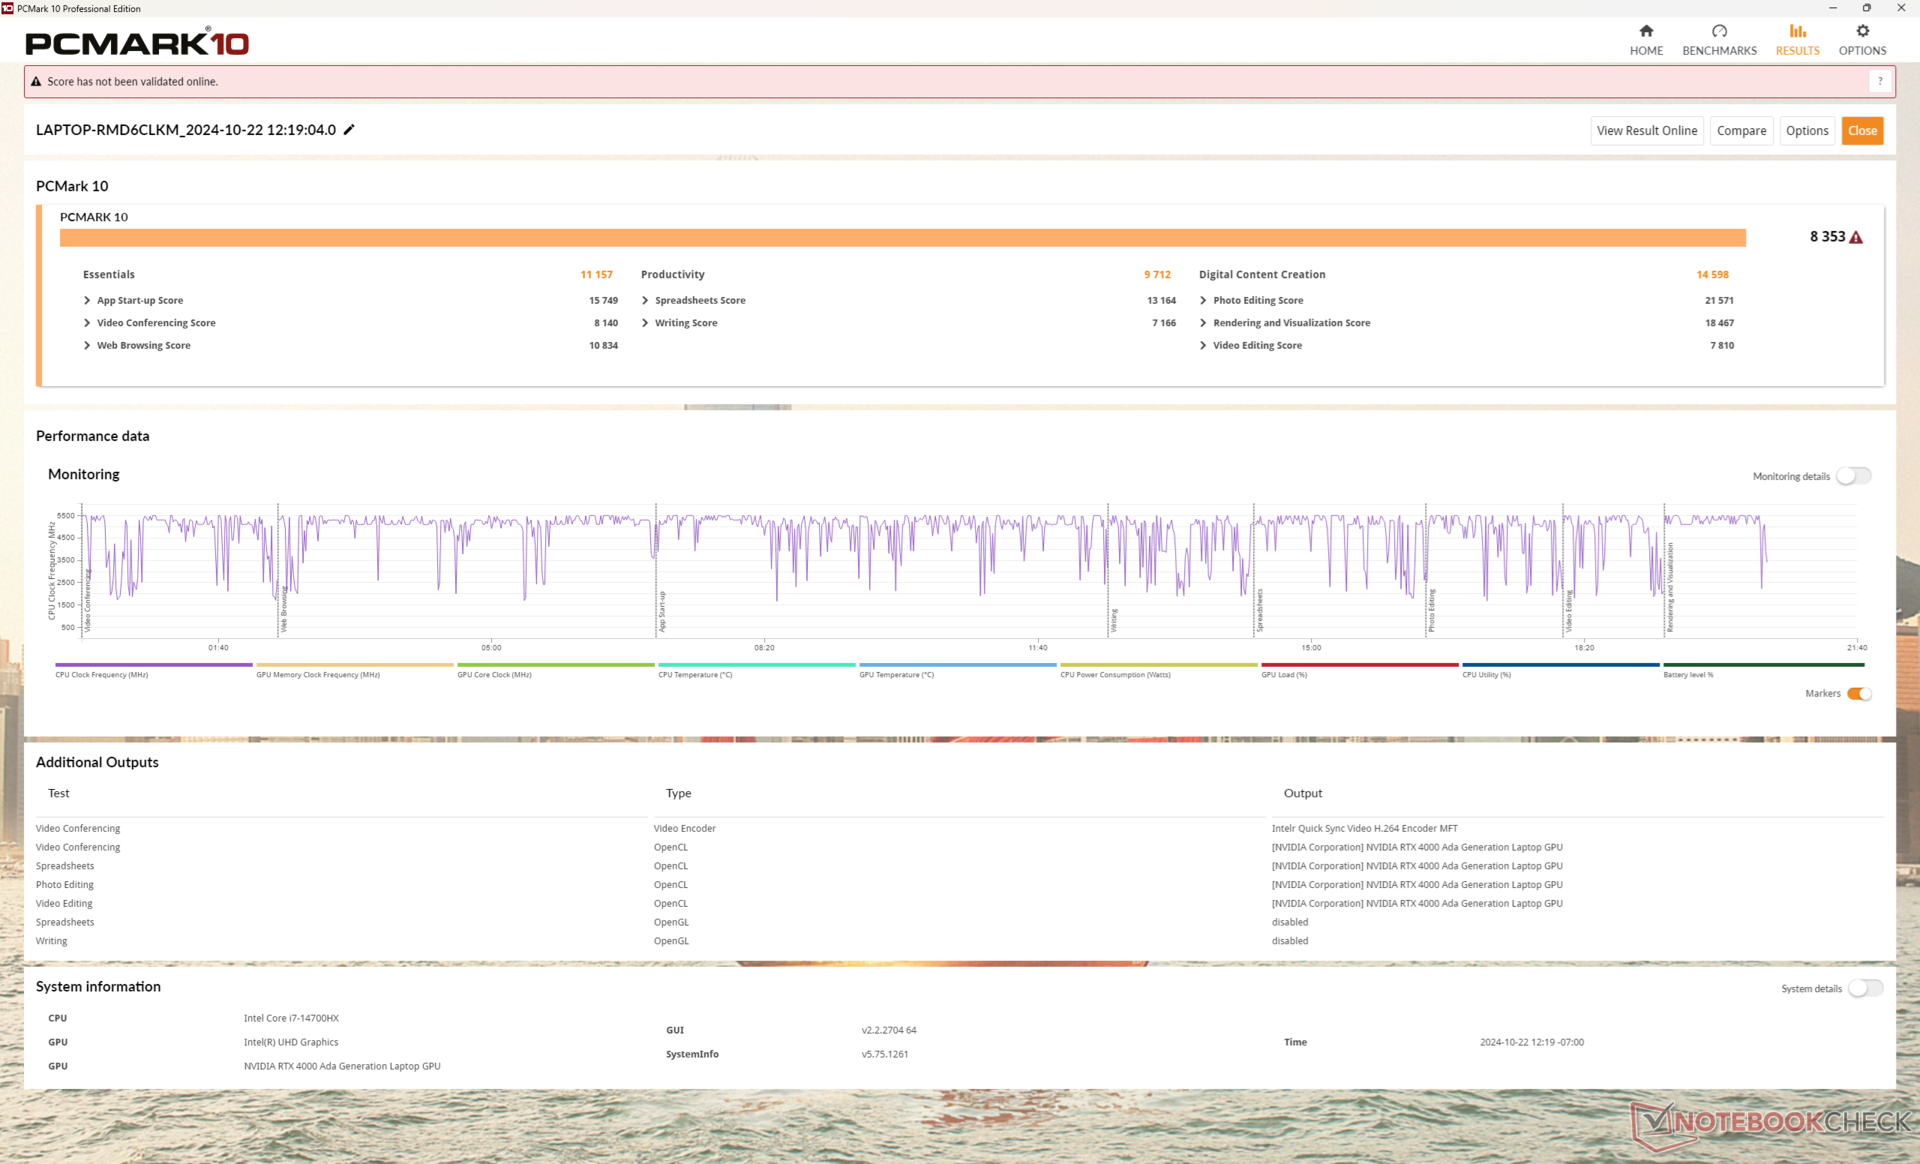
系统性能
CrossMark: Overall | Productivity | Creativity | Responsiveness
WebXPRT 3: Overall
WebXPRT 4: Overall
Mozilla Kraken 1.1: Total
| PCMark 10 / Score | |
| Lenovo ThinkPad P16 Gen 2 | |
| Average Intel Core i7-14700HX, NVIDIA RTX 4000 Ada Generation Laptop GPU (n=1) | |
| Dell Precision 5690 | |
| HP ZBook Power 16 G11 A | |
| Lenovo ThinkPad P16 G1 RTX A5500 | |
| Lenovo ThinkPad P16 G2 21FA000FGE | |
| Lenovo ThinkPad P16s G2 21K9000CGE | |
| PCMark 10 / Essentials | |
| Lenovo ThinkPad P16 Gen 2 | |
| Average Intel Core i7-14700HX, NVIDIA RTX 4000 Ada Generation Laptop GPU (n=1) | |
| Dell Precision 5690 | |
| Lenovo ThinkPad P16 G2 21FA000FGE | |
| Lenovo ThinkPad P16 G1 RTX A5500 | |
| HP ZBook Power 16 G11 A | |
| Lenovo ThinkPad P16s G2 21K9000CGE | |
| PCMark 10 / Productivity | |
| Dell Precision 5690 | |
| Lenovo ThinkPad P16 Gen 2 | |
| Average Intel Core i7-14700HX, NVIDIA RTX 4000 Ada Generation Laptop GPU (n=1) | |
| HP ZBook Power 16 G11 A | |
| Lenovo ThinkPad P16 G1 RTX A5500 | |
| Lenovo ThinkPad P16 G2 21FA000FGE | |
| Lenovo ThinkPad P16s G2 21K9000CGE | |
| PCMark 10 / Digital Content Creation | |
| Lenovo ThinkPad P16 Gen 2 | |
| Average Intel Core i7-14700HX, NVIDIA RTX 4000 Ada Generation Laptop GPU (n=1) | |
| Dell Precision 5690 | |
| HP ZBook Power 16 G11 A | |
| Lenovo ThinkPad P16 G1 RTX A5500 | |
| Lenovo ThinkPad P16 G2 21FA000FGE | |
| Lenovo ThinkPad P16s G2 21K9000CGE | |
| CrossMark / Overall | |
| Lenovo ThinkPad P16 Gen 2 | |
| Average Intel Core i7-14700HX, NVIDIA RTX 4000 Ada Generation Laptop GPU (n=1) | |
| Lenovo ThinkPad P16 G1 RTX A5500 | |
| Lenovo ThinkPad P16 G2 21FA000FGE | |
| Dell Precision 5690 | |
| HP ZBook Power 16 G11 A | |
| Lenovo ThinkPad P16s G2 21K9000CGE | |
| CrossMark / Productivity | |
| Lenovo ThinkPad P16 Gen 2 | |
| Average Intel Core i7-14700HX, NVIDIA RTX 4000 Ada Generation Laptop GPU (n=1) | |
| Lenovo ThinkPad P16 G1 RTX A5500 | |
| Dell Precision 5690 | |
| Lenovo ThinkPad P16 G2 21FA000FGE | |
| HP ZBook Power 16 G11 A | |
| Lenovo ThinkPad P16s G2 21K9000CGE | |
| CrossMark / Creativity | |
| Lenovo ThinkPad P16 Gen 2 | |
| Average Intel Core i7-14700HX, NVIDIA RTX 4000 Ada Generation Laptop GPU (n=1) | |
| Lenovo ThinkPad P16 G1 RTX A5500 | |
| Lenovo ThinkPad P16 G2 21FA000FGE | |
| HP ZBook Power 16 G11 A | |
| Dell Precision 5690 | |
| Lenovo ThinkPad P16s G2 21K9000CGE | |
| CrossMark / Responsiveness | |
| Lenovo ThinkPad P16 Gen 2 | |
| Average Intel Core i7-14700HX, NVIDIA RTX 4000 Ada Generation Laptop GPU (n=1) | |
| Dell Precision 5690 | |
| Lenovo ThinkPad P16 G1 RTX A5500 | |
| Lenovo ThinkPad P16 G2 21FA000FGE | |
| HP ZBook Power 16 G11 A | |
| Lenovo ThinkPad P16s G2 21K9000CGE | |
| WebXPRT 3 / Overall | |
| Lenovo ThinkPad P16 Gen 2 | |
| Average Intel Core i7-14700HX, NVIDIA RTX 4000 Ada Generation Laptop GPU (n=1) | |
| Lenovo ThinkPad P16 G2 21FA000FGE | |
| Lenovo ThinkPad P16 G1 RTX A5500 | |
| HP ZBook Power 16 G11 A | |
| Dell Precision 5690 | |
| Lenovo ThinkPad P16s G2 21K9000CGE | |
| WebXPRT 4 / Overall | |
| Lenovo ThinkPad P16 Gen 2 | |
| Average Intel Core i7-14700HX, NVIDIA RTX 4000 Ada Generation Laptop GPU (n=1) | |
| Lenovo ThinkPad P16 G1 RTX A5500 | |
| Dell Precision 5690 | |
| HP ZBook Power 16 G11 A | |
| Mozilla Kraken 1.1 / Total | |
| Lenovo ThinkPad P16s G2 21K9000CGE | |
| HP ZBook Power 16 G11 A | |
| Dell Precision 5690 | |
| Lenovo ThinkPad P16 G1 RTX A5500 | |
| Lenovo ThinkPad P16 G2 21FA000FGE | |
| Lenovo ThinkPad P16 Gen 2 | |
| Average Intel Core i7-14700HX, NVIDIA RTX 4000 Ada Generation Laptop GPU (n=1) | |
* ... smaller is better
| PCMark 10 Score | 8353 points | |
Help | ||
| AIDA64 / Memory Copy | |
| Dell Precision 5690 | |
| Average Intel Core i7-14700HX (63949 - 78742, n=7) | |
| Lenovo ThinkPad P16s G2 21K9000CGE | |
| Lenovo ThinkPad P16 Gen 2 | |
| Lenovo ThinkPad P16 G1 RTX A5500 | |
| HP ZBook Power 16 G11 A | |
| Lenovo ThinkPad P16 G2 21FA000FGE | |
| AIDA64 / Memory Read | |
| Dell Precision 5690 | |
| Average Intel Core i7-14700HX (68593 - 86175, n=7) | |
| Lenovo ThinkPad P16 Gen 2 | |
| Lenovo ThinkPad P16 G1 RTX A5500 | |
| HP ZBook Power 16 G11 A | |
| Lenovo ThinkPad P16 G2 21FA000FGE | |
| Lenovo ThinkPad P16s G2 21K9000CGE | |
| AIDA64 / Memory Write | |
| Lenovo ThinkPad P16s G2 21K9000CGE | |
| HP ZBook Power 16 G11 A | |
| Dell Precision 5690 | |
| Average Intel Core i7-14700HX (64033 - 76689, n=7) | |
| Lenovo ThinkPad P16 Gen 2 | |
| Lenovo ThinkPad P16 G1 RTX A5500 | |
| Lenovo ThinkPad P16 G2 21FA000FGE | |
| AIDA64 / Memory Latency | |
| Dell Precision 5690 | |
| Lenovo ThinkPad P16s G2 21K9000CGE | |
| Lenovo ThinkPad P16 G2 21FA000FGE | |
| HP ZBook Power 16 G11 A | |
| Lenovo ThinkPad P16 Gen 2 | |
| Lenovo ThinkPad P16 G1 RTX A5500 | |
| Average Intel Core i7-14700HX (82.7 - 96.4, n=7) | |
* ... smaller is better
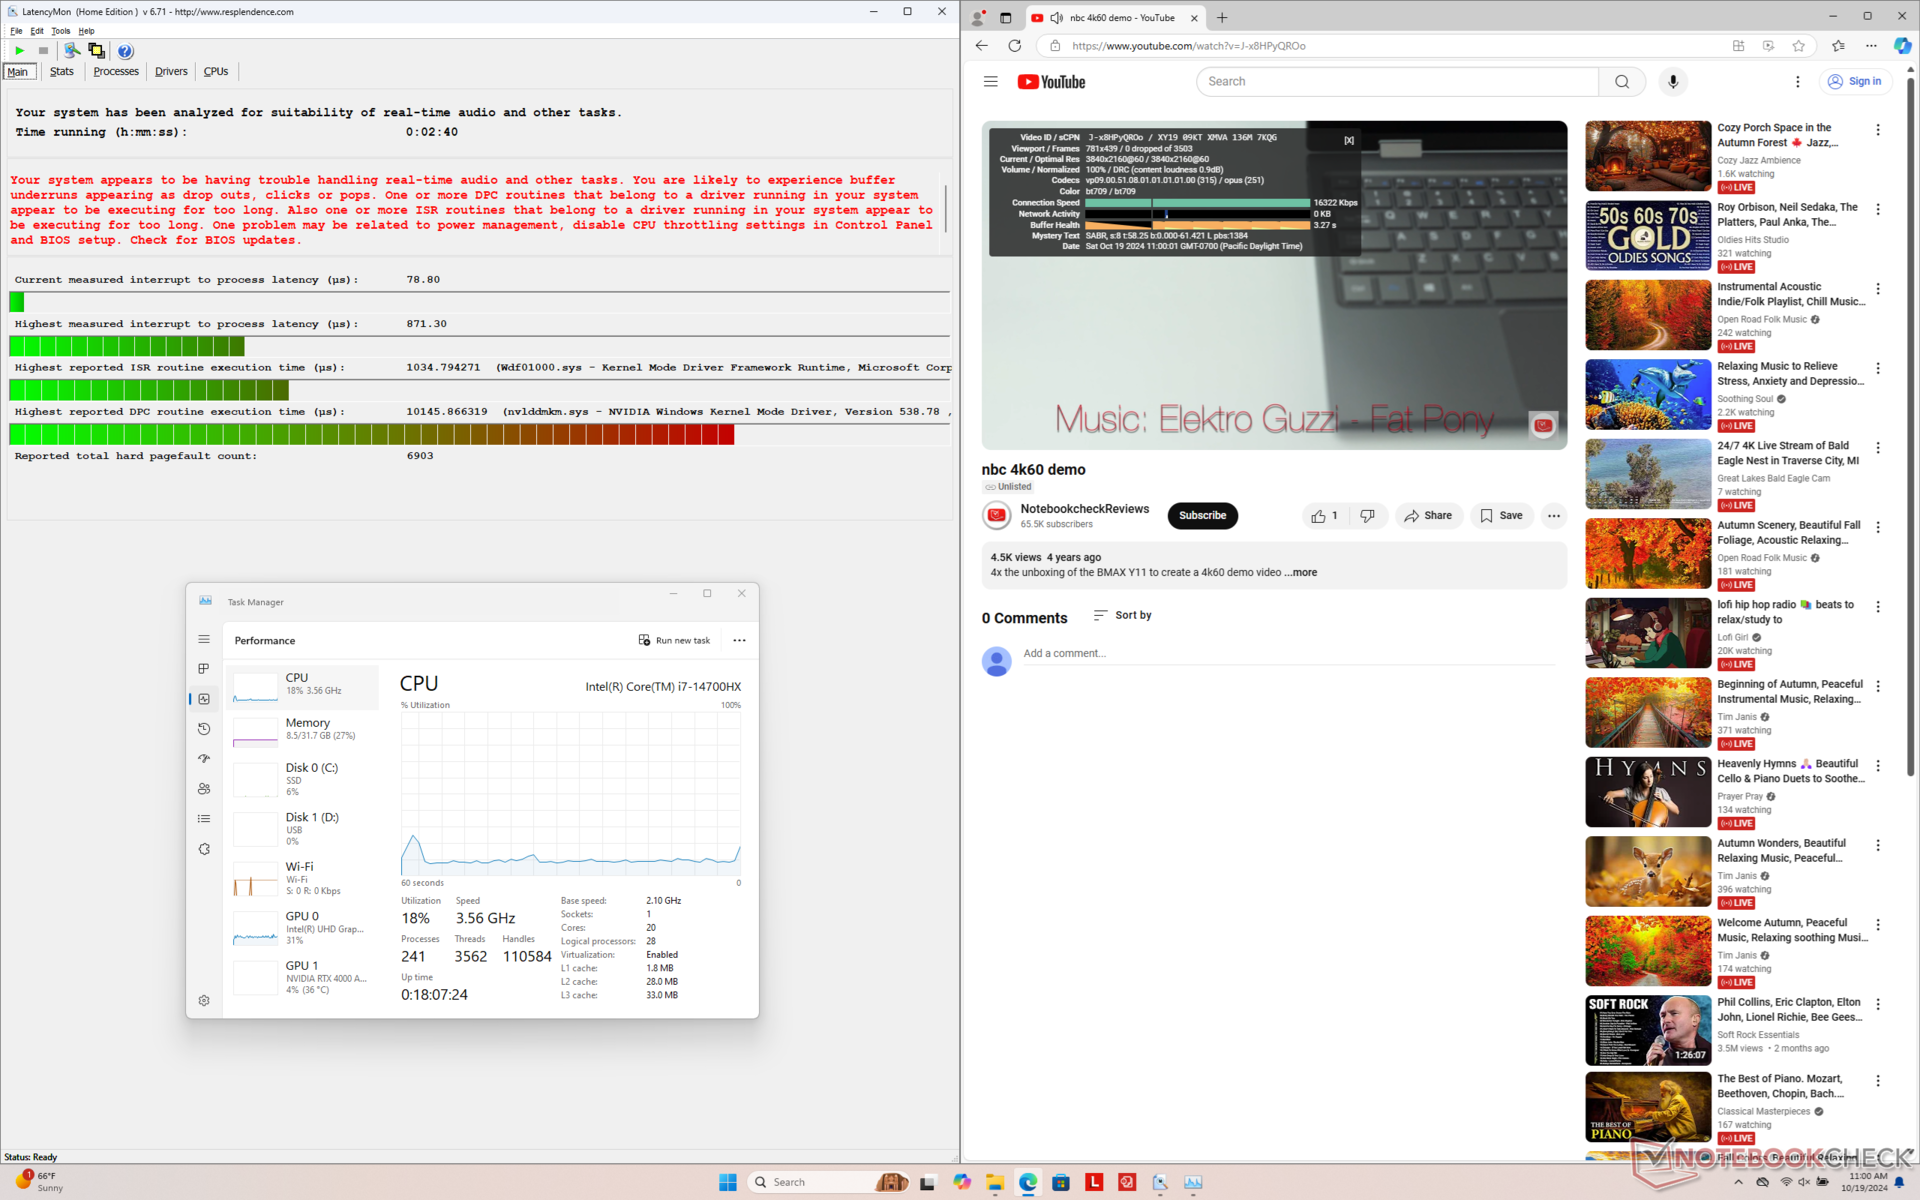
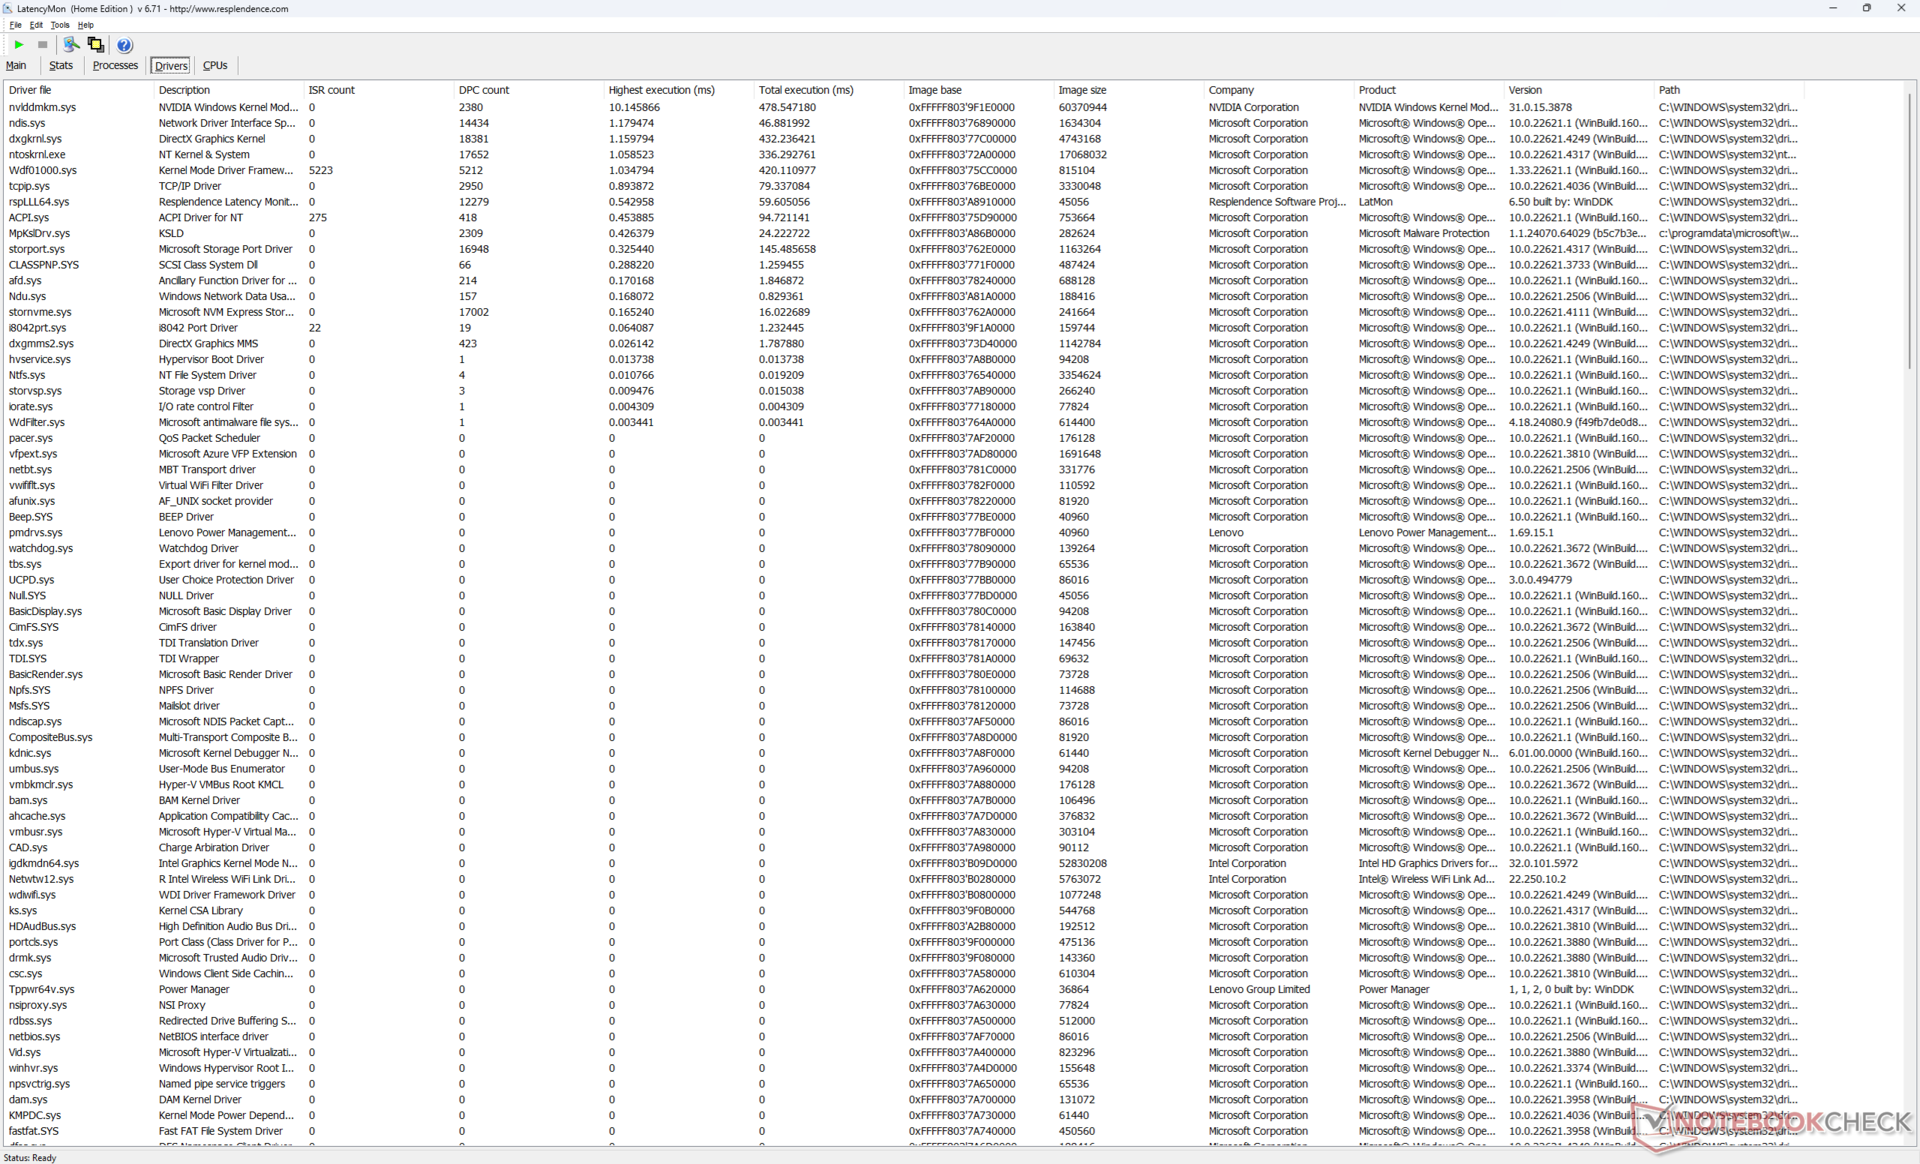
DPC 延迟
在打开我们主页的多个浏览器标签页时,LatencyMon 显示出轻微的 DPC 问题。在其他方面,以 60 FPS 播放 4K 视频也非常完美,没有掉帧记录。
| DPC Latencies / LatencyMon - interrupt to process latency (max), Web, Youtube, Prime95 | |
| HP ZBook Power 16 G11 A | |
| Lenovo ThinkPad P16 G1 RTX A5500 | |
| Lenovo ThinkPad P16s G2 21K9000CGE | |
| Lenovo ThinkPad P16 G2 21FA000FGE | |
| Lenovo ThinkPad P16 Gen 2 | |
| Dell Precision 5690 | |
* ... smaller is better
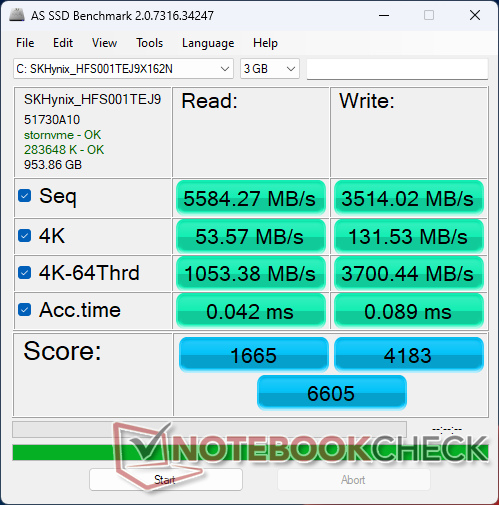
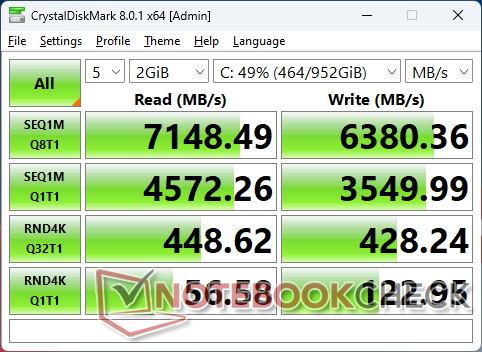
存储设备
在我们的两台 ThinkPad P16 Gen 2 测试机之间,没有观察到存储选项或固态硬盘性能有任何变化。

* ... smaller is better
Disk Throttling: DiskSpd Read Loop, Queue Depth 8
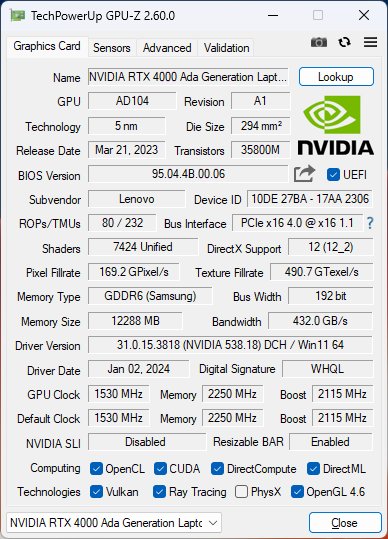
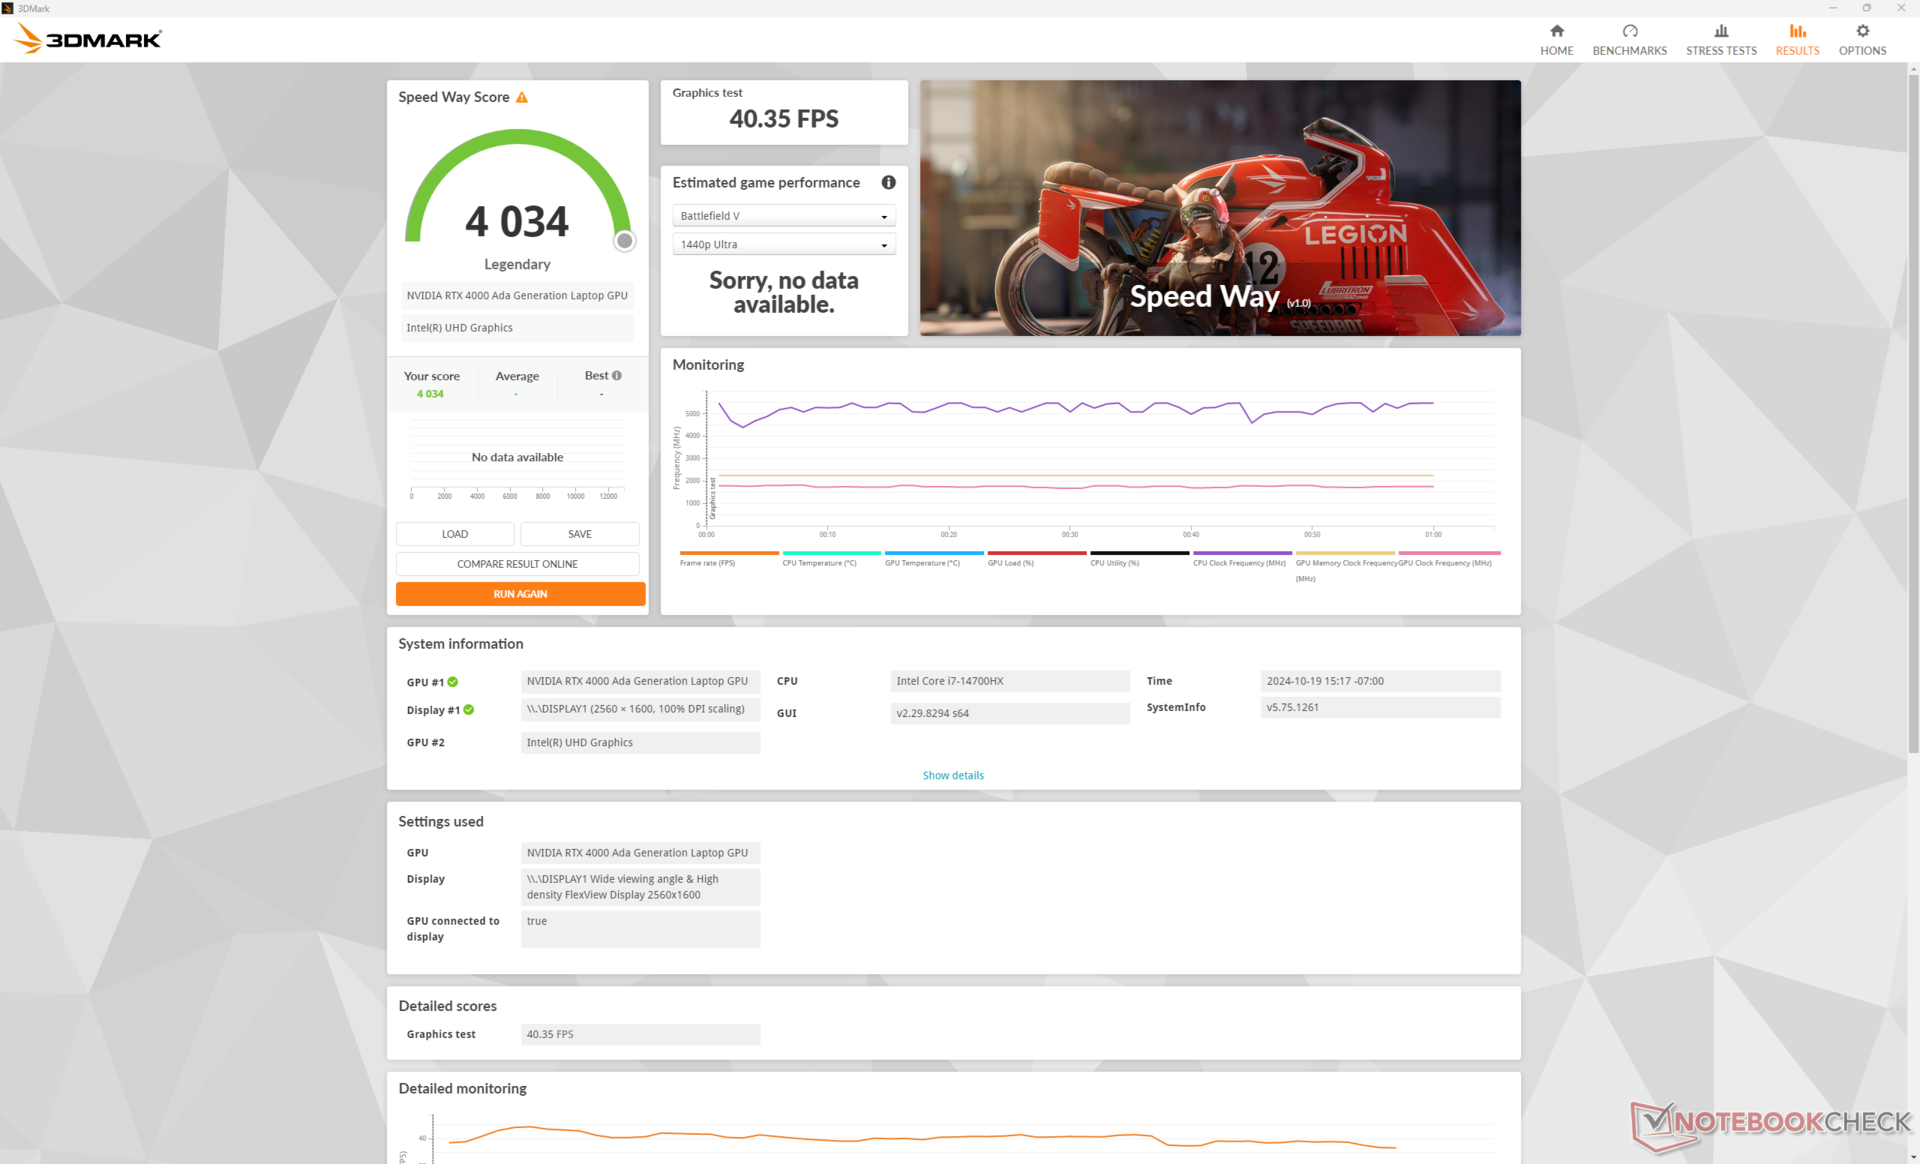
图形处理器性能
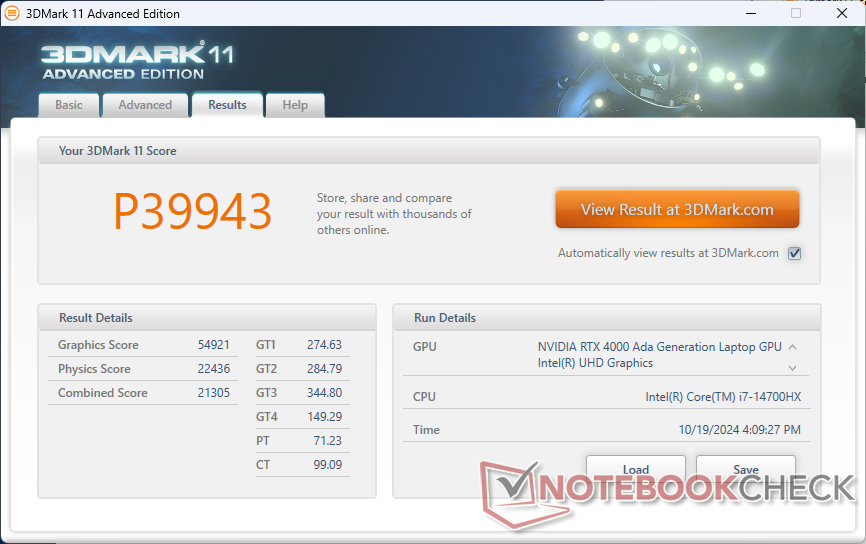
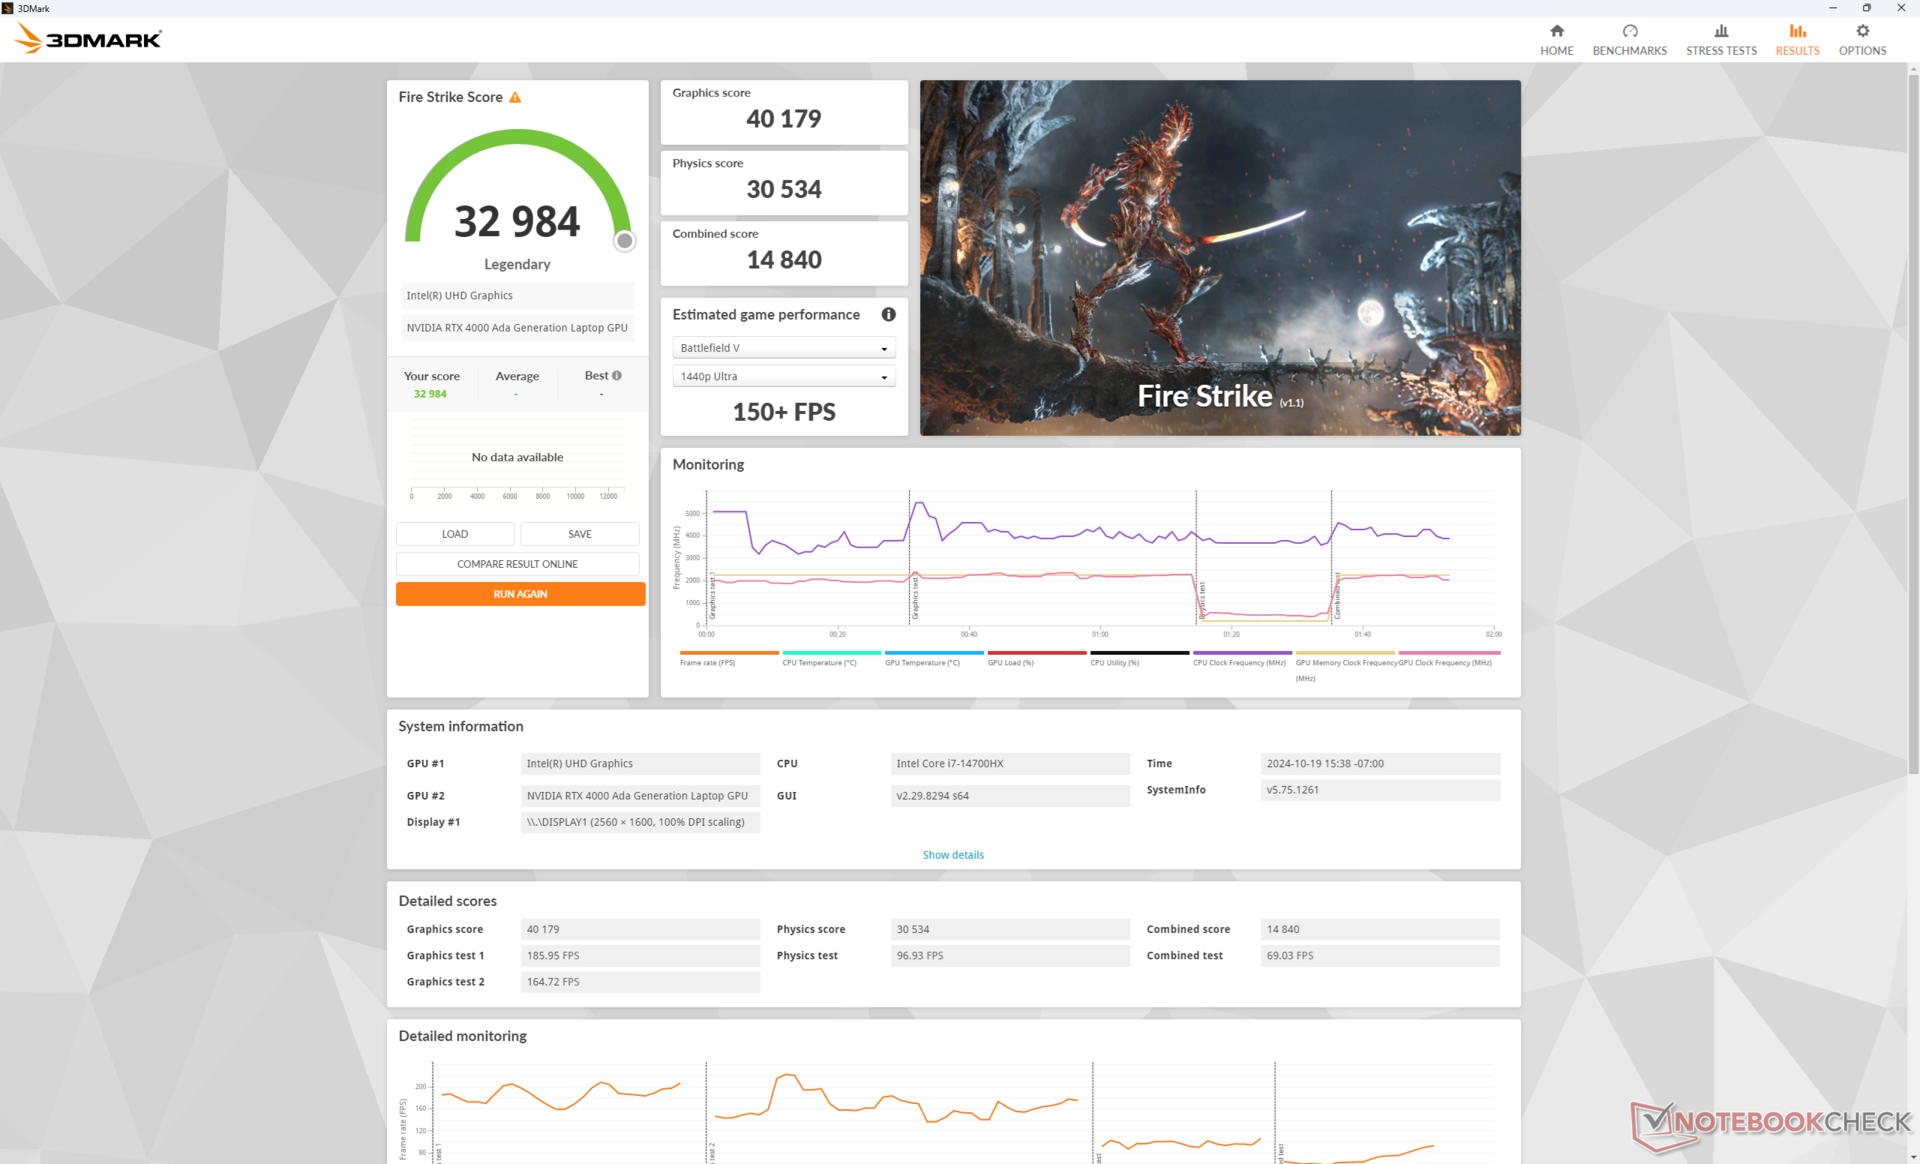
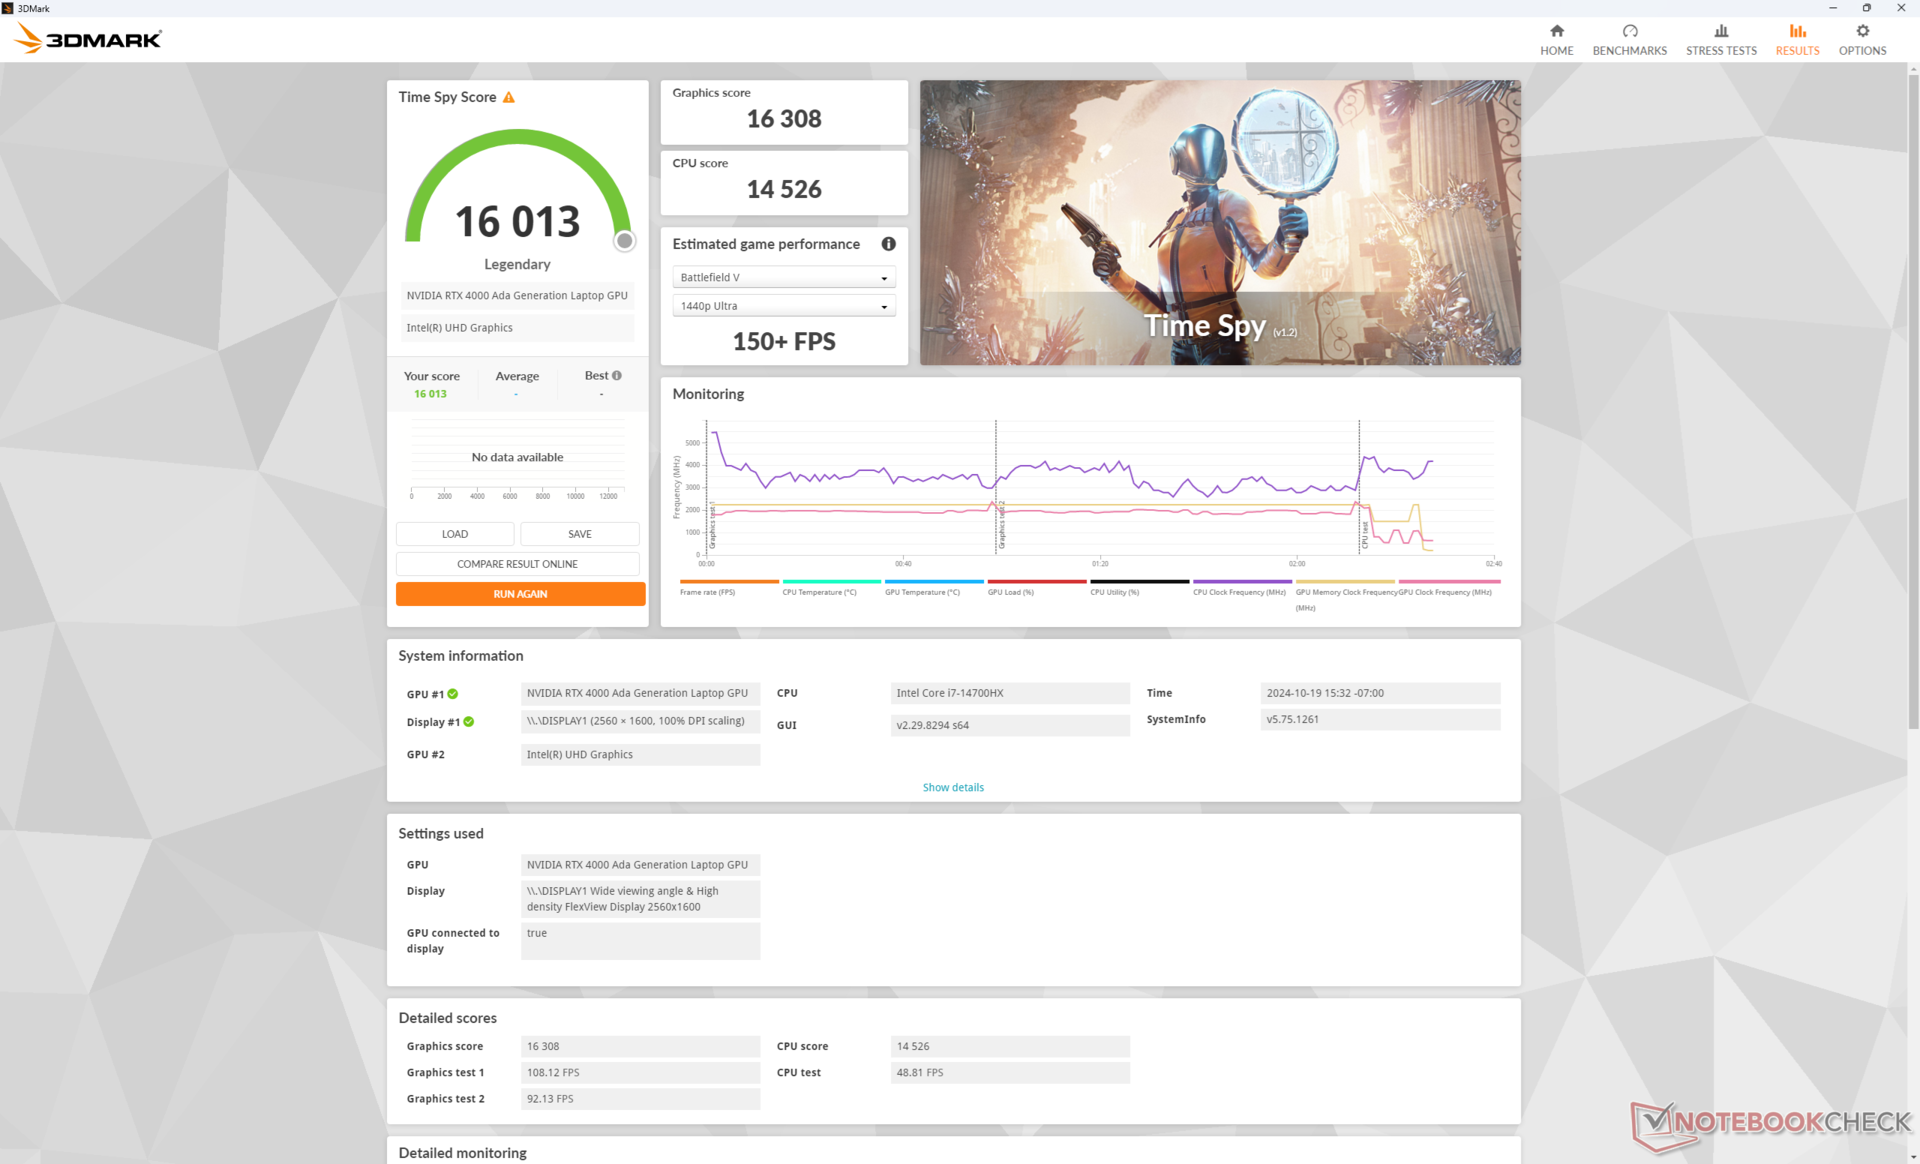
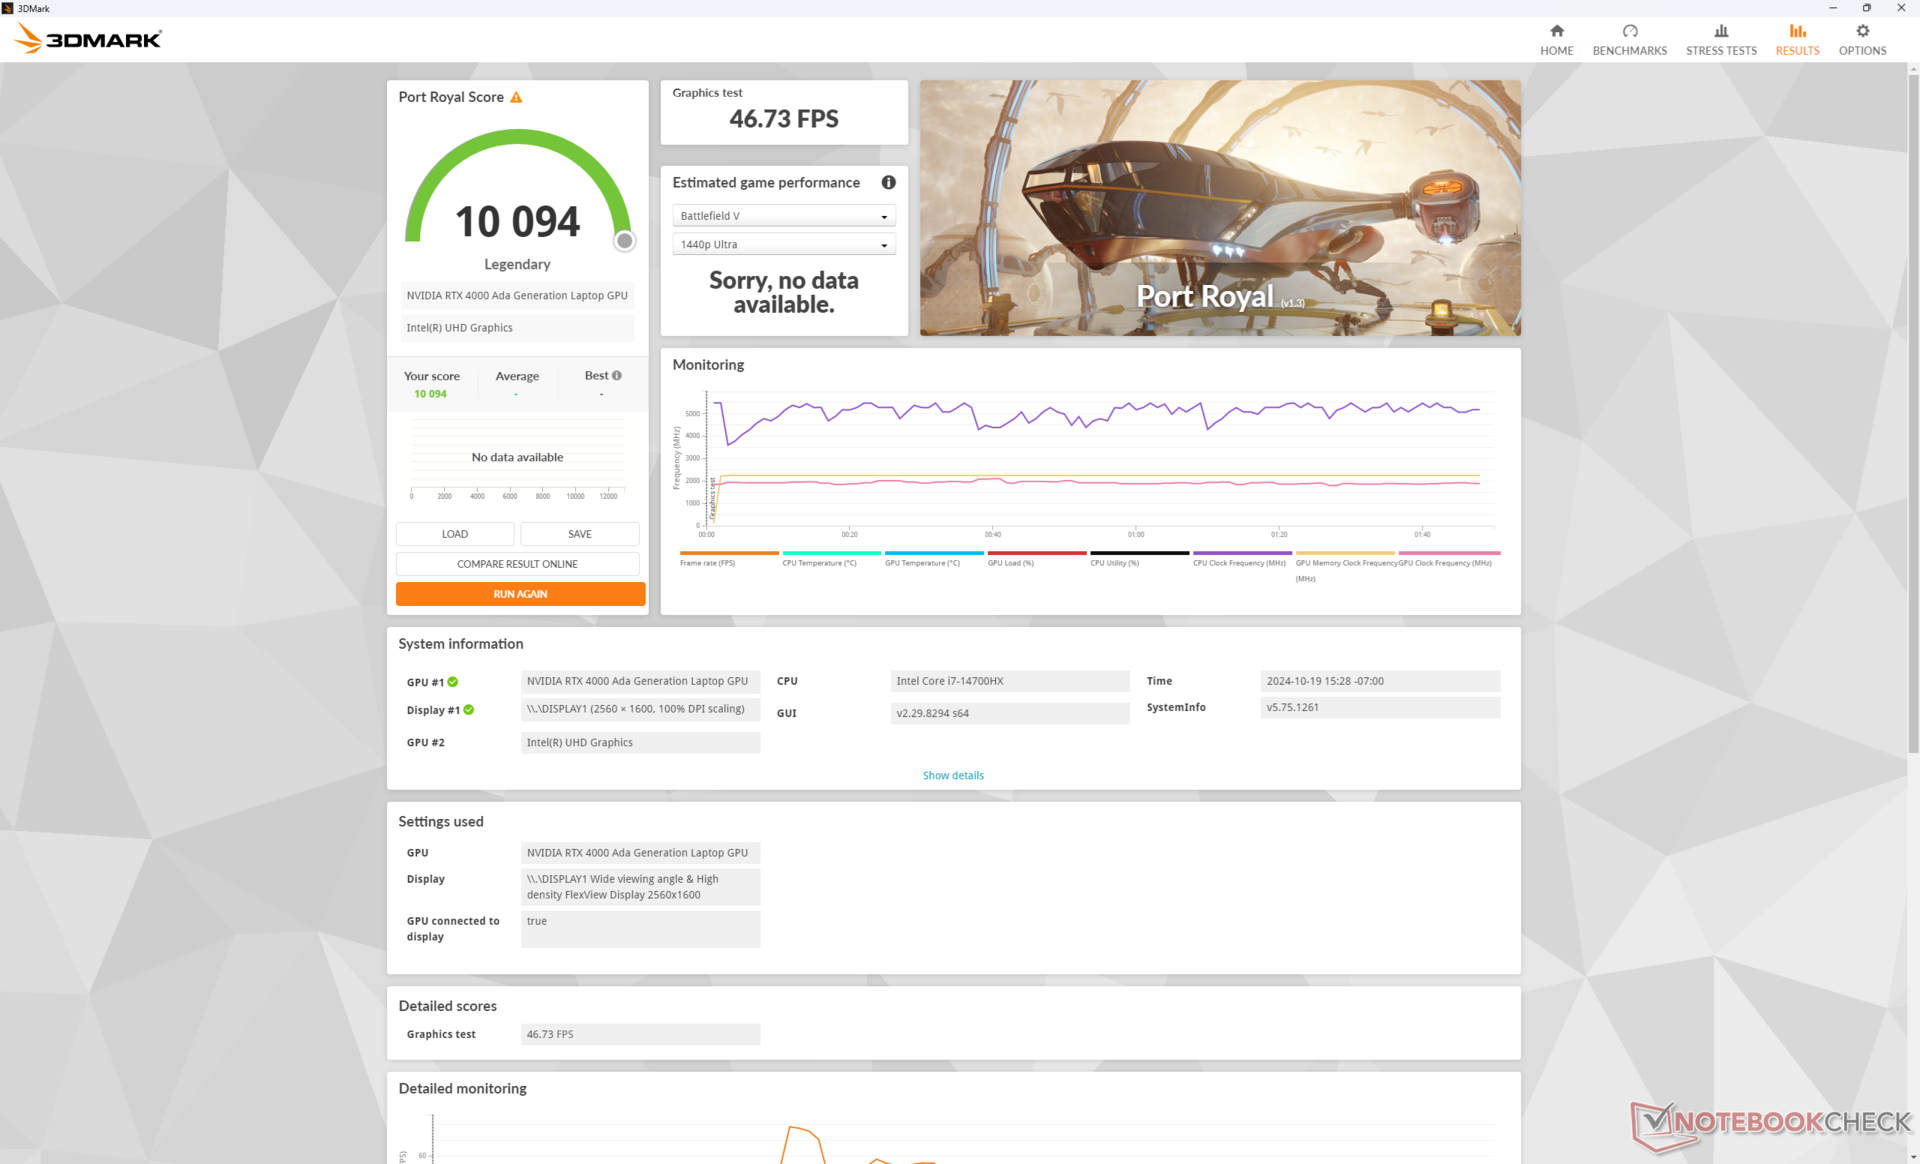
130 瓦 RTX 4000 Ada对于移动 GPU 来说,联想的 130 瓦 RTX 4000 Ada 性能非常强劲,甚至超过了 95 瓦的 RTX 5000 AdaPrecision 5690 中的 95 W RTX 5000 Ada。例如,3DMark 的结果要高出 10% 到 40%,在运行 SpecViewPerf 时也能得出类似的结果。
| 电源配置文件 | 图形得分 | 物理得分 | 综合得分 |
| 性能模式 | 40179 | 30534 | 14840 |
| 平衡模式 | 32889 (-18%) | 29923 (-2%) | 13007 (-12%) |
| 电池模式 | 23401 (-42%) | 27793 (-9%) | 8510 (-42%) |
从 "性能 "模式降至 "平衡 "模式对图形性能的影响较大,如上图Fire Strike 结果表所示。
| 3DMark Performance Rating - Percent | |
| Lenovo ThinkPad P16 Gen 2 -3! | |
| Average NVIDIA RTX 4000 Ada Generation Laptop GPU -3! | |
| Dell Precision 5690 -3! | |
| HP ZBook Fury 16 G11 | |
| HP ZBook Fury 16 G9 -3! | |
| Dell Precision 5000 5490 -3! | |
| MSI CreatorPro Z16P B12UKST -19! | |
| HP ZBook Power 15 G10 -11! | |
| Asus ExpertBook B6 Flip B6602FC2 -19! | |
| Lenovo ThinkPad P16v G1 AMD -18! | |
| Lenovo ThinkPad P1 G4-20Y4Z9DVUS -19! | |
| Lenovo ThinkPad P16s G2 21K9000CGE -19! | |
| HP ZBook Firefly 16 G9-6B897EA -19! | |
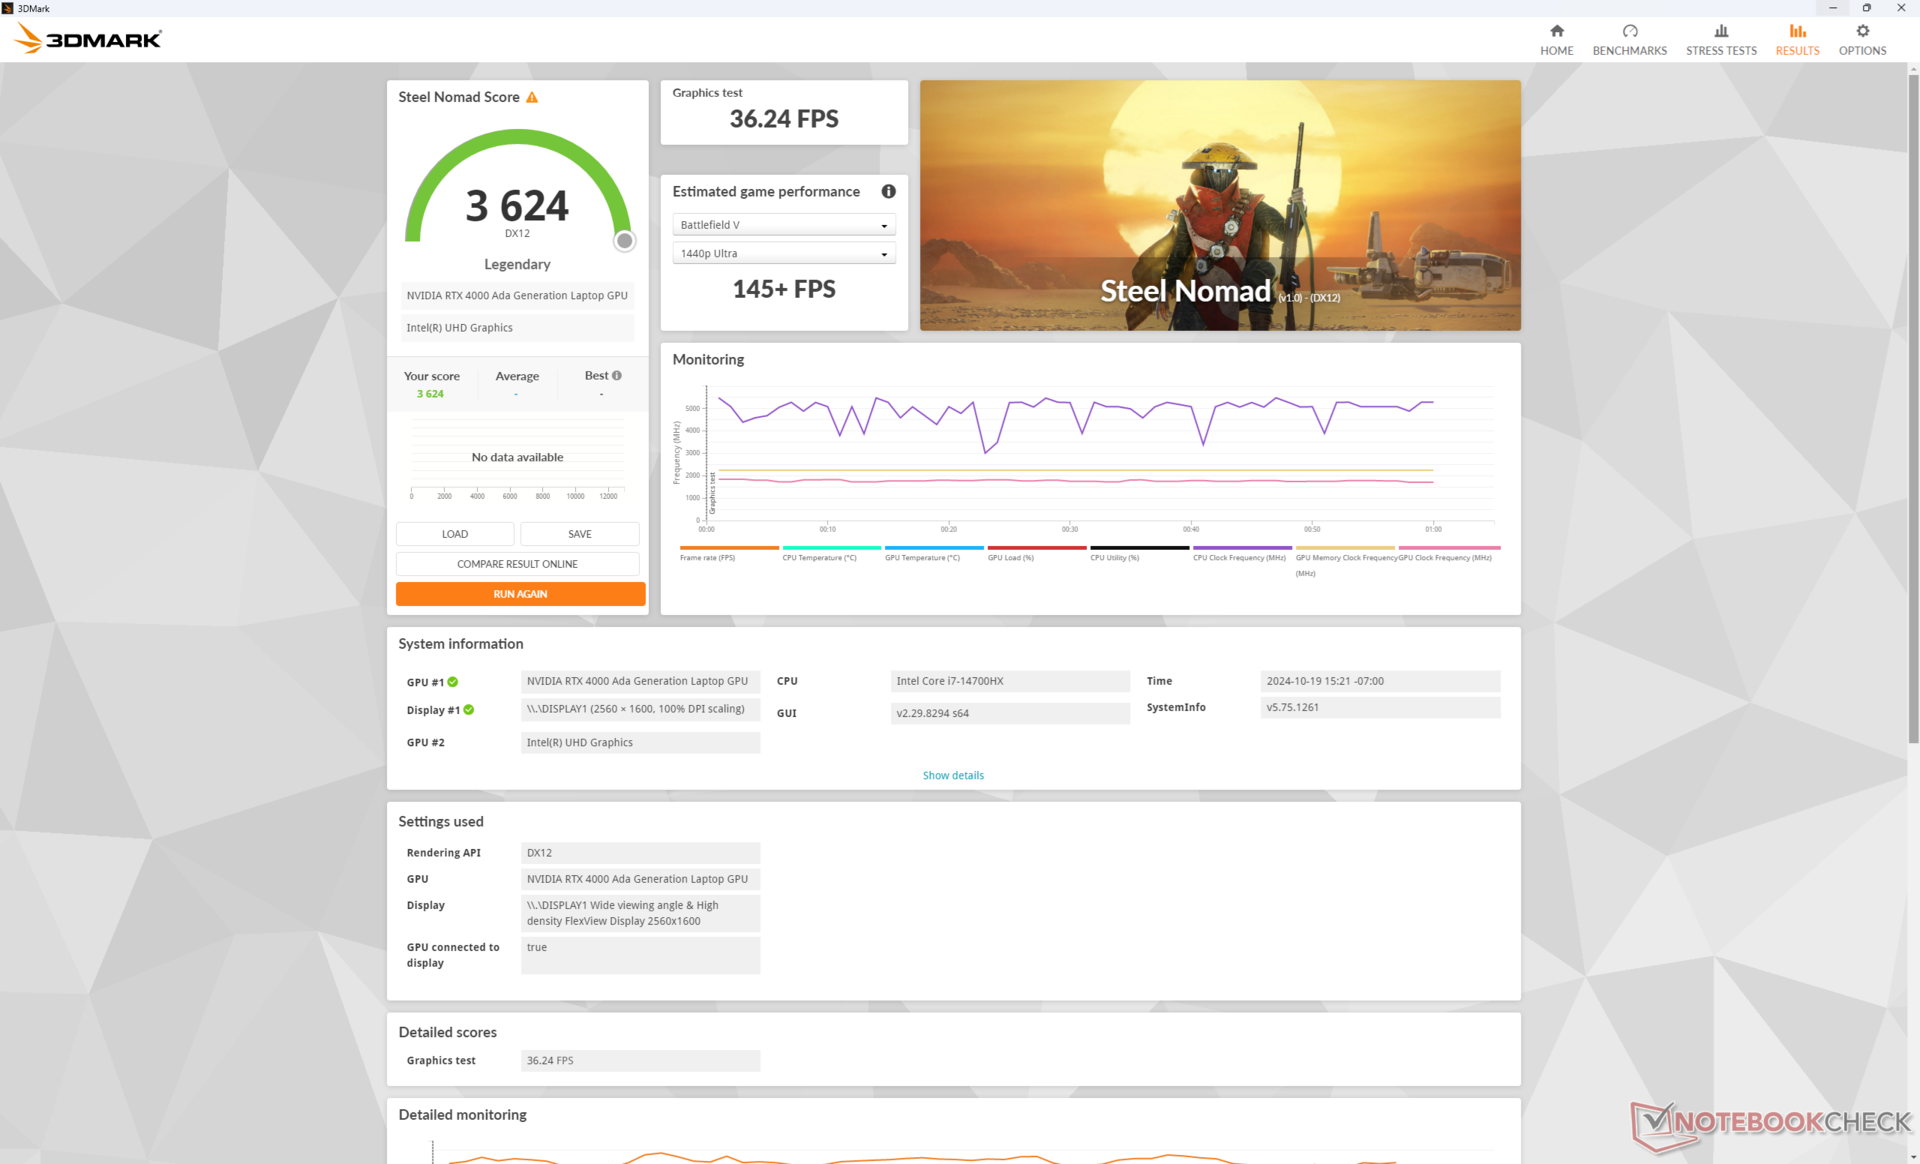
| 3DMark 11 Performance | 39943 points | |
| 3DMark Cloud Gate Standard Score | 61459 points | |
| 3DMark Fire Strike Score | 32984 points | |
| 3DMark Time Spy Score | 16013 points | |
| 3DMark Steel Nomad Score | 3624 points | |
Help | ||
* ... smaller is better
游戏性能
RTX 4000 Ada 虽然没有针对游戏进行优化,但仍是一款动力强劲的产品,尤其是考虑到其 130 W TGP 上限。游戏性能与运行在移动式 GeForce RTX 4080.
| Performance Rating - Percent | |
| Lenovo ThinkPad P16 Gen 2 | |
| Dell Precision 5690 -1! | |
| Lenovo ThinkPad P16 G1 RTX A5500 -1! | |
| Lenovo ThinkPad P16 G2 21FA000FGE -1! | |
| HP ZBook Power 16 G11 A | |
| Lenovo ThinkPad P16s G2 21K9000CGE -1! | |
| Baldur's Gate 3 - 1920x1080 Ultra Preset | |
| Lenovo ThinkPad P16 Gen 2 | |
| Dell Precision 5690 | |
| HP ZBook Power 16 G11 A | |
| GTA V - 1920x1080 Highest Settings possible AA:4xMSAA + FX AF:16x | |
| Lenovo ThinkPad P16 Gen 2 | |
| Lenovo ThinkPad P16 G1 RTX A5500 | |
| Lenovo ThinkPad P16 G2 21FA000FGE | |
| HP ZBook Power 16 G11 A | |
| Lenovo ThinkPad P16s G2 21K9000CGE | |
| Final Fantasy XV Benchmark - 1920x1080 High Quality | |
| Lenovo ThinkPad P16 Gen 2 | |
| Dell Precision 5690 | |
| Lenovo ThinkPad P16 G1 RTX A5500 | |
| Lenovo ThinkPad P16 G2 21FA000FGE | |
| HP ZBook Power 16 G11 A | |
| Lenovo ThinkPad P16s G2 21K9000CGE | |
| Strange Brigade - 1920x1080 ultra AA:ultra AF:16 | |
| Lenovo ThinkPad P16 Gen 2 | |
| Dell Precision 5690 | |
| Lenovo ThinkPad P16 G1 RTX A5500 | |
| Lenovo ThinkPad P16 G2 21FA000FGE | |
| HP ZBook Power 16 G11 A | |
| Lenovo ThinkPad P16s G2 21K9000CGE | |
| Dota 2 Reborn - 1920x1080 ultra (3/3) best looking | |
| Lenovo ThinkPad P16 Gen 2 | |
| Lenovo ThinkPad P16 G1 RTX A5500 | |
| Lenovo ThinkPad P16 G2 21FA000FGE | |
| Dell Precision 5690 | |
| HP ZBook Power 16 G11 A | |
| Lenovo ThinkPad P16s G2 21K9000CGE | |
| Cyberpunk 2077 2.2 Phantom Liberty | |
| 1920x1080 High Preset (FSR off) | |
| Lenovo ThinkPad P16 Gen 2 | |
| Average NVIDIA RTX 4000 Ada Generation Laptop GPU (n=1) | |
| HP ZBook Fury 16 G11 | |
| Dell Precision 5690 | |
| Dell Precision 5000 5490 | |
| HP ZBook Power 15 G10 | |
| Lenovo ThinkPad P16v G1 AMD | |
| 1920x1080 Ultra Preset (FSR off) | |
| Dell Precision 5690 | |
| Lenovo ThinkPad P16 Gen 2 | |
| Average NVIDIA RTX 4000 Ada Generation Laptop GPU (n=1) | |
| HP ZBook Fury 16 G11 | |
| Dell Precision 5000 5490 | |
| HP ZBook Power 15 G10 | |
| Lenovo ThinkPad P16v G1 AMD | |
| 2560x1440 Ultra Preset (FSR off) | |
| Lenovo ThinkPad P16 Gen 2 | |
| Average NVIDIA RTX 4000 Ada Generation Laptop GPU (n=1) | |
| Dell Precision 5690 | |
| HP ZBook Fury 16 G11 | |
| HP ZBook Power 15 G10 | |
遗憾的是,在运行《赛博朋克 2077》时性能略有下降。在游戏中闲置几分钟后,帧速率会从约 103 降到约 96,重复测试后结果也不会改善。这表明 GPU 有可能受益于更强大的散热解决方案。
Cyberpunk 2077 ultra FPS Chart
| low | med. | high | ultra | QHD | |
|---|---|---|---|---|---|
| GTA V (2015) | 185.8 | 183.9 | 179.4 | 125.6 | 118.7 |
| Dota 2 Reborn (2015) | 215.4 | 189.7 | 185.2 | 164.4 | |
| Final Fantasy XV Benchmark (2018) | 207 | 185.3 | 150 | 119.5 | |
| X-Plane 11.11 (2018) | 166.8 | 144 | 113.1 | ||
| Far Cry 5 (2018) | 168 | 148 | 138 | 128 | 125 |
| Strange Brigade (2018) | 452 | 372 | 323 | 292 | 210 |
| Tiny Tina's Wonderlands (2022) | 275.4 | 232.6 | 171.4 | 137.1 | 92 |
| F1 22 (2022) | 275 | 264 | 238 | 95.5 | 65.7 |
| Baldur's Gate 3 (2023) | 178.3 | 160.6 | 141.6 | 137 | 90.7 |
| Cyberpunk 2077 2.2 Phantom Liberty (2023) | 129.3 | 115.1 | 108.4 | 98.3 | 68.5 |
排放--响亮而负责
系统噪音
与配置较低的 RTX 2000 Ada 相比,我们设备中的风扇更容易增加转速和噪音。因此,当运行不同类型的负载时,用户可以期待更多的风扇脉动和风扇噪音变化。游戏等高负荷运行时,风扇噪音会达到 53 分贝(A),是我们测试过的噪音最大的 16 英寸工作站之一。
在平衡模式而非性能模式下运行《赛博朋克 2077》,风扇噪音会从 52.8 分贝(A)明显降低到 47.9 分贝(A)。不过,正如上文 GPU 性能部分所述,这是以牺牲性能为代价的。
Noise Level
| Idle |
| 29.1 / 29.1 / 29.1 dB(A) |
| Load |
| 41 / 52.9 dB(A) |
 | ||
30 dB silent 40 dB(A) audible 50 dB(A) loud |
||
min: | ||
| Lenovo ThinkPad P16 Gen 2 NVIDIA RTX 4000 Ada Generation Laptop GPU, i7-14700HX, SK hynix PC801 HFS001TEJ9X162N | Lenovo ThinkPad P16 G2 21FA000FGE NVIDIA RTX 2000 Ada Generation Laptop GPU, i7-13700HX, SK hynix PC801 HFS001TEJ9X162N | Lenovo ThinkPad P16s G2 21K9000CGE Radeon 780M, R7 PRO 7840U, SK hynix PC801 HFS001TEJ9X162N | Lenovo ThinkPad P16 G1 RTX A5500 RTX A5500 Laptop GPU, i9-12950HX, WDC PC SN810 2TB | HP ZBook Power 16 G11 A NVIDIA RTX 2000 Ada Generation Laptop GPU, R7 8845HS, Samsung PM9A1 MZVL22T0HBLB | Dell Precision 5690 NVIDIA RTX 5000 Ada Generation Laptop GPU, Ultra 9 185H, 2x Samsung PM9A1 1TB (RAID 0) | |
|---|---|---|---|---|---|---|
| Noise | 6% | 17% | 17% | 18% | 5% | |
| off / environment * | 23.9 | 23.5 2% | 22.6 5% | 23.1 3% | 23.5 2% | 23.4 2% |
| Idle Minimum * | 29.1 | 23.5 19% | 22.6 22% | 23.1 21% | 23.8 18% | 23.6 19% |
| Idle Average * | 29.1 | 29.2 -0% | 22.6 22% | 23.1 21% | 24.2 17% | 24.9 14% |
| Idle Maximum * | 29.1 | 29.5 -1% | 22.6 22% | 23.1 21% | 24.2 17% | 30.9 -6% |
| Load Average * | 41 | 32.7 20% | 37.8 8% | 28.9 30% | 25.4 38% | 40.4 1% |
| Cyberpunk 2077 ultra * | 52.8 | 43 19% | ||||
| Load Maximum * | 52.9 | 56.6 -7% | 40.5 23% | 51.4 3% | 45 15% | 51.9 2% |
| Witcher 3 ultra * | 50.6 | 40.3 | 51.6 | 48.3 |
* ... smaller is better
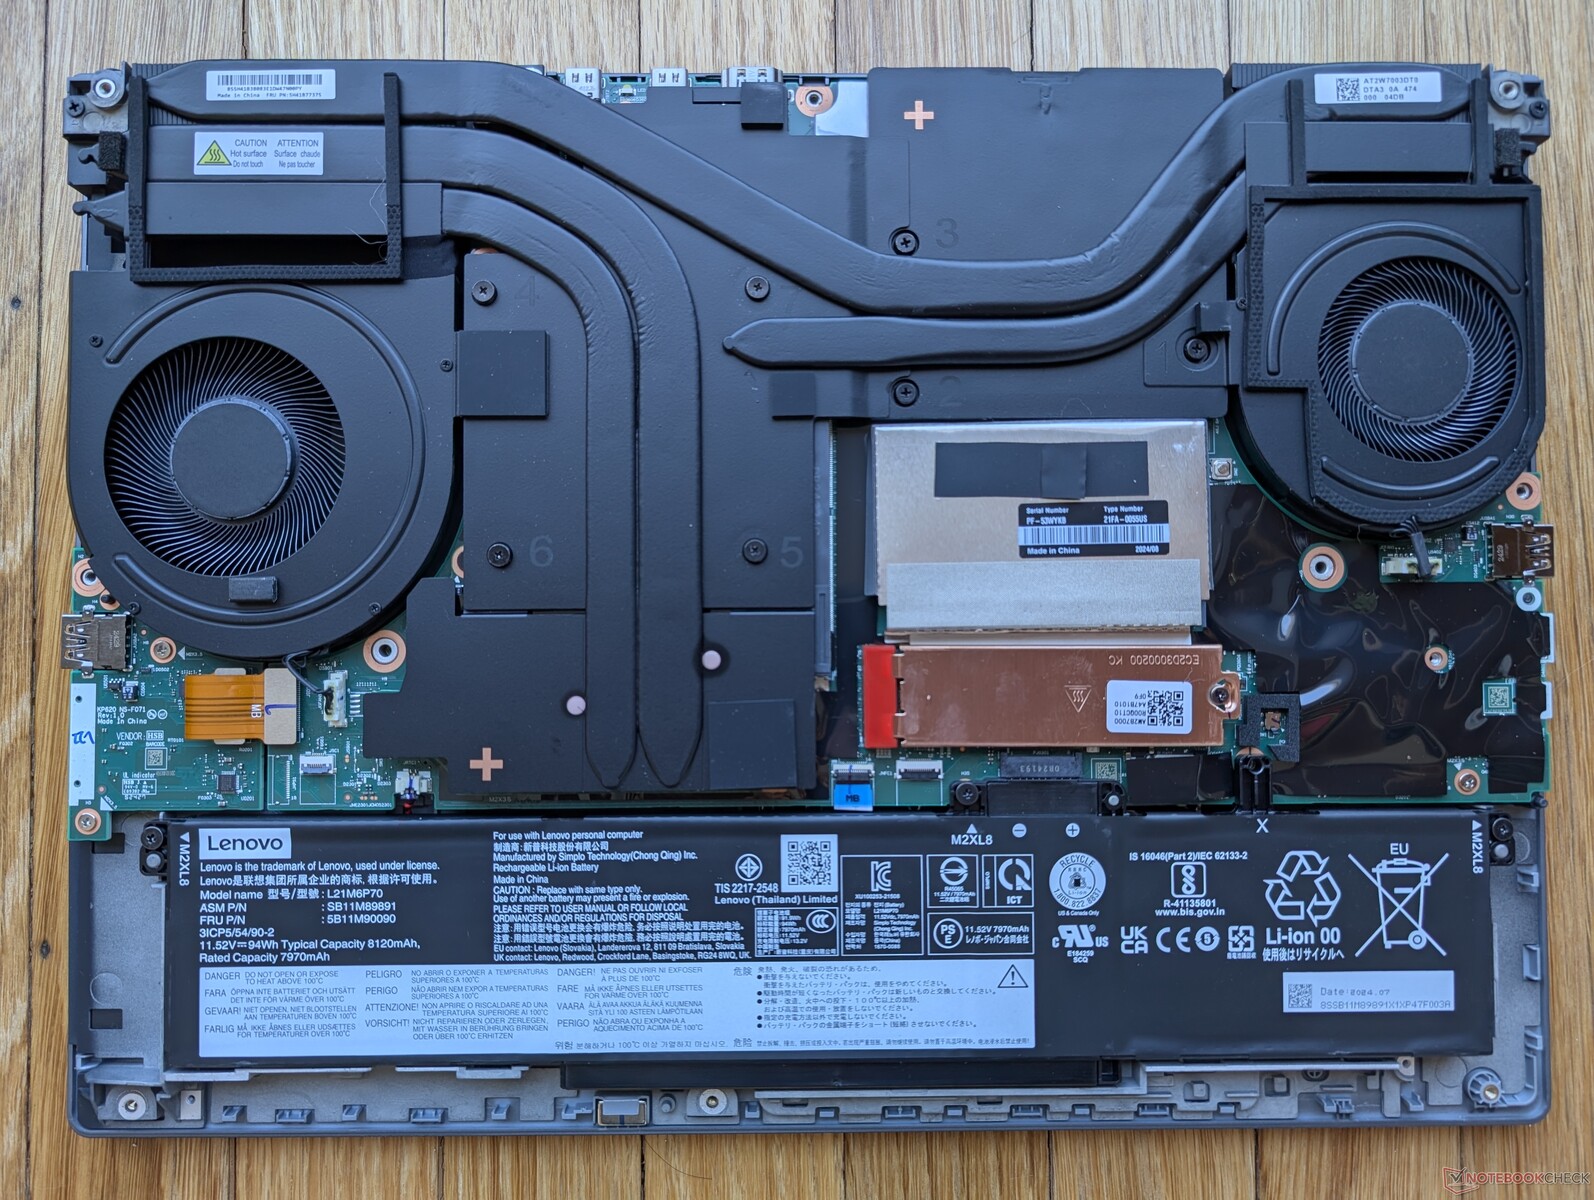
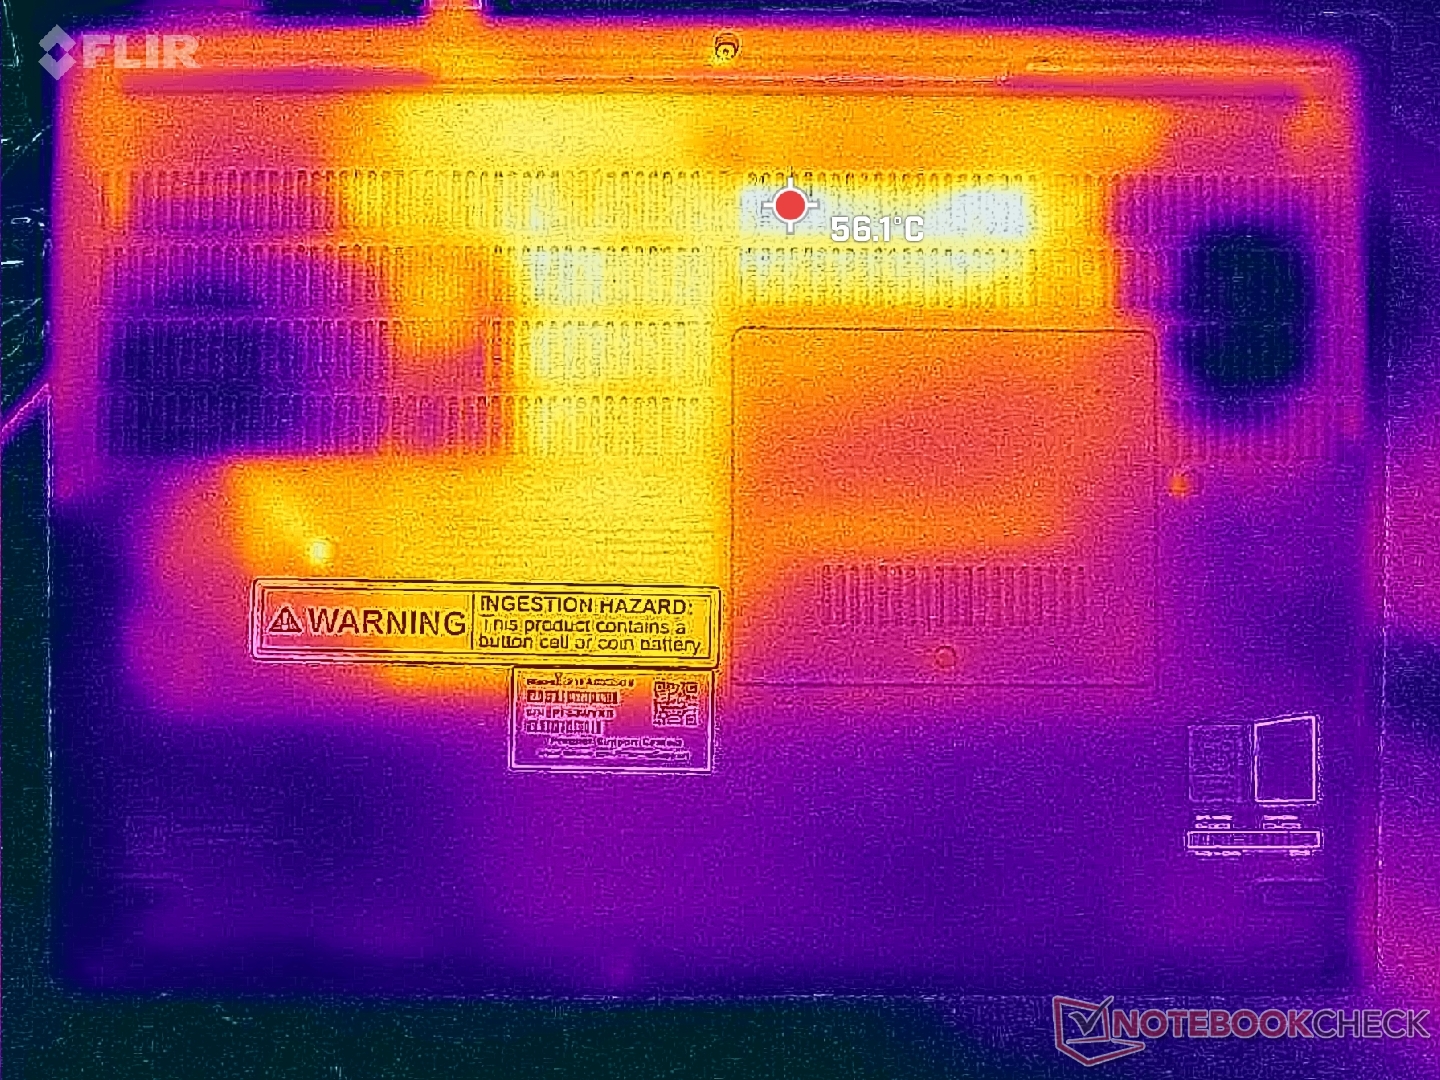
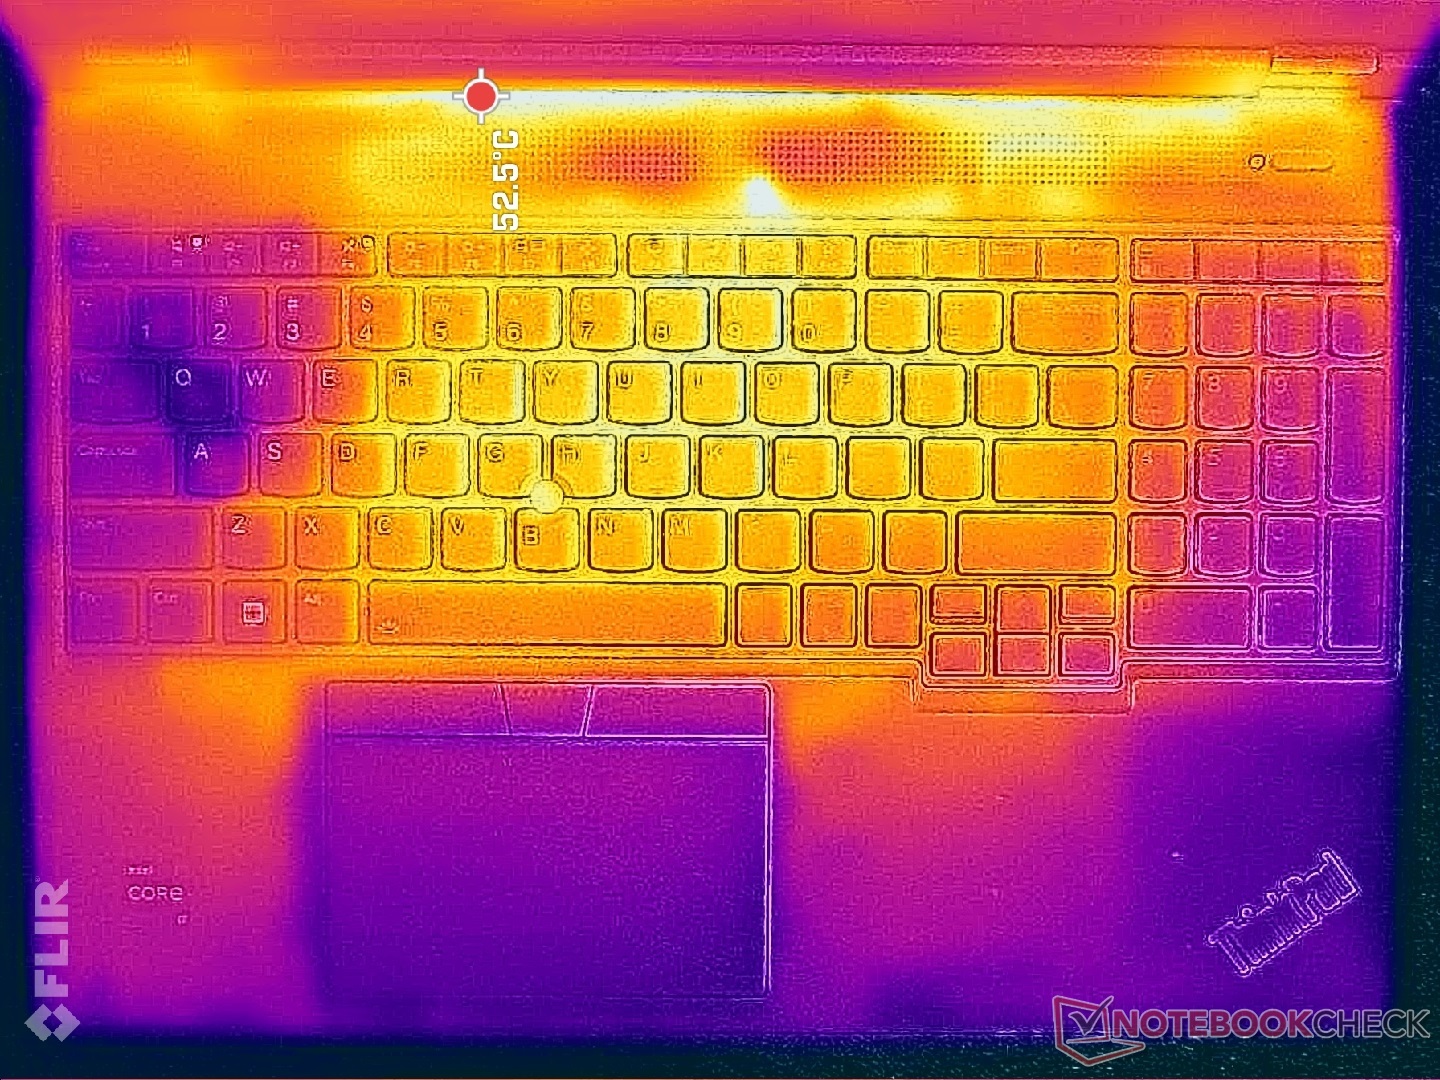
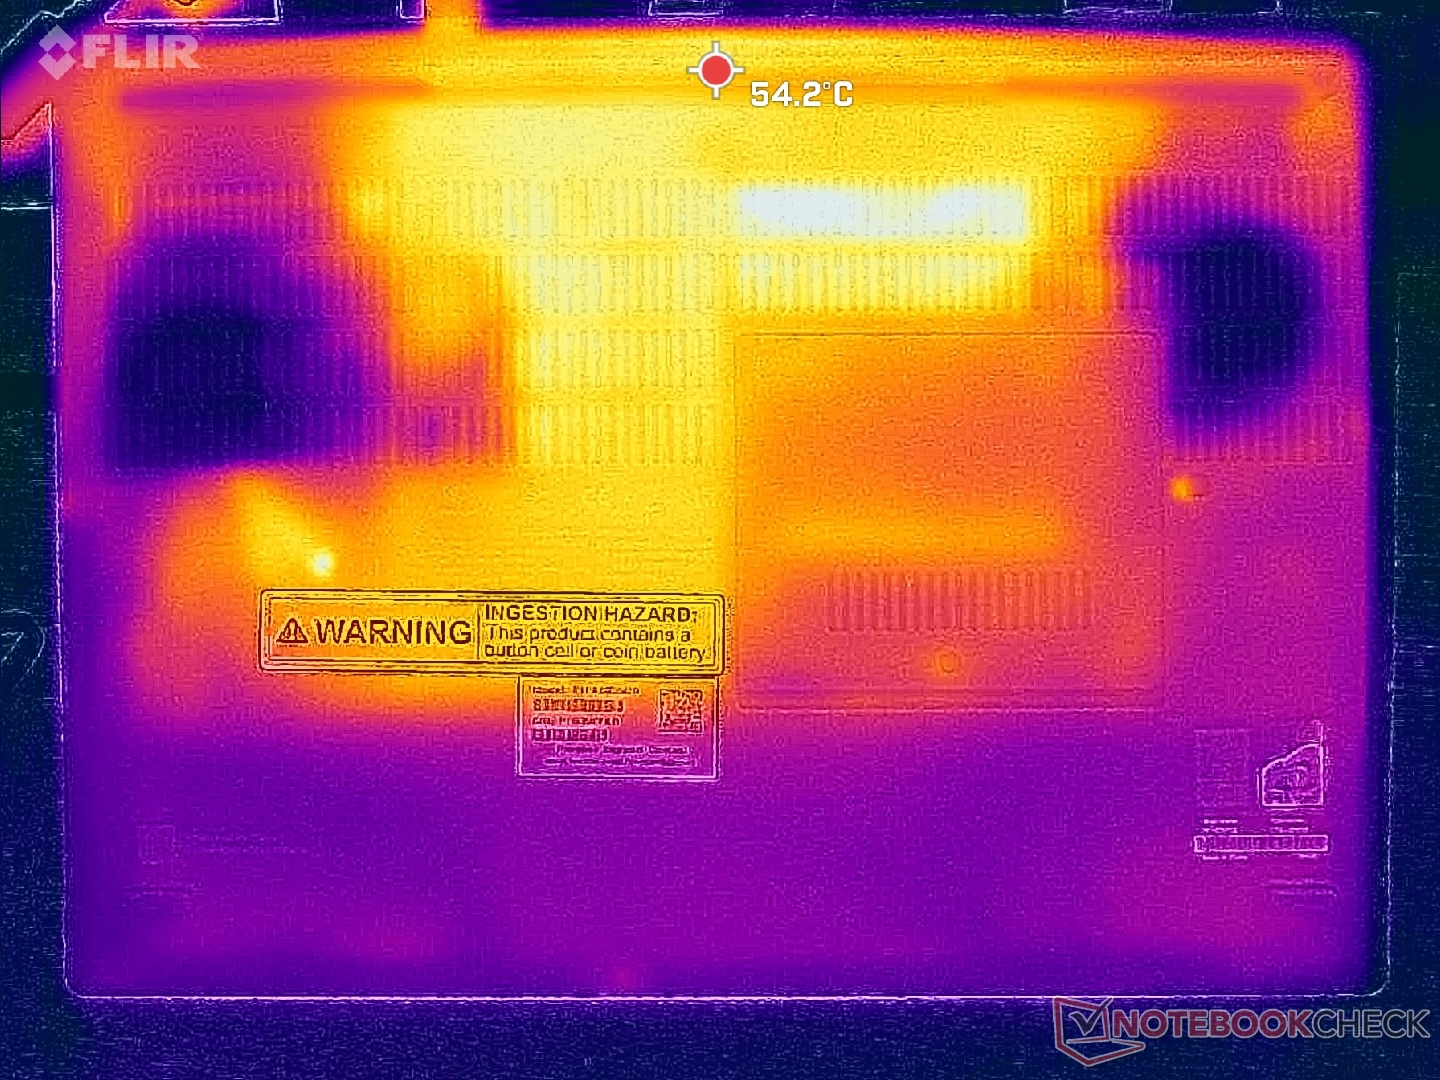
温度
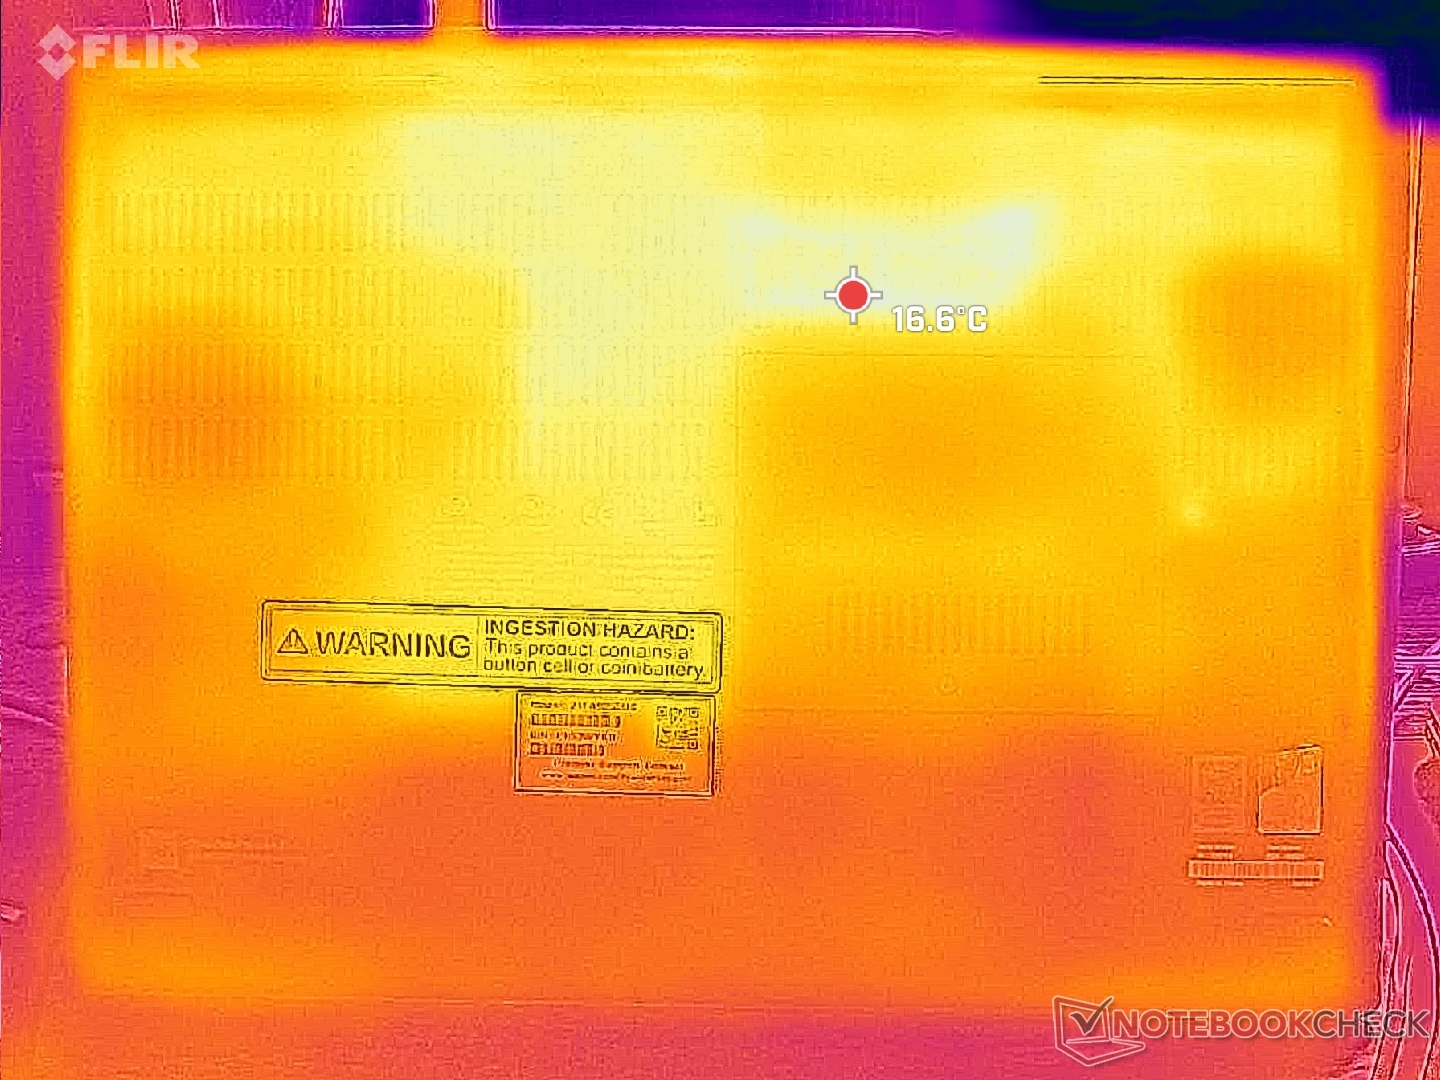
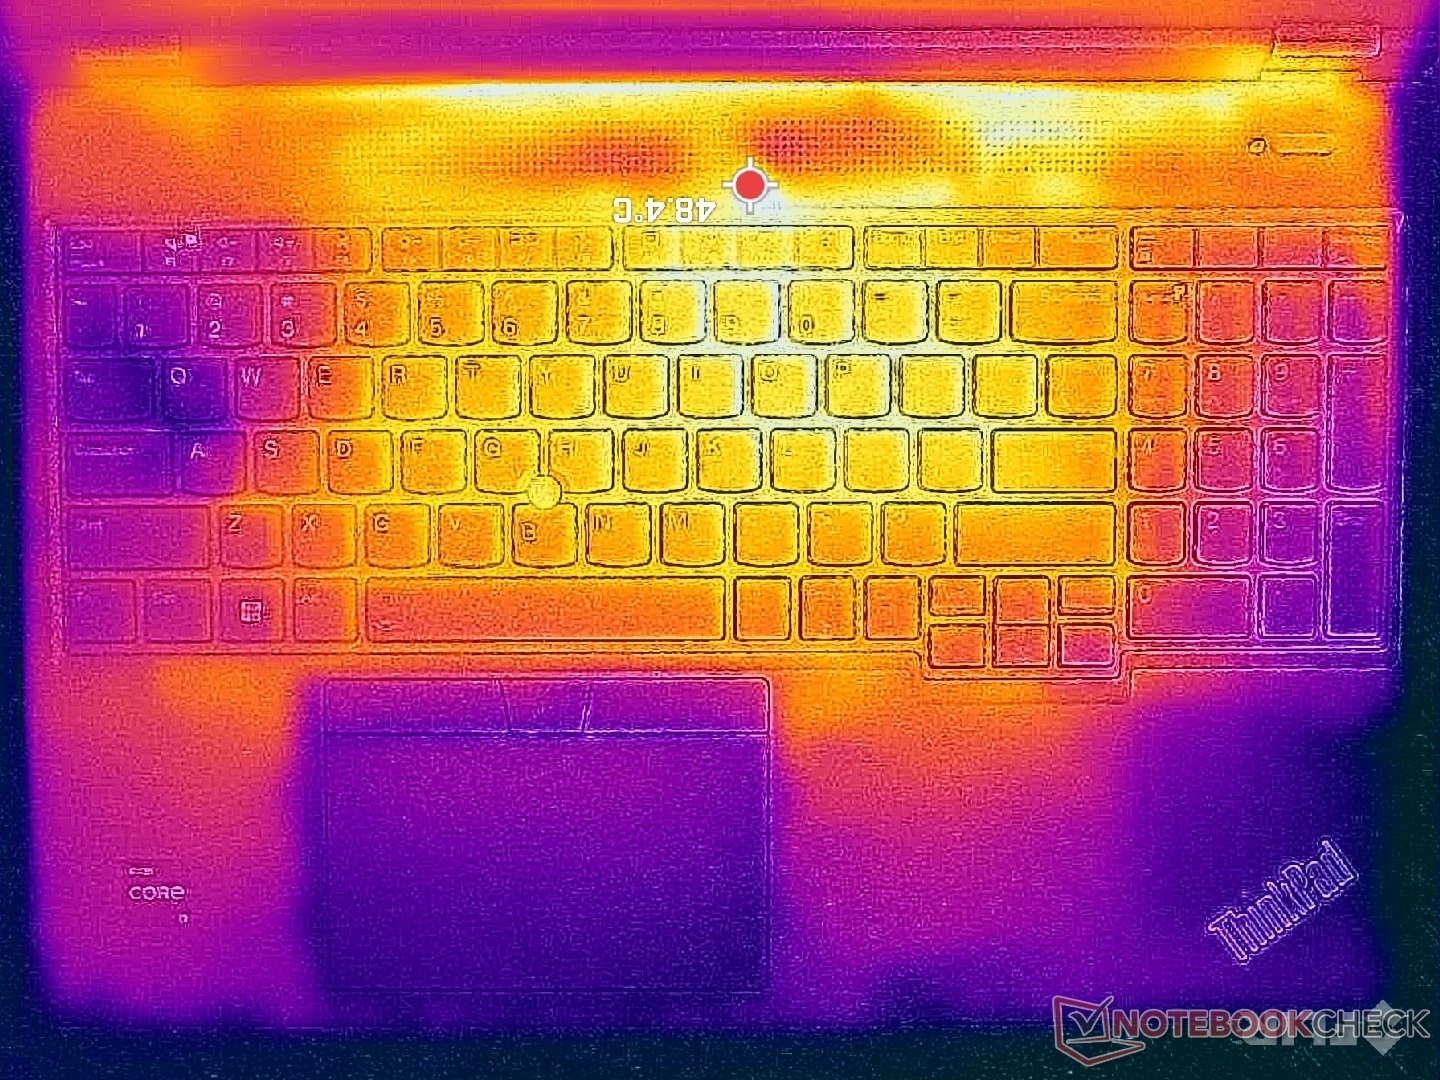
由于我们使用了要求更高的 130 W RTX 4000 Ada GPU,因此表面温度比我们的第一台 ThinkPad P16 Gen 2 测试机要高,但差异比预期的要大。运行苛刻负载时,C 盖和 D 盖的平均温度可达 43 摄氏度,而我们配置较低的配置只有 32 摄氏度。
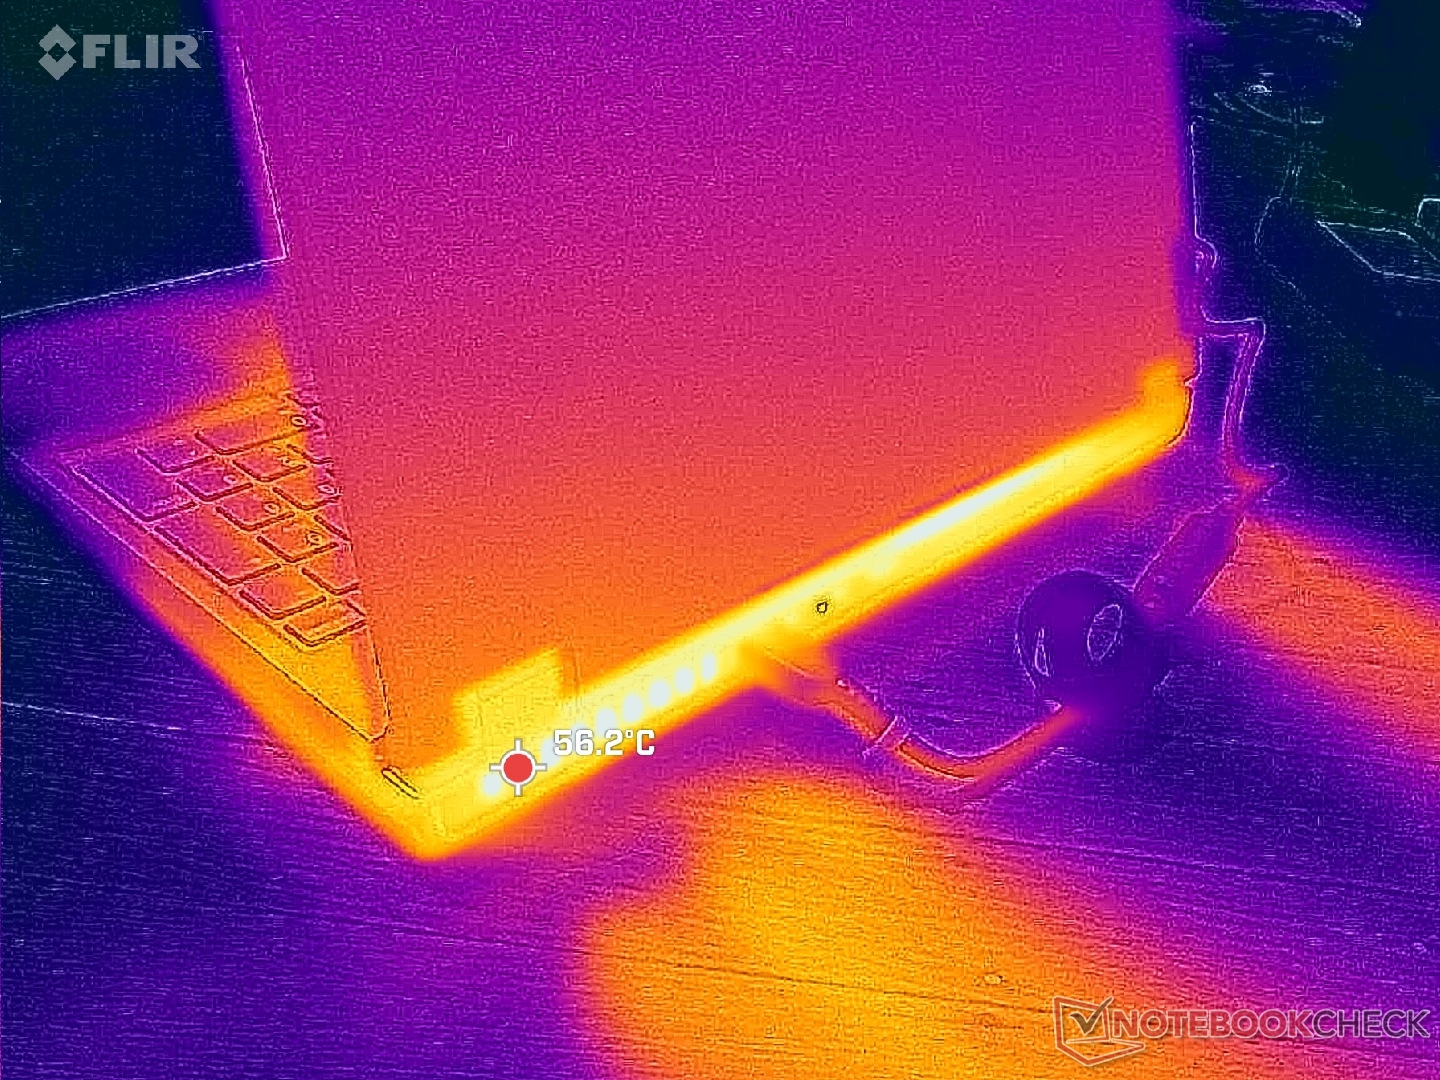
(-) The maximum temperature on the upper side is 46.6 °C / 116 F, compared to the average of 38.2 °C / 101 F, ranging from 22.2 to 69.8 °C for the class Workstation.
(-) The bottom heats up to a maximum of 51 °C / 124 F, compared to the average of 41.2 °C / 106 F
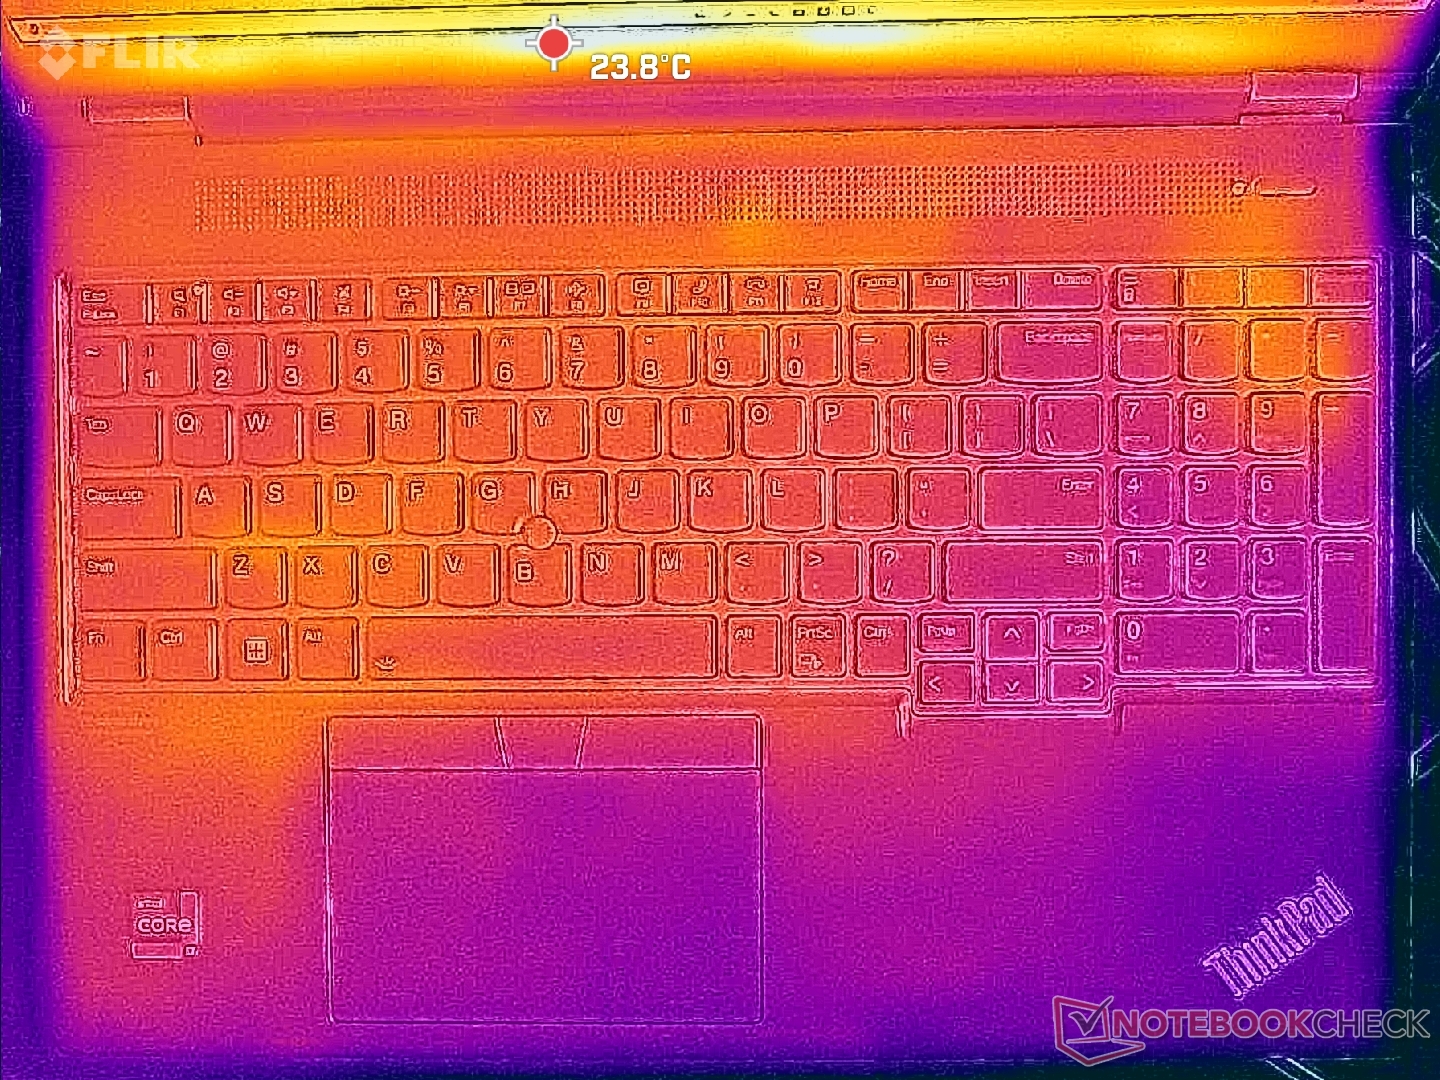
(+) In idle usage, the average temperature for the upper side is 23.9 °C / 75 F, compared to the device average of 32 °C / 90 F.
(-) 3: The average temperature for the upper side is 39.6 °C / 103 F, compared to the average of 32 °C / 90 F for the class Workstation.
(+) The palmrests and touchpad are reaching skin temperature as a maximum (35.6 °C / 96.1 F) and are therefore not hot.
(-) The average temperature of the palmrest area of similar devices was 27.8 °C / 82 F (-7.8 °C / -14.1 F).
| Lenovo ThinkPad P16 Gen 2 Intel Core i7-14700HX, NVIDIA RTX 4000 Ada Generation Laptop GPU | Lenovo ThinkPad P16 G2 21FA000FGE Intel Core i7-13700HX, NVIDIA RTX 2000 Ada Generation Laptop GPU | Lenovo ThinkPad P16s G2 21K9000CGE AMD Ryzen 7 PRO 7840U, AMD Radeon 780M | Lenovo ThinkPad P16 G1 RTX A5500 Intel Core i9-12950HX, NVIDIA RTX A5500 Laptop GPU | HP ZBook Power 16 G11 A AMD Ryzen 7 8845HS, NVIDIA RTX 2000 Ada Generation Laptop GPU | Dell Precision 5690 Intel Core Ultra 9 185H, Nvidia RTX 5000 Ada Generation Laptop GPU | |
|---|---|---|---|---|---|---|
| Heat | 3% | -2% | -17% | 6% | -3% | |
| Maximum Upper Side * | 46.6 | 47.2 -1% | 42.7 8% | 44.8 4% | 40.6 13% | 46.6 -0% |
| Maximum Bottom * | 51 | 39.5 23% | 47.2 7% | 49.8 2% | 40.6 20% | 33 35% |
| Idle Upper Side * | 24.8 | 28.1 -13% | 27.8 -12% | 30.6 -23% | 26 -5% | 32.4 -31% |
| Idle Bottom * | 25.6 | 25.3 1% | 28.4 -11% | 38.6 -51% | 26.6 -4% | 29.4 -15% |
* ... smaller is better
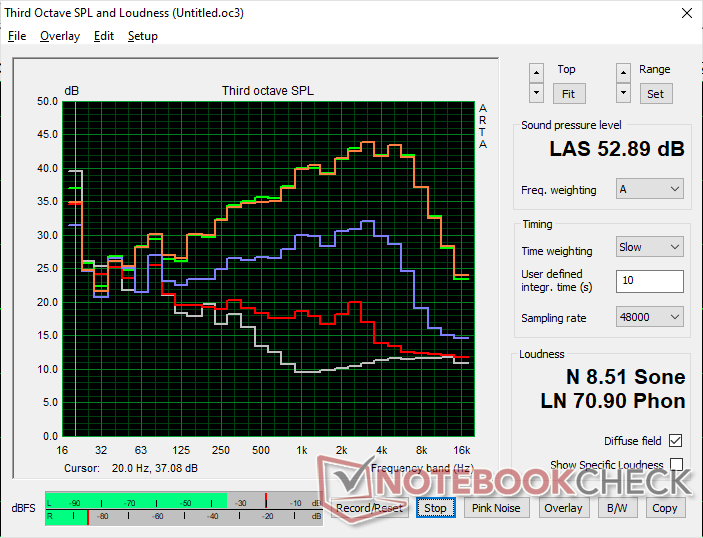
发言人
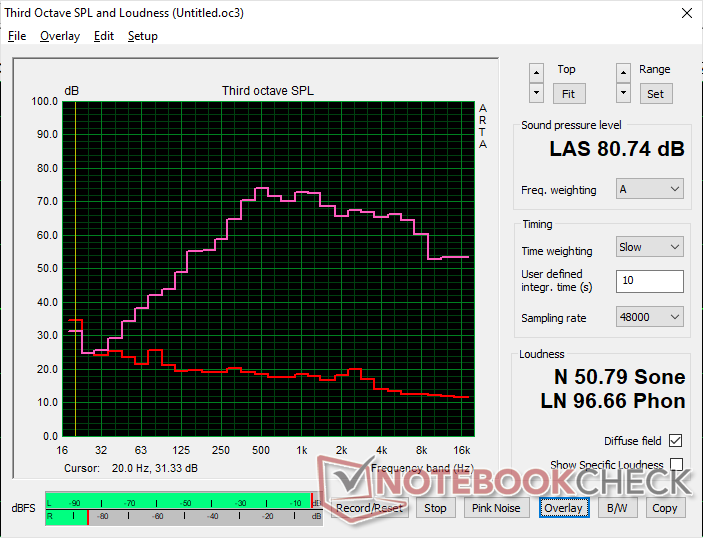
Lenovo ThinkPad P16 Gen 2 audio analysis
(±) | speaker loudness is average but good (80.7 dB)
Bass 100 - 315 Hz
(±) | reduced bass - on average 10.8% lower than median
(±) | linearity of bass is average (8% delta to prev. frequency)
Mids 400 - 2000 Hz
(±) | higher mids - on average 5.4% higher than median
(+) | mids are linear (6.2% delta to prev. frequency)
Highs 2 - 16 kHz
(+) | balanced highs - only 3.3% away from median
(+) | highs are linear (5.5% delta to prev. frequency)
Overall 100 - 16.000 Hz
(±) | linearity of overall sound is average (15.6% difference to median)
Compared to same class
» 32% of all tested devices in this class were better, 10% similar, 59% worse
» The best had a delta of 7%, average was 18%, worst was 35%
Compared to all devices tested
» 21% of all tested devices were better, 4% similar, 74% worse
» The best had a delta of 4%, average was 24%, worst was 134%
Apple MacBook Pro 16 2021 M1 Pro audio analysis
(+) | speakers can play relatively loud (84.7 dB)
Bass 100 - 315 Hz
(+) | good bass - only 3.8% away from median
(+) | bass is linear (5.2% delta to prev. frequency)
Mids 400 - 2000 Hz
(+) | balanced mids - only 1.3% away from median
(+) | mids are linear (2.1% delta to prev. frequency)
Highs 2 - 16 kHz
(+) | balanced highs - only 1.9% away from median
(+) | highs are linear (2.7% delta to prev. frequency)
Overall 100 - 16.000 Hz
(+) | overall sound is linear (4.6% difference to median)
Compared to same class
» 0% of all tested devices in this class were better, 0% similar, 100% worse
» The best had a delta of 5%, average was 18%, worst was 45%
Compared to all devices tested
» 0% of all tested devices were better, 0% similar, 100% worse
» The best had a delta of 4%, average was 24%, worst was 134%
能源管理
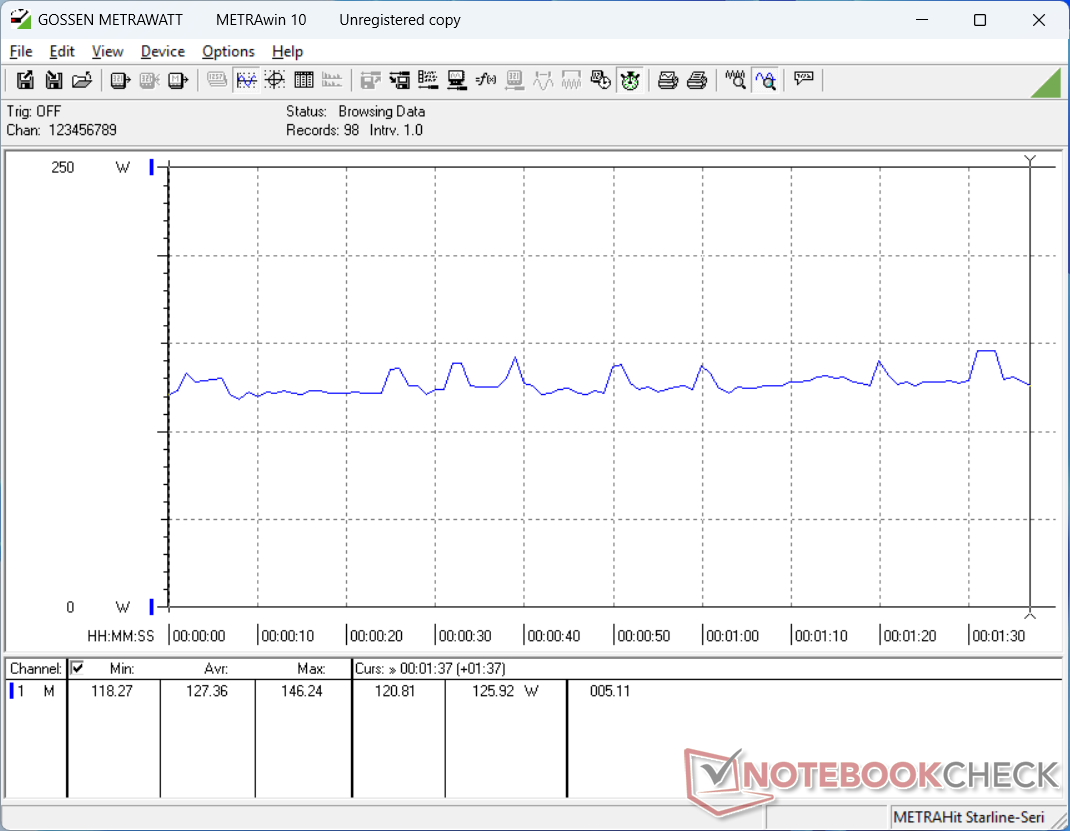
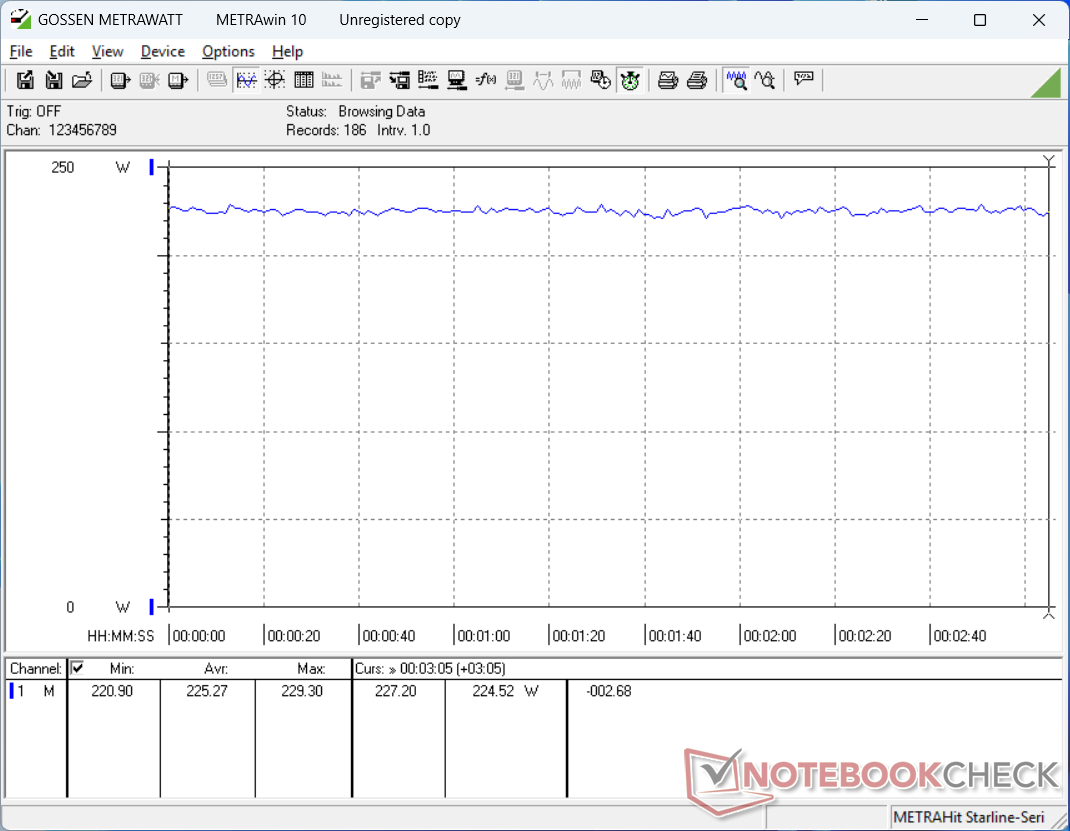
耗电量
在台式机上怠速运行时,功耗可高达 25 W,而在配置较低的 RTX 2000 配置上,功耗仅为 16 W。在运行游戏等高负荷负载时,功率差距可高达 80 瓦,耗电量增加 55%。请确保使用功率更大的 230 W AC 适配器,以充分发挥 RTX 4000 配置的性能。
| Off / Standby | |
| Idle | |
| Load |
|
Key:
min: | |
| Lenovo ThinkPad P16 Gen 2 i7-14700HX, NVIDIA RTX 4000 Ada Generation Laptop GPU, SK hynix PC801 HFS001TEJ9X162N, IPS, 2560x1600, 16" | Lenovo ThinkPad P16 G2 21FA000FGE i7-13700HX, NVIDIA RTX 2000 Ada Generation Laptop GPU, SK hynix PC801 HFS001TEJ9X162N, IPS LED, 2560x1600, 16" | Lenovo ThinkPad P16s G2 21K9000CGE R7 PRO 7840U, Radeon 780M, SK hynix PC801 HFS001TEJ9X162N, OLED, 3840x2400, 16" | Lenovo ThinkPad P16 G1 RTX A5500 i9-12950HX, RTX A5500 Laptop GPU, WDC PC SN810 2TB, IPS, 3840x2400, 16" | HP ZBook Power 16 G11 A R7 8845HS, NVIDIA RTX 2000 Ada Generation Laptop GPU, Samsung PM9A1 MZVL22T0HBLB, IPS, 2560x1600, 16" | Dell Precision 5690 Ultra 9 185H, NVIDIA RTX 5000 Ada Generation Laptop GPU, 2x Samsung PM9A1 1TB (RAID 0), OLED, 3840x2400, 16" | |
|---|---|---|---|---|---|---|
| Power Consumption | 7% | 55% | -27% | 47% | 8% | |
| Idle Minimum * | 7.9 | 9.3 -18% | 6.1 23% | 7.5 5% | 4.6 42% | 7.9 -0% |
| Idle Average * | 13.1 | 14.1 -8% | 6.5 50% | 20.1 -53% | 10 24% | 12 8% |
| Idle Maximum * | 24.2 | 15.5 36% | 7 71% | 40 -65% | 10.6 56% | 28.6 -18% |
| Load Average * | 127.4 | 133.6 -5% | 56.6 56% | 137 -8% | 60.9 52% | 98.8 22% |
| Cyberpunk 2077 ultra external monitor * | 219 | 92.8 58% | ||||
| Cyberpunk 2077 ultra * | 225 | 96.8 57% | ||||
| Load Maximum * | 248.5 | 179.6 28% | 68.3 73% | 285.9 -15% | 154.8 38% | 174.8 30% |
| Witcher 3 ultra * | 144.9 | 61.2 | 208 | 144.5 |
* ... smaller is better
Power Consumption Cyberpunk / Stress Test
Power Consumption external Monitor
电池寿命
即使设置为平衡模式和 150 nit 亮度,运行时间也比我们在配置较低的 ThinkPad P16 Gen 2 上记录的时间少一半以上。造成这种差异的主要原因是我们的 RTX 4000 Ada 设备不支持高级优化功能,因此无法完全禁用独立 GPU。
即使启用了联想快充,从空电到满电也需要 130 分钟。
| Lenovo ThinkPad P16 Gen 2 i7-14700HX, NVIDIA RTX 4000 Ada Generation Laptop GPU, 94 Wh | Lenovo ThinkPad P16 G2 21FA000FGE i7-13700HX, NVIDIA RTX 2000 Ada Generation Laptop GPU, 94 Wh | Lenovo ThinkPad P16s G2 21K9000CGE R7 PRO 7840U, Radeon 780M, 84 Wh | Lenovo ThinkPad P16 G1 RTX A5500 i9-12950HX, RTX A5500 Laptop GPU, 94 Wh | HP ZBook Power 16 G11 A R7 8845HS, NVIDIA RTX 2000 Ada Generation Laptop GPU, 83 Wh | Dell Precision 5690 Ultra 9 185H, NVIDIA RTX 5000 Ada Generation Laptop GPU, 98 Wh | |
|---|---|---|---|---|---|---|
| Battery Runtime | 248% | 329% | 136% | 293% | 271% | |
| WiFi v1.3 | 148 | 515 248% | 635 329% | 350 136% | 582 293% | 549 271% |
| H.264 | 797 | |||||
| Load | 92 | 103 | ||||
| Reader / Idle | 1566 |
Lenovo ThinkPad P16 Gen 2
- 10/25/2024 v8
Allen Ngo
 Total Sustainability Score:
 Transparency
The selection of devices to be reviewed is made by our editorial team. The test sample was provided to the author as a loan by the manufacturer or retailer for the purpose of this review. The lender had no influence on this review, nor did the manufacturer receive a copy of this review before publication. There was no obligation to publish this review. We never accept compensation or payment in return for our reviews. As an independent media company, Notebookcheck is not subjected to the authority of manufacturers, retailers or publishers.
This is how Notebookcheck is testing
Every year, Notebookcheck independently reviews hundreds of laptops and smartphones using standardized procedures to ensure that all results are comparable. We have continuously developed our test methods for around 20 years and set industry standards in the process. In our test labs, high-quality measuring equipment is utilized by experienced technicians and editors. These tests involve a multi-stage validation process. Our complex rating system is based on hundreds of well-founded measurements and benchmarks, which maintains objectivity. Further information on our test methods can be found here.

