

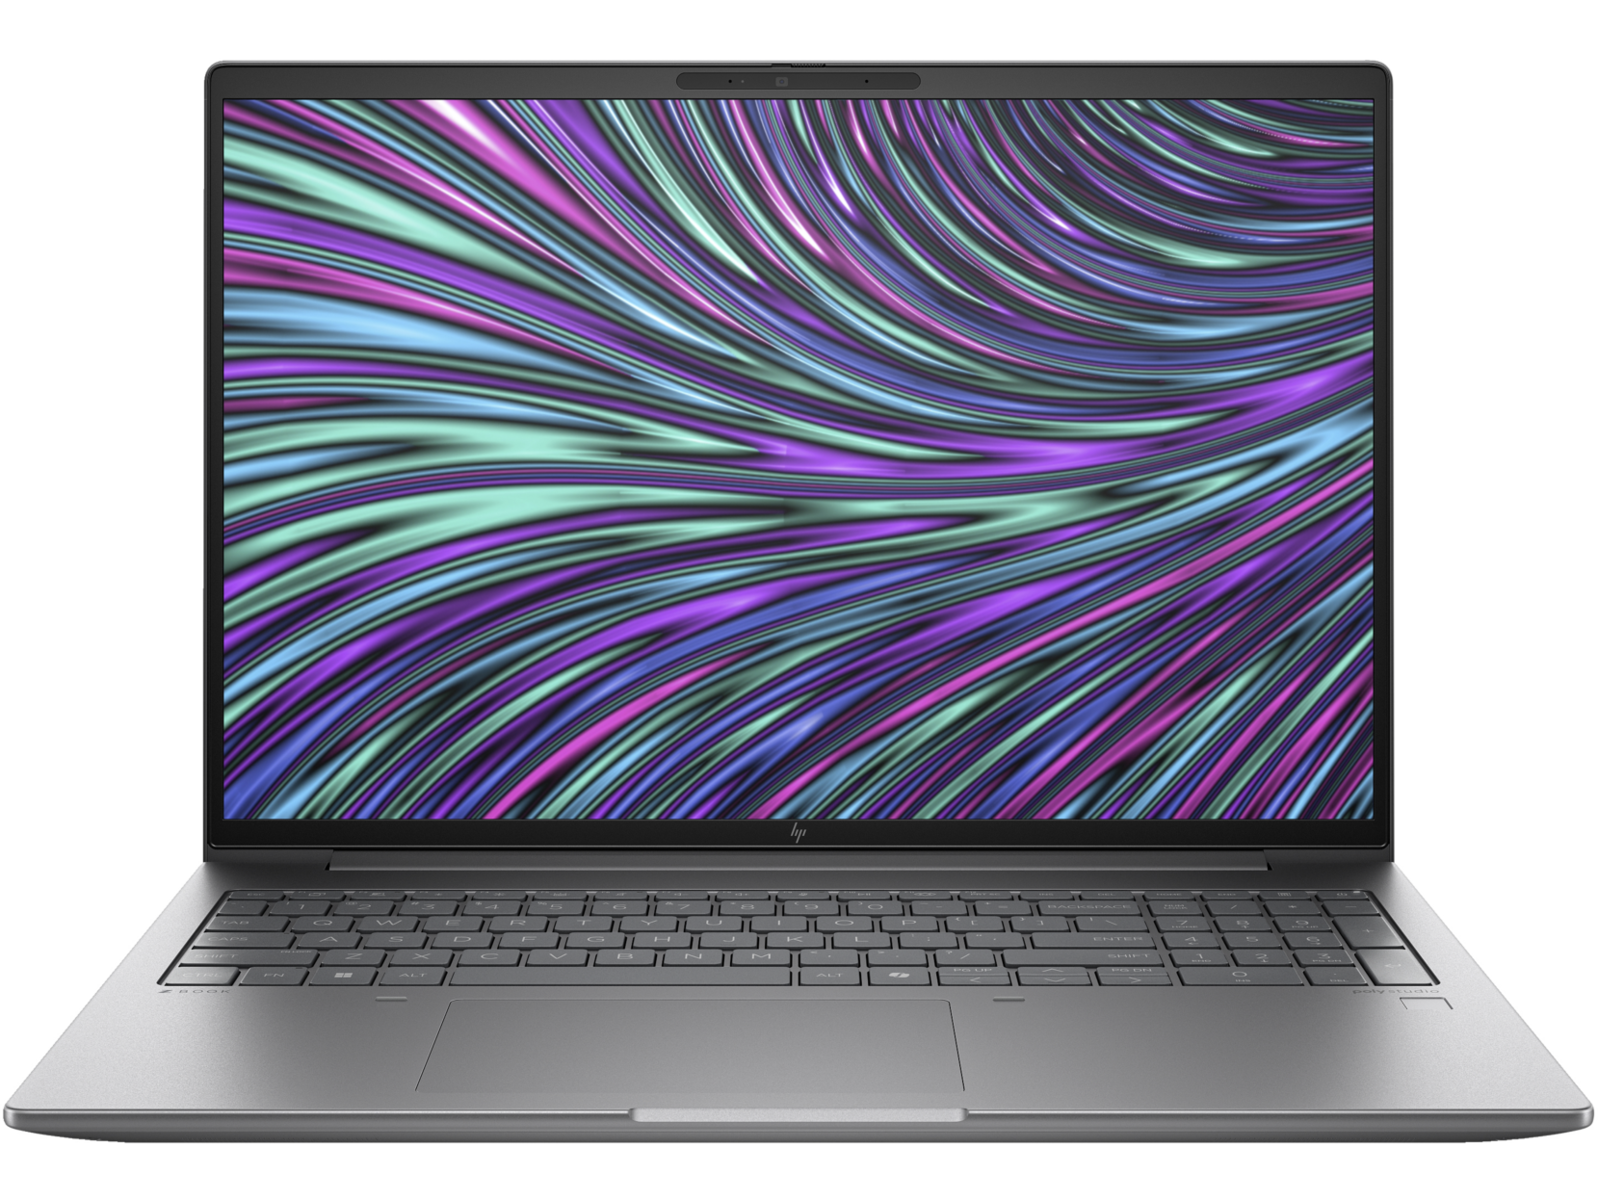
惠普 ZBook Power 16 G11 A 评测:配备 AMD Zen 4 的强大工作站

ZBook Power 16 G11 继承了老款 ZBook Power 15 G10 的设计,采用了新的内部处理器和新的外观变化。顾名思义,ZBook Power 16 G11 取消了旧的 15.6 英寸外形,采用 16 英寸设计,使该系列更加现代化。在性能方面,它介于低端的 ZBook Firefly 和高端的 ZBook Fury 之间。用户可以配置流星湖英特尔酷睿 Ultra 处理器或 AMD Ryzen Zen 4 处理器和 Nvidia RTX 显卡。
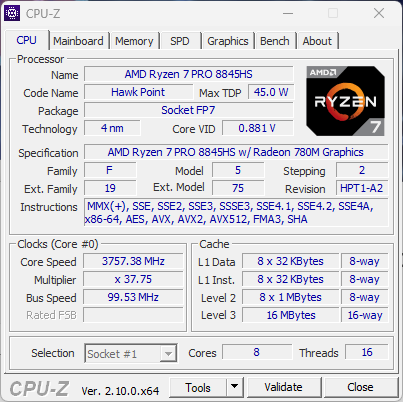
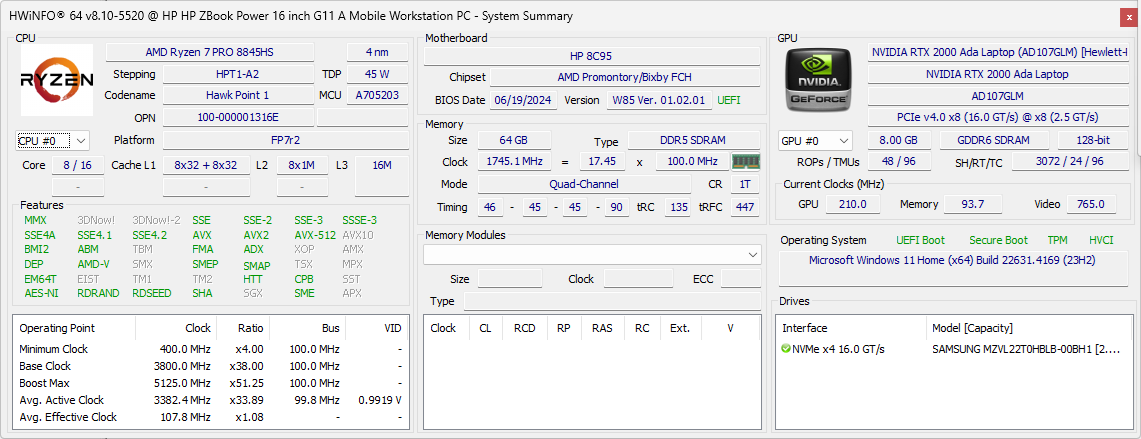
我们这次评测的是更高端的 AMD 配置(ZBook Power 16 G11 A),配备 Ryzen 7 8845HS CPU、RTX 2000 Ada GPU 和 120Hz 2560 x 1600p IPS 显示屏,售价约为 2100 美元。从 Ryzen 5 8645HS 到配备 1200p 显示屏和 RTX 1000、RTX 2000 或 RTX 3000 图形处理器的 Ryzen 9 8945HS,选择范围非常广泛。用户也可以选择完全不配备独立显卡。
该领域的竞争对手包括其他 16 英寸工作站,如 戴尔Precision 5690, 微星 CreatorPro Z16P或 联想 ThinkPad P16s G2.
更多惠普评测:
潜在的竞争对手比较
Rating | Version | Date | Model | Weight | Height | Size | Resolution | Price |
|---|---|---|---|---|---|---|---|---|
| 85.4 % | v8 | 10 / 2024 | HP ZBook Power 16 G11 A R7 8845HS, NVIDIA RTX 2000 Ada Generation Laptop GPU | 2.2 kg | 22.9 mm | 16.00" | 2560x1600 | |
| 88.9 % v7 (old) | v7 (old) | 12 / 2023 | HP ZBook Power 15 G10 R7 PRO 7840HS, NVIDIA RTX 2000 Ada Generation Laptop GPU | 2 kg | 22.9 mm | 15.60" | 2560x1440 | |
| 85.9 % | v8 | 08 / 2024 | HP ZBook Fury 16 G11 i9-14900HX, NVIDIA RTX 3500 Ada Generation Laptop GPU | 2.6 kg | 28.5 mm | 16.00" | 3840x2400 | |
| 83.5 % | v8 | 10 / 2024 | Lenovo ThinkPad P1 Gen 7 21KV001SGE Ultra 7 155H, NVIDIA GeForce RTX 4060 Laptop GPU | 2 kg | 20.5 mm | 16.00" | 2560x1600 | |
| 88.6 % v7 (old) | v7 (old) | 01 / 2024 | Lenovo ThinkPad P16s G2 21K9000CGE R7 PRO 7840U, Radeon 780M | 1.8 kg | 24.4 mm | 16.00" | 3840x2400 | |
| 88.3 % v7 (old) | v7 (old) | 05 / 2024 | Dell Precision 5690 Ultra 9 185H, NVIDIA RTX 5000 Ada Generation Laptop GPU | 2.3 kg | 22.17 mm | 16.00" | 3840x2400 |
注:我们最近更新了评级系统,第 8 版的结果与第 7 版的结果不具可比性。更多信息 此处.
外壳 - 通过 MIL-STD 810 认证
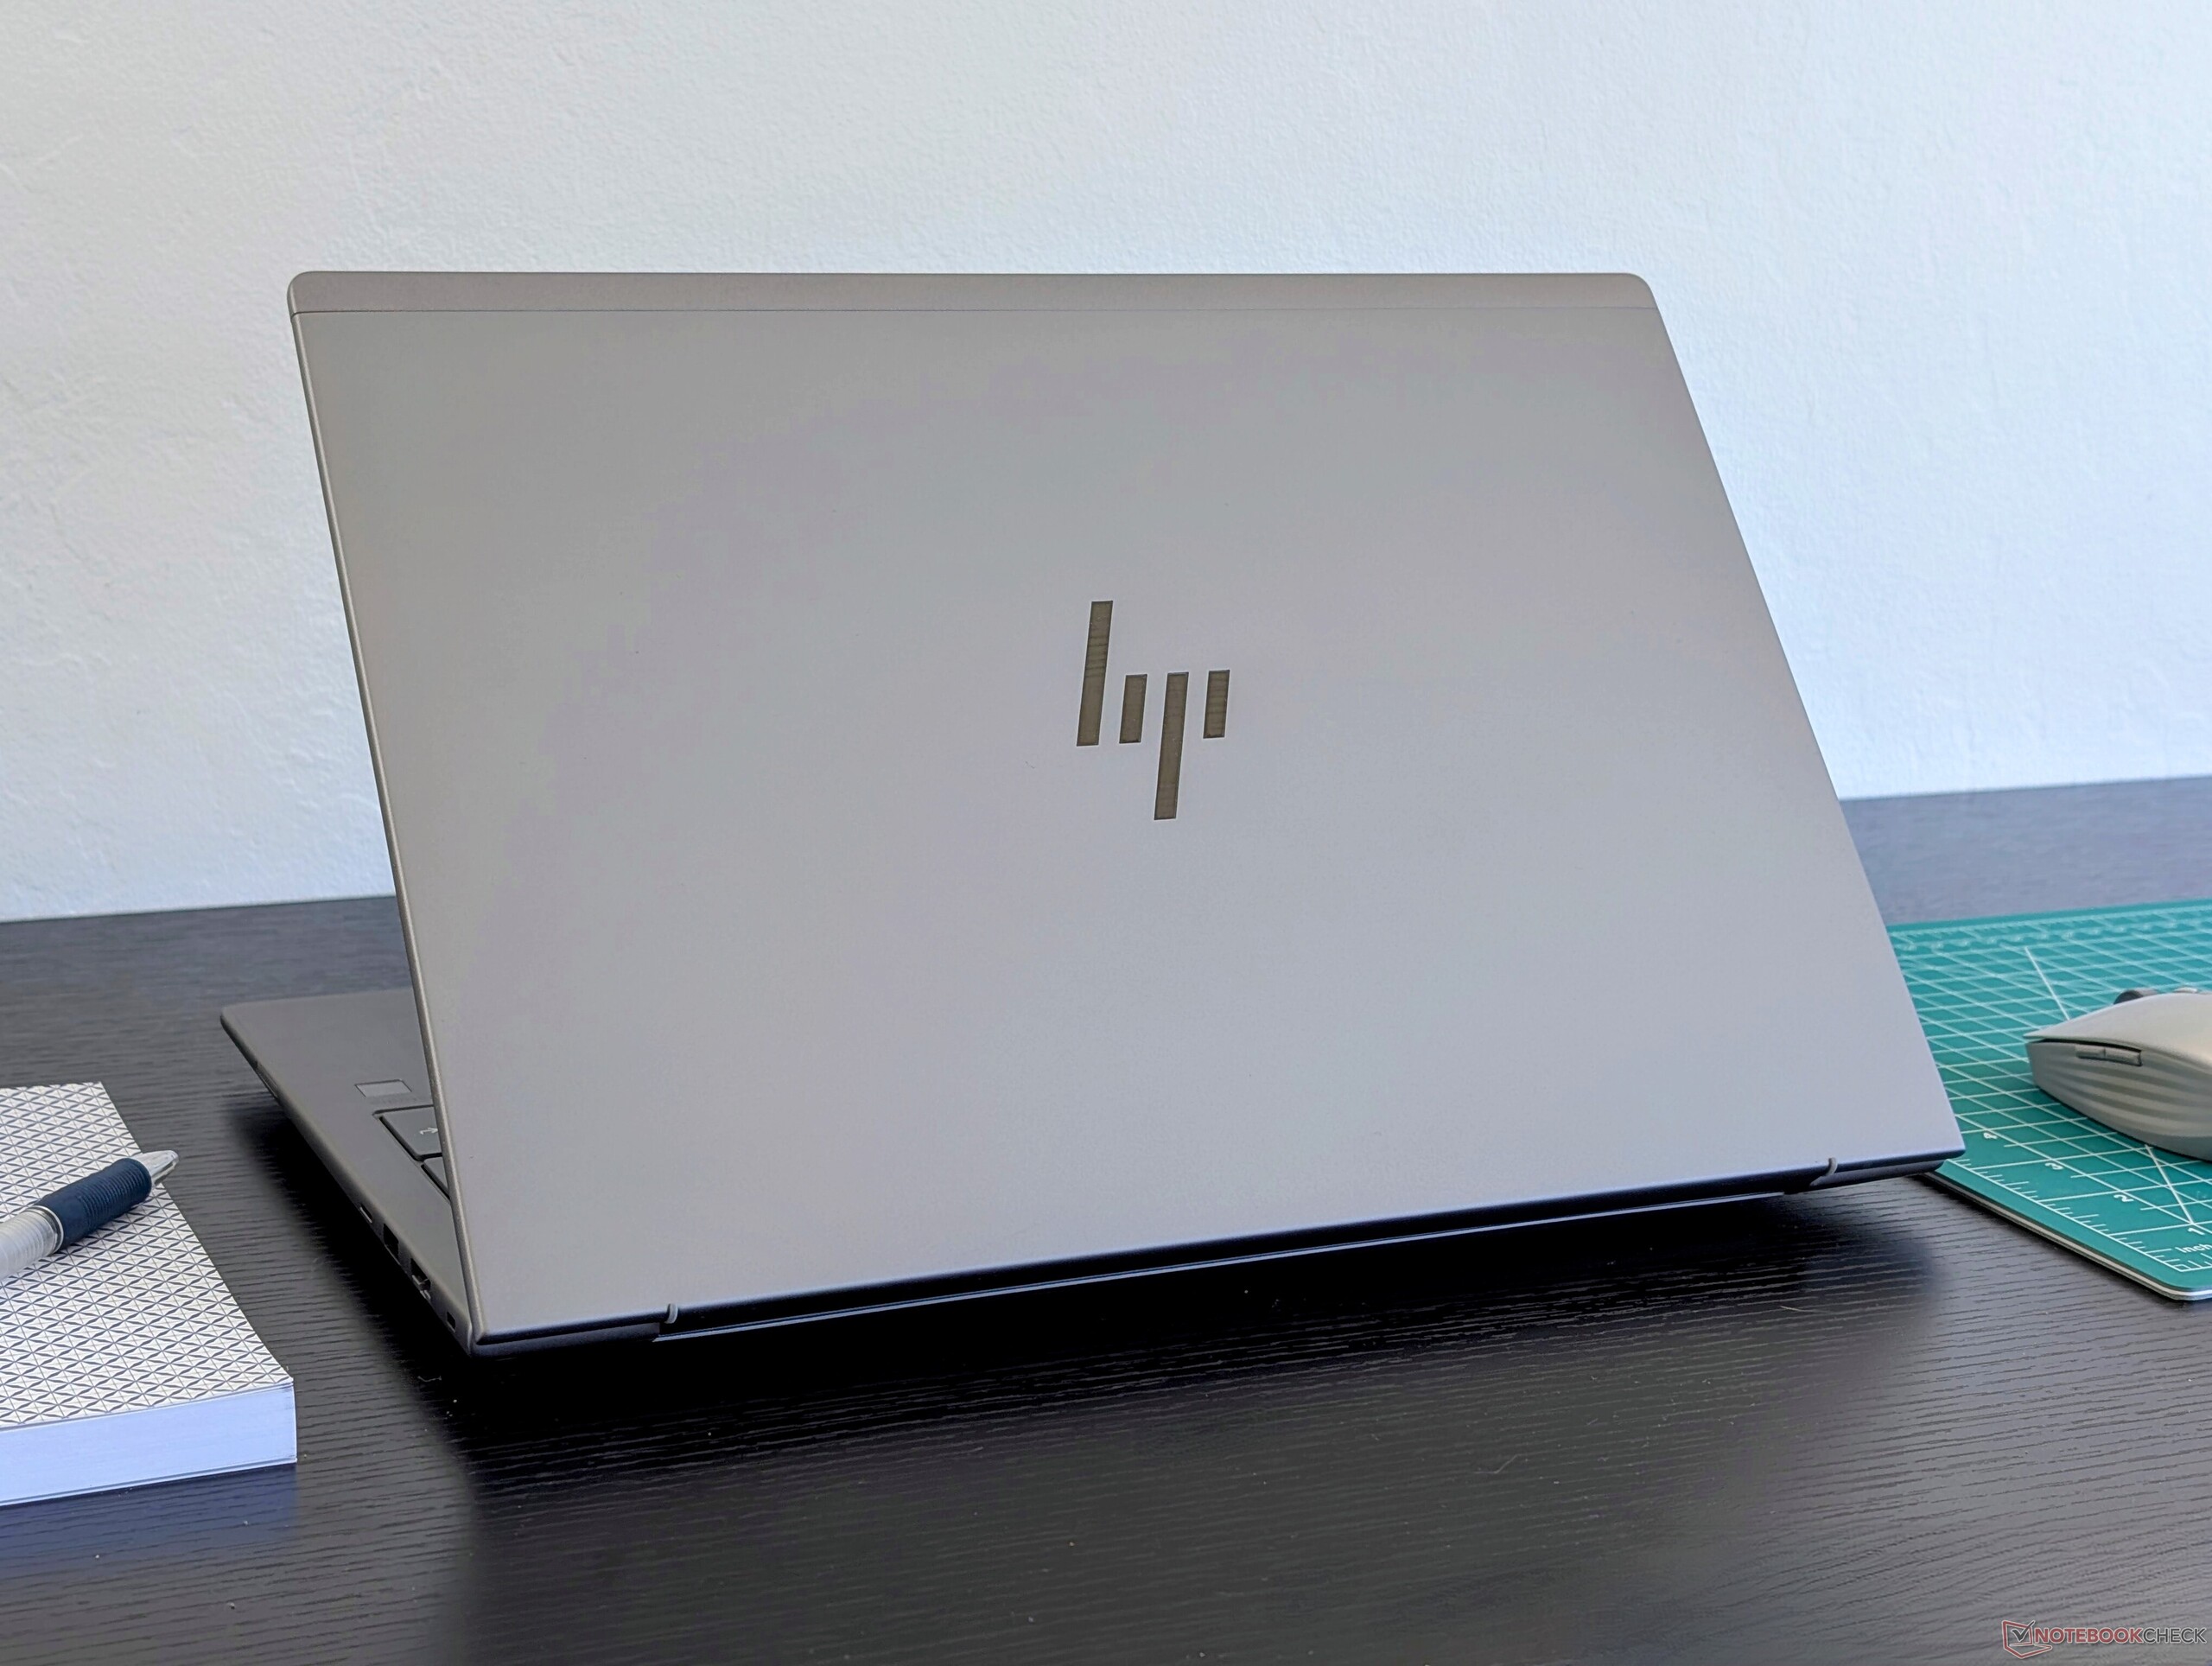
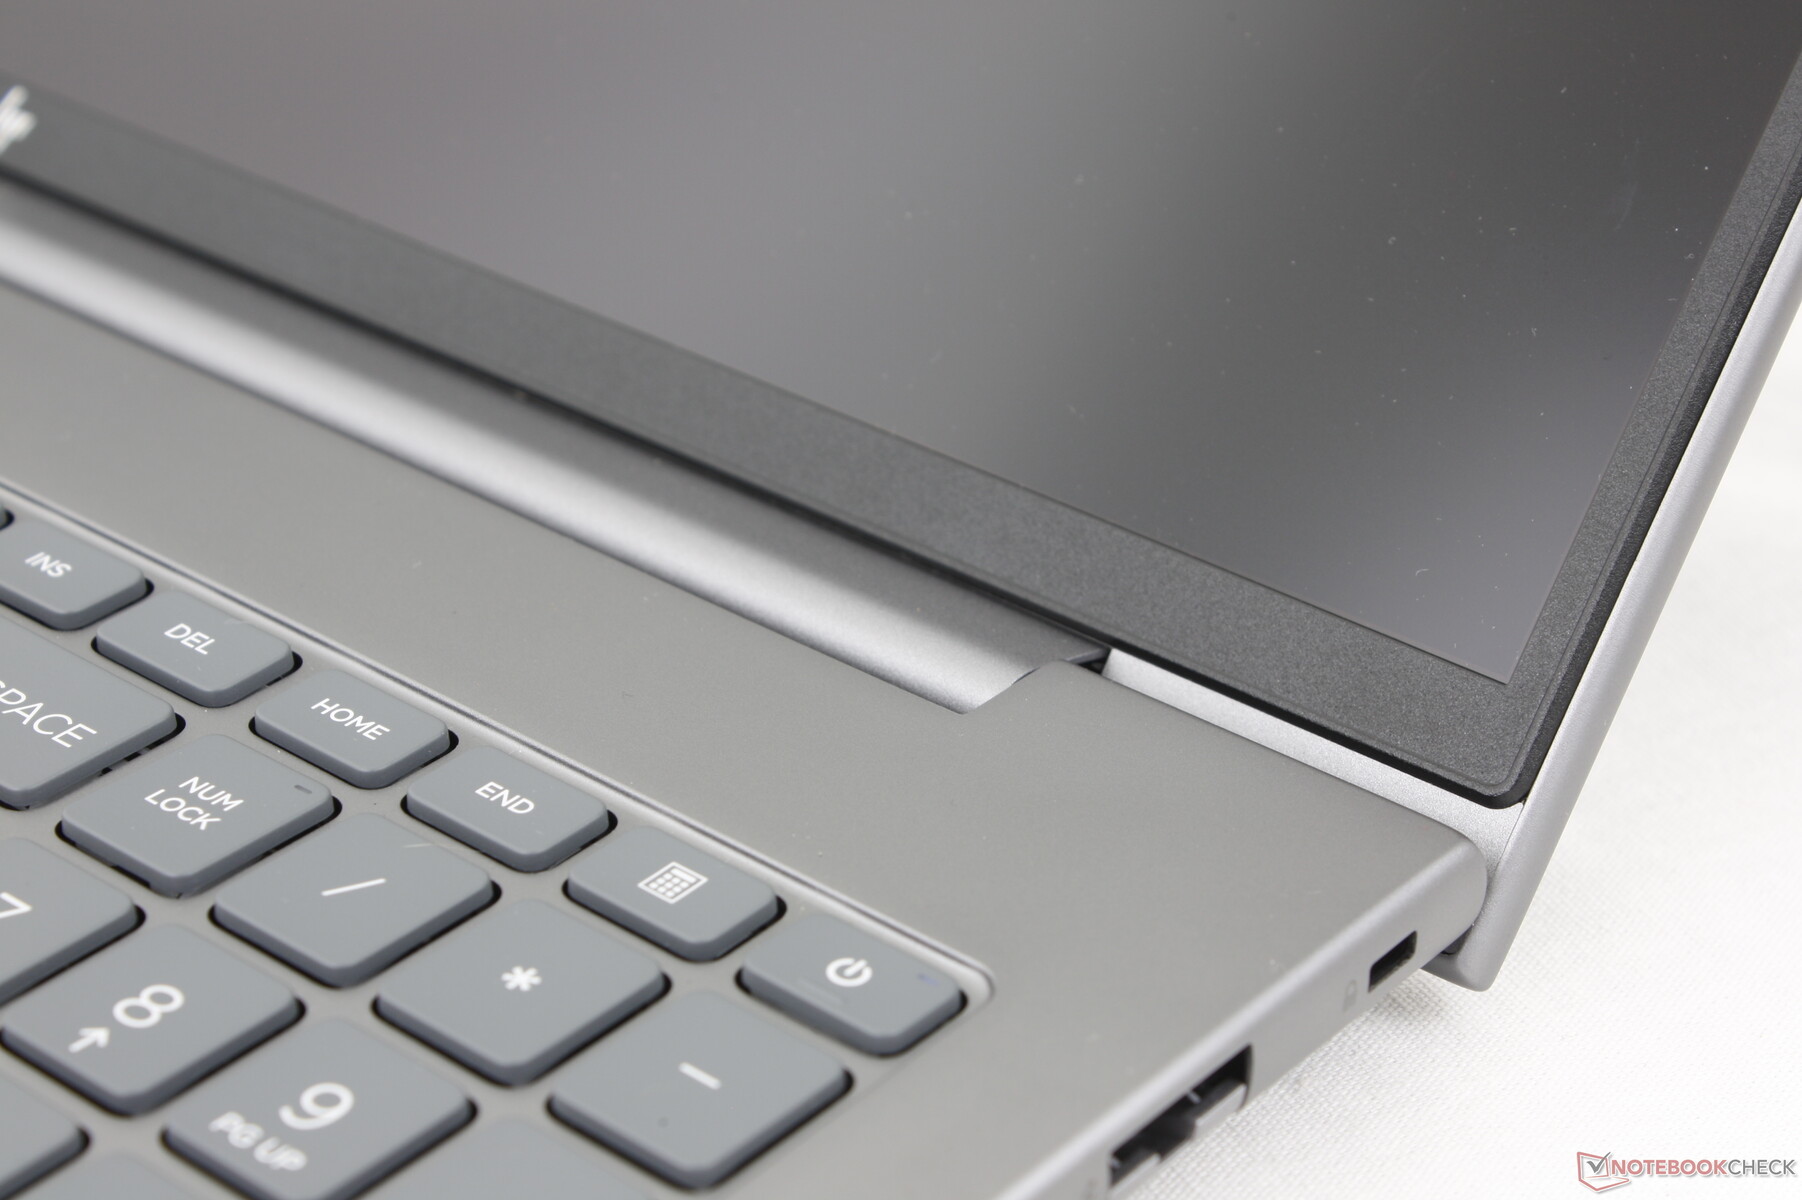
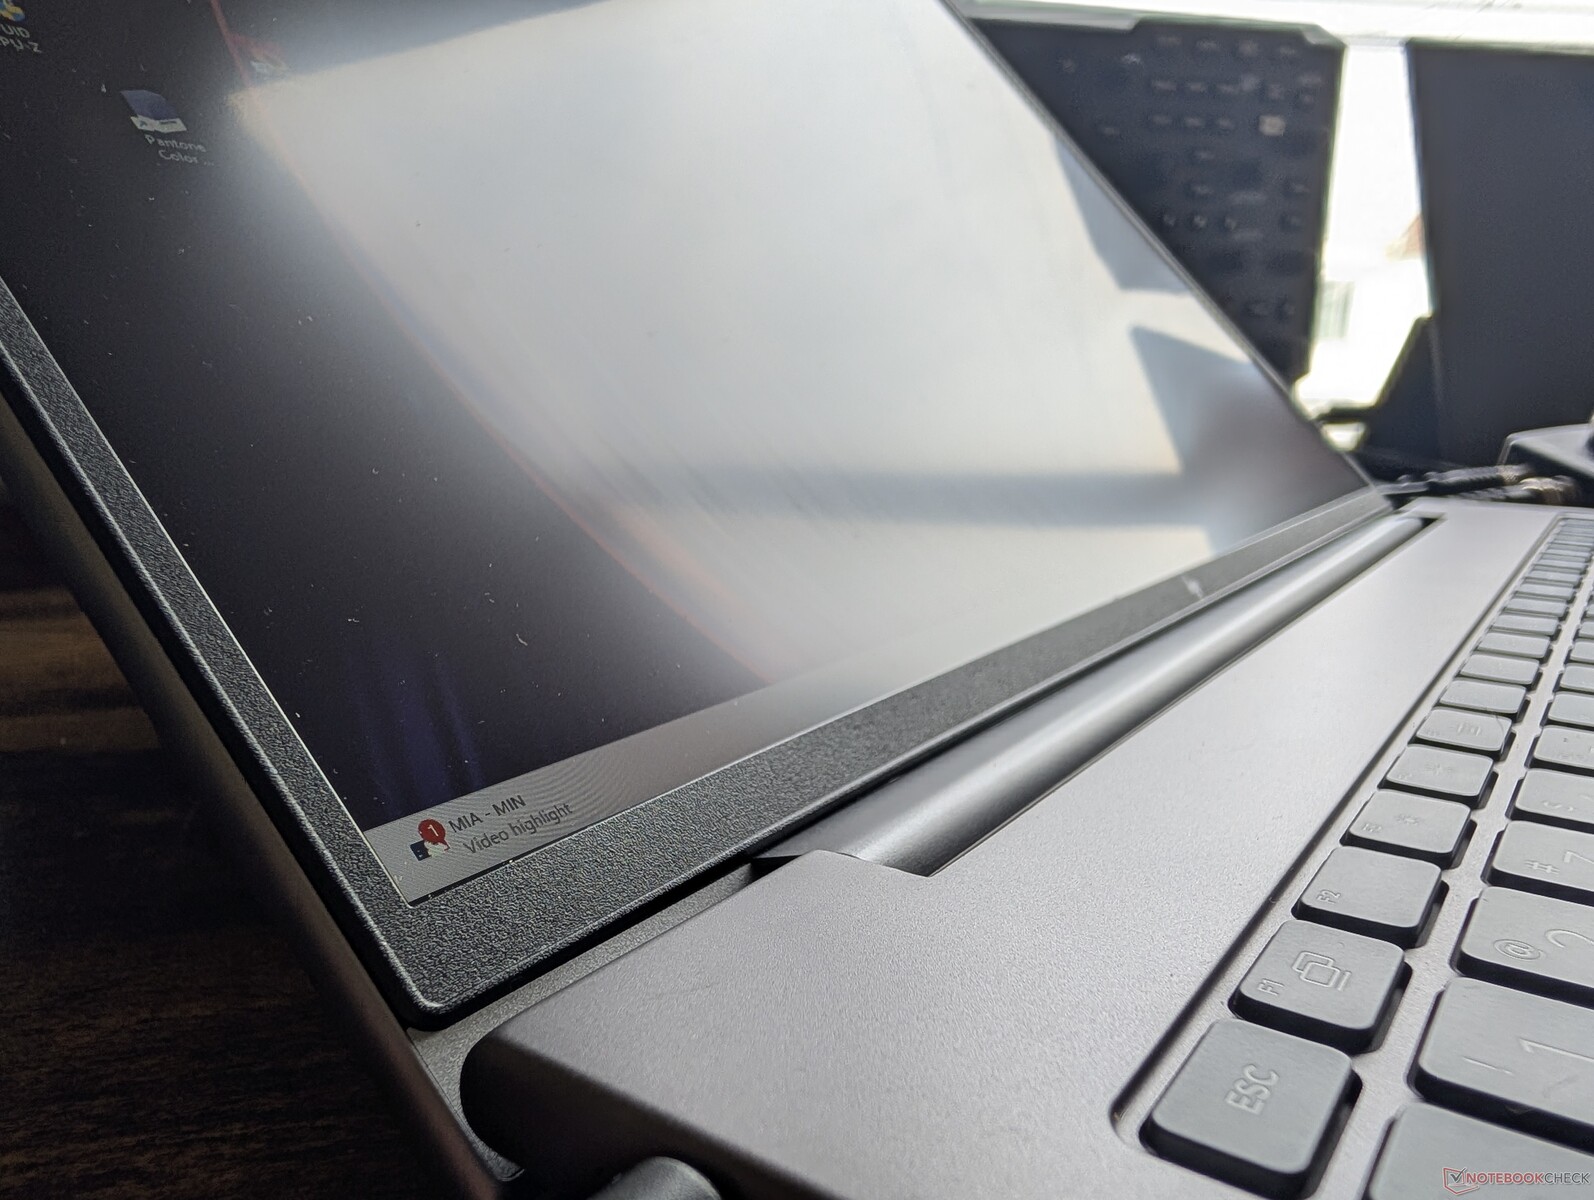
惠普几乎所有的 ZBook 机型都采用了类似的灰色铝合金材料,以保持整个系列的一致性。在这种情况下,ZBook Power 16 G11 采用了与 ZBook Power 15 G10 相同的光滑哑光金属质感,但在键盘边框、外盖饰边和底板上做了表面改动。
机箱的刚性非常好,在试图扭转底座时,弯曲和凹陷都很小。不过,铰链和盖子本应更加坚固,尤其是盖子几乎可以完全打开 180 度,这与 Precision 5690.
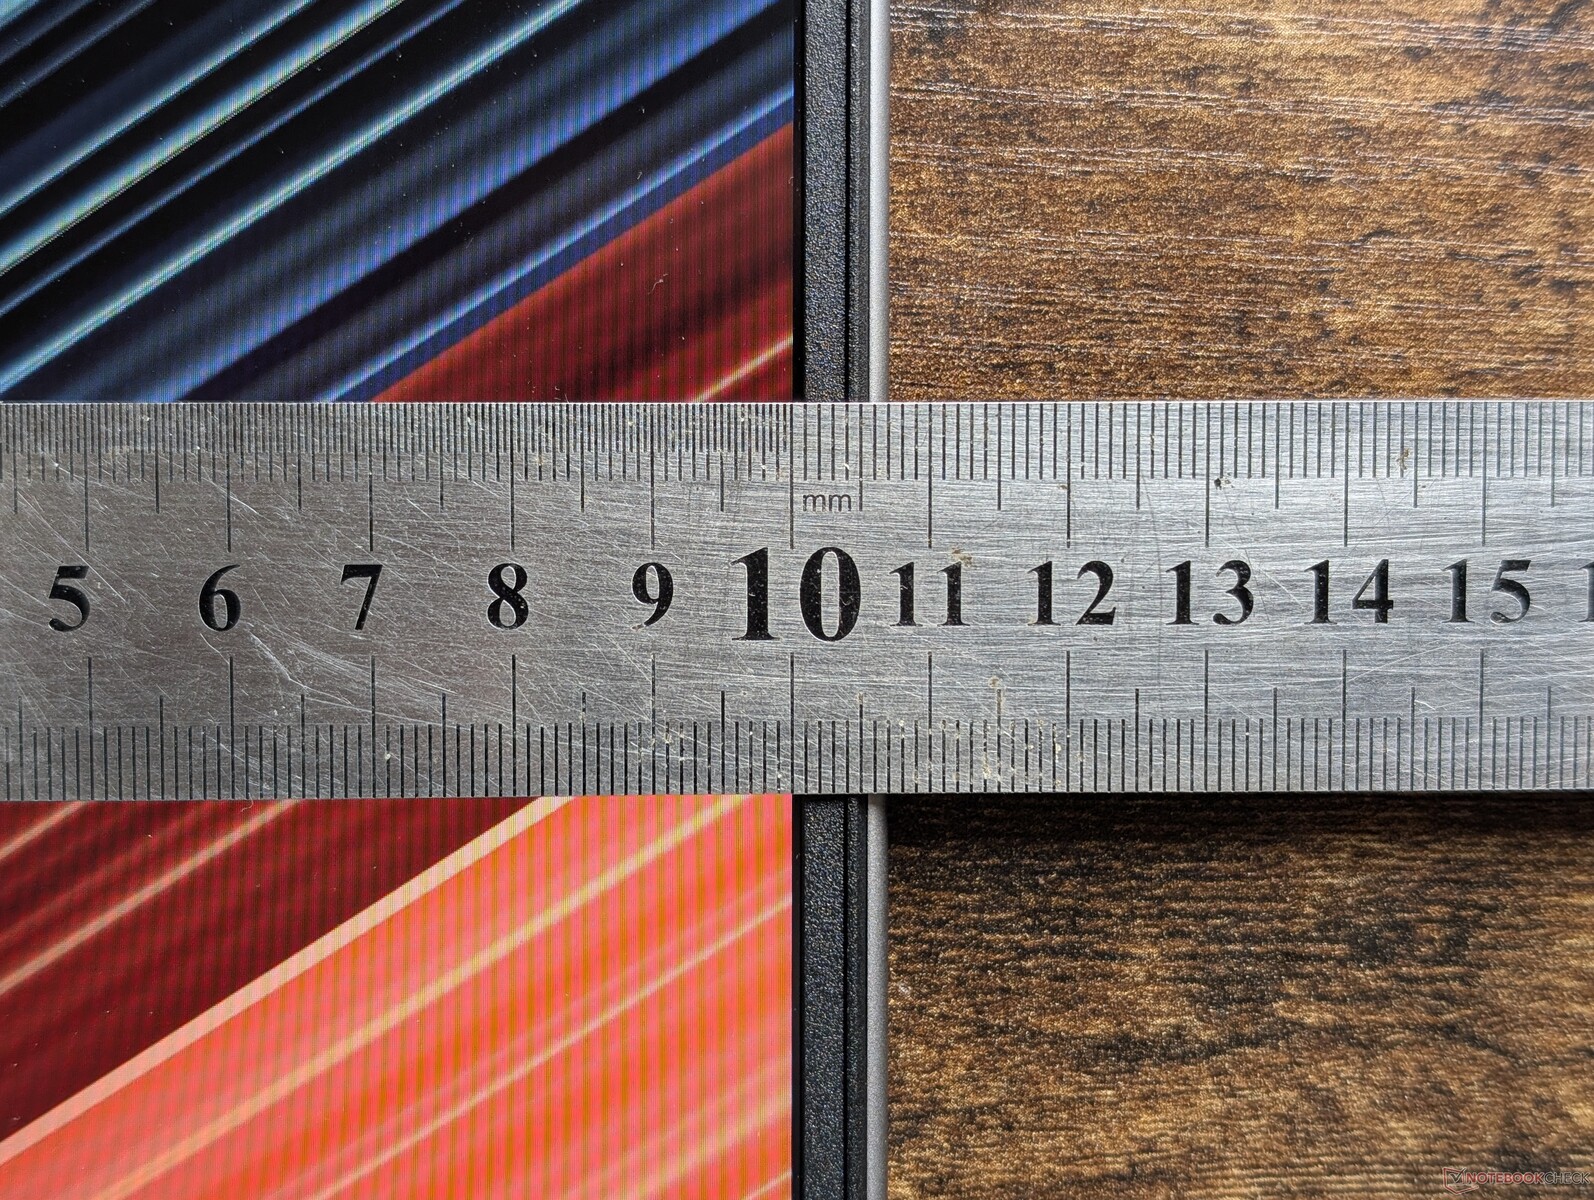
新的 16 英寸设计比即将推出的 15 英寸机型重约 10%,大约 7%。但它并没有变薄,这一点令人遗憾,因为它已经比一些竞争对手(如 ThinkPad P1 7 代)更厚了。笔记本 ZBook Fury 16 G11ZBook Fury 16 G11 更重、更厚,但有更快的 CPU 和 GPU 可供选择。惠普提供更轻薄的 ZBook Firefly 16系列,以满足用户更便携的需求。
连接性 - Thunderbolt 4 端口
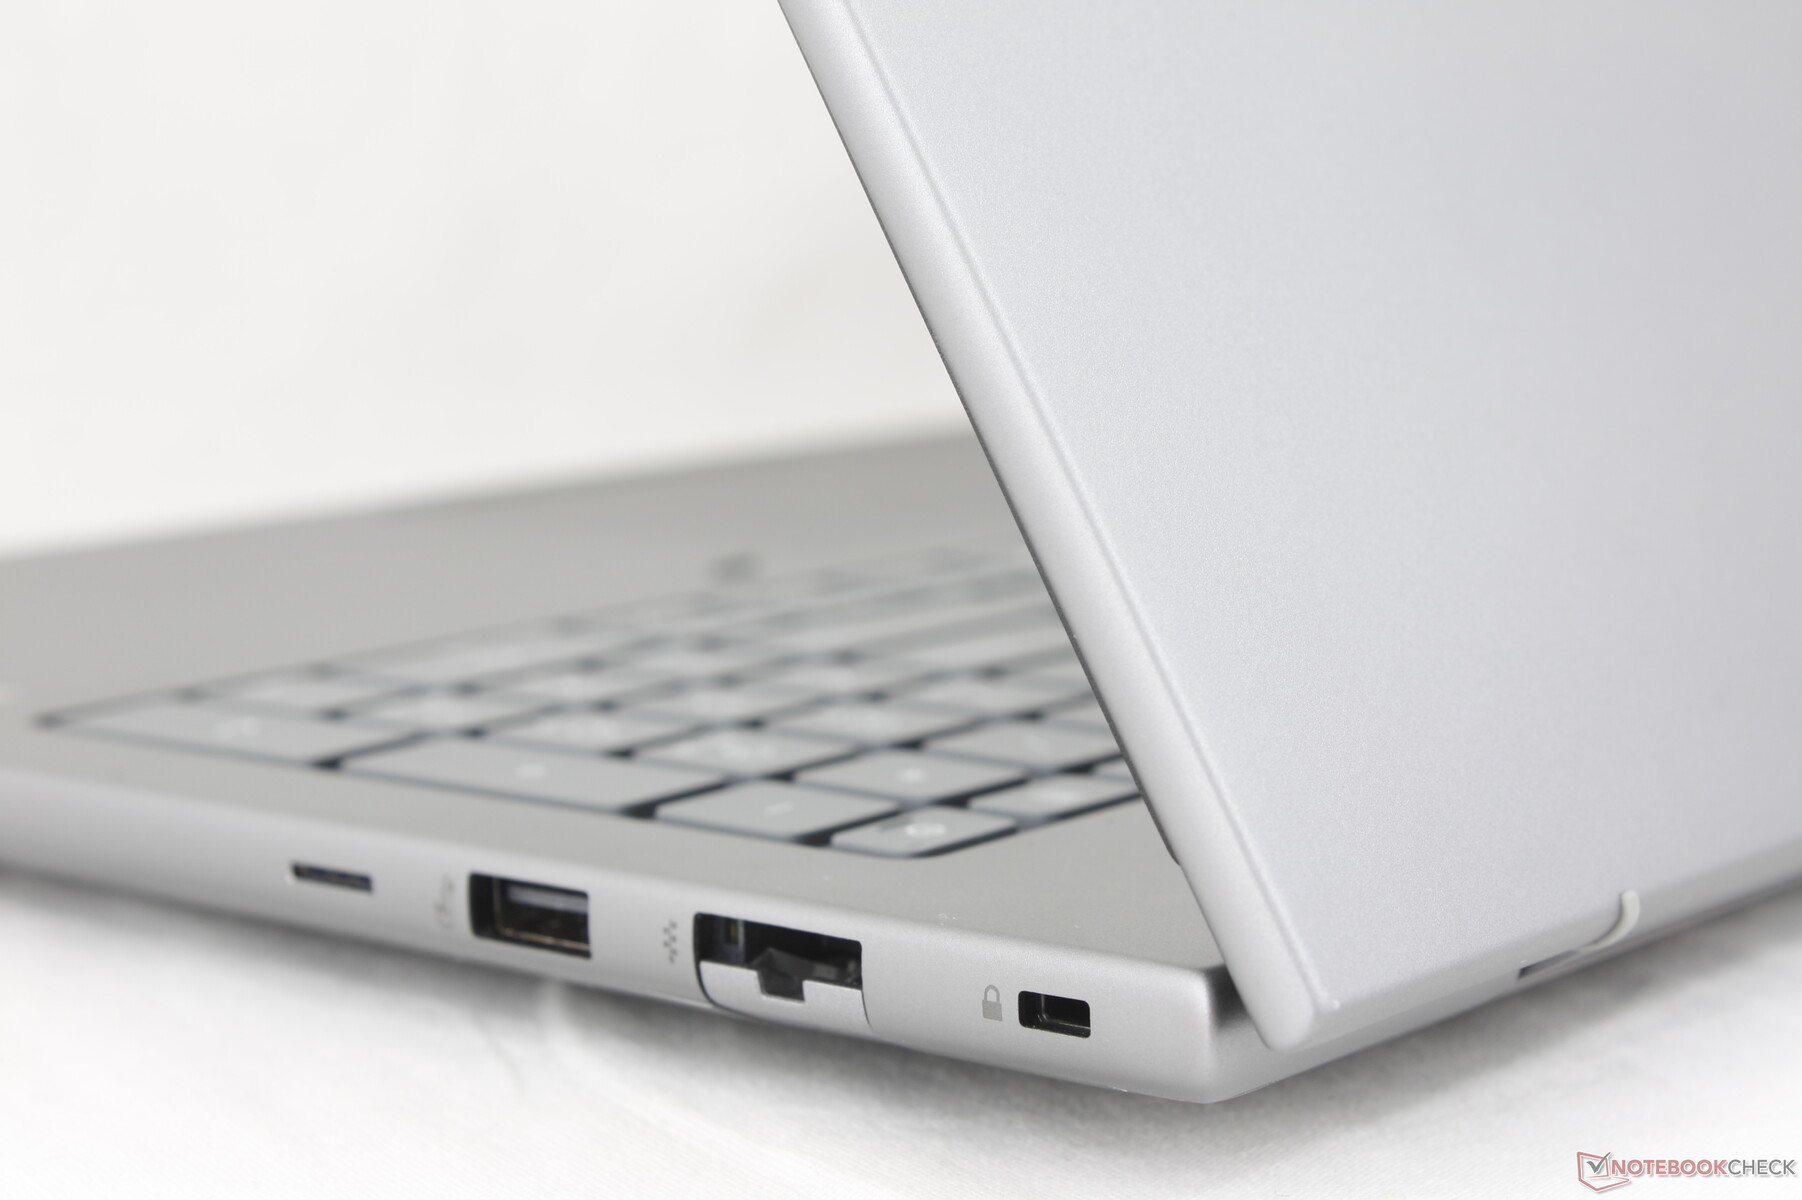
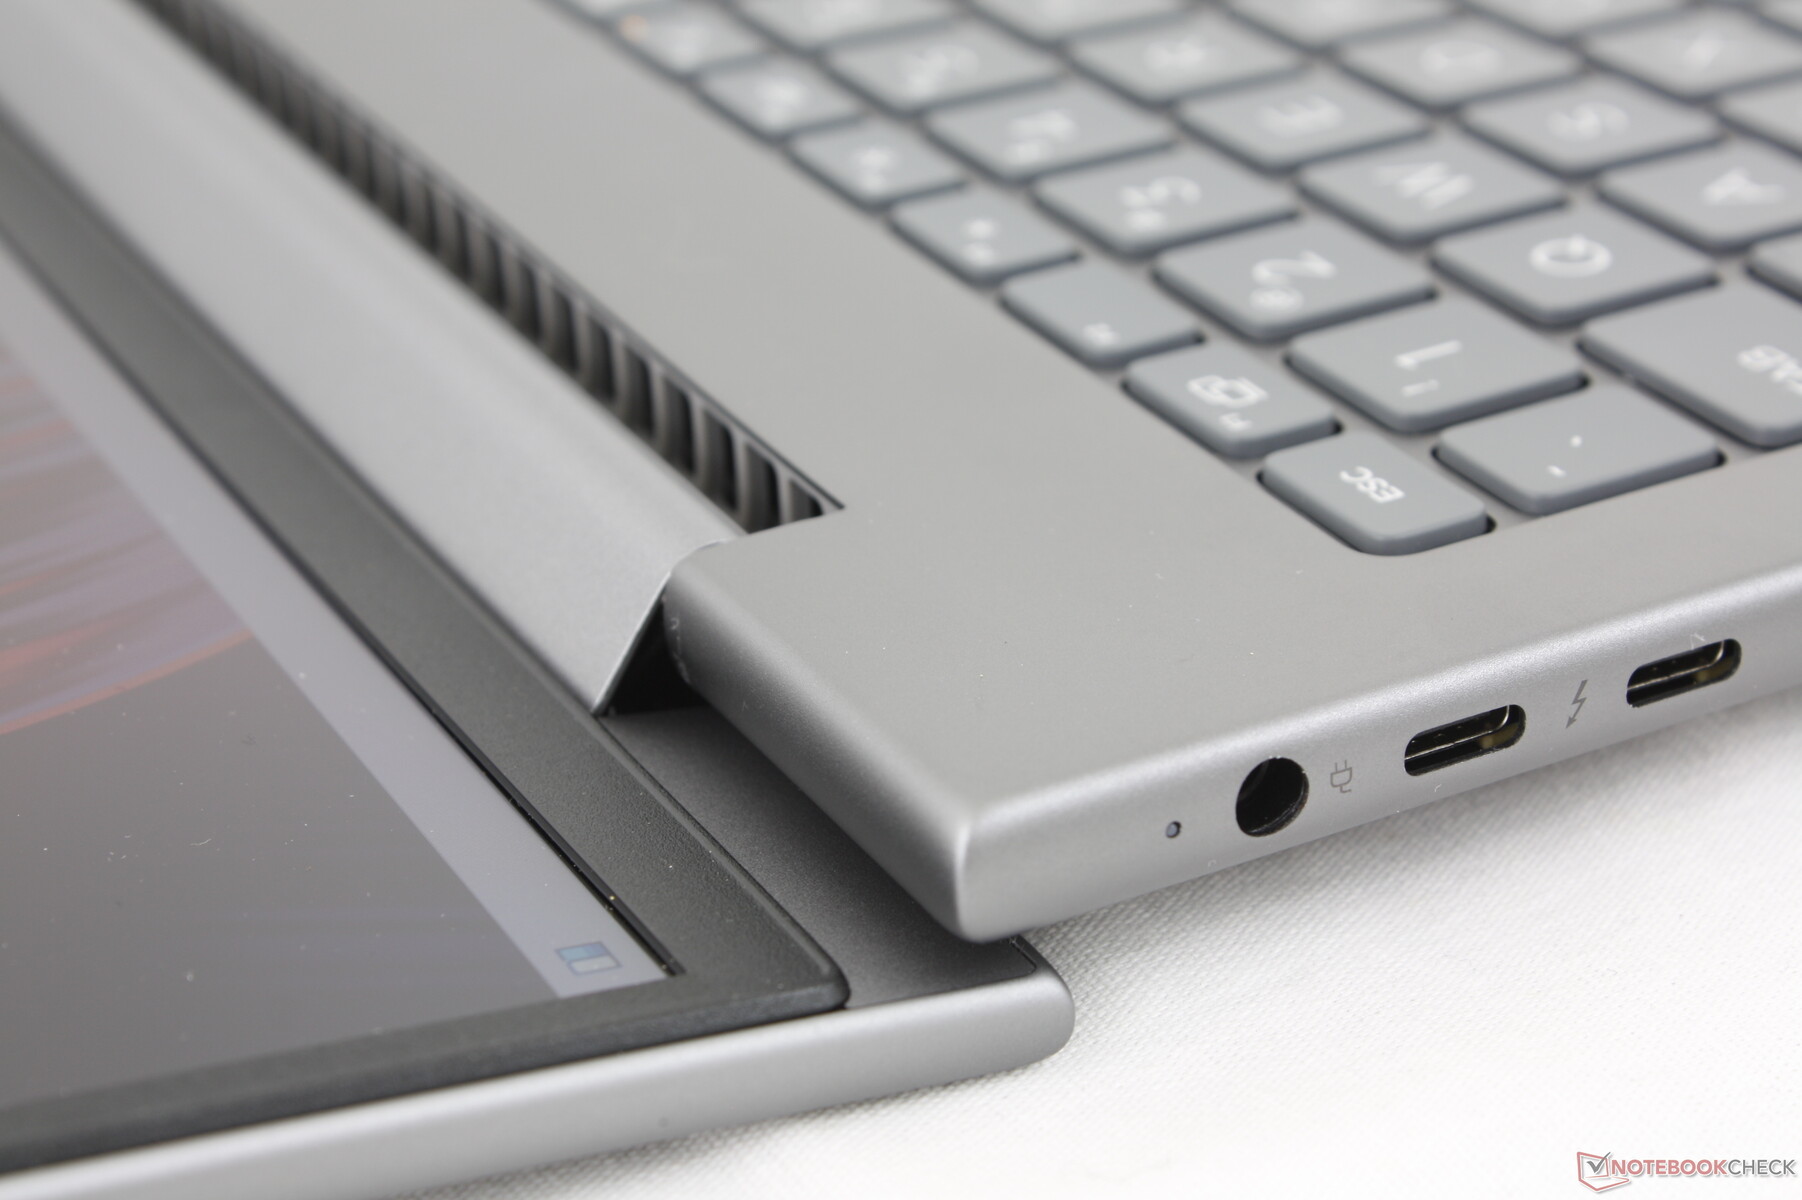
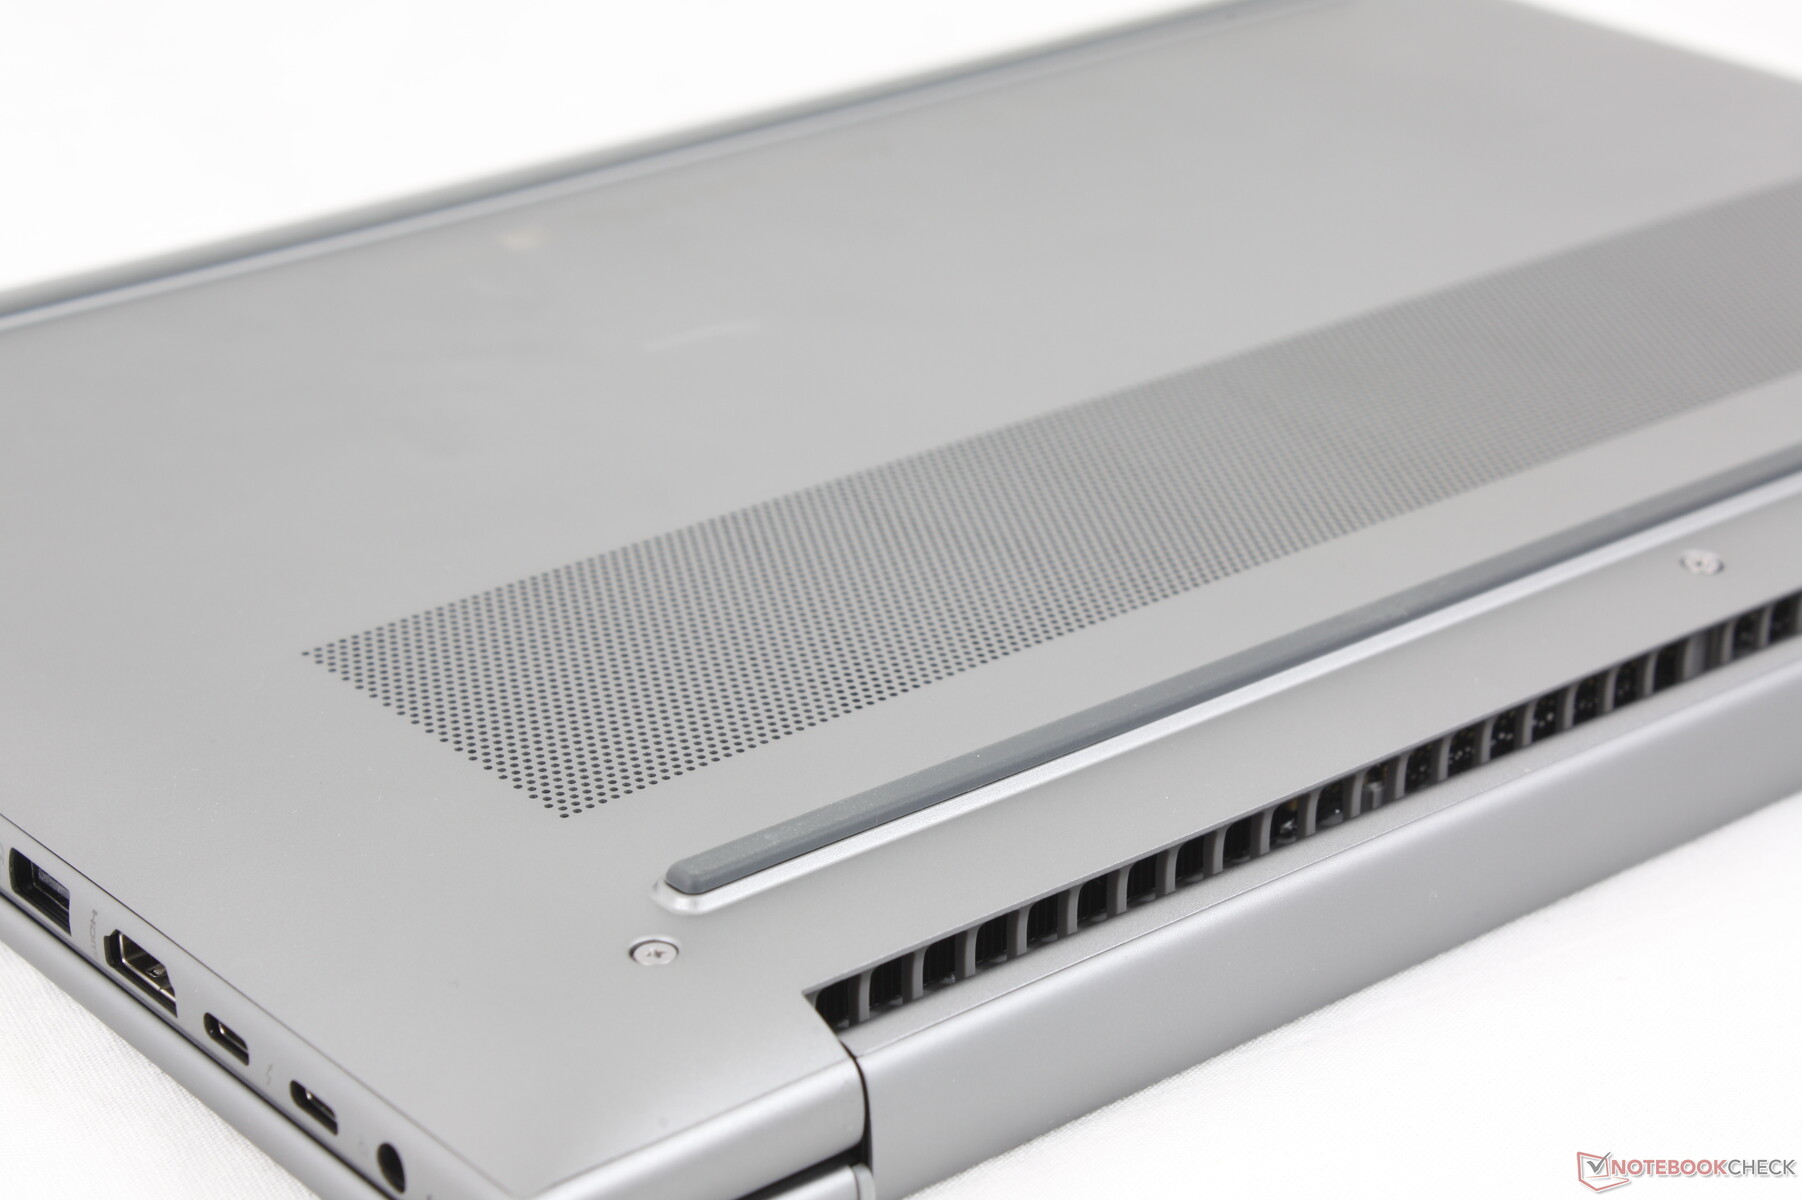
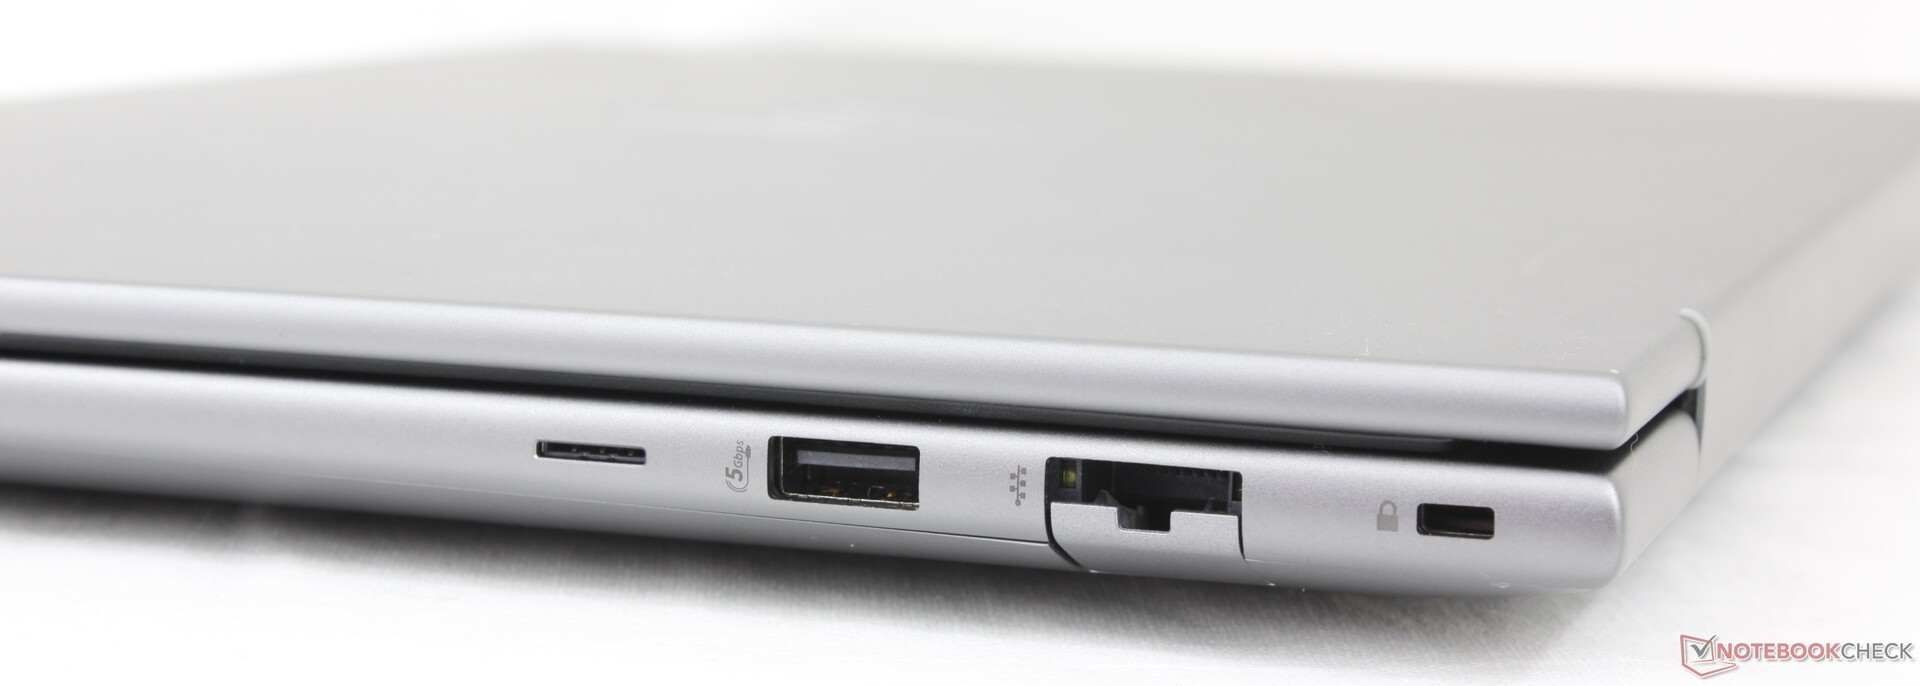
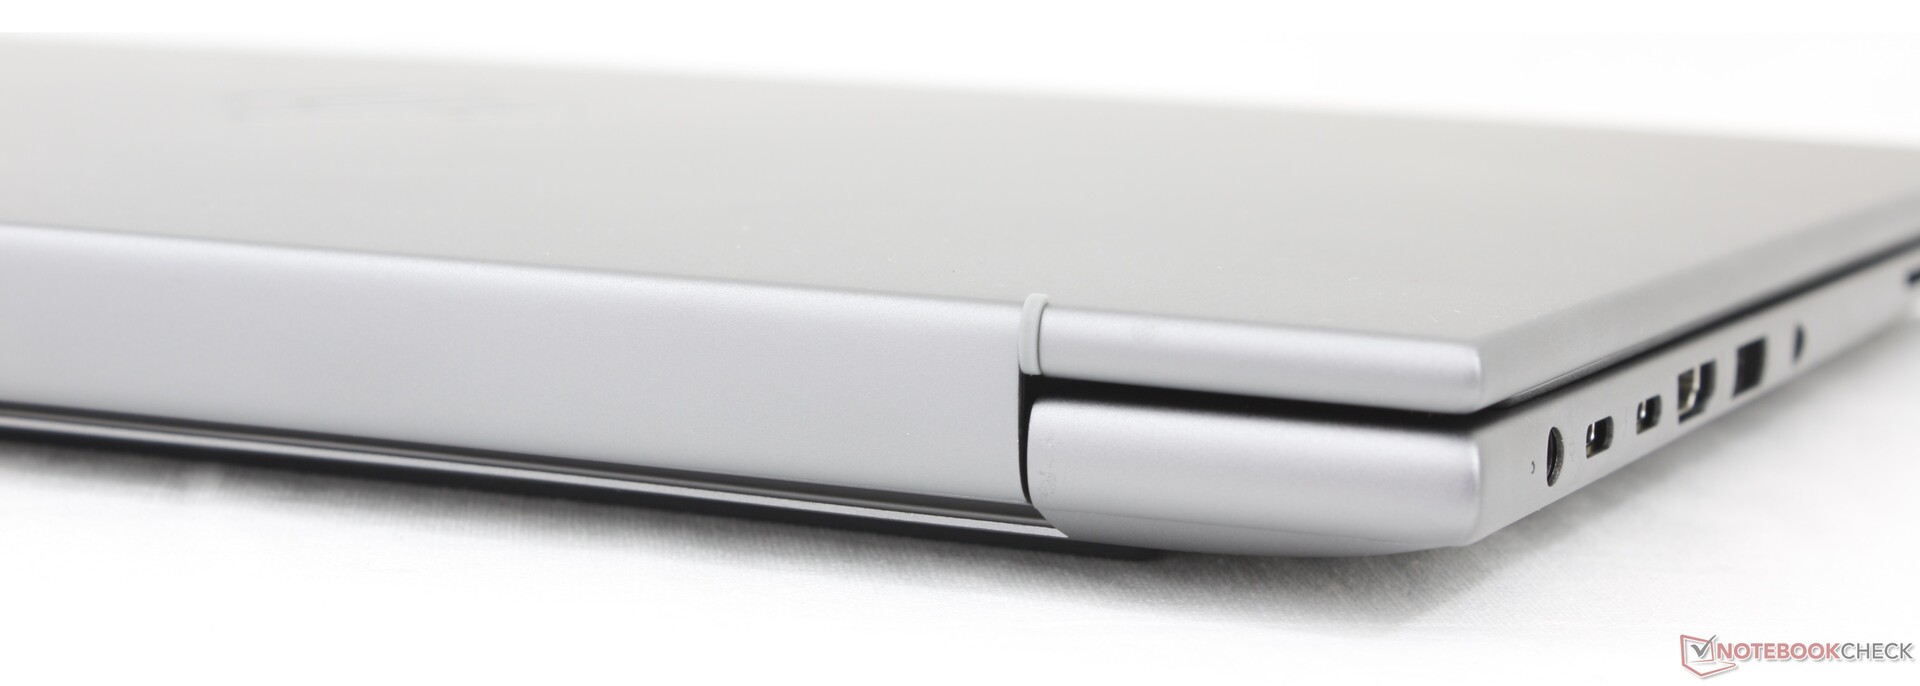
与去年的 ZBook Power 15 G10 相比,该机型减少了 USB-A 端口。其他所有接口都回来了,包括智能卡读卡器和双 USB-C Thunderbolt 4 端口,只是重新排列了一下。尤其是左侧边缘的端口过于拥挤,可以再分散一些。

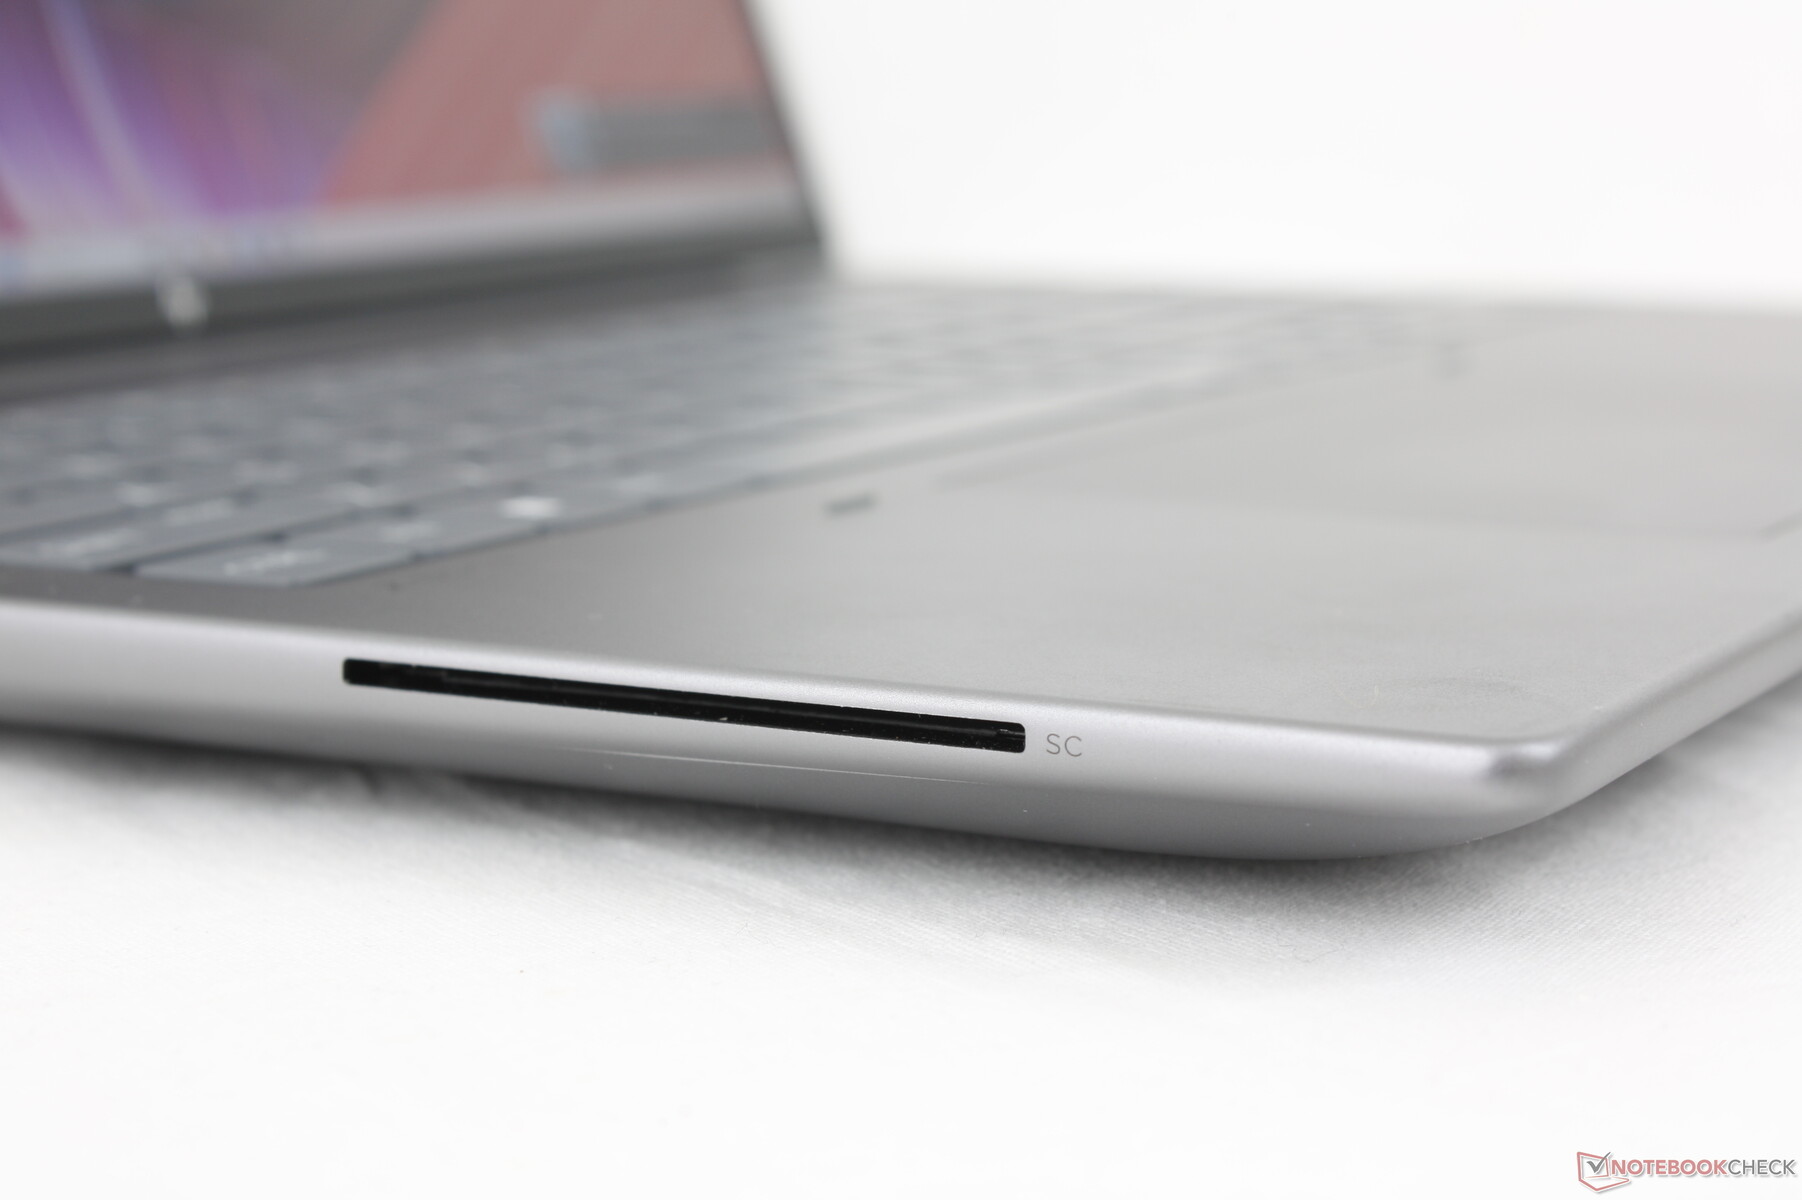
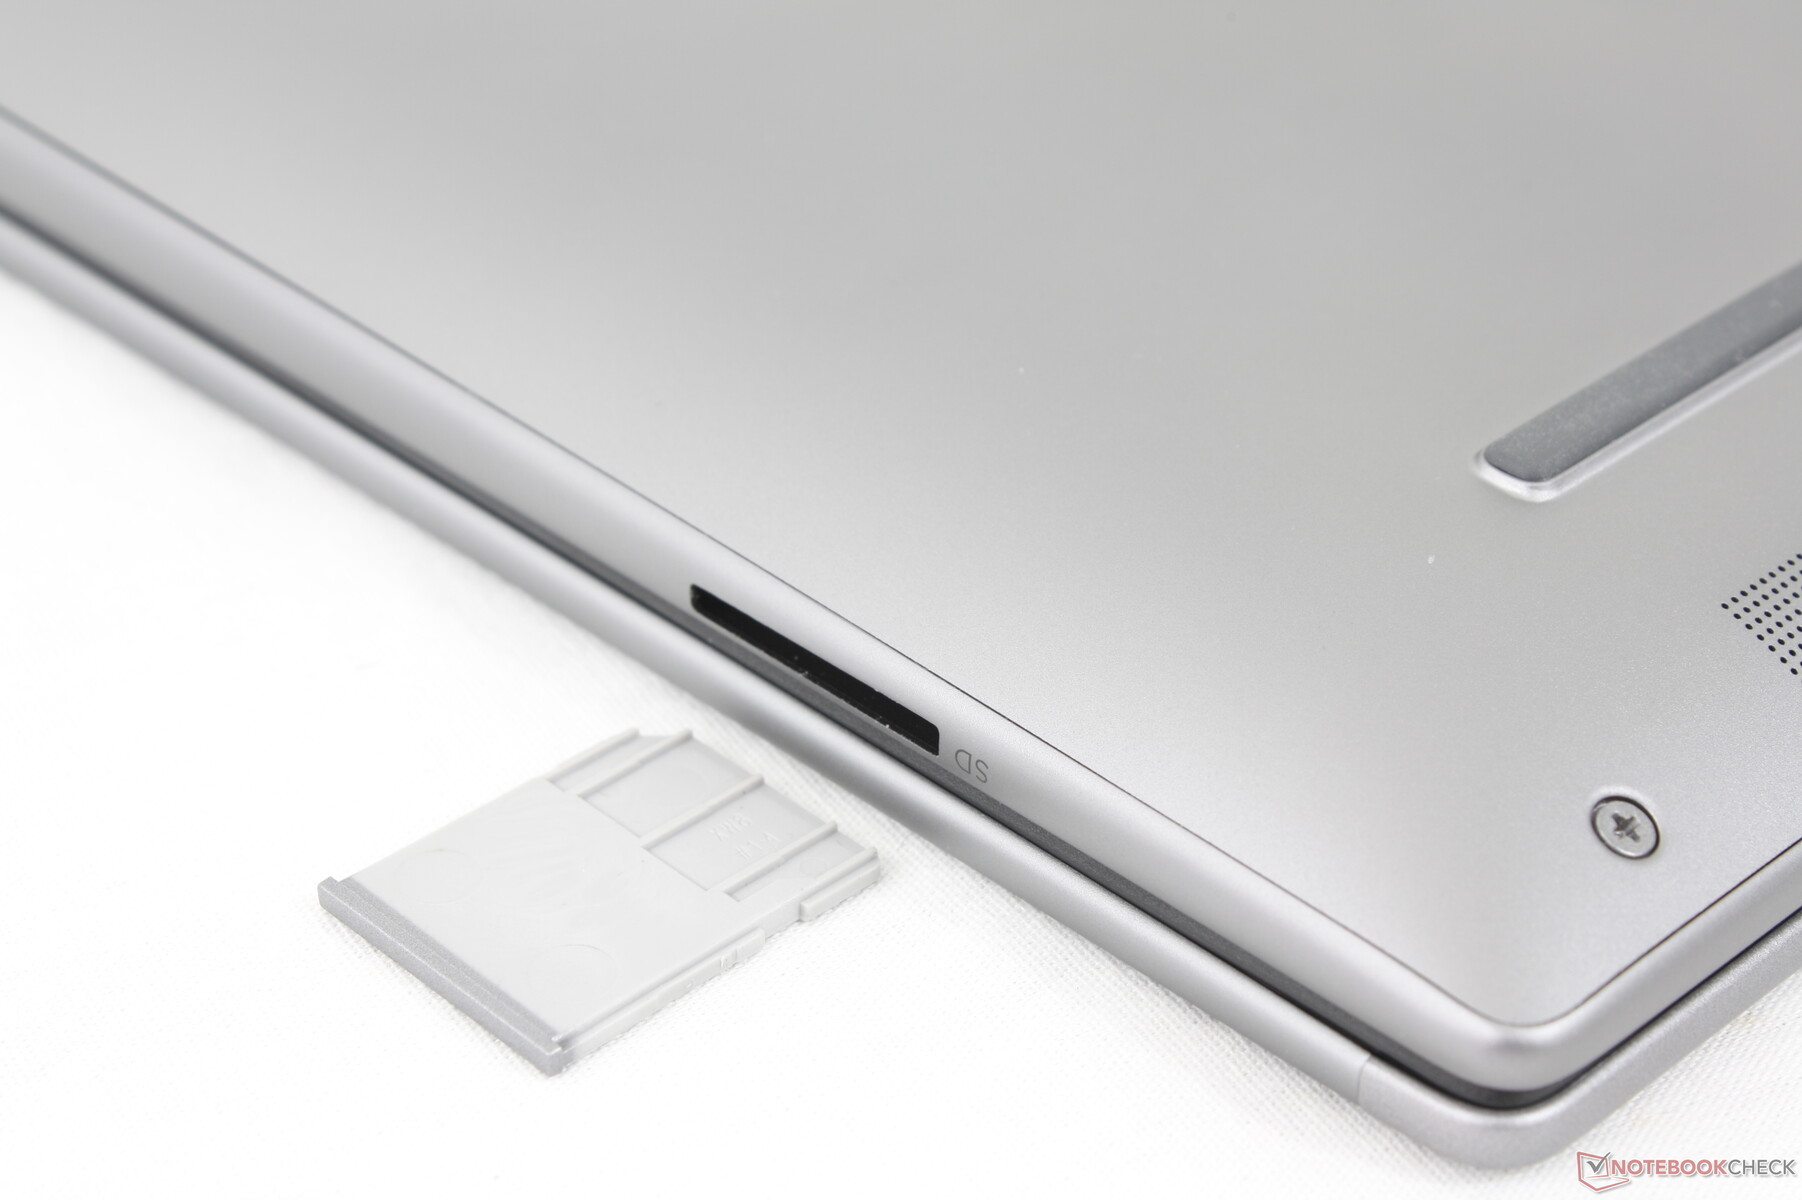
SD 读卡器
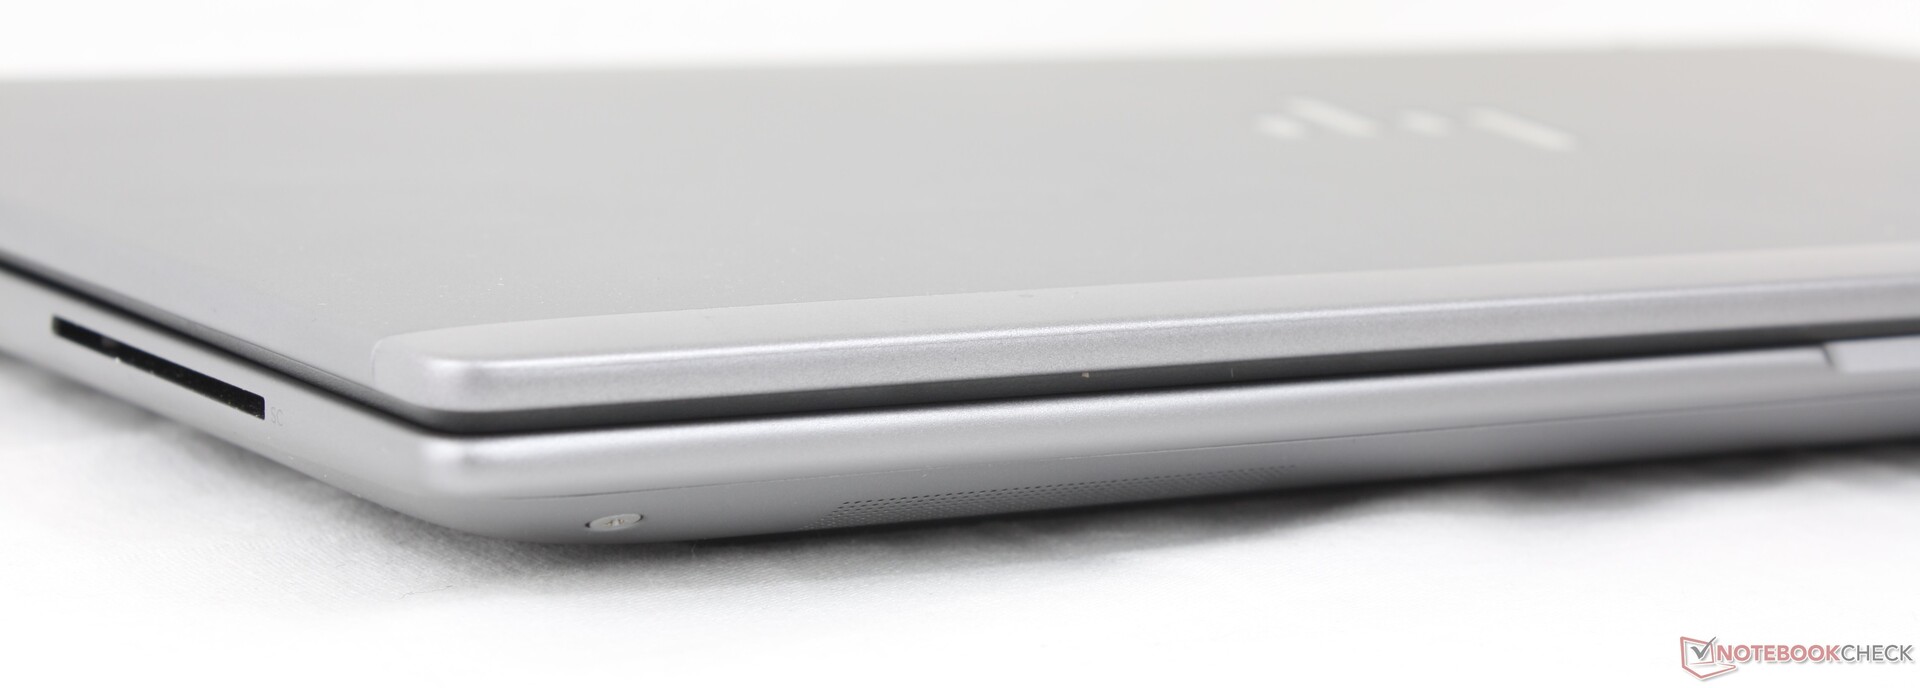
该机型集成了 MicroSD 读卡器,而 ZBook Power 15 G10 却没有这项功能。传输速率非常快;从我们的 UHS-II 测试卡中传输 1 GB 的图片只需不到 6 秒,而 ZBook Fury 16 G11 或 ThinkPad P1 Gen 7 则需要 12 秒。
| SD Card Reader | |
| average JPG Copy Test (av. of 3 runs) | |
| HP ZBook Power 16 G11 A (Toshiba Exceria Pro SDXC 64 GB UHS-II) | |
| HP ZBook Fury 16 G11 (Toshiba Exceria Pro SDXC 64 GB UHS-II) | |
| Lenovo ThinkPad P1 Gen 7 21KV001SGE (AV Pro V60) | |
| maximum AS SSD Seq Read Test (1GB) | |
| HP ZBook Power 16 G11 A (Toshiba Exceria Pro SDXC 64 GB UHS-II) | |
| HP ZBook Fury 16 G11 (Toshiba Exceria Pro SDXC 64 GB UHS-II) | |
| Lenovo ThinkPad P1 Gen 7 21KV001SGE (AV Pro V60) | |
交流
联发科 MT7922 标配 Wi-Fi 6E 和蓝牙 5.2 连接。此外,还提供 Realtek 选件以及用于广域网连接的 HP 4000 或高通 9205。
网络摄像头
标配 500 万像素网络摄像头、红外摄像头和物理快门滑块,与 ThinkPad P16s G2 相似。该机的 Precision 5690配备了分辨率更低的 200 万像素网络摄像头。


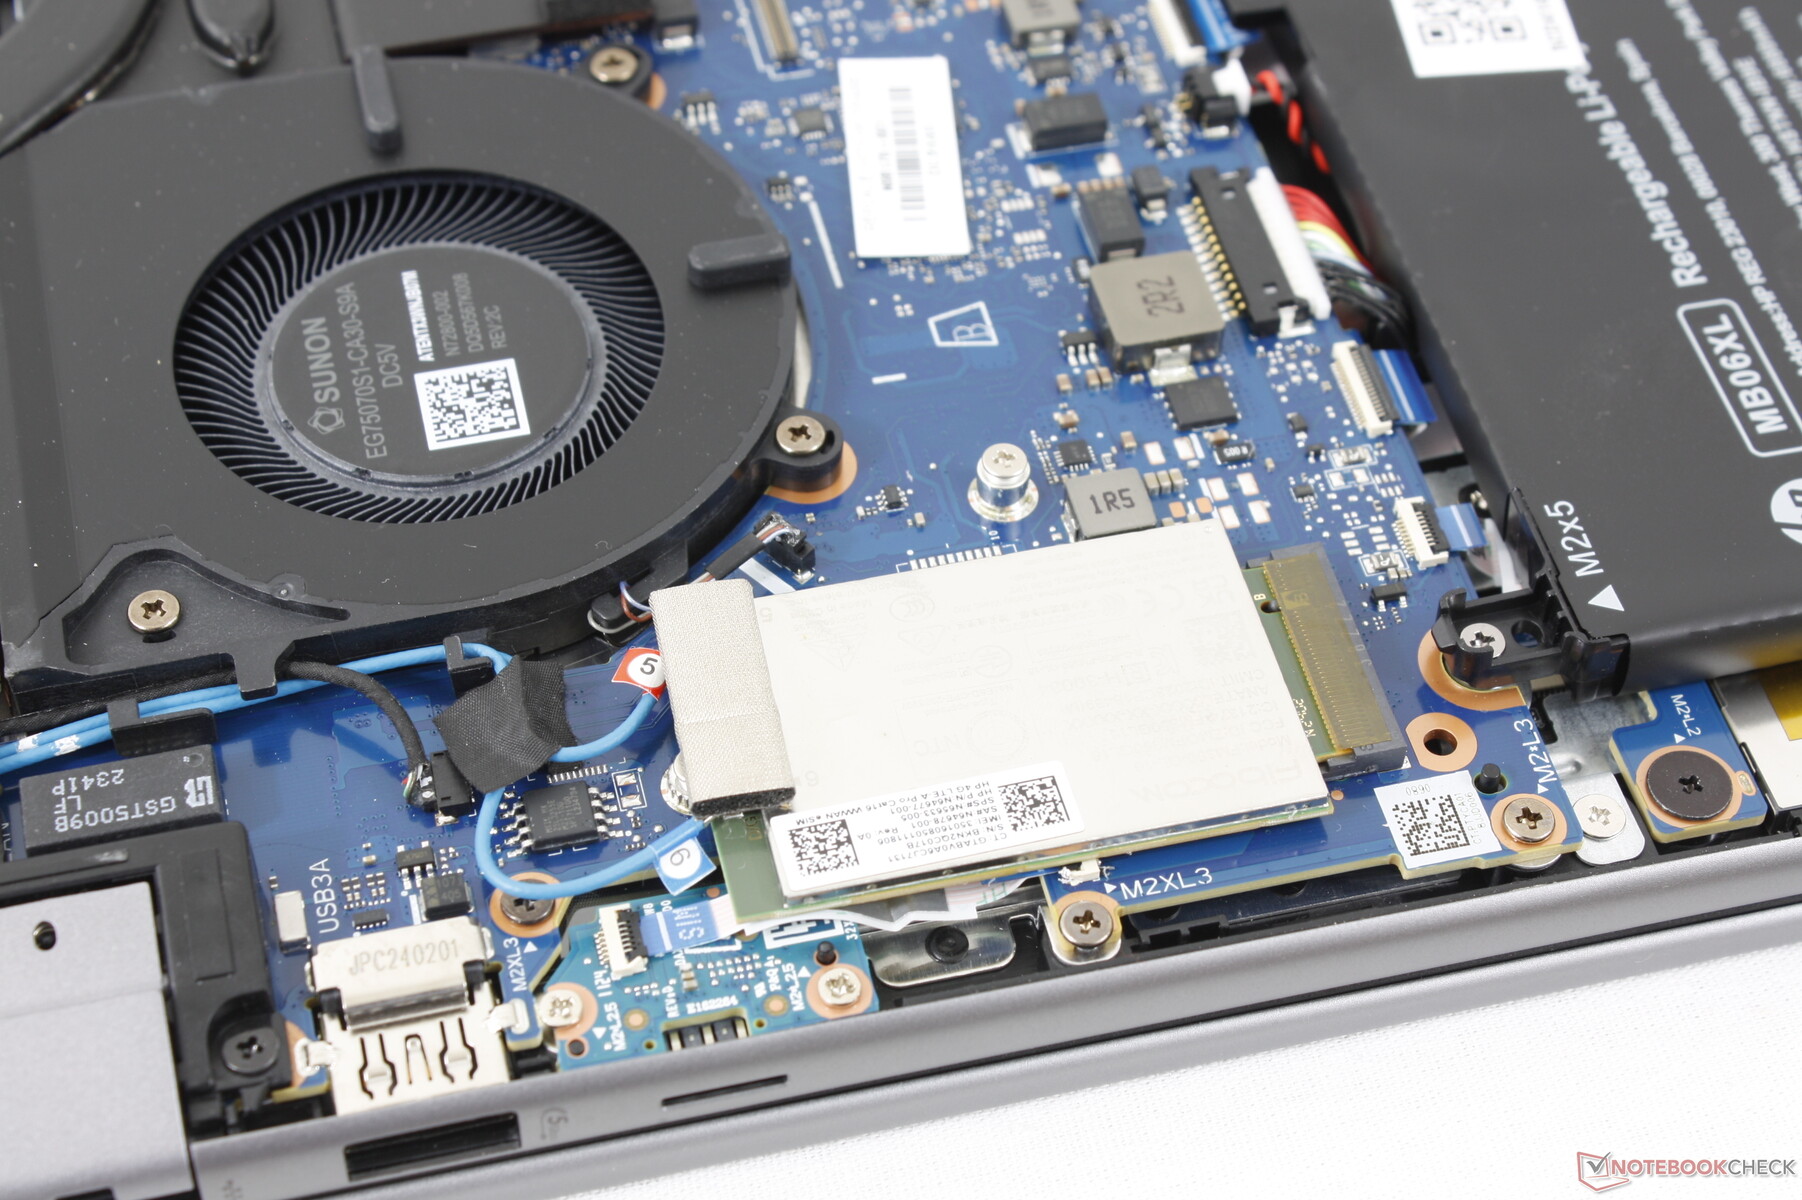
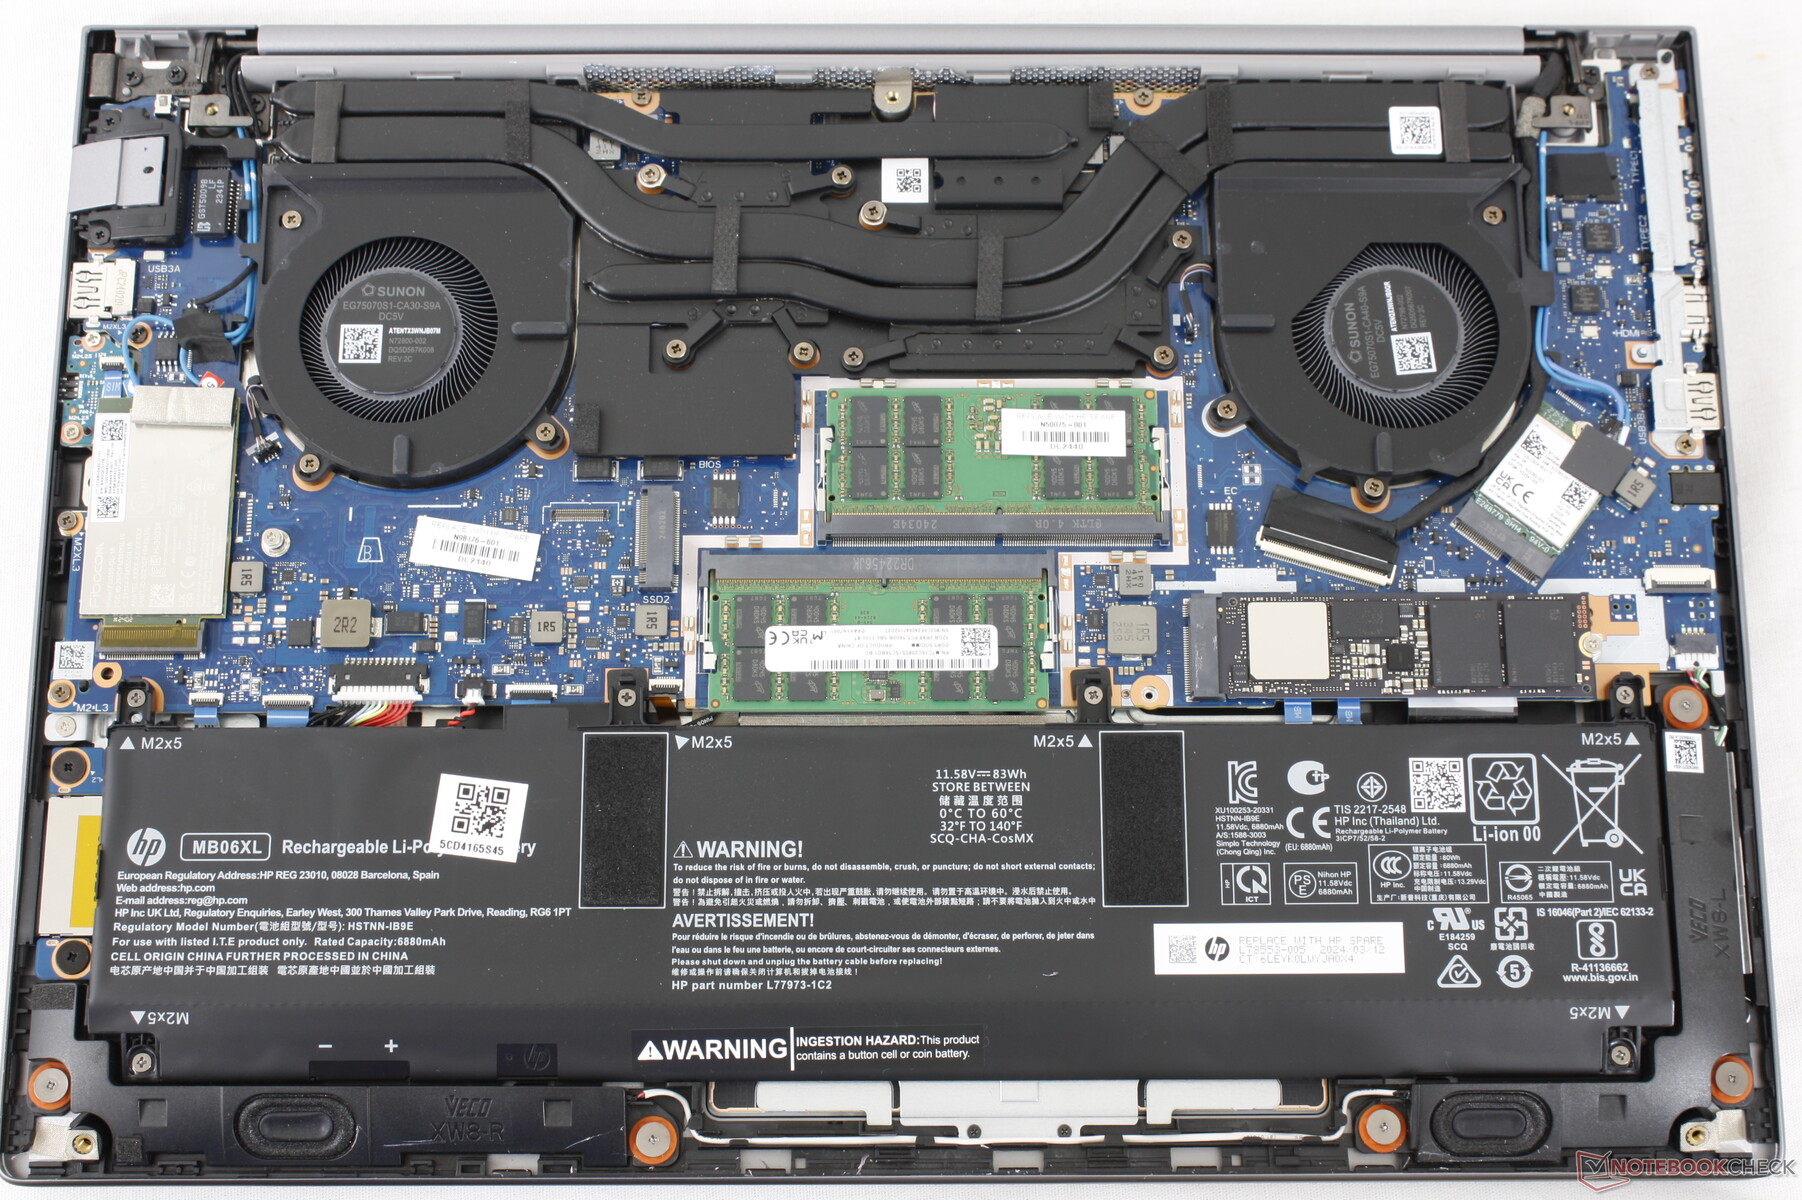
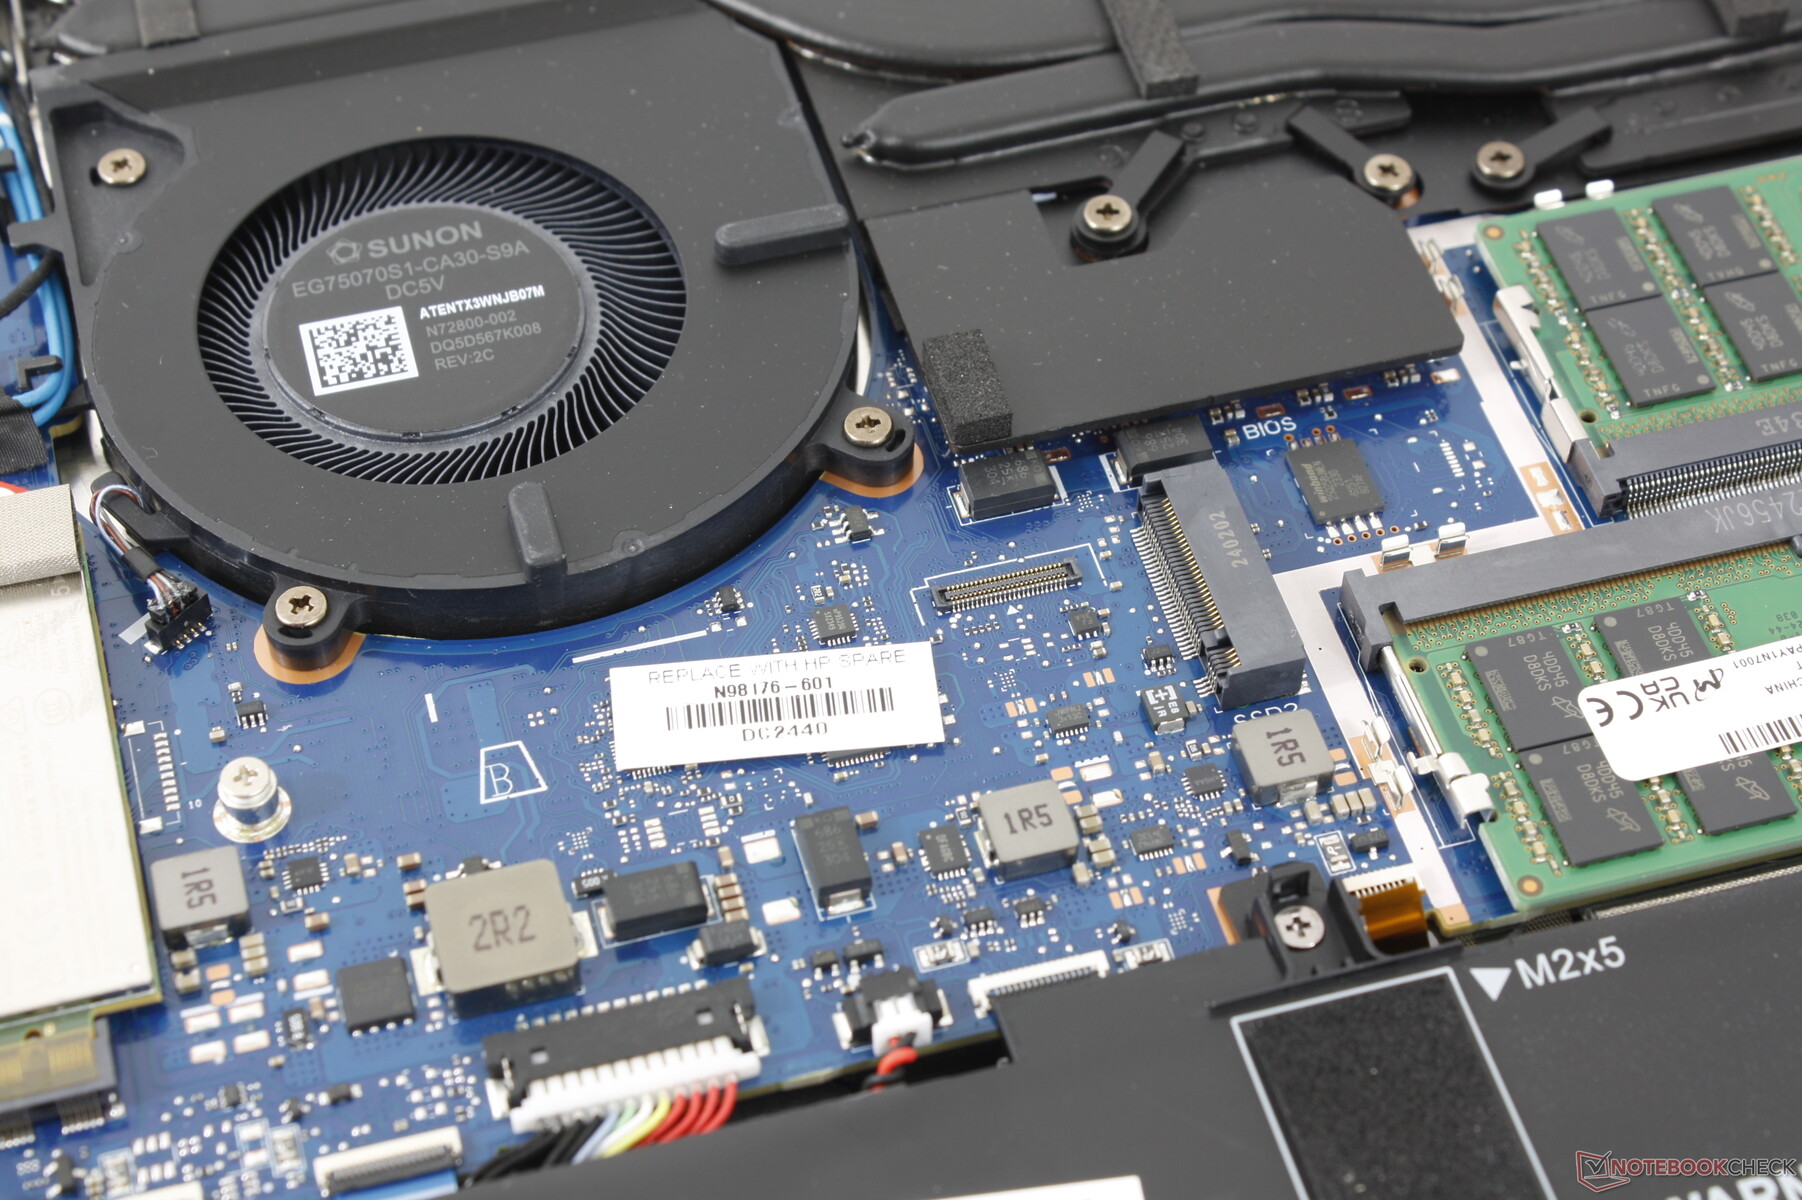
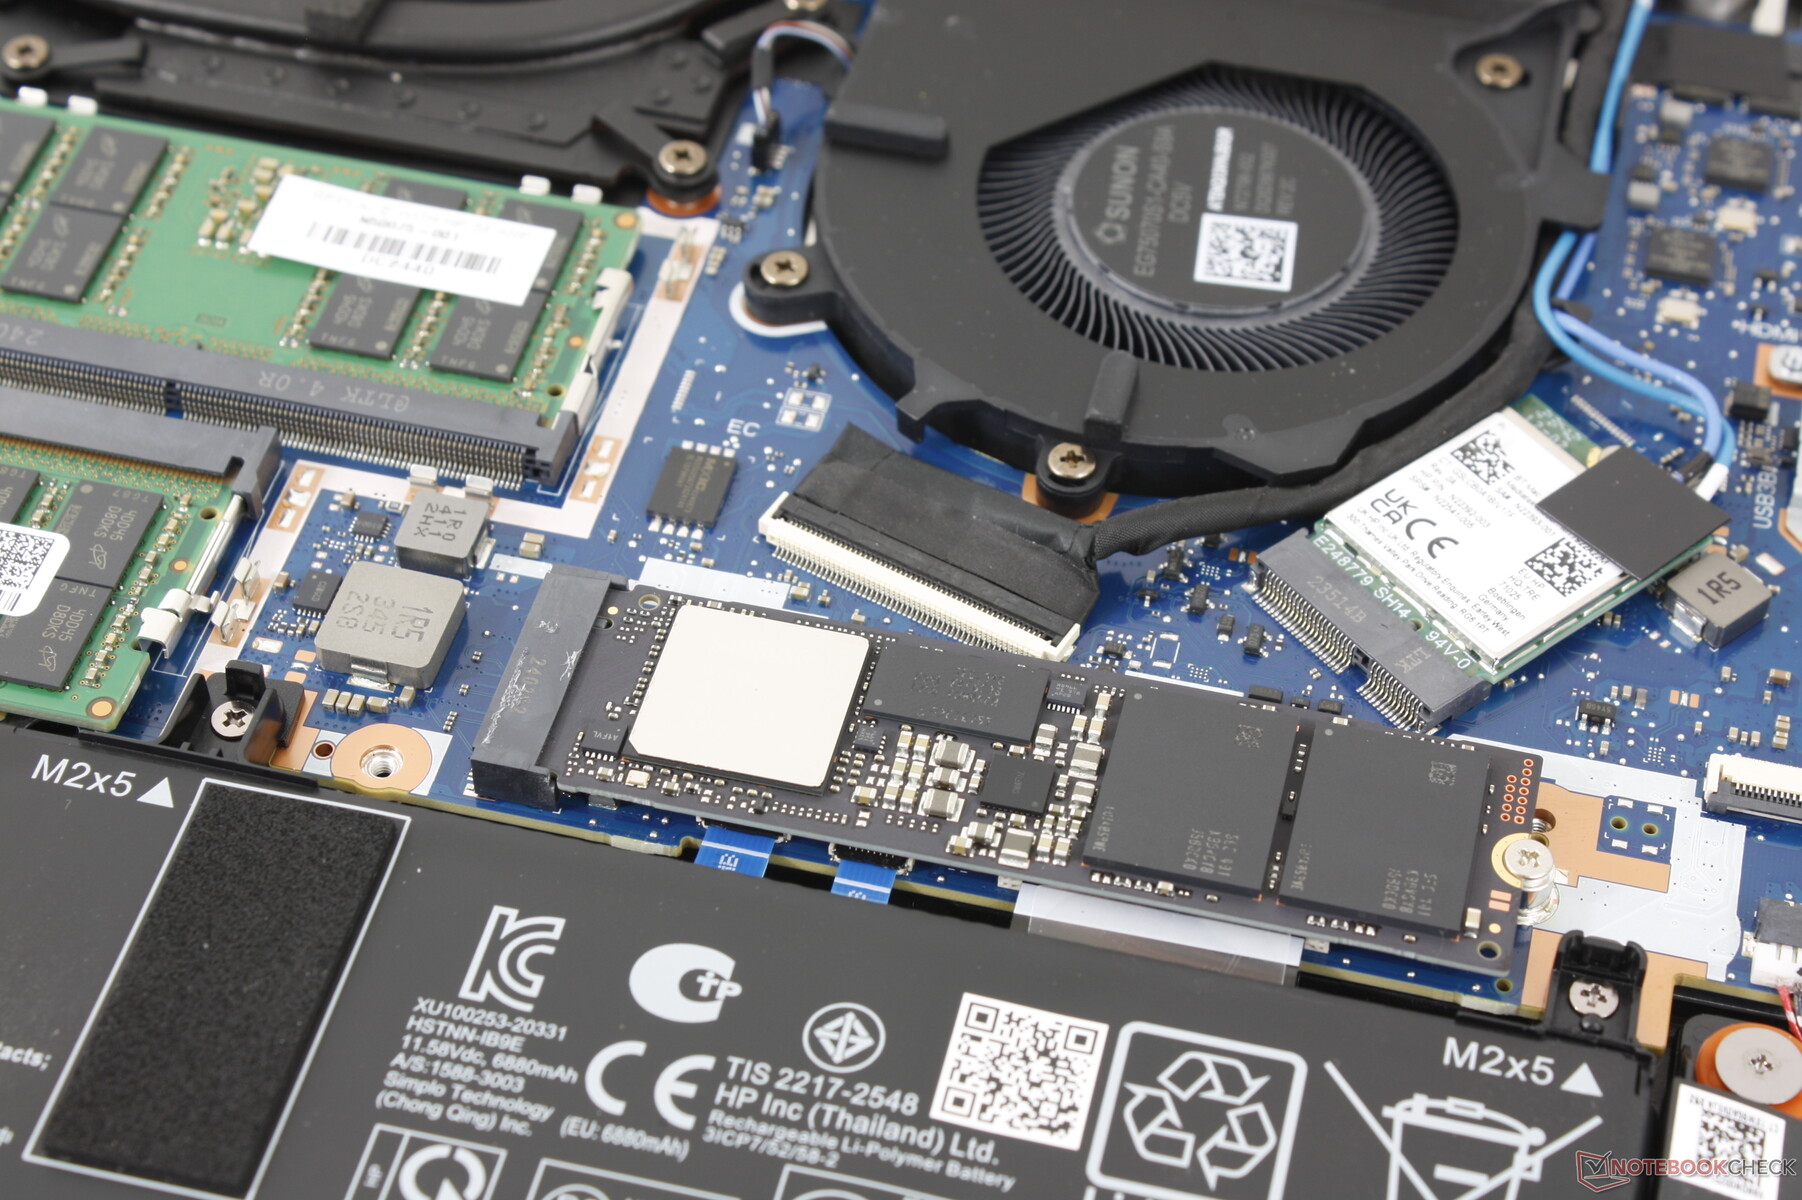
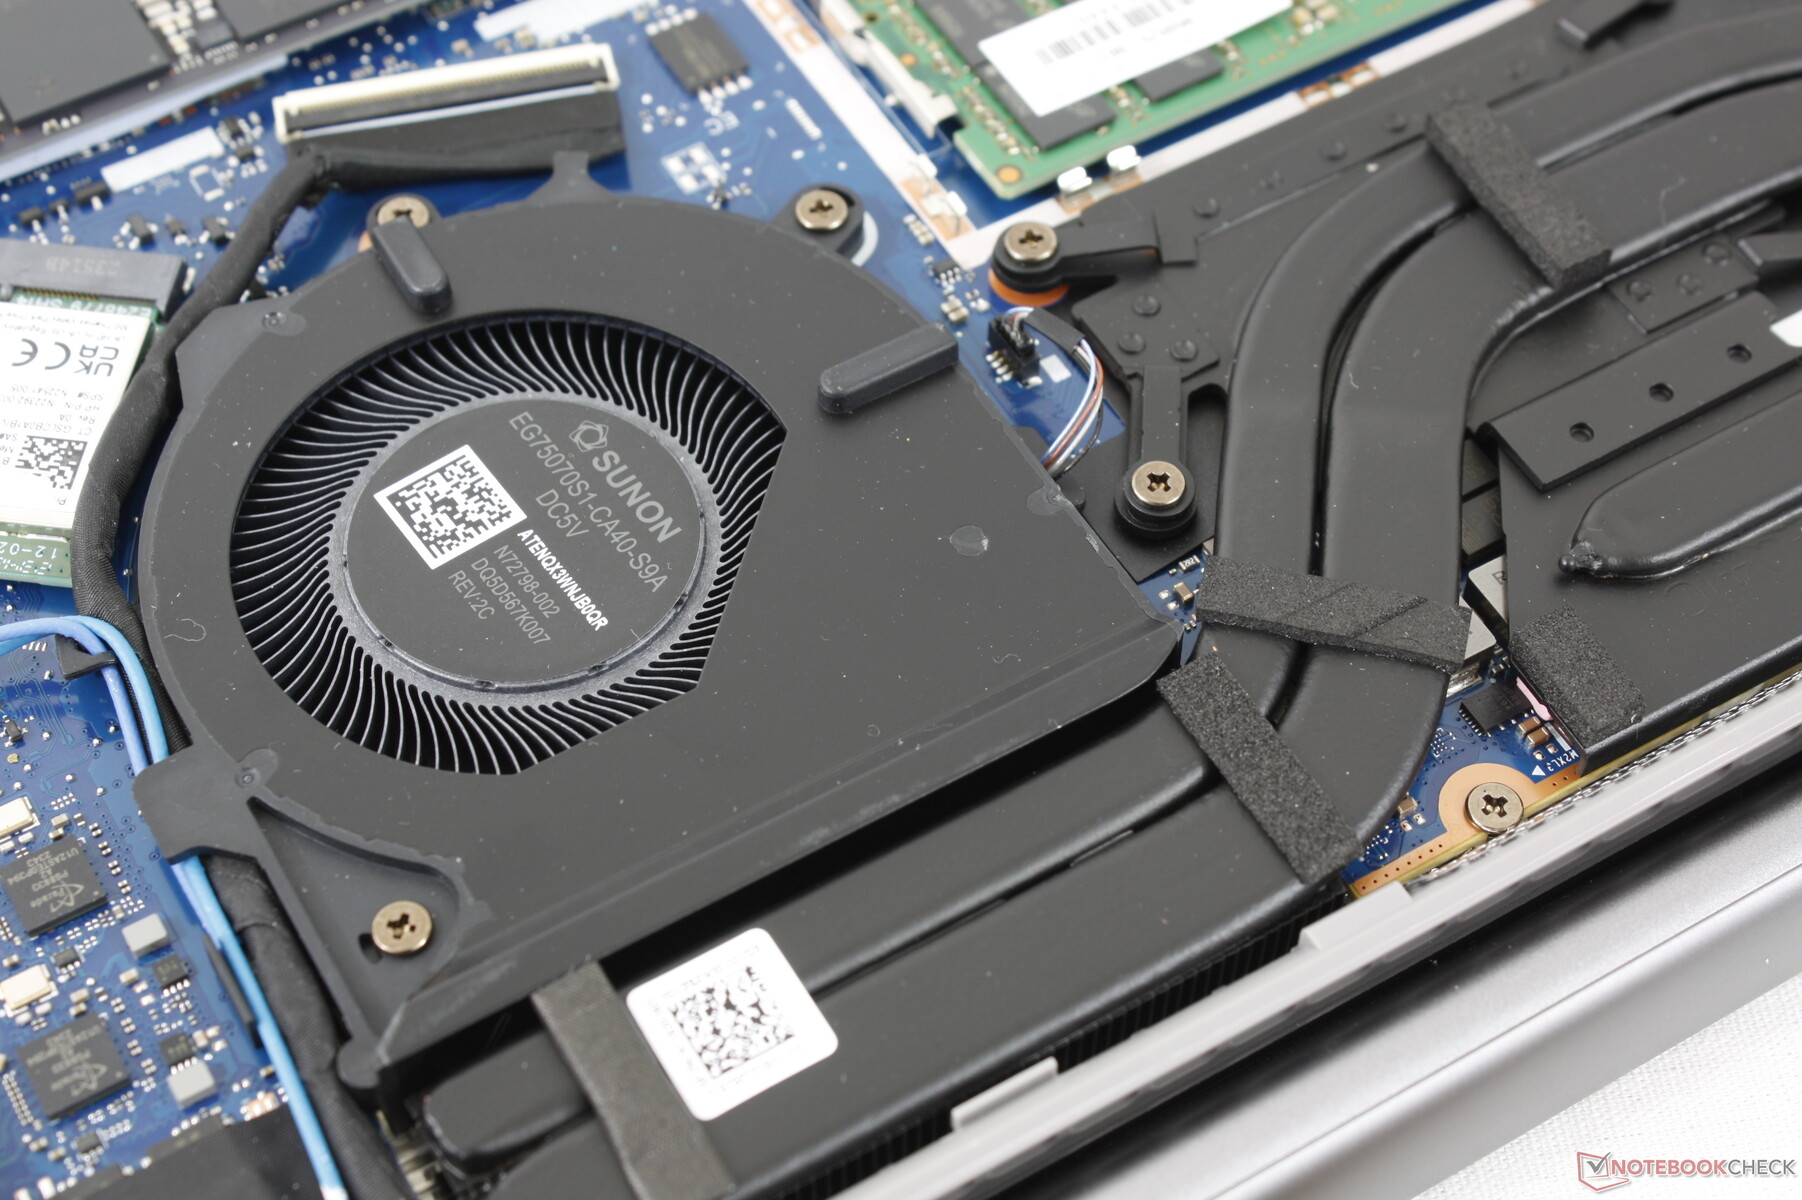
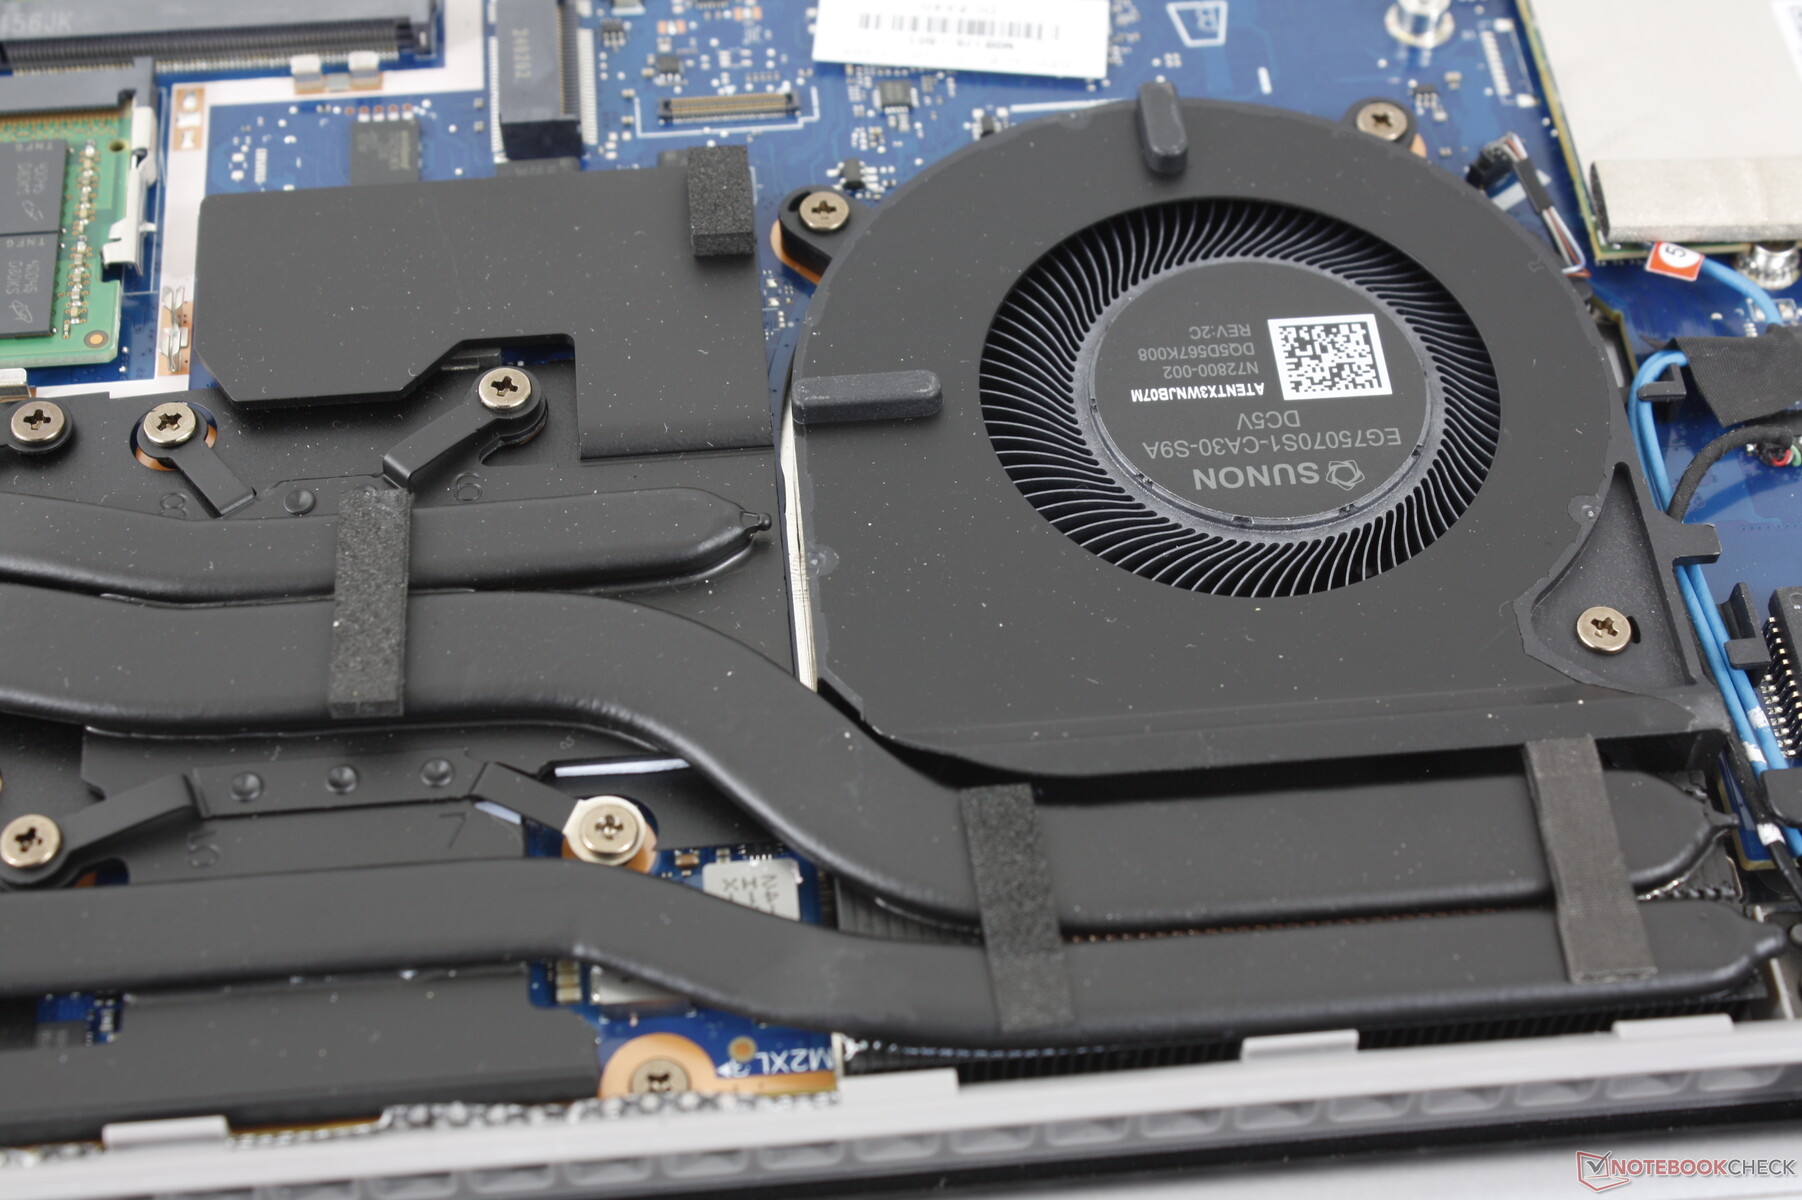
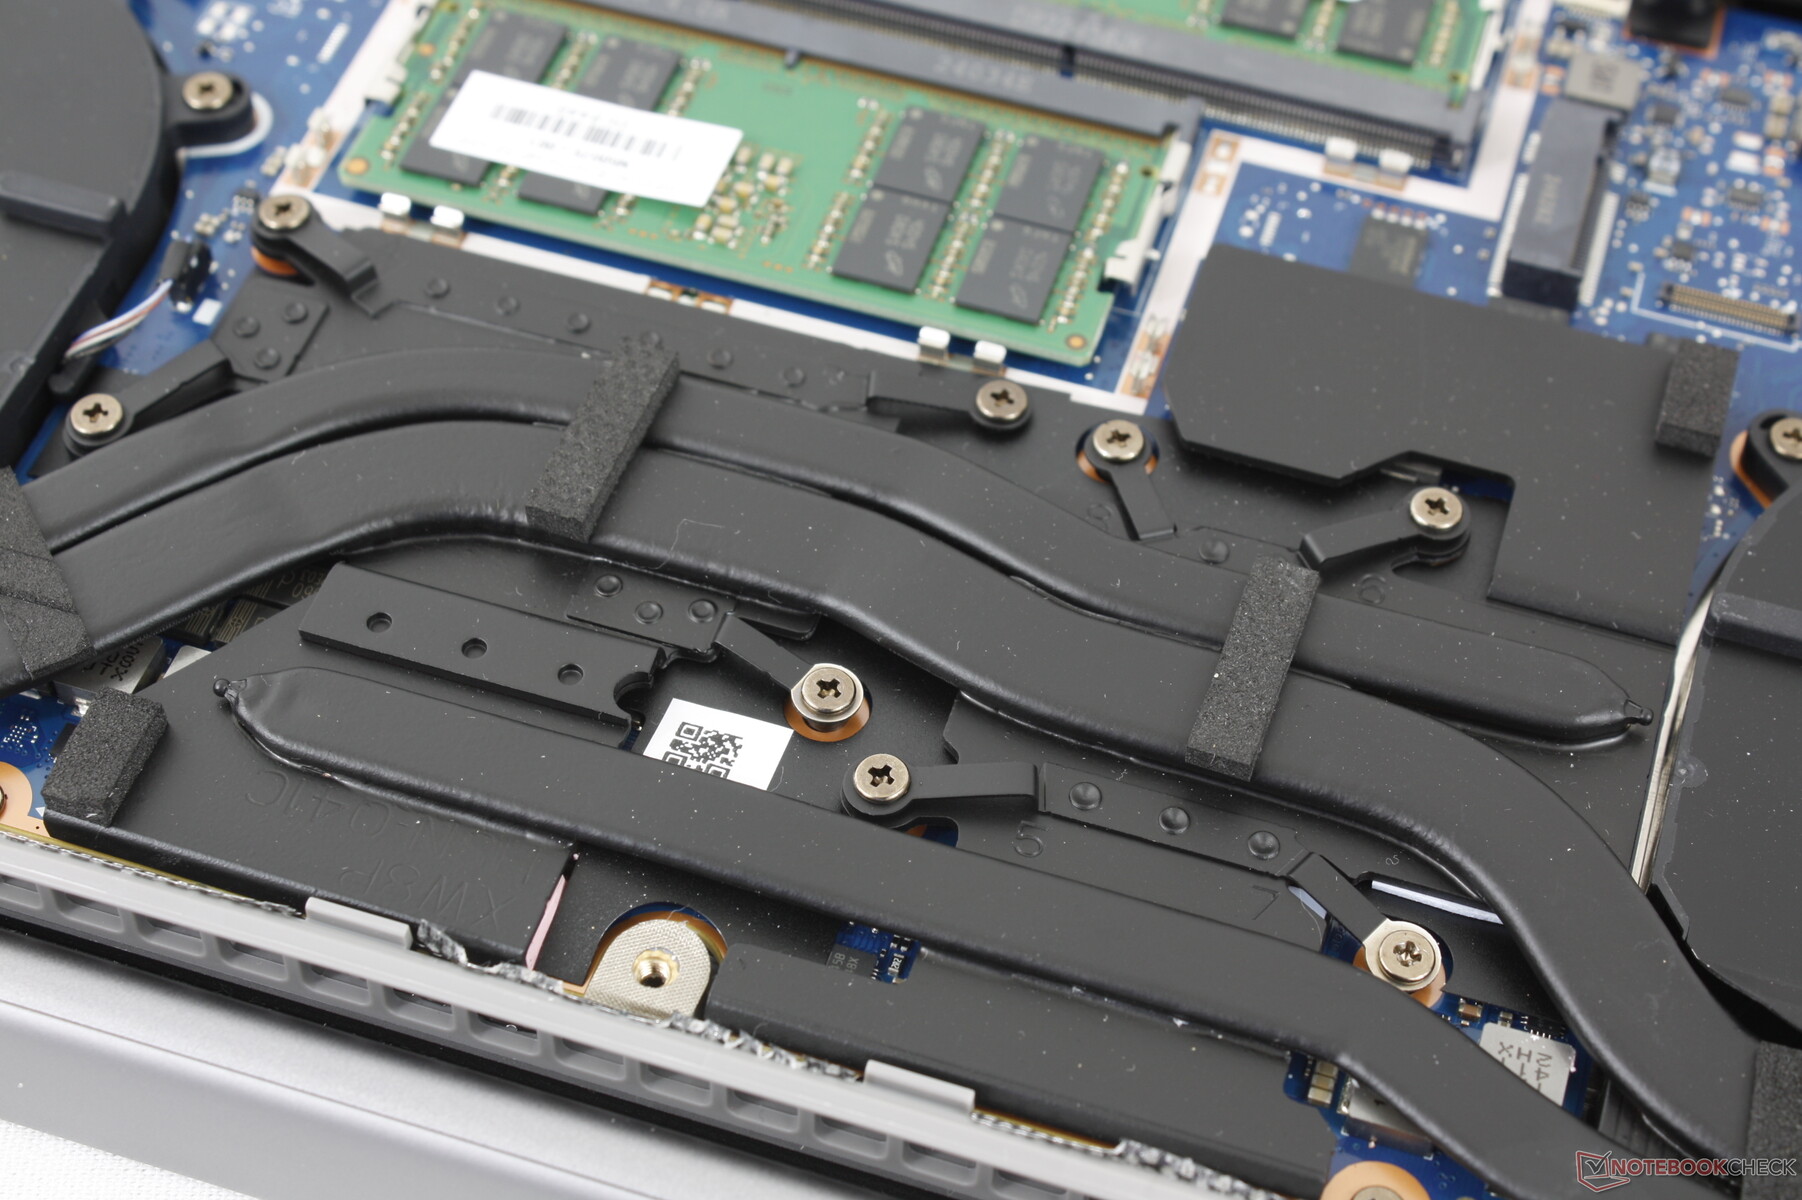
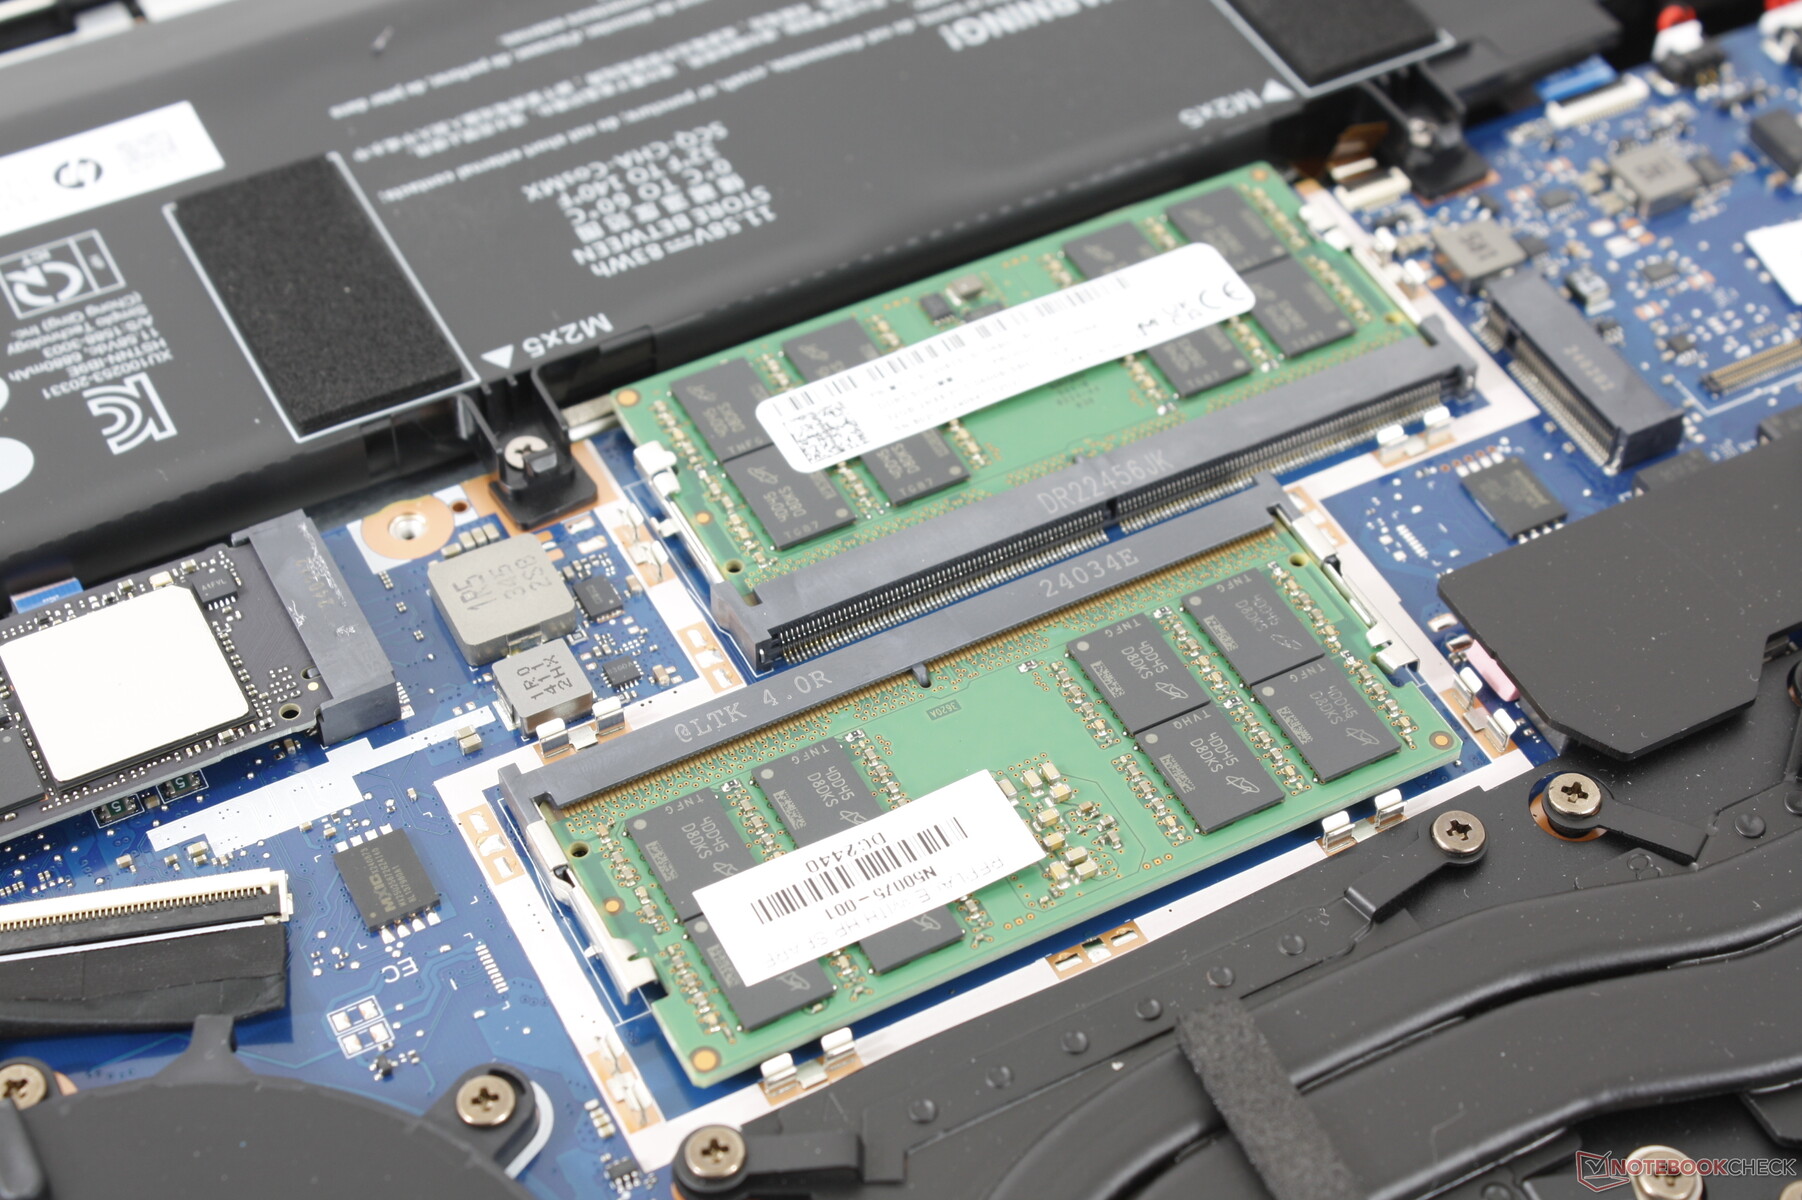
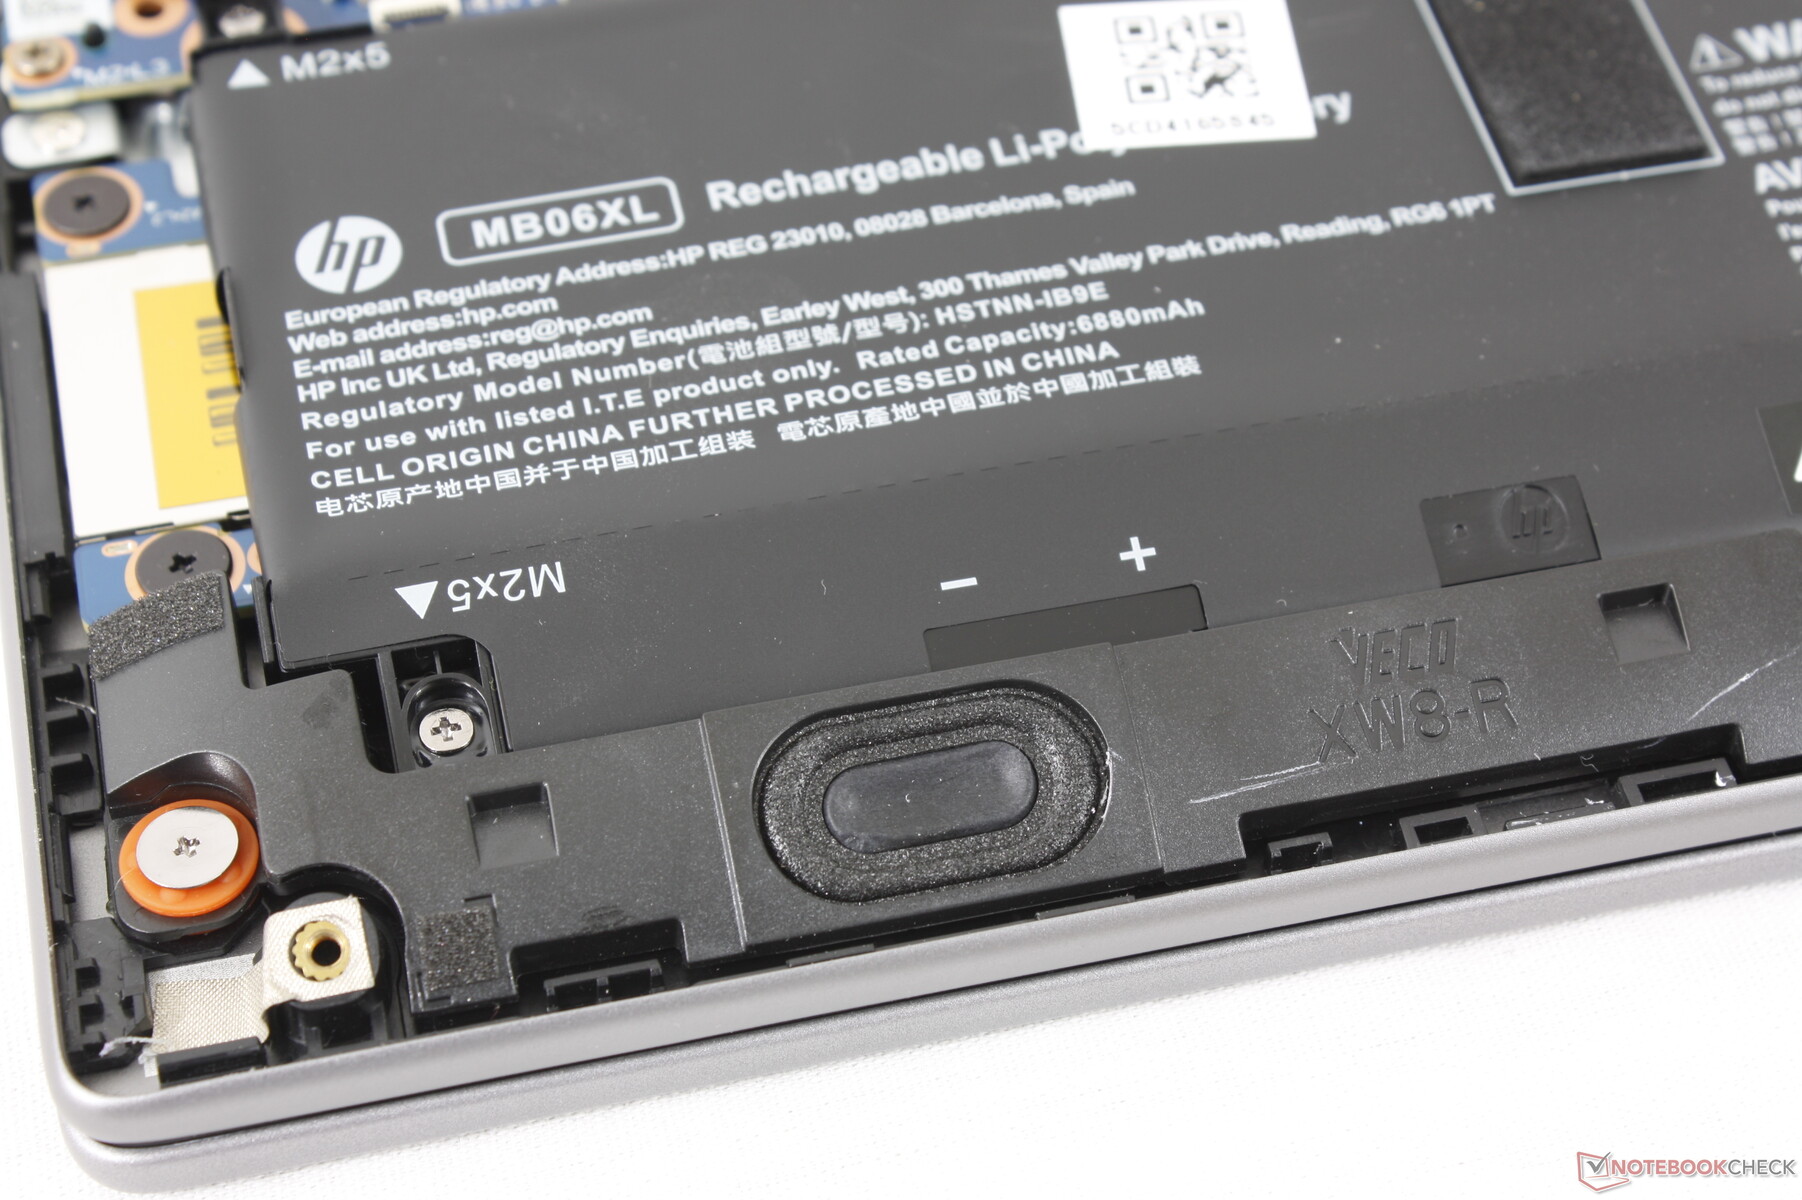
维护
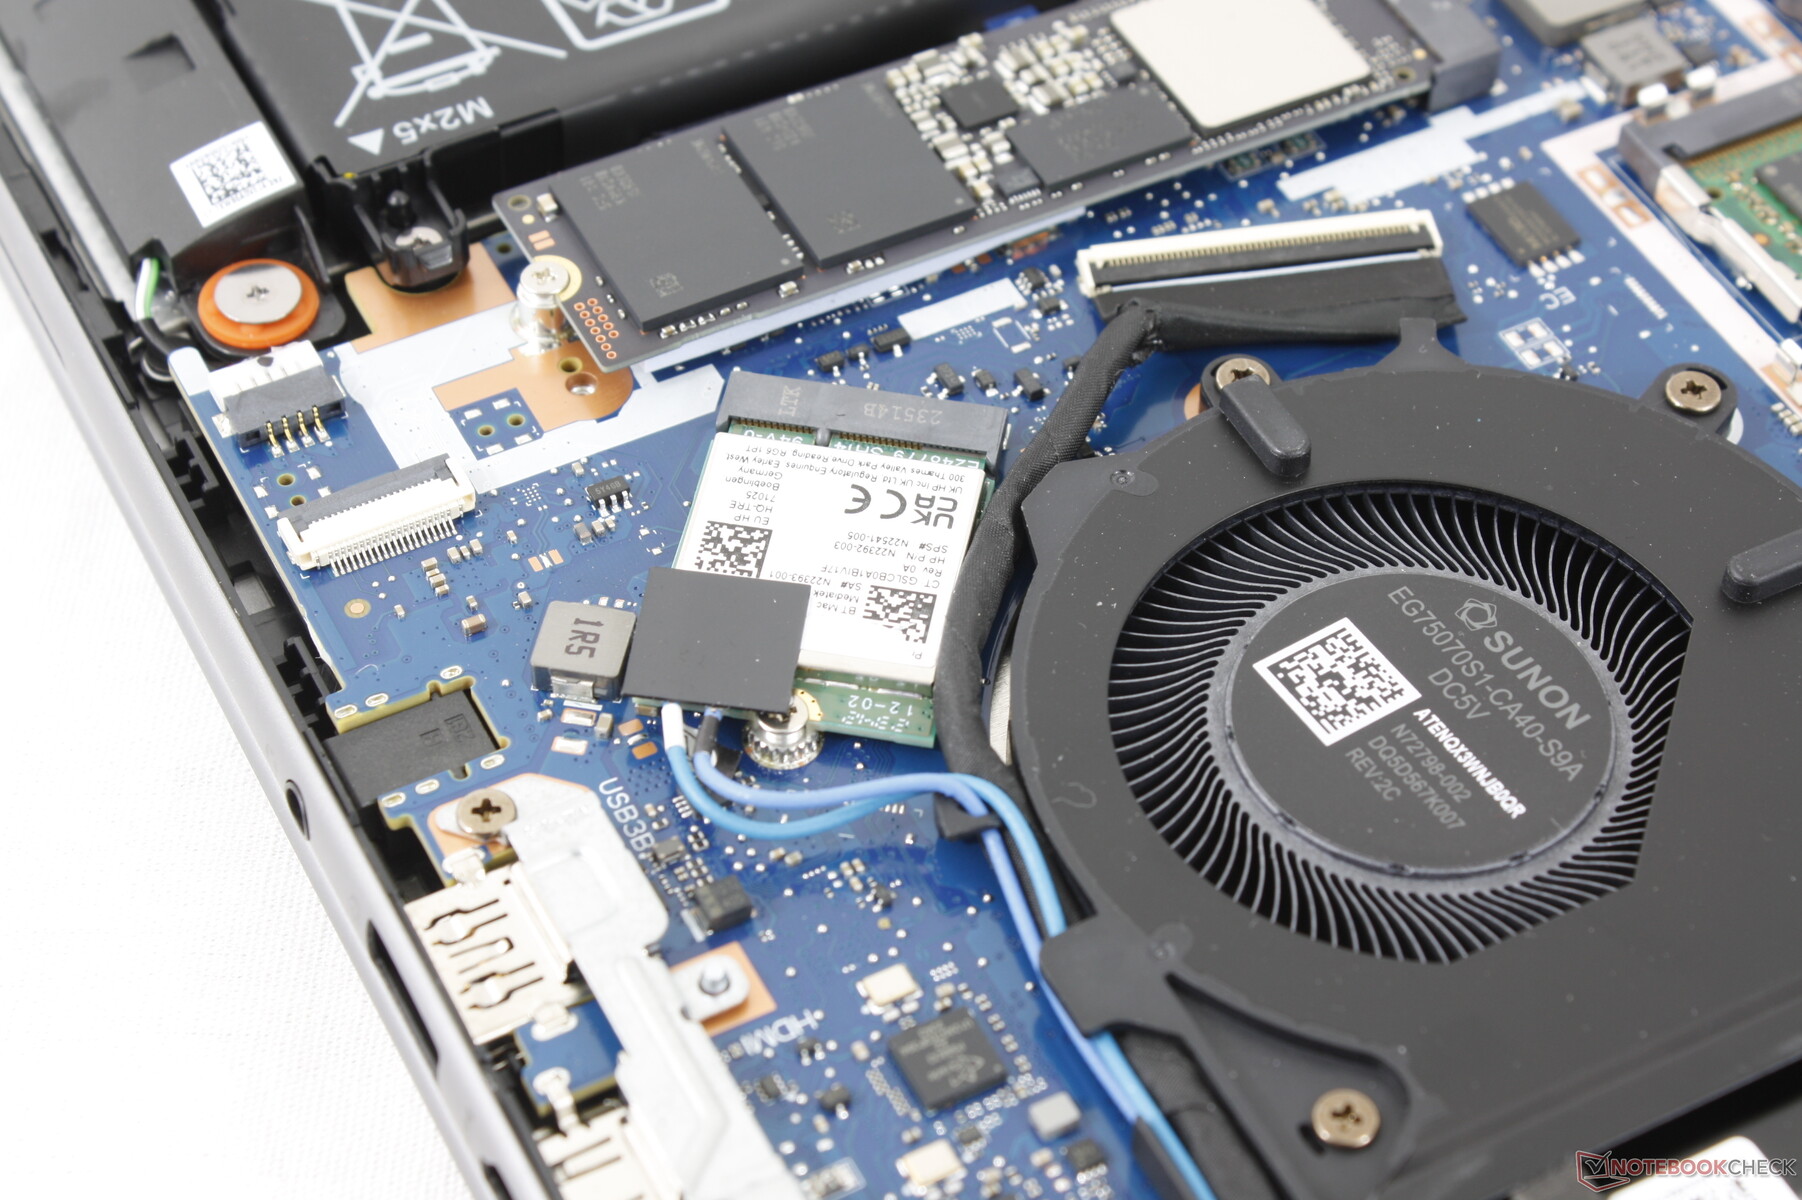
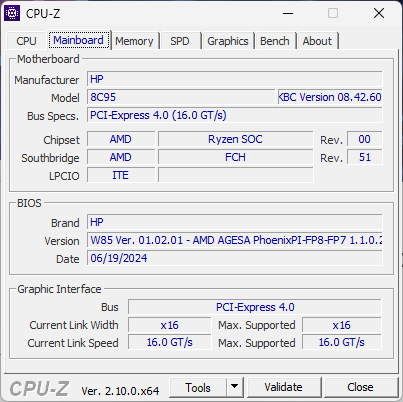
只需一把十字螺丝刀和锋利的边缘,底部面板就能相对轻松地弹开。与 ZBook Power 15 G10 相比,ZBook Power 15 G10 重新设计了内部结构,同时保留了相同的可升级选项,如 2x SODIMM 插槽、2x PCIe4 x4 NVMe SSD 插槽和可拆卸 WLAN 模块。这次还增加了 WAN 选项。
可持续性
生产过程中使用了低卤素,而包装则由模塑纸浆和再生塑料组成,这两种材料的来源分别为 100% 的可持续来源和 60% 的消费后来源。
配件和保修
包装盒内没有随附交流适配器和文件。令人失望的是,如果在美国购买,标准有限保修期只有一年,而 ZBook Fury 的标准保修期为三年。
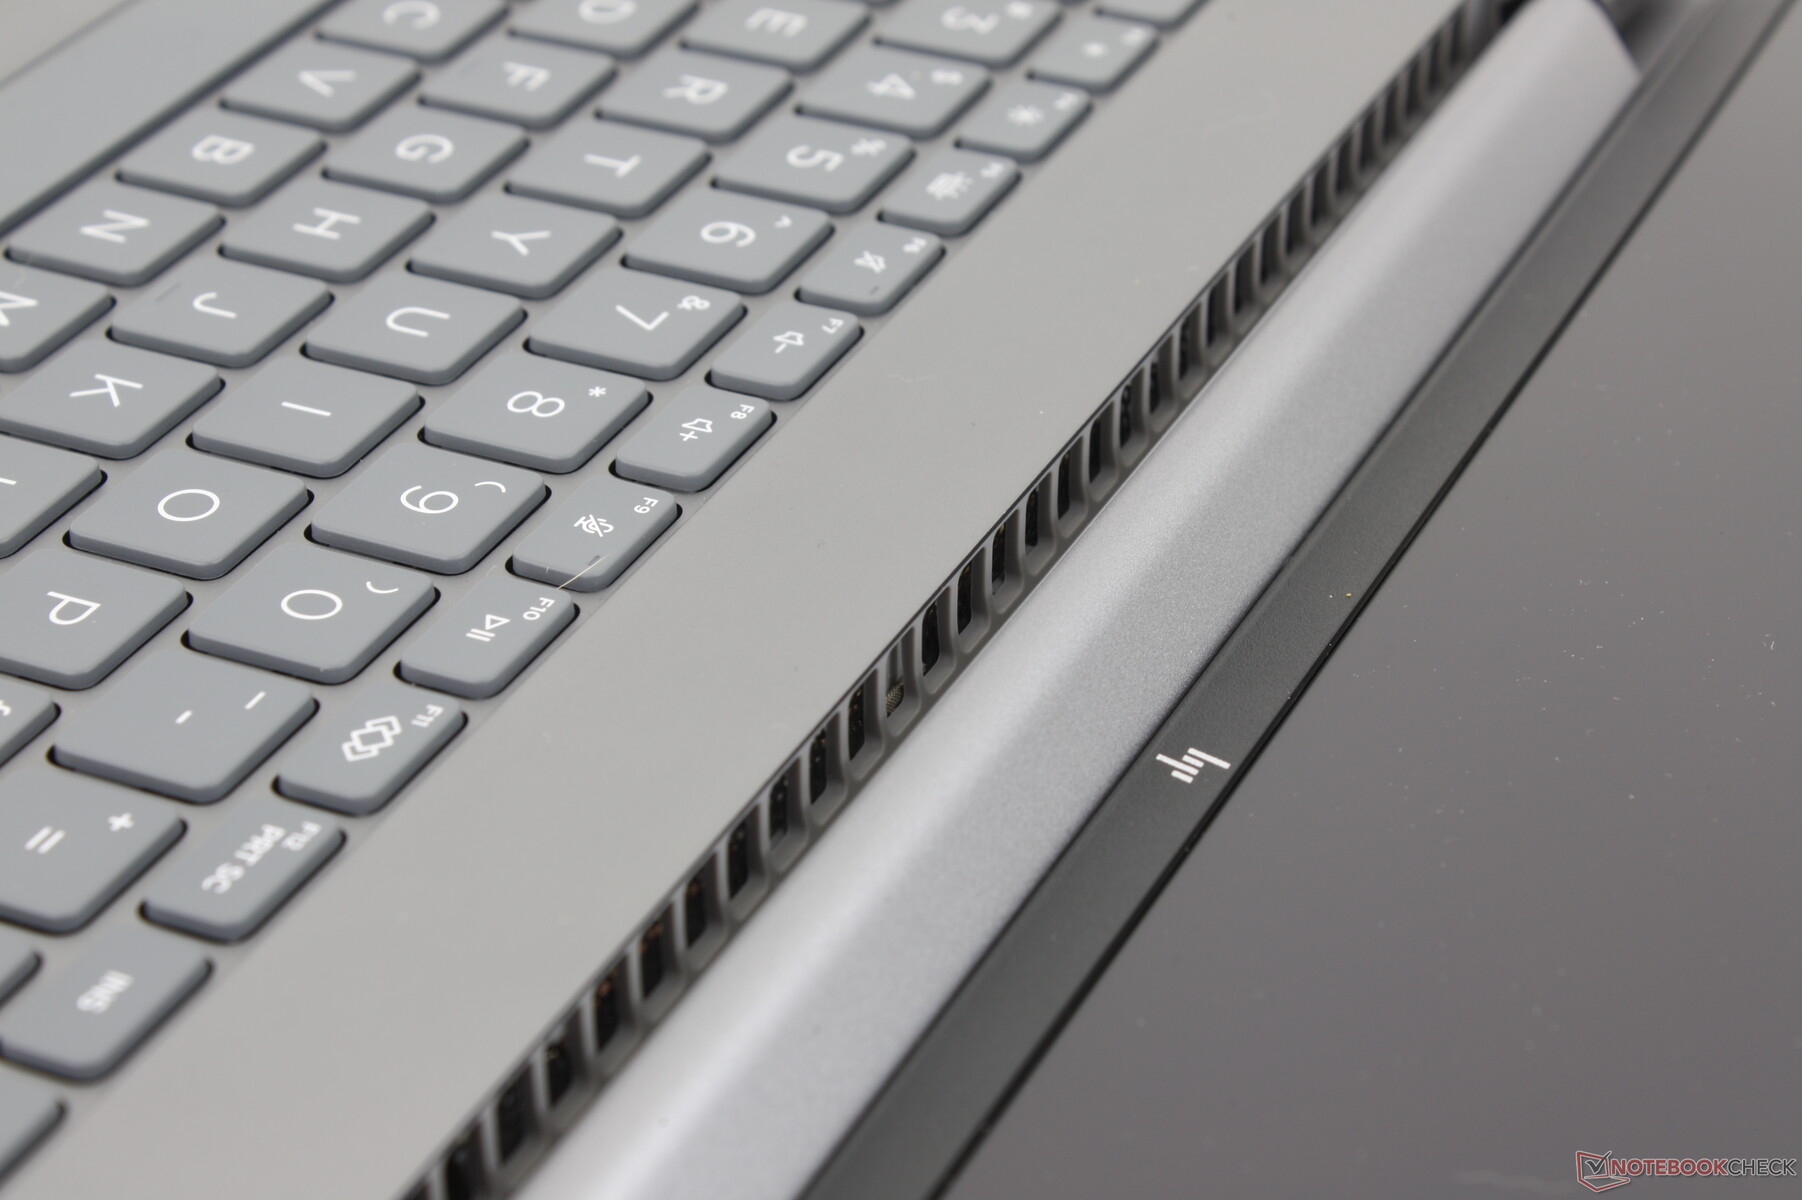
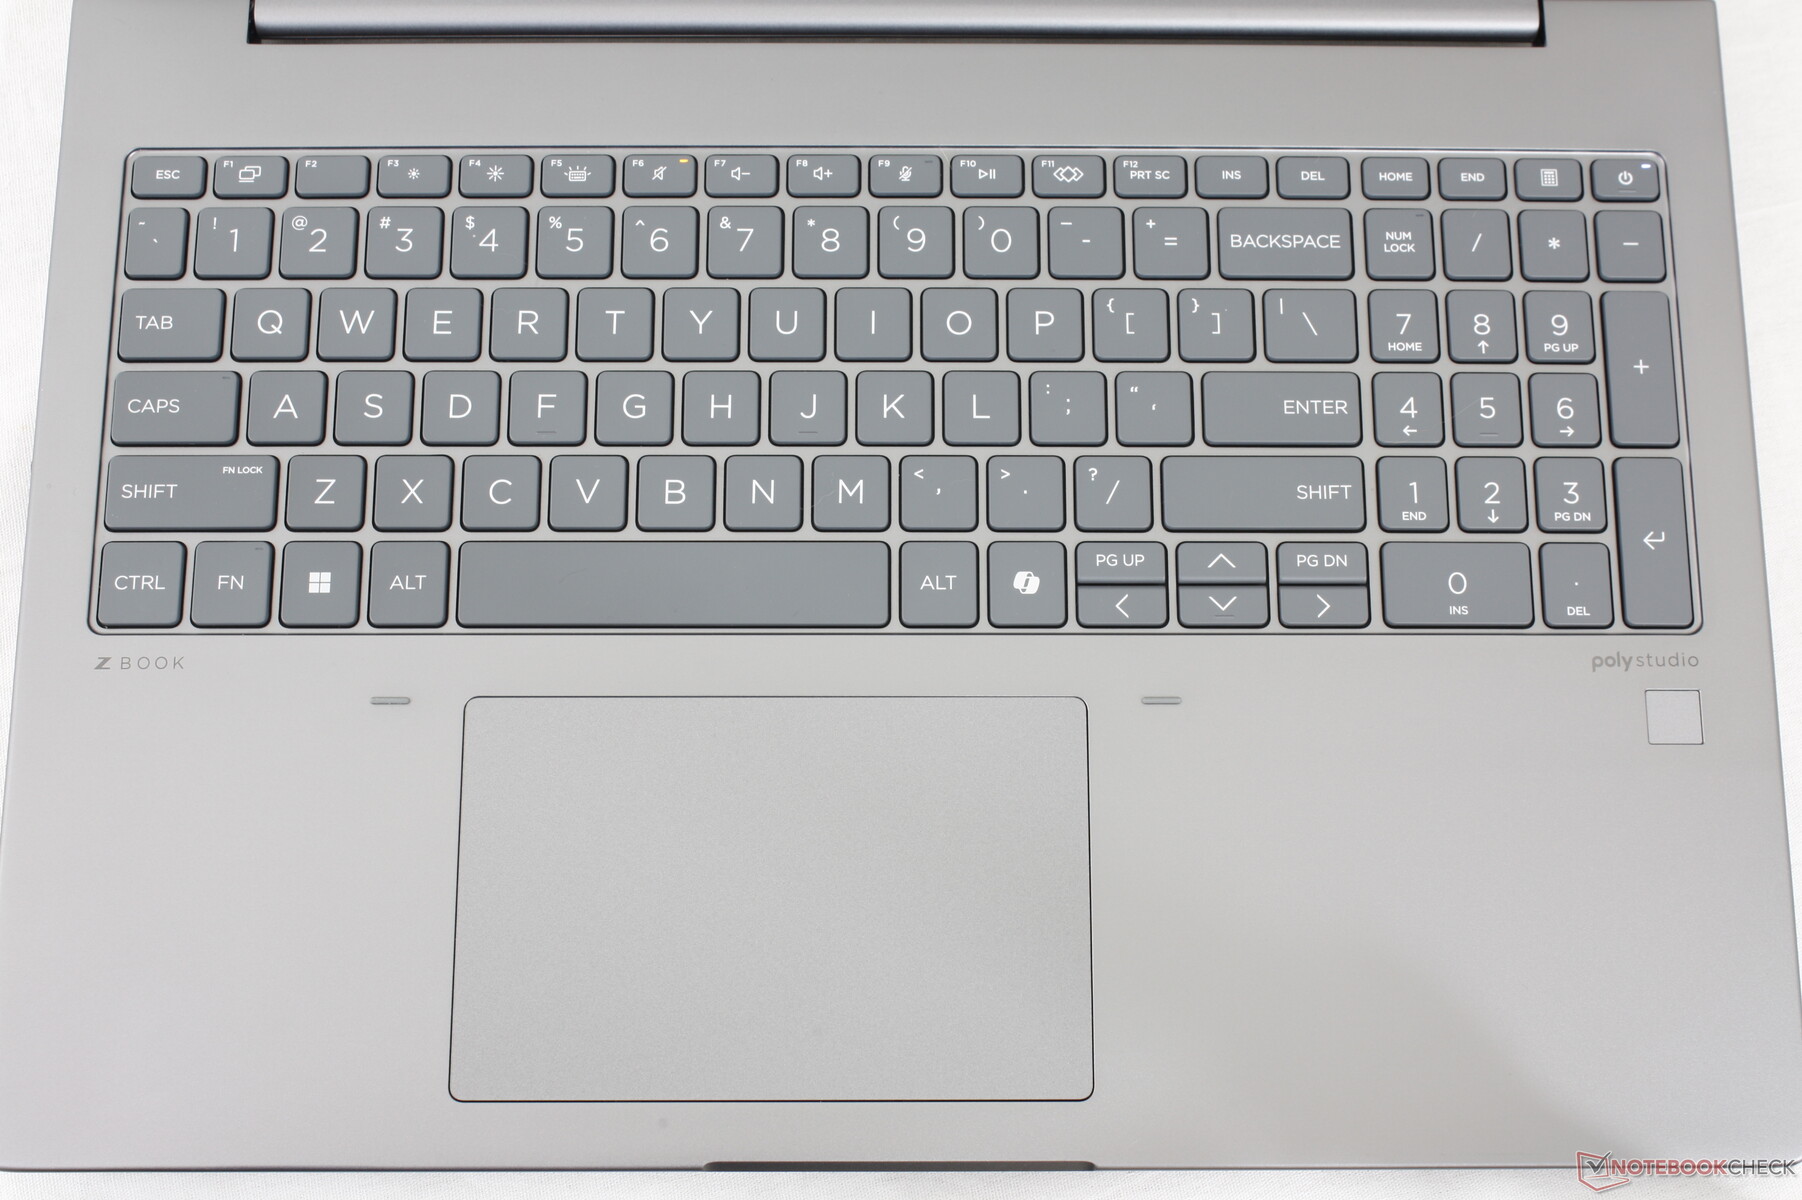
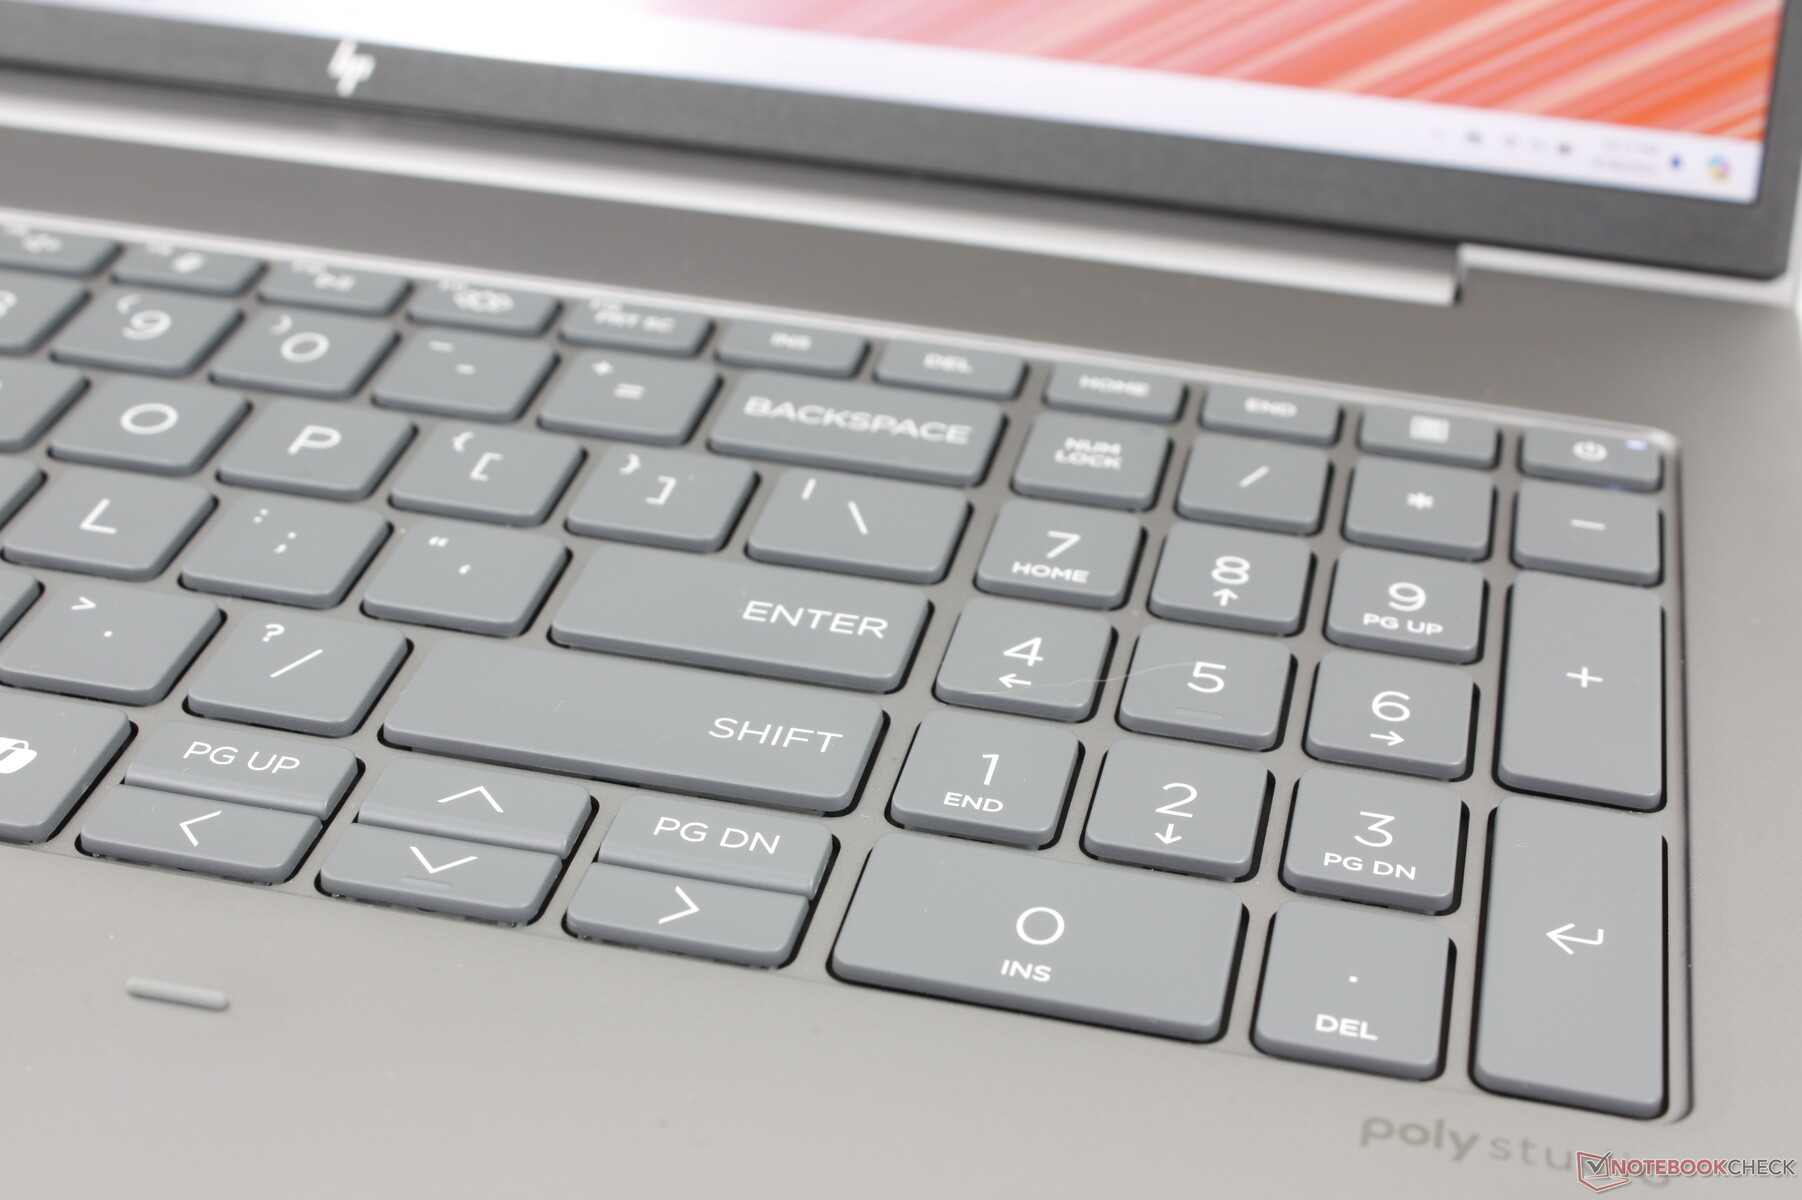
输入设备 - 宽大的按键
键盘
打字体验与 Spectre x360 16 键盘按键坚固,反馈相对清晰,打字舒适。尤其是键程感觉比大多数超极本更深,避免了典型的浅反馈或海绵反馈。
数字键盘已经回归,而竞争对手的 Precision 5690.不过,它的按键比 QWERTY 主键略窄,因此按下时的反馈明显较软。
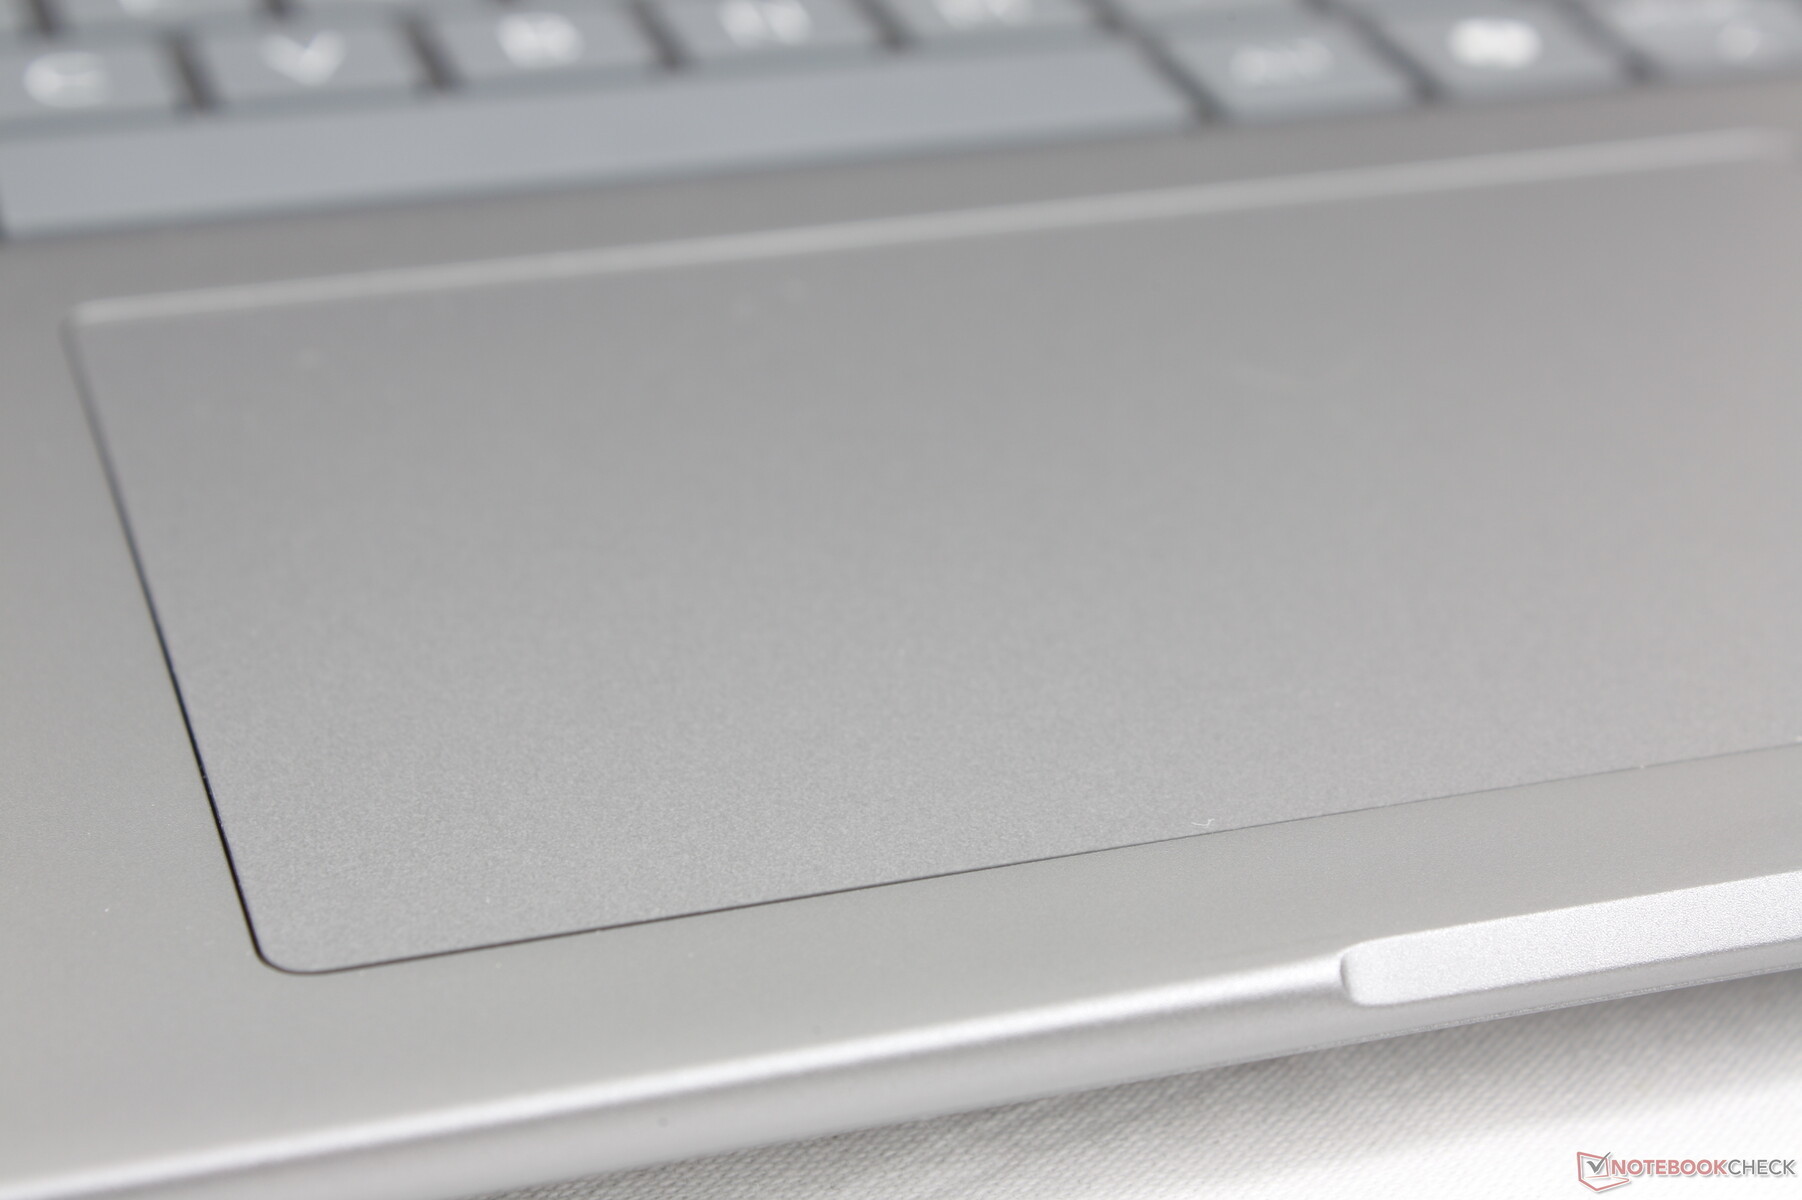
触摸板
点击板比以前更大(12.5 x 8 厘米对 11.5 x 7 厘米),以利用更大的 16 英寸外形尺寸。但仍然缺少专用按键,价格更高的 ZBook Fury 系列才有。尽管如此,ZBook Fury 系列的触感和反馈仍分别达到了平滑和 "咔哒 "的效果,比大多数消费类笔记本电脑上通常较为松软的点击板更加可靠。

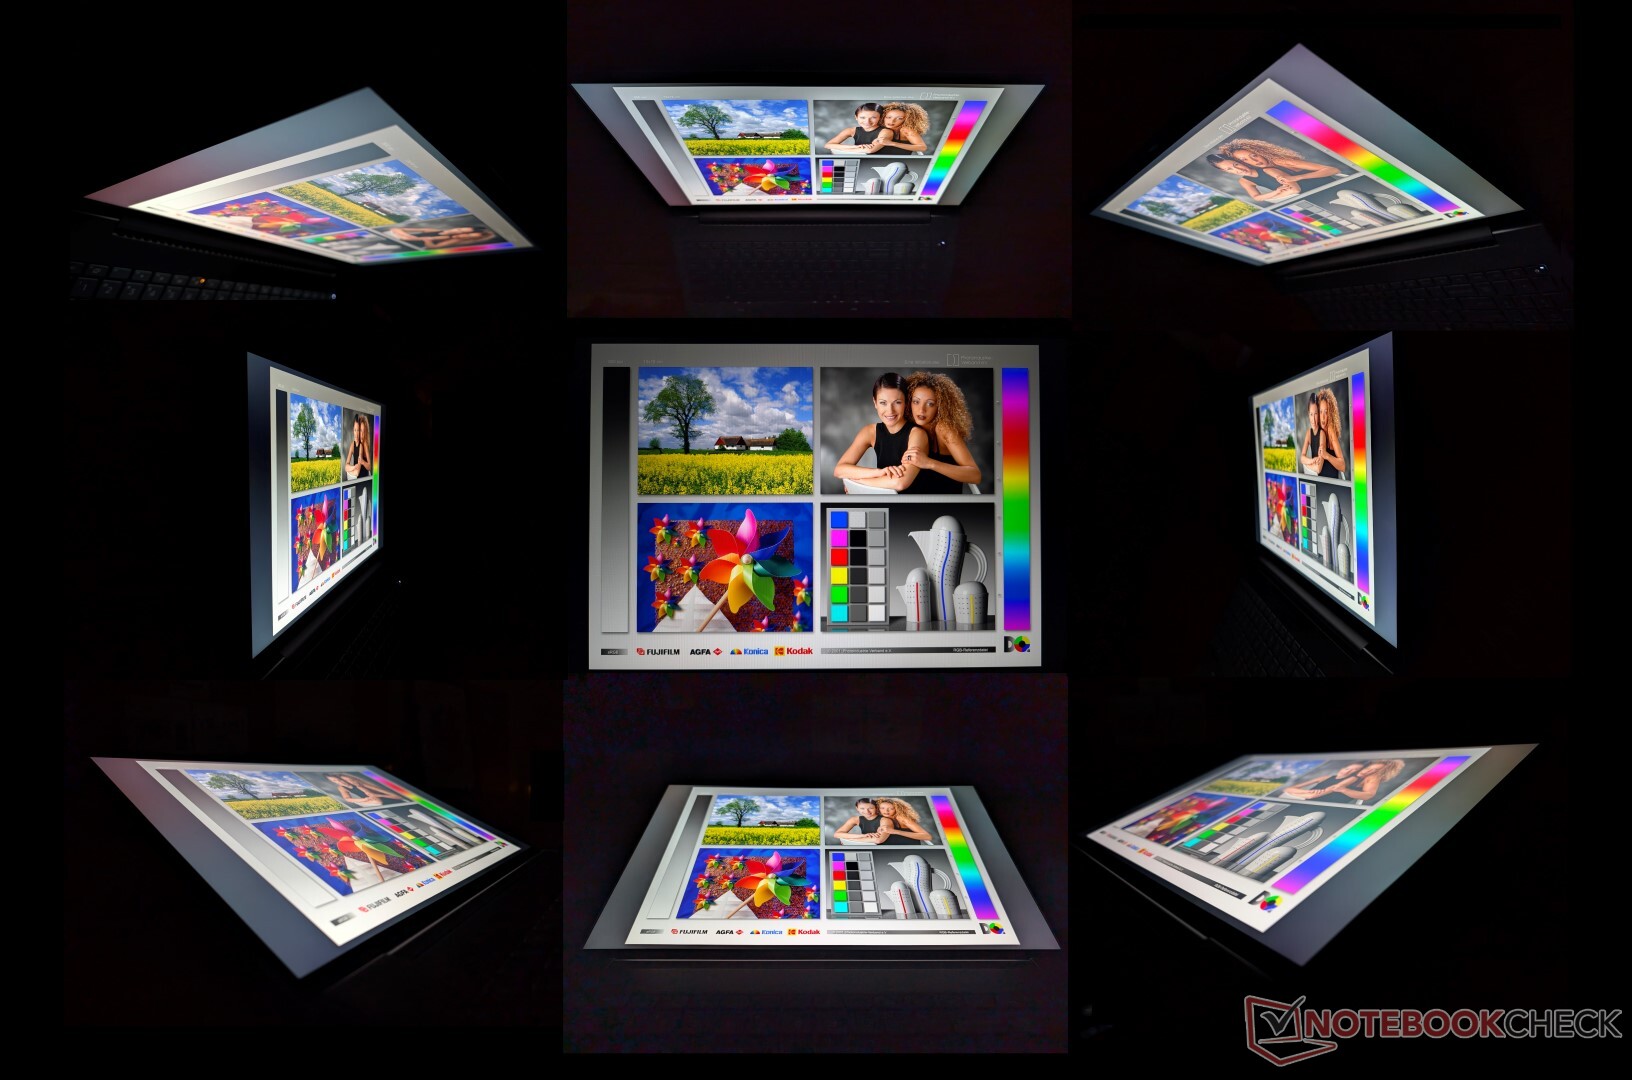
显示屏 - 全面采用 IPS
共有以下五种显示屏可供选择,均为 IPS 显示屏。我们的配置配备了粗体选项。
- 1920 x 1200,非触摸,雾面,250 尼特,45% NTSC,60 赫兹
- 1920 x 1200,触摸屏,哑光,250 尼特,45% NTSC,60 赫兹
- 1920 x 1200,非触摸,哑光,400 尼特,100% sRGB,60 赫兹
- 1920 x 1200,非触摸,雾面,1000 尼特,100% sRGB,HP Sure View,60 赫兹
- 2560 x 1600,非触摸,哑光,400 尼特,100% sRGB,120 赫兹
如果担心图像质量,用户应该跳过低端的前两个选项,因为色彩覆盖率只有 sRGB 的 60%。超亮的 1000 nit 面板值得一提,因为许多其他工作站都不提供这一功能,但遗憾的是,该选项与 Sure View 绑定,严重限制了视角,增加了隐私性。没有 OLED、HDR 或 P3 选项,这对于一款高性能工作站来说有点令人失望。用户必须升级到惠普 ZBook Fury 16 G11 或考虑使用 ThinkPad P16s G2以获得此类功能。


| |||||||||||||||||||||||||
Brightness Distribution: 88 %
Center on Battery: 470.7 cd/m²
Contrast: 826:1 (Black: 0.57 cd/m²)
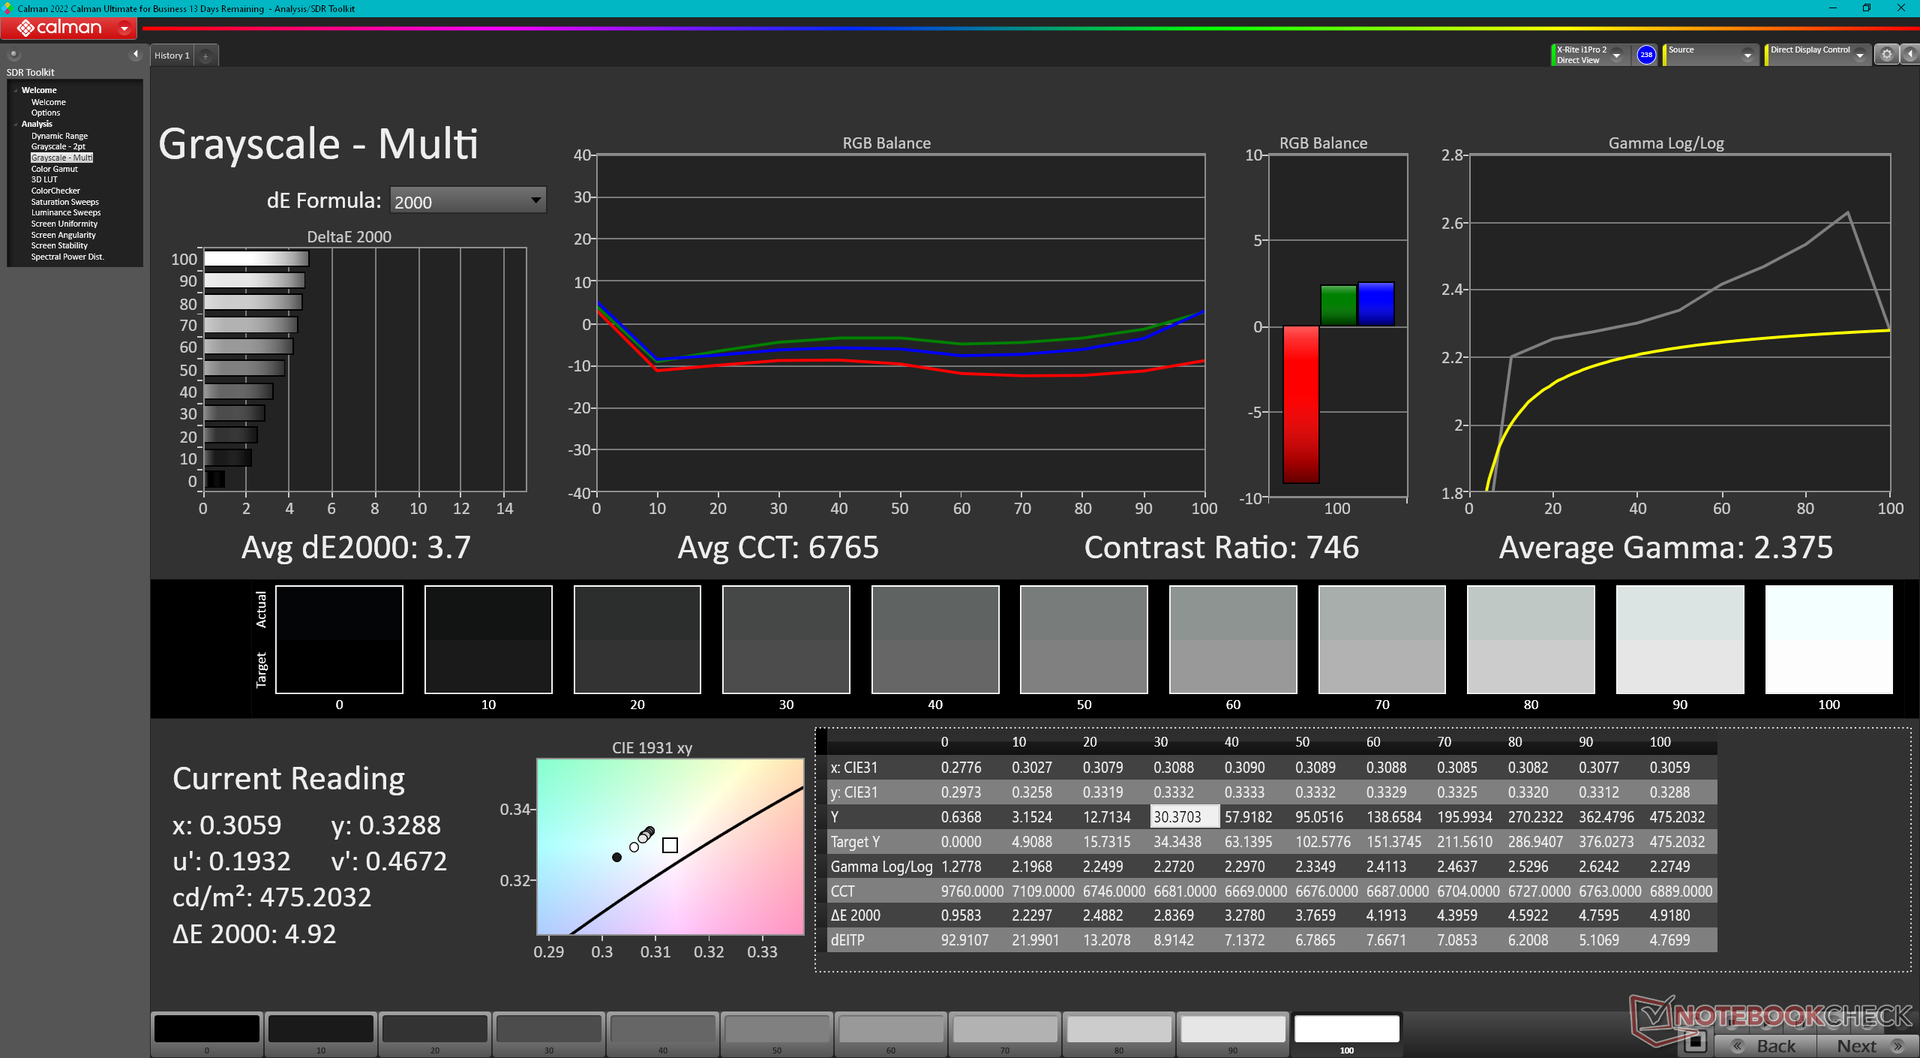
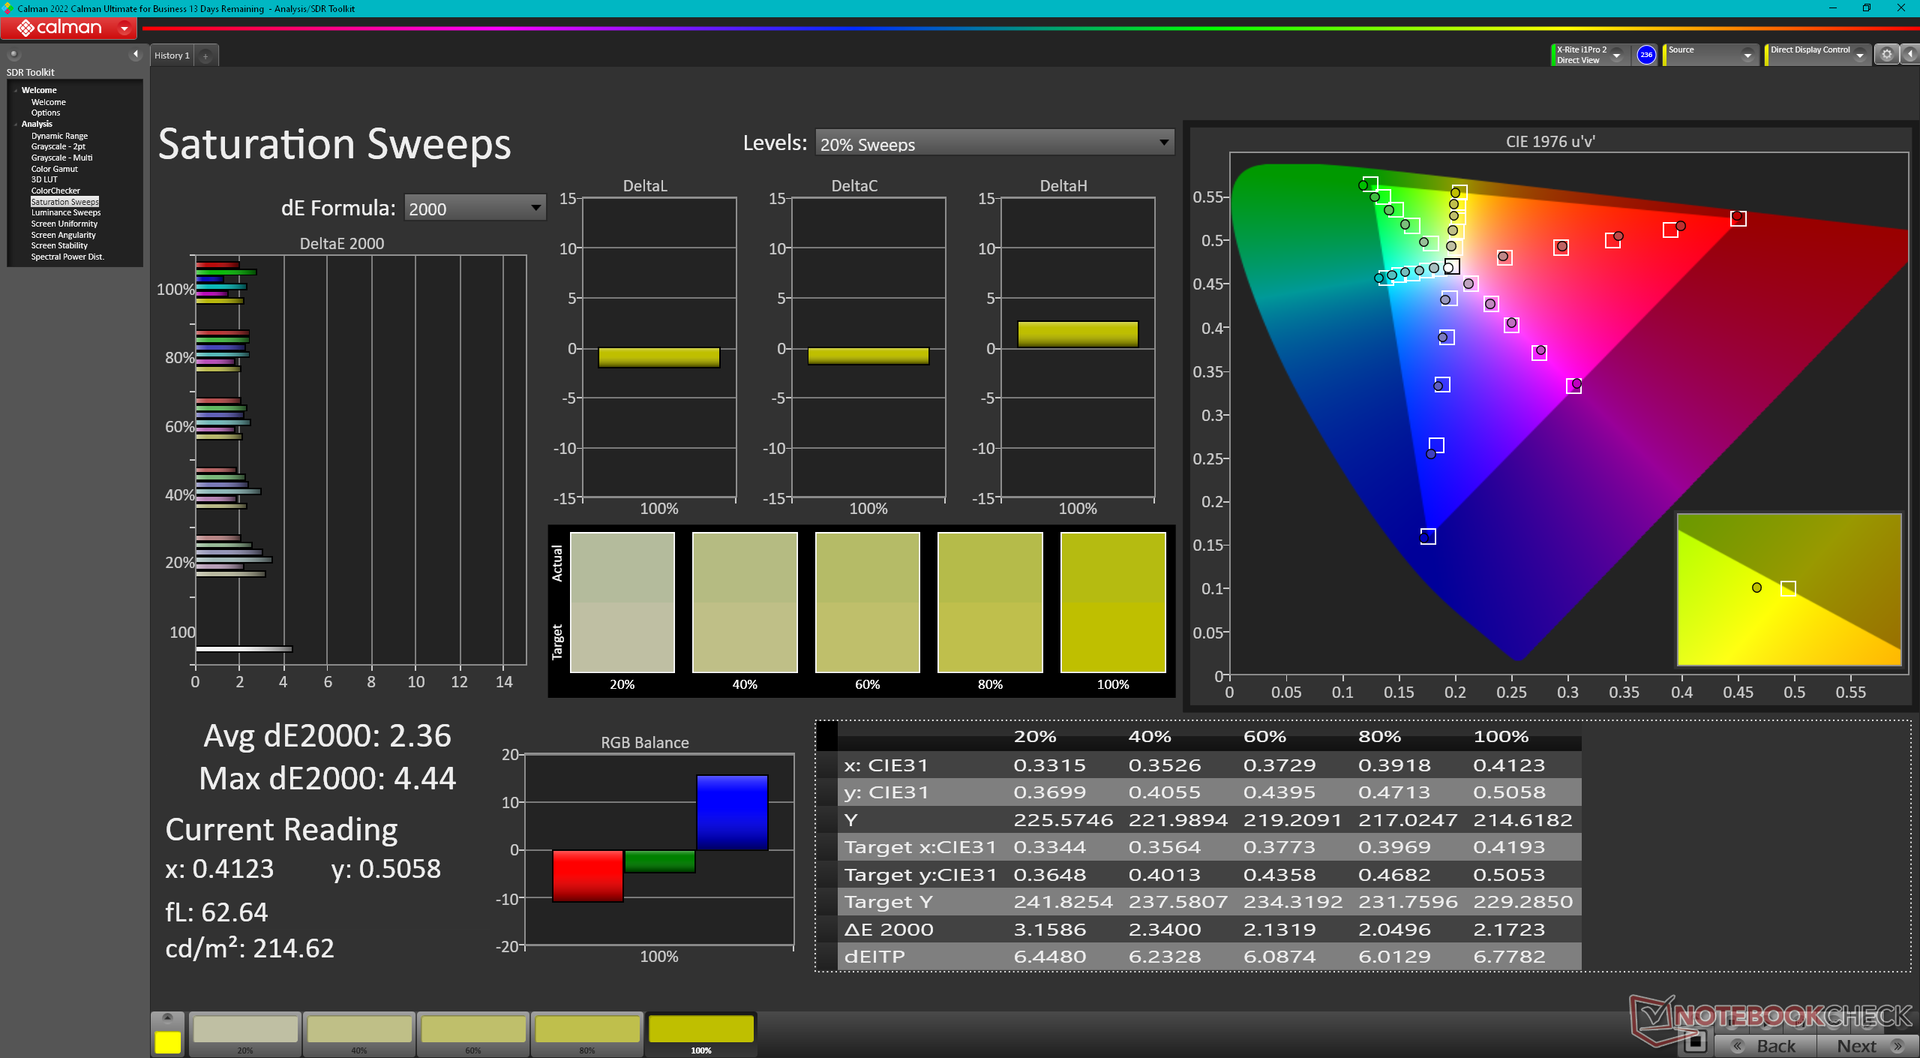
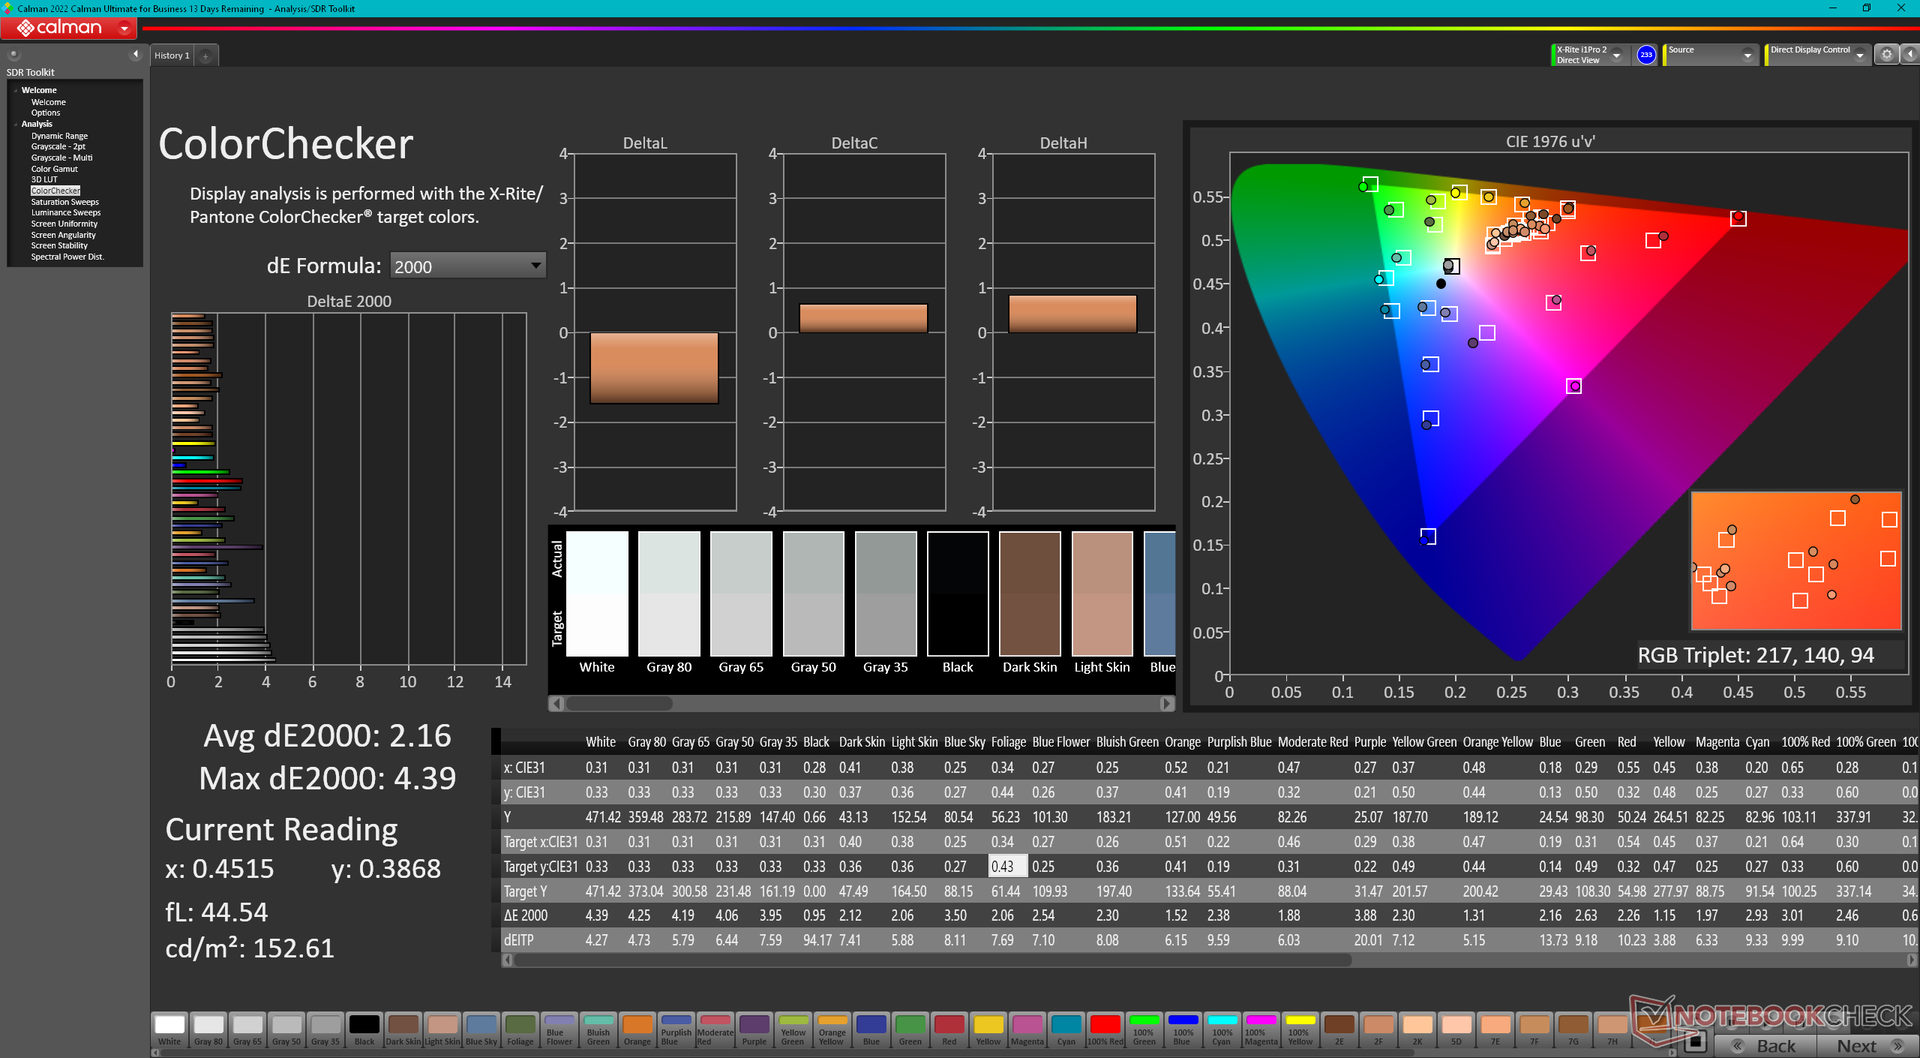
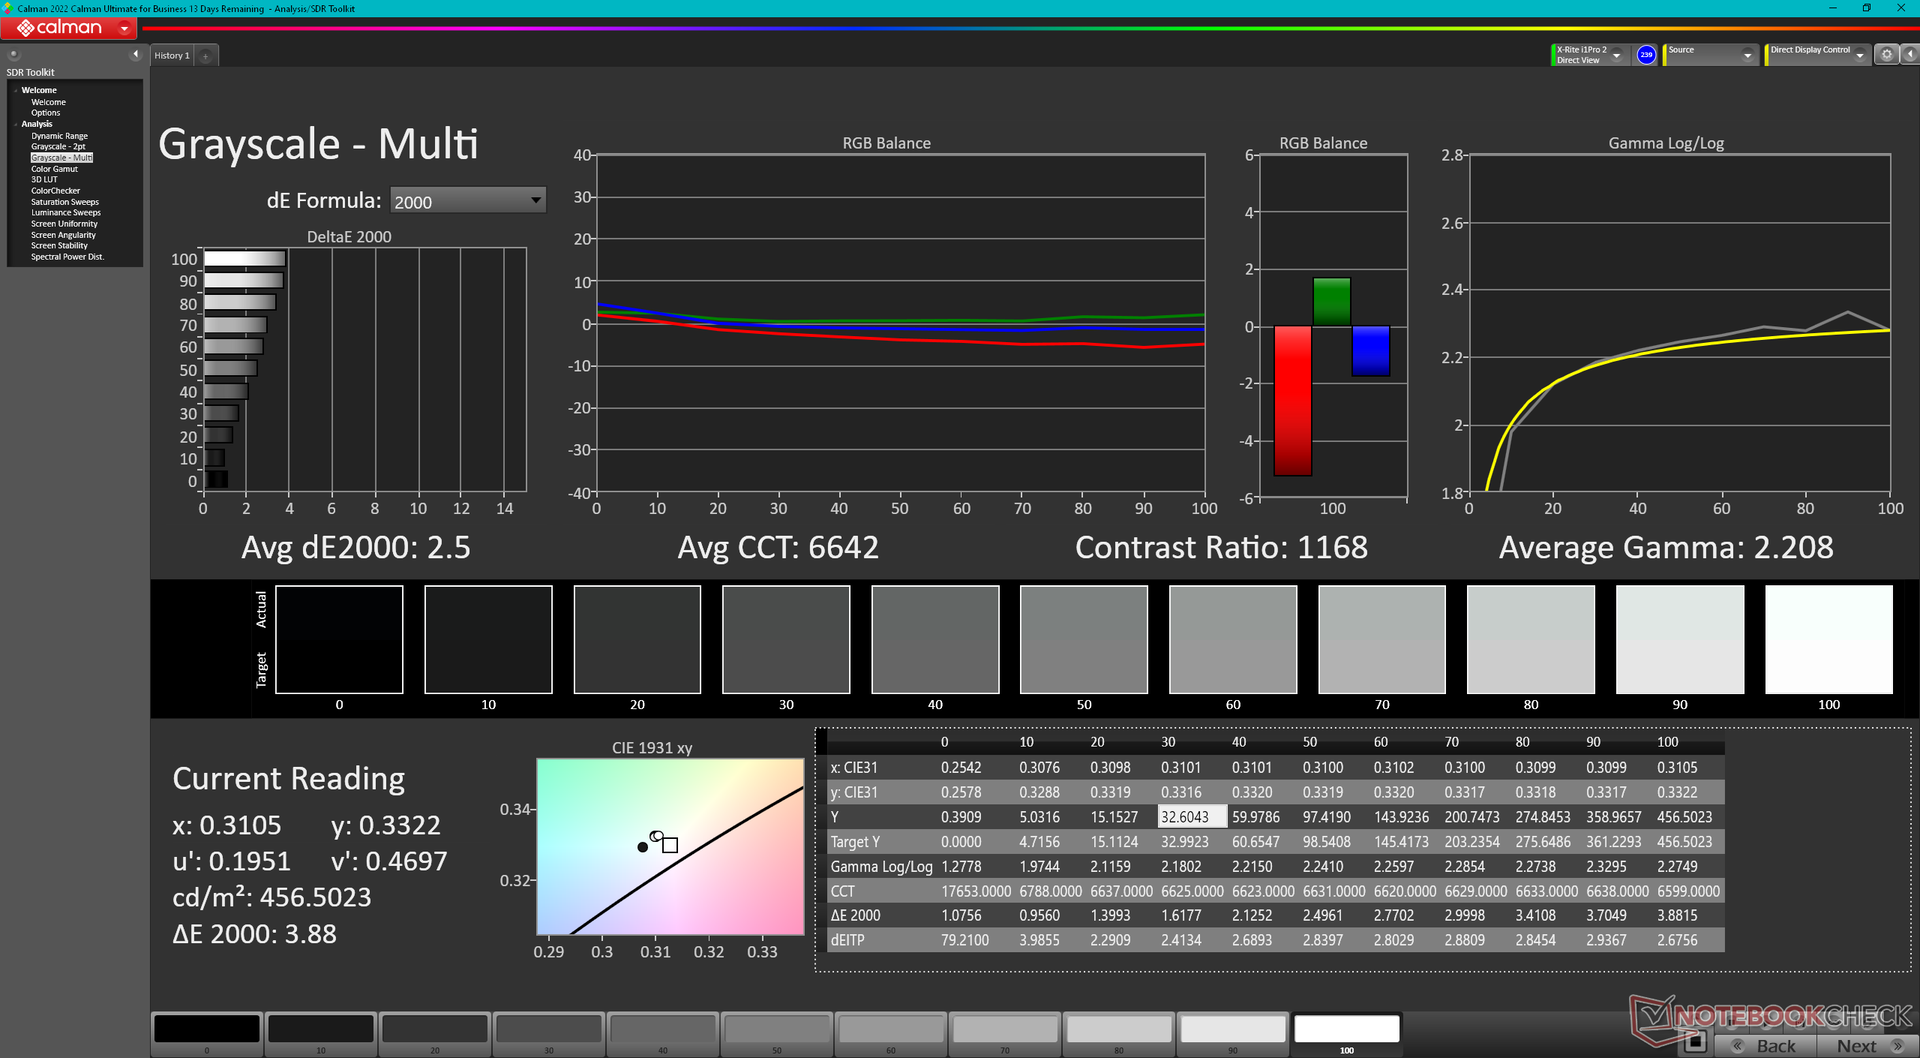
ΔE Color 2.16 | 0.5-29.43 Ø4.87, calibrated: 1.37
ΔE Greyscale 3.7 | 0.5-98 Ø5.1
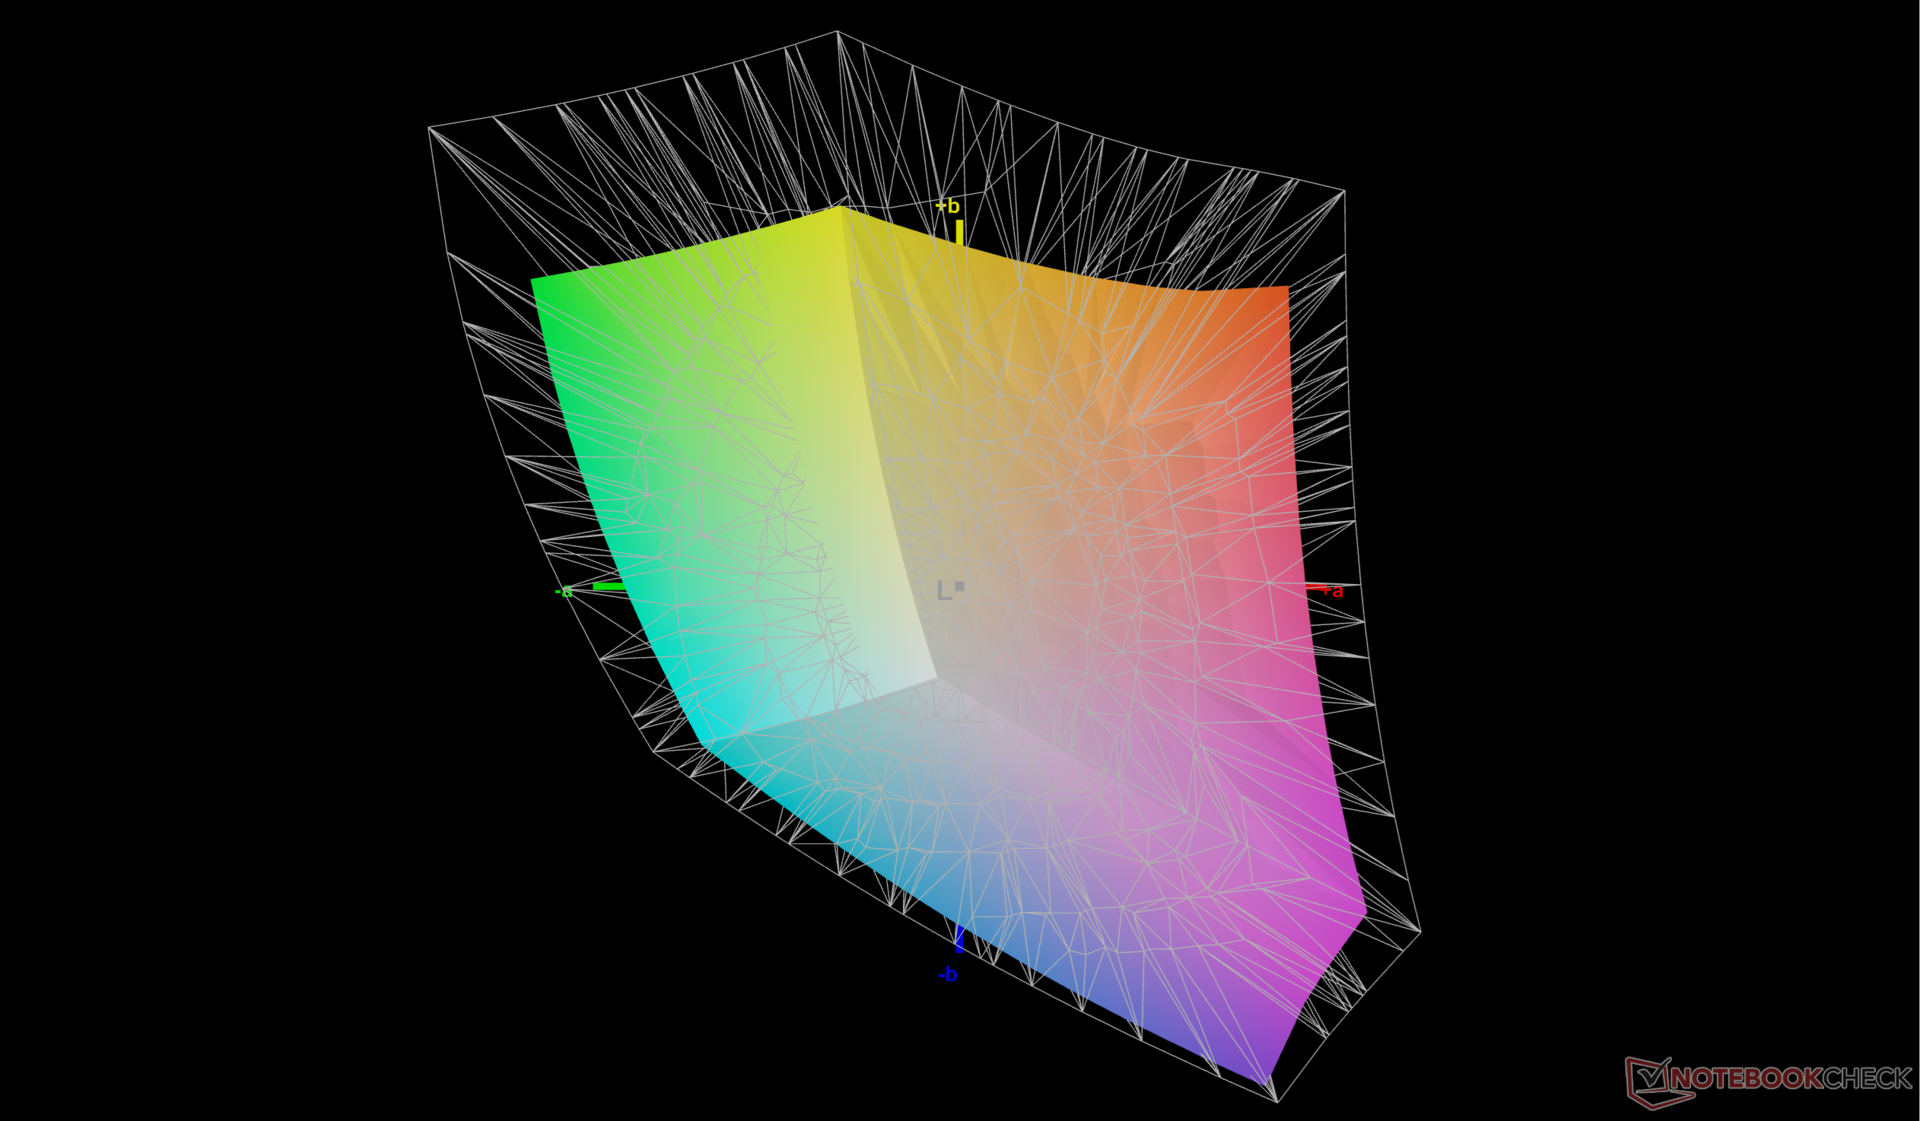
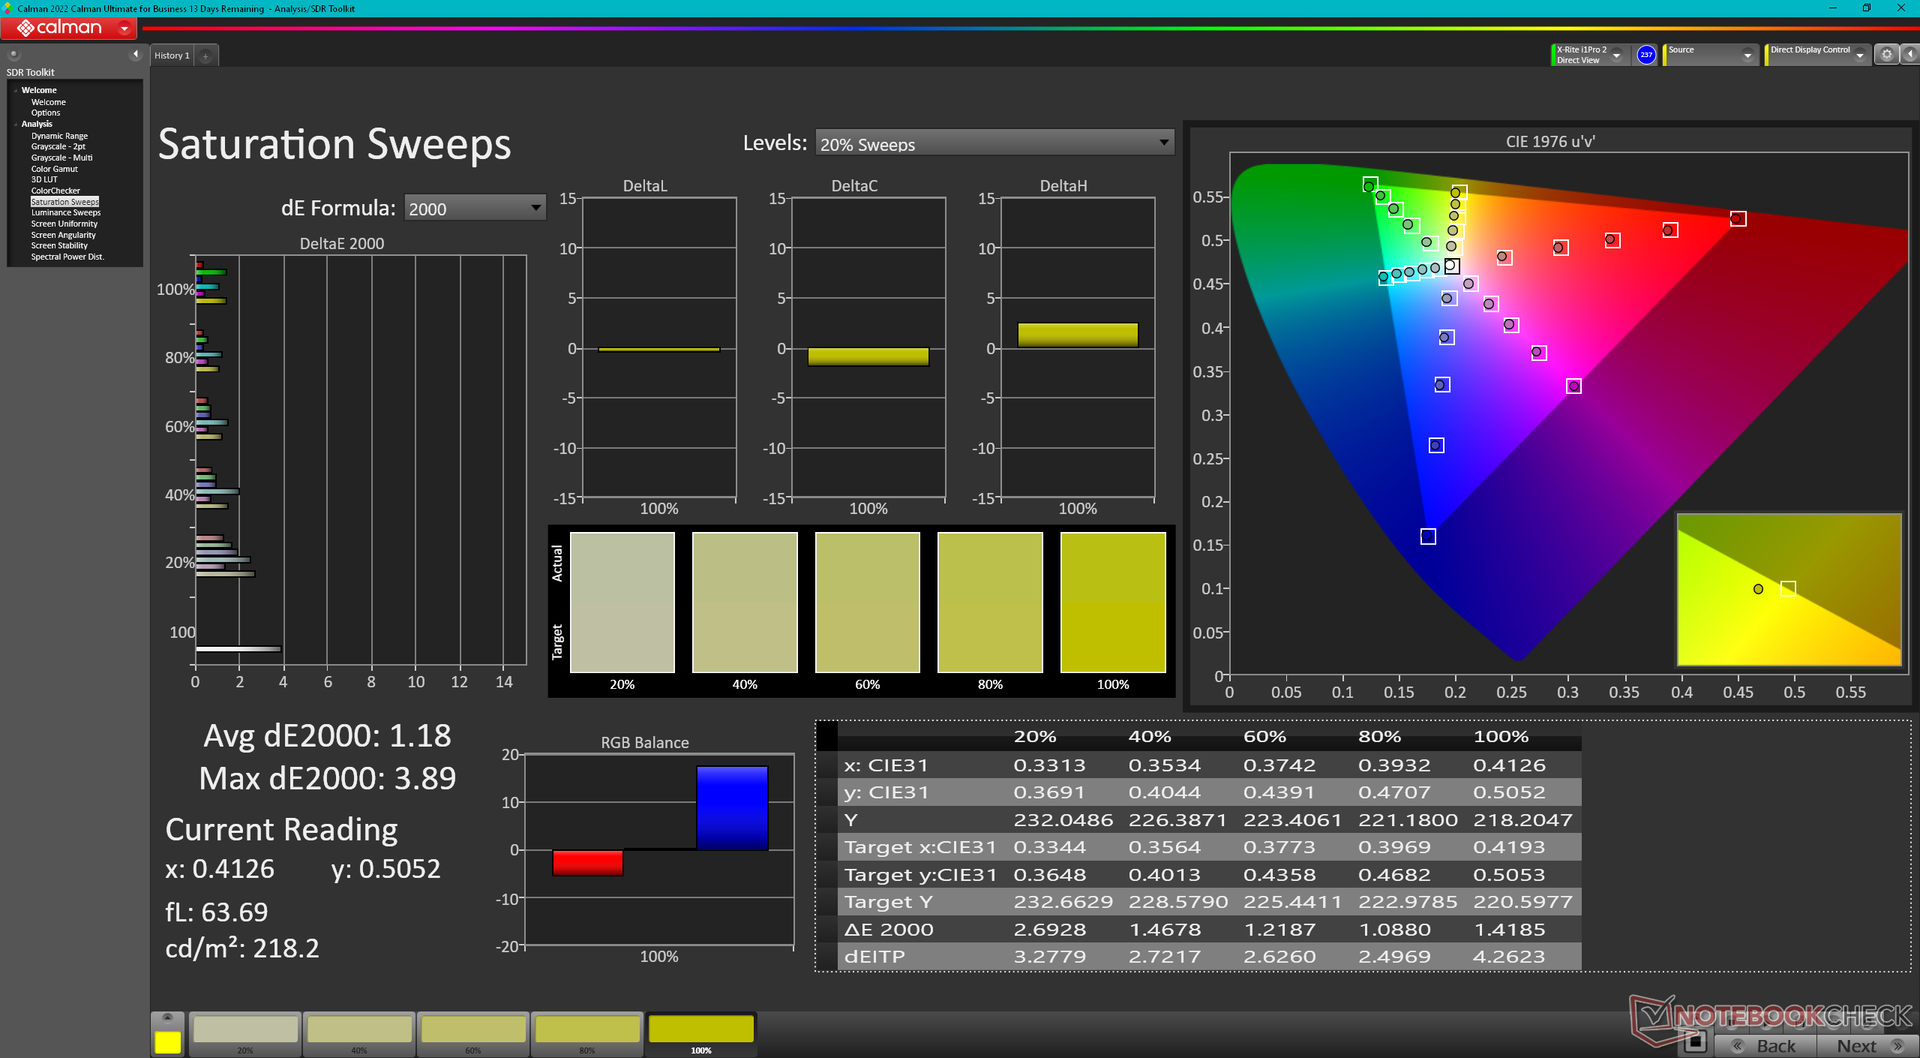
71% AdobeRGB 1998 (Argyll 2.2.0 3D)
97.7% sRGB (Argyll 2.2.0 3D)
69.1% Display P3 (Argyll 2.2.0 3D)
Gamma: 2.38
| HP ZBook Power 16 G11 A AUOA0A9, IPS, 2560x1600, 16", 120 Hz | HP ZBook Power 15 G10 BOE0B6A, IPS, 2560x1440, 15.6", 120 Hz | HP ZBook Fury 16 G11 AUO87A8, IPS, 3840x2400, 16", 120 Hz | Lenovo ThinkPad P1 Gen 7 21KV001SGE MNG007DA1-9 , IPS LED, 2560x1600, 16", 165 Hz | Lenovo ThinkPad P16s G2 21K9000CGE ATNA60YV04-0, OLED, 3840x2400, 16", 60 Hz | Dell Precision 5690 Samsung 160YV03, OLED, 3840x2400, 16", 60 Hz | |
|---|---|---|---|---|---|---|
| Display | -1% | 22% | 0% | 28% | 27% | |
| Display P3 Coverage | 69.1 | 68.2 -1% | 98.4 42% | 69.4 0% | 99.9 45% | 99.8 44% |
| sRGB Coverage | 97.7 | 95.6 -2% | 99.9 2% | 97.6 0% | 100 2% | 100 2% |
| AdobeRGB 1998 Coverage | 71 | 70.5 -1% | 86 21% | 71.8 1% | 96.9 36% | 96.6 36% |
| Response Times | -10% | 8% | -4% | 87% | 84% | |
| Response Time Grey 50% / Grey 80% * | 13.6 ? | 13 ? 4% | 11.4 ? 16% | 11.2 ? 18% | 1.5 ? 89% | 1.7 ? 87% |
| Response Time Black / White * | 8.4 ? | 10.4 ? -24% | 8.4 ? -0% | 10.6 ? -26% | 1.3 ? 85% | 1.7 ? 80% |
| PWM Frequency | 60 | 60 ? | ||||
| Screen | -13% | 5% | -10% | 2% | -14% | |
| Brightness middle | 470.7 | 313.8 -33% | 457.6 -3% | 516 10% | 416 -12% | 348.1 -26% |
| Brightness | 431 | 302 -30% | 466 8% | 505 17% | 421 -2% | 351 -19% |
| Brightness Distribution | 88 | 83 -6% | 83 -6% | 89 1% | 98 11% | 97 10% |
| Black Level * | 0.57 | 0.29 49% | 0.43 25% | 0.41 28% | ||
| Contrast | 826 | 1082 31% | 1064 29% | 1259 52% | ||
| Colorchecker dE 2000 * | 2.16 | 3.27 -51% | 2.78 -29% | 3.5 -62% | 1.3 40% | 4.18 -94% |
| Colorchecker dE 2000 max. * | 4.39 | 7.81 -78% | 5.53 -26% | 8.8 -100% | 2.8 36% | 6.68 -52% |
| Colorchecker dE 2000 calibrated * | 1.37 | 0.56 59% | 1.37 -0% | 1.2 12% | 2.9 -112% | 0.97 29% |
| Greyscale dE 2000 * | 3.7 | 5.9 -59% | 2 46% | 5.6 -51% | 1.8 51% | 1.7 54% |
| Gamma | 2.38 92% | 2.18 101% | 2.28 96% | 2.27 97% | 2.25 98% | 2.2 100% |
| CCT | 6765 96% | 6323 103% | 6806 96% | 6071 107% | 6574 99% | 6198 105% |
| Total Average (Program / Settings) | -8% /
-10% | 12% /
9% | -5% /
-7% | 39% /
22% | 32% /
13% |
* ... smaller is better
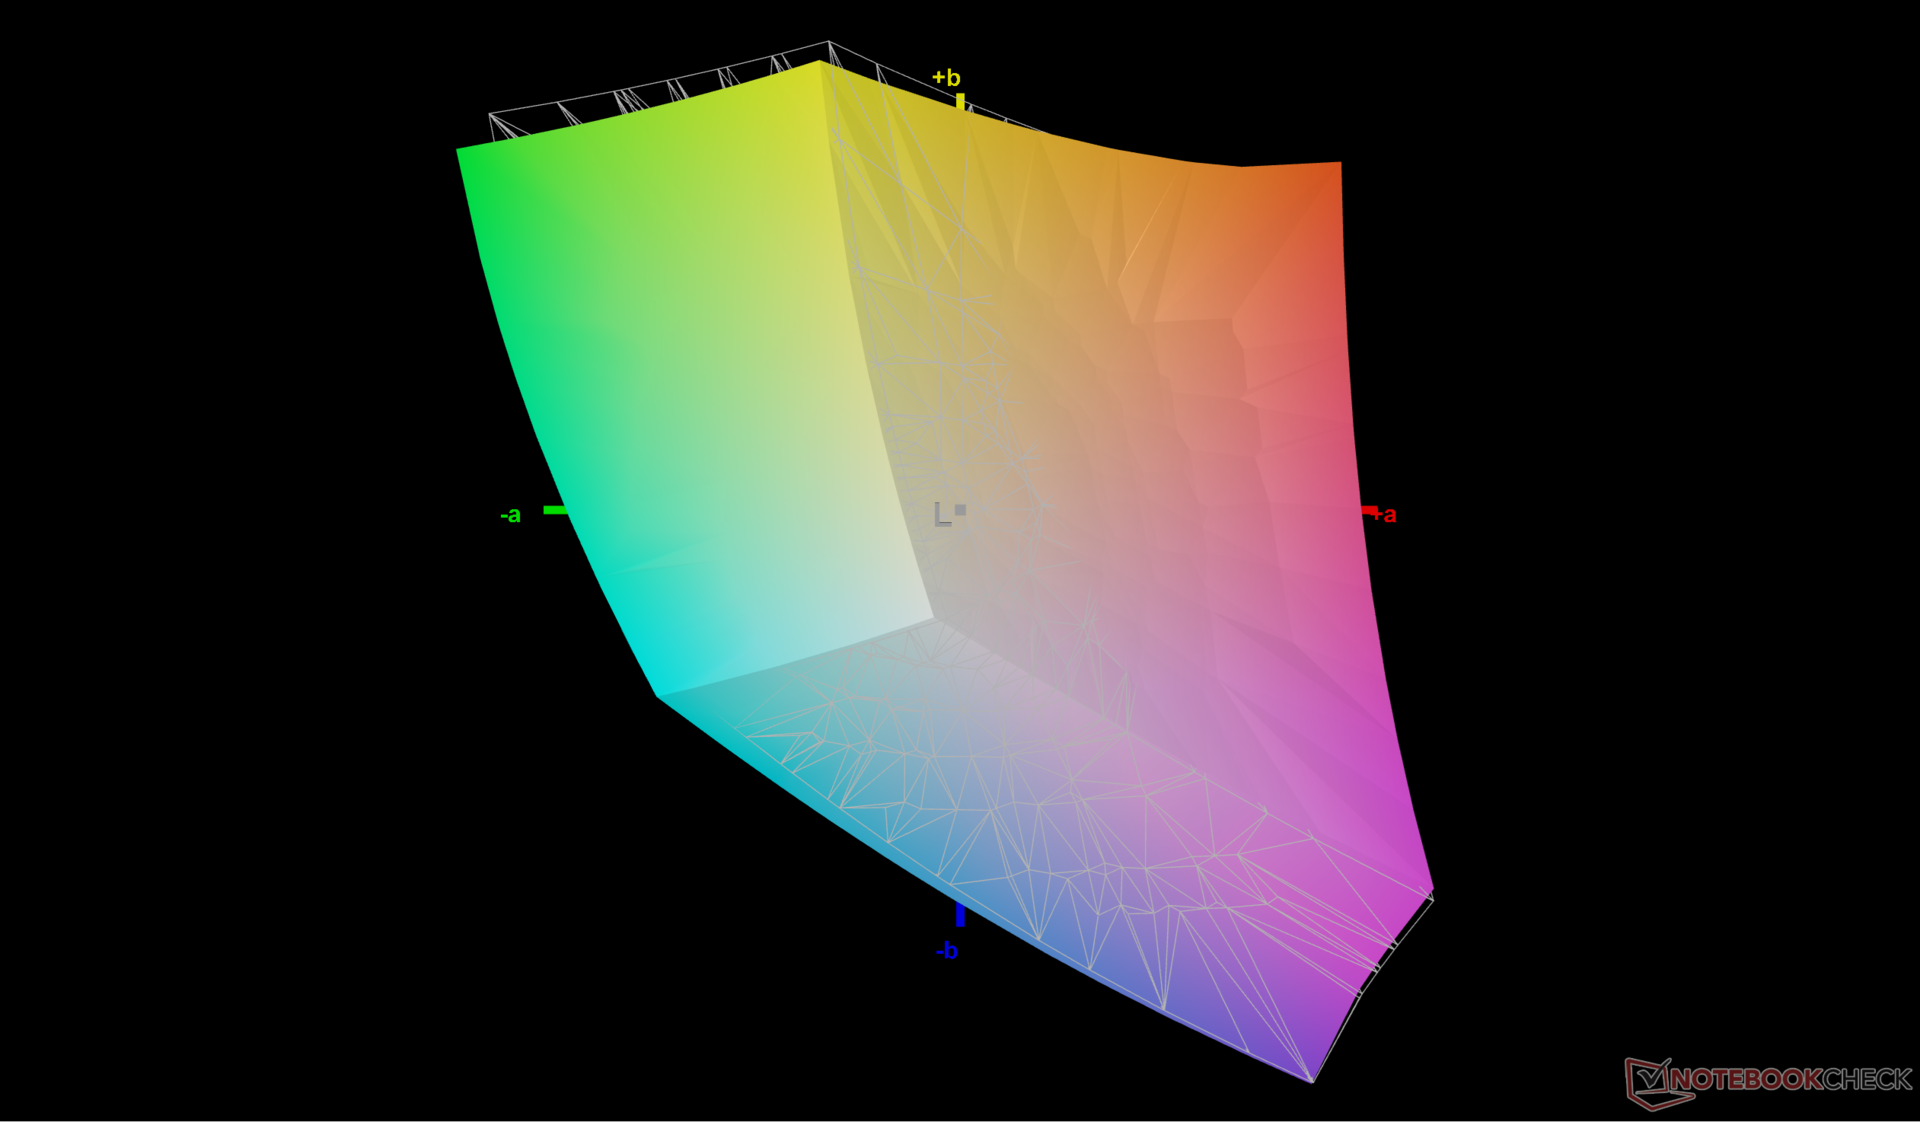
显示器开箱即按照 sRGB 标准进行了校准。使用我们的 X-Rite 色差计对面板进行校准后,平均灰度和色彩 deltaE 值会进一步提高,分别从 3.7 和 2.16 降至 2.5 和 1.37。我们的校准 ICM 配置文件可在上面免费下载。

Display Response Times
| ↔ Response Time Black to White | ||
|---|---|---|
| 8.4 ms ... rise ↗ and fall ↘ combined | ↗ 4.5 ms rise | 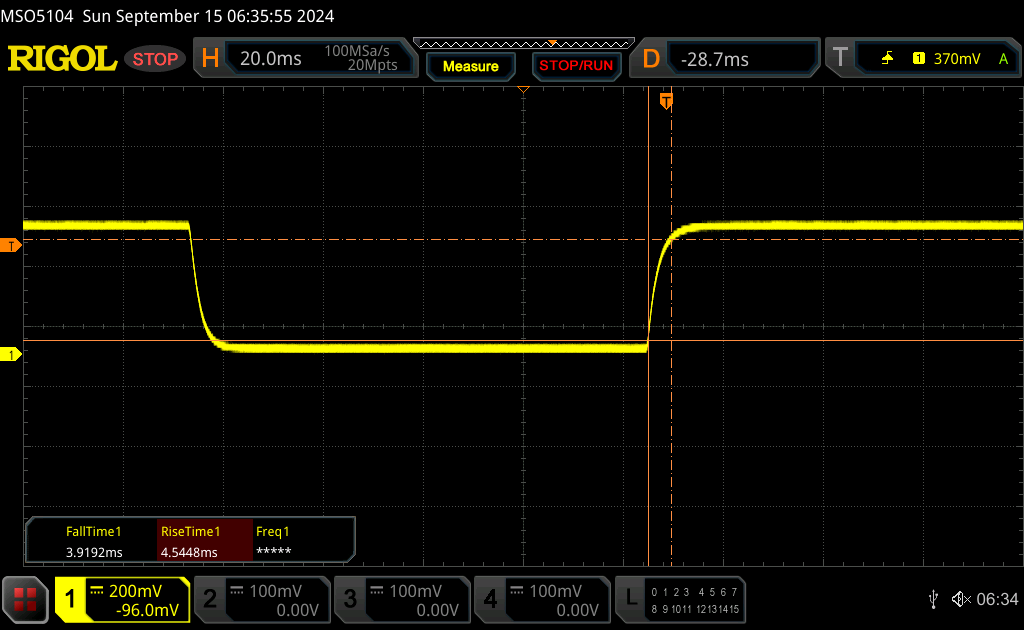 |
| ↘ 3.9 ms fall | ||
| The screen shows fast response rates in our tests and should be suited for gaming. In comparison, all tested devices range from 0.1 (minimum) to 240 (maximum) ms. » 21 % of all devices are better. This means that the measured response time is better than the average of all tested devices (20.8 ms). | ||
| ↔ Response Time 50% Grey to 80% Grey | ||
| 13.6 ms ... rise ↗ and fall ↘ combined | ↗ 7.2 ms rise | 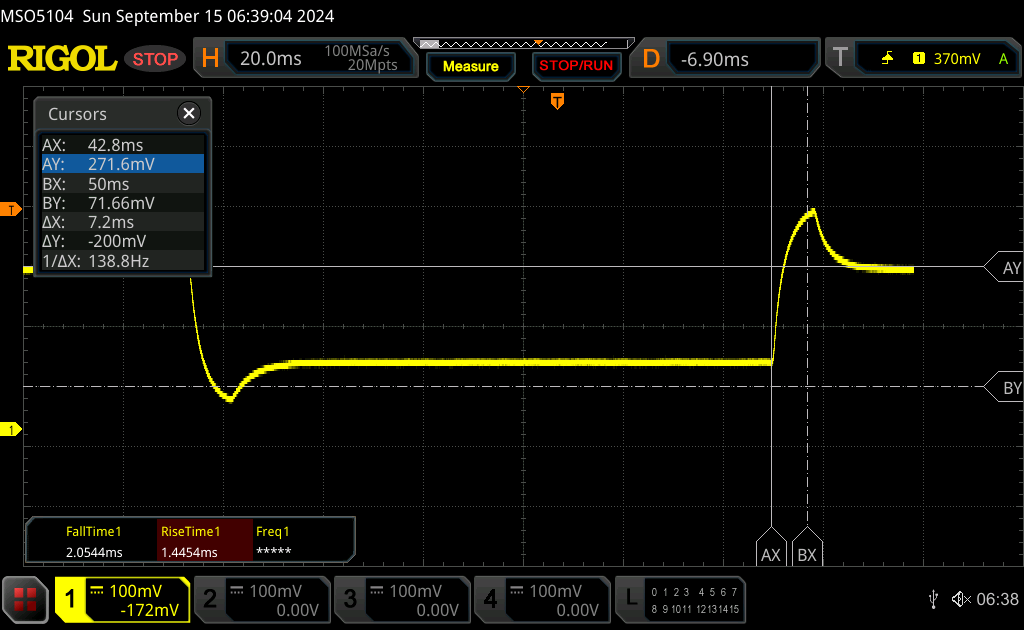 |
| ↘ 6.4 ms fall | ||
| The screen shows good response rates in our tests, but may be too slow for competitive gamers. In comparison, all tested devices range from 0.165 (minimum) to 636 (maximum) ms. » 24 % of all devices are better. This means that the measured response time is better than the average of all tested devices (32.5 ms). | ||
Screen Flickering / PWM (Pulse-Width Modulation)
| Screen flickering / PWM not detected |  | ||
In comparison: 53 % of all tested devices do not use PWM to dim the display. If PWM was detected, an average of 8516 (minimum: 5 - maximum: 343500) Hz was measured. | |||
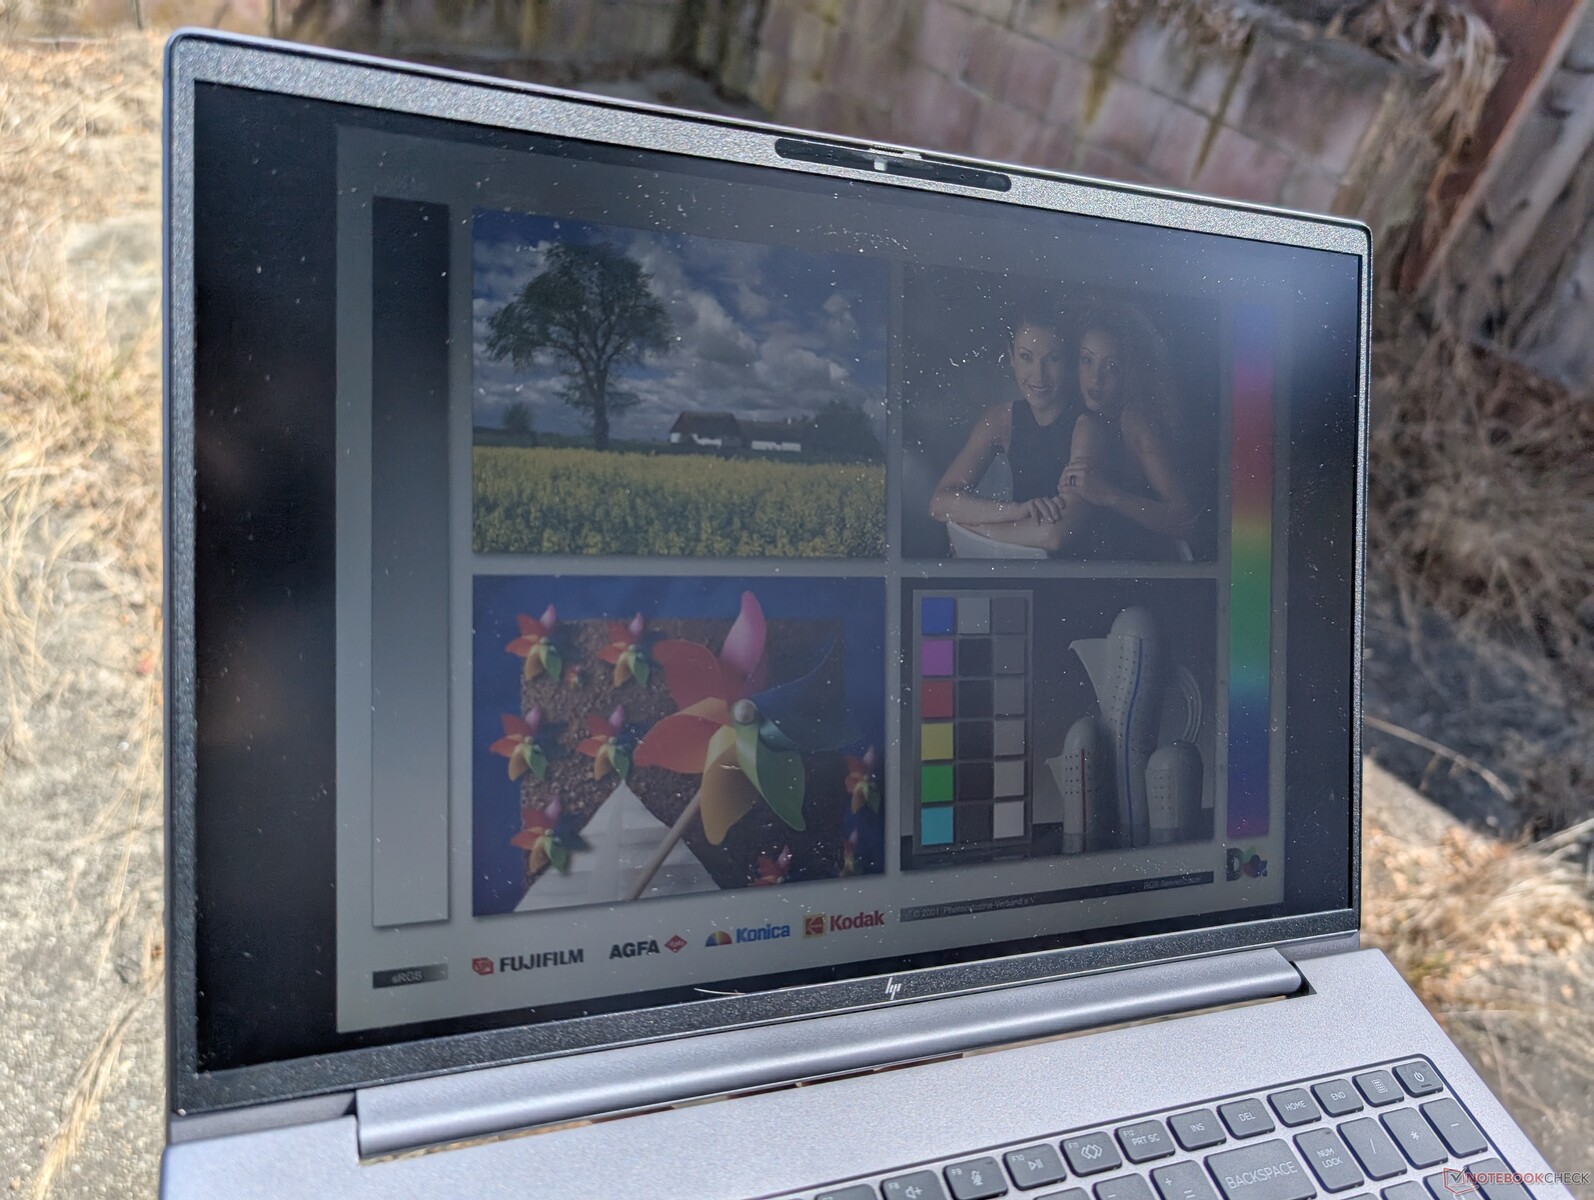
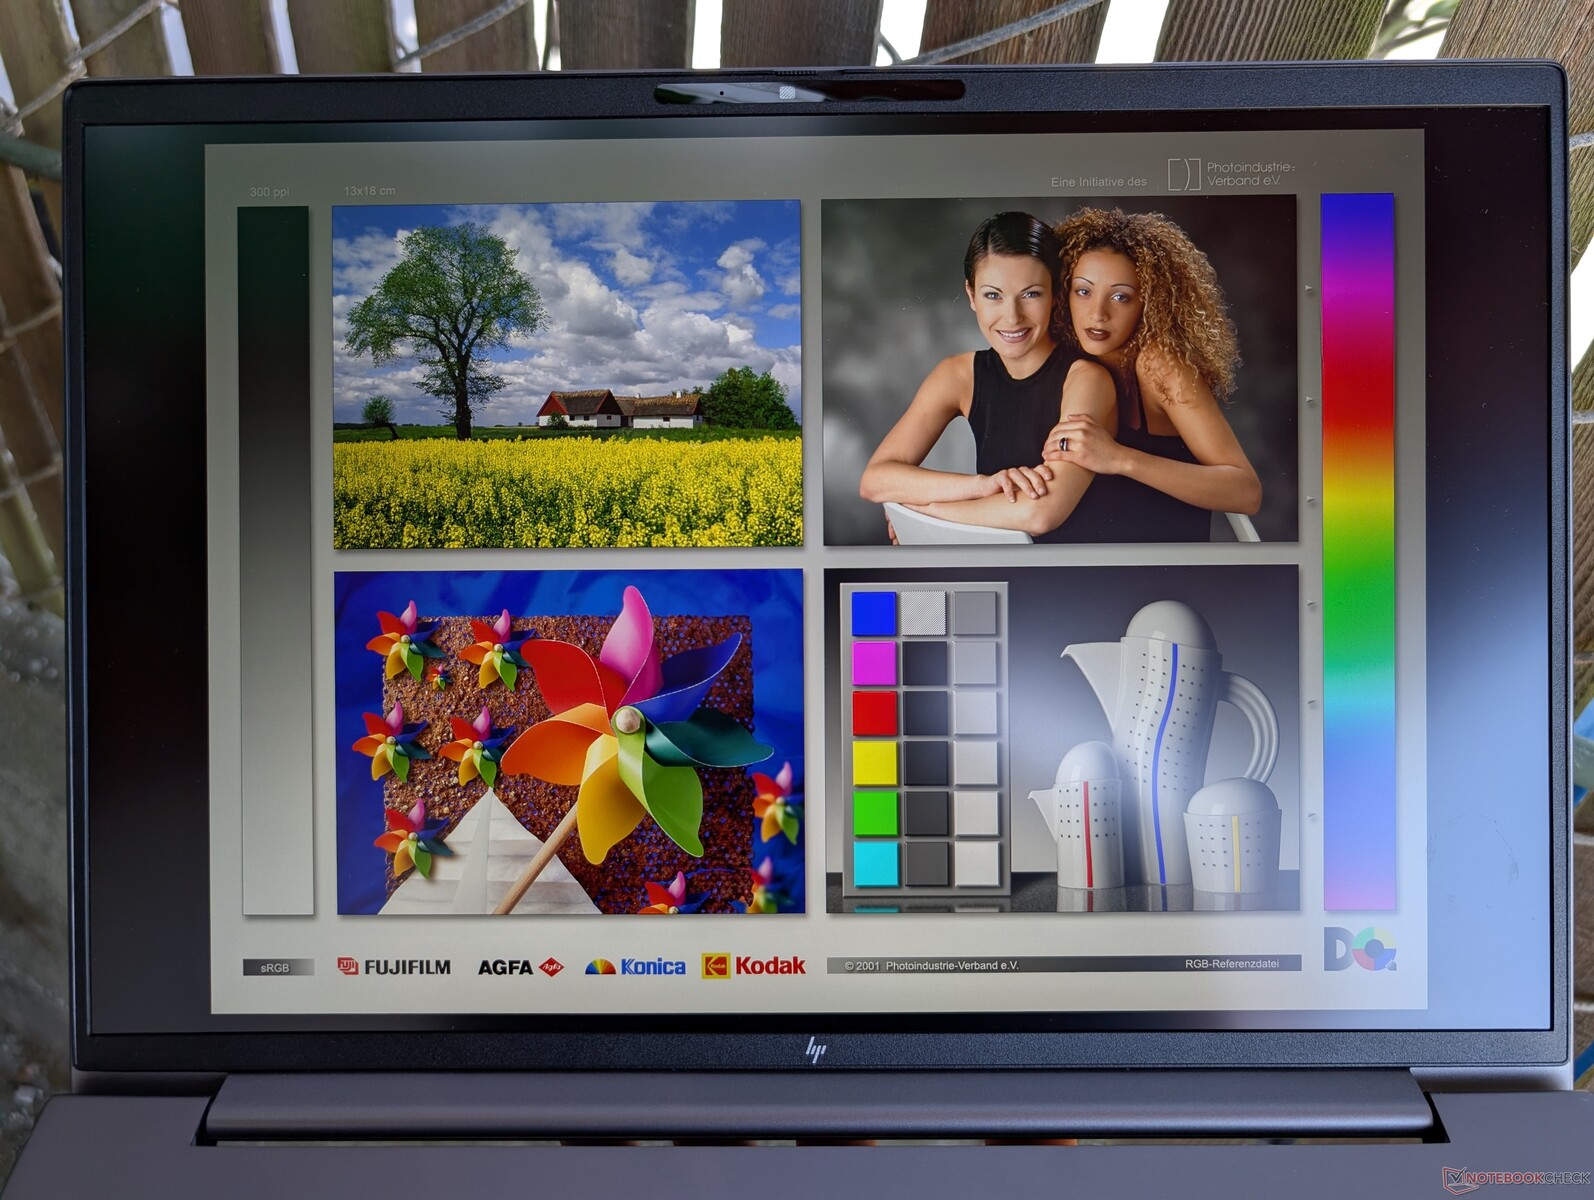
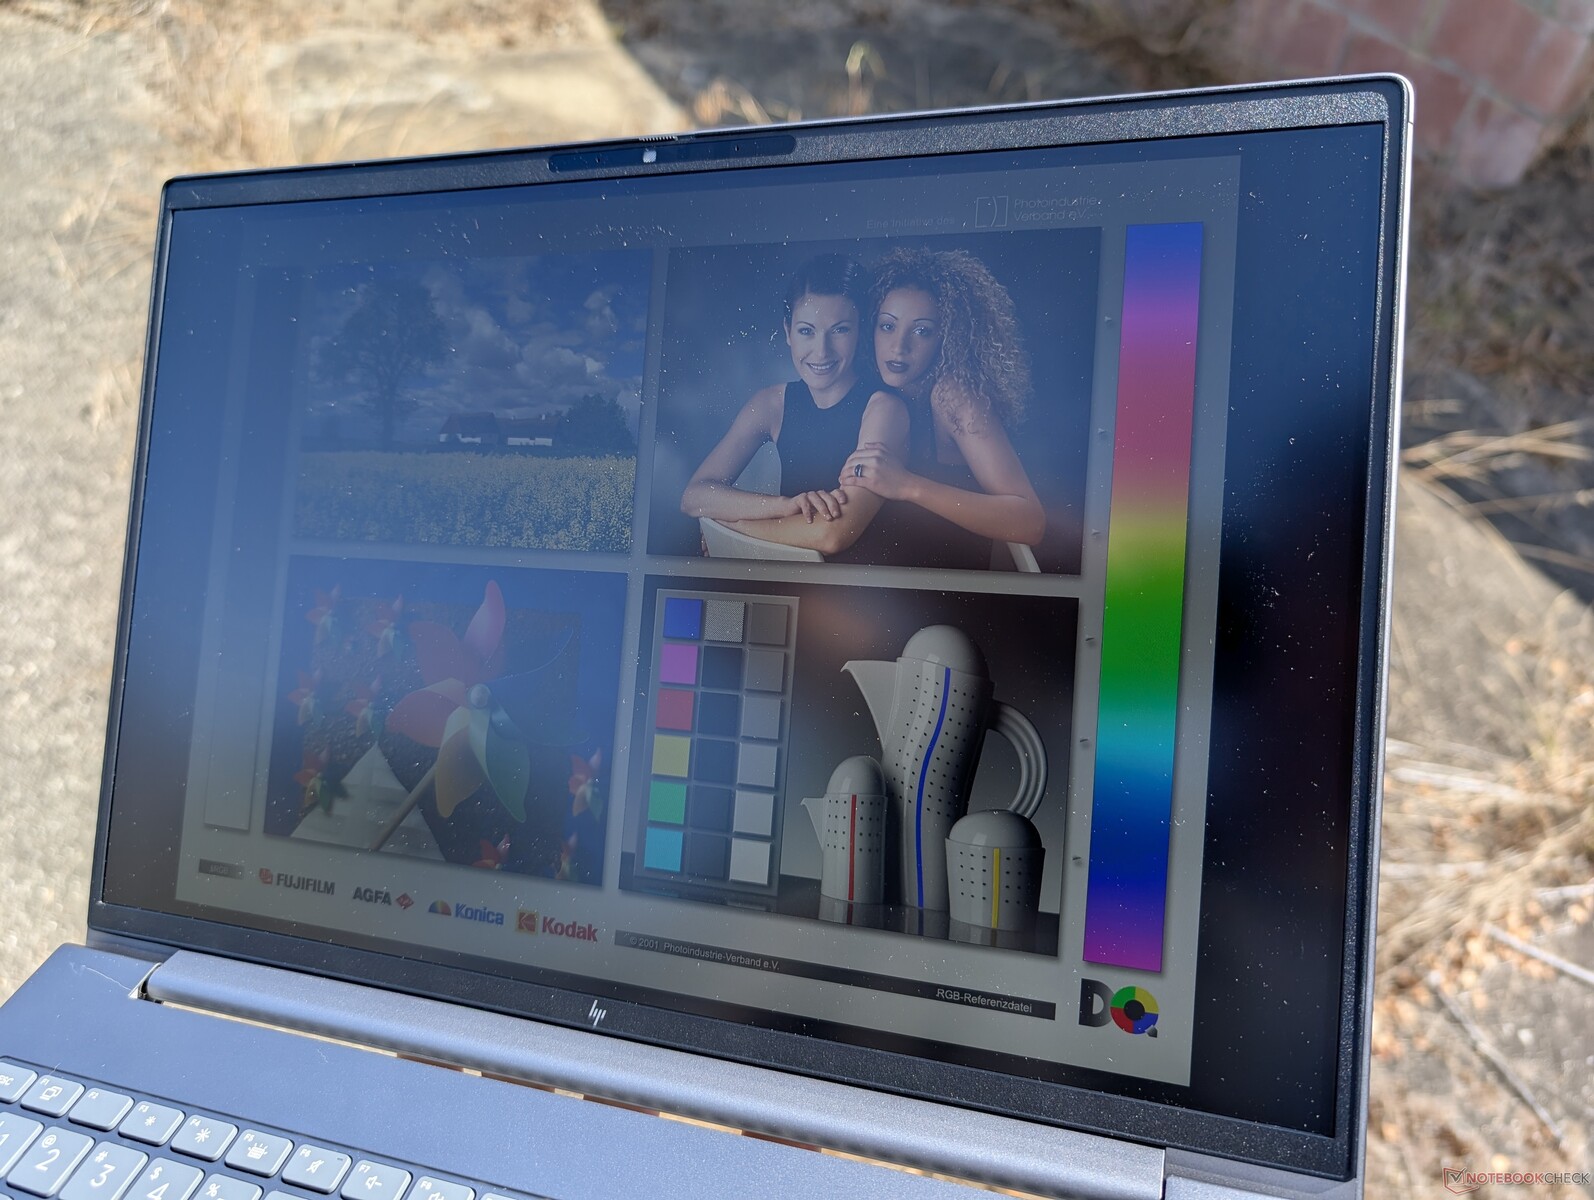
使用我们的 1600p 面板,在阴凉处的室外能见度还不错,但低端产品会更暗,更容易产生眩光。如果经常在户外使用,应考虑使用 1000 尼特的面板。
性能 - 全新的 Zen 4,同样的 Zen 4 性能
测试条件
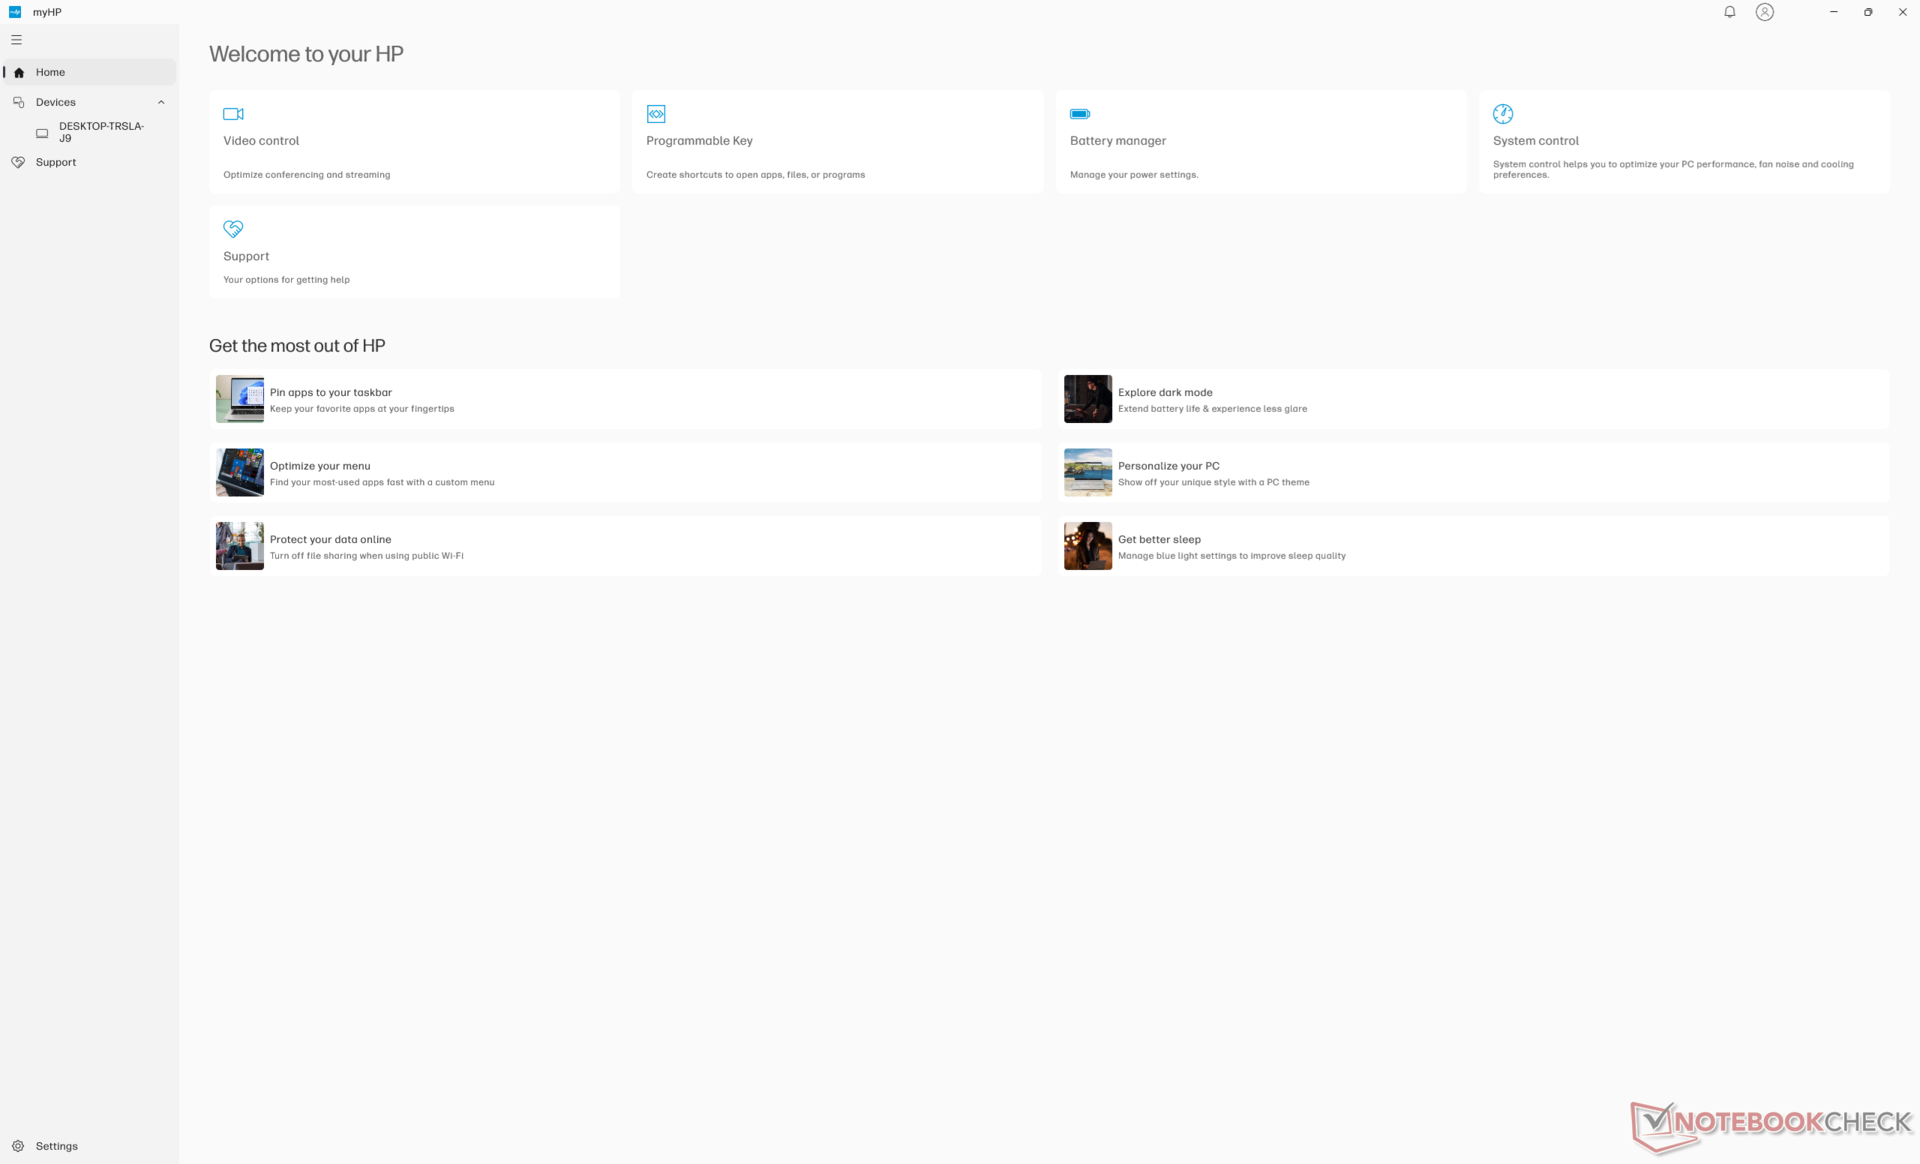
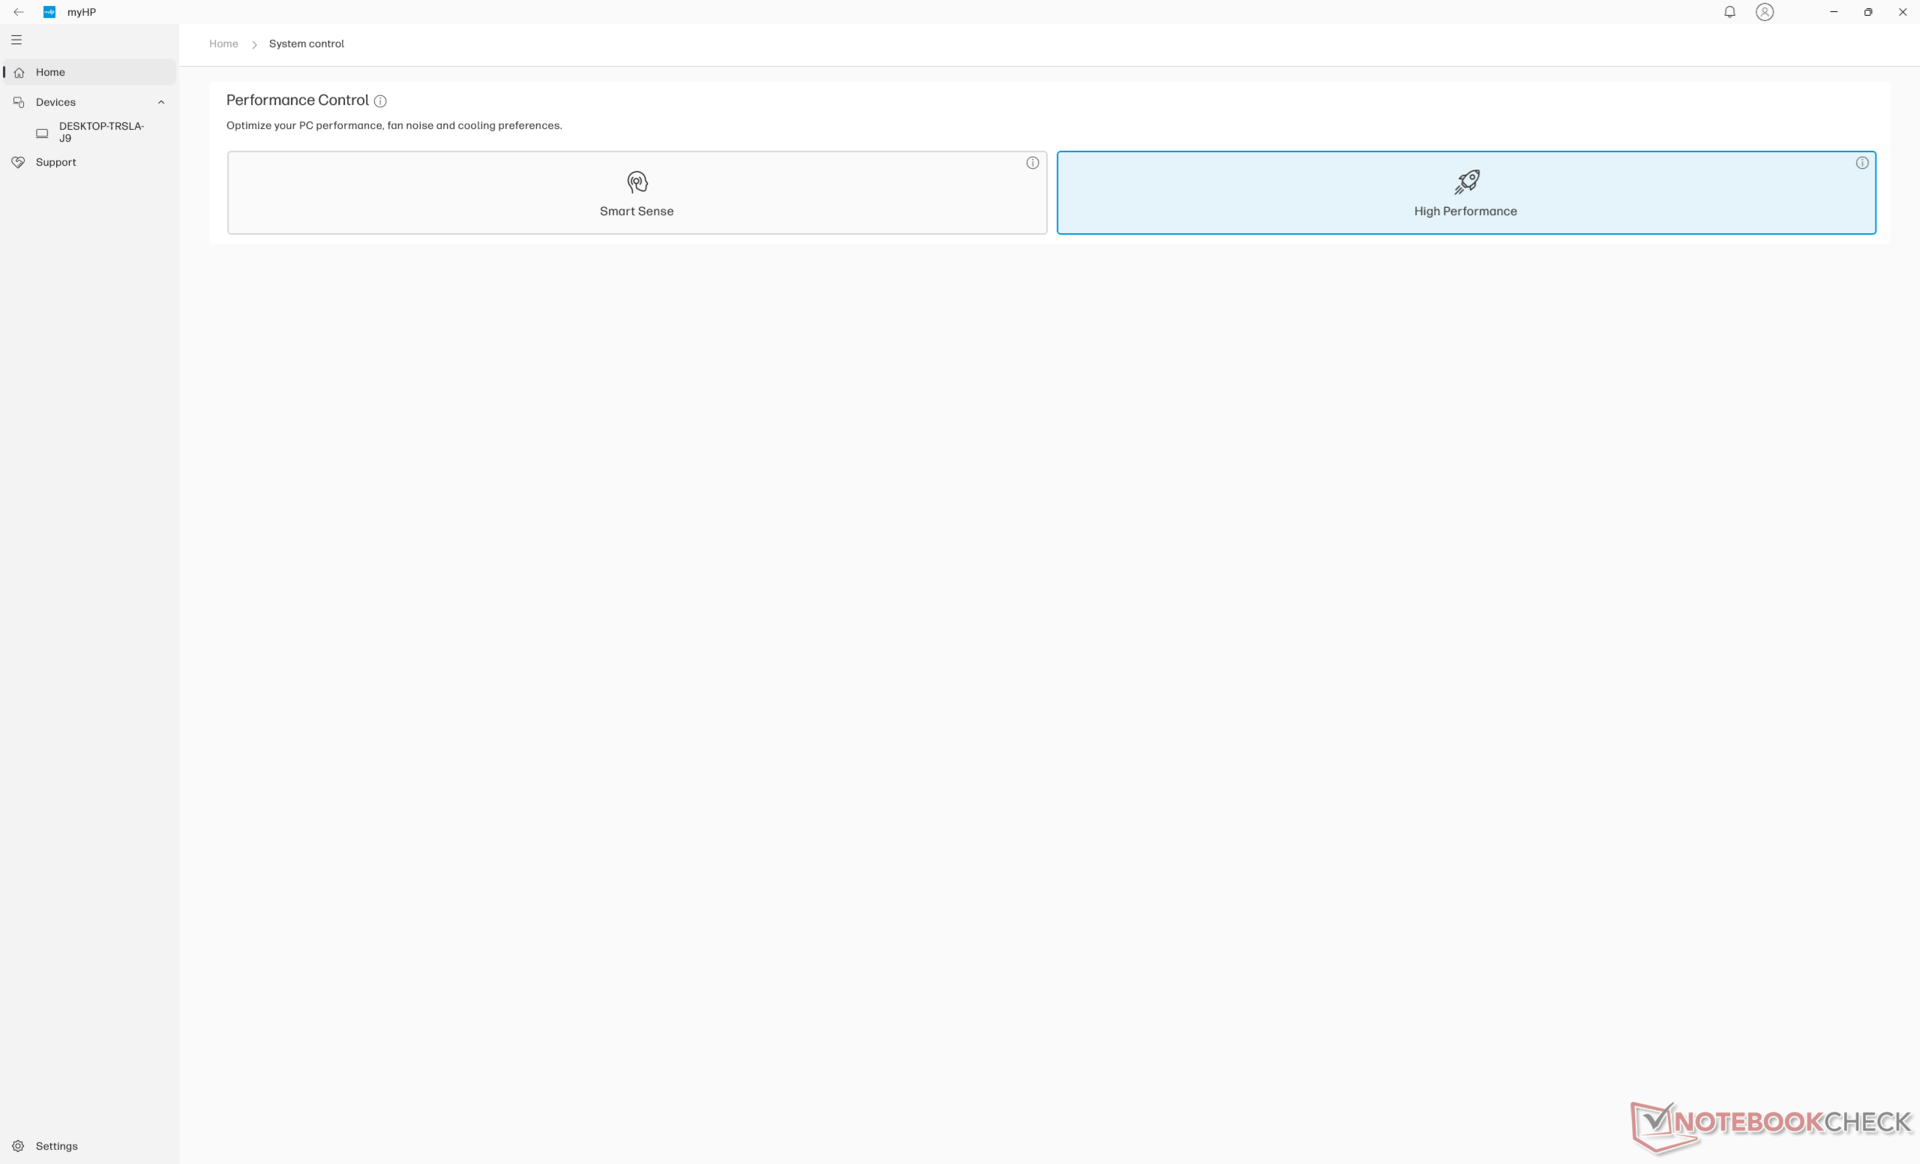
在运行以下基准测试之前,我们将 Windows 和 MyHP 都设置为性能模式。支持 Optimus 1.0。
处理器
......(英文 Ryzen 7 8845HS与 Ryzen 7 7840HS所取代的 ZBook Power 15 G10.事实上,基准测试显示,这两款处理器的性能仅相差几个百分点,基本相同。这可能会让那些期望在从 15 英寸过渡到 16 英寸的过程中获得更显著性能升级的电源用户感到失望。只有惠普更厚的 ZBook Fury 系列才有更快的 Raptor Lake-HX 选项。
与 Ryzen 7 7840HS 相比,Ryzen 7 8845HS 的主要优势在于集成的 NPU 带来的 AI 加速。不过,Co-Pilot+ 与 Hawk Point CPU 不兼容,因此 NPU 在这款机器上的实用性非常有限。
降级到 Ryzen 5 8645HS预计会降低 25% 至 30% 的性能,而升级到 Ryzen 9 8945HS预计性能仅会提高 5%。
Cinebench R15 Multi Loop
Cinebench R23: Multi Core | Single Core
Cinebench R20: CPU (Multi Core) | CPU (Single Core)
Cinebench R15: CPU Multi 64Bit | CPU Single 64Bit
Blender: v2.79 BMW27 CPU
7-Zip 18.03: 7z b 4 | 7z b 4 -mmt1
Geekbench 6.4: Multi-Core | Single-Core
Geekbench 5.5: Multi-Core | Single-Core
HWBOT x265 Benchmark v2.2: 4k Preset
LibreOffice : 20 Documents To PDF
R Benchmark 2.5: Overall mean
| Geekbench 6.4 / Multi-Core | |
| HP ZBook Fury 16 G11 | |
| Dell Precision 5690 | |
| Dell Precision 5000 5490 | |
| HP ZBook Power 15 G10 | |
| Average AMD Ryzen 7 8845HS (11073 - 14014, n=16) | |
| HP ZBook Power 16 G11 A | |
| Lenovo ThinkPad P16s G2 21K9000CGE | |
| Lenovo ThinkPad P16v G1 AMD | |
| Geekbench 6.4 / Single-Core | |
| HP ZBook Fury 16 G11 | |
| HP ZBook Power 15 G10 | |
| Average AMD Ryzen 7 8845HS (2510 - 2698, n=14) | |
| HP ZBook Power 16 G11 A | |
| Lenovo ThinkPad P16v G1 AMD | |
| Dell Precision 5690 | |
| Lenovo ThinkPad P16s G2 21K9000CGE | |
| Dell Precision 5000 5490 | |
Cinebench R23: Multi Core | Single Core
Cinebench R20: CPU (Multi Core) | CPU (Single Core)
Cinebench R15: CPU Multi 64Bit | CPU Single 64Bit
Blender: v2.79 BMW27 CPU
7-Zip 18.03: 7z b 4 | 7z b 4 -mmt1
Geekbench 6.4: Multi-Core | Single-Core
Geekbench 5.5: Multi-Core | Single-Core
HWBOT x265 Benchmark v2.2: 4k Preset
LibreOffice : 20 Documents To PDF
R Benchmark 2.5: Overall mean
* ... smaller is better
AIDA64: FP32 Ray-Trace | FPU Julia | CPU SHA3 | CPU Queen | FPU SinJulia | FPU Mandel | CPU AES | CPU ZLib | FP64 Ray-Trace | CPU PhotoWorxx
| Performance Rating | |
| Average AMD Ryzen 7 8845HS | |
| HP ZBook Power 15 G10 | |
| HP ZBook Power 16 G11 A | |
| HP ZBook Fury 16 G11 | |
| Lenovo ThinkPad P16s G2 21K9000CGE | |
| Dell Precision 5690 | |
| Lenovo ThinkPad P1 Gen 7 21KV001SGE | |
| AIDA64 / FP32 Ray-Trace | |
| Average AMD Ryzen 7 8845HS (23708 - 29544, n=12) | |
| HP ZBook Power 15 G10 | |
| HP ZBook Power 16 G11 A | |
| Lenovo ThinkPad P16s G2 21K9000CGE | |
| HP ZBook Fury 16 G11 | |
| Dell Precision 5690 | |
| Lenovo ThinkPad P1 Gen 7 21KV001SGE | |
| AIDA64 / FPU Julia | |
| HP ZBook Power 16 G11 A | |
| Average AMD Ryzen 7 8845HS (99659 - 125873, n=12) | |
| HP ZBook Power 15 G10 | |
| HP ZBook Fury 16 G11 | |
| Lenovo ThinkPad P16s G2 21K9000CGE | |
| Dell Precision 5690 | |
| Lenovo ThinkPad P1 Gen 7 21KV001SGE | |
| AIDA64 / CPU SHA3 | |
| HP ZBook Fury 16 G11 | |
| HP ZBook Power 16 G11 A | |
| Average AMD Ryzen 7 8845HS (4332 - 5180, n=12) | |
| HP ZBook Power 15 G10 | |
| Lenovo ThinkPad P16s G2 21K9000CGE | |
| Dell Precision 5690 | |
| Lenovo ThinkPad P1 Gen 7 21KV001SGE | |
| AIDA64 / CPU Queen | |
| HP ZBook Fury 16 G11 | |
| HP ZBook Power 16 G11 A | |
| Average AMD Ryzen 7 8845HS (109458 - 124695, n=12) | |
| HP ZBook Power 15 G10 | |
| Lenovo ThinkPad P16s G2 21K9000CGE | |
| Dell Precision 5690 | |
| Lenovo ThinkPad P1 Gen 7 21KV001SGE | |
| AIDA64 / FPU SinJulia | |
| Average AMD Ryzen 7 8845HS (14062 - 15519, n=12) | |
| HP ZBook Power 15 G10 | |
| HP ZBook Power 16 G11 A | |
| Lenovo ThinkPad P16s G2 21K9000CGE | |
| HP ZBook Fury 16 G11 | |
| Dell Precision 5690 | |
| Lenovo ThinkPad P1 Gen 7 21KV001SGE | |
| AIDA64 / FPU Mandel | |
| Average AMD Ryzen 7 8845HS (53436 - 67367, n=12) | |
| HP ZBook Power 15 G10 | |
| HP ZBook Power 16 G11 A | |
| Lenovo ThinkPad P16s G2 21K9000CGE | |
| HP ZBook Fury 16 G11 | |
| Dell Precision 5690 | |
| Lenovo ThinkPad P1 Gen 7 21KV001SGE | |
| AIDA64 / CPU AES | |
| HP ZBook Fury 16 G11 | |
| Average AMD Ryzen 7 8845HS (64515 - 172642, n=12) | |
| Dell Precision 5690 | |
| HP ZBook Power 15 G10 | |
| Lenovo ThinkPad P1 Gen 7 21KV001SGE | |
| HP ZBook Power 16 G11 A | |
| Lenovo ThinkPad P16s G2 21K9000CGE | |
| AIDA64 / CPU ZLib | |
| HP ZBook Fury 16 G11 | |
| Dell Precision 5690 | |
| Lenovo ThinkPad P1 Gen 7 21KV001SGE | |
| HP ZBook Power 16 G11 A | |
| HP ZBook Power 15 G10 | |
| Lenovo ThinkPad P16s G2 21K9000CGE | |
| Average AMD Ryzen 7 8845HS (627 - 1080, n=12) | |
| AIDA64 / FP64 Ray-Trace | |
| HP ZBook Power 15 G10 | |
| Average AMD Ryzen 7 8845HS (12361 - 15911, n=12) | |
| HP ZBook Power 16 G11 A | |
| Lenovo ThinkPad P16s G2 21K9000CGE | |
| HP ZBook Fury 16 G11 | |
| Dell Precision 5690 | |
| Lenovo ThinkPad P1 Gen 7 21KV001SGE | |
| AIDA64 / CPU PhotoWorxx | |
| Dell Precision 5690 | |
| HP ZBook Power 15 G10 | |
| Lenovo ThinkPad P1 Gen 7 21KV001SGE | |
| HP ZBook Power 16 G11 A | |
| Average AMD Ryzen 7 8845HS (33192 - 41668, n=12) | |
| Lenovo ThinkPad P16s G2 21K9000CGE | |
| HP ZBook Fury 16 G11 | |
压力测试
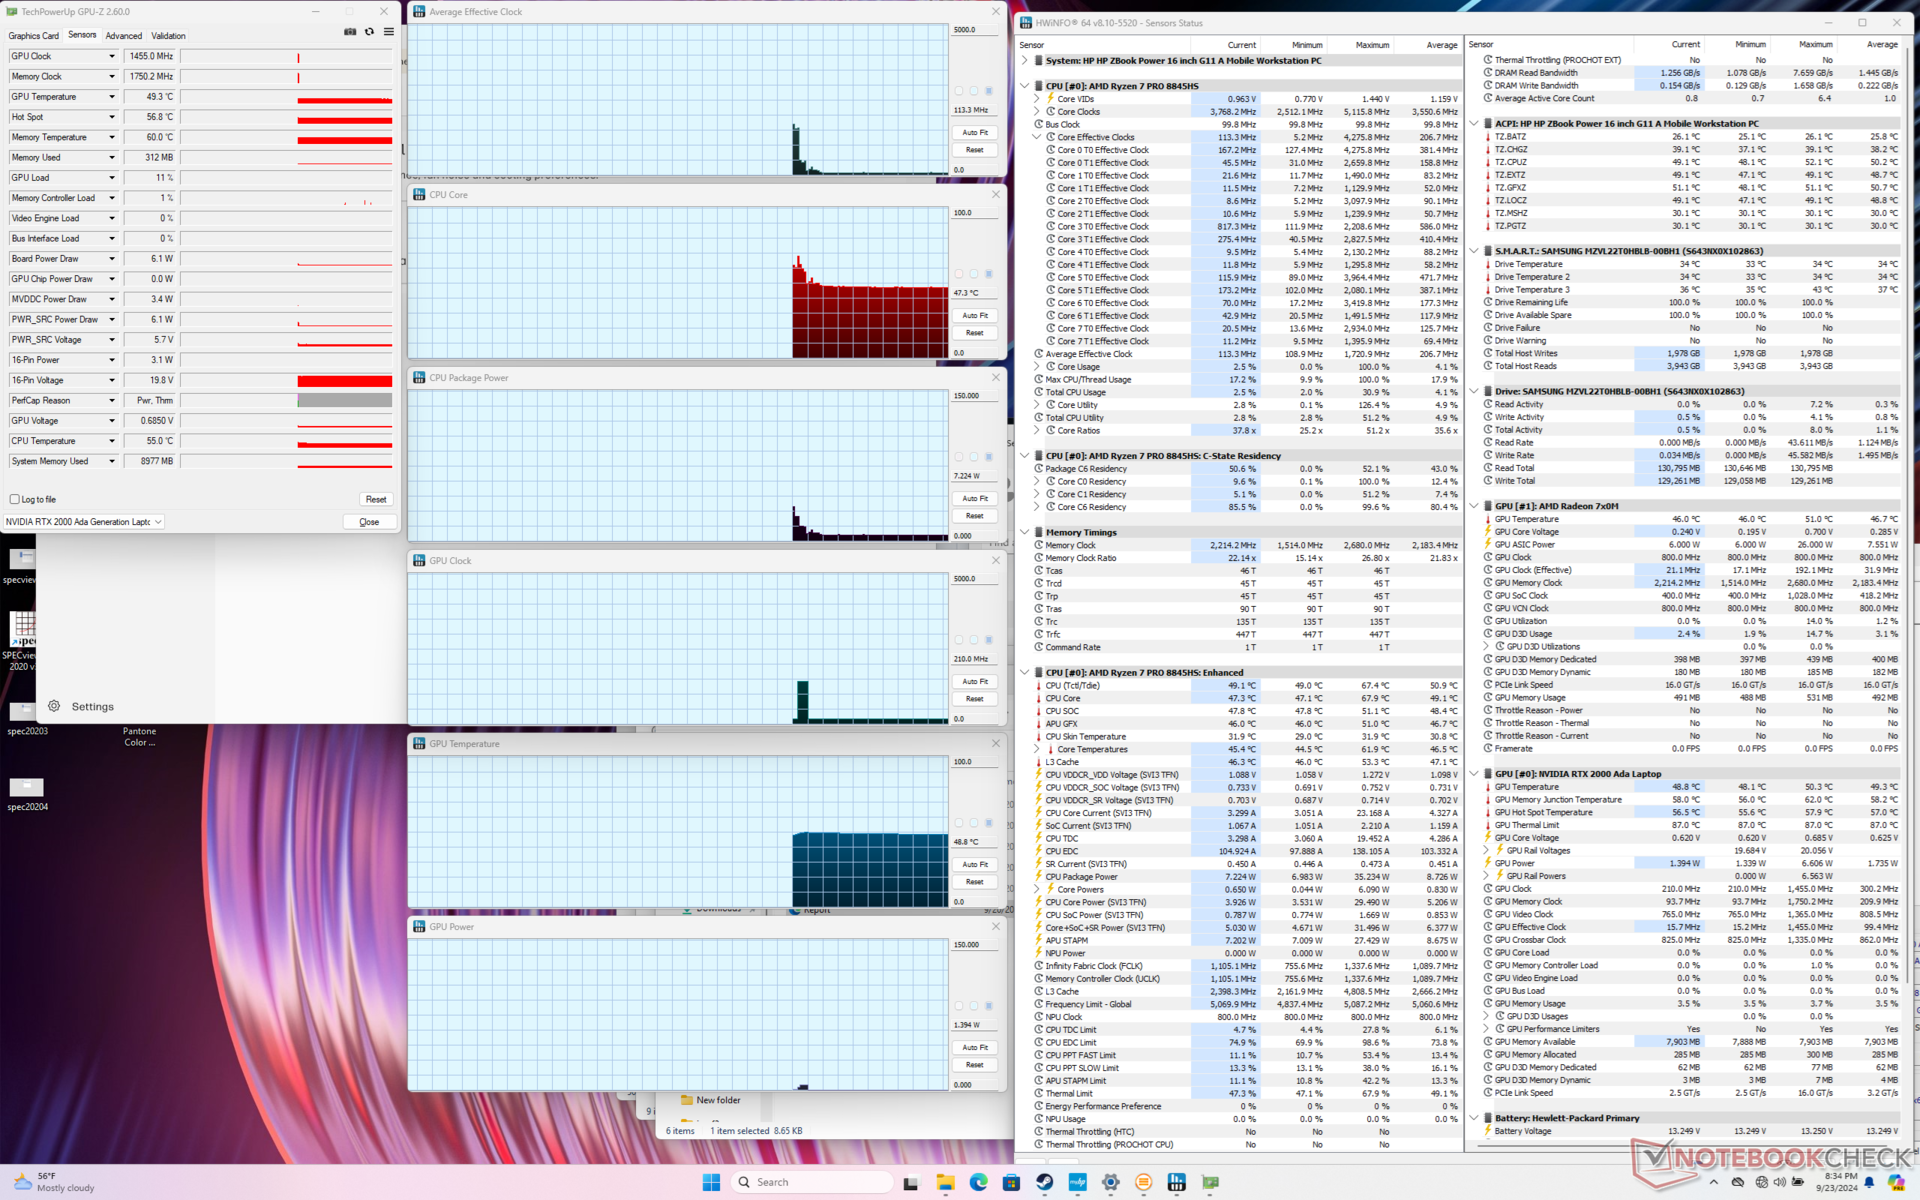
当启动 Prime95 压力时,CPU 会提升至 4.3 GHz、65 W 和 90 C,然后迅速下降并稳定在 3.8 GHz 和 50 W,以防止核心温度升高。结果与我们在 ZBook Power 15 G10 上观察到的结果相近,只是温度略高几度。
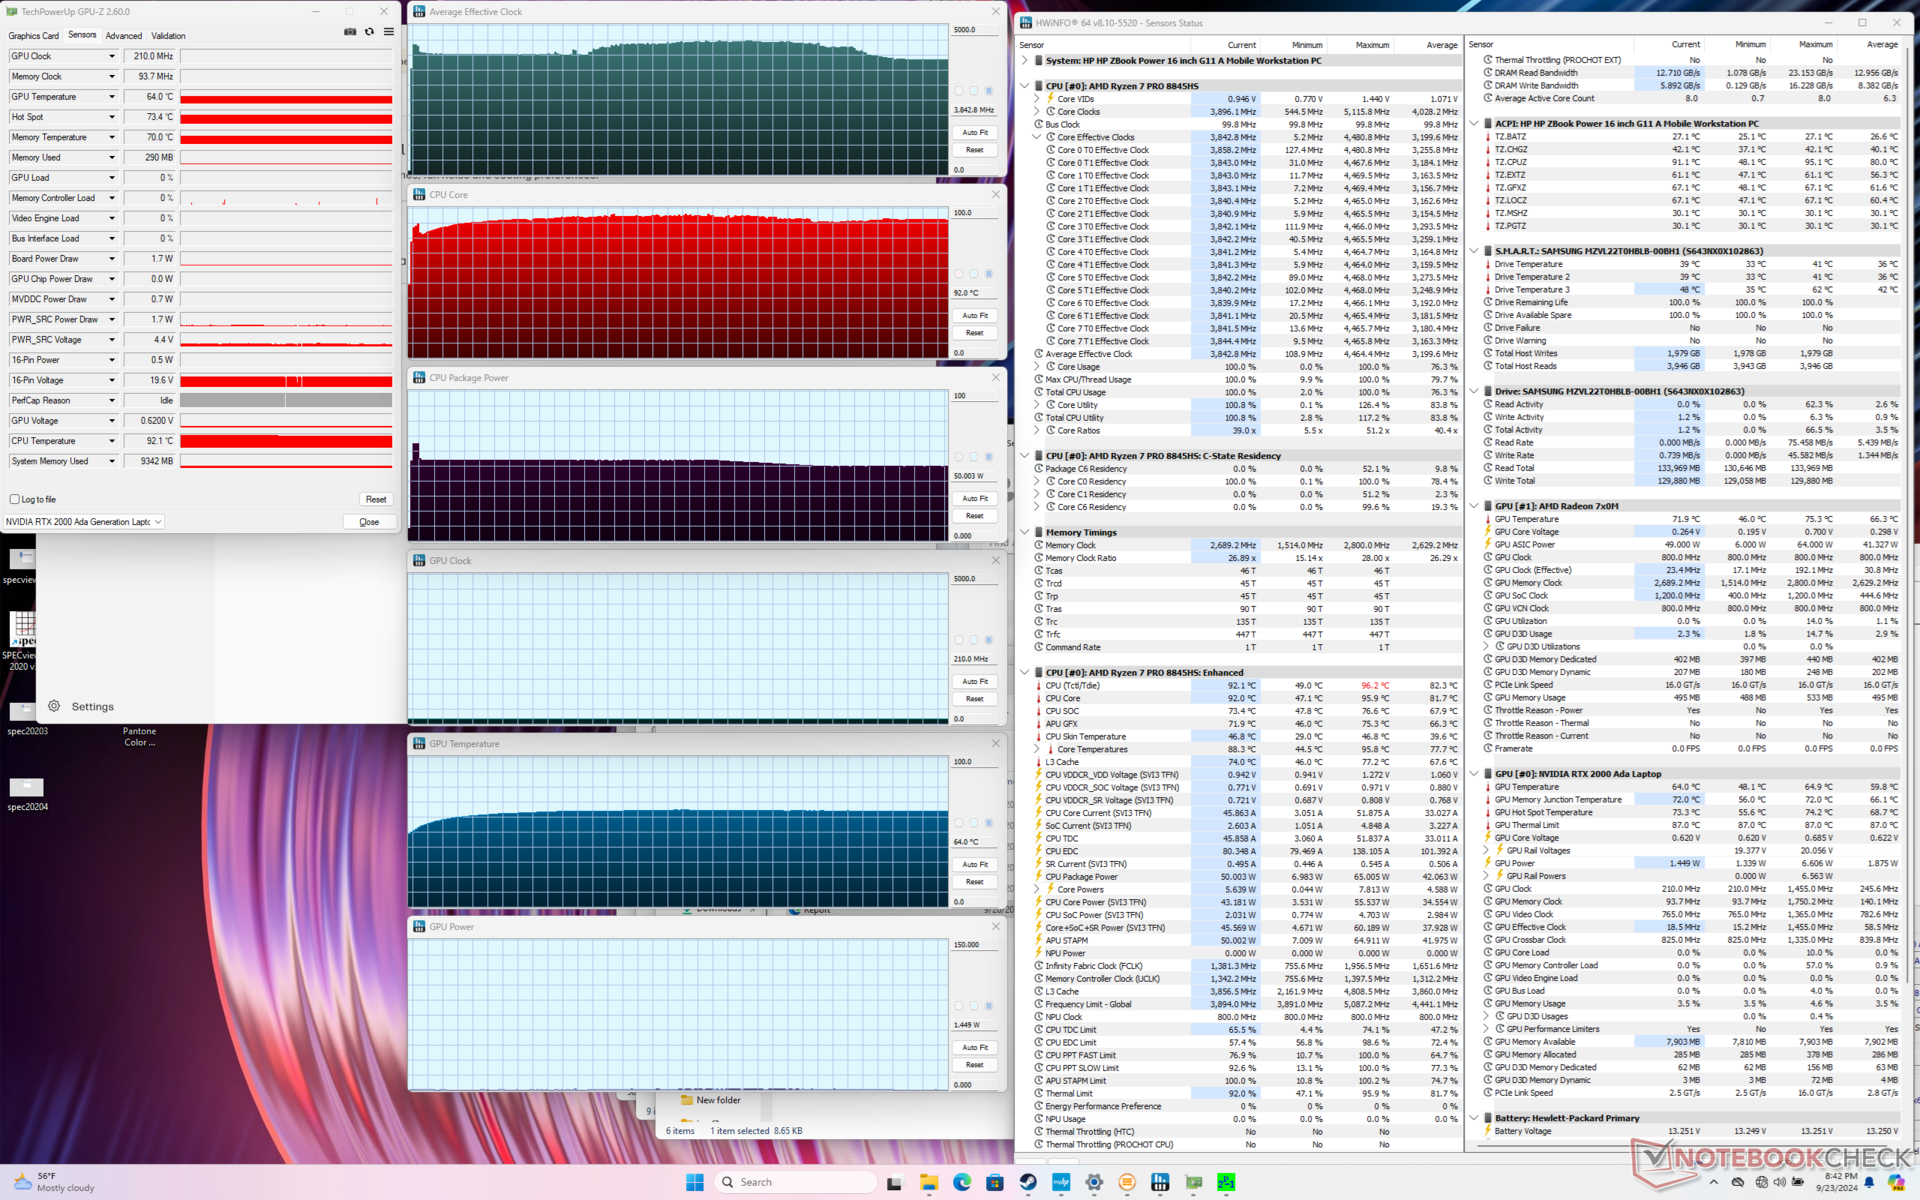
有趣的是,当同时运行 Prime95 和 FurMark 时,CPU 的节流更严重,仅为 2.8 GHz,而不是去年型号上的 3.8 GHz。这一变化可能是为了改善核心温度;CPU 现在能稳定在 66 摄氏度,而不是 ZBook Power 15 G10 上的 99 摄氏度。
如下图所示,在平衡模式而非性能模式下运行《赛博朋克 2077》,核心温度会稍低,平均时钟频率也会稍慢。GPU 板功耗也从 35 W 降至 30 W,而宣传的最大功耗为 50 W。
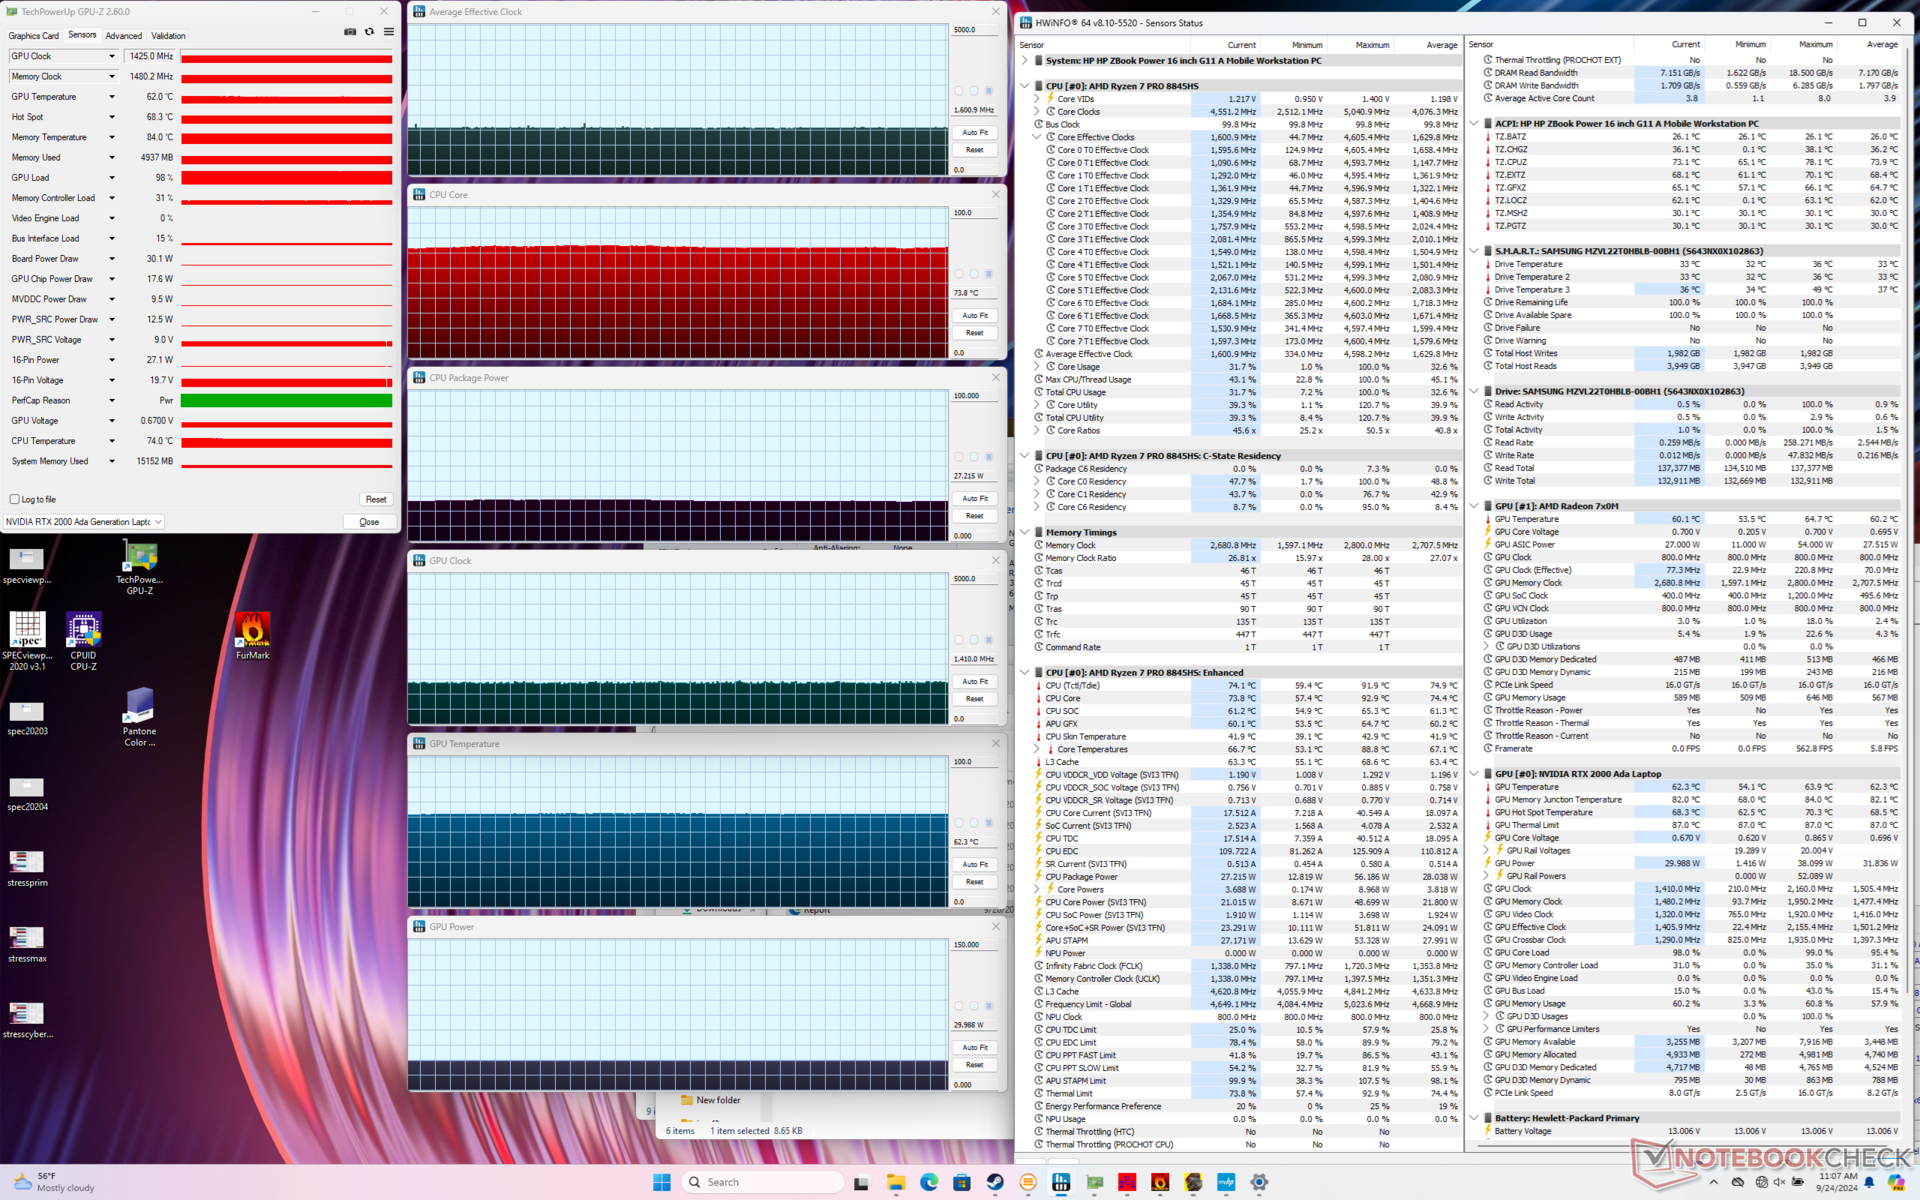
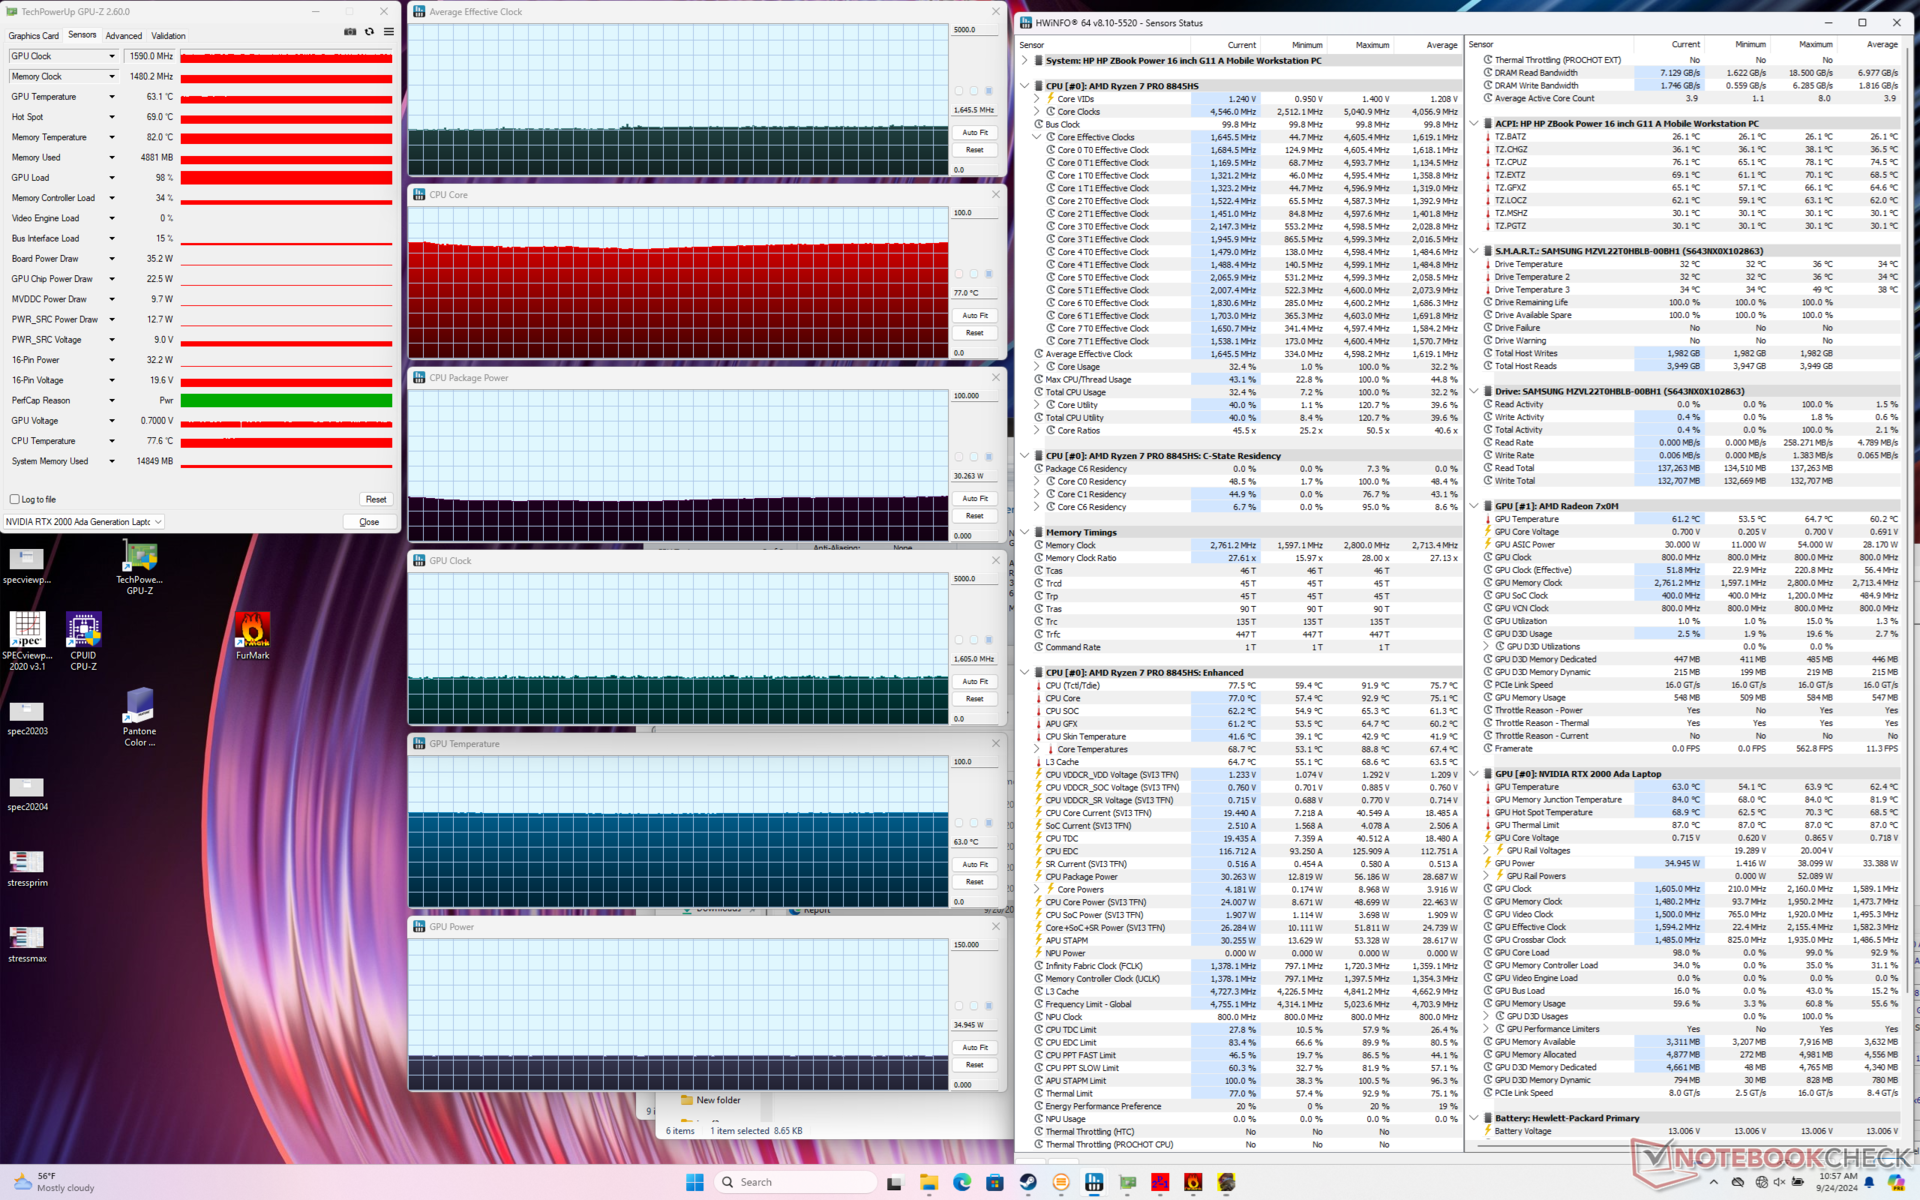
| 平均 CPU 时钟 (GHz) | GPU 时钟 (MHz) | 平均 CPU 温度 (°C) | 平均 GPU 温度 (°C) | |
| 系统闲置 | -- | -- | 47 | 49 |
| Prime95 压力 | 3.9 | -- | 92 | 64 |
| Prime95 + FurMark Stress | 2.8 | 1320 | 66 | 65 |
| 赛博朋克 2077》压力(平衡模式) | 1.6 | 1425 | 74 | 62 |
| 赛博朋克 2077》压力(性能模式) | 1.7 | 1590 | 77 | 63 |
系统性能
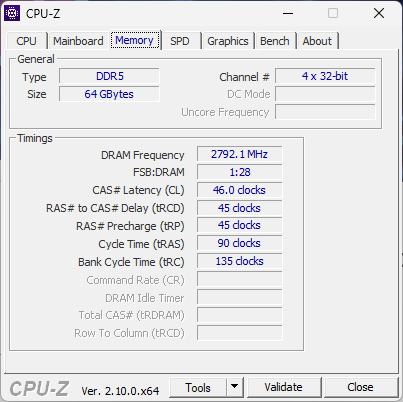
PCMark 结果与我们去年在 ZBook Power 15 G10 上记录的结果几乎完全相同。这意味着在我们的新机型上,浏览或编辑等传统的日常负载并没有明显加快。内存性能也没有改善。
我们遇到了一个从睡眠中唤醒的问题,需要硬关机才能返回 Windows。我们无法可靠地复制这个问题,但在移动工作站上出现这个问题还是值得注意的。

CrossMark: Overall | Productivity | Creativity | Responsiveness
WebXPRT 3: Overall
WebXPRT 4: Overall
Mozilla Kraken 1.1: Total
| PCMark 10 / Score | |
| Dell Precision 5690 | |
| HP ZBook Fury 16 G11 | |
| HP ZBook Power 15 G10 | |
| HP ZBook Power 16 G11 A | |
| Average AMD Ryzen 7 8845HS, NVIDIA RTX 2000 Ada Generation Laptop GPU (n=1) | |
| Lenovo ThinkPad P1 Gen 7 21KV001SGE | |
| Lenovo ThinkPad P16s G2 21K9000CGE | |
| PCMark 10 / Essentials | |
| Dell Precision 5690 | |
| HP ZBook Power 15 G10 | |
| HP ZBook Power 16 G11 A | |
| Average AMD Ryzen 7 8845HS, NVIDIA RTX 2000 Ada Generation Laptop GPU (n=1) | |
| Lenovo ThinkPad P1 Gen 7 21KV001SGE | |
| Lenovo ThinkPad P16s G2 21K9000CGE | |
| HP ZBook Fury 16 G11 | |
| PCMark 10 / Productivity | |
| Dell Precision 5690 | |
| HP ZBook Power 15 G10 | |
| HP ZBook Power 16 G11 A | |
| Average AMD Ryzen 7 8845HS, NVIDIA RTX 2000 Ada Generation Laptop GPU (n=1) | |
| HP ZBook Fury 16 G11 | |
| Lenovo ThinkPad P1 Gen 7 21KV001SGE | |
| Lenovo ThinkPad P16s G2 21K9000CGE | |
| PCMark 10 / Digital Content Creation | |
| HP ZBook Fury 16 G11 | |
| Dell Precision 5690 | |
| Lenovo ThinkPad P1 Gen 7 21KV001SGE | |
| HP ZBook Power 15 G10 | |
| HP ZBook Power 16 G11 A | |
| Average AMD Ryzen 7 8845HS, NVIDIA RTX 2000 Ada Generation Laptop GPU (n=1) | |
| Lenovo ThinkPad P16s G2 21K9000CGE | |
| CrossMark / Overall | |
| HP ZBook Fury 16 G11 | |
| Dell Precision 5690 | |
| HP ZBook Power 16 G11 A | |
| Average AMD Ryzen 7 8845HS, NVIDIA RTX 2000 Ada Generation Laptop GPU (n=1) | |
| Lenovo ThinkPad P1 Gen 7 21KV001SGE | |
| HP ZBook Power 15 G10 | |
| Lenovo ThinkPad P16s G2 21K9000CGE | |
| CrossMark / Productivity | |
| HP ZBook Fury 16 G11 | |
| Dell Precision 5690 | |
| HP ZBook Power 16 G11 A | |
| Average AMD Ryzen 7 8845HS, NVIDIA RTX 2000 Ada Generation Laptop GPU (n=1) | |
| Lenovo ThinkPad P1 Gen 7 21KV001SGE | |
| HP ZBook Power 15 G10 | |
| Lenovo ThinkPad P16s G2 21K9000CGE | |
| CrossMark / Creativity | |
| HP ZBook Fury 16 G11 | |
| HP ZBook Power 16 G11 A | |
| Average AMD Ryzen 7 8845HS, NVIDIA RTX 2000 Ada Generation Laptop GPU (n=1) | |
| Dell Precision 5690 | |
| Lenovo ThinkPad P1 Gen 7 21KV001SGE | |
| HP ZBook Power 15 G10 | |
| Lenovo ThinkPad P16s G2 21K9000CGE | |
| CrossMark / Responsiveness | |
| HP ZBook Fury 16 G11 | |
| Dell Precision 5690 | |
| HP ZBook Power 16 G11 A | |
| Average AMD Ryzen 7 8845HS, NVIDIA RTX 2000 Ada Generation Laptop GPU (n=1) | |
| Lenovo ThinkPad P1 Gen 7 21KV001SGE | |
| Lenovo ThinkPad P16s G2 21K9000CGE | |
| HP ZBook Power 15 G10 | |
| WebXPRT 3 / Overall | |
| HP ZBook Fury 16 G11 | |
| HP ZBook Power 15 G10 | |
| HP ZBook Power 16 G11 A | |
| Average AMD Ryzen 7 8845HS, NVIDIA RTX 2000 Ada Generation Laptop GPU (n=1) | |
| Dell Precision 5690 | |
| Lenovo ThinkPad P1 Gen 7 21KV001SGE | |
| Lenovo ThinkPad P16s G2 21K9000CGE | |
| WebXPRT 4 / Overall | |
| HP ZBook Fury 16 G11 | |
| Dell Precision 5690 | |
| Lenovo ThinkPad P1 Gen 7 21KV001SGE | |
| HP ZBook Power 16 G11 A | |
| Average AMD Ryzen 7 8845HS, NVIDIA RTX 2000 Ada Generation Laptop GPU (n=1) | |
| HP ZBook Power 15 G10 | |
| Mozilla Kraken 1.1 / Total | |
| Lenovo ThinkPad P16s G2 21K9000CGE | |
| HP ZBook Power 15 G10 | |
| HP ZBook Power 16 G11 A | |
| Average AMD Ryzen 7 8845HS, NVIDIA RTX 2000 Ada Generation Laptop GPU (n=1) | |
| Lenovo ThinkPad P1 Gen 7 21KV001SGE | |
| Dell Precision 5690 | |
| HP ZBook Fury 16 G11 | |
* ... smaller is better
| PCMark 10 Score | 7376 points | |
Help | ||
| AIDA64 / Memory Copy | |
| Dell Precision 5690 | |
| HP ZBook Power 15 G10 | |
| Average AMD Ryzen 7 8845HS (61459 - 71873, n=12) | |
| Lenovo ThinkPad P16s G2 21K9000CGE | |
| Lenovo ThinkPad P1 Gen 7 21KV001SGE | |
| HP ZBook Power 16 G11 A | |
| HP ZBook Fury 16 G11 | |
| AIDA64 / Memory Read | |
| Dell Precision 5690 | |
| Lenovo ThinkPad P1 Gen 7 21KV001SGE | |
| HP ZBook Power 15 G10 | |
| HP ZBook Power 16 G11 A | |
| HP ZBook Fury 16 G11 | |
| Average AMD Ryzen 7 8845HS (49866 - 61976, n=12) | |
| Lenovo ThinkPad P16s G2 21K9000CGE | |
| AIDA64 / Memory Write | |
| Lenovo ThinkPad P16s G2 21K9000CGE | |
| Average AMD Ryzen 7 8845HS (68425 - 93239, n=12) | |
| HP ZBook Power 15 G10 | |
| HP ZBook Power 16 G11 A | |
| Dell Precision 5690 | |
| Lenovo ThinkPad P1 Gen 7 21KV001SGE | |
| HP ZBook Fury 16 G11 | |
| AIDA64 / Memory Latency | |
| Dell Precision 5690 | |
| Lenovo ThinkPad P1 Gen 7 21KV001SGE | |
| Lenovo ThinkPad P16s G2 21K9000CGE | |
| HP ZBook Power 15 G10 | |
| HP ZBook Power 16 G11 A | |
| Average AMD Ryzen 7 8845HS (82.5 - 117, n=12) | |
| HP ZBook Fury 16 G11 | |
* ... smaller is better
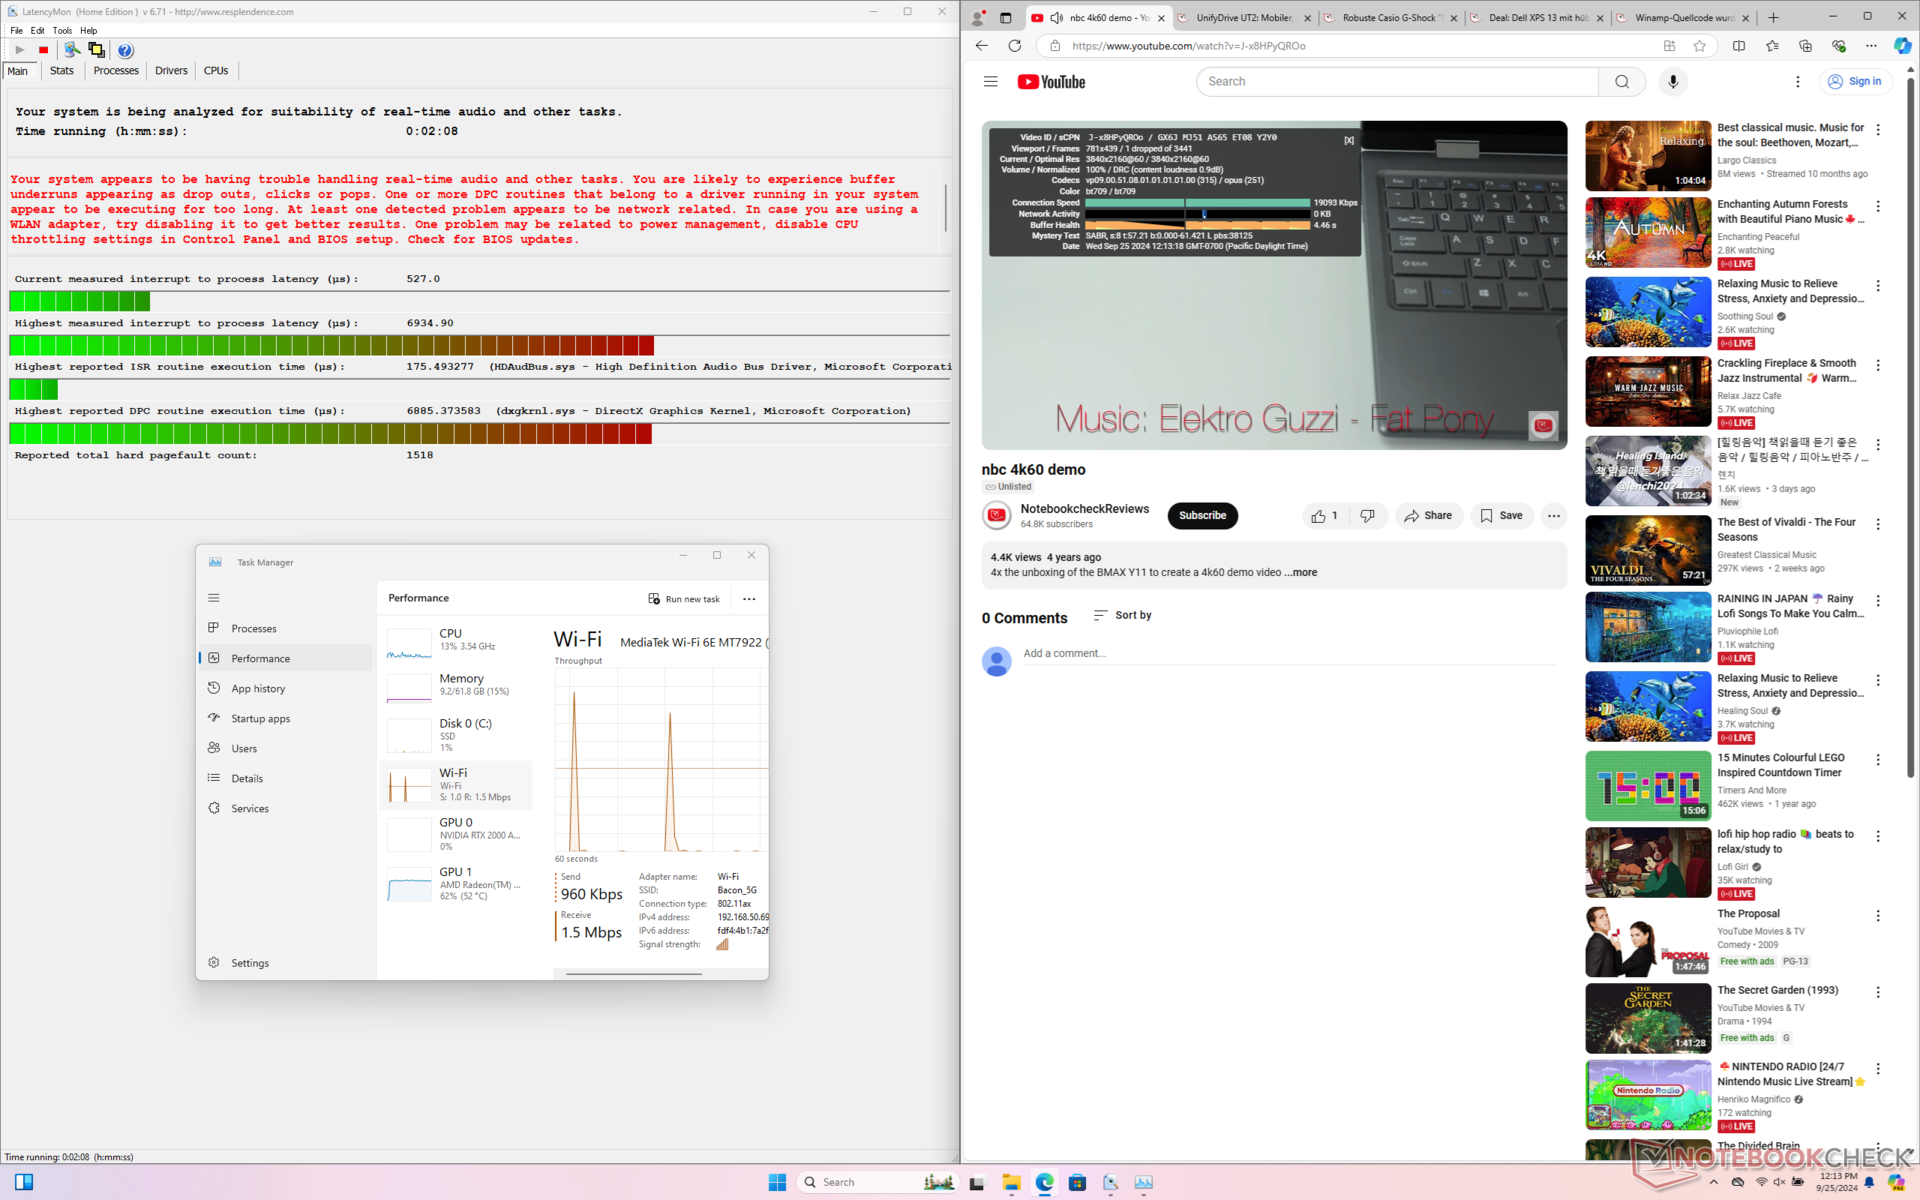
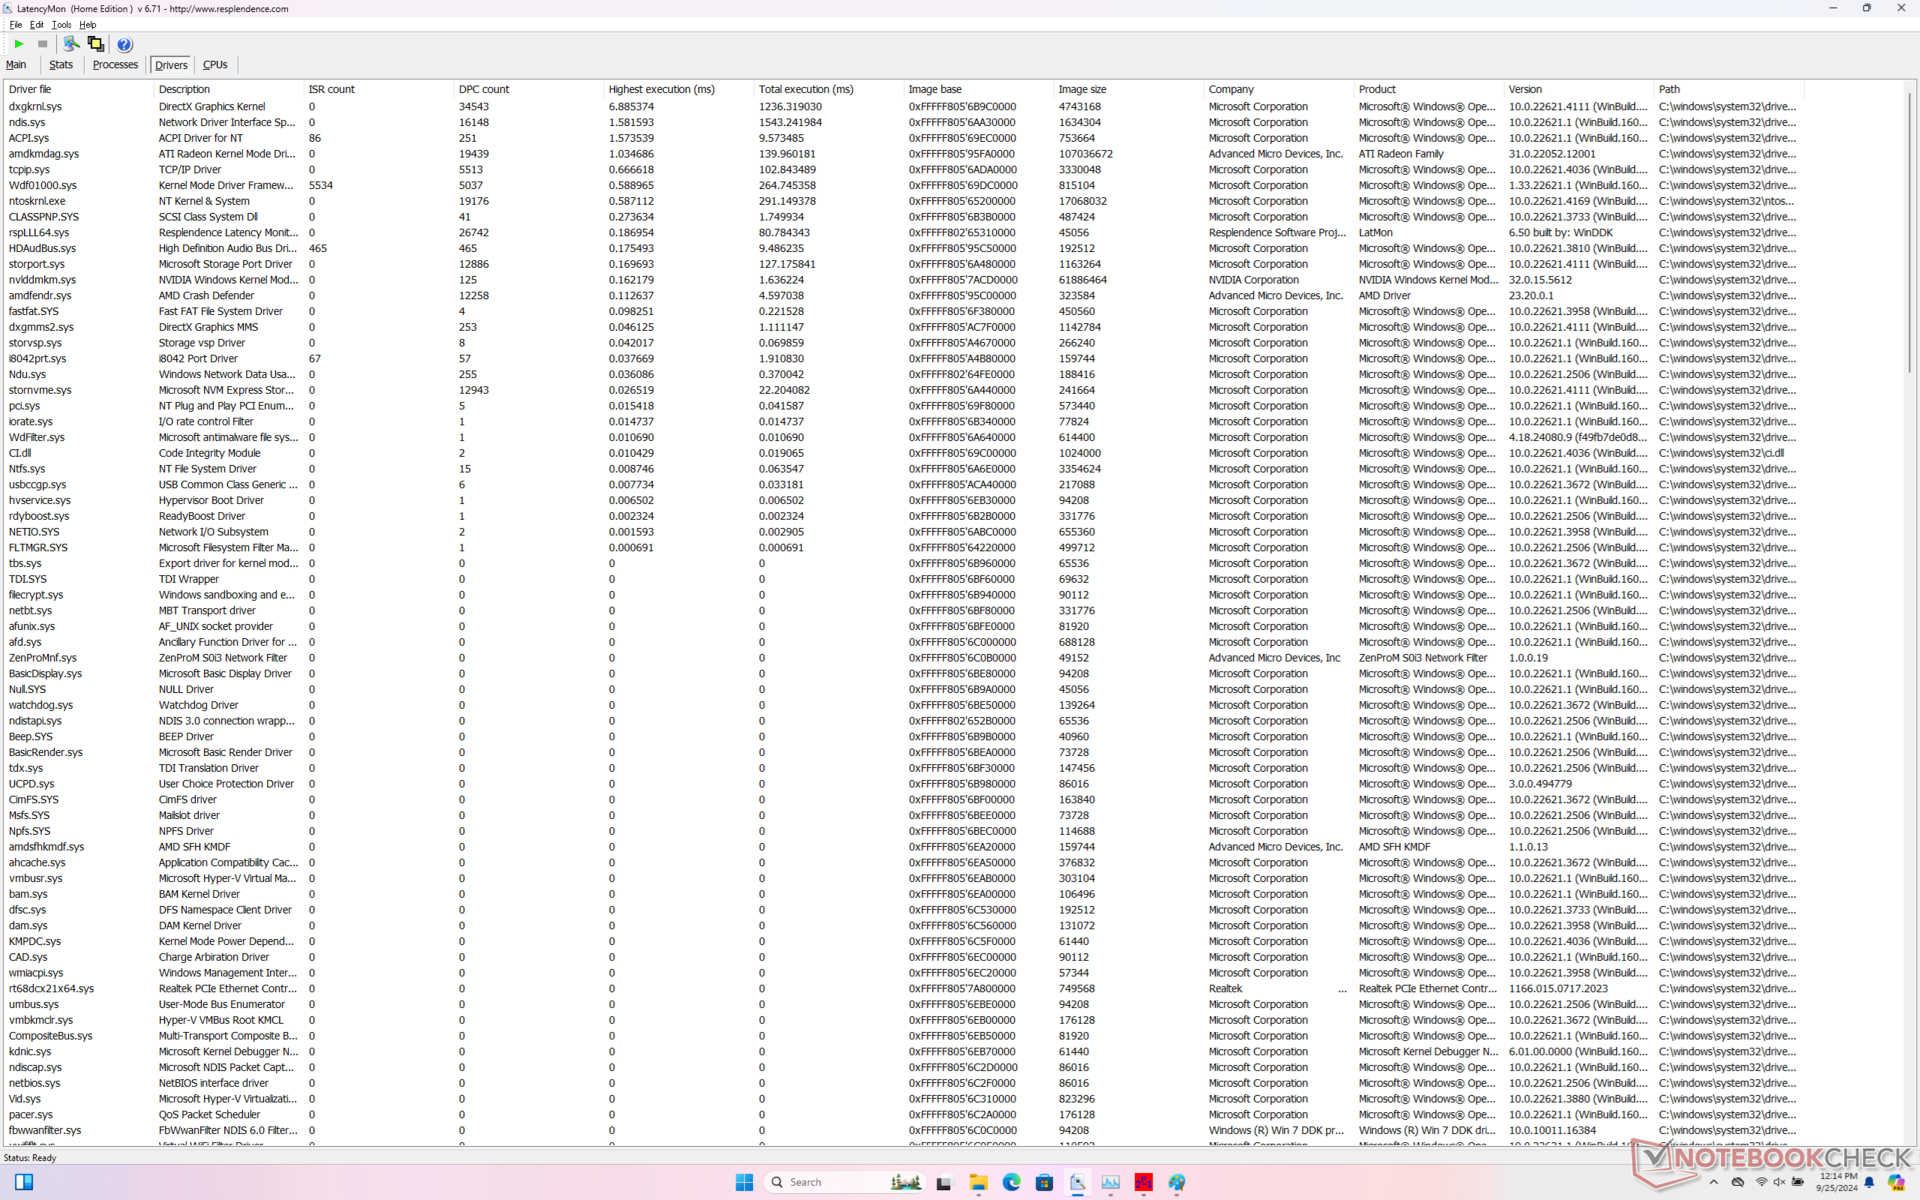
DPC 延迟
LatencyMon 显示了与 HDAudBus.sys 有关的 DPC 问题,即使经过多次重新测试也是如此。60 FPS 的 4K 视频回放也非常出色,在 60 秒的窗口中仅记录到一个丢帧。
| DPC Latencies / LatencyMon - interrupt to process latency (max), Web, Youtube, Prime95 | |
| HP ZBook Fury 16 G11 | |
| HP ZBook Power 16 G11 A | |
| HP ZBook Power 15 G10 | |
| Lenovo ThinkPad P1 Gen 7 21KV001SGE | |
| Lenovo ThinkPad P16s G2 21K9000CGE | |
| Dell Precision 5690 | |
* ... smaller is better
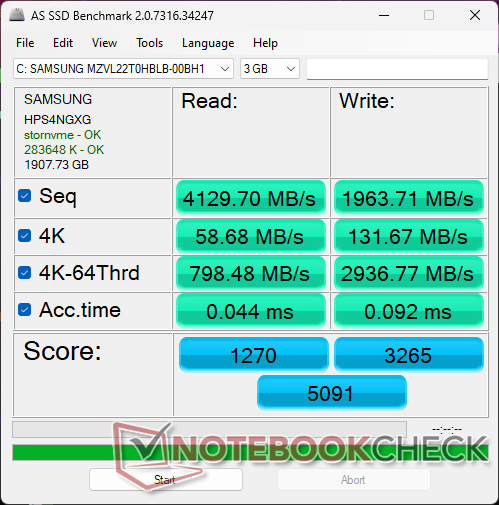
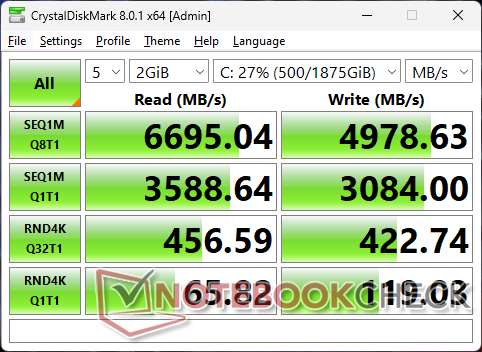
存储设备
我们的测试设备配备了 2 TB 三星 PM9A1PCIe4 x4 NVMe SSD,连续读取速率高达 6700 MB/s。遗憾的是,如下图所示的 DiskSpd 循环测试结果表明,在几分钟的压力下,硬盘的读取速度很快就降到了 2000 MB/s 的低水平。我们重复测试,结果也没有改善。这令人失望,因为旧款 ZBook Power 15 G10 中的 WD 硬盘不会出现任何节流问题。散热器很可能会提高性能。

| Drive Performance Rating - Percent | |
| HP ZBook Fury 16 G11 | |
| Dell Precision 5690 | |
| Lenovo ThinkPad P16s G2 21K9000CGE | |
| HP ZBook Power 15 G10 | |
| HP ZBook Power 16 G11 A | |
| Lenovo ThinkPad P1 Gen 7 21KV001SGE | |
* ... smaller is better
Disk Throttling: DiskSpd Read Loop, Queue Depth 8
图形处理器性能
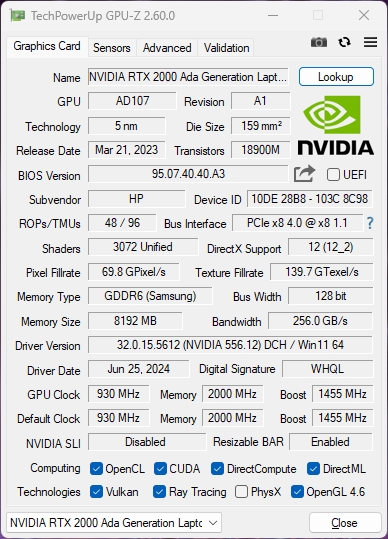
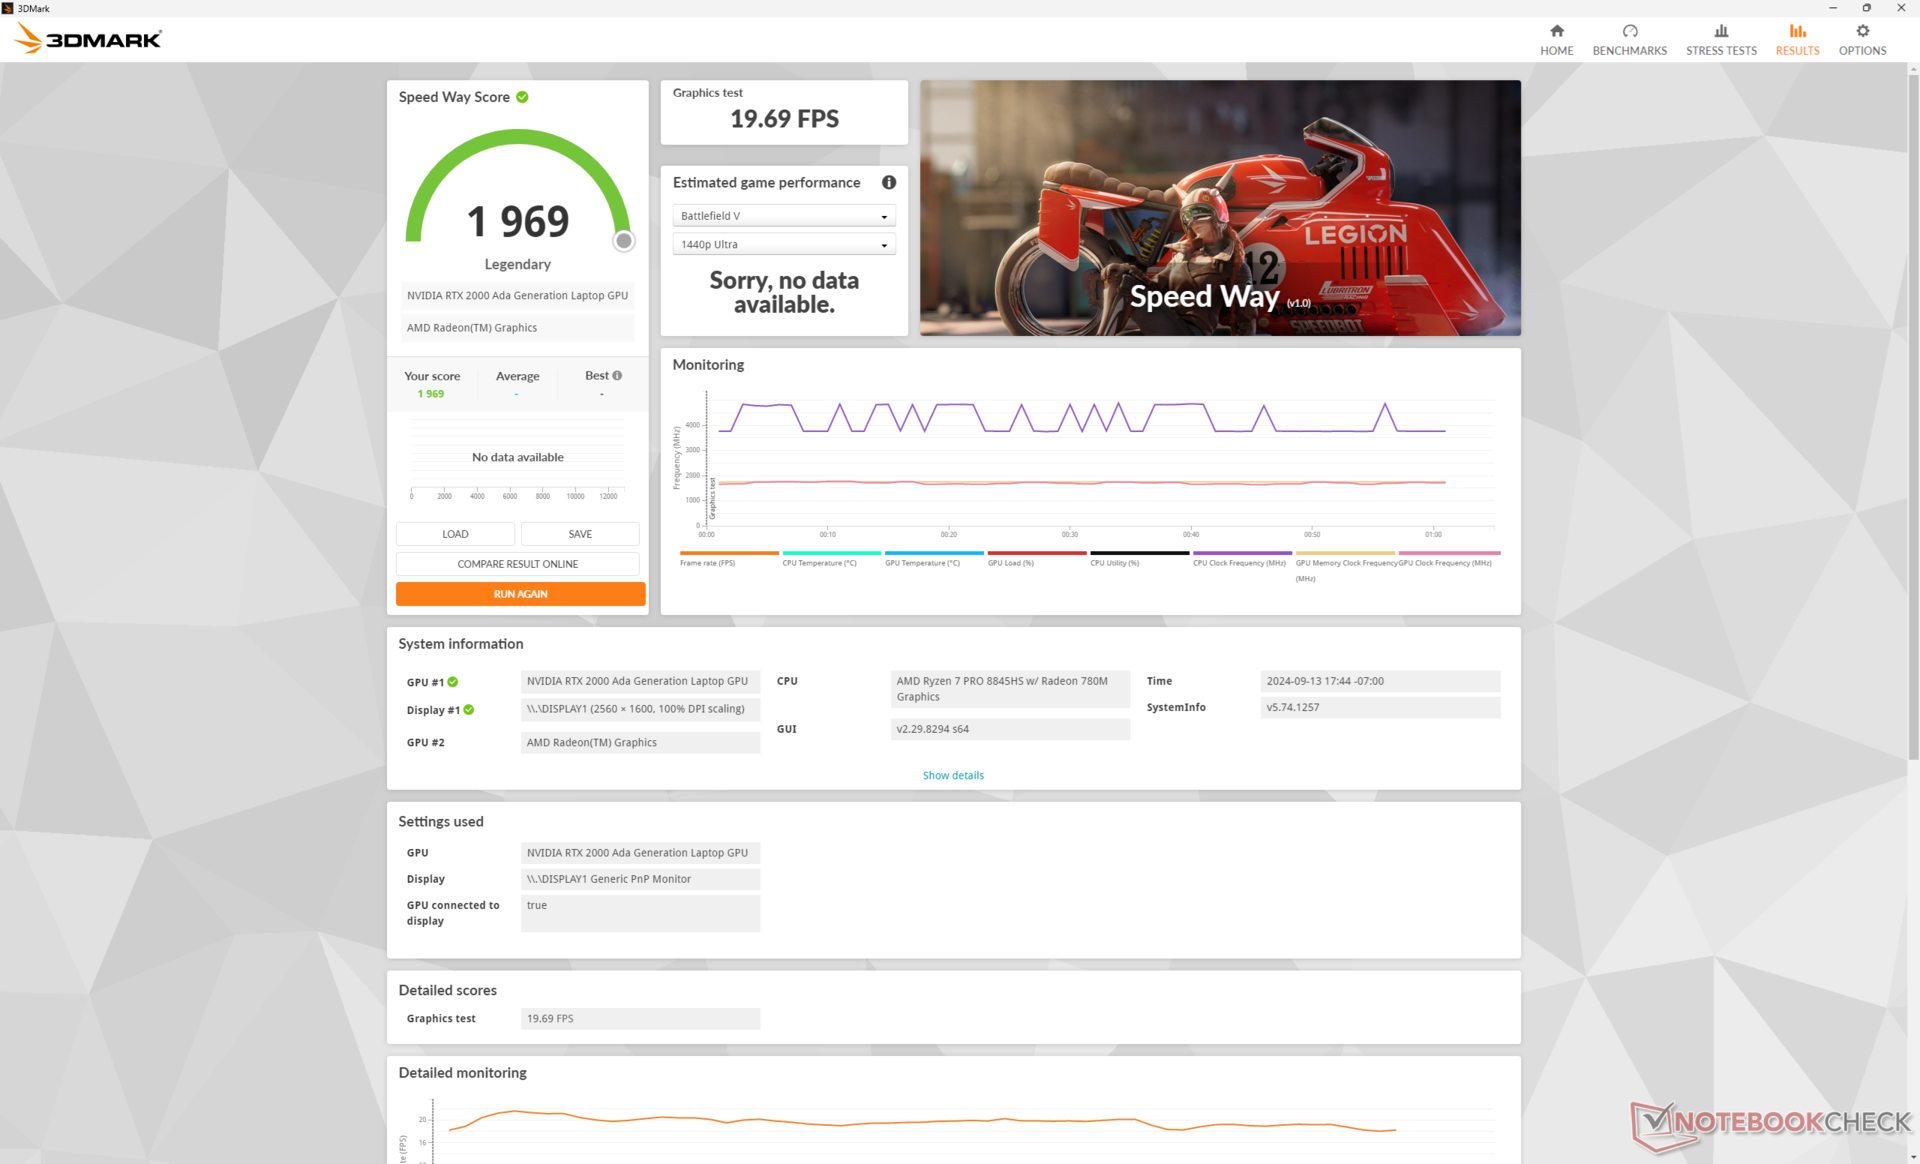
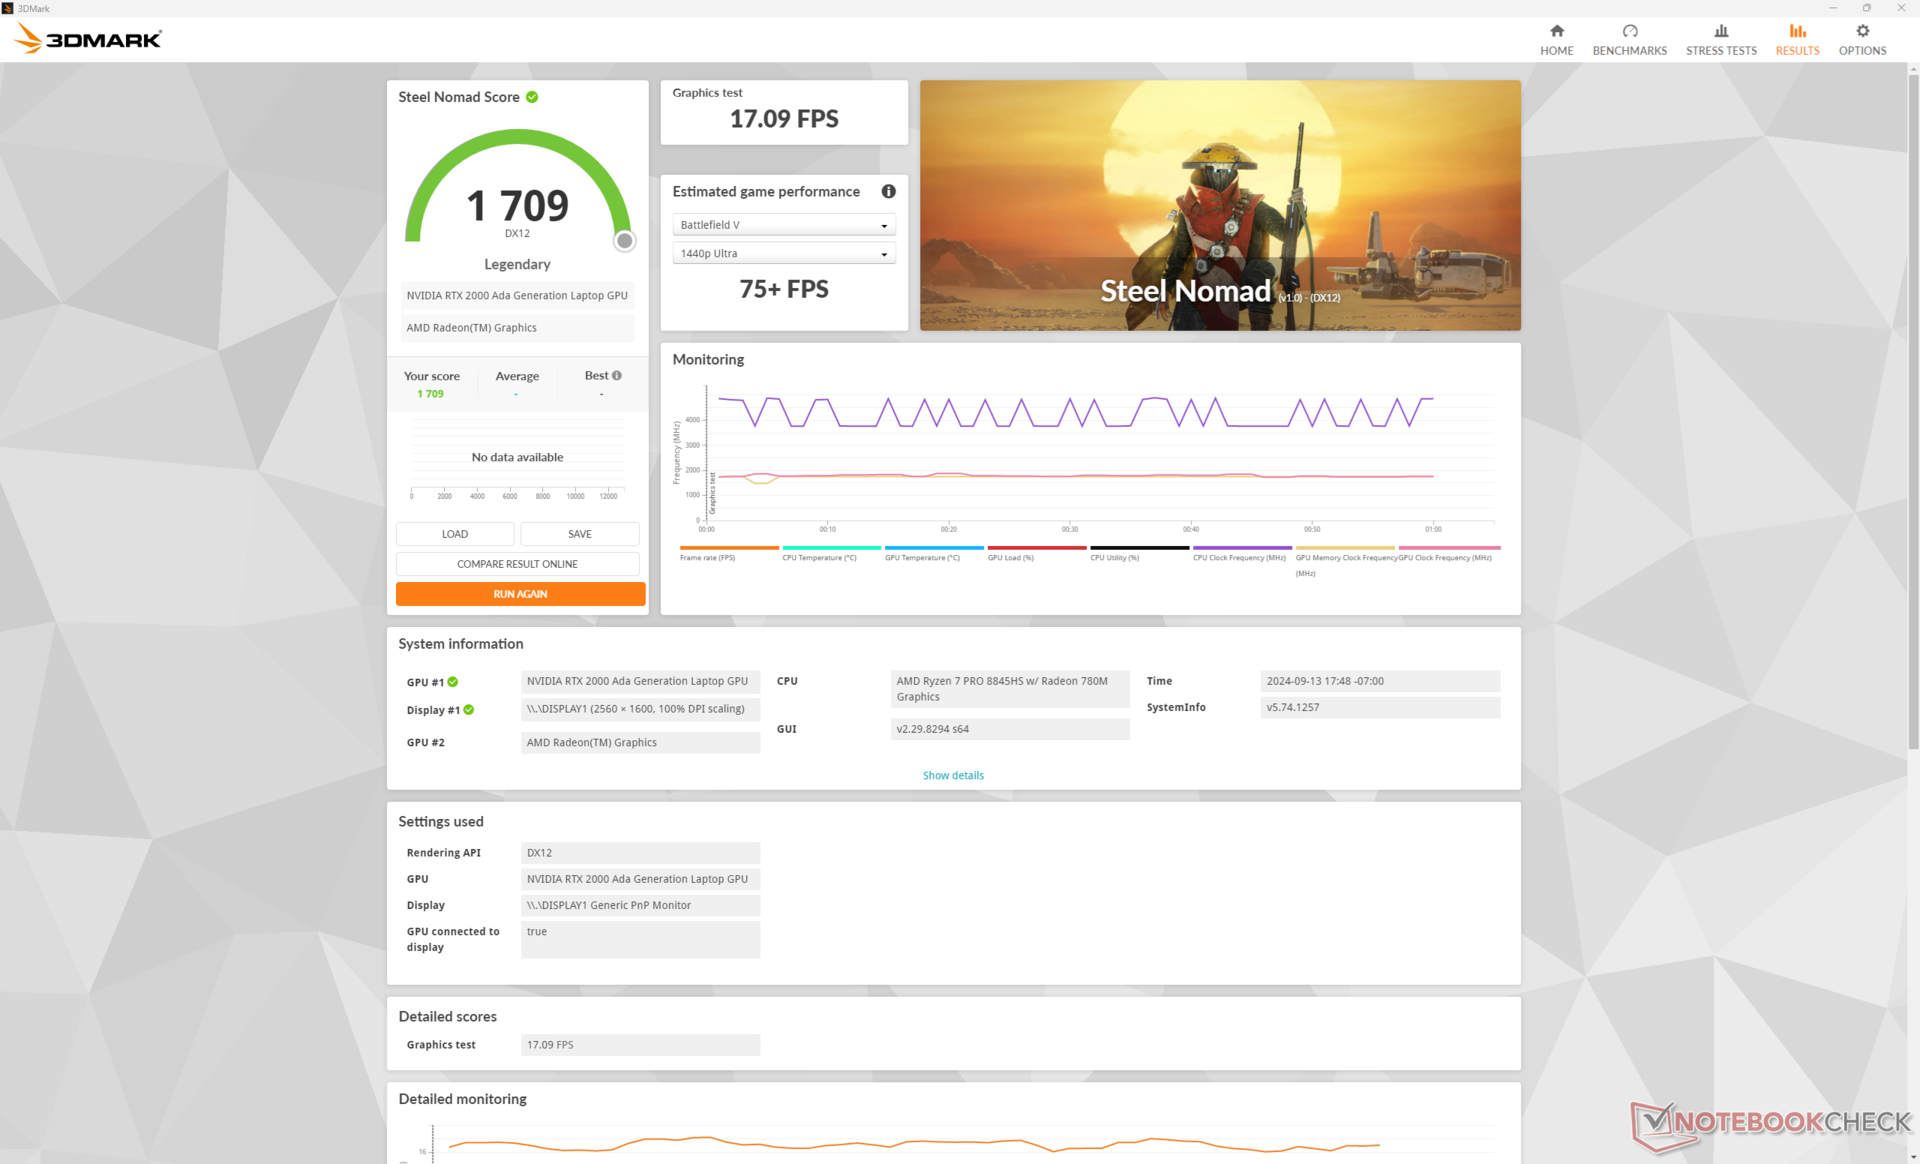
由于 Nvidia 尚未推出移动 Ada Lovelace 系列的后继产品,因此独立 GPU 选项仍与 15 英寸 ZBook Power 15 G10 相同。此外,在改用 16 英寸外形尺寸的过程中,散热解决方案也没有大幅改进,这意味着 ZBook Power 16 G11 仍然只能使用相同的 50 W TGP 上限和 RTX 1000 Ada, RTX 2000 Ada和 RTX 3000 Ada图形选项。用户需要考虑使用更厚的 ZBook Fury 16 系列来获得更高端的 RTX Ada 选项。
根据我们的使用经验,升级到 RTX 3000 Ada 最多只能带来微不足道的性能提升。 戴尔Precision 5490.
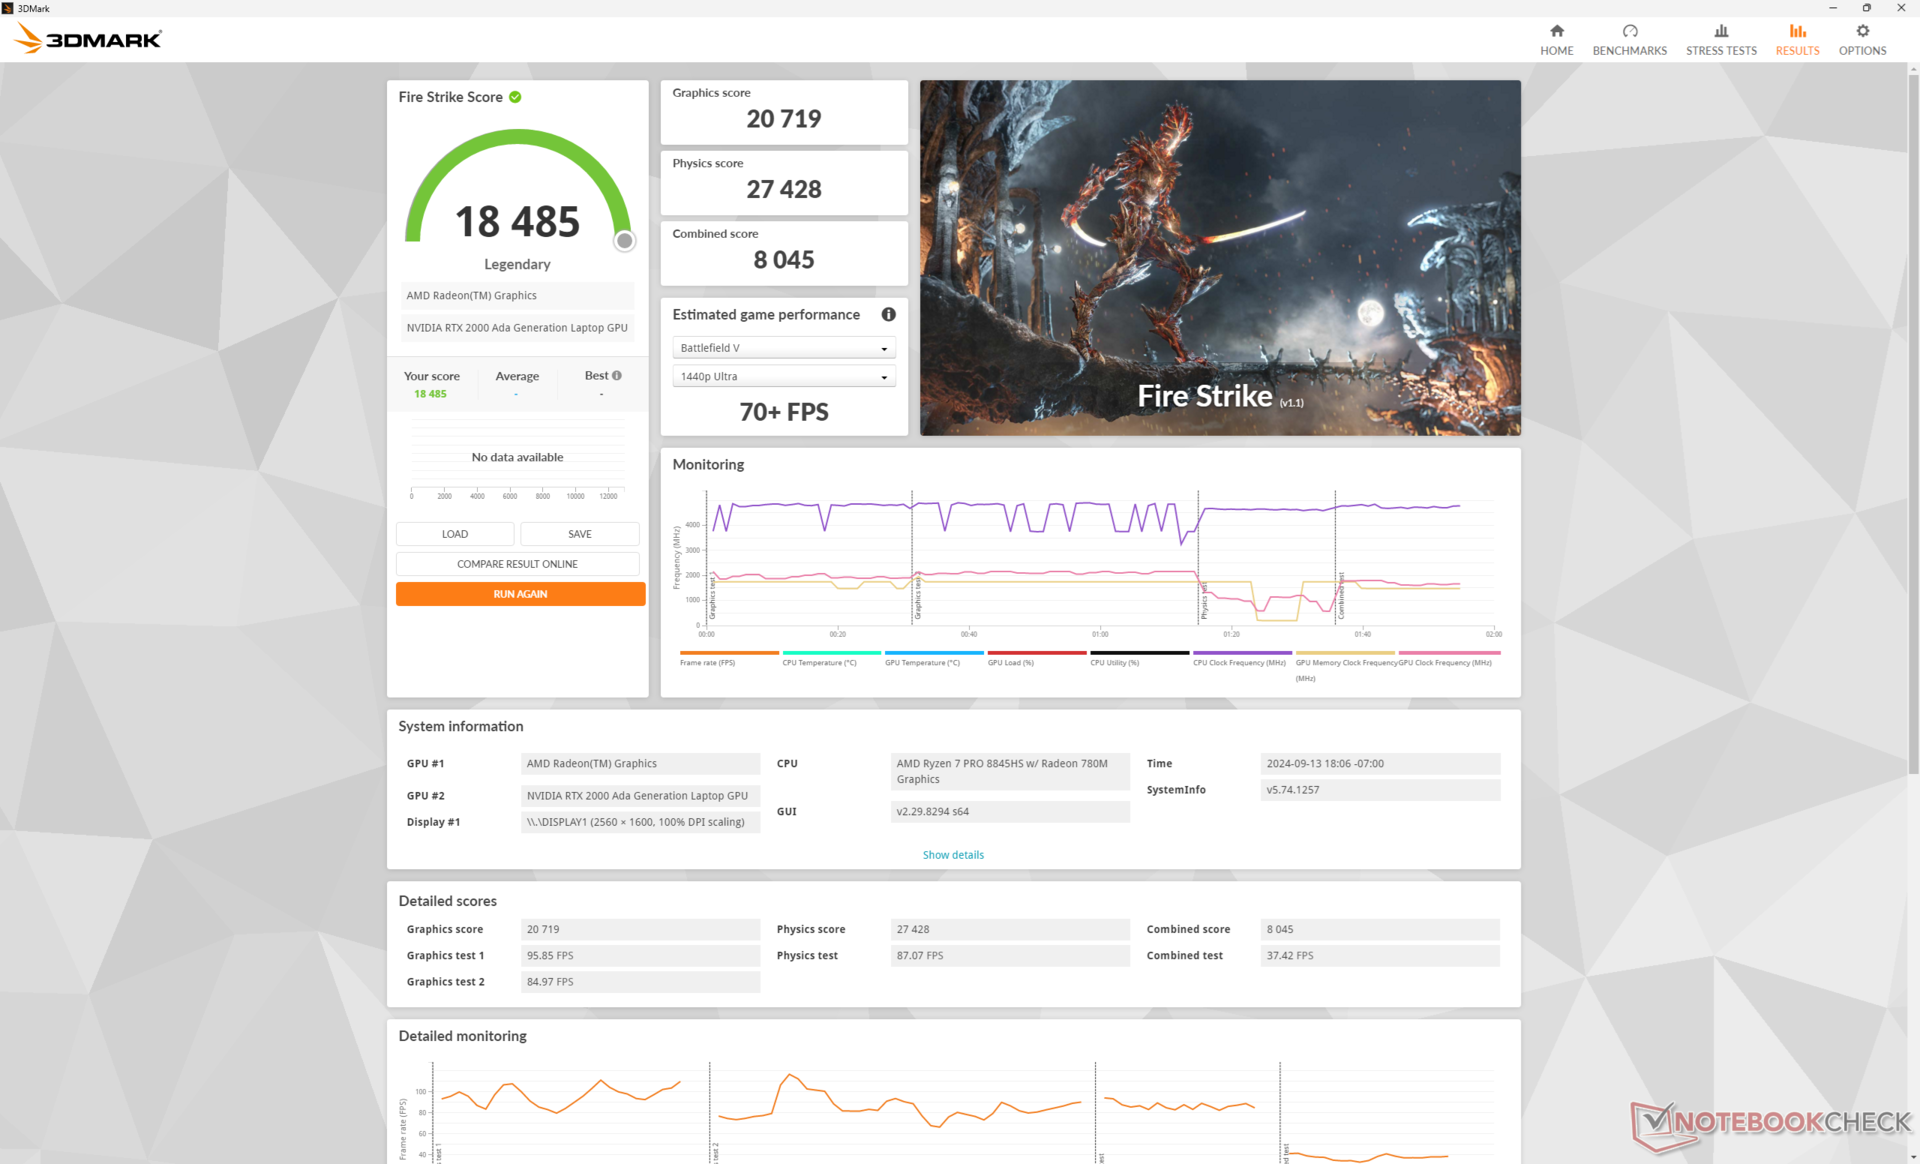
| 电源配置文件 | 图形分数 | 物理得分 | 综合得分 |
| 性能模式 | 20719 | 27428 | 8045 |
| 均衡模式 | 19961 (-4%) | 26363 (-4%) | 7633 (-5%) |
| 电池电量 | 8108 (-61%) | 6149 (-78%) | 1727 (-79%) |
如Fire Strike 上表所示,在平衡模式而非性能模式下运行会对性能产生轻微影响。不过,如果在电池模式下运行,CPU 和 GPU 性能都会大幅降低。
| 3DMark Performance Rating - Percent | |
| Dell Precision 5690 -3! | |
| HP ZBook Fury 16 G11 | |
| HP ZBook Fury 16 G9 -3! | |
| HP ZBook Power 16 G11 A | |
| Average NVIDIA RTX 2000 Ada Generation Laptop GPU | |
| Dell Precision 5000 5490 -3! | |
| MSI CreatorPro Z16P B12UKST -19! | |
| HP ZBook Power 15 G10 -11! | |
| Asus ExpertBook B6 Flip B6602FC2 -19! | |
| Lenovo ThinkPad P16v G1 AMD -18! | |
| Lenovo ThinkPad P1 G4-20Y4Z9DVUS -19! | |
| Lenovo ThinkPad P16s G2 21K9000CGE -19! | |
| HP ZBook Firefly 16 G9-6B897EA -19! | |
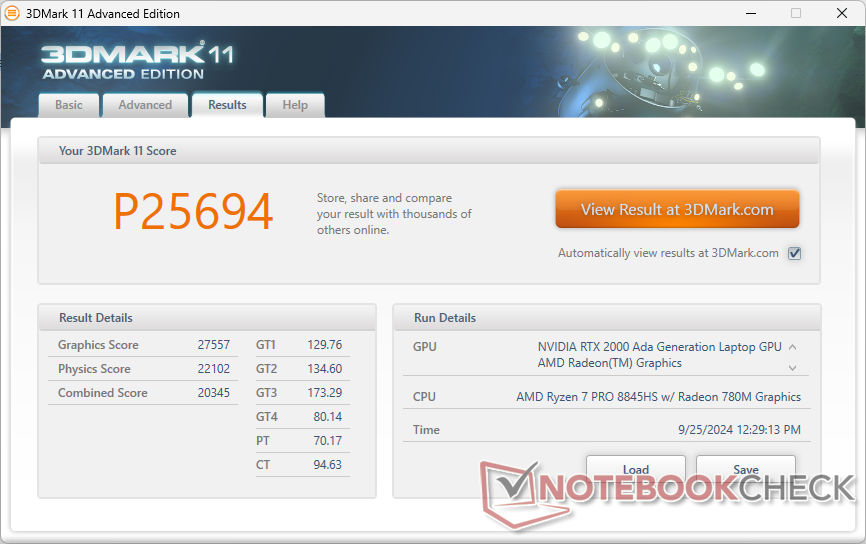
| 3DMark 11 Performance | 25694 points | |
| 3DMark Cloud Gate Standard Score | 51846 points | |
| 3DMark Fire Strike Score | 18485 points | |
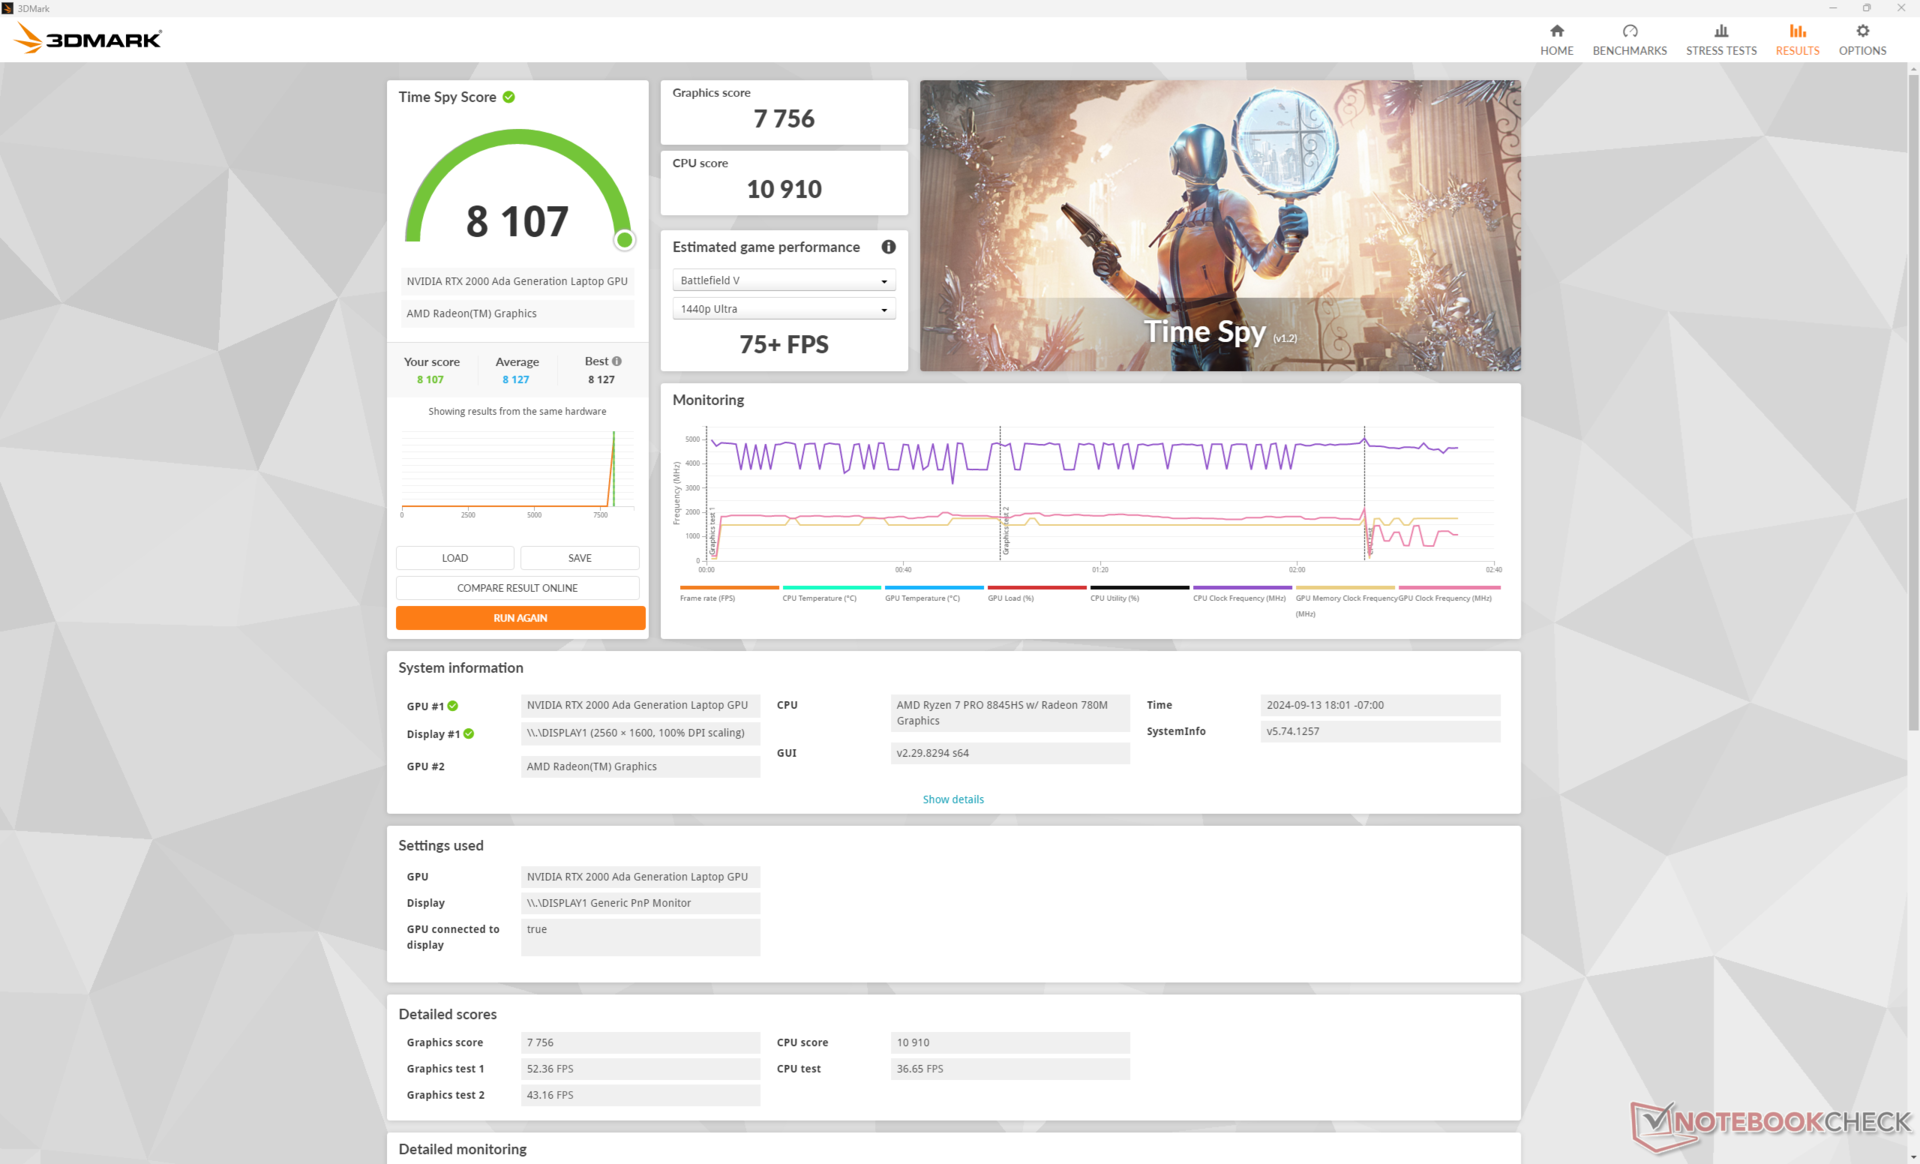
| 3DMark Time Spy Score | 8107 points | |
| 3DMark Steel Nomad Score | 1709 points | |
Help | ||
* ... smaller is better
游戏性能
虽然没有针对游戏进行优化,但 RTX 2000 Ada 与运行于 GeForce RTX 3060或 RTX 4060.
| GTA V - 1920x1080 Highest Settings possible AA:4xMSAA + FX AF:16x | |
| HP ZBook Fury 16 G9 | |
| HP ZBook Fury 16 G11 | |
| MSI CreatorPro Z16P B12UKST | |
| HP ZBook Power 16 G11 A | |
| HP ZBook Power 15 G10 | |
| Asus ExpertBook B6 Flip B6602FC2 | |
| Lenovo ThinkPad P16v G1 AMD | |
| HP ZBook Firefly 16 G9-6B897EA | |
| Lenovo ThinkPad P16s G2 21K9000CGE | |
Cyberpunk 2077 ultra FPS Chart
| low | med. | high | ultra | QHD | |
|---|---|---|---|---|---|
| GTA V (2015) | 180.6 | 162.7 | 90.3 | 63.4 | |
| Dota 2 Reborn (2015) | 145.2 | 142 | 126.1 | 119.9 | |
| Final Fantasy XV Benchmark (2018) | 166.1 | 89.3 | 66.3 | 49.4 | |
| X-Plane 11.11 (2018) | 83.2 | 72.1 | 60.6 | ||
| Far Cry 5 (2018) | 138 | 111 | 104 | 98 | 67 |
| Strange Brigade (2018) | 329 | 187.8 | 158.1 | 138.5 | 99.5 |
| Tiny Tina's Wonderlands (2022) | 139.1 | 115.1 | 80 | 64.4 | 46.3 |
| F1 22 (2022) | 186.6 | 171.1 | 129.1 | 46.2 | 29.8 |
| Baldur's Gate 3 (2023) | 87.1 | 75.7 | 67.6 | 66.1 | 45.6 |
| Cyberpunk 2077 2.2 Phantom Liberty (2023) | 81.1 | 61.4 | 51.7 | 44.8 | 29.7 |
排放量
系统噪音
风扇噪音水平和表现与我们在去年机型上观察到的类似。即使在运行3DMark 06的第一个基准测试场景后,系统仍然保持安静,噪音仅为 25.4 dB(A)。 ThinkPad P16s G2或Precision 5690 相比安静得多。
请注意,在平衡模式下风扇噪音明显更小;在性能模式下运行《赛博朋克 2077》时,噪音可高达 43 dB(A),而在平衡模式下仅为 37.5 dB(A)。
Noise Level
| Idle |
| 23.8 / 24.2 / 24.2 dB(A) |
| Load |
| 25.4 / 45 dB(A) |
 | ||
30 dB silent 40 dB(A) audible 50 dB(A) loud |
||
min: | ||
| HP ZBook Power 16 G11 A NVIDIA RTX 2000 Ada Generation Laptop GPU, R7 8845HS, Samsung PM9A1 MZVL22T0HBLB | HP ZBook Power 15 G10 NVIDIA RTX 2000 Ada Generation Laptop GPU, R7 PRO 7840HS, WDC PC SN810 2TB | HP ZBook Fury 16 G11 NVIDIA RTX 3500 Ada Generation Laptop GPU, i9-14900HX, SK hynix PC801 HFS001TEJ9X101N | Lenovo ThinkPad P1 Gen 7 21KV001SGE NVIDIA GeForce RTX 4060 Laptop GPU, Ultra 7 155H, Kioxia XG8 KXG8AZNV1T02 | Lenovo ThinkPad P16s G2 21K9000CGE Radeon 780M, R7 PRO 7840U, SK hynix PC801 HFS001TEJ9X162N | Dell Precision 5690 NVIDIA RTX 5000 Ada Generation Laptop GPU, Ultra 9 185H, 2x Samsung PM9A1 1TB (RAID 0) | |
|---|---|---|---|---|---|---|
| Noise | -3% | -15% | -18% | -3% | -17% | |
| off / environment * | 23.5 | 24.2 -3% | 23.2 1% | 24.7 -5% | 22.6 4% | 23.4 -0% |
| Idle Minimum * | 23.8 | 24.4 -3% | 23.2 3% | 24.7 -4% | 22.6 5% | 23.6 1% |
| Idle Average * | 24.2 | 24.4 -1% | 23.2 4% | 24.7 -2% | 22.6 7% | 24.9 -3% |
| Idle Maximum * | 24.2 | 24.4 -1% | 29.5 -22% | 24.7 -2% | 22.6 7% | 30.9 -28% |
| Load Average * | 25.4 | 27.4 -8% | 43 -69% | 43.7 -72% | 37.8 -49% | 40.4 -59% |
| Cyberpunk 2077 ultra * | 43 | 48.2 -12% | 53.2 -24% | |||
| Load Maximum * | 45 | 46.8 -4% | 48.2 -7% | 53.3 -18% | 40.5 10% | 51.9 -15% |
| Witcher 3 ultra * | 43.3 | 40.3 | 48.3 |
* ... smaller is better
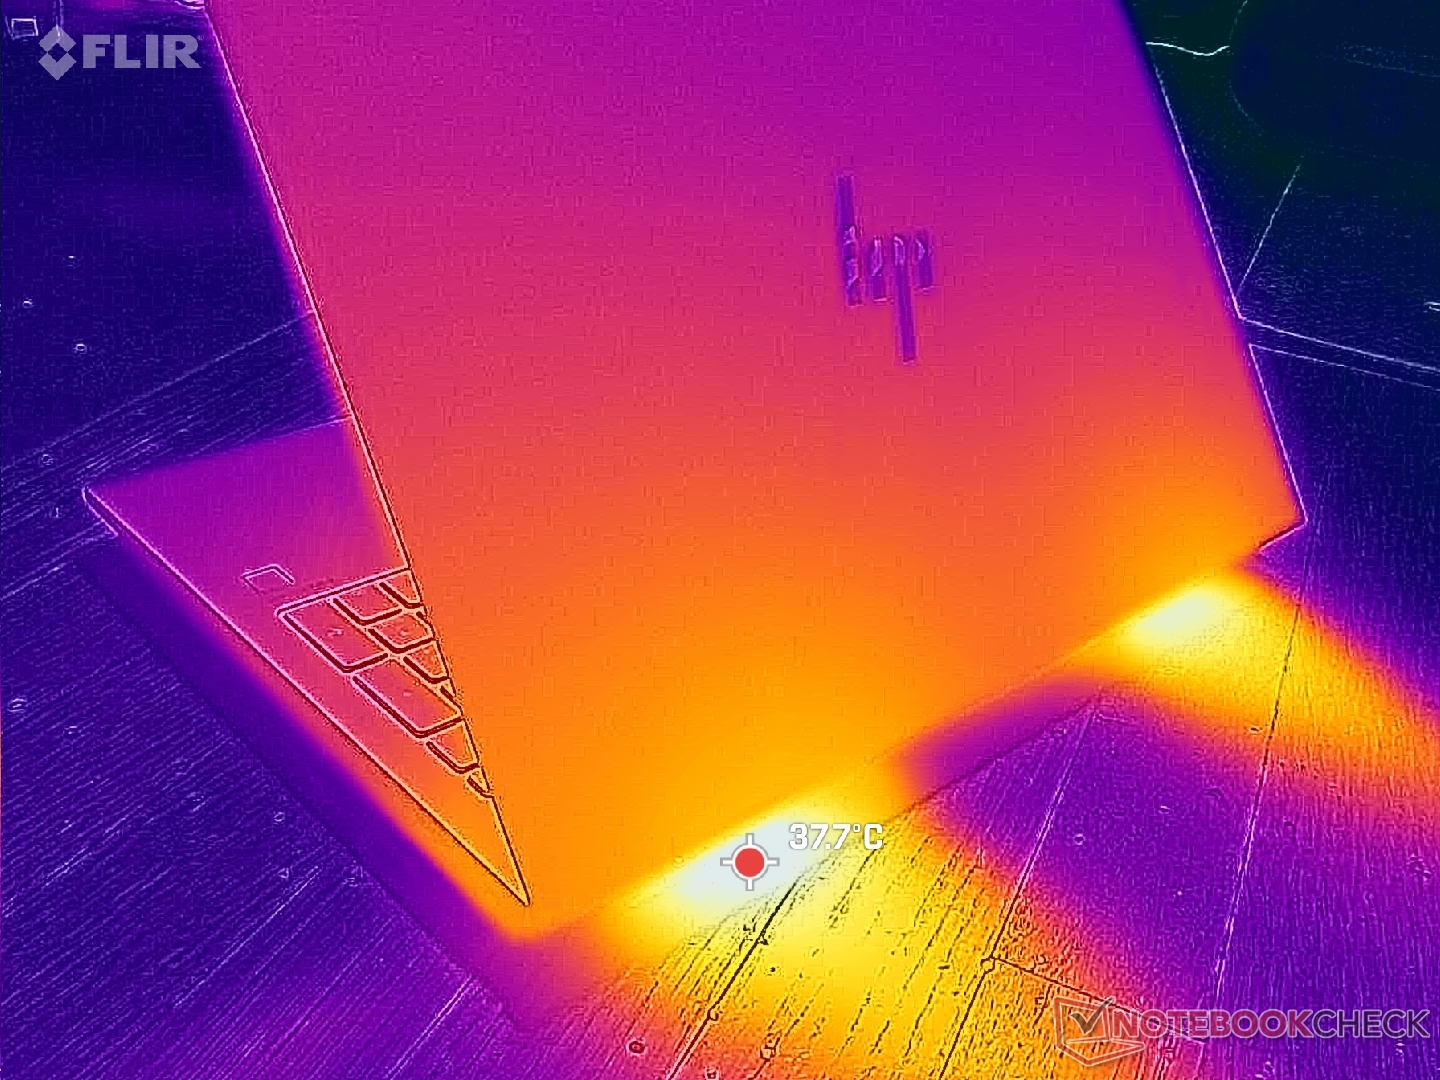
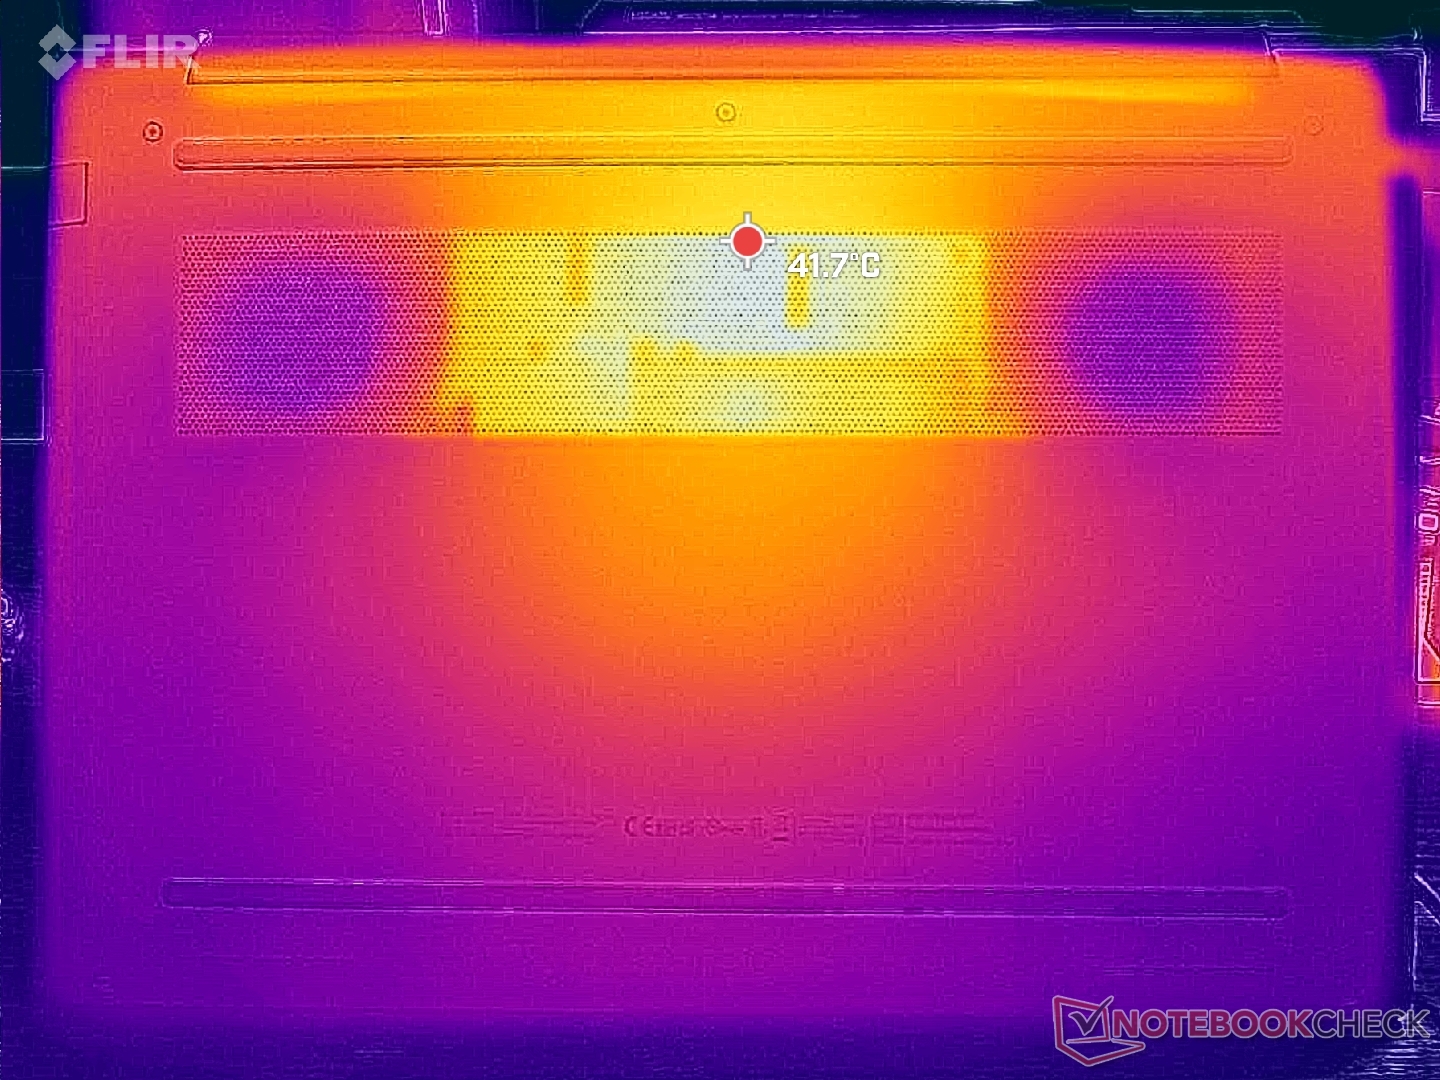
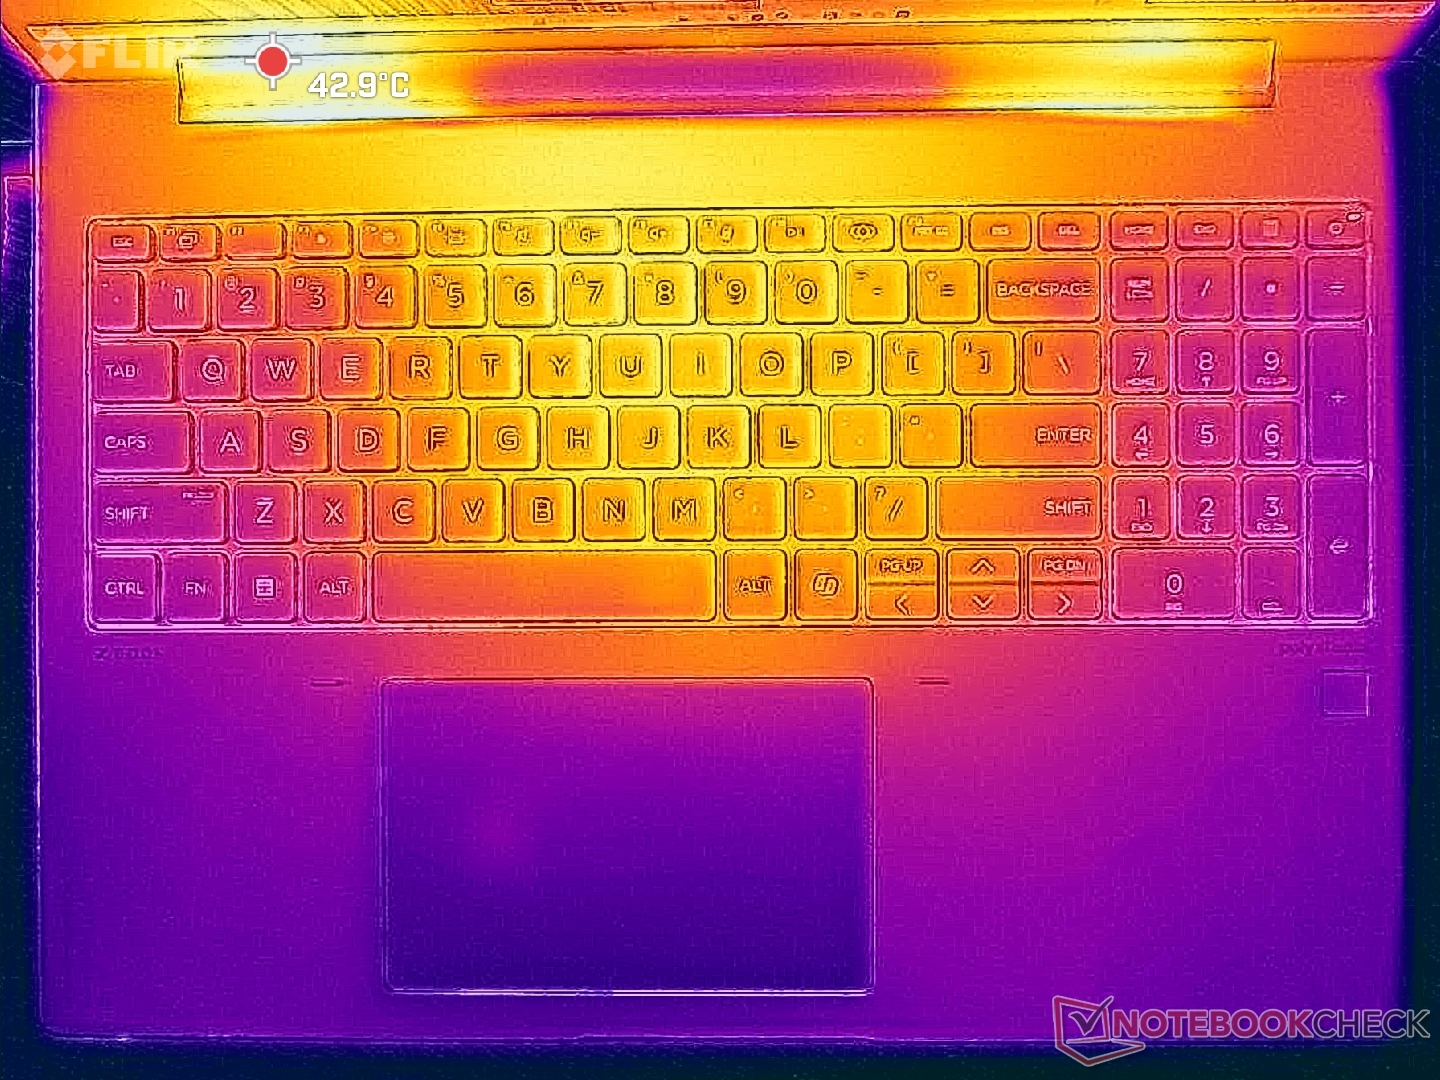
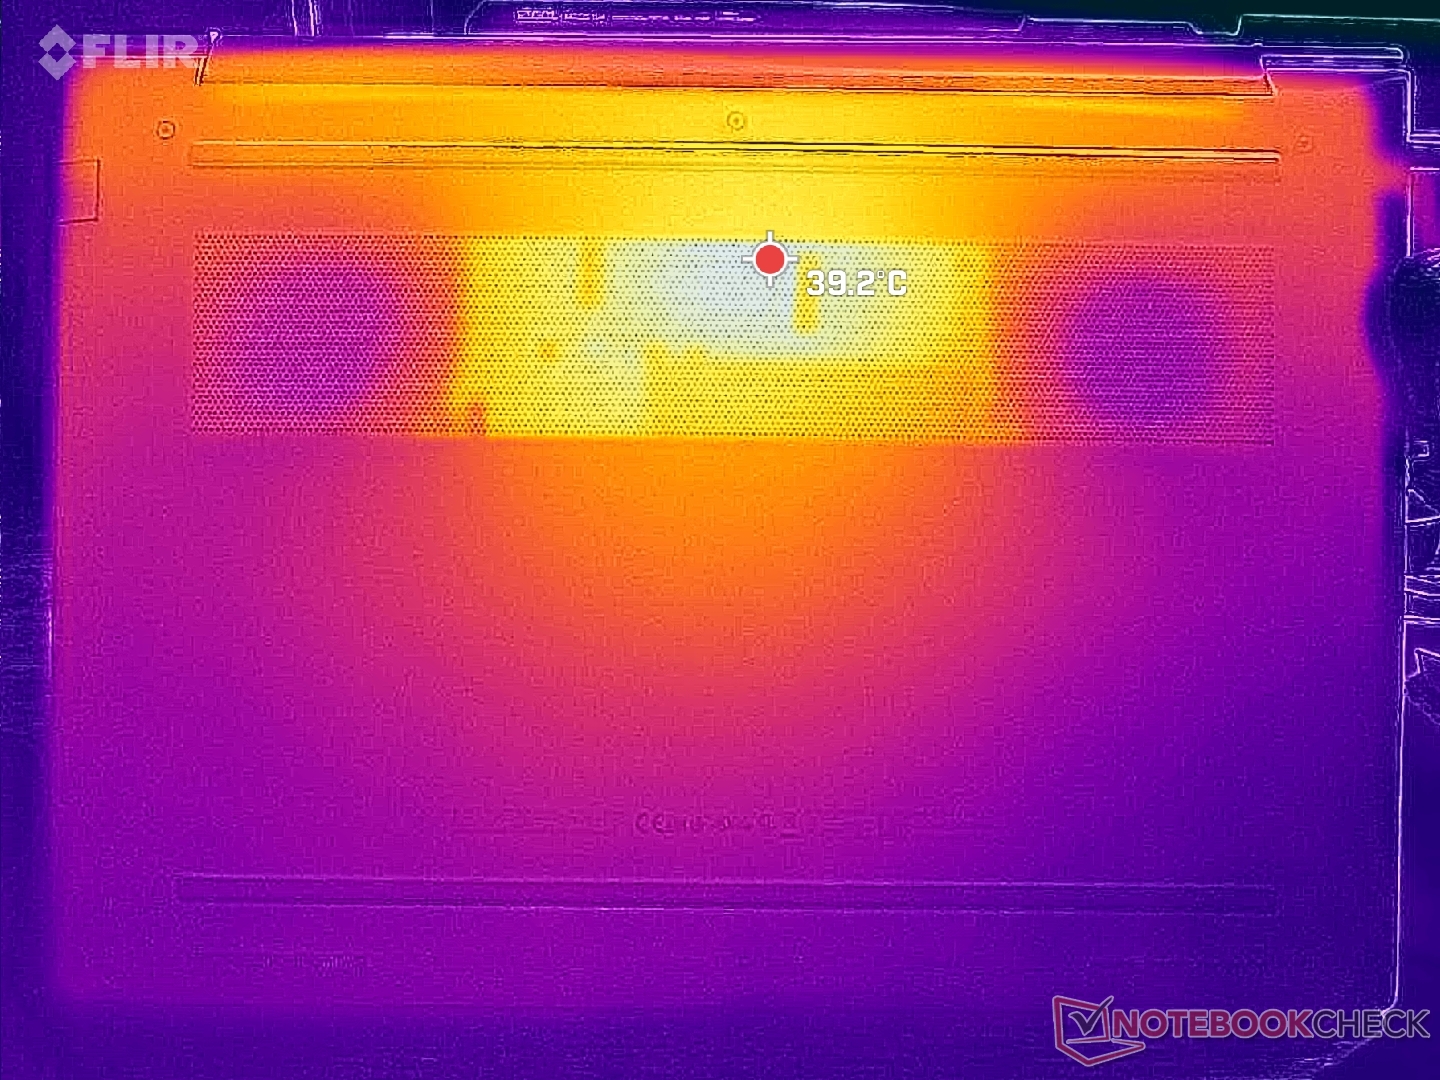
温度
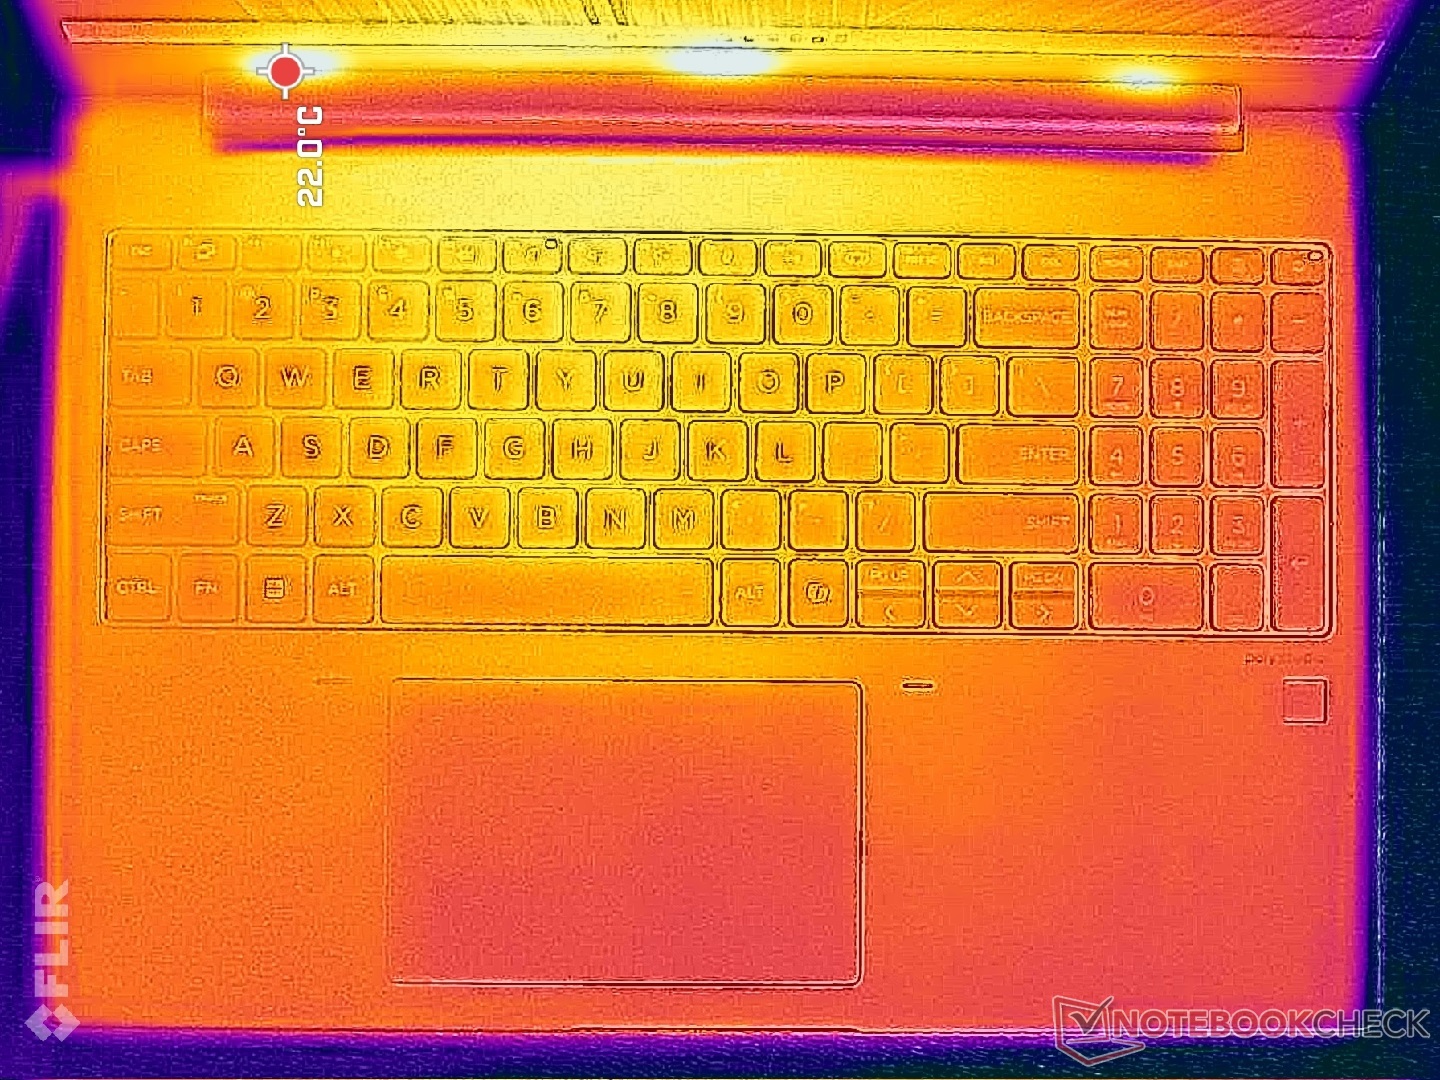
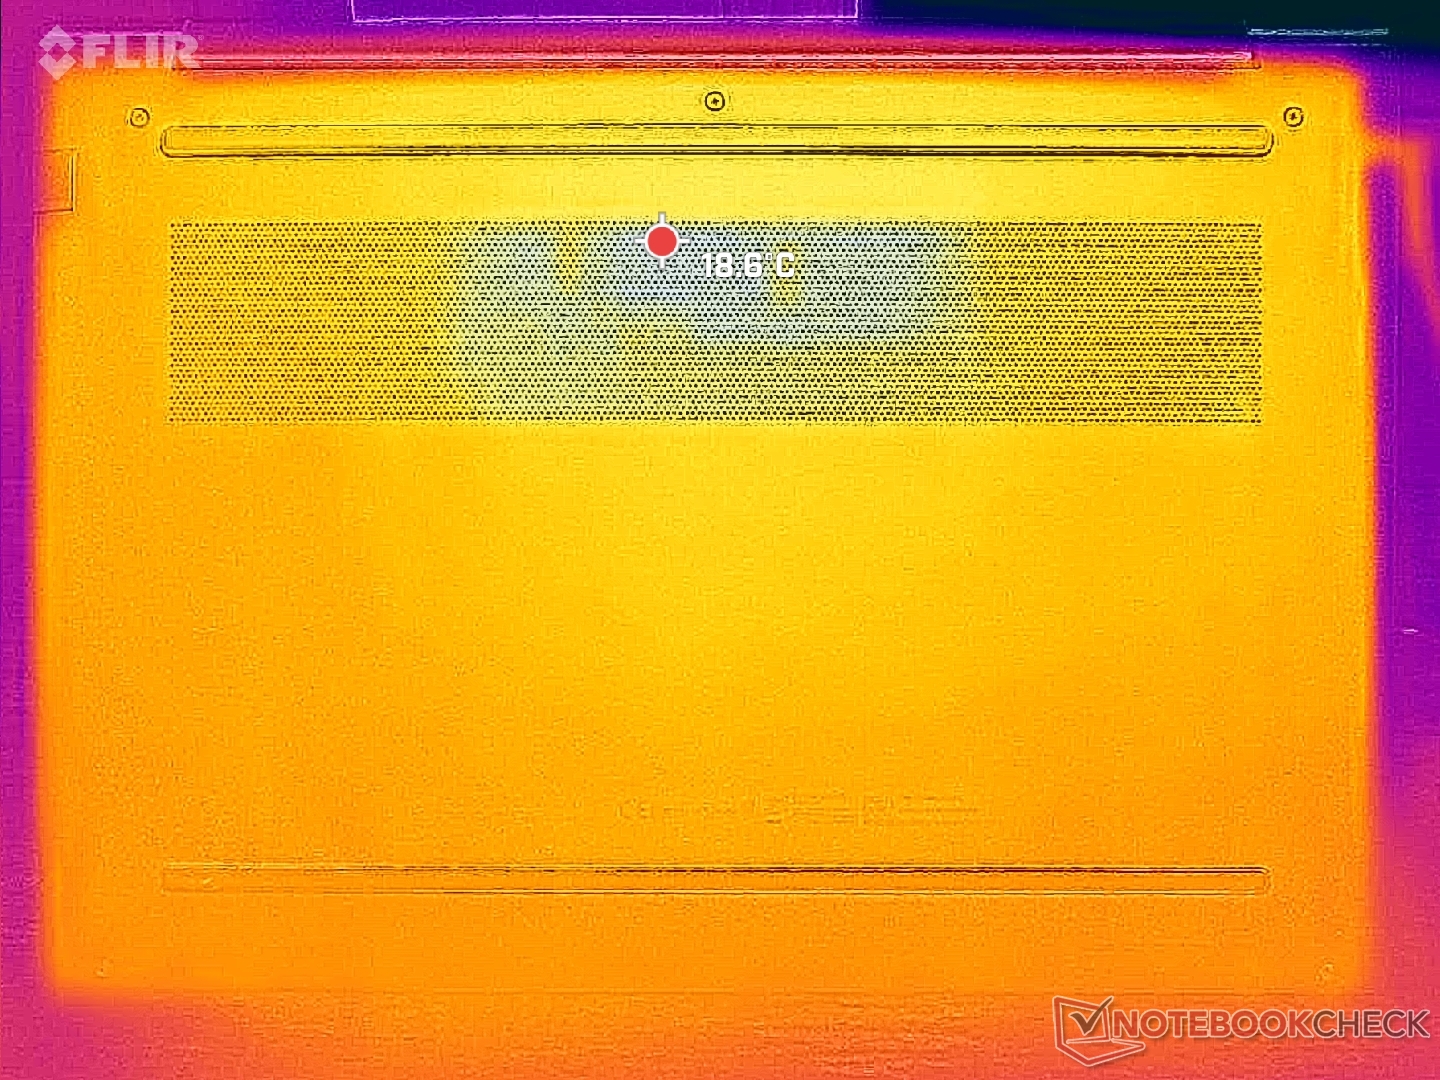
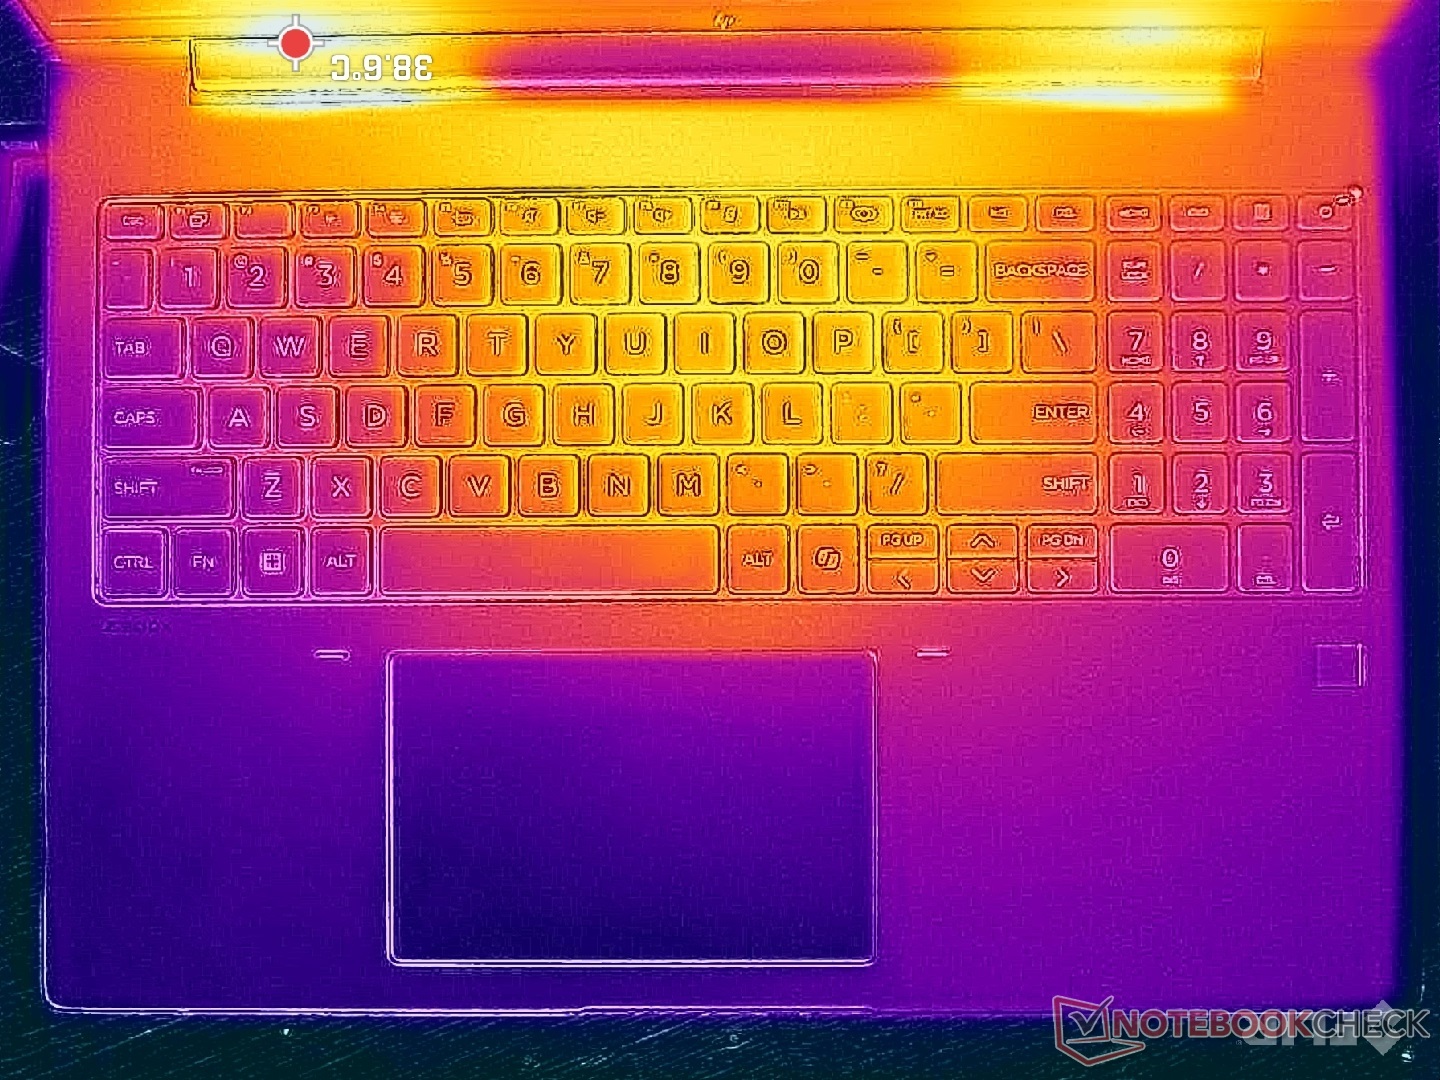
全新 16 英寸机型的表面温度普遍较低,尤其是底盖。与旧款 ZBook Power 15 G10 的 48 摄氏度相比,在运行苛刻负载时,底部的热点温度仅为 41 摄氏度。键盘中心的热斑也达到了 41 摄氏度,而掌托和两侧的温度仍然较低,手掌和手指感觉更舒适。
与功能更强大的 Precision 5690相比,戴尔设备的键盘温度更高,而底面温度更低。
(±) The maximum temperature on the upper side is 40.6 °C / 105 F, compared to the average of 38.2 °C / 101 F, ranging from 22.2 to 69.8 °C for the class Workstation.
(±) The bottom heats up to a maximum of 40.6 °C / 105 F, compared to the average of 41.2 °C / 106 F
(+) In idle usage, the average temperature for the upper side is 24.6 °C / 76 F, compared to the device average of 32 °C / 90 F.
(+) 3: The average temperature for the upper side is 30.1 °C / 86 F, compared to the average of 32 °C / 90 F for the class Workstation.
(+) The palmrests and touchpad are cooler than skin temperature with a maximum of 27.2 °C / 81 F and are therefore cool to the touch.
(±) The average temperature of the palmrest area of similar devices was 27.8 °C / 82 F (+0.6 °C / 1 F).
| HP ZBook Power 16 G11 A AMD Ryzen 7 8845HS, NVIDIA RTX 2000 Ada Generation Laptop GPU | HP ZBook Power 15 G10 AMD Ryzen 7 PRO 7840HS, NVIDIA RTX 2000 Ada Generation Laptop GPU | HP ZBook Fury 16 G11 Intel Core i9-14900HX, NVIDIA RTX 3500 Ada Generation Laptop GPU | Lenovo ThinkPad P1 Gen 7 21KV001SGE Intel Core Ultra 7 155H, NVIDIA GeForce RTX 4060 Laptop GPU | Lenovo ThinkPad P16s G2 21K9000CGE AMD Ryzen 7 PRO 7840U, AMD Radeon 780M | Dell Precision 5690 Intel Core Ultra 9 185H, Nvidia RTX 5000 Ada Generation Laptop GPU | |
|---|---|---|---|---|---|---|
| Heat | -7% | -26% | -8% | -9% | -8% | |
| Maximum Upper Side * | 40.6 | 42.4 -4% | 42.2 -4% | 50.3 -24% | 42.7 -5% | 46.6 -15% |
| Maximum Bottom * | 40.6 | 47.8 -18% | 48 -18% | 38 6% | 47.2 -16% | 33 19% |
| Idle Upper Side * | 26 | 26.8 -3% | 37 -42% | 28.3 -9% | 27.8 -7% | 32.4 -25% |
| Idle Bottom * | 26.6 | 27.2 -2% | 36.8 -38% | 27.3 -3% | 28.4 -7% | 29.4 -11% |
* ... smaller is better
发言人
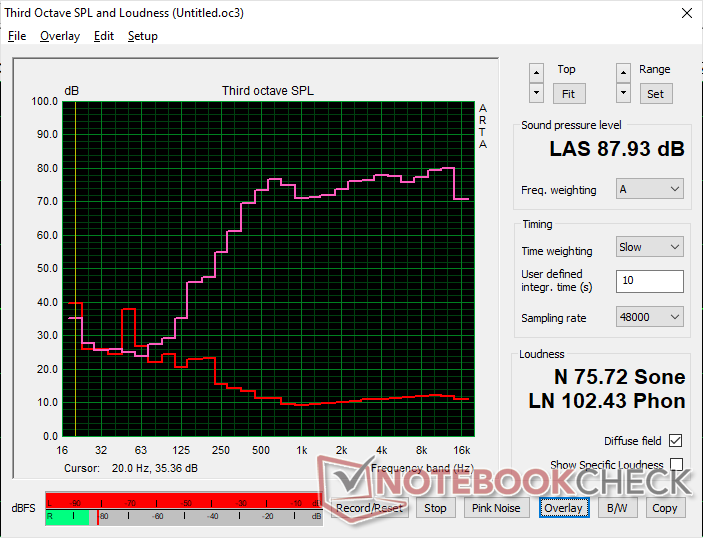
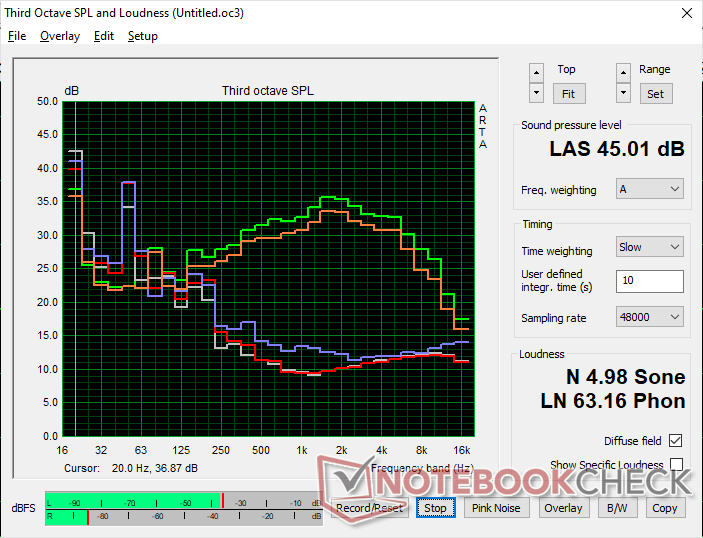
HP ZBook Power 16 G11 A audio analysis
(+) | speakers can play relatively loud (87.9 dB)
Bass 100 - 315 Hz
(-) | nearly no bass - on average 28.1% lower than median
(±) | linearity of bass is average (9% delta to prev. frequency)
Mids 400 - 2000 Hz
(+) | balanced mids - only 1.9% away from median
(+) | mids are linear (4.8% delta to prev. frequency)
Highs 2 - 16 kHz
(+) | balanced highs - only 3.6% away from median
(+) | highs are linear (2.4% delta to prev. frequency)
Overall 100 - 16.000 Hz
(±) | linearity of overall sound is average (15.1% difference to median)
Compared to same class
» 29% of all tested devices in this class were better, 7% similar, 63% worse
» The best had a delta of 7%, average was 18%, worst was 35%
Compared to all devices tested
» 19% of all tested devices were better, 4% similar, 77% worse
» The best had a delta of 4%, average was 24%, worst was 134%
Apple MacBook Pro 16 2021 M1 Pro audio analysis
(+) | speakers can play relatively loud (84.7 dB)
Bass 100 - 315 Hz
(+) | good bass - only 3.8% away from median
(+) | bass is linear (5.2% delta to prev. frequency)
Mids 400 - 2000 Hz
(+) | balanced mids - only 1.3% away from median
(+) | mids are linear (2.1% delta to prev. frequency)
Highs 2 - 16 kHz
(+) | balanced highs - only 1.9% away from median
(+) | highs are linear (2.7% delta to prev. frequency)
Overall 100 - 16.000 Hz
(+) | overall sound is linear (4.6% difference to median)
Compared to same class
» 0% of all tested devices in this class were better, 0% similar, 100% worse
» The best had a delta of 5%, average was 18%, worst was 45%
Compared to all devices tested
» 0% of all tested devices were better, 0% similar, 100% worse
» The best had a delta of 4%, average was 24%, worst was 134%
能源管理
耗电量
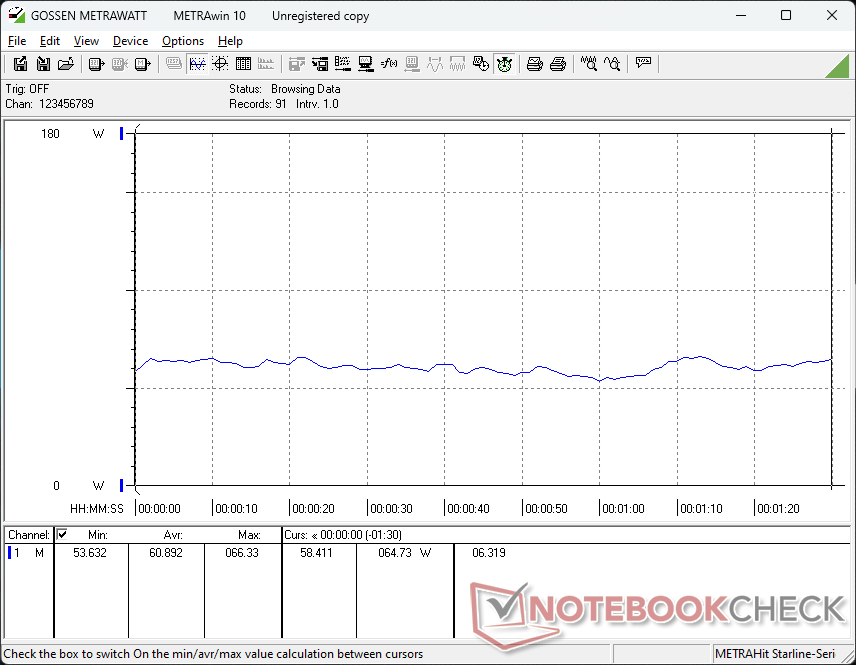
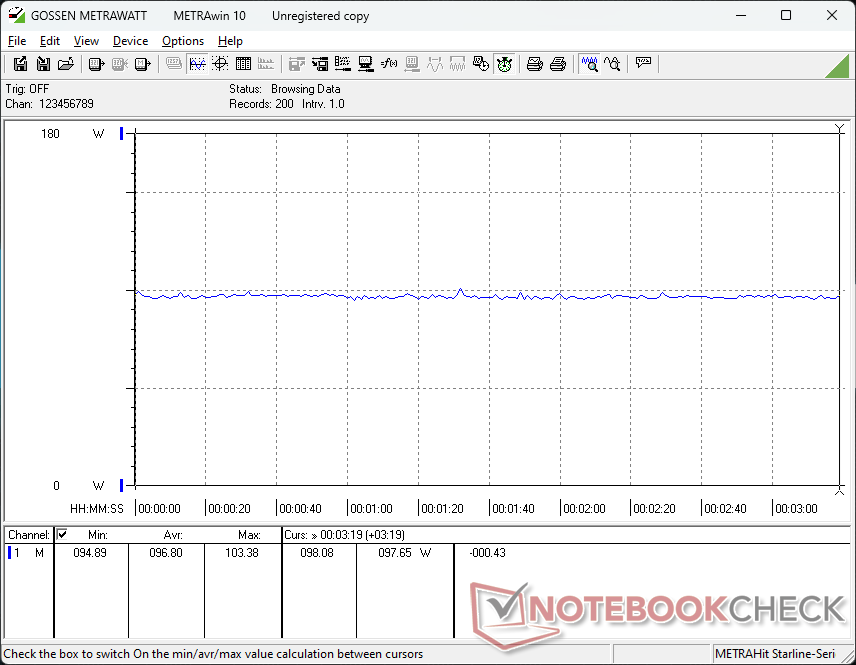
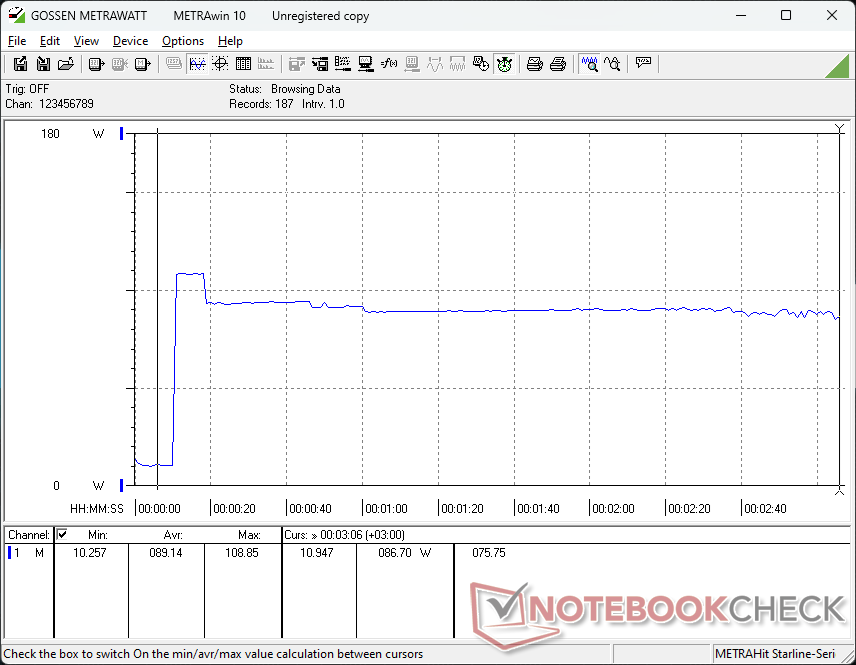
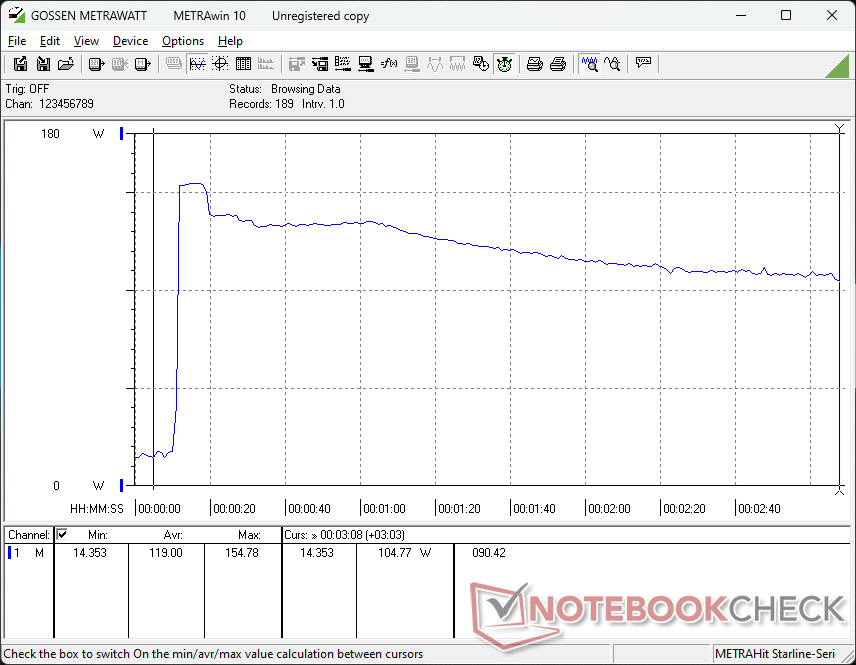
消耗水平和行为与我们在 ZBook Power 15 G10 上观察到的情况类似,这并不奇怪,因为它们的功率包络线保持不变。最显著的差异可能与同时运行 Prime95 和 FurMark 时较低的约 25 W 消耗有关。这可以归因于在运行此类负载时,如上文压力测试部分所述,为冷却核心温度而采取了更严格的节流措施。
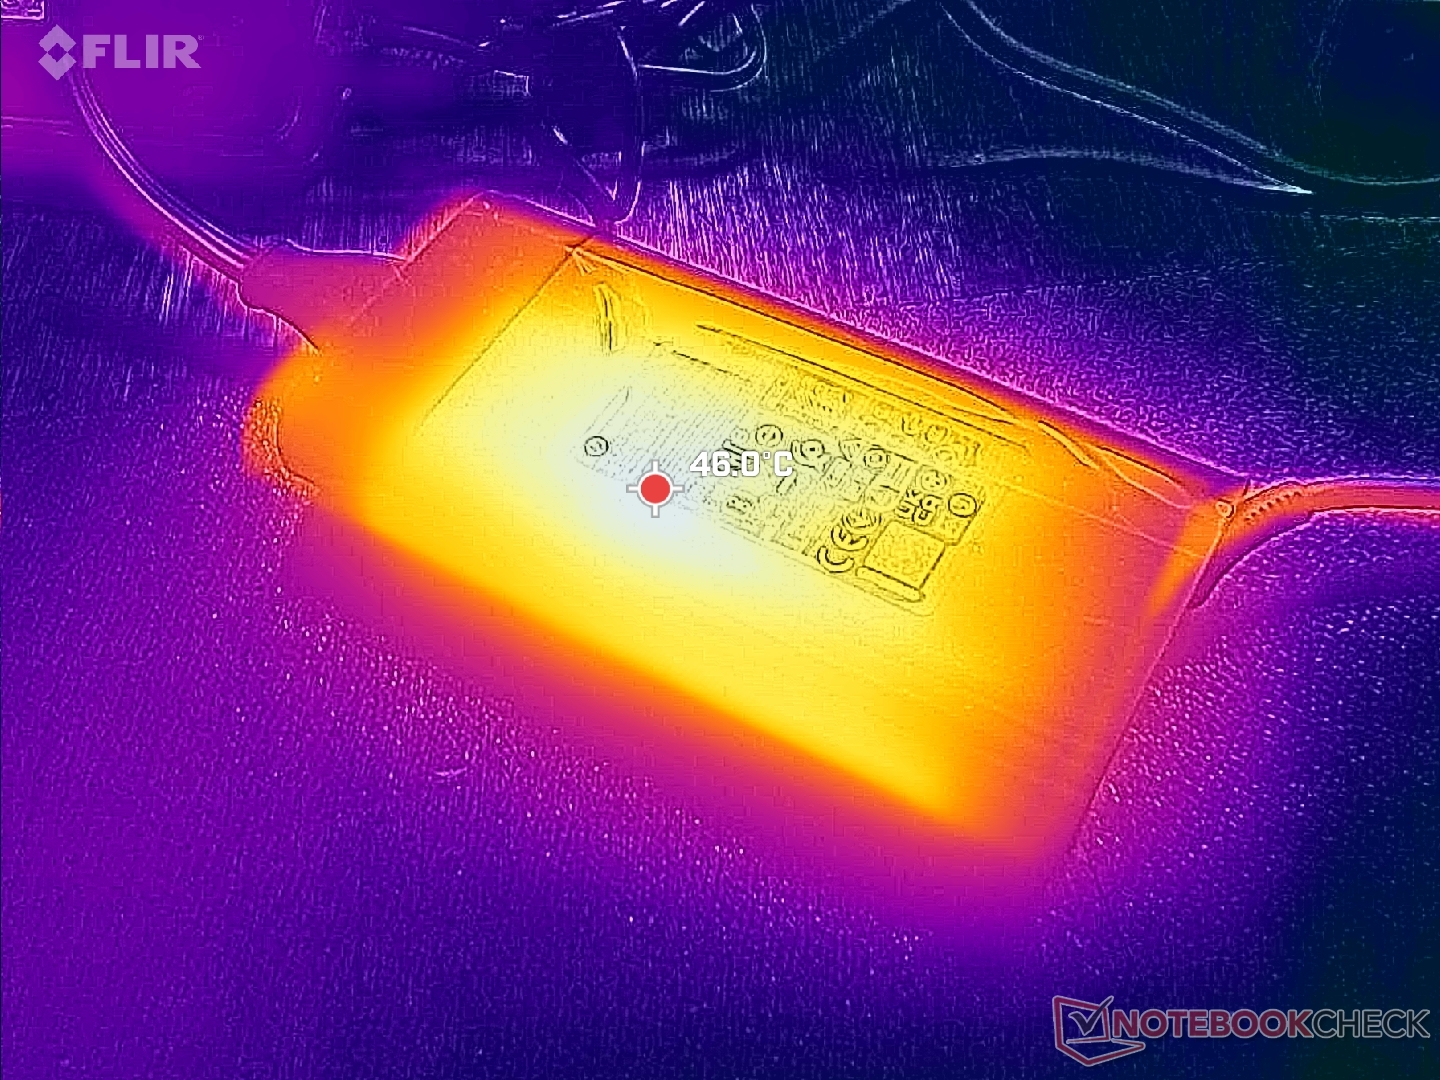
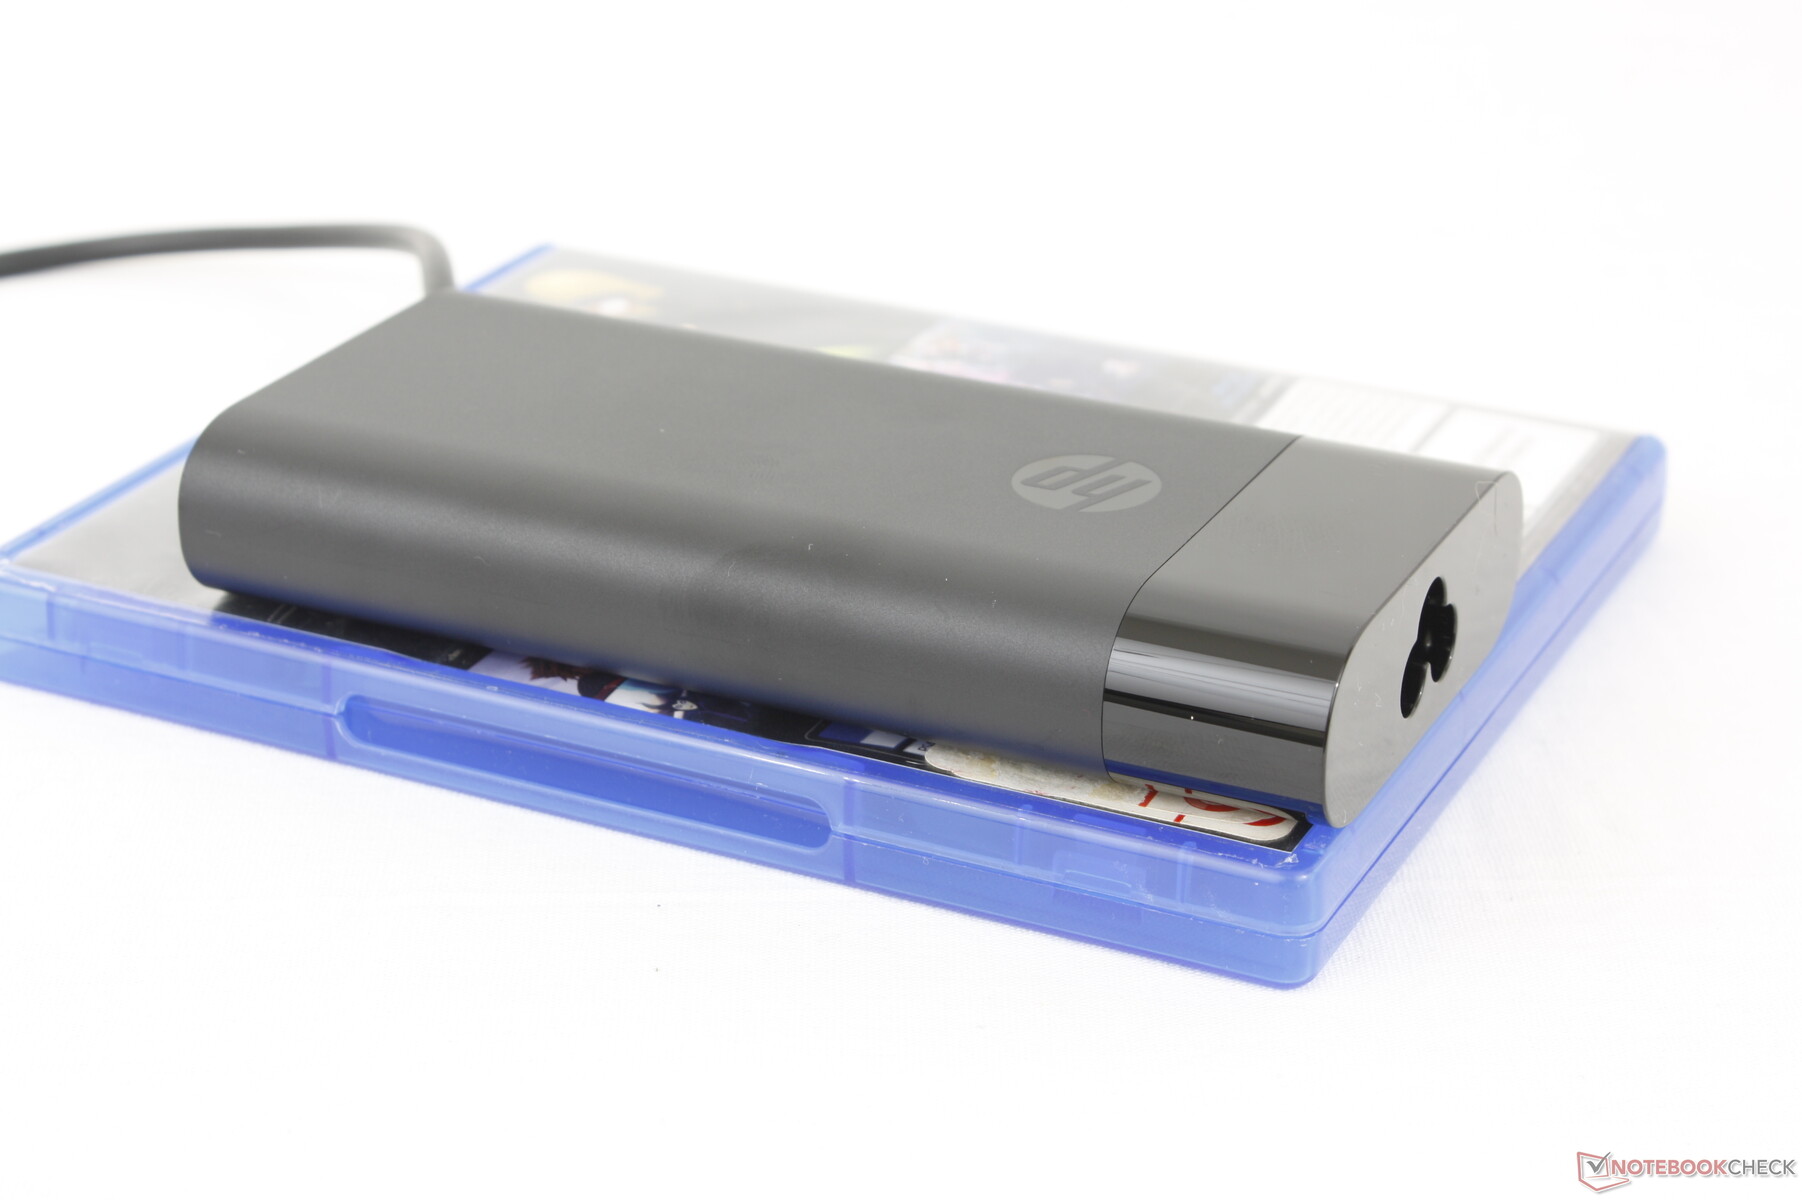
我们使用中等尺寸(约 13.8 x 6.5 x 2.2 厘米)的 150 瓦交流适配器记录了 155 瓦的临时最大功耗。
| Off / Standby | |
| Idle | |
| Load |
|
Key:
min: | |
| HP ZBook Power 16 G11 A R7 8845HS, NVIDIA RTX 2000 Ada Generation Laptop GPU, Samsung PM9A1 MZVL22T0HBLB, IPS, 2560x1600, 16" | HP ZBook Power 15 G10 R7 PRO 7840HS, NVIDIA RTX 2000 Ada Generation Laptop GPU, WDC PC SN810 2TB, IPS, 2560x1440, 15.6" | HP ZBook Fury 16 G11 i9-14900HX, NVIDIA RTX 3500 Ada Generation Laptop GPU, SK hynix PC801 HFS001TEJ9X101N, IPS, 3840x2400, 16" | Lenovo ThinkPad P1 Gen 7 21KV001SGE Ultra 7 155H, NVIDIA GeForce RTX 4060 Laptop GPU, Kioxia XG8 KXG8AZNV1T02, IPS LED, 2560x1600, 16" | Lenovo ThinkPad P16s G2 21K9000CGE R7 PRO 7840U, Radeon 780M, SK hynix PC801 HFS001TEJ9X162N, OLED, 3840x2400, 16" | Dell Precision 5690 Ultra 9 185H, NVIDIA RTX 5000 Ada Generation Laptop GPU, 2x Samsung PM9A1 1TB (RAID 0), OLED, 3840x2400, 16" | |
|---|---|---|---|---|---|---|
| Power Consumption | -13% | -80% | -35% | 20% | -67% | |
| Idle Minimum * | 4.6 | 5.3 -15% | 8.6 -87% | 7.3 -59% | 6.1 -33% | 7.9 -72% |
| Idle Average * | 10 | 9.9 1% | 14.8 -48% | 12.3 -23% | 6.5 35% | 12 -20% |
| Idle Maximum * | 10.6 | 16.7 -58% | 15.7 -48% | 17.9 -69% | 7 34% | 28.6 -170% |
| Load Average * | 60.9 | 61.3 -1% | 129.4 -112% | 78.2 -28% | 56.6 7% | 98.8 -62% |
| Cyberpunk 2077 ultra external monitor * | 92.8 | 192.6 -108% | 117.7 -27% | |||
| Cyberpunk 2077 ultra * | 96.8 | 199.4 -106% | 123.5 -28% | |||
| Load Maximum * | 154.8 | 145.3 6% | 236.1 -53% | 167.5 -8% | 68.3 56% | 174.8 -13% |
| Witcher 3 ultra * | 87.9 | 61.2 | 144.5 |
* ... smaller is better
Power Consumption Cyberpunk / Stress Test
Power Consumption external Monitor
电池寿命
尽管外形有所更新,但电池容量与去年的 ZBook Power 15 G10 相比没有变化。也许是巧合,运行时间几乎保持不变,实际 WLAN 浏览时间略高于 9.5 小时,然后自动关机。
从空电到满电的充电时间相对较短,不到 70 分钟。支持通过 USB-C 充电,尽管速度较慢。
| HP ZBook Power 16 G11 A R7 8845HS, NVIDIA RTX 2000 Ada Generation Laptop GPU, 83 Wh | HP ZBook Power 15 G10 R7 PRO 7840HS, NVIDIA RTX 2000 Ada Generation Laptop GPU, 83 Wh | HP ZBook Fury 16 G11 i9-14900HX, NVIDIA RTX 3500 Ada Generation Laptop GPU, 95 Wh | Lenovo ThinkPad P1 Gen 7 21KV001SGE Ultra 7 155H, NVIDIA GeForce RTX 4060 Laptop GPU, 90 Wh | Lenovo ThinkPad P16s G2 21K9000CGE R7 PRO 7840U, Radeon 780M, 84 Wh | Dell Precision 5690 Ultra 9 185H, NVIDIA RTX 5000 Ada Generation Laptop GPU, 98 Wh | |
|---|---|---|---|---|---|---|
| Battery Runtime | 3% | -31% | 7% | -1% | -6% | |
| Reader / Idle | 1566 | |||||
| WiFi v1.3 | 582 | 601 3% | 402 -31% | 595 2% | 635 9% | 549 -6% |
| Load | 103 | 114 11% | 92 -11% | |||
| H.264 | 797 |
Pros
Cons
结论:屏幕更大,性能不变
ZBook Power 16 G11 以更大更重的 16 英寸设计取代了 ZBook Power 15 系列。人们可能会认为更大的外形会带来更快的性能,但遗憾的是事实并非如此。与去年的 Phoenix CPU 相比,新的 Hawk Point CPU 并没有提供多少性能,而 GPU 的选择则完全相同,直到其 TGP 上限。重新设计机箱是惠普升级散热解决方案并从处理器中榨取更多性能的机会,但我们认为制造商并不想过多蚕食高端 ZBook Fury 的领地。
对于工作站来说,显示器的选择也有点令人失望。除了独特的 1000 nit 选项外,没有 OLED、P3 颜色或 4K 分辨率等值得一提的功能。与即将推出的 15.6 英寸版本相比,这样的面板会使更大的屏幕尺寸更具吸引力。相反,用户只能选择 2K 和 IPS。
ZBook Power 16 G11 与前代产品相比,除了屏幕尺寸增大到 16 英寸外,并无其他优势。两款机型的性能和功能几乎相同。
尽管缺乏性能升级和新功能,惠普仍然是一款强大的中端工作站。CPU 性能仍然明显快于 ThinkPad P16s G2的 CPU 性能要明显快于 ThinkPad P16s G2,后者仅限于 Ryzen-U 系列 CPU,而价格却低于流行的 戴尔Precision 5690配置相同 GPU 时的价格。不过,如果你已经拥有了一台 ZBook Power 15 G10,那么较重的 16 英寸版本可能会让你感觉是在走弯路。
价格和供应情况
惠普现已开始发售ZBook Power 16 G11 A,基本 Ryzen 5 和 iGPU 配置的起价为 1140 美元。我们的评测配置包括 Ryzen 7 CPU、RTX 2000 Ada GPU 和 1600p 显示屏,售价约为 2000 美元。
注:我们最近更新了评级系统,第 8 版的结果与第 7 版的结果不具可比性。更多信息 此处.
HP ZBook Power 16 G11 A
- 09/30/2024 v8
Allen Ngo
 Total Sustainability Score:
 Transparency
The selection of devices to be reviewed is made by our editorial team. The test sample was provided to the author as a loan by the manufacturer or retailer for the purpose of this review. The lender had no influence on this review, nor did the manufacturer receive a copy of this review before publication. There was no obligation to publish this review. We never accept compensation or payment in return for our reviews. As an independent media company, Notebookcheck is not subjected to the authority of manufacturers, retailers or publishers.
This is how Notebookcheck is testing
Every year, Notebookcheck independently reviews hundreds of laptops and smartphones using standardized procedures to ensure that all results are comparable. We have continuously developed our test methods for around 20 years and set industry standards in the process. In our test labs, high-quality measuring equipment is utilized by experienced technicians and editors. These tests involve a multi-stage validation process. Our complex rating system is based on hundreds of well-founded measurements and benchmarks, which maintains objectivity. Further information on our test methods can be found here.
Price comparison

