

Razer Blade 16 2025 评测--游戏笔记本电脑现在配备GeForce RTX 5090 笔记本电脑和更轻薄的机箱
回归本源--这样行得通吗?
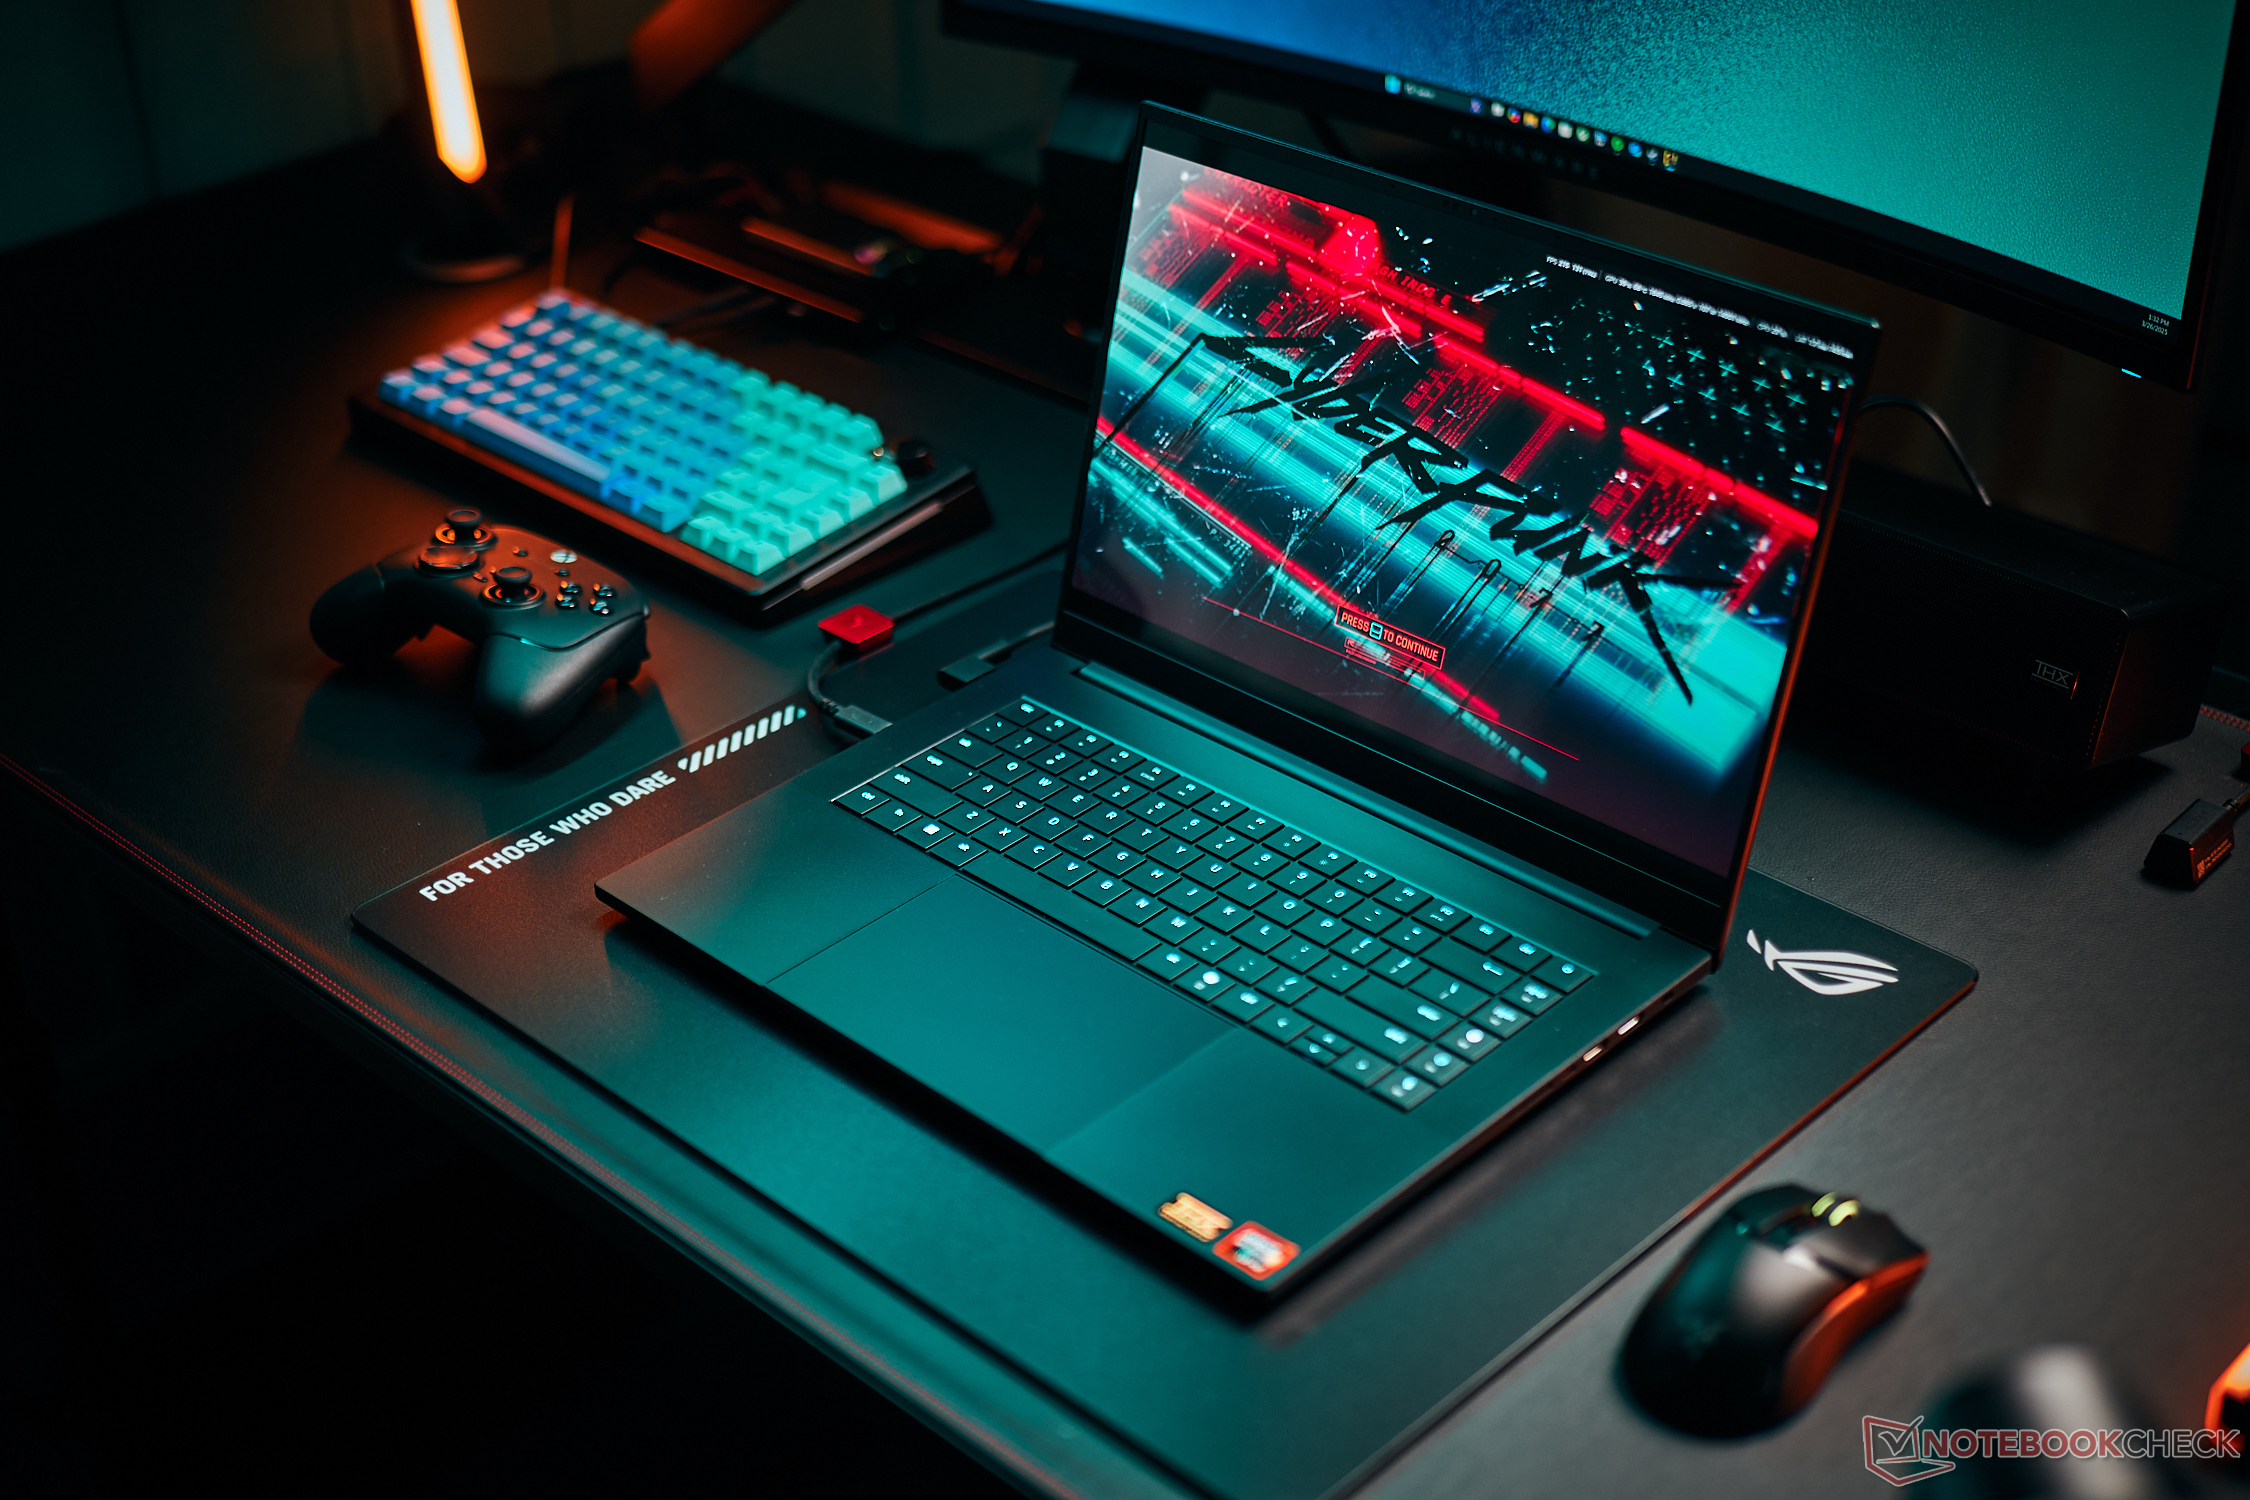
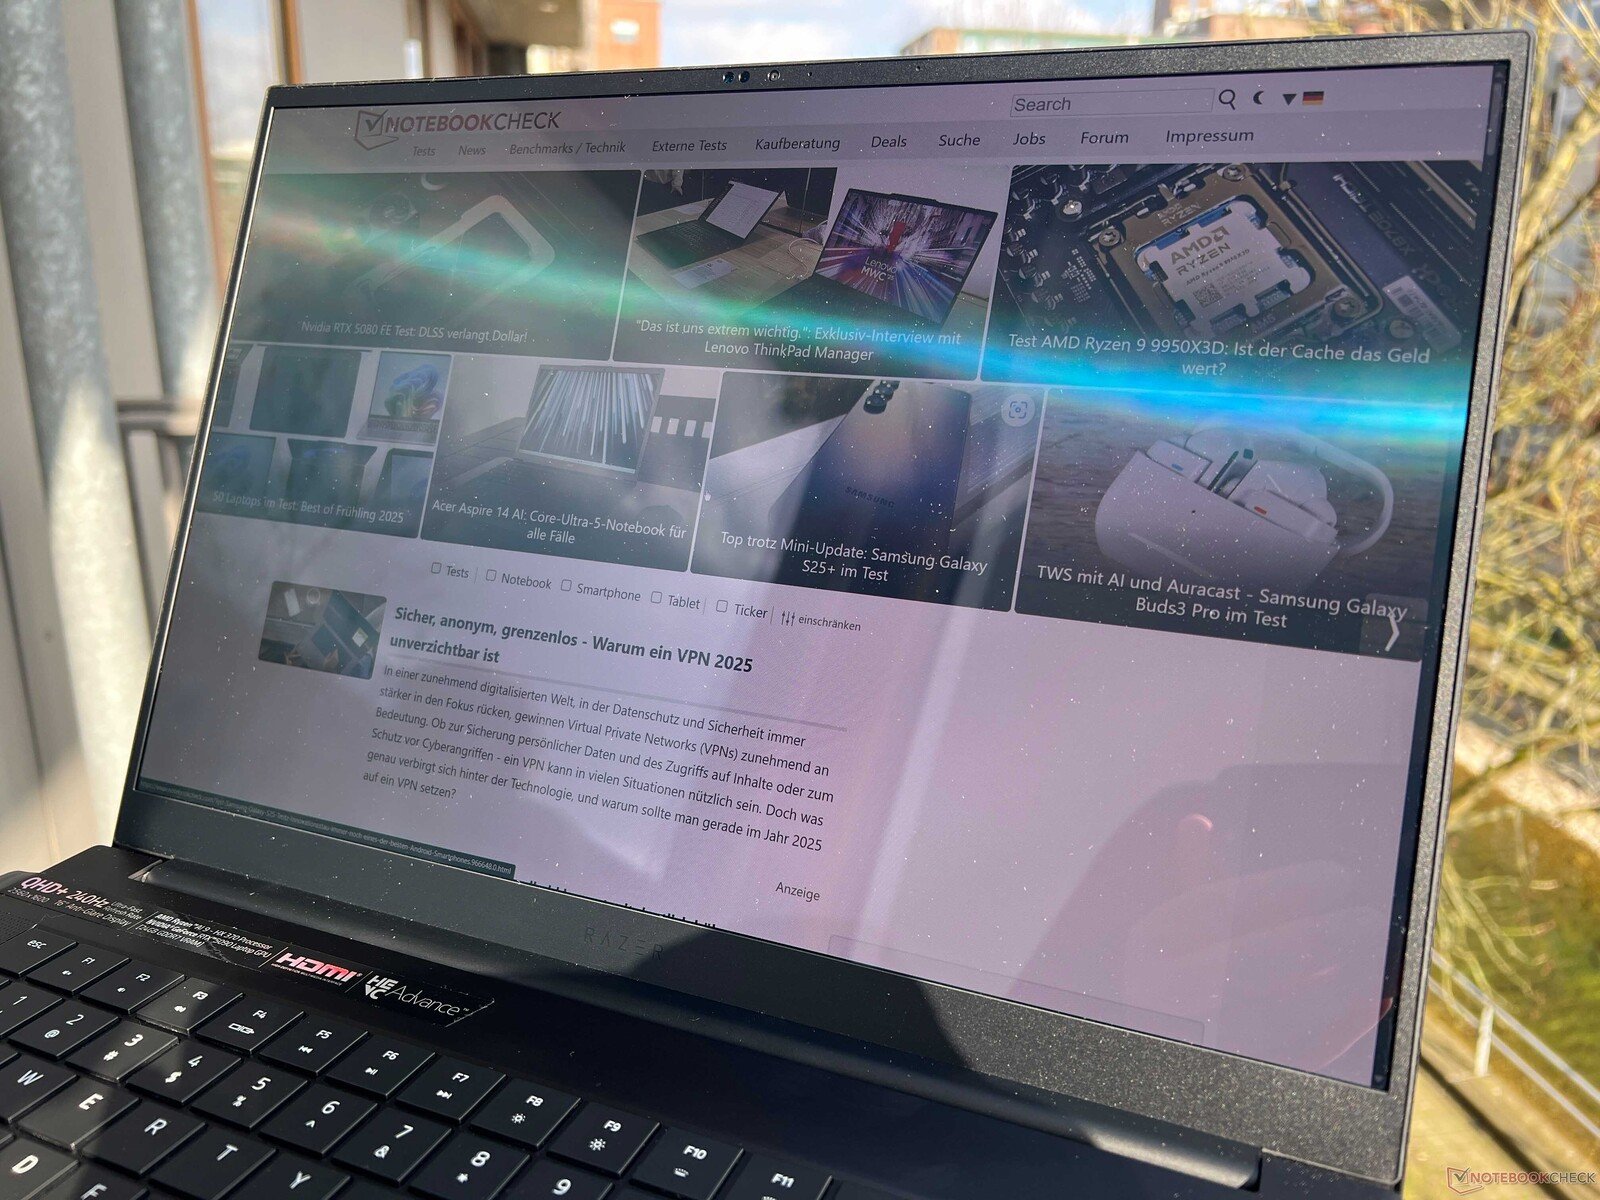
Razer Blade 16 2025 是首款配备全新 NvidiaGeForce RTX 5090 笔记本电脑的笔记本电脑,它运行 240-Hz OLED 面板。与此同时,Blade 16 再次大幅瘦身,这也意味着它现在使用了速度更慢的 AMD Ryzen 处理器。Andreas Osthoff, 👁 Andreas Osthoff (translated by DeepL / Ninh Duy) Published 🇺🇸 🇩🇪 ...
结论 - 尽管机身纤薄,Razer Blade 16 的性能却给人留下了深刻印象
当然,Razer Blade 2025 的有趣之处不仅在于其全新的GeForce RTX 5090 笔记本电脑,还在于其明显纤薄的机身。最大 TGP 为 160 瓦,Razer 仍能将全新 RTX 5090 笔记本电脑的速度提升到极致。
另一个妥协是处理器较弱。虽然 AMD Ryzen AI 9 HX 370 的速度绝不慢,但与速度更快的 HX CPU 相比仍有差距,这在 1080p 分辨率下尤为明显。不过,在原生 QHD 分辨率下使用 5090 笔记本电脑玩游戏仍然没有任何问题,尤其是在包括光线追踪在内的最高设置下,5090 笔记本电脑会显示出它的优势。得益于多帧生成技术,性能还能进一步大幅提升,在《赛博朋克》中几乎可以达到 200 FPS(QHD + RT Overdrive)。不过,如果你已经拥有一台配备 RTX 4090 的游戏笔记本电脑,那么只有当你能使用额外的 8 GB VRAM 时,升级才真正值得。另一方面,对于目前使用 RTX 3000 GPU 的用户来说,升级绝对是有意义的。
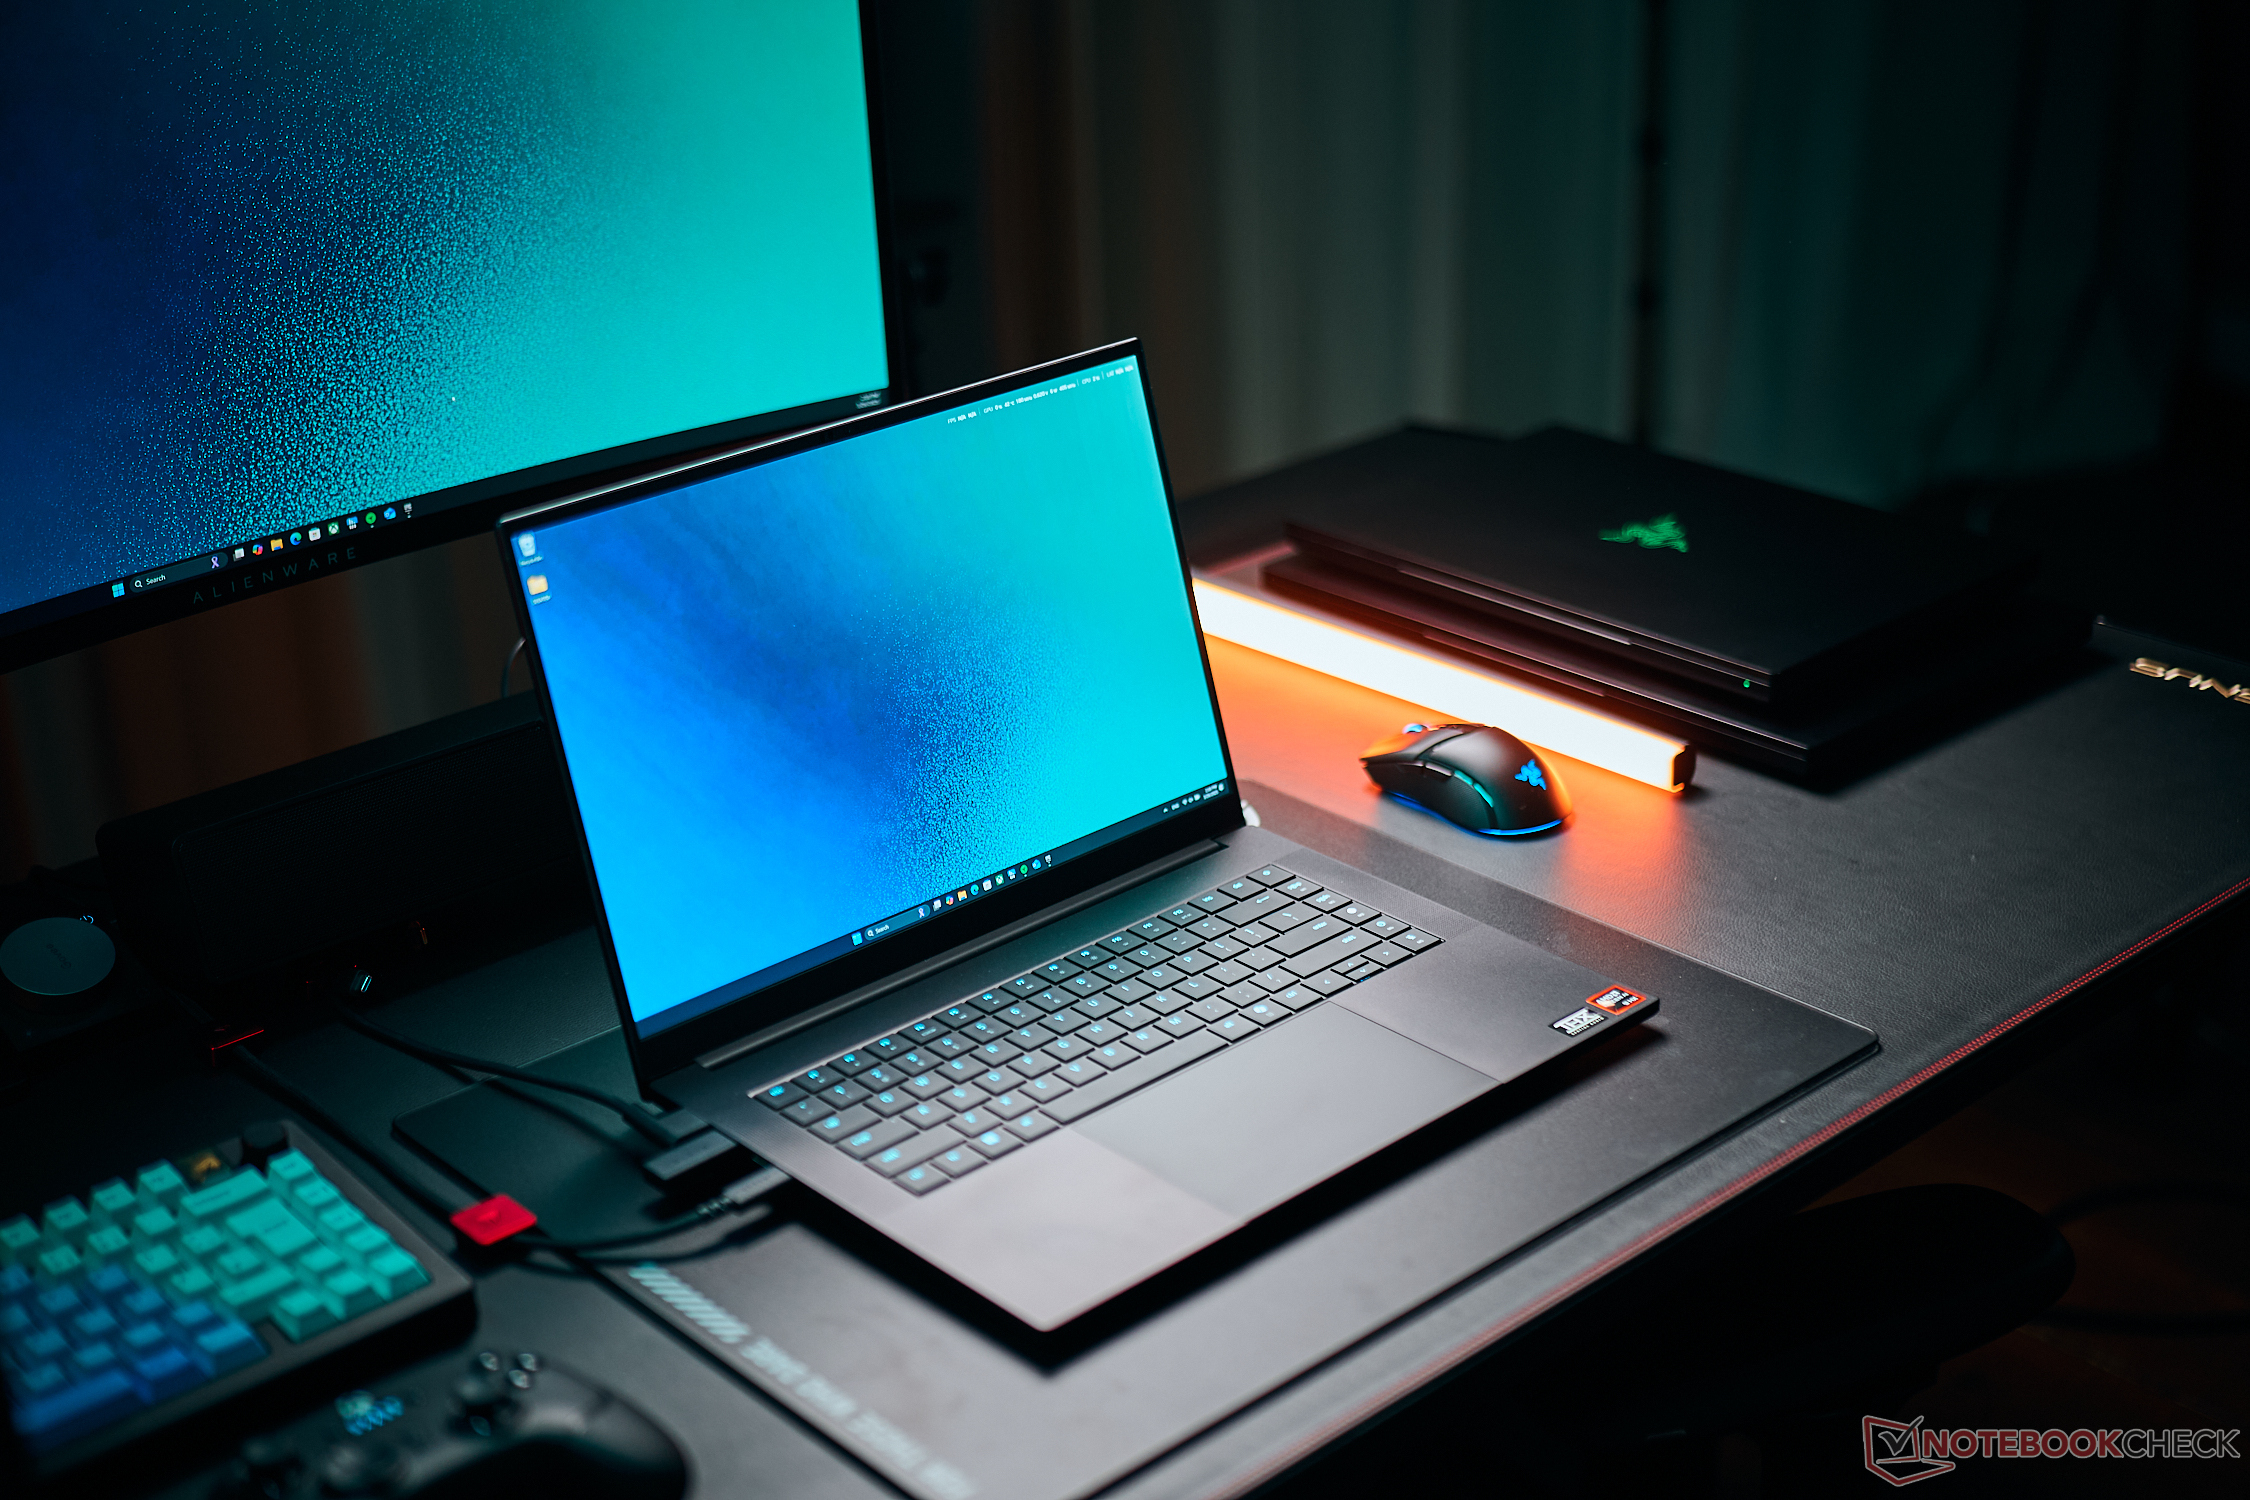
Blade 16 2025 的厚度仅为 17 毫米(约 0.67 英寸),重量约为 2 千克(约 4.4 磅),移动性很强,外壳的质量依然很高。但遗憾的是,表面仍然极易脏污。在维护选项方面,我们看到了退步,因为 Ryzen 处理器与焊接内存相结合。虽然键盘有所改进,但仍然比 ROG Zephyrus G16.
大型蒸发腔散热在噪音方面做得不错,但机箱温度有所上升。频率为 240 Hz 的 OLED 显示屏非常适合游戏,而且附带的色彩配置文件(P3 和 sRGB)校准效果极佳。只有 OLED 面板的 HDR 功能还有待改进。总的来说,新款 Razer Blade 2025 是一款出色的游戏笔记本电脑,尤其是移动性,同时还能为创意用户提供出色的性能。
Pros
Cons
- $5,698.00Razer Blade 16 Gaming Laptop: NVIDIA GeForce RTX 4090-13th Gen Intel 24-Core i9 HX CPU - 16" Dual Mode Mini LED (4K UHD+ 120Hz & FHD+ 240Hz) - 32GB RAM - 2TB SSD - Compact GaN Charger - Windows 11
- $3,998.88Razer Blade 18 Gaming Laptop: NVIDIA GeForce RTX 4080 - Intel Core i9 14900HX 14th Gen CPU - 18” QHD+ 300 Hz Mini LED Display - 32GB RAM - 1TB SSD - Thunderbolt 5 - Chroma RGB - Snap Tap
前几年,Razer Blade 16 曾是市场上速度最快的游戏笔记本电脑之一,而现在,Razer 推出了更轻薄的 2025 机型,更加回归本源。我们测试了这款配备 Ryzen AI 9 HX 370、32 GB 内存、2 TB SSD 存储和 NvidiaGeForce RTX 5090 笔记本电脑该机型的建议零售价为 4399 欧元(美国约为 4500 美元)。与旧款 刀锋 16相比,价格下降了 450 欧元(约合 485 美元)。
规格
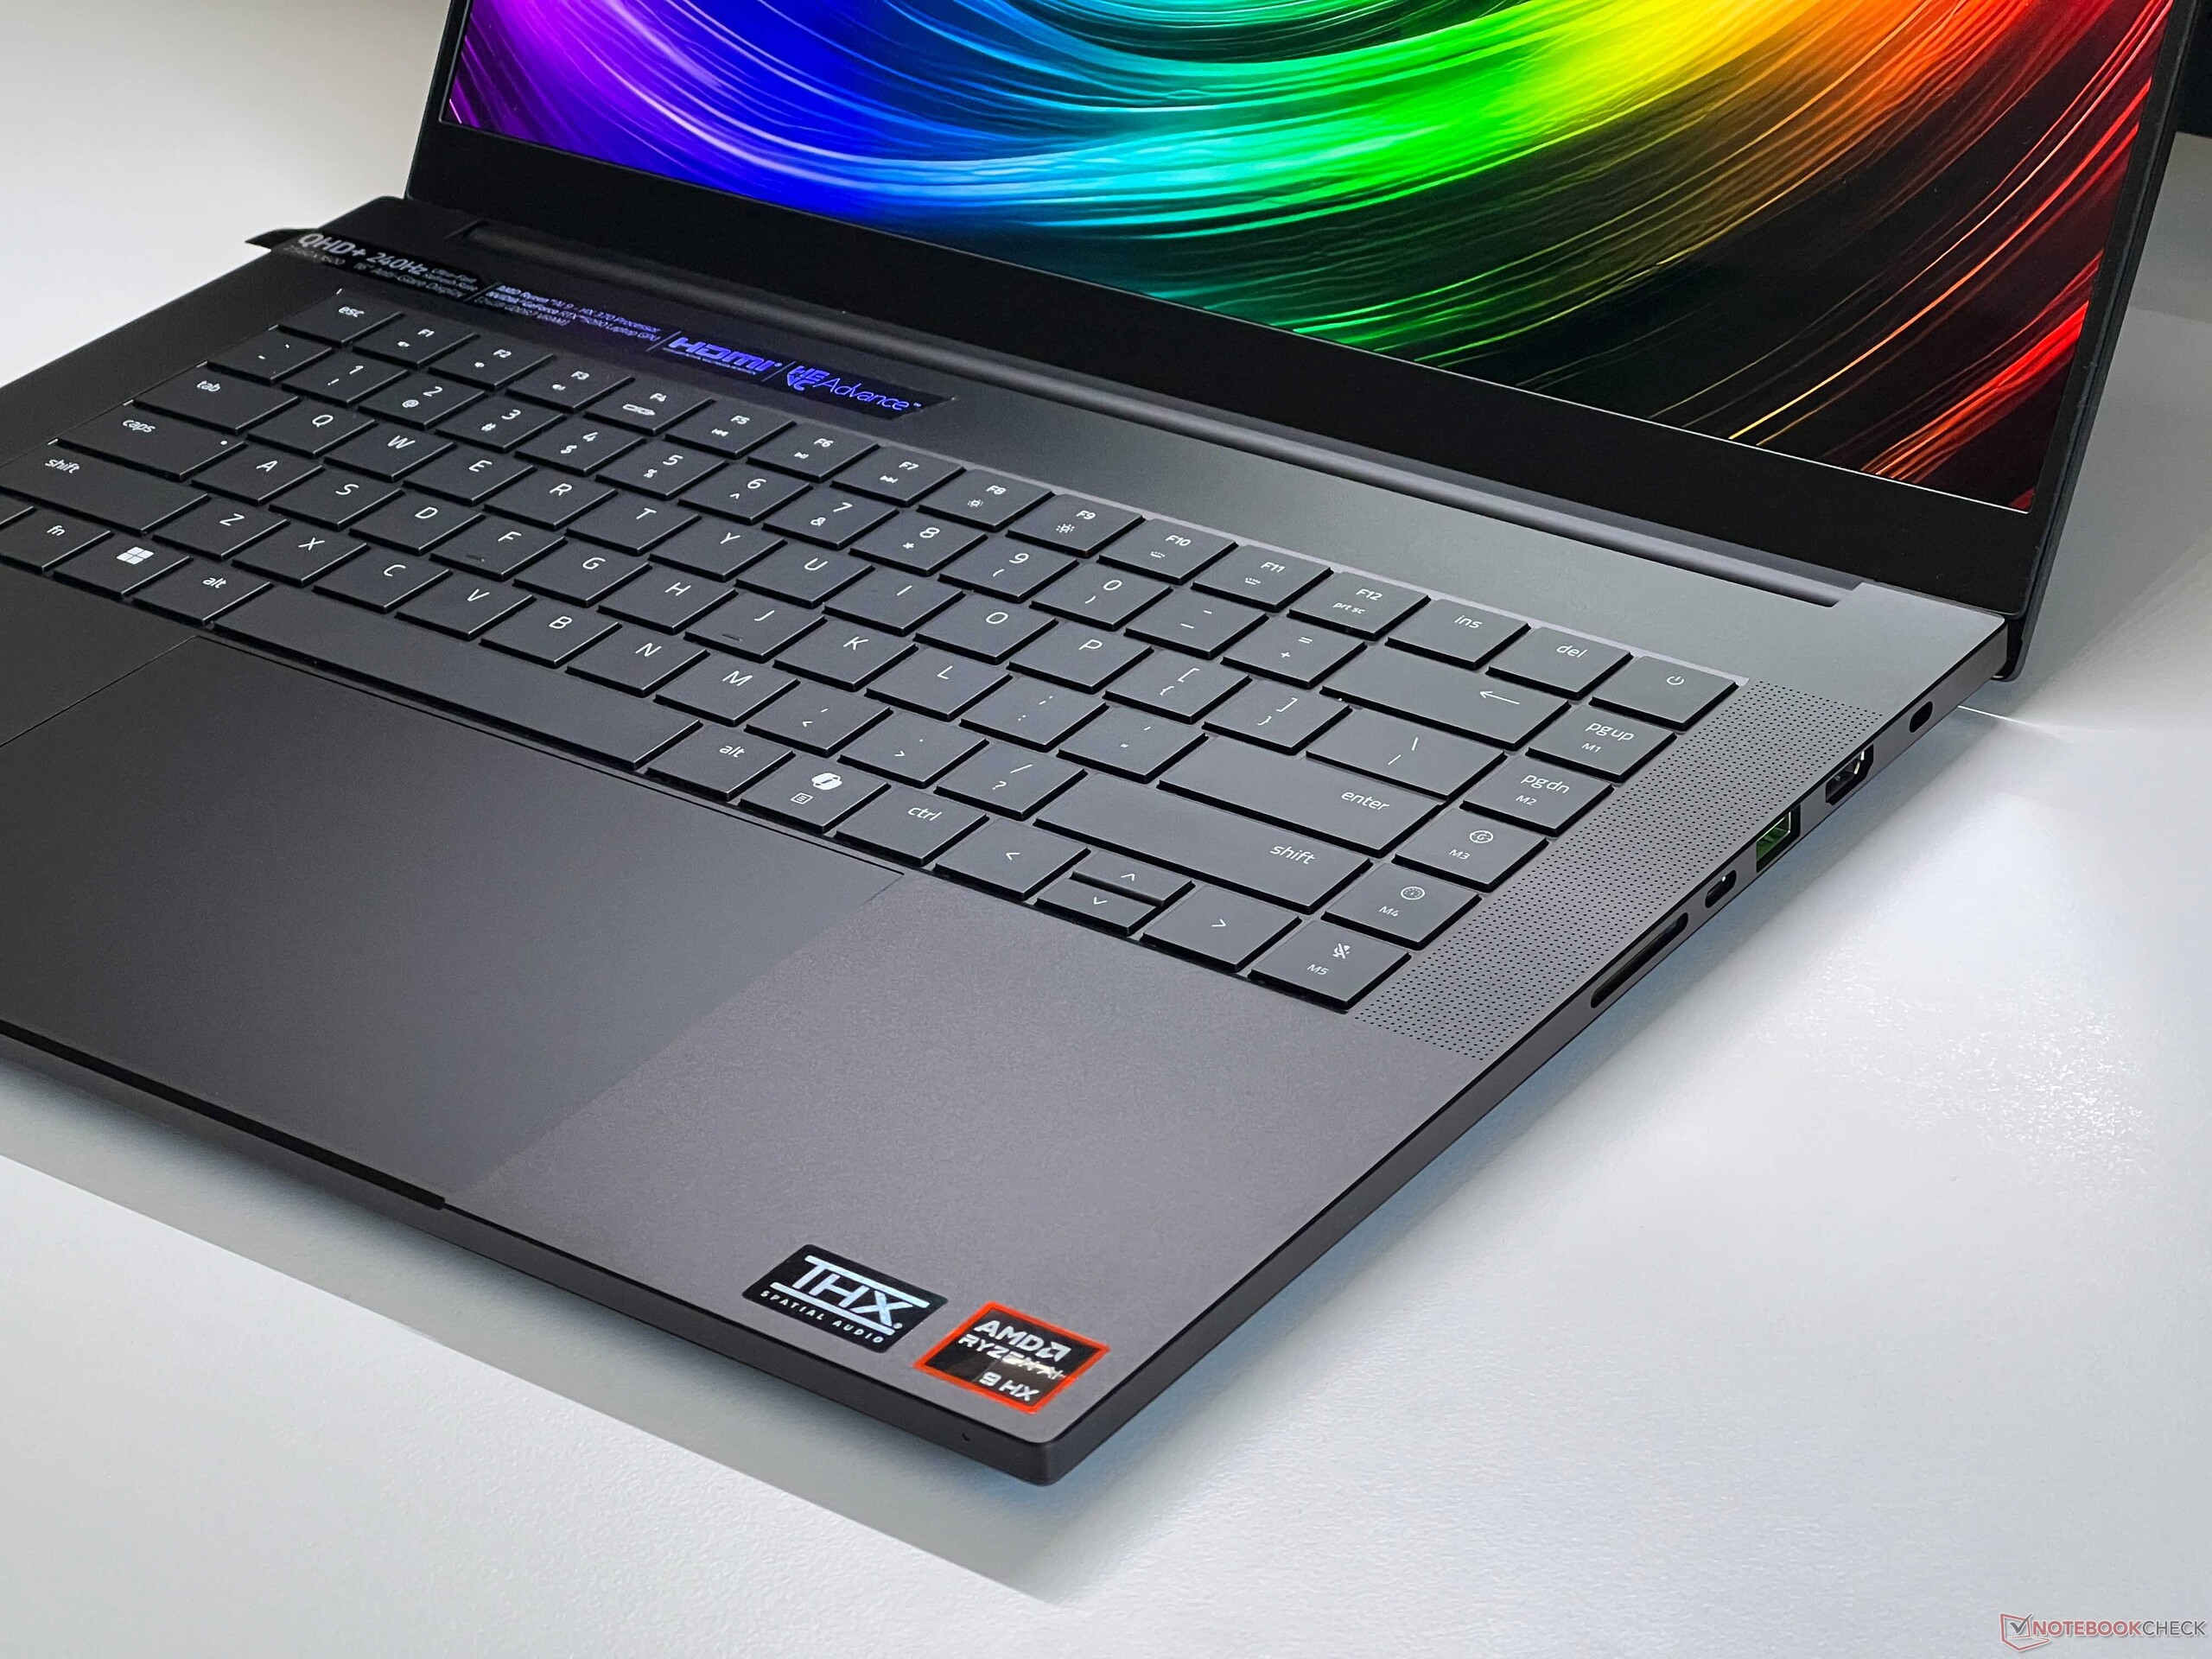
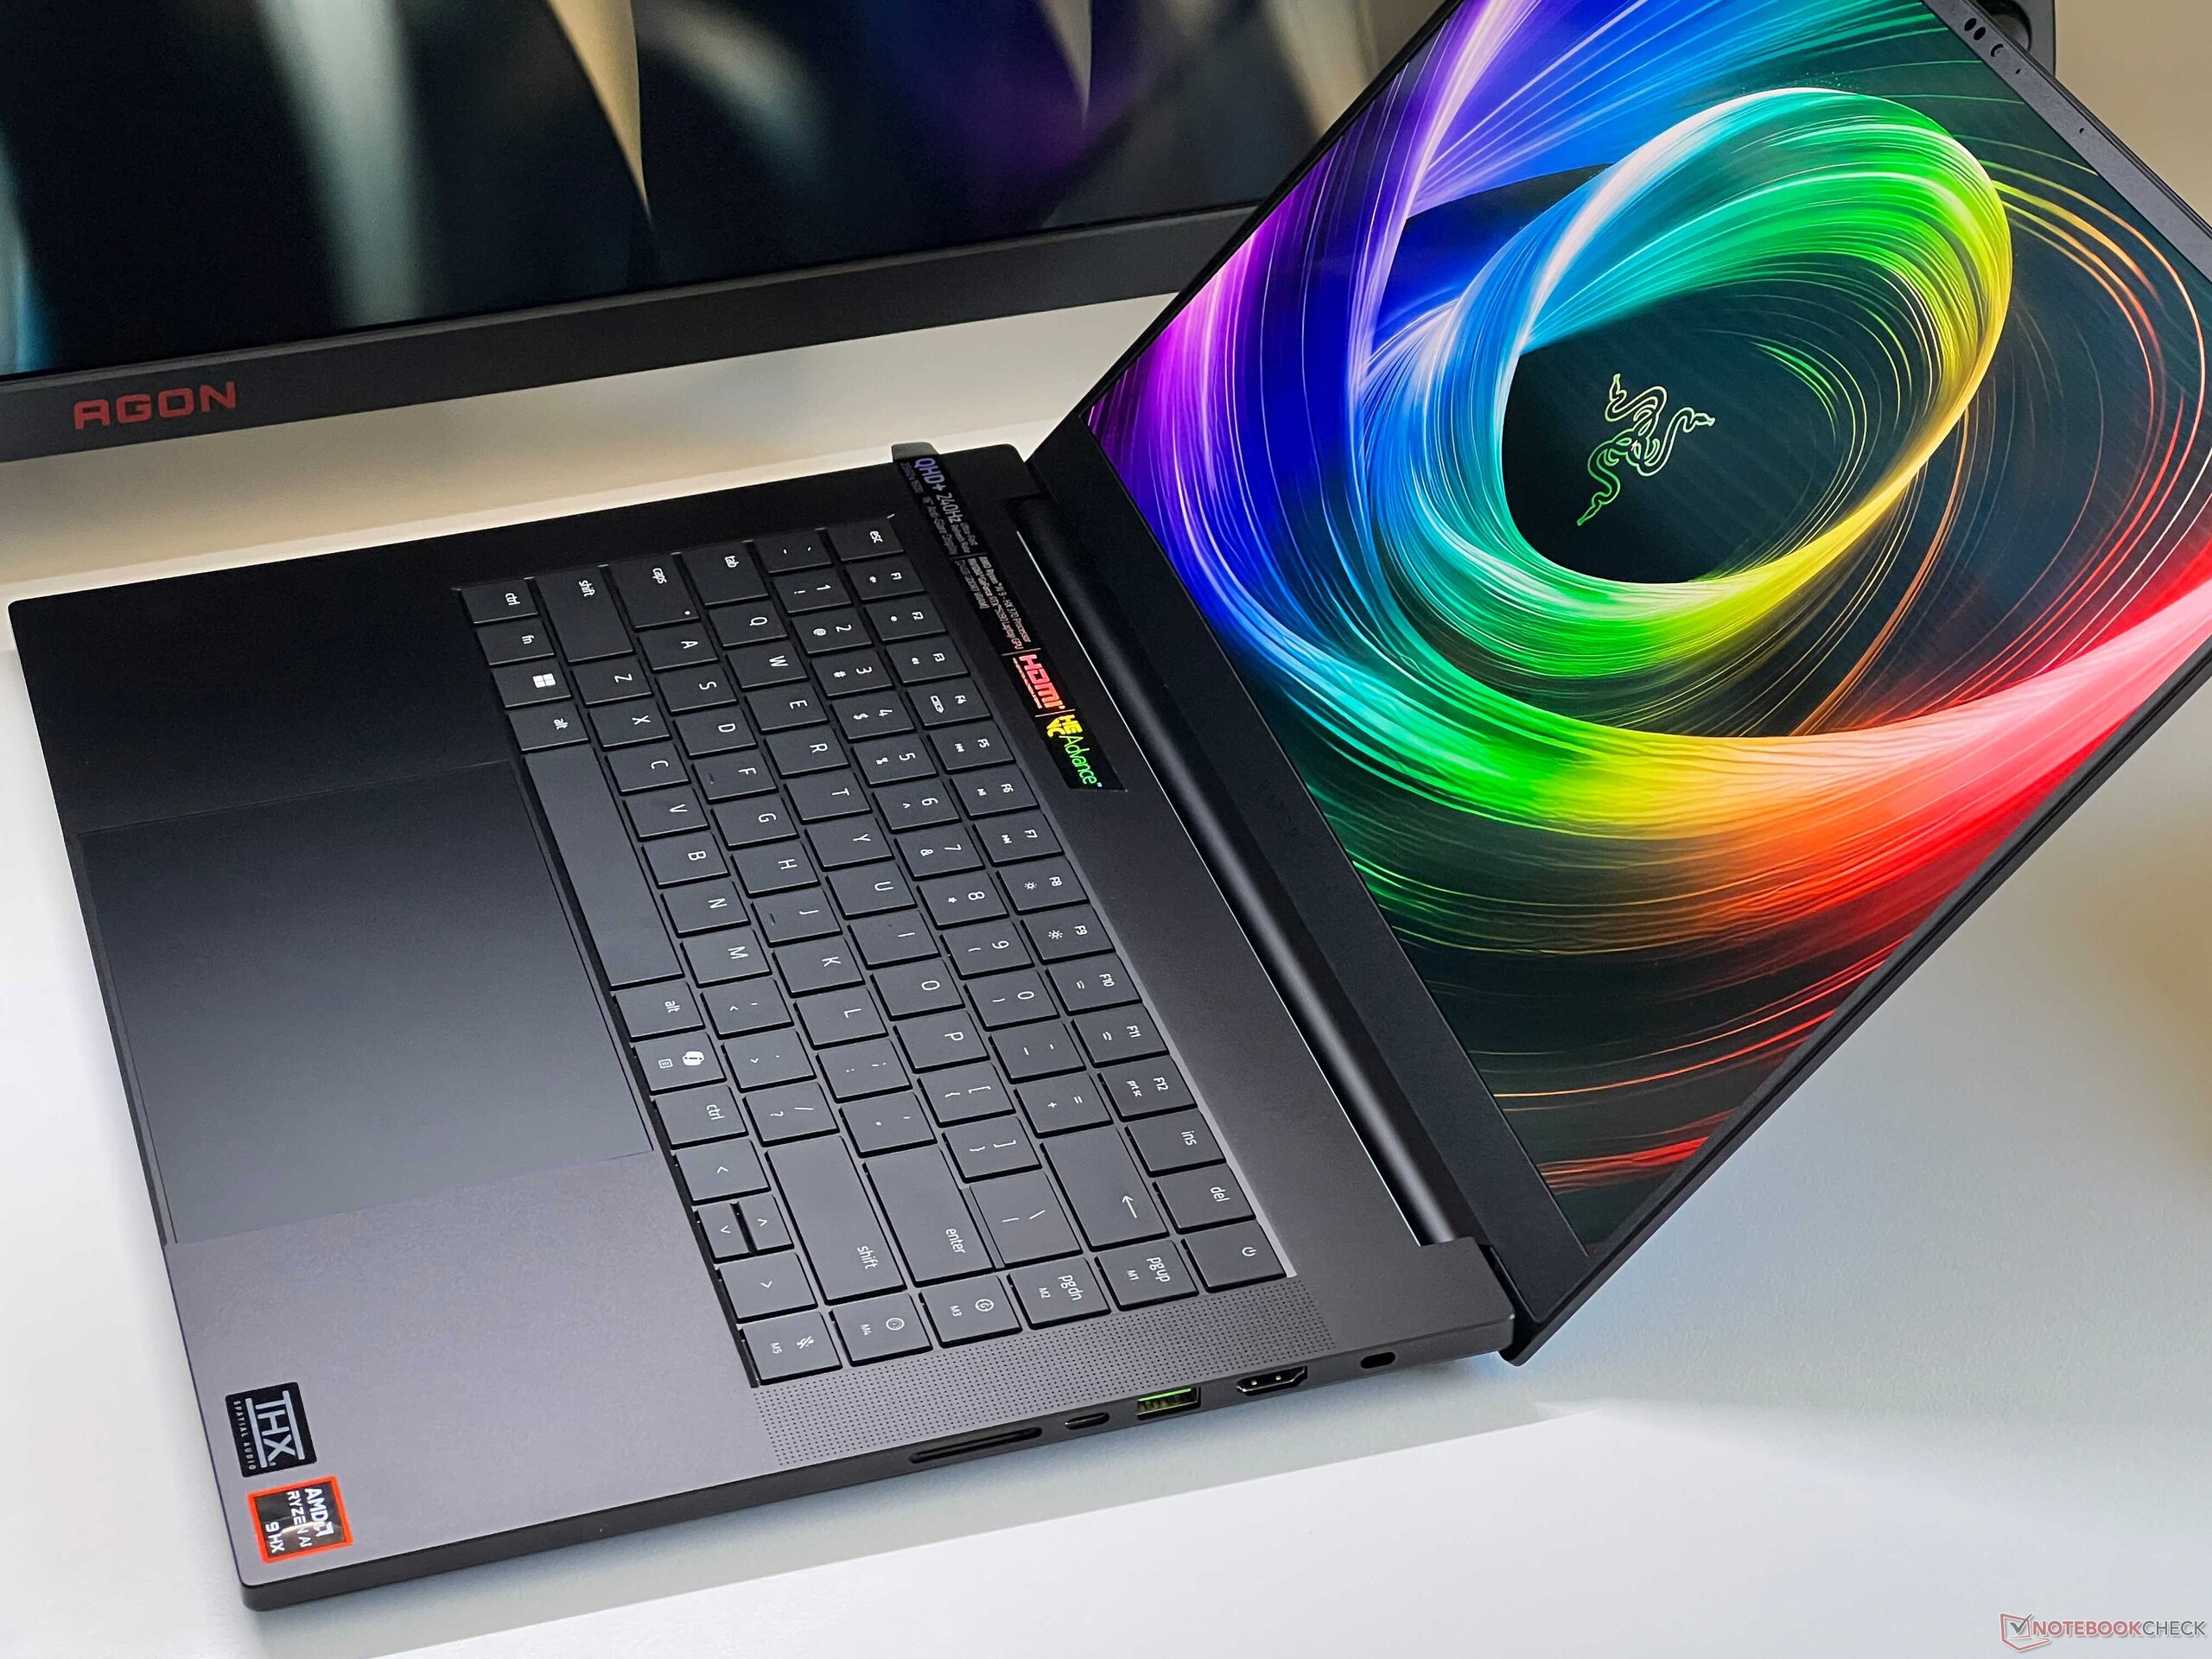
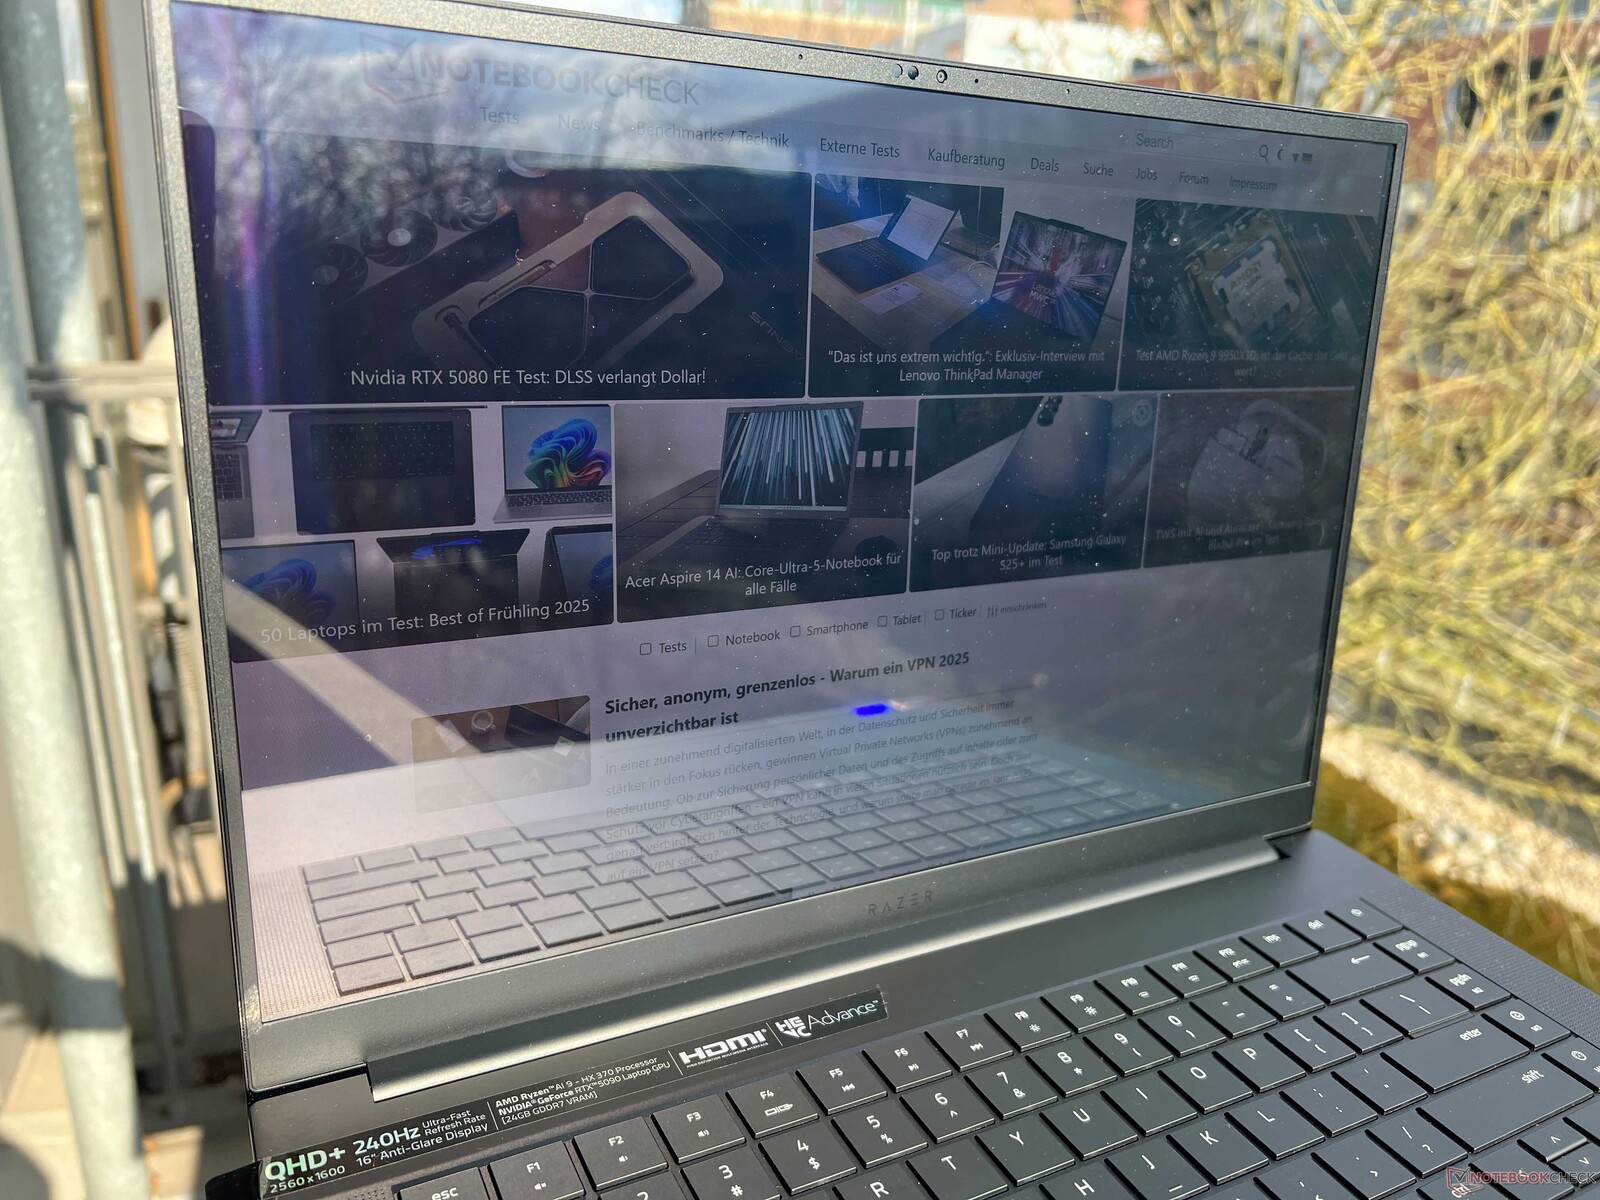
外壳 - Blade 16 现在明显更薄
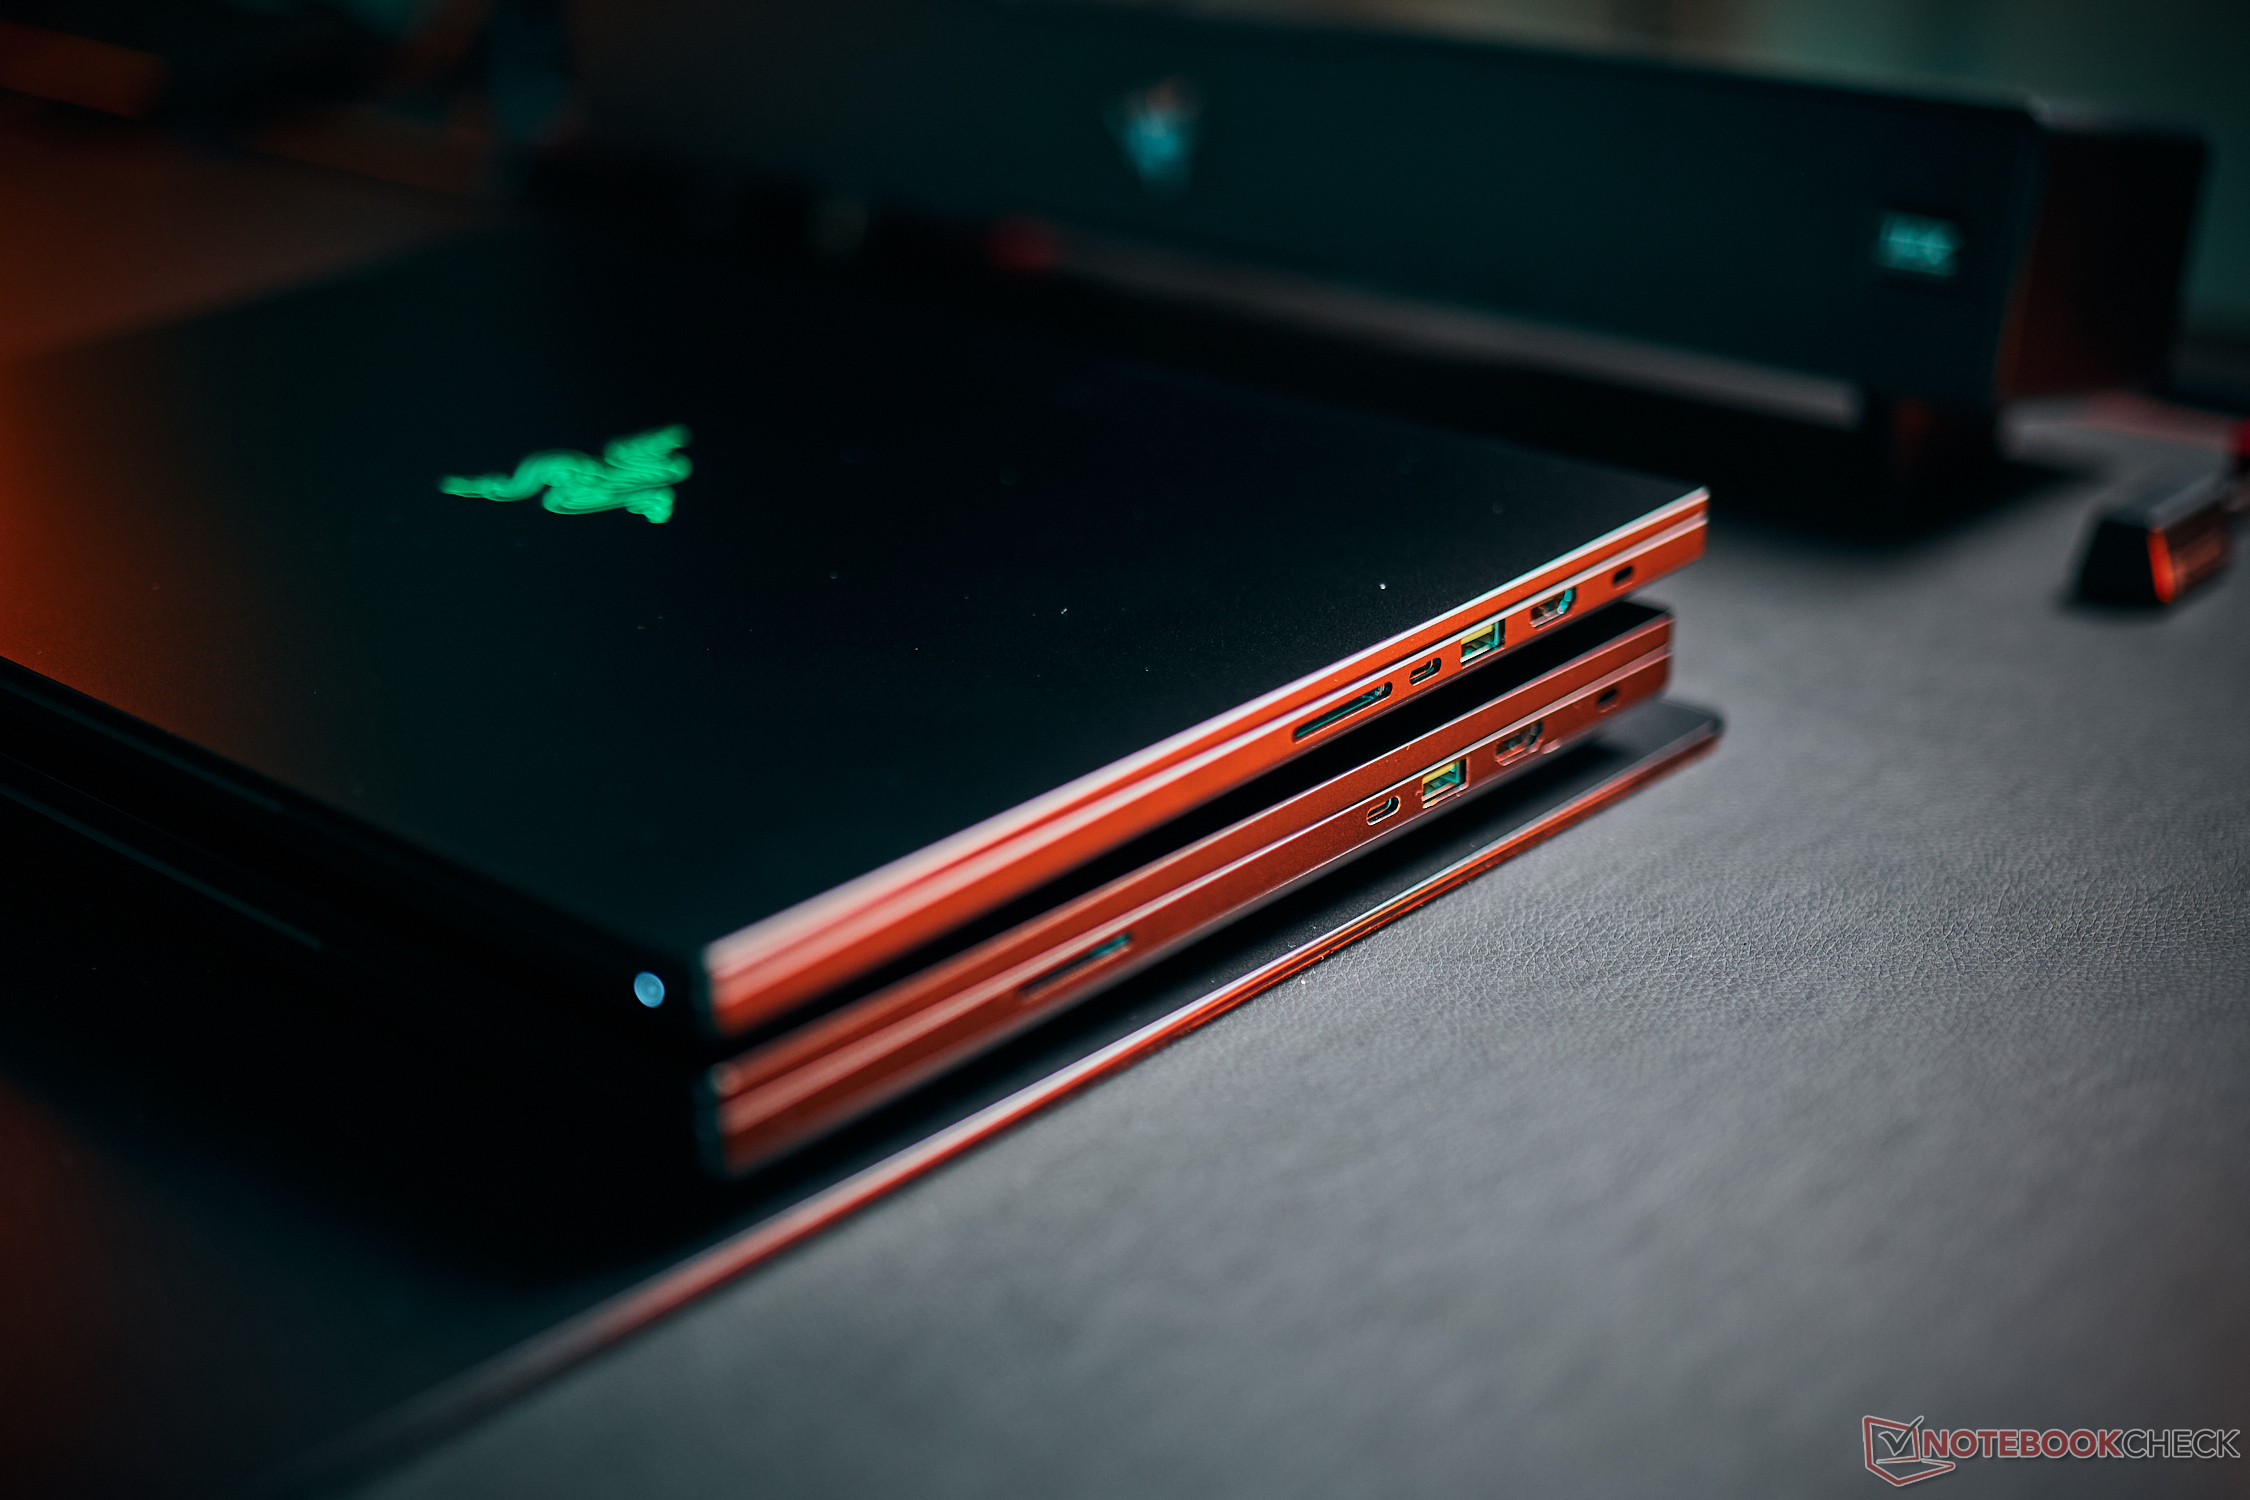
新款 Razer Blade 16 薄了 30% 以上(14.9 - 17.4 毫米,0.587 - 0.685 英寸),但基本设计没有改变。依然是黑色铝制外壳(一体式机身设计),具有很高的稳定性。底座无法翘起,键盘也只能通过用力才能将中央区域压得很小。尽管盖子很薄,但仍然非常坚固,铰链的调整也非常到位。在任何角度(最大 135 度)下,盖子都能牢牢固定,移动后也只有轻微的晃动。在这方面,Blade 16 与华硕 ROG Zephyrus G16 相比优势明显。它的做工非常出色,给人一种品质极高的感觉。
雷蛇仍然没有采用大量带照明的设计元素。除了键盘外,只有盖子上的 Razer 徽标会发光(可以关闭)。Blade 16 的用户必须做好定期清洁笔记本电脑的准备,因为其黑色表面是真正的指纹磁铁。不过大多数时候还是很容易清洁的。
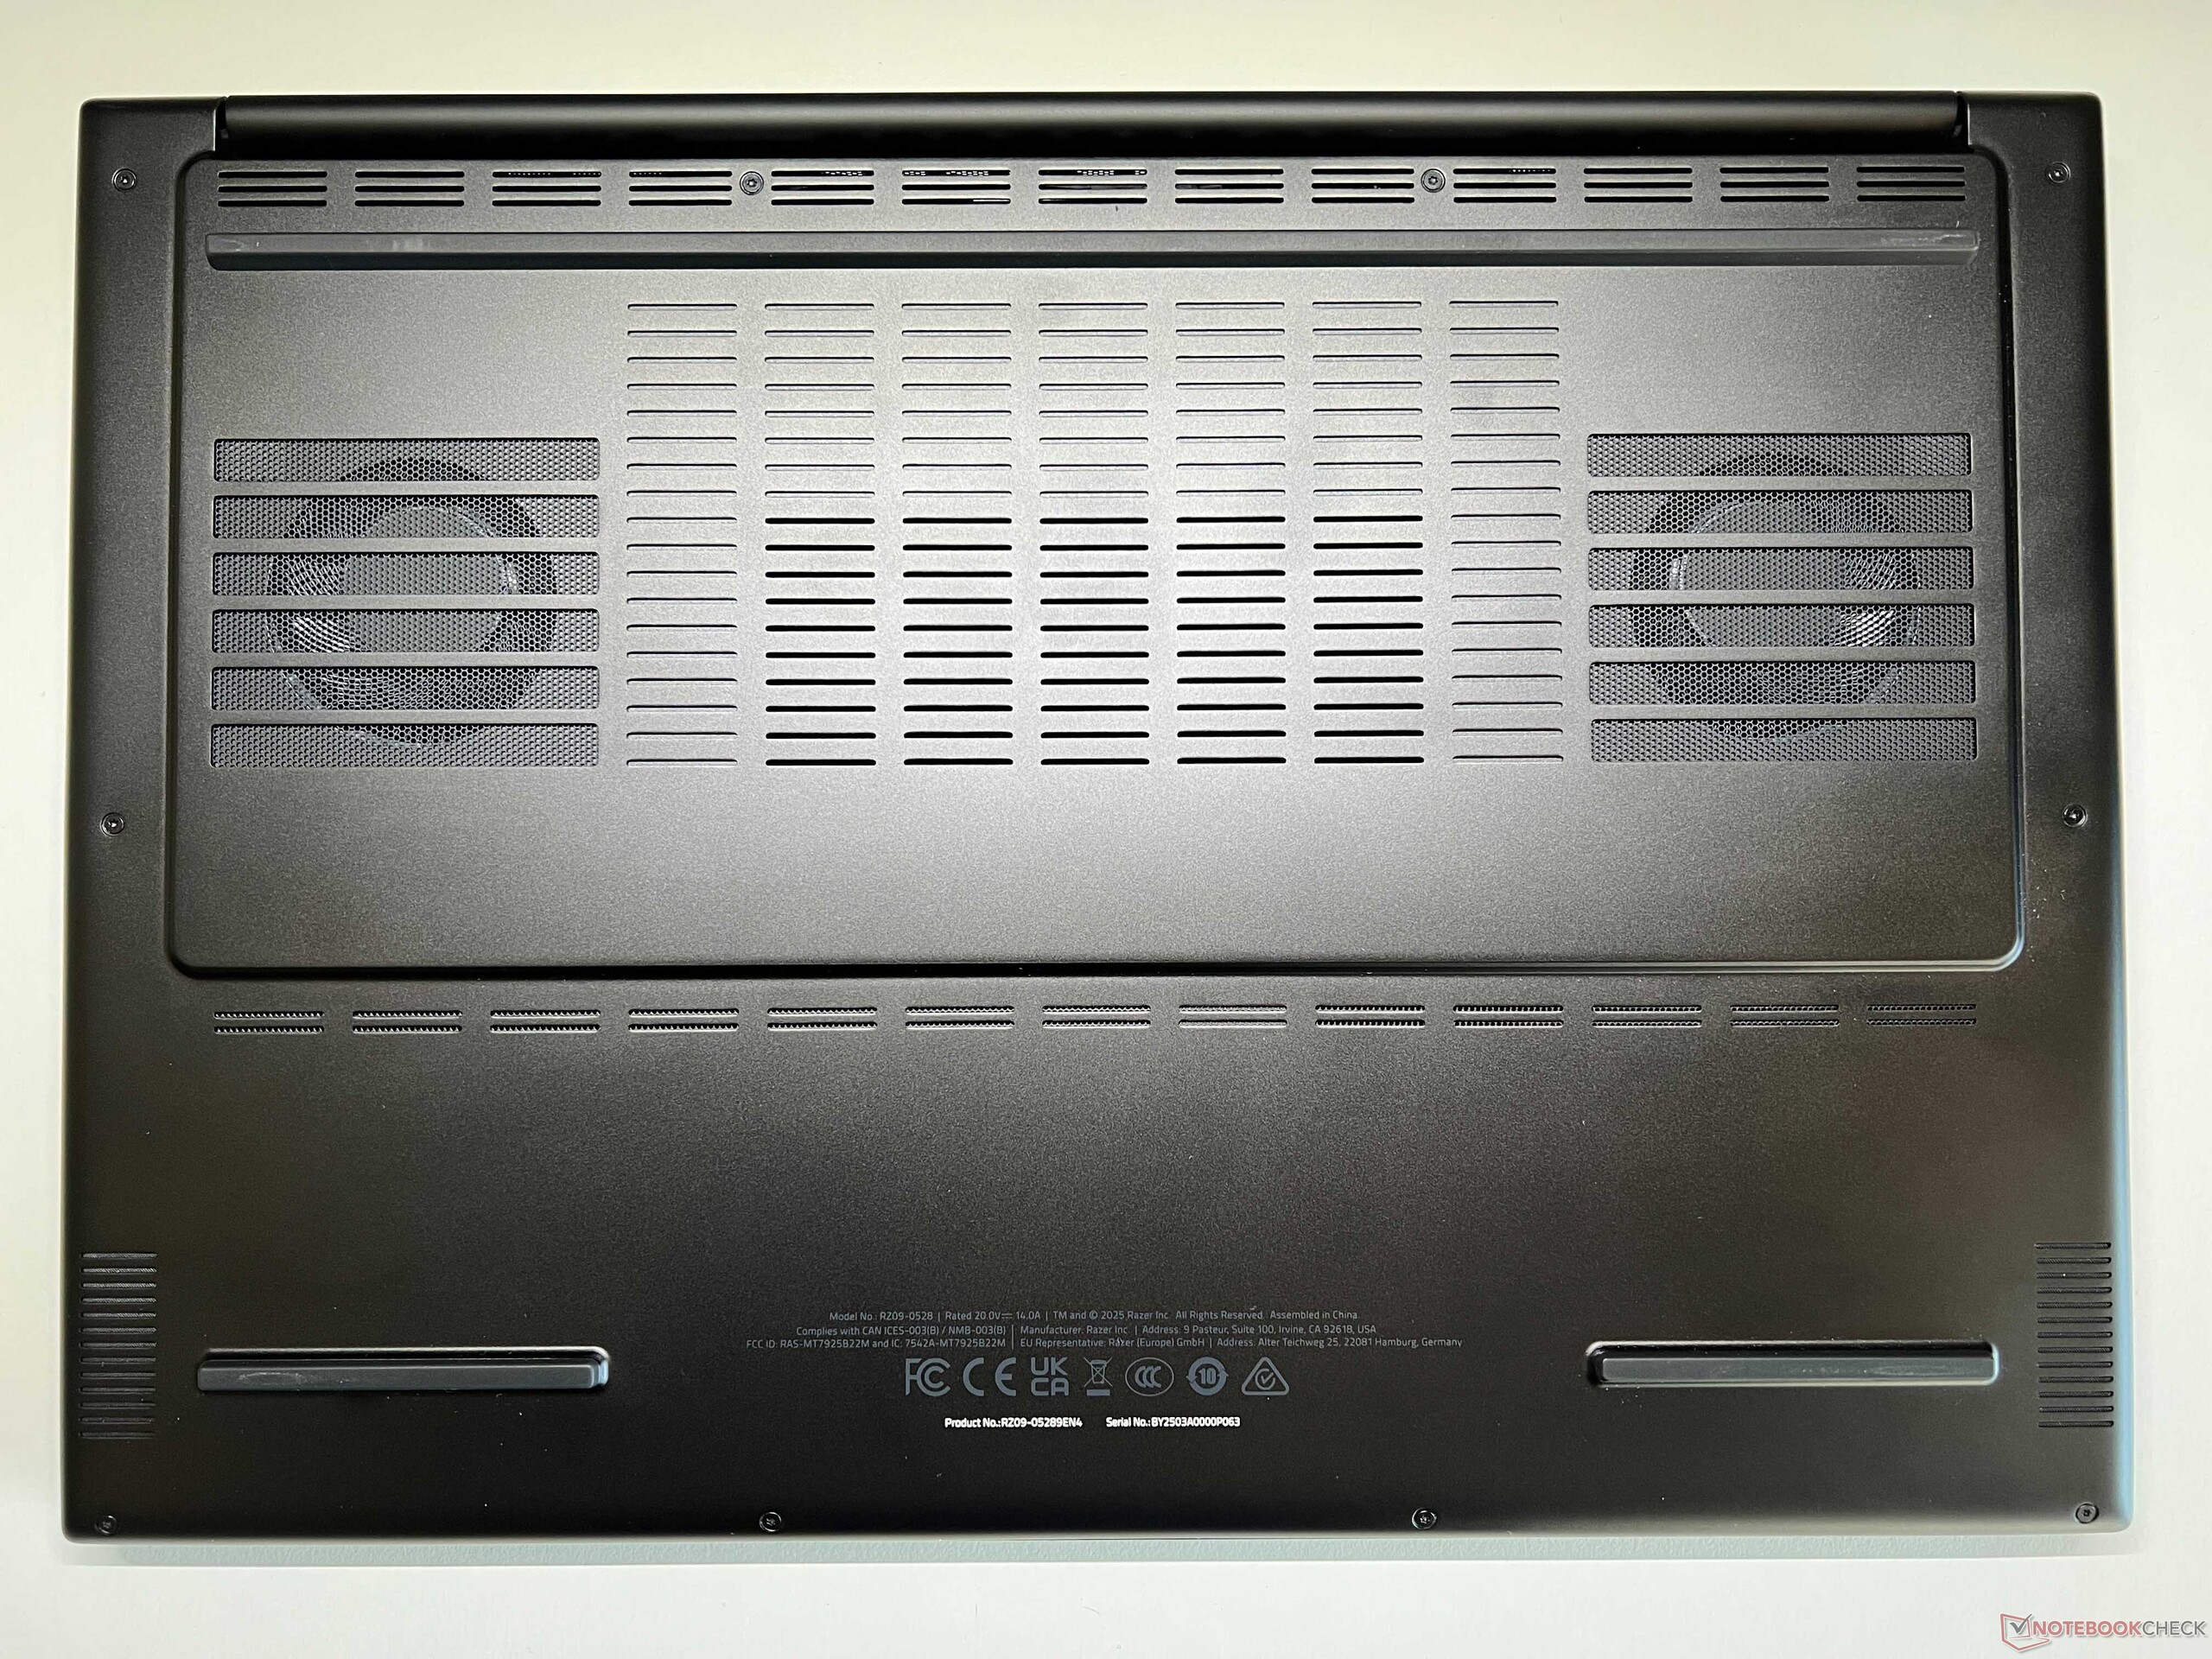
底部有一块区域被抬高,为散热提供了更多空间。但这在日常操作中并不明显,而且高度差也不像ThinkPad X9 15 那样明显。


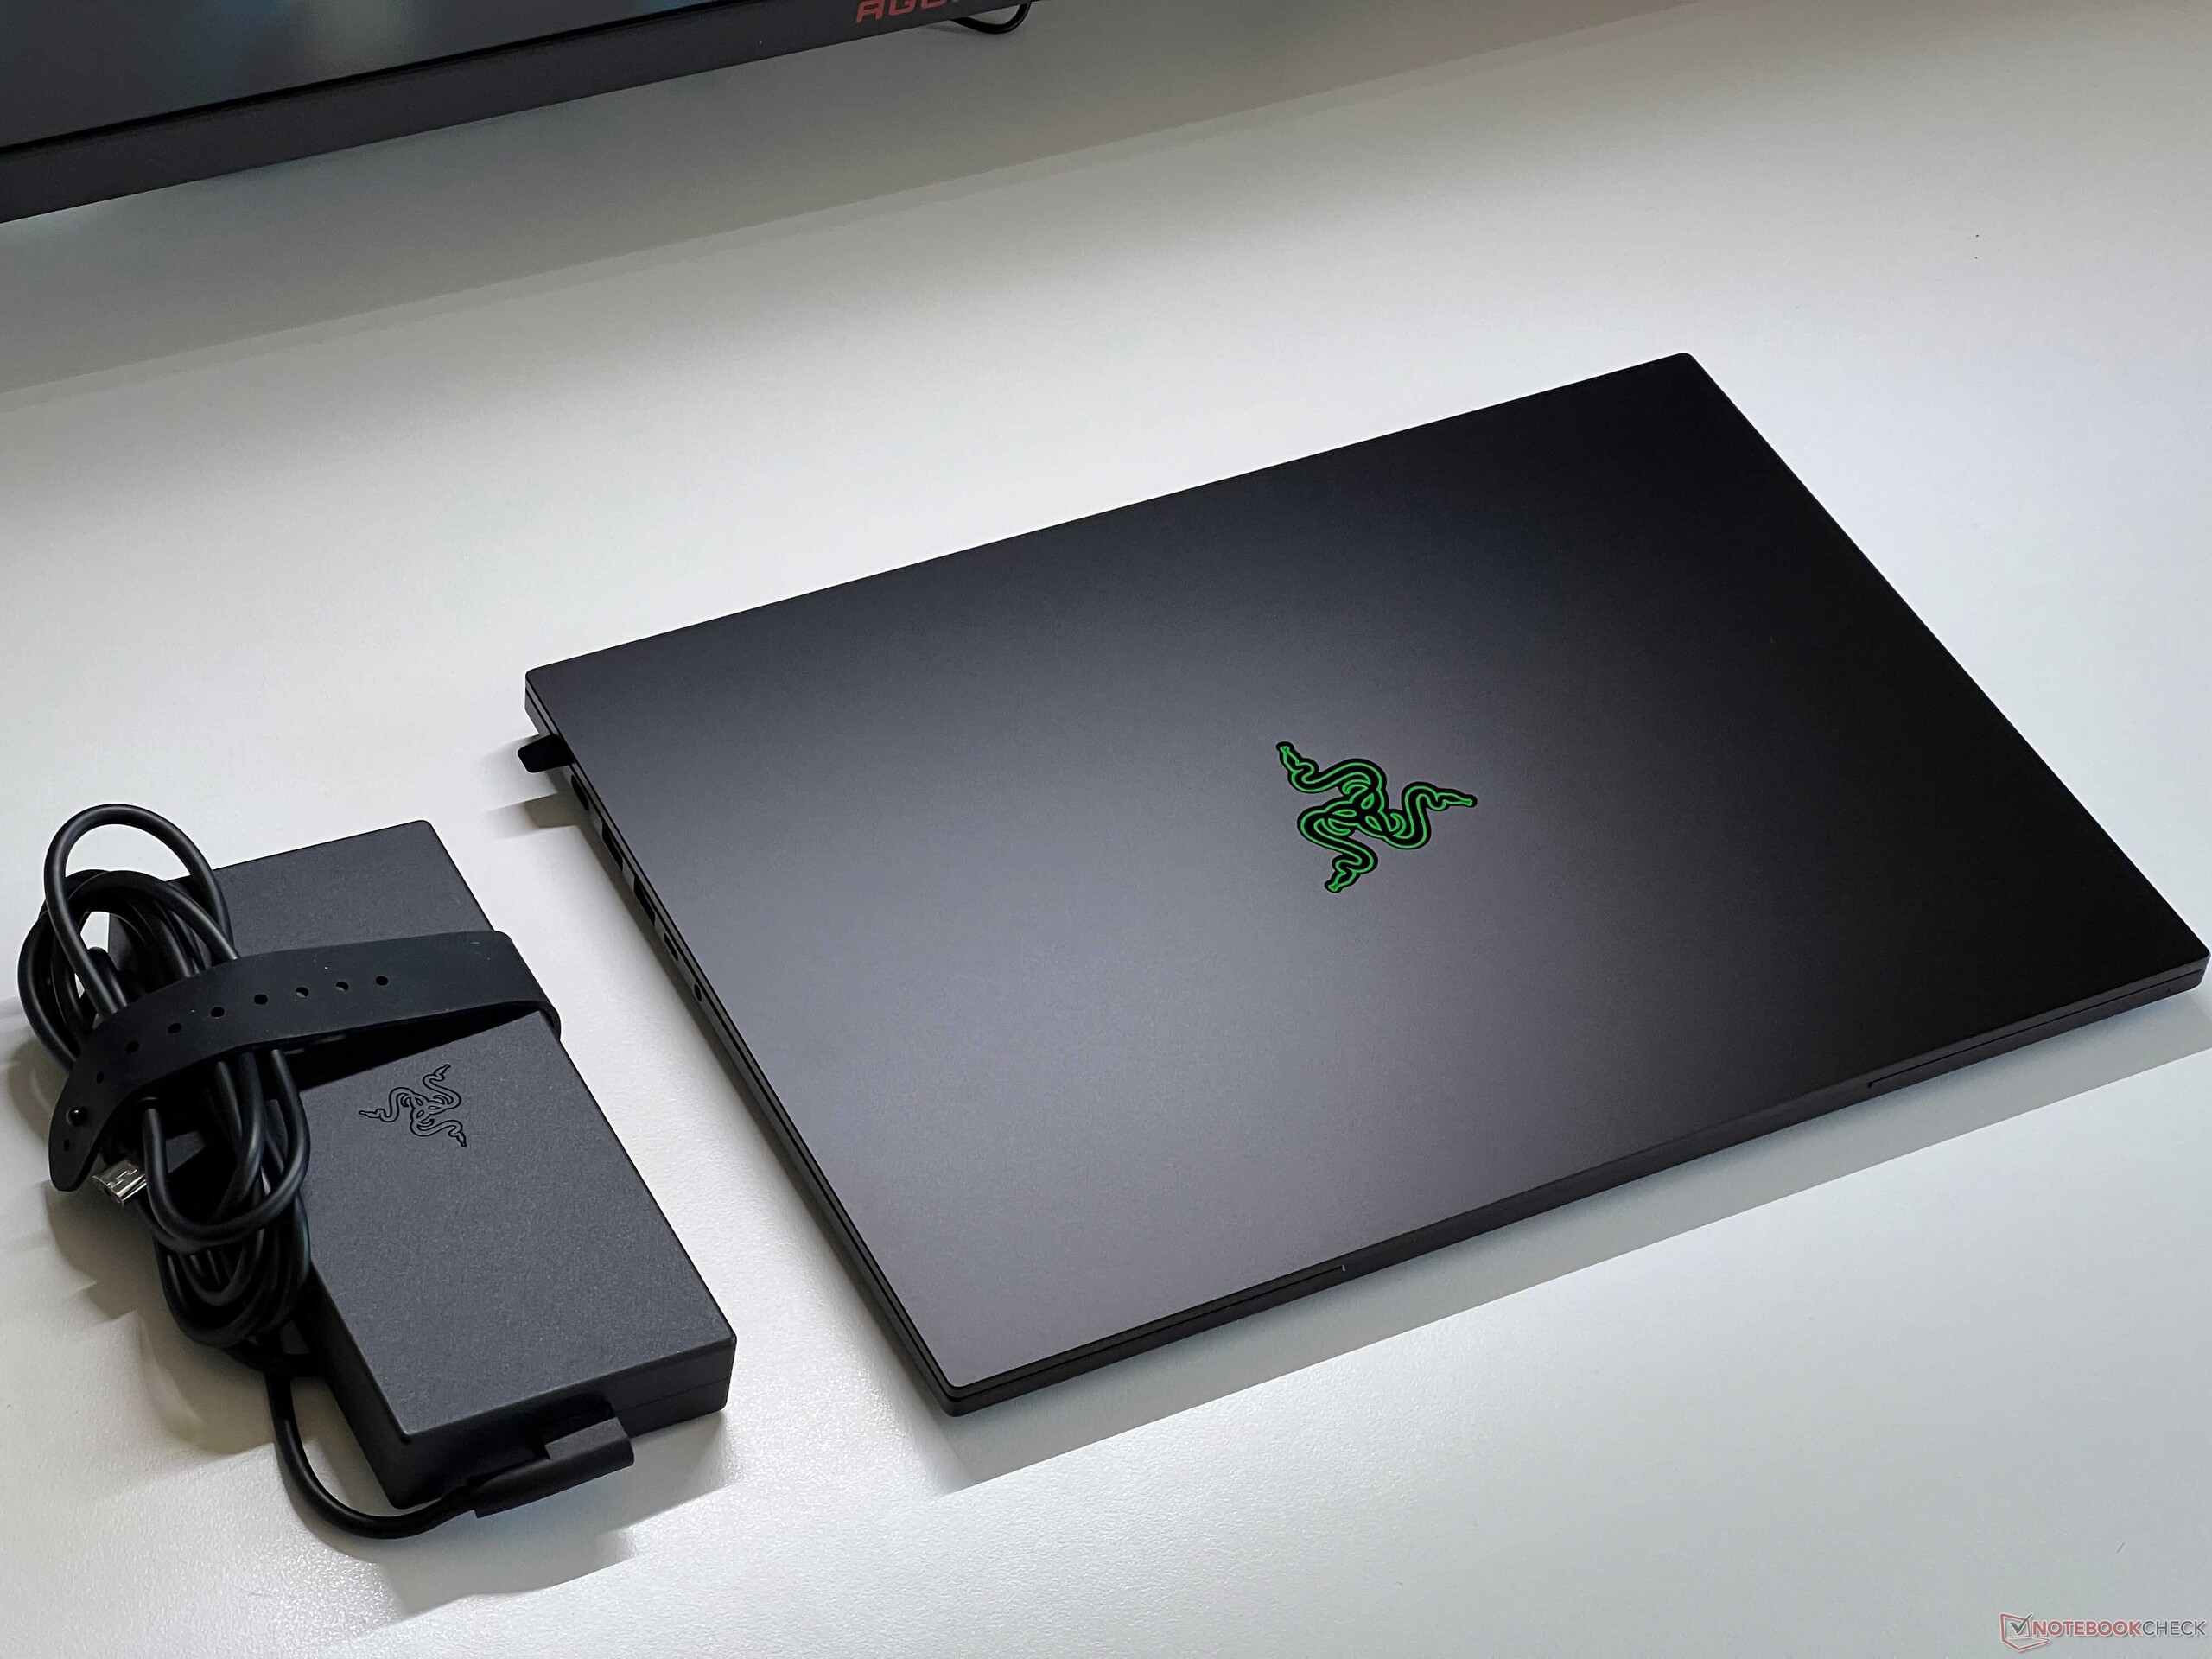

在尺寸对比中,Blade 16、ROG Zephyrus G16 以及 MacBook Pro 16几乎完全相同,而其他游戏笔记本电脑的体积则明显更大。2.1 千克(约 4.6 磅)的重量也与 MacBook 相当,但 Zephyrus G16 轻了近 200 克(约 7 盎司)。280 瓦充电器的重量为 795 克(约 28 盎司)。
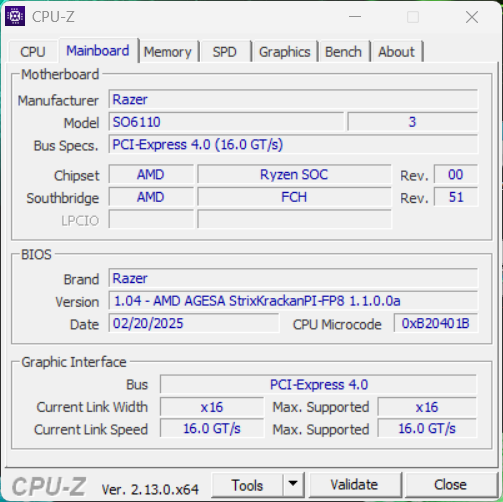
设备 - USB 4 和 Wi-Fi 7
Blade 16 继续提供所有重要的连接。不过,它放弃了 Thunderbolt 4,只能通过 USB-C 适配器获得一个以太网端口。两个 USB-C 4.0 端口通过 iGPU 连接,因此当你添加外接显示器时,GeForce GPU 并不总是需要运行(HDMI 通过 dGPU 连接)。Blade 16 是一款 Copilot+ 笔记本电脑。


SD 读卡器
读卡器位于右侧。在结合我们的参考卡(Angelbird AV Pro V60)复制图像文件时,传输速率最高可达 193 MB/s,最低为 133 MB/s。插入的卡会伸出机壳约 1 厘米(约 0.4 英寸)。
| SD Card Reader | |
| average JPG Copy Test (av. of 3 runs) | |
| Razer Blade 16 2024, RTX 4090 | |
| Alienware x16 R2 P120F (AV PRO microSD 128 GB V60) | |
| Apple MacBook Pro 16 2024 M4 Pro (Angelbird AV Pro V60) | |
| Razer Blade 16 2025 RTX 5090 (Angelbird AV Pro V60) | |
| Average of class Gaming (19 - 197.3, n=68, last 2 years) | |
| Asus ROG Zephyrus G16 GU605MY | |
| SCHENKER XMG Neo 16 (Early 24) (AV PRO microSD 128 GB V60) | |
| Lenovo Legion 9 16IRX9, RTX 4090 | |
| maximum AS SSD Seq Read Test (1GB) | |
| Alienware x16 R2 P120F (AV PRO microSD 128 GB V60) | |
| Apple MacBook Pro 16 2024 M4 Pro (Angelbird AV Pro V60) | |
| Razer Blade 16 2025 RTX 5090 (Angelbird AV Pro V60) | |
| Razer Blade 16 2024, RTX 4090 | |
| Average of class Gaming (25.8 - 263, n=67, last 2 years) | |
| Asus ROG Zephyrus G16 GU605MY | |
| Lenovo Legion 9 16IRX9, RTX 4090 | |
| SCHENKER XMG Neo 16 (Early 24) (AV PRO microSD 128 GB V60) | |
交流
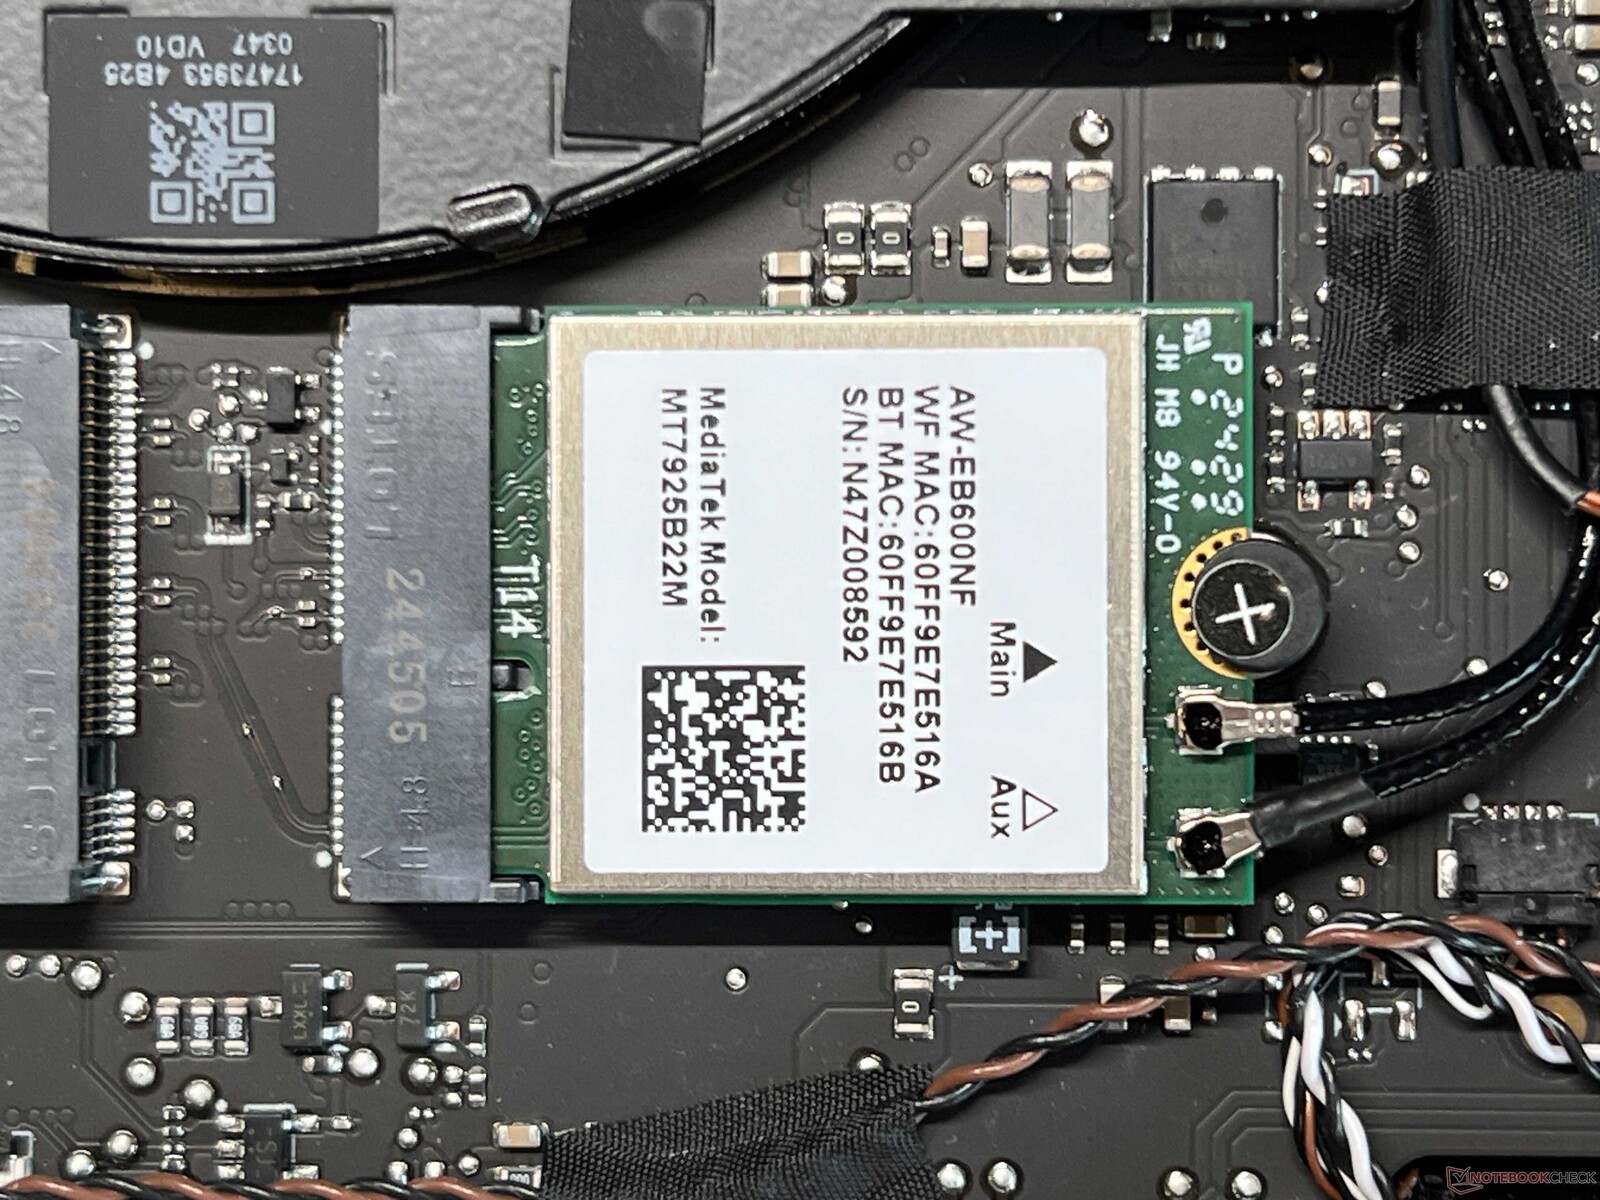
AMD Blade 16 配备了联发科技(MediaTek)的无线局域网模块(MT7925)。除了目前的 Wi-Fi-7 标准外,它还支持蓝牙 5.4。与华硕路由器配合使用,传输速率非常好且稳定。在测试过程中,我们没有遇到任何信号质量问题。
| Networking | |
| Razer Blade 16 2025 RTX 5090 | |
| iperf3 transmit AXE11000 | |
| iperf3 receive AXE11000 | |
| SCHENKER XMG Neo 16 (Early 24) | |
| iperf3 transmit AXE11000 | |
| iperf3 receive AXE11000 | |
| Alienware x16 R2 P120F | |
| iperf3 transmit AXE11000 | |
| iperf3 receive AXE11000 | |
| iperf3 transmit AXE11000 6GHz | |
| iperf3 receive AXE11000 6GHz | |
| Lenovo Legion 9 16IRX9, RTX 4090 | |
| iperf3 transmit AXE11000 | |
| iperf3 receive AXE11000 | |
| iperf3 transmit AXE11000 6GHz | |
| iperf3 receive AXE11000 6GHz | |
| Asus ROG Zephyrus G16 GU605MY | |
| iperf3 transmit AXE11000 | |
| iperf3 receive AXE11000 | |
| Razer Blade 16 2024, RTX 4090 | |
| iperf3 transmit AXE11000 | |
| iperf3 receive AXE11000 | |
| iperf3 transmit AXE11000 6GHz | |
| iperf3 receive AXE11000 6GHz | |
| Apple MacBook Pro 16 2024 M4 Pro | |
| iperf3 transmit AXE11000 | |
| iperf3 receive AXE11000 | |
网络摄像头
1080p 网络摄像头支持 Windows 的工作室特效,但不提供机械镜头盖。虽然图像质量不是特别好,但网络摄像头还是能胜任工作。此外,还有一个红外模块,可通过 Windows Hello 进行人脸识别。


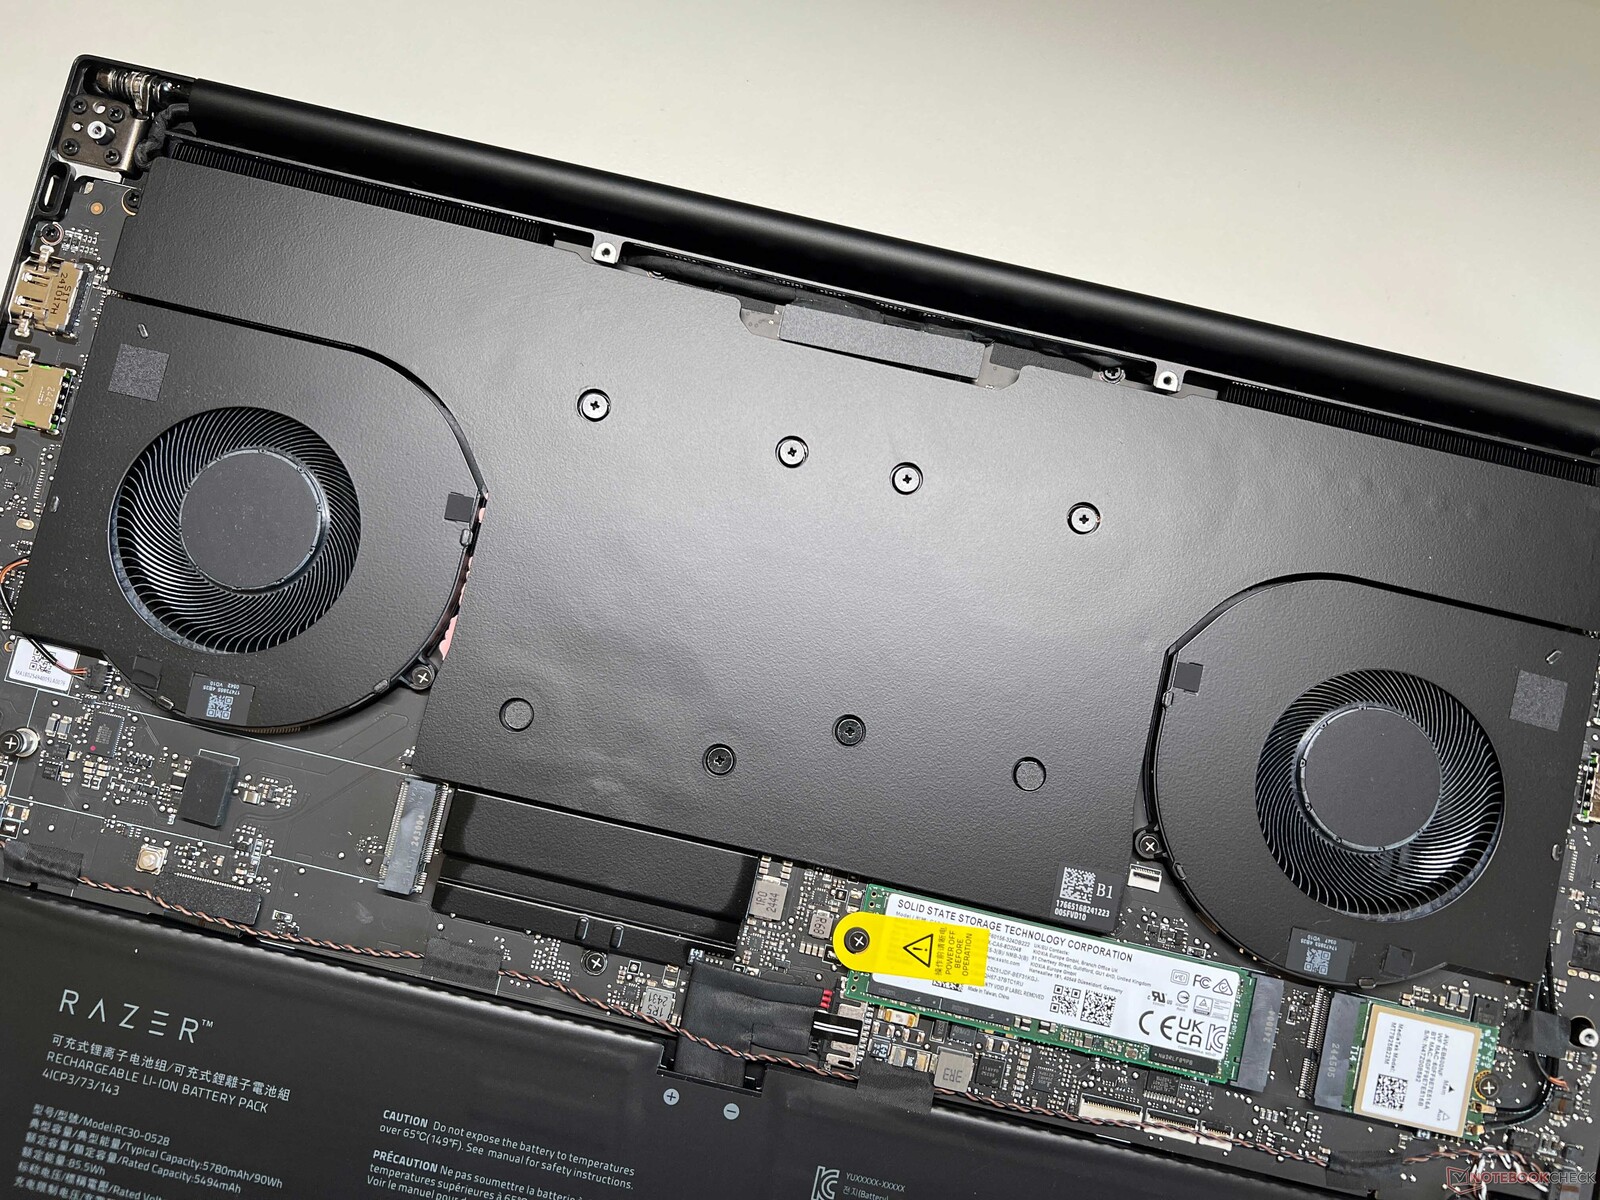
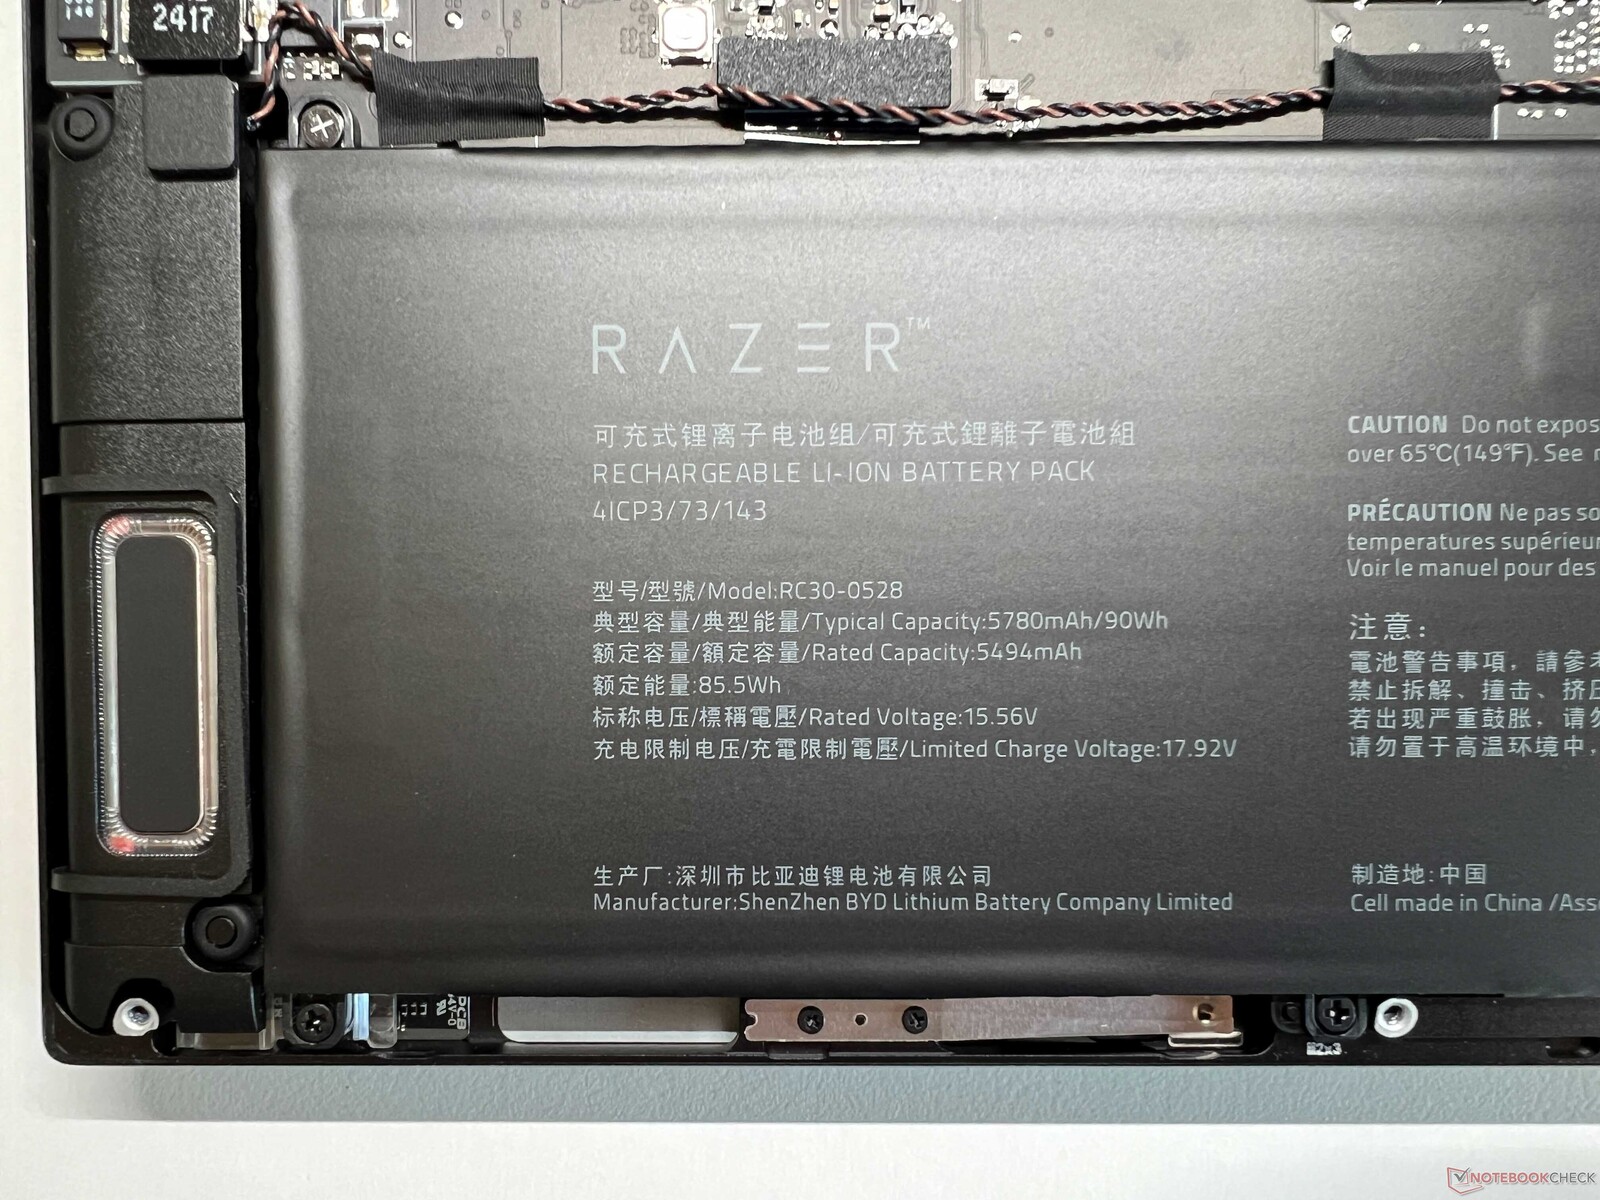
维护
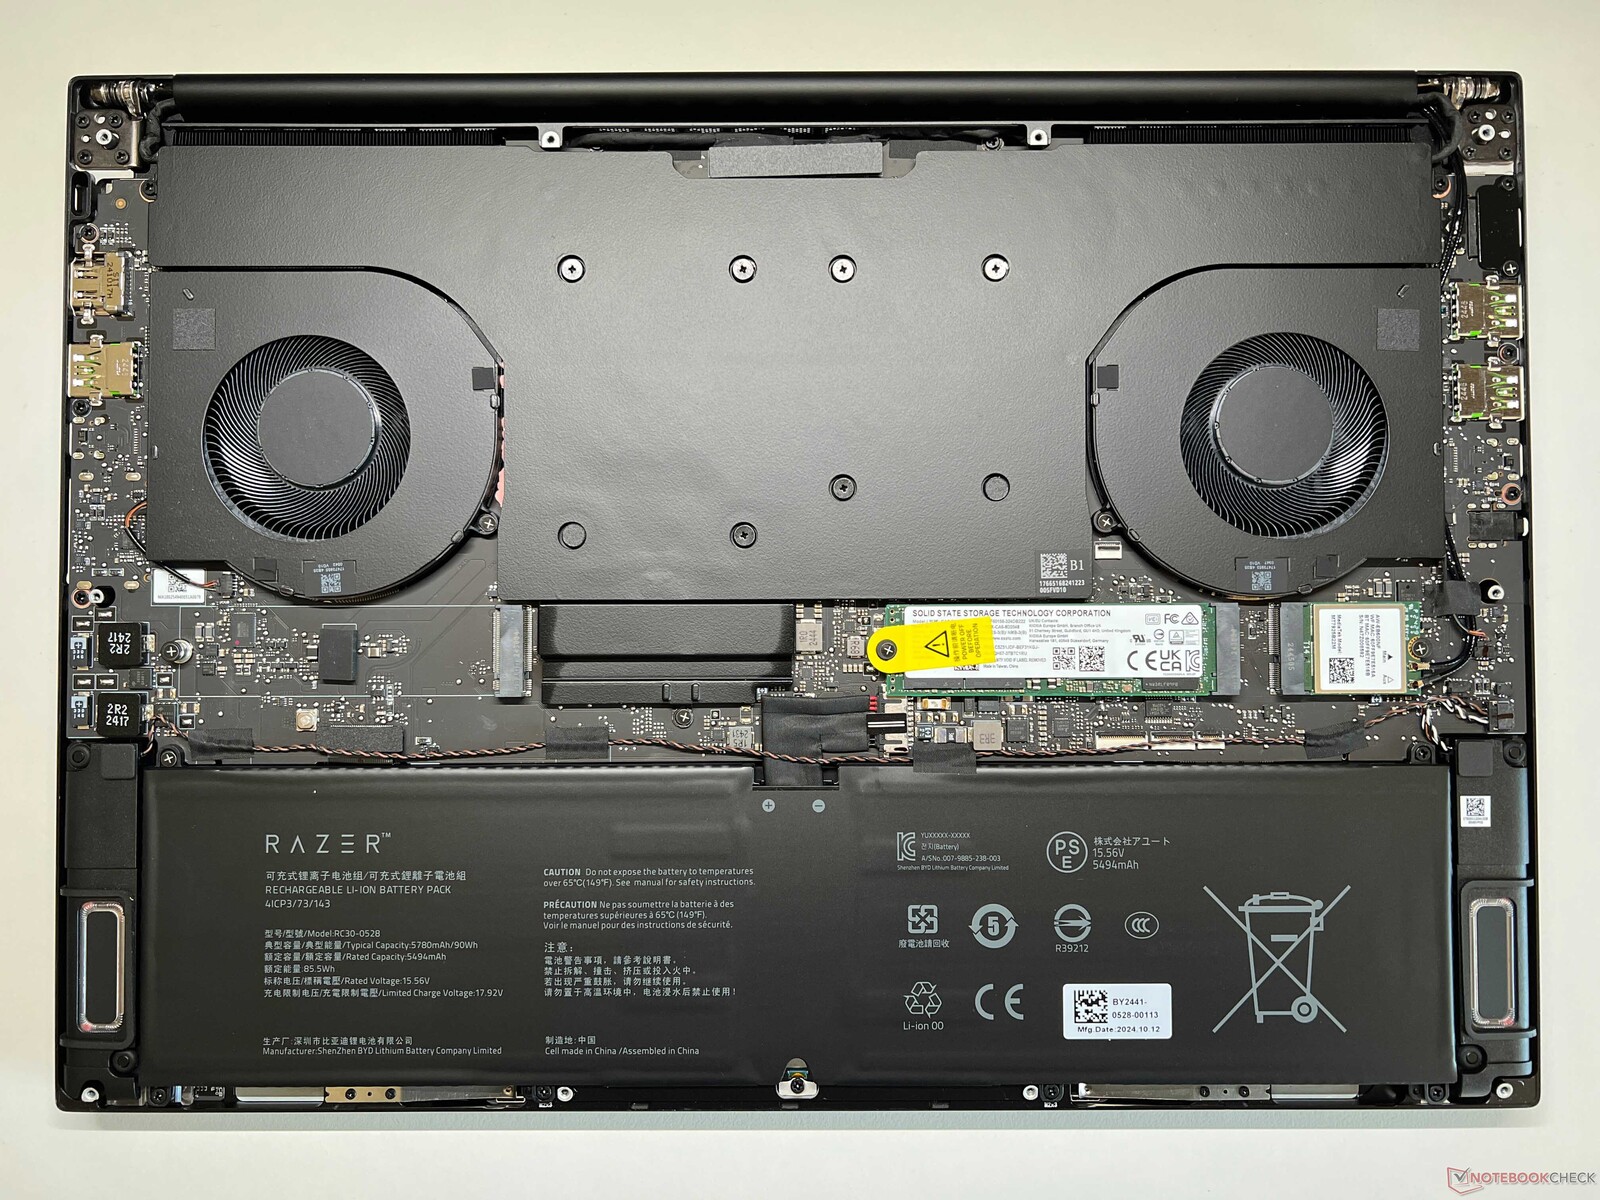
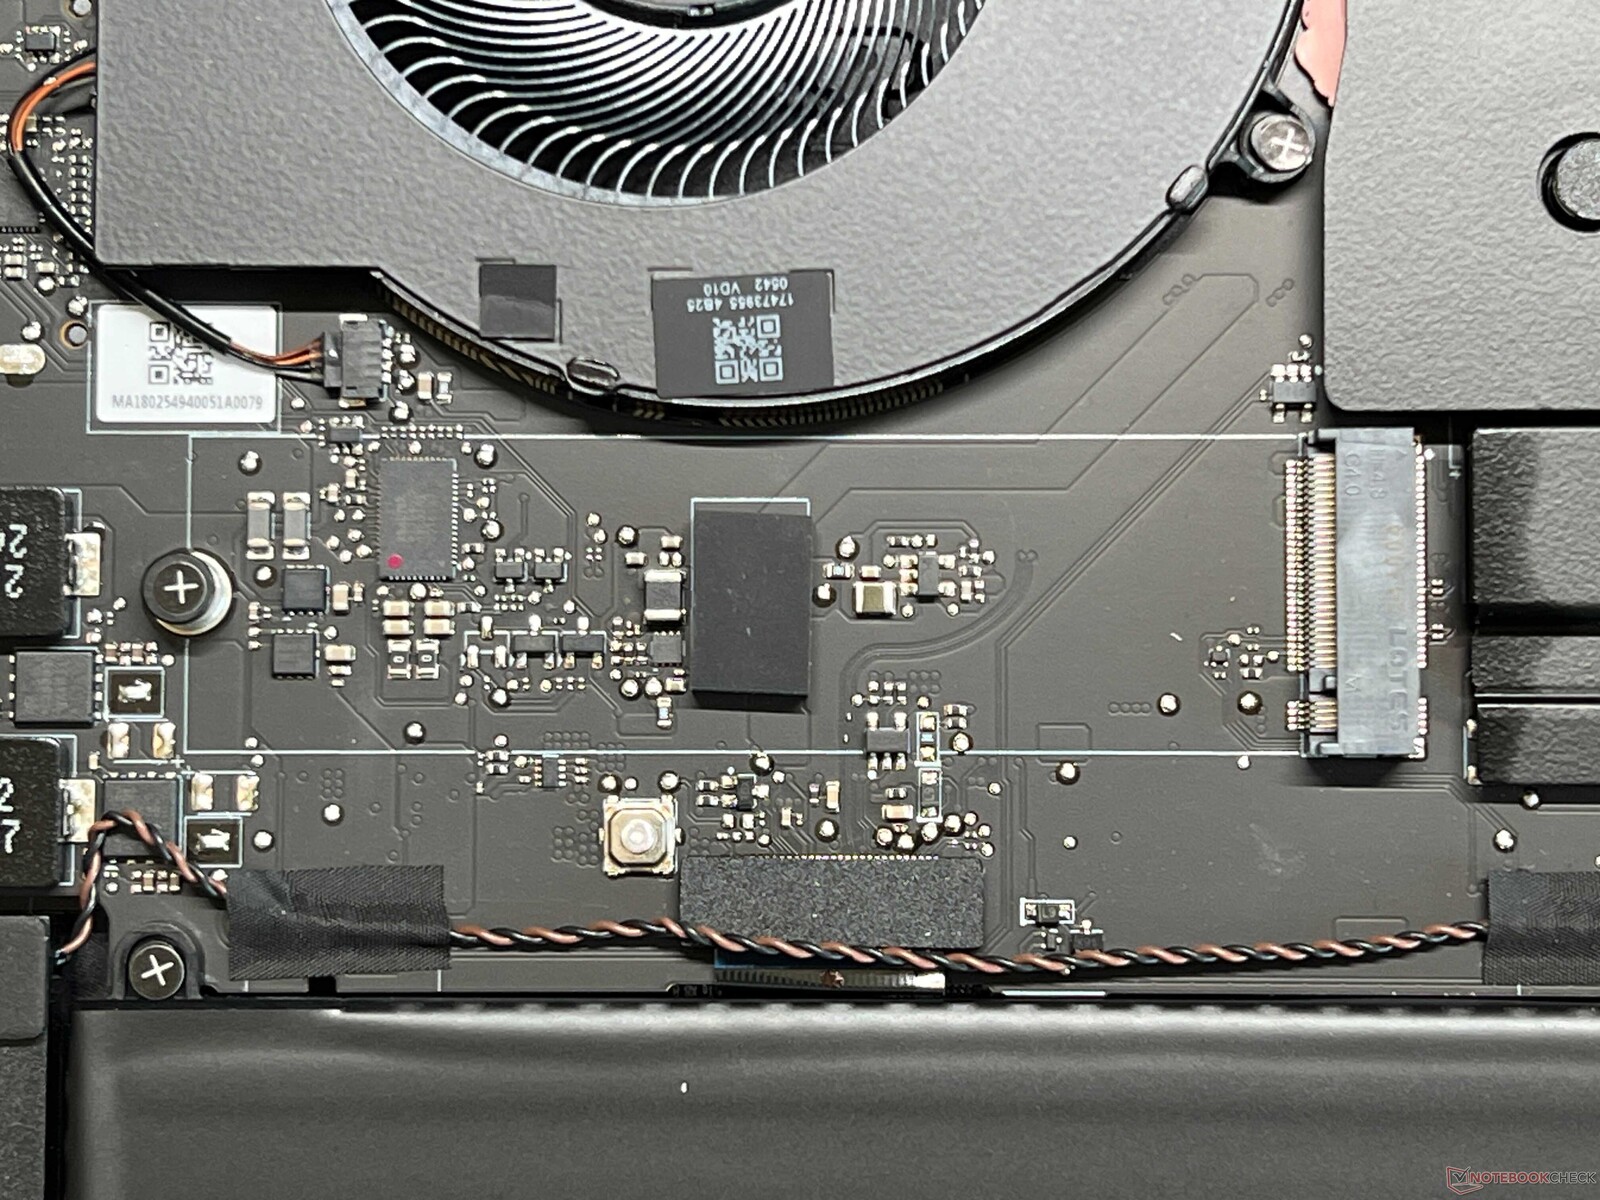
机箱底盖仅用几颗螺丝固定,可以顺利拆卸。机身内部与旧款相比有一些很大的不同 旧款机箱内有一个巨大的蒸汽腔和电池(旋入式),现在主要是散热装置。此外,还有两个用于 M.2-2280 固态硬盘的插槽,如果需要,还可以更换 WLAN 模块。不过,内存是焊接的。

可持续性
Razer 没有提供有关 Blade 16 可持续发展或环保认证的任何信息。
输入设备 - 刀片 16 现在的按键行程为 1.5 毫米
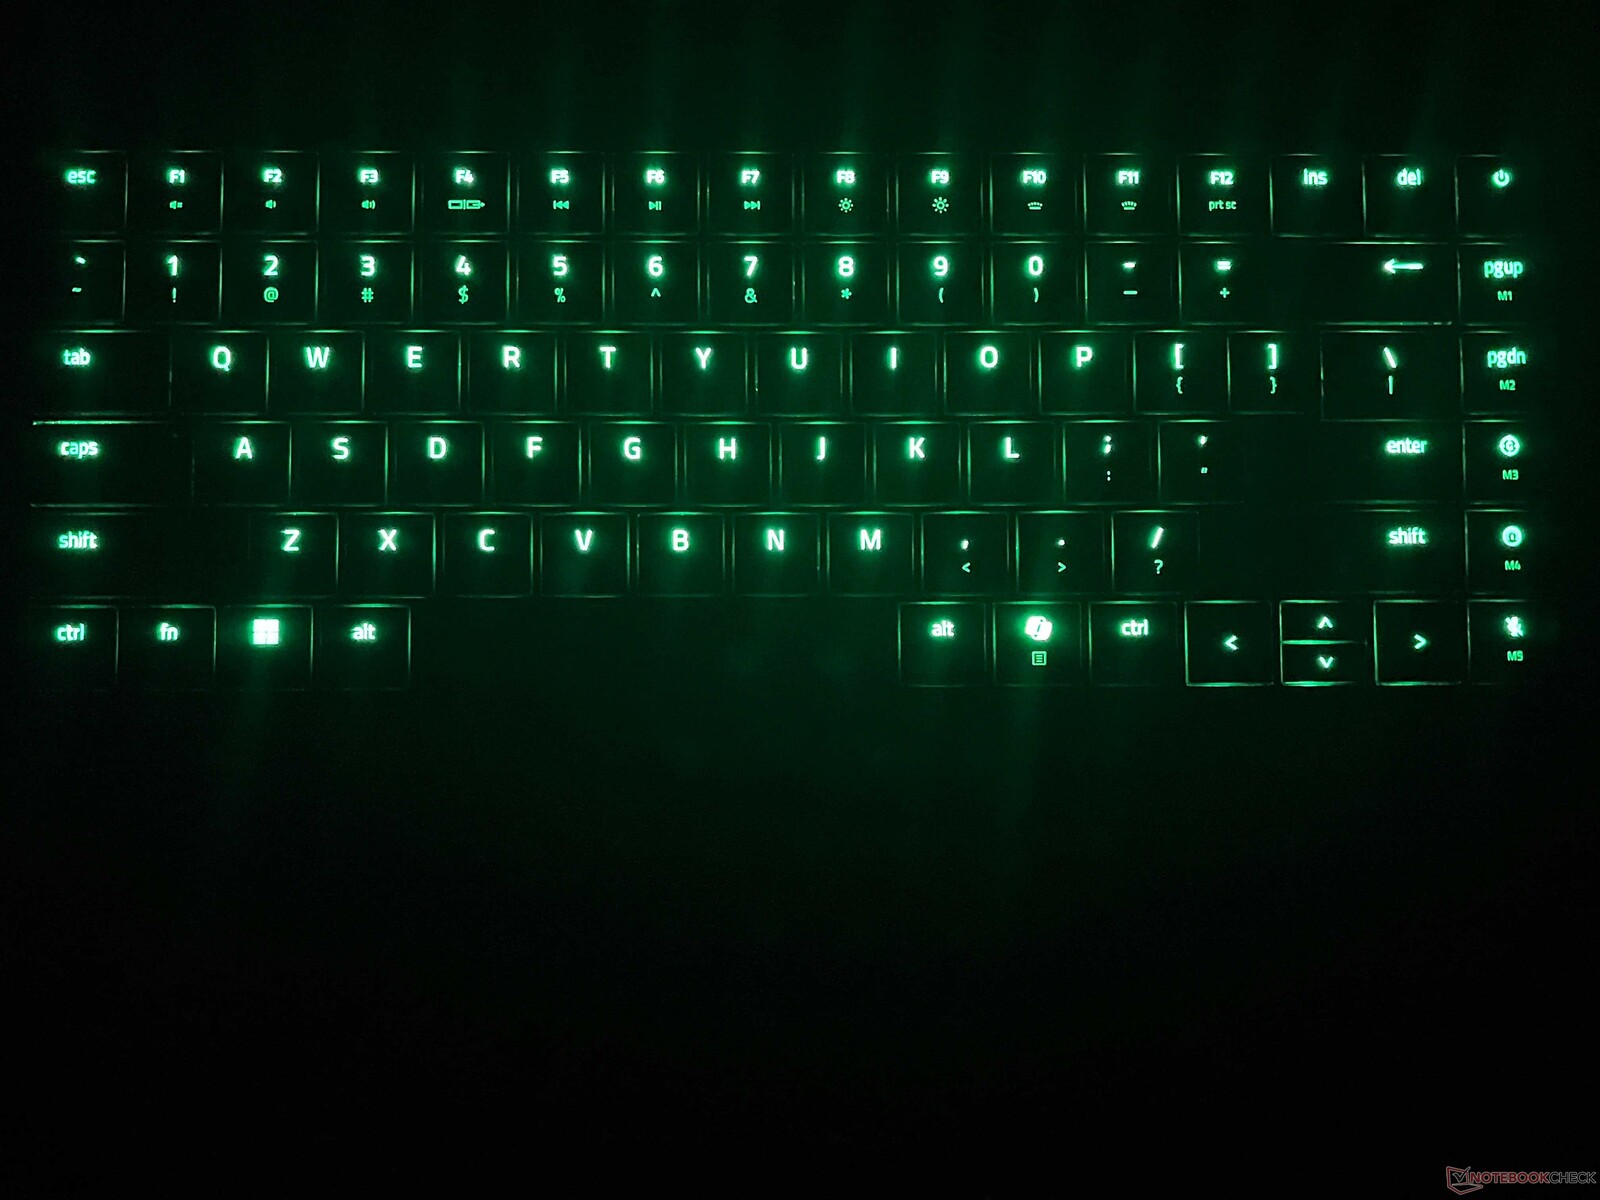
老式键盘 刀锋 16的键盘是许多用户争议的焦点。虽然按压点很清晰,但按键行程却很浅,只有 1 毫米(约 0.04 英寸)。在新款 Blade 16 中,雷蛇将键程增加到了 1.5 毫米(约 0.06 英寸),这无疑改善了输入体验。不过,我们仍然不得不说,与其他游戏笔记本电脑相比,打字舒适度只能算一般。纤薄 ROG Zephyrus G16为例,其 1.7 毫米(约 0.07 英寸)键程的键盘要舒适得多。按照惯例,您可以单独更改每个按键的照明度,Razer 还提供了 Chroma 软件,让玩家可以根据具体情况调整照明度。

ClickPad 尺寸为 15 x 9.7 厘米(约 5.9 x 3.8 英寸),非常大,其玻璃表面具有出色的滑动特性。鼠标垫的底部区域可以进行物理点击,并发出均匀、饱满、不连续(因此是高质量)的点击声。
显示屏 - OLED,240 Hz 和 G-Sync
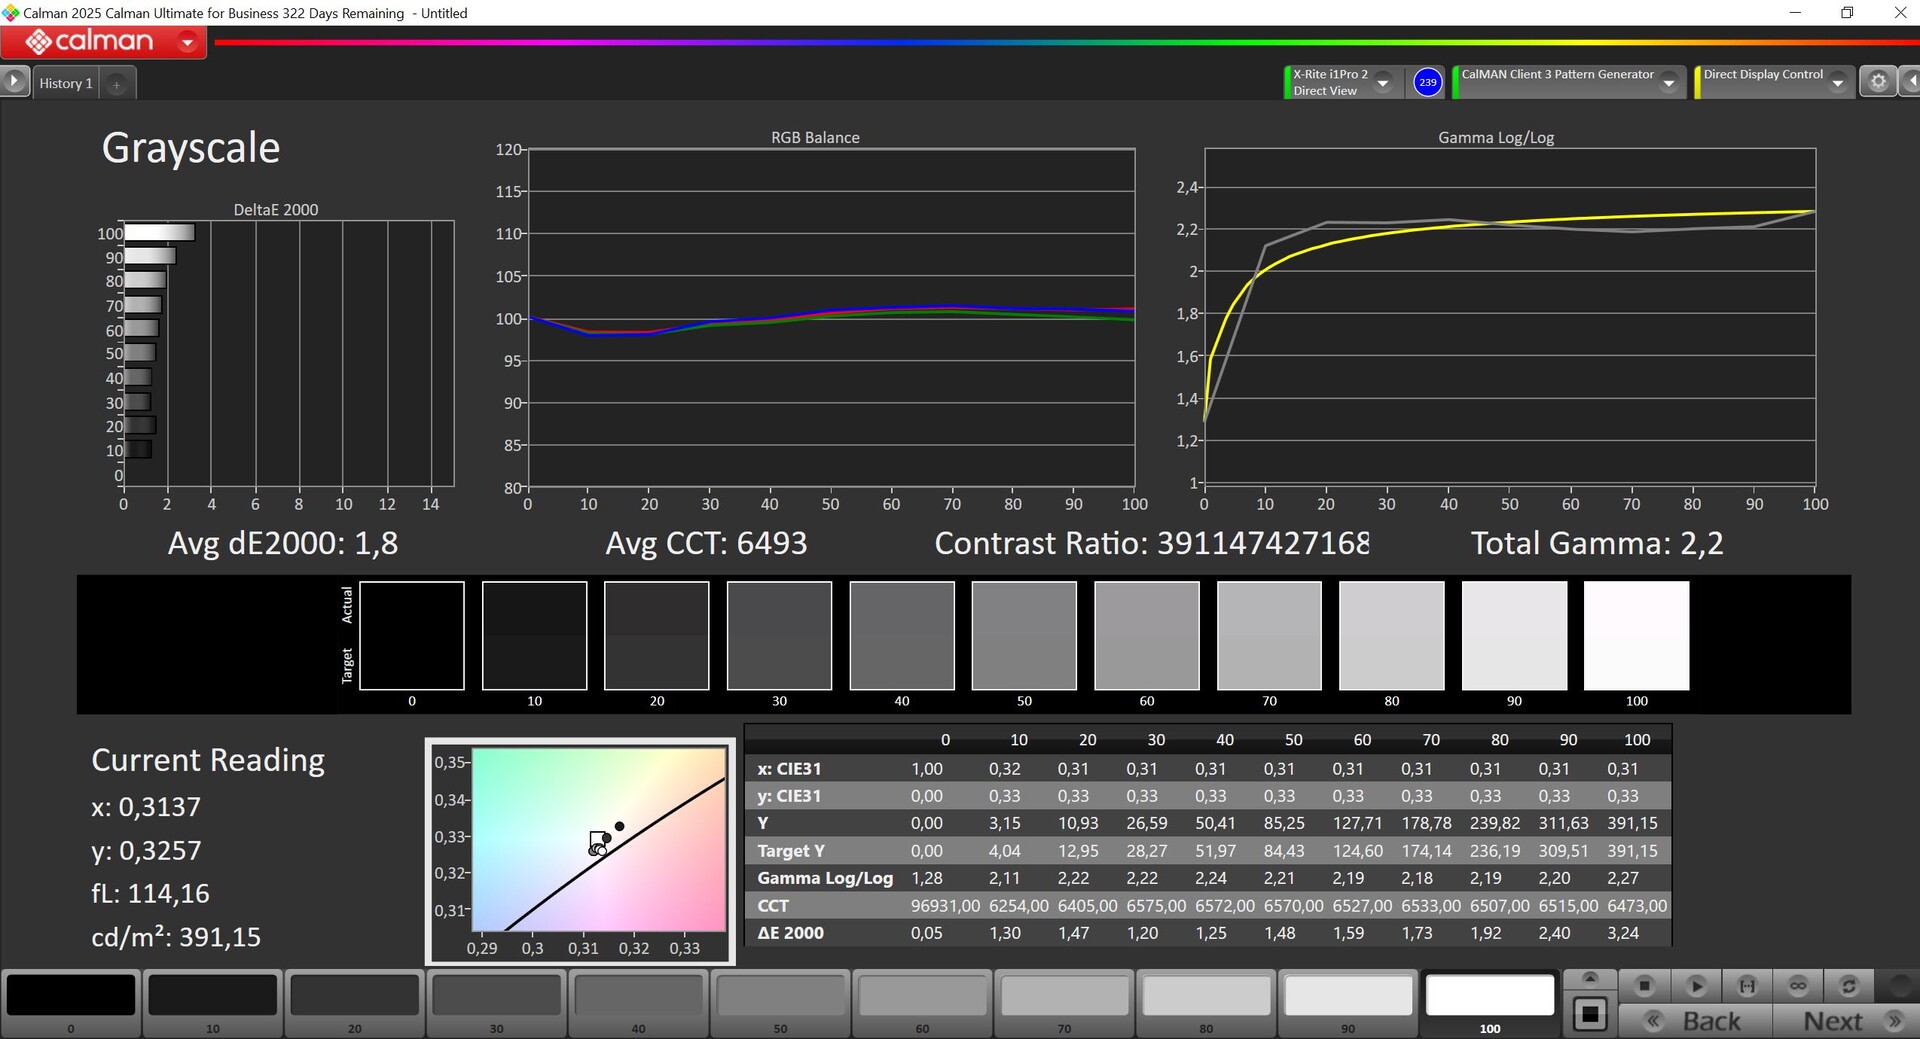
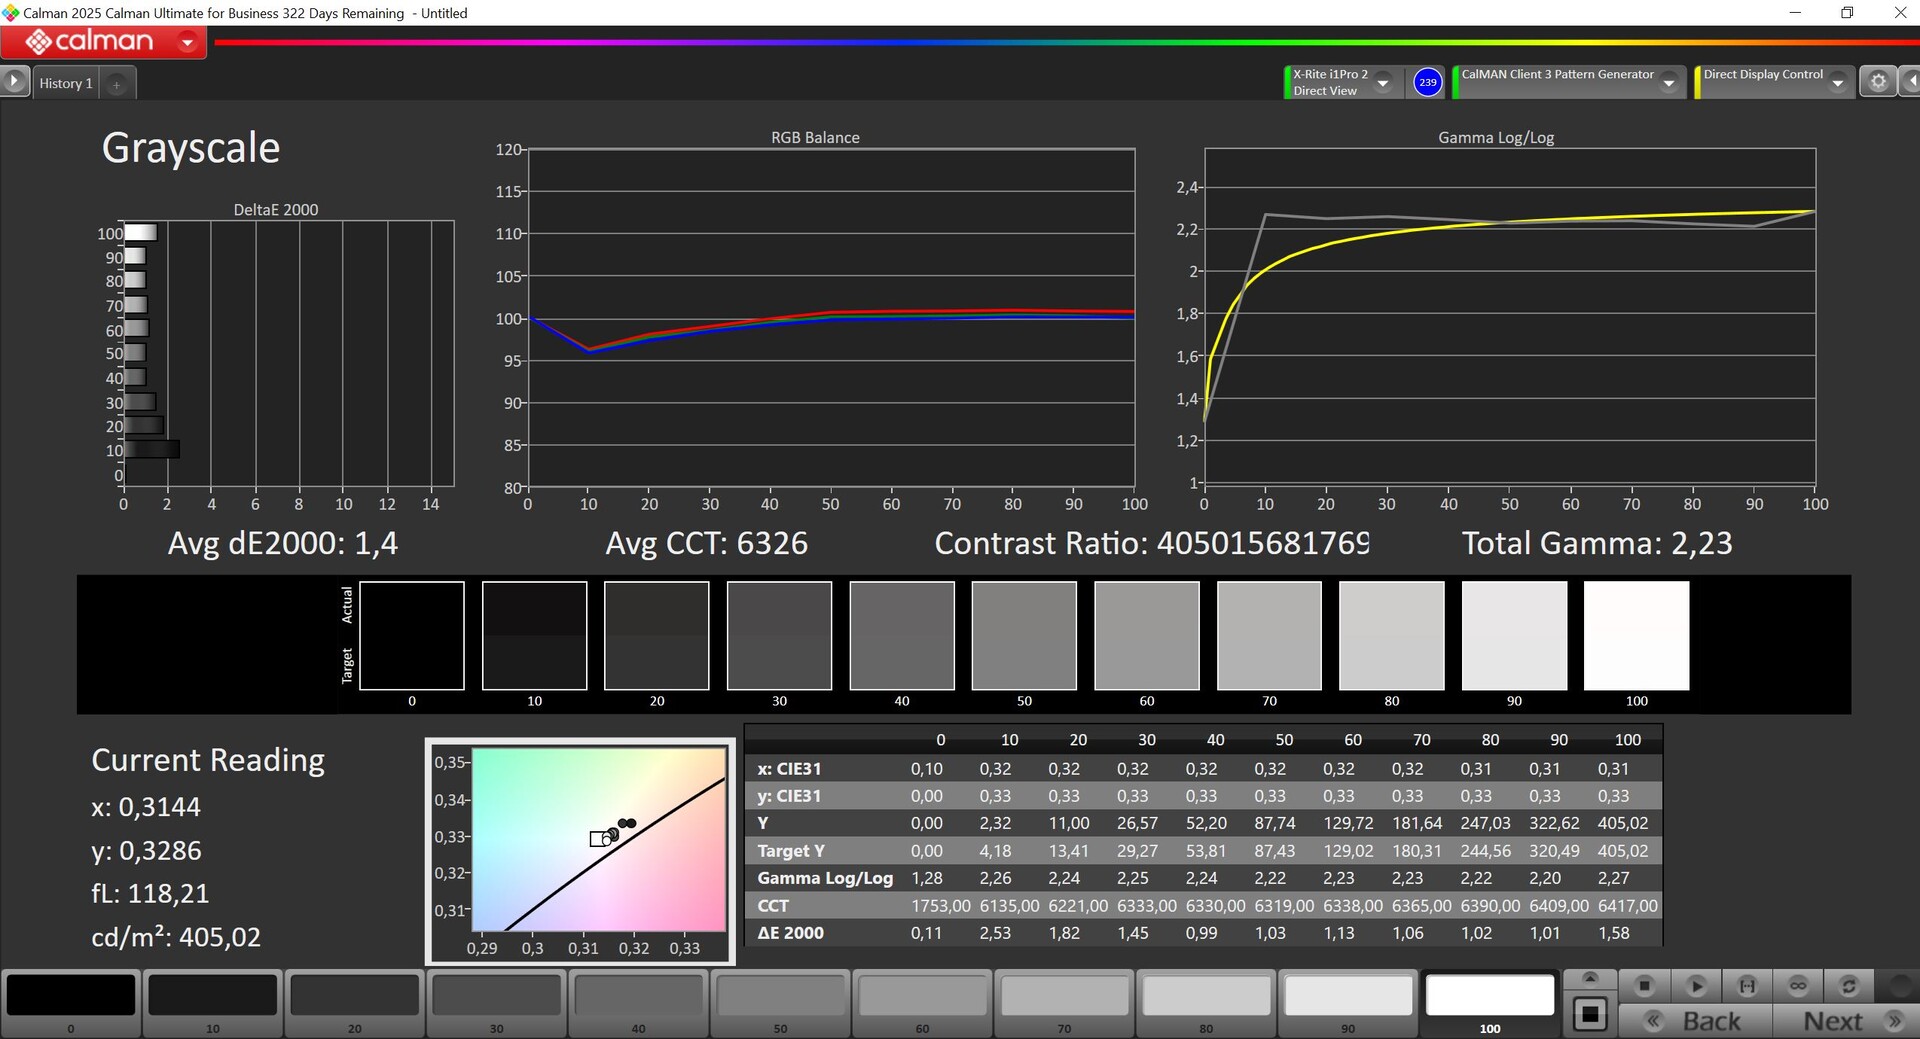
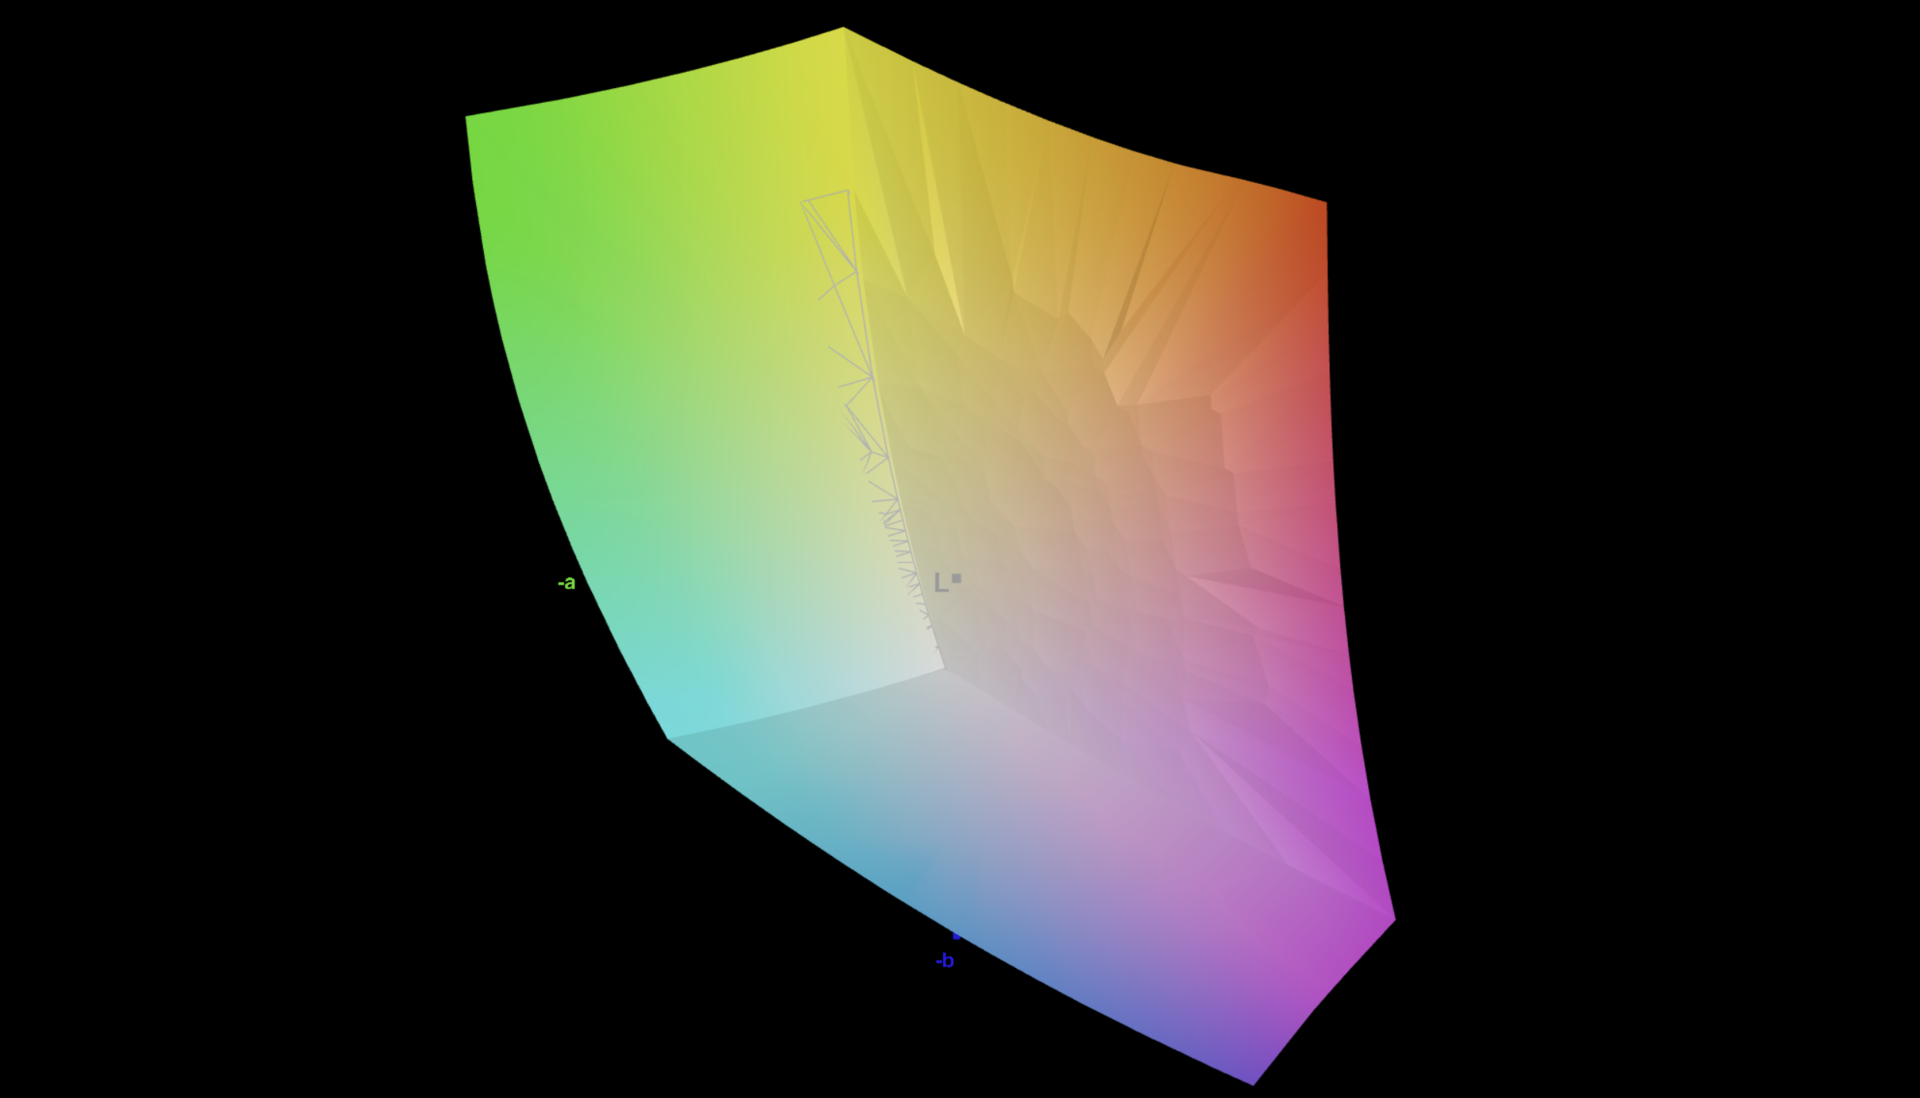
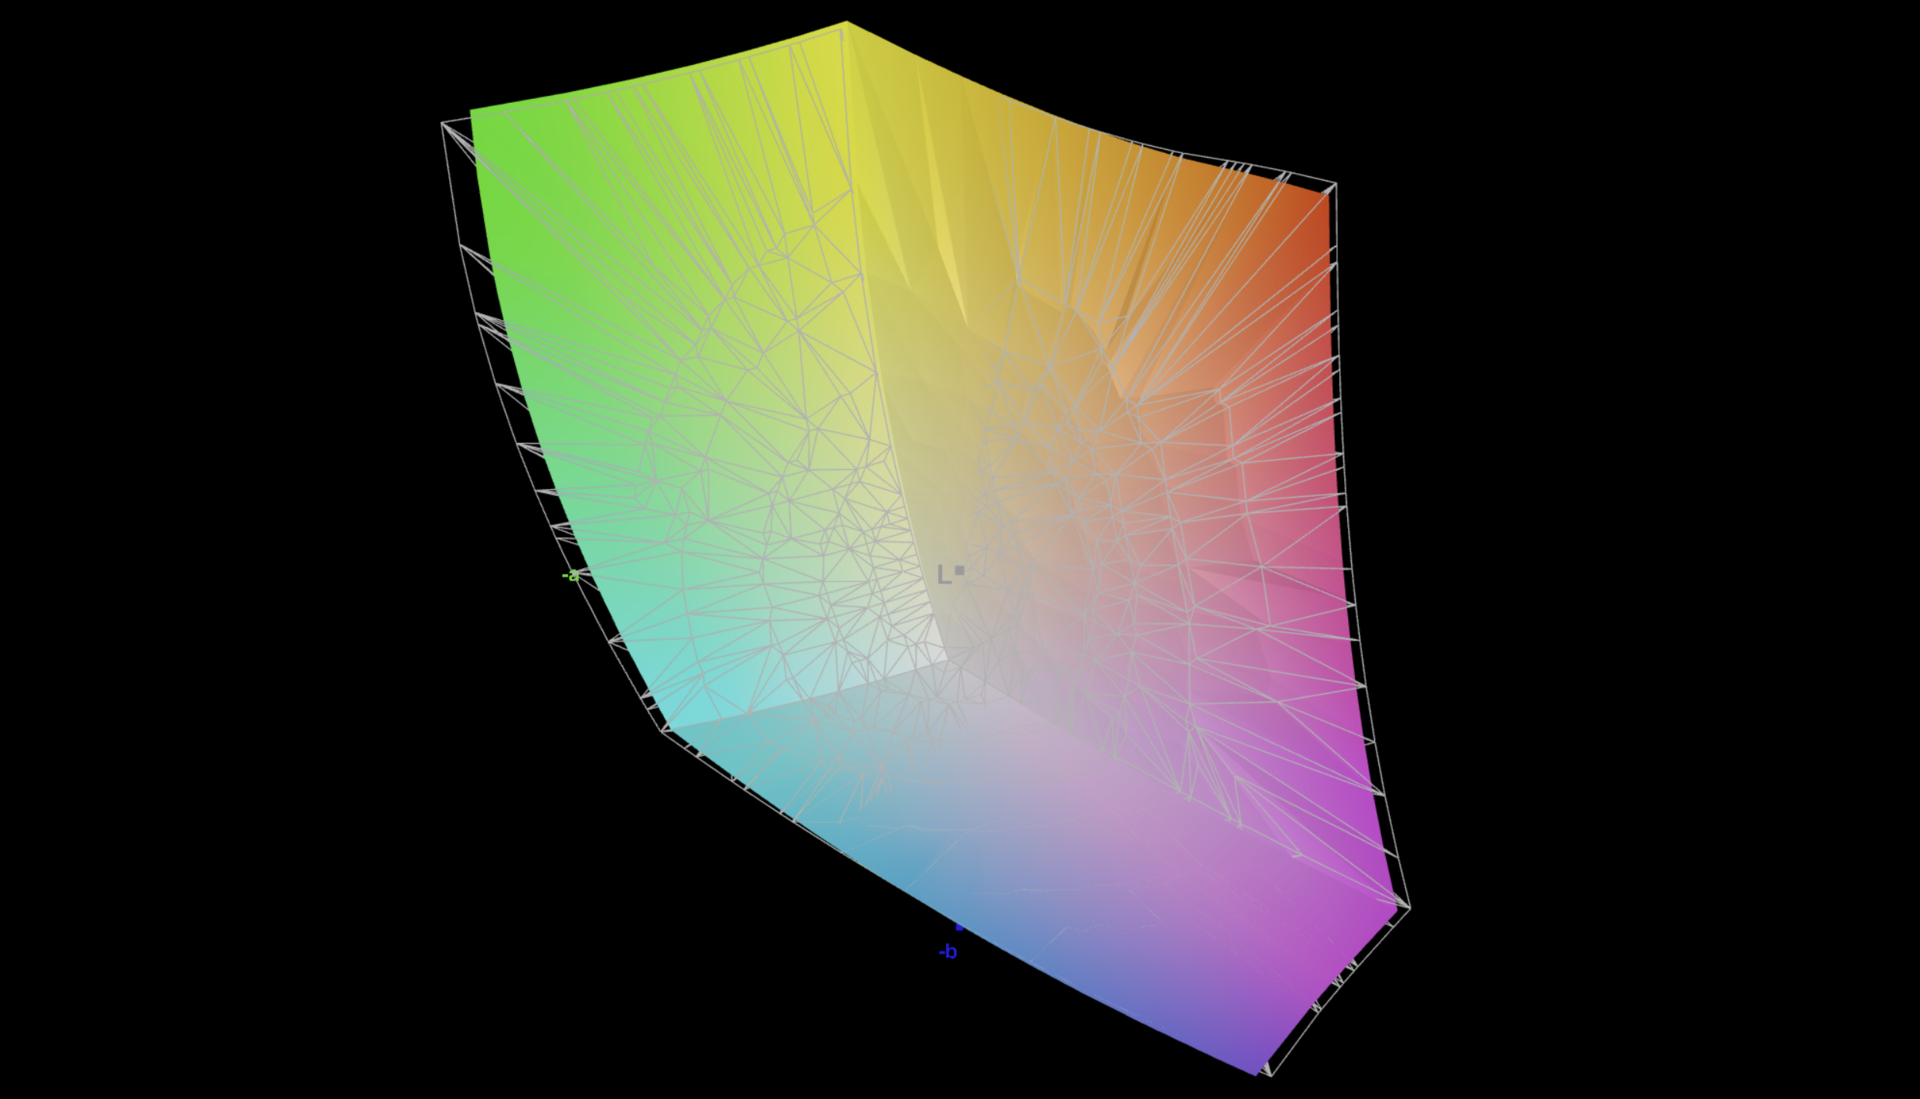
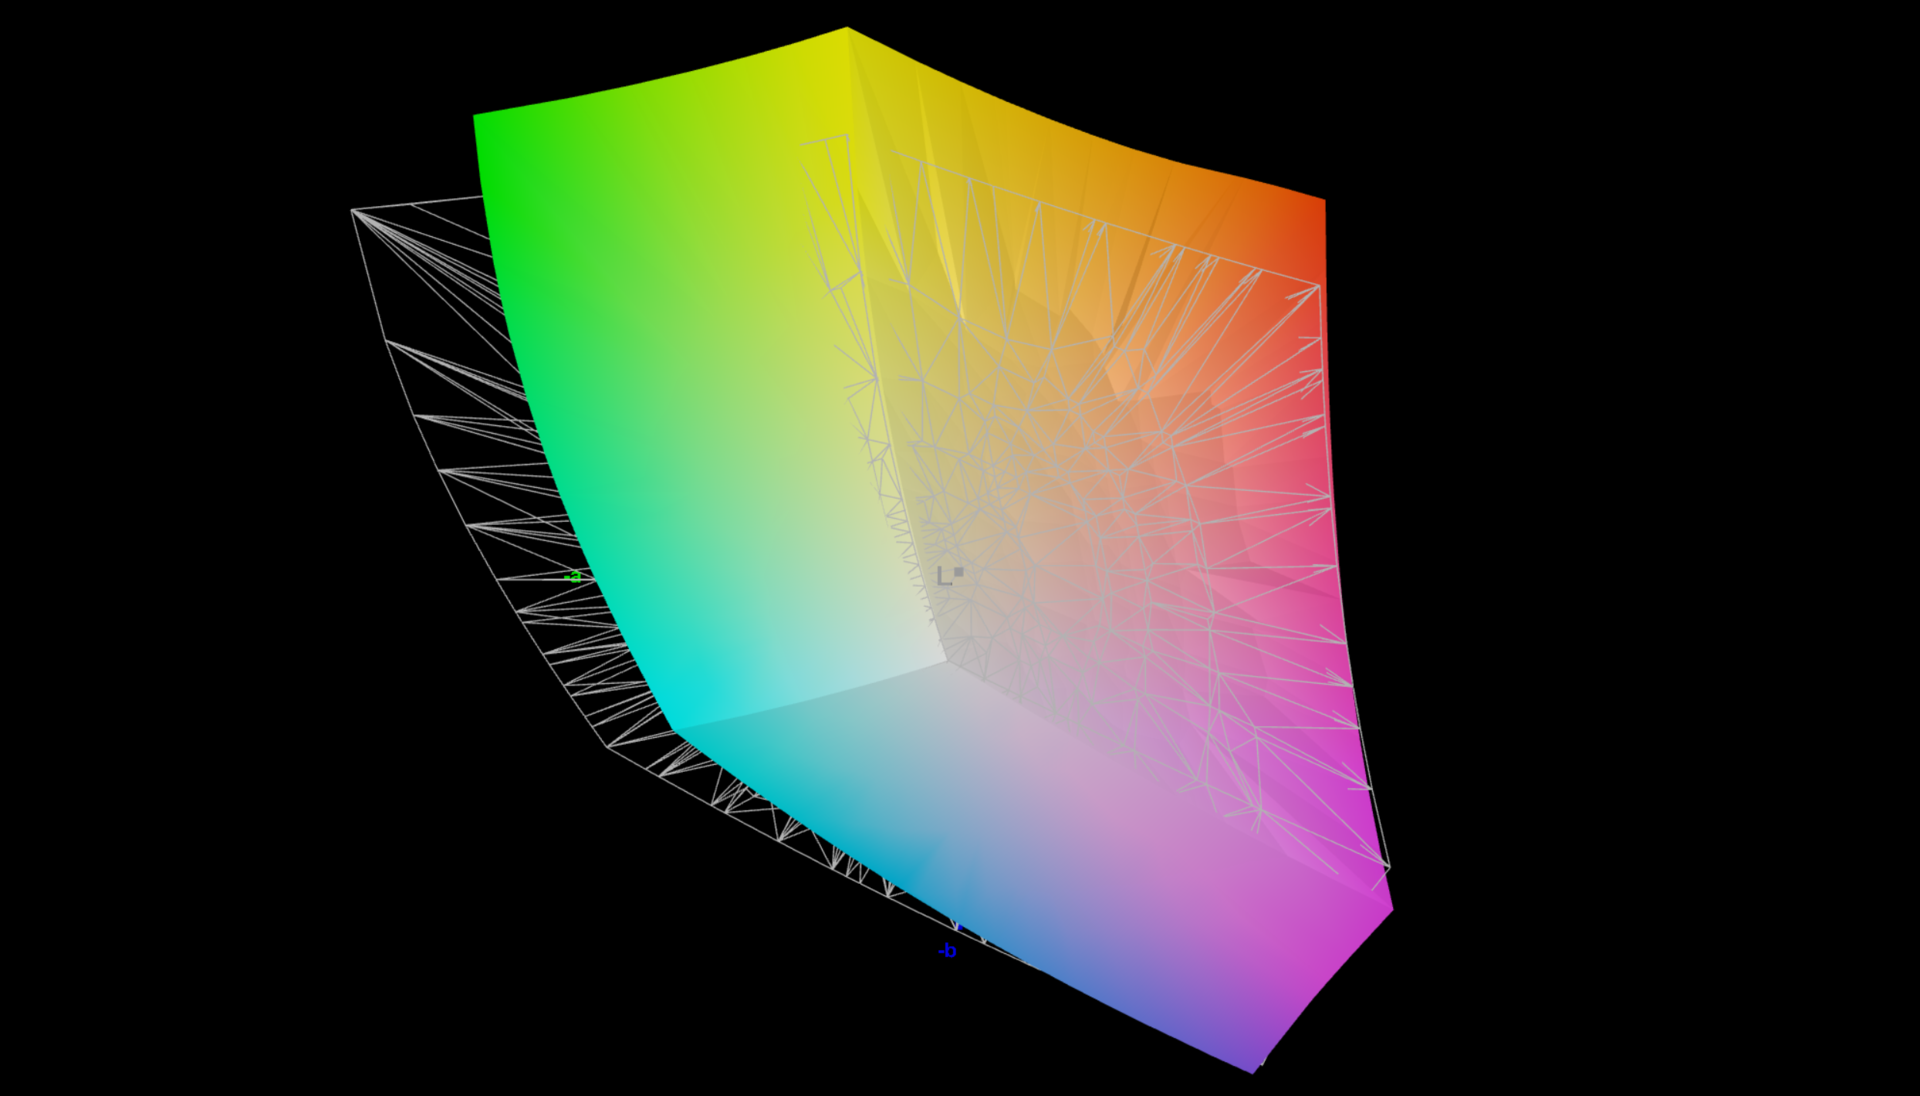
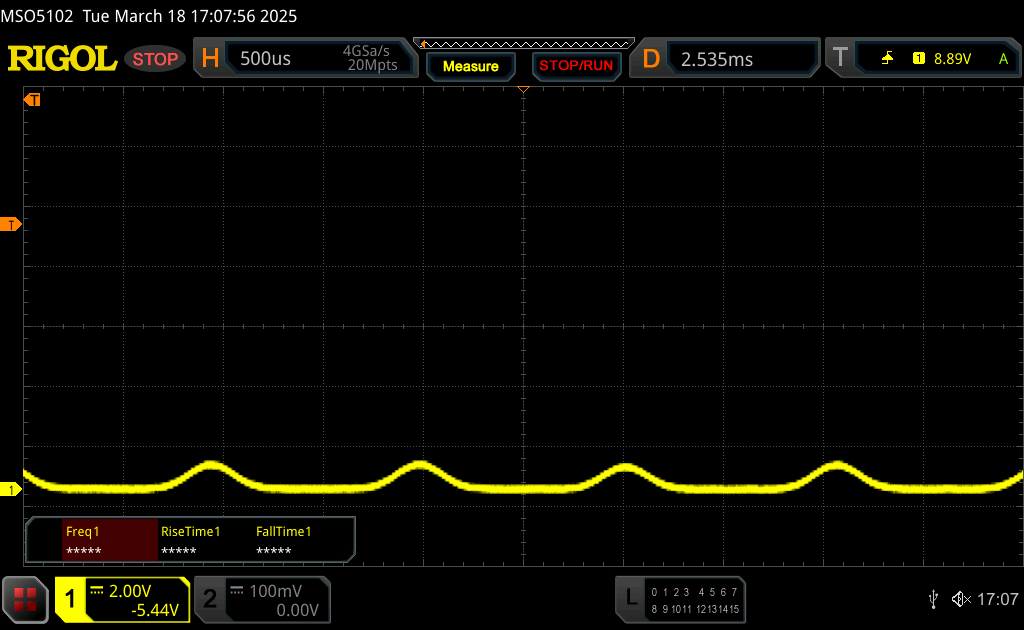
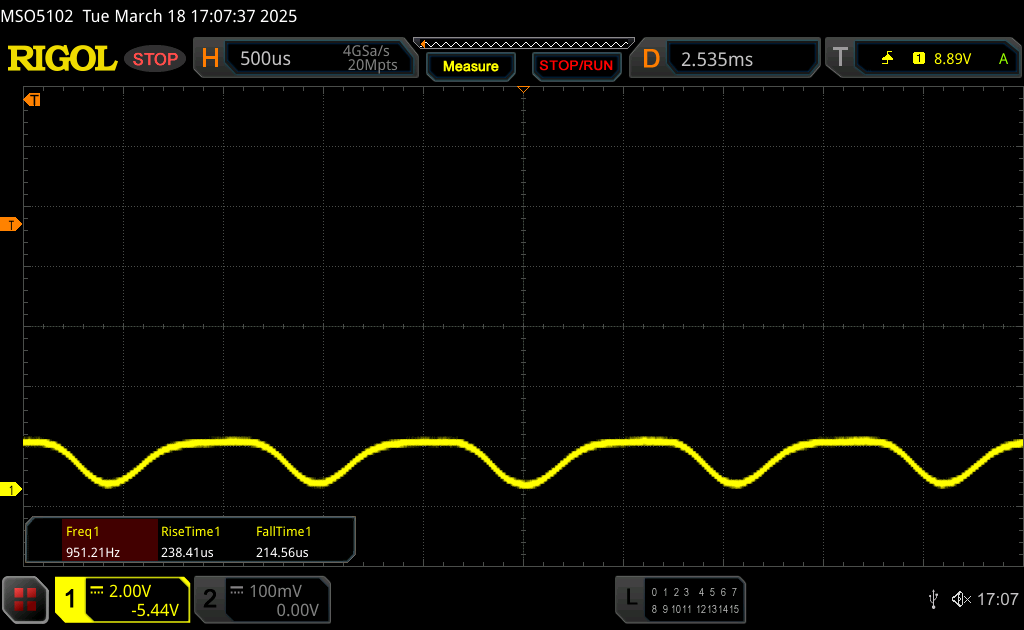
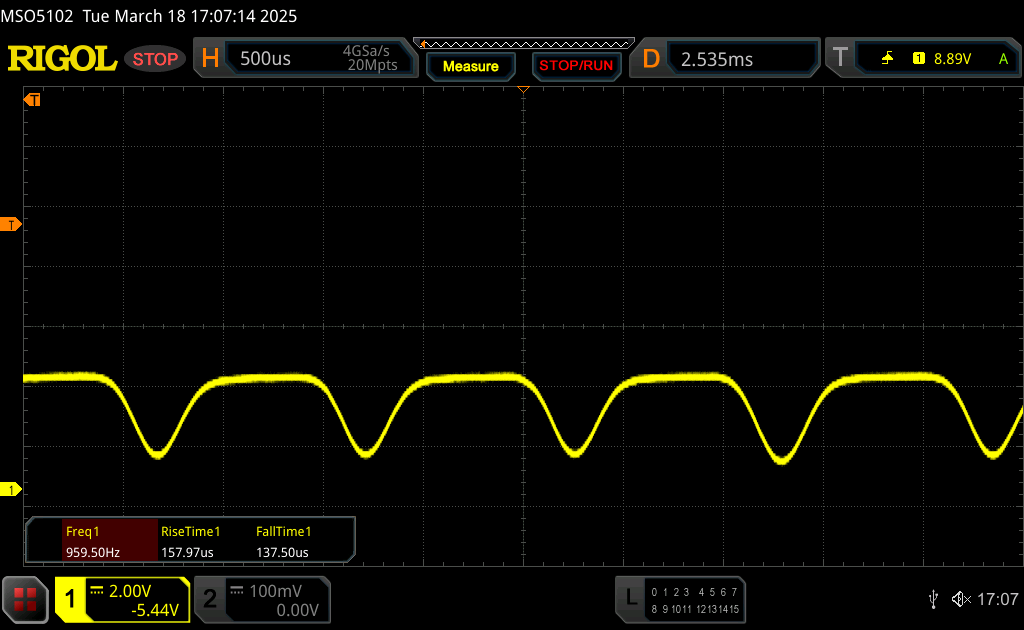
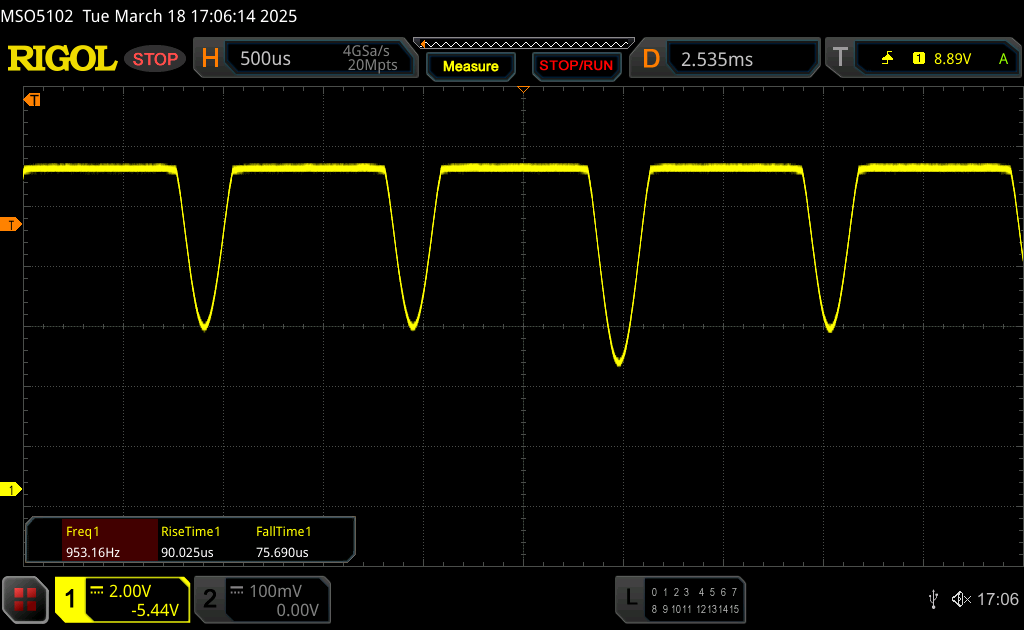
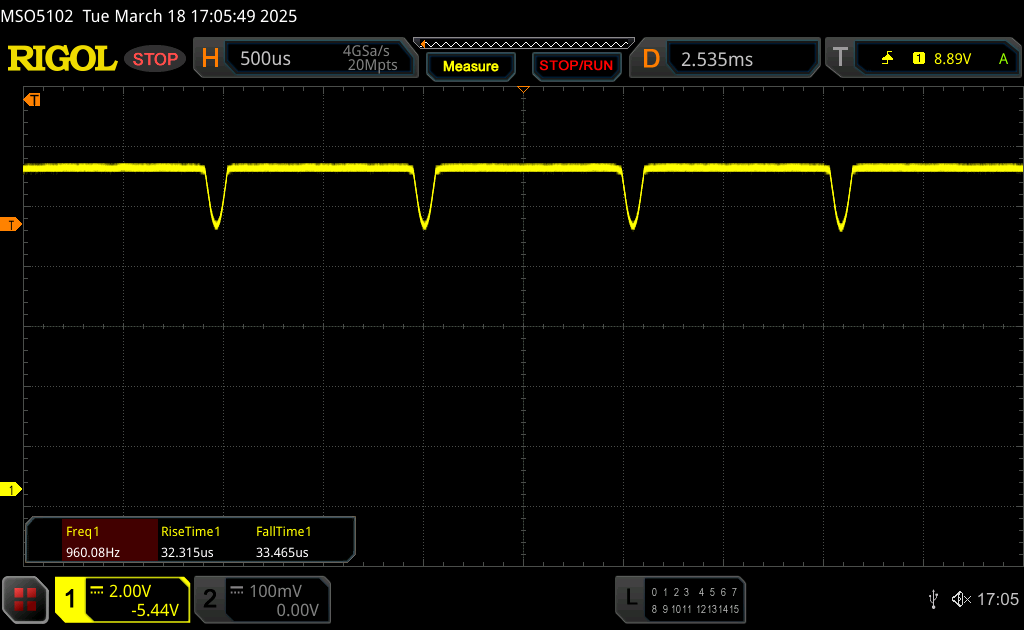
今年,三星 240-Hz OLED 的面板 ID 差别很小,但图像质量几乎完全相同,继续保持着极高的水平。色彩鲜艳,黑色饱和,响应速度极快。因此,这款显示器非常适合游戏。PWM 闪烁在所有亮度下都会出现,但其频率非常高,为 960 Hz,因此即使对敏感的用户也不会造成任何问题。
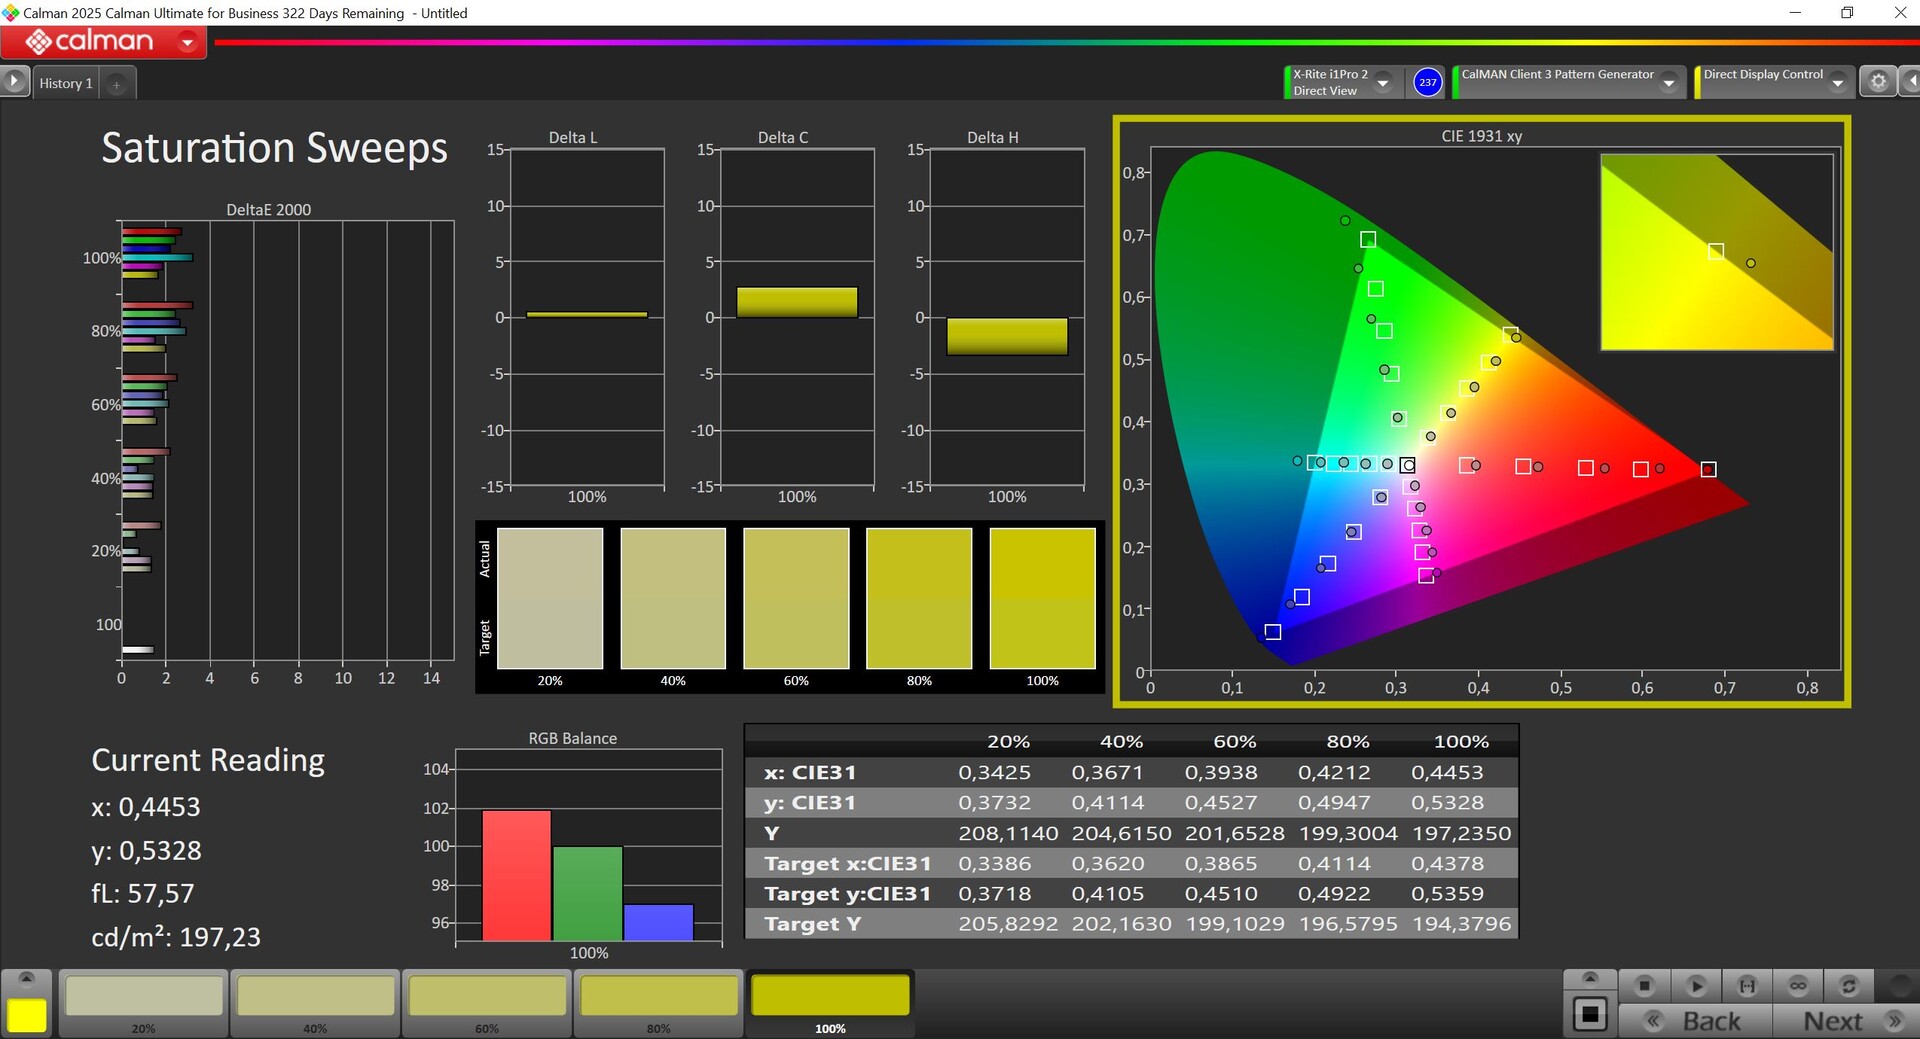
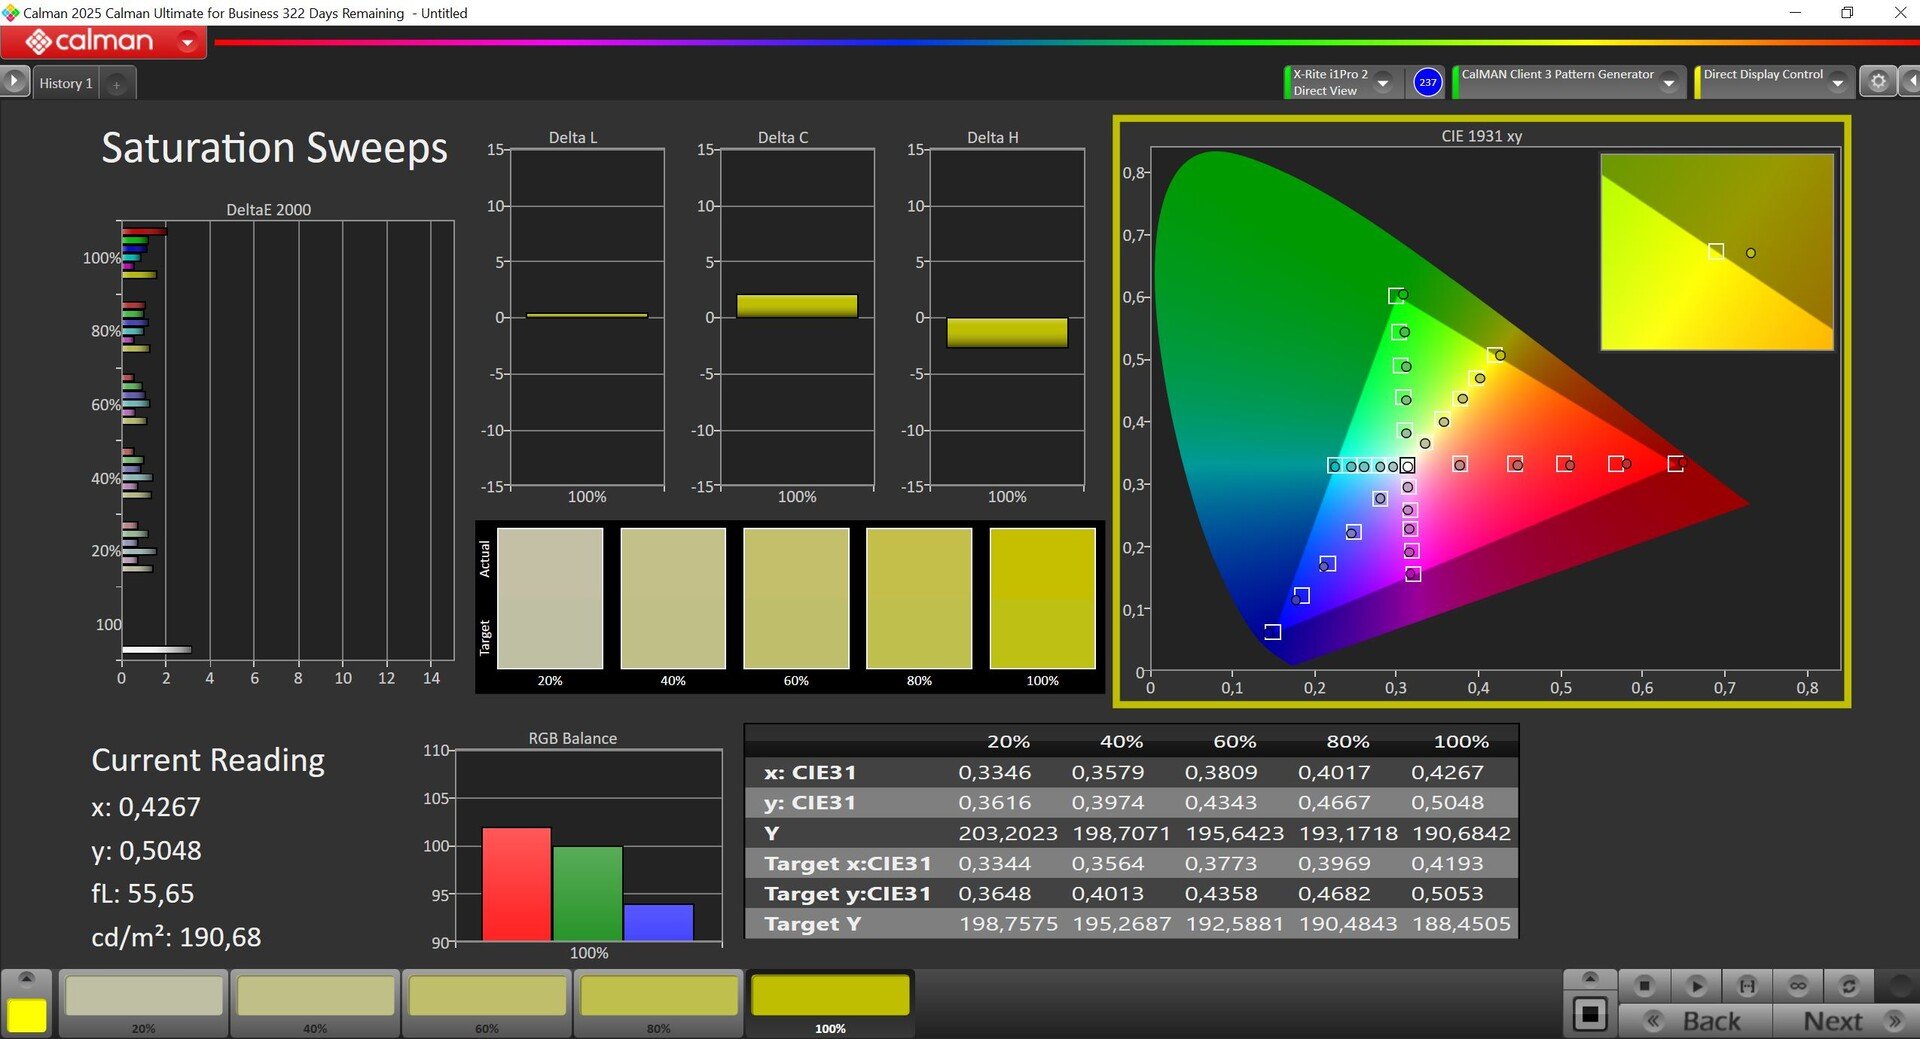
今年的亮度略低,约为 390 cd/m²,竞争对手通常会提供更好的数值。此外,HDR 的最大亮度也很低,仅为 431 cd/m²。另一方面,P3 和 sRGB 色彩空间的色彩配置文件在交货时已经非常准确(使用专业的 CalMAN 软件进行分析),我们无法进一步改进显示器。
| |||||||||||||||||||||||||
Brightness Distribution: 98 %
Center on Battery: 391 cd/m²
Contrast: ∞:1 (Black: 0 cd/m²)
ΔE Color 1.2 | 0.5-29.43 Ø4.87
ΔE Greyscale 1.8 | 0.5-98 Ø5.1
85% AdobeRGB 1998 (Argyll 2.2.0 3D)
99.9% sRGB (Argyll 2.2.0 3D)
96.1% Display P3 (Argyll 2.2.0 3D)
Gamma: 2.2
| Razer Blade 16 2025 RTX 5090 ATNA60DL04-0, OLED, 2560x1600, 16", 240 Hz | SCHENKER XMG Neo 16 (Early 24) BOE NE160QDM-NZA, IPS, 2560x1600, 16", 240 Hz | Alienware x16 R2 P120F BOE B160QAN, IPS, 2560x1600, 16", 240 Hz | Lenovo Legion 9 16IRX9, RTX 4090 CSOT T3 MNG007ZA2-2, MiniLED, 3200x2000, 16", 165 Hz | Asus ROG Zephyrus G16 GU605MY ATNA60DL01-0, OLED, 2560x1600, 16", 240 Hz | Razer Blade 16 2024, RTX 4090 Samsung SDC41AB (ATNA60DL03-0), OLED, 2560x1600, 16", 240 Hz | Apple MacBook Pro 16 2024 M4 Pro Mini-LED, 3456x2234, 16.2", 120 Hz | |
|---|---|---|---|---|---|---|---|
| Display | -15% | 2% | 0% | 6% | 5% | 3% | |
| Display P3 Coverage | 96.1 | 70.2 -27% | 98.3 2% | 95.3 -1% | 99.9 4% | 99.1 3% | 99.7 4% |
| sRGB Coverage | 99.9 | 98 -2% | 100 0% | 99.9 0% | 100 0% | 99.9 0% | 100 0% |
| AdobeRGB 1998 Coverage | 85 | 70.6 -17% | 88.8 4% | 86.6 2% | 96.9 14% | 95.6 12% | 88.8 4% |
| Response Times | -3720% | -2435% | -3211% | -3% | -27% | -12110% | |
| Response Time Grey 50% / Grey 80% * | 0.2 ? | 11.2 ? -5500% | 3.9 ? -1850% | 12.6 ? -6200% | 0.22 ? -10% | 0.24 ? -20% | 43 ? -21400% |
| Response Time Black / White * | 0.25 ? | 5.1 ? -1940% | 7.8 ? -3020% | 10 ? -3900% | 0.25 ? -0% | 0.4 ? -60% | 41.2 ? -16380% |
| PWM Frequency | 960 ? | 5430 466% | 960 ? 0% | 960 0% | 14880 1450% | ||
| Screen | -56% | -46% | -25% | -7% | 6% | 47% | |
| Brightness middle | 391 | 530 36% | 348.4 -11% | 631 61% | 416 6% | 418 7% | 632 62% |
| Brightness | 393 | 497 26% | 340 -13% | 664 69% | 418 6% | 420 7% | 616 57% |
| Brightness Distribution | 98 | 85 -13% | 90 -8% | 91 -7% | 96 -2% | 98 0% | 95 -3% |
| Black Level * | 0.53 | 0.33 | 0.03 | 0.02 | |||
| Colorchecker dE 2000 * | 1.2 | 3.21 -168% | 2.68 -123% | 2.68 -123% | 1.6 -33% | 1.07 11% | 0.6 50% |
| Colorchecker dE 2000 max. * | 3.2 | 5.8 -81% | 4.14 -29% | 6.41 -100% | 2.1 34% | 4.04 -26% | 1.2 62% |
| Greyscale dE 2000 * | 1.8 | 4.2 -133% | 3.4 -89% | 2.71 -51% | 2.7 -50% | 1.12 38% | 0.8 56% |
| Gamma | 2.2 100% | 2.226 99% | 2.41 91% | 2.27 97% | 2.16 102% | 2.29 96% | 2.21 100% |
| CCT | 6493 100% | 6448 101% | 6083 107% | 6135 106% | 6331 103% | 6417 101% | 6450 101% |
| Contrast | 1000 | 1056 | 21033 | 20900 | |||
| Colorchecker dE 2000 calibrated * | 1.44 | 0.42 | 2.68 | 1.07 | |||
| Total Average (Program / Settings) | -1264% /
-711% | -826% /
-467% | -1079% /
-815% | -1% /
-3% | -5% /
-2% | -4020% /
-3003% |
* ... smaller is better


Display Response Times
| ↔ Response Time Black to White | ||
|---|---|---|
| 0.25 ms ... rise ↗ and fall ↘ combined | ↗ 0.13 ms rise | 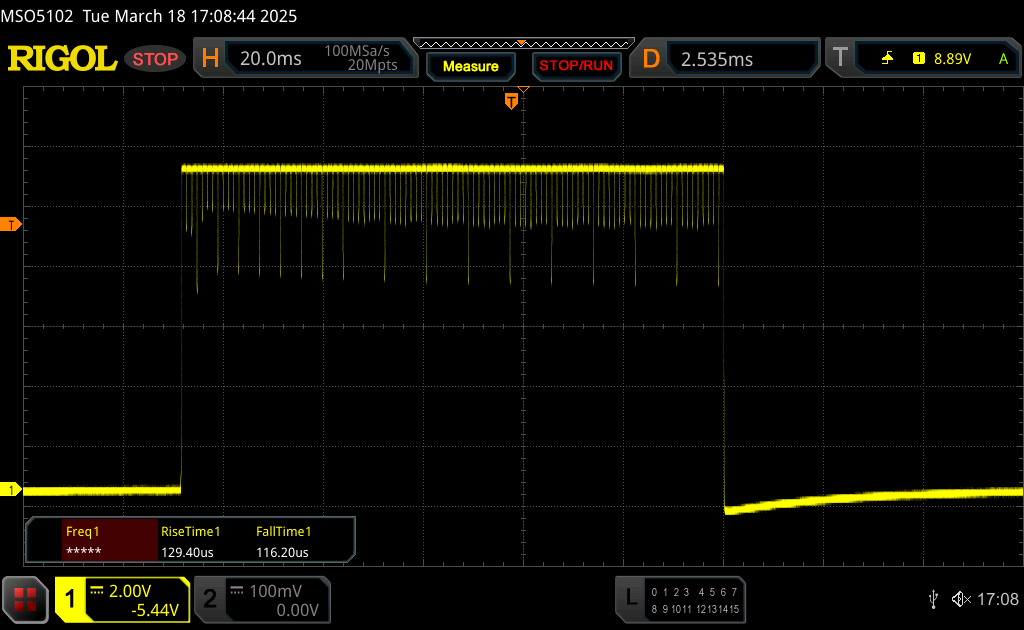 |
| ↘ 0.12 ms fall | ||
| The screen shows very fast response rates in our tests and should be very well suited for fast-paced gaming. In comparison, all tested devices range from 0.1 (minimum) to 240 (maximum) ms. » 0 % of all devices are better. This means that the measured response time is better than the average of all tested devices (20.7 ms). | ||
| ↔ Response Time 50% Grey to 80% Grey | ||
| 0.2 ms ... rise ↗ and fall ↘ combined | ↗ 0.1 ms rise | 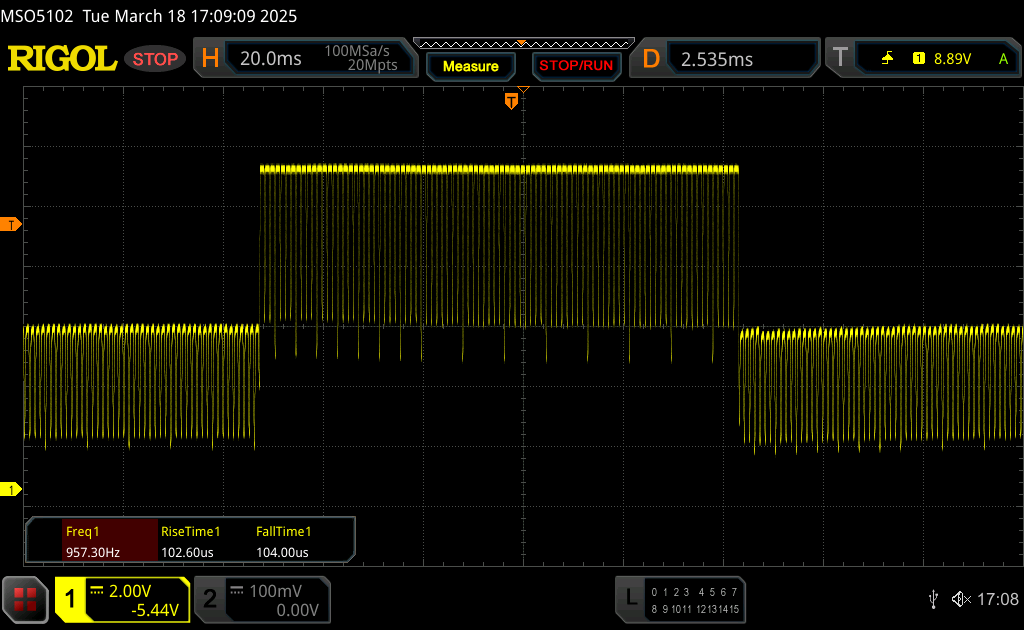 |
| ↘ 0.1 ms fall | ||
| The screen shows very fast response rates in our tests and should be very well suited for fast-paced gaming. In comparison, all tested devices range from 0.165 (minimum) to 636 (maximum) ms. » 0 % of all devices are better. This means that the measured response time is better than the average of all tested devices (32.5 ms). | ||
Screen Flickering / PWM (Pulse-Width Modulation)
| Screen flickering / PWM detected | 960 Hz Amplitude: 44 % | ≤ 100 % brightness setting | 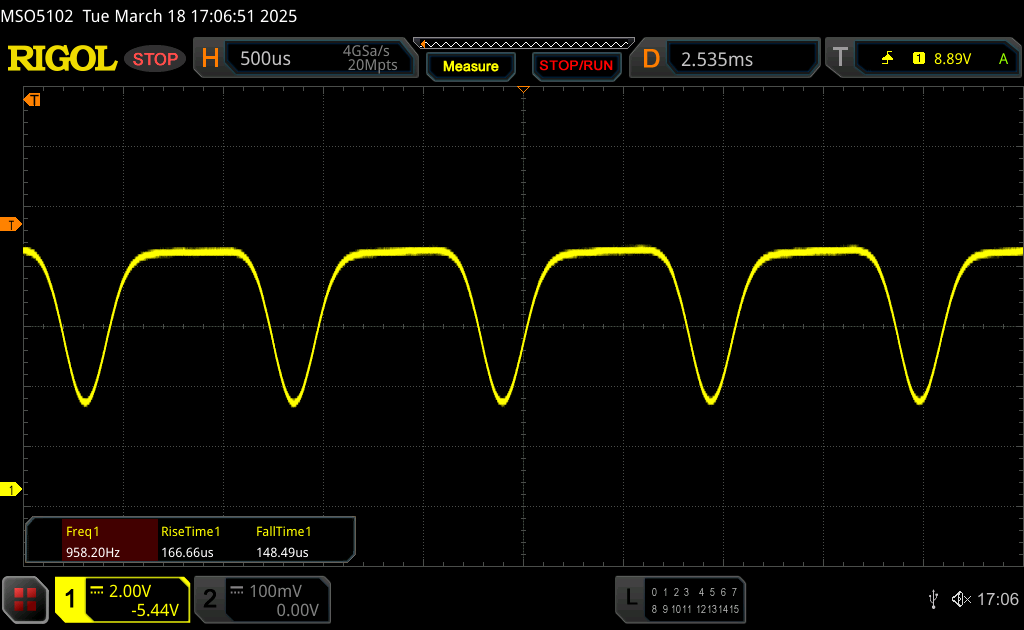 |
The display backlight flickers at 960 Hz (worst case, e.g., utilizing PWM) Flickering detected at a brightness setting of 100 % and below. There should be no flickering or PWM above this brightness setting. The frequency of 960 Hz is quite high, so most users sensitive to PWM should not notice any flickering. In comparison: 53 % of all tested devices do not use PWM to dim the display. If PWM was detected, an average of 8508 (minimum: 5 - maximum: 343500) Hz was measured. | |||


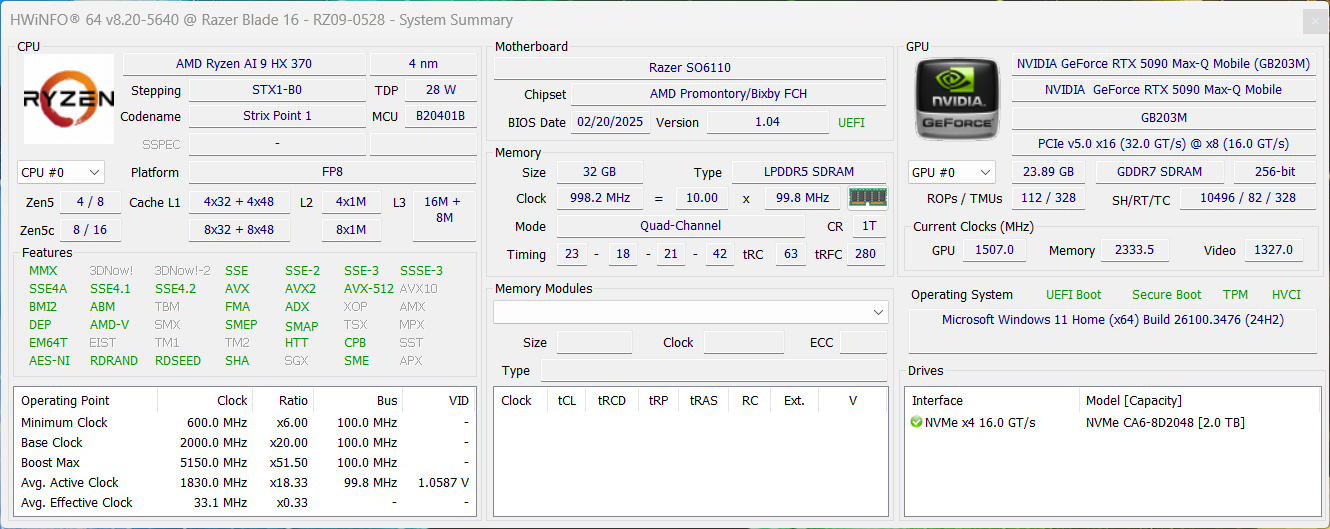
性能 - Ryzen AI 和GeForce RTX 5090 笔记本电脑
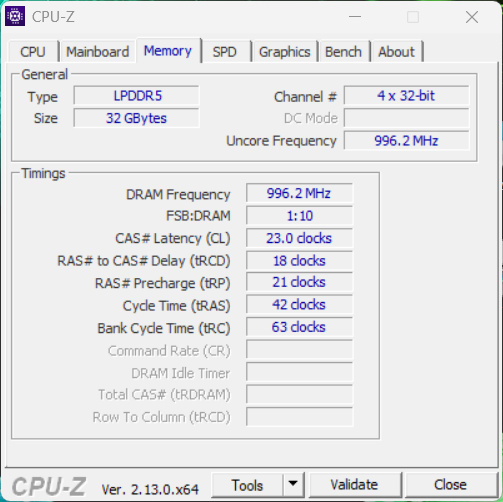
为了在更轻薄的机身中使用更快的 GPU,Razer 将英特尔 HX CPU 更改为 AMD 的 Ryzen AI 移动处理器。您可以选择 Ryzen AI 9 HX 370或 Ryzen AI 9 365最高 64 GB 焊接内存(LPDDR5x-8000)。

测试条件
Razer 提供多种电源配置文件,我们在下表列出了这些配置文件。为了获得最高性能,我们在基准测试和测量中使用了性能 模式。与 去年的型号相比,我们无法使用自定义 模式进一步提高性能。
| 模式 | CPU TDP | CB R23 Multi | GPU TGP | Time Spy 图形 | 赛博朋克 2077 QHD Ultra | 赛博朋克 2077 风扇体积 | 最大风扇体积 |
|---|---|---|---|---|---|---|---|
| 静音 | 35 瓦 | 18,105 分 | 110 瓦 | 17,919 分 | 84.5 FPS | 43 dB(A) | 45.7 dB(A) |
| 平衡 | 55/46 瓦 | 20,651 点 | 125 瓦 | 19,487 点 | 87.3 FPS | 48.2 dB(A) | 50.8 dB(A) |
| 性能 | 78/75 瓦 | 23,804 分 | 160 瓦 | 22,082 分 | 98.6 FPS | 48.2 dB(A) | 53.4 dB(A) |
| 电池 | 52/40 瓦 | 19,112 点 | 65 瓦 | 10,464 点 | 34.8 FPS | 40 dB(A) | 40 dB(A) |
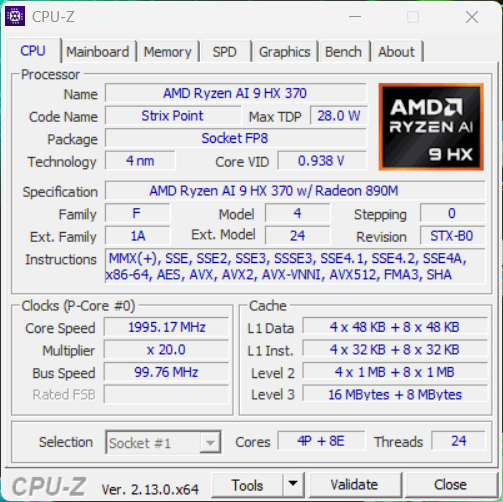
处理器 - AMD Ryzen AI 9 HX 370
产品 Ryzen AI 9 HX 370提供 12 个 CPU 内核,最大功耗为 78 瓦。基本上,它的多核性能不错,也比 2024 Zephyrus G16 配备的 酷睿至强 7 155H.但仍然落后于 酷睿 i9-14900HX当然,HX 处理器的功耗要高得多。在恒定负载下,性能保持稳定,但在电池工作状态下,多核性能下降约 20%。
Cinebench R15 Multi Constant Load Test
Cinebench 2024: CPU Multi Core | CPU Single Core
Cinebench R23: Multi Core | Single Core
Cinebench R20: CPU (Multi Core) | CPU (Single Core)
Cinebench R15: CPU Multi 64Bit | CPU Single 64Bit
Blender: v2.79 BMW27 CPU
7-Zip 18.03: 7z b 4 | 7z b 4 -mmt1
Geekbench 6.4: Multi-Core | Single-Core
Geekbench 5.5: Multi-Core | Single-Core
HWBOT x265 Benchmark v2.2: 4k Preset
LibreOffice : 20 Documents To PDF
R Benchmark 2.5: Overall mean
| CPU Performance Rating | |
| Apple MacBook Pro 16 M4 Max -8! | |
| SCHENKER XMG Neo 16 (Early 24) | |
| Razer Blade 16 2024, RTX 4090 -2! | |
| Lenovo Legion 9 16IRX9, RTX 4090 -2! | |
| Razer Blade 16 2025 RTX 5090 | |
| Asus ROG Zephyrus G16 GA605WV | |
| Average AMD Ryzen AI 9 HX 370 | |
| Average of class Gaming | |
| Lenovo Yoga Pro 9 16IMH9 -2! | |
| Asus ROG Zephyrus G16 GU605MY -2! | |
| Alienware x16 R2 P120F -2! | |
| Cinebench 2024 / CPU Multi Core | |
| Apple MacBook Pro 16 M4 Max | |
| Apple MacBook Pro 16 M4 Max | |
| SCHENKER XMG Neo 16 (Early 24) | |
| Razer Blade 16 2025 RTX 5090 | |
| Average of class Gaming (331 - 2223, n=59, last 2 years) | |
| Asus ROG Zephyrus G16 GA605WV | |
| Average AMD Ryzen AI 9 HX 370 (621 - 1284, n=24) | |
| Cinebench 2024 / CPU Single Core | |
| Apple MacBook Pro 16 M4 Max | |
| SCHENKER XMG Neo 16 (Early 24) | |
| Razer Blade 16 2025 RTX 5090 | |
| Average AMD Ryzen AI 9 HX 370 (113.6 - 121, n=14) | |
| Average of class Gaming (68.2 - 138, n=60, last 2 years) | |
| Asus ROG Zephyrus G16 GA605WV | |
| Cinebench R23 / Multi Core | |
| SCHENKER XMG Neo 16 (Early 24) | |
| Lenovo Legion 9 16IRX9, RTX 4090 | |
| Razer Blade 16 2024, RTX 4090 | |
| Apple MacBook Pro 16 M4 Max | |
| Razer Blade 16 2025 RTX 5090 | |
| Asus ROG Zephyrus G16 GA605WV | |
| Average of class Gaming (5668 - 39652, n=153, last 2 years) | |
| Average AMD Ryzen AI 9 HX 370 (10435 - 23805, n=24) | |
| Lenovo Yoga Pro 9 16IMH9 | |
| Asus ROG Zephyrus G16 GU605MY | |
| Alienware x16 R2 P120F | |
| Cinebench R23 / Single Core | |
| SCHENKER XMG Neo 16 (Early 24) | |
| Apple MacBook Pro 16 M4 Max | |
| Razer Blade 16 2024, RTX 4090 | |
| Razer Blade 16 2025 RTX 5090 | |
| Average AMD Ryzen AI 9 HX 370 (1921 - 2049, n=17) | |
| Asus ROG Zephyrus G16 GA605WV | |
| Lenovo Yoga Pro 9 16IMH9 | |
| Average of class Gaming (1136 - 2252, n=153, last 2 years) | |
| Asus ROG Zephyrus G16 GU605MY | |
| Lenovo Legion 9 16IRX9, RTX 4090 | |
| Alienware x16 R2 P120F | |
| Cinebench R20 / CPU (Multi Core) | |
| SCHENKER XMG Neo 16 (Early 24) | |
| Lenovo Legion 9 16IRX9, RTX 4090 | |
| Razer Blade 16 2024, RTX 4090 | |
| Razer Blade 16 2025 RTX 5090 | |
| Asus ROG Zephyrus G16 GA605WV | |
| Average AMD Ryzen AI 9 HX 370 (6449 - 9250, n=16) | |
| Average of class Gaming (2179 - 15517, n=153, last 2 years) | |
| Lenovo Yoga Pro 9 16IMH9 | |
| Asus ROG Zephyrus G16 GU605MY | |
| Alienware x16 R2 P120F | |
| Apple MacBook Pro 16 M4 Max | |
| Cinebench R20 / CPU (Single Core) | |
| SCHENKER XMG Neo 16 (Early 24) | |
| Razer Blade 16 2024, RTX 4090 | |
| Razer Blade 16 2025 RTX 5090 | |
| Average AMD Ryzen AI 9 HX 370 (753 - 804, n=16) | |
| Asus ROG Zephyrus G16 GA605WV | |
| Lenovo Yoga Pro 9 16IMH9 | |
| Average of class Gaming (439 - 866, n=153, last 2 years) | |
| Asus ROG Zephyrus G16 GU605MY | |
| Lenovo Legion 9 16IRX9, RTX 4090 | |
| Alienware x16 R2 P120F | |
| Apple MacBook Pro 16 M4 Max | |
| Cinebench R15 / CPU Multi 64Bit | |
| SCHENKER XMG Neo 16 (Early 24) | |
| Lenovo Legion 9 16IRX9, RTX 4090 | |
| Razer Blade 16 2024, RTX 4090 | |
| Apple MacBook Pro 16 M4 Max | |
| Razer Blade 16 2025 RTX 5090 | |
| Asus ROG Zephyrus G16 GA605WV | |
| Average of class Gaming (905 - 6074, n=156, last 2 years) | |
| Average AMD Ryzen AI 9 HX 370 (2498 - 3505, n=16) | |
| Asus ROG Zephyrus G16 GU605MY | |
| Lenovo Yoga Pro 9 16IMH9 | |
| Alienware x16 R2 P120F | |
| Cinebench R15 / CPU Single 64Bit | |
| Razer Blade 16 2024, RTX 4090 | |
| SCHENKER XMG Neo 16 (Early 24) | |
| Razer Blade 16 2025 RTX 5090 | |
| Apple MacBook Pro 16 M4 Max | |
| Average AMD Ryzen AI 9 HX 370 (293 - 315, n=16) | |
| Asus ROG Zephyrus G16 GA605WV | |
| Lenovo Yoga Pro 9 16IMH9 | |
| Average of class Gaming (191.9 - 343, n=153, last 2 years) | |
| Asus ROG Zephyrus G16 GU605MY | |
| Lenovo Legion 9 16IRX9, RTX 4090 | |
| Alienware x16 R2 P120F | |
| Blender / v2.79 BMW27 CPU | |
| Alienware x16 R2 P120F | |
| Asus ROG Zephyrus G16 GU605MY | |
| Average of class Gaming (81 - 555, n=146, last 2 years) | |
| Lenovo Yoga Pro 9 16IMH9 | |
| Average AMD Ryzen AI 9 HX 370 (140 - 192, n=16) | |
| Asus ROG Zephyrus G16 GA605WV | |
| Razer Blade 16 2025 RTX 5090 | |
| Razer Blade 16 2024, RTX 4090 | |
| Lenovo Legion 9 16IRX9, RTX 4090 | |
| SCHENKER XMG Neo 16 (Early 24) | |
| 7-Zip 18.03 / 7z b 4 | |
| SCHENKER XMG Neo 16 (Early 24) | |
| Lenovo Legion 9 16IRX9, RTX 4090 | |
| Razer Blade 16 2024, RTX 4090 | |
| Razer Blade 16 2025 RTX 5090 | |
| Average of class Gaming (23795 - 144064, n=151, last 2 years) | |
| Asus ROG Zephyrus G16 GA605WV | |
| Average AMD Ryzen AI 9 HX 370 (66154 - 83714, n=16) | |
| Lenovo Yoga Pro 9 16IMH9 | |
| Asus ROG Zephyrus G16 GU605MY | |
| Alienware x16 R2 P120F | |
| 7-Zip 18.03 / 7z b 4 -mmt1 | |
| SCHENKER XMG Neo 16 (Early 24) | |
| Razer Blade 16 2024, RTX 4090 | |
| Average of class Gaming (4199 - 7573, n=151, last 2 years) | |
| Razer Blade 16 2025 RTX 5090 | |
| Average AMD Ryzen AI 9 HX 370 (5859 - 6497, n=16) | |
| Asus ROG Zephyrus G16 GA605WV | |
| Lenovo Yoga Pro 9 16IMH9 | |
| Asus ROG Zephyrus G16 GU605MY | |
| Lenovo Legion 9 16IRX9, RTX 4090 | |
| Alienware x16 R2 P120F | |
| Geekbench 6.4 / Multi-Core | |
| Apple MacBook Pro 16 M4 Max | |
| SCHENKER XMG Neo 16 (Early 24) | |
| Razer Blade 16 2024, RTX 4090 | |
| Lenovo Legion 9 16IRX9, RTX 4090 | |
| Razer Blade 16 2025 RTX 5090 | |
| Asus ROG Zephyrus G16 GA605WV | |
| Asus ROG Zephyrus G16 GU605MY | |
| Average of class Gaming (5340 - 21668, n=122, last 2 years) | |
| Average AMD Ryzen AI 9 HX 370 (11973 - 15671, n=18) | |
| Lenovo Yoga Pro 9 16IMH9 | |
| Alienware x16 R2 P120F | |
| Geekbench 6.4 / Single-Core | |
| Apple MacBook Pro 16 M4 Max | |
| SCHENKER XMG Neo 16 (Early 24) | |
| Razer Blade 16 2024, RTX 4090 | |
| Razer Blade 16 2025 RTX 5090 | |
| Average AMD Ryzen AI 9 HX 370 (2780 - 2965, n=18) | |
| Asus ROG Zephyrus G16 GA605WV | |
| Average of class Gaming (1490 - 3219, n=122, last 2 years) | |
| Lenovo Yoga Pro 9 16IMH9 | |
| Asus ROG Zephyrus G16 GU605MY | |
| Lenovo Legion 9 16IRX9, RTX 4090 | |
| Alienware x16 R2 P120F | |
| Geekbench 5.5 / Multi-Core | |
| SCHENKER XMG Neo 16 (Early 24) | |
| Lenovo Legion 9 16IRX9, RTX 4090 | |
| Razer Blade 16 2024, RTX 4090 | |
| Razer Blade 16 2025 RTX 5090 | |
| Asus ROG Zephyrus G16 GA605WV | |
| Average of class Gaming (4557 - 25855, n=150, last 2 years) | |
| Asus ROG Zephyrus G16 GU605MY | |
| Lenovo Yoga Pro 9 16IMH9 | |
| Average AMD Ryzen AI 9 HX 370 (11394 - 15407, n=17) | |
| Alienware x16 R2 P120F | |
| Geekbench 5.5 / Single-Core | |
| SCHENKER XMG Neo 16 (Early 24) | |
| Razer Blade 16 2025 RTX 5090 | |
| Razer Blade 16 2024, RTX 4090 | |
| Asus ROG Zephyrus G16 GA605WV | |
| Average AMD Ryzen AI 9 HX 370 (1957 - 2136, n=17) | |
| Lenovo Yoga Pro 9 16IMH9 | |
| Average of class Gaming (986 - 2423, n=150, last 2 years) | |
| Asus ROG Zephyrus G16 GU605MY | |
| Lenovo Legion 9 16IRX9, RTX 4090 | |
| Alienware x16 R2 P120F | |
| HWBOT x265 Benchmark v2.2 / 4k Preset | |
| SCHENKER XMG Neo 16 (Early 24) | |
| Lenovo Legion 9 16IRX9, RTX 4090 | |
| Razer Blade 16 2024, RTX 4090 | |
| Razer Blade 16 2025 RTX 5090 | |
| Asus ROG Zephyrus G16 GA605WV | |
| Average AMD Ryzen AI 9 HX 370 (20.3 - 28.7, n=16) | |
| Average of class Gaming (6.72 - 42.9, n=150, last 2 years) | |
| Lenovo Yoga Pro 9 16IMH9 | |
| Asus ROG Zephyrus G16 GU605MY | |
| Alienware x16 R2 P120F | |
| LibreOffice / 20 Documents To PDF | |
| Average AMD Ryzen AI 9 HX 370 (46.8 - 66.6, n=16) | |
| Asus ROG Zephyrus G16 GA605WV | |
| Lenovo Legion 9 16IRX9, RTX 4090 | |
| Average of class Gaming (19 - 96.6, n=149, last 2 years) | |
| Razer Blade 16 2024, RTX 4090 | |
| Razer Blade 16 2025 RTX 5090 | |
| Alienware x16 R2 P120F | |
| Asus ROG Zephyrus G16 GU605MY | |
| Lenovo Yoga Pro 9 16IMH9 | |
| SCHENKER XMG Neo 16 (Early 24) | |
| R Benchmark 2.5 / Overall mean | |
| Alienware x16 R2 P120F | |
| Lenovo Legion 9 16IRX9, RTX 4090 | |
| Lenovo Yoga Pro 9 16IMH9 | |
| Average of class Gaming (0.3609 - 0.759, n=152, last 2 years) | |
| Asus ROG Zephyrus G16 GU605MY | |
| Average AMD Ryzen AI 9 HX 370 (0.3892 - 0.529, n=16) | |
| Asus ROG Zephyrus G16 GA605WV | |
| Razer Blade 16 2025 RTX 5090 | |
| Razer Blade 16 2024, RTX 4090 | |
| SCHENKER XMG Neo 16 (Early 24) | |
* ... smaller is better
AIDA64: FP32 Ray-Trace | FPU Julia | CPU SHA3 | CPU Queen | FPU SinJulia | FPU Mandel | CPU AES | CPU ZLib | FP64 Ray-Trace | CPU PhotoWorxx
| Performance Rating | |
| SCHENKER XMG Neo 16 (Early 24) | |
| Lenovo Legion 9 16IRX9, RTX 4090 | |
| Razer Blade 16 2025 RTX 5090 | |
| Razer Blade 16 2024, RTX 4090 | |
| Average AMD Ryzen AI 9 HX 370 | |
| Average of class Gaming | |
| Alienware x16 R2 P120F | |
| Asus ROG Zephyrus G16 GU605MY | |
| AIDA64 / FP32 Ray-Trace | |
| Razer Blade 16 2025 RTX 5090 | |
| Average AMD Ryzen AI 9 HX 370 (24673 - 37654, n=15) | |
| SCHENKER XMG Neo 16 (Early 24) | |
| Lenovo Legion 9 16IRX9, RTX 4090 | |
| Razer Blade 16 2024, RTX 4090 | |
| Average of class Gaming (4986 - 81639, n=149, last 2 years) | |
| Alienware x16 R2 P120F | |
| Asus ROG Zephyrus G16 GU605MY | |
| AIDA64 / FPU Julia | |
| SCHENKER XMG Neo 16 (Early 24) | |
| Razer Blade 16 2025 RTX 5090 | |
| Lenovo Legion 9 16IRX9, RTX 4090 | |
| Razer Blade 16 2024, RTX 4090 | |
| Average AMD Ryzen AI 9 HX 370 (95655 - 147937, n=16) | |
| Average of class Gaming (25360 - 252486, n=149, last 2 years) | |
| Alienware x16 R2 P120F | |
| Asus ROG Zephyrus G16 GU605MY | |
| AIDA64 / CPU SHA3 | |
| SCHENKER XMG Neo 16 (Early 24) | |
| Lenovo Legion 9 16IRX9, RTX 4090 | |
| Razer Blade 16 2024, RTX 4090 | |
| Razer Blade 16 2025 RTX 5090 | |
| Average AMD Ryzen AI 9 HX 370 (4421 - 5843, n=16) | |
| Average of class Gaming (1339 - 10389, n=149, last 2 years) | |
| Alienware x16 R2 P120F | |
| Asus ROG Zephyrus G16 GU605MY | |
| AIDA64 / CPU Queen | |
| SCHENKER XMG Neo 16 (Early 24) | |
| Razer Blade 16 2024, RTX 4090 | |
| Lenovo Legion 9 16IRX9, RTX 4090 | |
| Average of class Gaming (50699 - 200651, n=149, last 2 years) | |
| Alienware x16 R2 P120F | |
| Asus ROG Zephyrus G16 GU605MY | |
| Razer Blade 16 2025 RTX 5090 | |
| Average AMD Ryzen AI 9 HX 370 (41744 - 99088, n=16) | |
| AIDA64 / FPU SinJulia | |
| Razer Blade 16 2025 RTX 5090 | |
| Average AMD Ryzen AI 9 HX 370 (16445 - 19115, n=16) | |
| SCHENKER XMG Neo 16 (Early 24) | |
| Lenovo Legion 9 16IRX9, RTX 4090 | |
| Razer Blade 16 2024, RTX 4090 | |
| Average of class Gaming (4800 - 32988, n=149, last 2 years) | |
| Alienware x16 R2 P120F | |
| Asus ROG Zephyrus G16 GU605MY | |
| AIDA64 / FPU Mandel | |
| SCHENKER XMG Neo 16 (Early 24) | |
| Razer Blade 16 2025 RTX 5090 | |
| Lenovo Legion 9 16IRX9, RTX 4090 | |
| Average AMD Ryzen AI 9 HX 370 (50357 - 79251, n=15) | |
| Razer Blade 16 2024, RTX 4090 | |
| Average of class Gaming (12321 - 134044, n=149, last 2 years) | |
| Alienware x16 R2 P120F | |
| Asus ROG Zephyrus G16 GU605MY | |
| AIDA64 / CPU AES | |
| SCHENKER XMG Neo 16 (Early 24) | |
| Lenovo Legion 9 16IRX9, RTX 4090 | |
| Razer Blade 16 2024, RTX 4090 | |
| Average of class Gaming (19065 - 328679, n=149, last 2 years) | |
| Alienware x16 R2 P120F | |
| Asus ROG Zephyrus G16 GU605MY | |
| Razer Blade 16 2025 RTX 5090 | |
| Average AMD Ryzen AI 9 HX 370 (67015 - 96781, n=16) | |
| AIDA64 / CPU ZLib | |
| SCHENKER XMG Neo 16 (Early 24) | |
| Lenovo Legion 9 16IRX9, RTX 4090 | |
| Razer Blade 16 2024, RTX 4090 | |
| Razer Blade 16 2025 RTX 5090 | |
| Average AMD Ryzen AI 9 HX 370 (1077 - 1530, n=16) | |
| Average of class Gaming (373 - 2531, n=149, last 2 years) | |
| Alienware x16 R2 P120F | |
| Asus ROG Zephyrus G16 GU605MY | |
| AIDA64 / FP64 Ray-Trace | |
| Razer Blade 16 2025 RTX 5090 | |
| Average AMD Ryzen AI 9 HX 370 (13665 - 20608, n=16) | |
| SCHENKER XMG Neo 16 (Early 24) | |
| Lenovo Legion 9 16IRX9, RTX 4090 | |
| Razer Blade 16 2024, RTX 4090 | |
| Average of class Gaming (2540 - 43430, n=149, last 2 years) | |
| Alienware x16 R2 P120F | |
| Asus ROG Zephyrus G16 GU605MY | |
| AIDA64 / CPU PhotoWorxx | |
| Lenovo Legion 9 16IRX9, RTX 4090 | |
| Alienware x16 R2 P120F | |
| Asus ROG Zephyrus G16 GU605MY | |
| Razer Blade 16 2025 RTX 5090 | |
| Razer Blade 16 2024, RTX 4090 | |
| SCHENKER XMG Neo 16 (Early 24) | |
| Average AMD Ryzen AI 9 HX 370 (36752 - 51727, n=16) | |
| Average of class Gaming (10805 - 60161, n=149, last 2 years) | |
系统性能
不出所料,新款 Blade 16 是一款速度极快的笔记本电脑,在合成基准测试中也表现出色。我们在测试过程中没有遇到任何问题。只有高级 Optimus 图形切换功能会导致一些轻微的延迟,例如在启动游戏时。
CrossMark: Overall | Productivity | Creativity | Responsiveness
WebXPRT 3: Overall
WebXPRT 4: Overall
Mozilla Kraken 1.1: Total
| PCMark 10 / Score | |
| SCHENKER XMG Neo 16 (Early 24) | |
| Razer Blade 16 2024, RTX 4090 | |
| Razer Blade 16 2025 RTX 5090 | |
| Average AMD Ryzen AI 9 HX 370, Nvidia GeForce RTX 5090 Laptop (n=1) | |
| Lenovo Legion 9 16IRX9, RTX 4090 | |
| Asus ROG Zephyrus G16 GU605MY | |
| Average of class Gaming (5776 - 9852, n=132, last 2 years) | |
| Alienware x16 R2 P120F | |
| PCMark 10 / Essentials | |
| SCHENKER XMG Neo 16 (Early 24) | |
| Lenovo Legion 9 16IRX9, RTX 4090 | |
| Razer Blade 16 2024, RTX 4090 | |
| Asus ROG Zephyrus G16 GU605MY | |
| Average of class Gaming (9057 - 12600, n=132, last 2 years) | |
| Razer Blade 16 2025 RTX 5090 | |
| Average AMD Ryzen AI 9 HX 370, Nvidia GeForce RTX 5090 Laptop (n=1) | |
| Alienware x16 R2 P120F | |
| PCMark 10 / Productivity | |
| SCHENKER XMG Neo 16 (Early 24) | |
| Razer Blade 16 2024, RTX 4090 | |
| Razer Blade 16 2025 RTX 5090 | |
| Average AMD Ryzen AI 9 HX 370, Nvidia GeForce RTX 5090 Laptop (n=1) | |
| Lenovo Legion 9 16IRX9, RTX 4090 | |
| Asus ROG Zephyrus G16 GU605MY | |
| Average of class Gaming (6662 - 14612, n=132, last 2 years) | |
| Alienware x16 R2 P120F | |
| PCMark 10 / Digital Content Creation | |
| SCHENKER XMG Neo 16 (Early 24) | |
| Razer Blade 16 2025 RTX 5090 | |
| Average AMD Ryzen AI 9 HX 370, Nvidia GeForce RTX 5090 Laptop (n=1) | |
| Lenovo Legion 9 16IRX9, RTX 4090 | |
| Razer Blade 16 2024, RTX 4090 | |
| Alienware x16 R2 P120F | |
| Asus ROG Zephyrus G16 GU605MY | |
| Average of class Gaming (6807 - 18475, n=132, last 2 years) | |
| CrossMark / Productivity | |
| SCHENKER XMG Neo 16 (Early 24) | |
| Apple MacBook Pro 16 M4 Max | |
| Razer Blade 16 2024, RTX 4090 | |
| Average of class Gaming (1299 - 2204, n=113, last 2 years) | |
| Lenovo Legion 9 16IRX9, RTX 4090 | |
| Asus ROG Zephyrus G16 GU605MY | |
| Alienware x16 R2 P120F | |
| CrossMark / Responsiveness | |
| SCHENKER XMG Neo 16 (Early 24) | |
| Razer Blade 16 2024, RTX 4090 | |
| Lenovo Legion 9 16IRX9, RTX 4090 | |
| Average of class Gaming (1030 - 2330, n=113, last 2 years) | |
| Alienware x16 R2 P120F | |
| Apple MacBook Pro 16 M4 Max | |
| Asus ROG Zephyrus G16 GU605MY | |
| WebXPRT 3 / Overall | |
| Apple MacBook Pro 16 M4 Max | |
| SCHENKER XMG Neo 16 (Early 24) | |
| Razer Blade 16 2024, RTX 4090 | |
| Razer Blade 16 2025 RTX 5090 | |
| Average AMD Ryzen AI 9 HX 370, Nvidia GeForce RTX 5090 Laptop (n=1) | |
| Average of class Gaming (215 - 480, n=129, last 2 years) | |
| Asus ROG Zephyrus G16 GU605MY | |
| Lenovo Legion 9 16IRX9, RTX 4090 | |
| Alienware x16 R2 P120F | |
| WebXPRT 4 / Overall | |
| Apple MacBook Pro 16 M4 Max | |
| SCHENKER XMG Neo 16 (Early 24) | |
| Asus ROG Zephyrus G16 GU605MY | |
| Razer Blade 16 2025 RTX 5090 | |
| Average AMD Ryzen AI 9 HX 370, Nvidia GeForce RTX 5090 Laptop (n=1) | |
| Average of class Gaming (176.4 - 335, n=115, last 2 years) | |
| Lenovo Legion 9 16IRX9, RTX 4090 | |
| Alienware x16 R2 P120F | |
| Mozilla Kraken 1.1 / Total | |
| Alienware x16 R2 P120F | |
| Lenovo Legion 9 16IRX9, RTX 4090 | |
| Asus ROG Zephyrus G16 GU605MY | |
| Average of class Gaming (408 - 674, n=141, last 2 years) | |
| Razer Blade 16 2024, RTX 4090 | |
| Razer Blade 16 2025 RTX 5090 | |
| Average AMD Ryzen AI 9 HX 370, Nvidia GeForce RTX 5090 Laptop (n=1) | |
| SCHENKER XMG Neo 16 (Early 24) | |
| Apple MacBook Pro 16 M4 Max | |
* ... smaller is better
| PCMark 10 Score | 8254 points | |
Help | ||
| AIDA64 / Memory Copy | |
| Asus ROG Zephyrus G16 GU605MY | |
| Razer Blade 16 2025 RTX 5090 | |
| Alienware x16 R2 P120F | |
| Average AMD Ryzen AI 9 HX 370 (72702 - 93640, n=16) | |
| Lenovo Legion 9 16IRX9, RTX 4090 | |
| SCHENKER XMG Neo 16 (Early 24) | |
| Razer Blade 16 2024, RTX 4090 | |
| Average of class Gaming (21750 - 97515, n=149, last 2 years) | |
| AIDA64 / Memory Read | |
| Razer Blade 16 2025 RTX 5090 | |
| Average AMD Ryzen AI 9 HX 370 (84635 - 102937, n=16) | |
| SCHENKER XMG Neo 16 (Early 24) | |
| Razer Blade 16 2024, RTX 4090 | |
| Asus ROG Zephyrus G16 GU605MY | |
| Alienware x16 R2 P120F | |
| Lenovo Legion 9 16IRX9, RTX 4090 | |
| Average of class Gaming (22956 - 102937, n=149, last 2 years) | |
| AIDA64 / Memory Write | |
| Razer Blade 16 2025 RTX 5090 | |
| Average AMD Ryzen AI 9 HX 370 (83907 - 108954, n=16) | |
| Lenovo Legion 9 16IRX9, RTX 4090 | |
| SCHENKER XMG Neo 16 (Early 24) | |
| Asus ROG Zephyrus G16 GU605MY | |
| Razer Blade 16 2024, RTX 4090 | |
| Alienware x16 R2 P120F | |
| Average of class Gaming (22297 - 108954, n=149, last 2 years) | |
| AIDA64 / Memory Latency | |
| Alienware x16 R2 P120F | |
| Asus ROG Zephyrus G16 GU605MY | |
| Average AMD Ryzen AI 9 HX 370 (87.2 - 119.4, n=16) | |
| Razer Blade 16 2025 RTX 5090 | |
| Average of class Gaming (59.5 - 259, n=149, last 2 years) | |
| Lenovo Legion 9 16IRX9, RTX 4090 | |
| Razer Blade 16 2024, RTX 4090 | |
| SCHENKER XMG Neo 16 (Early 24) | |
* ... smaller is better
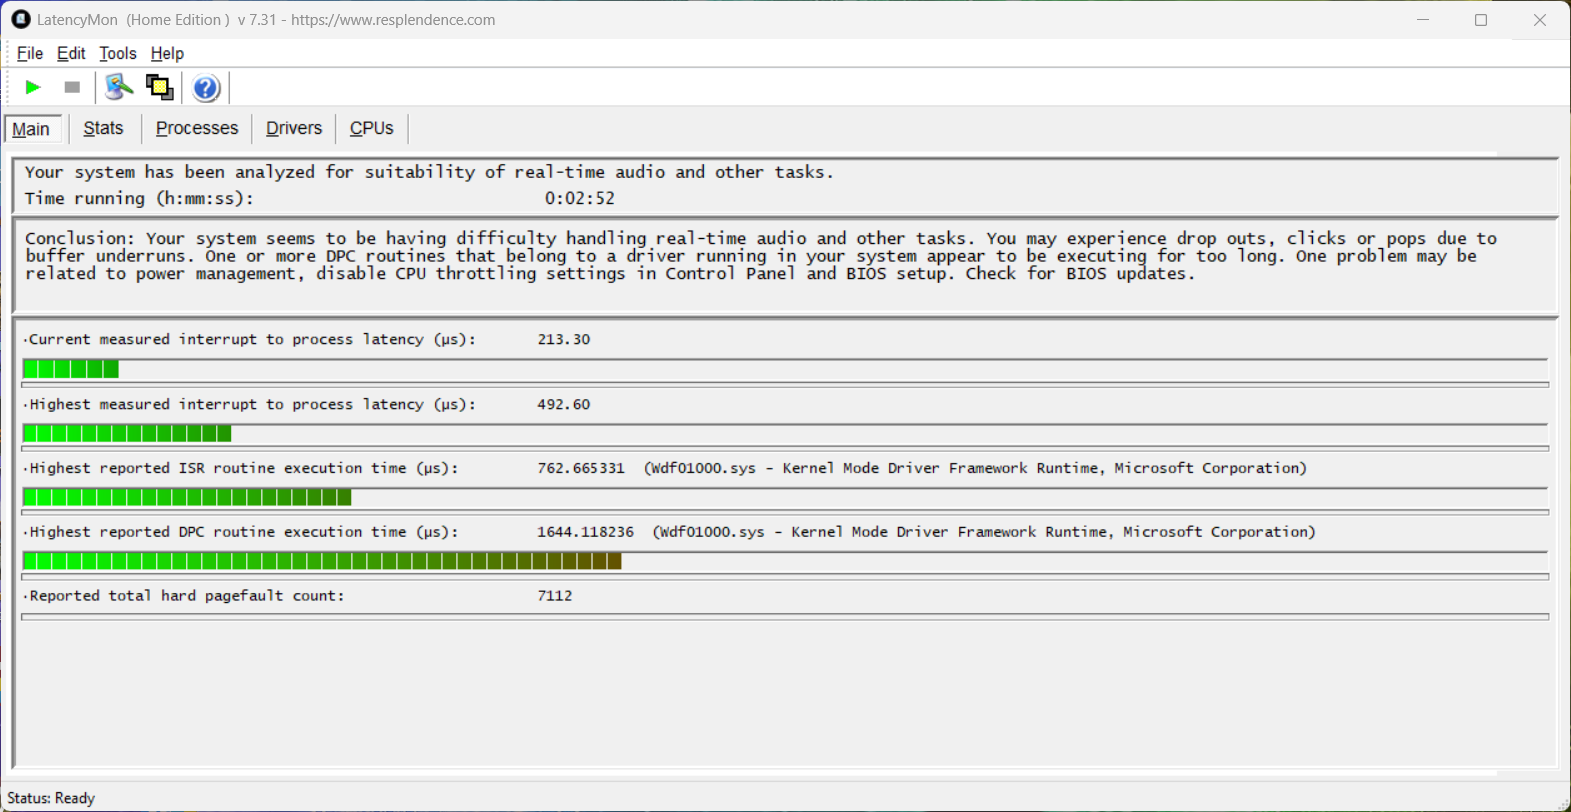
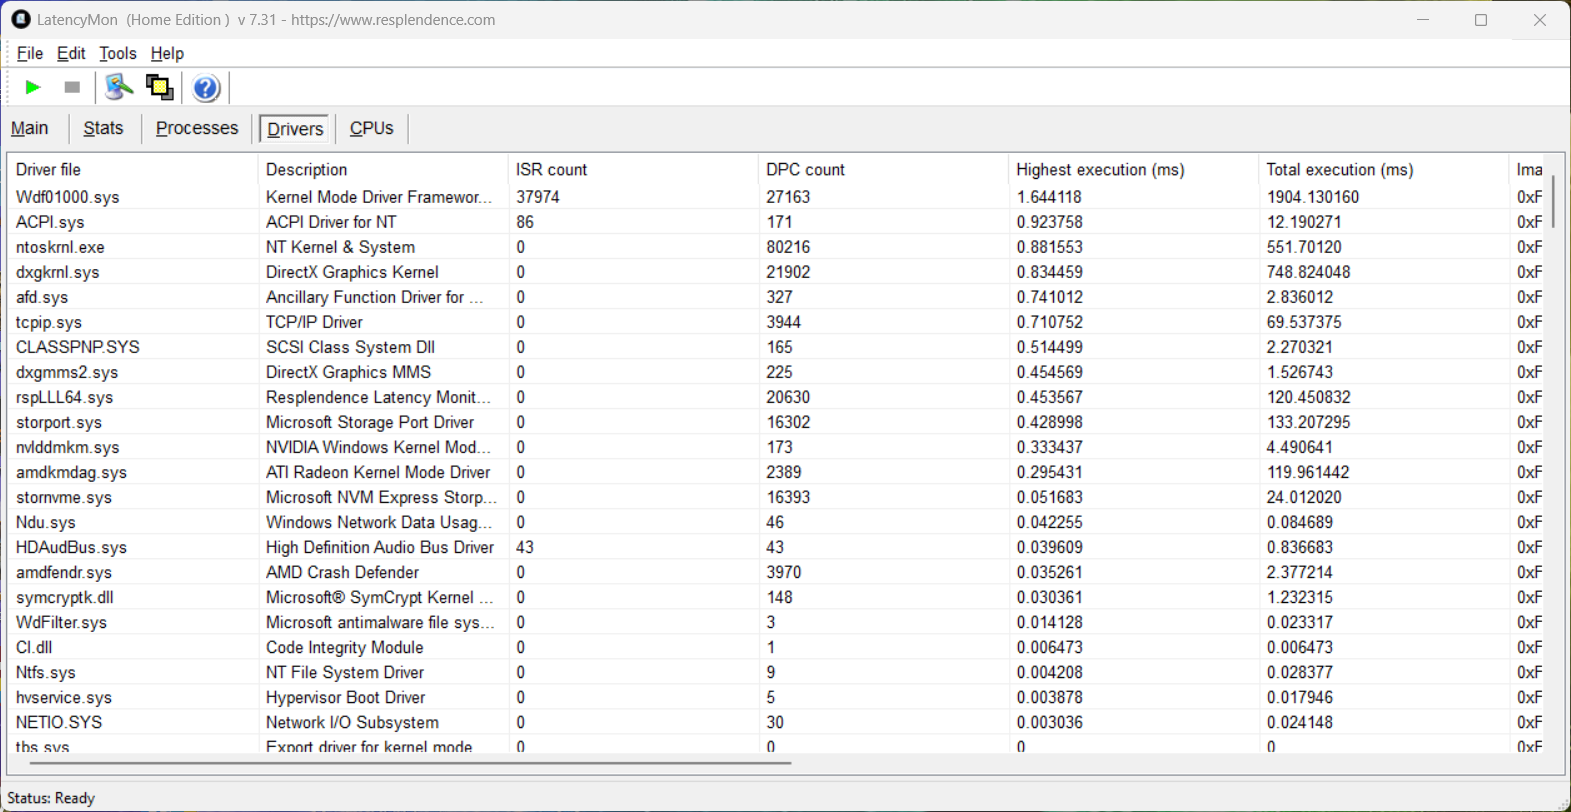
DPC 延迟
在我们的标准化延迟测试(上网、4K YouTube 视频、CPU 负载)中,采用当前 BIOS 版本的 Razer 笔记本电脑没有显示出任何限制。尽管有一个驱动程序给出了一些提示,但重要的 "中断到进程延迟 "值很低。
| DPC Latencies / LatencyMon - interrupt to process latency (max), Web, Youtube, Prime95 | |
| Alienware x16 R2 P120F | |
| Asus ROG Zephyrus G16 GU605MY | |
| SCHENKER XMG Neo 16 (Early 24) | |
| Lenovo Legion 9 16IRX9, RTX 4090 | |
| Razer Blade 16 2024, RTX 4090 | |
| Razer Blade 16 2025 RTX 5090 | |
* ... smaller is better
存储解决方案
我们的测试设备使用的是著名的 SSSTC CA6 的 2-TB 版本,它的传输速率非常高,即使在较长的负载下也能保持稳定的速度。

* ... smaller is better
Disk Throttling: DiskSpd Read Loop, Queue Depth 8
图形卡
我们测试的刀锋 16 2025 配备了新的 英伟达GeForce RTX 5090 笔记本电脑配备 24GB VRAM(GDDR7)。图形切换通过 Advanced Optimus 进行,最大 TGP 为 160 瓦(135 瓦 + 最大 25 瓦 Dynamic Boost)。您可以在我们的 我们的 GPU 分析.
合成基准测试的结果喜忧参半:旧版 Blade 16 在所有测试中都被超越,RTX 5090 笔记本电脑根据测试的不同领先 7% 到 20%,而 XMG Neo 16 中的 RTX 4090 笔记本电脑有时表现与旧版 Blade 16 相当。在创作者基准测试(PugetBench)中,5090 笔记本电脑与旧版 RTX 4090 笔记本电脑相比并无优势,但在剪切视频时,额外的 8 GB VRAM 代表着明显的优势。在 Procyon AI 测试中,5090 笔记本电脑领先约 15-17%。在持续负载下,GPU 性能保持稳定。
| GFXBench | |
| 3840x2160 4K Aztec Ruins High Tier Offscreen | |
| Average Nvidia GeForce RTX 5090 Laptop (243 - 267, n=2) | |
| Razer Blade 16 2025 RTX 5090 | |
| Apple MacBook Pro 16 M4 Max | |
| Average of class Gaming (27.3 - 243, n=5, last 2 years) | |
| Razer Blade 17 Early 2022 | |
| 2560x1440 Aztec Ruins High Tier Offscreen | |
| Apple MacBook Pro 16 M4 Max | |
| Average Nvidia GeForce RTX 5090 Laptop (466 - 557, n=2) | |
| Razer Blade 16 2025 RTX 5090 | |
| Average of class Gaming (58.3 - 518, n=5, last 2 years) | |
| Razer Blade 17 Early 2022 | |
| 3DMark 06 Standard Score | 64778 points | |
| 3DMark Vantage P Result | 111238 points | |
| 3DMark 11 Performance | 45291 points | |
| 3DMark Fire Strike Score | 37321 points | |
| 3DMark Time Spy Score | 18898 points | |
| 3DMark Steel Nomad Score | 5652 points | |
| 3DMark Steel Nomad Light Score | 22897 points | |
| 3DMark Steel Nomad Light Unlimited Score | 25160 points | |
Help | ||
| Blender / v3.3 Classroom OPTIX/RTX | |
| Average of class Gaming (10 - 95, n=144, last 2 years) | |
| Alienware x16 R2 P120F | |
| Average Nvidia GeForce RTX 5090 Laptop (10 - 20, n=7) | |
| Asus ROG Zephyrus G16 GU605MY | |
| Lenovo Legion 9 16IRX9, RTX 4090 | |
| SCHENKER XMG Neo 16 (Early 24) | |
| Razer Blade 16 2025 RTX 5090 | |
| Razer Blade 16 2024, RTX 4090 | |
| Blender / v3.3 Classroom CUDA | |
| Average Nvidia GeForce RTX 5090 Laptop (16 - 156, n=7) | |
| Average of class Gaming (16 - 156, n=147, last 2 years) | |
| Alienware x16 R2 P120F | |
| Asus ROG Zephyrus G16 GU605MY | |
| Razer Blade 16 2025 RTX 5090 | |
| Razer Blade 16 2024, RTX 4090 | |
| Lenovo Legion 9 16IRX9, RTX 4090 | |
| SCHENKER XMG Neo 16 (Early 24) | |
| Blender / v3.3 Classroom CPU | |
| Asus ROG Zephyrus G16 GU605MY | |
| Alienware x16 R2 P120F | |
| Average of class Gaming (123 - 962, n=152, last 2 years) | |
| Razer Blade 16 2025 RTX 5090 | |
| Razer Blade 16 2024, RTX 4090 | |
| Lenovo Legion 9 16IRX9, RTX 4090 | |
| SCHENKER XMG Neo 16 (Early 24) | |
| Apple MacBook Pro 16 M4 Max | |
| Average Nvidia GeForce RTX 5090 Laptop (125 - 259, n=7) | |
| Blender / v3.3 Classroom METAL | |
| Apple MacBook Pro 16 M4 Max | |
| Blender / v4.3 Barbershop OPTIX | |
| Average Nvidia GeForce RTX 5090 Laptop (48 - 286, n=3) | |
| Average of class Gaming (48 - 310, n=5, last 2 years) | |
| Razer Blade 16 2025 RTX 5090 | |
* ... smaller is better
| DaVinci Resolve PugetBench | |
| Standard Score 1.1 | |
| Razer Blade 16 2025 RTX 5090 | |
| Extended Score 1.1 | |
| Apple MacBook Pro 16 M4 Max | |
| Razer Blade 16 2025 RTX 5090 | |
| Razer Blade 16 2024, RTX 4090 | |
| Asus ROG Zephyrus G16 GA605WI | |
| Lenovo Yoga Pro 9 16IMH9 | |
| Photoshop PugetBench - Overall Score 1.01 | |
| Apple MacBook Pro 16 M4 Max | |
| Asus ROG Strix Scar 17 G733PYV-LL053X | |
| Razer Blade 16 2025 RTX 5090 | |
| Razer Blade 16 2024, RTX 4090 | |
| Premiere Pro PugetBench - Overall Score 1.1 | |
| Razer Blade 16 2025 RTX 5090 | |
| Apple MacBook Pro 16 M4 Max | |
| Asus ROG Strix Scar 17 G733PYV-LL053X | |
| Razer Blade 16 2024, RTX 4090 | |
| UL Procyon for Windows / | |
| Lenovo Yoga Pro 9 16IMH9 | |
| Asus ROG Zephyrus G16 GA605WI | |
| Alienware m18 R2 | |
| Razer Blade 16 2025 RTX 5090 | |
| UL Procyon for Windows / | |
| Razer Blade 16 2025 RTX 5090 | |
| Alienware m18 R2 | |
| Asus ROG Zephyrus G16 GA605WI | |
| Lenovo Yoga Pro 9 16IMH9 | |
* ... smaller is better
游戏性能
现在我们来看看游戏性能,其中我们区分了原生测试和升级基准测试。在这一点上,GeForce RTX 5000 系列的全新多帧生成技术尤其引人关注。在原生测试中,你可以清楚地看到较弱的 AMD 处理器限制了 1080p 的性能,这也是新的 Blade 16 在这里表现不如预期的原因。从 QHD 分辨率开始,情况就发生了变化,在 4K 分辨率下,5090 笔记本电脑的优势非常明显,甚至在激活光线追踪后还会增加。
| Cyberpunk 2077 2.2 Phantom Liberty - 1920x1080 Ultra Preset (FSR off) | |
| SCHENKER XMG Neo 16 (Early 24) | |
| Lenovo Legion 9 16IRX9, RTX 4090 | |
| Razer Blade 16 2025 RTX 5090 | |
| Alienware x16 R2 P120F | |
| Razer Blade 16 2024, RTX 4090 | |
| Asus ROG Zephyrus G16 GU605MY | |
| Razer Blade 17 Early 2022 | |
| Average of class Gaming (6.76 - 158, n=91, last 2 years) | |
| Apple MacBook Pro 16 M4 Max | |
| GTA V - 1920x1080 Highest Settings possible AA:4xMSAA + FX AF:16x | |
| SCHENKER XMG Neo 16 (Early 24) | |
| Razer Blade 16 2024, RTX 4090 | |
| Lenovo Legion 9 16IRX9, RTX 4090 | |
| Razer Blade 16 2025 RTX 5090 | |
| Average of class Gaming (12.1 - 168.2, n=131, last 2 years) | |
| Asus ROG Zephyrus G16 GU605MY | |
| Razer Blade 17 Early 2022 | |
| GTA V - 2560x1440 Highest Settings possible AA:4xMSAA + FX AF:16x | |
| SCHENKER XMG Neo 16 (Early 24) | |
| Lenovo Legion 9 16IRX9, RTX 4090 | |
| Average Nvidia GeForce RTX 5090 Laptop (121.4 - 156.8, n=3) | |
| Razer Blade 16 2024, RTX 4090 | |
| Razer Blade 16 2025 RTX 5090 | |
| Average of class Gaming (36.9 - 163.3, n=81, last 2 years) | |
| Asus ROG Zephyrus G16 GU605MY | |
| Razer Blade 17 Early 2022 | |
| Assassin's Creed Shadows - 2560x1440 Ultra High | |
| Razer Blade 16 2024, RTX 4090 | |
| Razer Blade 16 2025 RTX 5090 | |
| Average Nvidia GeForce RTX 5090 Laptop (37 - 59, n=4) | |
| Average of class Gaming (33 - 65, n=9, last 2 years) | |
| Monster Hunter Wilds - 2560x1440 ultra, RT: high, no upscaling | |
| Average Nvidia GeForce RTX 5090 Laptop (54 - 75, n=5) | |
| Average of class Gaming (54 - 73.2, n=8, last 2 years) | |
| Razer Blade 16 2025 RTX 5090 | |
| Razer Blade 16 2024, RTX 4090 | |
| Black Myth: Wukong - 2560x1440 cinematic TSR 100 | |
| Average Nvidia GeForce RTX 5090 Laptop (44 - 48, n=2) | |
| Razer Blade 16 2025 RTX 5090 | |
| Razer Blade 16 2024, RTX 4090 | |
| Asus ROG Zephyrus G16 GU605MY | |
| Average of class Gaming (19 - 44, n=7, last 2 years) | |
| Indiana Jones and the Great Circle - 2560x1440 Very Ultra Preset | |
| Razer Blade 16 2025 RTX 5090 | |
| Average Nvidia GeForce RTX 5090 Laptop (66.1 - 112.9, n=5) | |
| Razer Blade 16 2024, RTX 4090 | |
| Average of class Gaming (66.1 - 102.2, n=6, last 2 years) | |
| Cyberpunk 2077 2.2 Phantom Liberty - 3840x2160 Ultra Preset (FSR off) | |
| Razer Blade 16 2025 RTX 5090 | |
| Average Nvidia GeForce RTX 5090 Laptop (39.6 - 53.1, n=5) | |
| Razer Blade 16 2024, RTX 4090 | |
| Average of class Gaming (13.8 - 52.1, n=25, last 2 years) | |
| Asus ROG Zephyrus G16 GU605MY | |
| Alienware x16 R2 P120F | |
| Razer Blade 17 Early 2022 | |
| GTA V - 3840x2160 Highest Settings possible AA:4xMSAA + FX AF:16x | |
| Average Nvidia GeForce RTX 5090 Laptop (84.4 - 110.3, n=2) | |
| Razer Blade 16 2025 RTX 5090 | |
| Razer Blade 16 2024, RTX 4090 | |
| Lenovo Legion 9 16IRX9, RTX 4090 | |
| Asus ROG Zephyrus G16 GU605MY | |
| Average of class Gaming (33.6 - 110.3, n=26, last 2 years) | |
| Razer Blade 17 Early 2022 | |
| Final Fantasy XV Benchmark - 3840x2160 High Quality | |
| Average Nvidia GeForce RTX 5090 Laptop (96.8 - 101.3, n=3) | |
| Razer Blade 16 2025 RTX 5090 | |
| Alienware x16 R2 P120F | |
| Asus ROG Zephyrus G16 GU605MY | |
| Average of class Gaming (32.6 - 101.3, n=36, last 2 years) | |
| Razer Blade 17 Early 2022 | |
| Assassin's Creed Shadows - 3840x2160 Ultra High | |
| Average Nvidia GeForce RTX 5090 Laptop (35 - 39, n=3) | |
| Average of class Gaming (34 - 45, n=6, last 2 years) | |
| Razer Blade 16 2025 RTX 5090 | |
| Razer Blade 16 2024, RTX 4090 | |
| Monster Hunter Wilds - 3840x2160 ultra, RT: high, no upscaling | |
| Razer Blade 16 2025 RTX 5090 | |
| Average Nvidia GeForce RTX 5090 Laptop (33.4 - 48.5, n=5) | |
| Average of class Gaming (33.4 - 46.3, n=7, last 2 years) | |
| Razer Blade 16 2024, RTX 4090 | |
| Alan Wake 2 - 3840x2160 High Preset | |
| Razer Blade 16 2025 RTX 5090 | |
| Average Nvidia GeForce RTX 5090 Laptop (33.4 - 47.7, n=4) | |
| Razer Blade 16 2024, RTX 4090 | |
| Average of class Gaming (12.3 - 46, n=11, last 2 years) | |
| F1 24 - 3840x2160 Ultra High Preset AA:T AF:16x | |
| Average Nvidia GeForce RTX 5090 Laptop (48.8 - 54.2, n=3) | |
| Razer Blade 16 2025 RTX 5090 | |
| Average of class Gaming (21.8 - 52, n=6, last 2 years) | |
| Asus ROG Zephyrus G16 GU605MY | |
| Black Myth: Wukong - 3840x2160 cinematic TSR 100 | |
| Average Nvidia GeForce RTX 5090 Laptop (27 - 33, n=2) | |
| Razer Blade 16 2025 RTX 5090 | |
| Razer Blade 16 2024, RTX 4090 | |
| Average of class Gaming (12.6 - 27, n=5, last 2 years) | |
| Indiana Jones and the Great Circle - 3840x2160 Very Ultra Preset | |
| Average Nvidia GeForce RTX 5090 Laptop (48.2 - 70.8, n=5) | |
| Razer Blade 16 2025 RTX 5090 | |
| Average of class Gaming (48.2 - 65, n=6, last 2 years) | |
| Razer Blade 16 2024, RTX 4090 | |
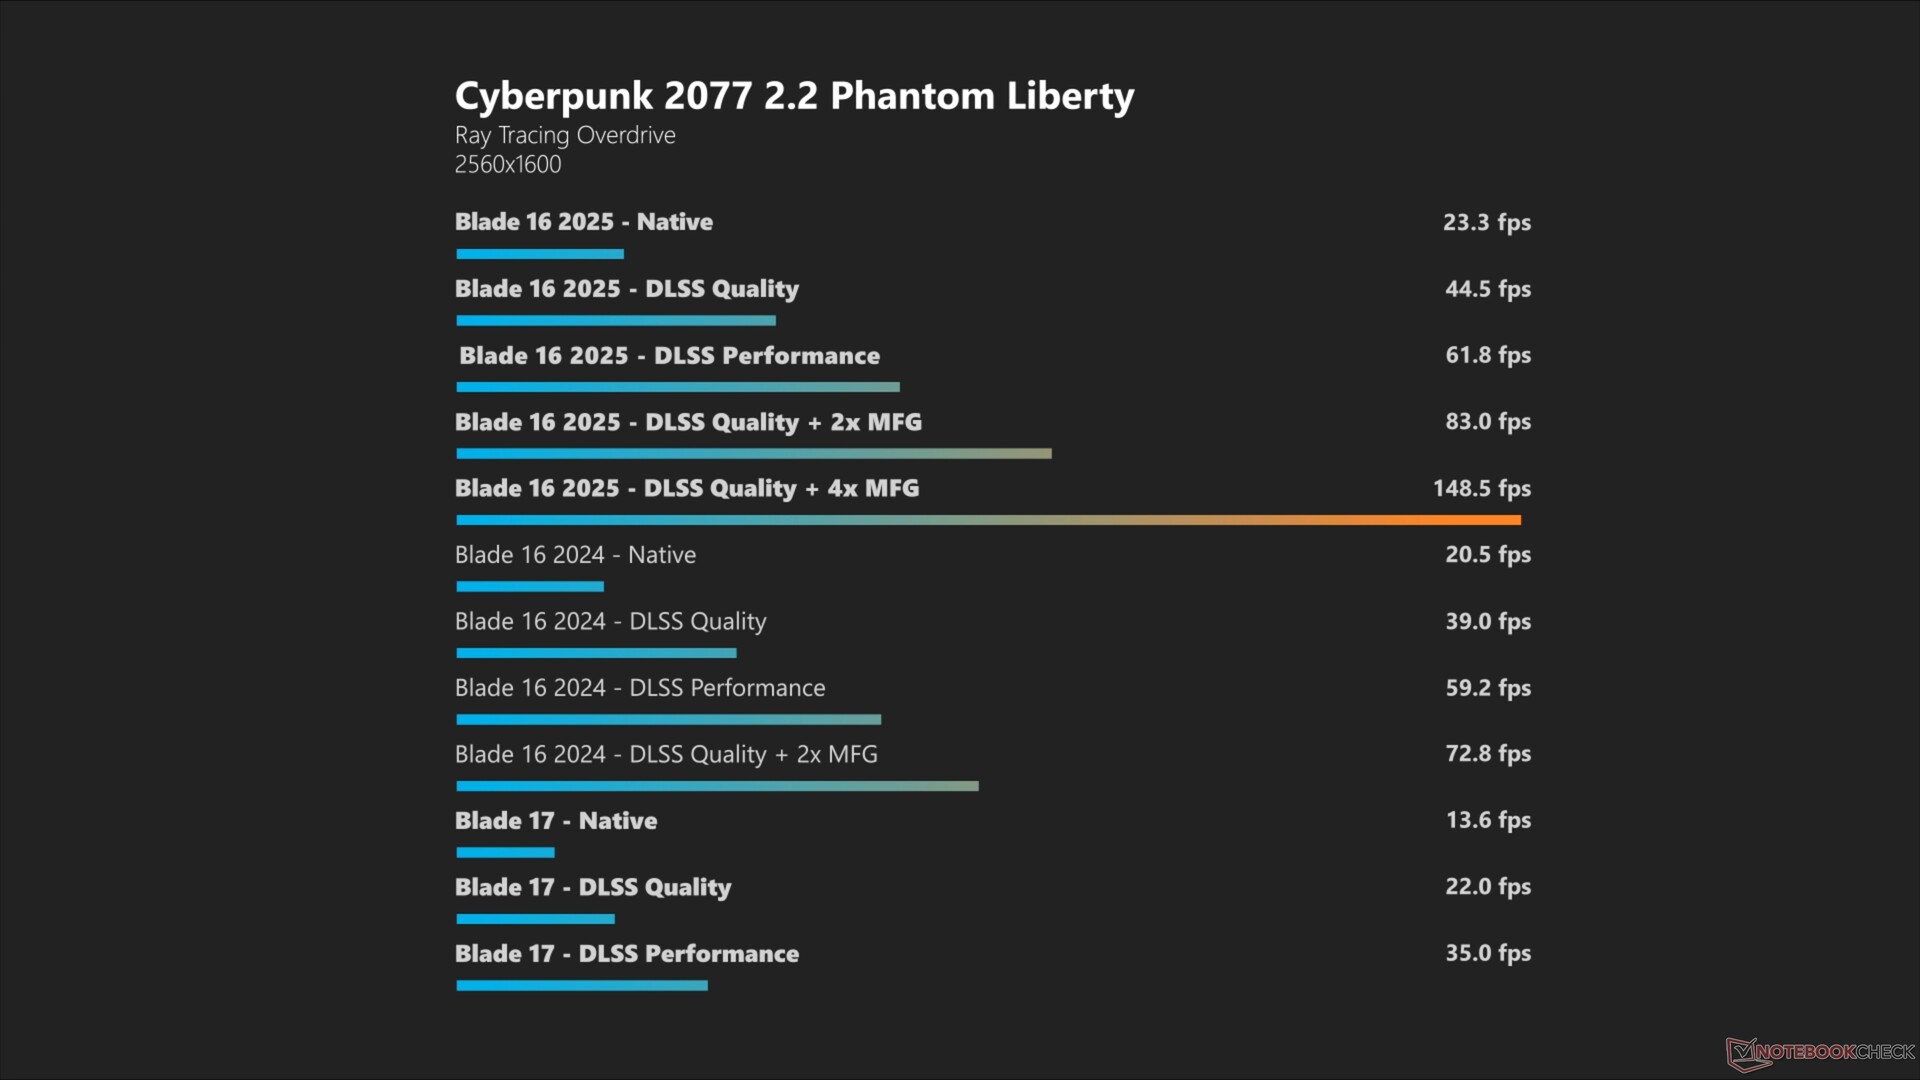
Cyberpunk 2077 Ultra FPS Chart
新一代GeForce 50xx 的主要功能是多帧生成。在我们使用《赛博朋克 2077》进行的测试中,我们看到了性能的大幅提升,尤其是在 MFG(x4) 中。但你必须小心,因为在游戏过程中,印象会发生变化,而且还有点取决于原生性能。例如,在 WQHD 分辨率下,MFG(x4) 运行得非常好,但在外接显示器的 4K 分辨率下,快速移动时图像看起来略显模糊。
| 分辨率 | 预设 | 原生 | DLSS(自动) | DLSS(自动)+ FG(x2) | DLSS(自动)+ FG(x4) |
|---|---|---|---|---|---|
| QHD | Ultra | 98.6 FPS | 104.3 FPS | 189.9 FPS | 321.2 FPS |
| QHD | RT Overdrive | 26.8 FPS | 58.4 FPS | 99.1 FPS | 185.1 FPS |
| 4K | Ultra | 50.7 FPS | 84.5 FPS | 130.9 FPS | 219.9 FPS |
| 4K | RT Overdrive | 12.6 FPS | 43.2 FPS | 69.2 FPS | 121.5 FPS |
通过《赛博朋克 2077》和《艾伦-威克 2》这两款游戏,我们还比较了 RTX 5090 笔记本电脑的游戏性能、 RTX 4090 笔记本电脑(刀锋 16 2024)和 RTX 3080 Ti 笔记本电脑(刀锋 17) 在所有可用的升频技术与最大设置相结合的情况下相互对比。在这里你可以清楚地看到,由于采用了 MFG(x4)技术,新的 5090 笔记本电脑与 RTX 4090 笔记本电脑相比优势明显。但在其他设置下,优势并不明显,不足以成为购买新产品的理由。另一方面,与 RTX 3080 Ti 笔记本电脑相比,其优势则非常明显。

| low | med. | high | ultra | QHD DLSS | QHD | 4K DLSS | 4K | |
|---|---|---|---|---|---|---|---|---|
| GTA V (2015) | 121.6 | 121.4 | 150.7 | |||||
| The Witcher 3 (2015) | 192 | 151 | 129 | |||||
| Dota 2 Reborn (2015) | 173.9 | 152.7 | 143.3 | 137.1 | 133 | |||
| Final Fantasy XV Benchmark (2018) | 174.7 | 167.8 | 147.4 | 139.5 | 96.8 | |||
| X-Plane 11.11 (2018) | 109.4 | 103.6 | 85.2 | 71.3 | ||||
| Strange Brigade (2018) | 404 | 341 | 322 | 319 | 303 | 174.6 | ||
| Baldur's Gate 3 (2023) | 180 | 175 | 163.5 | 162 | 138.8 | 124.2 | 79.1 | |
| Cyberpunk 2077 2.2 Phantom Liberty (2023) | 125.8 | 115.4 | 117.8 | 105.3 | 104.6 | 98.6 | 72.2 | 50.7 |
| Alan Wake 2 (2023) | 95.2 | 76.7 | 43 | |||||
| F1 24 (2024) | 236 | 236 | 236 | 133 | 94.9 | 80.5 | 48.8 | |
| Black Myth: Wukong (2024) | 57 | 64 | 44 | 46 | 27 | |||
| Indiana Jones and the Great Circle (2024) | 119.6 | 113.9 | 97.3 | 62.3 | ||||
| Monster Hunter Wilds (2025) | 68.06 | 68.57 | 65.61 | 57.59 | 44.07 | |||
| Assassin's Creed Shadows (2025) | 64 | 62 | 50 | 47 | 35 |
排放 - 大型蒸汽腔
噪音排放
Razer 使用两个风扇和一个巨大的蒸汽室进行散热。即使是非常简单的任务,风扇也几乎始终运转,产生约 30 分贝(A)的轻微呼啸声。在游戏时,噪音会达到 48 dB(A),在压力测试中最高可达 53 dB(A)。但为了公平起见,我们还必须提到 ROG Zephyrus G162024 的噪音更大,尽管其游戏性能更低。我们的测试设备没有产生任何其他电子噪音。
Noise Level
| Idle |
| 24.1 / 30.6 / 30.6 dB(A) |
| Load |
| 45.5 / 53.4 dB(A) |
 | ||
30 dB silent 40 dB(A) audible 50 dB(A) loud |
||
min: | ||
| Razer Blade 16 2025 RTX 5090 GeForce RTX 5090 Laptop, Ryzen AI 9 HX 370, SSSTC CA6-8D2048 | Apple MacBook Pro 16 M4 Max M4 Max 40-Core GPU, M4 Max (16 cores), Apple SSD AP1024Z | SCHENKER XMG Neo 16 (Early 24) NVIDIA GeForce RTX 4090 Laptop GPU, i9-14900HX, Samsung 990 Pro 1 TB | Alienware x16 R2 P120F NVIDIA GeForce RTX 4080 Laptop GPU, Ultra 9 185H, WDC PC SN810 1TB | Lenovo Legion 9 16IRX9, RTX 4090 NVIDIA GeForce RTX 4090 Laptop GPU, i9-14900HX, Micron 3400 2TB MTFDKBA2T0TFH | Asus ROG Zephyrus G16 GU605MY NVIDIA GeForce RTX 4090 Laptop GPU, Ultra 9 185H, Samsung PM9A1a MZVL22T0HDLB | Razer Blade 16 2024, RTX 4090 NVIDIA GeForce RTX 4090 Laptop GPU, i9-14900HX, Samsung PM9A1 MZVL22T0HBLB | |
|---|---|---|---|---|---|---|---|
| Noise | 12% | -6% | 9% | 12% | -2% | 9% | |
| off / environment * | 24.1 | 24.1 -0% | 26 -8% | 23.4 3% | 23 5% | 24.6 -2% | 23 5% |
| Idle Minimum * | 24.1 | 24.1 -0% | 28 -16% | 23.8 1% | 23 5% | 24.6 -2% | 23 5% |
| Idle Average * | 30.6 | 24.1 21% | 29 5% | 28.5 7% | 23 25% | 27.8 9% | 23 25% |
| Idle Maximum * | 30.6 | 24.1 21% | 31 -1% | 28.5 7% | 23 25% | 31.9 -4% | 27.66 10% |
| Load Average * | 45.5 | 42.2 7% | 51 -12% | 28.8 37% | 39 14% | 49.2 -8% | 43.76 4% |
| Cyberpunk 2077 ultra * | 48.2 | 42.2 12% | 52.3 -9% | ||||
| Load Maximum * | 53.4 | 42.2 21% | 56 -5% | 54.2 -1% | 55.56 -4% | 52.3 2% | 50.37 6% |
| Witcher 3 ultra * | 54 | 49.5 | 55.32 | 46.81 |
* ... smaller is better
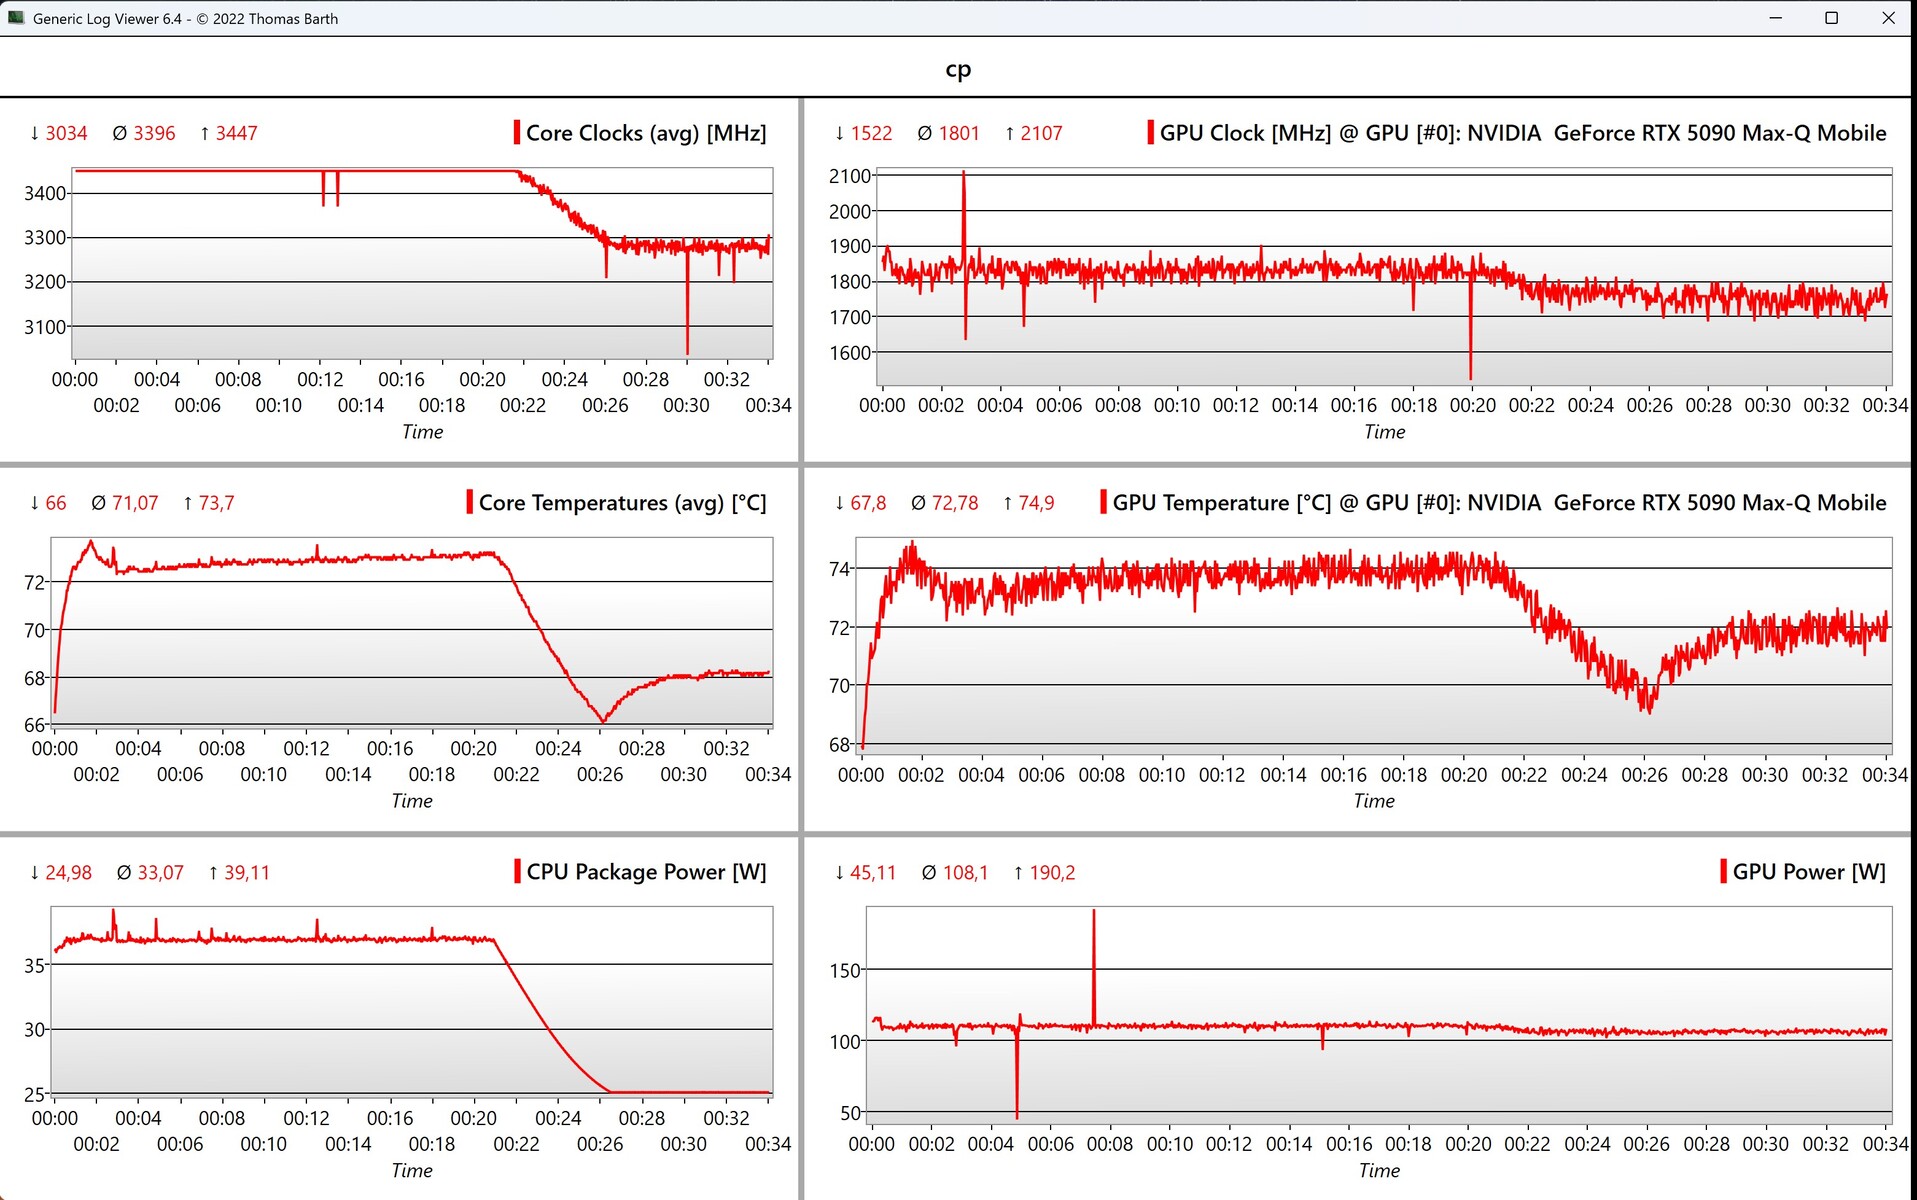
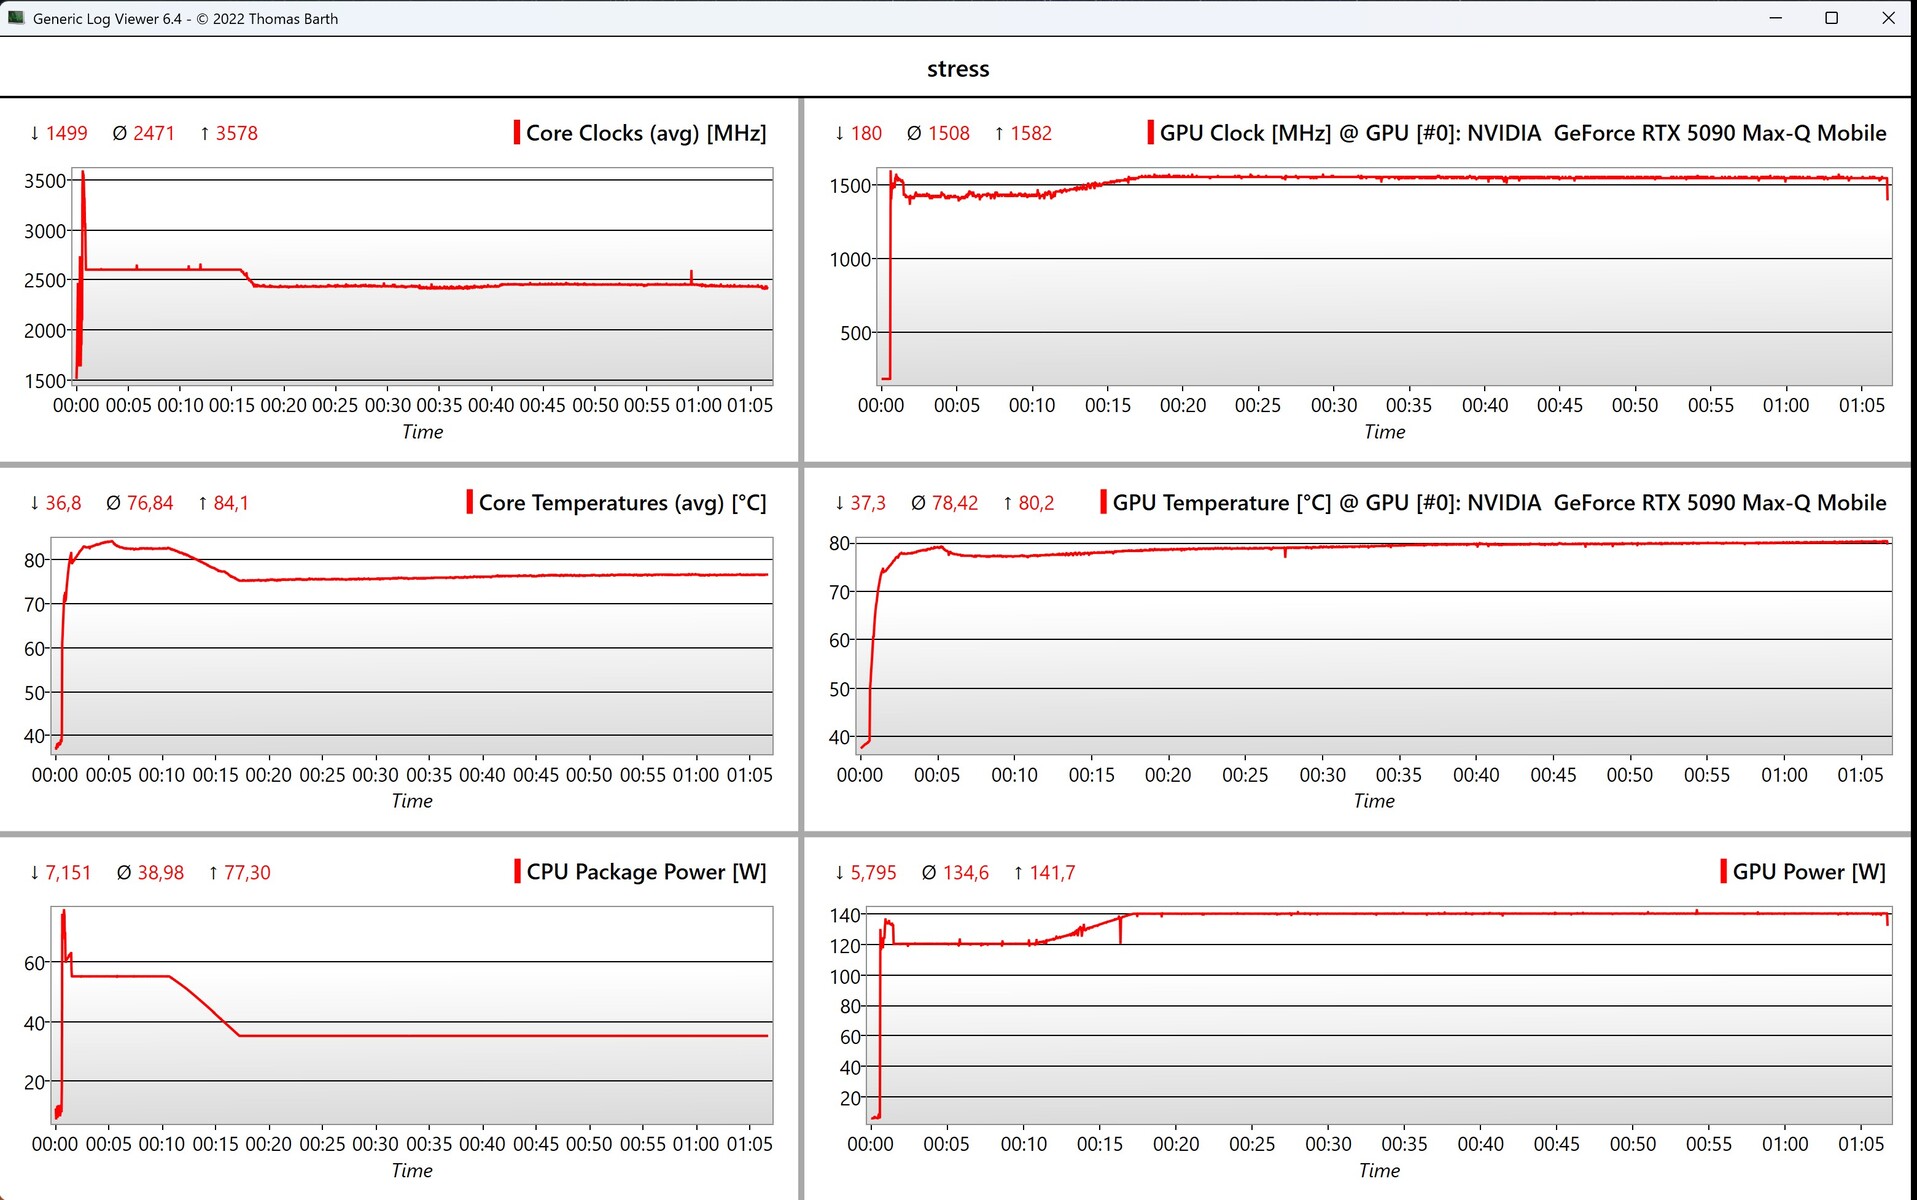
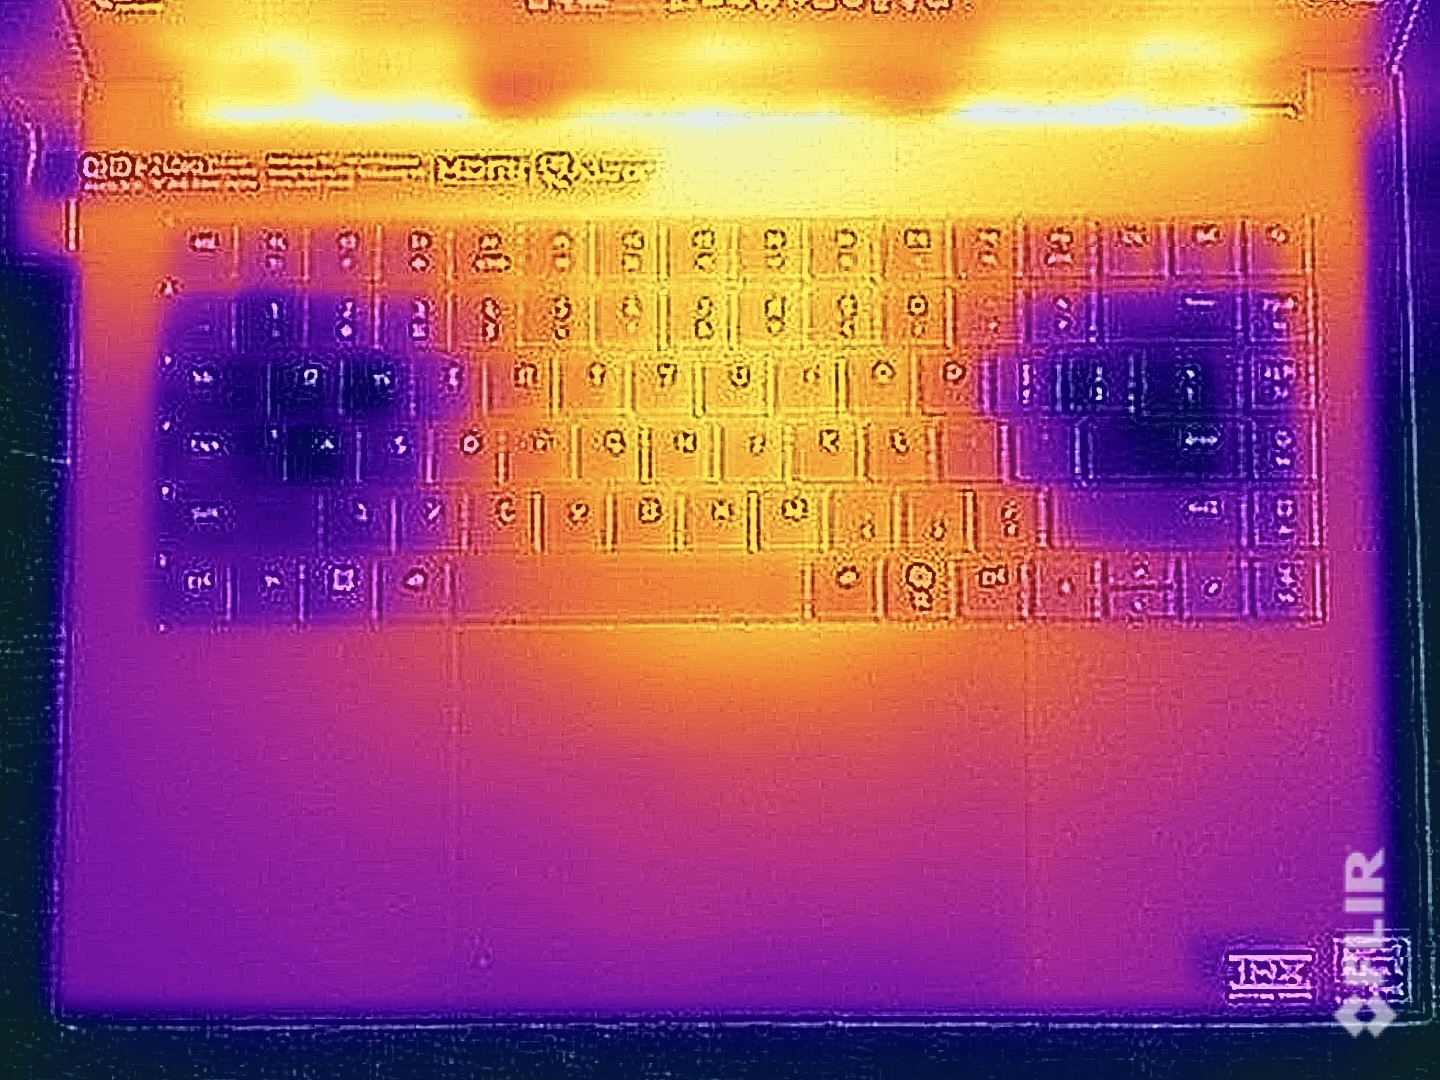
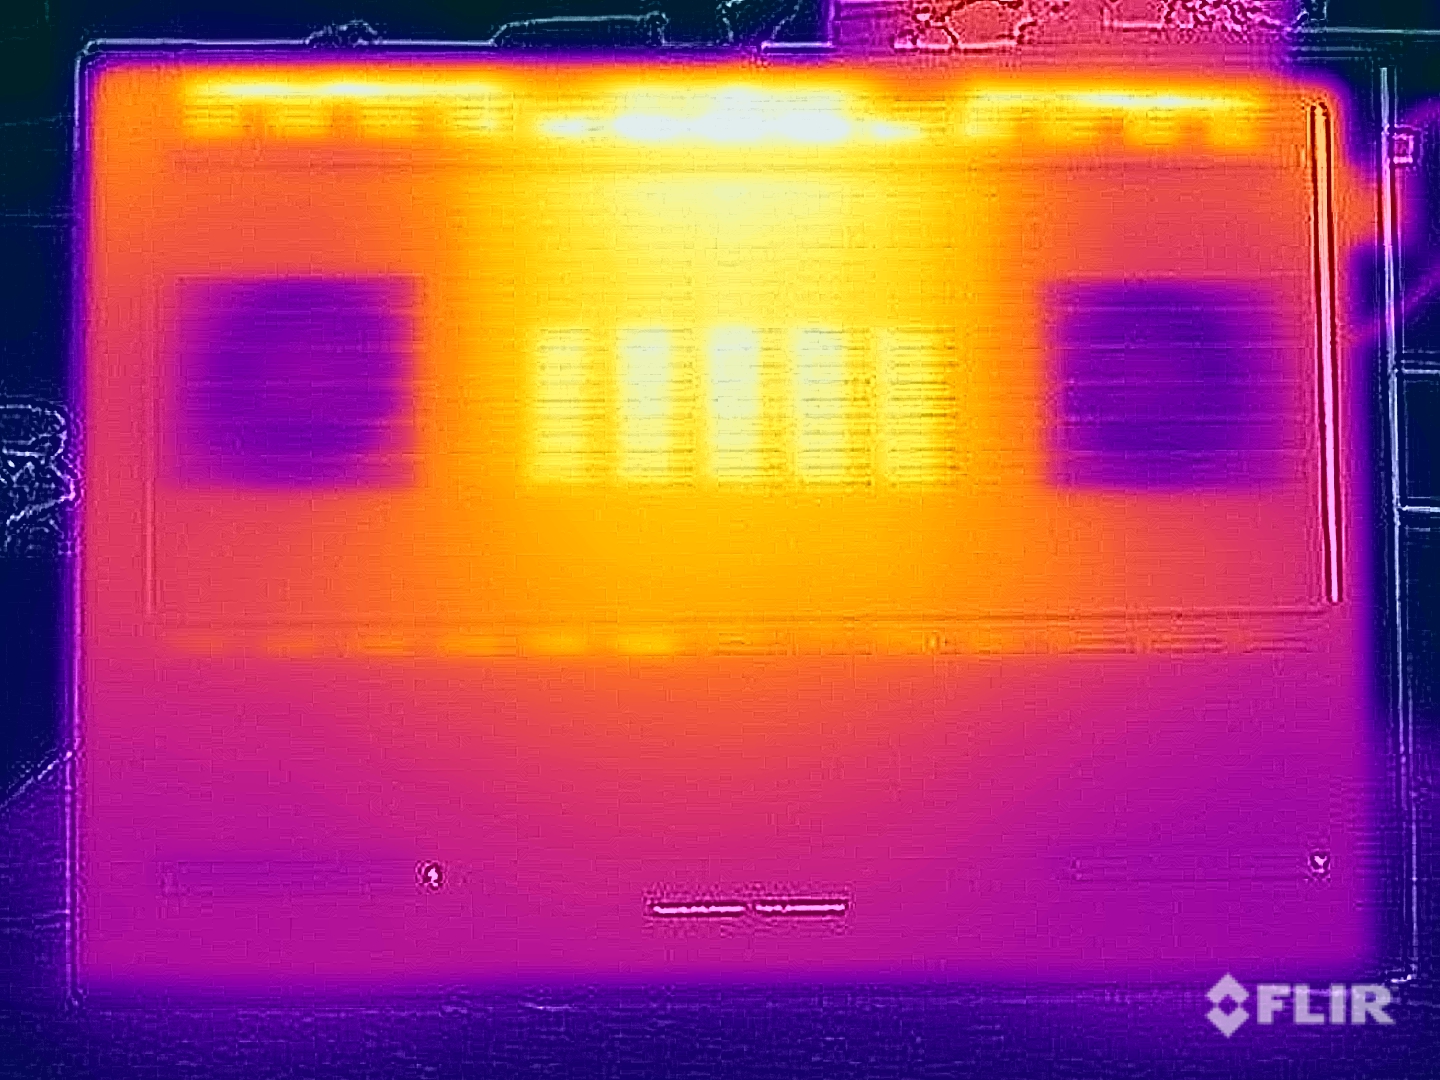
温度
在闲置状态下,铝制机壳仍然非常凉爽,但在负载情况下,我们测得底部温度超过 50 °C(122 °F)。因此,在这种情况下,不应将设备放在膝盖上,并确保良好的通风。键盘的部分区域也会明显升温,尽管对游戏玩家非常重要的 WASD 区域仍然保持舒适的低温。在压力测试过程中,CPU 和 GPU 之间的比例在一段时间后会发生一些变化,但总体而言 GPU 仍然明显占优。在最大功率下,Blade 16 能够持续冷却近 180 瓦的功率。
(-) The maximum temperature on the upper side is 48.3 °C / 119 F, compared to the average of 40.4 °C / 105 F, ranging from 21.2 to 68.8 °C for the class Gaming.
(-) The bottom heats up to a maximum of 53.3 °C / 128 F, compared to the average of 43.2 °C / 110 F
(+) In idle usage, the average temperature for the upper side is 27 °C / 81 F, compared to the device average of 33.9 °C / 93 F.
(±) 3: The average temperature for the upper side is 37.1 °C / 99 F, compared to the average of 33.9 °C / 93 F for the class Gaming.
(±) The palmrests and touchpad can get very hot to the touch with a maximum of 36.4 °C / 97.5 F.
(-) The average temperature of the palmrest area of similar devices was 28.9 °C / 84 F (-7.5 °C / -13.5 F).
| Razer Blade 16 2025 RTX 5090 AMD Ryzen AI 9 HX 370, Nvidia GeForce RTX 5090 Laptop | Apple MacBook Pro 16 M4 Max Apple M4 Max (16 cores), Apple M4 Max 40-Core GPU | SCHENKER XMG Neo 16 (Early 24) Intel Core i9-14900HX, NVIDIA GeForce RTX 4090 Laptop GPU | Alienware x16 R2 P120F Intel Core Ultra 9 185H, NVIDIA GeForce RTX 4080 Laptop GPU | Lenovo Legion 9 16IRX9, RTX 4090 Intel Core i9-14900HX, NVIDIA GeForce RTX 4090 Laptop GPU | Asus ROG Zephyrus G16 GU605MY Intel Core Ultra 9 185H, NVIDIA GeForce RTX 4090 Laptop GPU | Razer Blade 16 2024, RTX 4090 Intel Core i9-14900HX, NVIDIA GeForce RTX 4090 Laptop GPU | |
|---|---|---|---|---|---|---|---|
| Heat | 18% | 4% | -12% | -20% | 9% | 6% | |
| Maximum Upper Side * | 48.3 | 42.8 11% | 47 3% | 51 -6% | 56 -16% | 45.9 5% | 45 7% |
| Maximum Bottom * | 53.3 | 42.3 21% | 56 -5% | 50.8 5% | 53 1% | 47.5 11% | 45 16% |
| Idle Upper Side * | 28.3 | 23.6 17% | 27 5% | 36.6 -29% | 38 -34% | 26.1 8% | 29 -2% |
| Idle Bottom * | 30.3 | 23.5 22% | 27 11% | 35.2 -16% | 39 -29% | 26.6 12% | 30 1% |
* ... smaller is better
发言人
在瘦身计划的影响下,扬声器的质量受到了一些影响。 ROG Zephyrus G16表明,在这方面还可以做得更好。
Razer Blade 16 2025 RTX 5090 audio analysis
(+) | speakers can play relatively loud (82.1 dB)
Bass 100 - 315 Hz
(±) | reduced bass - on average 11.8% lower than median
(±) | linearity of bass is average (8.5% delta to prev. frequency)
Mids 400 - 2000 Hz
(±) | higher mids - on average 5.2% higher than median
(+) | mids are linear (5% delta to prev. frequency)
Highs 2 - 16 kHz
(+) | balanced highs - only 4.5% away from median
(+) | highs are linear (4.6% delta to prev. frequency)
Overall 100 - 16.000 Hz
(+) | overall sound is linear (14.3% difference to median)
Compared to same class
» 25% of all tested devices in this class were better, 7% similar, 69% worse
» The best had a delta of 6%, average was 18%, worst was 132%
Compared to all devices tested
» 16% of all tested devices were better, 4% similar, 80% worse
» The best had a delta of 4%, average was 24%, worst was 134%
SCHENKER XMG Neo 16 (Early 24) audio analysis
(+) | speakers can play relatively loud (86 dB)
Bass 100 - 315 Hz
(-) | nearly no bass - on average 16.3% lower than median
(±) | linearity of bass is average (8.6% delta to prev. frequency)
Mids 400 - 2000 Hz
(+) | balanced mids - only 3% away from median
(+) | mids are linear (3.6% delta to prev. frequency)
Highs 2 - 16 kHz
(+) | balanced highs - only 2.5% away from median
(+) | highs are linear (4.9% delta to prev. frequency)
Overall 100 - 16.000 Hz
(+) | overall sound is linear (12.4% difference to median)
Compared to same class
» 14% of all tested devices in this class were better, 3% similar, 83% worse
» The best had a delta of 6%, average was 18%, worst was 132%
Compared to all devices tested
» 9% of all tested devices were better, 2% similar, 88% worse
» The best had a delta of 4%, average was 24%, worst was 134%
Alienware x16 R2 P120F audio analysis
(+) | speakers can play relatively loud (89.9 dB)
Bass 100 - 315 Hz
(±) | reduced bass - on average 7.4% lower than median
(±) | linearity of bass is average (7.6% delta to prev. frequency)
Mids 400 - 2000 Hz
(+) | balanced mids - only 2.6% away from median
(+) | mids are linear (3.6% delta to prev. frequency)
Highs 2 - 16 kHz
(+) | balanced highs - only 3.4% away from median
(+) | highs are linear (2.8% delta to prev. frequency)
Overall 100 - 16.000 Hz
(+) | overall sound is linear (8.2% difference to median)
Compared to same class
» 1% of all tested devices in this class were better, 1% similar, 98% worse
» The best had a delta of 6%, average was 18%, worst was 132%
Compared to all devices tested
» 1% of all tested devices were better, 1% similar, 98% worse
» The best had a delta of 4%, average was 24%, worst was 134%
Lenovo Legion 9 16IRX9, RTX 4090 audio analysis
(±) | speaker loudness is average but good (78.96 dB)
Bass 100 - 315 Hz
(±) | reduced bass - on average 13.2% lower than median
(±) | linearity of bass is average (8.9% delta to prev. frequency)
Mids 400 - 2000 Hz
(+) | balanced mids - only 3.2% away from median
(+) | mids are linear (3.4% delta to prev. frequency)
Highs 2 - 16 kHz
(+) | balanced highs - only 1.8% away from median
(+) | highs are linear (4% delta to prev. frequency)
Overall 100 - 16.000 Hz
(+) | overall sound is linear (11.3% difference to median)
Compared to same class
» 8% of all tested devices in this class were better, 3% similar, 89% worse
» The best had a delta of 6%, average was 18%, worst was 132%
Compared to all devices tested
» 6% of all tested devices were better, 2% similar, 92% worse
» The best had a delta of 4%, average was 24%, worst was 134%
Asus ROG Zephyrus G16 GU605MY audio analysis
(+) | speakers can play relatively loud (83 dB)
Bass 100 - 315 Hz
(+) | good bass - only 3.3% away from median
(±) | linearity of bass is average (7.6% delta to prev. frequency)
Mids 400 - 2000 Hz
(+) | balanced mids - only 3.4% away from median
(+) | mids are linear (3.1% delta to prev. frequency)
Highs 2 - 16 kHz
(+) | balanced highs - only 1.7% away from median
(+) | highs are linear (4.6% delta to prev. frequency)
Overall 100 - 16.000 Hz
(+) | overall sound is linear (6.5% difference to median)
Compared to same class
» 0% of all tested devices in this class were better, 0% similar, 100% worse
» The best had a delta of 6%, average was 18%, worst was 132%
Compared to all devices tested
» 1% of all tested devices were better, 0% similar, 99% worse
» The best had a delta of 4%, average was 24%, worst was 134%
Razer Blade 16 2024, RTX 4090 audio analysis
(±) | speaker loudness is average but good (81.16 dB)
Bass 100 - 315 Hz
(±) | reduced bass - on average 8.2% lower than median
(±) | linearity of bass is average (7.4% delta to prev. frequency)
Mids 400 - 2000 Hz
(+) | balanced mids - only 3.3% away from median
(+) | mids are linear (5.9% delta to prev. frequency)
Highs 2 - 16 kHz
(+) | balanced highs - only 1.6% away from median
(+) | highs are linear (3.1% delta to prev. frequency)
Overall 100 - 16.000 Hz
(+) | overall sound is linear (9.2% difference to median)
Compared to same class
» 3% of all tested devices in this class were better, 1% similar, 96% worse
» The best had a delta of 6%, average was 18%, worst was 132%
Compared to all devices tested
» 3% of all tested devices were better, 1% similar, 97% worse
» The best had a delta of 4%, average was 24%, worst was 134%
Apple MacBook Pro 16 2024 M4 Pro audio analysis
(+) | speakers can play relatively loud (84.6 dB)
Bass 100 - 315 Hz
(±) | reduced bass - on average 5.1% lower than median
(+) | bass is linear (5.6% delta to prev. frequency)
Mids 400 - 2000 Hz
(+) | balanced mids - only 1.4% away from median
(+) | mids are linear (2.4% delta to prev. frequency)
Highs 2 - 16 kHz
(+) | balanced highs - only 1.7% away from median
(+) | highs are linear (3% delta to prev. frequency)
Overall 100 - 16.000 Hz
(+) | overall sound is linear (4.8% difference to median)
Compared to same class
» 0% of all tested devices in this class were better, 1% similar, 99% worse
» The best had a delta of 5%, average was 18%, worst was 45%
Compared to all devices tested
» 0% of all tested devices were better, 0% similar, 100% worse
» The best had a delta of 4%, average was 24%, worst was 134%
电源管理 - 改进电池寿命
耗电量

在我们的功耗测量中,处理器的速度较慢和 GPU 的 TGP 较低当然是显而易见的。Blade 16 2025 在所有情况下都更加高效。它还只配备了一个 280 瓦的充电器(之前为 330 瓦),但这已经完全足够了。在压力测试开始时,我们测得的最大功率接近 250 瓦,大约 45 秒后降到 220 瓦。
| Off / Standby | |
| Idle | |
| Load |
|
Key:
min: | |
| Razer Blade 16 2025 RTX 5090 Ryzen AI 9 HX 370, GeForce RTX 5090 Laptop, SSSTC CA6-8D2048, OLED, 2560x1600, 16" | Apple MacBook Pro 16 M4 Max M4 Max (16 cores), M4 Max 40-Core GPU, Apple SSD AP1024Z, Mini-LED, 3456x2234, 16.2" | SCHENKER XMG Neo 16 (Early 24) i9-14900HX, NVIDIA GeForce RTX 4090 Laptop GPU, Samsung 990 Pro 1 TB, IPS, 2560x1600, 16" | Alienware x16 R2 P120F Ultra 9 185H, NVIDIA GeForce RTX 4080 Laptop GPU, WDC PC SN810 1TB, IPS, 2560x1600, 16" | Lenovo Legion 9 16IRX9, RTX 4090 i9-14900HX, NVIDIA GeForce RTX 4090 Laptop GPU, Micron 3400 2TB MTFDKBA2T0TFH, MiniLED, 3200x2000, 16" | Asus ROG Zephyrus G16 GU605MY Ultra 9 185H, NVIDIA GeForce RTX 4090 Laptop GPU, Samsung PM9A1a MZVL22T0HDLB, OLED, 2560x1600, 16" | Razer Blade 16 2024, RTX 4090 i9-14900HX, NVIDIA GeForce RTX 4090 Laptop GPU, Samsung PM9A1 MZVL22T0HBLB, OLED, 2560x1600, 16" | Average Nvidia GeForce RTX 5090 Laptop | Average of class Gaming | |
|---|---|---|---|---|---|---|---|---|---|
| Power Consumption | 20% | -27% | -30% | -69% | 15% | -34% | -32% | -29% | |
| Idle Minimum * | 10.9 | 4.7 57% | 6 45% | 9.9 9% | 20.5 -88% | 7.8 28% | 16.9 -55% | 10.6 ? 3% | 13.6 ? -25% |
| Idle Average * | 13.5 | 15.5 -15% | 16 -19% | 14.5 -7% | 27.7 -105% | 10.9 19% | 17.8 -32% | 22.1 ? -64% | 19 ? -41% |
| Idle Maximum * | 13.7 | 15.6 -14% | 28 -104% | 33.5 -145% | 32.1 -134% | 11.6 15% | 19.6 -43% | 23.2 ? -69% | 26.5 ? -93% |
| Load Average * | 120.2 | 125 -4% | 130 -8% | 97.5 19% | 105 13% | 98.7 18% | 128 -6% | 132.3 ? -10% | 103 ? 14% |
| Cyberpunk 2077 ultra * | 178.2 | 116.2 35% | 157.3 12% | ||||||
| Cyberpunk 2077 ultra external monitor * | 177.6 | 107.2 40% | 165.5 7% | ||||||
| Load Maximum * | 246.1 | 143.7 42% | 361 -47% | 315.2 -28% | 323 -31% | 232 6% | 328 -33% | 298 ? -21% | 246 ? -0% |
| Witcher 3 ultra * | 302 | 230 | 246 | 243 |
* ... smaller is better
Power Consumption Cyberpunk / Stress Test
Power Consumption with External Monitor
电池寿命
现在的电池容量比以前略低,只有 90 Wh。不过,电池续航时间仍然比以前要长,我们测得在全亮度状态下可使用近 8 小时或 5.5 小时。在电池工作状态下也可以玩游戏,但只能持续略多于一小时。Nvidia 的 "电池提升 "功能可以改善电池续航时间,该功能可根据情况将人工智能的性能限制在 30 FPS 左右。但效果并不理想,至少在《赛博朋克》中是如此(约 22-24 FPS)。
| Razer Blade 16 2025 RTX 5090 Ryzen AI 9 HX 370, GeForce RTX 5090 Laptop, 90 Wh | Apple MacBook Pro 16 M4 Max M4 Max (16 cores), M4 Max 40-Core GPU, 99.6 Wh | SCHENKER XMG Neo 16 (Early 24) i9-14900HX, NVIDIA GeForce RTX 4090 Laptop GPU, 99.8 Wh | Alienware x16 R2 P120F Ultra 9 185H, NVIDIA GeForce RTX 4080 Laptop GPU, 90 Wh | Lenovo Legion 9 16IRX9, RTX 4090 i9-14900HX, NVIDIA GeForce RTX 4090 Laptop GPU, 99.99 Wh | Asus ROG Zephyrus G16 GU605MY Ultra 9 185H, NVIDIA GeForce RTX 4090 Laptop GPU, 90 Wh | Razer Blade 16 2024, RTX 4090 i9-14900HX, NVIDIA GeForce RTX 4090 Laptop GPU, 95.2 Wh | Average of class Gaming | |
|---|---|---|---|---|---|---|---|---|
| Battery Runtime | 124% | -28% | -59% | -45% | -18% | -27% | -21% | |
| H.264 | 592 | 1305 120% | 418 -29% | 294 -50% | 456 -23% | 448 ? -24% | ||
| WiFi v1.3 | 475 | 1078 127% | 350 -26% | 193 -59% | 290 -39% | 391 -18% | 329 -31% | 388 ? -18% |
| Cyberpunk 2077 ultra 150cd | 71 |
Notebookcheck 整体估值
Razer Blade 16 2025 RTX 5090
- 03/26/2025 v8
Andreas Osthoff
 Total Sustainability Score:
 Possible Alternatives in Comparison
Image | Model / Review | Price | Weight | Height | Display |
|---|---|---|---|---|---|
1. 87%  | Razer Blade 16 2025 RTX 5090 AMD Ryzen AI 9 HX 370 ⎘ Nvidia GeForce RTX 5090 Laptop ⎘ 32 GB Memory, 2048 GB SSD | Amazon: 1. $4,159.99 Razer Blade 16 Gaming Laptop... 2. $5,698.00 Razer Blade 16 Gaming Laptop... 3. $3,998.88 Razer Blade 18 Gaming Laptop... List Price: 4399€ | 2.1 kg | 17.4 mm | 16.00" 2560x1600 189 PPI OLED |
2. 91.7%  | Apple MacBook Pro 16 M4 Max Apple M4 Max (16 cores) ⎘ Apple M4 Max 40-Core GPU ⎘ 48 GB Memory, 1024 GB SSD | Amazon: 1. $3,639.00 Apple 2024 MacBook Pro Lapto... 2. $5,679.00 Apple 2024 MacBook Pro Lapto... 3. $4,239.00 Apple 2024 MacBook Pro Lapto... List Price: 4699€ | 2.1 kg | 16.8 mm | 16.20" 3456x2234 254 PPI Mini-LED |
3. 85.5%  | SCHENKER XMG Neo 16 (Early 24) Intel Core i9-14900HX ⎘ NVIDIA GeForce RTX 4090 Laptop GPU ⎘ 32 GB Memory, 1024 GB SSD | Amazon: 1. $143.00 16.0" for Schenker XMG Neo 1... 2. $150.00 16.0" Screen Replacement for... 3. $145.00 16.0" WQXGA 2560(RGB)×1600 ... List Price: 3800 Euro | 2.5 kg | 26.6 mm | 16.00" 2560x1600 189 PPI IPS |
4. 88.4% v7 (old)  | Alienware x16 R2 P120F Intel Core Ultra 9 185H ⎘ NVIDIA GeForce RTX 4080 Laptop GPU ⎘ 32 GB Memory, 1024 GB SSD | Amazon: $2,628.30 List Price: 3200 USD | 2.7 kg | 18.57 mm | 16.00" 2560x1600 189 PPI IPS |
5. 83.9%  | Lenovo Legion 9 16IRX9, RTX 4090 Intel Core i9-14900HX ⎘ NVIDIA GeForce RTX 4090 Laptop GPU ⎘ 64 GB Memory, 2048 GB SSD | Amazon: $4,799.00 List Price: 4899 Euro | 2.5 kg | 22.7 mm | 16.00" 3200x2000 236 PPI MiniLED |
6. 86.1%  | Asus ROG Zephyrus G16 GU605MY Intel Core Ultra 9 185H ⎘ NVIDIA GeForce RTX 4090 Laptop GPU ⎘ 32 GB Memory, 2048 GB SSD | Amazon: List Price: 4300€ | 1.9 kg | 16.4 mm | 16.00" 2560x1600 189 PPI OLED |
7. 91.1% v7 (old)  | Razer Blade 16 2024, RTX 4090 Intel Core i9-14900HX ⎘ NVIDIA GeForce RTX 4090 Laptop GPU ⎘ 32 GB Memory, 2048 GB SSD | Amazon: $4,795.00 List Price: 4850 Euro | 2.5 kg | 22 mm | 16.00" 2560x1600 189 PPI OLED |
Transparency
The selection of devices to be reviewed is made by our editorial team. The test sample was provided to the author as a loan by the manufacturer or retailer for the purpose of this review. The lender had no influence on this review, nor did the manufacturer receive a copy of this review before publication. There was no obligation to publish this review. We never accept compensation or payment in return for our reviews. As an independent media company, Notebookcheck is not subjected to the authority of manufacturers, retailers or publishers.
This is how Notebookcheck is testing
Every year, Notebookcheck independently reviews hundreds of laptops and smartphones using standardized procedures to ensure that all results are comparable. We have continuously developed our test methods for around 20 years and set industry standards in the process. In our test labs, high-quality measuring equipment is utilized by experienced technicians and editors. These tests involve a multi-stage validation process. Our complex rating system is based on hundreds of well-founded measurements and benchmarks, which maintains objectivity. Further information on our test methods can be found here.

