

微星Summit E13 AI Evo敞篷版评测:酷睿至尊 7 的严重节流问题
速度太快,难以驾驭。
最新的 Summit E13 A1MTG 展示了将酷睿 Ultra-H CPU 放进原本为酷睿-U 系列处理器设计的笔记本电脑中会发生什么。纸面上听起来速度很快,但随后出现的节流和温度水平需要引起注意。Allen Ngo, 👁 Allen Ngo (translated by DeepL / Ninh Duy) Published 🇺🇸 🇫🇷 ...
判决--前进一步,后退两步
与上一代产品相比,Summit E13 AI Evo A1MTG 会给人一种降级的感觉。它的酷睿Ultra H处理器在纸面上听起来不错,但实际上,由于Summit E13最初是为ULV酷睿U系列处理器设计的,因此处理器的节流比其他大多数采用相同处理器的笔记本电脑要快得多,也剧烈得多。较新的型号当然比最初的 2021 版本更快,但考虑到我们使用其他酷睿超 H 系列笔记本电脑(如 框架笔记本 13.5.电池续航时间和核心温度等方面也受到了处理器变化的影响。
其他令人失望的变化包括减少了 USB-C 端口,取消了 MicroSD 阅读器。即使是基本的 IPS 显示屏也从 120 Hz 降为 60 Hz,黑白响应时间缓慢的问题也没有得到改善。
现在,Summit E13 已经接近 4 岁了,也许是时候重新设计机箱了。酷睿 Ultra-H 处理器帮助微星将该机型与其他 13 英寸可折叠机型区分开来,但如果能首先改进散热解决方案以支持更高的 CPU 需求,就能更好地实现该处理器。高于平均水平的温度和风扇噪音都表明散热解决方案在努力维持新处理器的运行。
Pros
Cons
可能的替代品比较
Image | Model / Review | Price | Weight | Height | Display |
|---|---|---|---|---|---|
1. 78.6% 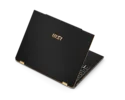 | MSI Summit E13 AI Evo A1MTG Intel Core Ultra 7 155H ⎘ Intel Arc 8-Core iGPU ⎘ 16 GB Memory, 1024 GB SSD | Amazon: $1,099.00 List Price: 1100 USD | 1.3 kg | 16.2 mm | 13.30" 1920x1200 170 PPI IPS |
2. 86.9% v7 (old)  | MSI Summit E13 Flip Evo A11MT Intel Core i7-1185G7 ⎘ Intel Iris Xe Graphics G7 96EUs ⎘ 32 GB Memory, 1024 GB SSD | Amazon: 1. $969.99 MSI Summit E13 Flip Evo (202... 2. $899.00 MSI Summit E13 Flip Evo Prof... 3. $1,599.00 MSI Summit E13 Flip Evo Busi... List Price: 1900 USD | 1.4 kg | 14.9 mm | 13.40" 1920x1200 169 PPI IPS |
3. 87% v7 (old)  | Lenovo Yoga Book 9 13IMU9 Intel Core Ultra 7 155U ⎘ Intel Graphics 4-Core iGPU (Arc) ⎘ 16 GB Memory | Amazon: $1,699.00 List Price: 2000 USD | 1.4 kg | 15.95 mm | 13.30" 2880x1800 255 PPI OLED |
4. 88.1% v7 (old)  | Lenovo ThinkPad L13 Yoga G4 i7-1355U Intel Core i7-1355U ⎘ Intel Iris Xe Graphics G7 96EUs ⎘ 16 GB Memory, 512 GB SSD | Amazon: 1. $899.98 Lenovo ThinkPad T14 Gen 5 Bu... 2. $1,369.00 Lenovo ThinkPad T14 G4 Home ... 3. $649.00 Lenovo - ThinkPad L13 Yoga 2... List Price: 1589 USD | 1.4 kg | 17.1 mm | 13.30" 1920x1200 170 PPI IPS |
5. 90.3% v7 (old)  | HP Elite Dragonfly Folio 13.5 G3 Intel Core i7-1265U ⎘ Intel Iris Xe Graphics G7 96EUs ⎘ 16 GB Memory, 512 GB SSD | Amazon: 1. $19.99 New Slim 65W USB C Laptop Ch... 2. $39.99 Smatree Hard EVA Protective ... 3. $34.99 Broonel Black Leather Folio ... List Price: 3900 USD | 1.4 kg | 17.8 mm | 13.50" 1920x1280 171 PPI IPS |
6. 89% v7 (old)  | Dell Latitude 9330 Intel Core i7-1260U ⎘ Intel Iris Xe Graphics G7 96EUs ⎘ 16 GB Memory | Amazon: 1. $25.99 65W USB C Charger Genuine Re... 2. $42.93 Berfea Protective Cover Case... 3. $36.77 Dell Laptop Charger 90W Watt... | 1.2 kg | 14.1 mm | 13.30" 2560x1600 227 PPI IPS |
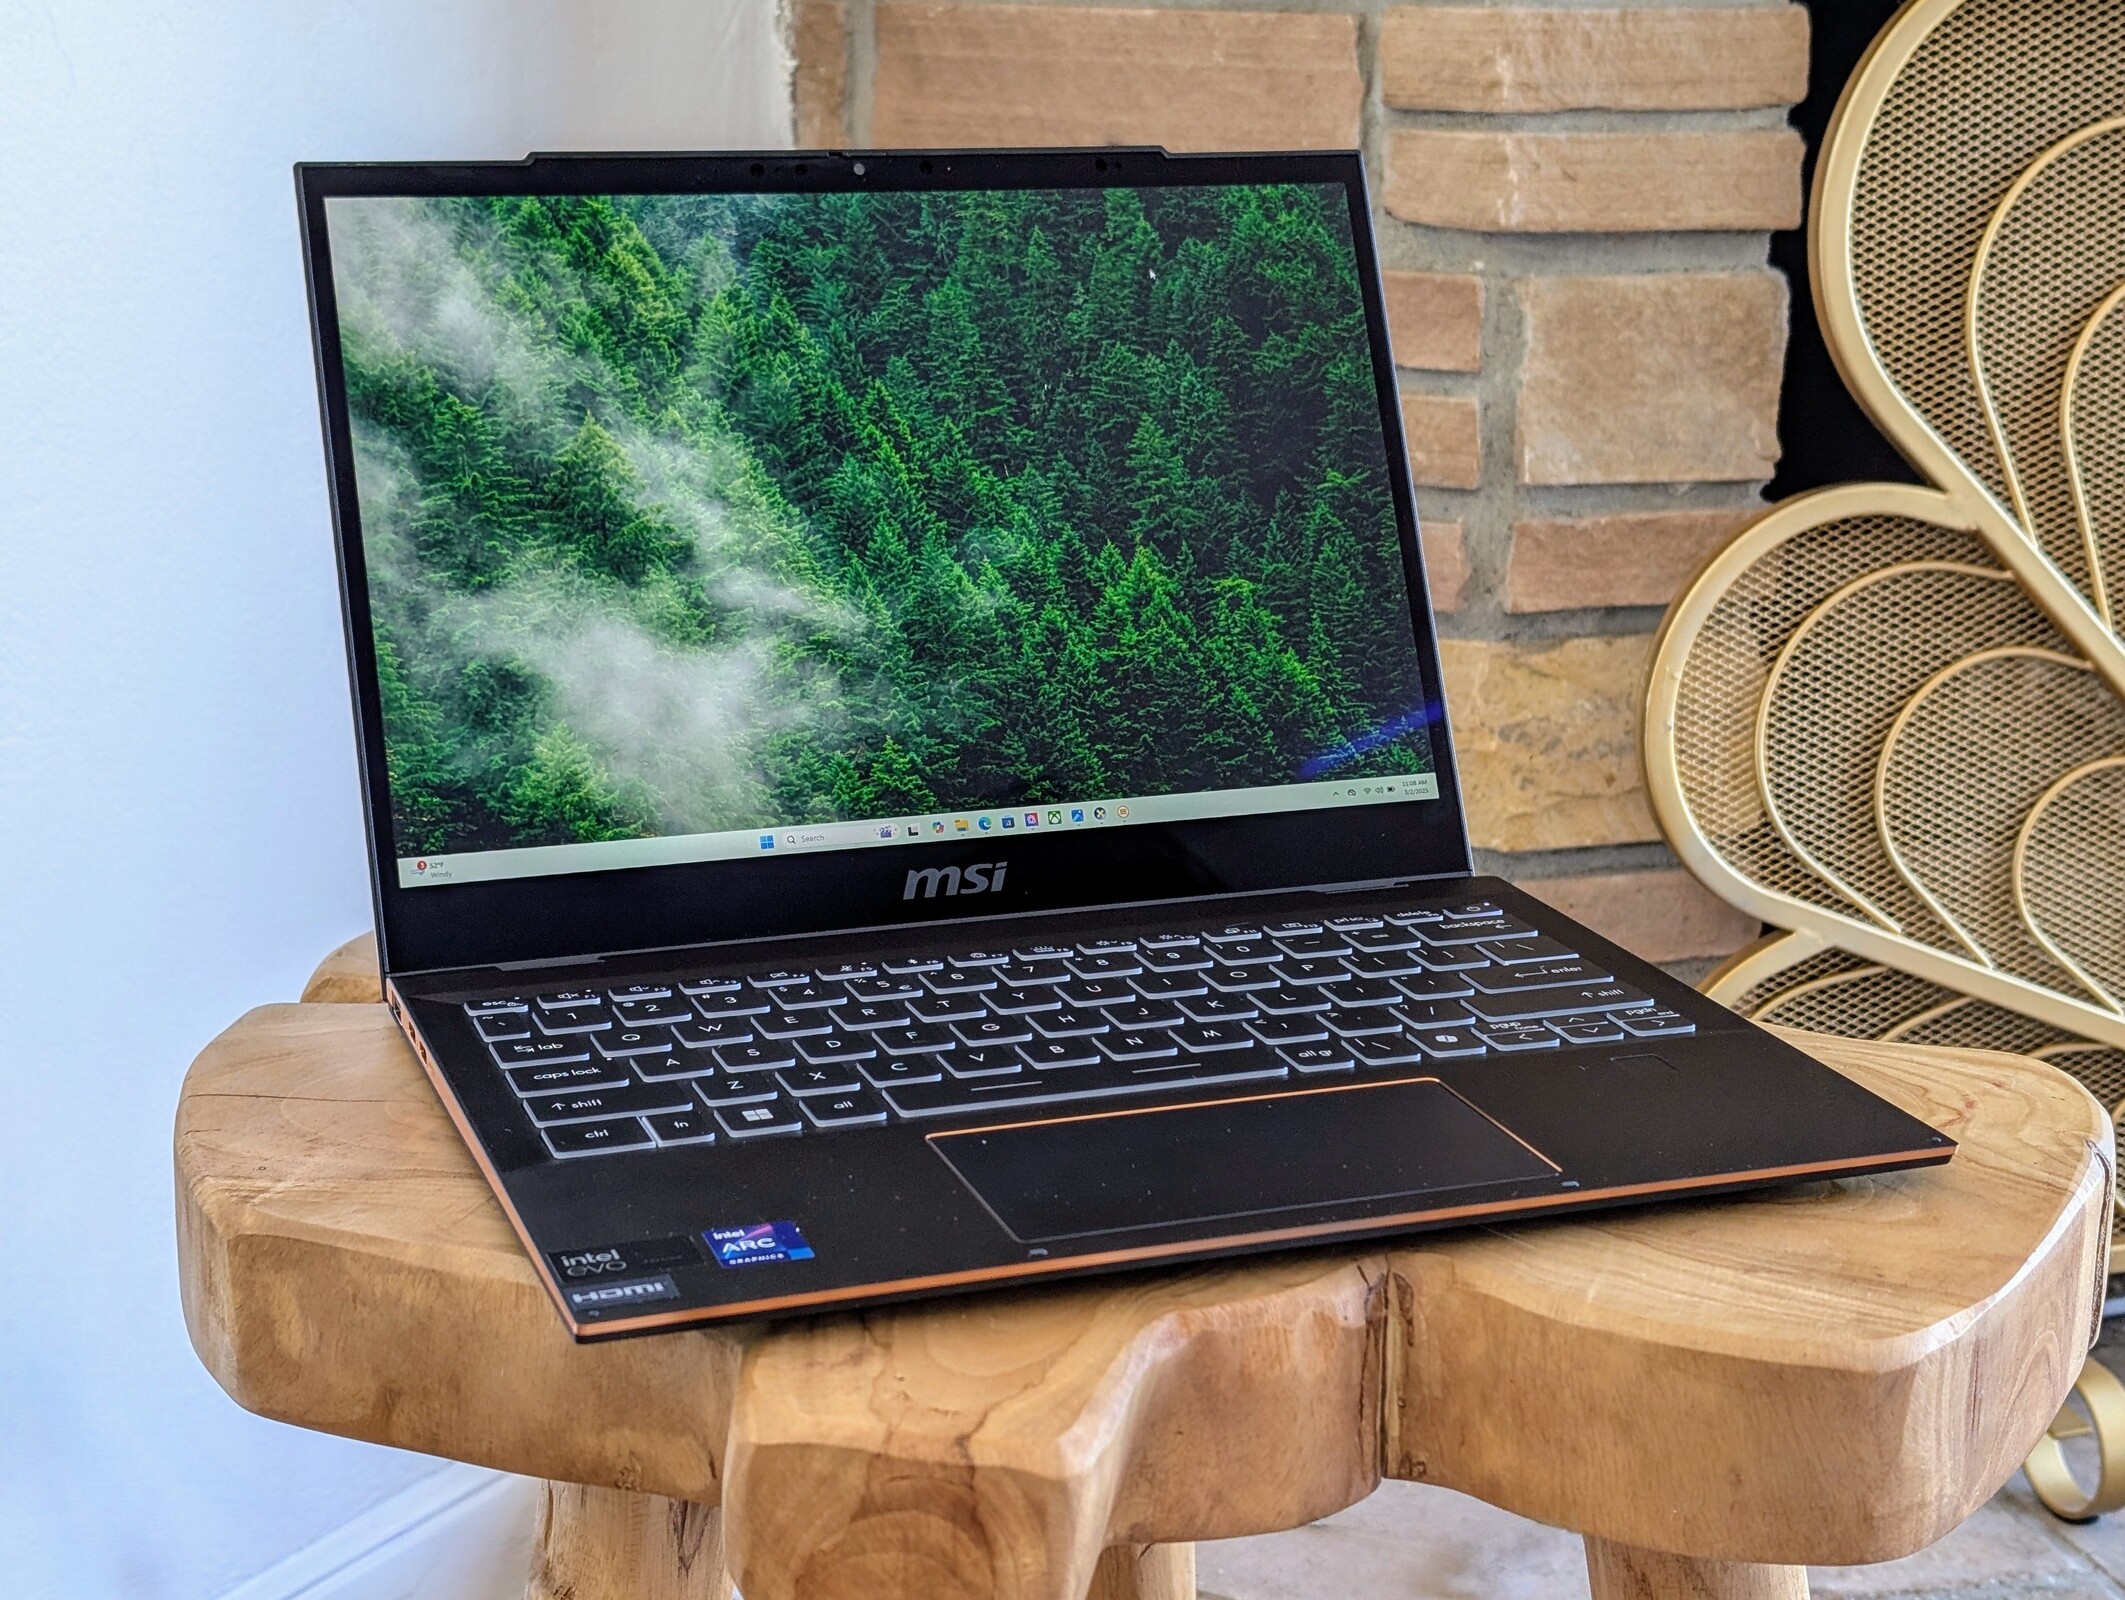
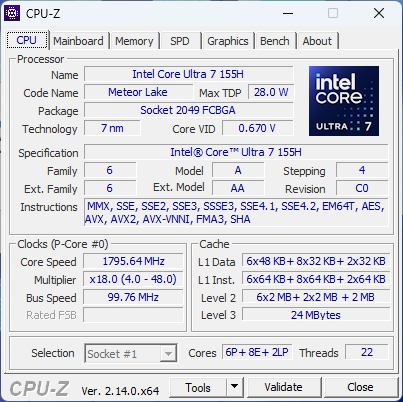
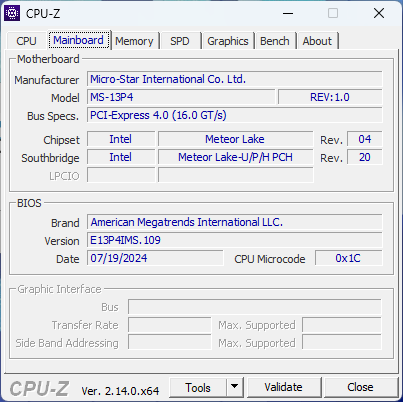
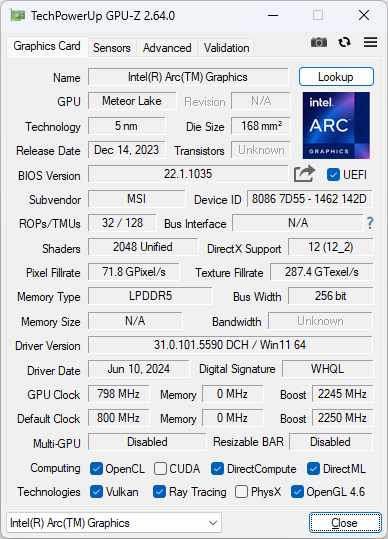
2024 Summit E13 AI Evo A1MTG 是2021 Summit E13 Flip Evo 的升级版。虽然去掉了 "Flip "的名称,但该机型仍和前代产品一样采用二合一外形设计。它配备了较新的英特尔酷睿流星湖-H 处理器,取代了 2021 机型上较旧的Tiger Lake-U 选项。
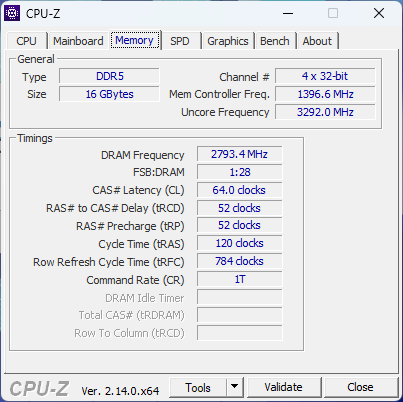
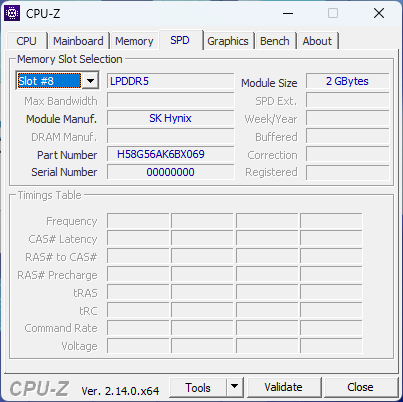
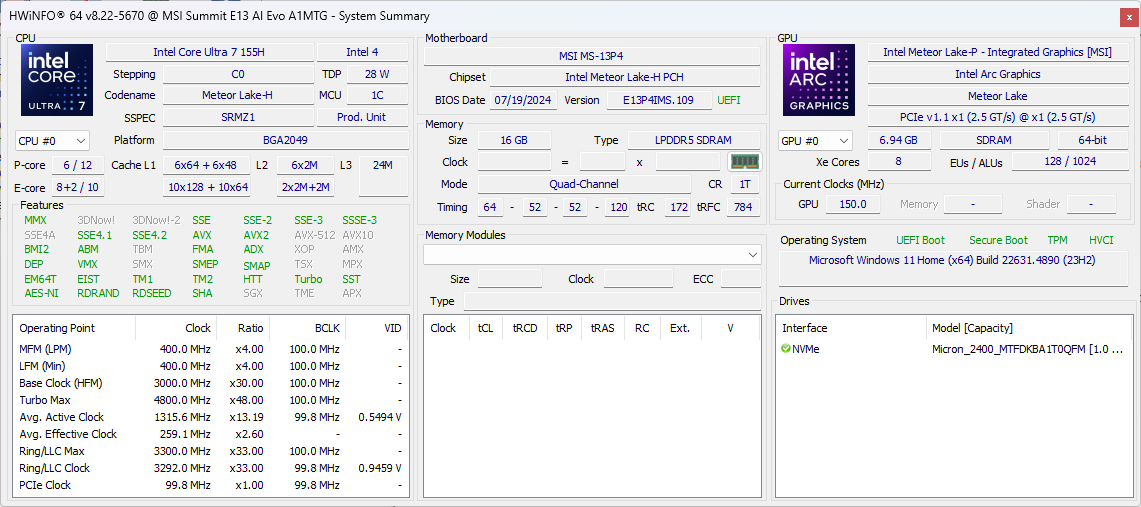
我们的测试机配备了酷睿 Ultra 7 155H CPU、16 GB LPDDR5-5600 内存和 1 TB SSD,售价约为 1100 美元。其他型号可能提供 32GB LPDDR5-6400 内存或速度较慢的 Core Ultra 5 125H,但 1200p IPS 触摸屏似乎是全线产品的固定配置。
竞争对手包括其他 13 英寸办公子笔记本,如戴尔Latitude 9330,惠普 Elite Dragonfly Folio, 或 联想 ThinkPad L13 Yoga G4 。
更多微星评论:
规格
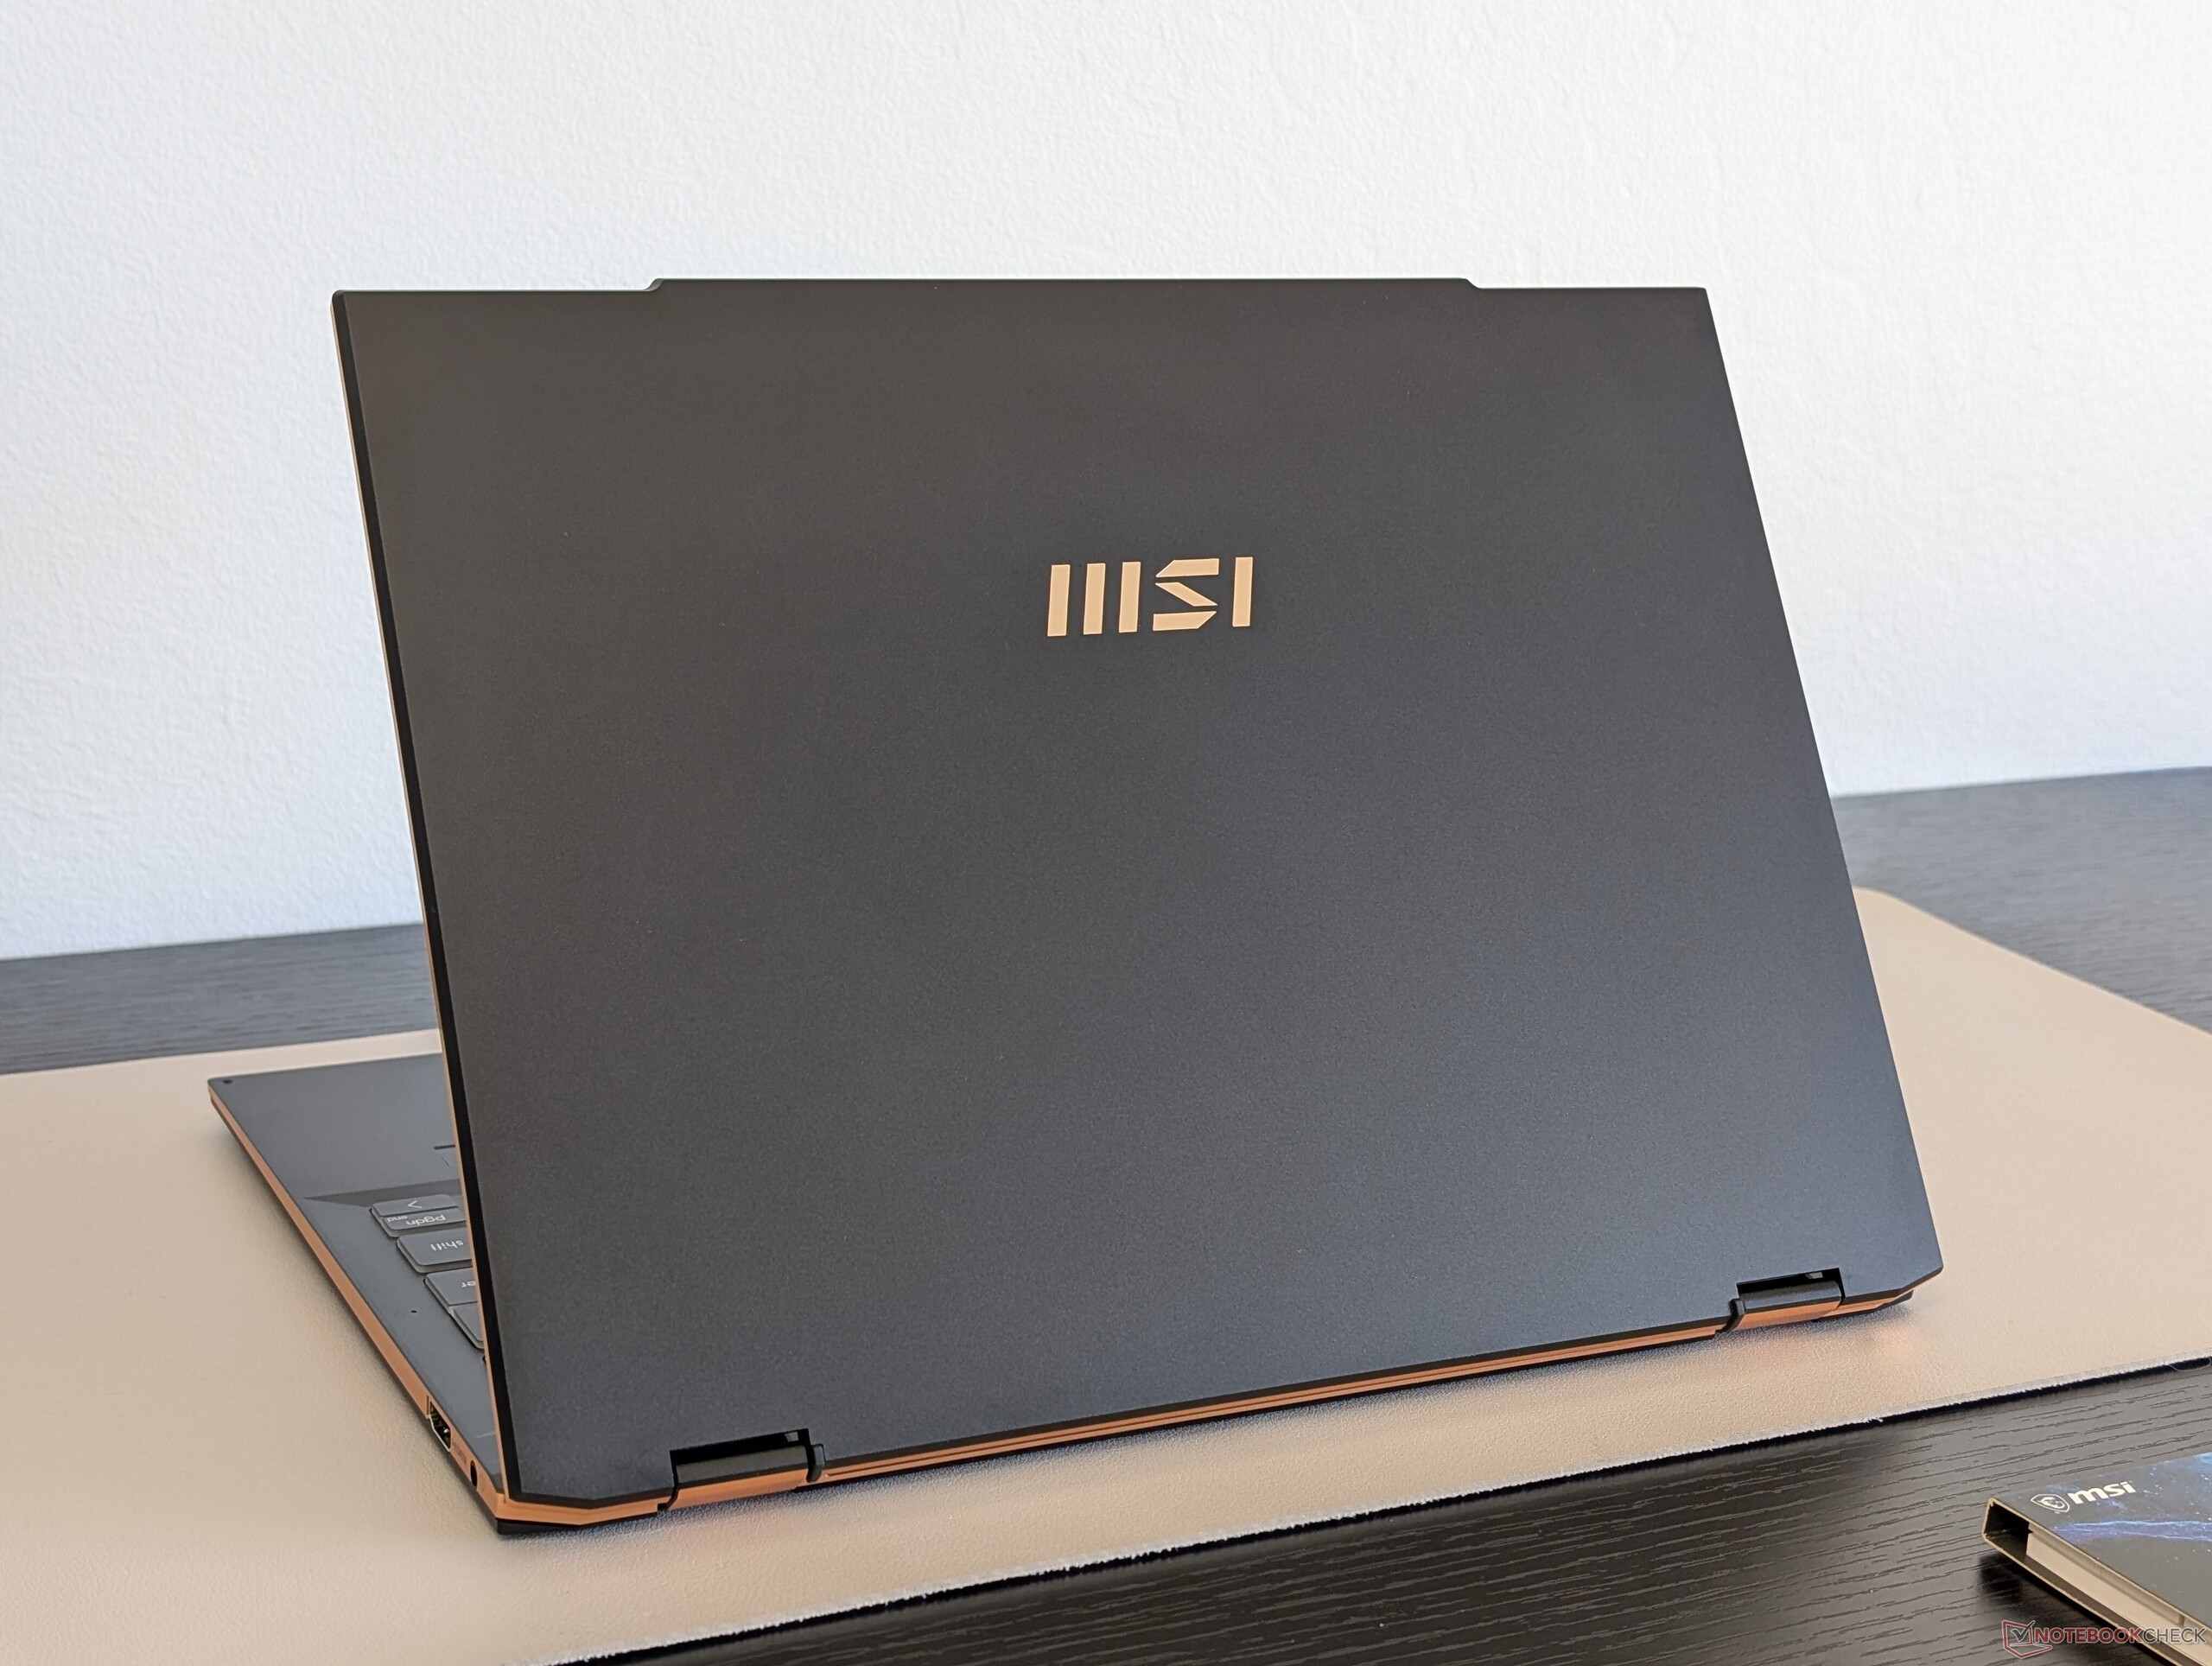
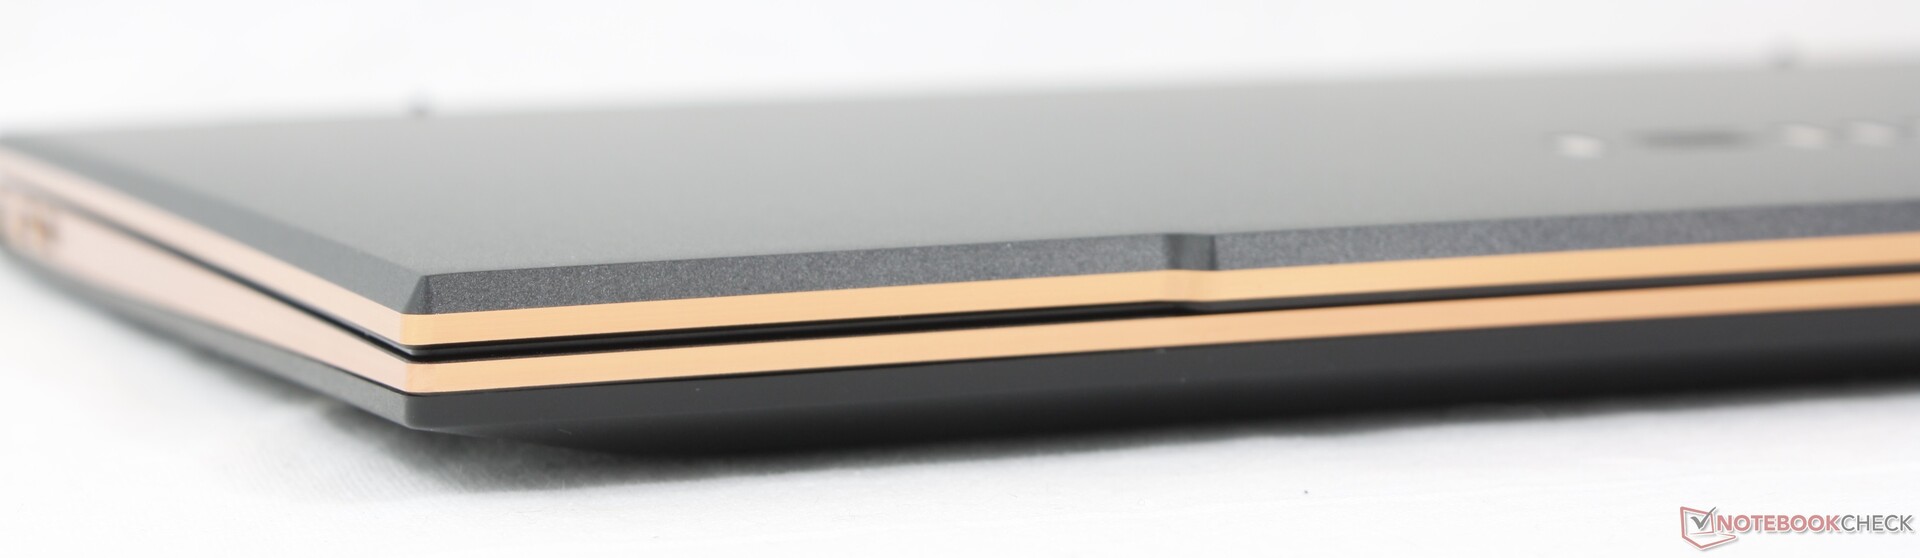
箱子 - 金色饰边
与 2021 版相比,2024 版 Summit E13 配备了不同的端口和新的网络摄像头快门。除此之外,它们的机箱完全相同,外部和内部均无重大变化。
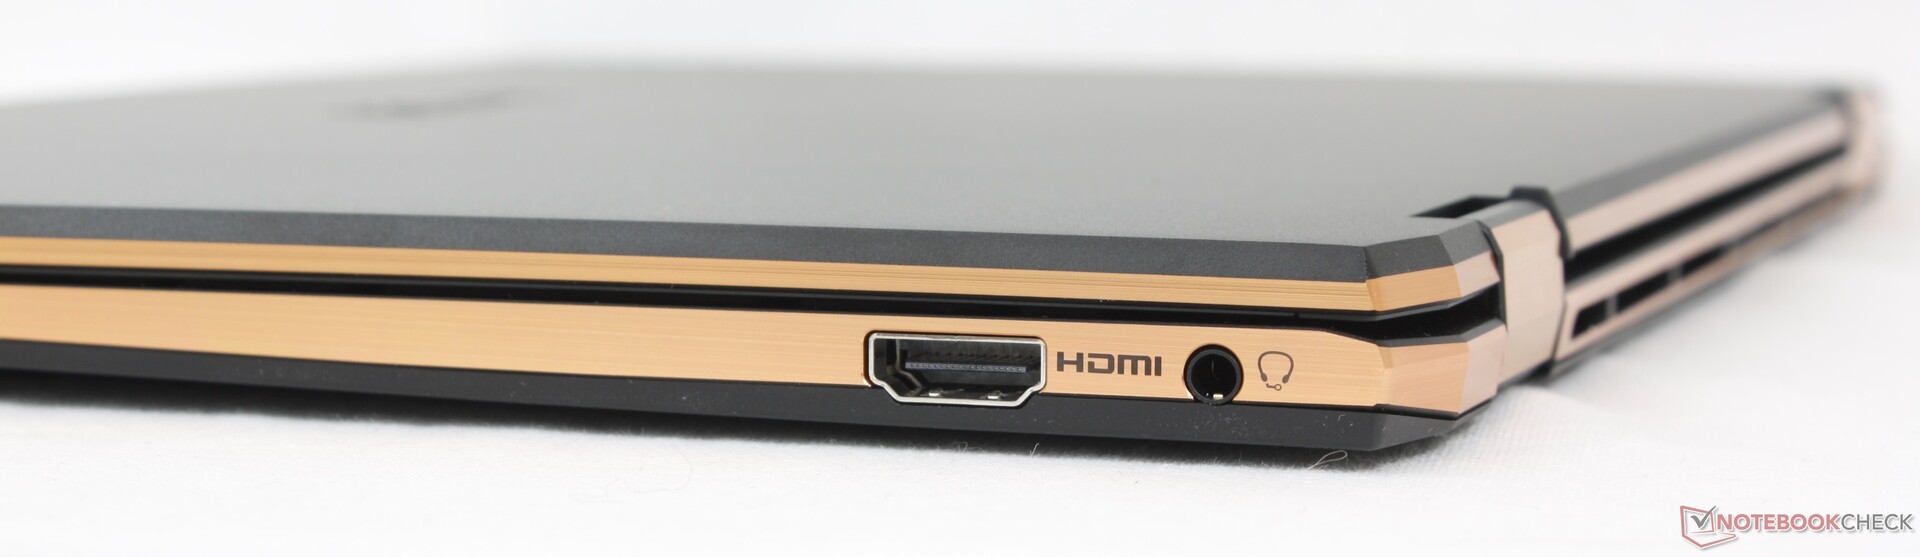
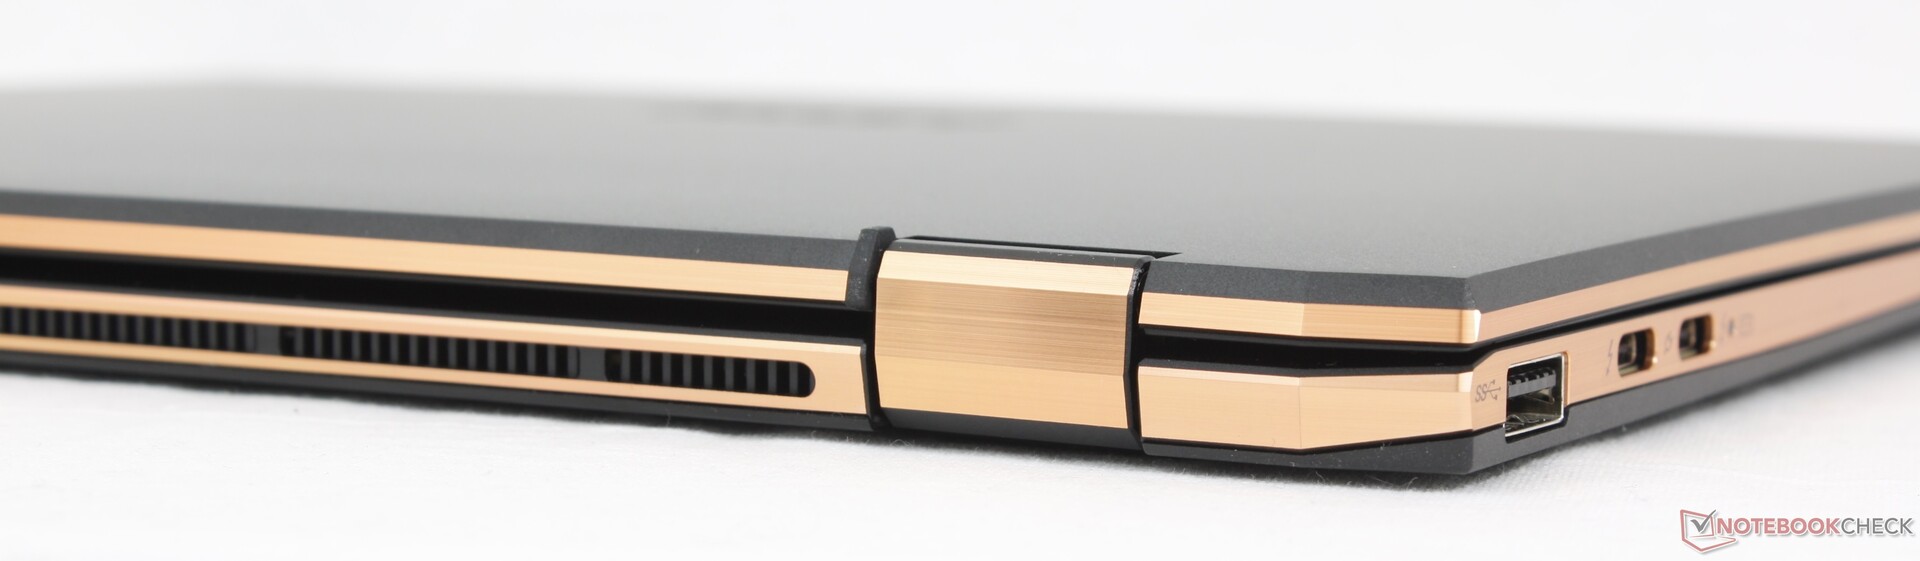
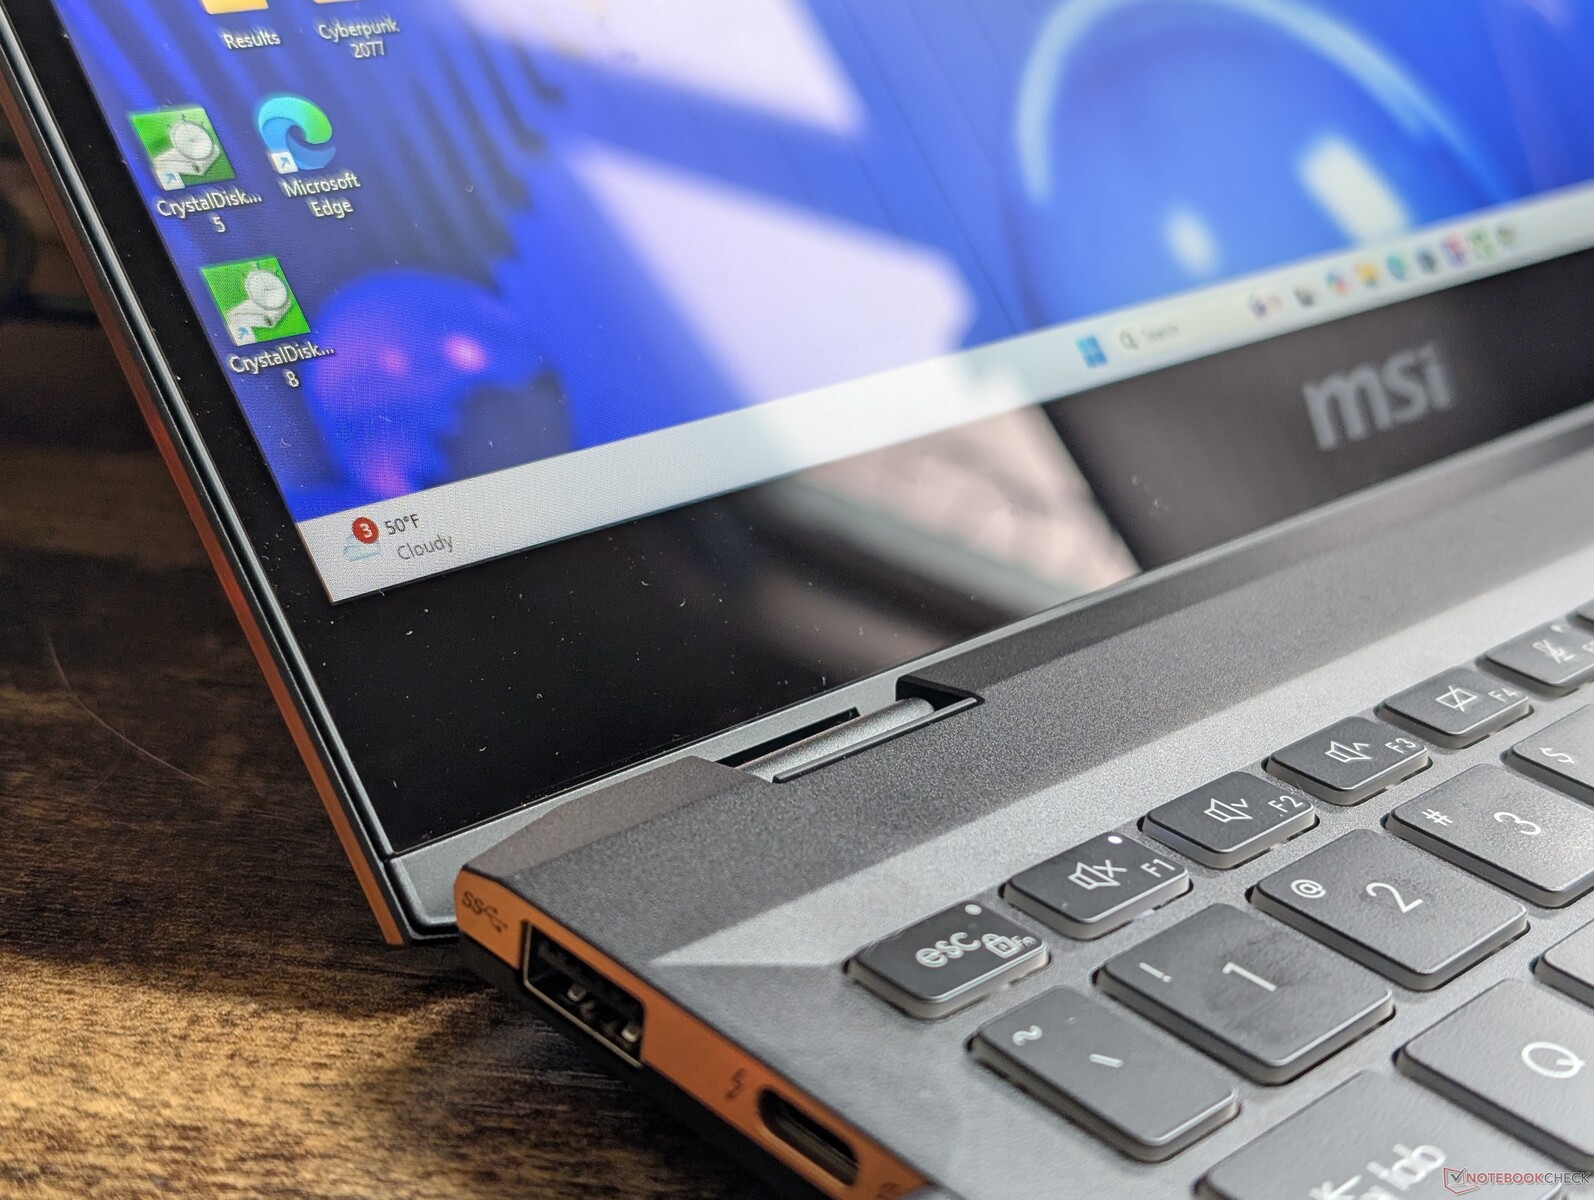
连通性 - 今年新增的端口
与 2021 型号相比,端口选项发生了变化,而且不一定是更好的变化。其中一个 USB-C 端口被取消,改用 HDMI,而 MicroSD 读卡器则被完全取消。

交流
| Networking | |
| iperf3 transmit AX12 | |
| MSI Summit E13 Flip Evo A11MT | |
| iperf3 receive AX12 | |
| MSI Summit E13 Flip Evo A11MT | |
| iperf3 transmit AXE11000 | |
| Lenovo ThinkPad L13 Yoga G4 i7-1355U | |
| HP Elite Dragonfly Folio 13.5 G3 | |
| Dell Latitude 9330 | |
| Lenovo Yoga Book 9 13IMU9 | |
| MSI Summit E13 AI Evo A1MTG | |
| iperf3 receive AXE11000 | |
| Lenovo ThinkPad L13 Yoga G4 i7-1355U | |
| Lenovo Yoga Book 9 13IMU9 | |
| HP Elite Dragonfly Folio 13.5 G3 | |
| Dell Latitude 9330 | |
| MSI Summit E13 AI Evo A1MTG | |
| iperf3 transmit AXE11000 6GHz | |
| HP Elite Dragonfly Folio 13.5 G3 | |
| Dell Latitude 9330 | |
| MSI Summit E13 AI Evo A1MTG | |
| Lenovo Yoga Book 9 13IMU9 | |
| iperf3 receive AXE11000 6GHz | |
| HP Elite Dragonfly Folio 13.5 G3 | |
| MSI Summit E13 AI Evo A1MTG | |
| Dell Latitude 9330 | |
| Lenovo Yoga Book 9 13IMU9 | |
网络摄像头
网络摄像头仍为 1080p 或 200 万像素,仅支持红外。


维护
根据LaptopMedia 的维修视频,维修工作与 2021 型号相似,甚至包括主板布局。.内存不可升级,最多只能支持一个 M.2 2280 固态硬盘。
可持续性
微星宣传称在生产过程中没有采取任何可持续发展措施。零售包装盒主要是纸和纸板,AC 适配器采用塑料包装。
配件和保修
零售包装盒内除了交流适配器和文件外,还包括微星Pen 2活动手写笔。如果在美国购买,制造商通常提供一年有限保修。
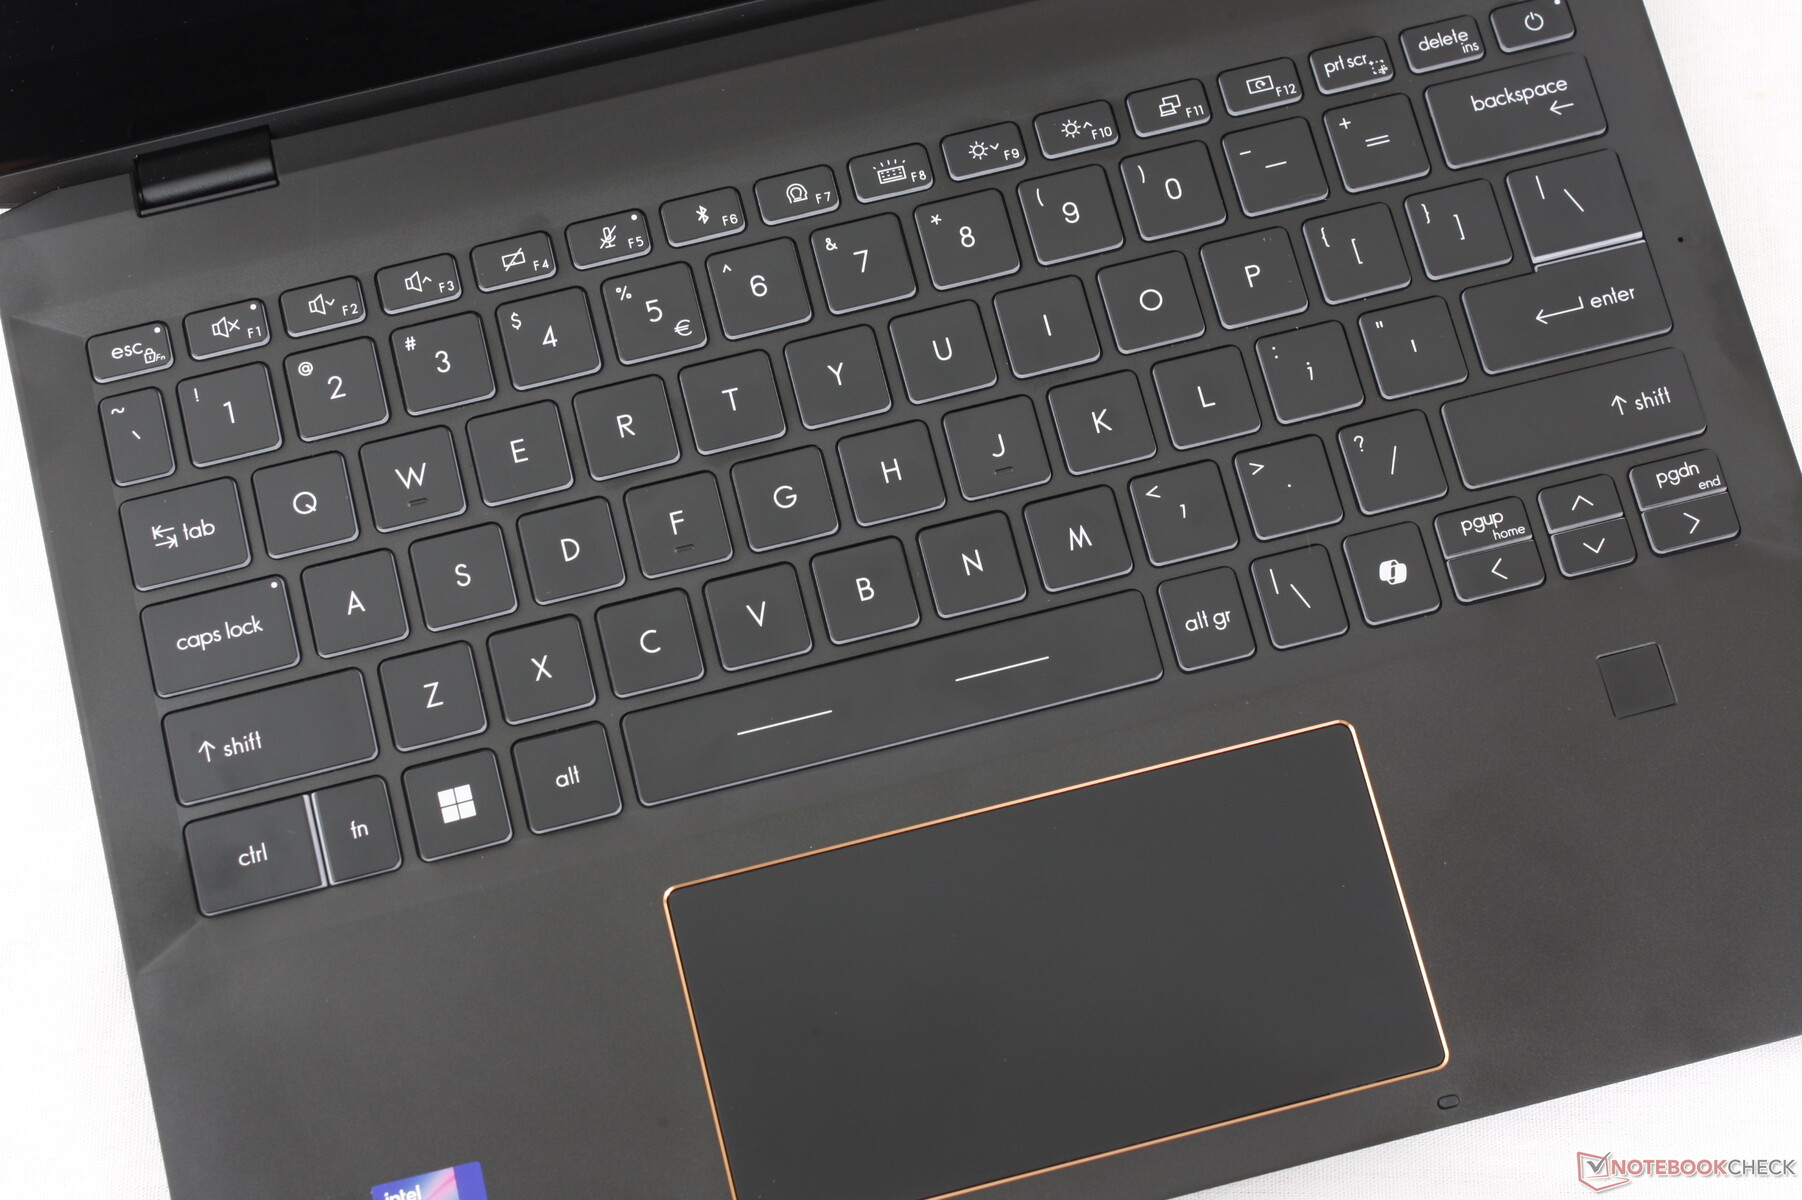
输入设备
键盘和点击板的整体尺寸和反馈没有变化,打字体验与 2021 机型相同。今年新增了专用的副驾驶键,并对 Fn 和 Ctrl 键进行了小幅修改。遗憾的是,小尺寸的 PgUp、PgDn 和方向键仍然非常拥挤、松软,总体上不可靠。
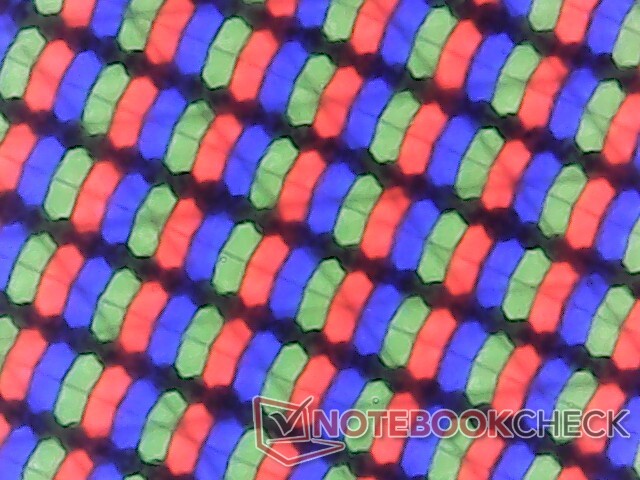
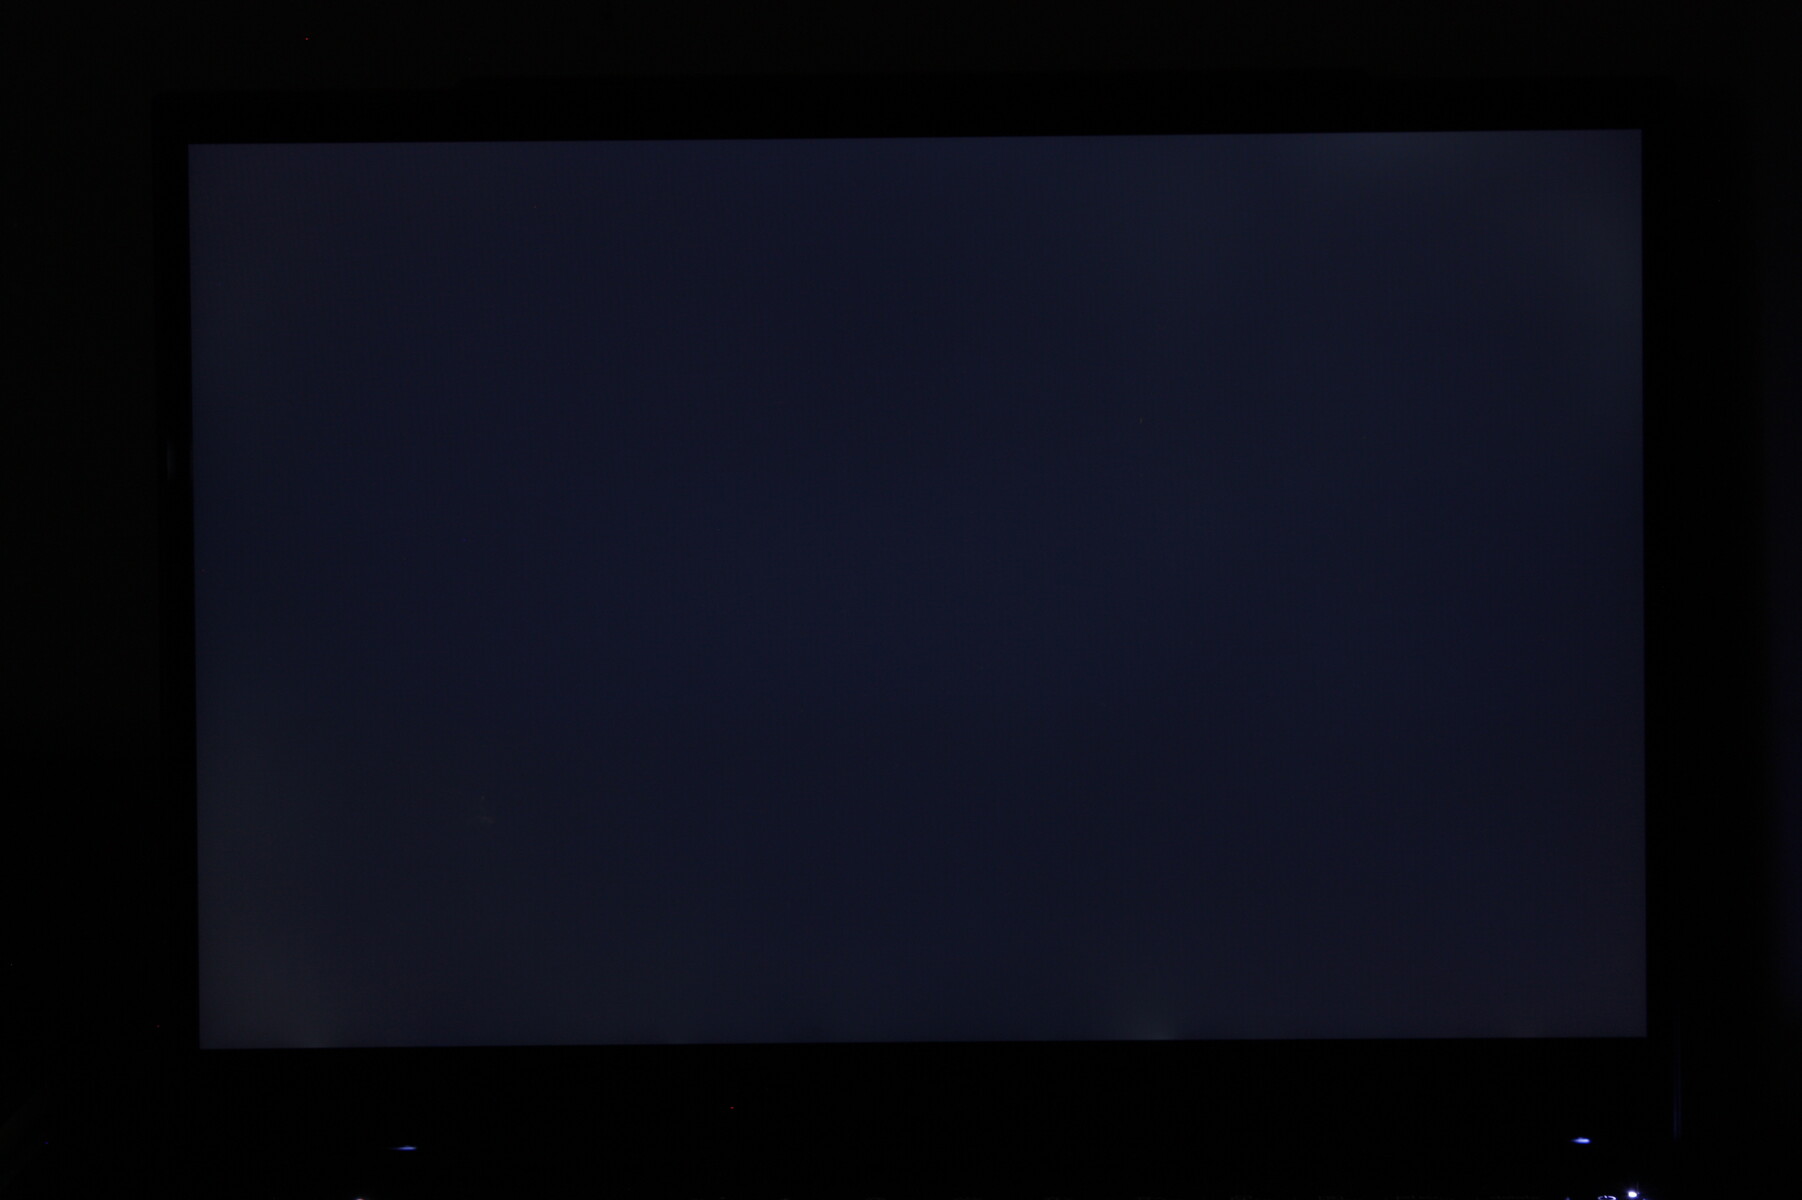
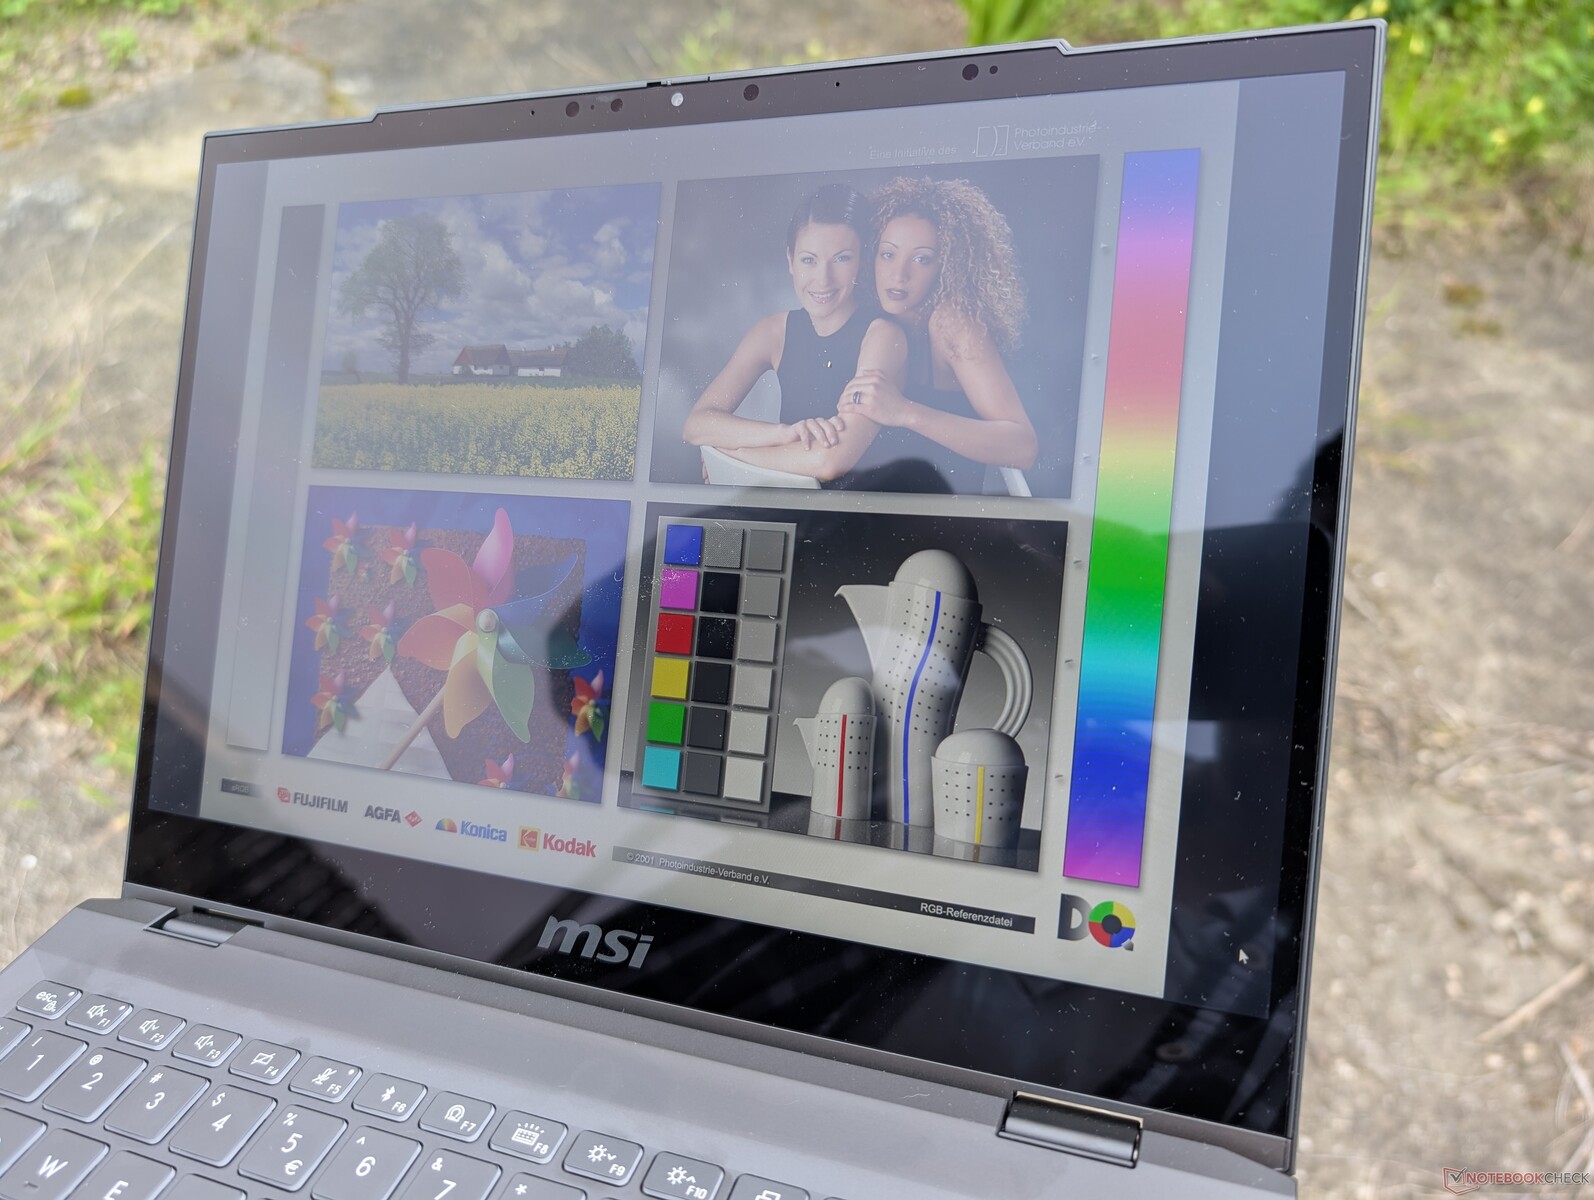
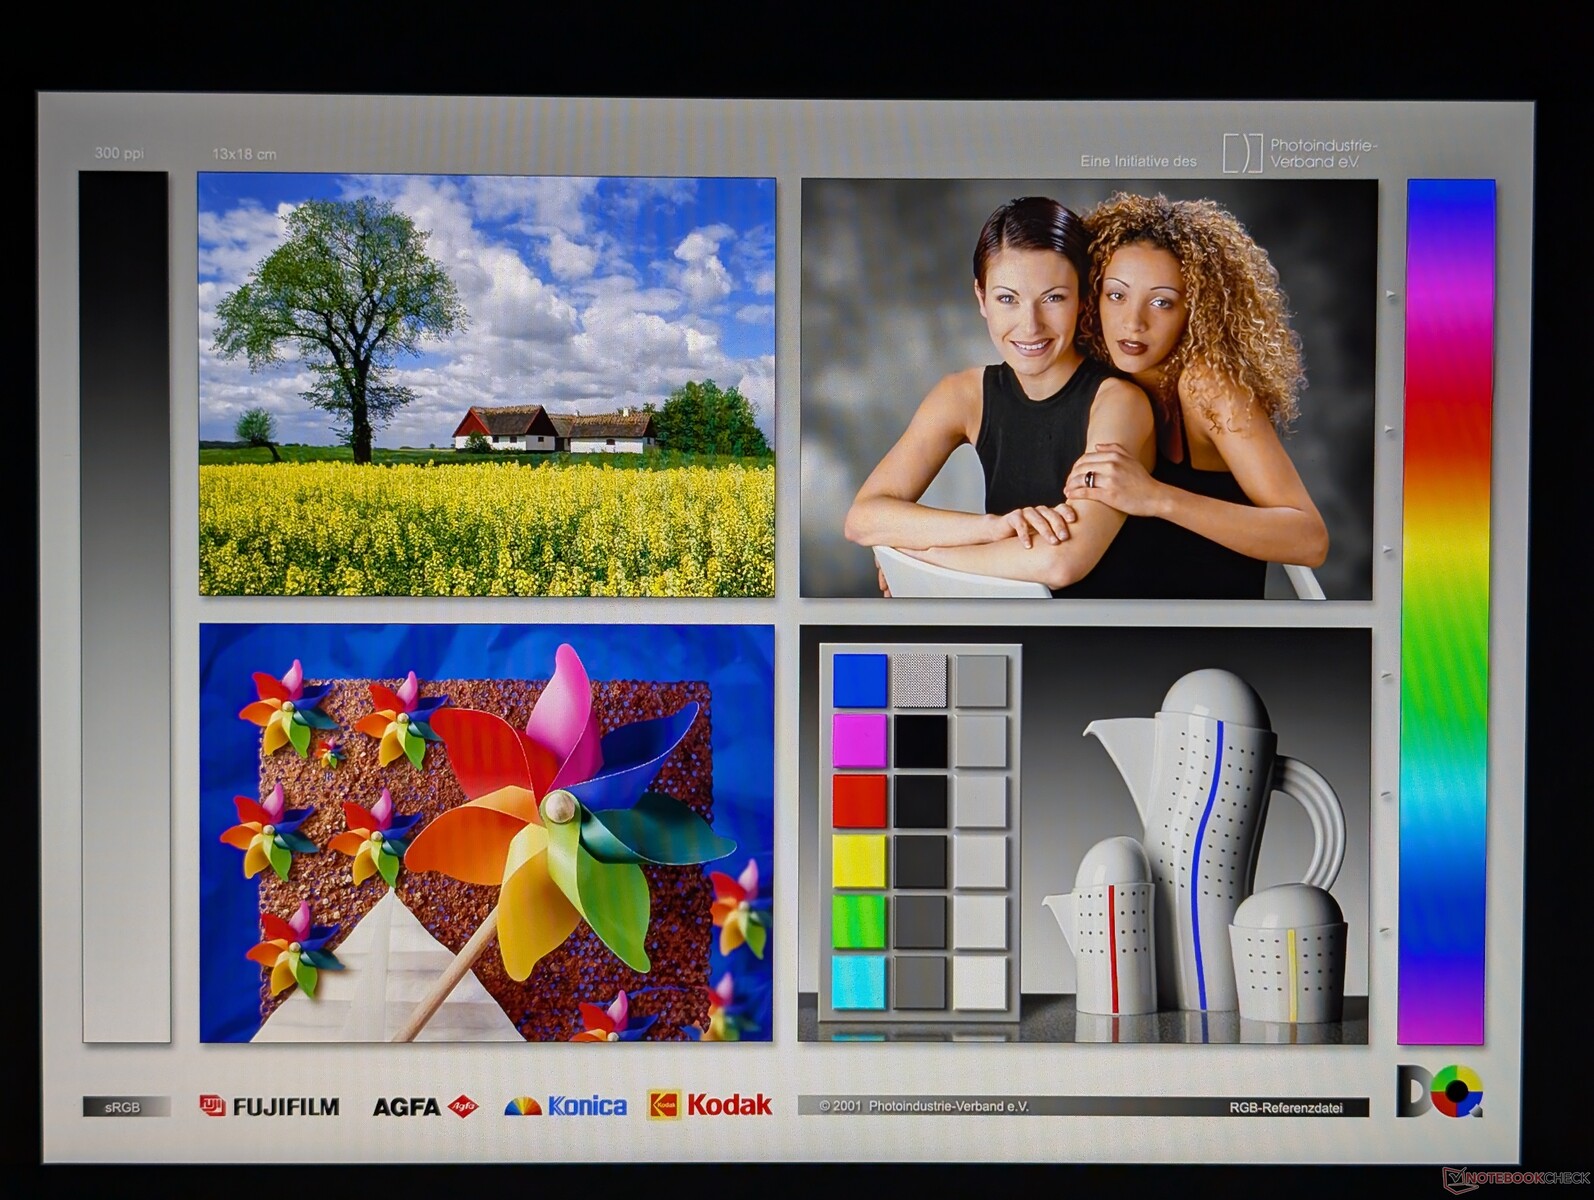
显示屏--性价比一般
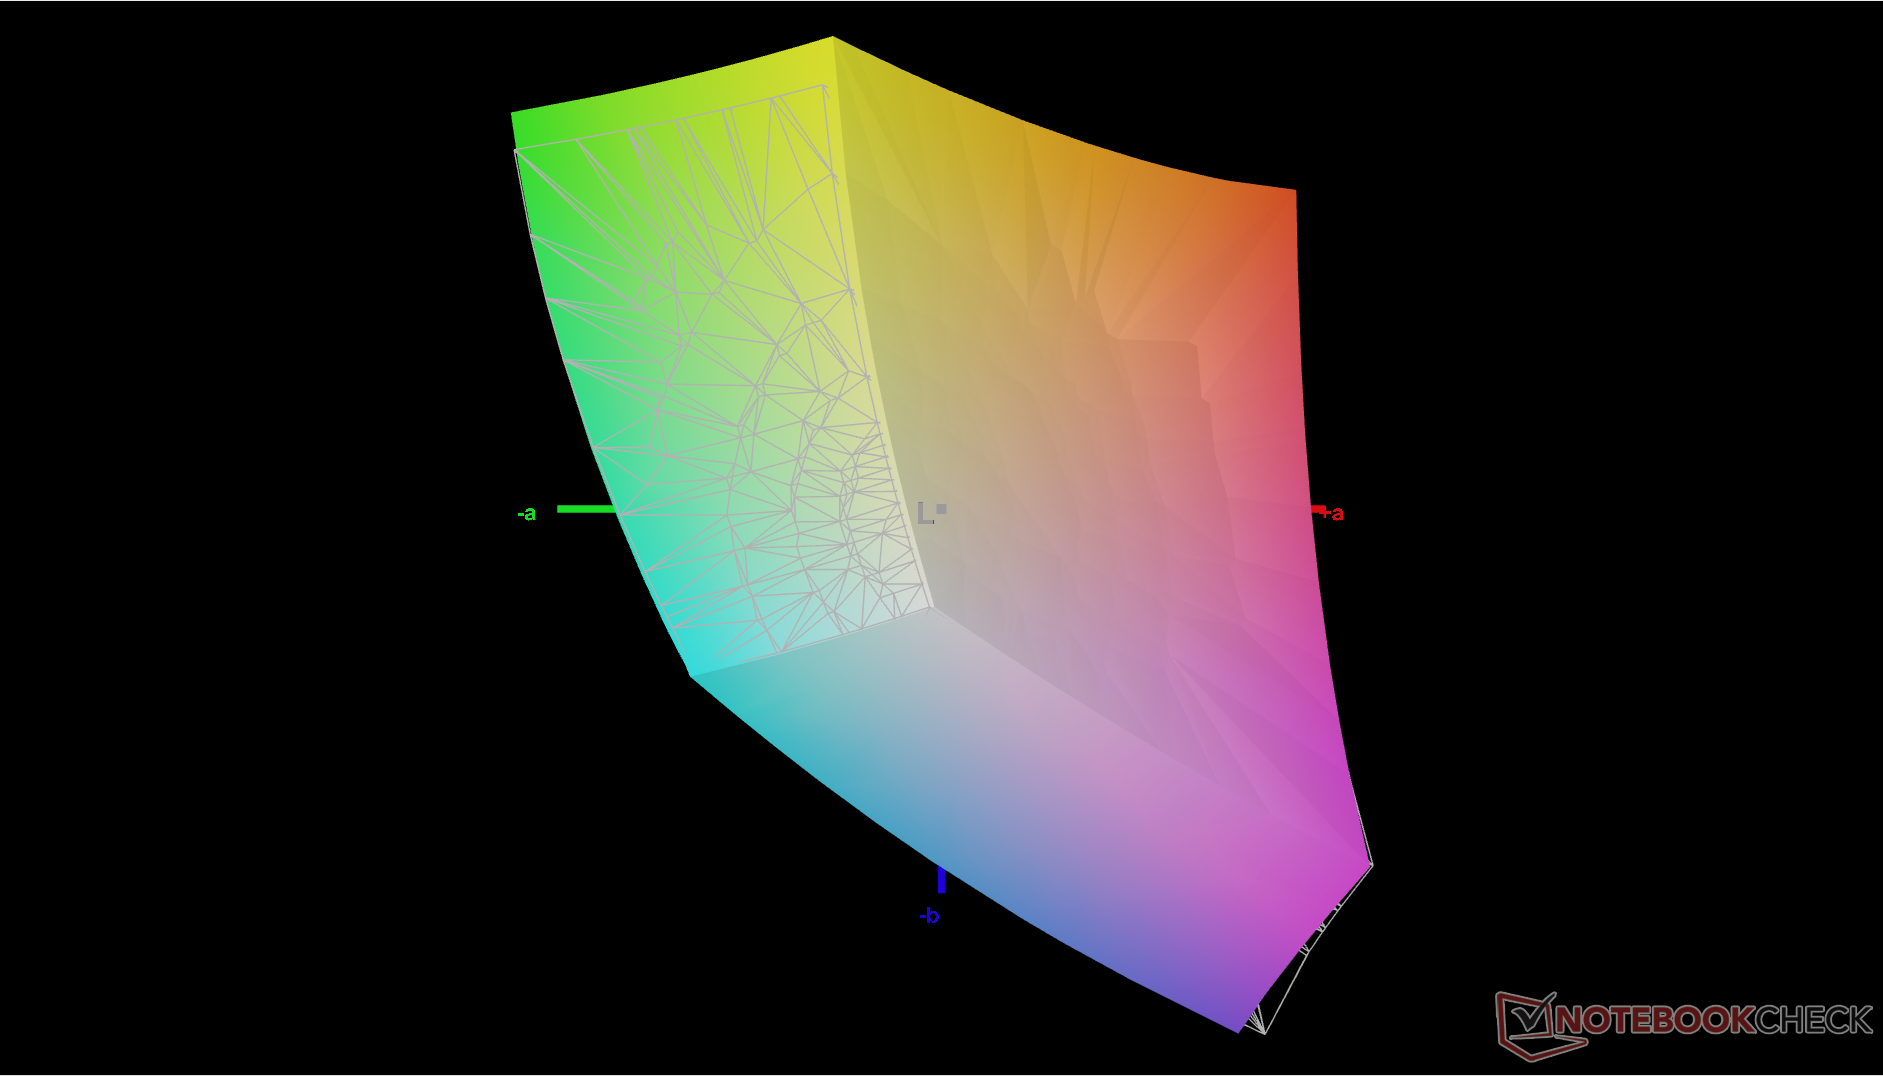
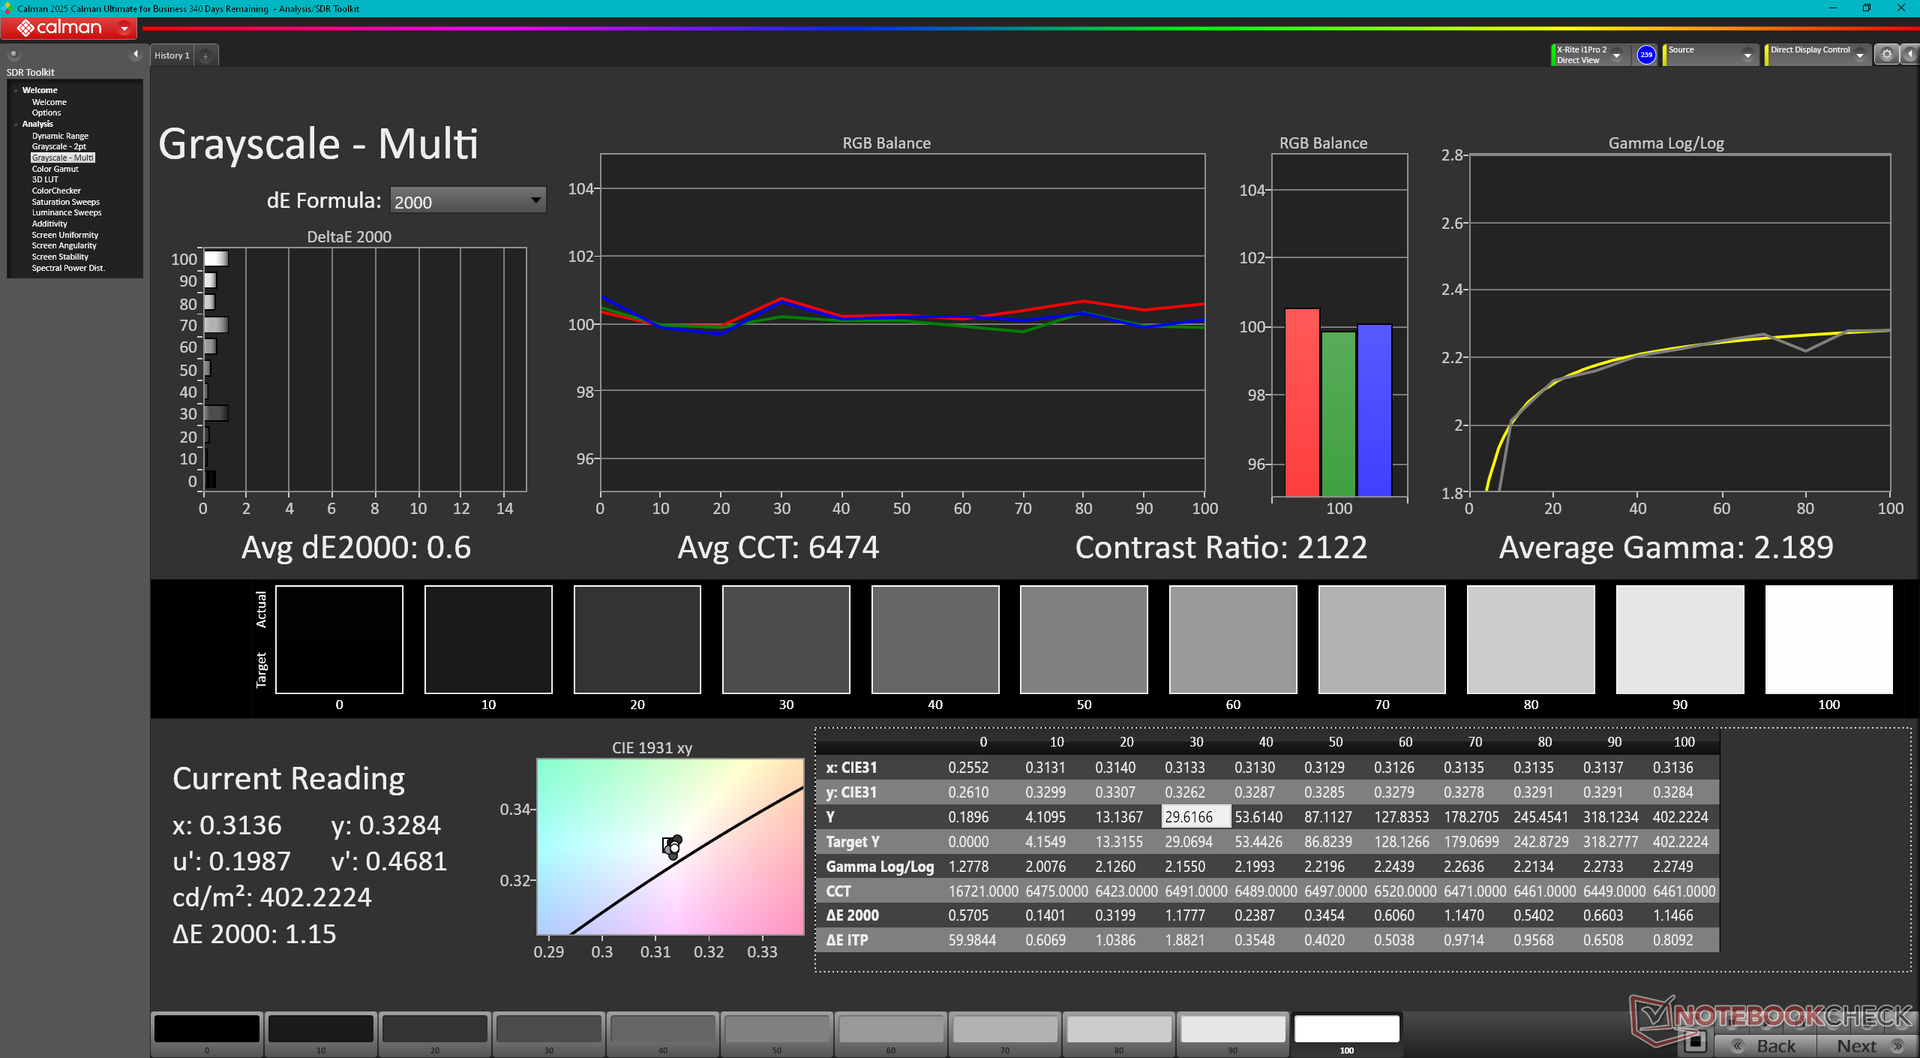
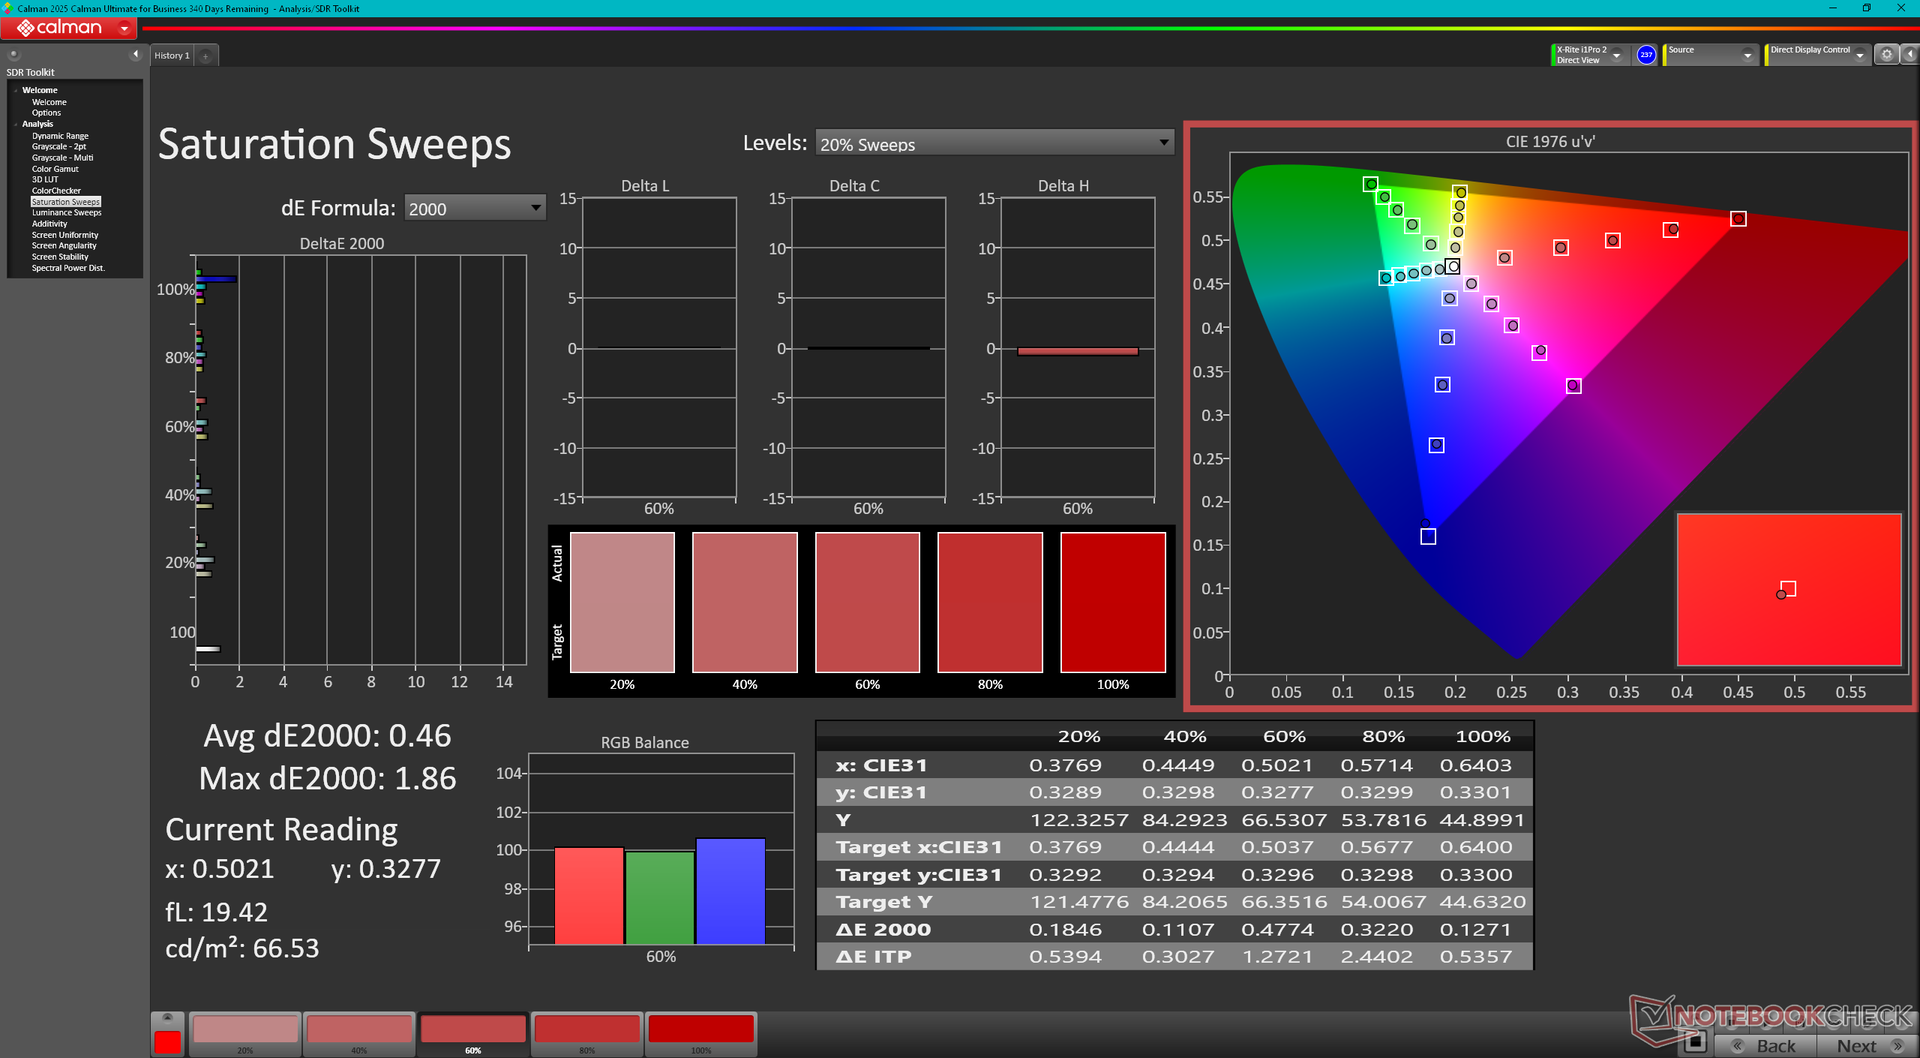
我们的设备采用的是 60 赫兹的奇美面板,而不是 2021 型号上 120 赫兹的夏普面板。奇美面板提供类似的 sRGB 色彩,但对比度略低。即使按照非游戏标准,黑白和灰度响应时间仍然很慢。
| |||||||||||||||||||||||||
Brightness Distribution: 88 %
Center on Battery: 405.2 cd/m²
Contrast: 1192:1 (Black: 0.34 cd/m²)
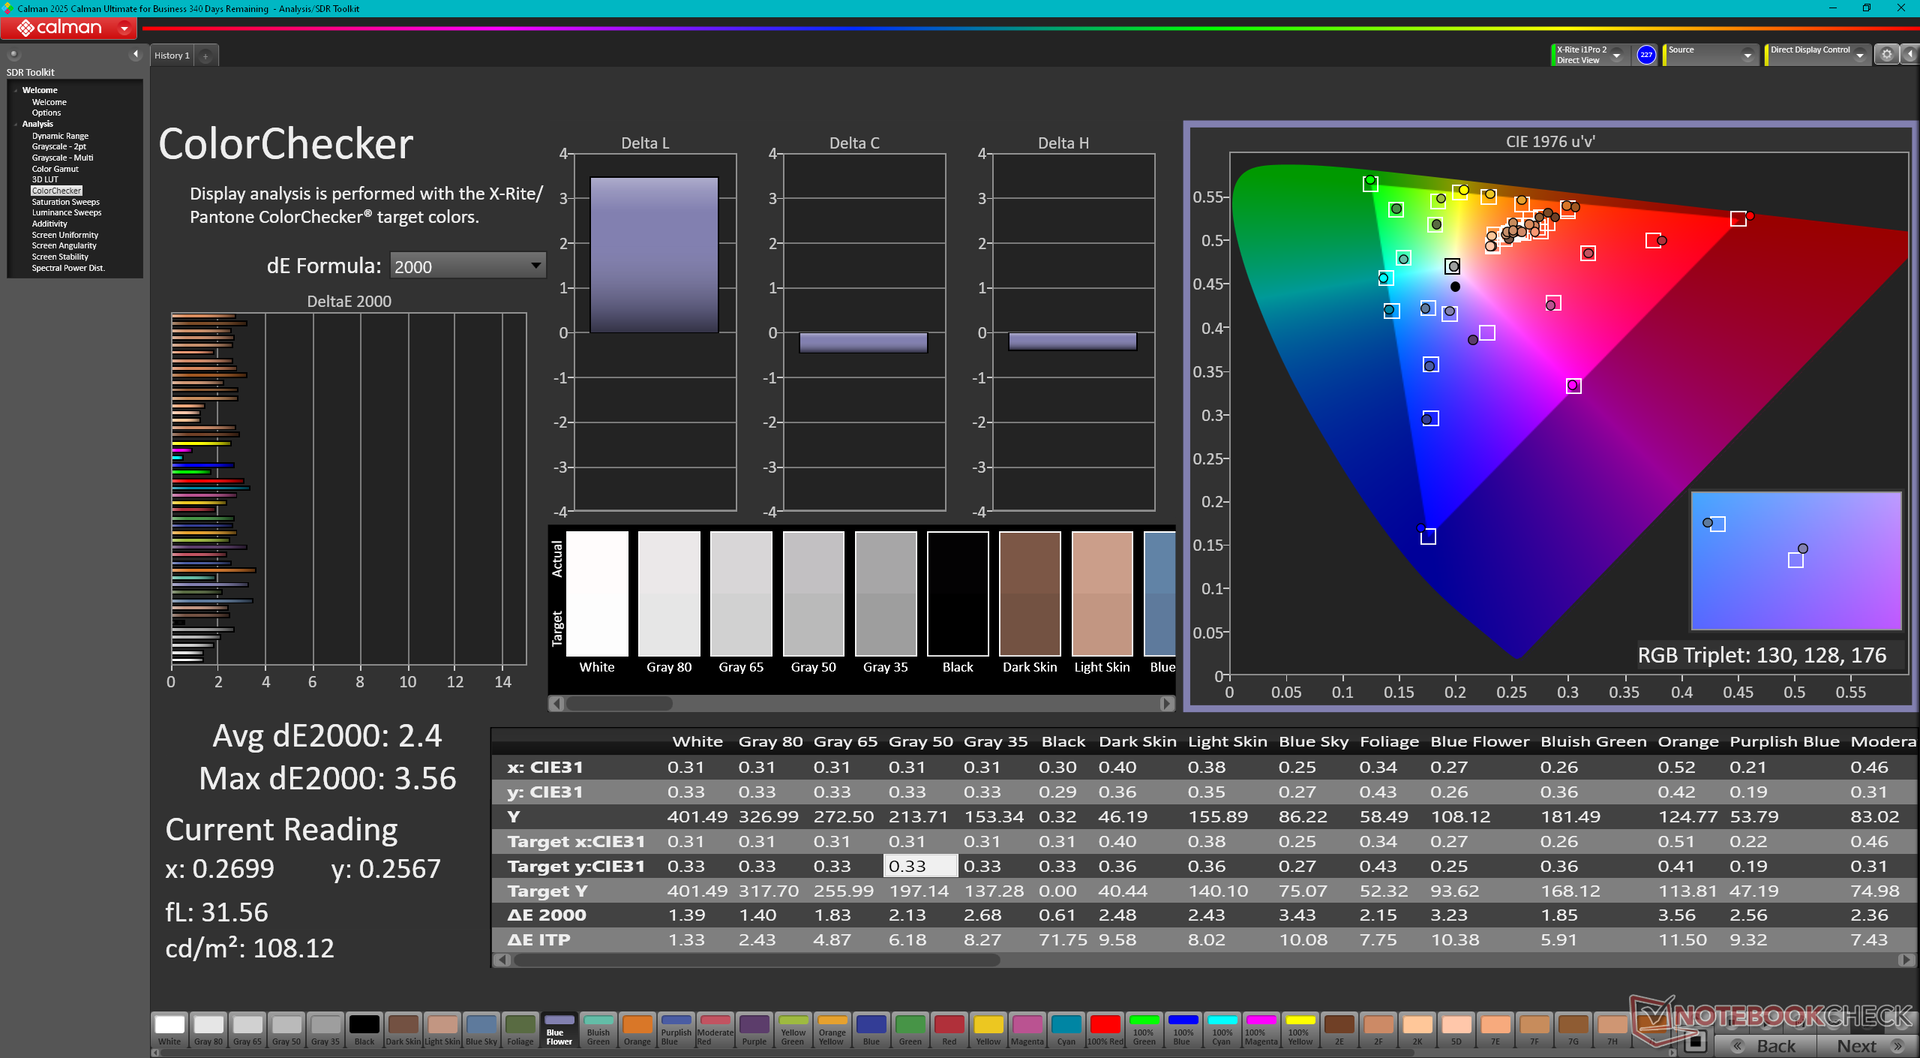
ΔE Color 2.4 | 0.5-29.43 Ø4.86, calibrated: 0.54
ΔE Greyscale 1.9 | 0.5-98 Ø5.1
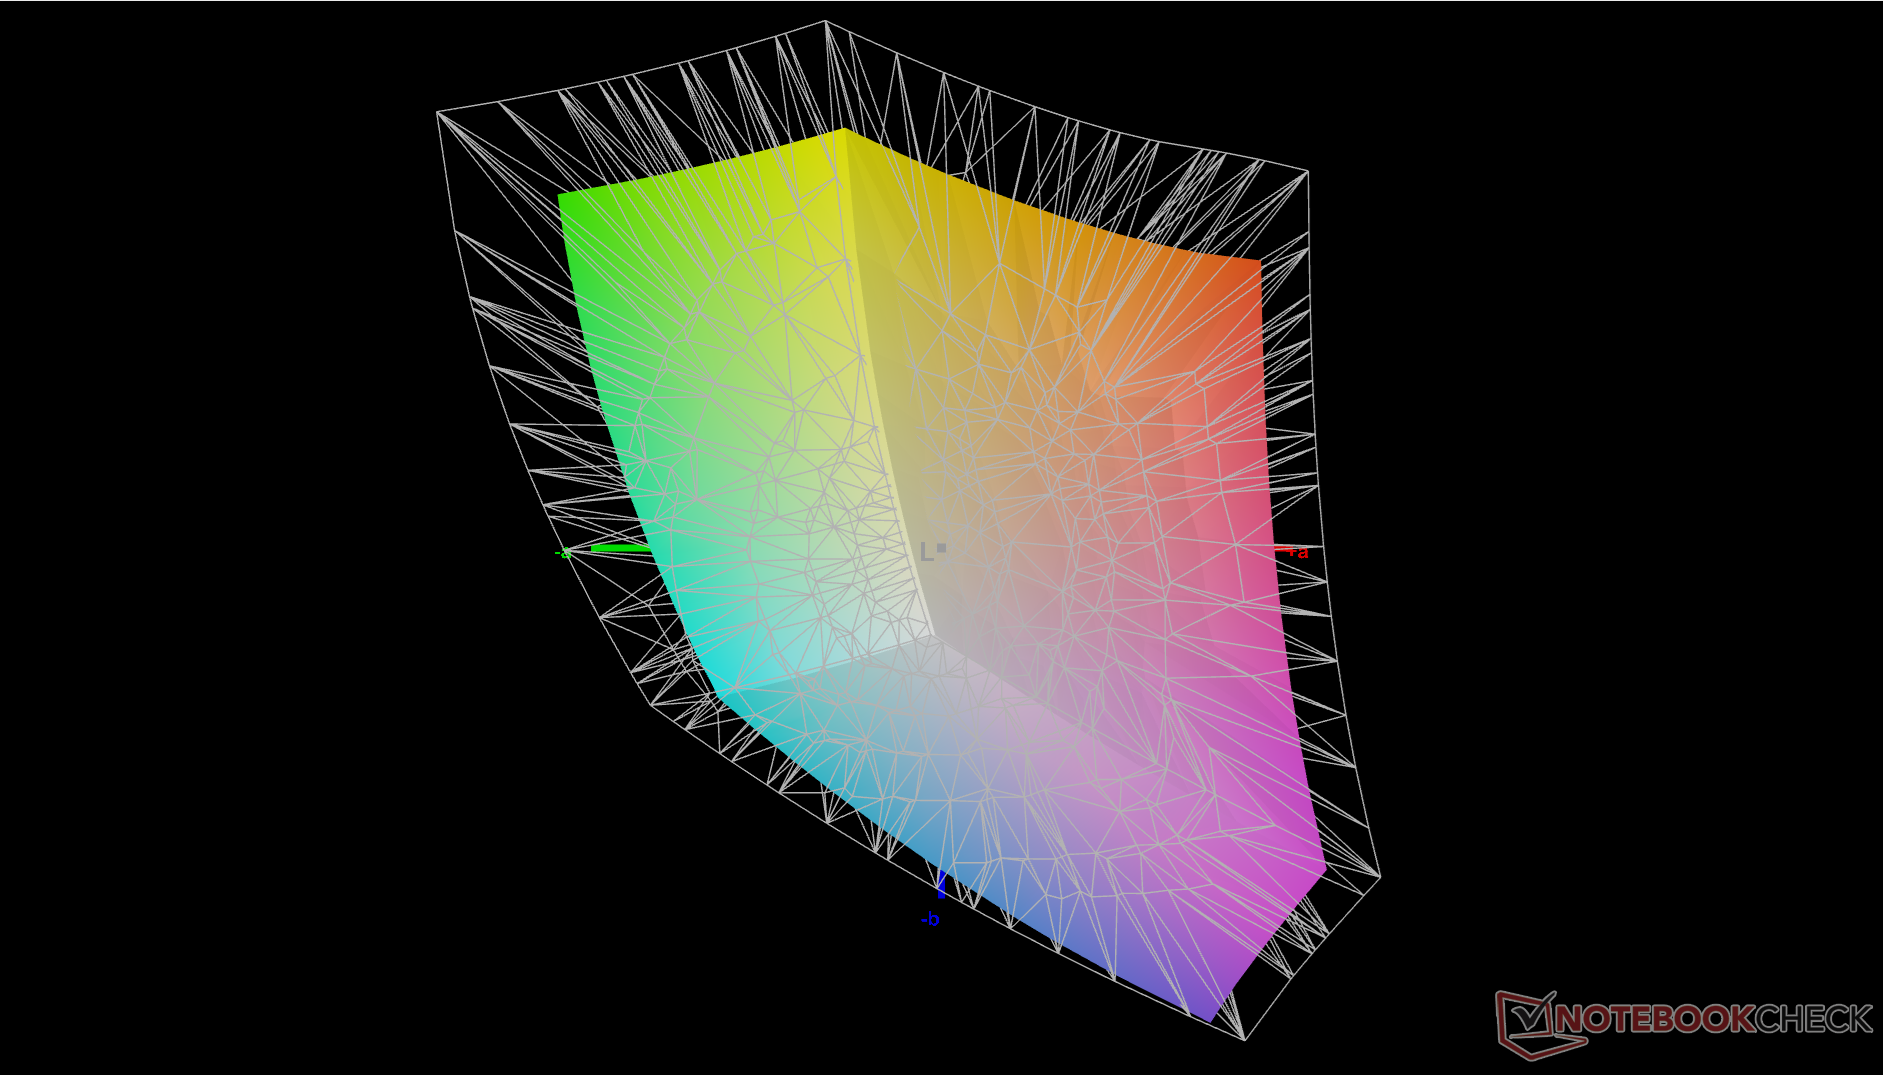
73.1% AdobeRGB 1998 (Argyll 2.2.0 3D)
98.6% sRGB (Argyll 2.2.0 3D)
71.6% Display P3 (Argyll 2.2.0 3D)
Gamma: 2
| MSI Summit E13 AI Evo A1MTG CMN13C6, IPS, 1920x1200, 13.3", 60 Hz | MSI Summit E13 Flip Evo A11MT Sharp LQ134N1JW53, IPS, 1920x1200, 13.4", 120 Hz | Lenovo Yoga Book 9 13IMU9 SDC ATNA33AA02-0, OLED, 2880x1800, 13.3", 60 Hz | Lenovo ThinkPad L13 Yoga G4 i7-1355U NV133WUM-N61, IPS, 1920x1200, 13.3", 60 Hz | HP Elite Dragonfly Folio 13.5 G3 Chi Mei CMN13C0, IPS, 1920x1280, 13.5", 60 Hz | Dell Latitude 9330 AU Optronics B133QAA, IPS, 2560x1600, 13.3", 60 Hz | |
|---|---|---|---|---|---|---|
| Display | -2% | 24% | -0% | -3% | 5% | |
| Display P3 Coverage | 71.6 | 69.8 -3% | 99.7 39% | 71.6 0% | 68.3 -5% | 77.8 9% |
| sRGB Coverage | 98.6 | 98.8 0% | 100 1% | 99.8 1% | 98.6 0% | 99.9 1% |
| AdobeRGB 1998 Coverage | 73.1 | 70.6 -3% | 97 33% | 71.9 -2% | 70.2 -4% | 77.5 6% |
| Response Times | -16% | 96% | 52% | -19% | -29% | |
| Response Time Grey 50% / Grey 80% * | 60 ? | 64 ? -7% | 1.88 ? 97% | 27.3 ? 54% | 66.8 ? -11% | 67.6 ? -13% |
| Response Time Black / White * | 35.1 ? | 44 ? -25% | 2.1 ? 94% | 17.9 ? 49% | 44.4 ? -26% | 50.4 ? -44% |
| PWM Frequency | 60 ? | |||||
| Screen | -3% | -34% | -25% | -6% | -12% | |
| Brightness middle | 405.2 | 551.3 36% | 362.6 -11% | 278.1 -31% | 369.5 -9% | 542.3 34% |
| Brightness | 372 | 517 39% | 368 -1% | 280 -25% | 350 -6% | 516 39% |
| Brightness Distribution | 88 | 91 3% | 97 10% | 92 5% | 87 -1% | 85 -3% |
| Black Level * | 0.34 | 0.37 -9% | 0.34 -0% | 0.24 29% | 0.38 -12% | |
| Contrast | 1192 | 1490 25% | 818 -31% | 1540 29% | 1427 20% | |
| Colorchecker dE 2000 * | 2.4 | 1.45 40% | 4.66 -94% | 2.6 -8% | 2.3 4% | 3.18 -33% |
| Colorchecker dE 2000 max. * | 3.56 | 2.86 20% | 7.25 -104% | 4.81 -35% | 4.34 -22% | 6.05 -70% |
| Colorchecker dE 2000 calibrated * | 0.54 | 1.7 -215% | 0.56 -4% | 0.51 6% | 0.6 -11% | 0.67 -24% |
| Greyscale dE 2000 * | 1.9 | 1.3 32% | 2.6 -37% | 3.9 -105% | 3.1 -63% | 3.1 -63% |
| Gamma | 2 110% | 2.14 103% | 2.2 100% | 2.29 96% | 2.1 105% | 2.08 106% |
| CCT | 6503 100% | 6580 99% | 6055 107% | 5877 111% | 6248 104% | 6140 106% |
| Color Space (Percent of AdobeRGB 1998) | 65 | |||||
| Color Space (Percent of sRGB) | 99 | |||||
| Total Average (Program / Settings) | -7% /
-5% | 29% /
2% | 9% /
-9% | -9% /
-7% | -12% /
-11% |
* ... smaller is better
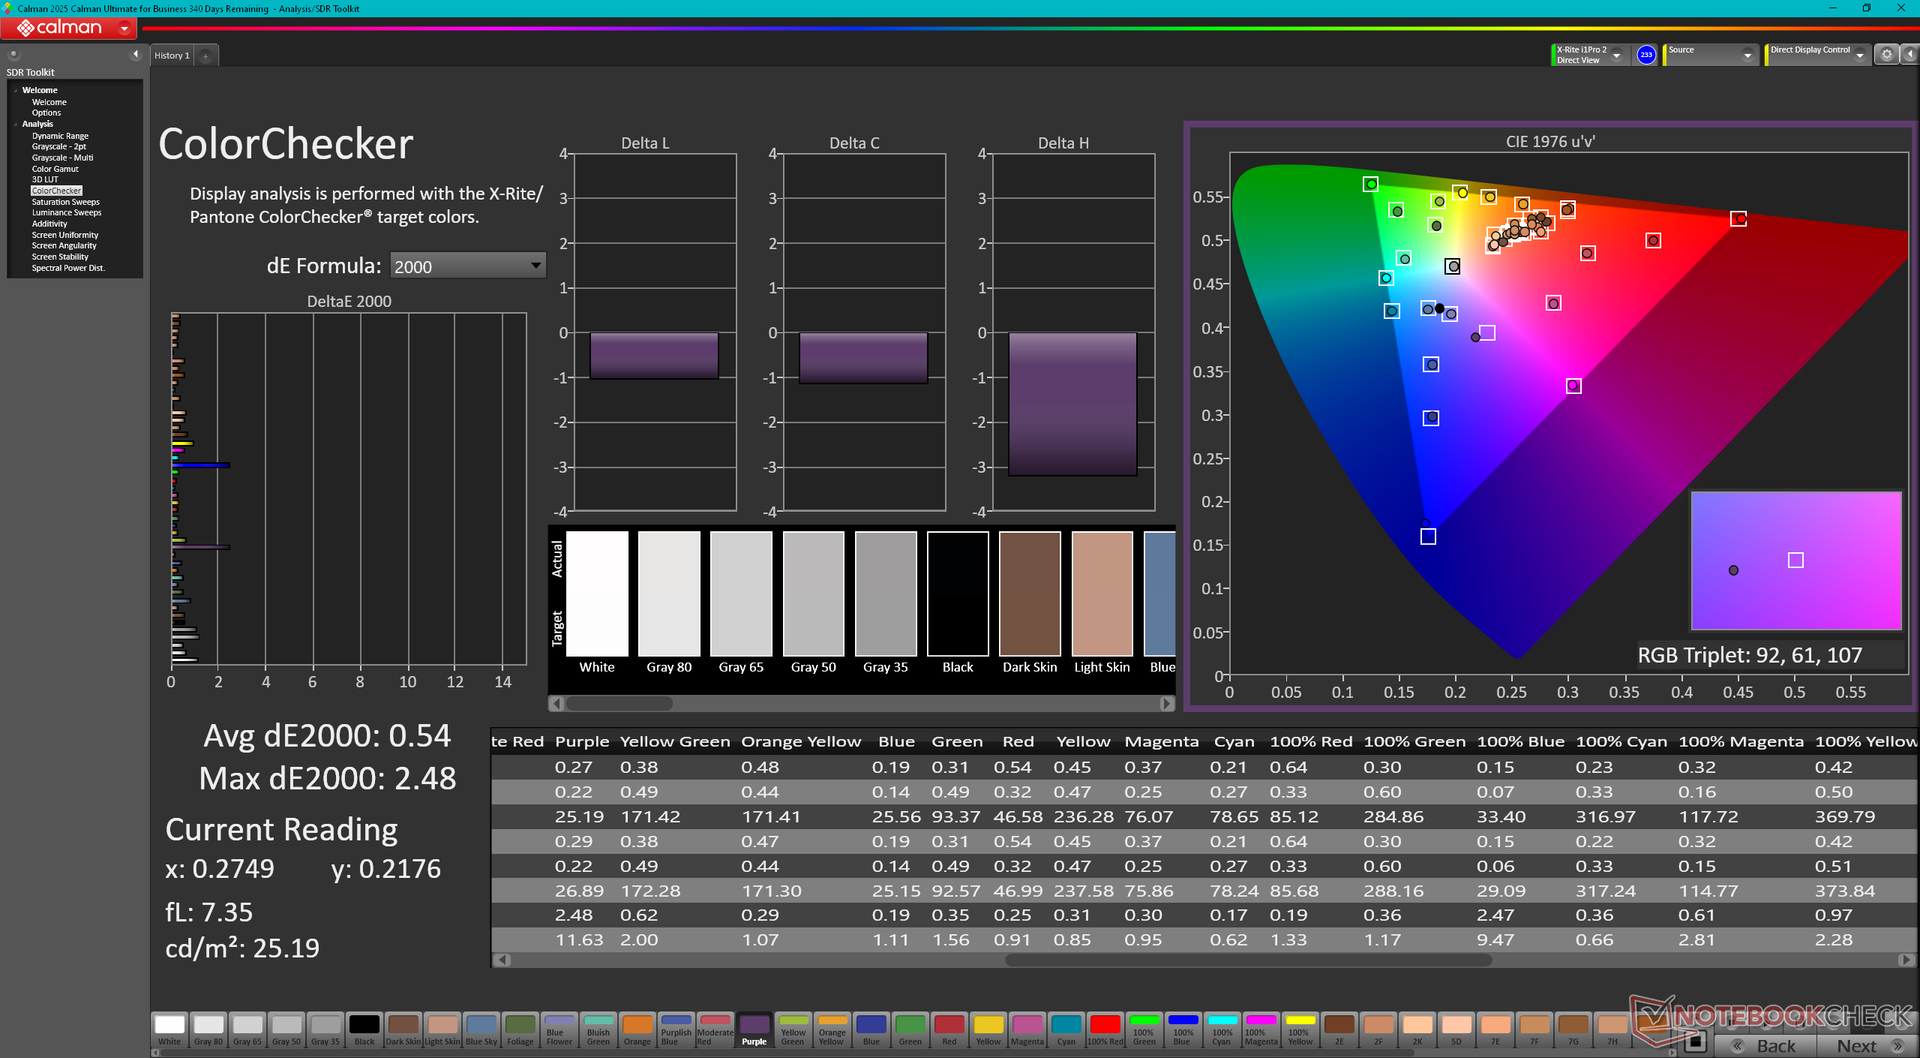
显示器的开箱校准可能还不错,但我们自己的 X-Rite 校准可以进一步改善色彩。平均灰度和色彩 DeltaE 值分别低至 0.6 和 0.54。


Display Response Times
| ↔ Response Time Black to White | ||
|---|---|---|
| 35.1 ms ... rise ↗ and fall ↘ combined | ↗ 17 ms rise | 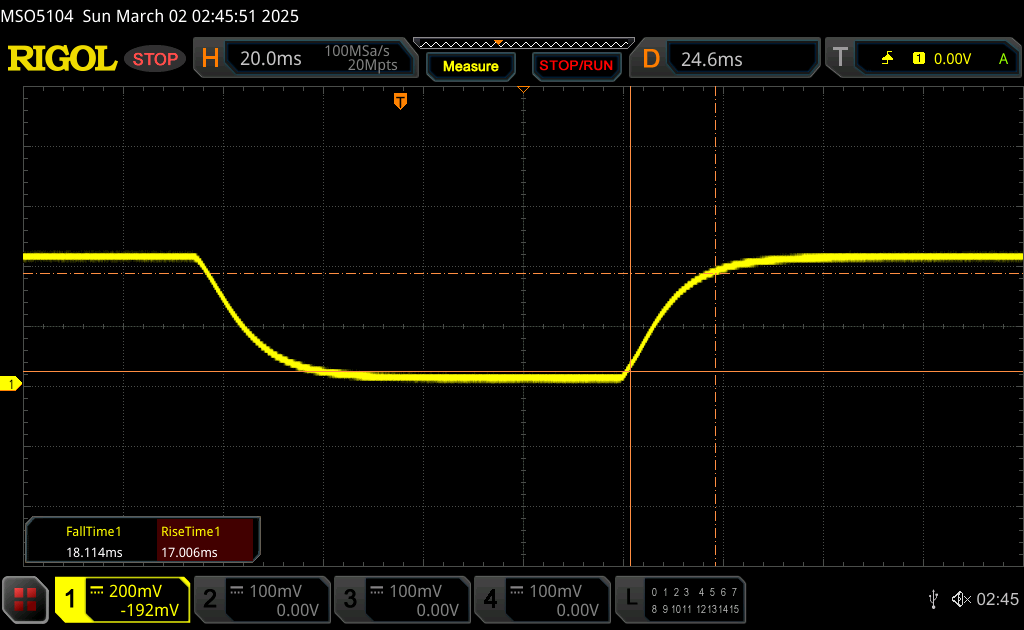 |
| ↘ 18.1 ms fall | ||
| The screen shows slow response rates in our tests and will be unsatisfactory for gamers. In comparison, all tested devices range from 0.1 (minimum) to 240 (maximum) ms. » 92 % of all devices are better. This means that the measured response time is worse than the average of all tested devices (20.7 ms). | ||
| ↔ Response Time 50% Grey to 80% Grey | ||
| 60 ms ... rise ↗ and fall ↘ combined | ↗ 27.2 ms rise | 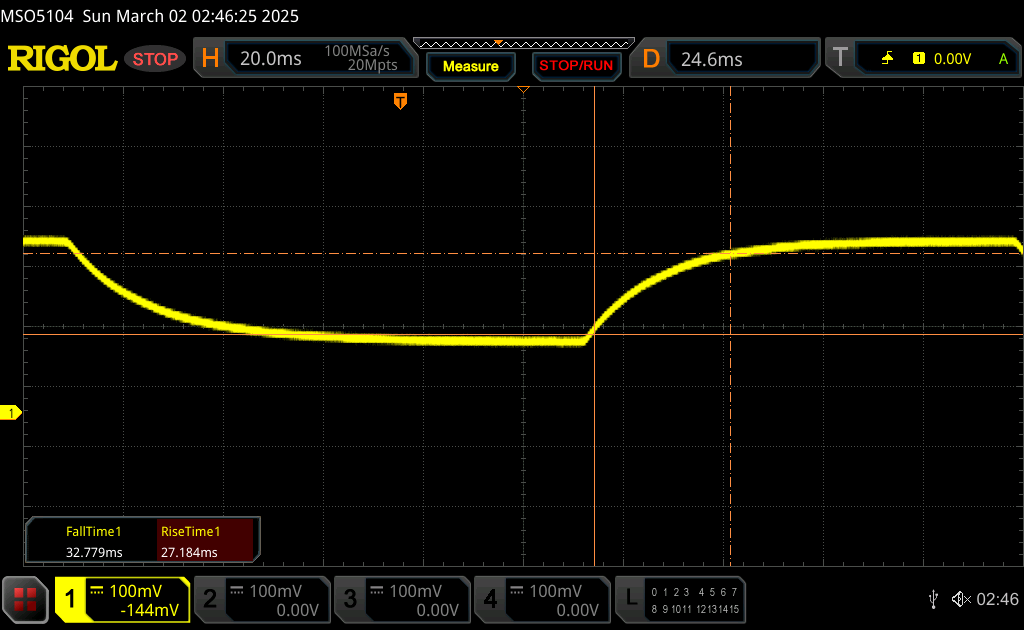 |
| ↘ 32.8 ms fall | ||
| The screen shows slow response rates in our tests and will be unsatisfactory for gamers. In comparison, all tested devices range from 0.165 (minimum) to 636 (maximum) ms. » 95 % of all devices are better. This means that the measured response time is worse than the average of all tested devices (32.5 ms). | ||
Screen Flickering / PWM (Pulse-Width Modulation)
| Screen flickering / PWM not detected | 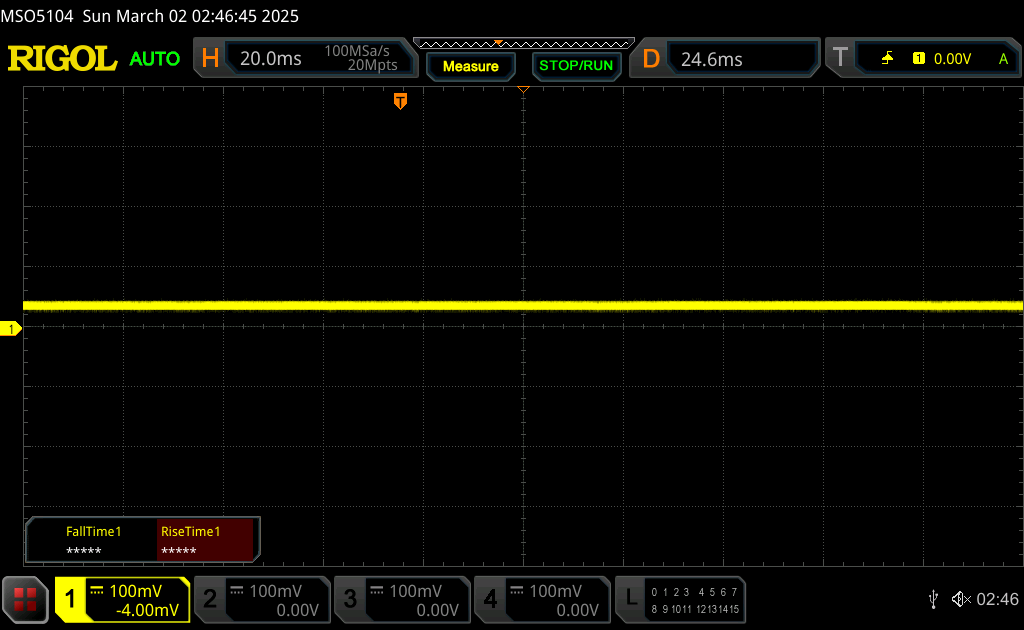 | ||
In comparison: 53 % of all tested devices do not use PWM to dim the display. If PWM was detected, an average of 8485 (minimum: 5 - maximum: 343500) Hz was measured. | |||
性能 - Core Ultra-H 难以驾驭
测试条件
在运行以下基准测试之前,我们将 Windows 设置为高性能模式,将 MSI Center 设置为极致性能模式。
处理器
在我们的 CineBench R15 xT 压力测试中,CPU 的原始多线程性能仅在第一个循环后就会下降 20% 以上。因此,我们系统的性能比我们数据库中配备相同的 酷睿至尊 7 155H处理器的笔记本电脑的平均性能要慢大约 20%。
Cinebench R15 Multi Loop
Cinebench R23: Multi Core | Single Core
Cinebench R20: CPU (Multi Core) | CPU (Single Core)
Cinebench R15: CPU Multi 64Bit | CPU Single 64Bit
Blender: v2.79 BMW27 CPU
7-Zip 18.03: 7z b 4 | 7z b 4 -mmt1
Geekbench 6.4: Multi-Core | Single-Core
Geekbench 5.5: Multi-Core | Single-Core
HWBOT x265 Benchmark v2.2: 4k Preset
LibreOffice : 20 Documents To PDF
R Benchmark 2.5: Overall mean
| Geekbench 6.4 / Multi-Core | |
| Asus ROG Flow Z13 GZ302EA-RU073W | |
| Average Intel Core Ultra 7 155H (7732 - 13656, n=55) | |
| Framework Laptop 13.5 Ryzen 7 7840U | |
| MSI Prestige 13 AI Plus Evo A2VMG | |
| MSI Summit E13 AI Evo A1MTG | |
| Lenovo Yoga Book 9 13IMU9 | |
| Lenovo ThinkPad L13 Yoga G4 i7-1355U | |
| Geekbench 6.4 / Single-Core | |
| Asus ROG Flow Z13 GZ302EA-RU073W | |
| MSI Prestige 13 AI Plus Evo A2VMG | |
| Framework Laptop 13.5 Ryzen 7 7840U | |
| Lenovo ThinkPad L13 Yoga G4 i7-1355U | |
| Average Intel Core Ultra 7 155H (1901 - 2473, n=52) | |
| Lenovo Yoga Book 9 13IMU9 | |
| MSI Summit E13 AI Evo A1MTG | |
* ... smaller is better
AIDA64: FP32 Ray-Trace | FPU Julia | CPU SHA3 | CPU Queen | FPU SinJulia | FPU Mandel | CPU AES | CPU ZLib | FP64 Ray-Trace | CPU PhotoWorxx
| Performance Rating | |
| Average Intel Core Ultra 7 155H | |
| MSI Summit E13 AI Evo A1MTG | |
| Lenovo Yoga Book 9 13IMU9 | |
| MSI Summit E13 Flip Evo A11MT | |
| HP Elite Dragonfly Folio 13.5 G3 | |
| Lenovo ThinkPad L13 Yoga G4 i7-1355U | |
| Dell Latitude 9330 | |
| AIDA64 / FP32 Ray-Trace | |
| Average Intel Core Ultra 7 155H (6670 - 18470, n=50) | |
| MSI Summit E13 AI Evo A1MTG | |
| Lenovo Yoga Book 9 13IMU9 | |
| MSI Summit E13 Flip Evo A11MT | |
| Dell Latitude 9330 | |
| HP Elite Dragonfly Folio 13.5 G3 | |
| Lenovo ThinkPad L13 Yoga G4 i7-1355U | |
| AIDA64 / FPU Julia | |
| Average Intel Core Ultra 7 155H (40905 - 93181, n=50) | |
| MSI Summit E13 AI Evo A1MTG | |
| Lenovo Yoga Book 9 13IMU9 | |
| HP Elite Dragonfly Folio 13.5 G3 | |
| Dell Latitude 9330 | |
| Lenovo ThinkPad L13 Yoga G4 i7-1355U | |
| MSI Summit E13 Flip Evo A11MT | |
| AIDA64 / CPU SHA3 | |
| Average Intel Core Ultra 7 155H (1940 - 4436, n=50) | |
| MSI Summit E13 AI Evo A1MTG | |
| Lenovo Yoga Book 9 13IMU9 | |
| MSI Summit E13 Flip Evo A11MT | |
| Dell Latitude 9330 | |
| Lenovo ThinkPad L13 Yoga G4 i7-1355U | |
| HP Elite Dragonfly Folio 13.5 G3 | |
| AIDA64 / CPU Queen | |
| Average Intel Core Ultra 7 155H (64698 - 94181, n=50) | |
| MSI Summit E13 AI Evo A1MTG | |
| HP Elite Dragonfly Folio 13.5 G3 | |
| Lenovo ThinkPad L13 Yoga G4 i7-1355U | |
| MSI Summit E13 Flip Evo A11MT | |
| Dell Latitude 9330 | |
| Lenovo Yoga Book 9 13IMU9 | |
| AIDA64 / FPU SinJulia | |
| Average Intel Core Ultra 7 155H (5639 - 10647, n=50) | |
| MSI Summit E13 AI Evo A1MTG | |
| Lenovo Yoga Book 9 13IMU9 | |
| MSI Summit E13 Flip Evo A11MT | |
| HP Elite Dragonfly Folio 13.5 G3 | |
| Lenovo ThinkPad L13 Yoga G4 i7-1355U | |
| Dell Latitude 9330 | |
| AIDA64 / FPU Mandel | |
| Average Intel Core Ultra 7 155H (18236 - 47685, n=50) | |
| MSI Summit E13 AI Evo A1MTG | |
| Lenovo Yoga Book 9 13IMU9 | |
| MSI Summit E13 Flip Evo A11MT | |
| HP Elite Dragonfly Folio 13.5 G3 | |
| Dell Latitude 9330 | |
| Lenovo ThinkPad L13 Yoga G4 i7-1355U | |
| AIDA64 / CPU AES | |
| Average Intel Core Ultra 7 155H (45713 - 152179, n=50) | |
| MSI Summit E13 Flip Evo A11MT | |
| MSI Summit E13 AI Evo A1MTG | |
| Lenovo Yoga Book 9 13IMU9 | |
| HP Elite Dragonfly Folio 13.5 G3 | |
| Lenovo ThinkPad L13 Yoga G4 i7-1355U | |
| Dell Latitude 9330 | |
| AIDA64 / CPU ZLib | |
| Average Intel Core Ultra 7 155H (557 - 1250, n=50) | |
| MSI Summit E13 AI Evo A1MTG | |
| Lenovo Yoga Book 9 13IMU9 | |
| HP Elite Dragonfly Folio 13.5 G3 | |
| Lenovo ThinkPad L13 Yoga G4 i7-1355U | |
| Dell Latitude 9330 | |
| MSI Summit E13 Flip Evo A11MT | |
| AIDA64 / FP64 Ray-Trace | |
| Average Intel Core Ultra 7 155H (3569 - 9802, n=50) | |
| MSI Summit E13 AI Evo A1MTG | |
| Lenovo Yoga Book 9 13IMU9 | |
| MSI Summit E13 Flip Evo A11MT | |
| Dell Latitude 9330 | |
| HP Elite Dragonfly Folio 13.5 G3 | |
| Lenovo ThinkPad L13 Yoga G4 i7-1355U | |
| AIDA64 / CPU PhotoWorxx | |
| Average Intel Core Ultra 7 155H (32719 - 54223, n=50) | |
| Lenovo Yoga Book 9 13IMU9 | |
| HP Elite Dragonfly Folio 13.5 G3 | |
| MSI Summit E13 AI Evo A1MTG | |
| MSI Summit E13 Flip Evo A11MT | |
| Dell Latitude 9330 | |
| Lenovo ThinkPad L13 Yoga G4 i7-1355U | |
压力测试
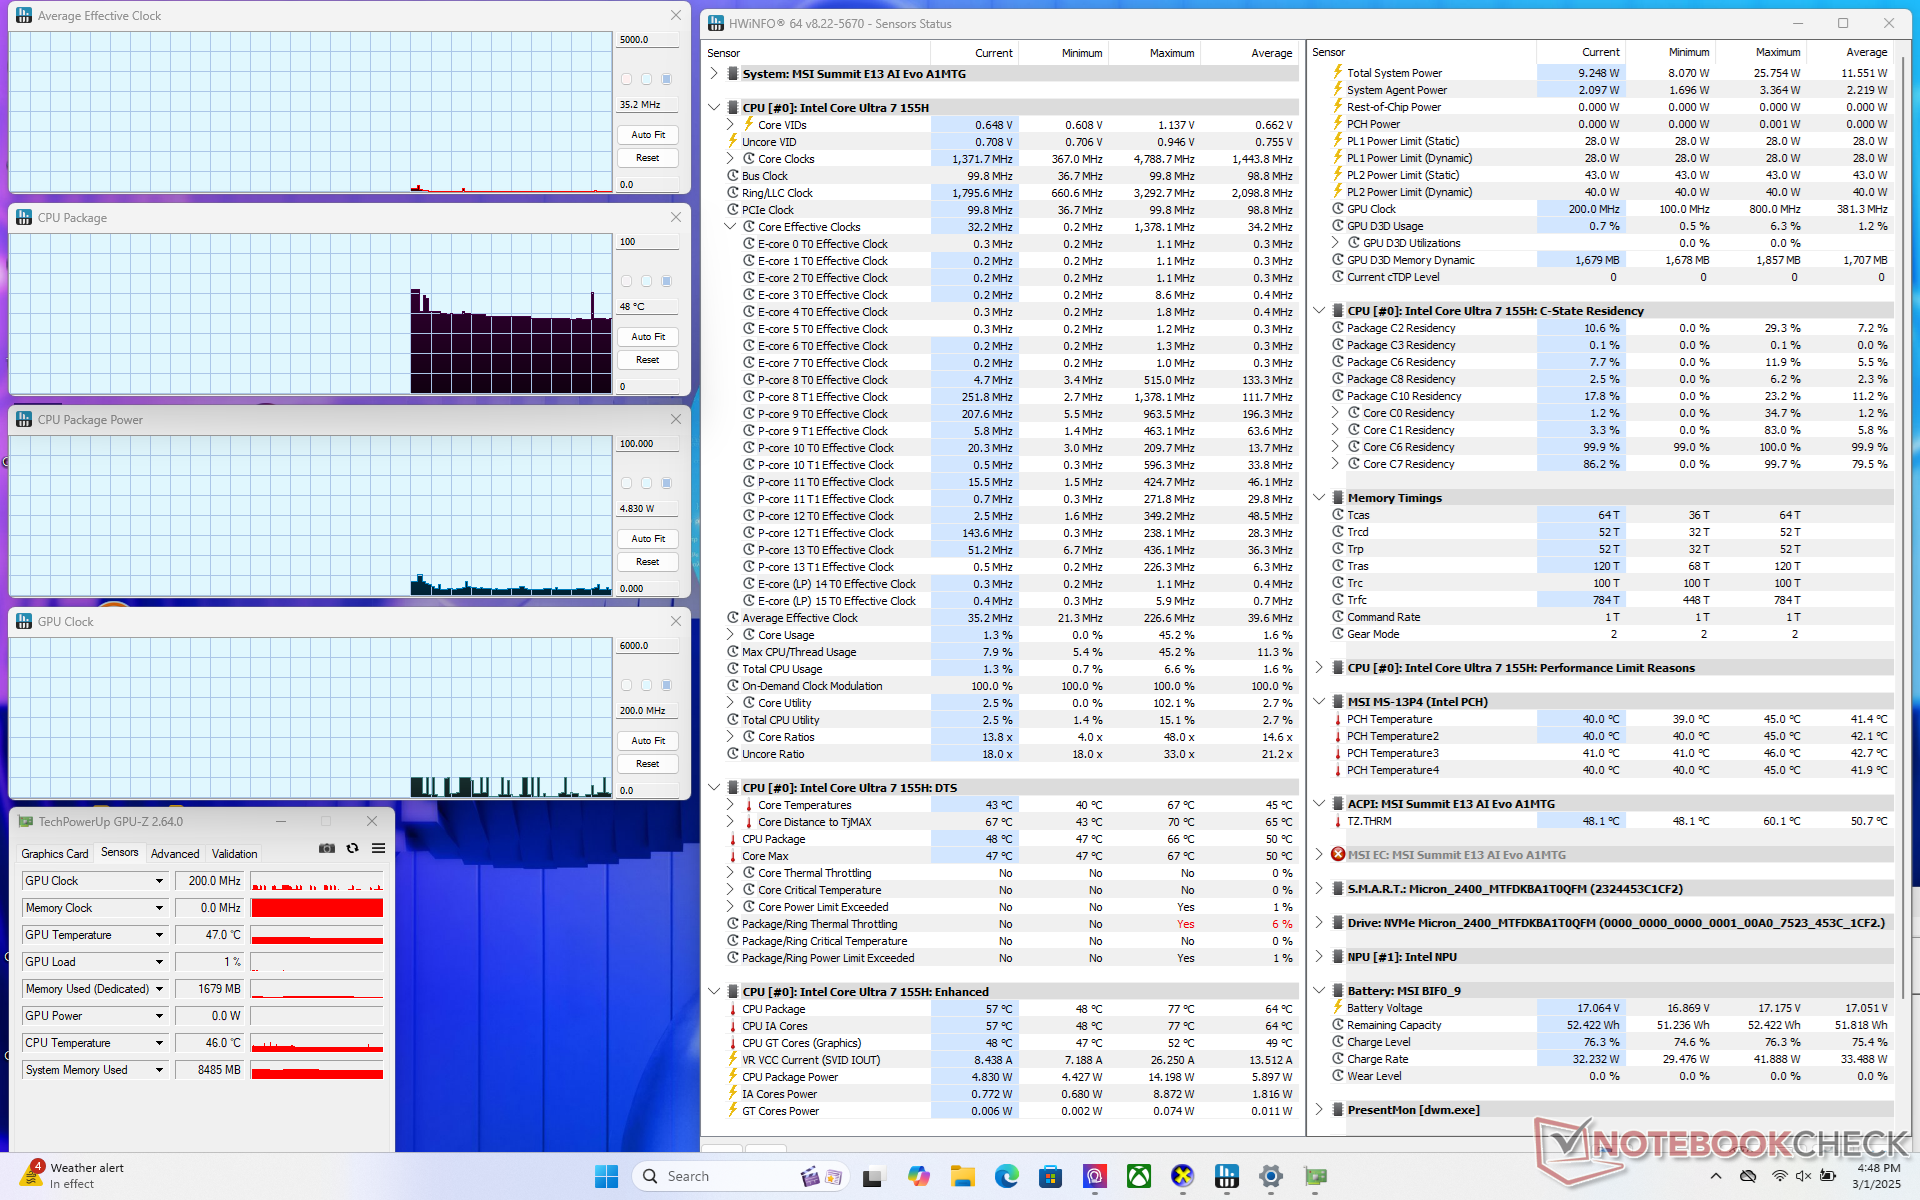
在运行 Prime95 时,CPU 的主频将升至 2.1 GHz,功耗为 41 W,片刻后核心温度达到 84 C。然后,CPU 将稳定在 1.3 GHz 和 28 W,以便在启用 Cooler Boost 后保持 81 C 的核心温度。如果禁用 Cooler Boost,核心温度仅会上升几度。
在运行《赛博朋克 2077》时,GPU 时钟频率相对不稳定,如下图所示,即使在游戏中空转也是如此。这反映了下文 GPU 性能部分所述的不稳定帧频。核心温度也非常高,达到 87 摄氏度,比 2021 机型高出 10 摄氏度以上。

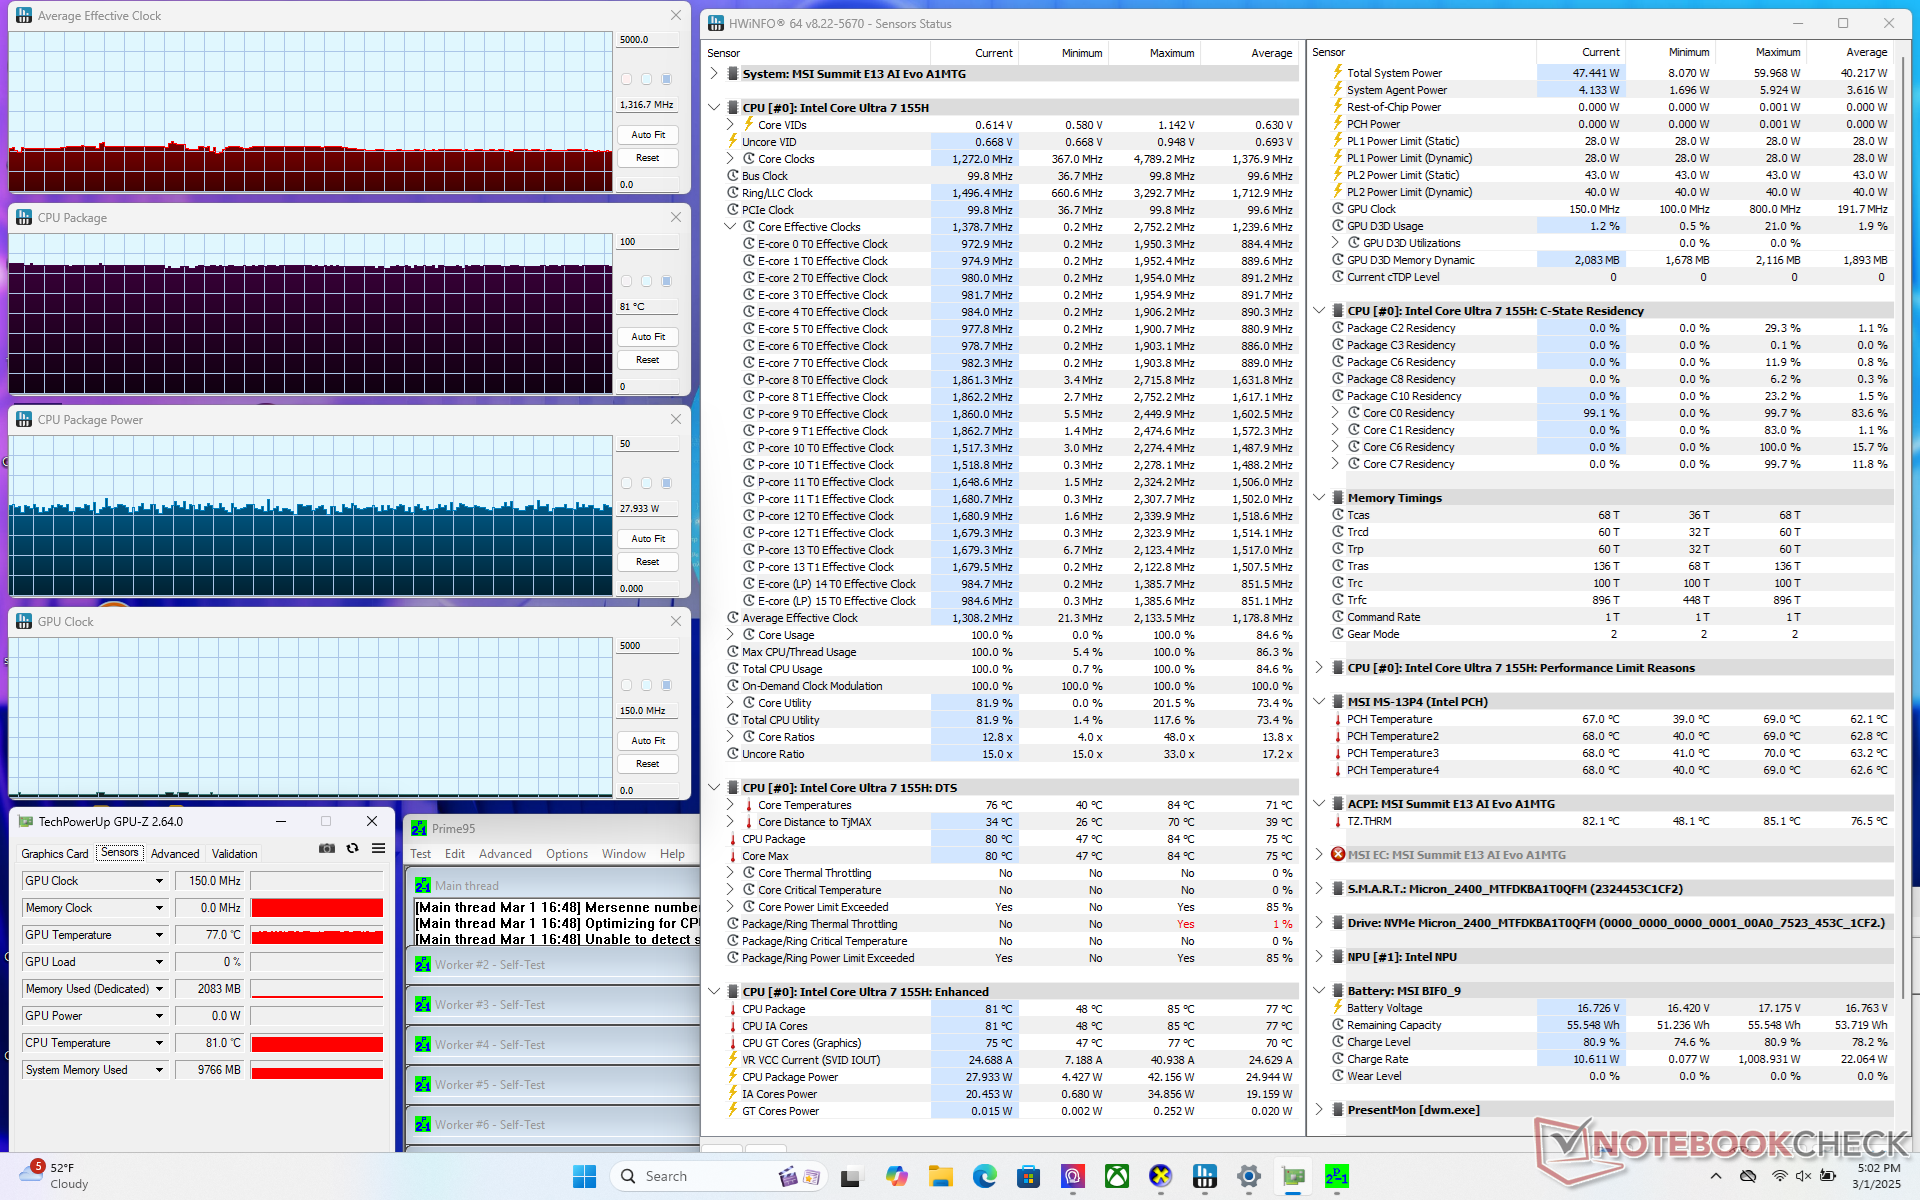
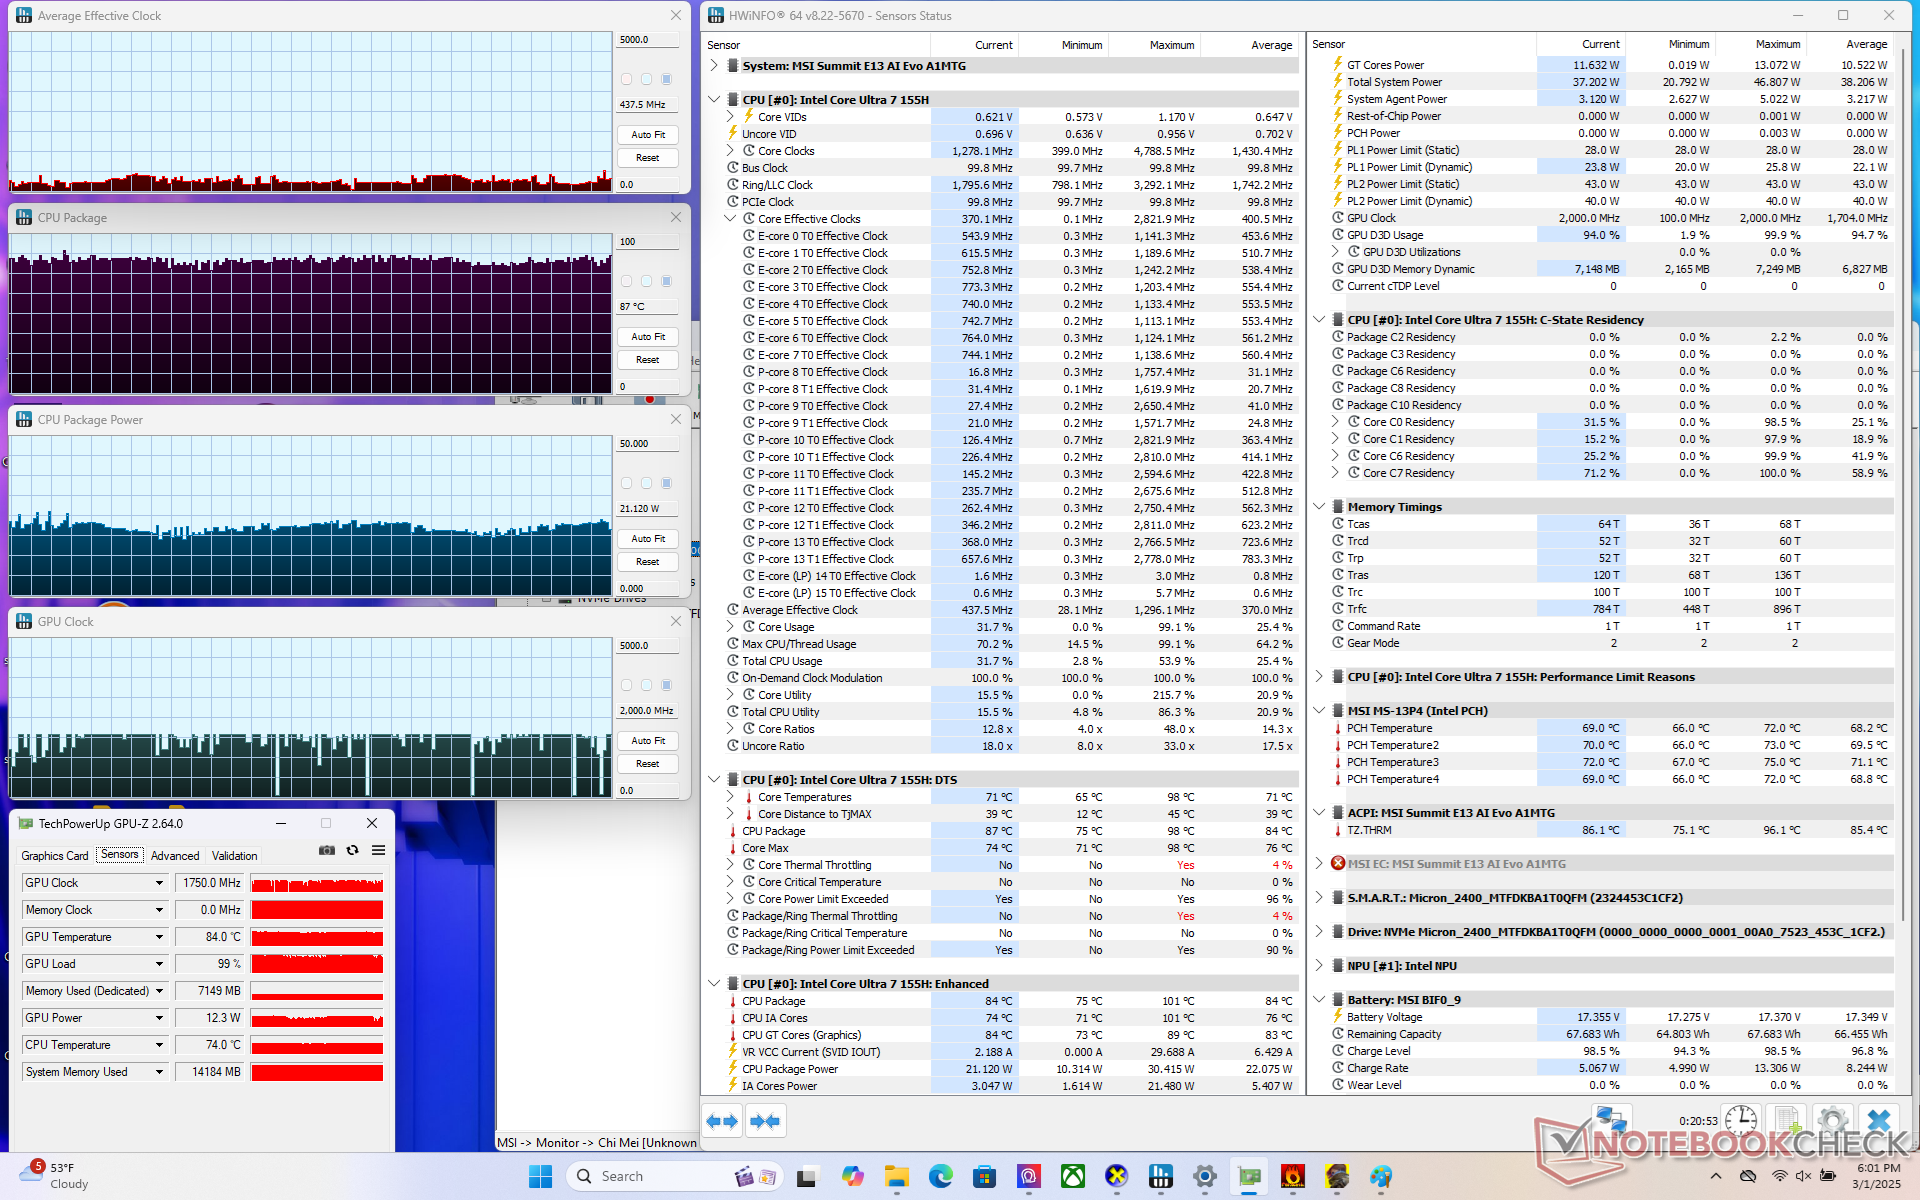
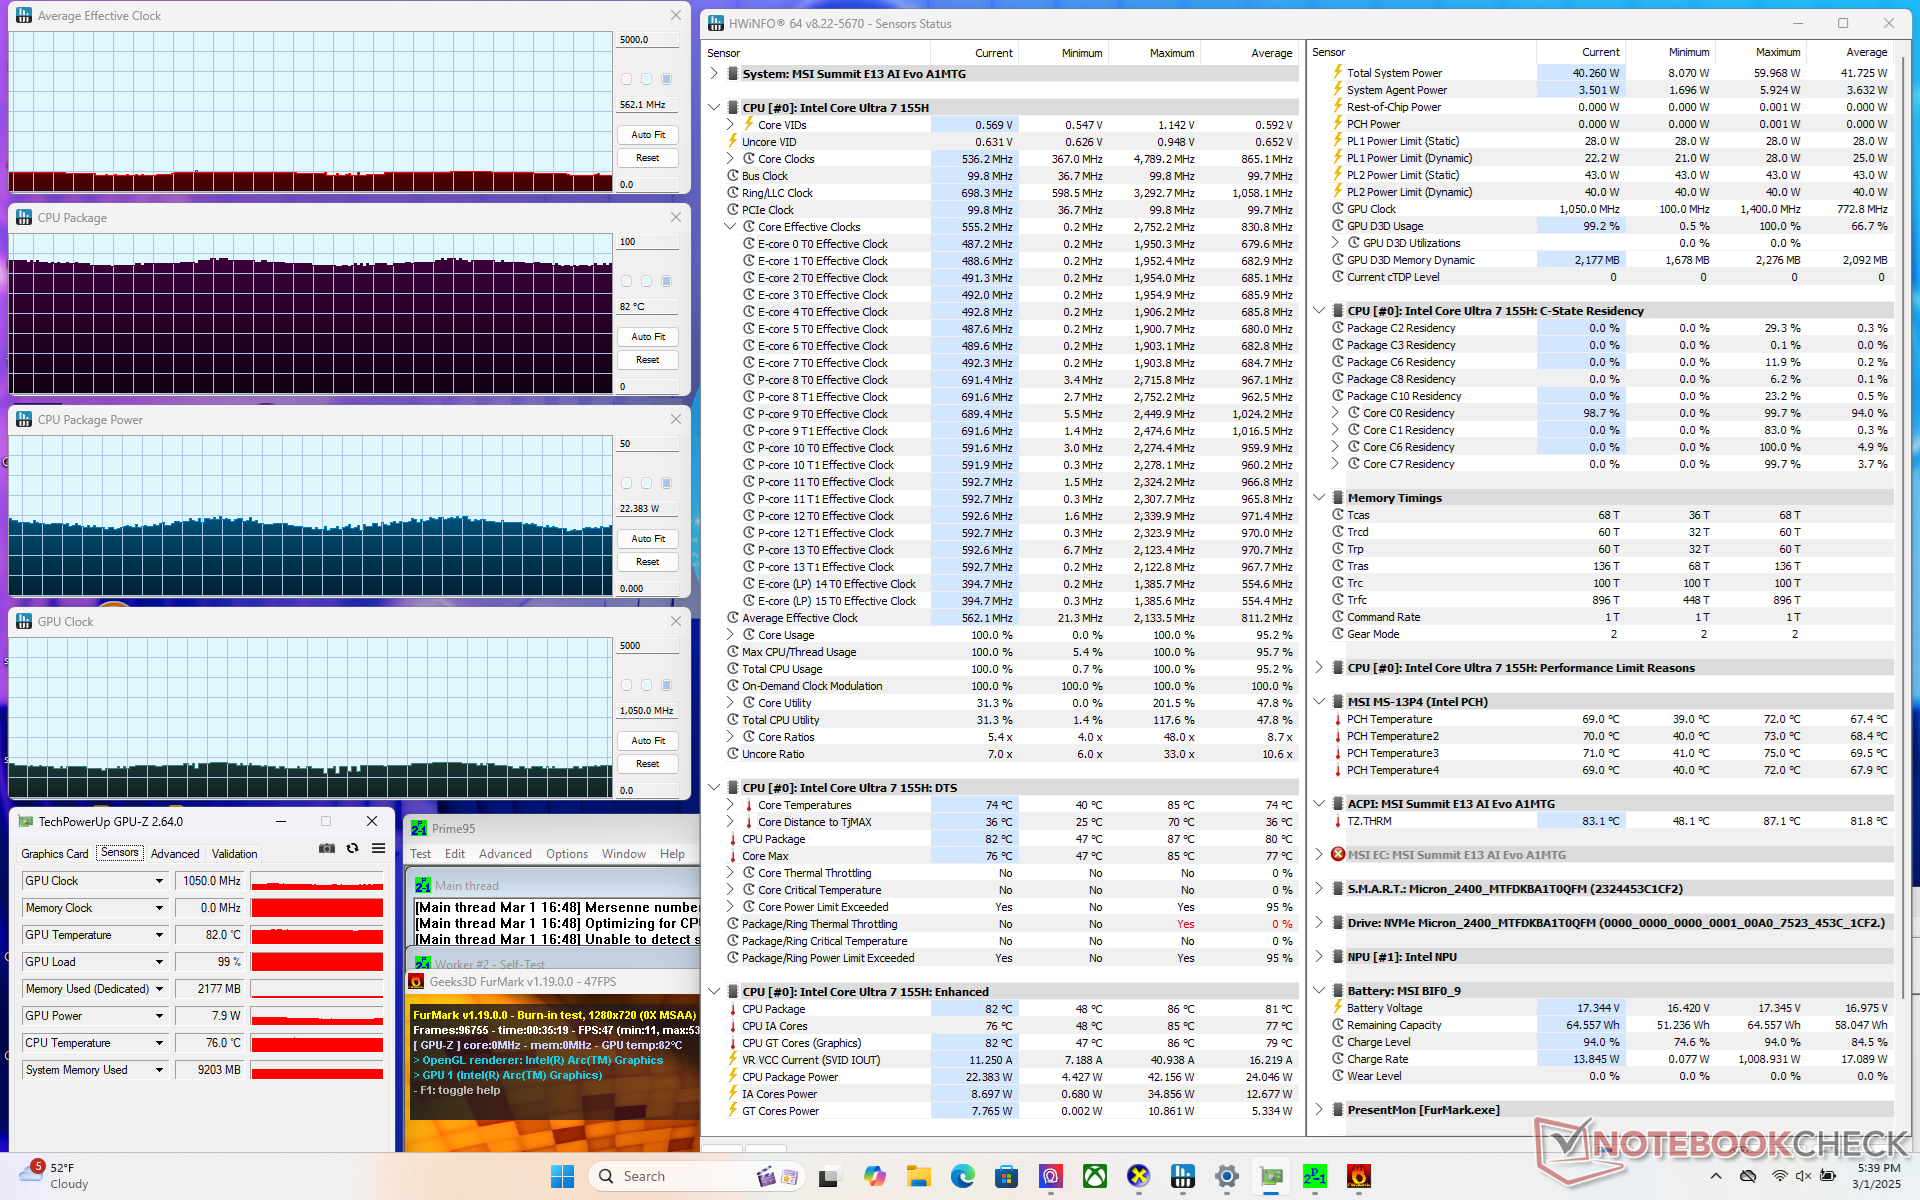
| CPU 平均时钟 (GHz) | GPU 时钟 (MHz) | CPU 平均温度 (°C) | |
| 系统闲置 | -- | -- | 48 |
| Prime95 压力(开启散热器升压) | 1.3 | -- | 81 |
| Prime95 压力(关闭散热器升压) | 1.3 | -- | 81 |
| Prime95 + FurMark Stress | 0.6 | 1050 | 82 |
| 赛博朋克 2077》压力 | 0.4 | ~2000 | 87 |
系统性能
CrossMark: Overall | Productivity | Creativity | Responsiveness
WebXPRT 3: Overall
WebXPRT 4: Overall
Mozilla Kraken 1.1: Total
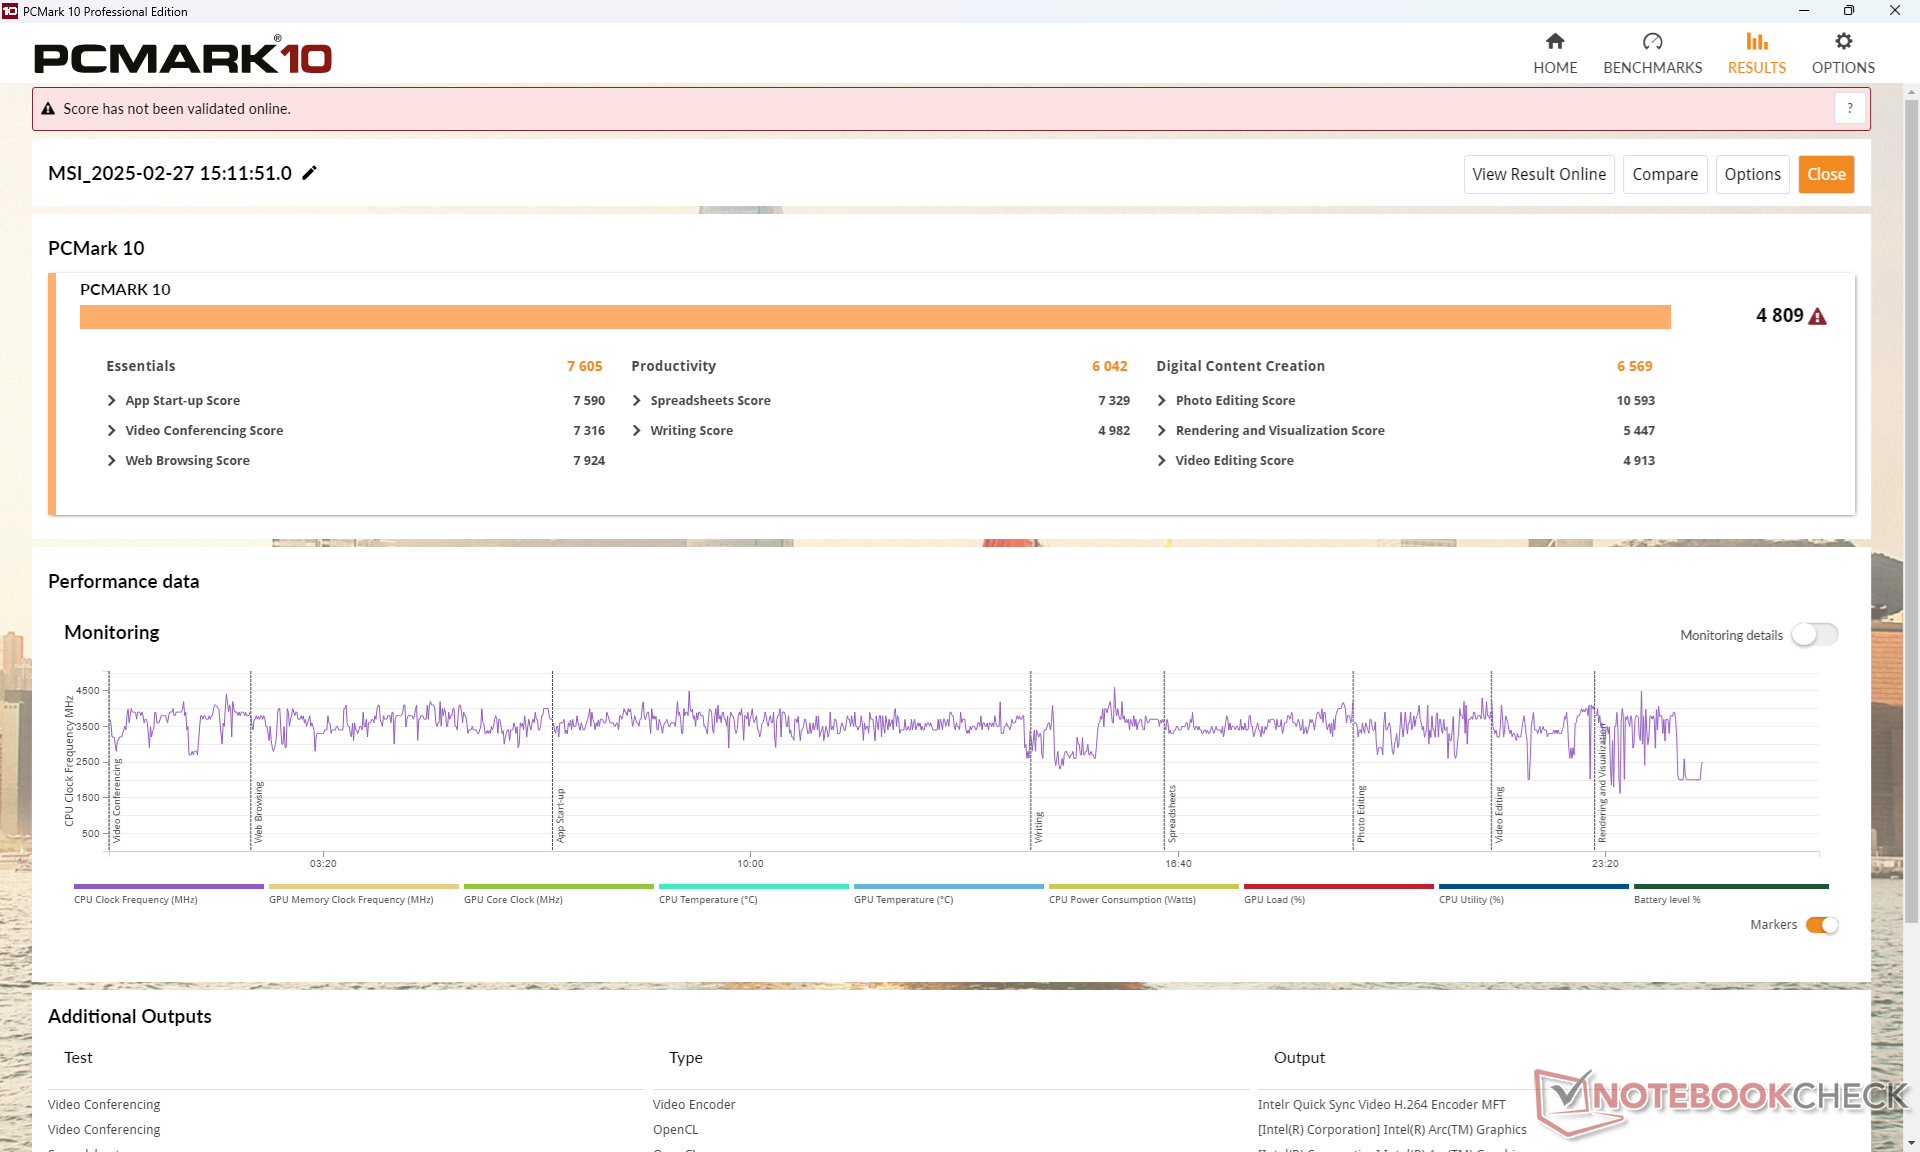
| PCMark 10 / Score | |
| Average Intel Core Ultra 7 155H, Intel Arc 8-Core iGPU (4809 - 7529, n=34) | |
| Lenovo Yoga Book 9 13IMU9 | |
| Lenovo ThinkPad L13 Yoga G4 i7-1355U | |
| HP Elite Dragonfly Folio 13.5 G3 | |
| Dell Latitude 9330 | |
| MSI Summit E13 AI Evo A1MTG | |
| MSI Summit E13 Flip Evo A11MT | |
| PCMark 10 / Essentials | |
| HP Elite Dragonfly Folio 13.5 G3 | |
| Lenovo ThinkPad L13 Yoga G4 i7-1355U | |
| Lenovo Yoga Book 9 13IMU9 | |
| Average Intel Core Ultra 7 155H, Intel Arc 8-Core iGPU (7605 - 11289, n=34) | |
| Dell Latitude 9330 | |
| MSI Summit E13 Flip Evo A11MT | |
| MSI Summit E13 AI Evo A1MTG | |
| PCMark 10 / Productivity | |
| Average Intel Core Ultra 7 155H, Intel Arc 8-Core iGPU (6042 - 10591, n=34) | |
| Lenovo Yoga Book 9 13IMU9 | |
| Lenovo ThinkPad L13 Yoga G4 i7-1355U | |
| HP Elite Dragonfly Folio 13.5 G3 | |
| Dell Latitude 9330 | |
| MSI Summit E13 Flip Evo A11MT | |
| MSI Summit E13 AI Evo A1MTG | |
| PCMark 10 / Digital Content Creation | |
| Average Intel Core Ultra 7 155H, Intel Arc 8-Core iGPU (4985 - 10709, n=34) | |
| Lenovo Yoga Book 9 13IMU9 | |
| MSI Summit E13 AI Evo A1MTG | |
| Lenovo ThinkPad L13 Yoga G4 i7-1355U | |
| HP Elite Dragonfly Folio 13.5 G3 | |
| Dell Latitude 9330 | |
| MSI Summit E13 Flip Evo A11MT | |
| CrossMark / Overall | |
| Average Intel Core Ultra 7 155H, Intel Arc 8-Core iGPU (1366 - 1903, n=34) | |
| MSI Summit E13 AI Evo A1MTG | |
| HP Elite Dragonfly Folio 13.5 G3 | |
| Lenovo ThinkPad L13 Yoga G4 i7-1355U | |
| Lenovo Yoga Book 9 13IMU9 | |
| CrossMark / Productivity | |
| Average Intel Core Ultra 7 155H, Intel Arc 8-Core iGPU (1291 - 1798, n=33) | |
| HP Elite Dragonfly Folio 13.5 G3 | |
| MSI Summit E13 AI Evo A1MTG | |
| Lenovo ThinkPad L13 Yoga G4 i7-1355U | |
| Lenovo Yoga Book 9 13IMU9 | |
| CrossMark / Creativity | |
| Average Intel Core Ultra 7 155H, Intel Arc 8-Core iGPU (1519 - 1929, n=33) | |
| MSI Summit E13 AI Evo A1MTG | |
| HP Elite Dragonfly Folio 13.5 G3 | |
| Lenovo ThinkPad L13 Yoga G4 i7-1355U | |
| Lenovo Yoga Book 9 13IMU9 | |
| CrossMark / Responsiveness | |
| HP Elite Dragonfly Folio 13.5 G3 | |
| MSI Summit E13 AI Evo A1MTG | |
| Average Intel Core Ultra 7 155H, Intel Arc 8-Core iGPU (939 - 1802, n=33) | |
| Lenovo Yoga Book 9 13IMU9 | |
| Lenovo ThinkPad L13 Yoga G4 i7-1355U | |
| WebXPRT 3 / Overall | |
| Lenovo ThinkPad L13 Yoga G4 i7-1355U | |
| HP Elite Dragonfly Folio 13.5 G3 | |
| MSI Summit E13 AI Evo A1MTG | |
| Average Intel Core Ultra 7 155H, Intel Arc 8-Core iGPU (252 - 299, n=34) | |
| Lenovo Yoga Book 9 13IMU9 | |
| MSI Summit E13 Flip Evo A11MT | |
| Dell Latitude 9330 | |
| WebXPRT 4 / Overall | |
| Lenovo ThinkPad L13 Yoga G4 i7-1355U | |
| Average Intel Core Ultra 7 155H, Intel Arc 8-Core iGPU (166.4 - 309, n=29) | |
| Lenovo Yoga Book 9 13IMU9 | |
| HP Elite Dragonfly Folio 13.5 G3 | |
| Dell Latitude 9330 | |
| MSI Summit E13 AI Evo A1MTG | |
| Mozilla Kraken 1.1 / Total | |
| MSI Summit E13 Flip Evo A11MT | |
| Dell Latitude 9330 | |
| HP Elite Dragonfly Folio 13.5 G3 | |
| Lenovo Yoga Book 9 13IMU9 | |
| MSI Summit E13 AI Evo A1MTG | |
| Average Intel Core Ultra 7 155H, Intel Arc 8-Core iGPU (517 - 614, n=35) | |
| Lenovo ThinkPad L13 Yoga G4 i7-1355U | |
* ... smaller is better
| PCMark 10 Score | 4809 points | |
Help | ||
| AIDA64 / Memory Copy | |
| Average Intel Core Ultra 7 155H (62397 - 96791, n=50) | |
| Lenovo Yoga Book 9 13IMU9 | |
| MSI Summit E13 AI Evo A1MTG | |
| Dell Latitude 9330 | |
| HP Elite Dragonfly Folio 13.5 G3 | |
| Lenovo ThinkPad L13 Yoga G4 i7-1355U | |
| MSI Summit E13 Flip Evo A11MT | |
| AIDA64 / Memory Read | |
| Average Intel Core Ultra 7 155H (60544 - 90647, n=50) | |
| MSI Summit E13 AI Evo A1MTG | |
| HP Elite Dragonfly Folio 13.5 G3 | |
| Lenovo Yoga Book 9 13IMU9 | |
| Dell Latitude 9330 | |
| MSI Summit E13 Flip Evo A11MT | |
| Lenovo ThinkPad L13 Yoga G4 i7-1355U | |
| AIDA64 / Memory Write | |
| HP Elite Dragonfly Folio 13.5 G3 | |
| MSI Summit E13 AI Evo A1MTG | |
| Average Intel Core Ultra 7 155H (58692 - 93451, n=50) | |
| Lenovo ThinkPad L13 Yoga G4 i7-1355U | |
| Dell Latitude 9330 | |
| Lenovo Yoga Book 9 13IMU9 | |
| MSI Summit E13 Flip Evo A11MT | |
| AIDA64 / Memory Latency | |
| Lenovo Yoga Book 9 13IMU9 | |
| Average Intel Core Ultra 7 155H (116.2 - 233, n=50) | |
| MSI Summit E13 AI Evo A1MTG | |
| HP Elite Dragonfly Folio 13.5 G3 | |
| Dell Latitude 9330 | |
| Lenovo ThinkPad L13 Yoga G4 i7-1355U | |
| MSI Summit E13 Flip Evo A11MT | |
* ... smaller is better
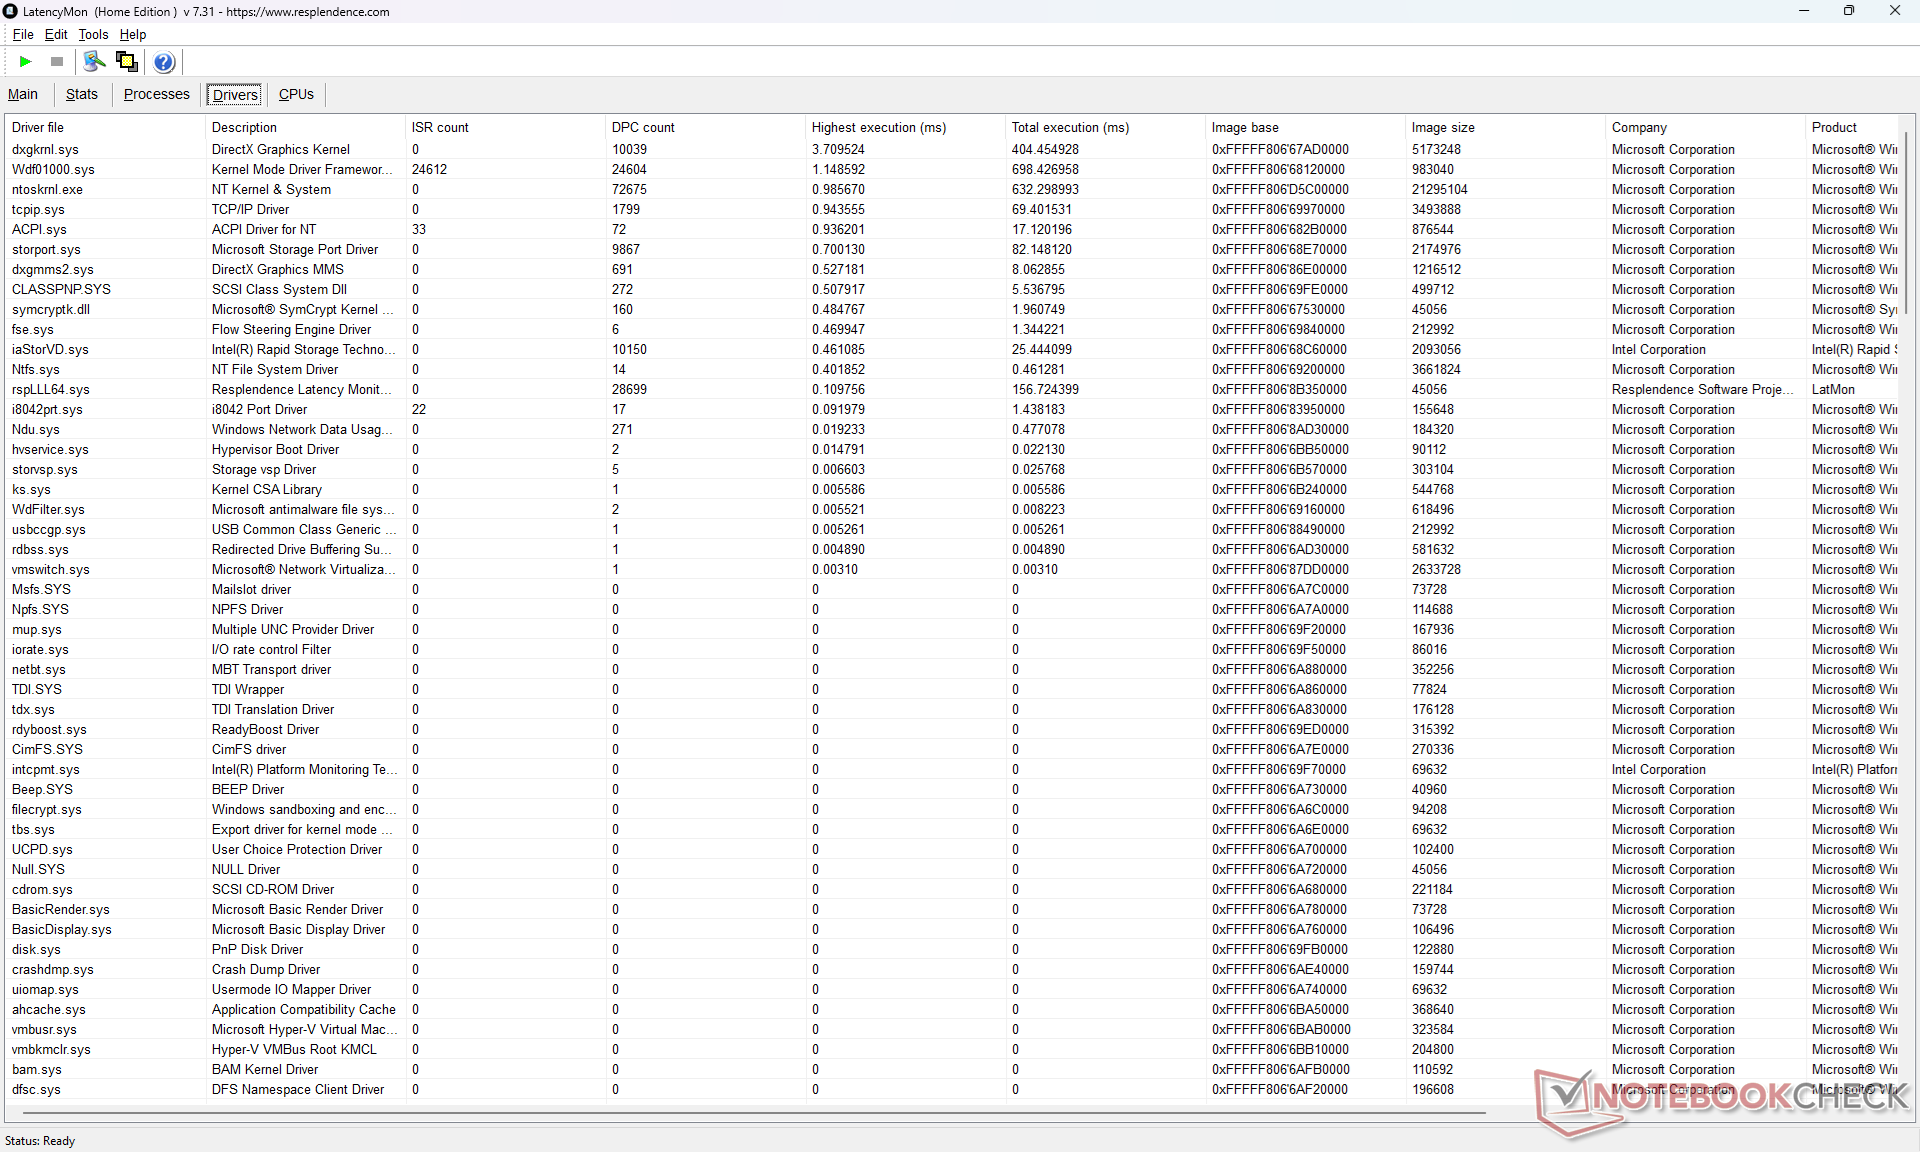
DPC 延迟
在打开我们主页的多个浏览器标签页时,LatencyMon 显示了 DPC 问题。4K60 视频回放并不完美,但依然流畅,测试开始时仅出现 3 次丢帧。

| DPC Latencies / LatencyMon - interrupt to process latency (max), Web, Youtube, Prime95 | |
| Dell Latitude 9330 | |
| HP Elite Dragonfly Folio 13.5 G3 | |
| MSI Summit E13 AI Evo A1MTG | |
| MSI Summit E13 Flip Evo A11MT | |
| Lenovo ThinkPad L13 Yoga G4 i7-1355U | |
| Lenovo Yoga Book 9 13IMU9 | |
* ... smaller is better
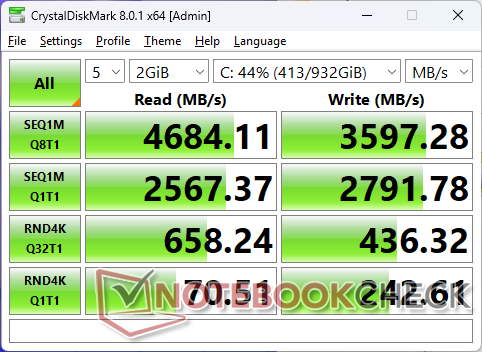
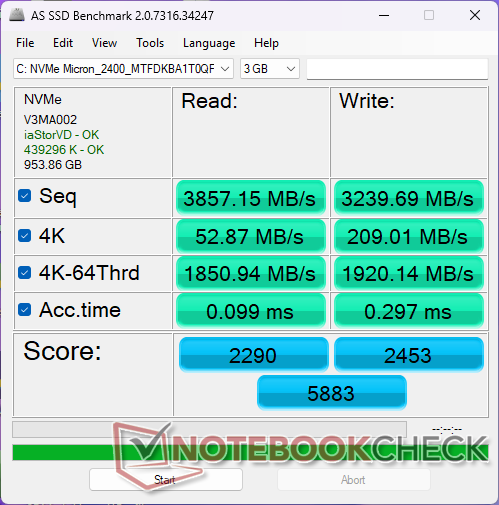
存储设备
美光 美光 2400PCIe4 x4 NVMe 固态硬盘在压力下会出现节流。例如,在循环运行 DiskSpd 时,传输速率将达到每秒约 4300 MB,然后在测试开始约 5 分钟后降至每秒约 2600 MB。

* ... smaller is better
Disk Throttling: DiskSpd Read Loop, Queue Depth 8
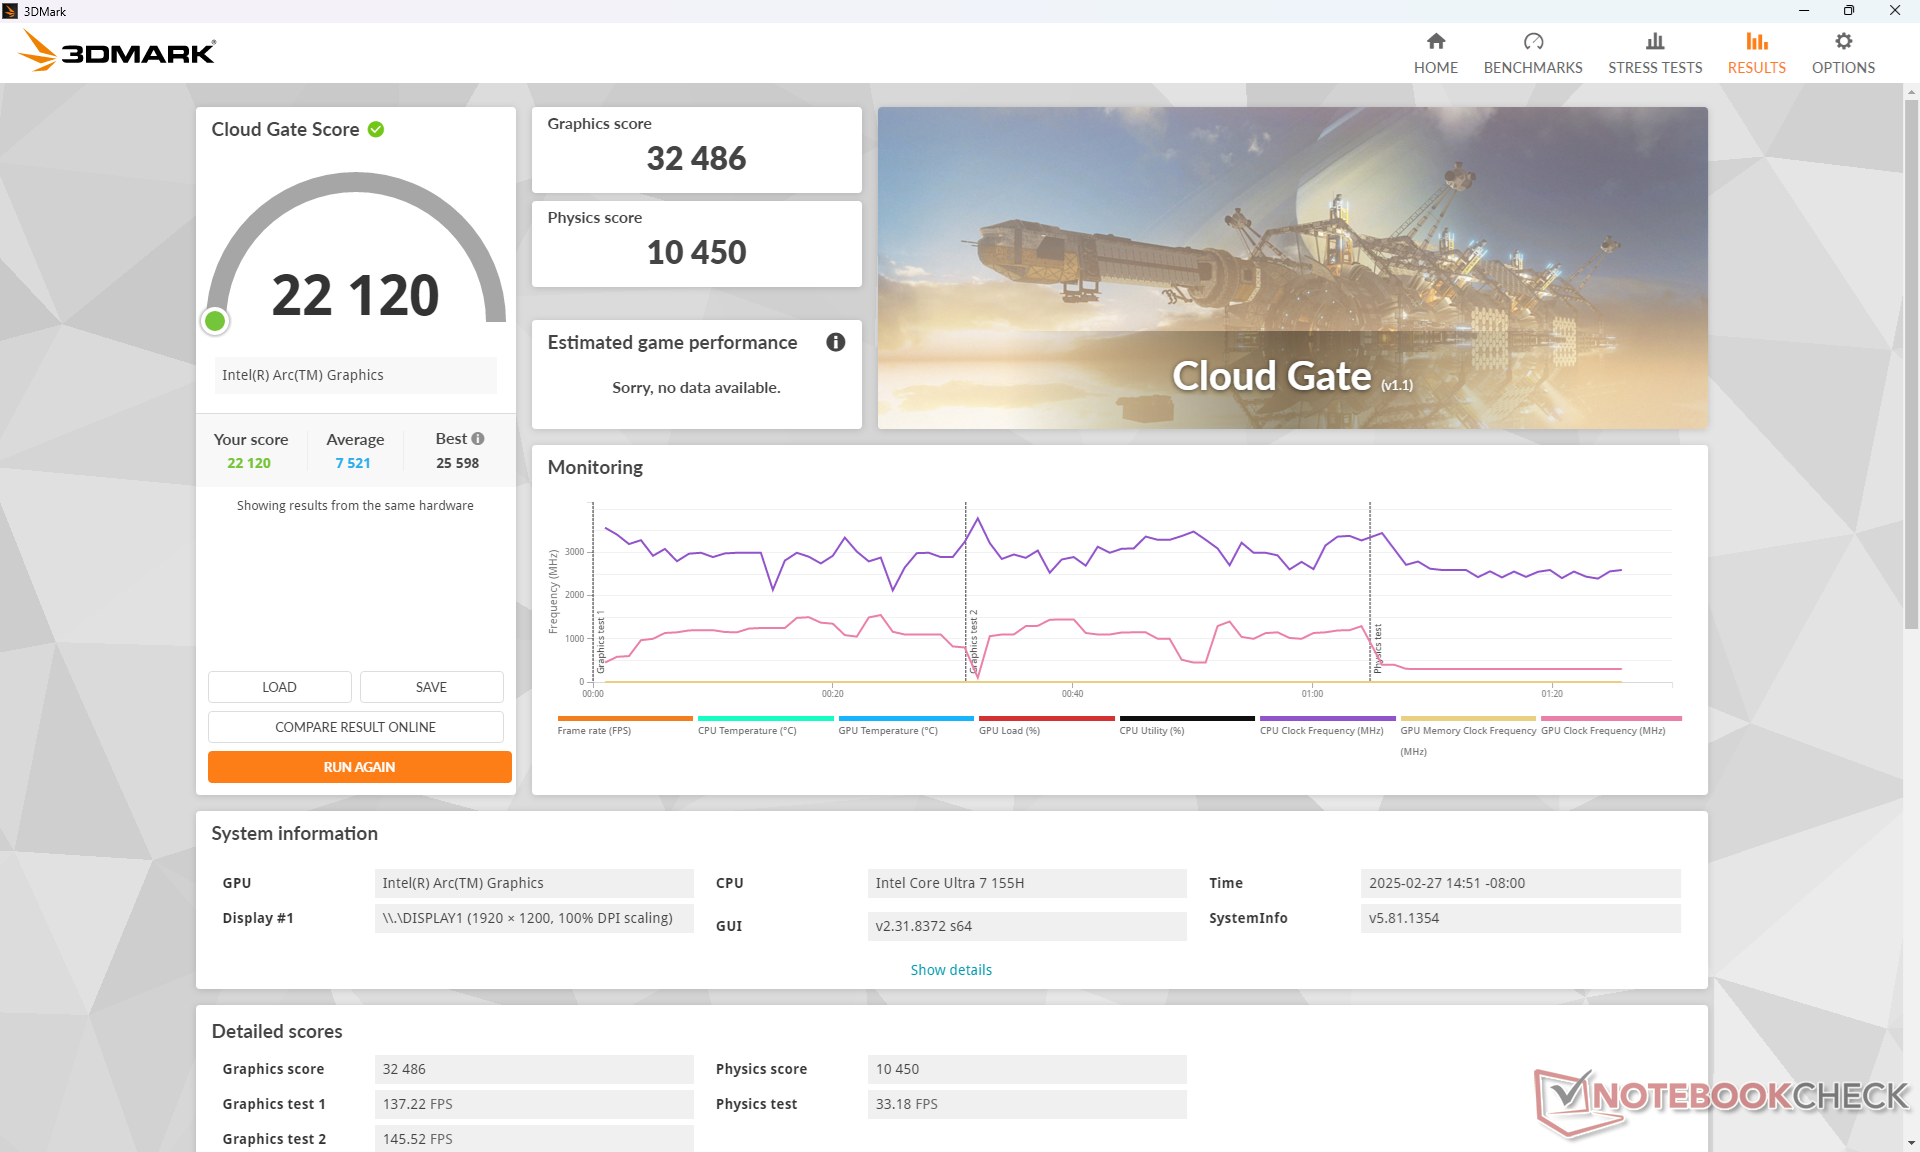
图形处理器性能
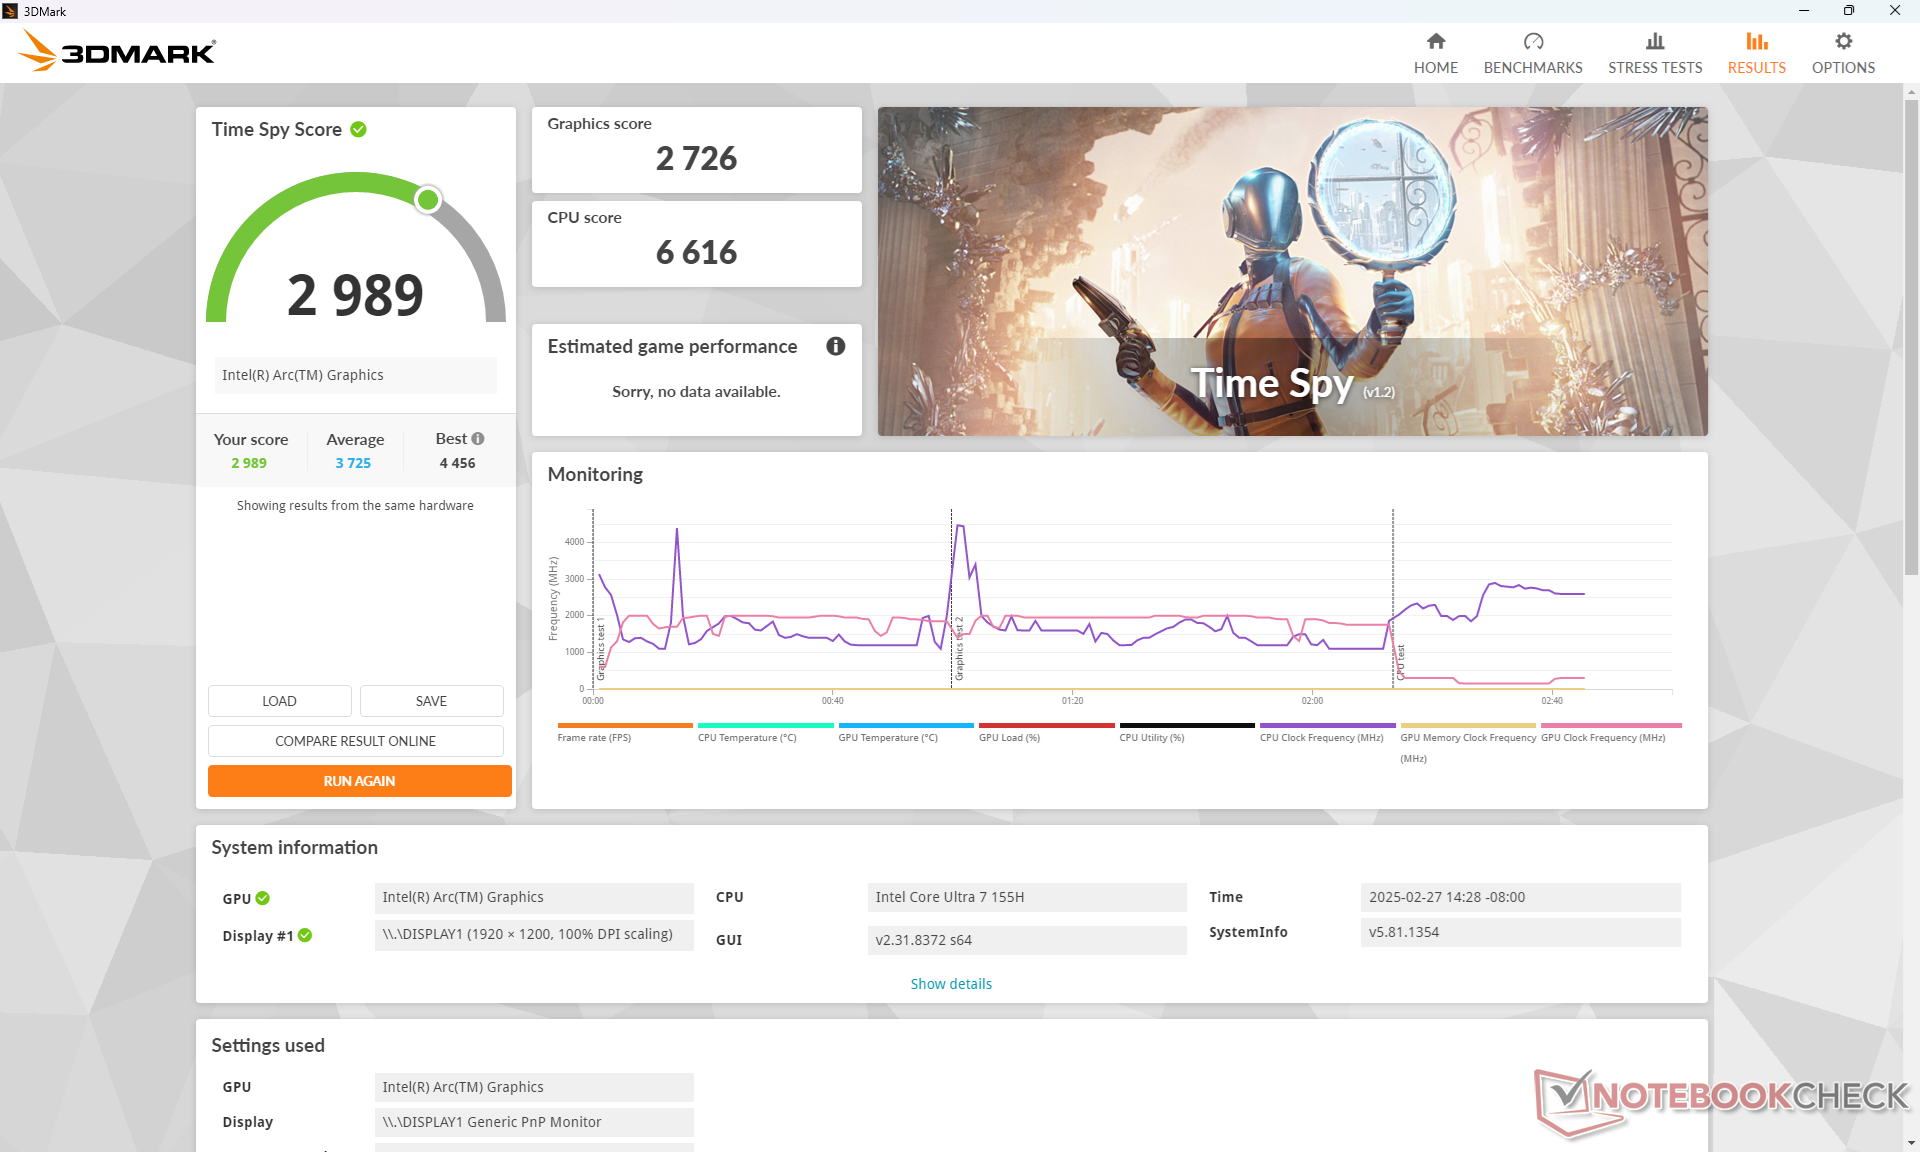
上面提到的 CPU 性能低于预期导致图形性能低于预期。弧 弧 8根据 3DMark 基准测试,我们的微星 Arc 8 的性能比我们数据库中具有相同集成显卡的普通笔记本电脑大约慢 15%到 25%。
F1 22》和《赛博朋克 2077》在设置为 "高 "或 "超 "时会崩溃。
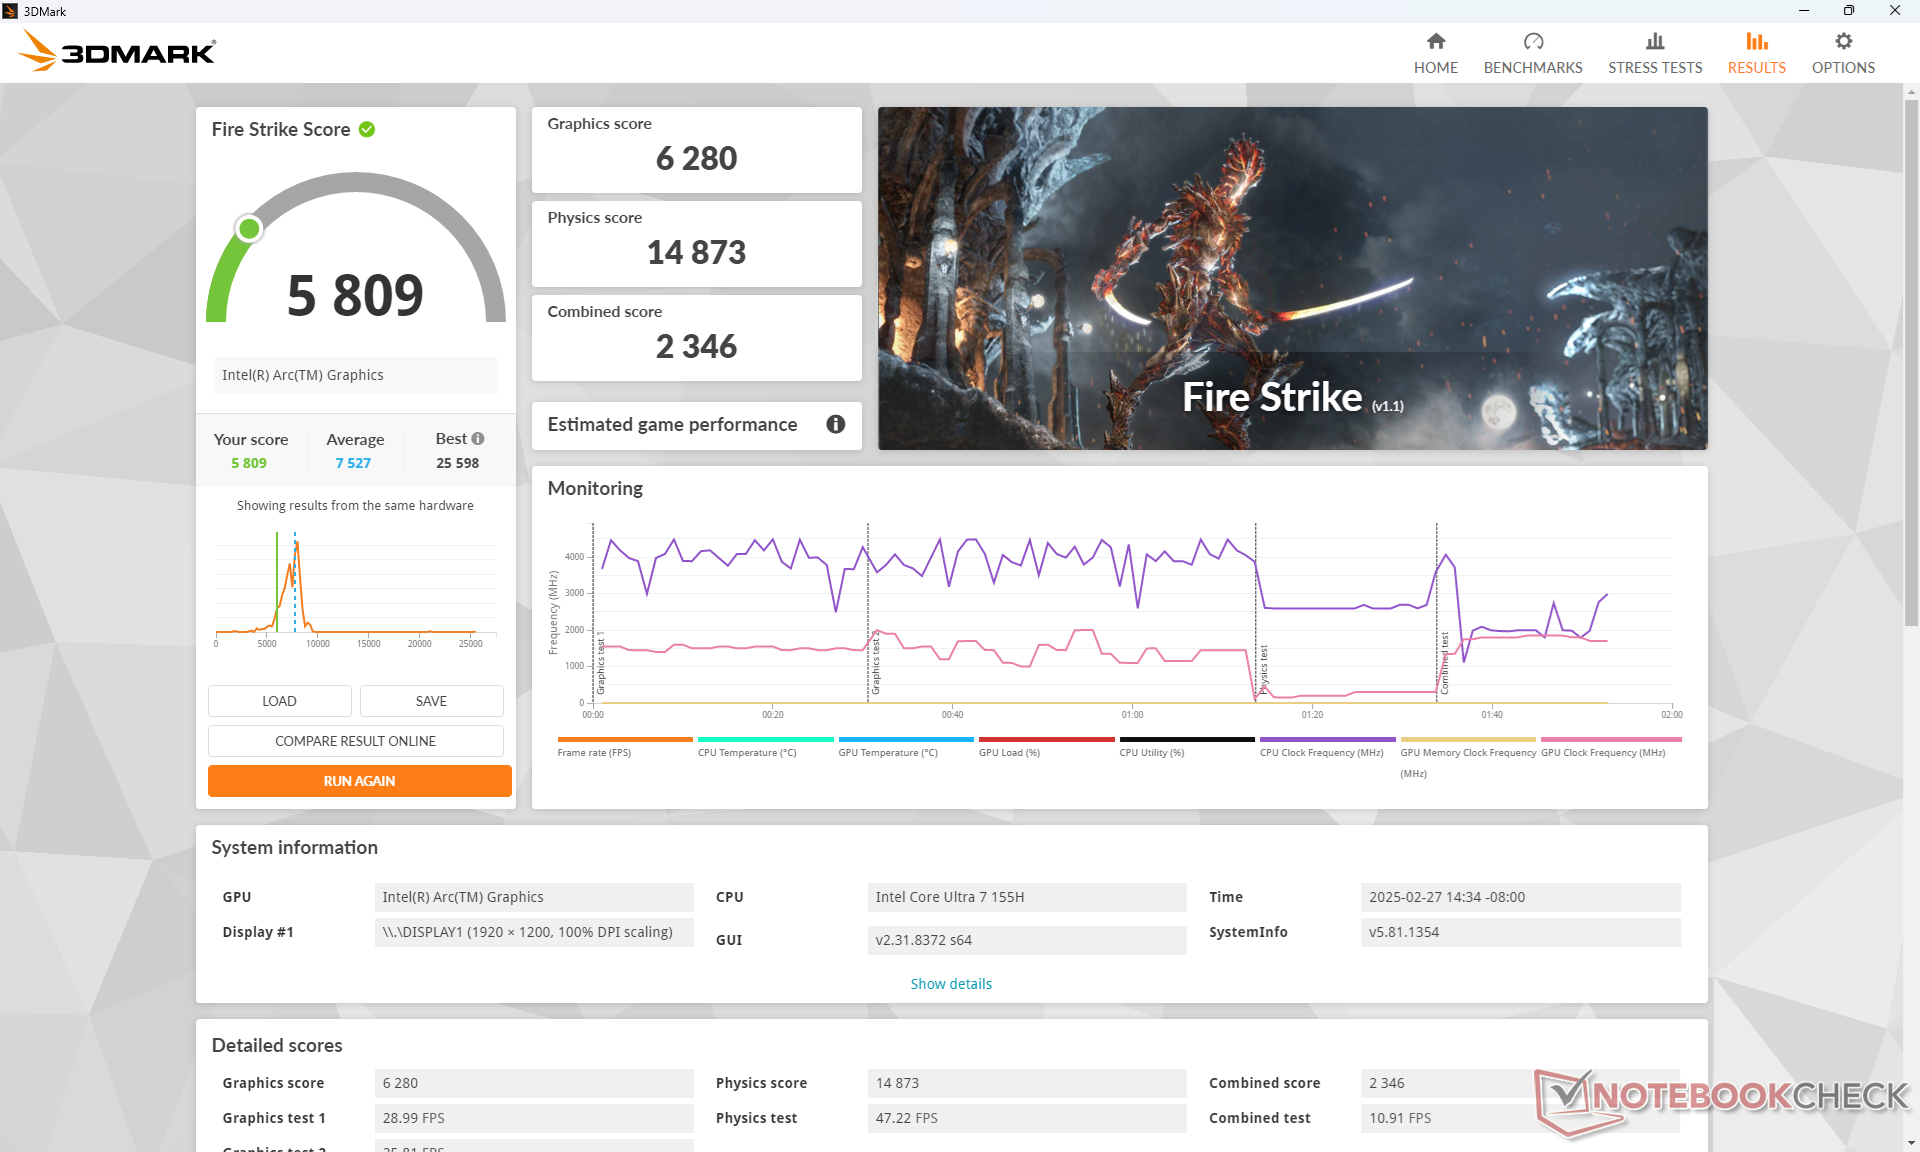
| 电源配置文件 | 图形分数 | 物理得分 | 综合得分 |
| 性能模式 | 6280 | 14873 | 2346 |
| 平衡模式 | 5786 (-8%) | 9842 (-34%) | 1685 (-28%) |
| 电池电量 | 5196 (-17%) | 15031 (-0%) | 2267 (-3%) |
根据我们上面的Fire Strike 结果表,在平衡模式下运行会对 CPU 性能产生相当大的影响。
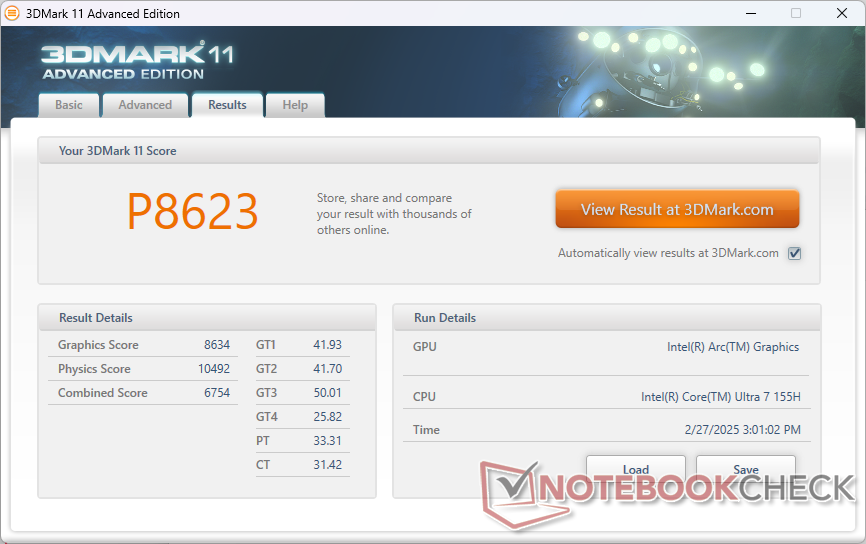
| 3DMark 11 Performance | 8623 points | |
| 3DMark Cloud Gate Standard Score | 22120 points | |
| 3DMark Fire Strike Score | 5809 points | |
| 3DMark Time Spy Score | 2989 points | |
Help | ||
* ... smaller is better
游戏性能
游戏性能不佳。除了上面提到的 CPU 和 GPU 性能不足外,明显的重影和卡顿问题甚至在运行《DOTA 2 Reborn》等要求不高的游戏时也会让人心烦意乱。
| Cyberpunk 2077 2.2 Phantom Liberty | |
| 1280x720 Low Preset (FSR off) | |
| MSI Prestige 13 AI Plus Evo A2VMG | |
| Average Intel Arc 8-Core iGPU (34.5 - 58, n=18) | |
| MSI Summit E13 AI Evo A1MTG | |
| Lenovo Yoga Book 9 13IMU9 | |
| 1920x1080 Low Preset (FSR off) | |
| Asus ROG Flow Z13 GZ302EA-RU073W | |
| MSI Prestige 13 AI Plus Evo A2VMG | |
| Average Intel Arc 8-Core iGPU (11.3 - 38, n=36) | |
| MSI Summit E13 AI Evo A1MTG | |
| Lenovo Yoga Book 9 13IMU9 | |
| 1920x1080 Medium Preset (FSR off) | |
| Asus ROG Flow Z13 GZ302EA-RU073W | |
| MSI Prestige 13 AI Plus Evo A2VMG | |
| Average Intel Arc 8-Core iGPU (9.42 - 31.4, n=34) | |
| MSI Summit E13 AI Evo A1MTG | |
| Lenovo Yoga Book 9 13IMU9 | |
| 1920x1080 High Preset (FSR off) | |
| Asus ROG Flow Z13 GZ302EA-RU073W | |
| MSI Prestige 13 AI Plus Evo A2VMG | |
| Average Intel Arc 8-Core iGPU (7.3 - 27.6, n=34) | |
| Lenovo Yoga Book 9 13IMU9 | |
| 1920x1080 Ultra Preset (FSR off) | |
| Asus ROG Flow Z13 GZ302EA-RU073W | |
| MSI Prestige 13 AI Plus Evo A2VMG | |
| Average Intel Arc 8-Core iGPU (13 - 24.7, n=26) | |
| Lenovo Yoga Book 9 13IMU9 | |
Cyberpunk 2077 ultra FPS Chart
| low | med. | high | ultra | |
|---|---|---|---|---|
| GTA V (2015) | 50.6 | 51.1 | 23.9 | 12 |
| Dota 2 Reborn (2015) | 93.2 | 83.5 | 65.2 | 63 |
| Final Fantasy XV Benchmark (2018) | 49.2 | 29.4 | 20.7 | |
| X-Plane 11.11 (2018) | 46.2 | 37.5 | 31.4 | |
| Strange Brigade (2018) | 131.2 | 61.3 | 45.7 | 33.9 |
| Tiny Tina's Wonderlands (2022) | 41.5 | 31.7 | 22 | 17.7 |
| F1 22 (2022) | 57.8 | 53.5 | ||
| Baldur's Gate 3 (2023) | 22.8 | 19.5 | 16.8 | 16.3 |
| Cyberpunk 2077 2.2 Phantom Liberty (2023) | 28.3 | 23.4 |
排放量
系统噪音
仅在浏览或流媒体时,风扇噪音很小,但当负载较高时,噪音很快就会增大。此外,噪音相对较高,因此任何转速变化都会很明显。由于采用了要求更高的酷睿Ultra-H处理器,在运行游戏等高负载时,风扇的噪音比其他大多数13英寸商务笔记本电脑都要大。
Noise Level
| Idle |
| 24.1 / 24.8 / 26.5 dB(A) |
| Load |
| 39.3 / 49.1 dB(A) |
 | ||
30 dB silent 40 dB(A) audible 50 dB(A) loud |
||
min: | ||
| MSI Summit E13 AI Evo A1MTG Arc 8-Core, Ultra 7 155H, Micron 2400 MTFDKBA1T0QFM | MSI Summit E13 Flip Evo A11MT Iris Xe G7 96EUs, i7-1185G7, Phison 1TB SM2801T24GKBB4S-E162 | Lenovo Yoga Book 9 13IMU9 Graphics 4-Core, Ultra 7 155U | Lenovo ThinkPad L13 Yoga G4 i7-1355U Iris Xe G7 96EUs, i7-1355U, Samsung PM9B1 512GB MZAL4512HBLU | HP Elite Dragonfly Folio 13.5 G3 Iris Xe G7 96EUs, i7-1265U, Samsung PM9A1 MZVL2512HCJQ | Dell Latitude 9330 Iris Xe G7 96EUs, i7-1260U | |
|---|---|---|---|---|---|---|
| Noise | 0% | 16% | 11% | 11% | 9% | |
| off / environment * | 24 | 24.5 -2% | 23.3 3% | 23.1 4% | 24.6 -3% | 23 4% |
| Idle Minimum * | 24.1 | 24.7 -2% | 23.3 3% | 23.4 3% | 24.6 -2% | 23 5% |
| Idle Average * | 24.8 | 24.7 -0% | 23.3 6% | 23.4 6% | 24.6 1% | 23.1 7% |
| Idle Maximum * | 26.5 | 26.4 -0% | 24.6 7% | 23.4 12% | 24.6 7% | 23.1 13% |
| Load Average * | 39.3 | 37.8 4% | 26.2 33% | 33.9 14% | 27.8 29% | 37.1 6% |
| Cyberpunk 2077 ultra * | 45 | |||||
| Load Maximum * | 49.1 | 48.8 1% | 27.3 44% | 36.9 25% | 33.4 32% | 40.5 18% |
| Witcher 3 ultra * | 41.4 | 27.3 | 36.9 | 33.4 | 40.6 |
* ... smaller is better
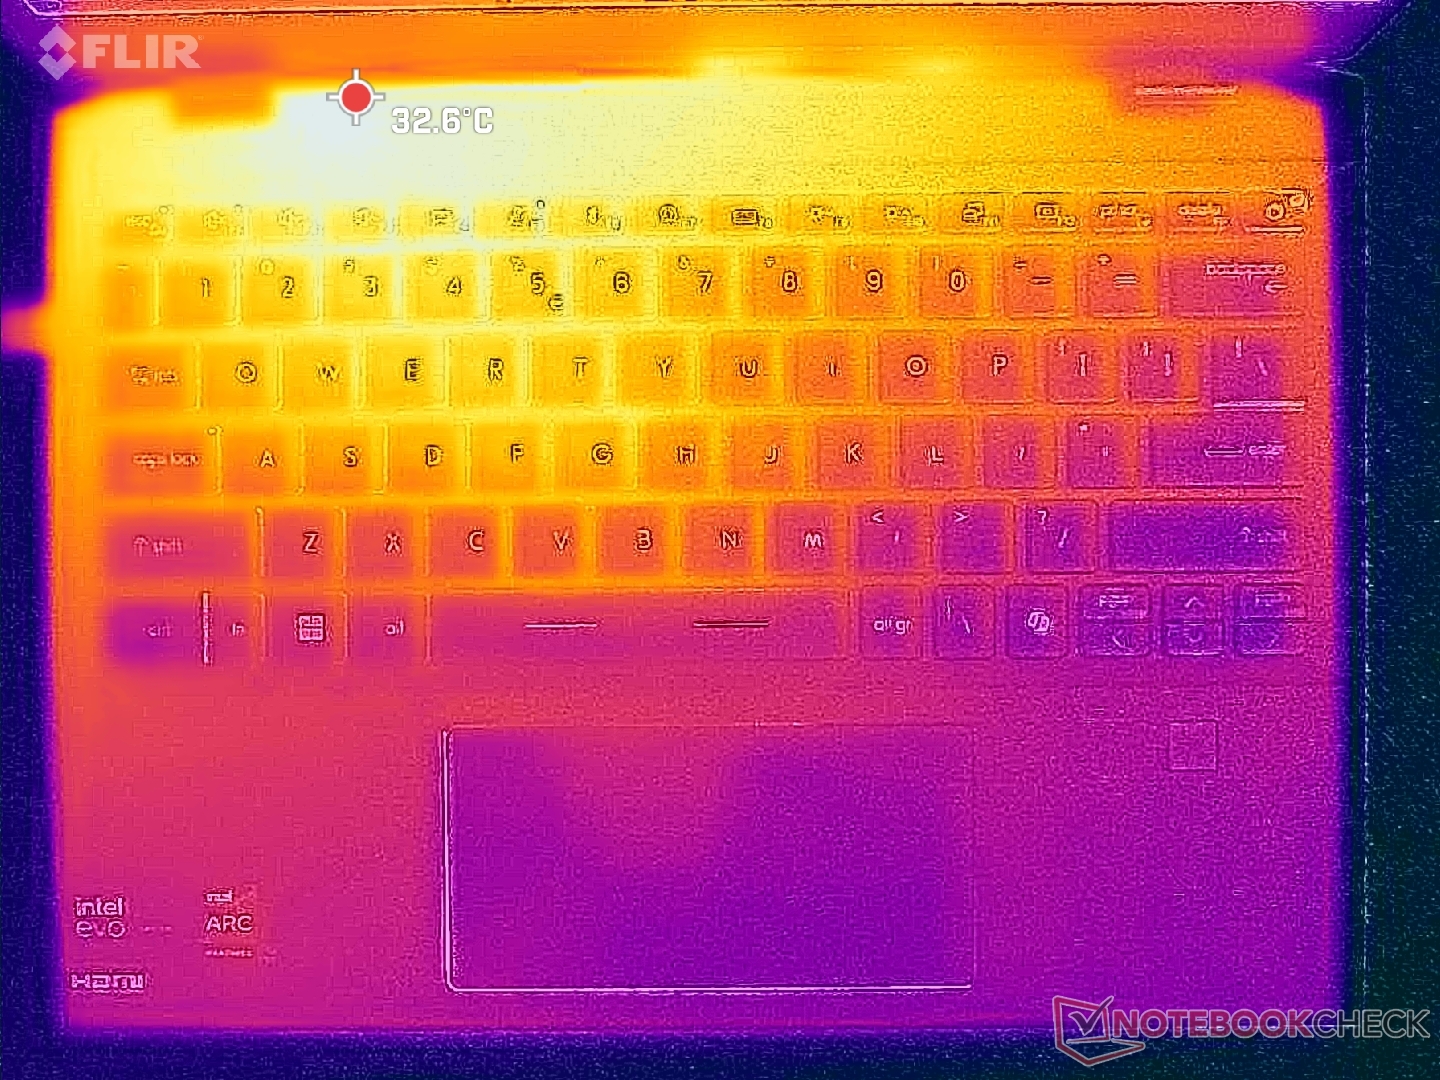
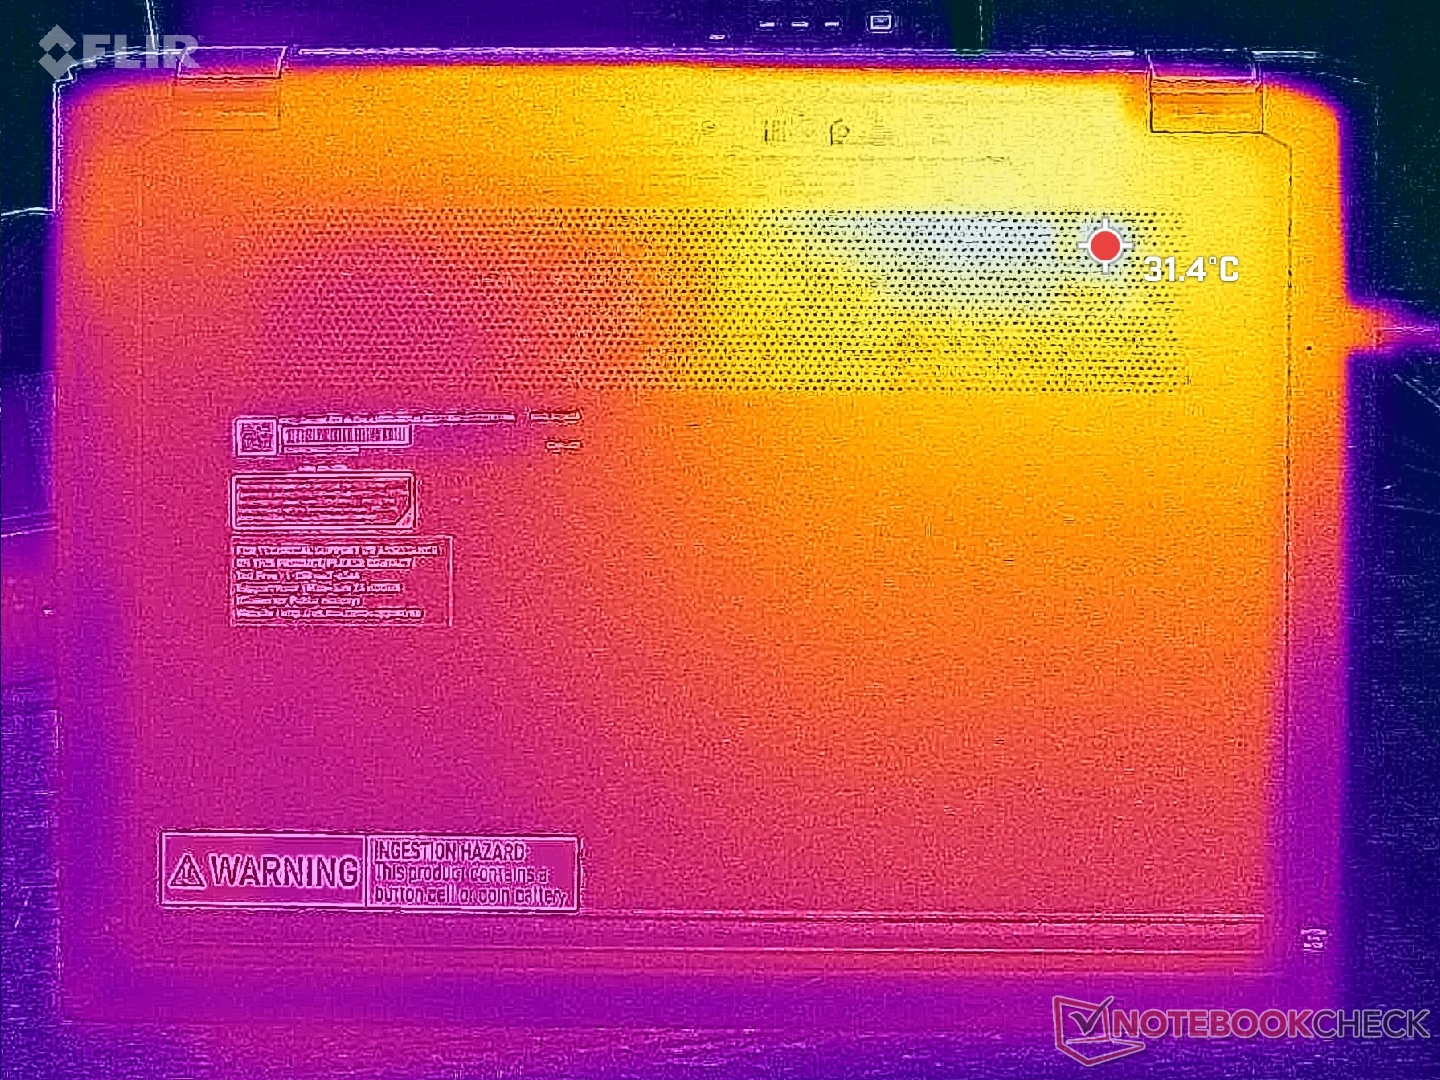
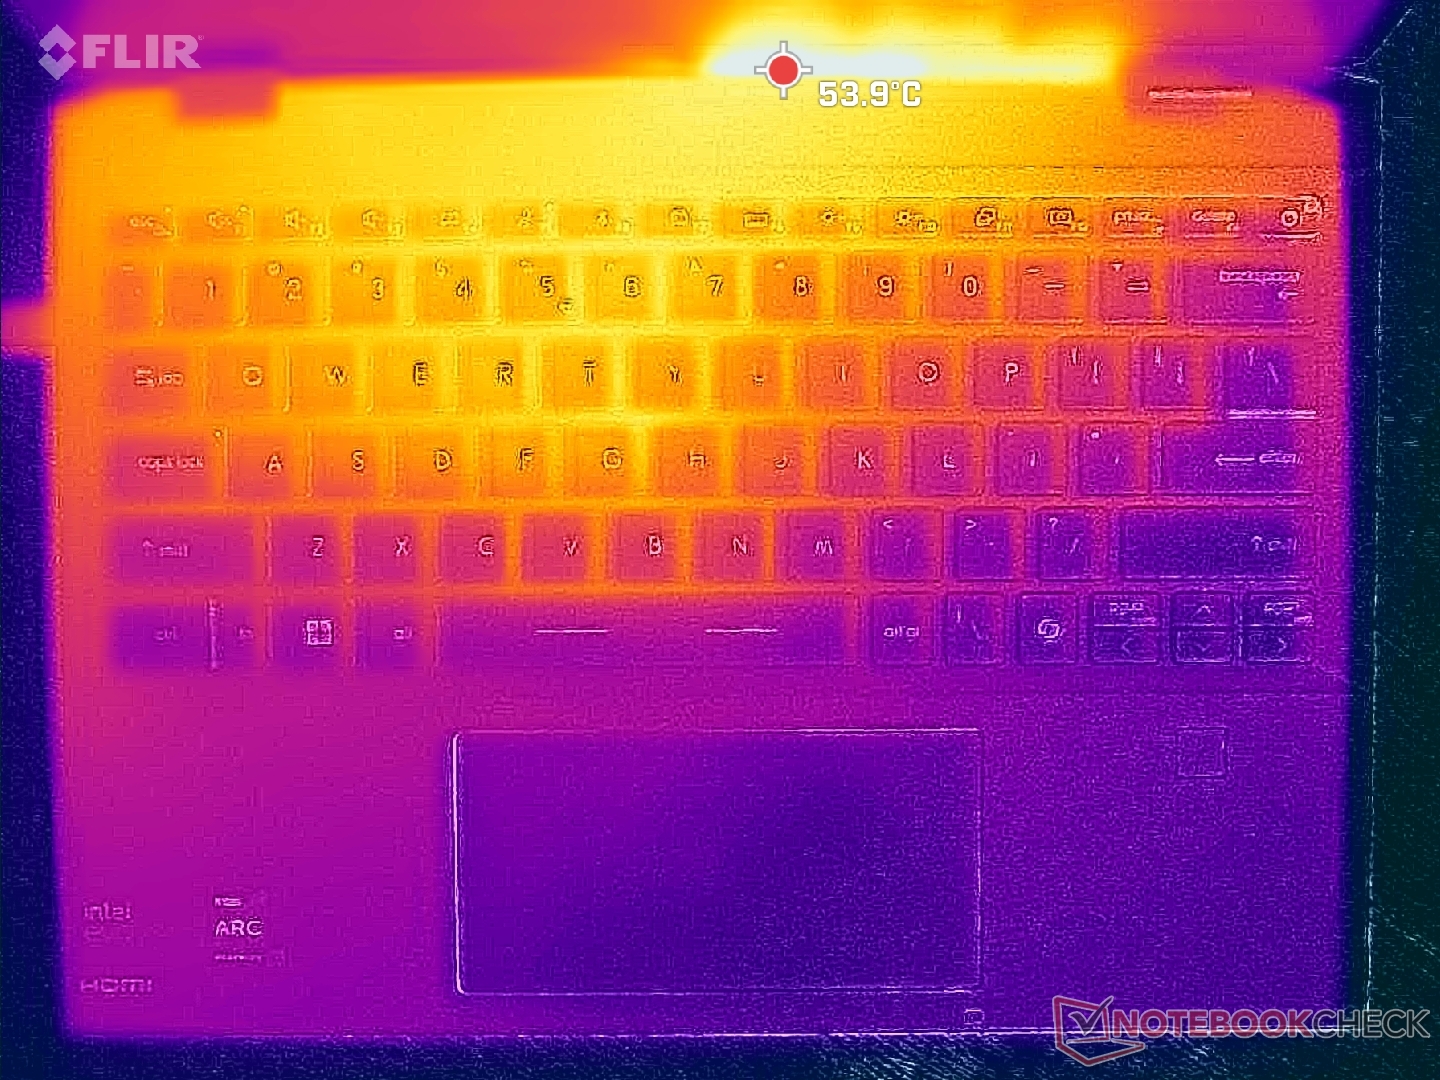
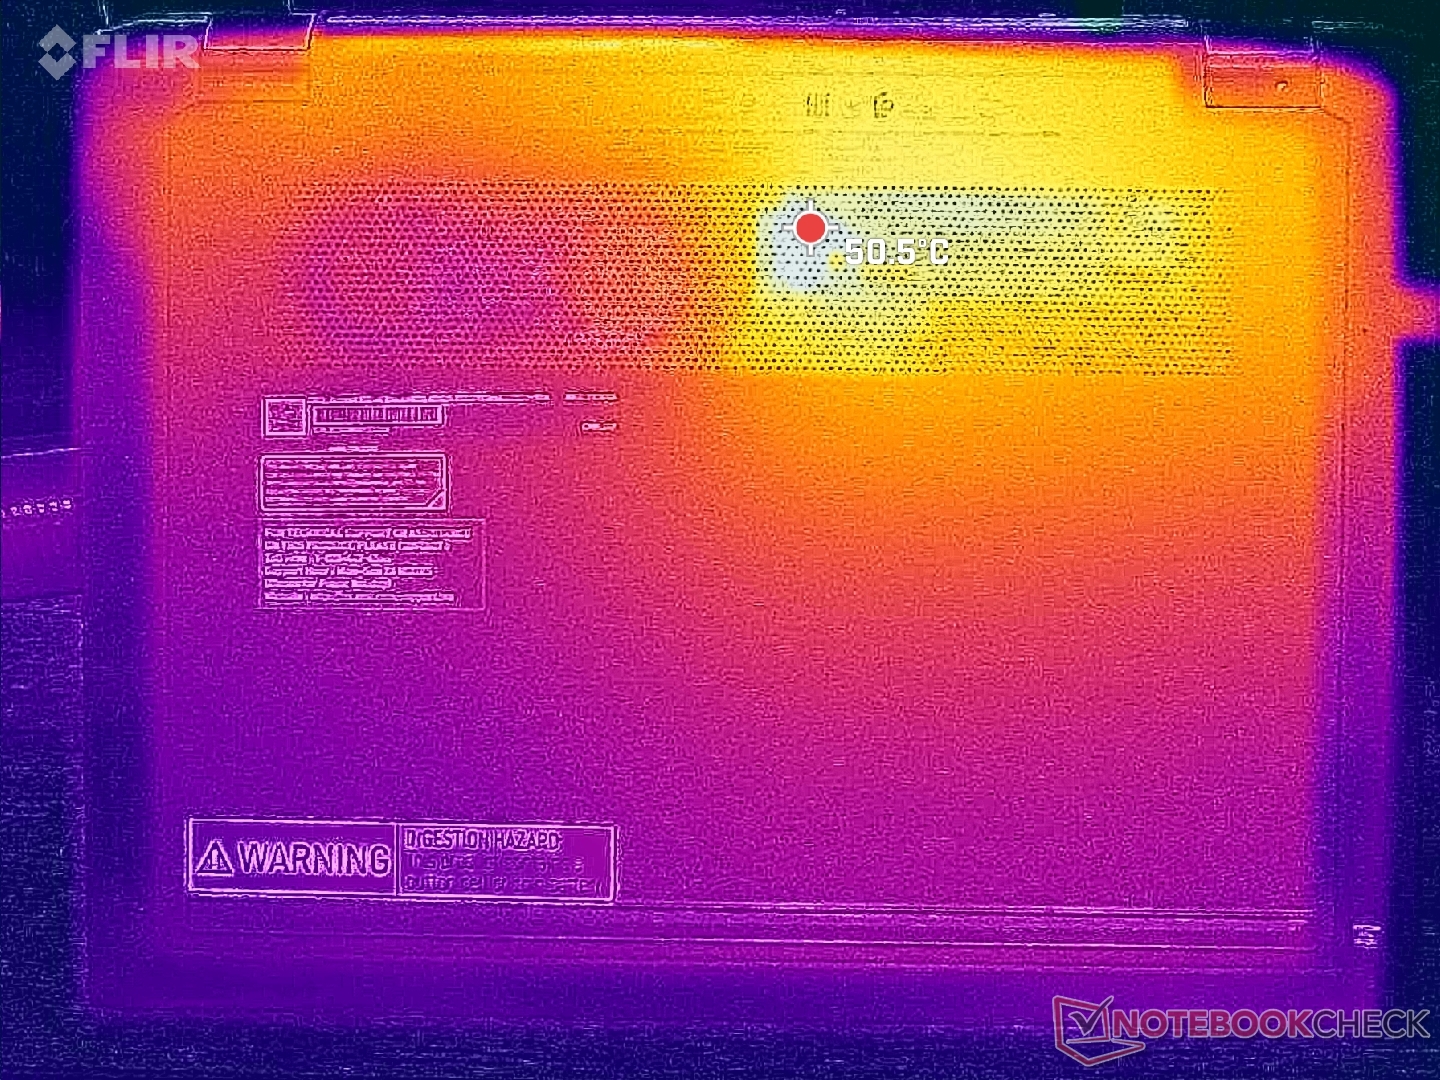
温度
即使只是在桌面上空转,表面温度也非常高。怠速运行时的热点温度为 36 摄氏度,而运行高负载时的热点温度则超过 45 摄氏度,这比其他大多数 13 英寸可折叠电脑的温度都要高。
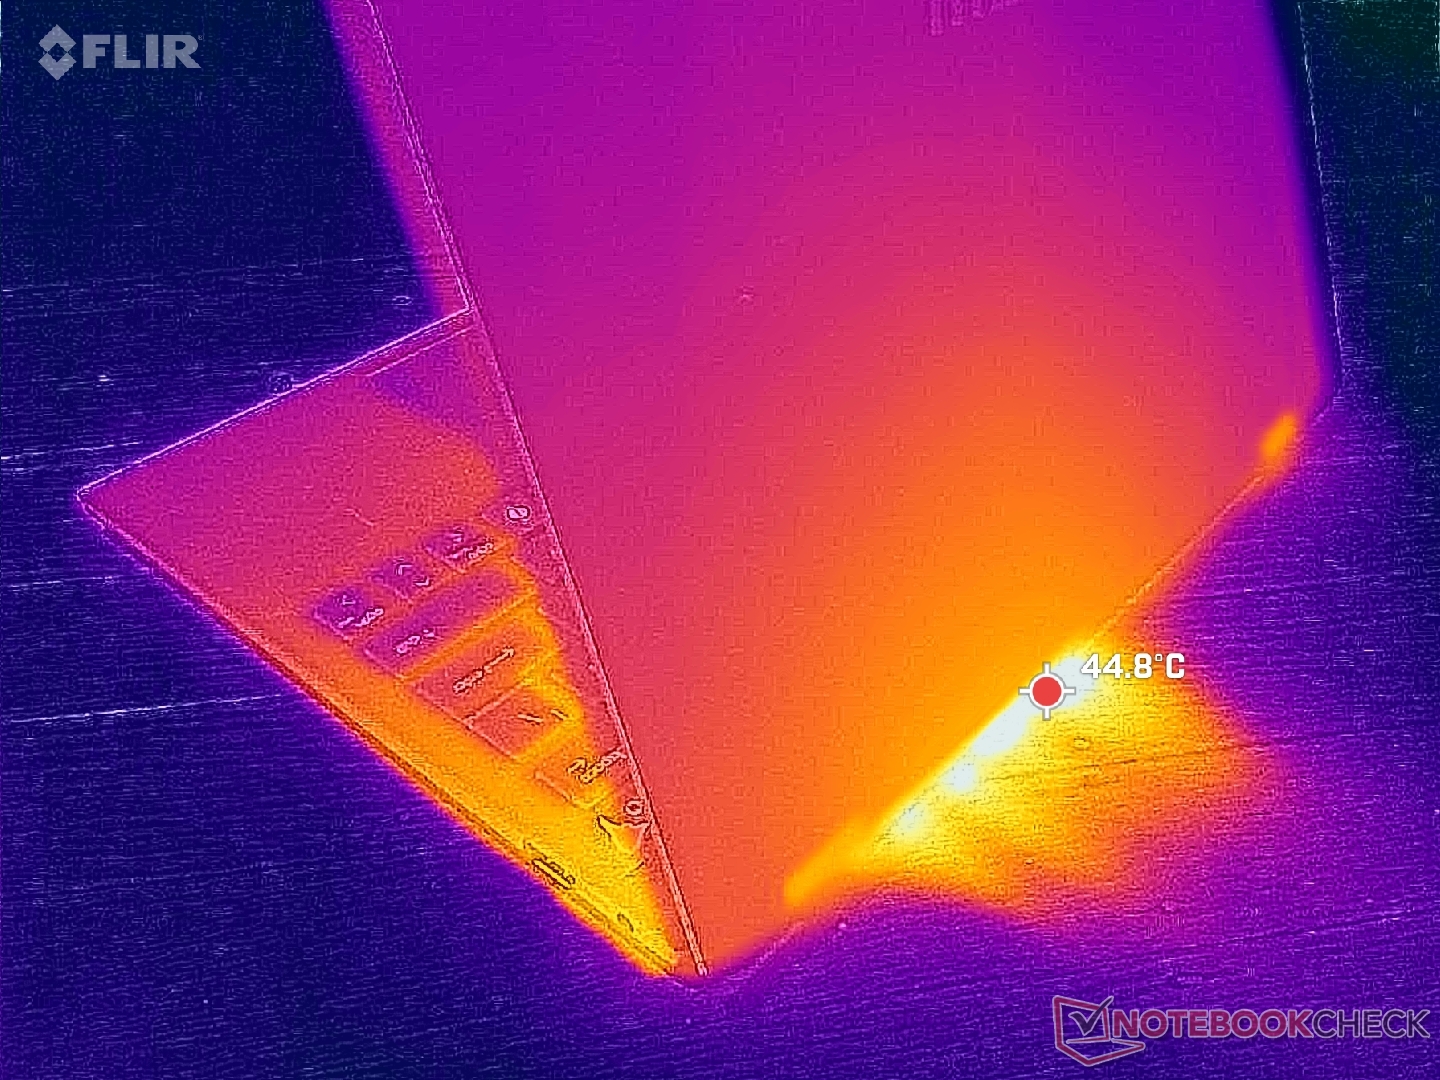
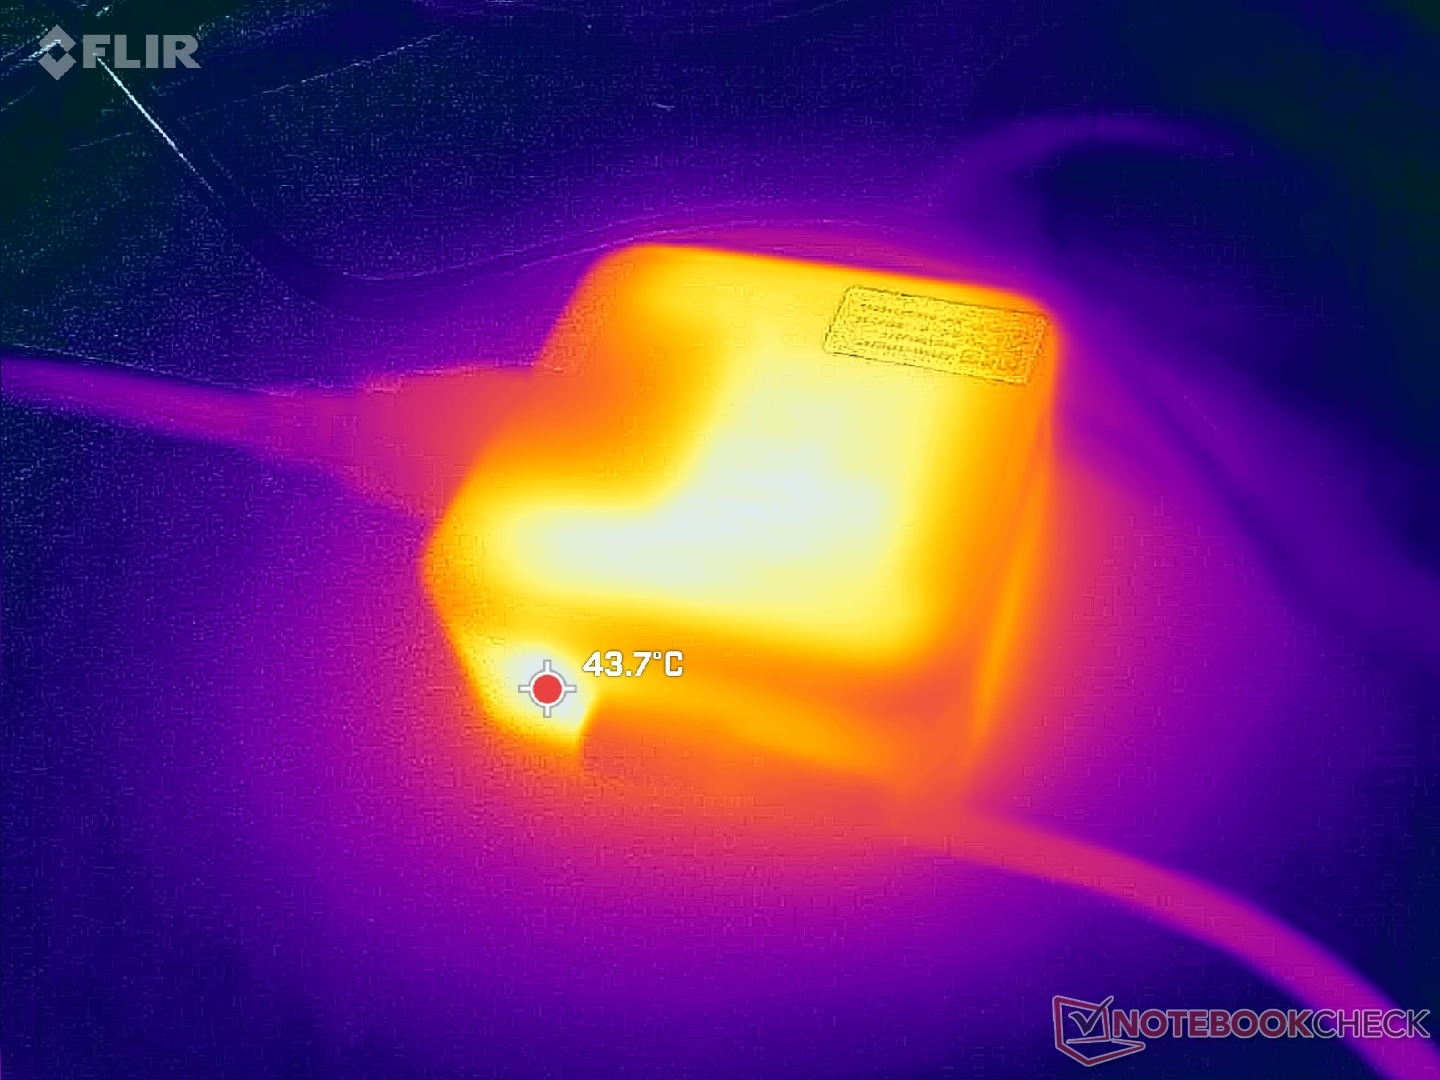
(-) The maximum temperature on the upper side is 45.2 °C / 113 F, compared to the average of 35.4 °C / 96 F, ranging from 19.6 to 60 °C for the class Convertible.
(±) The bottom heats up to a maximum of 44.8 °C / 113 F, compared to the average of 36.8 °C / 98 F
(+) In idle usage, the average temperature for the upper side is 30.1 °C / 86 F, compared to the device average of 30.2 °C / 86 F.
(+) The palmrests and touchpad are cooler than skin temperature with a maximum of 28.8 °C / 83.8 F and are therefore cool to the touch.
(±) The average temperature of the palmrest area of similar devices was 28 °C / 82.4 F (-0.8 °C / -1.4 F).
| MSI Summit E13 AI Evo A1MTG Intel Core Ultra 7 155H, Intel Arc 8-Core iGPU | MSI Summit E13 Flip Evo A11MT Intel Core i7-1185G7, Intel Iris Xe Graphics G7 96EUs | Lenovo Yoga Book 9 13IMU9 Intel Core Ultra 7 155U, Intel Graphics 4-Core iGPU (Arc) | Lenovo ThinkPad L13 Yoga G4 i7-1355U Intel Core i7-1355U, Intel Iris Xe Graphics G7 96EUs | HP Elite Dragonfly Folio 13.5 G3 Intel Core i7-1265U, Intel Iris Xe Graphics G7 96EUs | Dell Latitude 9330 Intel Core i7-1260U, Intel Iris Xe Graphics G7 96EUs | |
|---|---|---|---|---|---|---|
| Heat | -7% | 10% | 6% | 28% | 12% | |
| Maximum Upper Side * | 45.2 | 52 -15% | 39.2 13% | 38.4 15% | 32.8 27% | 40.6 10% |
| Maximum Bottom * | 44.8 | 57.4 -28% | 41 8% | 46 -3% | 33.4 25% | 50.2 -12% |
| Idle Upper Side * | 34.8 | 30.4 13% | 32.2 7% | 31.2 10% | 24.6 29% | 25 28% |
| Idle Bottom * | 35.8 | 34.2 4% | 31.6 12% | 34.8 3% | 24.6 31% | 27.6 23% |
* ... smaller is better
发言人
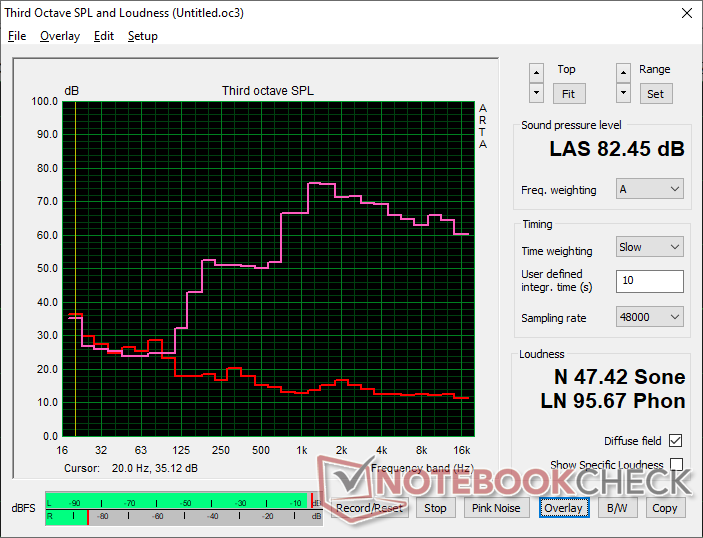
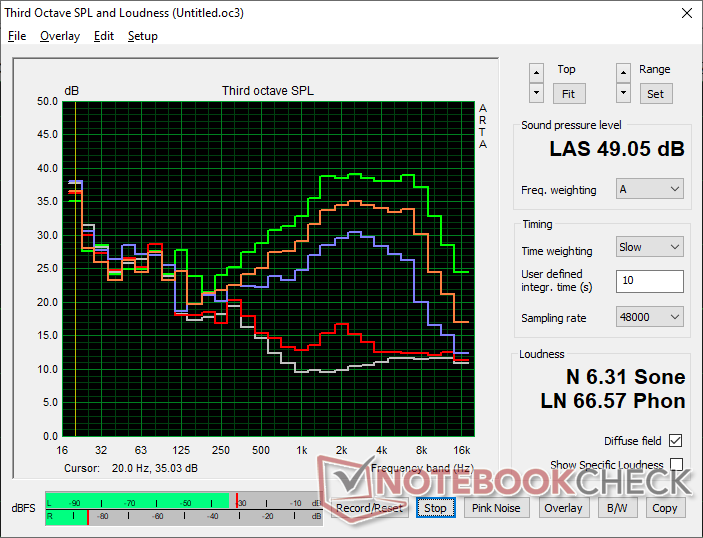
MSI Summit E13 AI Evo A1MTG audio analysis
(+) | speakers can play relatively loud (82.5 dB)
Bass 100 - 315 Hz
(-) | nearly no bass - on average 21.9% lower than median
(±) | linearity of bass is average (9.9% delta to prev. frequency)
Mids 400 - 2000 Hz
(±) | reduced mids - on average 9.2% lower than median
(±) | linearity of mids is average (7.6% delta to prev. frequency)
Highs 2 - 16 kHz
(+) | balanced highs - only 3.2% away from median
(+) | highs are linear (3.3% delta to prev. frequency)
Overall 100 - 16.000 Hz
(±) | linearity of overall sound is average (21.4% difference to median)
Compared to same class
» 55% of all tested devices in this class were better, 12% similar, 33% worse
» The best had a delta of 6%, average was 20%, worst was 57%
Compared to all devices tested
» 57% of all tested devices were better, 7% similar, 35% worse
» The best had a delta of 4%, average was 24%, worst was 134%
Apple MacBook Pro 16 2021 M1 Pro audio analysis
(+) | speakers can play relatively loud (84.7 dB)
Bass 100 - 315 Hz
(+) | good bass - only 3.8% away from median
(+) | bass is linear (5.2% delta to prev. frequency)
Mids 400 - 2000 Hz
(+) | balanced mids - only 1.3% away from median
(+) | mids are linear (2.1% delta to prev. frequency)
Highs 2 - 16 kHz
(+) | balanced highs - only 1.9% away from median
(+) | highs are linear (2.7% delta to prev. frequency)
Overall 100 - 16.000 Hz
(+) | overall sound is linear (4.6% difference to median)
Compared to same class
» 0% of all tested devices in this class were better, 0% similar, 100% worse
» The best had a delta of 5%, average was 18%, worst was 45%
Compared to all devices tested
» 0% of all tested devices were better, 0% similar, 100% worse
» The best had a delta of 4%, average was 24%, worst was 134%
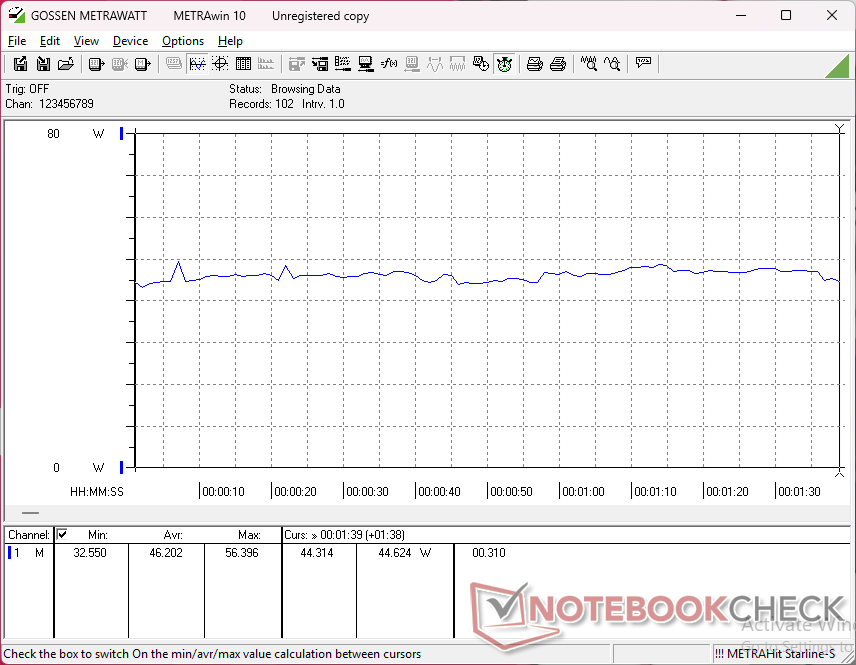
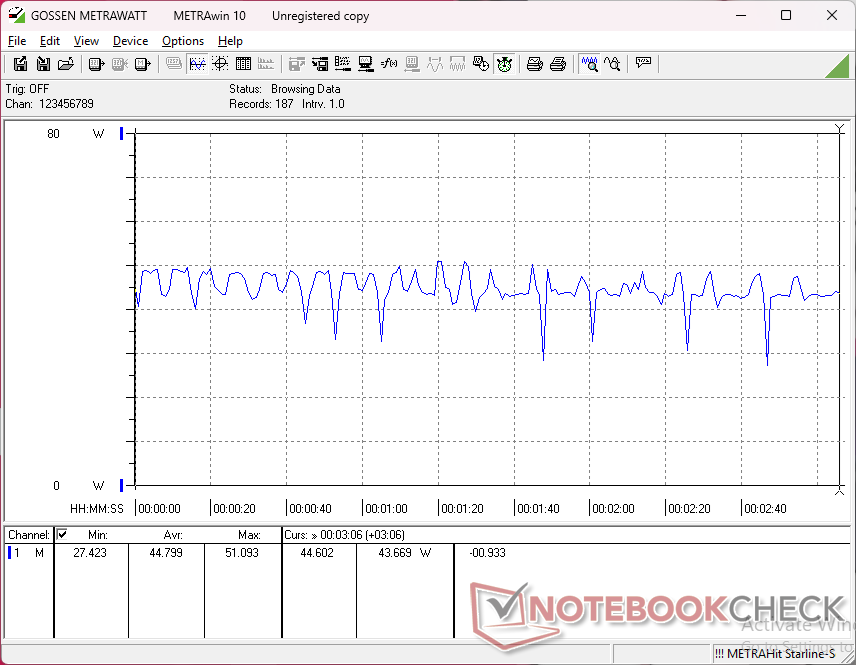
能源管理
耗电量
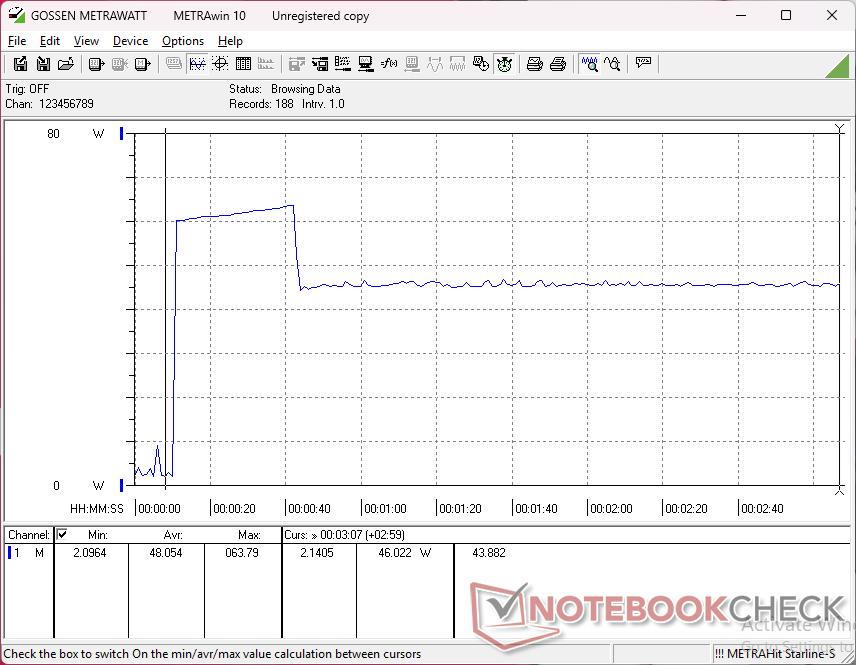
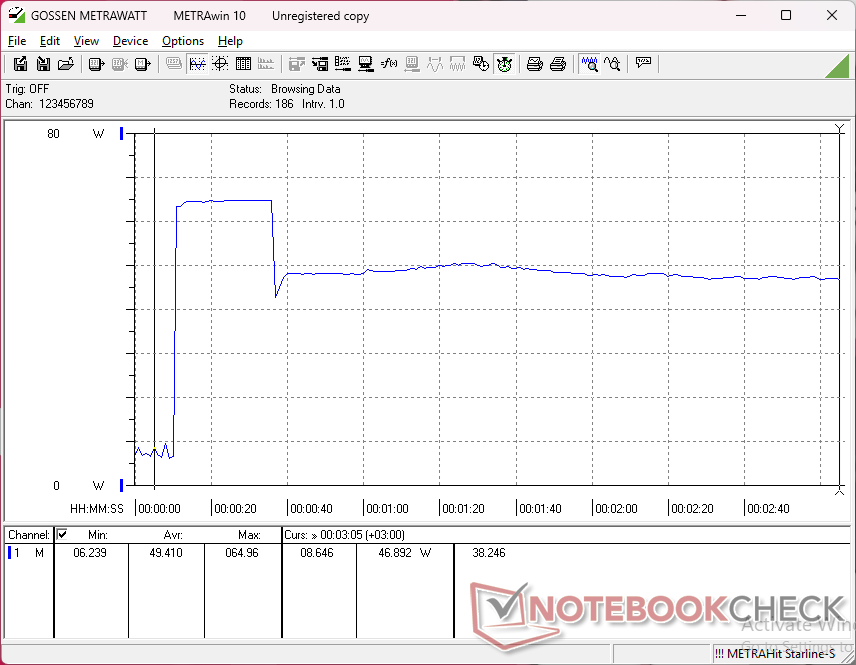
在运行《 赛博朋克 2077》 等要求较高的 GPU 负载时,功耗可能会不稳定,这与上文提到的帧速率卡顿现象一致。这与 框架 13.5相比,Framework 13.5 配备了完全相同的 Core Ultra 7 155H CPU,但在负载情况下功耗要稳定得多。
| Off / Standby | |
| Idle | |
| Load |
|
Key:
min: | |
| MSI Summit E13 AI Evo A1MTG Ultra 7 155H, Arc 8-Core, Micron 2400 MTFDKBA1T0QFM, IPS, 1920x1200, 13.3" | MSI Summit E13 Flip Evo A11MT i7-1185G7, Iris Xe G7 96EUs, Phison 1TB SM2801T24GKBB4S-E162, IPS, 1920x1200, 13.4" | Lenovo Yoga Book 9 13IMU9 Ultra 7 155U, Graphics 4-Core, , OLED, 2880x1800, 13.3" | Lenovo ThinkPad L13 Yoga G4 i7-1355U i7-1355U, Iris Xe G7 96EUs, Samsung PM9B1 512GB MZAL4512HBLU, IPS, 1920x1200, 13.3" | HP Elite Dragonfly Folio 13.5 G3 i7-1265U, Iris Xe G7 96EUs, Samsung PM9A1 MZVL2512HCJQ, IPS, 1920x1280, 13.5" | Dell Latitude 9330 i7-1260U, Iris Xe G7 96EUs, , IPS, 2560x1600, 13.3" | |
|---|---|---|---|---|---|---|
| Power Consumption | -52% | -116% | -59% | -26% | -40% | |
| Idle Minimum * | 2.3 | 4.8 -109% | 7.1 -209% | 5.5 -139% | 3.4 -48% | 4.7 -104% |
| Idle Average * | 4.8 | 8.4 -75% | 9.1 -90% | 8.3 -73% | 4.9 -2% | 8.2 -71% |
| Idle Maximum * | 5 | 8.6 -72% | 18.4 -268% | 9.1 -82% | 9.3 -86% | 8.4 -68% |
| Load Average * | 46.2 | 47.1 -2% | 51.3 -11% | 49.9 -8% | 41.9 9% | 36.8 20% |
| Cyberpunk 2077 ultra external monitor * | 41.9 | |||||
| Cyberpunk 2077 ultra * | 44.8 | |||||
| Load Maximum * | 65 | 65.9 -1% | 65.5 -1% | 60 8% | 67.5 -4% | 49.9 23% |
| Witcher 3 ultra * | 51.6 | 41.5 | 42.4 | 36.4 | 30.4 |
* ... smaller is better
Power Consumption Cyberpunk / Stress Test
Power Consumption external Monitor
电池寿命
无线局域网的运行时间比老款的 Summit E13 短了几个小时,但总体来说还是不错的,实际使用时间接近 9.5 小时。
| MSI Summit E13 AI Evo A1MTG Ultra 7 155H, Arc 8-Core, 70 Wh | MSI Summit E13 Flip Evo A11MT i7-1185G7, Iris Xe G7 96EUs, 70 Wh | Lenovo Yoga Book 9 13IMU9 Ultra 7 155U, Graphics 4-Core, 80 Wh | Lenovo ThinkPad L13 Yoga G4 i7-1355U i7-1355U, Iris Xe G7 96EUs, 46 Wh | HP Elite Dragonfly Folio 13.5 G3 i7-1265U, Iris Xe G7 96EUs, 53 Wh | Dell Latitude 9330 i7-1260U, Iris Xe G7 96EUs, 50 Wh | |
|---|---|---|---|---|---|---|
| Battery Runtime | 18% | 7% | -35% | -1% | -1% | |
| WiFi v1.3 | 568 | 672 18% | 608 7% | 371 -35% | 565 -1% | 564 -1% |
| Reader / Idle | 1267 | 1637 | 923 | |||
| Load | 109 | 158 | 140 |
笔记本检查评级
MSI Summit E13 AI Evo A1MTG
- 03/04/2025 v8
Allen Ngo
 Total Sustainability Score:
 Transparency
The selection of devices to be reviewed is made by our editorial team. The test sample was freely purchased by the author at his/her own expense. The lender had no influence on this review, nor did the manufacturer receive a copy of this review before publication. There was no obligation to publish this review. We never accept compensation or payment in return for our reviews. As an independent media company, Notebookcheck is not subjected to the authority of manufacturers, retailers or publishers.
This is how Notebookcheck is testing
Every year, Notebookcheck independently reviews hundreds of laptops and smartphones using standardized procedures to ensure that all results are comparable. We have continuously developed our test methods for around 20 years and set industry standards in the process. In our test labs, high-quality measuring equipment is utilized by experienced technicians and editors. These tests involve a multi-stage validation process. Our complex rating system is based on hundreds of well-founded measurements and benchmarks, which maintains objectivity. Further information on our test methods can be found here.

