

微软 Surface Laptop 7 13.8 Copilot+ 评测--得益于骁龙 X 精英版,MacBook Air 终成劲敌?
潜在的竞争对手比较
Rating | Version | Date | Model | Weight | Height | Size | Resolution | Price |
|---|---|---|---|---|---|---|---|---|
| 86.2 % | v8 | 07 / 2024 | Microsoft Surface Laptop 7 13.8 Copilot+ SD X Elite X1E-80-100, Adreno X1-85 3.8 TFLOPS | 1.3 kg | 17.5 mm | 13.80" | 2304x1536 | |
| 90.1 % v7 (old) | v7 (old) | 05 / 2024 | Lenovo ThinkBook 13x G4 21KR0008GE Ultra 5 125H, Arc 7-Core | 1.2 kg | 12.9 mm | 13.50" | 2880x1920 | |
| 86.5 % v7 (old) | v7 (old) | 05 / 2024 | Dell XPS 13 9340 Core Ultra 7 Ultra 7 155H, Arc 8-Core | 1.2 kg | 15.3 mm | 13.40" | 1920x1200 | |
| 92.4 % v7 (old) | v7 (old) | 03 / 2024 | Apple MacBook Air 13 M3 10C GPU M3, M3 10-Core GPU | 1.2 kg | 11.3 mm | 13.60" | 2560x1664 | |
| 87.5 % v7 (old) | v7 (old) | 10 / 2023 | Framework Laptop 13.5 Ryzen 7 7840U R7 7840U, Radeon 780M | 1.3 kg | 15.85 mm | 13.50" | 2256x1504 | |
| 91.9 % v7 (old) | v7 (old) | 07 / 2023 | HP Dragonfly G4 i7-1365U, Iris Xe G7 96EUs | 1.1 kg | 16.3 mm | 13.50" | 1920x1280 |
注:我们最近更新了评级系统,第 8 版的结果与第 7 版的结果不具可比性。更多信息 此处.
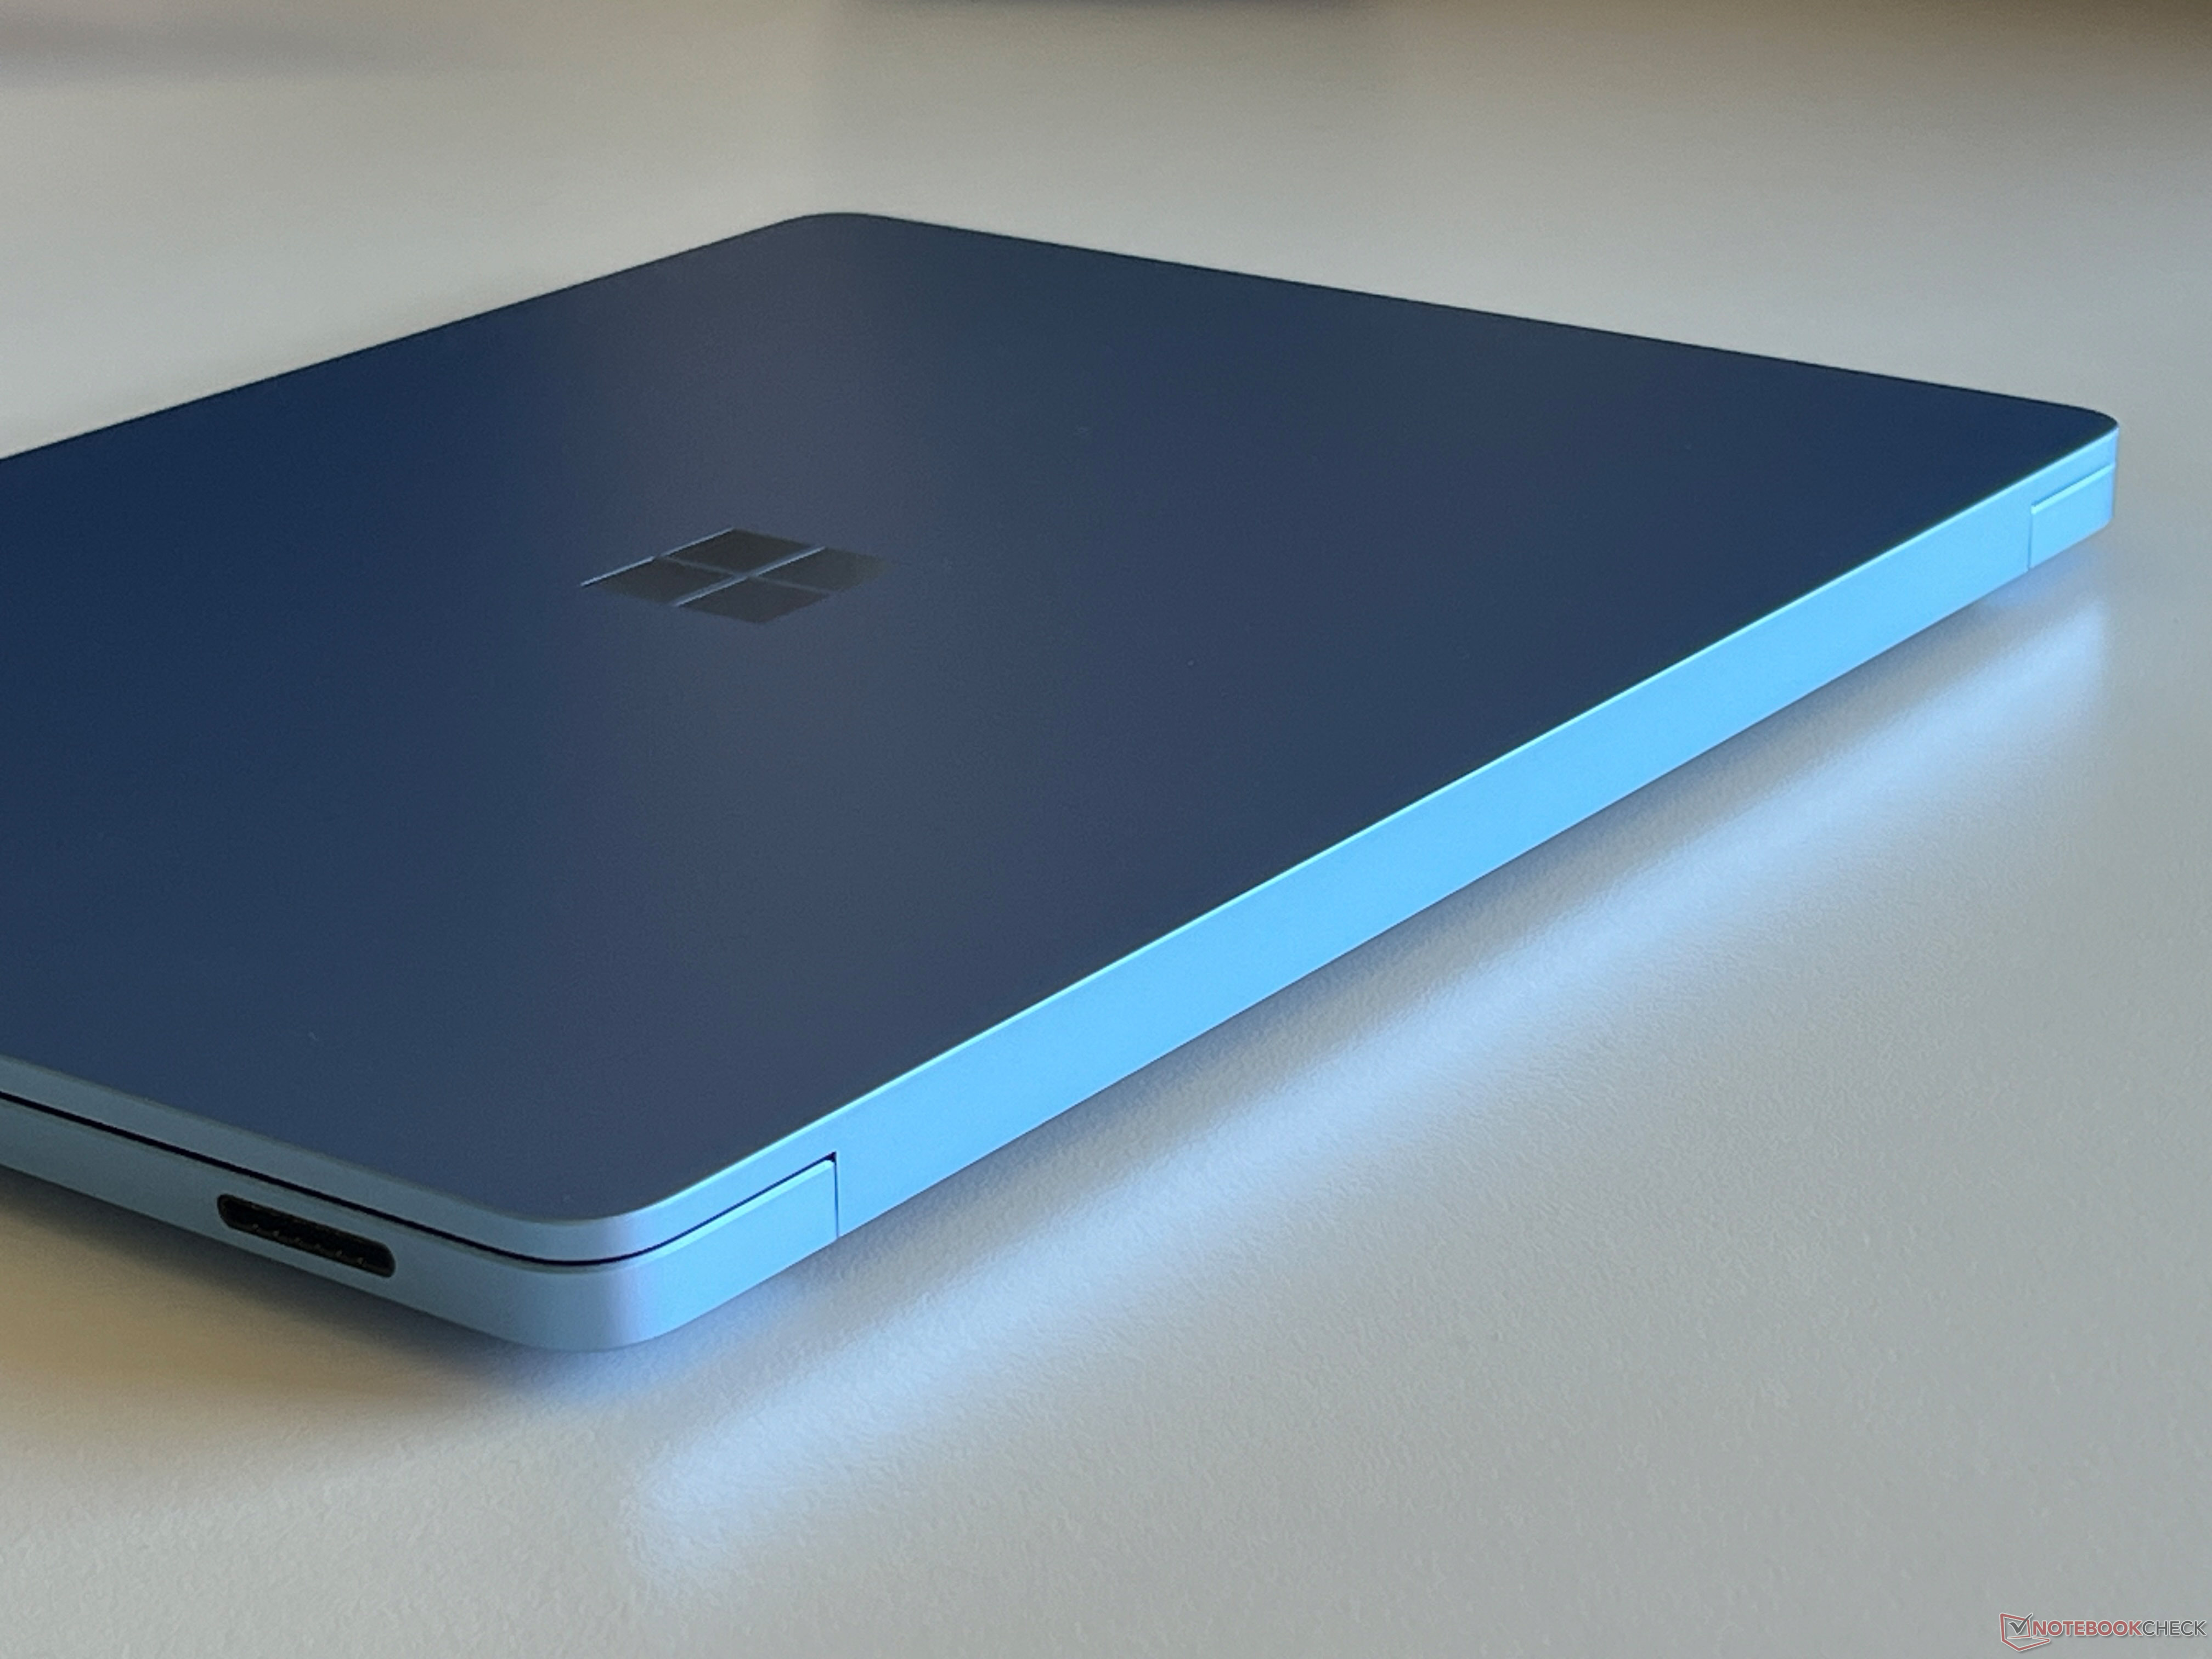
外壳 - 可进行维护的金属外壳
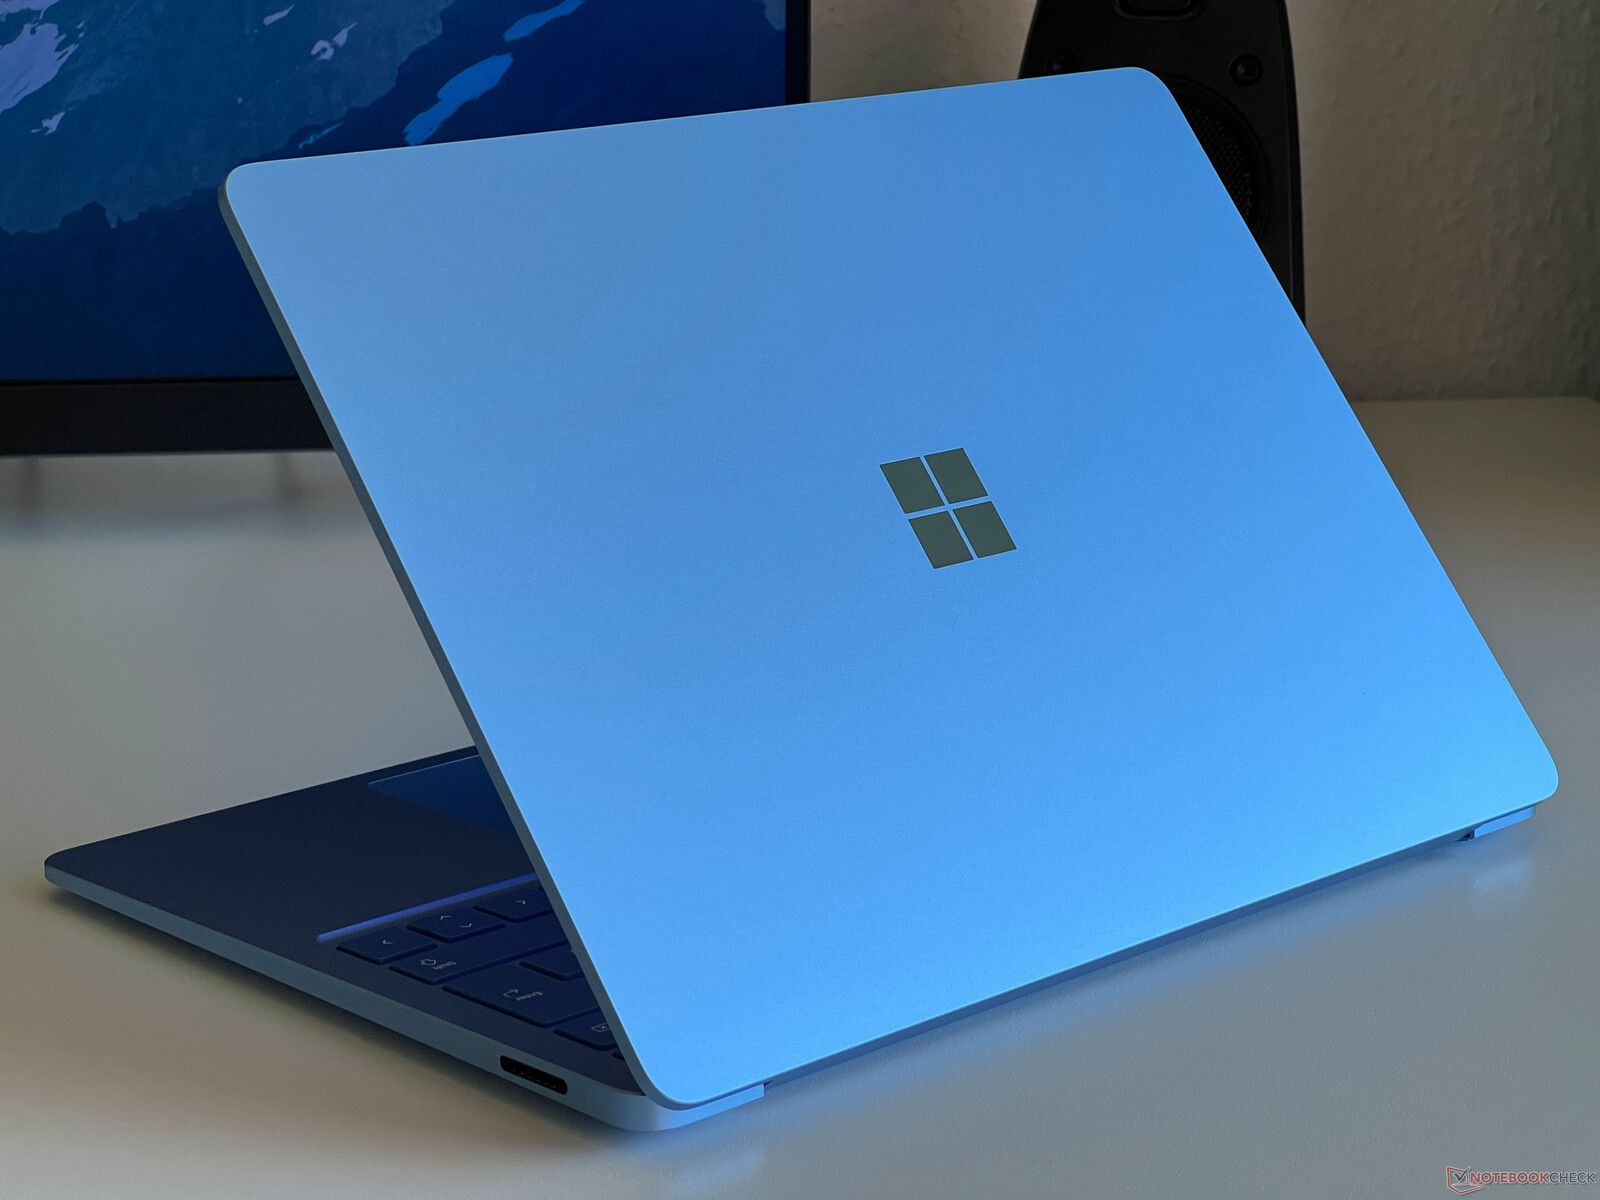
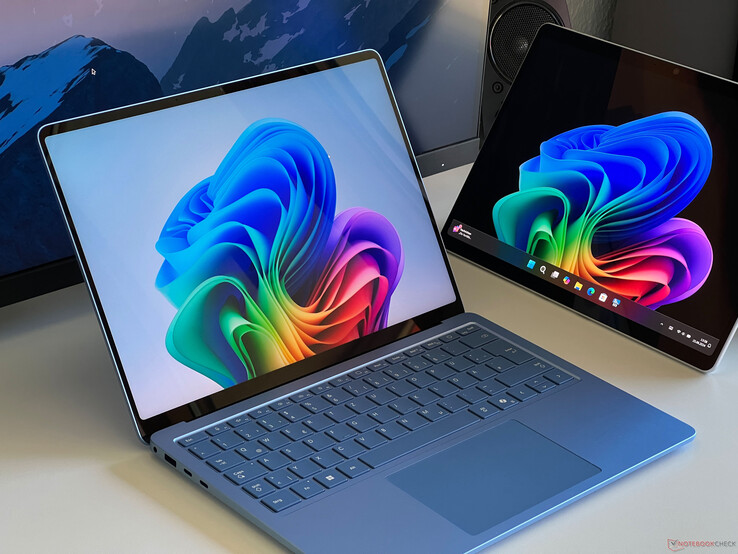
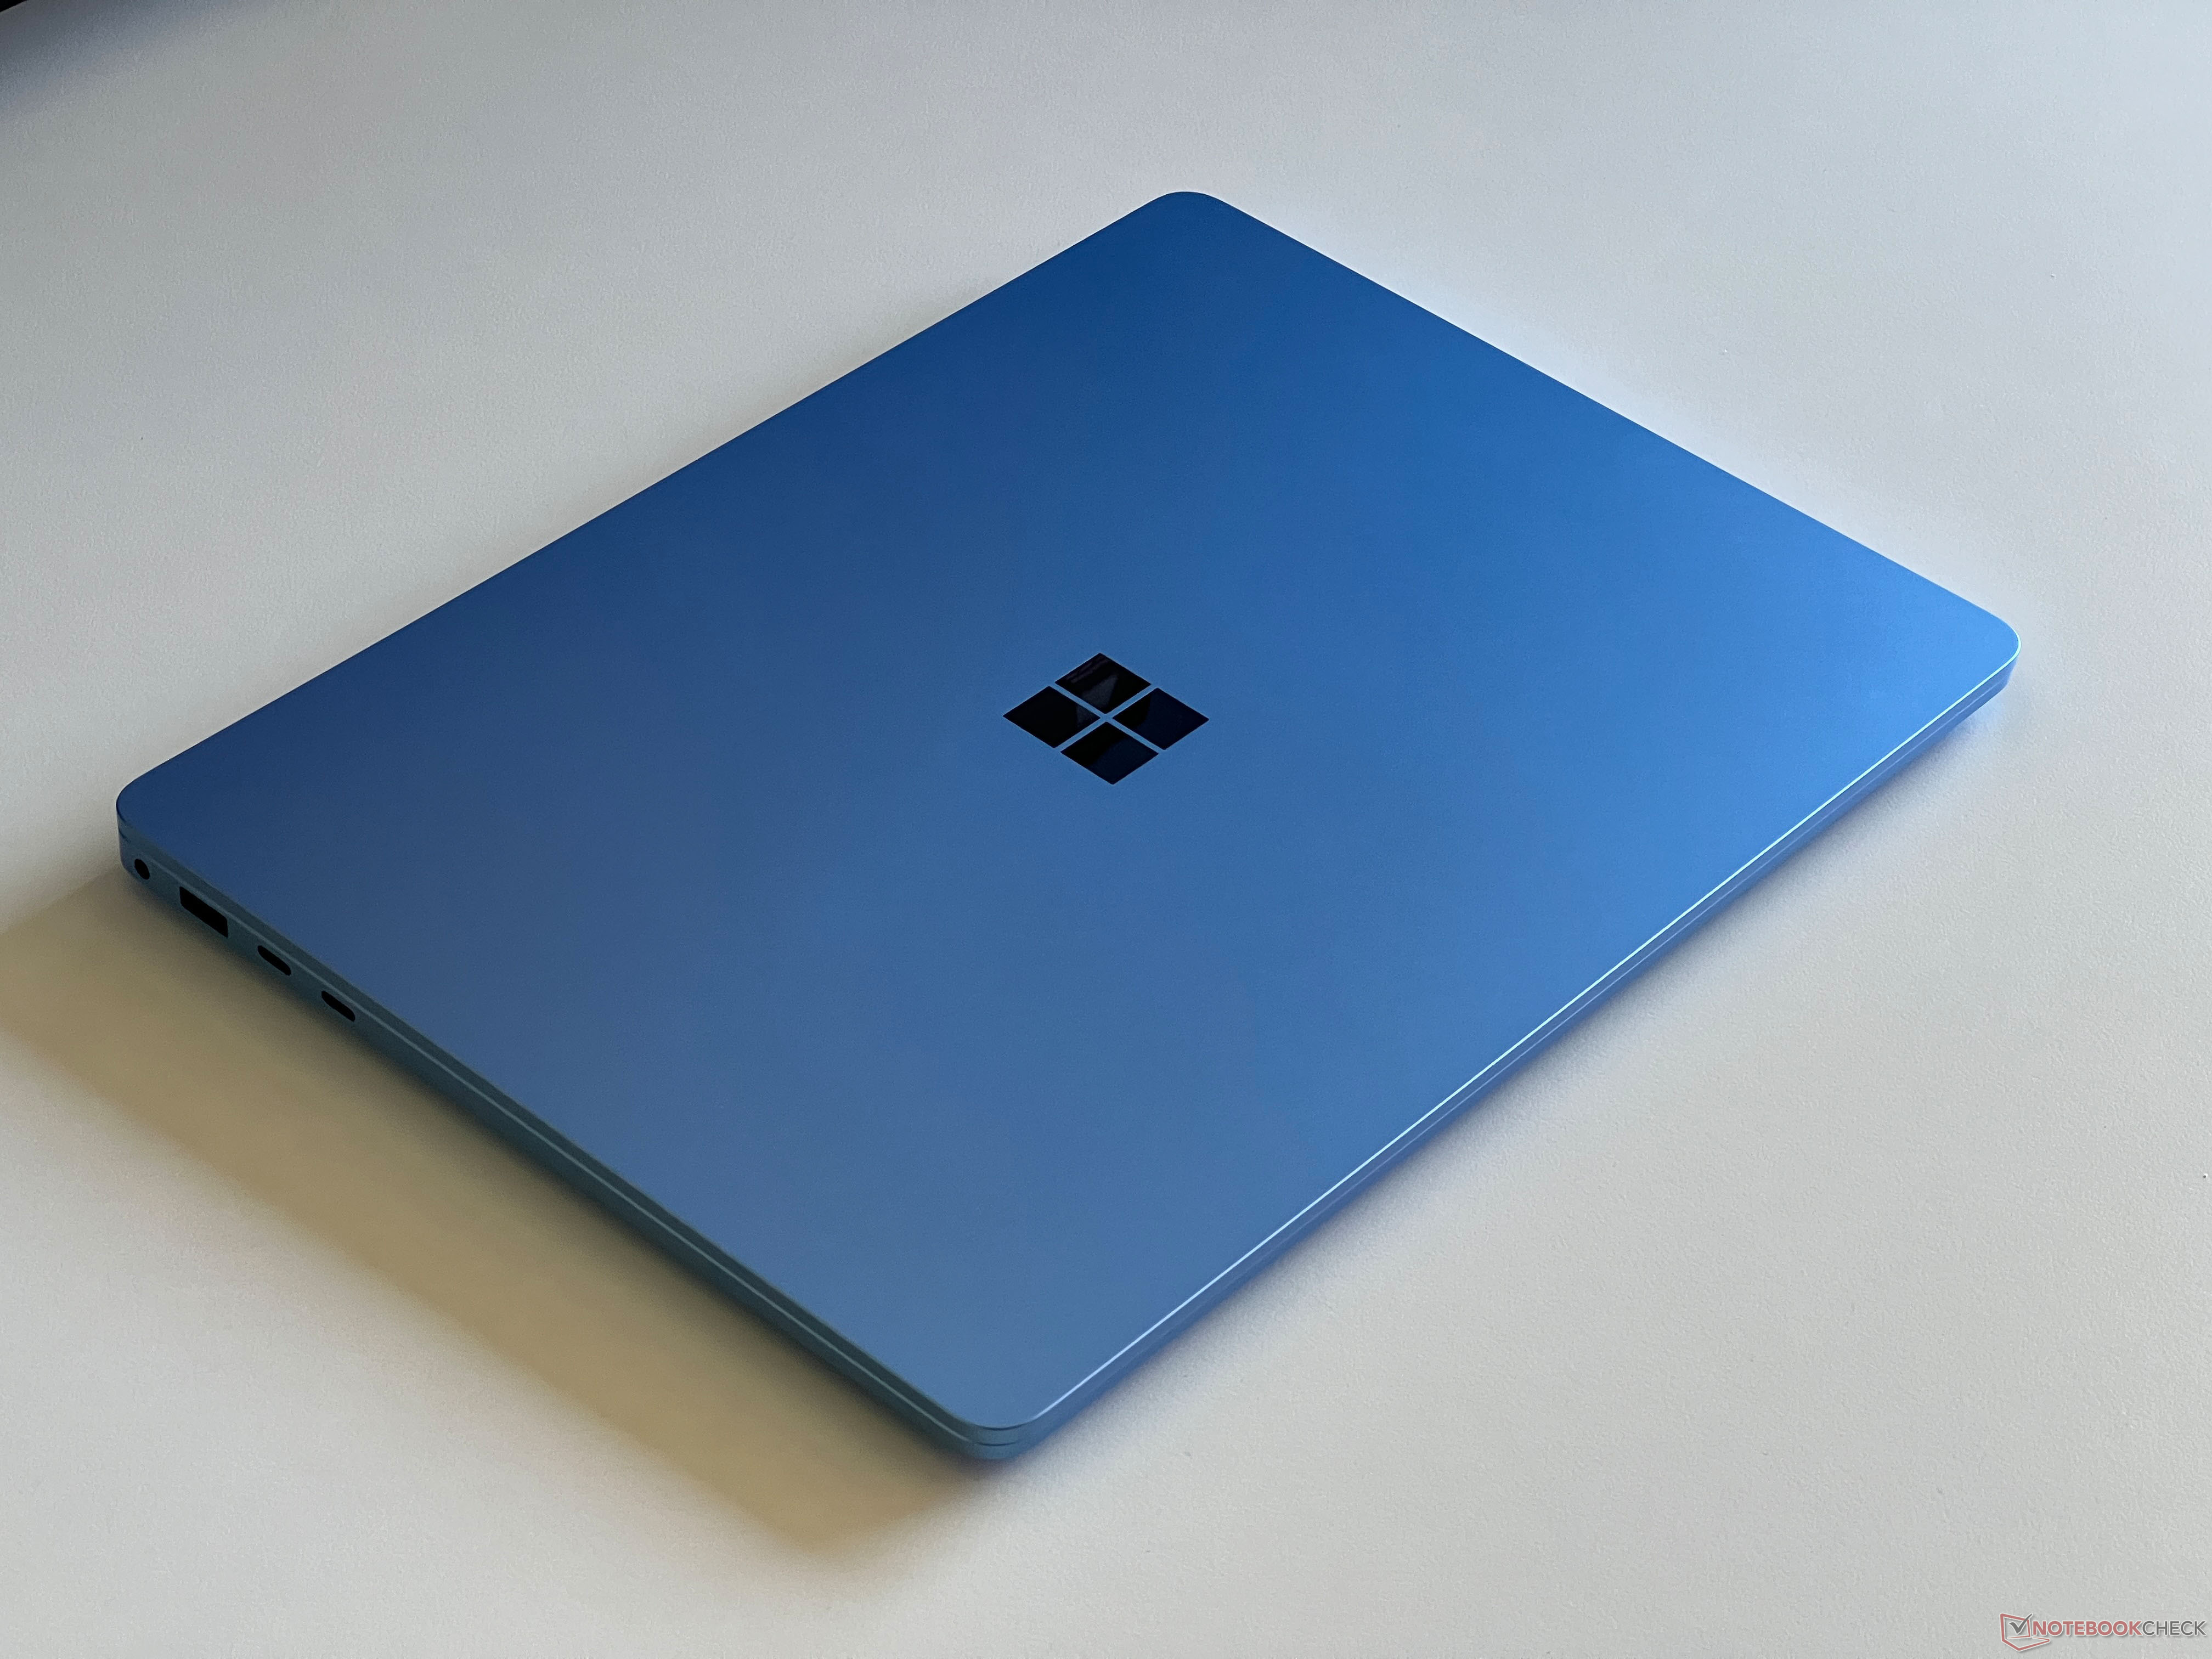
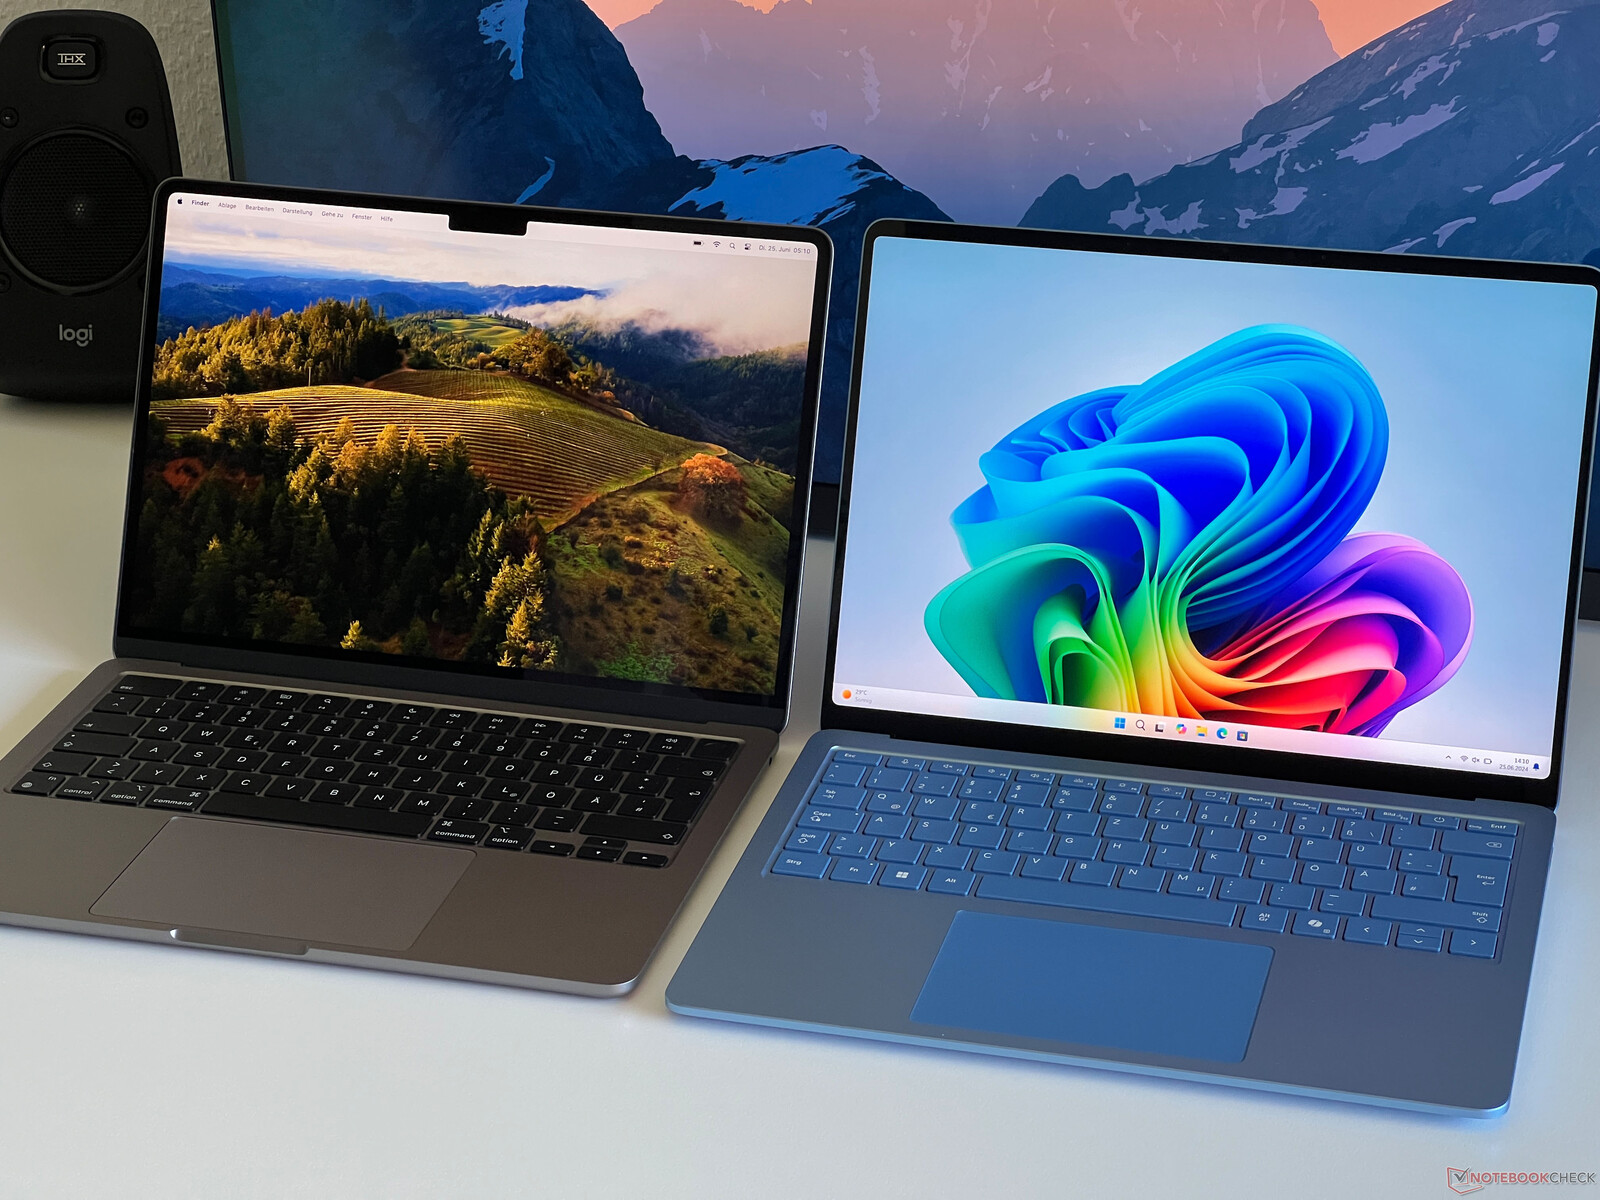
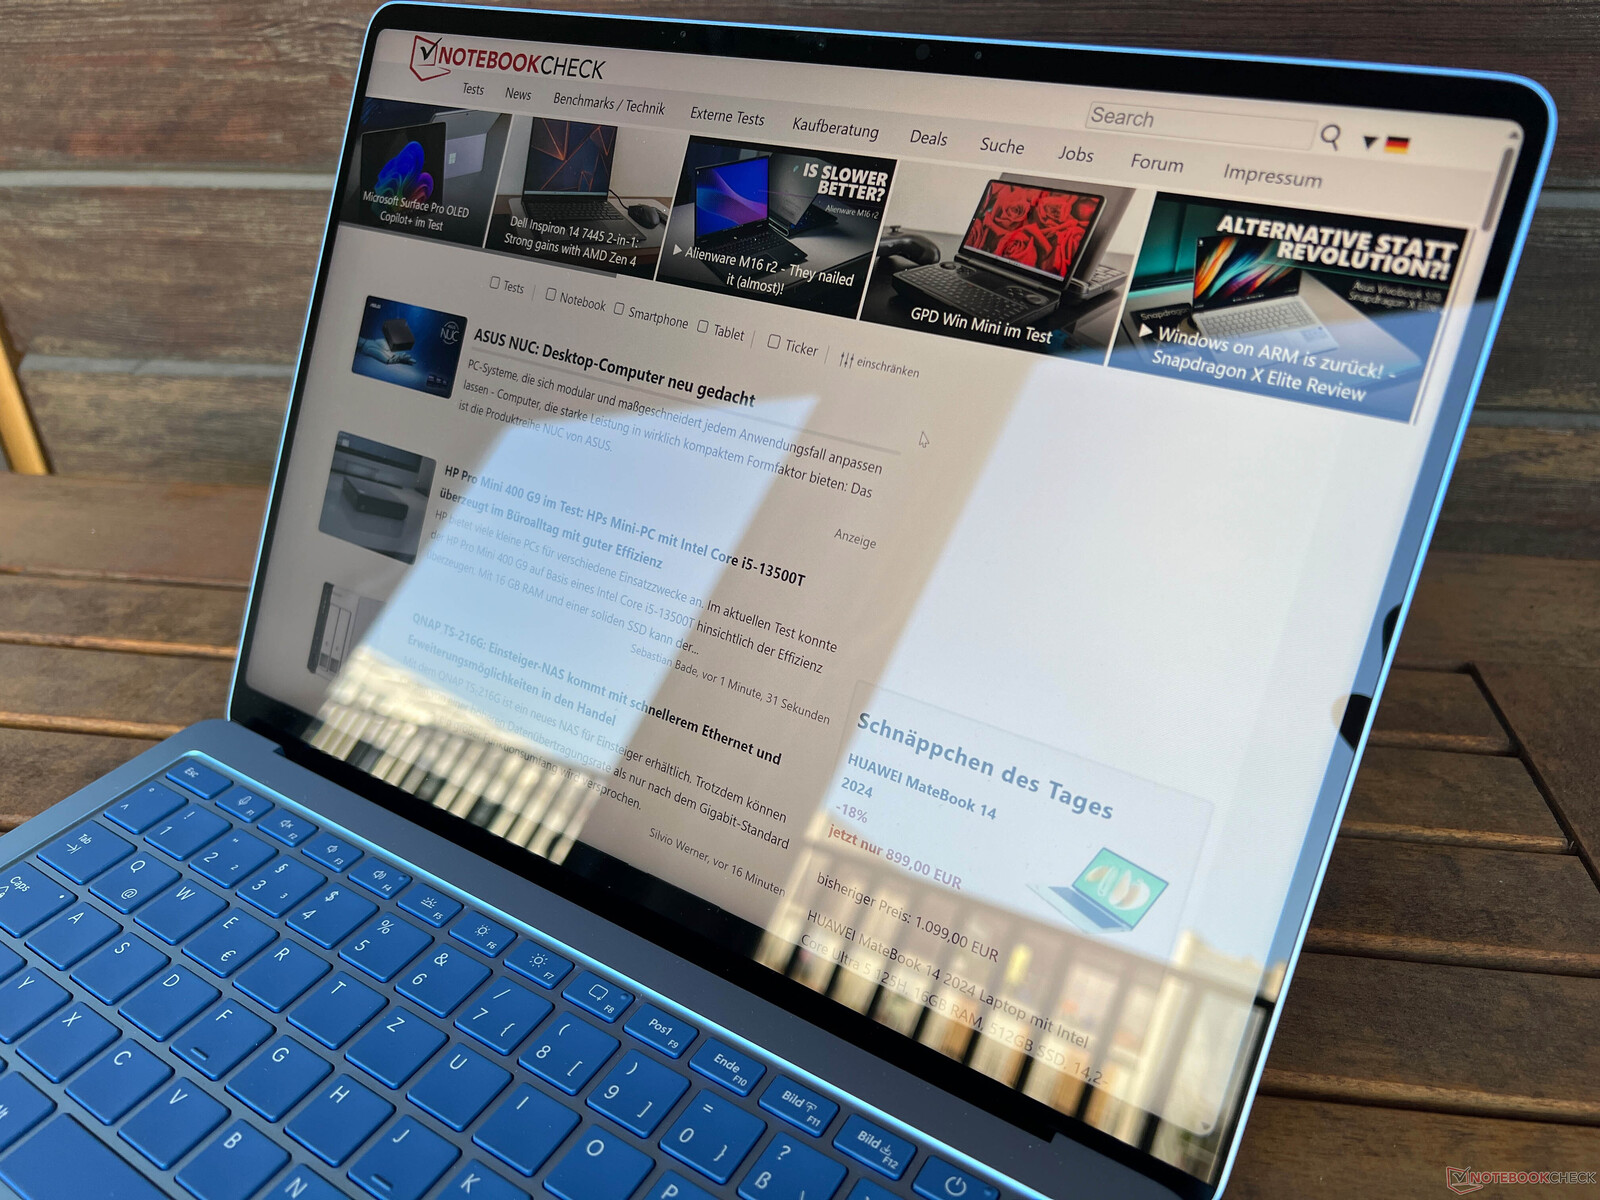
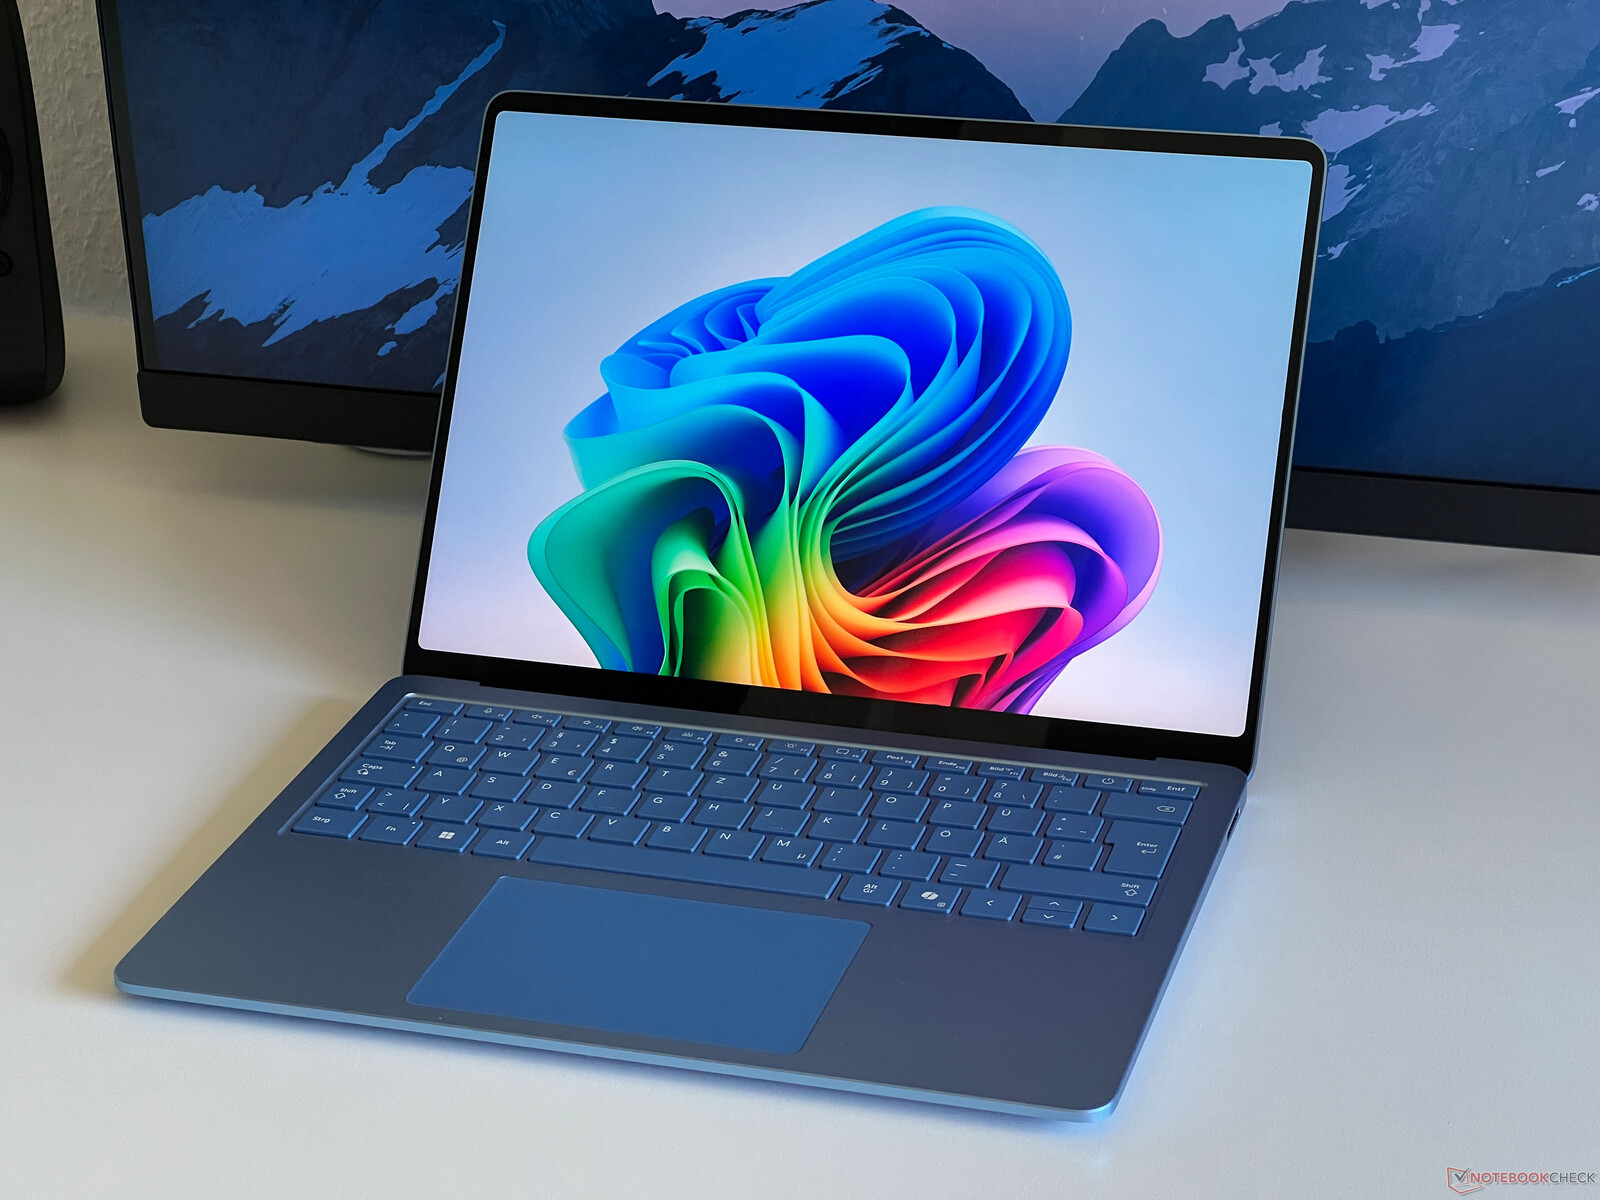
第七代 Surface Laptop 的设计没有任何变化,从外观上看,你根本看不出这是一款全新的骁龙机型。这只有通过新的 Copilot 按钮才能看出来。金属外壳的结构仍然非常出色,微软为这款笔记本电脑提供了黑色、铂金色、灰米色或宝石蓝色(我们评测设备的颜色)。根据光线的不同,蓝宝石蓝色的机型非常醒目,我们很喜欢。此外,它还没有指纹问题。
稳定性非常好,只需施加很大的压力就能实现最低限度的弯曲。不过,我们无法听到任何嘎吱嘎吱的声音。铰链基本校准良好,但在调整打开角度(最大 135 度)时,还是会有轻微晃动。地面晃动时(例如在火车上)不会出现问题。第七代设备的一个新功能是维护选项,因为盖子不再是胶粘的(稍后详述)。
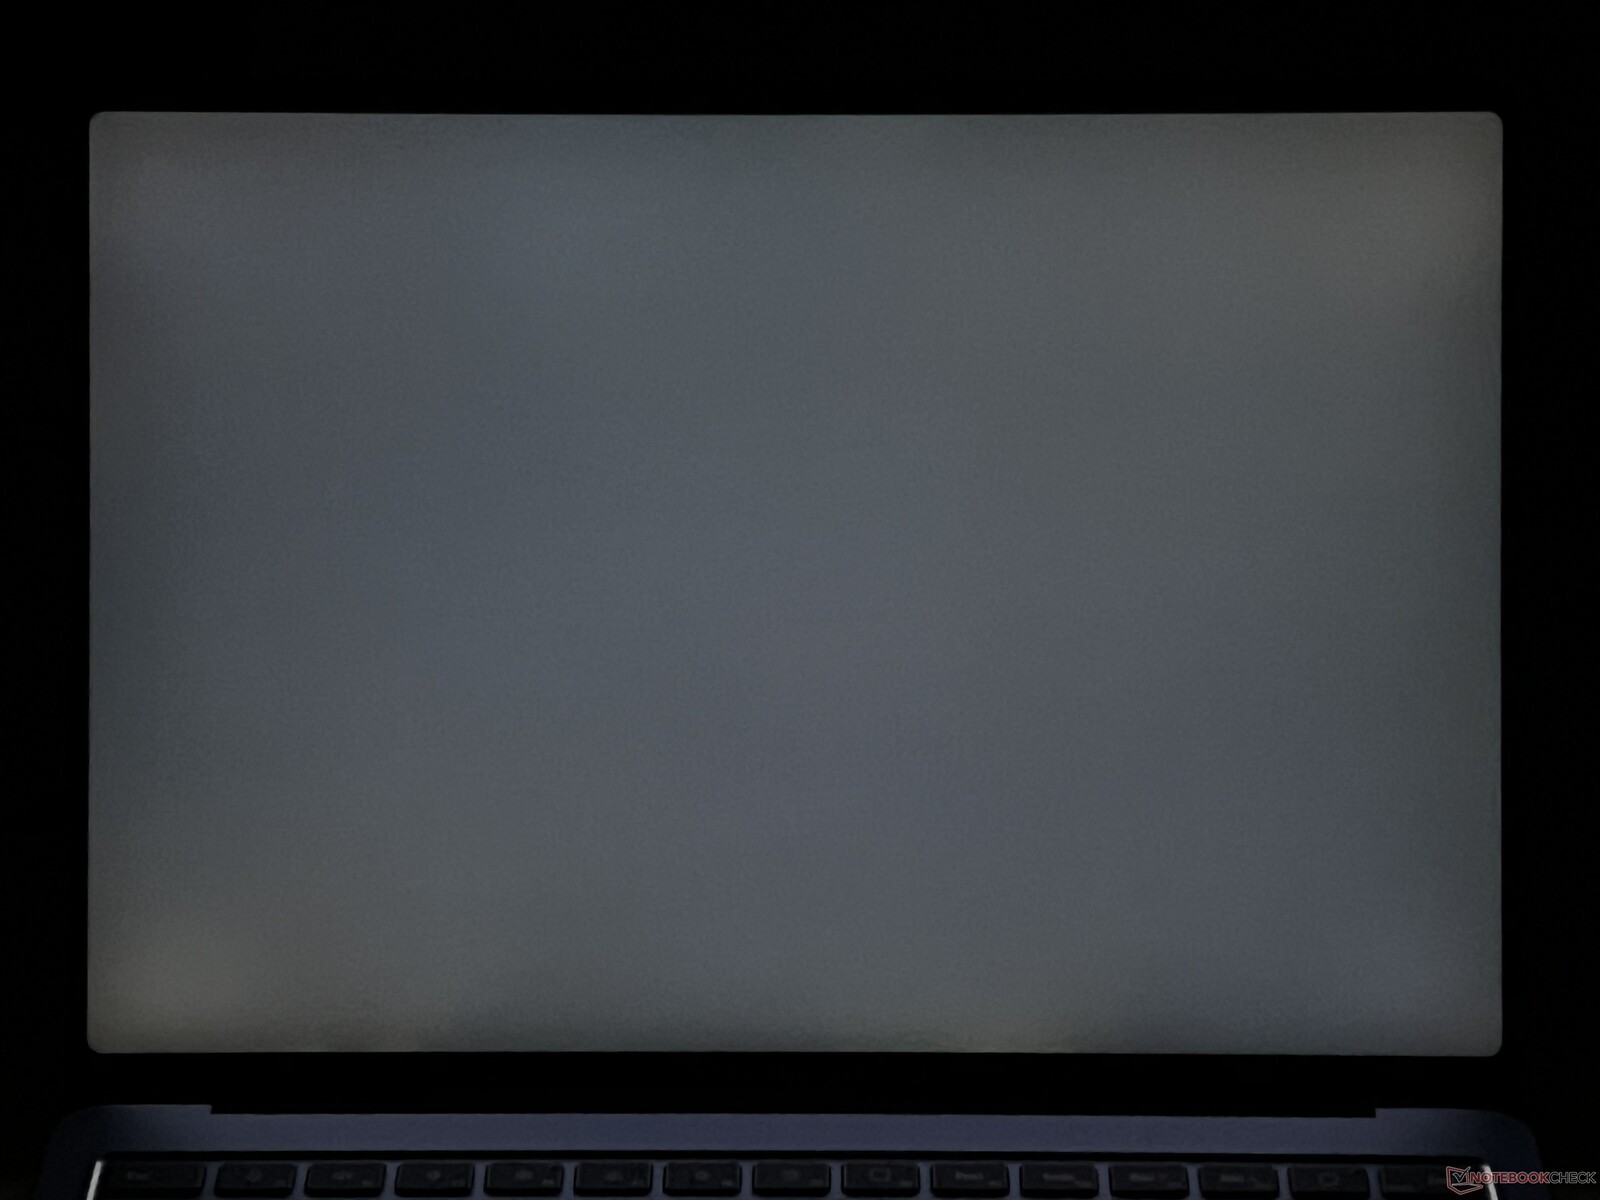
Surface Laptop 13.8 并不是一款特别轻薄的设备。它的重量略高于 1.3 千克,后部厚度为 17.5 毫米,是本次对比中最厚的笔记本电脑。尽管如此,这款笔记本电脑总体上非常小巧,可以轻松收纳到背包中。在与 MacBook Air 13 M3(见下图),你会发现 Surface 笔记本电脑有多厚,而且占地面积稍大。 随机提供的 39 瓦 PSU 重 213 克。
功能 - USB 4 和 Wi-Fi 7
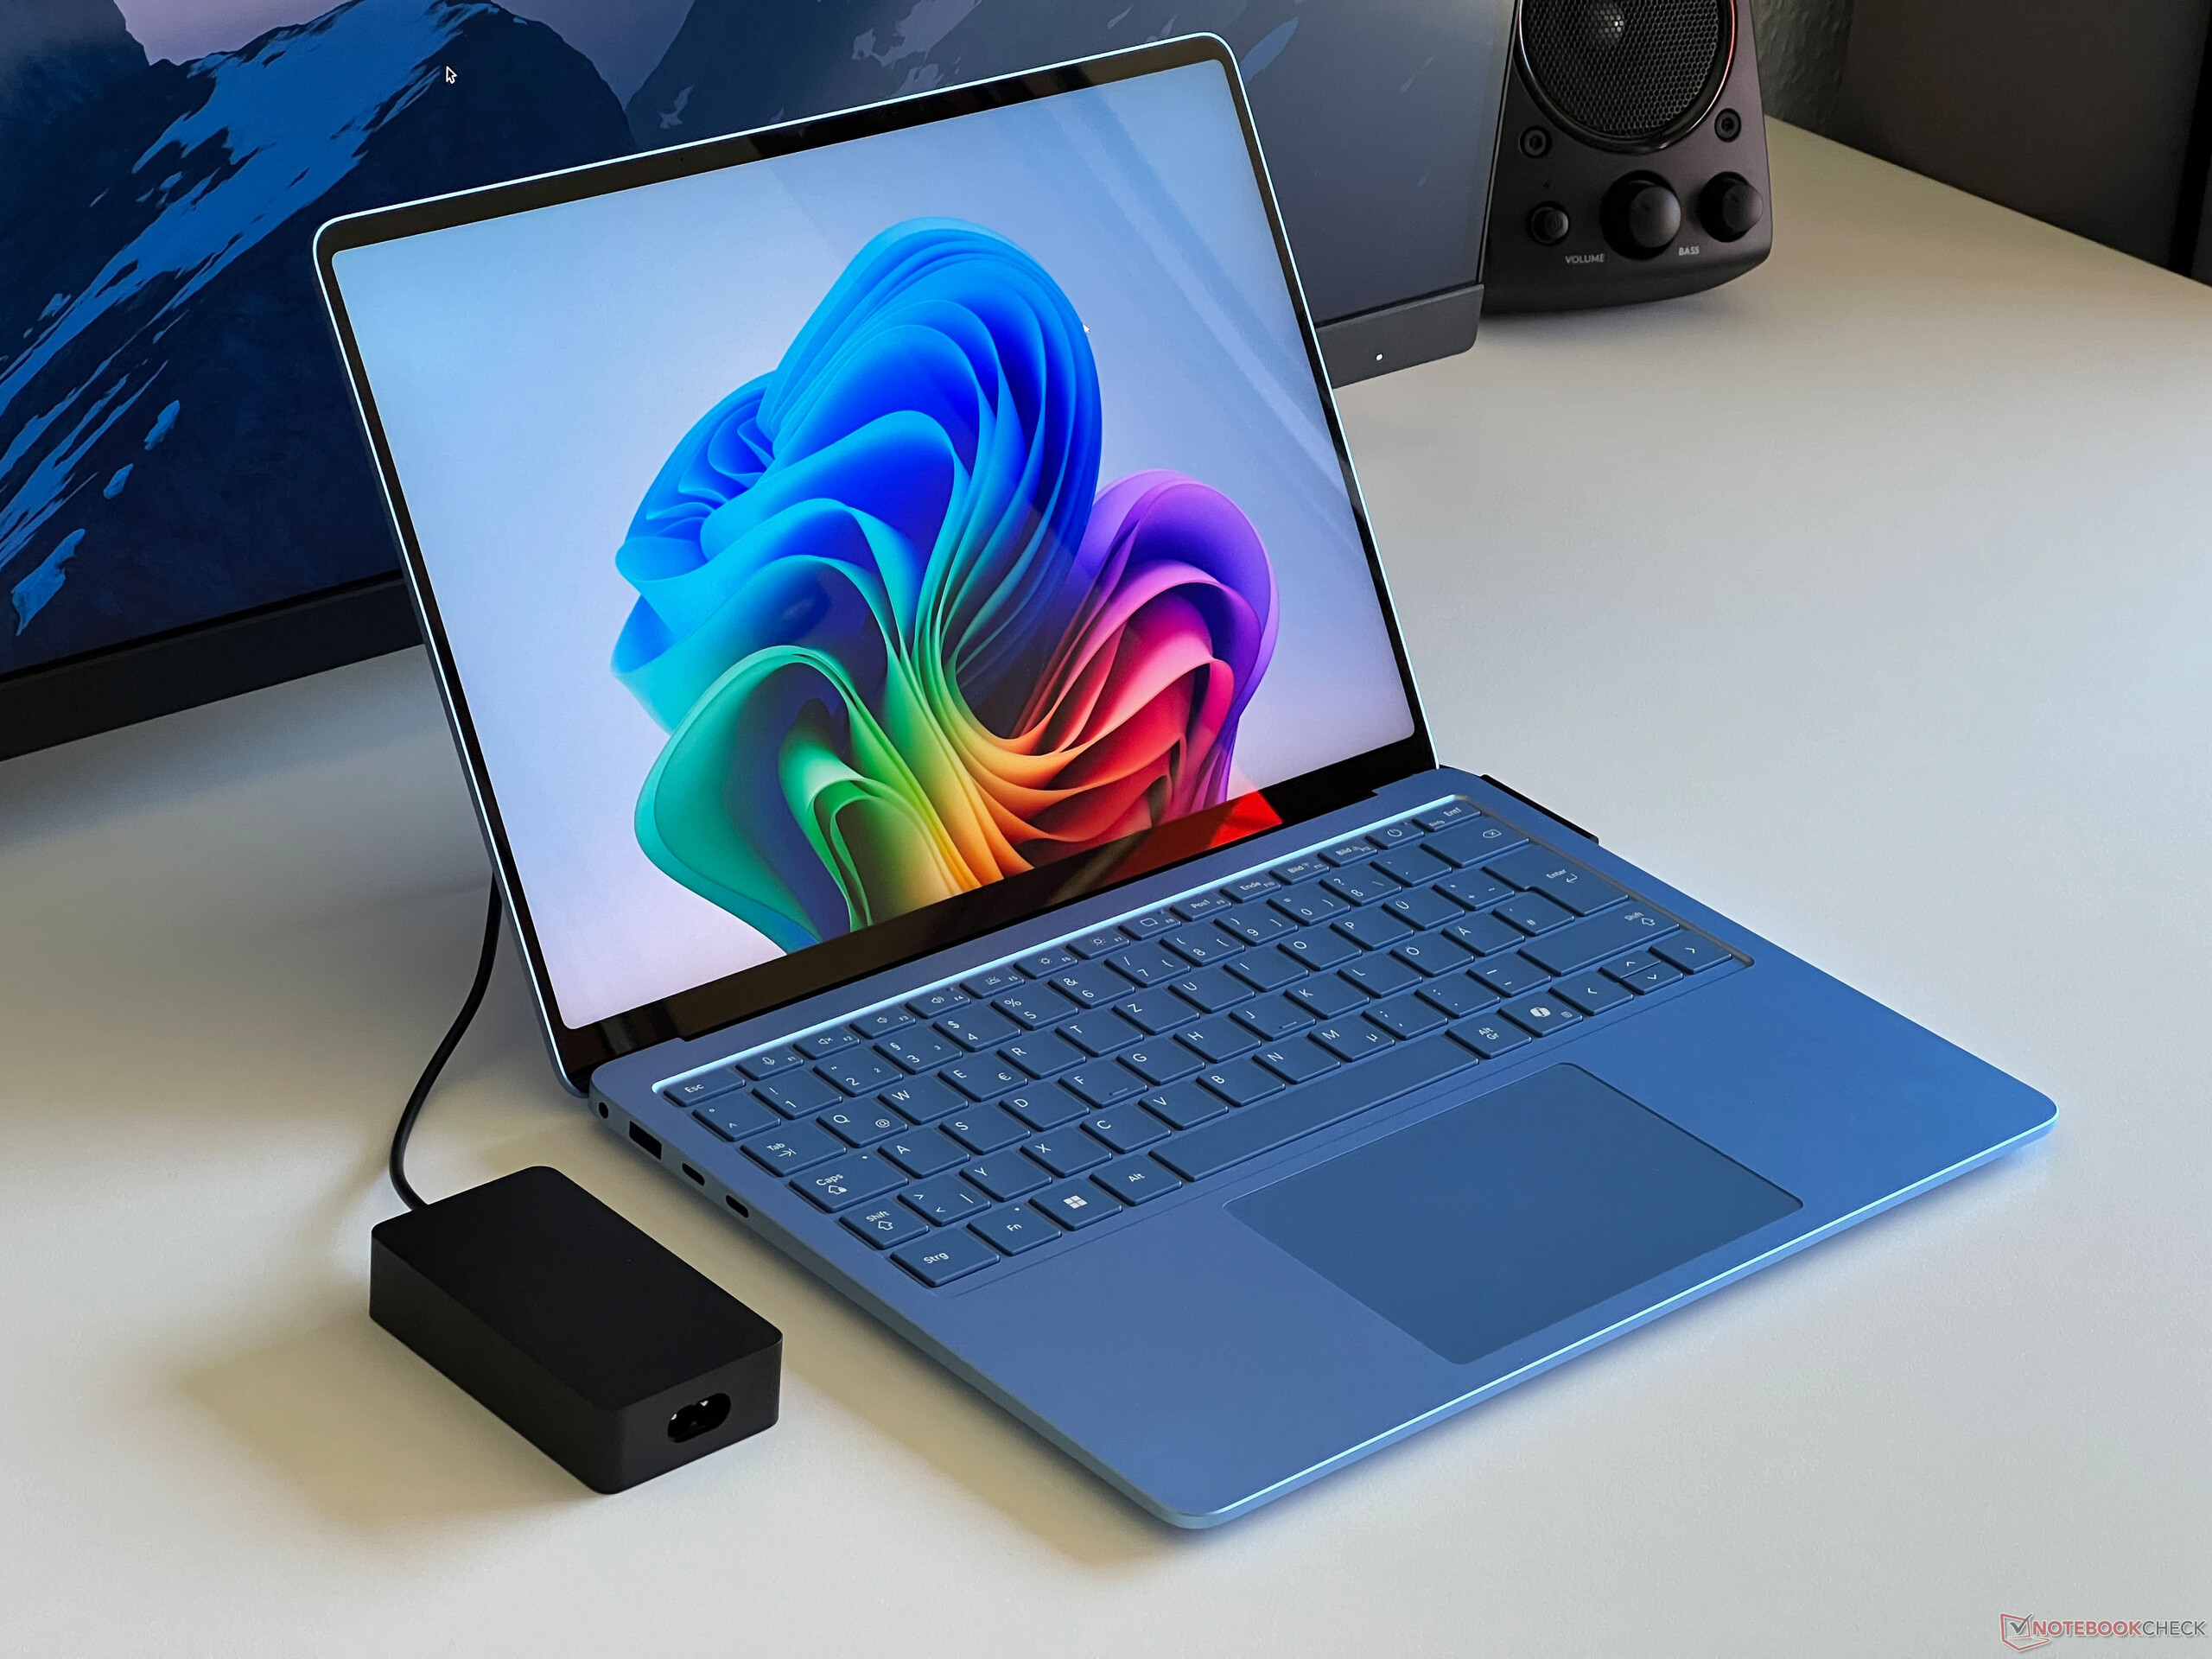
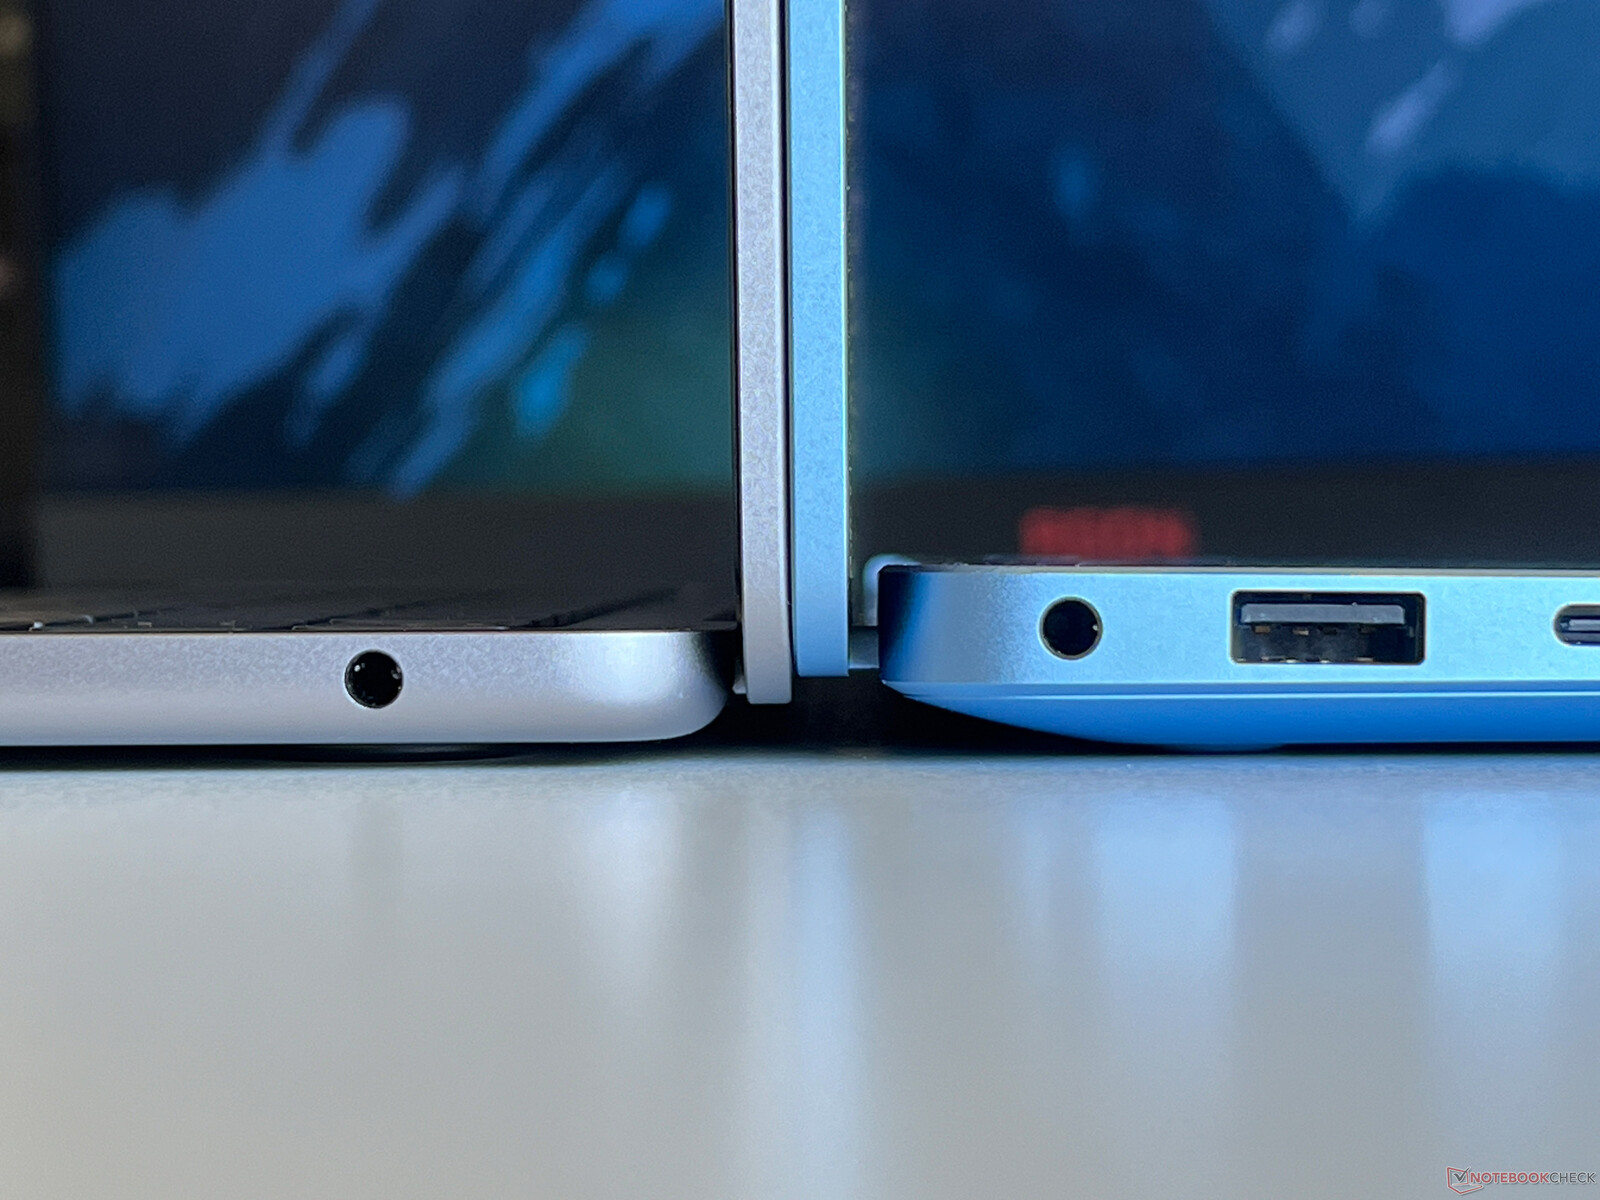
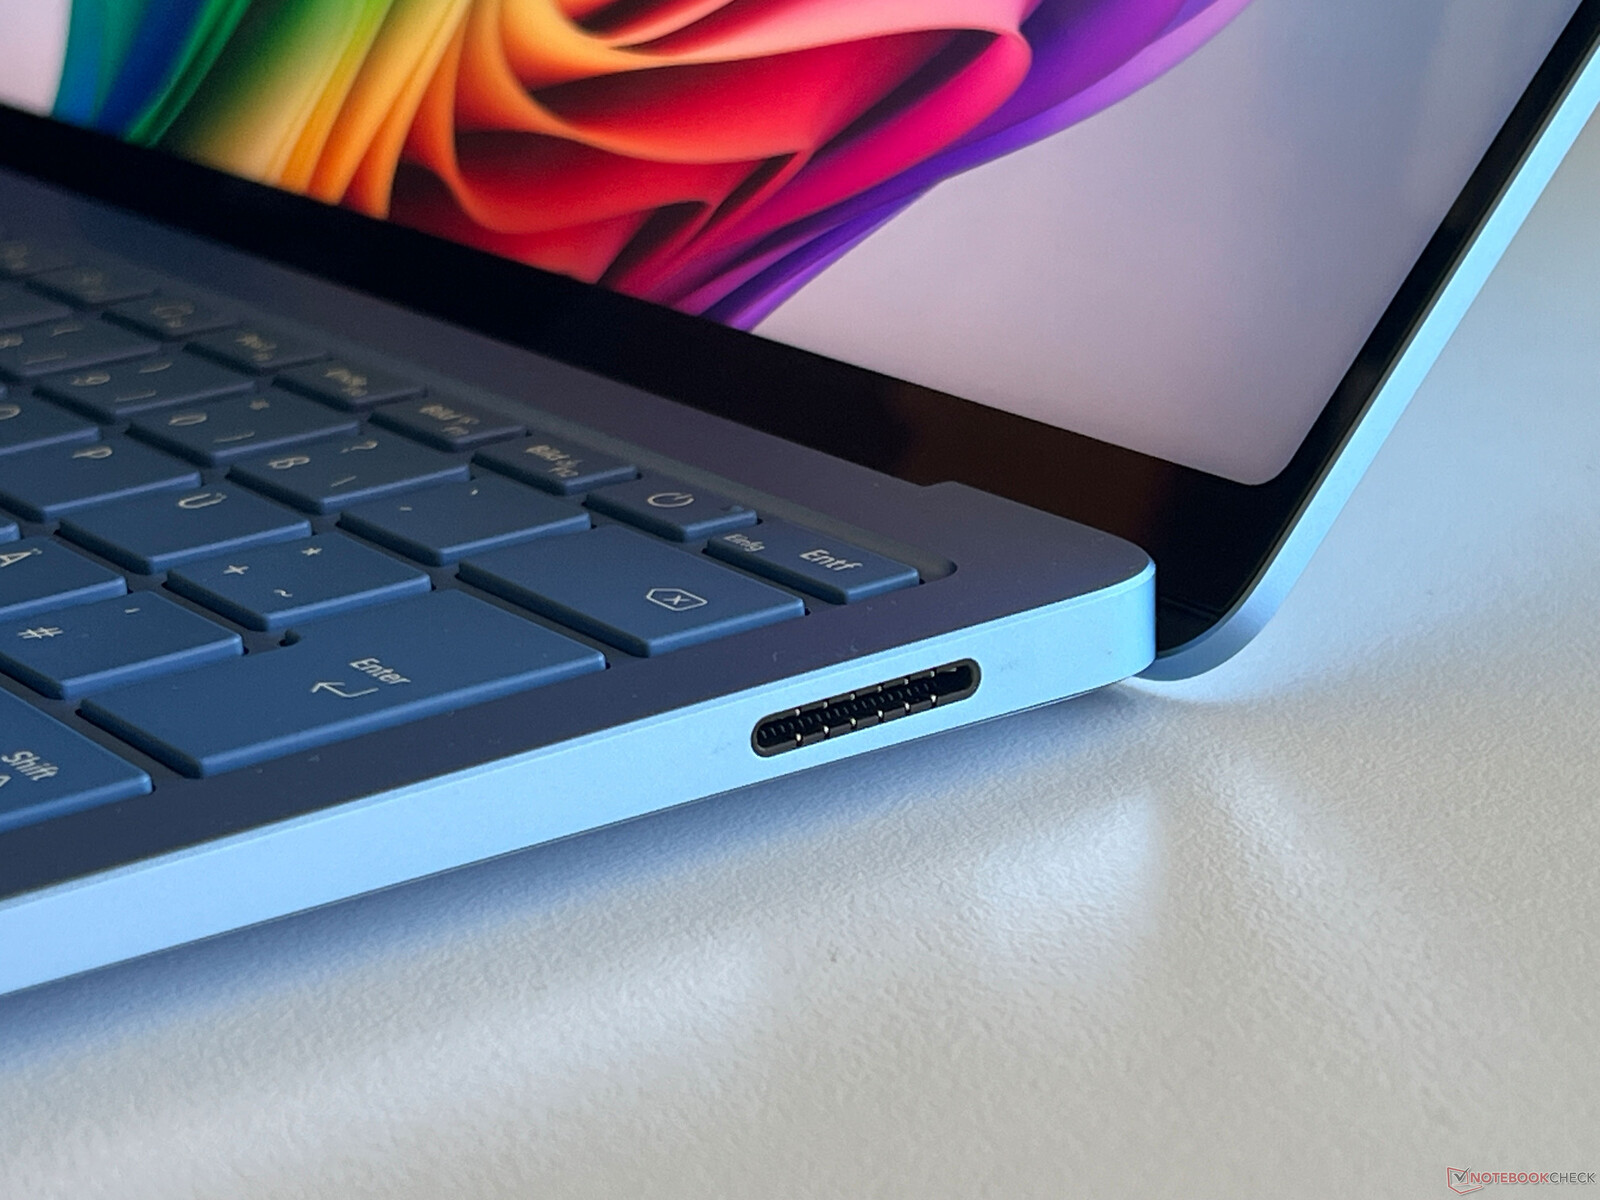
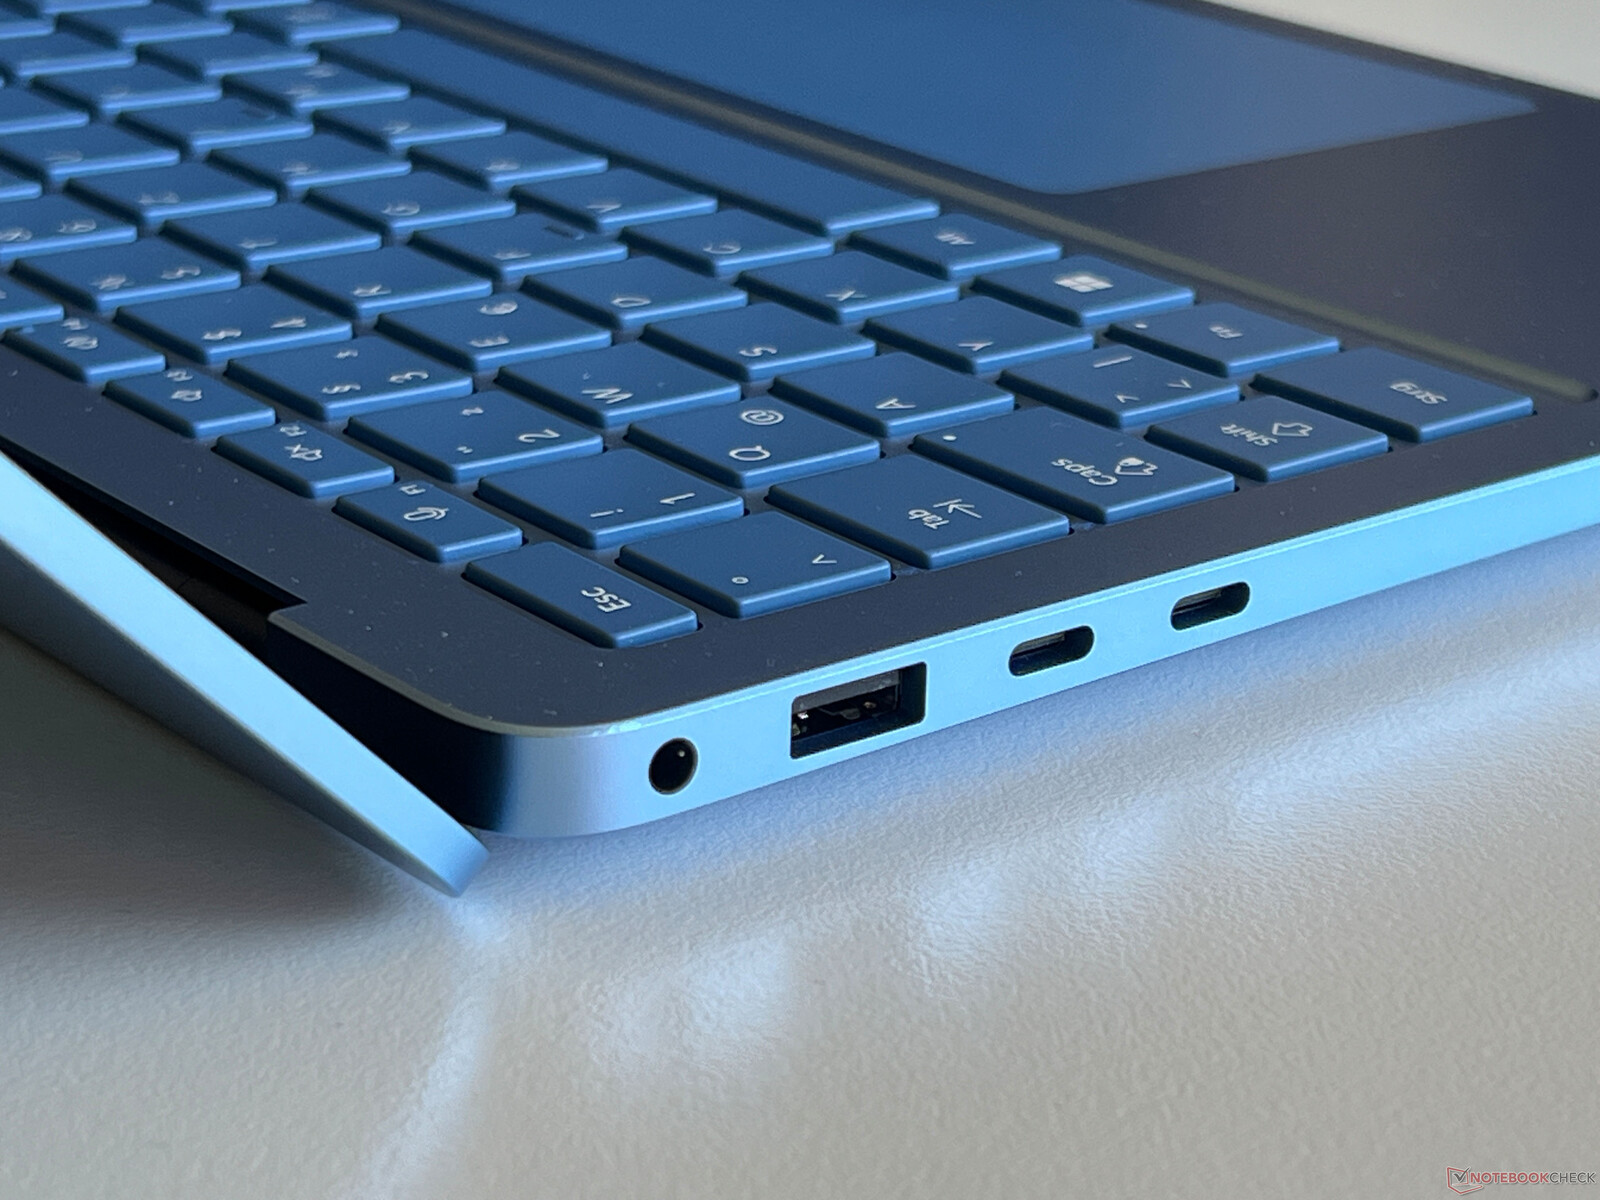
微软继续选择 Surface Connect 端口,设备也可以通过该端口进行充电(也可以通过 USB-C 充电)。此外,还有两个 USB 4.0 接口和一个普通的 USB-A 端口。不过,您将不得不放弃读卡器。
交流
骁龙处理器配备的 FastConnect 7800 Wi-Fi 模块还支持新的 Wi-Fi 7 标准和蓝牙 5.4。在我们使用华硕参考路由器进行的评测中,传输速度高且稳定,但发送性能不如 MacBook Air或 ThinkBook 13x.
| Networking | |
| Microsoft Surface Laptop 7 13.8 Copilot+ | |
| iperf3 transmit AXE11000 | |
| iperf3 receive AXE11000 | |
| iperf3 transmit AXE11000 6GHz | |
| iperf3 receive AXE11000 6GHz | |
| Lenovo ThinkBook 13x G4 21KR0008GE | |
| iperf3 transmit AXE11000 | |
| iperf3 receive AXE11000 | |
| Dell XPS 13 9340 Core Ultra 7 | |
| iperf3 transmit AXE11000 | |
| iperf3 receive AXE11000 | |
| Apple MacBook Air 13 M3 10C GPU | |
| iperf3 transmit AXE11000 | |
| iperf3 receive AXE11000 | |
| Framework Laptop 13.5 Ryzen 7 7840U | |
| iperf3 transmit AXE11000 | |
| iperf3 receive AXE11000 | |
| iperf3 transmit AXE11000 6GHz | |
| iperf3 receive AXE11000 6GHz | |
| HP Dragonfly G4 | |
| iperf3 transmit AXE11000 | |
| iperf3 receive AXE11000 | |
| iperf3 transmit AXE11000 6GHz | |
| iperf3 receive AXE11000 6GHz | |
网络摄像头
微软采用的是 1080p 网络摄像头,当然也支持当前的 Studio Effects。从质量上看,效果还算不错,但无法与 Surface Pro 的出色摄像头相比。 Surface Pro2 合 1 的摄像头相比。虽然没有配备机械/电子快门,但有一个红外传感器用于通过 Windows Hello 进行人脸识别。


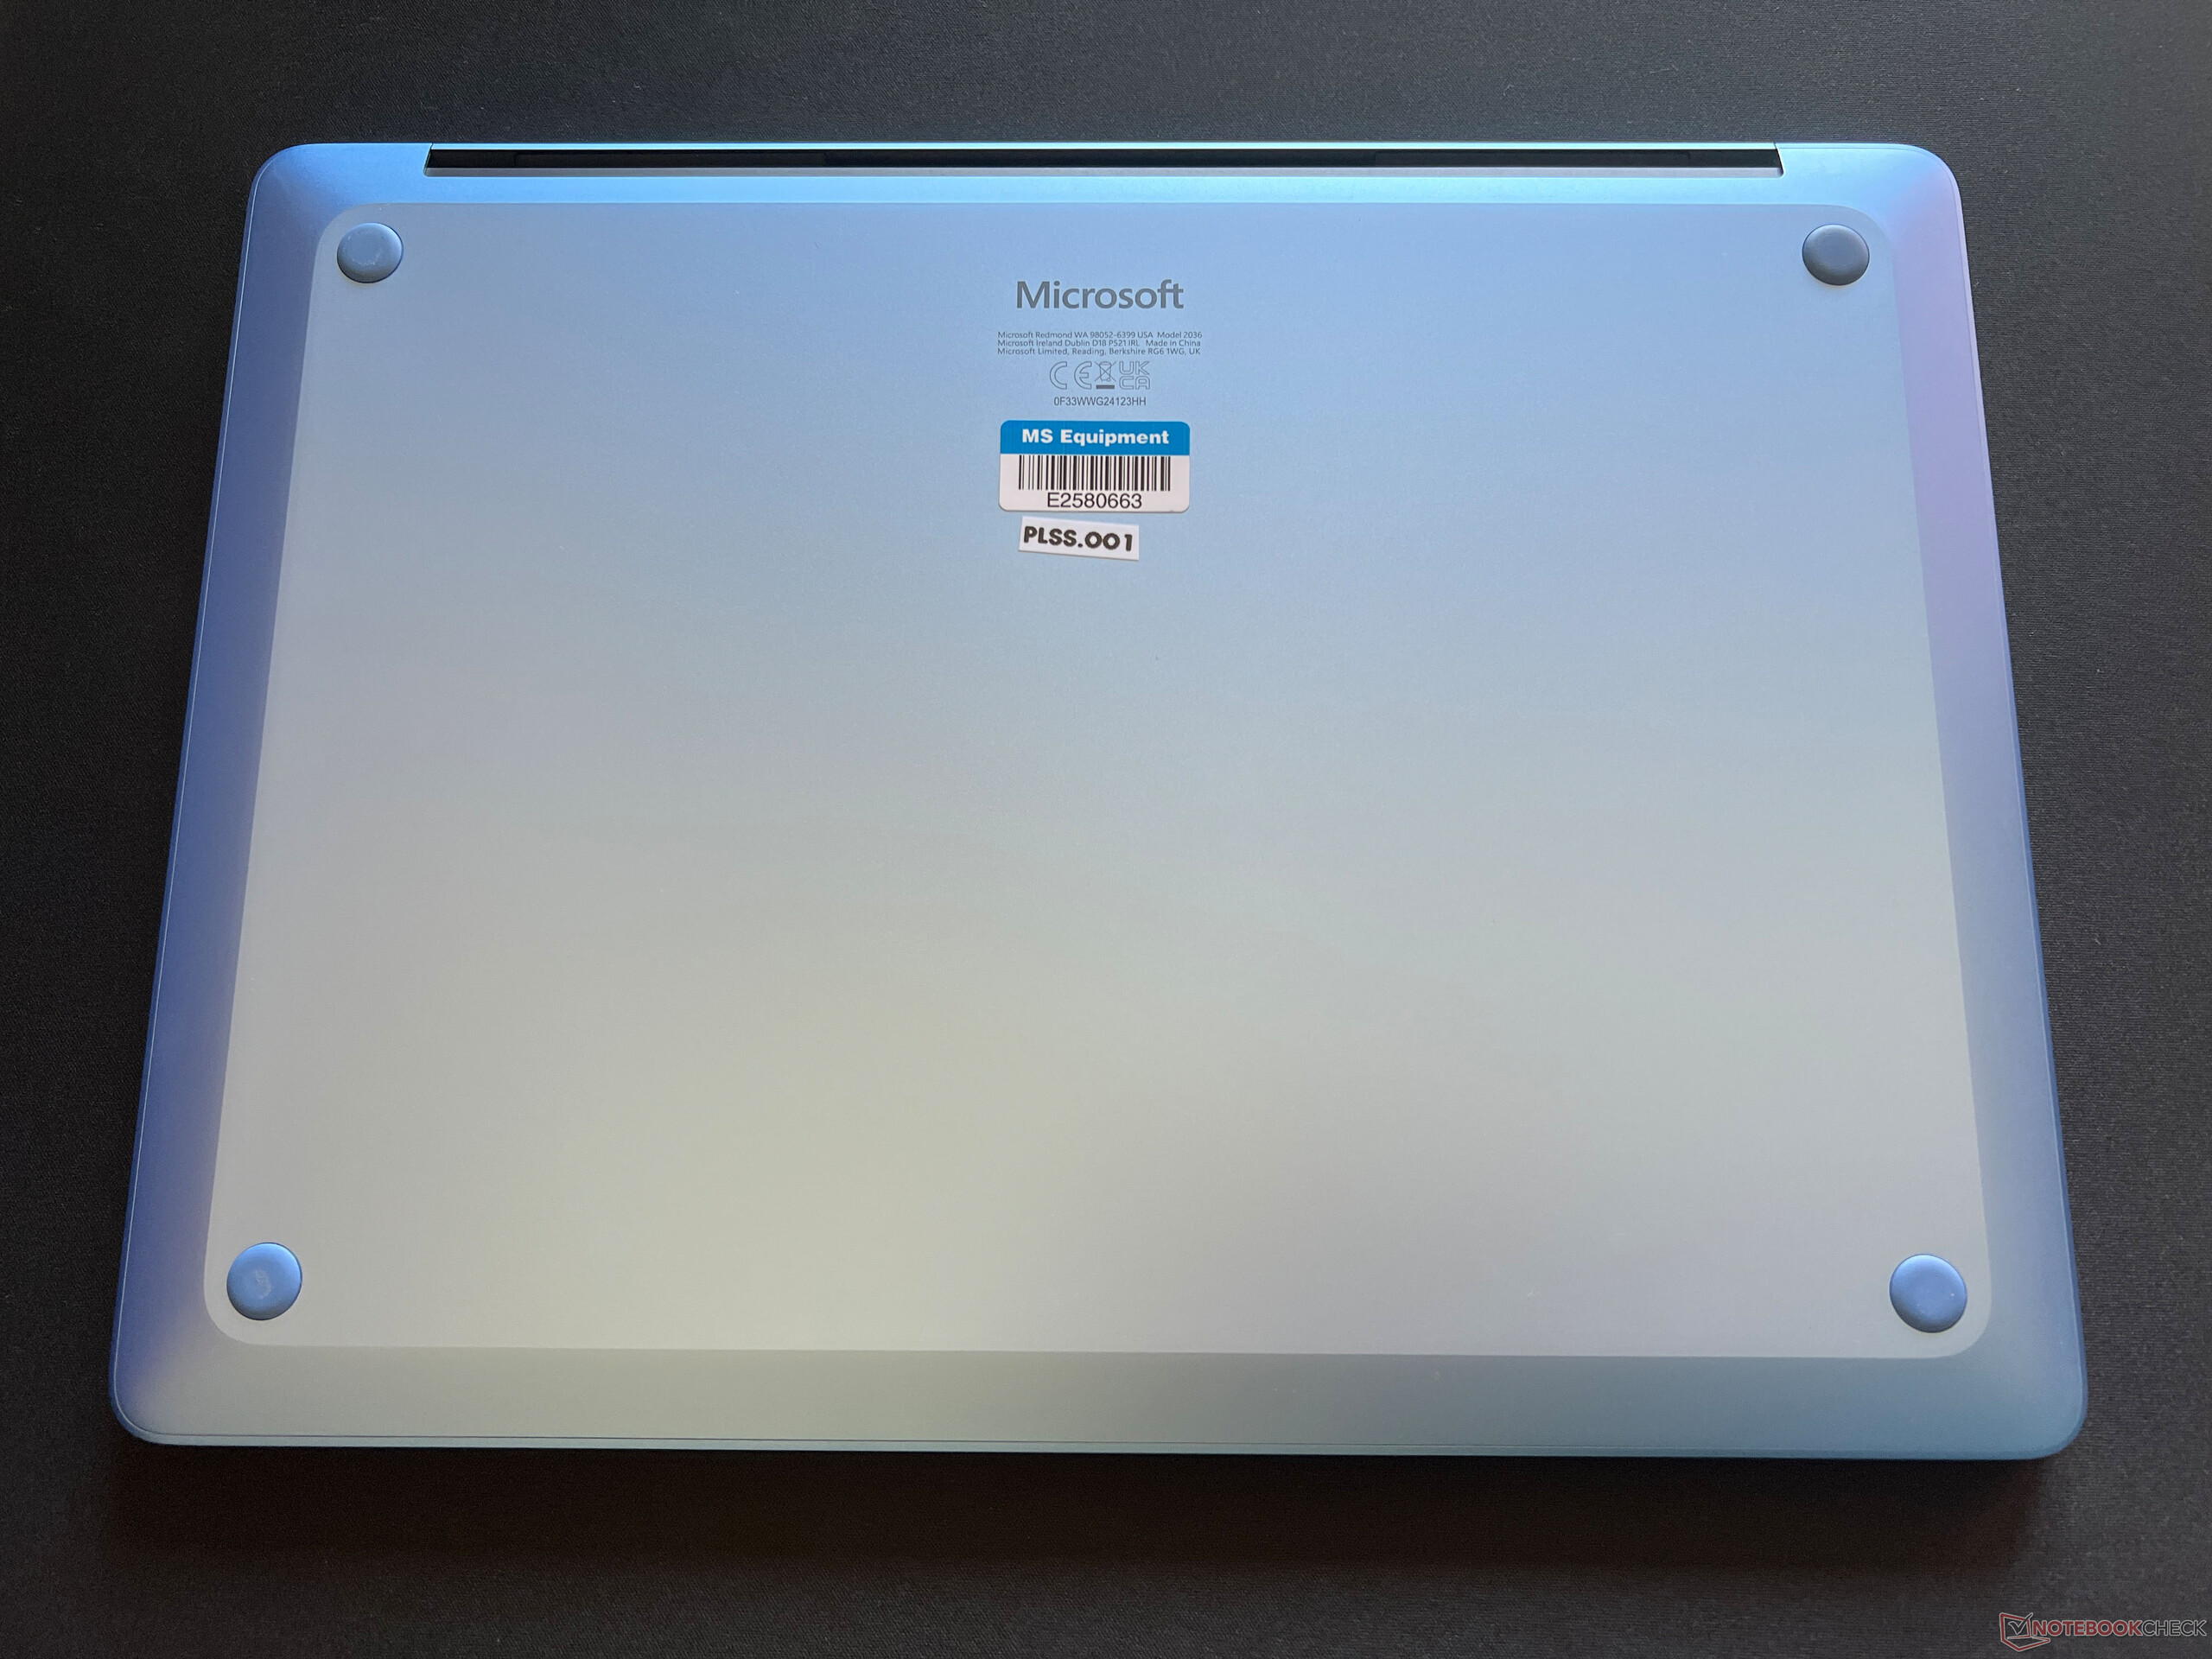
维护
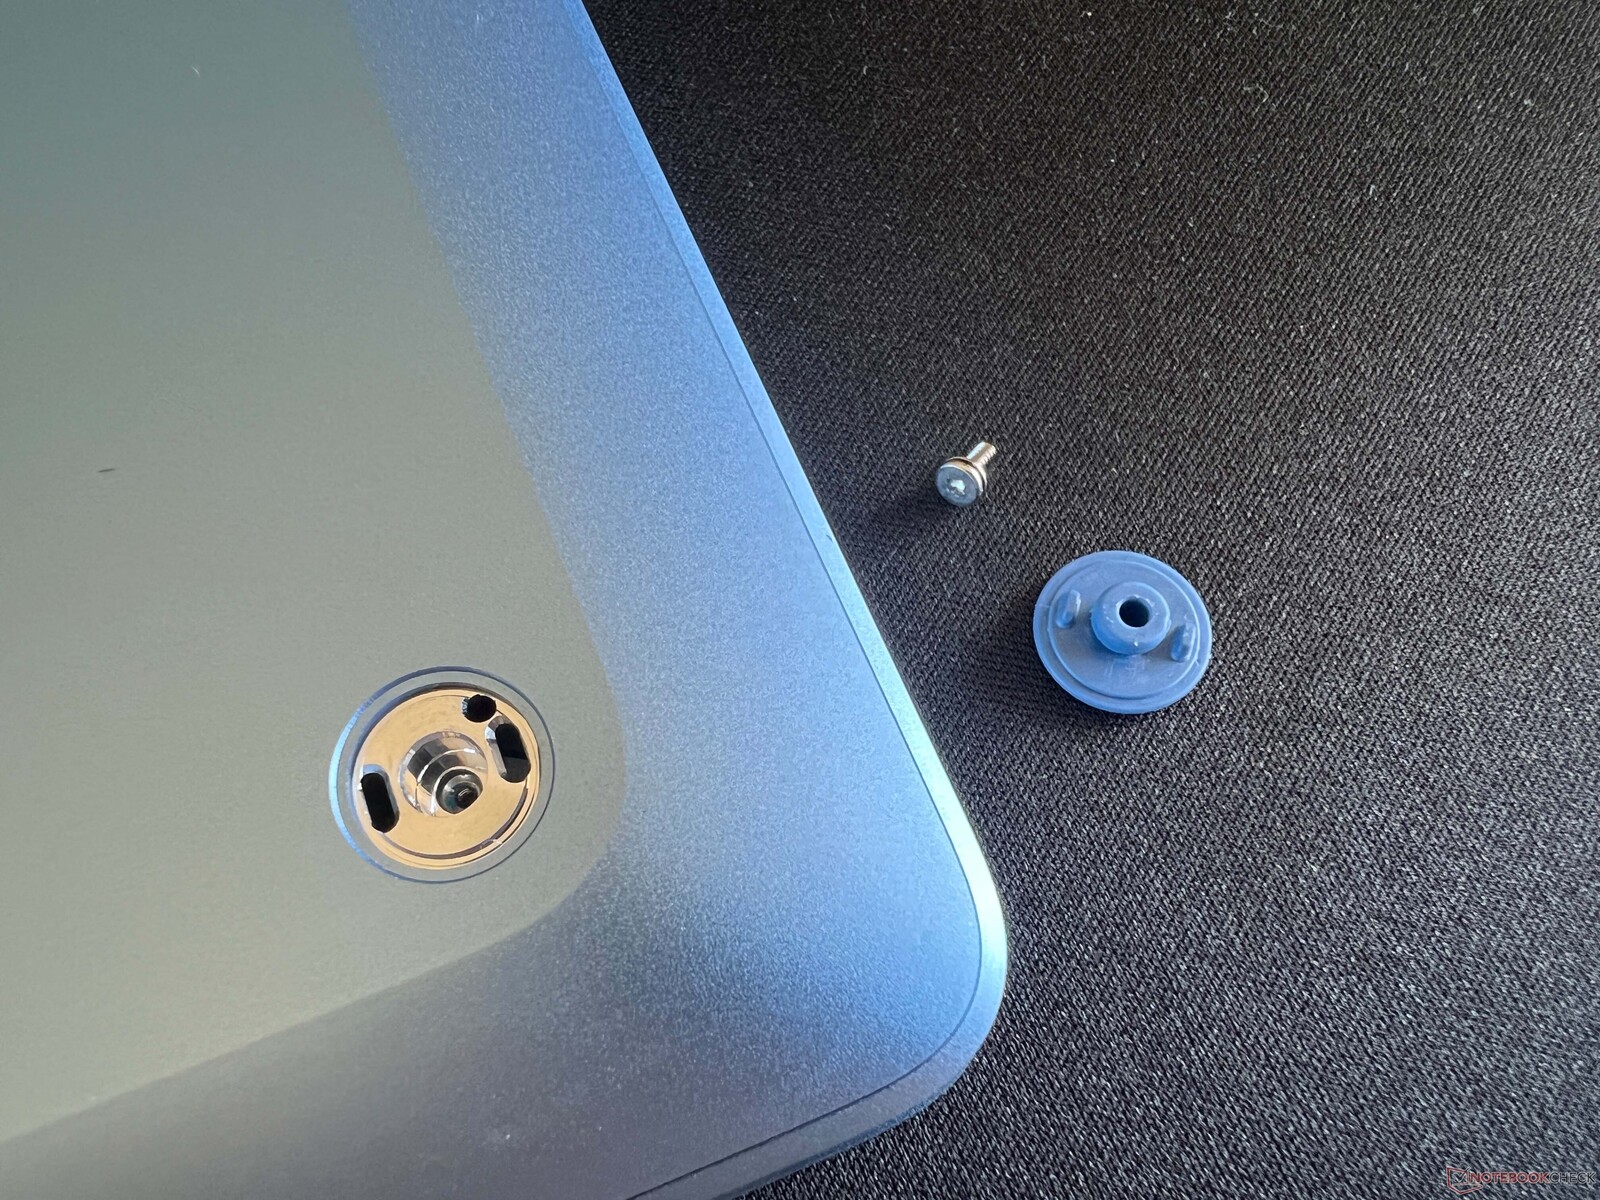
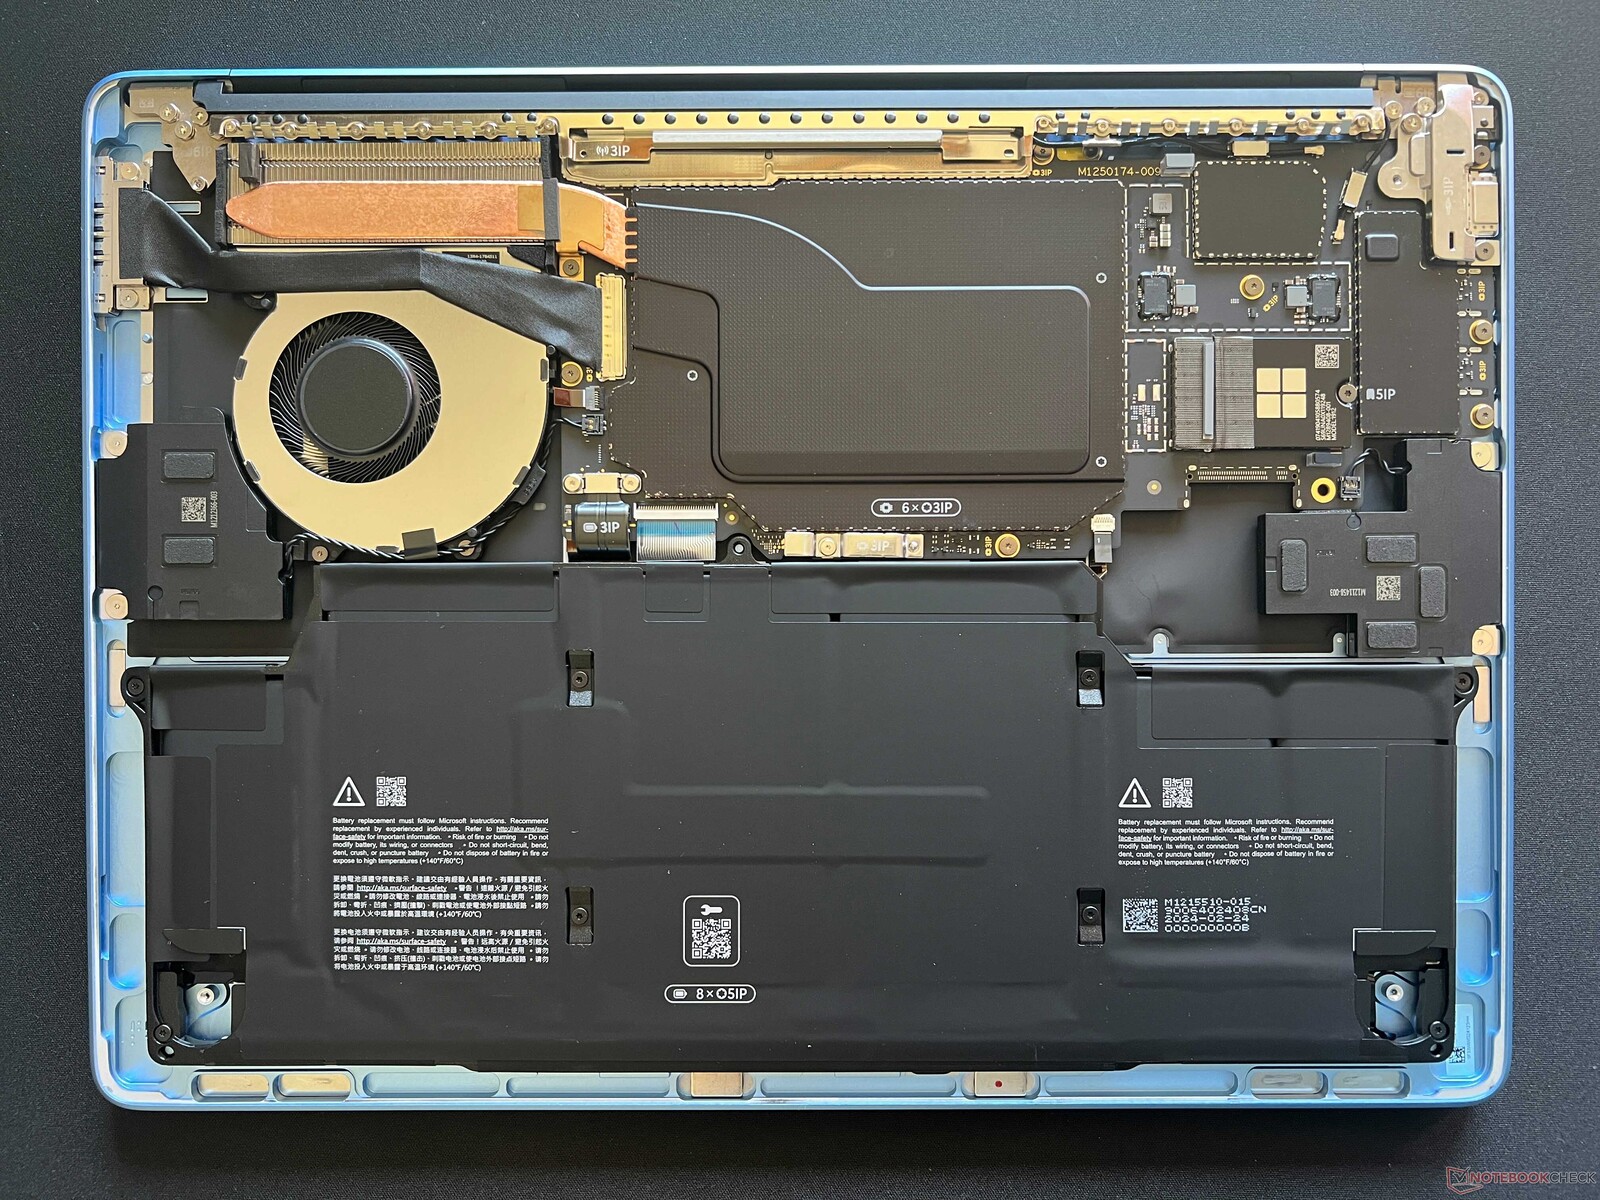
与旧款产品相比,Surface Laptop 7 的底座是用螺丝固定的,而不是用胶水粘合。四颗螺丝(Torx T5)隐藏在橡胶脚垫下,但很容易找到。在内部,风扇、电池和紧凑型 M.2 2230 固态硬盘也很容易接触到。不过,内存和 Wi-Fi 是焊接的。
保修
制造商提供 12 个月的保修服务。当然,在德国还有额外的两年法定保修。制造商以 Microsoft Complete 为名,提供两年、三年或四年(+ 149 美元、219 美元或 249 美元)的延长保修服务。当然,这也包括意外损坏。但不包括现场服务,这意味着设备必须送修。
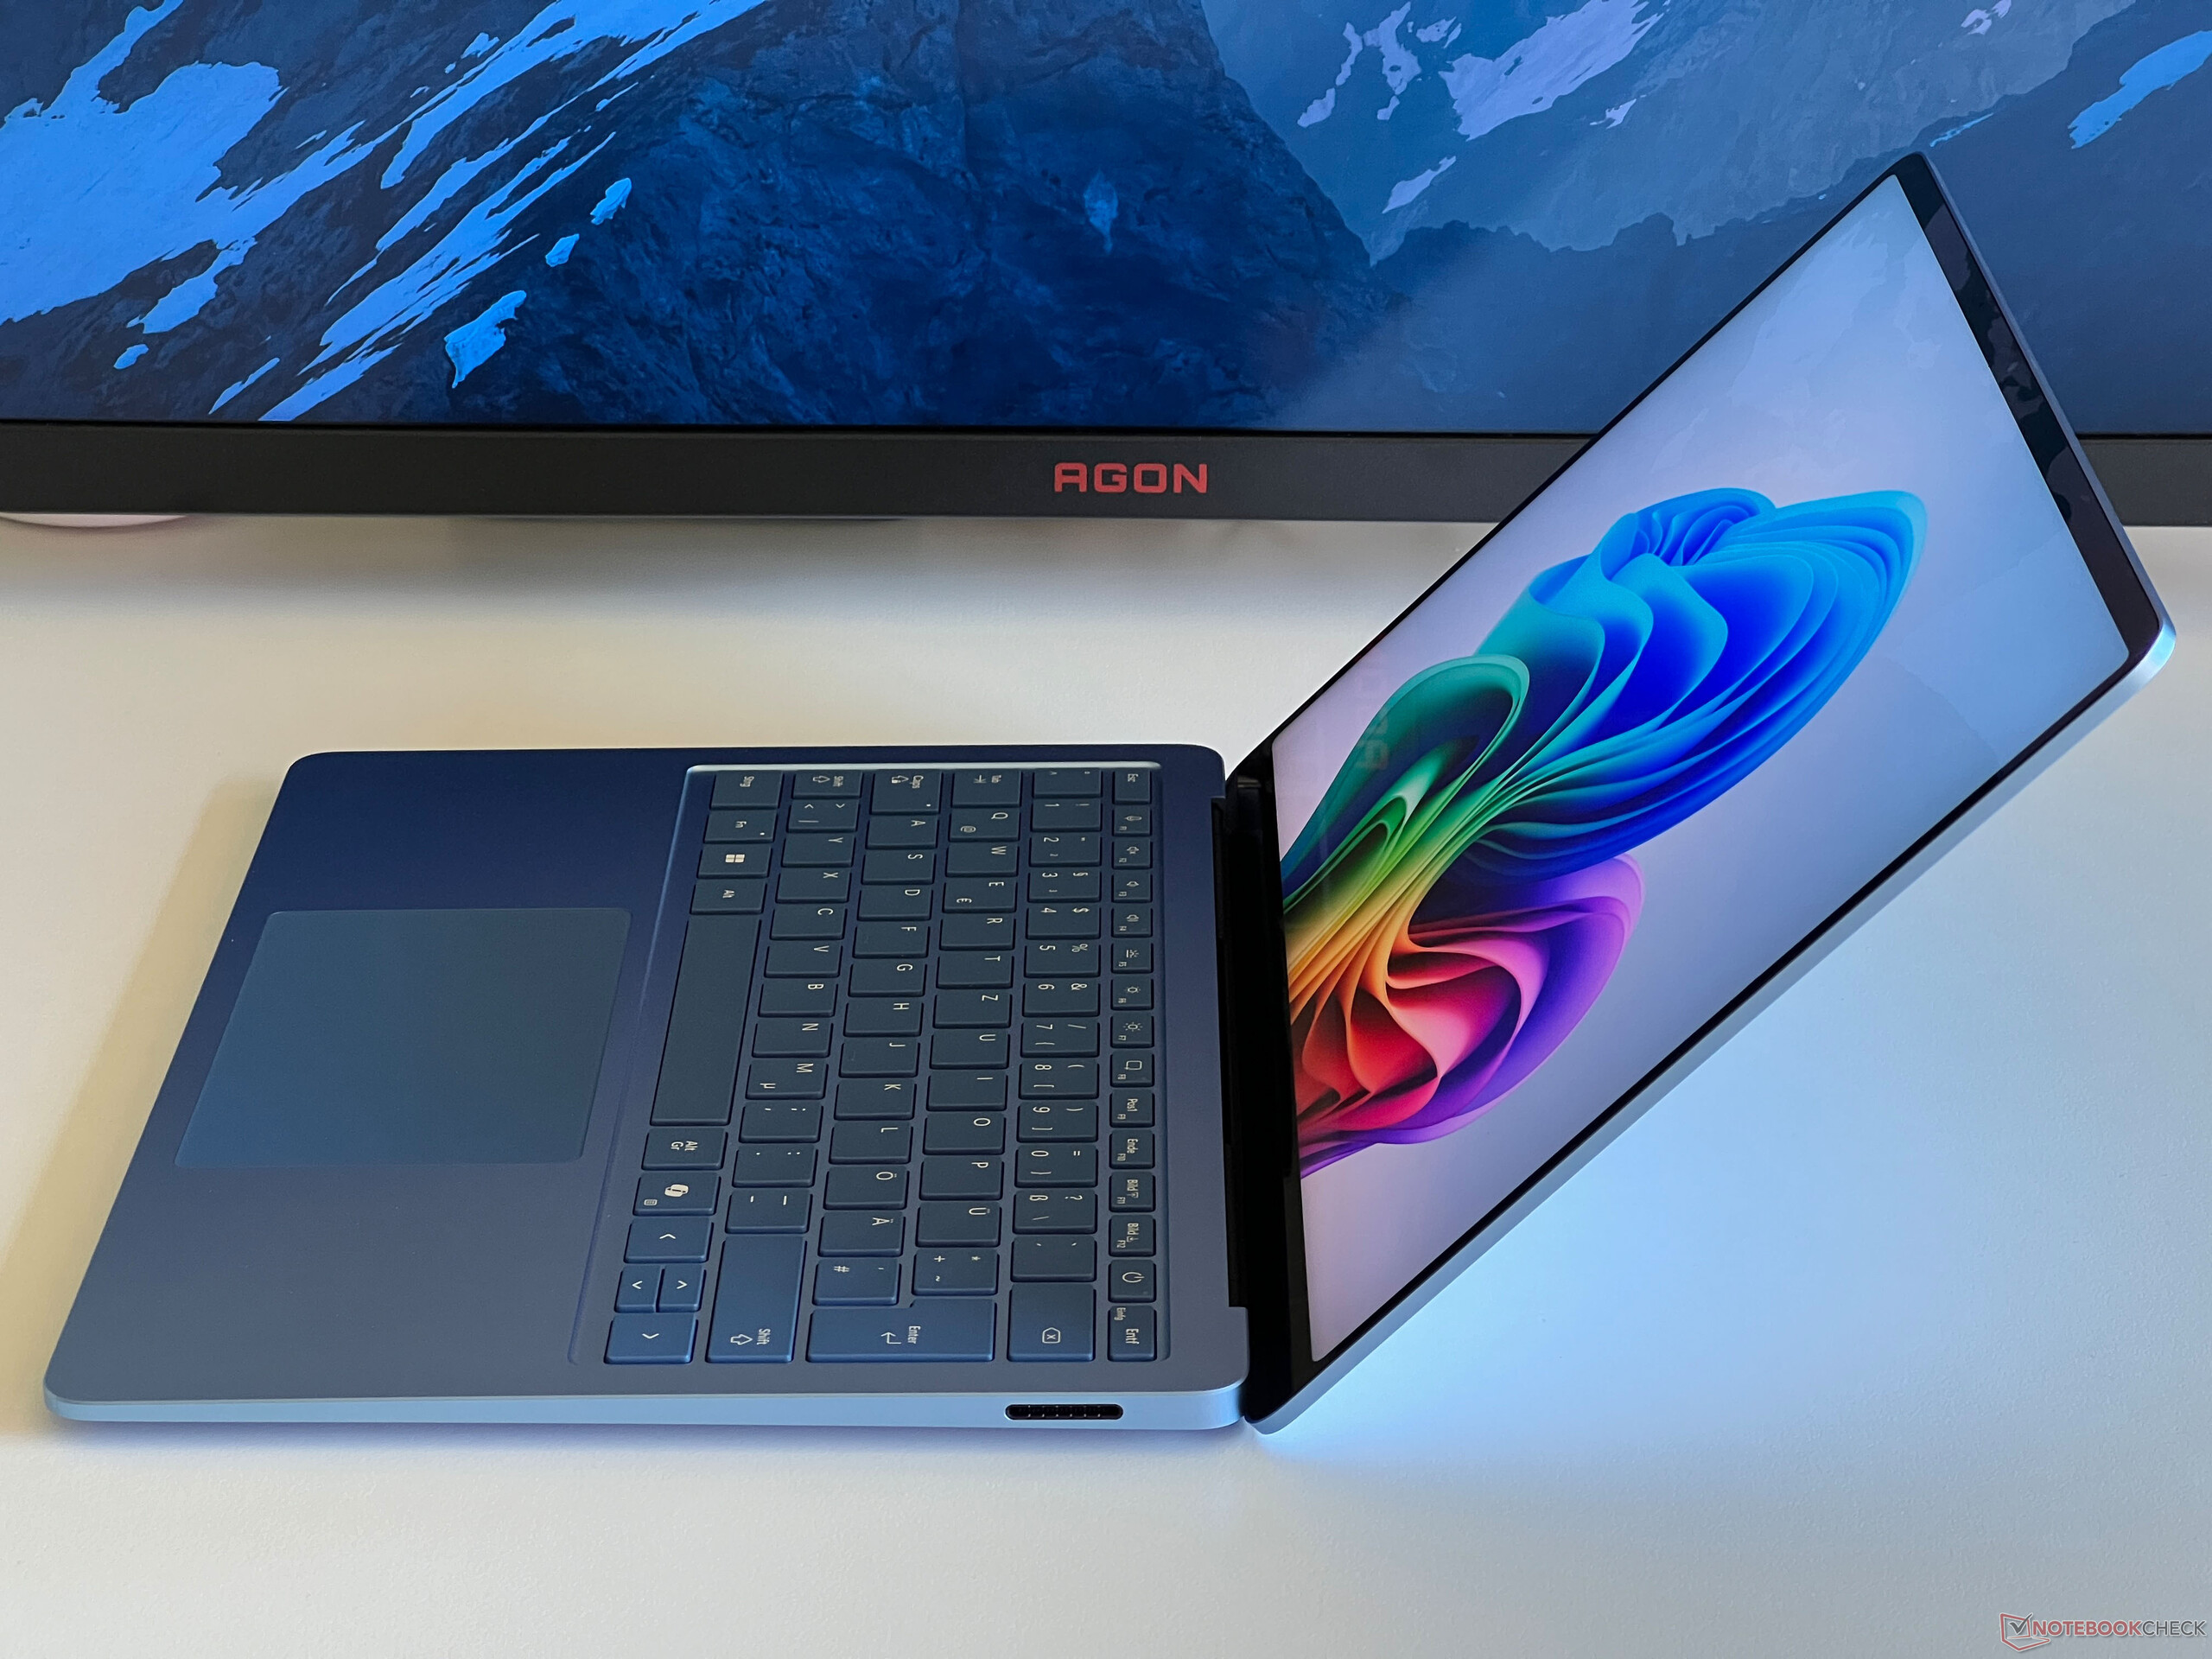
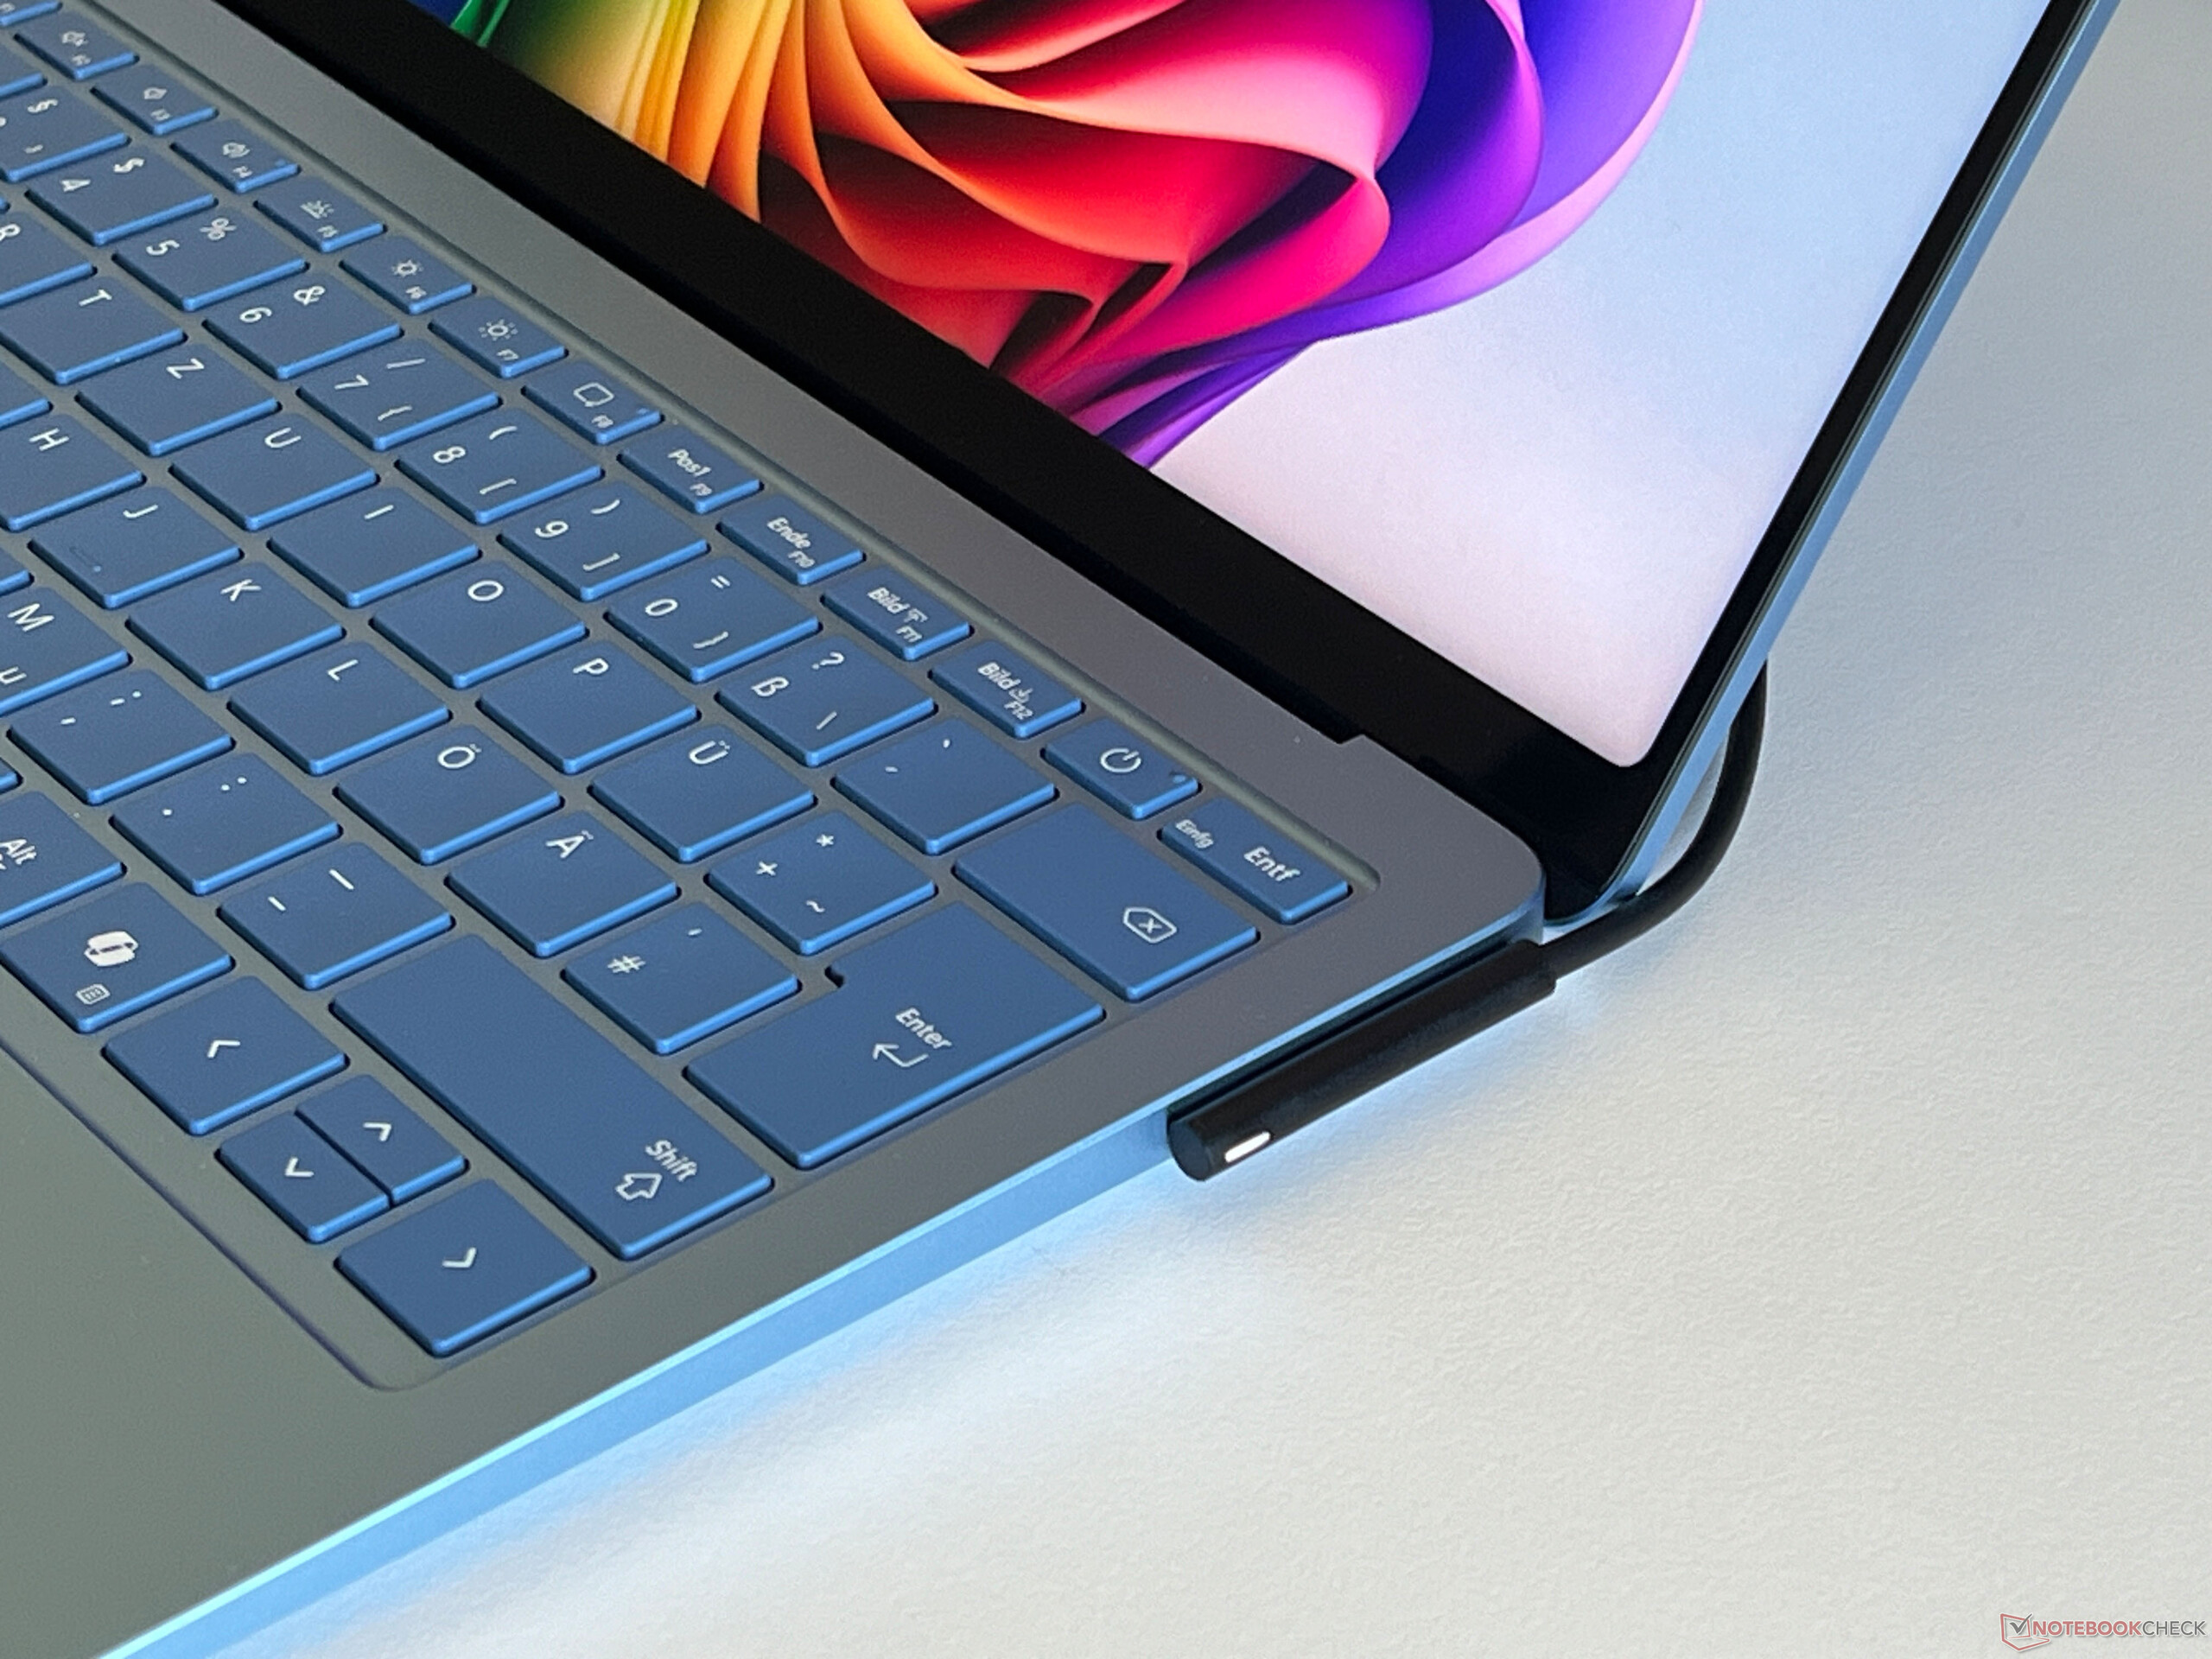
输入设备 - 触摸屏和触觉触摸板
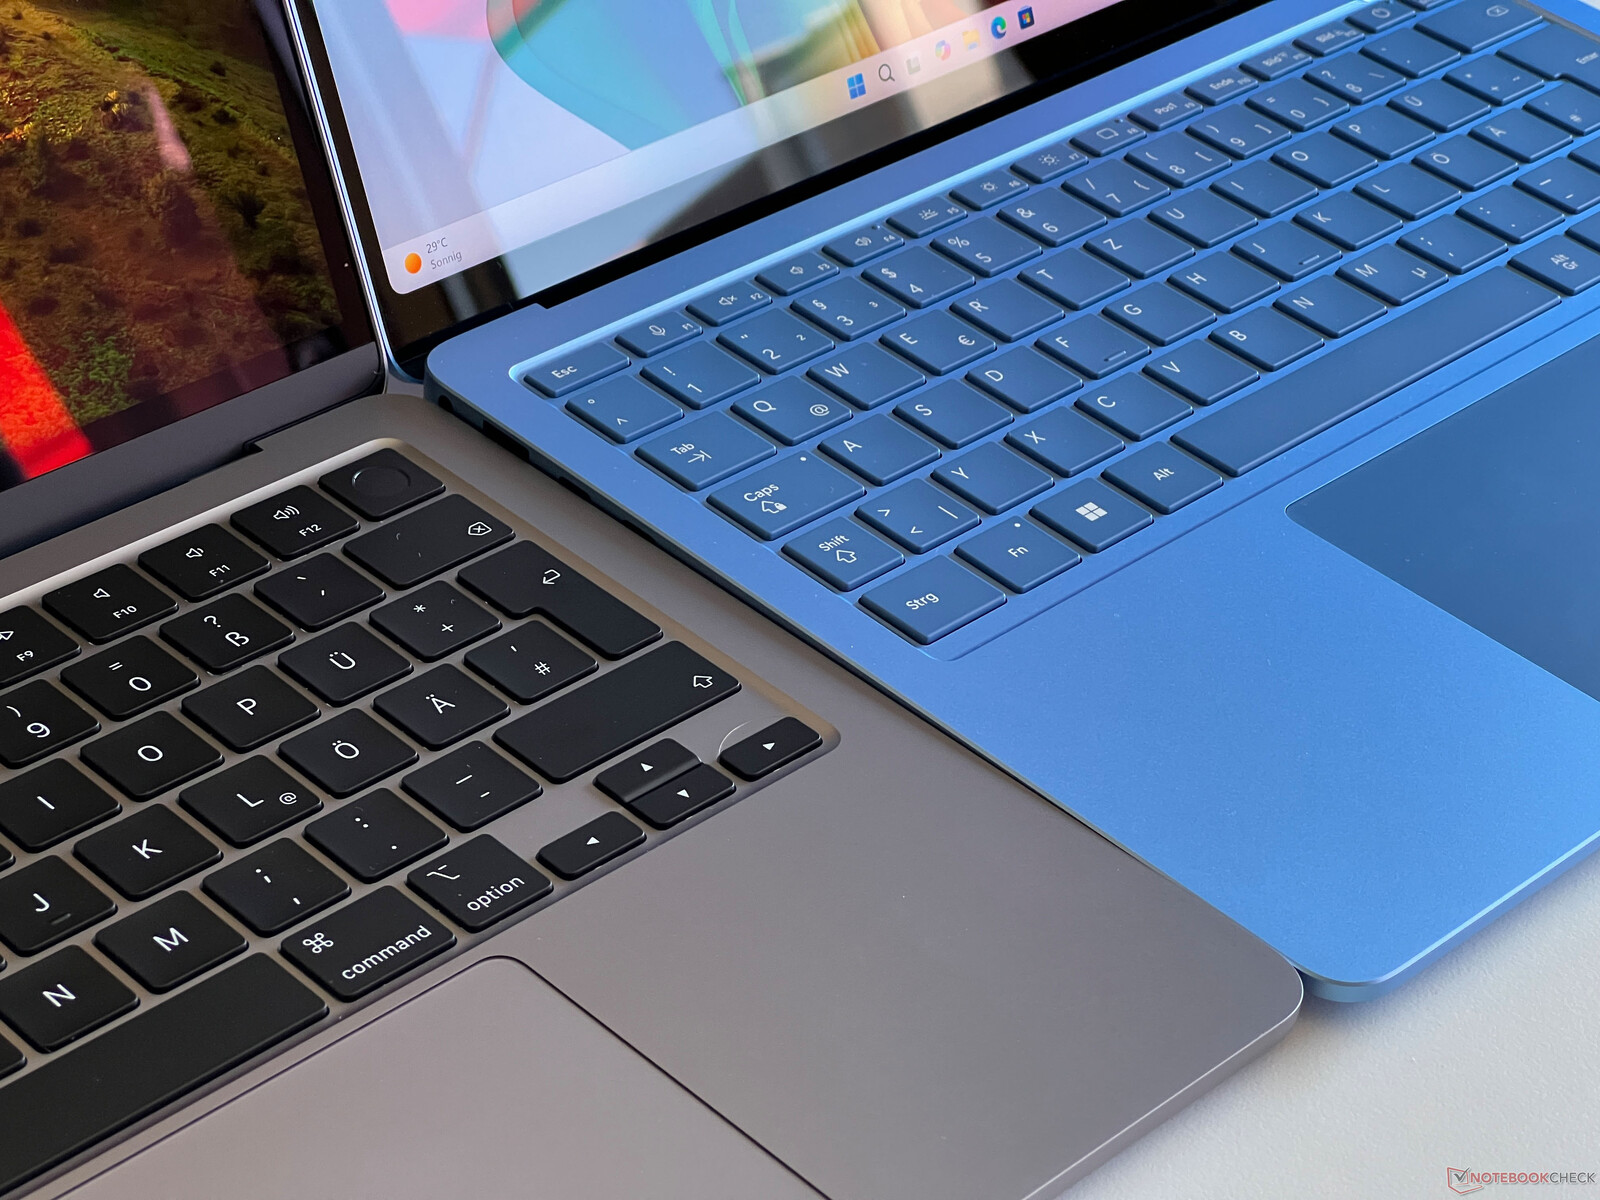
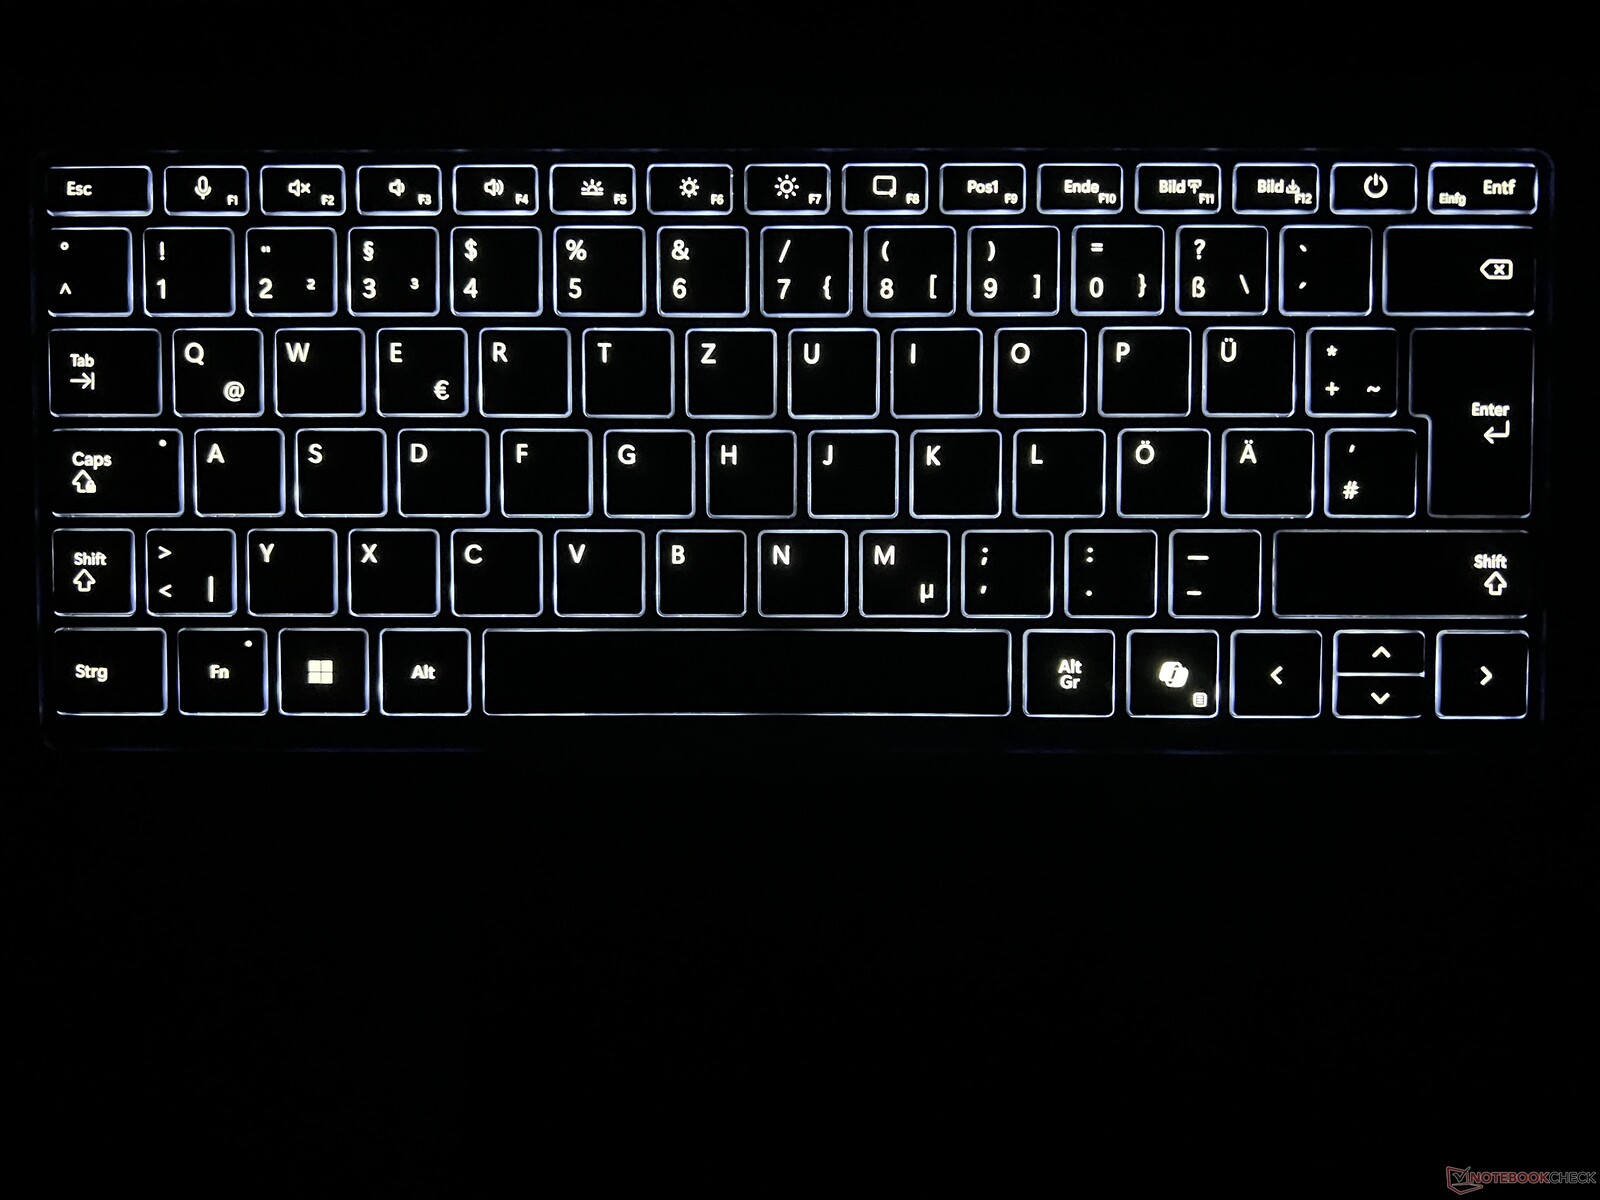
Surface Laptop 7 的键盘提供了舒适的键入体验。以前的机型键盘显得有些摇晃,但现在已不再如此。键程足够,压力点也很舒适,这意味着即使是较长的文本也能舒适地编译。虽然带有新 Copilot 按钮的布局没有带来任何惊喜,但方向键却非常小。白色背光有三个强度级别,但不能通过传感器自动激活。
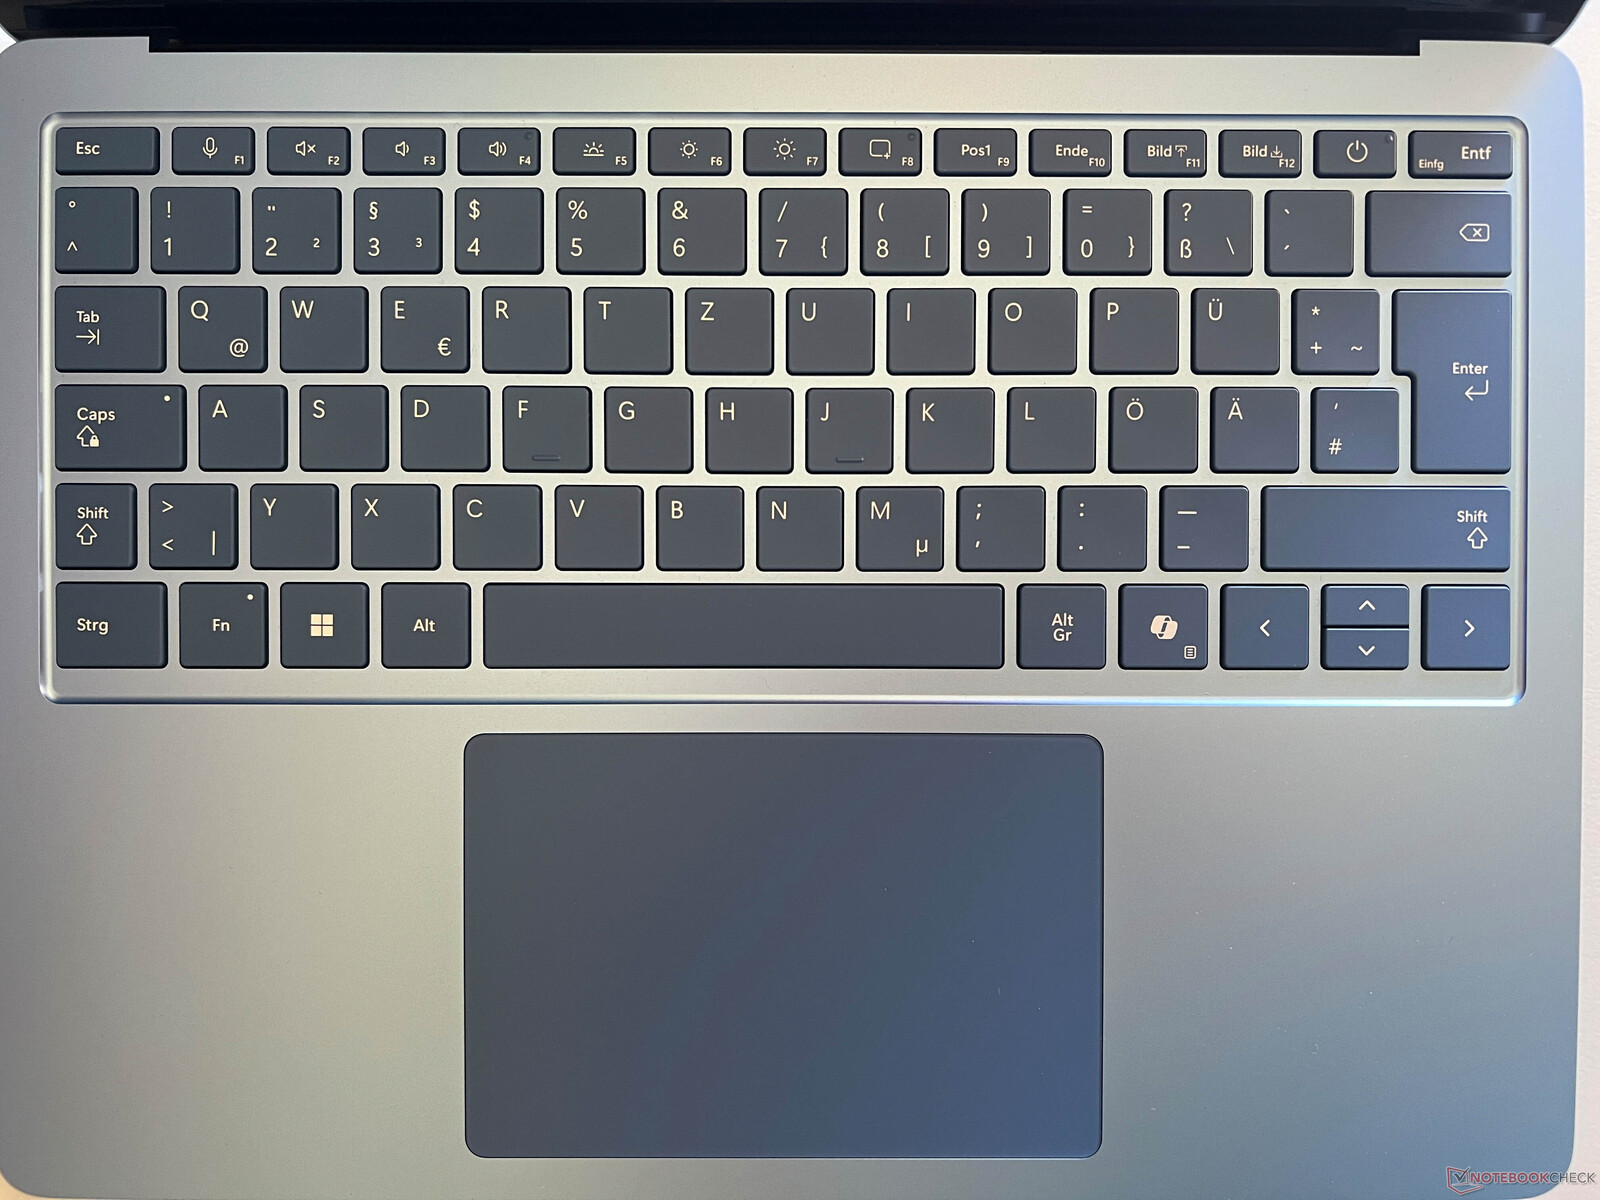
新款 Surface 笔记本电脑采用了 Surface Studio 2 中的触觉触摸板。它没有任何可移动部件,点击反馈是通过振动电机产生的。这意味着在任何地方点击触控板都会产生相同的反馈(非常安静)。在实际使用中,它与光滑的表面(12 x 8 厘米)配合得天衣无缝。此外,还有一个电容式触摸屏,可以完美地工作。
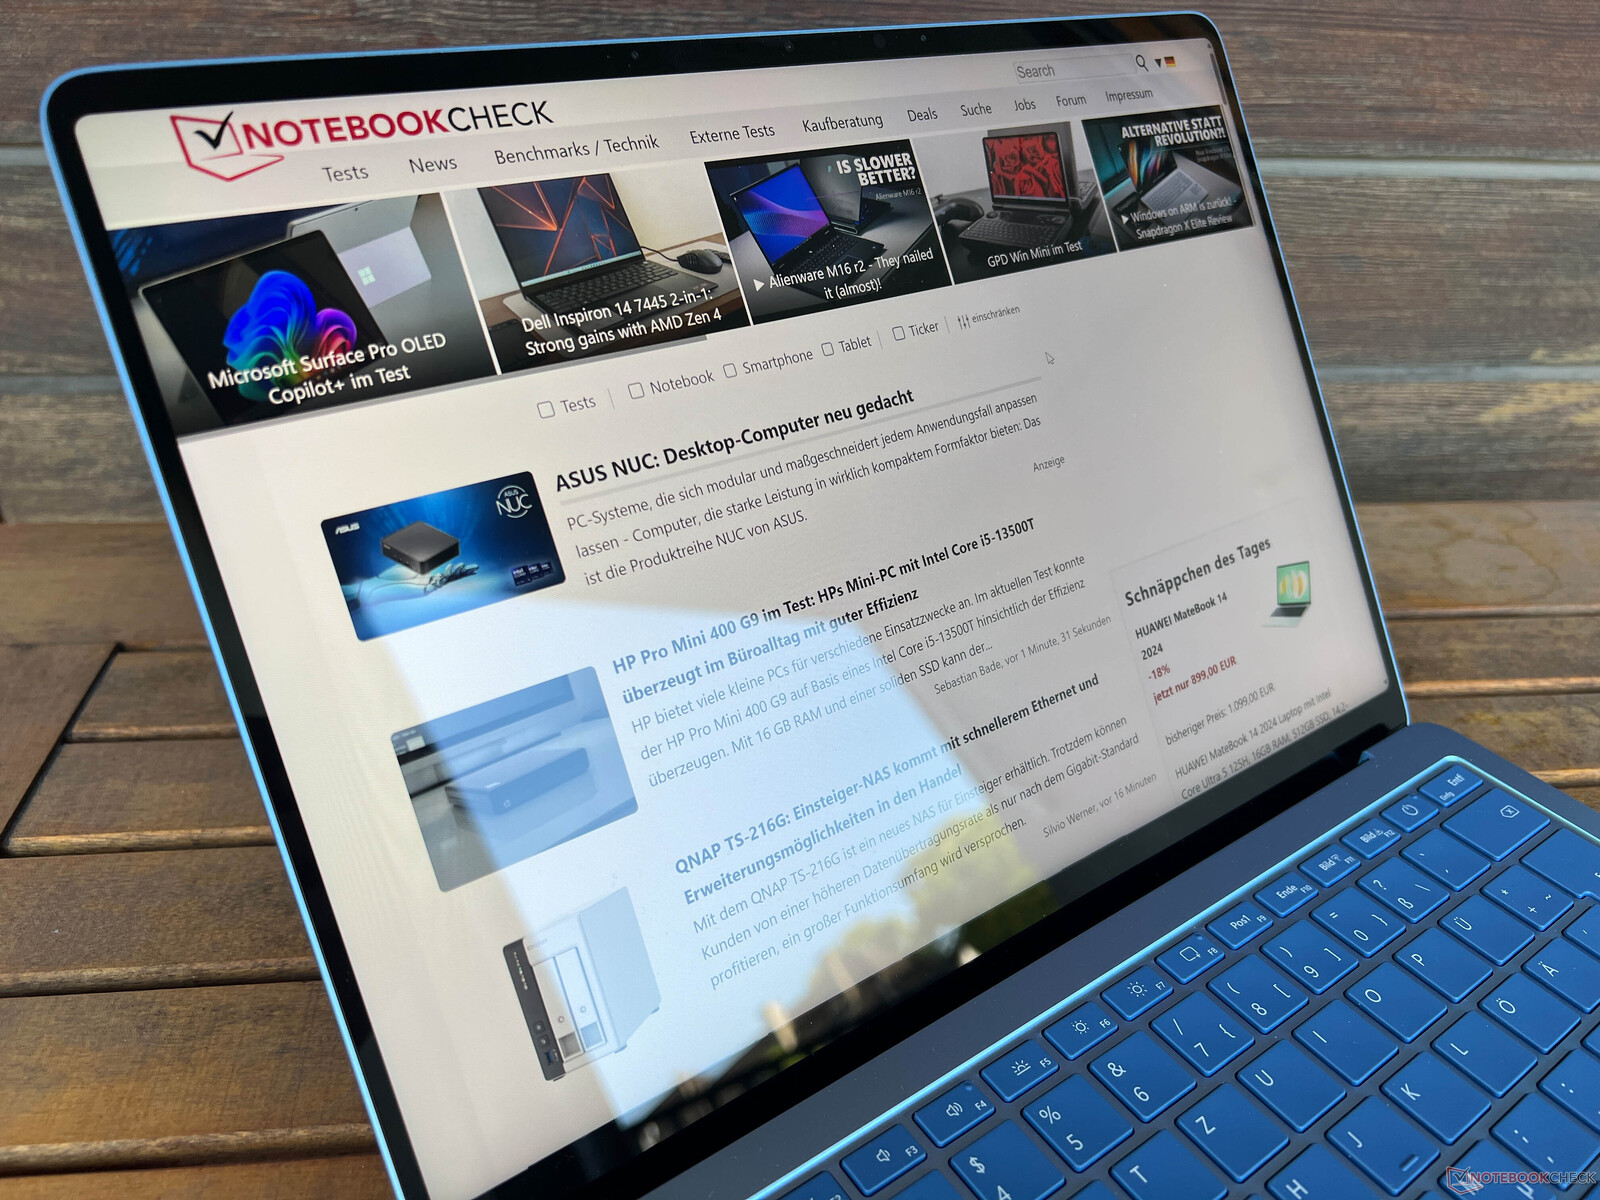
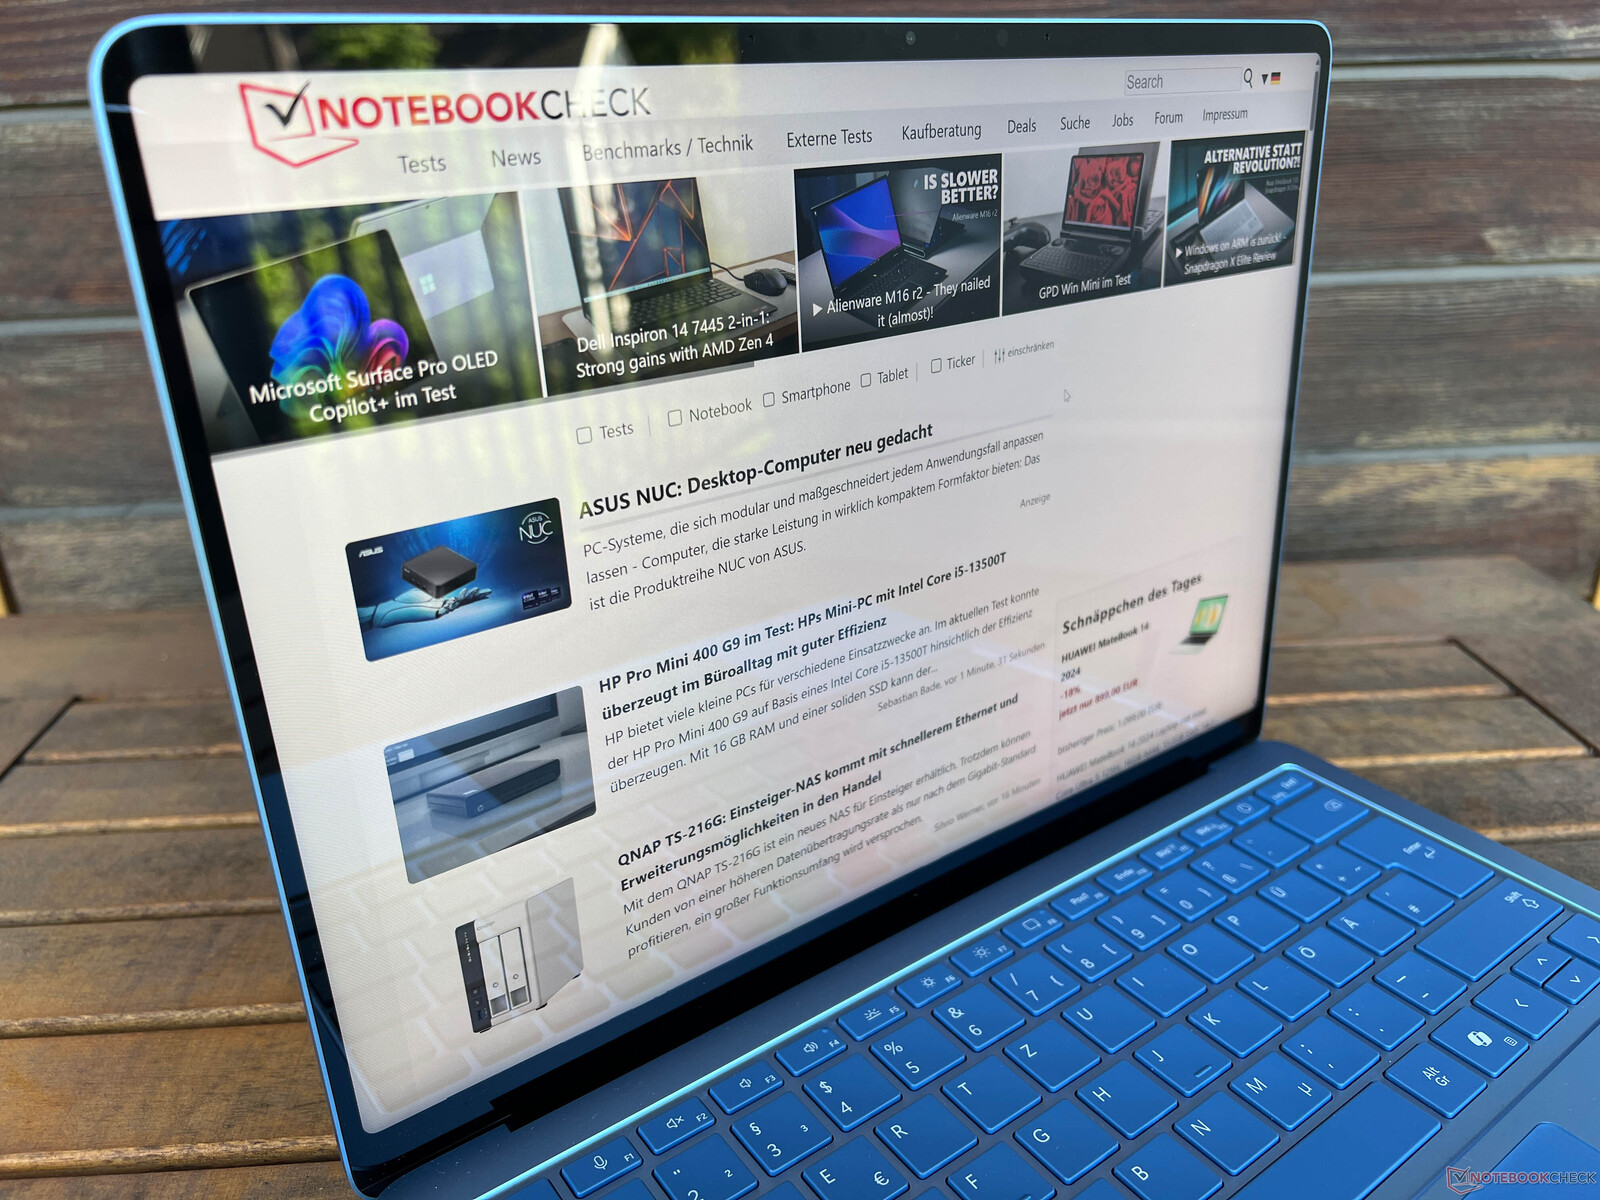
显示屏 - 现在为 600 cd/m² 的 IPS 面板
微软没有改变显示屏的基本特性(供应商:夏普),因为我们再次使用的是分辨率为 2,304 x 1,536 像素的 3:2 IPS 触摸屏。对角线尺寸为 13.8 英寸,显示屏足够清晰,主观图像质量也不错,因为面板支持 120 Hz 频率。不过,Surface Laptop 的显示质量并没有达到 OLED 面板所达到的高度,而在 Surface Pro的 OLED 显示屏无疑会很有趣。尽管如此,与 MacBook Air相比,高频率是一个优势。
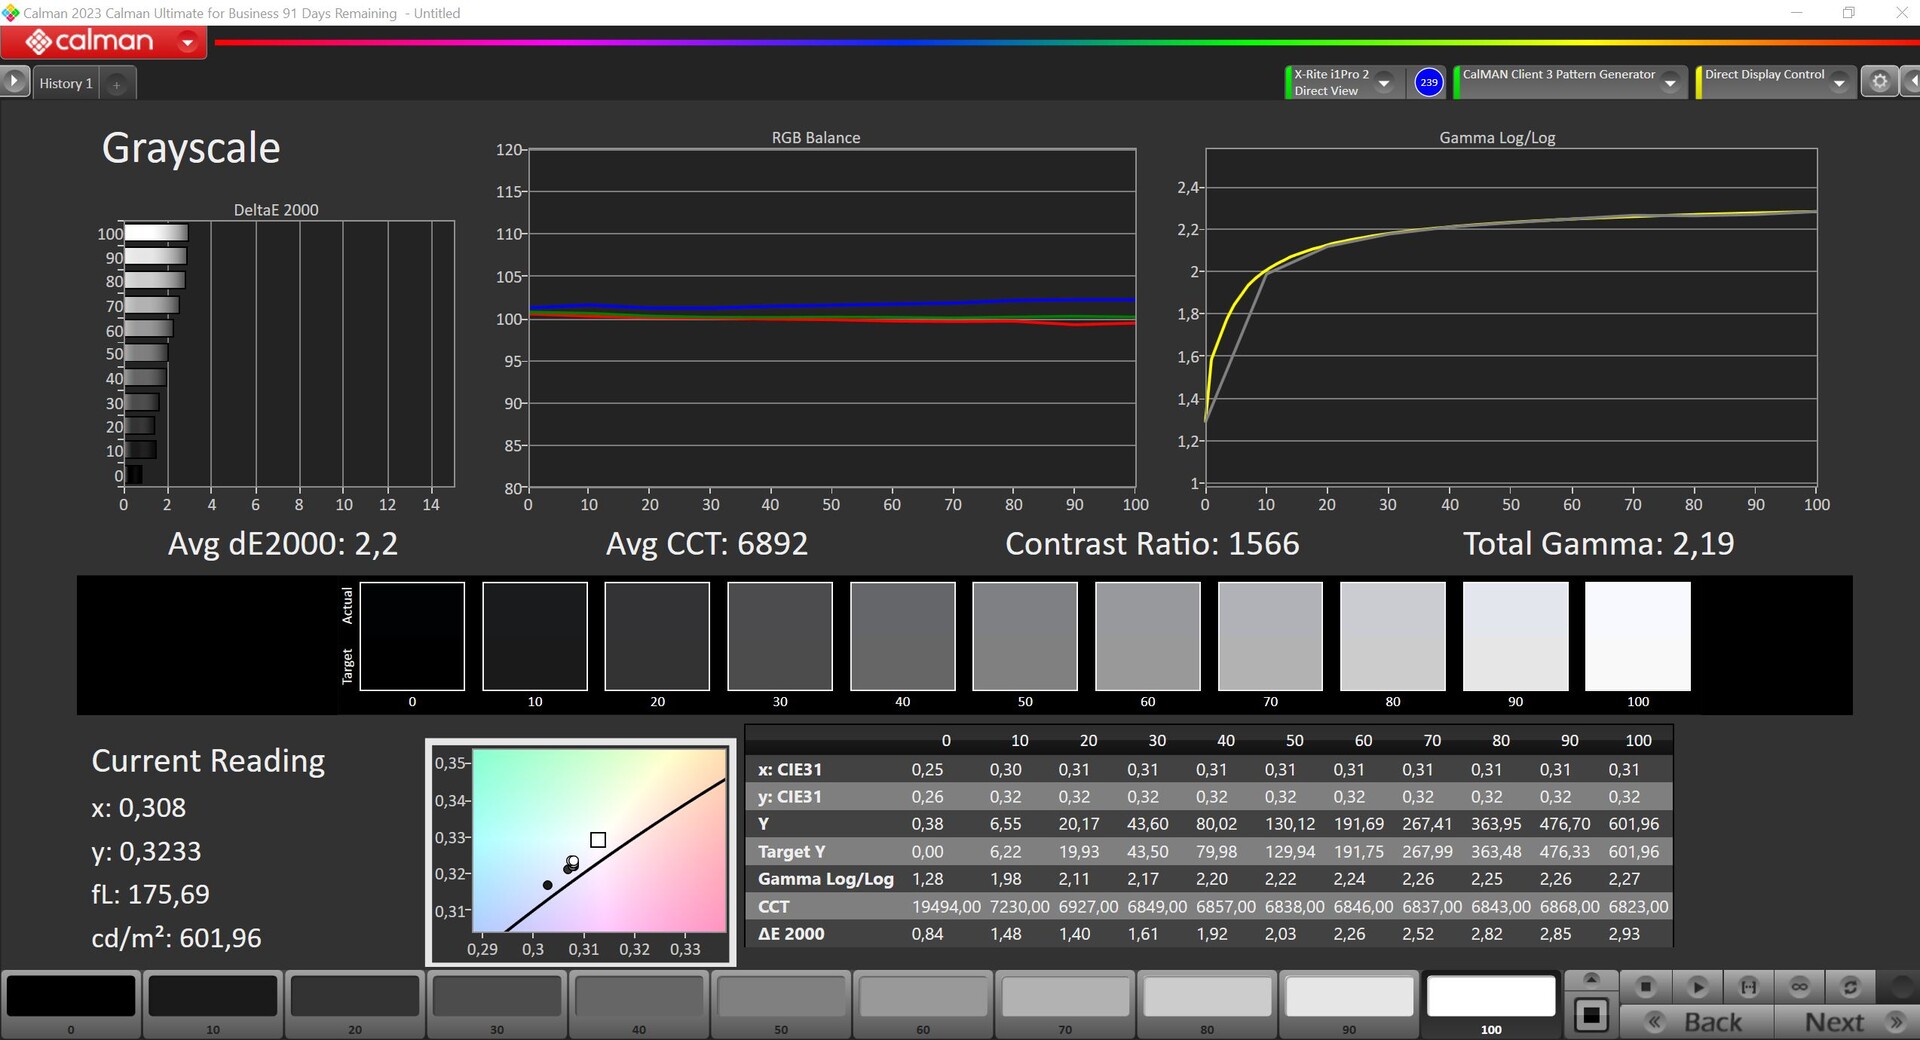
亮度有所提高,目前平均亮度接近 600 cd/m²。这意味着黑色值受到影响,0.43 cd/m² 的黑色值略微偏高。最大对比度仍徘徊在 1,400:1 左右。支持 HDR 内容,但最大亮度保持不变。看不到 PWM 闪烁,响应时间也很短。此外,尽管亮度很高,但光渗也不会造成任何问题。亮度和色温都可以通过传感器根据环境光线进行调节。
| |||||||||||||||||||||||||
Brightness Distribution: 94 %
Center on Battery: 603 cd/m²
Contrast: 1409:1 (Black: 0.43 cd/m²)
ΔE Color 1.3 | 0.5-29.43 Ø4.87
ΔE Greyscale 2.1 | 0.5-98 Ø5.1
87.3% AdobeRGB 1998 (Argyll 2.2.0 3D)
98.2% sRGB (Argyll 2.2.0 3D)
97.8% Display P3 (Argyll 2.2.0 3D)
Gamma: 2.16
| Microsoft Surface Laptop 7 13.8 Copilot+ LQ138P1JX61, IPS, 2304x1536, 13.8" | Lenovo ThinkBook 13x G4 21KR0008GE LEN135WQ+, IPS, 2880x1920, 13.5" | Dell XPS 13 9340 Core Ultra 7 SHP1593, IPS, 1920x1200, 13.4" | Apple MacBook Air 13 M3 10C GPU IPS, 2560x1664, 13.6" | Framework Laptop 13.5 Ryzen 7 7840U BOE CQ NE135FBM-N41, IPS, 2256x1504, 13.5" | HP Dragonfly G4 Chi Mei CMN13C0, IPS, 1920x1280, 13.5" | |
|---|---|---|---|---|---|---|
| Display | -19% | -16% | 1% | -16% | -16% | |
| Display P3 Coverage | 97.8 | 65.5 -33% | 69.4 -29% | 98.4 1% | 69 -29% | 68.4 -30% |
| sRGB Coverage | 98.2 | 97.3 -1% | 97.8 0% | 99.9 2% | 99.1 1% | 98.3 0% |
| AdobeRGB 1998 Coverage | 87.3 | 67.7 -22% | 71.7 -18% | 87.9 1% | 71.1 -19% | 70.4 -19% |
| Response Times | 28% | -35% | -23% | -56% | -53% | |
| Response Time Grey 50% / Grey 80% * | 38.9 ? | 27.3 ? 30% | 43.2 ? -11% | 34.5 ? 11% | 50.4 ? -30% | 48.8 ? -25% |
| Response Time Black / White * | 17.4 ? | 12.8 ? 26% | 27.6 ? -59% | 27.2 ? -56% | 31.5 ? -81% | 31.3 ? -80% |
| PWM Frequency | ||||||
| Screen | -12% | -53% | -9% | -33% | -25% | |
| Brightness middle | 606 | 539 -11% | 429 -29% | 525 -13% | 436 -28% | 408.8 -33% |
| Brightness | 592 | 513 -13% | 407 -31% | 506 -15% | 416 -30% | 399 -33% |
| Brightness Distribution | 94 | 89 -5% | 90 -4% | 92 -2% | 89 -5% | 90 -4% |
| Black Level * | 0.43 | 0.38 12% | 0.28 35% | 0.42 2% | 0.36 16% | 0.32 26% |
| Contrast | 1409 | 1418 1% | 1532 9% | 1250 -11% | 1211 -14% | 1278 -9% |
| Colorchecker dE 2000 * | 1.3 | 1.4 -8% | 2.6 -100% | 1.4 -8% | 1.81 -39% | 2.02 -55% |
| Colorchecker dE 2000 max. * | 2.1 | 3.5 -67% | 6.6 -214% | 2.8 -33% | 4.73 -125% | 3.84 -83% |
| Greyscale dE 2000 * | 2.1 | 2.2 -5% | 4 -90% | 2 5% | 2.9 -38% | 2.3 -10% |
| Gamma | 2.16 102% | 2.19 100% | 2.23 99% | 2.2 100% | 2.27 97% | 2.2 100% |
| CCT | 6842 95% | 6710 97% | 7332 89% | 6876 95% | 6784 96% | 6203 105% |
| Colorchecker dE 2000 calibrated * | 0.7 | 1.4 | 0.45 | 0.61 | ||
| Total Average (Program / Settings) | -1% /
-7% | -35% /
-42% | -10% /
-9% | -35% /
-32% | -31% /
-27% |
* ... smaller is better


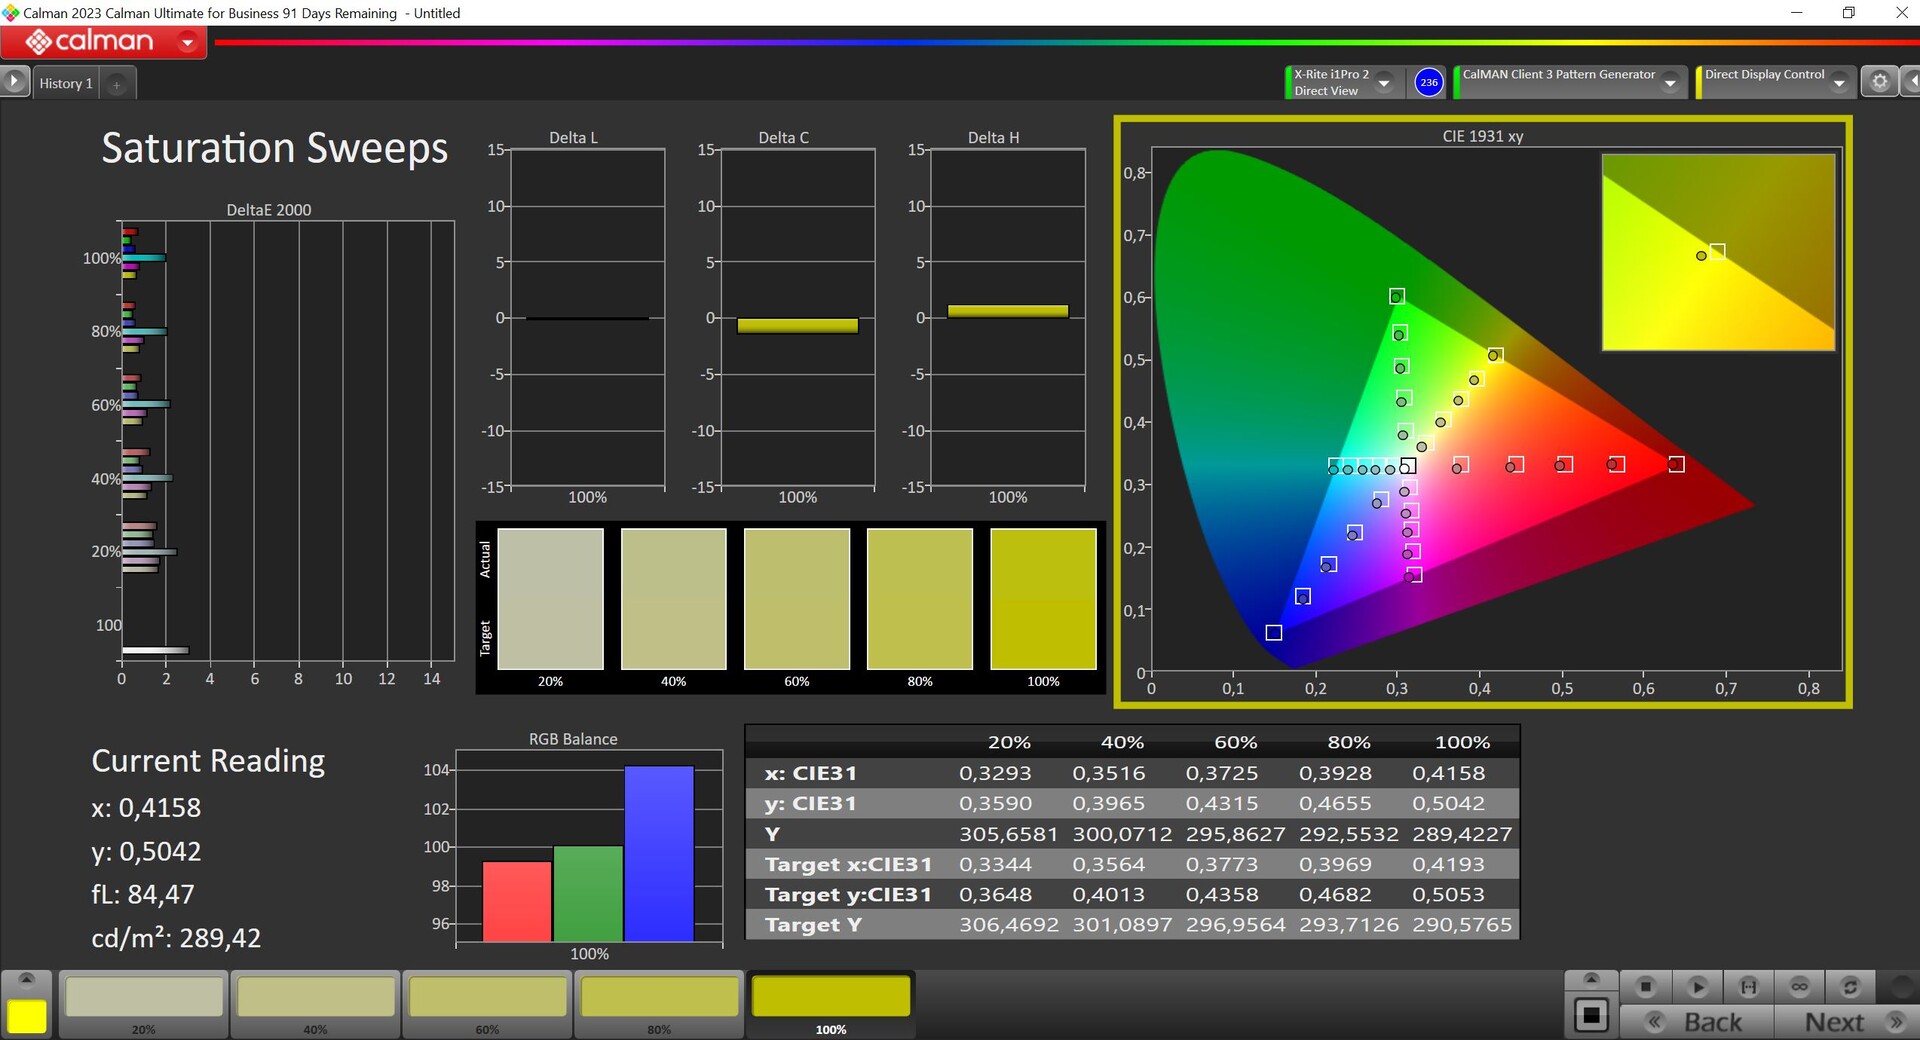
我们使用专业的 CalMAN 软件对面板进行了测试,微软提供了两种配置文件:Vivid和sRGB。作为标准配置,Vivid 配置文件处于激活状态,涵盖更大的 P3 色彩空间。这两个配置文件都非常准确,而且不需要校准,因为我们目前无法进行校准。我们的 i1Profiler 软件目前与 ARM 系统不兼容。由于 P3 和 sRGB 色彩空间的全面覆盖,图像和视频的编辑都能顺利进行。

Display Response Times
| ↔ Response Time Black to White | ||
|---|---|---|
| 17.4 ms ... rise ↗ and fall ↘ combined | ↗ 5.7 ms rise | 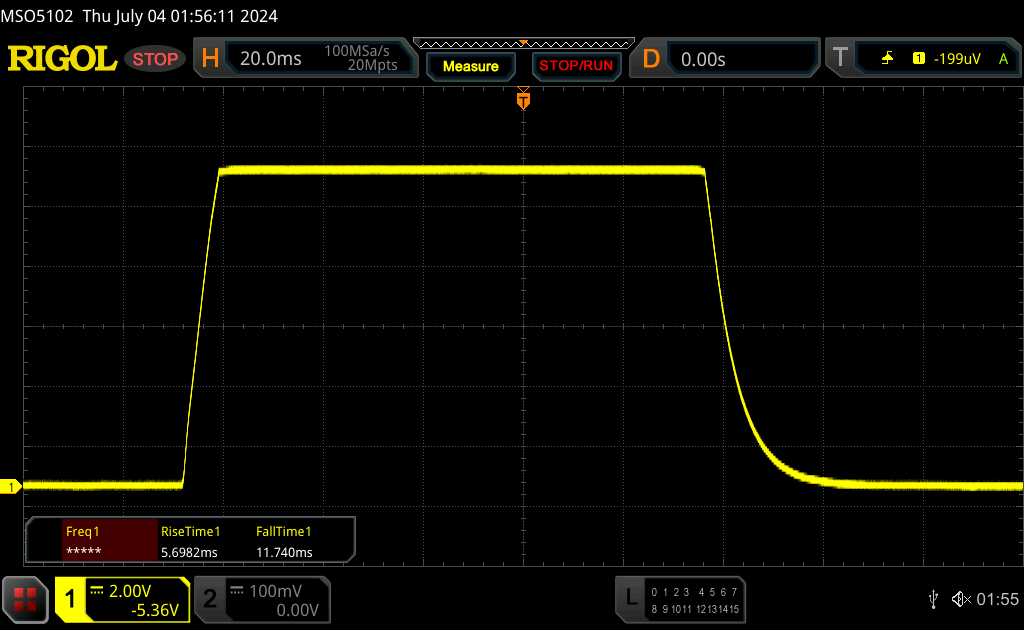 |
| ↘ 11.7 ms fall | ||
| The screen shows good response rates in our tests, but may be too slow for competitive gamers. In comparison, all tested devices range from 0.1 (minimum) to 240 (maximum) ms. » 36 % of all devices are better. This means that the measured response time is better than the average of all tested devices (20.8 ms). | ||
| ↔ Response Time 50% Grey to 80% Grey | ||
| 38.9 ms ... rise ↗ and fall ↘ combined | ↗ 17.6 ms rise | 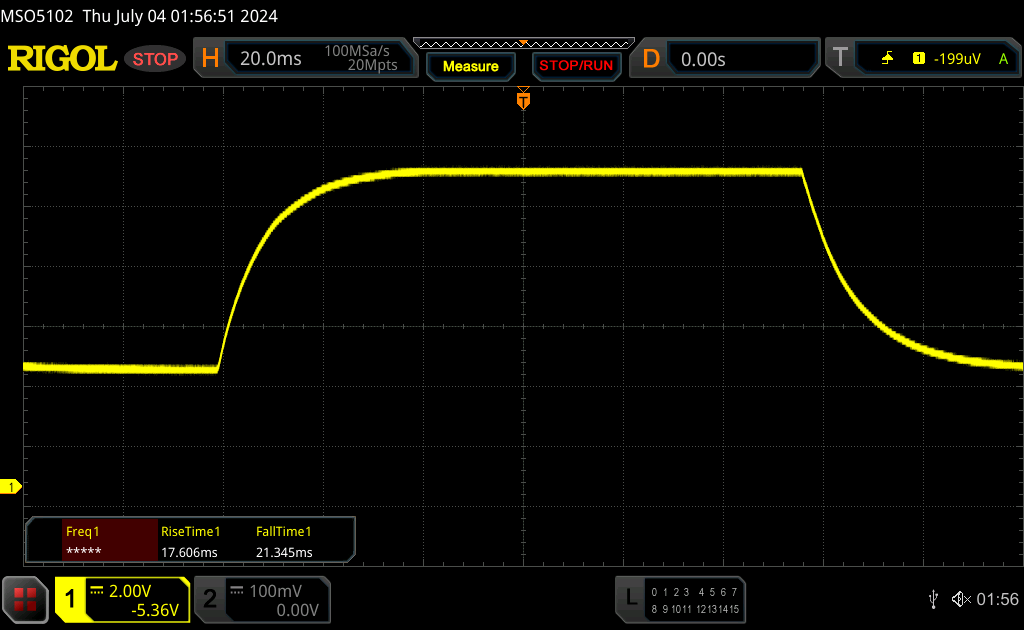 |
| ↘ 21.3 ms fall | ||
| The screen shows slow response rates in our tests and will be unsatisfactory for gamers. In comparison, all tested devices range from 0.165 (minimum) to 636 (maximum) ms. » 56 % of all devices are better. This means that the measured response time is worse than the average of all tested devices (32.5 ms). | ||
Screen Flickering / PWM (Pulse-Width Modulation)
| Screen flickering / PWM not detected | 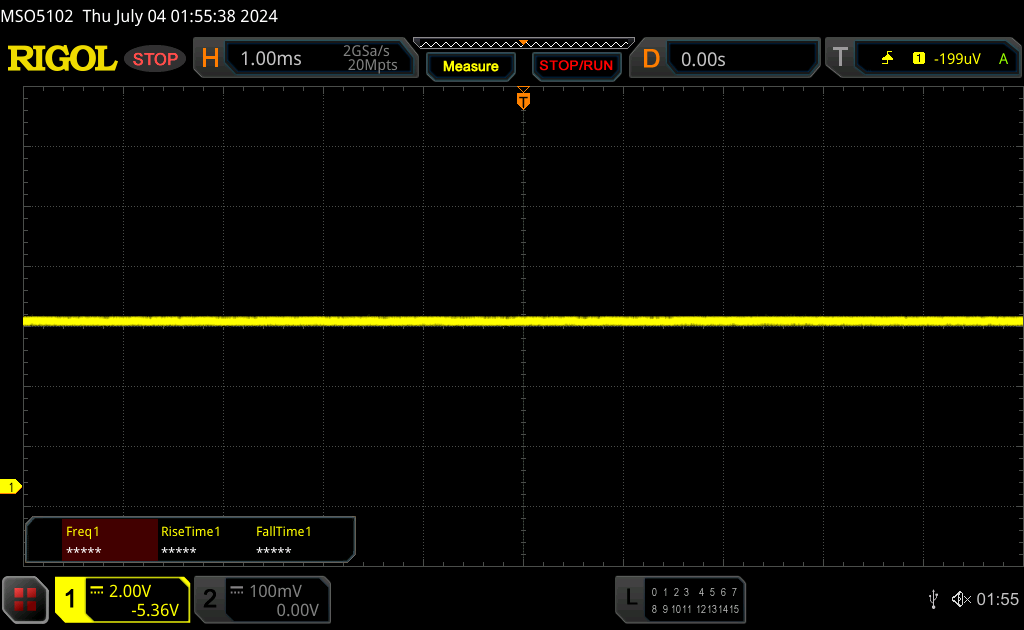 | ||
In comparison: 53 % of all tested devices do not use PWM to dim the display. If PWM was detected, an average of 8519 (minimum: 5 - maximum: 343500) Hz was measured. | |||
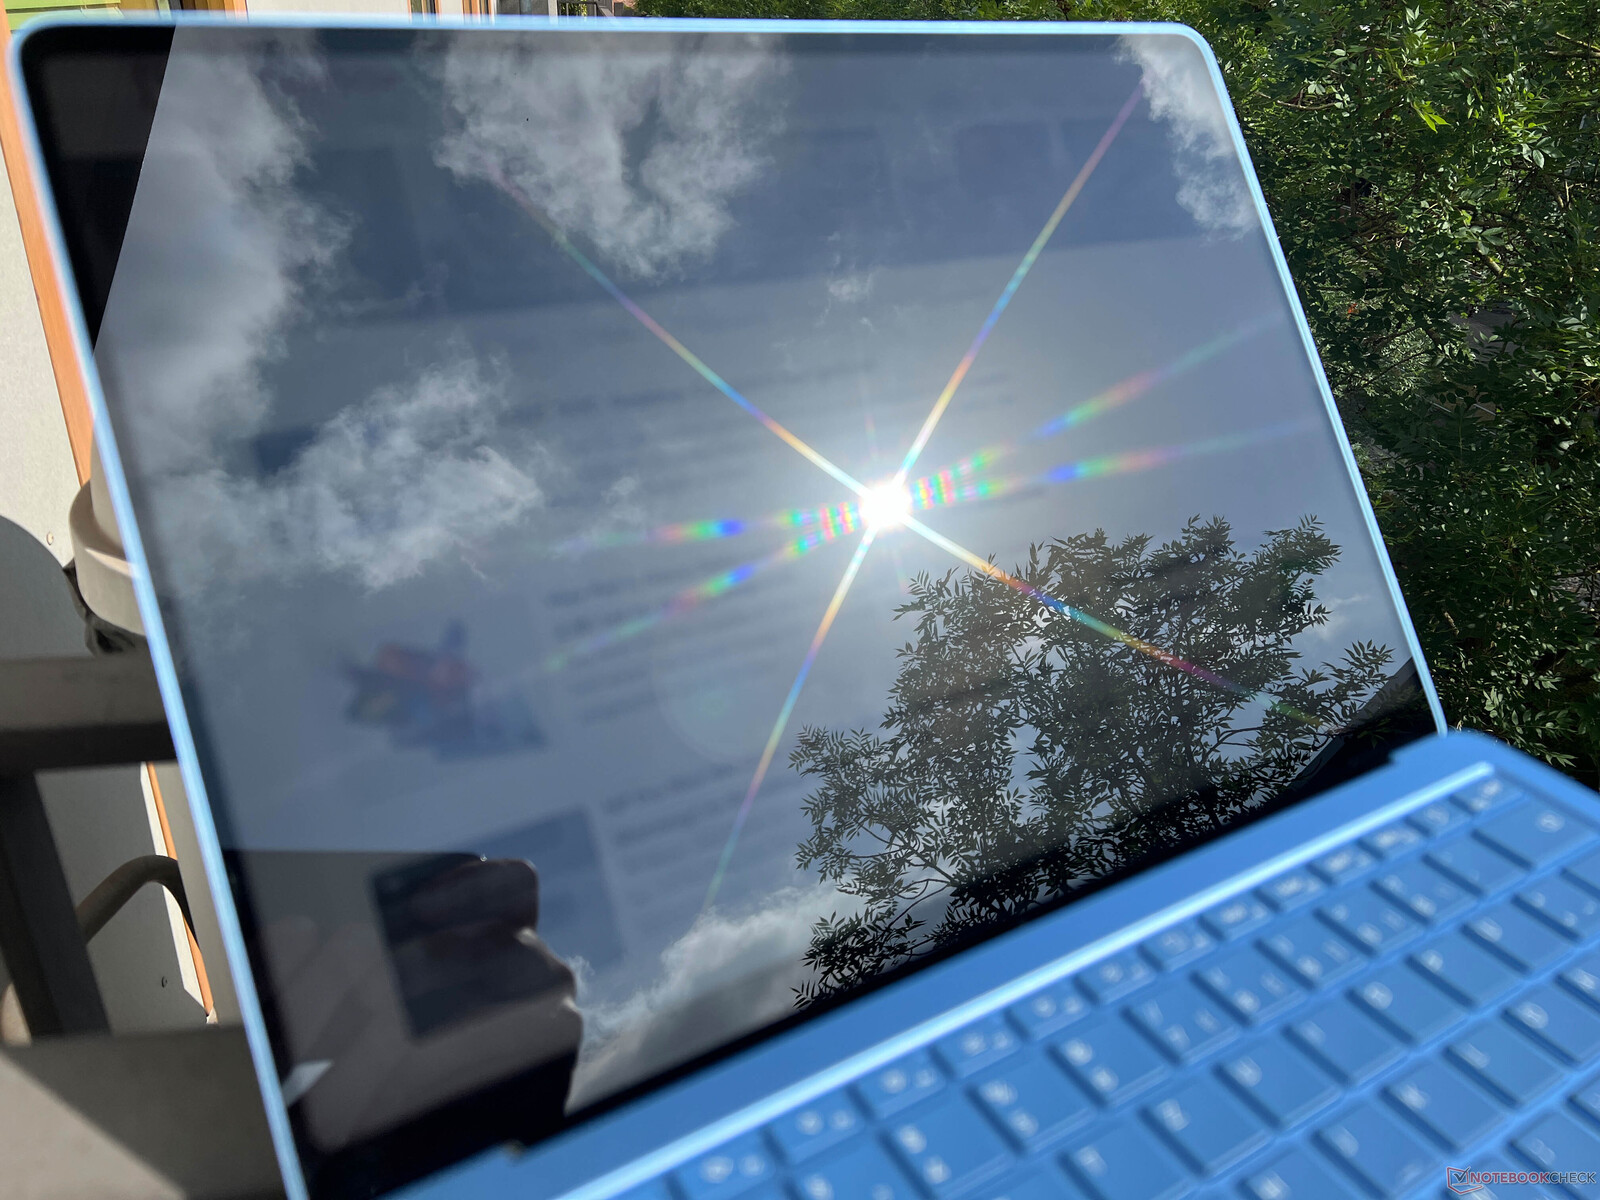
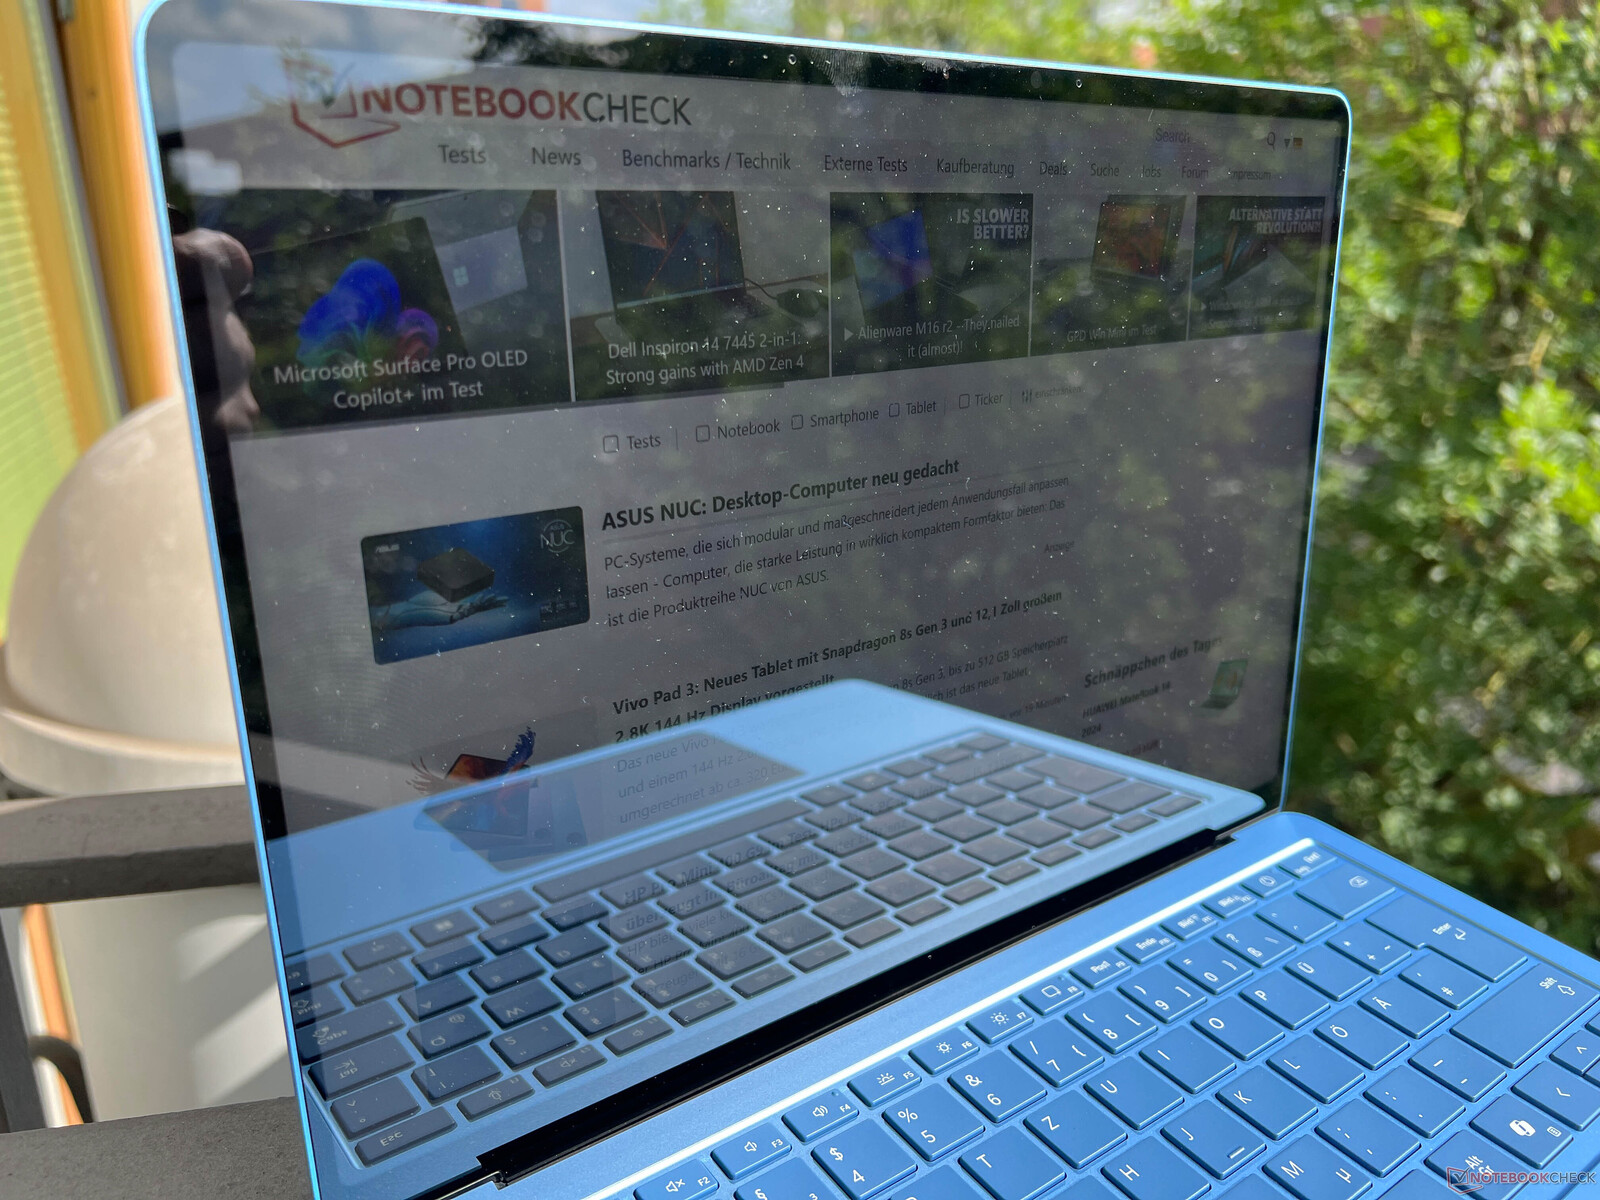
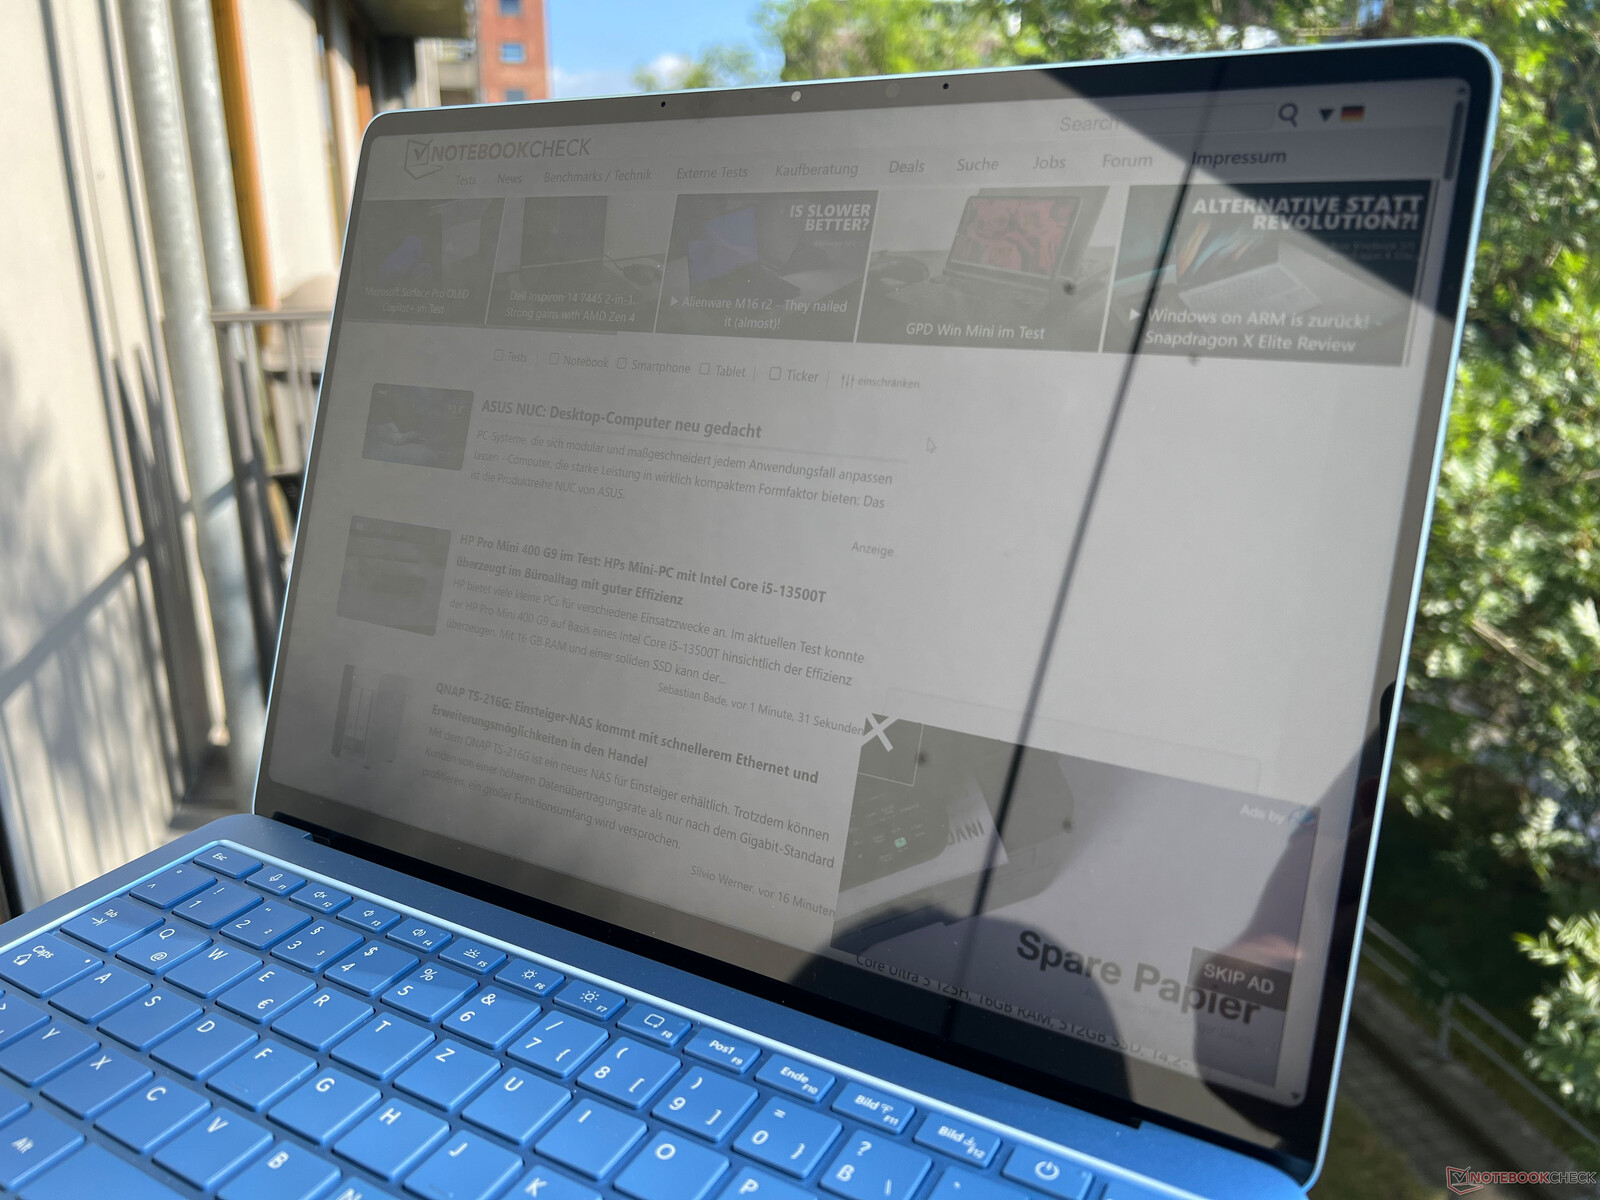
触摸屏的反光很强,在户外会遇到反光问题。高亮度可以稍稍弥补这一点,但在这方面,反光较少的屏幕,如目前的华为 Matebook X Pro 的触摸屏。 华为 Matebook X Pro的触摸屏就是一个优势。在视角稳定性方面没有限制。

性能 - 配备双核涡轮增压技术的 Snapdragon X Elite
新款 Surface Laptop 7 13.8 有两种配置,一种是骁龙 X Plus(X1P-64-100),另一种是骁龙 X Elite(X1E-80-100)。标准配置为 16 GB 内存(LPDDR5x-8448),目前还有 32 GB 内存的配置,售价为 1999 美元。此外,增加固态硬盘存储空间的附加费用也非常高。
我们运行了正常的测试程序,不过,并不是每个程序都能兼容,很多测试也没有原生的 ARM 应用程序。由于在日常使用中会遇到仿真问题,我们也将展示这些结果。
测试条件
微软并没有为其设备提供自己的能耗配置文件,而是提供 Windows 性能模式。在 Surface 设备上,这些模式总是以不同的方式命名:推荐(代表最佳节能)、更好的性能 (代表平衡)以及最佳性能。我们以最佳性能 模式为标准进行了以下基准测试和测量。
处理器 - Snapdragon X1E-80-100
A Snapdragon X Elite X1E-80-100用于价格较高的新款 Surface 笔记本电脑。它的全部 12 个内核的时钟频率高达 3.4 GHz,还支持高达 4.0 GHz 的双核涡轮增压。更多技术细节请参见 我们的分析文章. 与 Surface Pro 的情况一样,我们假设其 TDP 在 23-30 瓦之间,两款微软设备的测试结果不相上下。在 CPU 基准测试中,Cinebench 2024 和 Geekbench 6 本机测试都特别有趣。在这一领域,骁龙处理器的成绩也优于配备 AMD 和英特尔 CPU 的直接竞争对手。Apple被动冷却的 M3 芯片在多核测试中速度较慢,但在单核测试中占有优势。在电池模式下,性能保持一致。骁龙 X Plus 骁龙 X Plus在 Surface Pro(因此与 Surface Laptop 不相上下)在两项本地测试中仅慢 7-13%。
Geekbench 6.4: Multi-Core | Single-Core
Cinebench R23: Multi Core | Single Core
Cinebench R20: CPU (Multi Core) | CPU (Single Core)
Cinebench R15: CPU Multi 64Bit | CPU Single 64Bit
Blender: v2.79 BMW27 CPU
7-Zip 18.03: 7z b 4 | 7z b 4 -mmt1
Geekbench 5.5: Multi-Core | Single-Core
HWBOT x265 Benchmark v2.2: 4k Preset
LibreOffice : 20 Documents To PDF
R Benchmark 2.5: Overall mean
| Cinebench 2024 / CPU Multi Core | |
| Microsoft Surface Laptop 7 13.8 Copilot+ | |
| Microsoft Surface Pro OLED Copilot+ | |
| Average Qualcomm Snapdragon X Elite X1E-80-100 (621 - 927, n=7) | |
| Microsoft Surface Pro Copilot+ | |
| Average of class Subnotebook (148 - 1162, n=60, last 2 years) | |
| Dell XPS 13 9340 Core Ultra 7 | |
| Apple MacBook Air 13 M3 10C GPU | |
| Lenovo ThinkBook 13x G4 21KR0008GE | |
| Cinebench 2024 / CPU Single Core | |
| Apple MacBook Air 13 M3 10C GPU | |
| Microsoft Surface Pro OLED Copilot+ | |
| Microsoft Surface Laptop 7 13.8 Copilot+ | |
| Average Qualcomm Snapdragon X Elite X1E-80-100 (122 - 123, n=7) | |
| Average of class Subnotebook (35 - 173, n=43, last 2 years) | |
| Microsoft Surface Pro Copilot+ | |
| Dell XPS 13 9340 Core Ultra 7 | |
| Lenovo ThinkBook 13x G4 21KR0008GE | |
| Geekbench 6.4 / Multi-Core | |
| Microsoft Surface Pro OLED Copilot+ | |
| Microsoft Surface Laptop 7 13.8 Copilot+ | |
| Microsoft Surface Pro Copilot+ | |
| Average Qualcomm Snapdragon X Elite X1E-80-100 (7596 - 14998, n=9) | |
| Apple MacBook Air 13 M3 10C GPU | |
| Dell XPS 13 9340 Core Ultra 7 | |
| Average of class Subnotebook (2244 - 17489, n=72, last 2 years) | |
| Framework Laptop 13.5 Ryzen 7 7840U | |
| Lenovo ThinkBook 13x G4 21KR0008GE | |
| Geekbench 6.4 / Single-Core | |
| Apple MacBook Air 13 M3 10C GPU | |
| Microsoft Surface Pro OLED Copilot+ | |
| Microsoft Surface Laptop 7 13.8 Copilot+ | |
| Average Qualcomm Snapdragon X Elite X1E-80-100 (1896 - 2845, n=9) | |
| Average of class Subnotebook (960 - 3655, n=67, last 2 years) | |
| Framework Laptop 13.5 Ryzen 7 7840U | |
| Microsoft Surface Pro Copilot+ | |
| Dell XPS 13 9340 Core Ultra 7 | |
| Lenovo ThinkBook 13x G4 21KR0008GE | |
| Cinebench R23 / Multi Core | |
| Framework Laptop 13.5 Ryzen 7 7840U | |
| Dell XPS 13 9340 Core Ultra 7 | |
| Average of class Subnotebook (1555 - 21812, n=76, last 2 years) | |
| Apple MacBook Air 13 M3 10C GPU | |
| Microsoft Surface Laptop 7 13.8 Copilot+ | |
| Microsoft Surface Pro OLED Copilot+ | |
| Average Qualcomm Snapdragon X Elite X1E-80-100 (6772 - 10792, n=7) | |
| Lenovo ThinkBook 13x G4 21KR0008GE | |
| Microsoft Surface Pro Copilot+ | |
| HP Dragonfly G4 | |
| Cinebench R23 / Single Core | |
| Apple MacBook Air 13 M3 10C GPU | |
| HP Dragonfly G4 | |
| Dell XPS 13 9340 Core Ultra 7 | |
| Average of class Subnotebook (358 - 2165, n=76, last 2 years) | |
| Framework Laptop 13.5 Ryzen 7 7840U | |
| Lenovo ThinkBook 13x G4 21KR0008GE | |
| Microsoft Surface Pro OLED Copilot+ | |
| Microsoft Surface Laptop 7 13.8 Copilot+ | |
| Average Qualcomm Snapdragon X Elite X1E-80-100 (1273 - 1321, n=7) | |
| Microsoft Surface Pro Copilot+ | |
| Cinebench R20 / CPU (Multi Core) | |
| Framework Laptop 13.5 Ryzen 7 7840U | |
| Dell XPS 13 9340 Core Ultra 7 | |
| Average of class Subnotebook (579 - 8541, n=71, last 2 years) | |
| Microsoft Surface Laptop 7 13.8 Copilot+ | |
| Lenovo ThinkBook 13x G4 21KR0008GE | |
| Microsoft Surface Pro OLED Copilot+ | |
| Average Qualcomm Snapdragon X Elite X1E-80-100 (2539 - 4107, n=7) | |
| Microsoft Surface Pro Copilot+ | |
| HP Dragonfly G4 | |
| Cinebench R20 / CPU (Single Core) | |
| HP Dragonfly G4 | |
| Dell XPS 13 9340 Core Ultra 7 | |
| Lenovo ThinkBook 13x G4 21KR0008GE | |
| Framework Laptop 13.5 Ryzen 7 7840U | |
| Average of class Subnotebook (128 - 826, n=71, last 2 years) | |
| Microsoft Surface Laptop 7 13.8 Copilot+ | |
| Microsoft Surface Pro OLED Copilot+ | |
| Average Qualcomm Snapdragon X Elite X1E-80-100 (470 - 495, n=7) | |
| Microsoft Surface Pro Copilot+ | |
| Cinebench R15 / CPU Multi 64Bit | |
| Microsoft Surface Pro OLED Copilot+ | |
| Dell XPS 13 9340 Core Ultra 7 | |
| Framework Laptop 13.5 Ryzen 7 7840U | |
| Microsoft Surface Laptop 7 13.8 Copilot+ | |
| Microsoft Surface Pro Copilot+ | |
| Average of class Subnotebook (327 - 3345, n=77, last 2 years) | |
| Average Qualcomm Snapdragon X Elite X1E-80-100 (1476 - 2249, n=7) | |
| Lenovo ThinkBook 13x G4 21KR0008GE | |
| HP Dragonfly G4 | |
| Cinebench R15 / CPU Single 64Bit | |
| HP Dragonfly G4 | |
| Dell XPS 13 9340 Core Ultra 7 | |
| Average of class Subnotebook (72.4 - 322, n=72, last 2 years) | |
| Framework Laptop 13.5 Ryzen 7 7840U | |
| Microsoft Surface Pro OLED Copilot+ | |
| Lenovo ThinkBook 13x G4 21KR0008GE | |
| Microsoft Surface Laptop 7 13.8 Copilot+ | |
| Average Qualcomm Snapdragon X Elite X1E-80-100 (230 - 248, n=7) | |
| Microsoft Surface Pro Copilot+ | |
| Blender / v2.79 BMW27 CPU | |
| Apple MacBook Air 13 M3 10C GPU | |
| HP Dragonfly G4 | |
| Microsoft Surface Pro Copilot+ | |
| Average of class Subnotebook (159 - 2271, n=75, last 2 years) | |
| Average Qualcomm Snapdragon X Elite X1E-80-100 (331 - 510, n=7) | |
| Lenovo ThinkBook 13x G4 21KR0008GE | |
| Microsoft Surface Pro OLED Copilot+ | |
| Microsoft Surface Laptop 7 13.8 Copilot+ | |
| Dell XPS 13 9340 Core Ultra 7 | |
| Framework Laptop 13.5 Ryzen 7 7840U | |
| 7-Zip 18.03 / 7z b 4 | |
| Framework Laptop 13.5 Ryzen 7 7840U | |
| Dell XPS 13 9340 Core Ultra 7 | |
| Average of class Subnotebook (11668 - 77867, n=67, last 2 years) | |
| Microsoft Surface Laptop 7 13.8 Copilot+ | |
| Microsoft Surface Pro OLED Copilot+ | |
| Average Qualcomm Snapdragon X Elite X1E-80-100 (34299 - 46146, n=7) | |
| Microsoft Surface Pro Copilot+ | |
| HP Dragonfly G4 | |
| 7-Zip 18.03 / 7z b 4 -mmt1 | |
| Framework Laptop 13.5 Ryzen 7 7840U | |
| HP Dragonfly G4 | |
| Average of class Subnotebook (2643 - 6442, n=69, last 2 years) | |
| Dell XPS 13 9340 Core Ultra 7 | |
| Microsoft Surface Pro OLED Copilot+ | |
| Microsoft Surface Laptop 7 13.8 Copilot+ | |
| Average Qualcomm Snapdragon X Elite X1E-80-100 (5242 - 5359, n=7) | |
| Lenovo ThinkBook 13x G4 21KR0008GE | |
| Microsoft Surface Pro Copilot+ | |
| Geekbench 5.5 / Multi-Core | |
| Dell XPS 13 9340 Core Ultra 7 | |
| Apple MacBook Air 13 M3 10C GPU | |
| Framework Laptop 13.5 Ryzen 7 7840U | |
| Lenovo ThinkBook 13x G4 21KR0008GE | |
| Average of class Subnotebook (2557 - 17218, n=68, last 2 years) | |
| HP Dragonfly G4 | |
| Geekbench 5.5 / Single-Core | |
| Apple MacBook Air 13 M3 10C GPU | |
| Framework Laptop 13.5 Ryzen 7 7840U | |
| HP Dragonfly G4 | |
| Average of class Subnotebook (726 - 2350, n=68, last 2 years) | |
| Dell XPS 13 9340 Core Ultra 7 | |
| Lenovo ThinkBook 13x G4 21KR0008GE | |
| HWBOT x265 Benchmark v2.2 / 4k Preset | |
| Framework Laptop 13.5 Ryzen 7 7840U | |
| Dell XPS 13 9340 Core Ultra 7 | |
| Average of class Subnotebook (0.97 - 25.1, n=70, last 2 years) | |
| Lenovo ThinkBook 13x G4 21KR0008GE | |
| HP Dragonfly G4 | |
| Microsoft Surface Laptop 7 13.8 Copilot+ | |
| Microsoft Surface Pro OLED Copilot+ | |
| Average Qualcomm Snapdragon X Elite X1E-80-100 (4.74 - 7.53, n=7) | |
| Microsoft Surface Pro Copilot+ | |
| LibreOffice / 20 Documents To PDF | |
| Microsoft Surface Laptop 7 13.8 Copilot+ | |
| Average Qualcomm Snapdragon X Elite X1E-80-100 (50.9 - 98.5, n=7) | |
| Microsoft Surface Pro Copilot+ | |
| Average of class Subnotebook (38.5 - 220, n=68, last 2 years) | |
| Microsoft Surface Pro OLED Copilot+ | |
| Lenovo ThinkBook 13x G4 21KR0008GE | |
| Dell XPS 13 9340 Core Ultra 7 | |
| HP Dragonfly G4 | |
| Framework Laptop 13.5 Ryzen 7 7840U | |
| R Benchmark 2.5 / Overall mean | |
| Microsoft Surface Pro Copilot+ | |
| Average Qualcomm Snapdragon X Elite X1E-80-100 (0.63 - 0.67, n=7) | |
| Microsoft Surface Pro OLED Copilot+ | |
| Microsoft Surface Laptop 7 13.8 Copilot+ | |
| Average of class Subnotebook (0.403 - 1.456, n=70, last 2 years) | |
| Lenovo ThinkBook 13x G4 21KR0008GE | |
| Dell XPS 13 9340 Core Ultra 7 | |
| HP Dragonfly G4 | |
| Framework Laptop 13.5 Ryzen 7 7840U | |
* ... smaller is better
AIDA64: FP32 Ray-Trace | FPU Julia | CPU SHA3 | CPU Queen | FPU SinJulia | FPU Mandel | CPU AES | CPU ZLib | FP64 Ray-Trace | CPU PhotoWorxx
| Performance Rating | |
| Framework Laptop 13.5 Ryzen 7 7840U | |
| Dell XPS 13 9340 Core Ultra 7 | |
| Average of class Subnotebook | |
| Lenovo ThinkBook 13x G4 21KR0008GE | |
| Microsoft Surface Laptop 7 13.8 Copilot+ | |
| Average Qualcomm Snapdragon X Elite X1E-80-100 | |
| Microsoft Surface Pro OLED Copilot+ | |
| HP Dragonfly G4 | |
| AIDA64 / FP32 Ray-Trace | |
| Framework Laptop 13.5 Ryzen 7 7840U | |
| Average of class Subnotebook (1135 - 32888, n=70, last 2 years) | |
| Dell XPS 13 9340 Core Ultra 7 | |
| Lenovo ThinkBook 13x G4 21KR0008GE | |
| Microsoft Surface Laptop 7 13.8 Copilot+ | |
| HP Dragonfly G4 | |
| Average Qualcomm Snapdragon X Elite X1E-80-100 (2184 - 7469, n=7) | |
| Microsoft Surface Pro OLED Copilot+ | |
| AIDA64 / FPU Julia | |
| Framework Laptop 13.5 Ryzen 7 7840U | |
| Dell XPS 13 9340 Core Ultra 7 | |
| Average of class Subnotebook (5218 - 123315, n=70, last 2 years) | |
| Lenovo ThinkBook 13x G4 21KR0008GE | |
| HP Dragonfly G4 | |
| Microsoft Surface Laptop 7 13.8 Copilot+ | |
| Average Qualcomm Snapdragon X Elite X1E-80-100 (5687 - 26391, n=7) | |
| Microsoft Surface Pro OLED Copilot+ | |
| AIDA64 / CPU SHA3 | |
| Framework Laptop 13.5 Ryzen 7 7840U | |
| Microsoft Surface Laptop 7 13.8 Copilot+ | |
| Dell XPS 13 9340 Core Ultra 7 | |
| Average of class Subnotebook (444 - 5287, n=70, last 2 years) | |
| Average Qualcomm Snapdragon X Elite X1E-80-100 (2607 - 3122, n=7) | |
| Microsoft Surface Pro OLED Copilot+ | |
| Lenovo ThinkBook 13x G4 21KR0008GE | |
| HP Dragonfly G4 | |
| AIDA64 / CPU Queen | |
| Framework Laptop 13.5 Ryzen 7 7840U | |
| Lenovo ThinkBook 13x G4 21KR0008GE | |
| Dell XPS 13 9340 Core Ultra 7 | |
| Average of class Subnotebook (10579 - 115682, n=70, last 2 years) | |
| HP Dragonfly G4 | |
| Microsoft Surface Pro OLED Copilot+ | |
| Microsoft Surface Laptop 7 13.8 Copilot+ | |
| Average Qualcomm Snapdragon X Elite X1E-80-100 (67219 - 69762, n=7) | |
| AIDA64 / FPU SinJulia | |
| Framework Laptop 13.5 Ryzen 7 7840U | |
| Dell XPS 13 9340 Core Ultra 7 | |
| Average of class Subnotebook (744 - 18418, n=70, last 2 years) | |
| Lenovo ThinkBook 13x G4 21KR0008GE | |
| HP Dragonfly G4 | |
| Microsoft Surface Pro OLED Copilot+ | |
| Microsoft Surface Laptop 7 13.8 Copilot+ | |
| Average Qualcomm Snapdragon X Elite X1E-80-100 (1521 - 2357, n=7) | |
| AIDA64 / FPU Mandel | |
| Framework Laptop 13.5 Ryzen 7 7840U | |
| Dell XPS 13 9340 Core Ultra 7 | |
| Average of class Subnotebook (3341 - 65433, n=70, last 2 years) | |
| Lenovo ThinkBook 13x G4 21KR0008GE | |
| HP Dragonfly G4 | |
| Microsoft Surface Pro OLED Copilot+ | |
| Microsoft Surface Laptop 7 13.8 Copilot+ | |
| Average Qualcomm Snapdragon X Elite X1E-80-100 (10117 - 15669, n=7) | |
| AIDA64 / CPU AES | |
| Framework Laptop 13.5 Ryzen 7 7840U | |
| Microsoft Surface Pro OLED Copilot+ | |
| Dell XPS 13 9340 Core Ultra 7 | |
| Microsoft Surface Laptop 7 13.8 Copilot+ | |
| Average Qualcomm Snapdragon X Elite X1E-80-100 (39956 - 71089, n=7) | |
| Average of class Subnotebook (638 - 161430, n=70, last 2 years) | |
| Lenovo ThinkBook 13x G4 21KR0008GE | |
| HP Dragonfly G4 | |
| AIDA64 / CPU ZLib | |
| Framework Laptop 13.5 Ryzen 7 7840U | |
| Dell XPS 13 9340 Core Ultra 7 | |
| Microsoft Surface Pro OLED Copilot+ | |
| Average of class Subnotebook (164.9 - 1379, n=70, last 2 years) | |
| Microsoft Surface Laptop 7 13.8 Copilot+ | |
| Average Qualcomm Snapdragon X Elite X1E-80-100 (398 - 802, n=7) | |
| Lenovo ThinkBook 13x G4 21KR0008GE | |
| HP Dragonfly G4 | |
| AIDA64 / FP64 Ray-Trace | |
| Framework Laptop 13.5 Ryzen 7 7840U | |
| Average of class Subnotebook (610 - 17495, n=70, last 2 years) | |
| Dell XPS 13 9340 Core Ultra 7 | |
| Lenovo ThinkBook 13x G4 21KR0008GE | |
| Microsoft Surface Laptop 7 13.8 Copilot+ | |
| Average Qualcomm Snapdragon X Elite X1E-80-100 (2581 - 4044, n=7) | |
| HP Dragonfly G4 | |
| Microsoft Surface Pro OLED Copilot+ | |
| AIDA64 / CPU PhotoWorxx | |
| Dell XPS 13 9340 Core Ultra 7 | |
| Lenovo ThinkBook 13x G4 21KR0008GE | |
| Average of class Subnotebook (6569 - 64588, n=70, last 2 years) | |
| Microsoft Surface Pro OLED Copilot+ | |
| Microsoft Surface Laptop 7 13.8 Copilot+ | |
| HP Dragonfly G4 | |
| Average Qualcomm Snapdragon X Elite X1E-80-100 (28474 - 38707, n=7) | |
| Framework Laptop 13.5 Ryzen 7 7840U | |
系统性能
在日常使用中,Surface 笔记本电脑的响应速度非常快,在这一点上与竞争对手没有任何区别。不过,需要注意的是,ARM 版本并非适用于所有应用程序或驱动程序。与 AMD/Intel 笔记本电脑相比,Surface Laptop 受到了一定的限制,尤其是在使用需要自带驱动程序的旧式外设时(例如打印机、扫描仪、外置声卡等)。
WebXPRT 3: Overall
WebXPRT 4: Overall
Mozilla Kraken 1.1: Total
| CrossMark / Overall | |
| Apple MacBook Air 13 M3 10C GPU | |
| Framework Laptop 13.5 Ryzen 7 7840U | |
| Dell XPS 13 9340 Core Ultra 7 | |
| HP Dragonfly G4 | |
| Average of class Subnotebook (365 - 2018, n=68, last 2 years) | |
| Lenovo ThinkBook 13x G4 21KR0008GE | |
| Microsoft Surface Pro OLED Copilot+ | |
| Microsoft Surface Laptop 7 13.8 Copilot+ | |
| Average Qualcomm Snapdragon X Elite X1E-80-100, Qualcomm SD X Adreno X1-85 3.8 TFLOPS (1356 - 1443, n=7) | |
| CrossMark / Productivity | |
| Apple MacBook Air 13 M3 10C GPU | |
| Framework Laptop 13.5 Ryzen 7 7840U | |
| HP Dragonfly G4 | |
| Dell XPS 13 9340 Core Ultra 7 | |
| Average of class Subnotebook (364 - 1875, n=68, last 2 years) | |
| Lenovo ThinkBook 13x G4 21KR0008GE | |
| Microsoft Surface Pro OLED Copilot+ | |
| Microsoft Surface Laptop 7 13.8 Copilot+ | |
| Average Qualcomm Snapdragon X Elite X1E-80-100, Qualcomm SD X Adreno X1-85 3.8 TFLOPS (1271 - 1375, n=7) | |
| CrossMark / Creativity | |
| Apple MacBook Air 13 M3 10C GPU | |
| Dell XPS 13 9340 Core Ultra 7 | |
| Framework Laptop 13.5 Ryzen 7 7840U | |
| Average of class Subnotebook (372 - 2396, n=68, last 2 years) | |
| HP Dragonfly G4 | |
| Lenovo ThinkBook 13x G4 21KR0008GE | |
| Microsoft Surface Pro OLED Copilot+ | |
| Microsoft Surface Laptop 7 13.8 Copilot+ | |
| Average Qualcomm Snapdragon X Elite X1E-80-100, Qualcomm SD X Adreno X1-85 3.8 TFLOPS (1402 - 1537, n=7) | |
| CrossMark / Responsiveness | |
| Framework Laptop 13.5 Ryzen 7 7840U | |
| Microsoft Surface Pro OLED Copilot+ | |
| Dell XPS 13 9340 Core Ultra 7 | |
| HP Dragonfly G4 | |
| Apple MacBook Air 13 M3 10C GPU | |
| Average of class Subnotebook (312 - 1899, n=68, last 2 years) | |
| Microsoft Surface Laptop 7 13.8 Copilot+ | |
| Average Qualcomm Snapdragon X Elite X1E-80-100, Qualcomm SD X Adreno X1-85 3.8 TFLOPS (1237 - 1401, n=7) | |
| Lenovo ThinkBook 13x G4 21KR0008GE | |
| WebXPRT 3 / Overall | |
| Apple MacBook Air 13 M3 10C GPU | |
| Average Qualcomm Snapdragon X Elite X1E-80-100, Qualcomm SD X Adreno X1-85 3.8 TFLOPS (430 - 455, n=7) | |
| Microsoft Surface Pro OLED Copilot+ | |
| Microsoft Surface Laptop 7 13.8 Copilot+ | |
| Framework Laptop 13.5 Ryzen 7 7840U | |
| Average of class Subnotebook (156 - 479, n=67, last 2 years) | |
| HP Dragonfly G4 | |
| Dell XPS 13 9340 Core Ultra 7 | |
| Lenovo ThinkBook 13x G4 21KR0008GE | |
| WebXPRT 4 / Overall | |
| Apple MacBook Air 13 M3 10C GPU | |
| Average Qualcomm Snapdragon X Elite X1E-80-100, Qualcomm SD X Adreno X1-85 3.8 TFLOPS (295 - 324, n=7) | |
| Microsoft Surface Laptop 7 13.8 Copilot+ | |
| Microsoft Surface Pro OLED Copilot+ | |
| HP Dragonfly G4 | |
| Average of class Subnotebook (132 - 348, n=68, last 2 years) | |
| Dell XPS 13 9340 Core Ultra 7 | |
| Framework Laptop 13.5 Ryzen 7 7840U | |
| Lenovo ThinkBook 13x G4 21KR0008GE | |
| Mozilla Kraken 1.1 / Total | |
| Lenovo ThinkBook 13x G4 21KR0008GE | |
| Dell XPS 13 9340 Core Ultra 7 | |
| Average of class Subnotebook (278 - 1104, n=76, last 2 years) | |
| Framework Laptop 13.5 Ryzen 7 7840U | |
| HP Dragonfly G4 | |
| Average Qualcomm Snapdragon X Elite X1E-80-100, Qualcomm SD X Adreno X1-85 3.8 TFLOPS (391 - 422, n=7) | |
| Microsoft Surface Pro OLED Copilot+ | |
| Microsoft Surface Laptop 7 13.8 Copilot+ | |
| Apple MacBook Air 13 M3 10C GPU | |
* ... smaller is better
| AIDA64 / Memory Copy | |
| Dell XPS 13 9340 Core Ultra 7 | |
| Lenovo ThinkBook 13x G4 21KR0008GE | |
| Average of class Subnotebook (14554 - 109035, n=70, last 2 years) | |
| Microsoft Surface Pro OLED Copilot+ | |
| Framework Laptop 13.5 Ryzen 7 7840U | |
| Microsoft Surface Laptop 7 13.8 Copilot+ | |
| Average Qualcomm Snapdragon X Elite X1E-80-100 (44795 - 63495, n=7) | |
| HP Dragonfly G4 | |
| AIDA64 / Memory Read | |
| Microsoft Surface Pro OLED Copilot+ | |
| Microsoft Surface Laptop 7 13.8 Copilot+ | |
| Average Qualcomm Snapdragon X Elite X1E-80-100 (58855 - 125604, n=7) | |
| Dell XPS 13 9340 Core Ultra 7 | |
| Lenovo ThinkBook 13x G4 21KR0008GE | |
| Average of class Subnotebook (15948 - 122210, n=70, last 2 years) | |
| Framework Laptop 13.5 Ryzen 7 7840U | |
| HP Dragonfly G4 | |
| AIDA64 / Memory Write | |
| Average of class Subnotebook (15709 - 117898, n=70, last 2 years) | |
| Framework Laptop 13.5 Ryzen 7 7840U | |
| Dell XPS 13 9340 Core Ultra 7 | |
| HP Dragonfly G4 | |
| Lenovo ThinkBook 13x G4 21KR0008GE | |
| Microsoft Surface Pro OLED Copilot+ | |
| Microsoft Surface Laptop 7 13.8 Copilot+ | |
| Average Qualcomm Snapdragon X Elite X1E-80-100 (37270 - 45265, n=7) | |
| AIDA64 / Memory Latency | |
| Lenovo ThinkBook 13x G4 21KR0008GE | |
| Dell XPS 13 9340 Core Ultra 7 | |
| Average of class Subnotebook (7.2 - 187.8, n=69, last 2 years) | |
| HP Dragonfly G4 | |
| Framework Laptop 13.5 Ryzen 7 7840U | |
| Average Qualcomm Snapdragon X Elite X1E-80-100 (7.4 - 8.8, n=6) | |
| Microsoft Surface Pro OLED Copilot+ | |
| Microsoft Surface Laptop 7 13.8 Copilot+ | |
* ... smaller is better
DPC 延迟
由于 LatencyMon 应用程序无法在 ARM 系统上启动,因此我们无法进行标准的延迟测试。在播放 4K YouTube 视频时,至少没有出现丢帧问题。
大容量存储器
微软安装了一个 M.2 2230 固态硬盘,可以轻松更换。我们的评测设备安装的是 512 GB 的三星 PM9B1 版本,不过初次安装后,你只能使用 416 GB。该固态硬盘的性能高达 3.6 GB/s,完全满足日常使用需求,而且传输速度稳定,即使在持续负载期间也是如此。其他固态硬盘基准测试 这里.

* ... smaller is better
Continuous Performance Read: DiskSpd Read Loop, Queue Depth 8
图形卡 - Adreno X1-85
目前,Adreno-X1-85-GPU 有两种型号 Adreno-X1-85-GPU而与 X1E-80-100 结合使用的是主频较慢的 1.2 GHz(3.8 TFLOPS)版本。 在实际使用中,iGPU 的性能绰绰有余,即使在播放高分辨率视频时也没有任何问题。在原生 GPU 基准测试 "WildLife Extreme Unlimited "中,Surface Laptop 的性能介于 英特尔弧形显卡以及 AMD Radeon 780M.
到目前为止一切顺利,但一旦你尝试玩游戏,问题就来了。原生 ARM 游戏很少,我们在测试中不断遇到问题。有时游戏甚至无法启动(《孤岛惊魂 5》、《波斯王子失落的王冠》、Witcher 3 、《F1 23》和《F1 24》),有时在较高设置下会出现图形错误/崩溃(《古墓丽影:暗影》、《全面战争:法老王》),或者游戏中经常出现崩溃(《赛博朋克 2077》)。这种情况今后应该会有所改善,但希望偶尔玩玩游戏的用户还是不要选择骁龙笔记本电脑。
无论是在持续负载期间还是在电池模式下,GPU 性能都保持稳定。其他 GPU 基准测试 这里.
| 3DMark 11 Performance | 6855 points | |
| 3DMark Fire Strike Score | 5727 points | |
| 3DMark Time Spy Score | 1868 points | |
| 3DMark Steel Nomad Score | 476 points | |
| 3DMark Steel Nomad Light Score | 2005 points | |
| 3DMark Steel Nomad Light Unlimited Score | 1932 points | |
Help | ||
| Blender / v3.3 Classroom METAL | |
| Average of class Subnotebook (103 - 237, n=4, last 2 years) | |
| Apple MacBook Air 13 M3 10C GPU | |
| Blender / v3.3 Classroom CPU | |
| HP Dragonfly G4 | |
| Lenovo ThinkBook 13x G4 21KR0008GE | |
| Average Qualcomm SD X Adreno X1-85 3.8 TFLOPS (545 - 899, n=12) | |
| Microsoft Surface Pro OLED Copilot+ | |
| Microsoft Surface Laptop 7 13.8 Copilot+ | |
| Average of class Subnotebook (241 - 1127, n=72, last 2 years) | |
| Apple MacBook Air 13 M3 10C GPU | |
| Dell XPS 13 9340 Core Ultra 7 | |
| Framework Laptop 13.5 Ryzen 7 7840U | |
* ... smaller is better
| Cyberpunk 2077 2.2 Phantom Liberty - 1920x1080 Ultra Preset (FSR off) | |
| Average of class Subnotebook (8.48 - 31.4, n=47, last 2 years) | |
| Lenovo ThinkBook 13x G4 21KR0008GE | |
| Microsoft Surface Laptop 7 13.8 Copilot+ | |
| Microsoft Surface Pro OLED Copilot+ | |
| GTA V - 1920x1080 Highest Settings possible AA:4xMSAA + FX AF:16x | |
| Microsoft Surface Laptop 7 13.8 Copilot+ | |
| Average of class Subnotebook (7.81 - 53, n=67, last 2 years) | |
| Lenovo ThinkBook 13x G4 21KR0008GE | |
| Dell XPS 13 9340 Core Ultra 7 | |
| HP Dragonfly G4 | |
| Baldur's Gate 3 - 1920x1080 Ultra Preset | |
| Average of class Subnotebook (12.1 - 31.1, n=43, last 2 years) | |
| Apple MacBook Air 13 M3 10C GPU | |
| Microsoft Surface Laptop 7 13.8 Copilot+ | |
| Microsoft Surface Pro OLED Copilot+ | |
Cyberpunk 2077 ultra FPS diagram
| low | med. | high | ultra | |
|---|---|---|---|---|
| GTA V (2015) | 100.6 | 96.3 | 50 | 21.5 |
| Dota 2 Reborn (2015) | 85.9 | 65.7 | 61.7 | 53.2 |
| Final Fantasy XV Benchmark (2018) | 57.3 | 24.9 | 15.8 | |
| X-Plane 11.11 (2018) | 37.8 | |||
| Strange Brigade (2018) | 137 | 51 | 43 | 36 |
| Shadow of the Tomb Raider (2018) | 60 | 25 | 23 | |
| F1 22 (2022) | 57 | 50.1 | 38 | |
| Baldur's Gate 3 (2023) | 24.7 | 20.3 | 17.5 | 17 |
| Cyberpunk 2077 2.2 Phantom Liberty (2023) | 22.7 | 18.9 | 16.4 | 14.3 |
| Total War Pharaoh (2023) | 87.6 | 55.2 |
排放 - 日常情况下非常安静
噪音排放
Surface 13.8 笔记本电脑的风扇在日常使用中一般听不到声音。风扇长时间处于关闭状态,在轻微负载下也能保持 26 分贝(A)的噪音,非常安静。在玩游戏时,我们能从设备中听到最高 31.5 分贝(A)的噪音。只有在 CPU 满载和压力测试时,风扇才会迅速达到最高水平,约为 40 dB(A)。我们无法检测到任何其他电子噪音。
Noise Level
| Idle |
| 23.8 / 23.8 / 23.8 dB(A) |
| Load |
| 26 / 40.3 dB(A) |
 | ||
30 dB silent 40 dB(A) audible 50 dB(A) loud |
||
min: | ||
| Microsoft Surface Laptop 7 13.8 Copilot+ Adreno X1-85 3.8 TFLOPS, SD X Elite X1E-80-100, Samsung MZ9L4512HBLU-00BMV | Lenovo ThinkBook 13x G4 21KR0008GE Arc 7-Core, Ultra 5 125H, Samsung PM9C1a MZAL8512HDLU | Dell XPS 13 9340 Core Ultra 7 Arc 8-Core, Ultra 7 155H, Micron 2550 512GB | Apple MacBook Air 13 M3 10C GPU M3 10-Core GPU, M3, Apple SSD AP0512Z | Framework Laptop 13.5 Ryzen 7 7840U Radeon 780M, R7 7840U, WD PC SN740 512GB SDDPNQD-512G | HP Dragonfly G4 Iris Xe G7 96EUs, i7-1365U, Micron 3400 MTFDKBA512TFH 512GB | |
|---|---|---|---|---|---|---|
| Noise | -9% | -12% | -8% | -0% | ||
| off / environment * | 23.8 | 24.5 -3% | 25.1 -5% | 22.6 5% | 23.3 2% | |
| Idle Minimum * | 23.8 | 24.5 -3% | 25.1 -5% | 22.6 5% | 23.5 1% | |
| Idle Average * | 23.8 | 24.5 -3% | 25.1 -5% | 22.6 5% | 23.5 1% | |
| Idle Maximum * | 23.8 | 27.1 -14% | 25.1 -5% | 24.2 -2% | 26.8 -13% | |
| Load Average * | 26 | 33.3 -28% | 37.4 -44% | 35.8 -38% | 27.2 -5% | |
| Cyberpunk 2077 ultra * | 31.5 | |||||
| Load Maximum * | 40.3 | 40.7 -1% | 42.5 -5% | 48.9 -21% | 35 13% | |
| Witcher 3 ultra * | 36.8 | 42.5 | 46.5 | 32.7 |
* ... smaller is better
温度
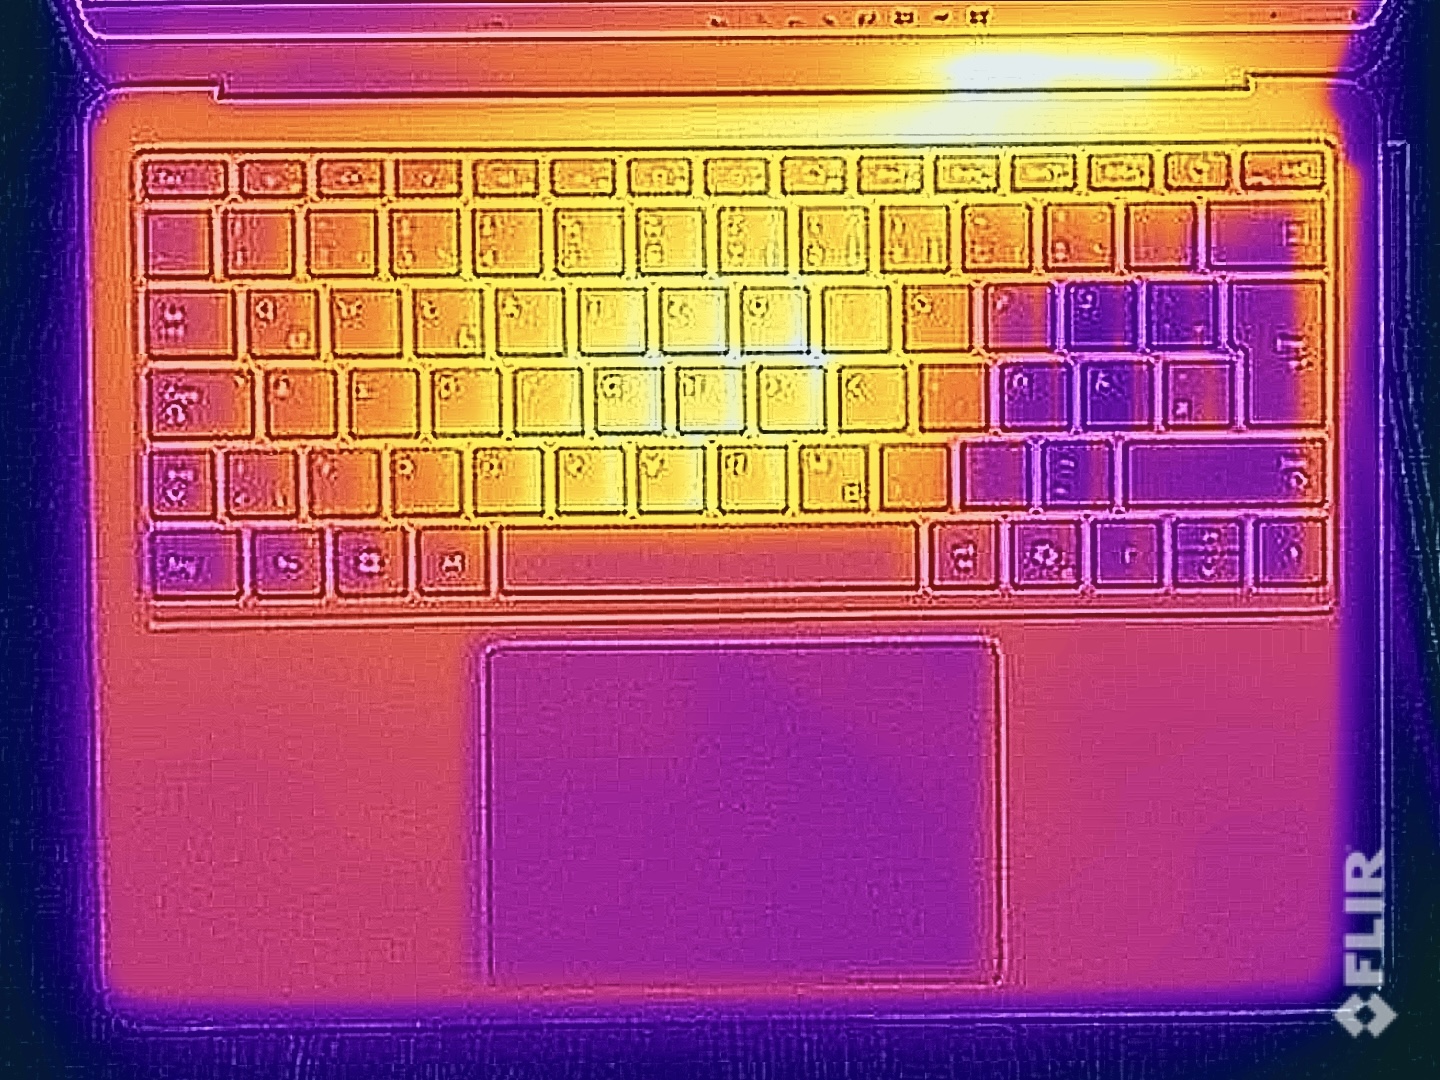
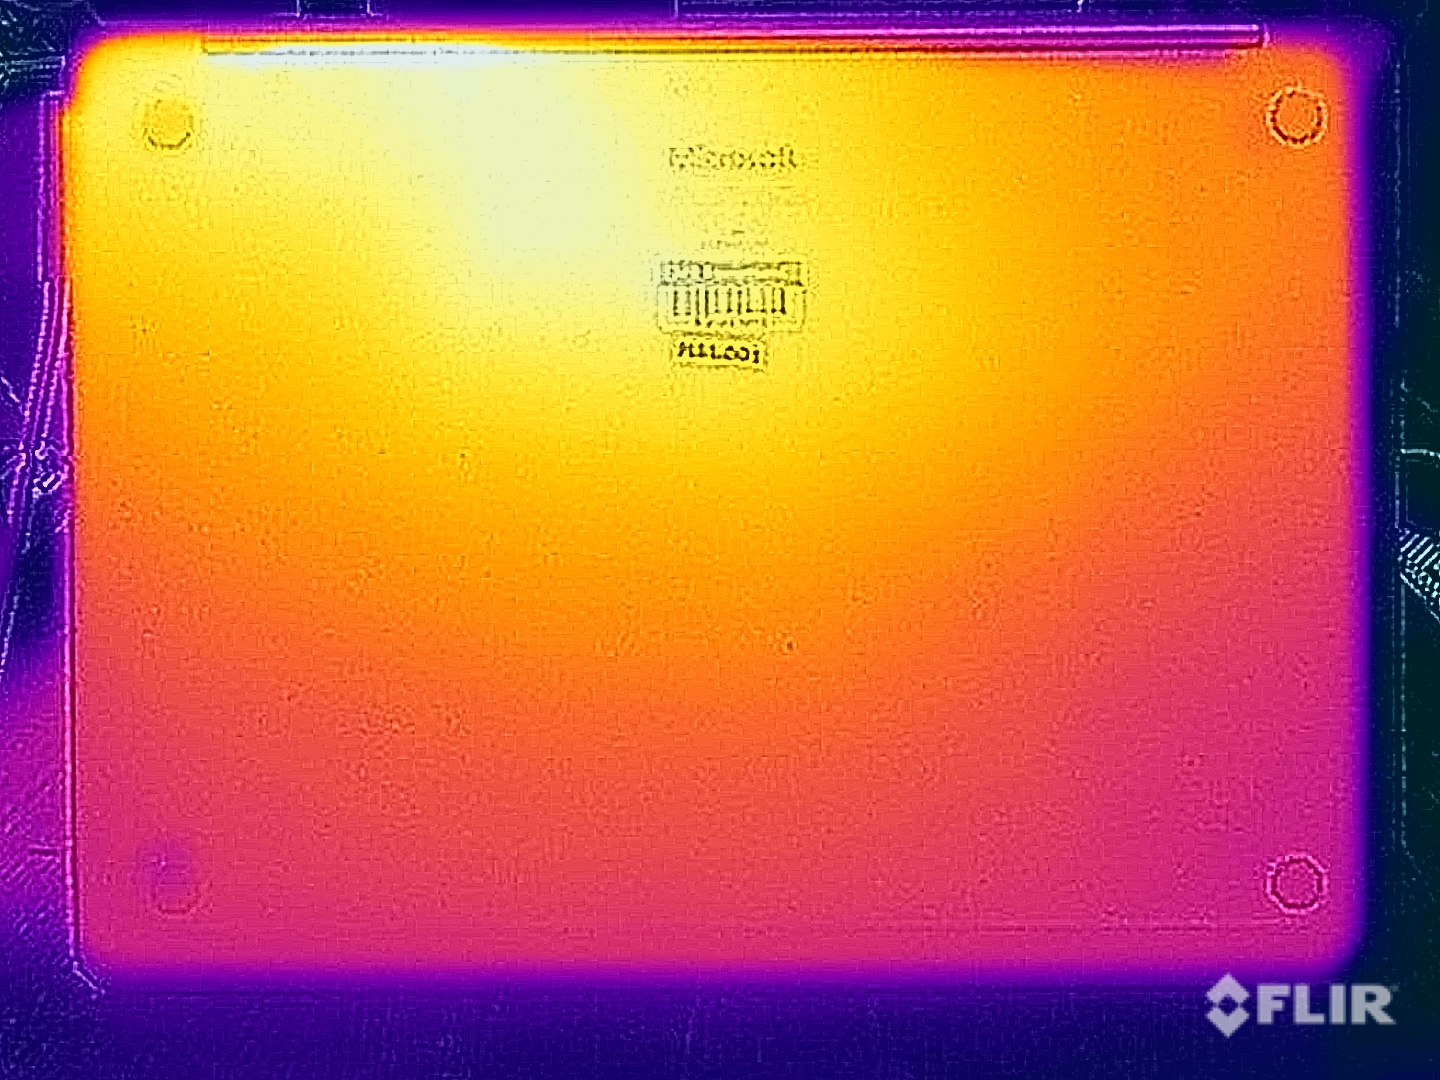
在空闲运行和执行要求不高的实际任务时,金属外壳几乎不会发热。但在玩游戏时,尤其是在 CPU 负载较高的情况下,这种情况很快就会发生变化,我们测得设备底座的温度高达 47 °C。由于金属外壳的缘故,这种情况已经令人不快,因此应避免将笔记本电脑放在膝盖上。同样,键盘也会发热,这可能会导致打字时受到限制。
(-) The maximum temperature on the upper side is 47.1 °C / 117 F, compared to the average of 35.9 °C / 97 F, ranging from 21.4 to 59 °C for the class Subnotebook.
(±) The bottom heats up to a maximum of 44.6 °C / 112 F, compared to the average of 39.3 °C / 103 F
(+) In idle usage, the average temperature for the upper side is 24.3 °C / 76 F, compared to the device average of 30.8 °C / 87 F.
(-) 3: The average temperature for the upper side is 40.9 °C / 106 F, compared to the average of 30.8 °C / 87 F for the class Subnotebook.
(+) The palmrests and touchpad are reaching skin temperature as a maximum (35.8 °C / 96.4 F) and are therefore not hot.
(-) The average temperature of the palmrest area of similar devices was 28.2 °C / 82.8 F (-7.6 °C / -13.6 F).
| Microsoft Surface Laptop 7 13.8 Copilot+ Qualcomm Snapdragon X Elite X1E-80-100, Qualcomm SD X Adreno X1-85 3.8 TFLOPS | Lenovo ThinkBook 13x G4 21KR0008GE Intel Core Ultra 5 125H, Intel Arc 7-Core iGPU | Dell XPS 13 9340 Core Ultra 7 Intel Core Ultra 7 155H, Intel Arc 8-Core iGPU | Apple MacBook Air 13 M3 10C GPU Apple M3, Apple M3 10-Core GPU | Framework Laptop 13.5 Ryzen 7 7840U AMD Ryzen 7 7840U, AMD Radeon 780M | HP Dragonfly G4 Intel Core i7-1365U, Intel Iris Xe Graphics G7 96EUs | |
|---|---|---|---|---|---|---|
| Heat | -2% | 2% | 7% | -8% | -1% | |
| Maximum Upper Side * | 47.1 | 43.1 8% | 41 13% | 44.3 6% | 42 11% | 38.6 18% |
| Maximum Bottom * | 44.6 | 39.2 12% | 43.5 2% | 43.4 3% | 47.4 -6% | 40.4 9% |
| Idle Upper Side * | 24.7 | 28.3 -15% | 25.3 -2% | 22.3 10% | 28.8 -17% | 28.2 -14% |
| Idle Bottom * | 24.5 | 28 -14% | 25.5 -4% | 22.1 10% | 29.6 -21% | 29 -18% |
* ... smaller is better
发言人
立体声扬声器表现出色,总体而言,质量与 戴尔 XPS 13 9340相近,但比 MacBook Air 13 M3尤其是 ThinkBook 13x G4.虽然只有在直接比较时才会发现这一点。
Microsoft Surface Laptop 7 13.8 Copilot+ audio analysis
(±) | speaker loudness is average but good (81.8 dB)
Bass 100 - 315 Hz
(±) | reduced bass - on average 12.7% lower than median
(±) | linearity of bass is average (9.8% delta to prev. frequency)
Mids 400 - 2000 Hz
(+) | balanced mids - only 4.1% away from median
(+) | mids are linear (2.4% delta to prev. frequency)
Highs 2 - 16 kHz
(+) | balanced highs - only 2.1% away from median
(+) | highs are linear (2.5% delta to prev. frequency)
Overall 100 - 16.000 Hz
(+) | overall sound is linear (12.1% difference to median)
Compared to same class
» 13% of all tested devices in this class were better, 4% similar, 83% worse
» The best had a delta of 5%, average was 19%, worst was 53%
Compared to all devices tested
» 8% of all tested devices were better, 2% similar, 90% worse
» The best had a delta of 4%, average was 24%, worst was 134%
Lenovo ThinkBook 13x G4 21KR0008GE audio analysis
(+) | speakers can play relatively loud (83.8 dB)
Bass 100 - 315 Hz
(±) | reduced bass - on average 9% lower than median
(±) | linearity of bass is average (8% delta to prev. frequency)
Mids 400 - 2000 Hz
(+) | balanced mids - only 2.4% away from median
(+) | mids are linear (2.9% delta to prev. frequency)
Highs 2 - 16 kHz
(+) | balanced highs - only 3.2% away from median
(+) | highs are linear (3.4% delta to prev. frequency)
Overall 100 - 16.000 Hz
(+) | overall sound is linear (8.6% difference to median)
Compared to same class
» 3% of all tested devices in this class were better, 1% similar, 97% worse
» The best had a delta of 5%, average was 19%, worst was 53%
Compared to all devices tested
» 2% of all tested devices were better, 1% similar, 97% worse
» The best had a delta of 4%, average was 24%, worst was 134%
Dell XPS 13 9340 Core Ultra 7 audio analysis
(+) | speakers can play relatively loud (83.2 dB)
Bass 100 - 315 Hz
(-) | nearly no bass - on average 17% lower than median
(±) | linearity of bass is average (9.3% delta to prev. frequency)
Mids 400 - 2000 Hz
(+) | balanced mids - only 2.1% away from median
(+) | mids are linear (4.7% delta to prev. frequency)
Highs 2 - 16 kHz
(+) | balanced highs - only 2.5% away from median
(+) | highs are linear (4.6% delta to prev. frequency)
Overall 100 - 16.000 Hz
(+) | overall sound is linear (11.6% difference to median)
Compared to same class
» 12% of all tested devices in this class were better, 3% similar, 85% worse
» The best had a delta of 5%, average was 19%, worst was 53%
Compared to all devices tested
» 7% of all tested devices were better, 2% similar, 91% worse
» The best had a delta of 4%, average was 24%, worst was 134%
Apple MacBook Air 13 M3 10C GPU audio analysis
(+) | speakers can play relatively loud (83.2 dB)
Bass 100 - 315 Hz
(±) | reduced bass - on average 13.3% lower than median
(±) | linearity of bass is average (11.3% delta to prev. frequency)
Mids 400 - 2000 Hz
(+) | balanced mids - only 0.4% away from median
(+) | mids are linear (1.6% delta to prev. frequency)
Highs 2 - 16 kHz
(+) | balanced highs - only 4.5% away from median
(+) | highs are linear (1.9% delta to prev. frequency)
Overall 100 - 16.000 Hz
(+) | overall sound is linear (10.7% difference to median)
Compared to same class
» 8% of all tested devices in this class were better, 3% similar, 89% worse
» The best had a delta of 5%, average was 19%, worst was 53%
Compared to all devices tested
» 5% of all tested devices were better, 1% similar, 94% worse
» The best had a delta of 4%, average was 24%, worst was 134%
能源管理 - 提高效率
耗电量
在屏幕亮度最低的情况下,新款 Surface 笔记本电脑的空闲运行效率特别高,当然,在高亮度下,600 cd/m² 的屏幕亮度也会大显身手。在负载情况下,最大功耗为 41 瓦,而在游戏时,这一数字仅为 39 瓦。附带的 39 瓦 PSU 足以满足电源需求,但在这种使用情况下,它缺乏同时为电池充电的能力。微软至少应该为 Snapdragon X Elite 版本配备功率更大的 PSU。
| Off / Standby | |
| Idle | |
| Load |
|
Key:
min: | |
| Microsoft Surface Laptop 7 13.8 Copilot+ SD X Elite X1E-80-100, Adreno X1-85 3.8 TFLOPS, Samsung MZ9L4512HBLU-00BMV, IPS, 2304x1536, 13.8" | Lenovo ThinkBook 13x G4 21KR0008GE Ultra 5 125H, Arc 7-Core, Samsung PM9C1a MZAL8512HDLU, IPS, 2880x1920, 13.5" | Dell XPS 13 9340 Core Ultra 7 Ultra 7 155H, Arc 8-Core, Micron 2550 512GB, IPS, 1920x1200, 13.4" | Apple MacBook Air 13 M3 10C GPU M3, M3 10-Core GPU, Apple SSD AP0512Z, IPS, 2560x1664, 13.6" | Framework Laptop 13.5 Ryzen 7 7840U R7 7840U, Radeon 780M, WD PC SN740 512GB SDDPNQD-512G, IPS, 2256x1504, 13.5" | HP Dragonfly G4 i7-1365U, Iris Xe G7 96EUs, Micron 3400 MTFDKBA512TFH 512GB, IPS, 1920x1280, 13.5" | Average Qualcomm SD X Adreno X1-85 3.8 TFLOPS | Average of class Subnotebook | |
|---|---|---|---|---|---|---|---|---|
| Power Consumption | -96% | -66% | -22% | -58% | -63% | -47% | -76% | |
| Idle Minimum * | 1.4 | 5.4 -286% | 3.8 -171% | 1.95 -39% | 4 -186% | 4.1 -193% | 3.61 ? -158% | 4.3 ? -207% |
| Idle Average * | 6.3 | 7.8 -24% | 7 -11% | 8.7 -38% | 6.5 -3% | 7.5 -19% | 6.9 ? -10% | 7.33 ? -16% |
| Idle Maximum * | 7.6 | 8.9 -17% | 7.3 4% | 8.9 -17% | 6.8 11% | 8.2 -8% | 7.87 ? -4% | 9.07 ? -19% |
| Load Average * | 26.9 | 49.4 -84% | 52.6 -96% | 34.3 -28% | 48 -78% | 35.5 -32% | 30.2 ? -12% | 45.2 ? -68% |
| Cyberpunk 2077 ultra * | 38.5 | |||||||
| Load Maximum * | 40.7 | 68.8 -69% | 62.7 -54% | 35.4 13% | 55.2 -36% | 66.5 -63% | 61 ? -50% | 69 ? -70% |
| Witcher 3 ultra * | 44.4 | 38.3 | 28.6 | 52.3 | 37.5 |
* ... smaller is better
Power consumption Cyberpunk 2077 / stress test
Power consumption with an external monitor
电池寿命
55 Wh 电池的续航时间也非常不错,但并不突出。在 Wi-Fi 测试中,在 150 d/m² 的条件下(占评测设备最大亮度的 57%),我们在 60 Hz 和 120 Hz 的条件下分别使用了 14 小时和 13 小时。在全亮度条件下,这些数字缩短为 7 小时 47 分钟(60 Hz)和 7 小时 27 分钟(120 Hz)。这意味着 Surface 笔记本电脑落后于 MacBook Air 和惠普 Dragonfly G4。
在视频测试中,微软笔记本电脑的表现非常出色,达到了 19 小时 41 分钟,但在这种情况下,微软笔记本电脑被 ThinkBook 13x G4 等产品击败。相比之下,在负载情况下,80 分钟后熄灯。在设备开启的情况下,使用 39 瓦 PSU 完成一个完整的充电周期需要 139 分钟(82 分钟后达到 80%,使用 65 瓦 PSU 则需要 111 分钟(58 分钟后达到 80%)。
| Microsoft Surface Laptop 7 13.8 Copilot+ SD X Elite X1E-80-100, Adreno X1-85 3.8 TFLOPS, 54 Wh | Lenovo ThinkBook 13x G4 21KR0008GE Ultra 5 125H, Arc 7-Core, 74 Wh | Dell XPS 13 9340 Core Ultra 7 Ultra 7 155H, Arc 8-Core, 55 Wh | Apple MacBook Air 13 M3 10C GPU M3, M3 10-Core GPU, 52.6 Wh | Framework Laptop 13.5 Ryzen 7 7840U R7 7840U, Radeon 780M, 61 Wh | HP Dragonfly G4 i7-1365U, Iris Xe G7 96EUs, 68 Wh | Average of class Subnotebook | |
|---|---|---|---|---|---|---|---|
| Battery Runtime | 10% | 14% | 36% | -15% | 76% | 7% | |
| H.264 | 1181 | 1229 4% | 1053 -11% | 1044 -12% | 961 ? -19% | ||
| WiFi v1.3 | 852 | 684 -20% | 769 -10% | 914 7% | 726 -15% | 954 12% | 757 ? -11% |
| Load | 80 | 116 45% | 131 64% | 171 114% | 192 140% | 121.3 ? 52% |
Pros
Cons
结论 - 兼容性有问题的好笔记本电脑
新款 Surface Laptop Copilot+ 基本上是一款不错的笔记本电脑,但也有一些客户应该了解的局限性。从本质上讲,新的骁龙处理器提供了良好的性能,ARM 版本的 Windows 也运行得很好。因此,在日常使用时,你应该不会注意到 ARM 设备与 AMD 或英特尔处理器之间的区别。不过,ARM 处理器也有兼容性方面的限制,因为并不是所有的应用程序都能正常运行,尤其是旧版本的软件或需要特殊驱动程序的程序。游戏也是如此,存在很多问题。此外,在满负荷工作时,你会发现笔记本电脑的小型冷却系统噪音很大,温度很高。
就硬件本身而言,我们只有少量批评的理由,因为金属外壳是优质的,可以轻松打开。输入设备非常好,IPS 除了反光强烈之外给人留下了深刻印象,考虑到电池容量,电池续航时间也非常不错。不过,像往常一样,这取决于你如何使用它,因为如果你用力按压设备,不到 1.5 小时电池就会没电。一些竞争对手的续航时间也更长。
新款 Surface Laptop 13.8 Copilot+ 对于使用当前软件版本且不想玩游戏的日常用户来说,是一款非常不错的电脑。不过,在这种情况下,配备骁龙 X Plus 的更便宜的基本版本更有意义。
如果你能接受这些限制,我们仍然推荐配备骁龙 X Plus 的基本版本。它们的规格大致相同,而且 我们的分析在我们的分析中,我们已经观察到骁龙 X Plus 在日常情况下的运行速度并没有明显变慢。256 GB SSD 可以轻松更换,这意味着你可以避免微软的高额附加费(从 256 GB 升级到 512 GB 需要 250 美元)。
与 Apple MacBook Air 13相比,Surface Laptop 具有一些优势,例如固态硬盘扩展、亮度稍高、120 Hz 的触摸屏或在日常使用中仍有意义的 USB-A 端口。在电池续航时间方面,Surface Laptop 与 MacBook Air 13 持平。 MacBook Air要轻薄得多,而且仍具有被动散热的巨大优势。
与当前其他 Windows 笔记本电脑相比,Surface Laptop 也不占优势,因为评测设备的价格较高,而且除了在日常情况下风扇会稍微安静一些以及额外的 Copilot+ AI 功能(但这是有时间限制的,很快就会在即将推出的 Zen5 和 Lunar Lake 笔记本电脑上提供)外,采用 ARM 处理器的 Windows 笔记本电脑没有真正的优势。如果采用标准的 5G 调制解调器,本可以获得优势,但微软选择不在 Surface 笔记本电脑中采用这一功能。
价格和供应情况
配备骁龙 X Elite 的全新 Surface Laptop 13 Copilot+ 在亚马逊上的售价为 1669 美元。配备骁龙 X Plus 和 256 GB 固态硬盘的基本型号售价为 1069 美元。.
注:我们最近更新了评级系统,第 8 版的结果与第 7 版的结果不具可比性。更多信息 此处.
Microsoft Surface Laptop 7 13.8 Copilot+
- 07/04/2024 v8
Andreas Osthoff
 Total Sustainability Score:
 Transparency
The selection of devices to be reviewed is made by our editorial team. The test sample was provided to the author as a loan by the manufacturer or retailer for the purpose of this review. The lender had no influence on this review, nor did the manufacturer receive a copy of this review before publication. There was no obligation to publish this review. We never accept compensation or payment in return for our reviews. As an independent media company, Notebookcheck is not subjected to the authority of manufacturers, retailers or publishers.
This is how Notebookcheck is testing
Every year, Notebookcheck independently reviews hundreds of laptops and smartphones using standardized procedures to ensure that all results are comparable. We have continuously developed our test methods for around 20 years and set industry standards in the process. In our test labs, high-quality measuring equipment is utilized by experienced technicians and editors. These tests involve a multi-stage validation process. Our complex rating system is based on hundreds of well-founded measurements and benchmarks, which maintains objectivity. Further information on our test methods can be found here.
Price comparison

