

Zotac Zone 评测:丰富的显示屏与同级领先的输入
首款配备 120 Hz OLED 的基于 Windows 的掌上电脑。
Zone 配备了许多新颖的想法和目前最好的输入设备,但这款配备 7 英寸 OLED 显示屏的掌上电脑在软件方面可能还需要进一步改进。Anubhav Sharma, 👁 Alexander Wätzel (translated by DeepL / Ninh Duy) Published 🇺🇸 🇹🇷 ...
评语:令人惊叹的游戏体验,但还需进一步打磨
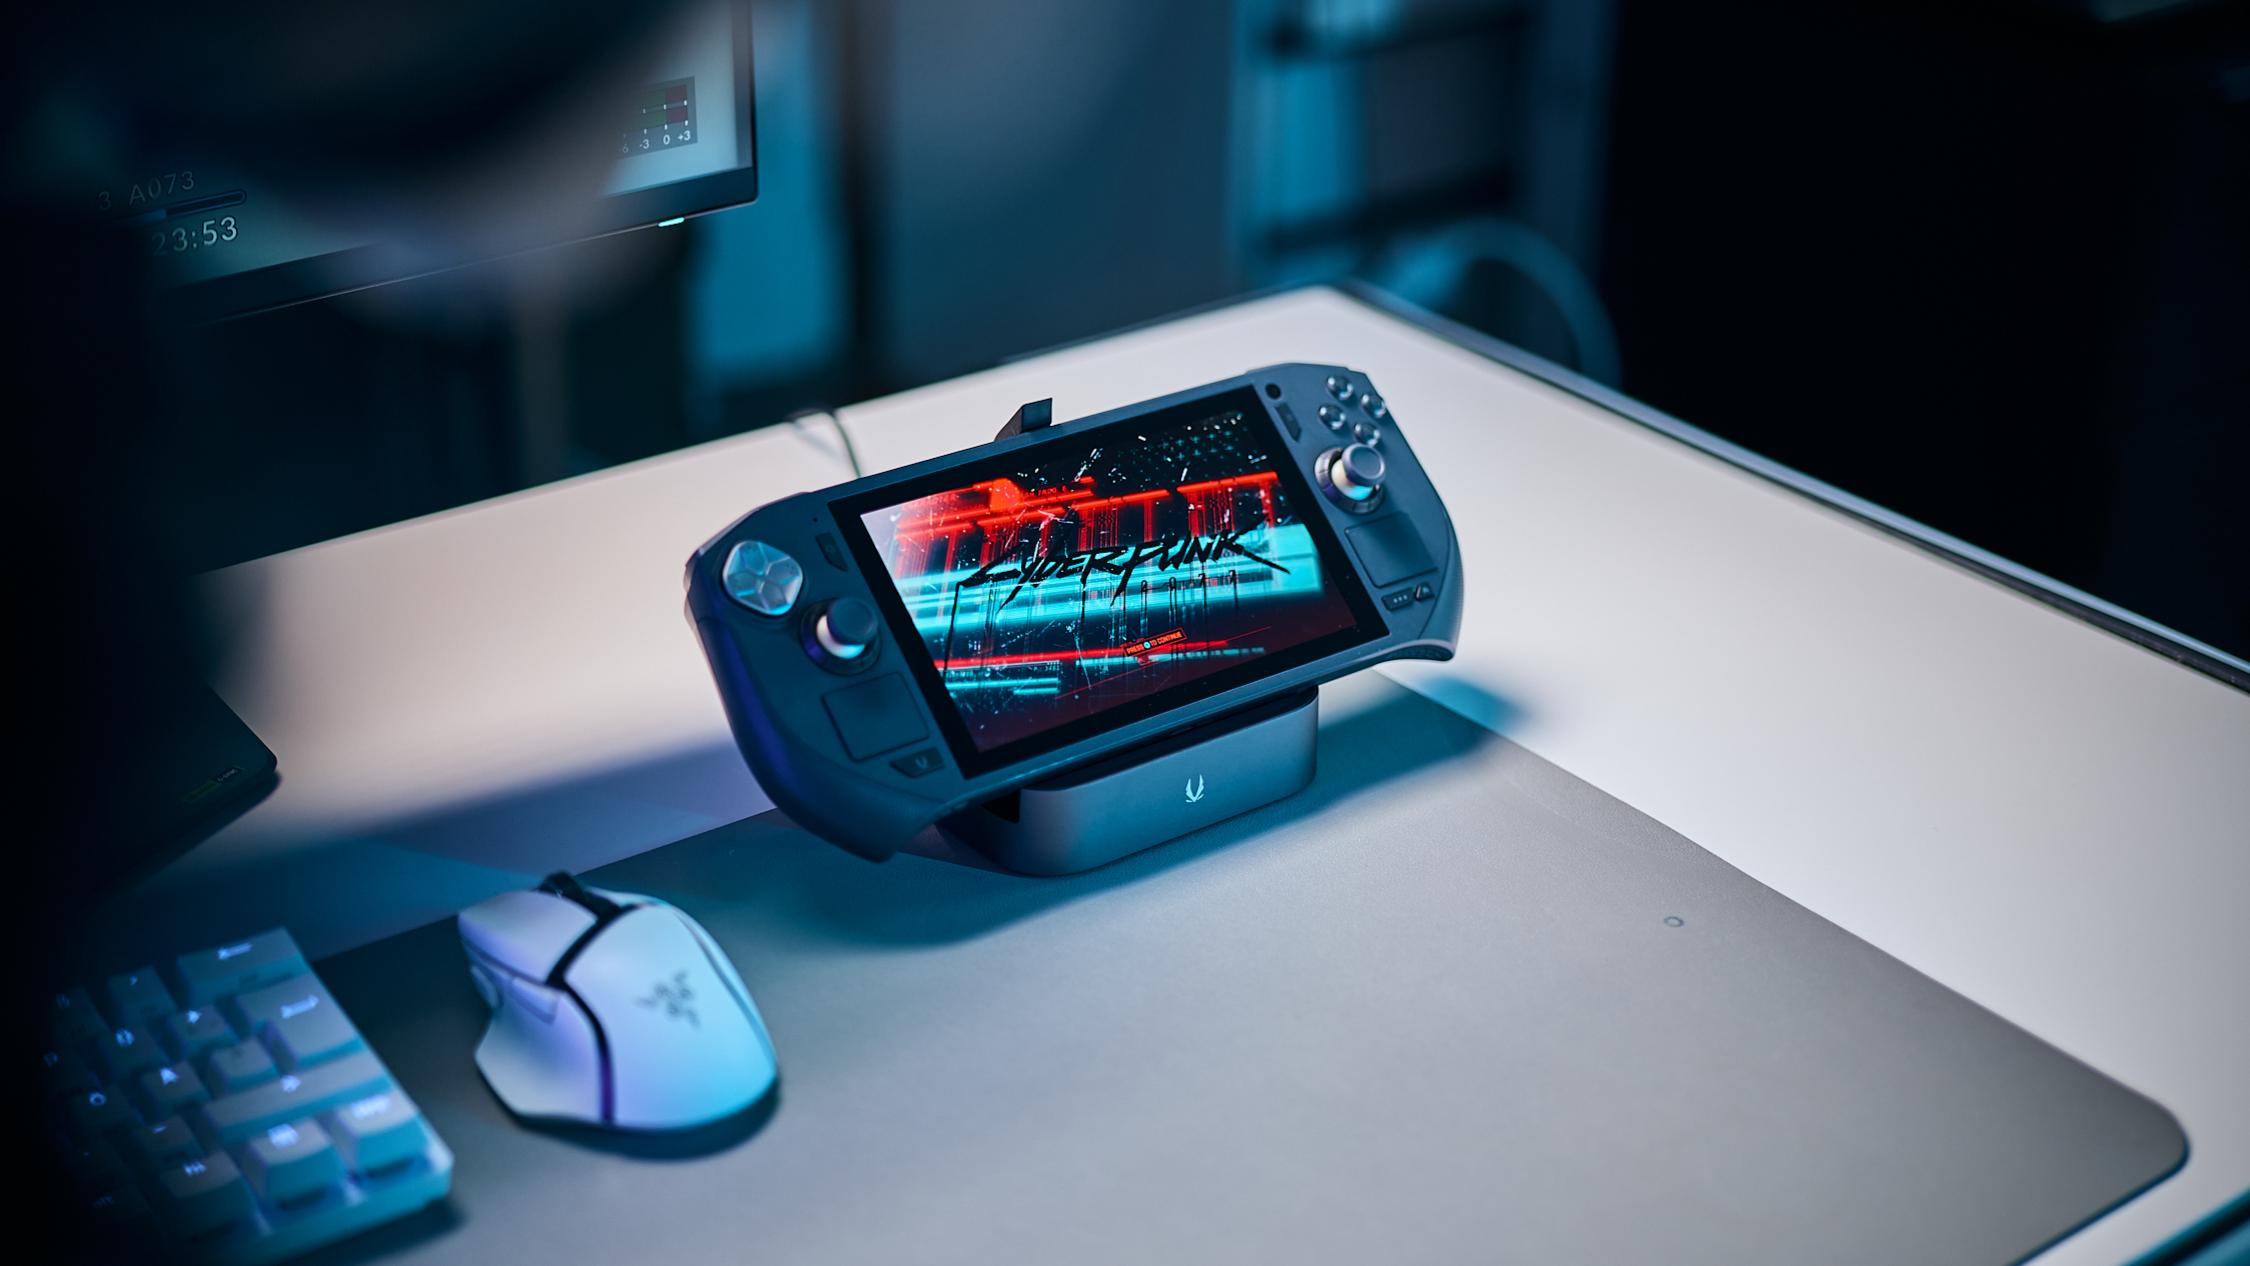
来自 Zotac 的好朋友们显然以前见过 Steam Deck(OLED),甚至可能还拿过 ROG Ally X 或微星的 Claw,因为他们自己的首款掌上电脑显然从既定的竞争产品中汲取了一些灵感。因此,虽然整体外形和尺寸与竞争对手十分相似,但 Zone 设法在基于 Windows 的掌上电脑配方中添加了足够多的独特功能和新创意,从而创造了自己的特色。Zotac 凭借华丽的 120Hz OLED 屏幕、令人惊叹且基本领先于同类产品的输入、价格合理的配件选择以及不相上下的性能,开了个好头。
遗憾的是,Team Red 的 Ryzen APU 开箱后无法发挥最佳性能,软件体验也需要改进,但考虑到这几乎是所有制造商在发布时都会遇到的问题,我们期待最终产品能有重大改进。
因此,让我们看看 Zotac Zone 是否还能在当今的掌上电脑市场占有一席之地。
Pros
Cons
潜在的竞争对手比较
Image | Model / Review | Price | Weight | Height | Display |
|---|---|---|---|---|---|
1.  | Zotac ZGC-G1A1W-01 AMD Ryzen 7 8840U ⎘ AMD Radeon 780M ⎘ 16 GB Memory | 849 Euro | 692 g | 7.00" 1920x1080 315 PPI | |
2. 84.6%  | Asus ROG Ally X AMD Ryzen Z1 Extreme ⎘ AMD Radeon 780M ⎘ 24 GB Memory, 1024 GB SSD | 899 Euro | 685 g | 36.9 mm | 7.00" 1920x1080 315 PPI IPS |
3. 66.3%  | Lenovo Legion Go AMD Ryzen Z1 Extreme ⎘ AMD Radeon 780M ⎘ 16 GB Memory, 512 GB SSD | 800 Euro | 845 g | 41 mm | 8.80" 2560x1600 343 PPI IPS |
4. 77.4%  | MSI Claw Intel Core Ultra 7 155H ⎘ Intel Arc 8-Core iGPU ⎘ 16 GB Memory, 1024 GB SSD | 849 Euro | 672 g | 33 mm | 7.00" 1920x1080 315 PPI IPS |
5. 88.9% v7 (old)  | Valve Steam Deck 1 TB OLED AMD Steam Deck OLED APU ⎘ AMD Radeon Steam Deck 8CU ⎘ 16 GB Memory, 1024 GB SSD | 679 Euro | 640 g | 49 mm | 7.40" 1280x800 204 PPI OLED |
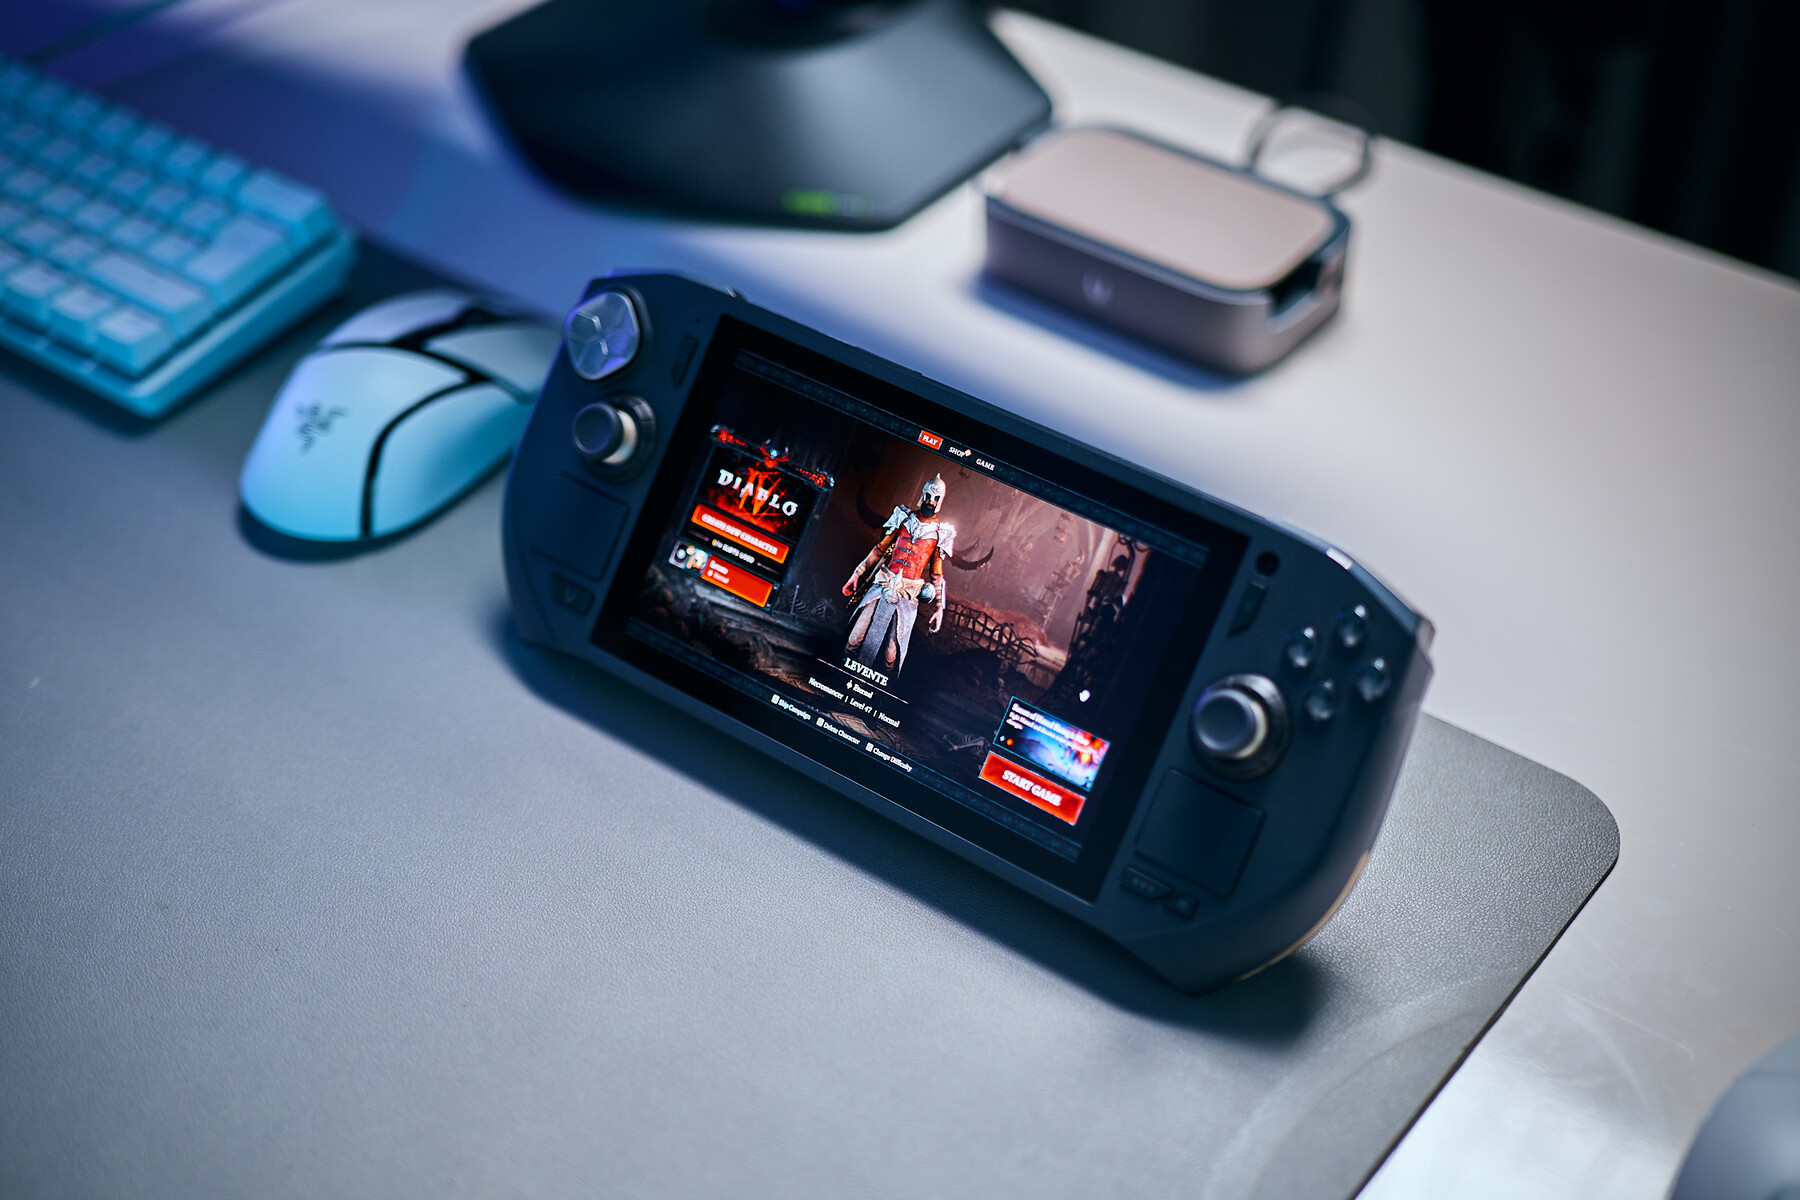
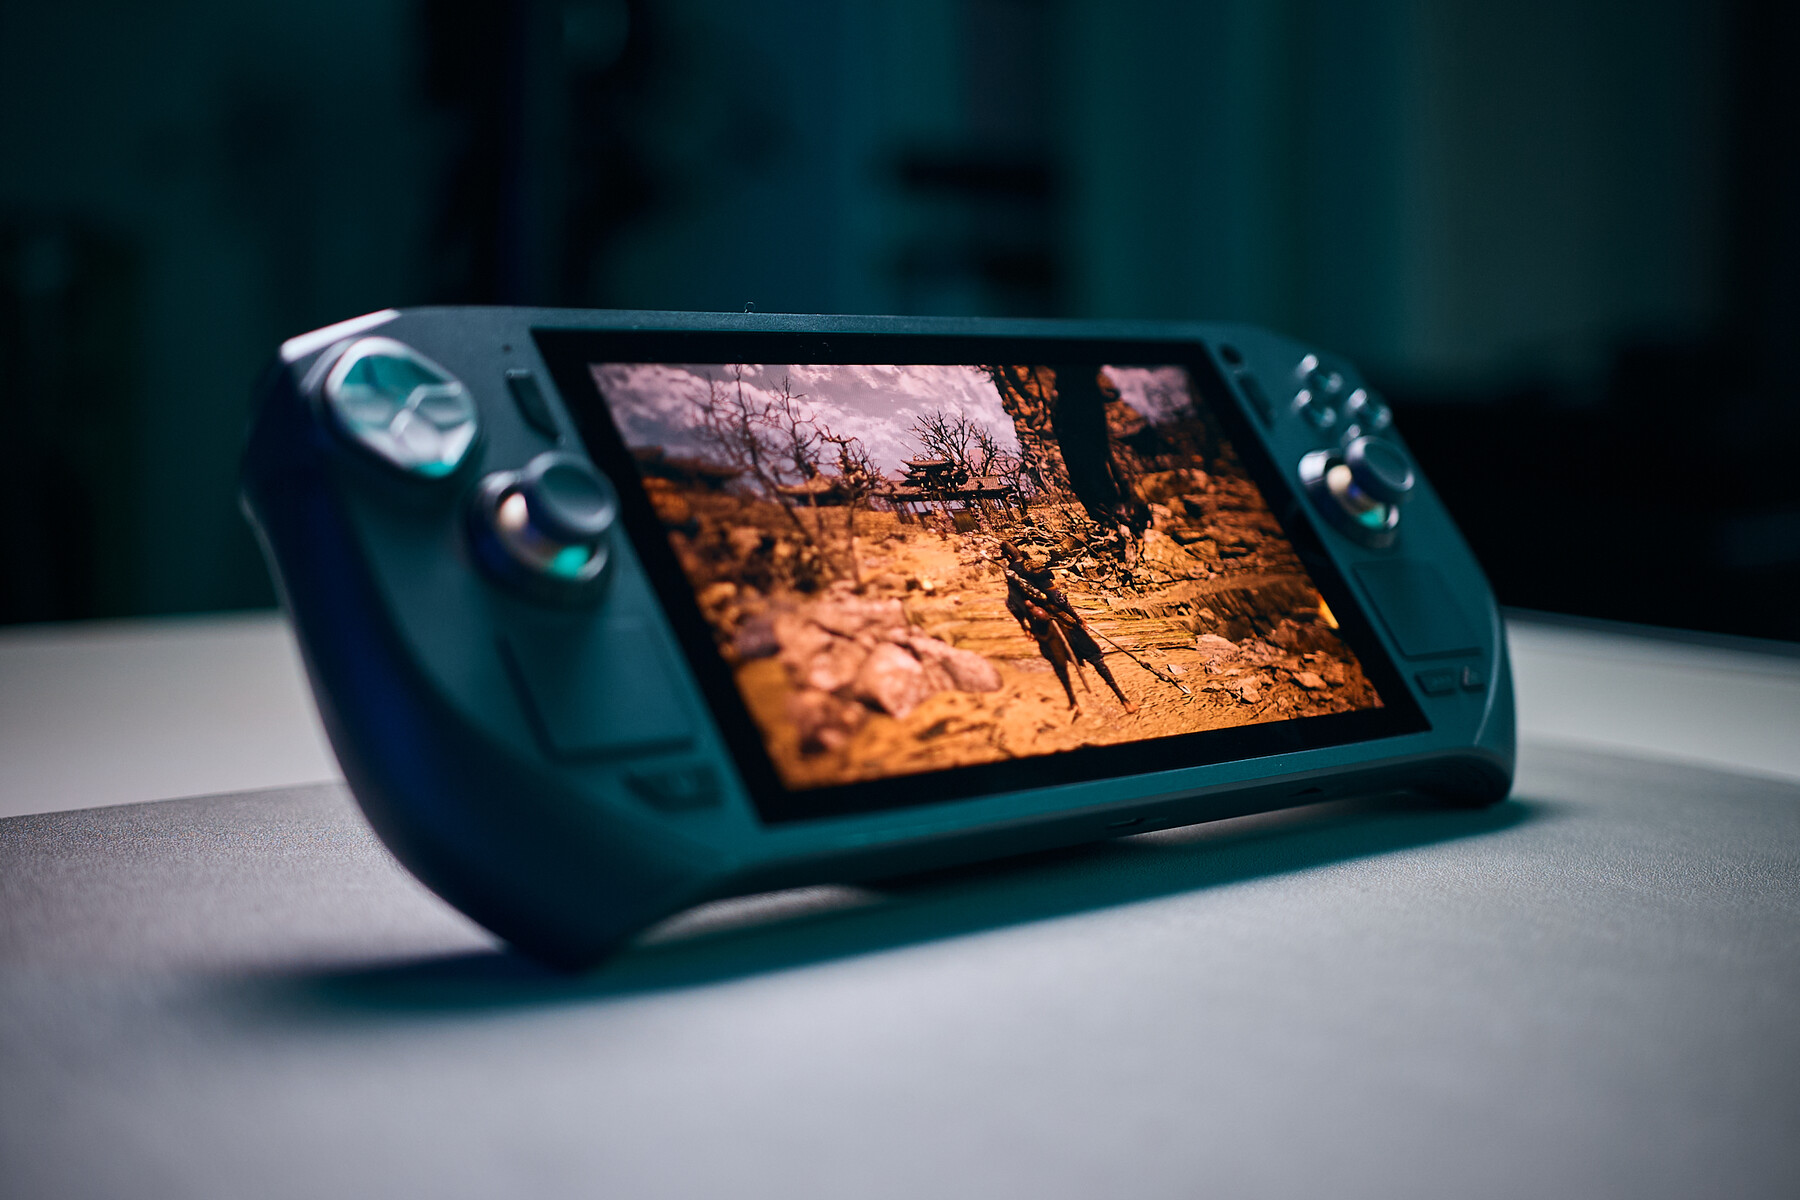
现在,掌上游戏市场相当火爆,而 Zotac 推出了新款 Zotac Zone。这款基于 Windows 的掌上游戏机配备了 OLED 显示屏、 霍尔效应触发器,以及由 AMD.尽管市场已经相当拥挤,尤其是像 华硕 ROG Ally X和 蒸汽甲板(OLED)和 Steam Deck(OLED)等设备的引领下,Zone 的一些突出特点可能会使其在竞争中占据优势。尽管性能和整体软件体验让我们褒贬不一,但凭借令人难以置信的明亮显示屏和可定制的控制功能,Zone 希望为自己开辟一个利基市场。
Zone上市时只有一种配置,售价为849欧元。我们还没有关于美元价格的消息,但一旦有相关信息,我们将立即更新文章。
作为免责声明,这只是一个相对较早的样品,并非完整的最终评测机型。不过,Zotac 仍然有足够的信心让我们进行了大量的测试,因此我们还是可以提供一些适当的数据。我们无法在启用 HDR 的情况下进行任何显示测量,我们的样品电池还存在一些问题,触摸板也在为最终版本进行调整。
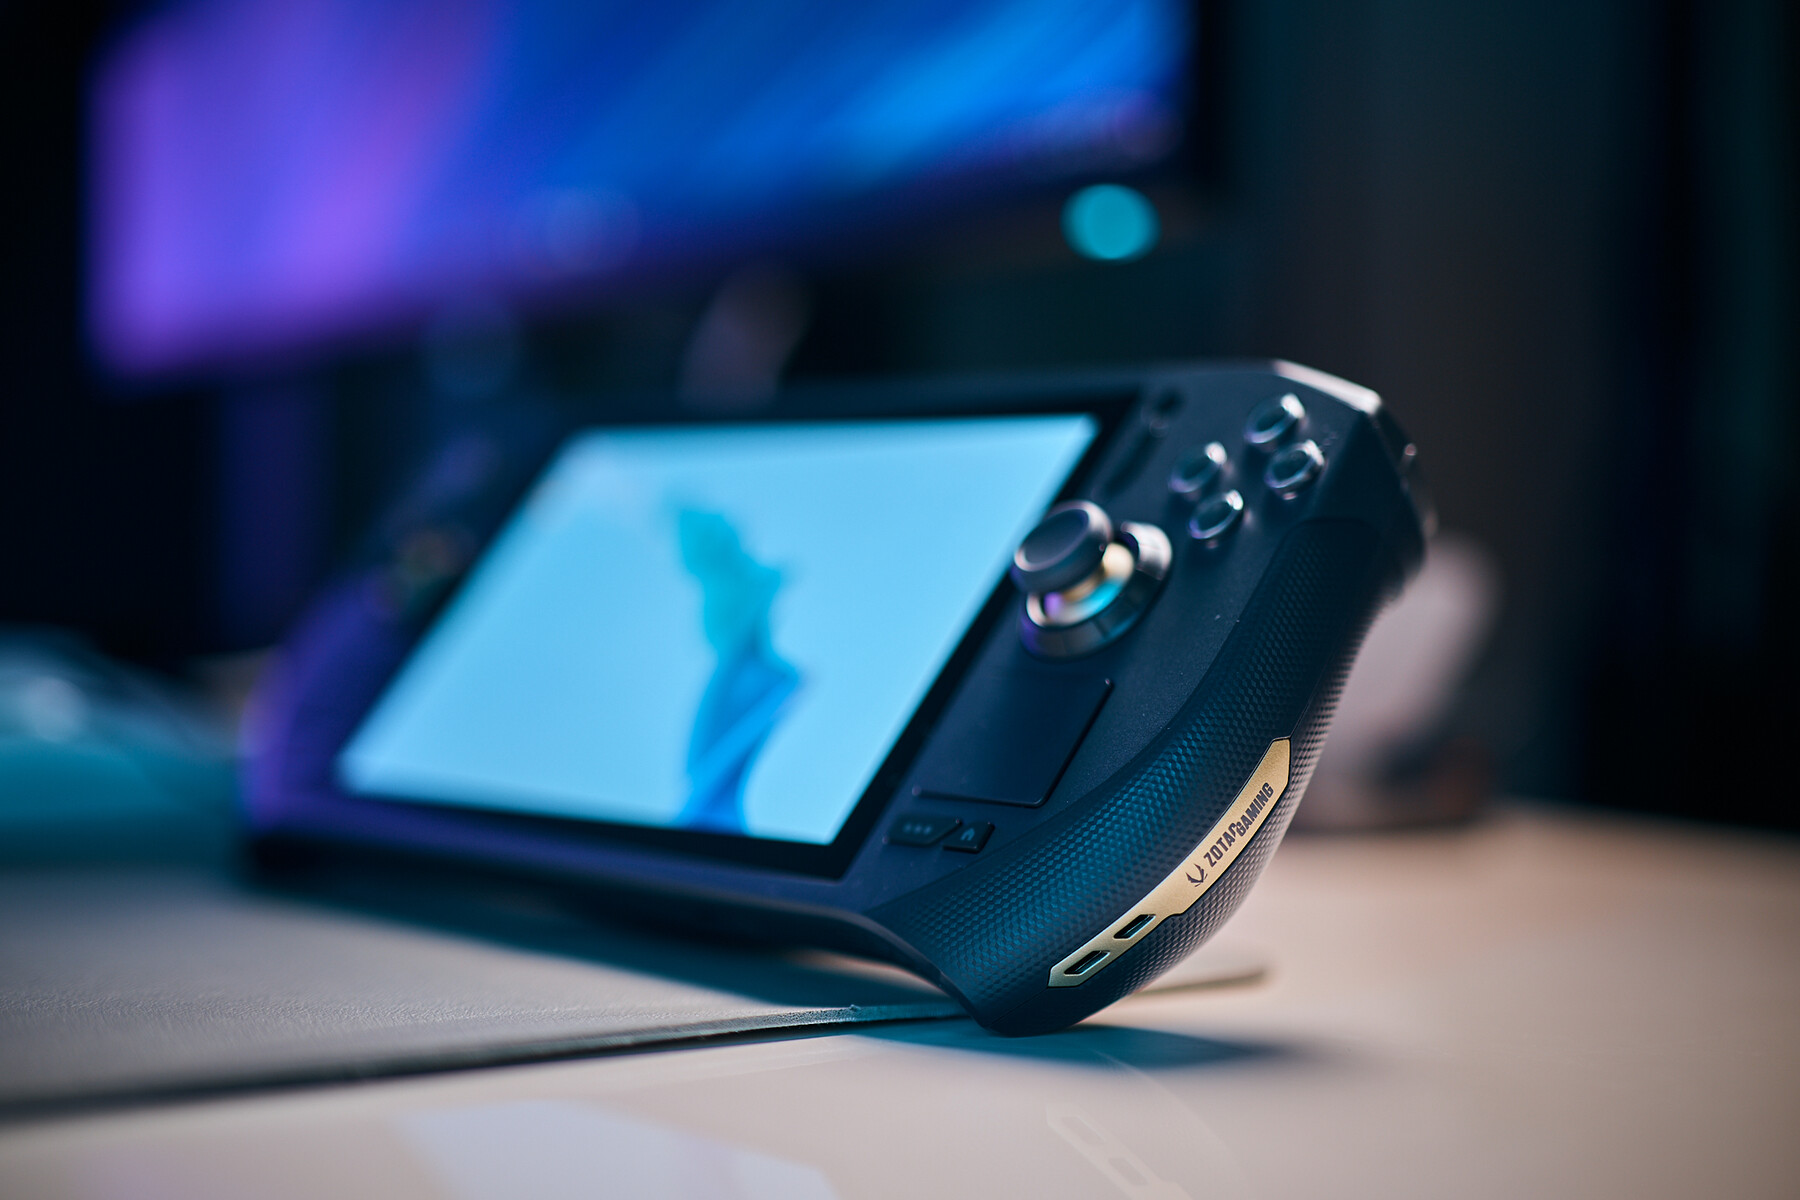
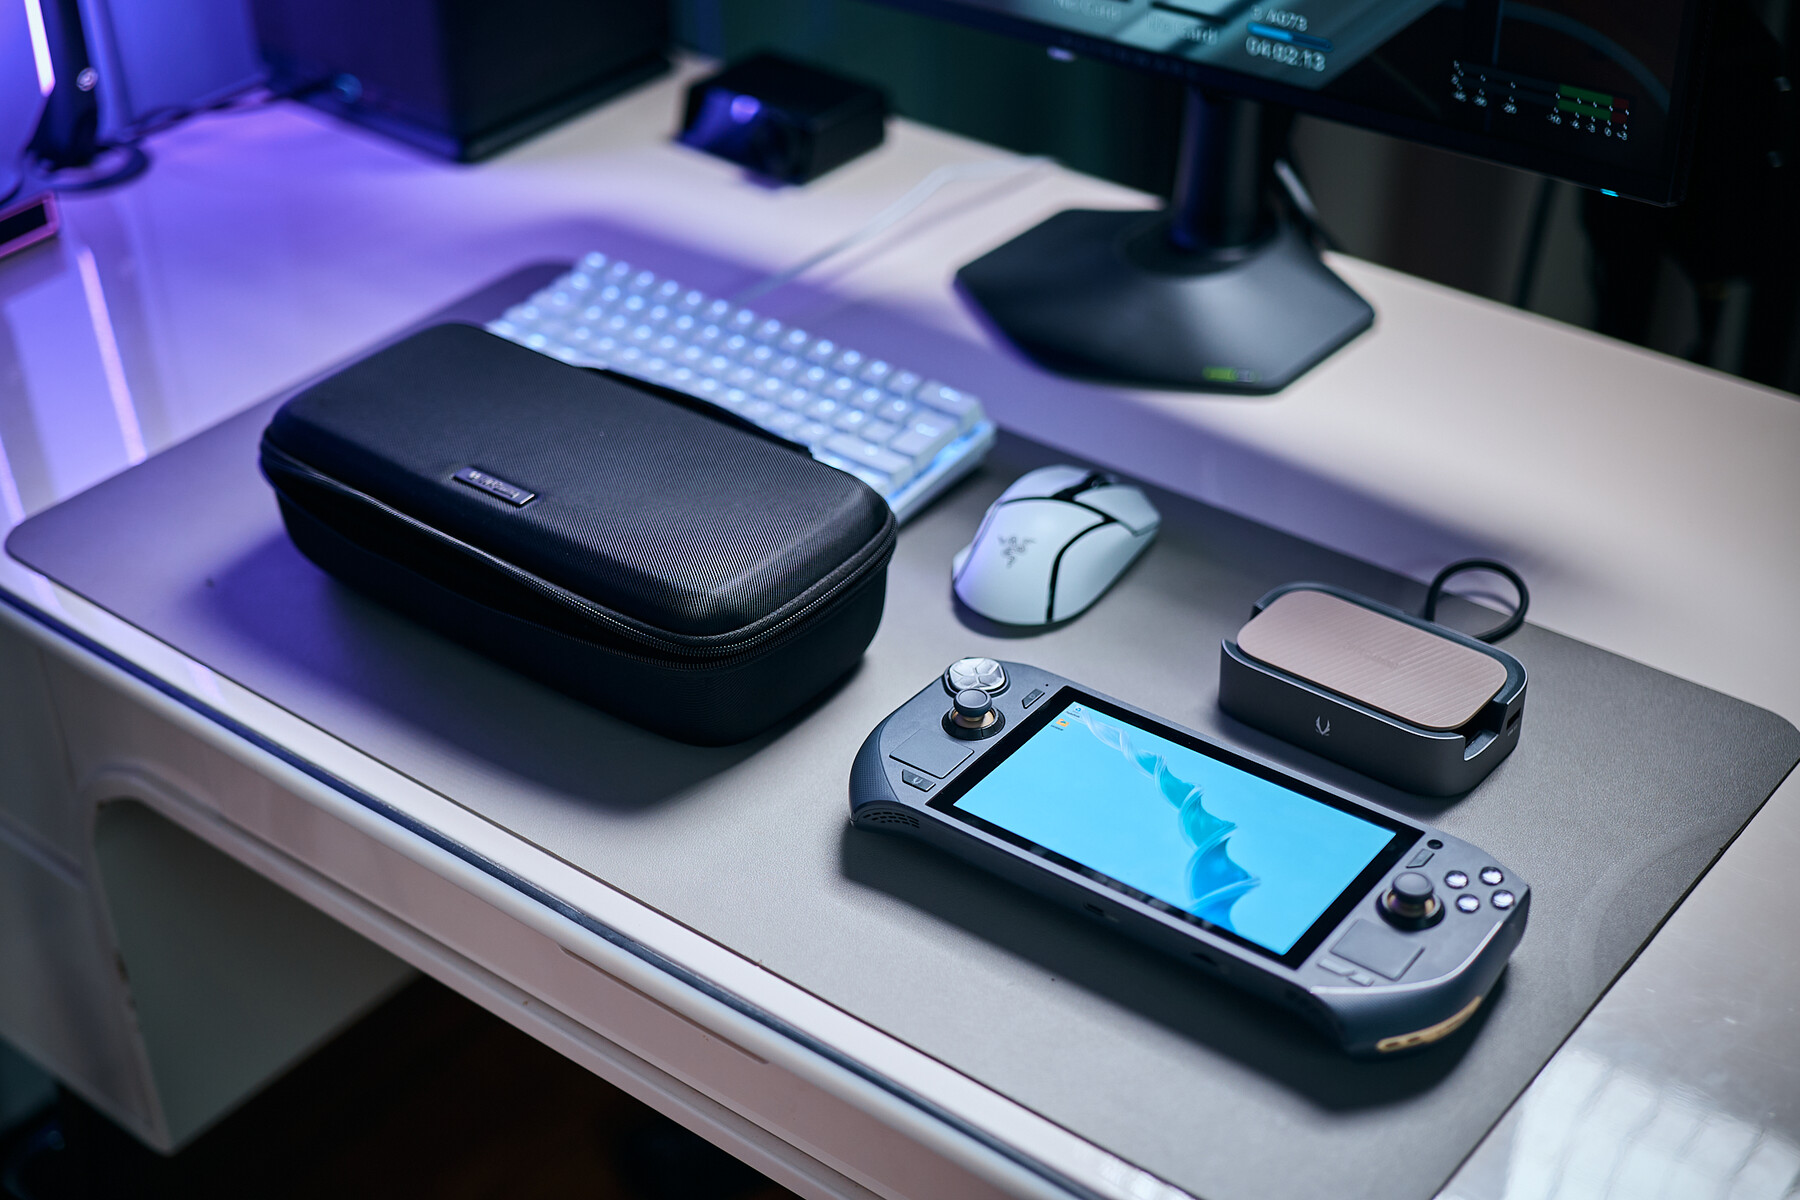
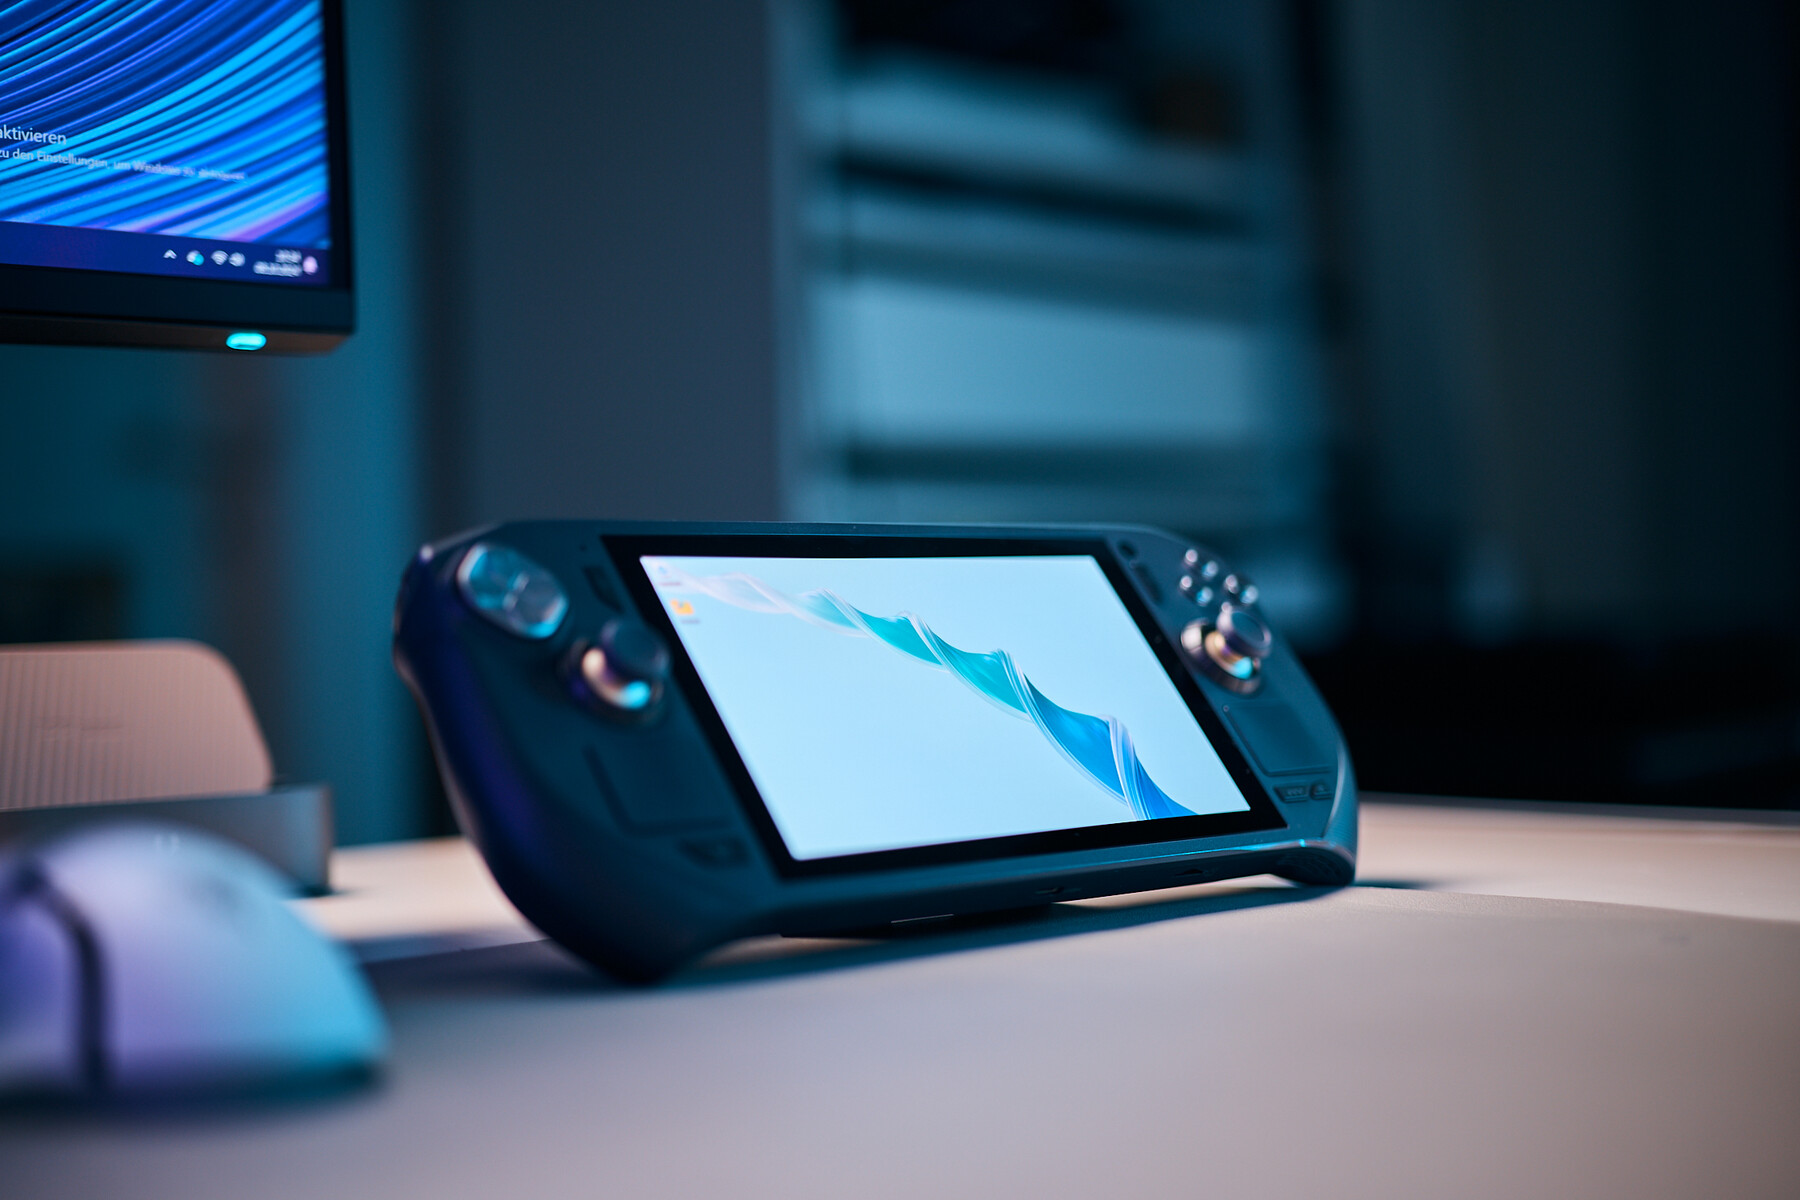
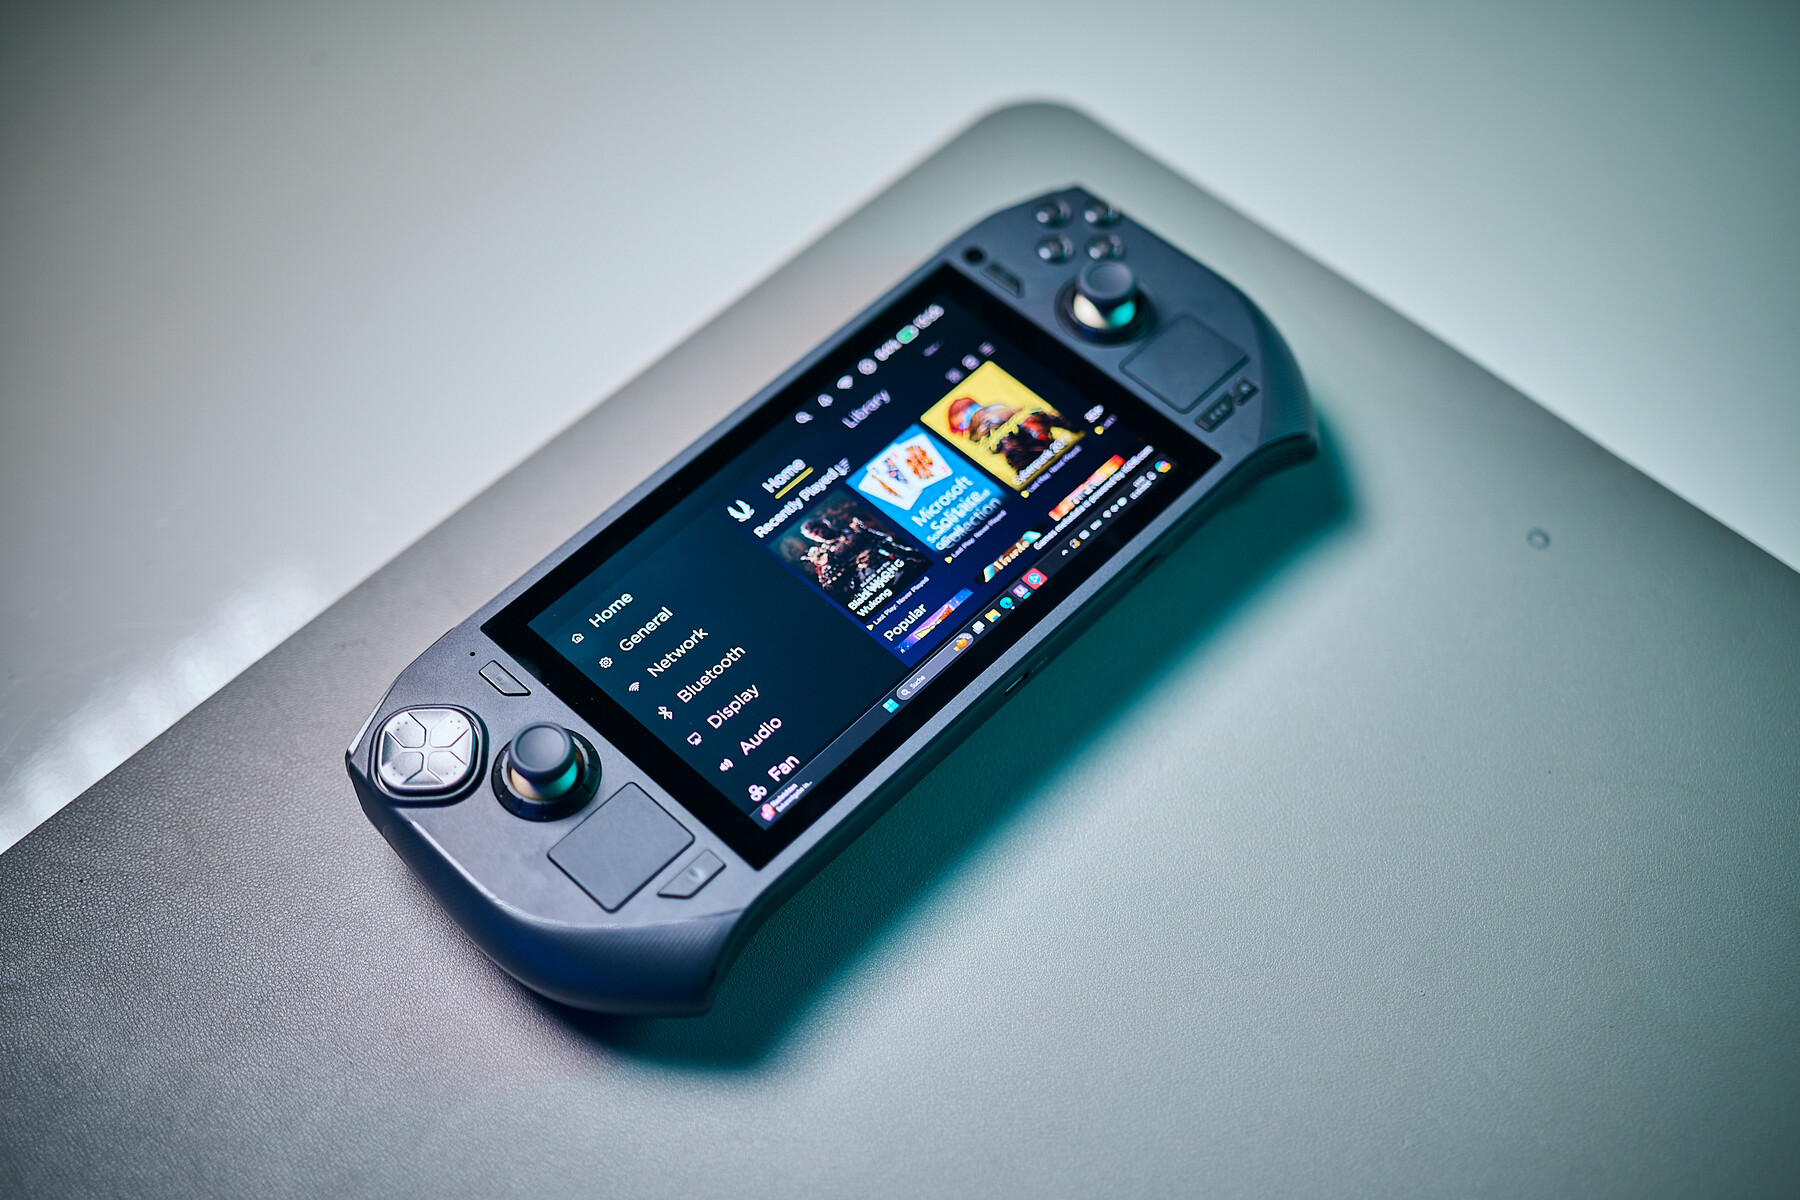
案例 - 灰色调
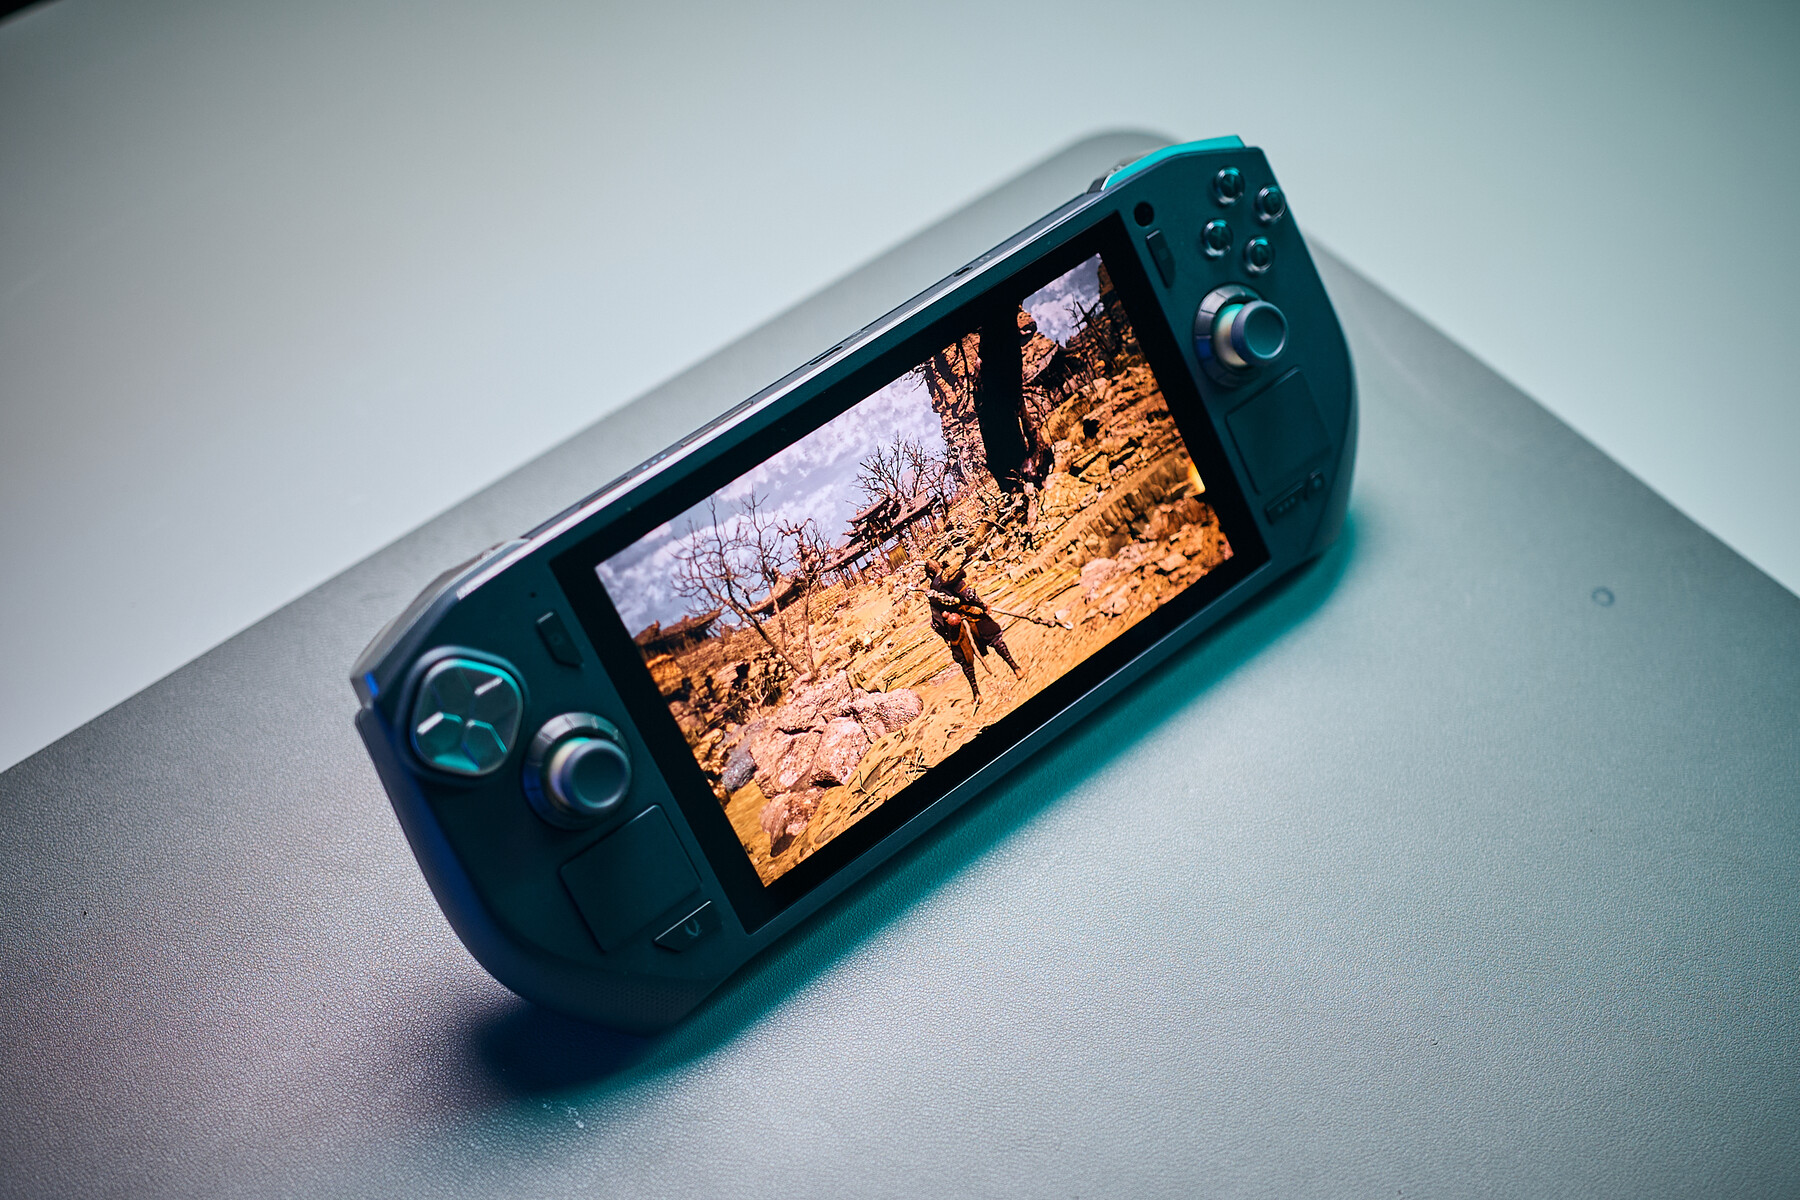
Zone 与其他 Windows 竞争对手(如前面提到的 Ally X 或 微星爪在整体形状、尺寸和重量方面都不相上下。Zotac 在人体工学方面的设计非常出色,这款产品握起来非常舒适,手柄足够深,控制按钮布局合理。我们尤其喜欢机身下部的圆角设计,即使在长时间的游戏过程中,手部的定位也非常自然。
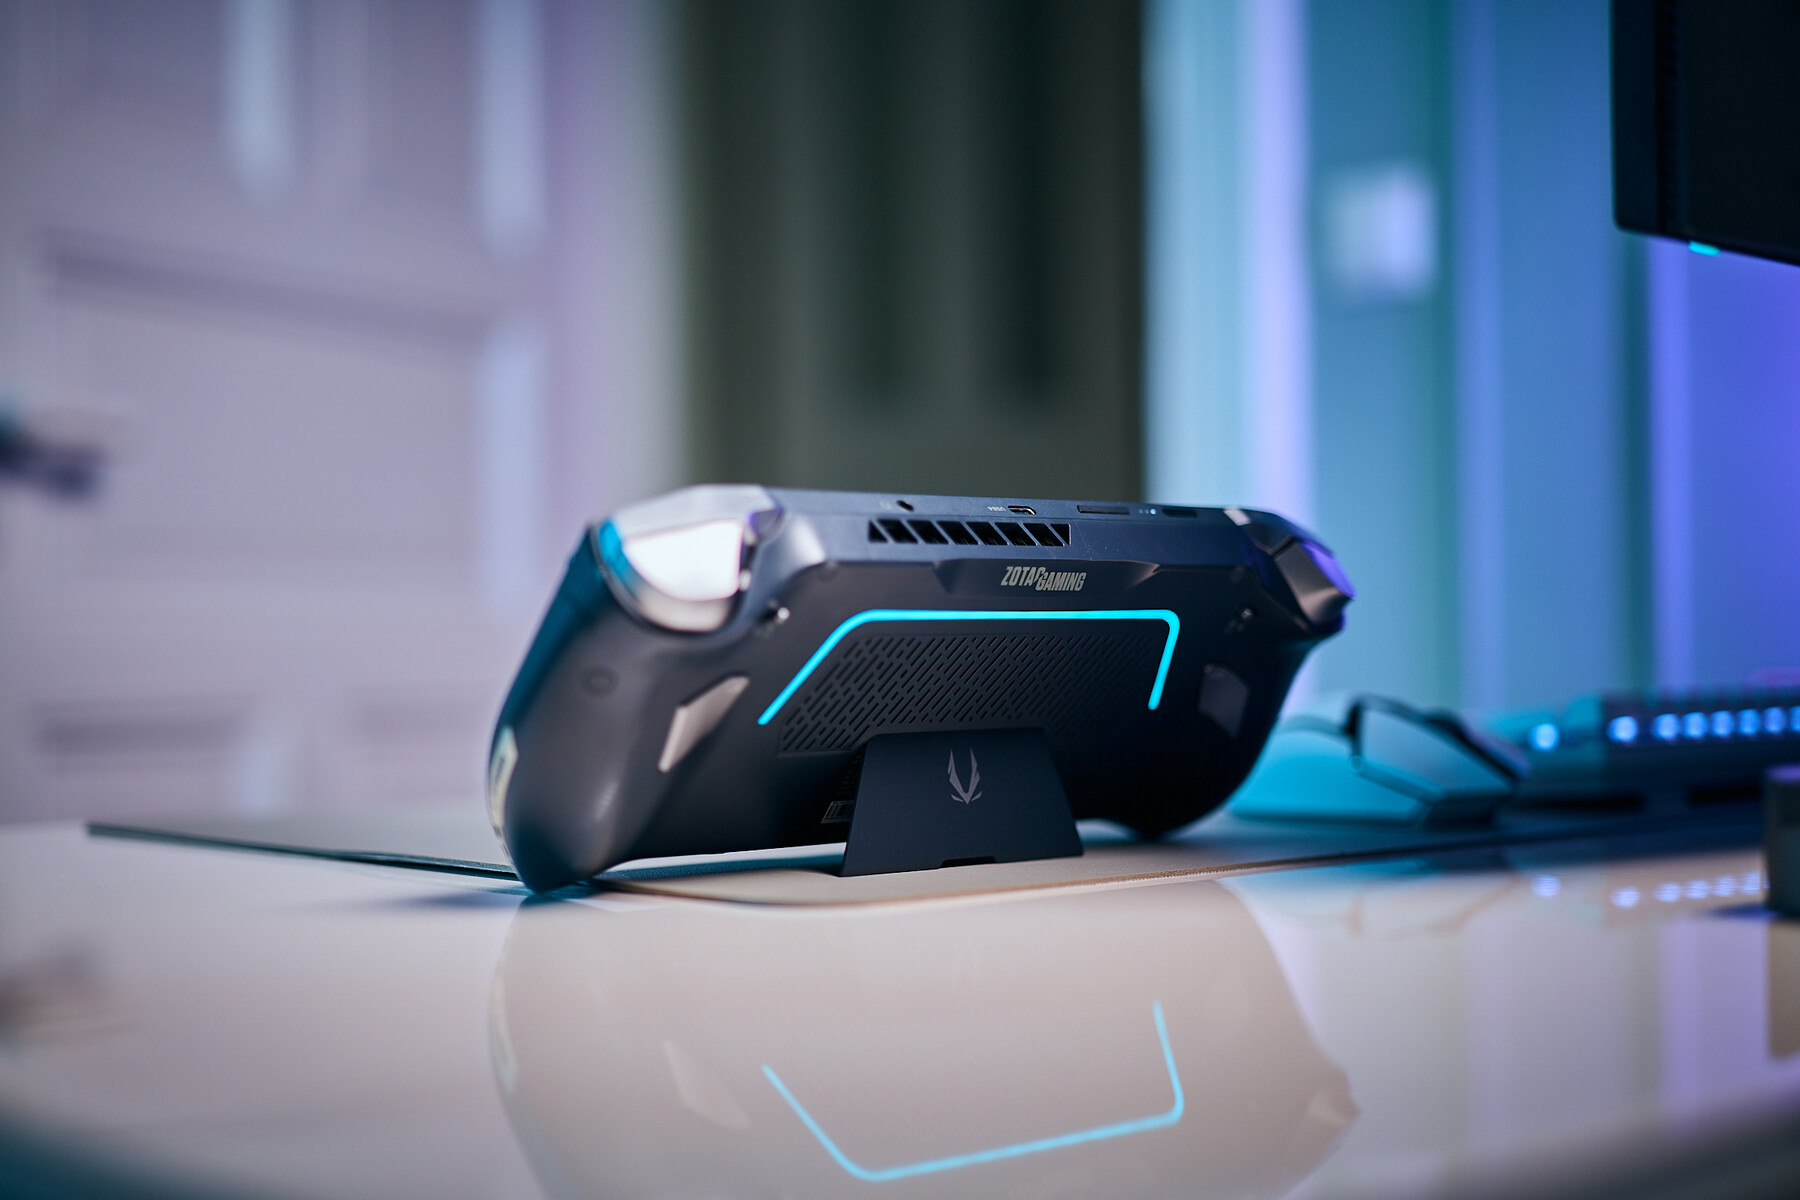
Zone 还配备了一个小支架,虽然不是最坚固的,但如果你只是想在闪亮的新 OLED 手持设备上看点东西,它绝对是非常方便的。
这款小手持设备的整体感觉相当不错。当然,它全身都是塑料,但手感足够致密和高档,尽管我认为 Ally X 略胜一筹。
深灰色可能并不适合所有人,但通过浅色、近乎银色的点缀,Zotac 成功地创造出了一种独特的外观,在大多数纯黑色的竞争对手中脱颖而出。
连接性 - USB 4.0 上下接口
在输入/输出方面,Zotac Zone 配备了一对 USB-C 4 端口,为充电和连接外设提供了相当大的灵活性。此外,Zone 还配备了一个耳机插孔和一个 microSD 读卡器,这在同类设备中属于标准配置。
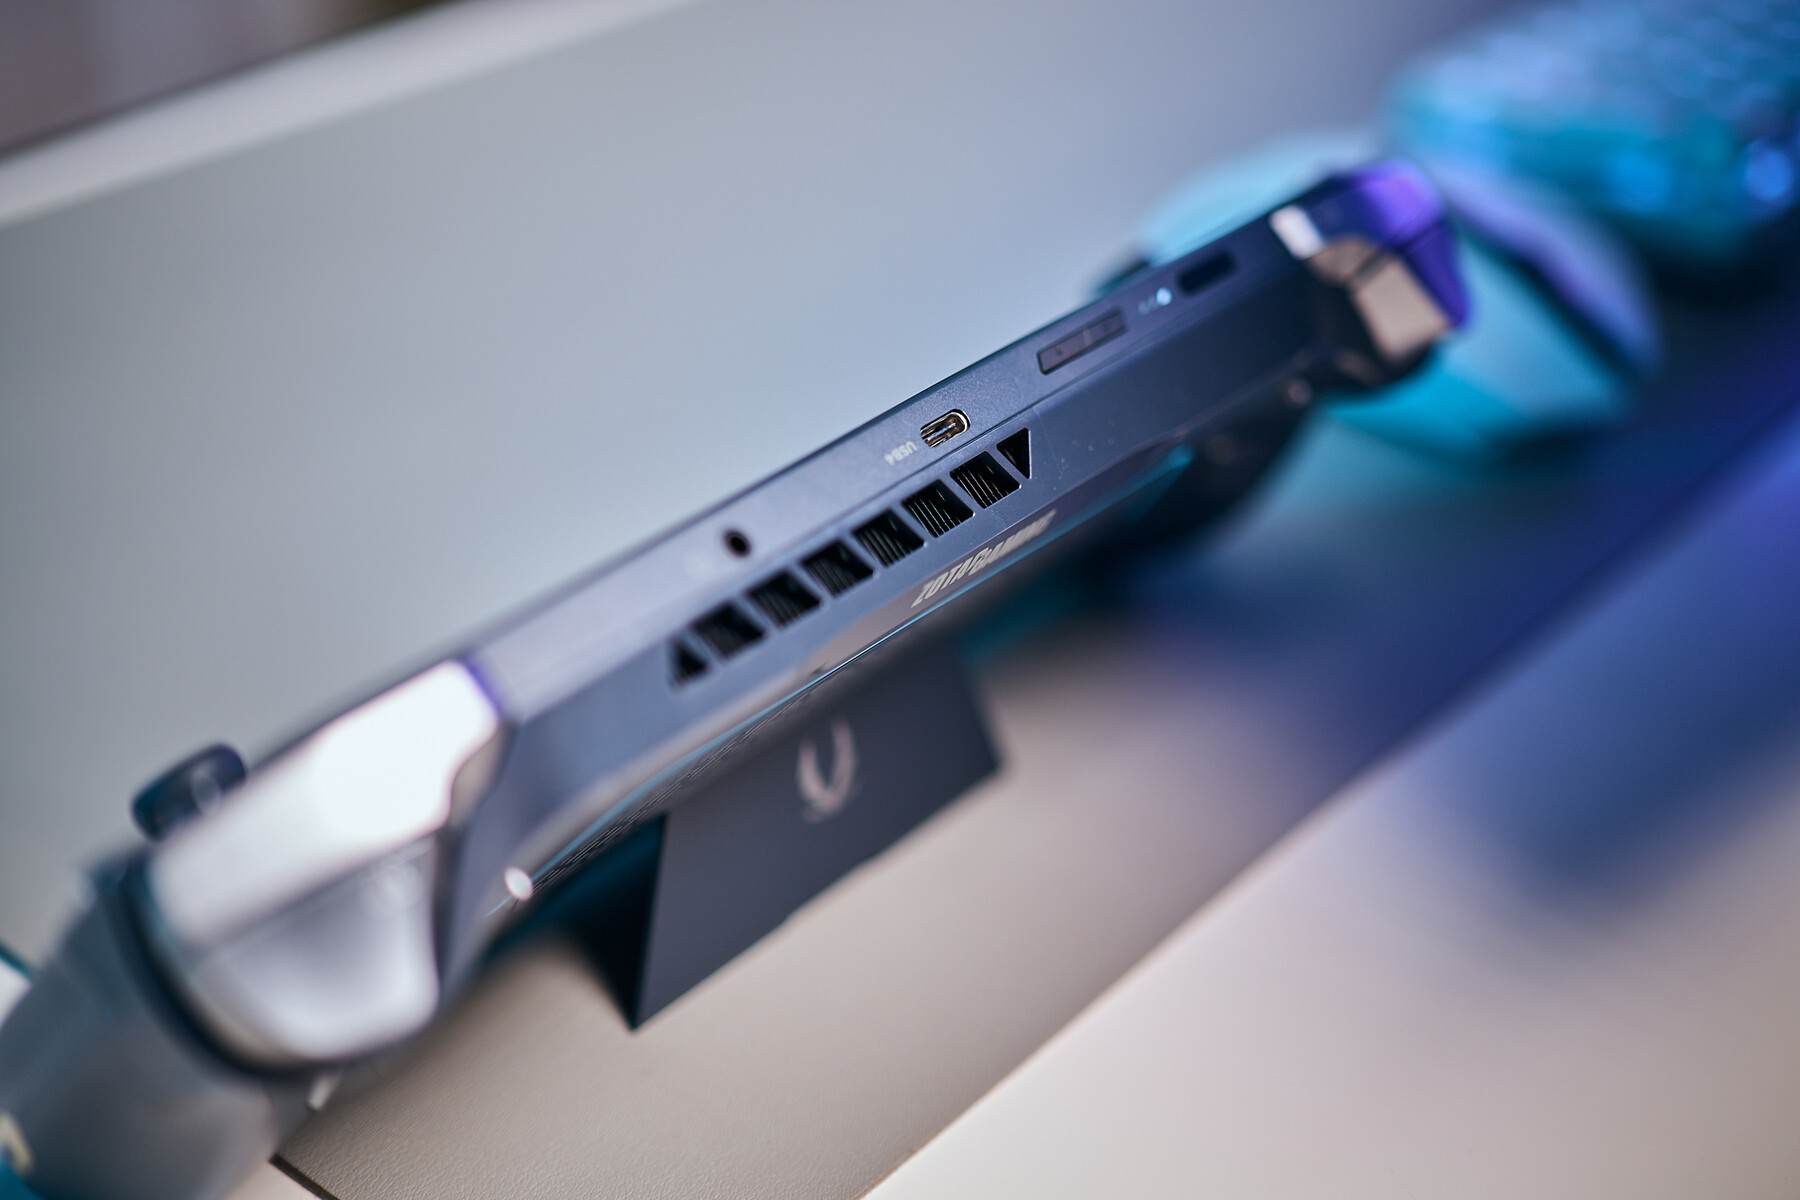
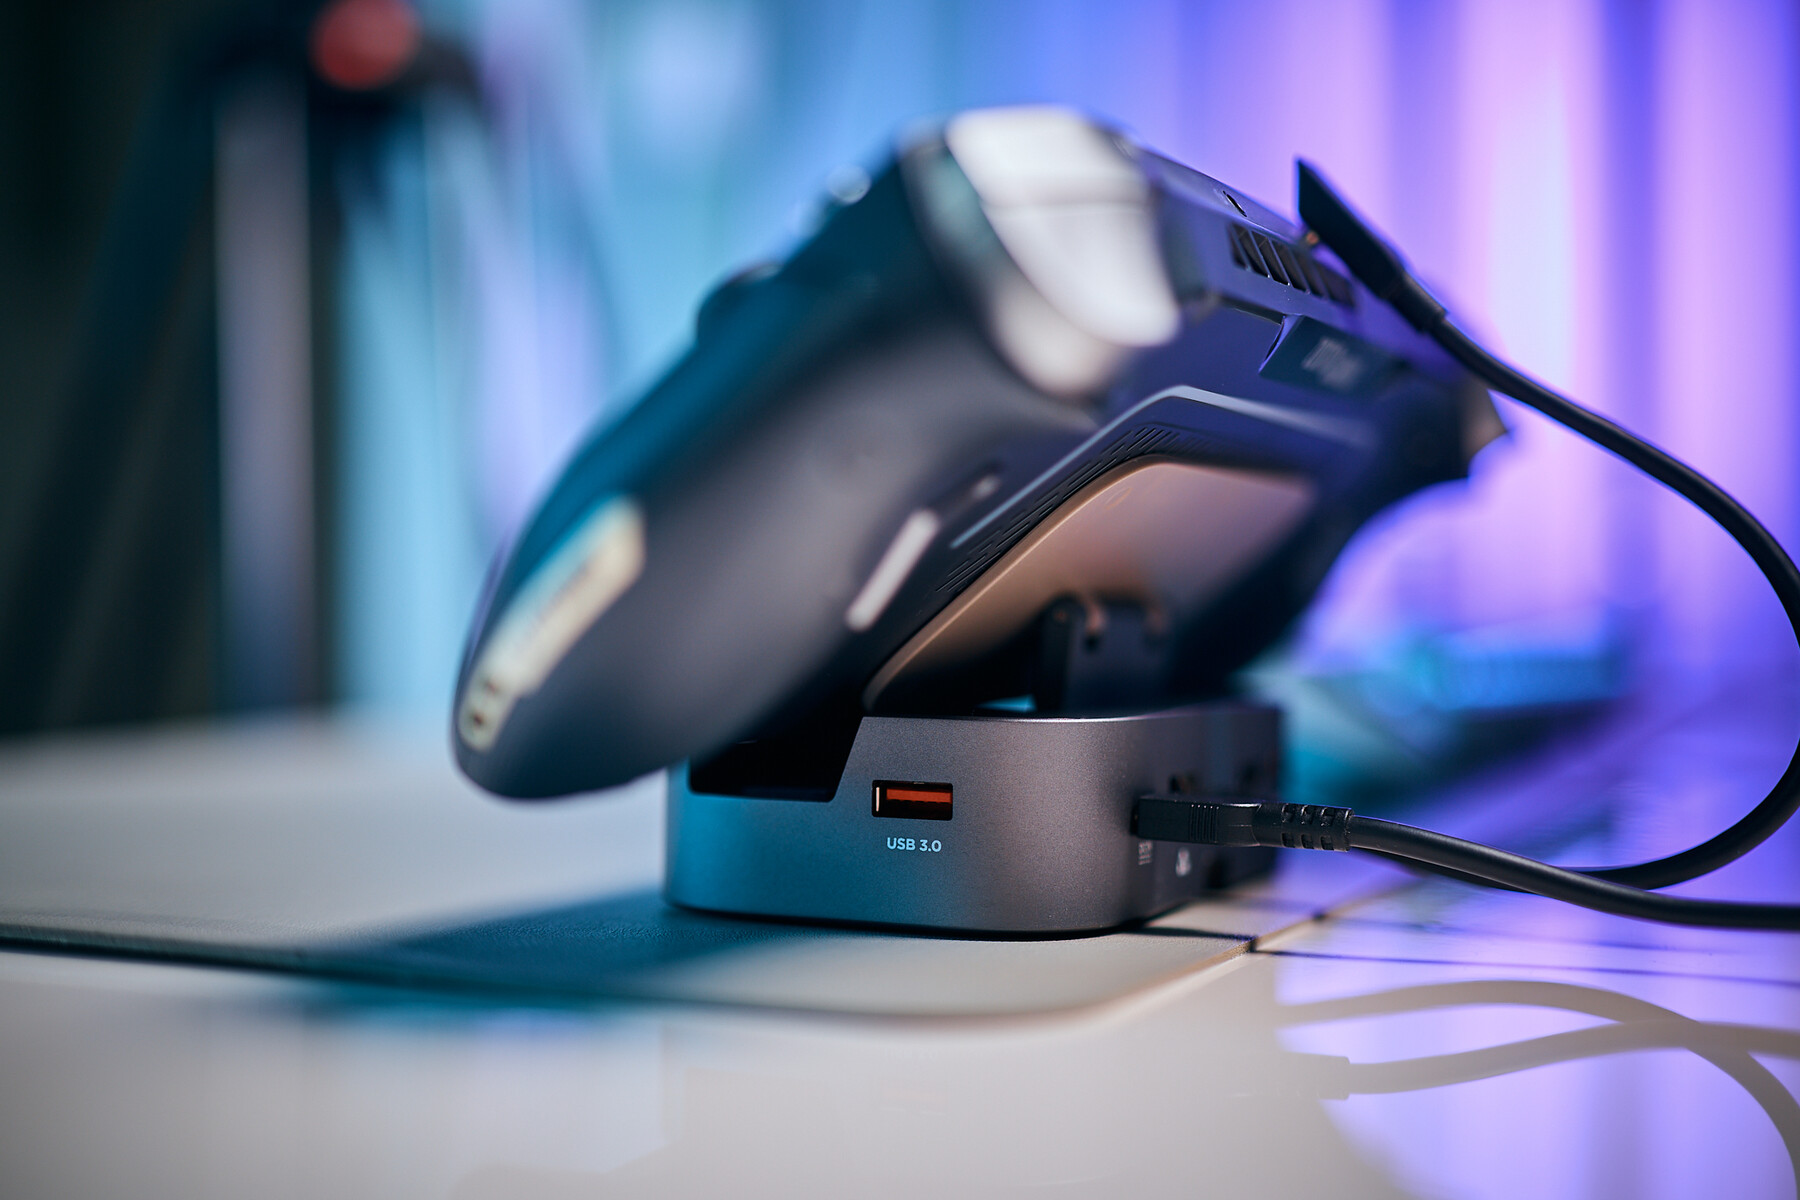
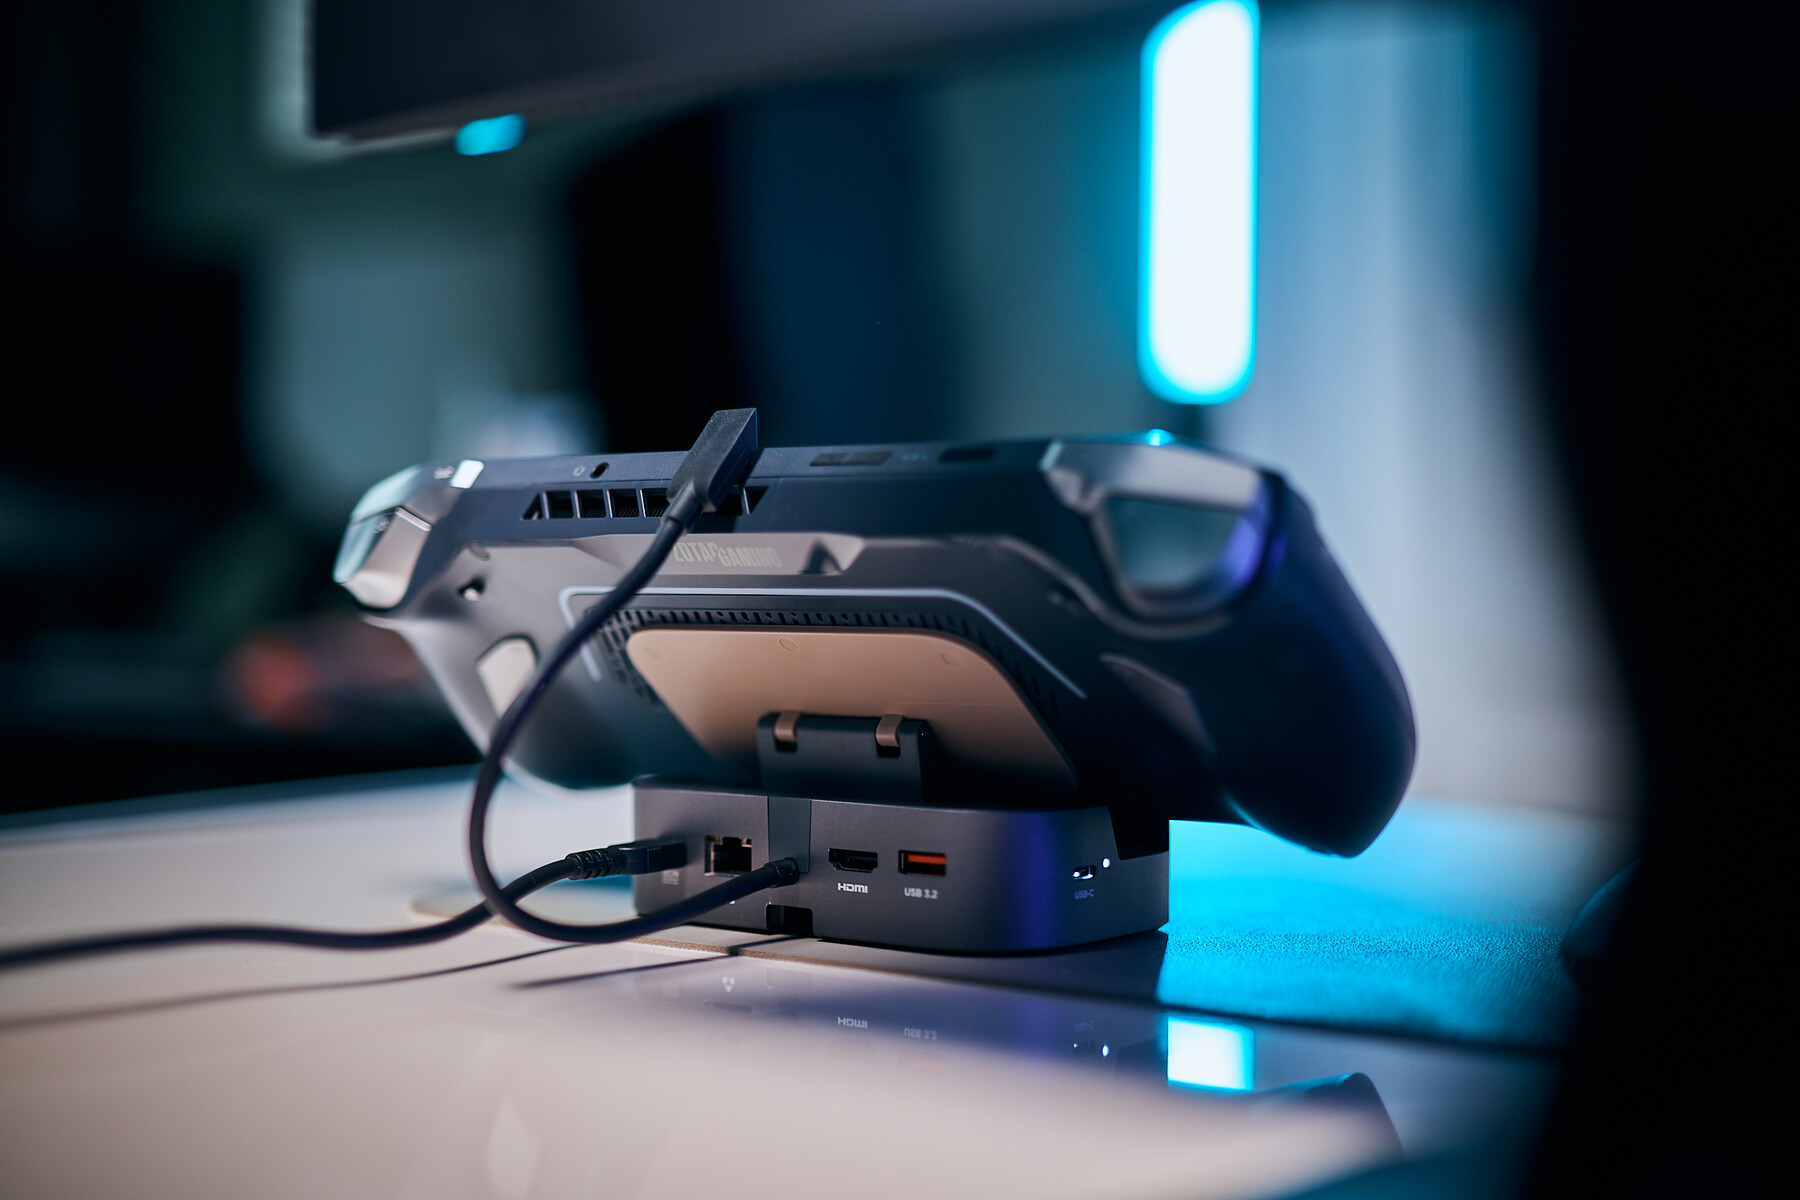
配件 - 价格合理的底座,可放置所有蒸汽资料库。
如果您想将手持设备作为主要计算设备使用,Zotac 还出售一个价格非常合理的底座(79 欧元)。 这款底座增加了更多功能,包括一个额外的 USB-C 端口、一对 USB-A、HDMI、网络功能和一个 NVMe 插槽。这使得该设备成为提高工作效率的理想选择,同时也可以作为游戏库的新家。
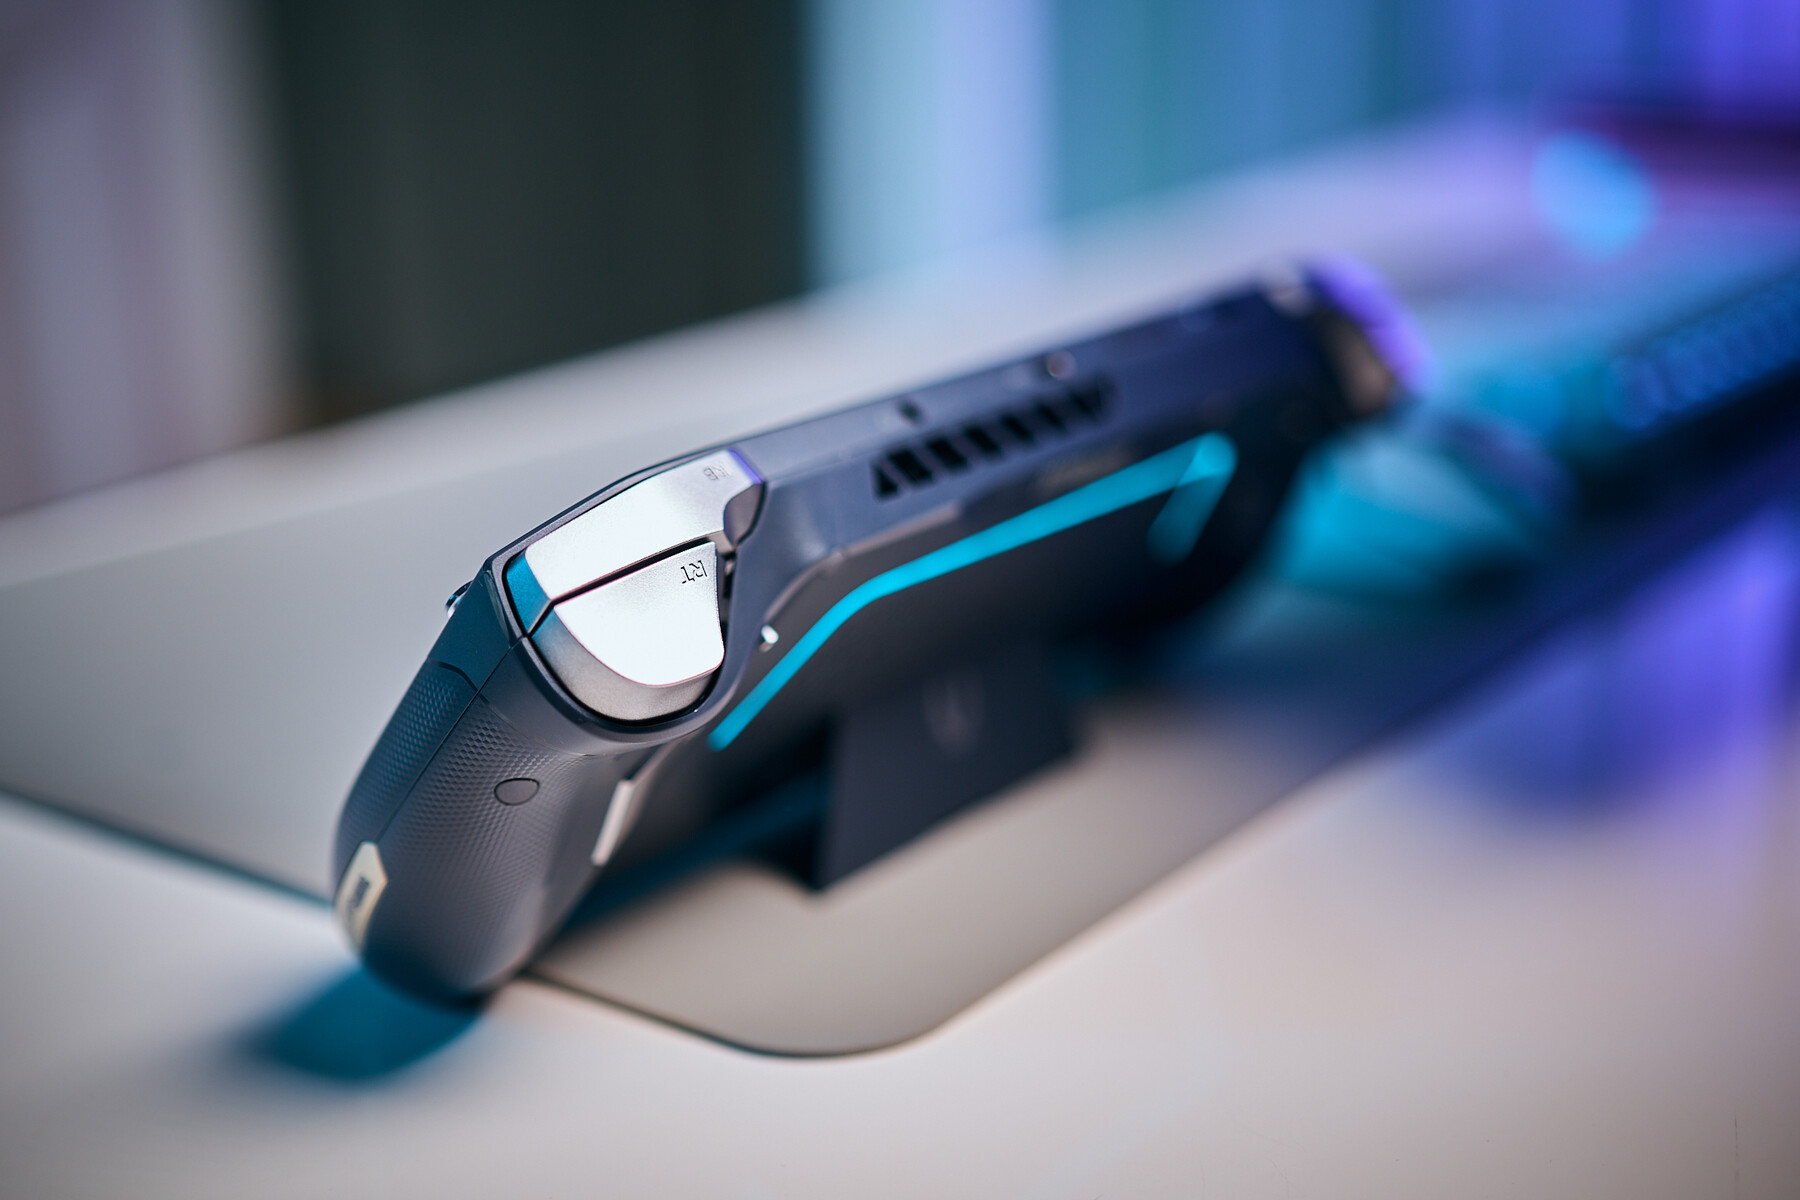
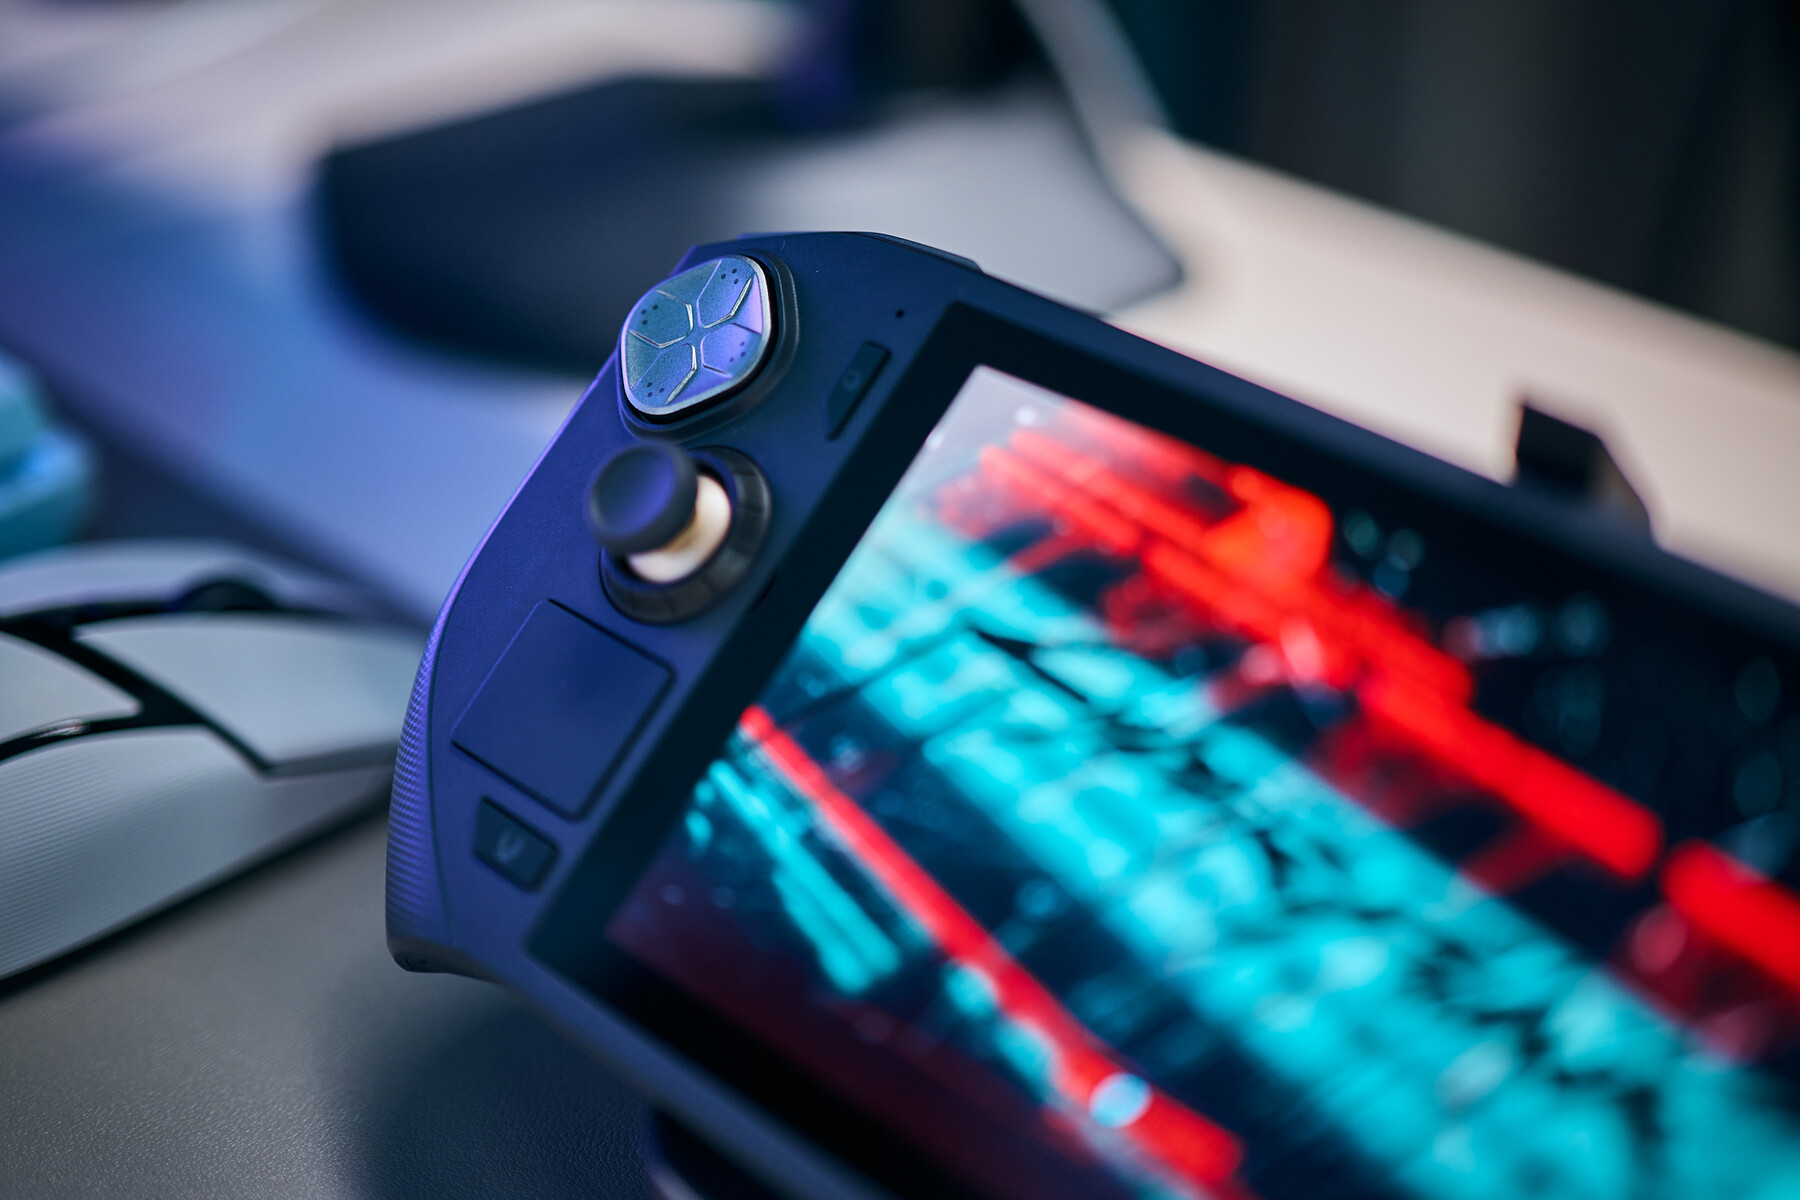
输入设备 - 可与市场上最好的控制器相媲美
D-pad 是目前手持设备上最好的 D-pad 之一。它的点击触感极佳,几乎就像滑鼠一样,令人难以置信的满足感和精确度。
霍尔效应操纵杆的手感也很顺滑,阻力恰到好处,可实现细致入微的控制。操纵杆周围的圆环是一个额外的功能,它可以作为径向输入,在 Zotac 软件中映射到不同的功能。默认情况下,这些圆环可控制显示亮度、RGB 强度或系统音量,在我们的测试中,虽然感觉不是特别直接,但也能正常工作。
通过触发器(也是霍尔效应),Zotac 还增加了一个派对小把戏。作为手持设备的首创,您可以选择经典的模拟行程,例如在赛车游戏中实现精确控制;或者,只需轻按一个小开关,就能将其转换为快速触发模式,这非常适合在射击游戏或类似游戏中需要即时输入时使用。 黑色神话:悟空.
同样,操作感觉几乎与鼠标无异,触感与 d-pad 相同。
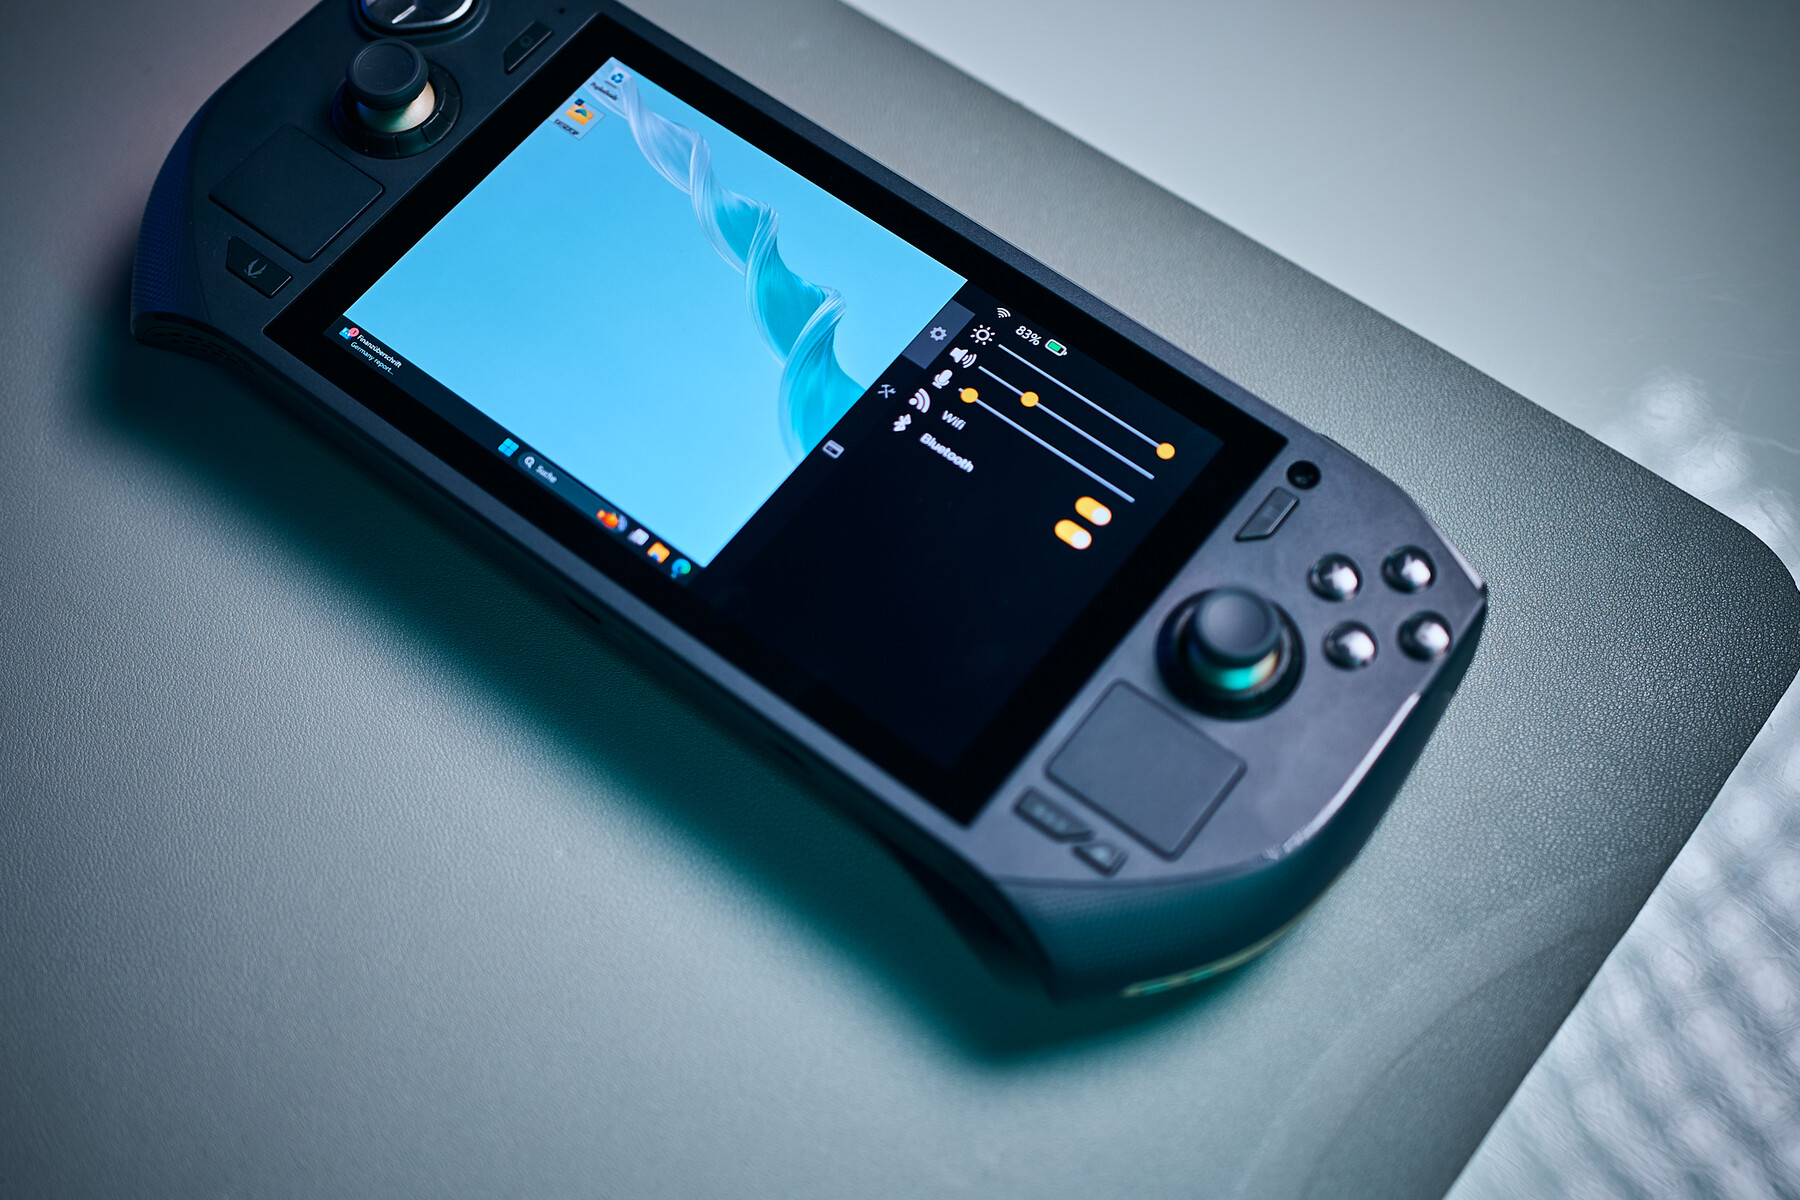
触摸板--用于精细动作
Zotac Zone 包含一对触摸板,类似于 Valve 的 Steam Deck 或 联想的Legion Go.这些触摸板旨在模拟鼠标输入--对于 Windows 桌面或策略游戏来说,这是一项天赐的功能。遗憾的是,点击的感觉有点廉价,移动也很难控制。不过,Zotac 告诉我们,他们正在为最终版本进行改进。
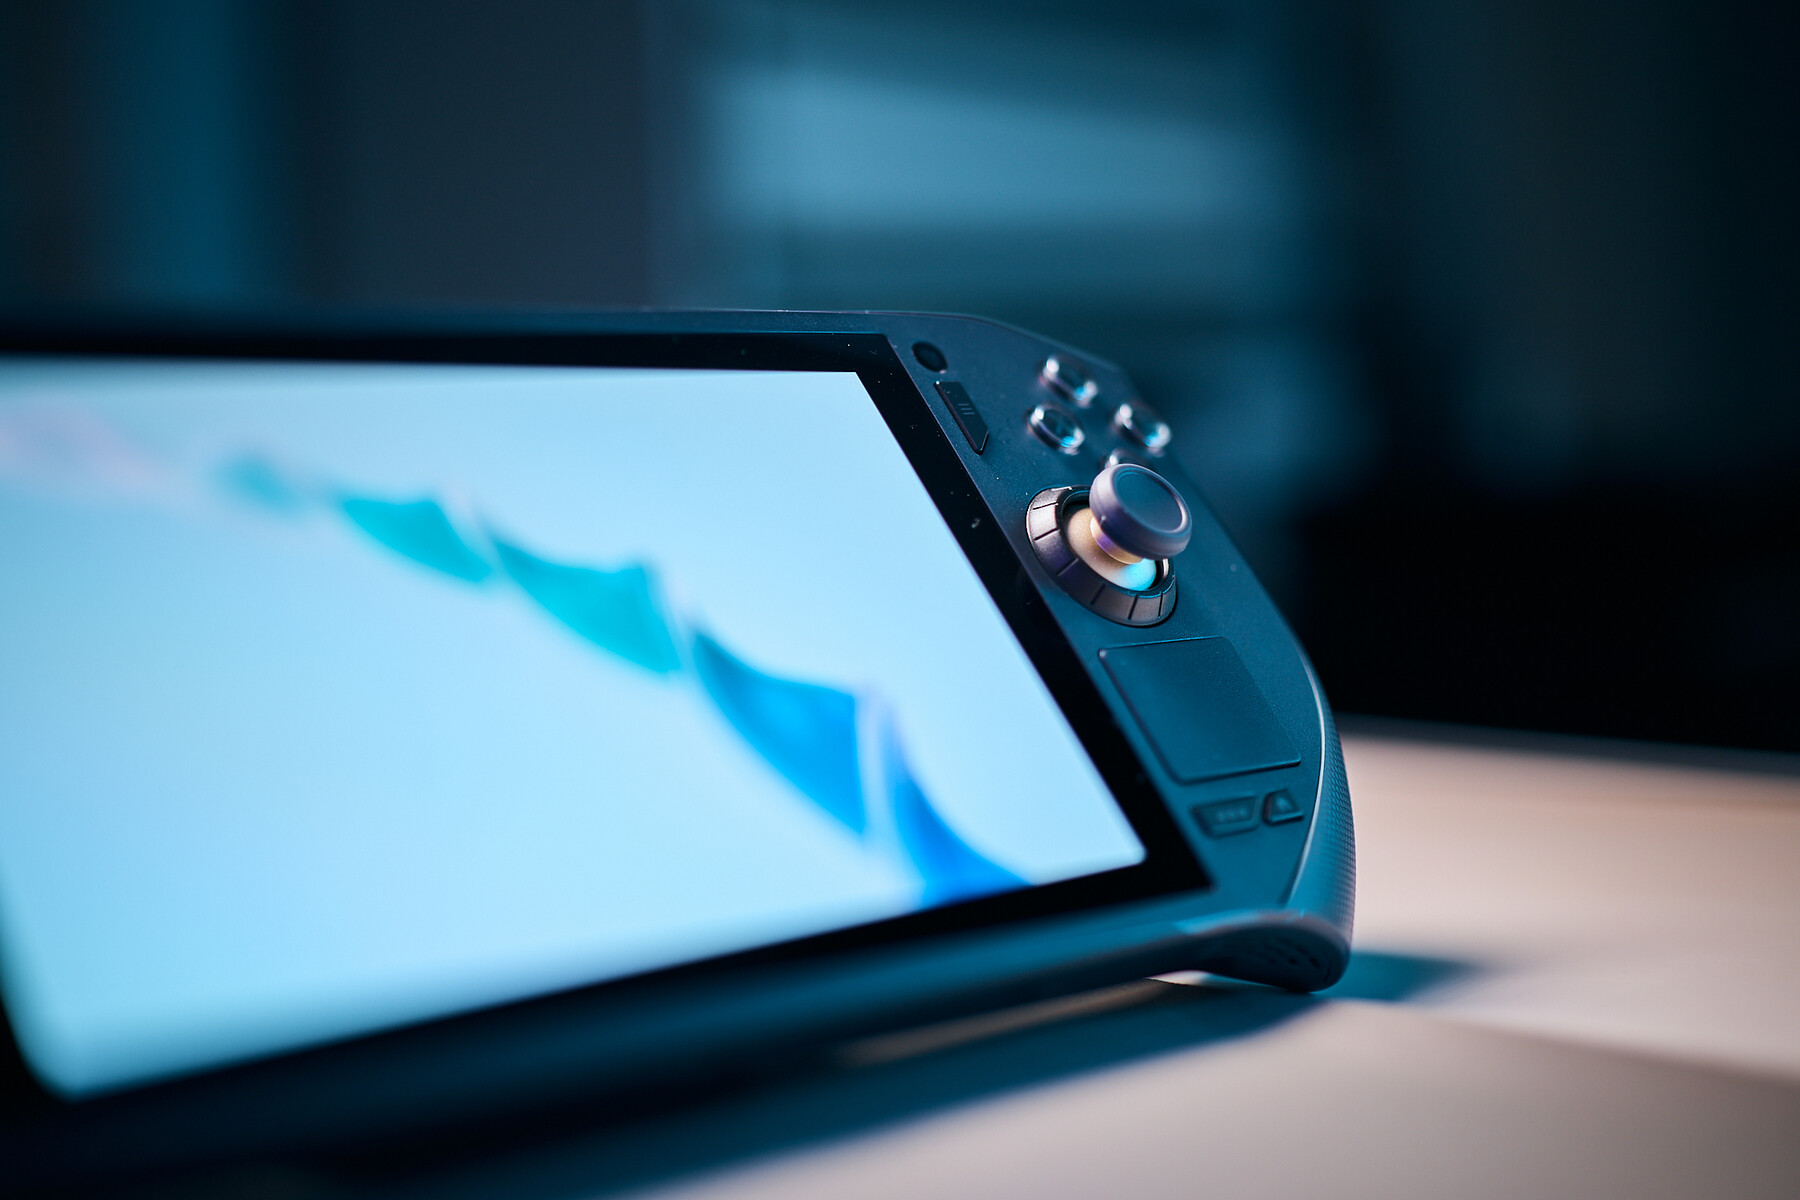
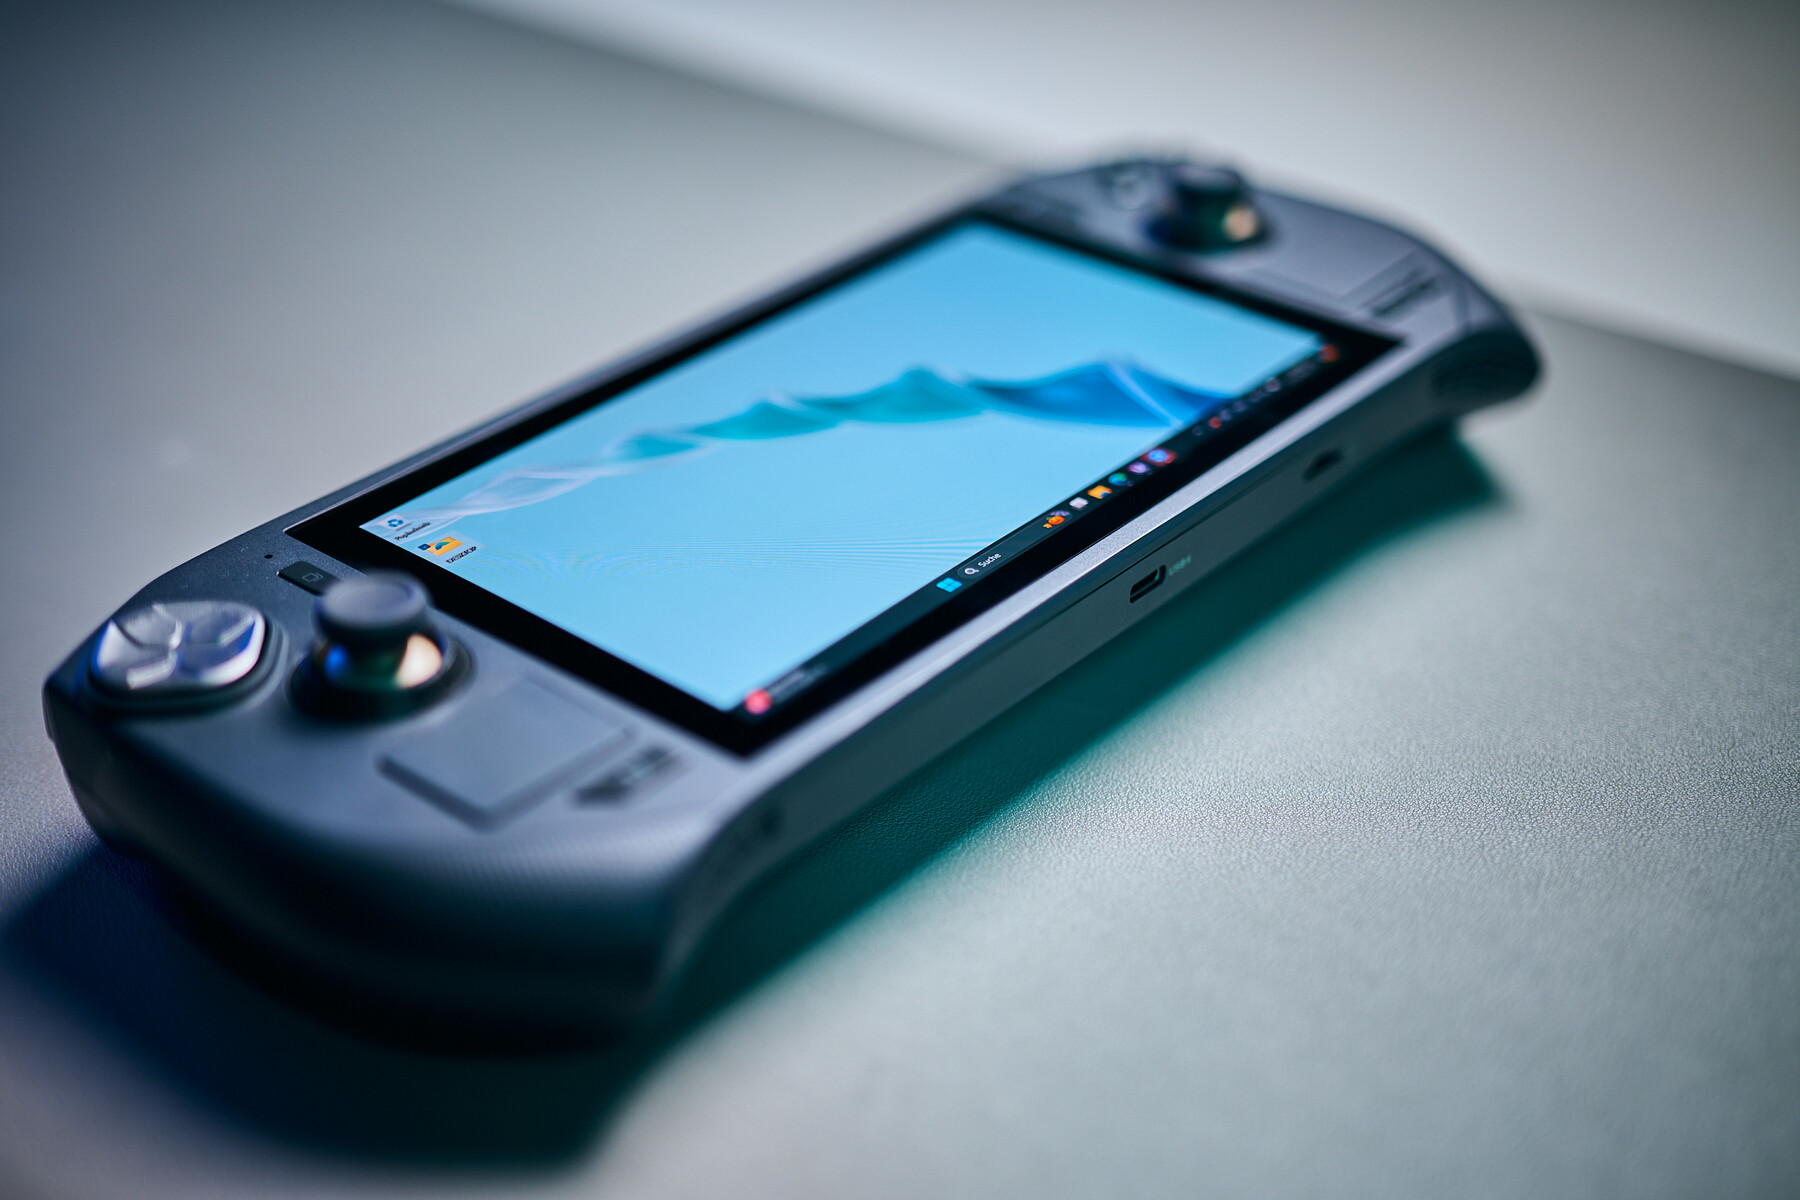
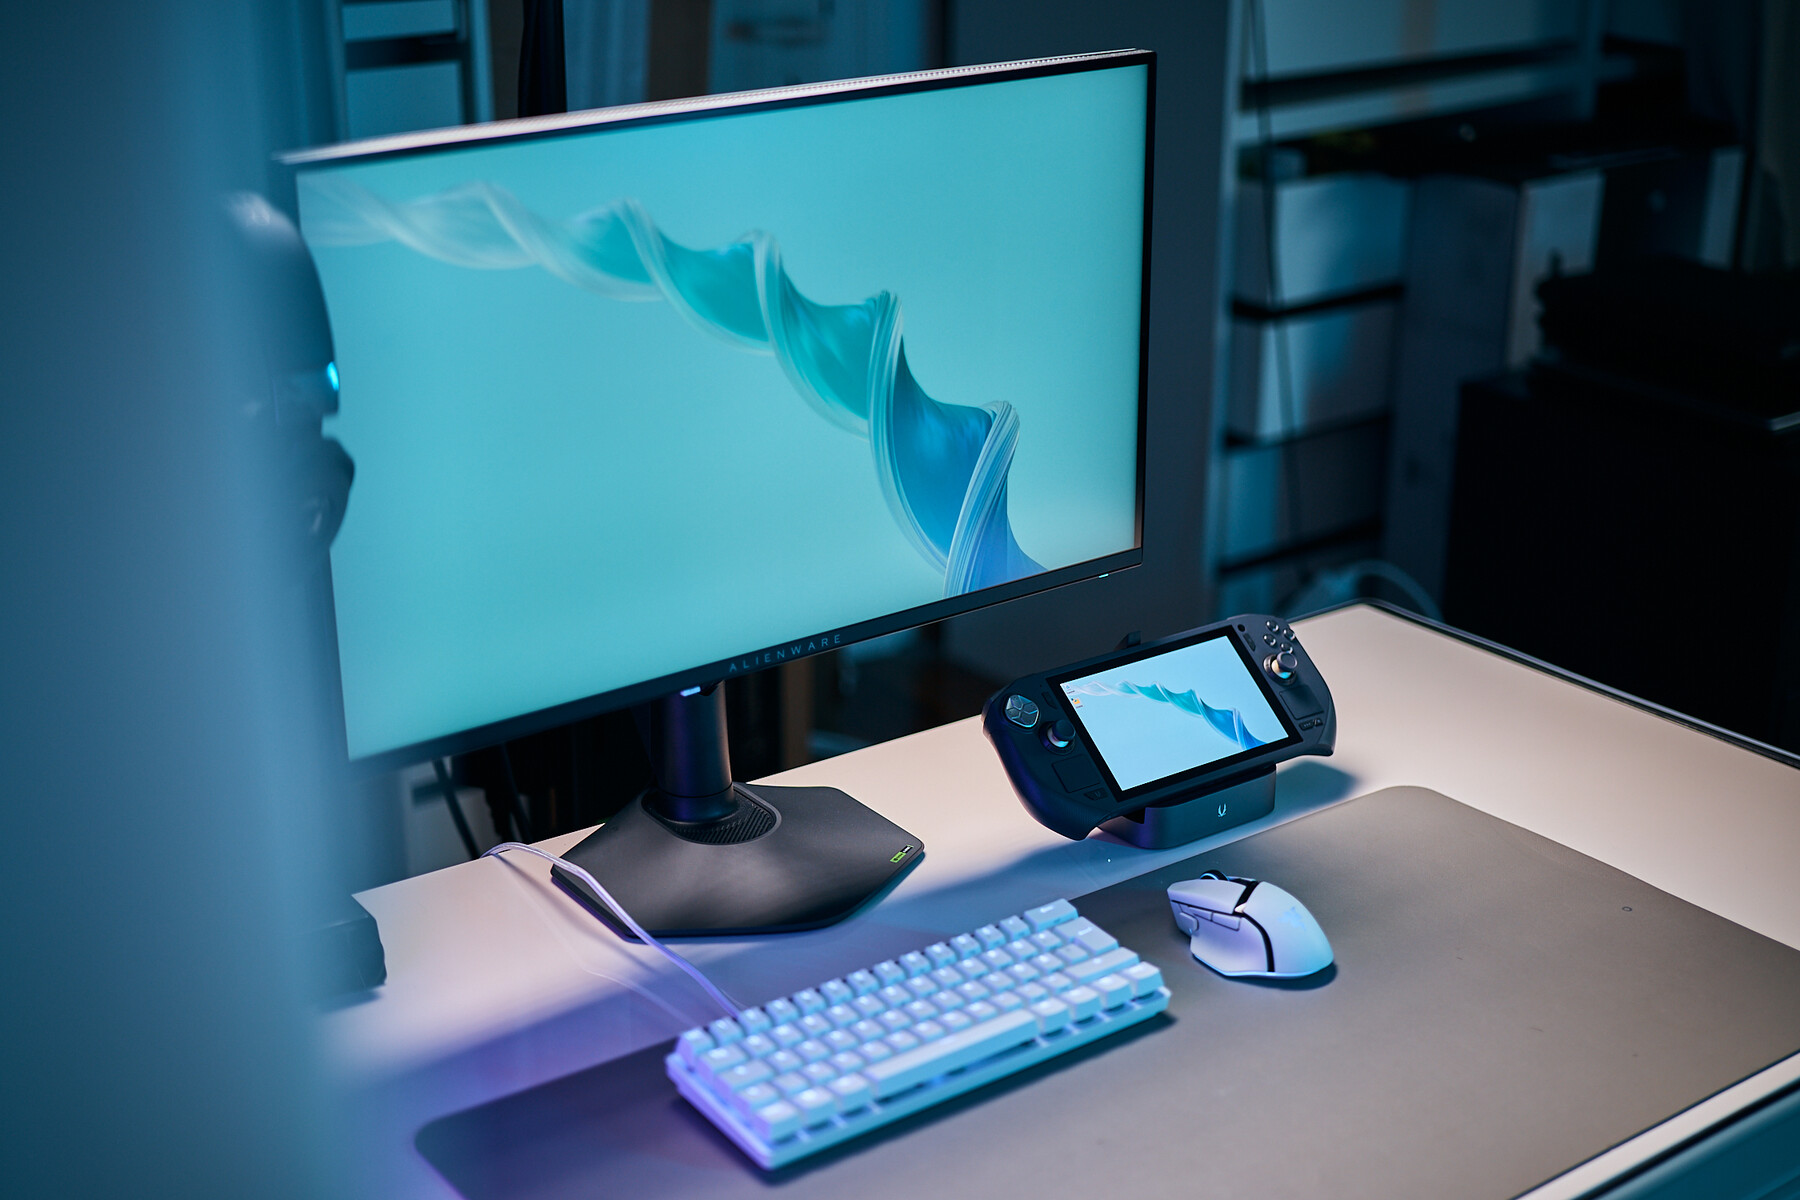
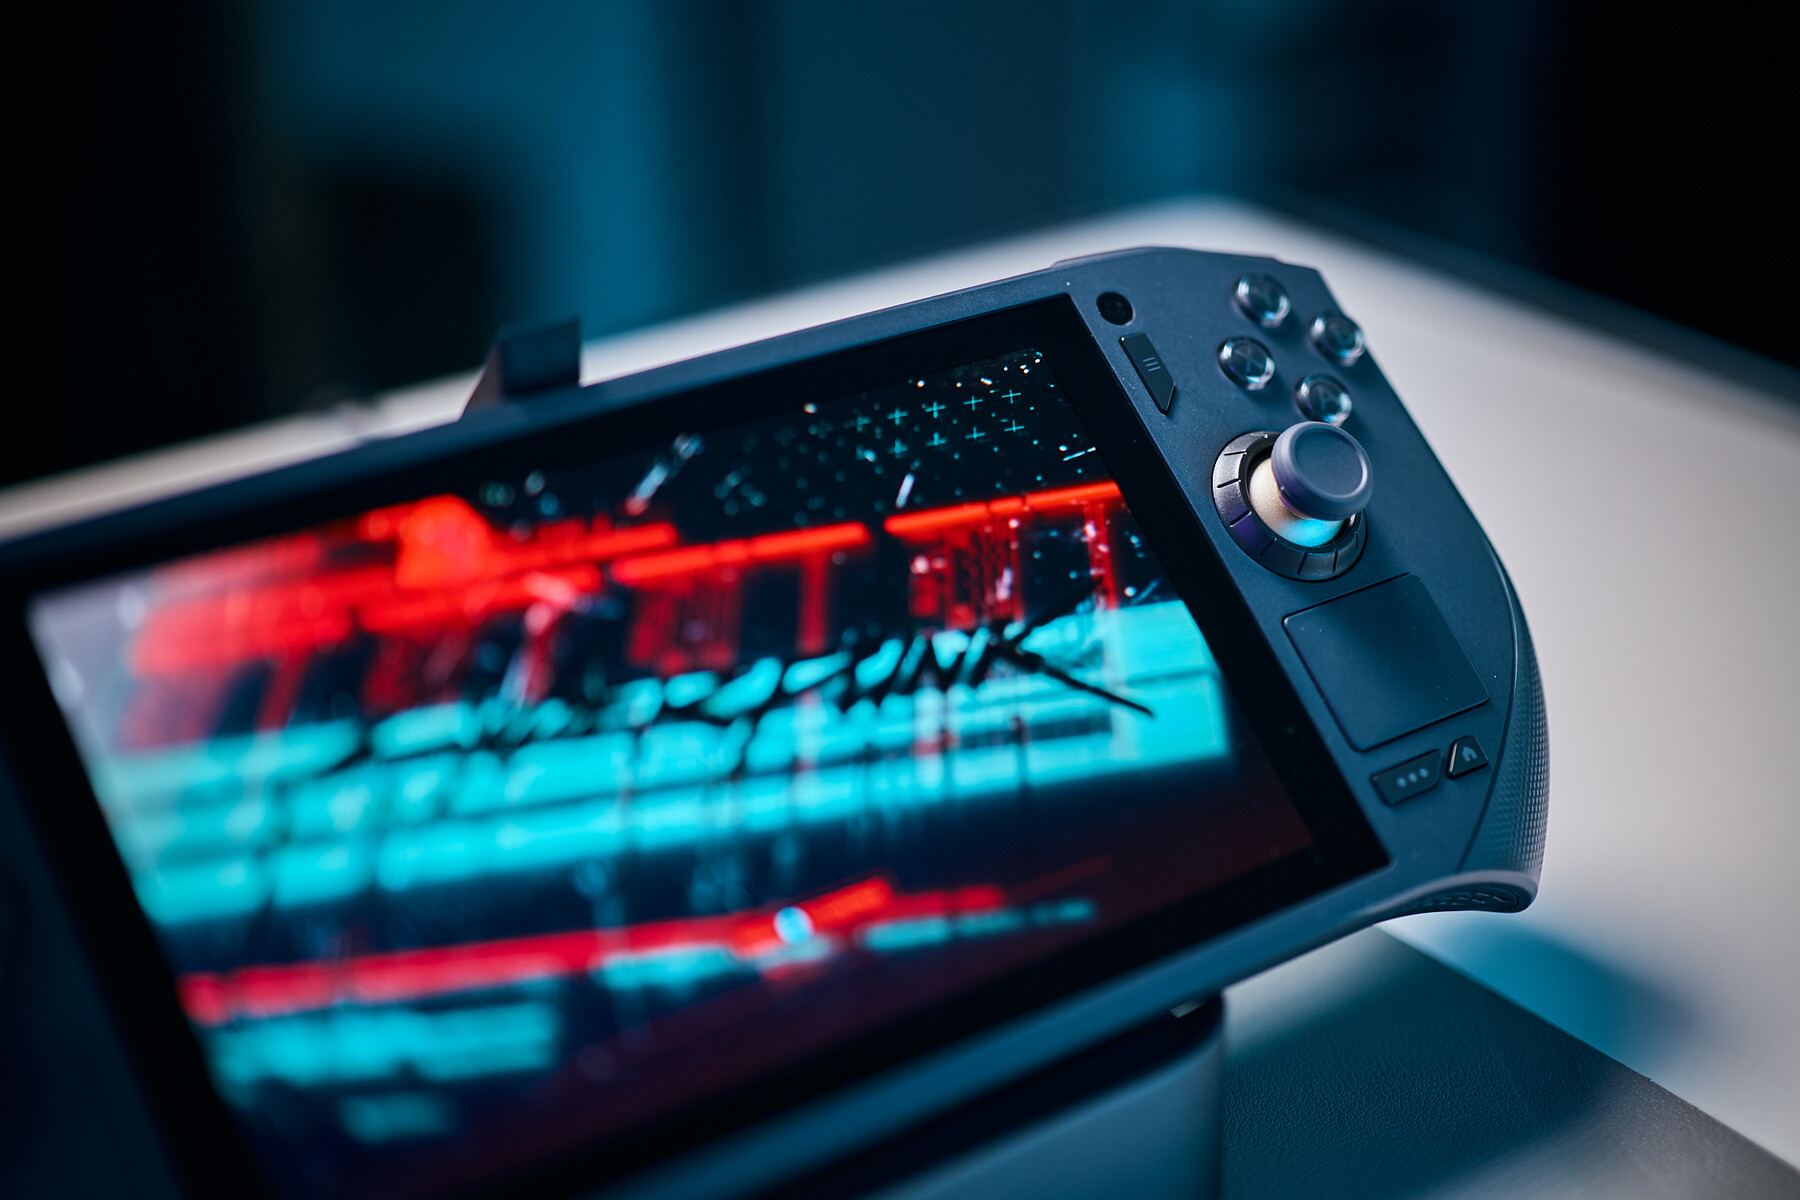
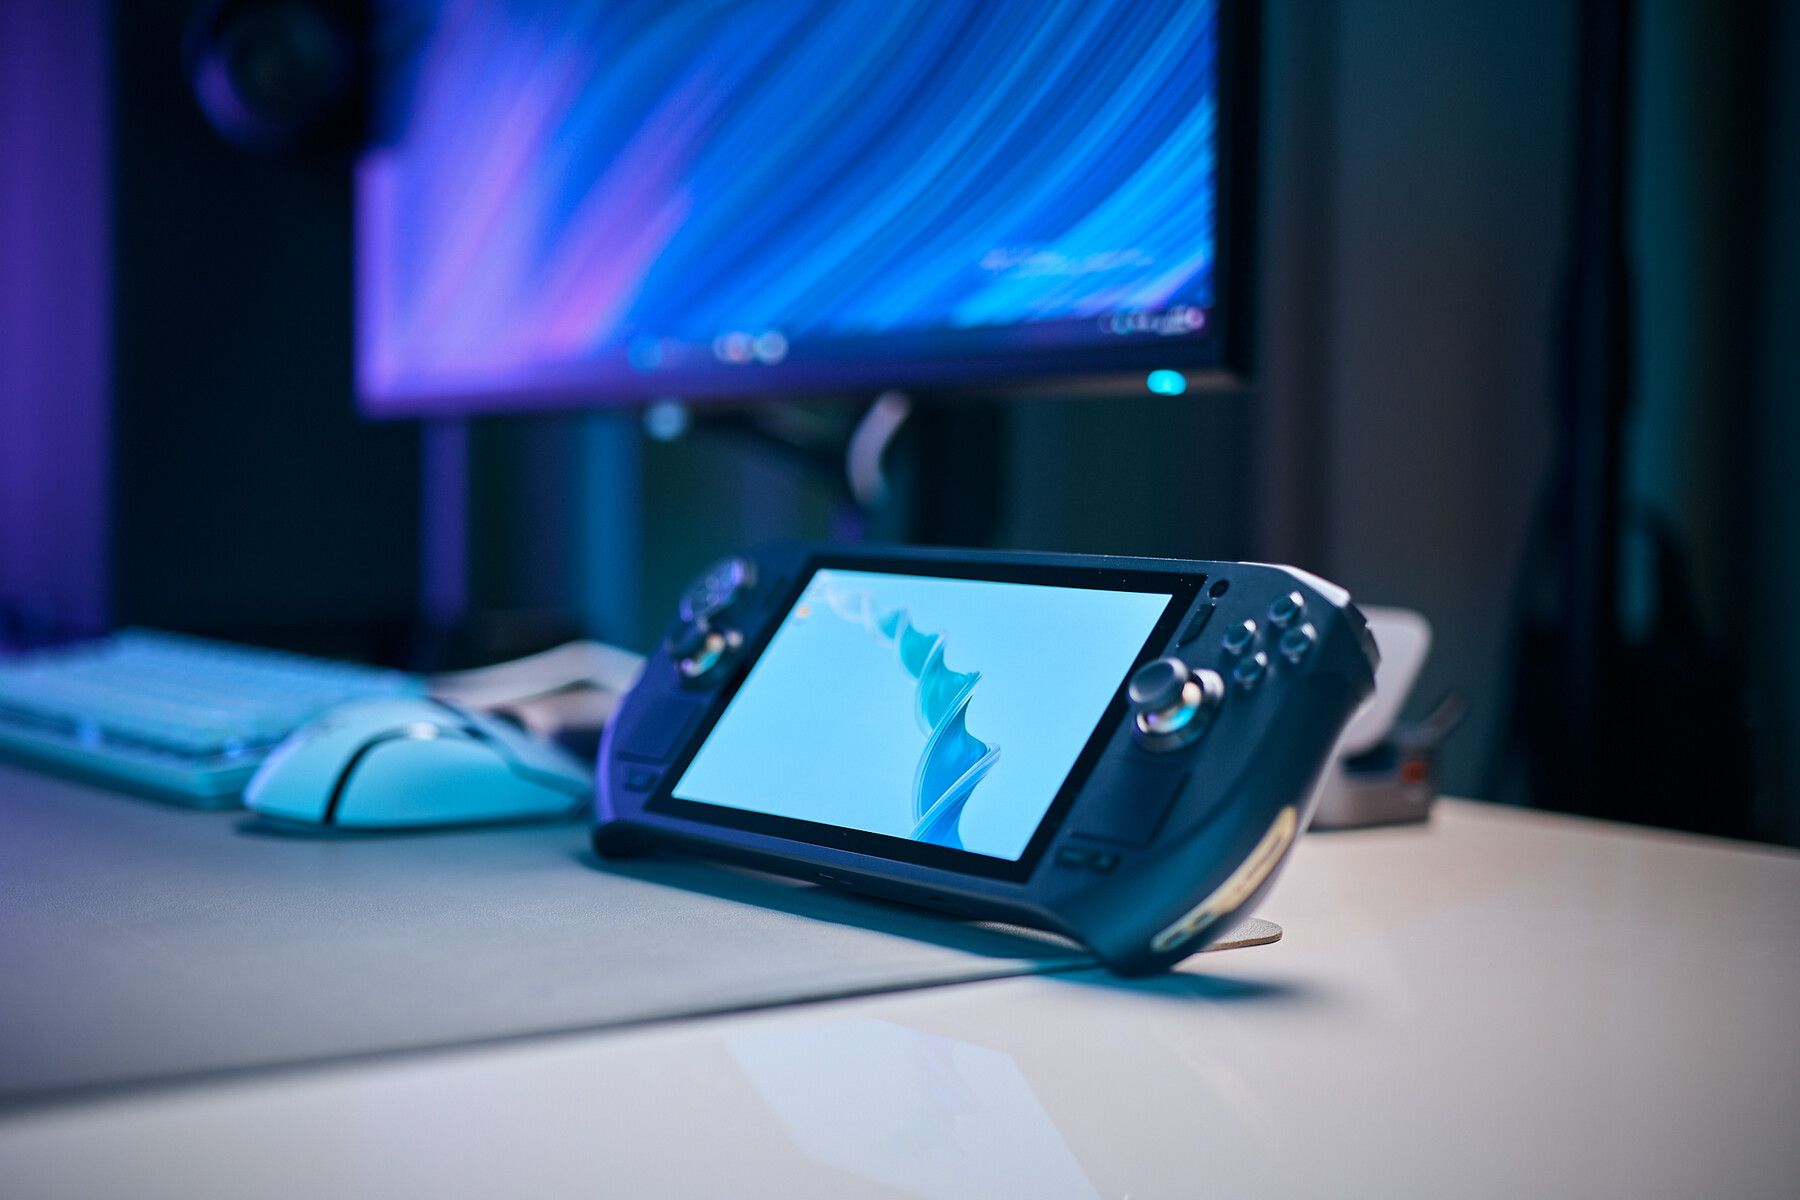
显示屏--就是那些 "墨色 "的黑色!
Zotac Zone 配备了 OLED 显示屏,运行频率为 120Hz,可带来令人惊叹的视觉体验。我们的测量结果甚至超过了 Zotac 声称的亮度,超过 800 Nits,尽管屏幕是光面的,但仍可进行户外游戏。与典型的显示技术一样,对比度非常出色,提供了深邃的黑色和鲜艳的色彩,非常适合游戏和 Netflix节目都非常适合。
不过,出厂校准还有改进的余地,默认色彩设置中的蓝色色调非常明显。虽然有些用户可能不会觉得这让人分心,但对于那些喜欢更精确色彩还原的用户来说,这可能是一个很大的瑕疵。幸好可以使用手动校准来改善色彩平衡,我们希望 Zotac 能在最终零售机型中解决这个问题。
OLED 显示屏的一个显著缺点是 PWM 频率较低,仅为 120Hz,这可能会导致敏感用户在长时间游戏时眼睛疲劳。不过,如果你能接受这个缺点,你就能获得目前市场上最好的显示体验之一,至少在视窗方面是这样。
| |||||||||||||||||||||||||
Contrast: 20936:1 (Black: 0.04 cd/m²)
ΔE Color 7.1 | 0.5-29.43 Ø4.87, calibrated: 3.9
ΔE Greyscale 9.1 | 0.5-98 Ø5.1
Gamma: 2.19
| Zotac ZGC-G1A1W-01 1920x1080, 7", 120 Hz | Asus ROG Ally X TL070FVXS01-0, IPS, 1920x1080, 7", 120 Hz | Asus ROG Ally Z1 Extreme TL070FVSX01-0, IPS, 1920x1080, 7", 120 Hz | Lenovo Legion Go Legion Go Display, IPS, 2560x1600, 8.8", 144 Hz | MSI Claw TL070FVXS02-0, IPS, 1920x1080, 7", 120 Hz | Ayaneo Kun Ayaneo 2K, IPS, 2560x1600, 8.4", 60 Hz | Valve Steam Deck 1 TB OLED ANX7530 U, OLED, 1280x800, 7.4", 90 Hz | ONEXPLAYER 2 Pro AR18 FLQ8423-24L0, IPS, 2560x1600, 8.4", 60 Hz | |
|---|---|---|---|---|---|---|---|---|
| Display | ||||||||
| Display P3 Coverage | 66.2 | 65.6 | 92.1 | 67 | 93.52 | 99.6 | 91.9 | |
| sRGB Coverage | 93.4 | 92.1 | 99.56 | 94.4 | 99.4 | 100 | 99.3 | |
| AdobeRGB 1998 Coverage | 68.5 | 67.9 | 90.09 | 69.4 | 91.2 | 96.1 | 81.6 | |
| Response Times | -380% | -419% | -466% | -362% | 4784% | -177% | -1203% | |
| Response Time Grey 50% / Grey 80% * | 1.08 ? | 9.7 ? -798% | 10.5 ? -872% | 20.8 ? -1826% | 9.2 ? -752% | 24.2 ? -2141% | 9 ? -733% | 25.5 ? -2261% |
| Response Time Black / White * | 9.3 ? | 5.7 ? 39% | 6 ? 35% | 14.4 ? -55% | 6.6 ? 29% | 16.2 ? -74% | 9 ? 3% | 22.73 ? -144% |
| PWM Frequency | 120 | 700 483% | 20000 16567% | 360 ? 200% | ||||
| Screen | -99% | -143% | -136% | -86% | -159% | 29% | -22% | |
| Brightness middle | 837.42 | 484 -42% | 513 -39% | 411 -51% | 477 -43% | 680 -19% | 485 -42% | 318 -62% |
| Black Level * | 0.04 | 0.35 -775% | 0.38 -850% | 0.42 -950% | 0.32 -700% | 0.5 -1150% | 0.03 25% | 0.1118 -180% |
| Contrast | 20936 | 1383 -93% | 1350 -94% | 979 -95% | 1491 -93% | 1360 -94% | 16167 -23% | 2844 -86% |
| Colorchecker dE 2000 * | 7.1 | 2.9 59% | 3.7 48% | 5.94 16% | 2.6 63% | 4 44% | 2 72% | 4.81 32% |
| Colorchecker dE 2000 max. * | 12.7 | 7.1 44% | 8.3 35% | 10.56 17% | 5.8 54% | 9 29% | 5 61% | 6.93 45% |
| Colorchecker dE 2000 calibrated * | 3.9 | 1.4 64% | 2.95 24% | 1.5 62% | 1 74% | 1.53 61% | ||
| Greyscale dE 2000 * | 9.1 | 4.5 51% | 5.1 44% | 0.92 90% | 3.9 57% | 9 1% | 2 78% | 6.12 33% |
| Gamma | 2.19 100% | 2.24 98% | 2.14 103% | 1.93 114% | 2.17 101% | 2 110% | 2 110% | 2.003 110% |
| CCT | 7946 82% | 7534 86% | 7732 84% | 8064 81% | 7250 90% | 7188 90% | 6336 103% | 7707 84% |
| Brightness | 456 | 474 | 413 | 461 | 678 | 482 | 287 | |
| Brightness Distribution | 88 | 84 | 80 | 88 | 91 | 98 | 48 | |
| Total Average (Program / Settings) | -240% /
-161% | -281% /
-212% | -301% /
-235% | -224% /
-147% | 2313% /
1324% | -74% /
-40% | -613% /
-285% |
* ... smaller is better
Display Response Times
| ↔ Response Time Black to White | ||
|---|---|---|
| 9.3 ms ... rise ↗ and fall ↘ combined | ↗ 8.7 ms rise | 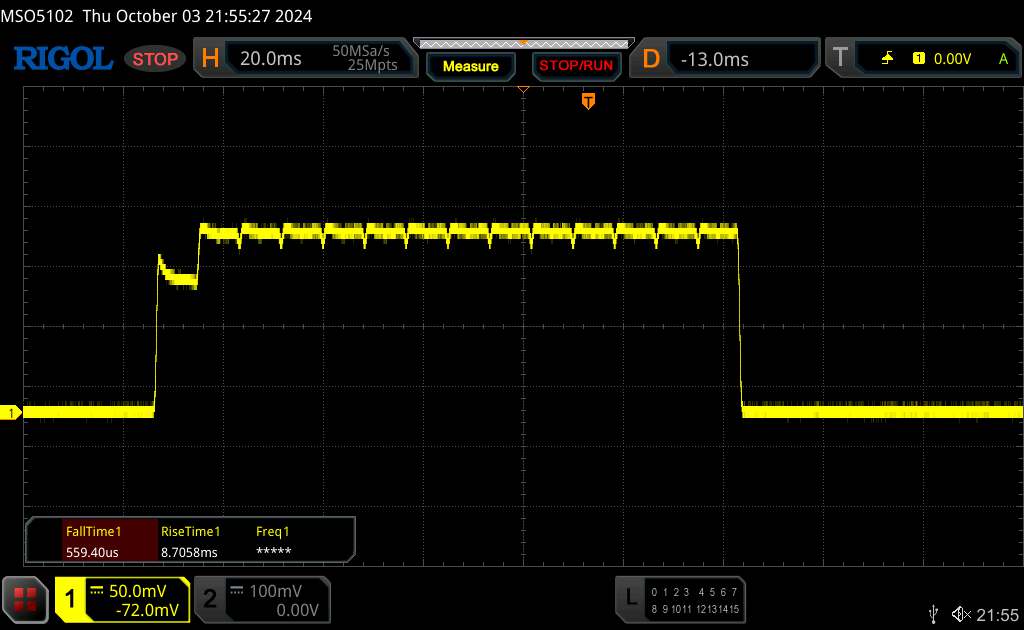 |
| ↘ 0.6 ms fall | ||
| The screen shows fast response rates in our tests and should be suited for gaming. In comparison, all tested devices range from 0.1 (minimum) to 240 (maximum) ms. » 23 % of all devices are better. This means that the measured response time is better than the average of all tested devices (20.8 ms). | ||
| ↔ Response Time 50% Grey to 80% Grey | ||
| 1.08 ms ... rise ↗ and fall ↘ combined | ↗ 0.54 ms rise | 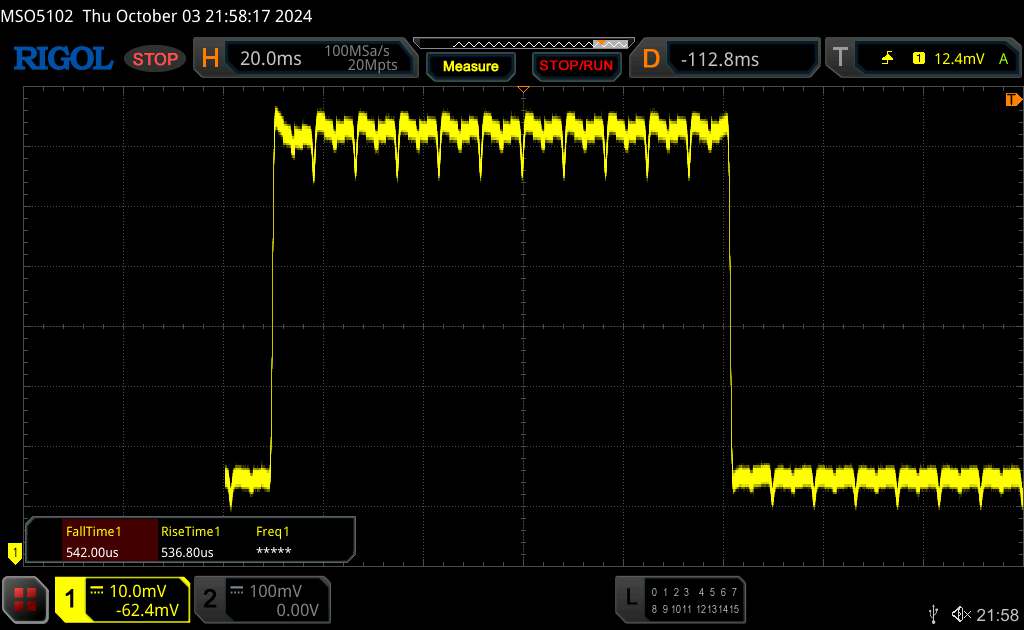 |
| ↘ 0.54 ms fall | ||
| The screen shows very fast response rates in our tests and should be very well suited for fast-paced gaming. In comparison, all tested devices range from 0.165 (minimum) to 636 (maximum) ms. » 3 % of all devices are better. This means that the measured response time is better than the average of all tested devices (32.5 ms). | ||
Screen Flickering / PWM (Pulse-Width Modulation)
| Screen flickering / PWM detected | 120 Hz | 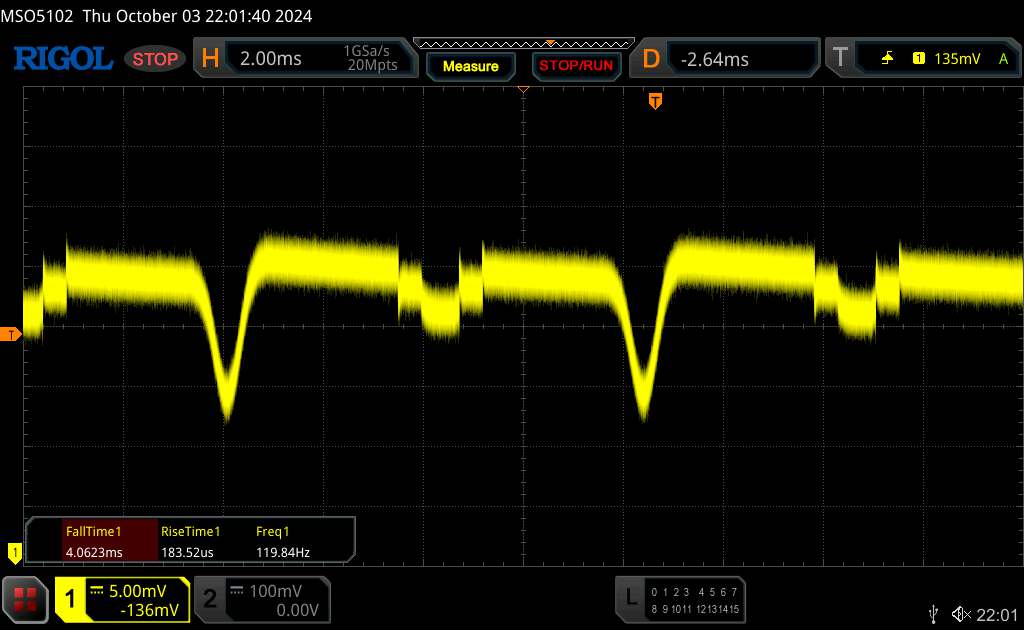 | |
The display backlight flickers at 120 Hz (worst case, e.g., utilizing PWM) . The frequency of 120 Hz is very low, so the flickering may cause eyestrain and headaches after extended use. In comparison: 53 % of all tested devices do not use PWM to dim the display. If PWM was detected, an average of 8516 (minimum: 5 - maximum: 343500) Hz was measured. | |||
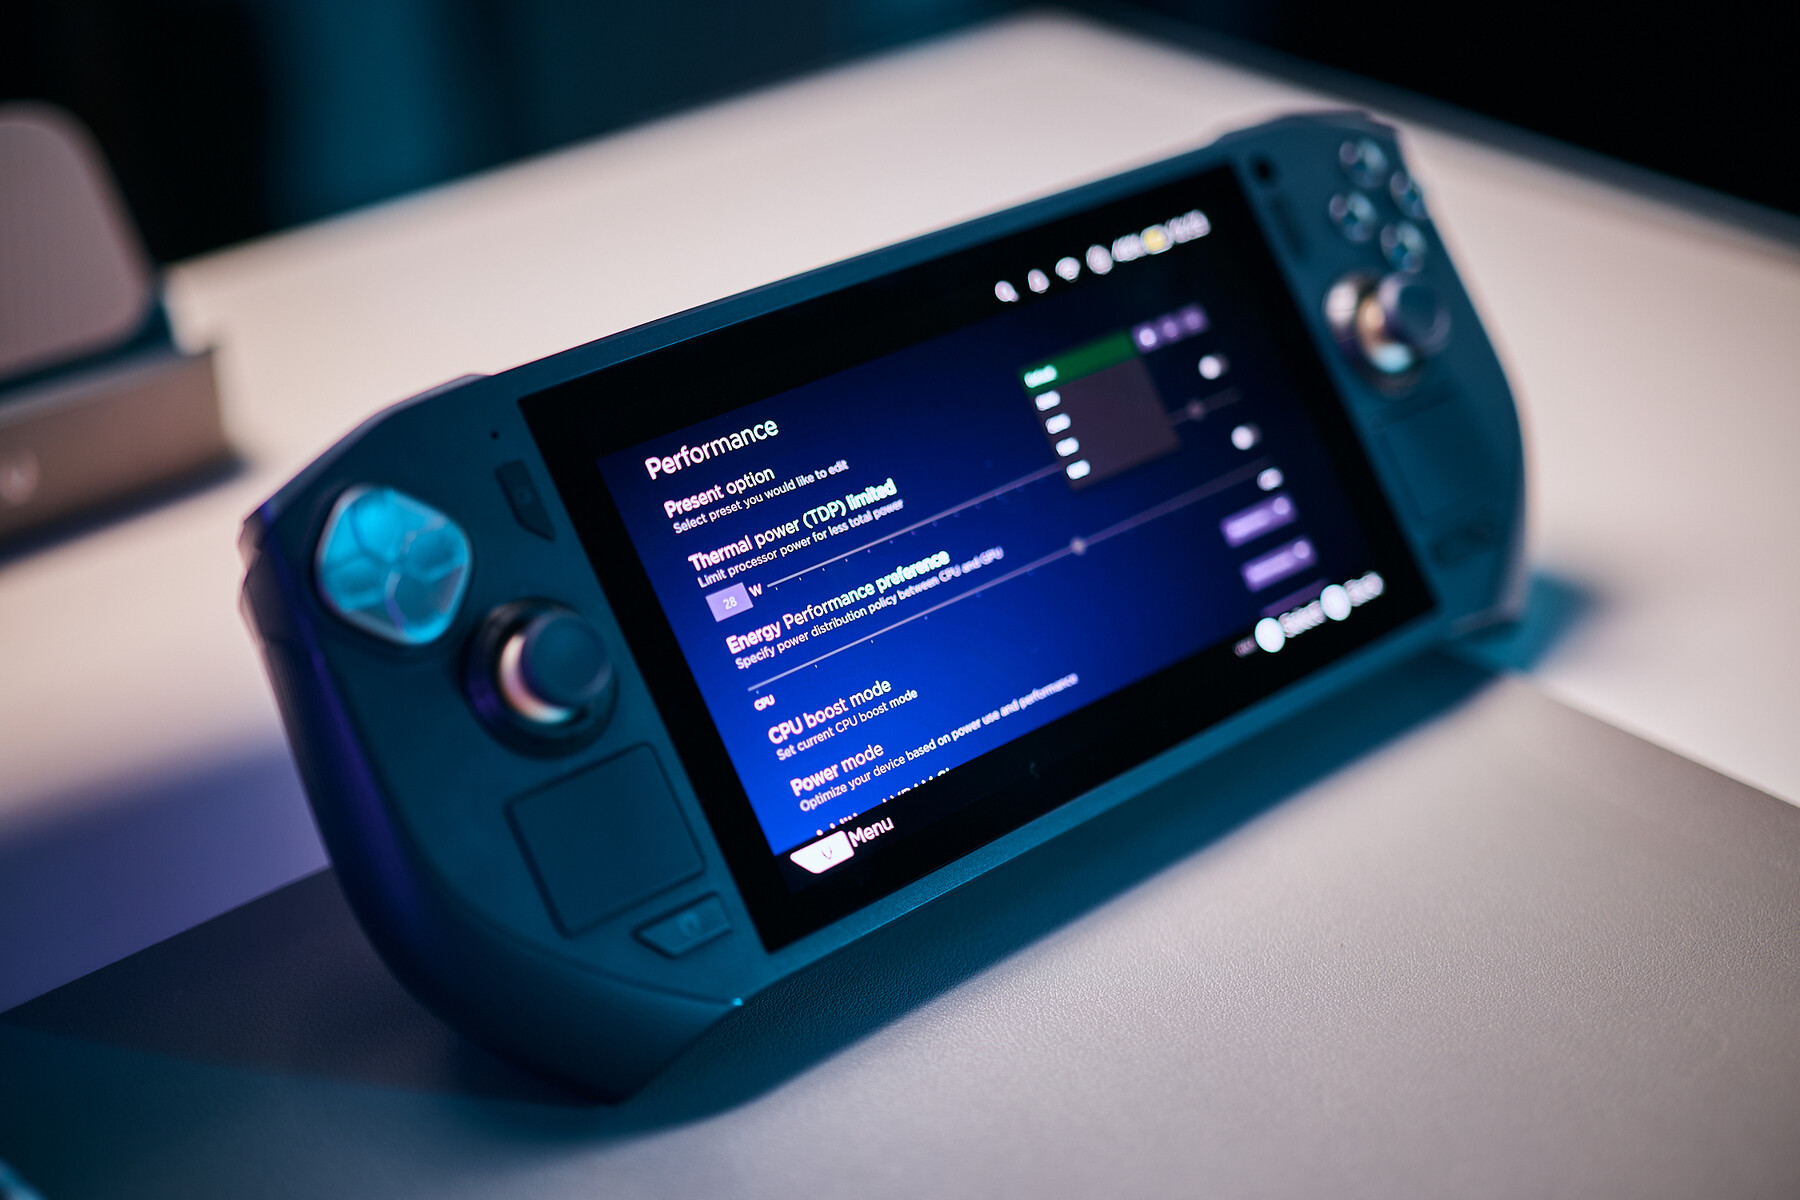
性能--视情况而定!
审查设置
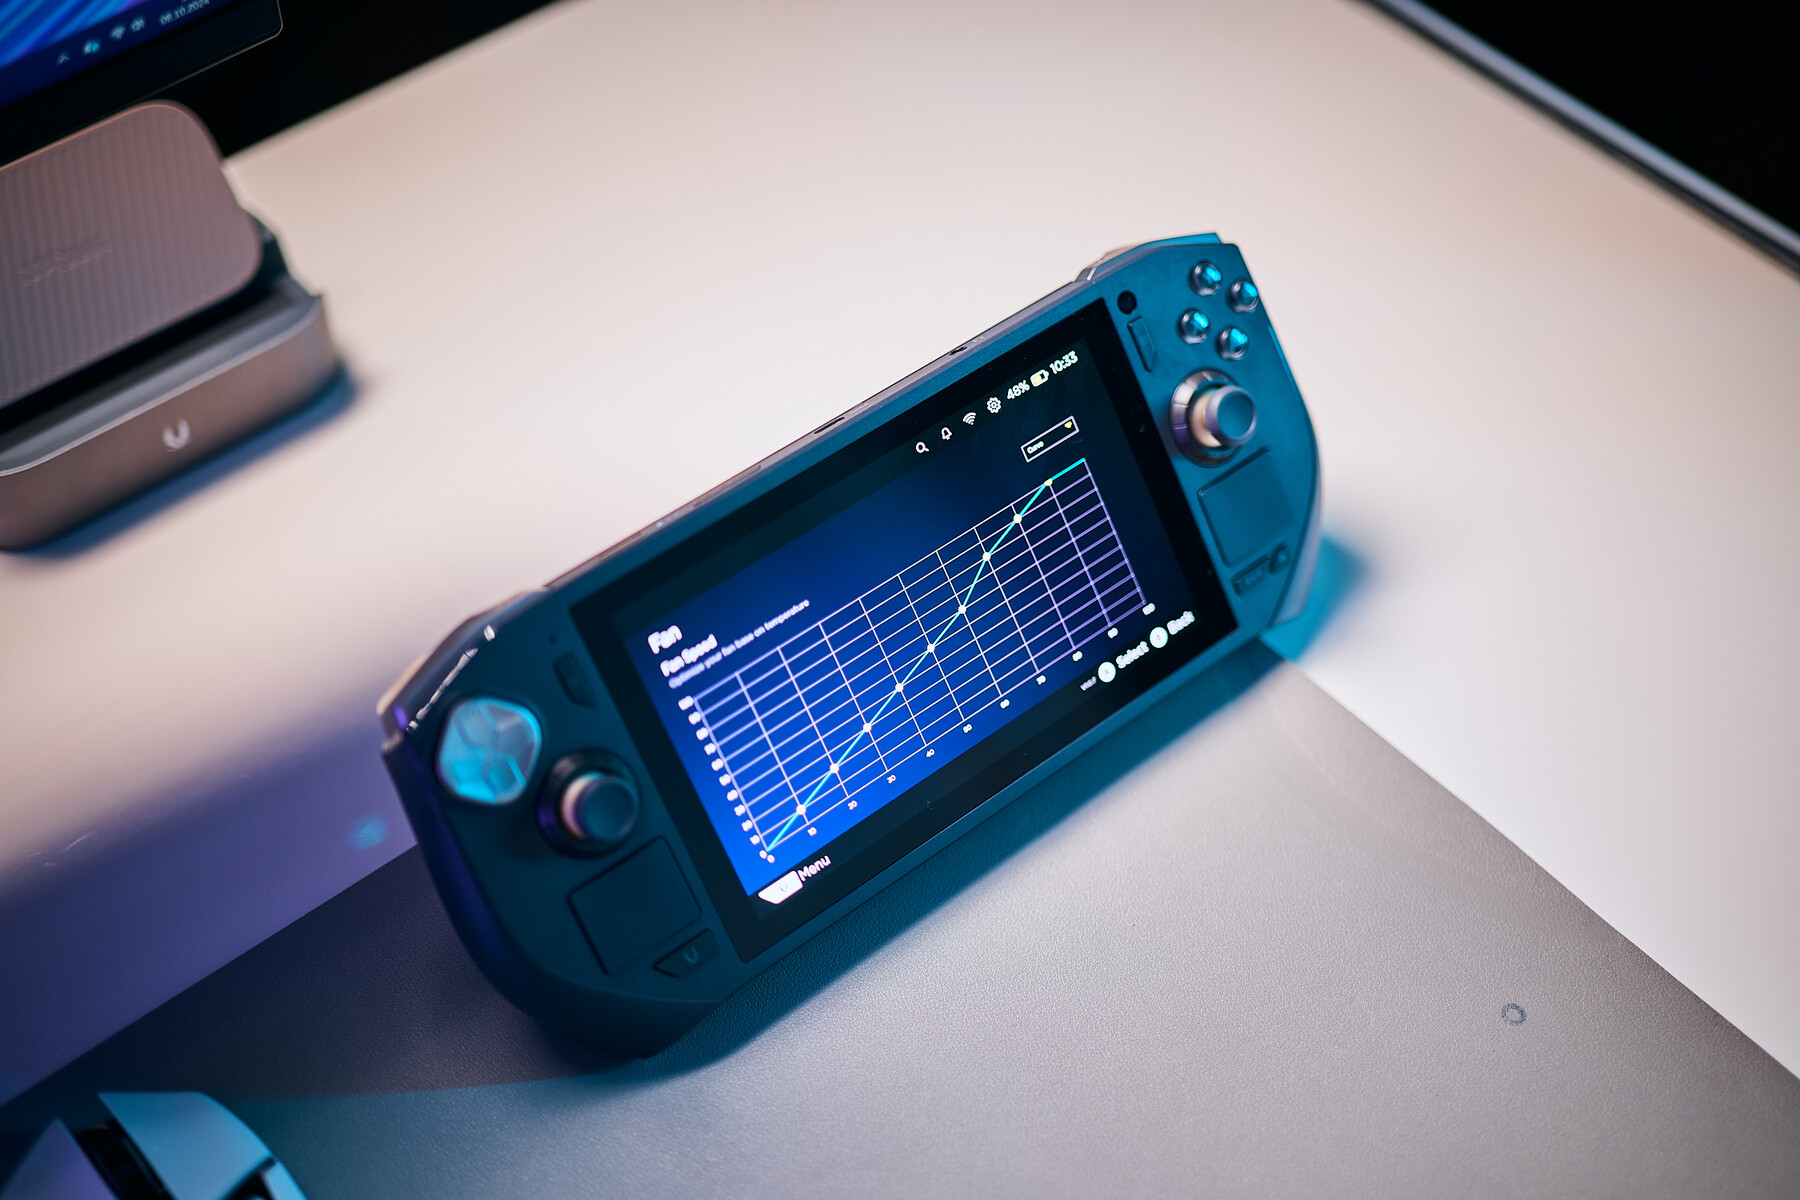
我们认为,Zotac 选择了相对保守的标准设置,以控制温度和风扇噪音,基本上是想在瓦特数和性能之间找到最佳平衡点。
不过,由于你可以选择在 Zotac 的管理应用程序中调整一切,我们以 10 瓦的增量创建了三个额外的配置文件,以了解性能如何扩展到 Zone 的最大 30 瓦。
| Energieprofil | APU TDP | CB R23 Multi | Time Spy Graphics | CP 2077 1080p Low |
|---|---|---|---|---|
| 标准 | 18/16 W | 10198 Pkt. | 2680 Pkt. | 32.49 FPS |
| 30W(定制) | 30W | 13563 Pkt. | 3057 Pkt. | 40.53 FPS |
| 20W(自定义) | 20W | 11300 件 | 2804 件 | 35.60 FPS |
| 10W(自定义) | 10W | 7500Pkt. | 1646 Pkt. | 17.73 FPS |
Prozessor
说到纯粹的 CPU 性能(可以说这对游戏掌上电脑并不那么重要),Zotac 的首款掌上电脑要么落后于竞争对手,要么处于竞争对手的中间位置。
| CPU Performance Rating | |
| Asus ROG Ally Z1 Extreme | |
| Asus ROG Ally X | |
| MSI Claw | |
| Ayaneo Kun | |
| ONEXPLAYER 2 Pro AR18 | |
| Zotac ZGC-G1A1W-01 | |
| Lenovo Legion Go | |
| Average of class Handheld / UMPC | |
| Average AMD Ryzen 7 8840U | |
| Zotac ZGC-G1A1W-01 | |
| Valve Steam Deck 1 TB OLED -1! | |
| Cinebench R23 / Multi Core | |
| Asus ROG Ally X | |
| Ayaneo Kun | |
| Asus ROG Ally Z1 Extreme | |
| MSI Claw | |
| Zotac ZGC-G1A1W-01 | |
| ONEXPLAYER 2 Pro AR18 | |
| Lenovo Legion Go | |
| Average AMD Ryzen 7 8840U (10162 - 13563, n=7) | |
| Average of class Handheld / UMPC (3984 - 16841, n=17, last 2 years) | |
| Zotac ZGC-G1A1W-01 | |
| Valve Steam Deck 1 TB OLED | |
| Cinebench R23 / Single Core | |
| Asus ROG Ally Z1 Extreme | |
| MSI Claw | |
| Lenovo Legion Go | |
| Asus ROG Ally X | |
| ONEXPLAYER 2 Pro AR18 | |
| Zotac ZGC-G1A1W-01 | |
| Average of class Handheld / UMPC (1088 - 2006, n=16, last 2 years) | |
| Zotac ZGC-G1A1W-01 | |
| Average AMD Ryzen 7 8840U (1088 - 1740, n=7) | |
| Ayaneo Kun | |
图形处理器性能 - 不新,但仍有竞争力
在我们的 GPU 合成测试中,情况也差不多。Zone 非常保守的标准设置肯定无法让你体验到红队 780M的能力。但是,如果你将它的功耗提升到最高 30W,它就能轻松超越我们迄今为止测试过的大多数其他手持设备。不过,在风扇噪音方面,它确实需要做出非常重大的权衡,但这一点稍后再谈。
老实说,我们不太理解为什么 Zotac 不提供更多的性能配置文件。虽然对于发烧友来说,有很多选项可以根据自己的特定需求对性能进行微调是件好事,但大多数用户很可能没有能力或耐心去深入了解。
| 3DMark Performance Rating - Percent | |
| MSI Claw | |
| Asus ROG Ally X | |
| Zotac ZGC-G1A1W-01 | |
| Ayaneo Kun | |
| Average of class Handheld / UMPC | |
| ONEXPLAYER 2 Pro AR18 | |
| Asus ROG Ally Z1 Extreme | |
| Lenovo Legion Go | |
| Average AMD Radeon 780M | |
| Zotac ZGC-G1A1W-01 | |
| 3DMark | |
| 1920x1080 Fire Strike Graphics | |
| Asus ROG Ally X | |
| MSI Claw | |
| Ayaneo Kun | |
| Zotac ZGC-G1A1W-01 | |
| Average of class Handheld / UMPC (6580 - 9971, n=17, last 2 years) | |
| Lenovo Legion Go | |
| ONEXPLAYER 2 Pro AR18 | |
| Asus ROG Ally Z1 Extreme | |
| Average AMD Radeon 780M (4550 - 8904, n=65) | |
| Zotac ZGC-G1A1W-01 | |
| 2560x1440 Time Spy Graphics | |
| MSI Claw | |
| Asus ROG Ally X | |
| Zotac ZGC-G1A1W-01 | |
| Average of class Handheld / UMPC (2058 - 4118, n=17, last 2 years) | |
| Ayaneo Kun | |
| ONEXPLAYER 2 Pro AR18 | |
| Asus ROG Ally Z1 Extreme | |
| Average AMD Radeon 780M (1496 - 3196, n=65) | |
| Zotac ZGC-G1A1W-01 | |
| Lenovo Legion Go | |
| 3DMark Fire Strike Score | 6787 points | |
| 3DMark Time Spy Score | 2954 points | |
Help | ||
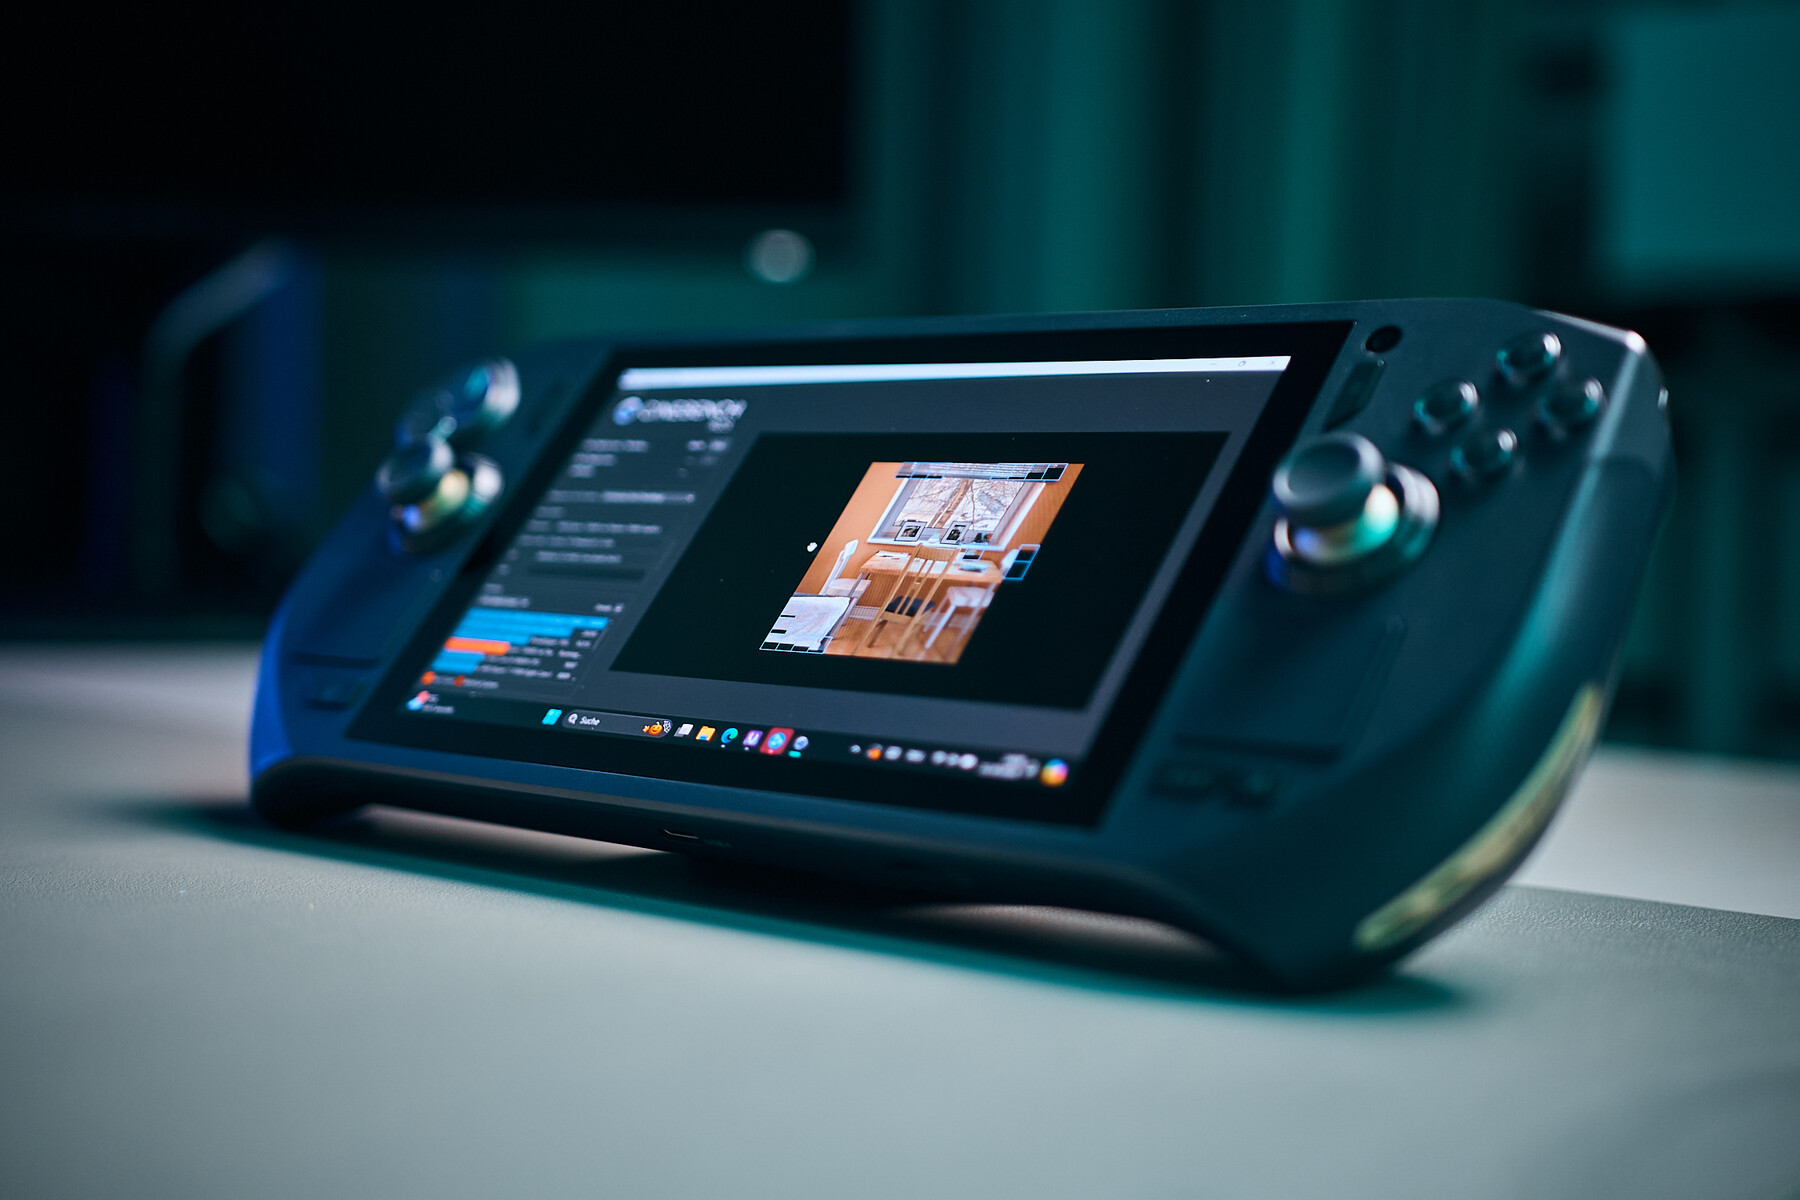
软件体验--面向爱好者
说到软件,Zotac 的覆盖和管理解决方案确实提供了你所期望的一切,但它绝对没有华硕的 Armory Crate SE 那样精致和灵敏,而且缺少一些现在已经成为标准的东西,如 FPS 计数器或基本的遥测功能。
当然,你可以很容易地为它获取第三方软件,但这并不是一种非常精简的体验。
控制叠加功能使用起来也有点麻烦,有些输入无法立即生效,或者在调整设置时会被踢出游戏。因此,虽然硬件很棒,但我认为在软件方面,Zotac 还需要做一些功课。但公平地说,这是所有制造商一开始都在努力解决的问题,只要有足够的用户反馈和一点时间,我们就有望看到一些改进。
游戏性能
说到实际游戏性能,情况与之前一样:
,要么是标准模式下非常低的数据,要么是 ryzen 以 30W 运行时非常非常有竞争力的结果。
总的来说,您将获得与其他掌上电脑大致相同的性能体验,但正如所有掌上电脑一样,您必须进行一些调整才能获得适合自己的帧数体验。
| Performance Rating - Percent | |
| Lenovo Legion Go | |
| Asus ROG Ally X | |
| Zotac ZGC-G1A1W-01 | |
| Ayaneo Kun | |
| ONEXPLAYER 2 Pro AR18 | |
| Asus ROG Ally Z1 Extreme | |
| Average of class Handheld / UMPC | |
| Zotac ZGC-G1A1W-01 | |
| MSI Claw | |
| Valve Steam Deck 1 TB OLED | |
| Cyberpunk 2077 2.2 Phantom Liberty - 1920x1080 Low Preset (FSR off) | |
| Lenovo Legion Go | |
| Asus ROG Ally X | |
| Ayaneo Kun | |
| Ayaneo Kun | |
| ONEXPLAYER 2 Pro AR18 | |
| Zotac ZGC-G1A1W-01 | |
| Zotac ZGC-G1A1W-01 | |
| Asus ROG Ally Z1 Extreme | |
| Average of class Handheld / UMPC (25 - 52.1, n=23, last 2 years) | |
| Zotac ZGC-G1A1W-01 | |
| MSI Claw | |
| Valve Steam Deck 1 TB OLED | |
| Shadow of the Tomb Raider - 1920x1080 Medium Preset | |
| Zotac ZGC-G1A1W-01 | |
| Asus ROG Ally X | |
| Asus ROG Ally Z1 Extreme | |
| Ayaneo Kun | |
| ONEXPLAYER 2 Pro AR18 | |
| Zotac ZGC-G1A1W-01 | |
| Lenovo Legion Go | |
| Average of class Handheld / UMPC (27 - 48, n=13, last 2 years) | |
| MSI Claw | |
| Valve Steam Deck 1 TB OLED | |
FSR 和 Frame Generation - 为您的手持设备增添动力
话虽如此、 FSR和 帧数在过去的几个月里,AMD 的 FSR 和帧生成技术有了很大的改进,举个例子来说,虽然《黑色神话:悟空传》在低设置下的原生渲染帧数非常不稳定,但通过升频和帧生成技术,帧数可以轻松超过或接近 60fps,体验非常棒,尤其是在 OLED 显示屏上玩目前要求最高的游戏。
我还玩了很多 迪亚波罗 4现在我也在玩《DIABLO IV》,为即将到来的扩展做准备,在使用 FSR 时,我的帧数略低于 60fps,再加上华丽的屏幕和超触感输入,如果你问我,这就是顶级的掌上游戏。
排放--无声而缓慢,或响亮而快速
系统噪音
如前所述,Zotac Zone 的风扇噪音取决于所选的性能设置。在标准设置(16-18W)下,风扇运行时噪音相对较小,一般使用时只有轻微的嗡嗡声。这使它在较安静的环境中使用时更加舒适,不会有任何大的噪音干扰。
然而,当 TDP 提升到 30W 以最大限度地提高性能数据时,风扇的声音会变得更大,以补偿增加的热量。在此设置下,风扇的声音非常大,这可能会在长时间游戏时对某些人造成困扰。
在相应的YouTube 评测 中,我们添加了一些在不同功率设置和不同使用情况下的主观噪音示例(9:20)。
电池运行时间
Zotac 表示,Zotac Zone 早期样品的电池情况尚未最终确定,因此还不能对电池续航时间进行全面评估。因此,我们只是做了一个简单的测试,运行 赛博朋克 2077在低设置、最大亮度下运行。测试结果约为 1 小时 38 分钟,与大多数同类产品相比还算不错。
Ally X 的 80 瓦时电池极大地震撼了市场;从现在起,这将成为所有其他竞争者必须竞争的标准。
Lean back and enjoy: Our Zotac Zone review video
Transparency
The selection of devices to be reviewed is made by our editorial team. The test sample was provided to the author as a loan by the manufacturer or retailer for the purpose of this review. The lender had no influence on this review, nor did the manufacturer receive a copy of this review before publication. There was no obligation to publish this review. We never accept compensation or payment in return for our reviews. As an independent media company, Notebookcheck is not subjected to the authority of manufacturers, retailers or publishers.
This is how Notebookcheck is testing
Every year, Notebookcheck independently reviews hundreds of laptops and smartphones using standardized procedures to ensure that all results are comparable. We have continuously developed our test methods for around 20 years and set industry standards in the process. In our test labs, high-quality measuring equipment is utilized by experienced technicians and editors. These tests involve a multi-stage validation process. Our complex rating system is based on hundreds of well-founded measurements and benchmarks, which maintains objectivity. Further information on our test methods can be found here.
Price comparison

