

戴尔 Inspiron 16 Plus 7640 笔记本电脑评测:与去年的机型相比,变化虽小却很重要

Inspiron 16 Plus 7640 的命名恰如其分,它取代了 2023 Inspiron 16 Plus 7630,采用了全新的 AI 就绪处理器,而不是去年的 Raptor Lake-H 选项。除了内外部的一些其他小变化外,该机型与前代产品基本相同,因此我们建议您查看我们的 Inspiron 15 Plus 7630 的评测了解有关 Inspiron 15 Plus 7640 物理特性的更多信息。
Inspiron 16 Plus 7640 有多种配置,从第 13 代酷睿 i7-13620H 到第 14 代酷睿 Ultra 9 185H,从集成 UHD 或 Arc 显卡到独立GeForce RTX 4060,以及 1200p 或 1600p 显示屏可供选择。此外,还提供配备 Ryzen 5 8540U 或 Ryzen 7 8840U 的 AMD Zen 4 SKU,但仅适用于普通 Inspiron 16 7640 非加长版机型,没有独立显卡或 1600p 选项。我们的测试机是高端配置,配备酷睿至尊 7 155H、1600p 显示屏和 RTX 4060 显卡,零售价约为 1300 美元。
竞争对手包括其他中端 16 英寸多媒体笔记本电脑,如 华硕 VivoBook Pro 16, 联想 Yoga 7 2 合 1 16IML9或 惠普 Envy 16 系列.
更多戴尔评测:
潜在的竞争对手比较
Rating | Date | Model | Weight | Height | Size | Resolution | Price |
|---|---|---|---|---|---|---|---|
| 83.4 % | 06 / 2024 | Dell Inspiron 16 Plus 7640 Ultra 7 155H, NVIDIA GeForce RTX 4060 Laptop GPU | 2.2 kg | 19.9 mm | 16.00" | 2560x1600 | |
| 87.1 % v7 (old) | 08 / 2023 | Dell Inspiron 16 Plus 7630 i7-13700H, NVIDIA GeForce RTX 4060 Laptop GPU | 2.2 kg | 19.95 mm | 16.00" | 2560x1600 | |
| 87.4 % v7 (old) | 08 / 2022 | Dell Inspiron 16 Plus 7620 i7-12700H, GeForce RTX 3050 Ti Laptop GPU | 2.1 kg | 18.99 mm | 16.00" | 3072x1920 | |
| 90.4 % v7 (old) | 03 / 2024 | Samsung Galaxy Book4 Ultra Ultra 7 155H, NVIDIA GeForce RTX 4050 Laptop GPU | 1.8 kg | 17 mm | 16.00" | 2880x1800 | |
| 89.1 % v7 (old) | 02 / 2024 | Lenovo Legion 5 16IRX G9 i7-14650HX, NVIDIA GeForce RTX 4060 Laptop GPU | 2.4 kg | 25.2 mm | 16.00" | 2560x1600 | |
| 87.6 % v7 (old) | 11 / 2023 | Asus VivoBook Pro 16 K6602VU i9-13900H, NVIDIA GeForce RTX 4050 Laptop GPU | 1.9 kg | 19 mm | 16.00" | 3200x2000 |
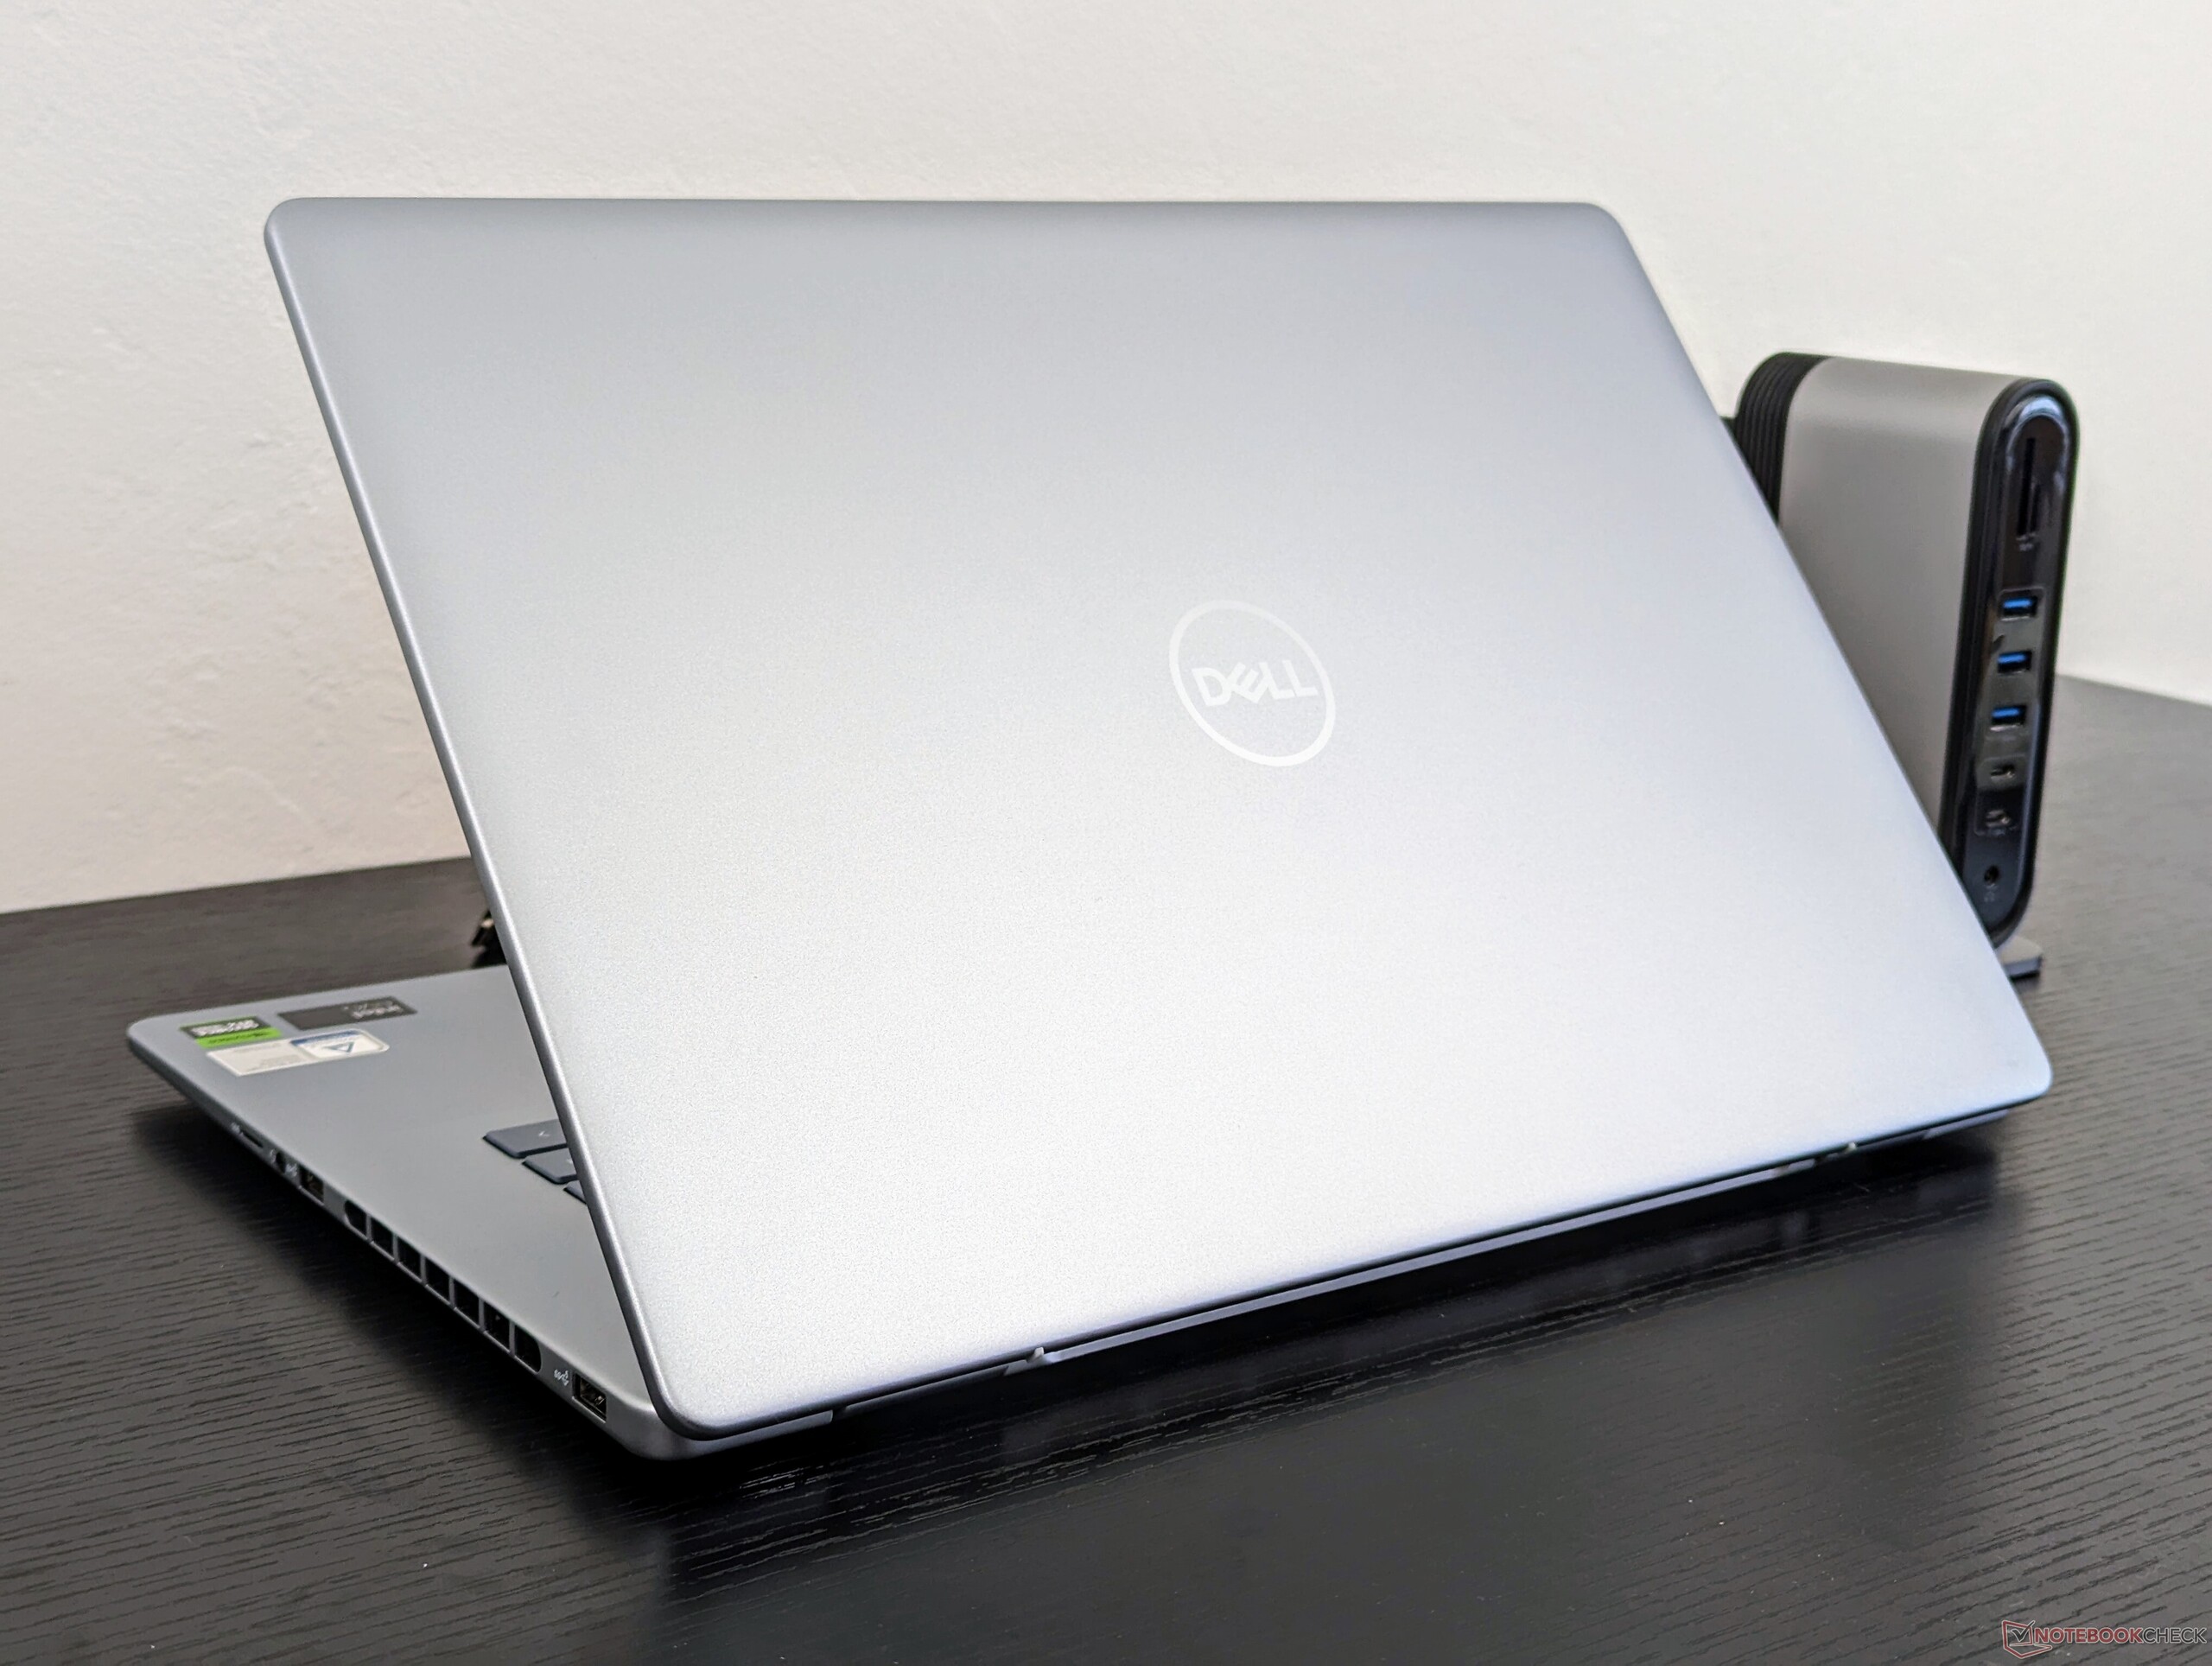
案例 - 更多更大的通风口
该机型新增了一个专用的 Co-Pilot 键,取代了键盘右半部分的 Ctrl 键。掌托区域更扁平,底座周边更圆润,背面和侧面的通风栅经过重新设计,比以前更大。机箱材料和端口在其他方面没有变化,第一印象和尺寸相似。
SD 读卡器
| SD Card Reader | |
| average JPG Copy Test (av. of 3 runs) | |
| Asus VivoBook Pro 16 K6602VU (Angelbird AV Pro V60) | |
| Samsung Galaxy Book4 Ultra (Angelbird AV Pro V60) | |
| Lenovo Legion 5 16IRX G9 | |
| Dell Inspiron 16 Plus 7620 (Toshiba Exceria Pro SDXC 64 GB UHS-II) | |
| Dell Inspiron 16 Plus 7640 (Angelbird AV Pro V60) | |
| Dell Inspiron 16 Plus 7630 (AV Pro SD microSD 128 GB V60) | |
| maximum AS SSD Seq Read Test (1GB) | |
| Asus VivoBook Pro 16 K6602VU (Angelbird AV Pro V60) | |
| Samsung Galaxy Book4 Ultra (Angelbird AV Pro V60) | |
| Lenovo Legion 5 16IRX G9 | |
| Dell Inspiron 16 Plus 7640 (Angelbird AV Pro V60) | |
| Dell Inspiron 16 Plus 7620 (Toshiba Exceria Pro SDXC 64 GB UHS-II) | |
| Dell Inspiron 16 Plus 7630 (AV Pro SD microSD 128 GB V60) | |
交流
| Networking | |
| iperf3 transmit AXE11000 | |
| Samsung Galaxy Book4 Ultra | |
| Asus VivoBook Pro 16 K6602VU | |
| Lenovo Legion 5 16IRX G9 | |
| Dell Inspiron 16 Plus 7630 | |
| Dell Inspiron 16 Plus 7640 | |
| iperf3 receive AXE11000 | |
| Samsung Galaxy Book4 Ultra | |
| Asus VivoBook Pro 16 K6602VU | |
| Lenovo Legion 5 16IRX G9 | |
| Dell Inspiron 16 Plus 7630 | |
| Dell Inspiron 16 Plus 7640 | |
| iperf3 transmit AXE11000 6GHz | |
| Dell Inspiron 16 Plus 7630 | |
| Asus VivoBook Pro 16 K6602VU | |
| Dell Inspiron 16 Plus 7620 | |
| Dell Inspiron 16 Plus 7640 | |
| iperf3 receive AXE11000 6GHz | |
| Asus VivoBook Pro 16 K6602VU | |
| Dell Inspiron 16 Plus 7630 | |
| Dell Inspiron 16 Plus 7620 | |
| Dell Inspiron 16 Plus 7640 | |
网络摄像头
描述网络摄像头质量,添加测试图表图像。


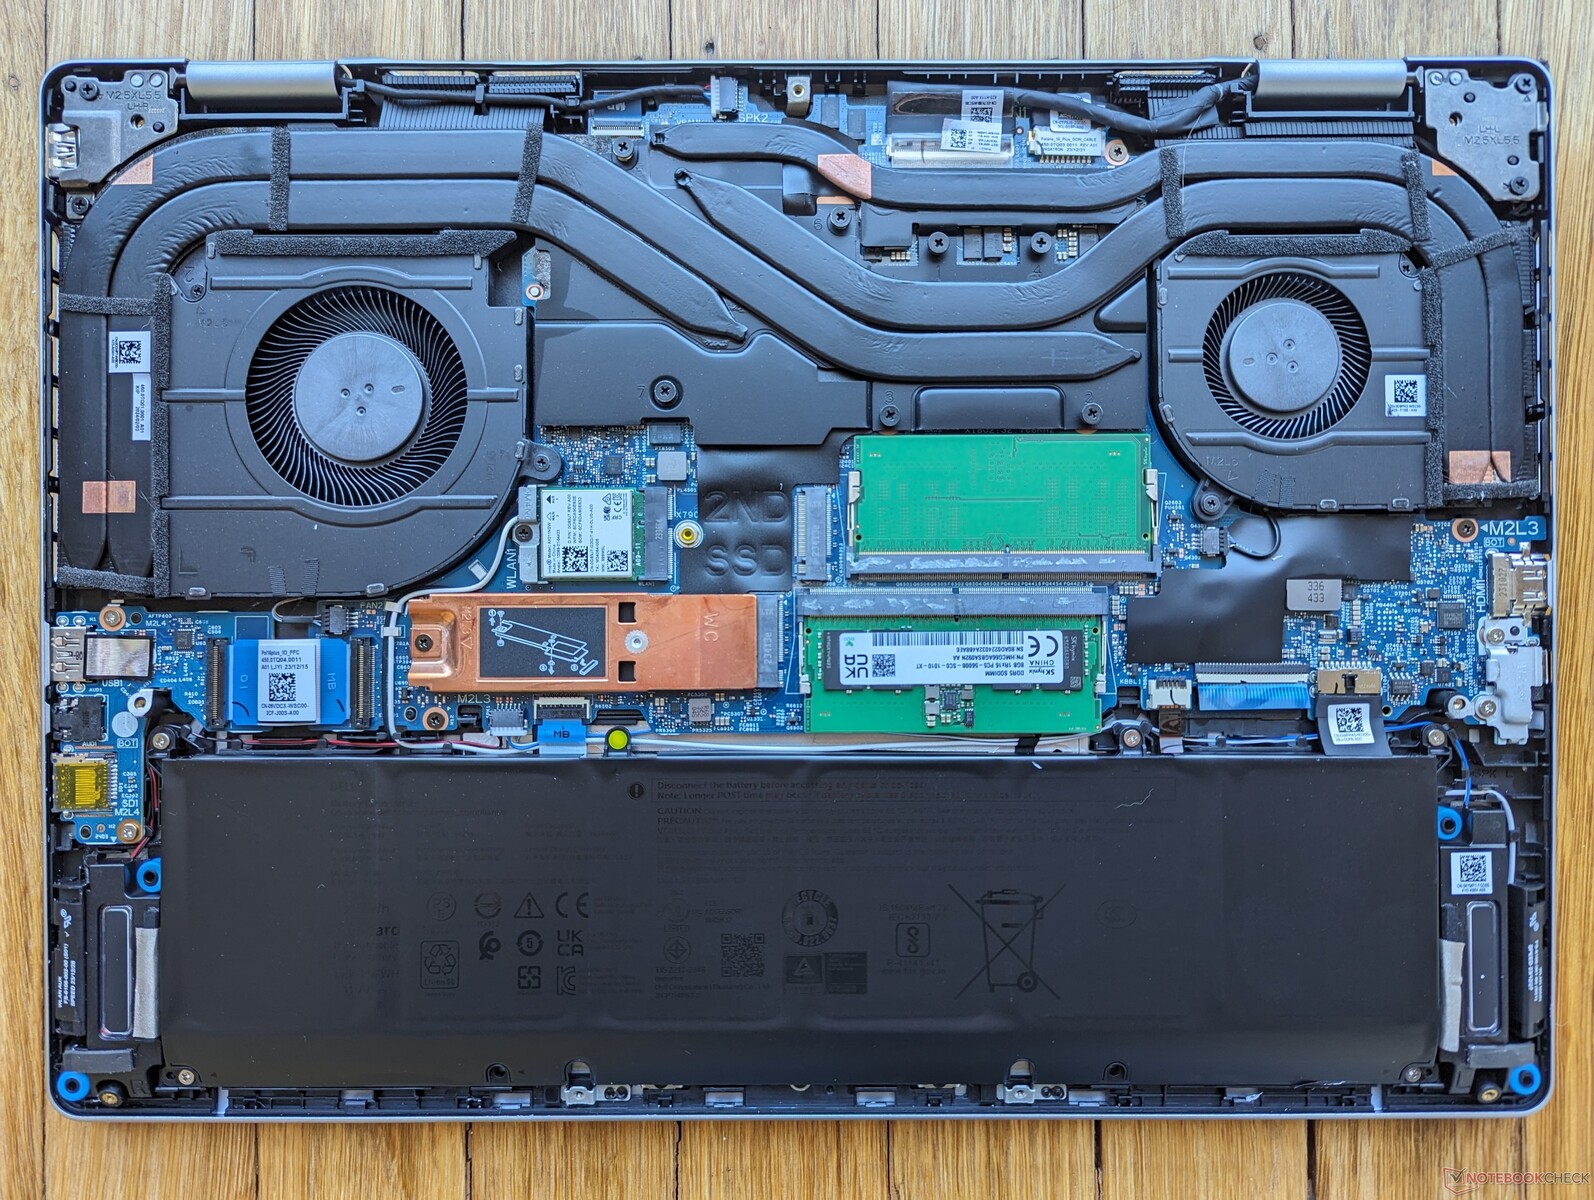
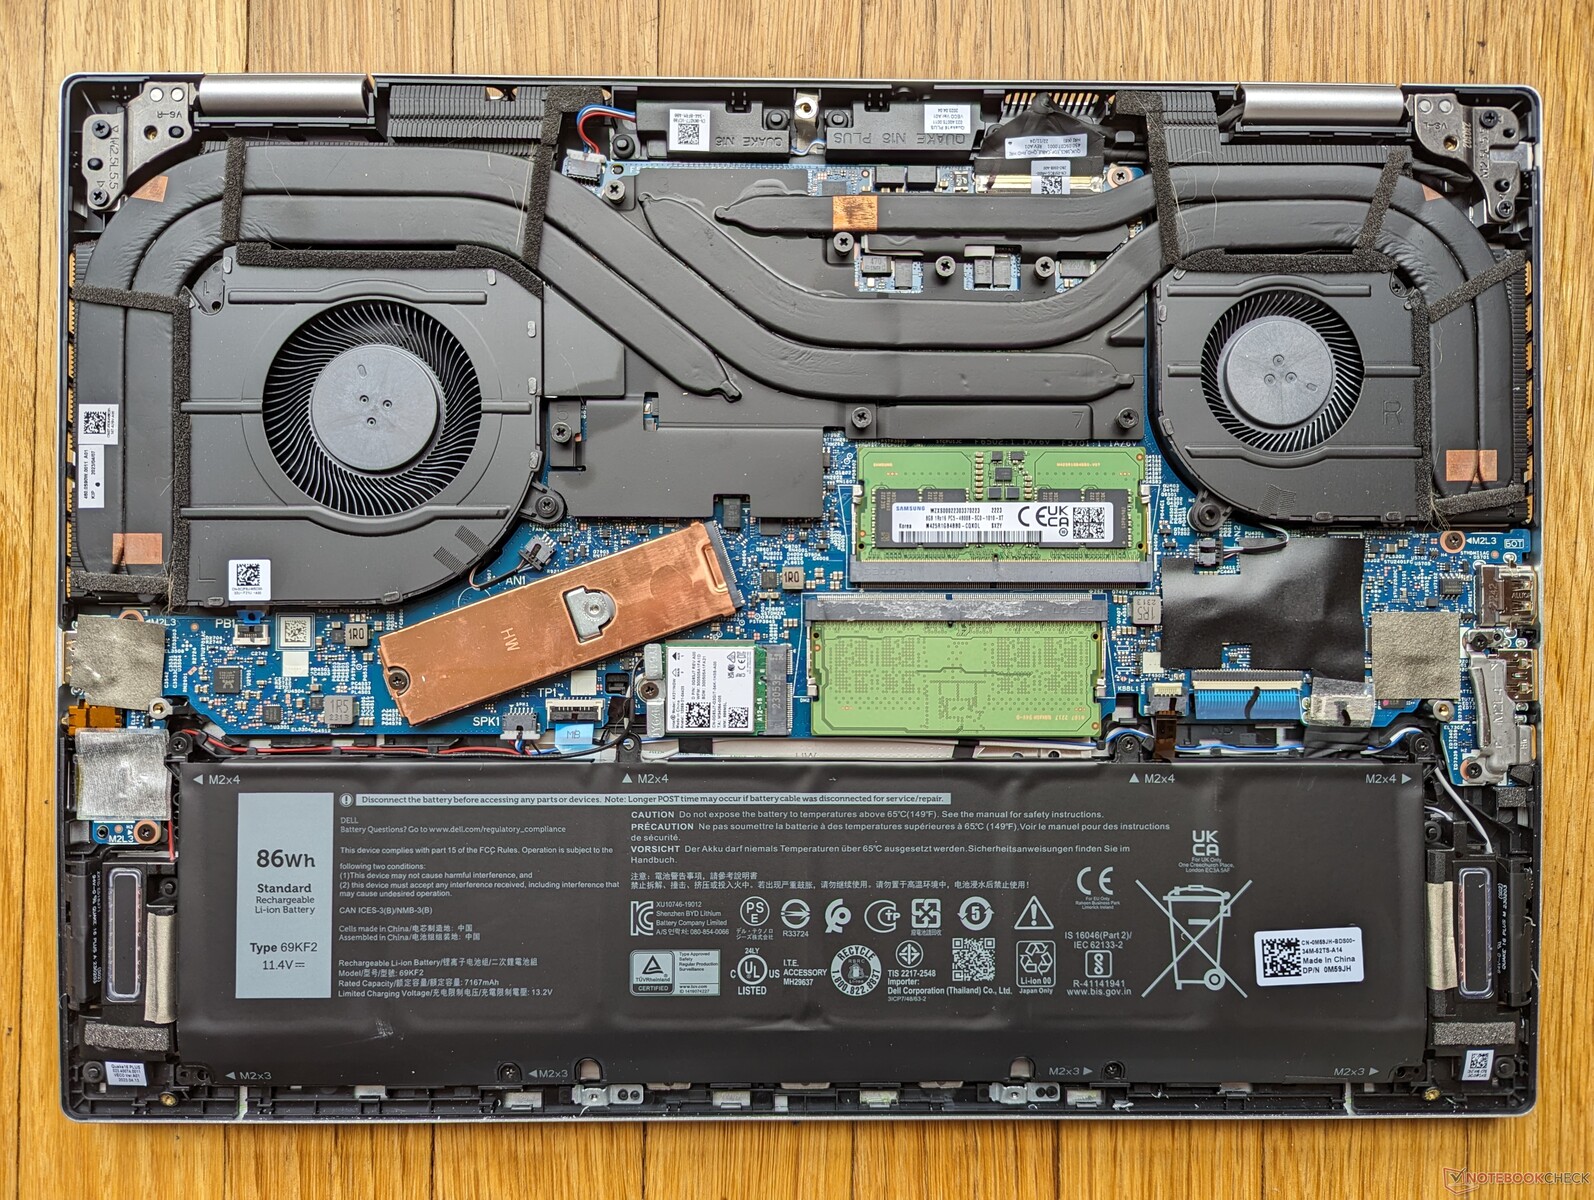
维护
打开系统后可以看到它与前代产品的一个主要区别:支持二级 M.2 2230 固态硬盘。除此之外,其他方面似乎与 Inspiron 16 Plus 7630 基本相同,如下图所示。
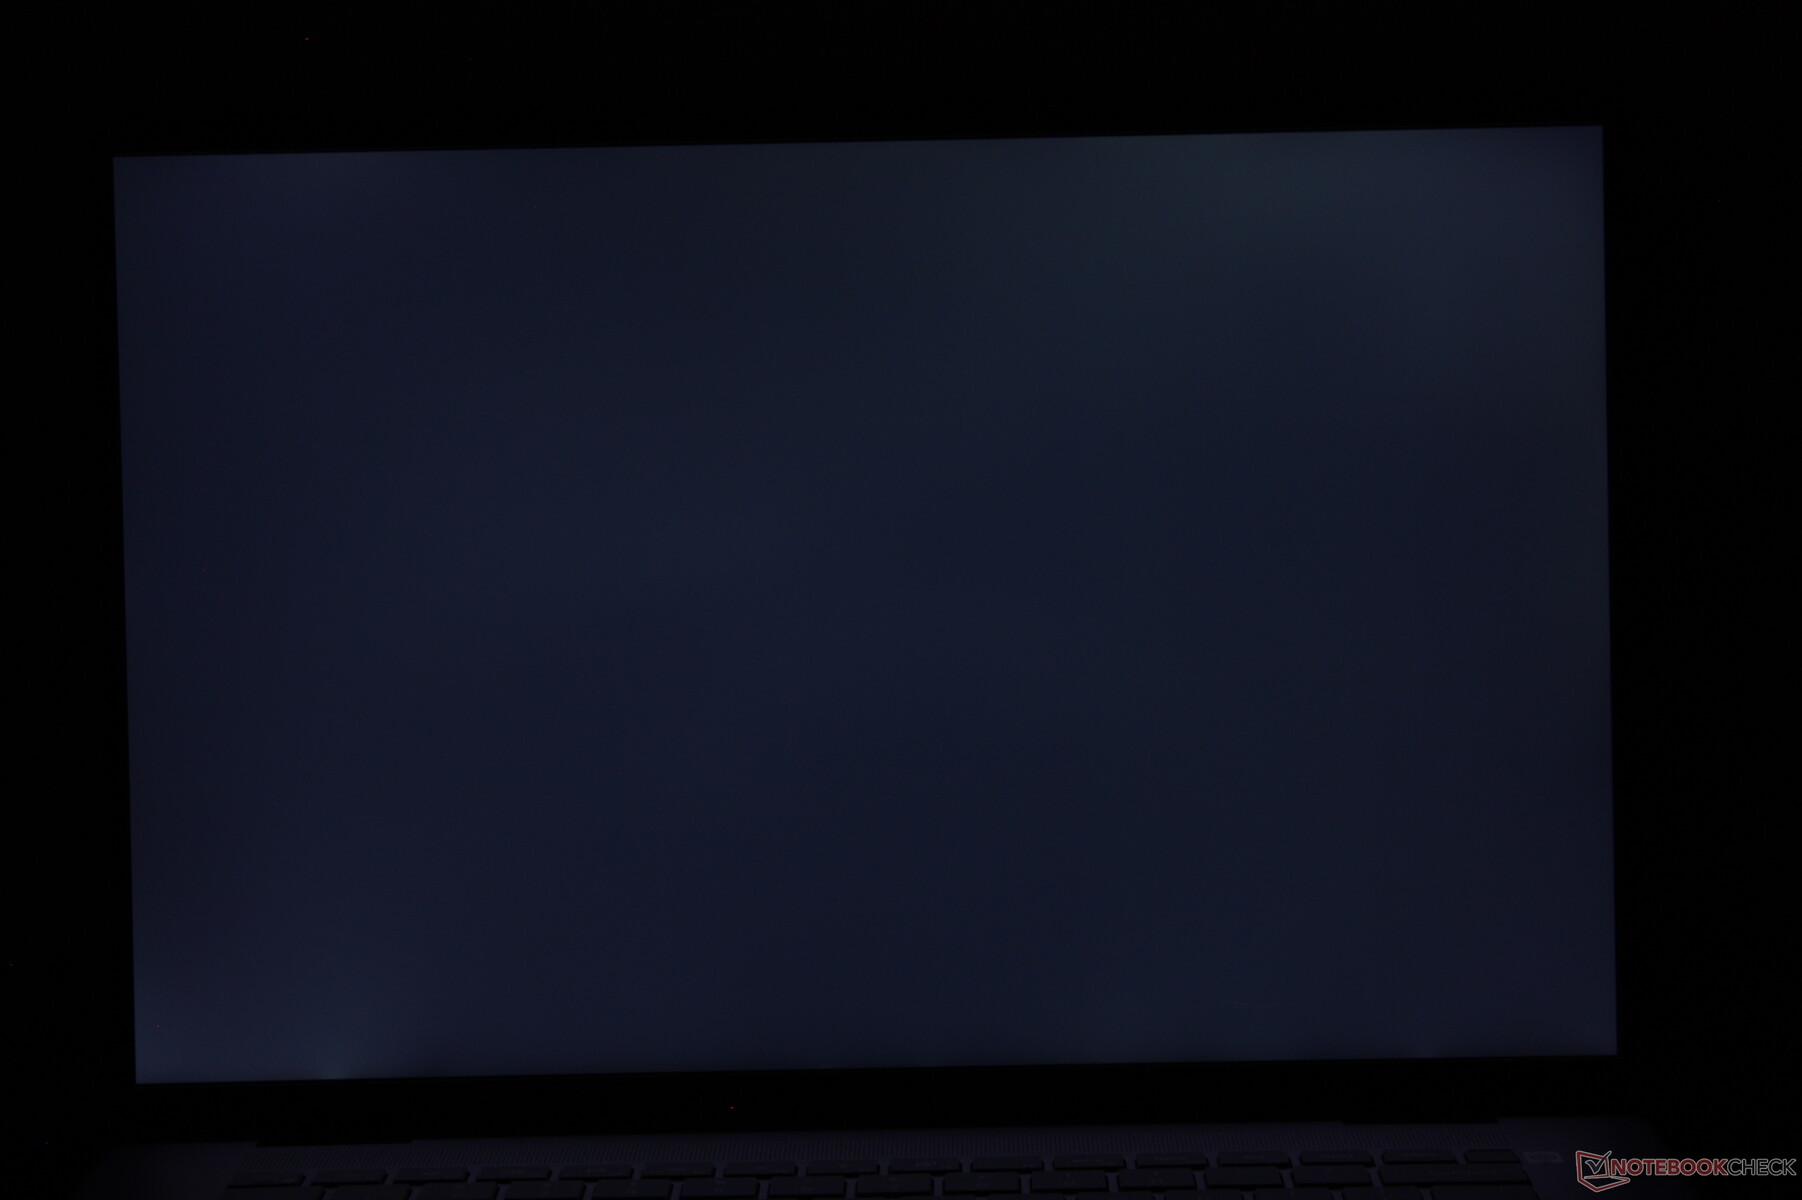
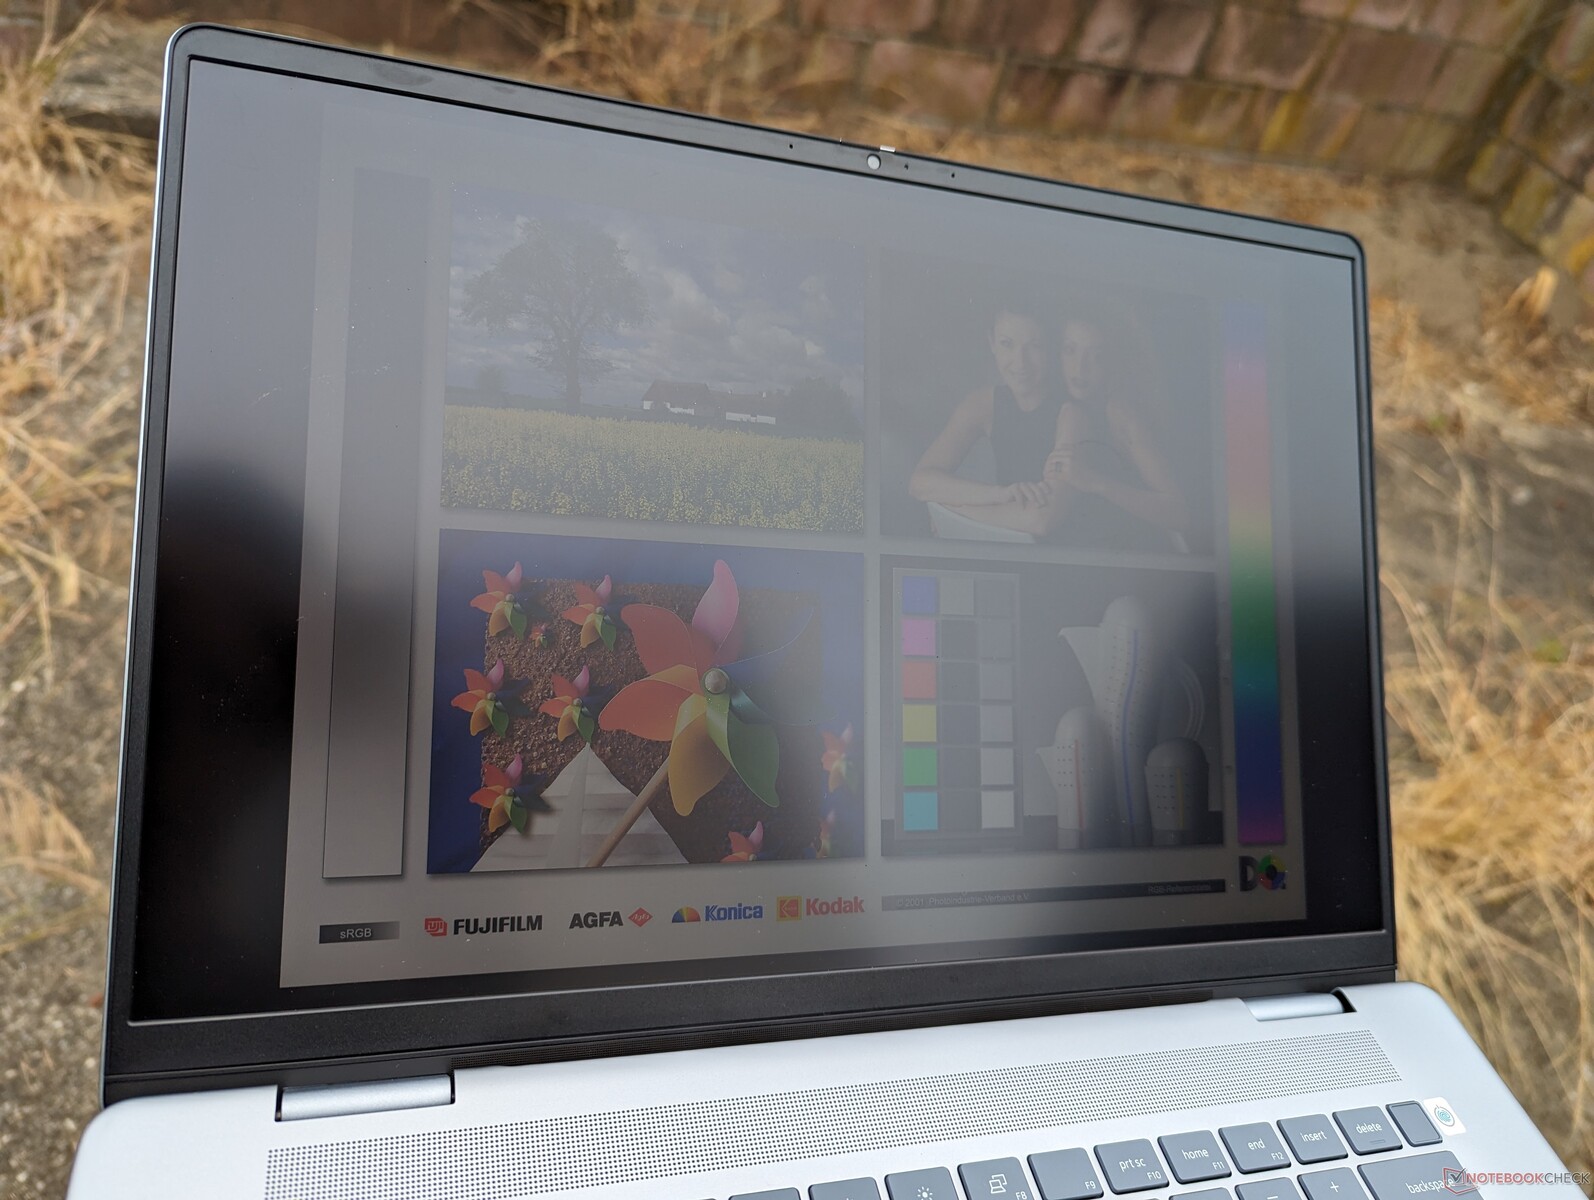
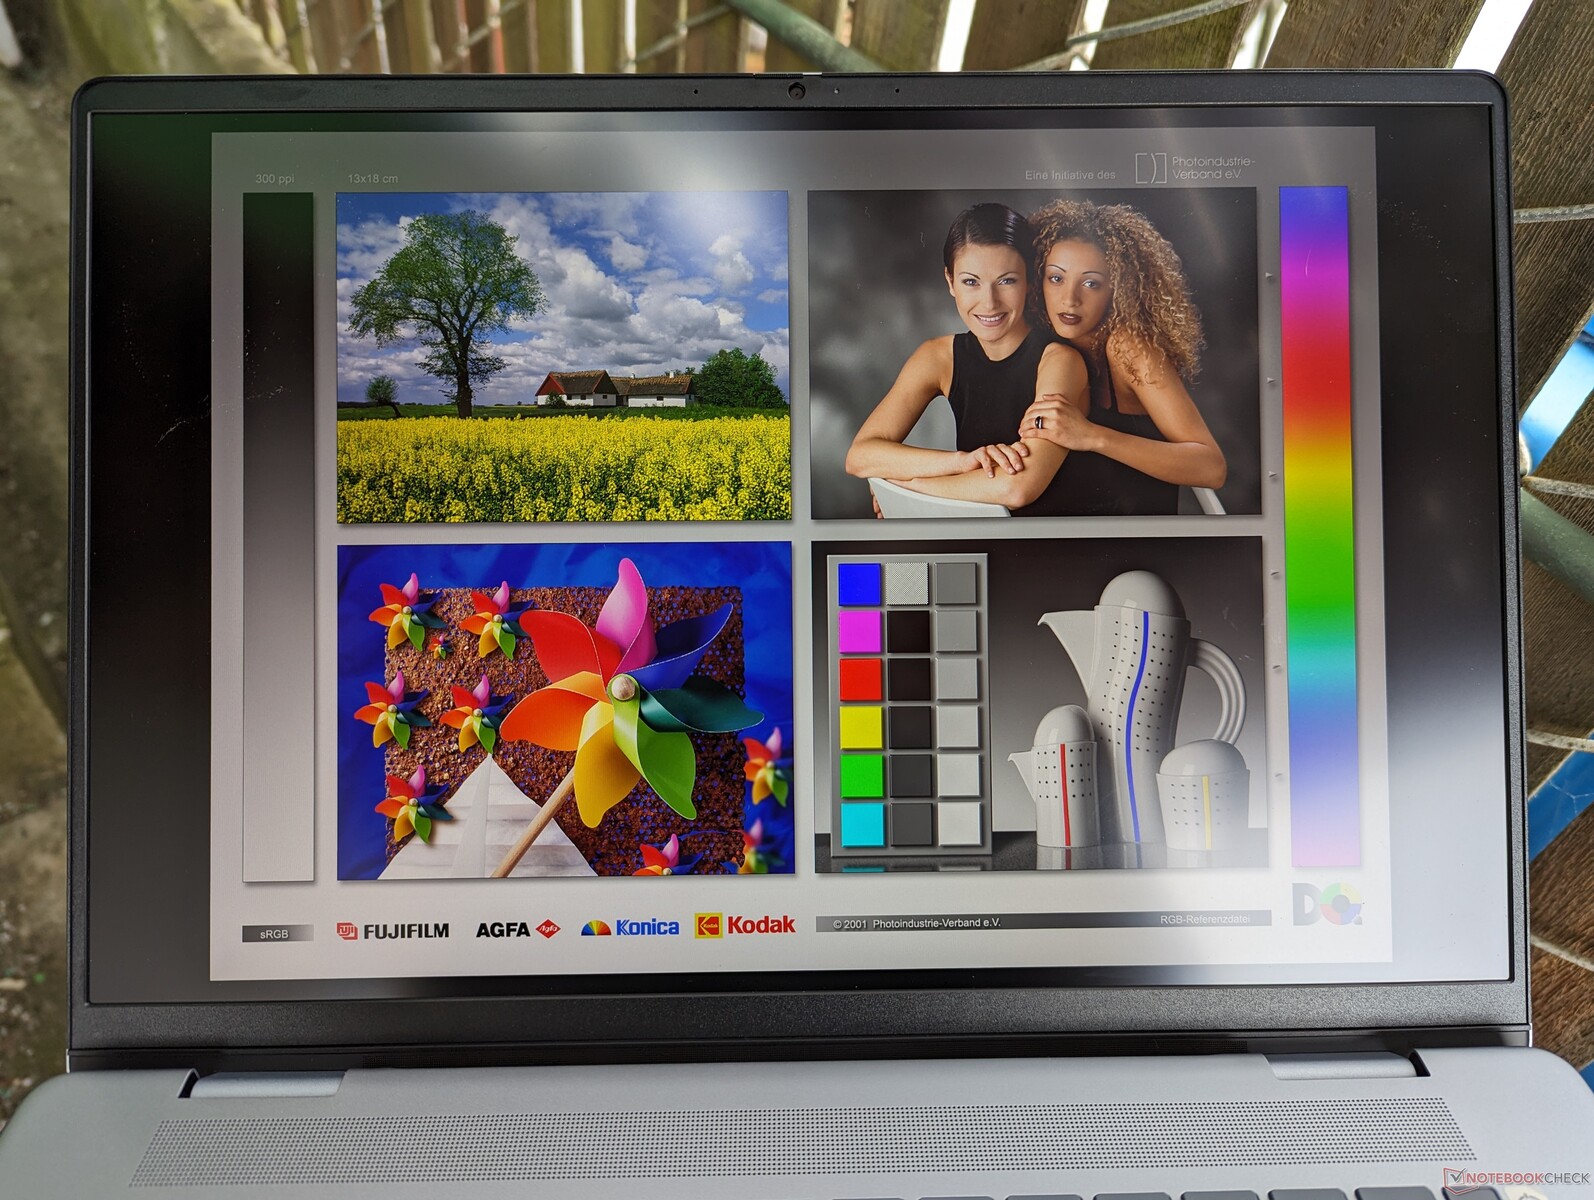
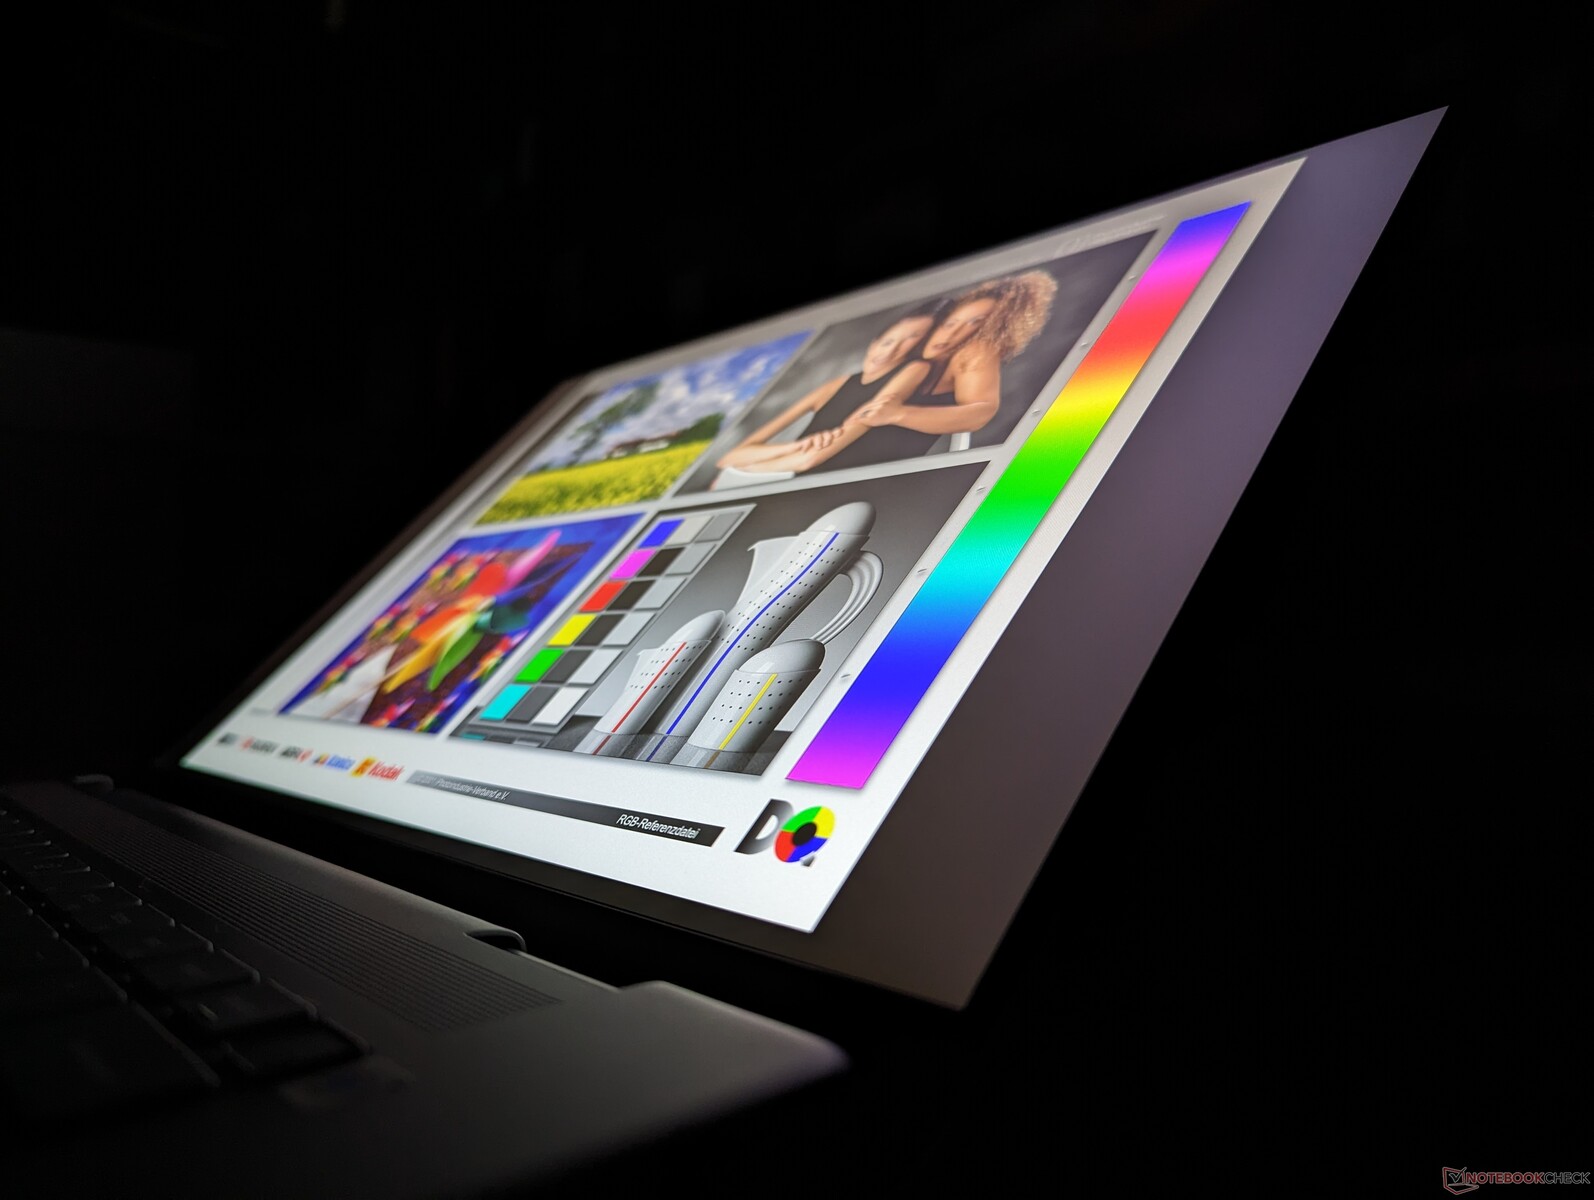
显示屏 - FHD+ 和 QHD+ 选项
有以下两种显示选项:
- 1920 x 1200,60 Hz,触摸屏,亮面
- 2560 x 1600,120 赫兹,非触摸屏,亚光
我们的设备配备了上述黑体面板。请注意,戴尔官方产品页面错误地将 1600p 面板的频率列为 60 Hz;我们可以确认,该面板支持 120 Hz 和 48 Hz 的原生刷新率,与去年的 Inspiron 16 Plus 7630 类似,不支持 G-Sync。
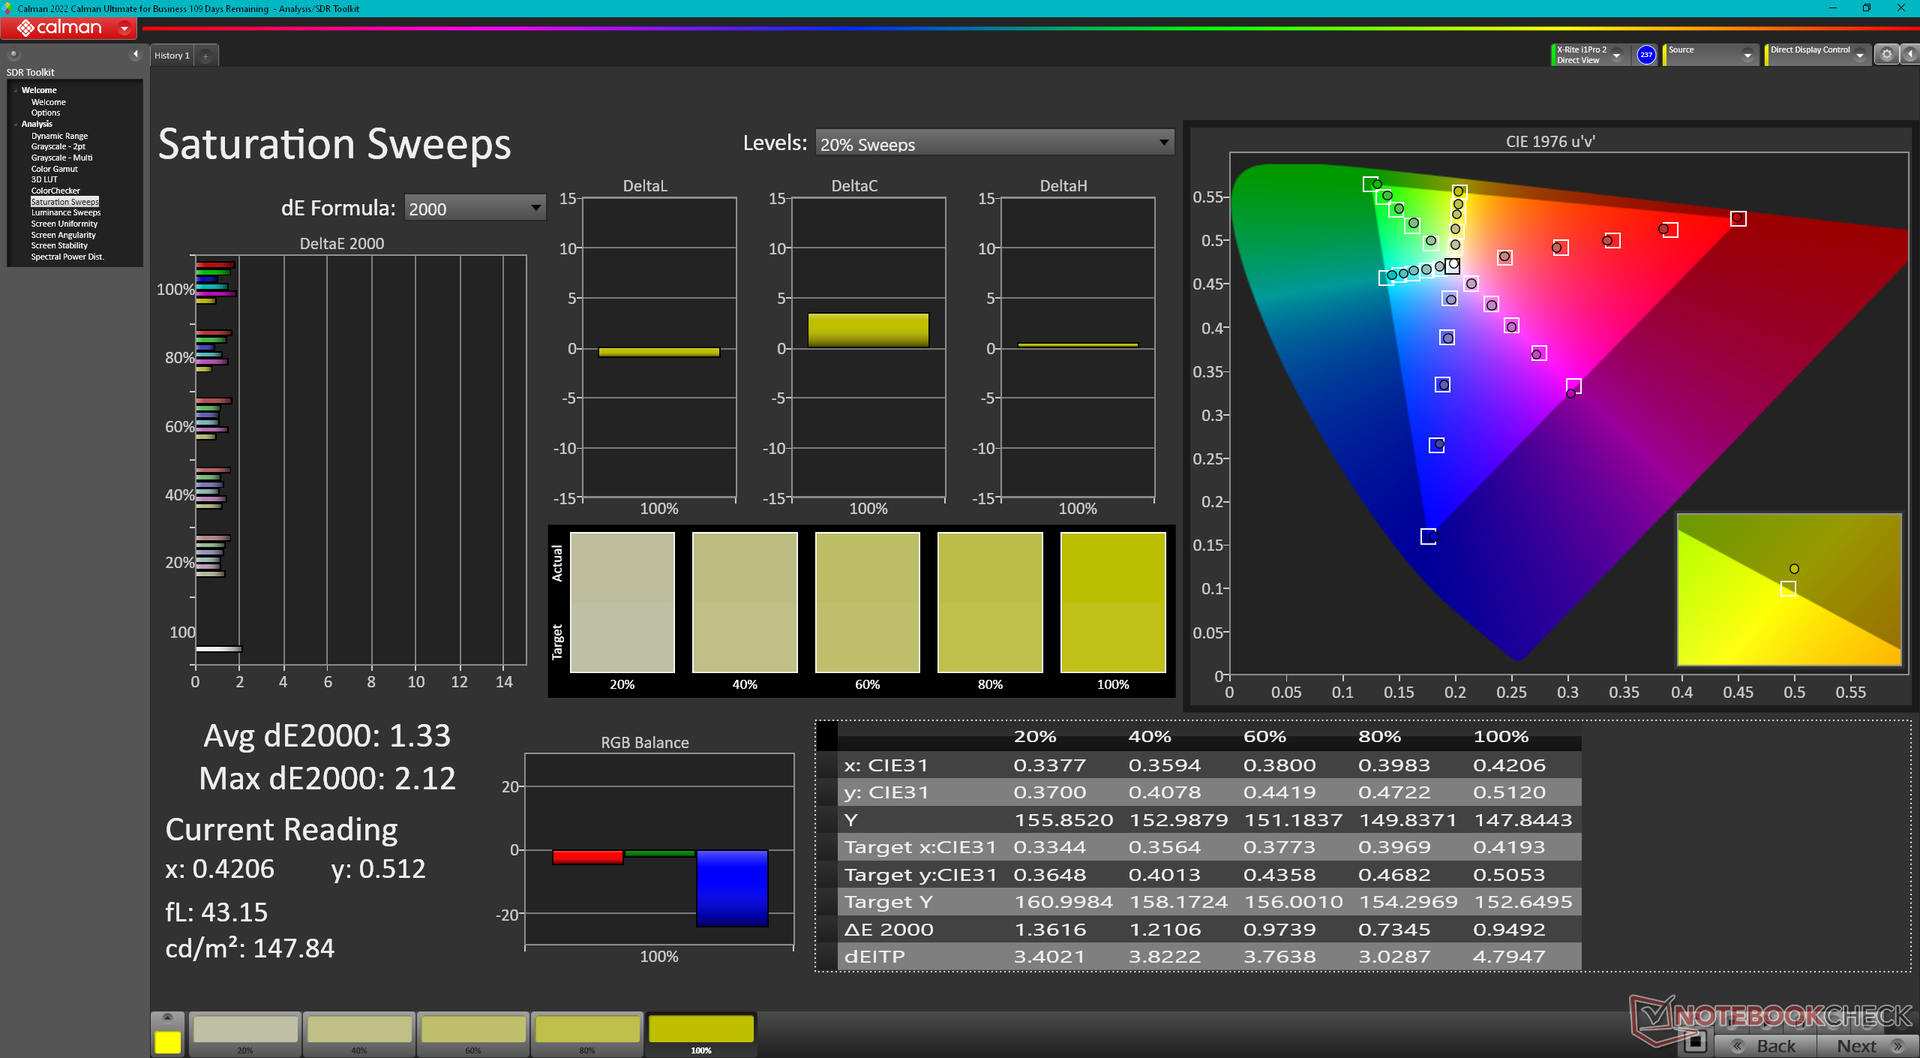
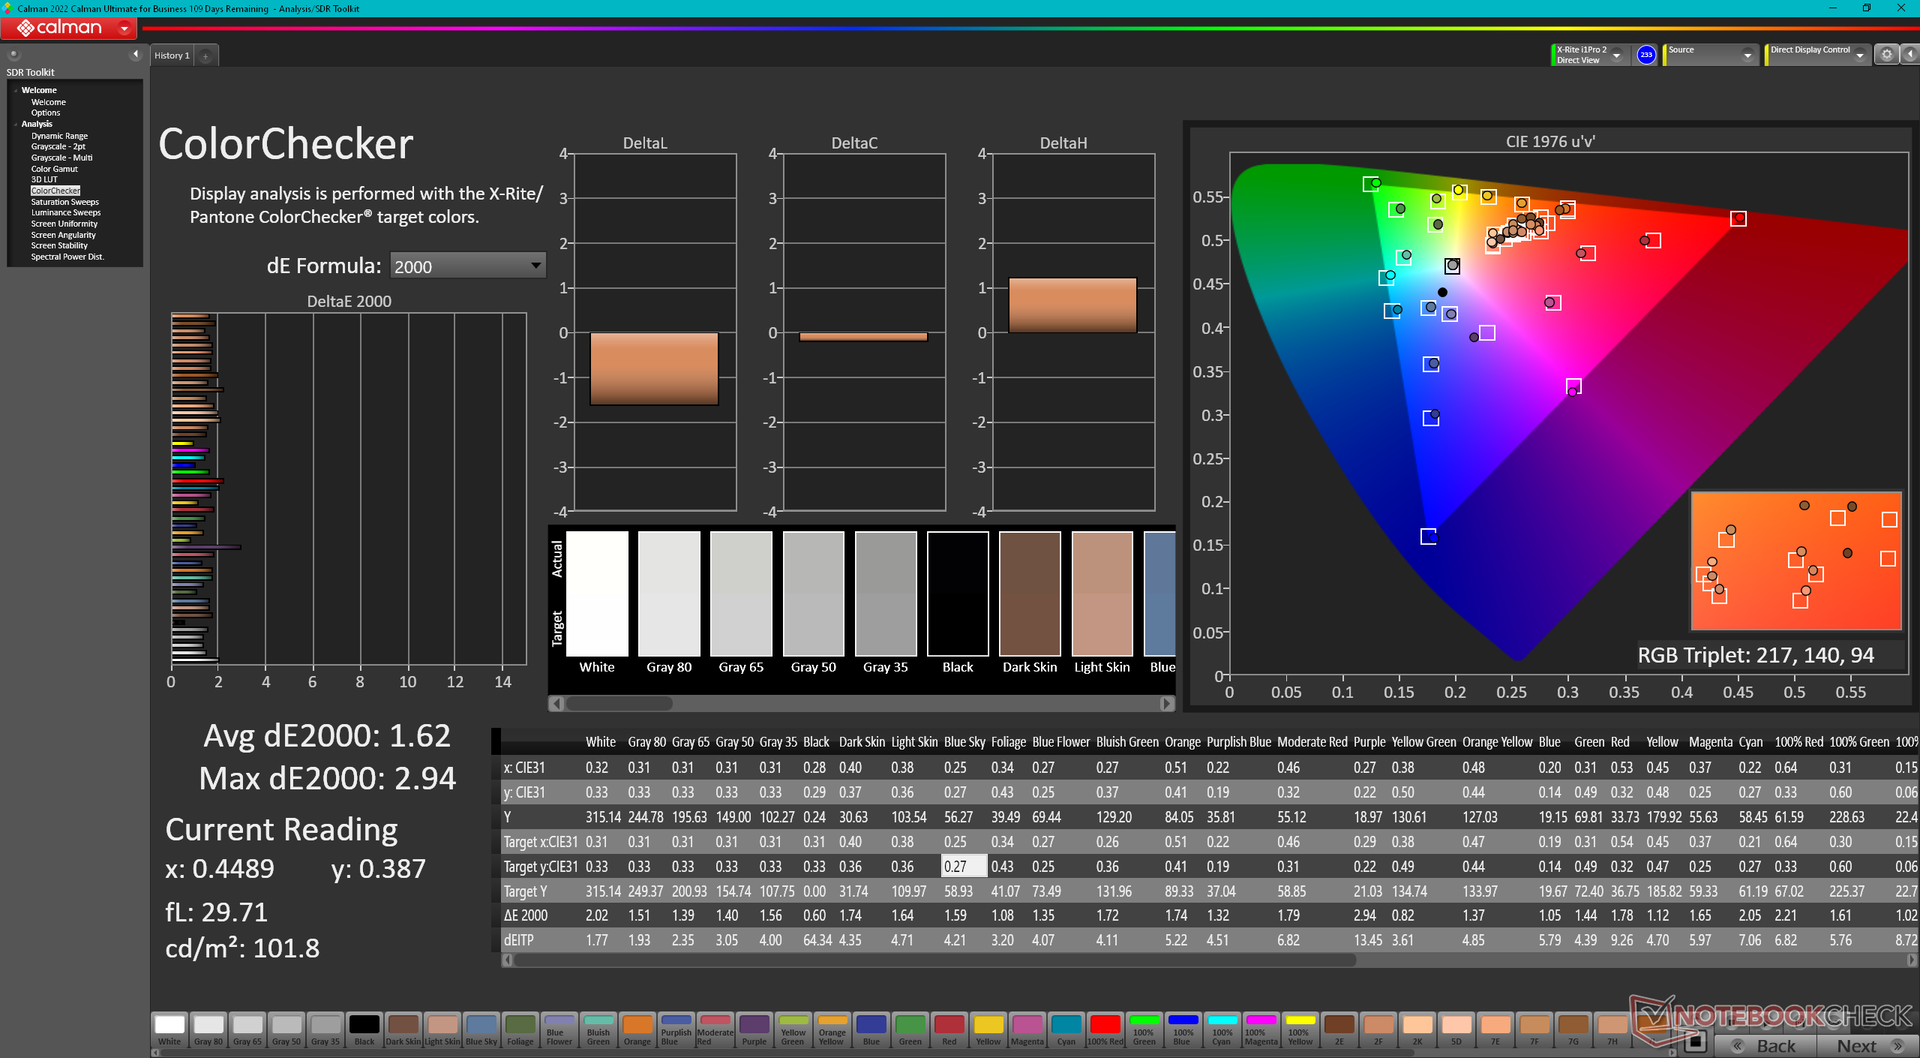
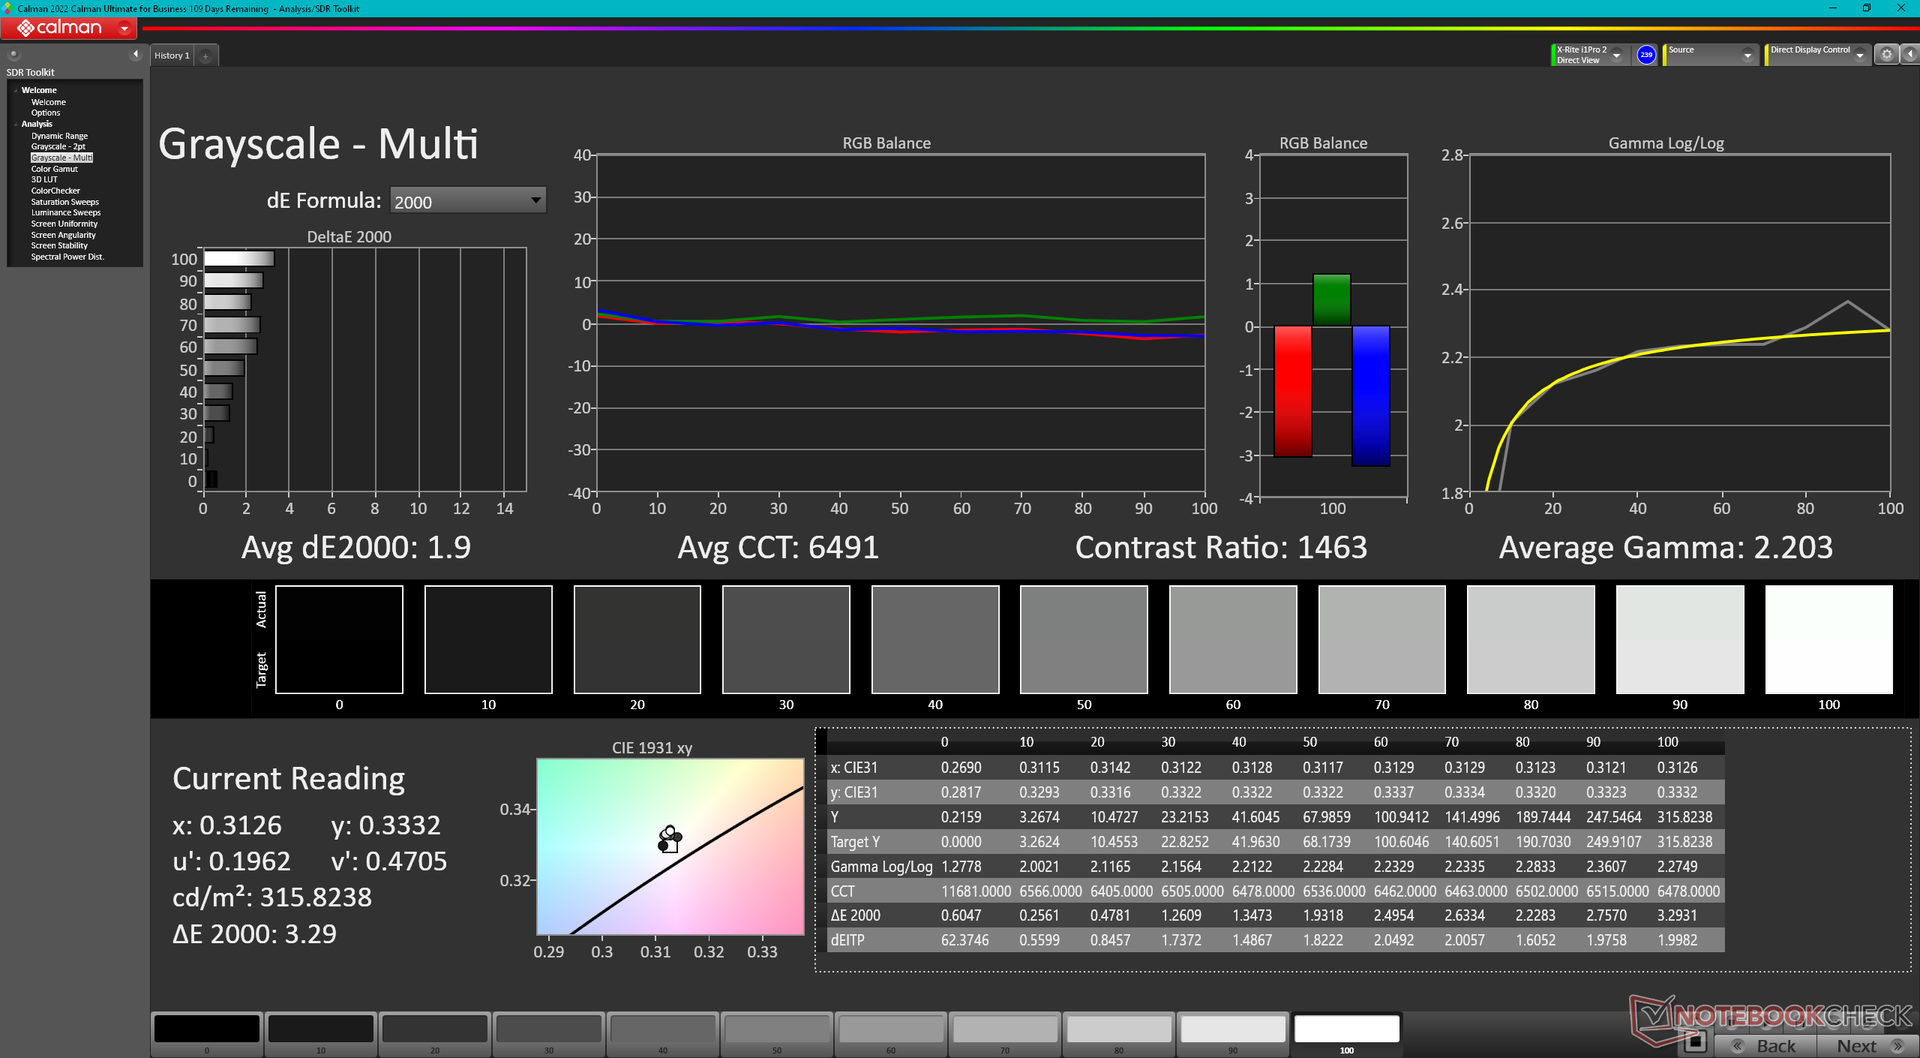
有趣的是,戴尔在今年的 Inspiron 16 Plus 7640 上将面板供应商从 LG 飞利浦换成了友达光电。更新的面板响应速度更快,可以最大限度地减少重影现象,同时提供与以前类似的 sRGB 色彩、亮度级别和对比度。
| |||||||||||||||||||||||||
Brightness Distribution: 89 %
Center on Battery: 314.7 cd/m²
Contrast: 1124:1 (Black: 0.28 cd/m²)
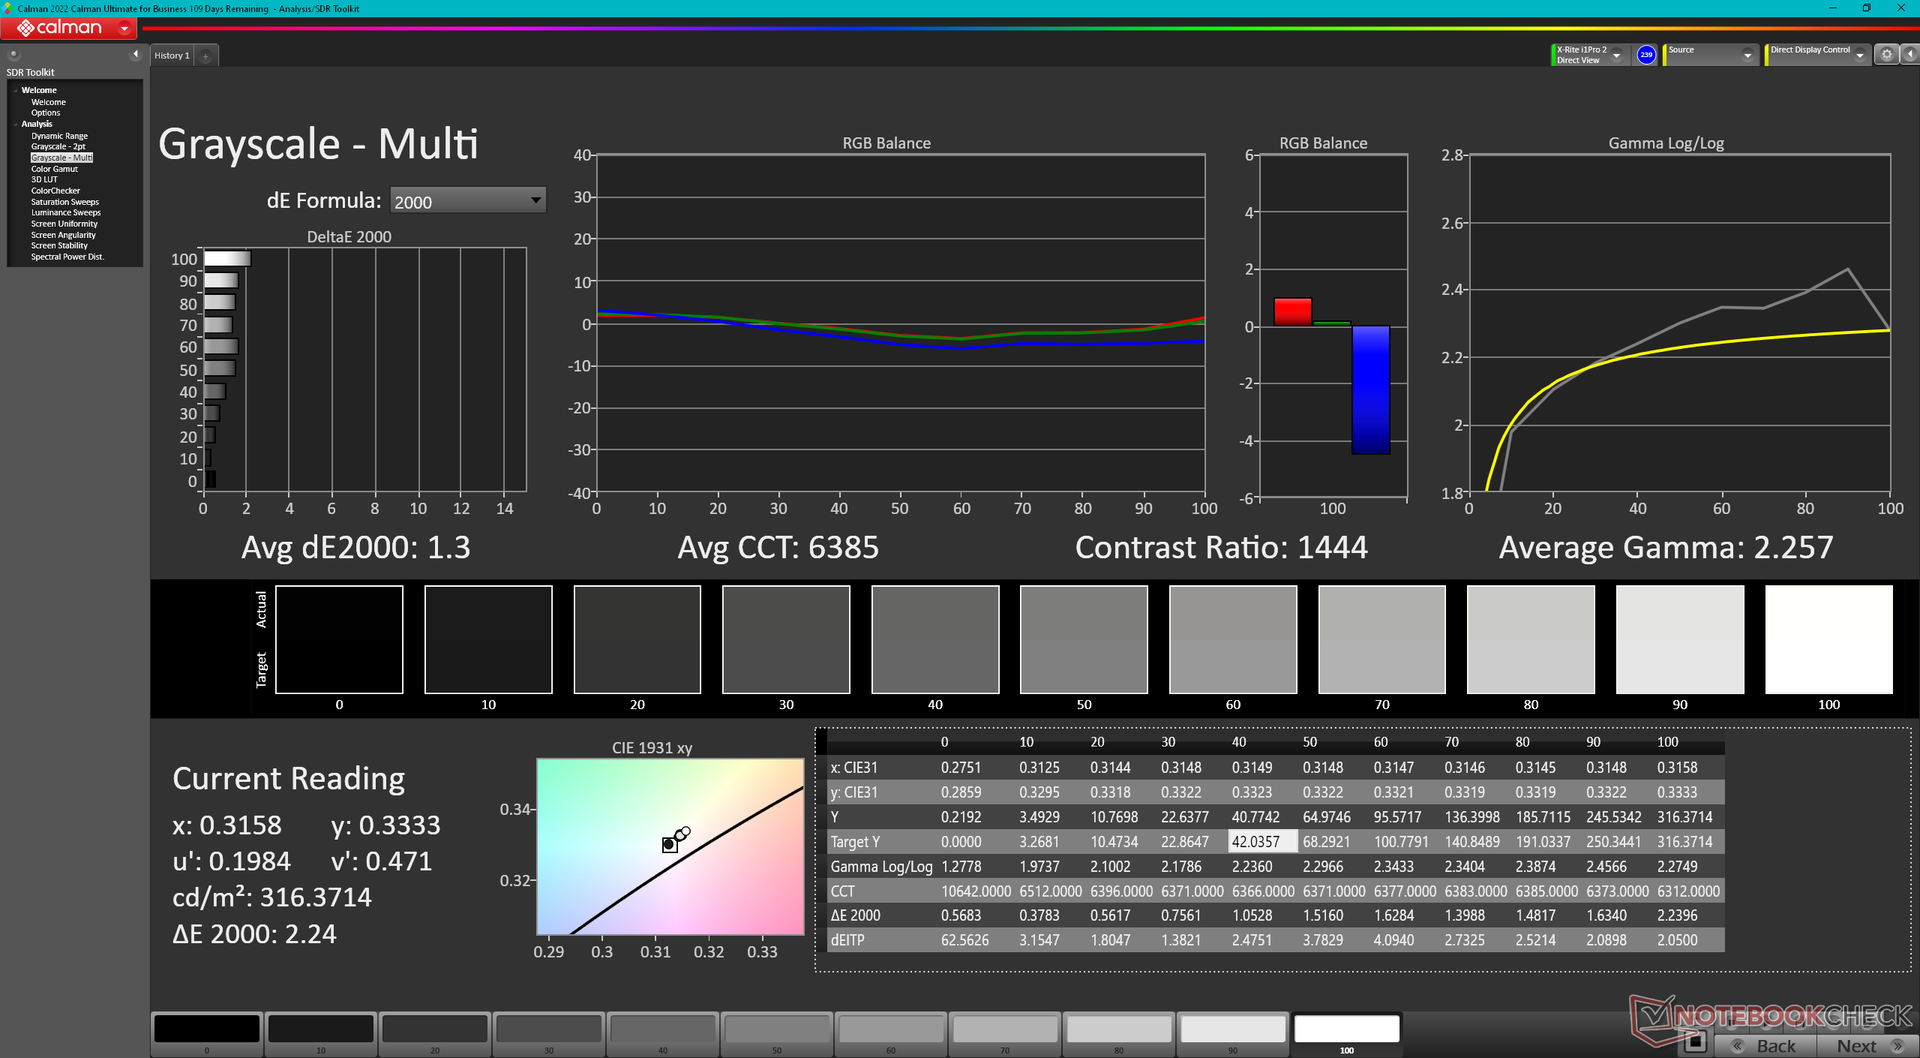
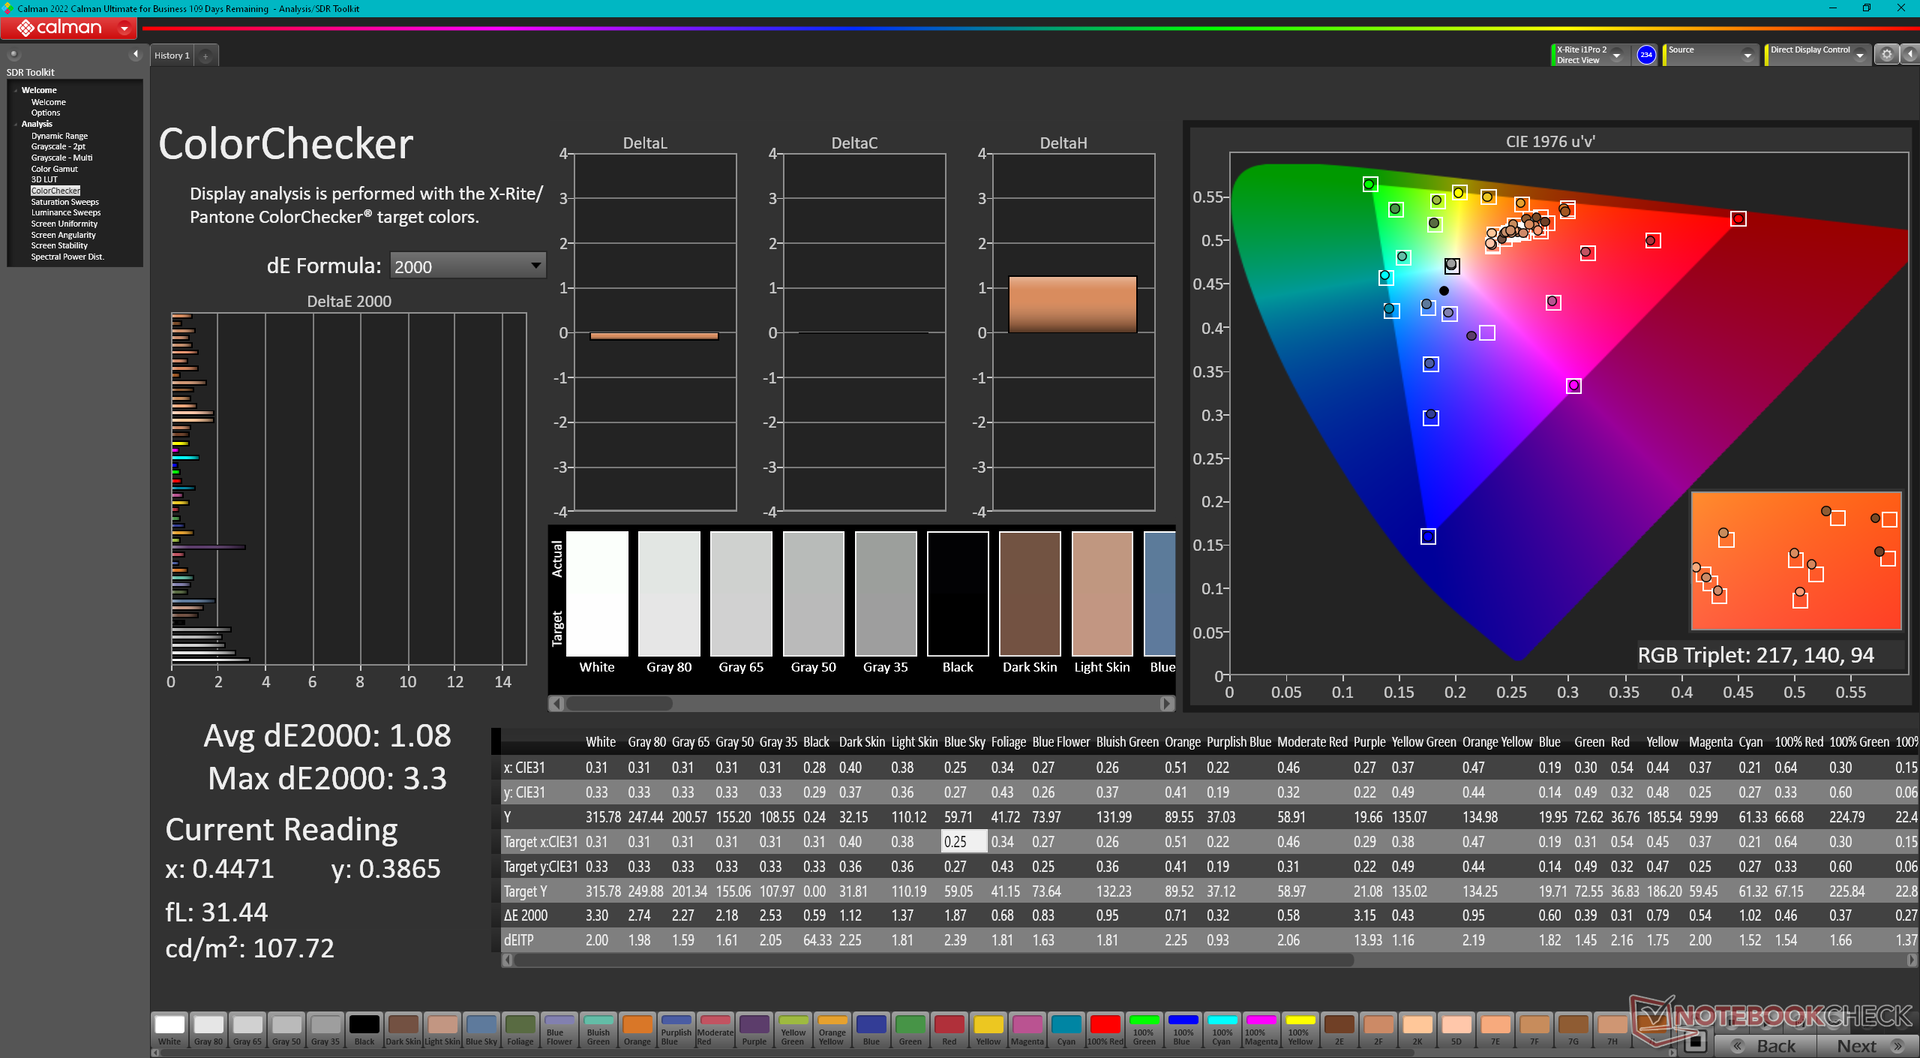
ΔE Color 1.62 | 0.5-29.43 Ø4.87, calibrated: 1.08
ΔE Greyscale 1.3 | 0.5-98 Ø5.1
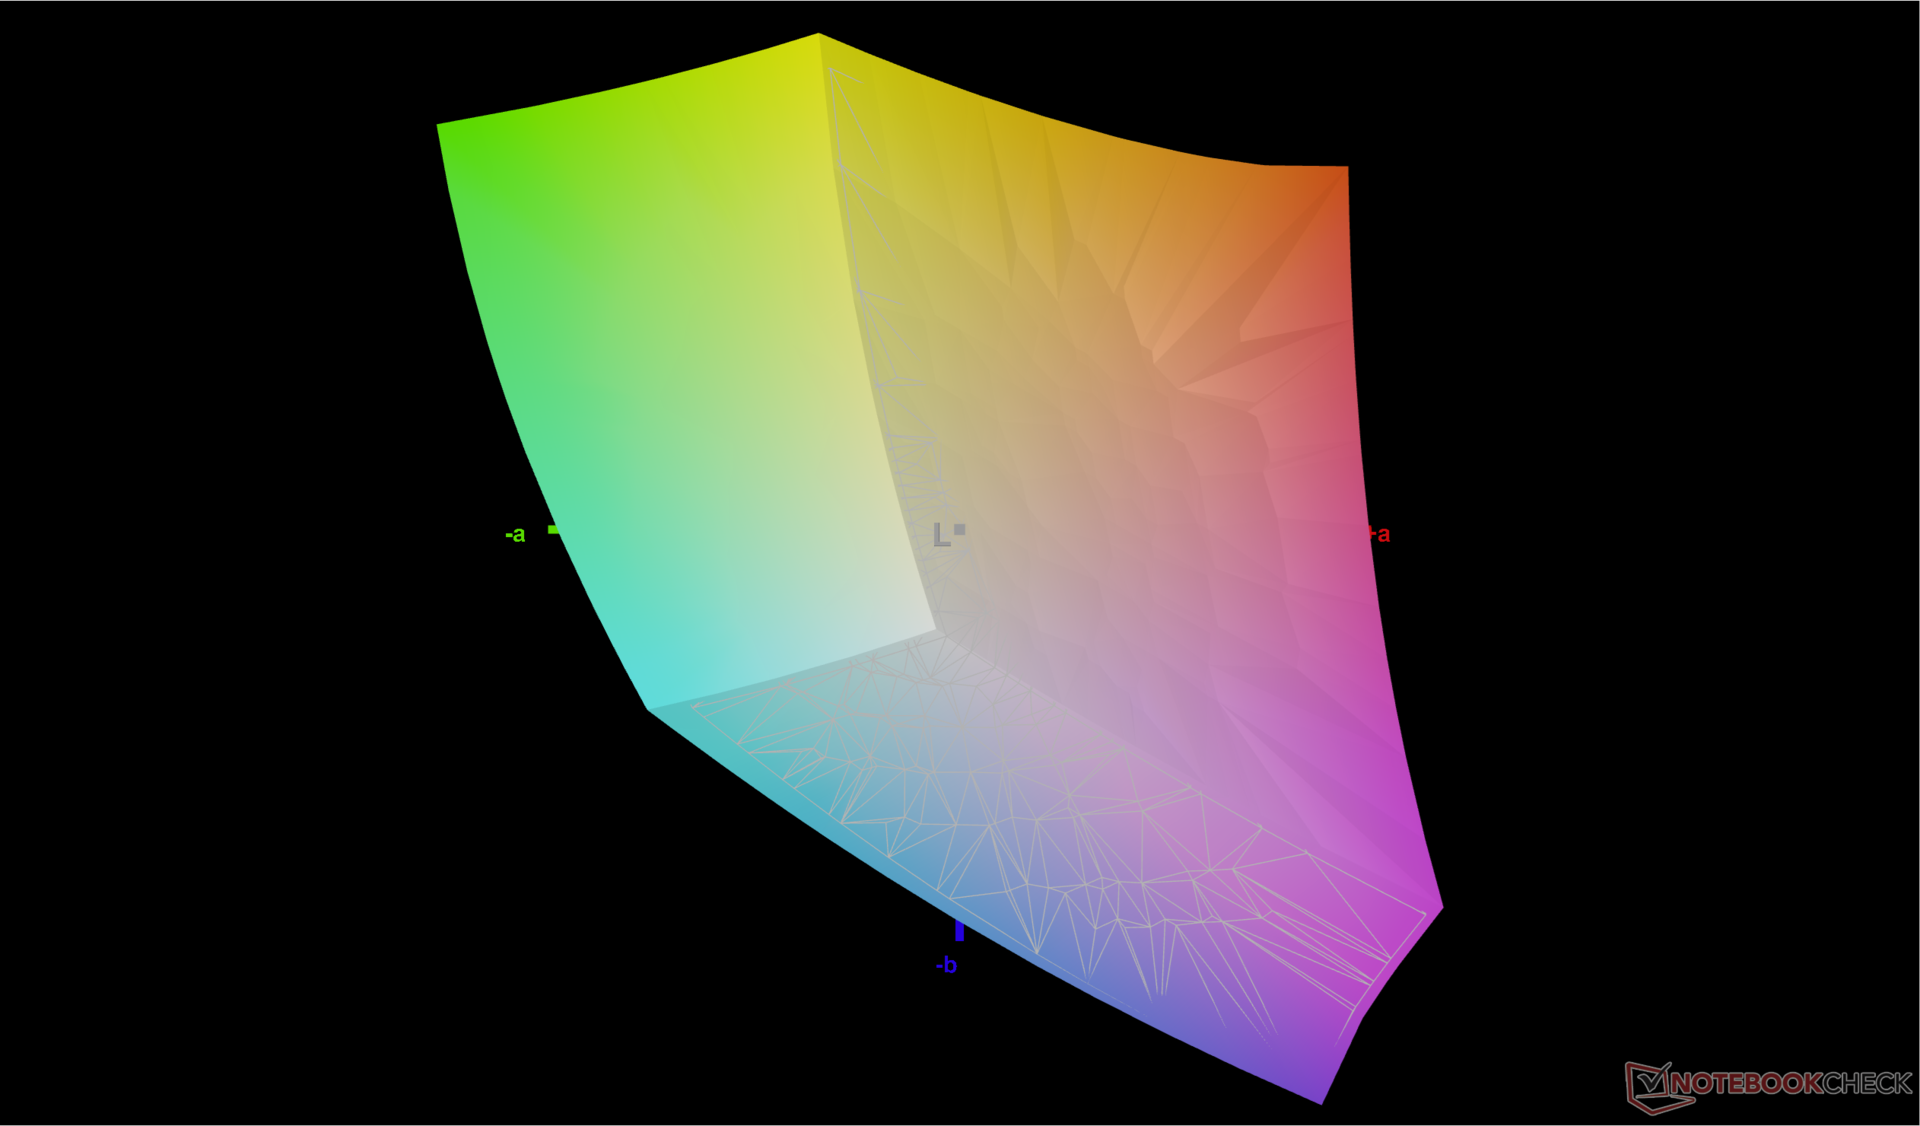
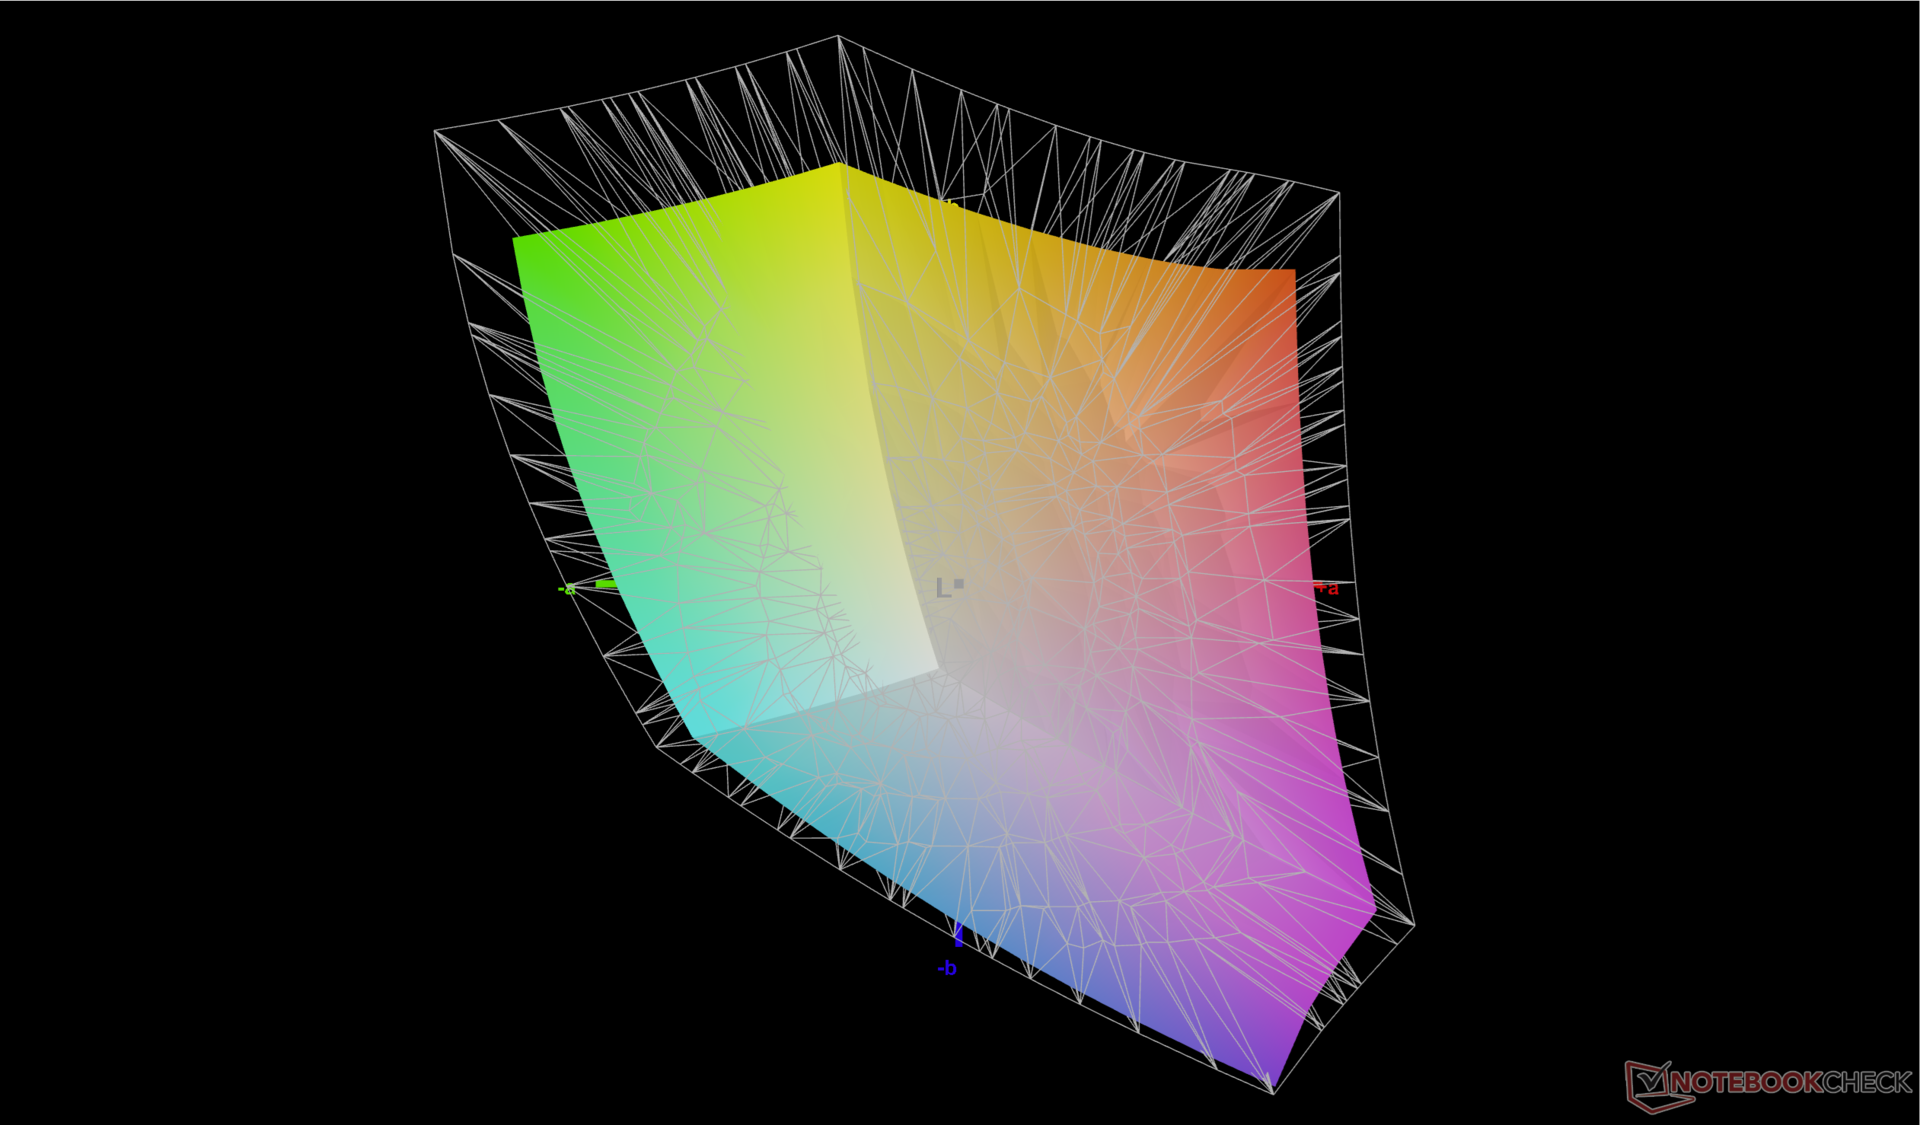
76.7% AdobeRGB 1998 (Argyll 2.2.0 3D)
99.8% sRGB (Argyll 2.2.0 3D)
76% Display P3 (Argyll 2.2.0 3D)
Gamma: 2.26
| Dell Inspiron 16 Plus 7640 AU Optronics B160QAN, IPS, 2560x1600, 16" | Dell Inspiron 16 Plus 7630 LG Philips 160WQ2, IPS, 2560x1600, 16" | Dell Inspiron 16 Plus 7620 BOE NE16N41, IPS, 3072x1920, 16" | Samsung Galaxy Book4 Ultra ATNA60CL07-0, OLED, 2880x1800, 16" | Lenovo Legion 5 16IRX G9 NE160QDM-NZ3, IPS, 2560x1600, 16" | Asus VivoBook Pro 16 K6602VU Samsung ATNA60BX01-1, OLED, 3200x2000, 16" | |
|---|---|---|---|---|---|---|
| Display | -5% | -4% | 15% | -3% | 19% | |
| Display P3 Coverage | 76 | 70.1 -8% | 70.8 -7% | 98.6 30% | 72.4 -5% | 98.7 30% |
| sRGB Coverage | 99.8 | 99.6 0% | 99.5 0% | 99.9 0% | 100 0% | 99.7 0% |
| AdobeRGB 1998 Coverage | 76.7 | 72.3 -6% | 73.2 -5% | 88.5 15% | 74.1 -3% | 96.5 26% |
| Response Times | -38% | -54% | 97% | 51% | 61% | |
| Response Time Grey 50% / Grey 80% * | 25.6 ? | 35 ? -37% | 38 ? -48% | 0.54 ? 98% | 12.5 ? 51% | 0.68 ? 97% |
| Response Time Black / White * | 17.6 ? | 24.2 ? -38% | 28 ? -59% | 0.69 ? 96% | 8.7 ? 51% | 13.2 ? 25% |
| PWM Frequency | 240 ? | 240 ? | ||||
| Screen | -57% | -2% | 5% | 25% | -68% | |
| Brightness middle | 314.7 | 299.4 -5% | 288.9 -8% | 390 24% | 526 67% | 353 12% |
| Brightness | 291 | 290 0% | 276 -5% | 393 35% | 500 72% | 354 22% |
| Brightness Distribution | 89 | 92 3% | 92 3% | 98 10% | 87 -2% | 98 10% |
| Black Level * | 0.28 | 0.21 25% | 0.26 7% | 0.33 -18% | ||
| Contrast | 1124 | 1426 27% | 1111 -1% | 1594 42% | ||
| Colorchecker dE 2000 * | 1.62 | 4.25 -162% | 1.88 -16% | 1.4 14% | 1.2 26% | 4.23 -161% |
| Colorchecker dE 2000 max. * | 2.94 | 6.71 -128% | 4.37 -49% | 2.7 8% | 2.1 29% | 7.13 -143% |
| Colorchecker dE 2000 calibrated * | 1.08 | 0.52 52% | 0.42 61% | 1 7% | 2.42 -124% | |
| Greyscale dE 2000 * | 1.3 | 5.5 -323% | 1.4 -8% | 2.1 -62% | 1.3 -0% | 2.5 -92% |
| Gamma | 2.26 97% | 2.35 94% | 2.3 96% | 2.27 97% | 2.23 99% | 2.4 92% |
| CCT | 6385 102% | 6368 102% | 6634 98% | 6431 101% | 6391 102% | 6642 98% |
| Total Average (Program / Settings) | -33% /
-43% | -20% /
-10% | 39% /
24% | 24% /
23% | 4% /
-25% |
* ... smaller is better
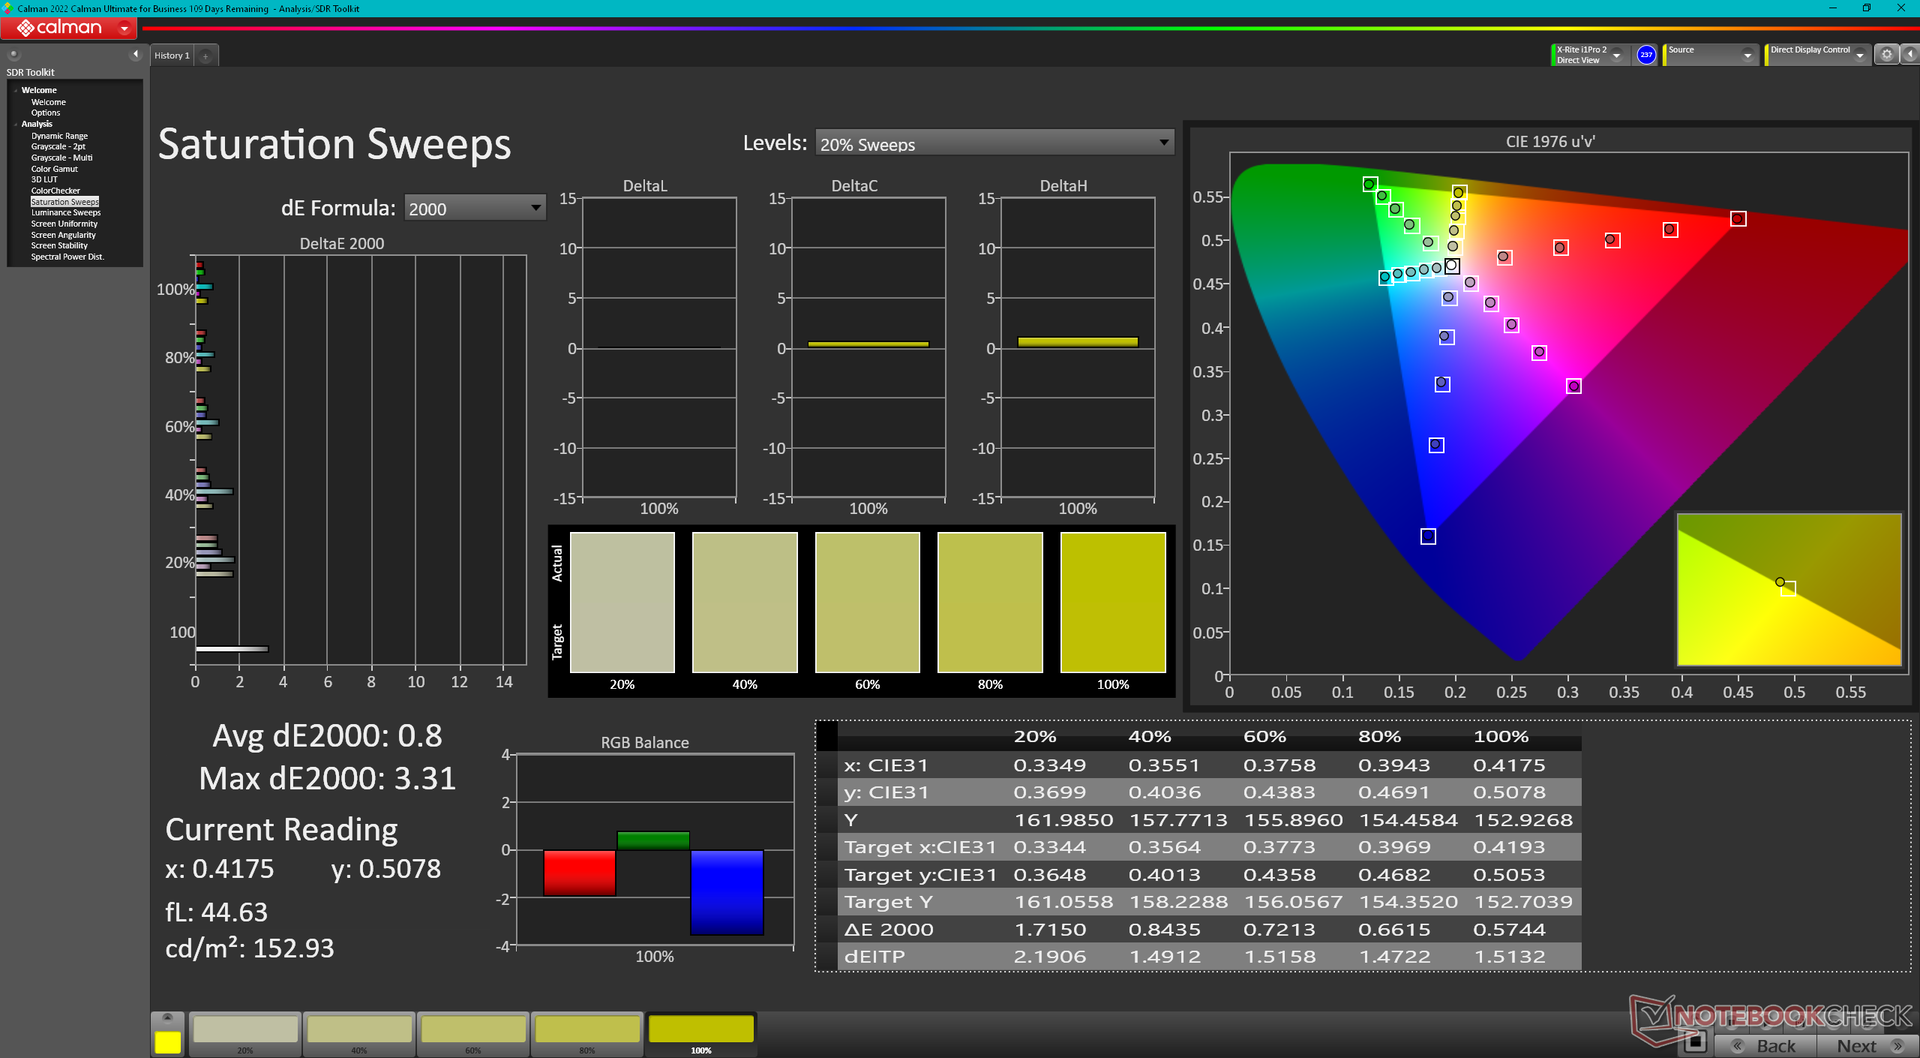
鉴于 Inspiron 系列通常比高端的 XPS 系列更经济实惠,对色彩精确度的要求也更低,因此显示器开箱即经过良好校准,这一点令人惊讶。正如下面的截图所示,尝试自行校准面板只会使平均 deltaE 值略有改善。因此,对于大多数用户来说,没有必要进行最终用户校准。
Display Response Times
| ↔ Response Time Black to White | ||
|---|---|---|
| 17.6 ms ... rise ↗ and fall ↘ combined | ↗ 8.5 ms rise | 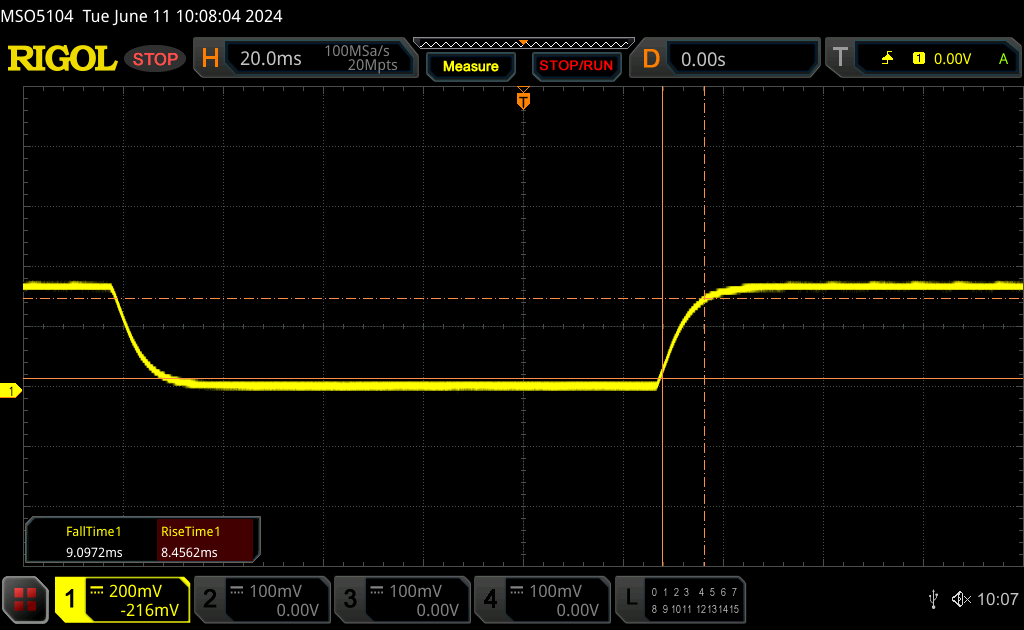 |
| ↘ 9.1 ms fall | ||
| The screen shows good response rates in our tests, but may be too slow for competitive gamers. In comparison, all tested devices range from 0.1 (minimum) to 240 (maximum) ms. » 36 % of all devices are better. This means that the measured response time is better than the average of all tested devices (20.8 ms). | ||
| ↔ Response Time 50% Grey to 80% Grey | ||
| 25.6 ms ... rise ↗ and fall ↘ combined | ↗ 12.3 ms rise | 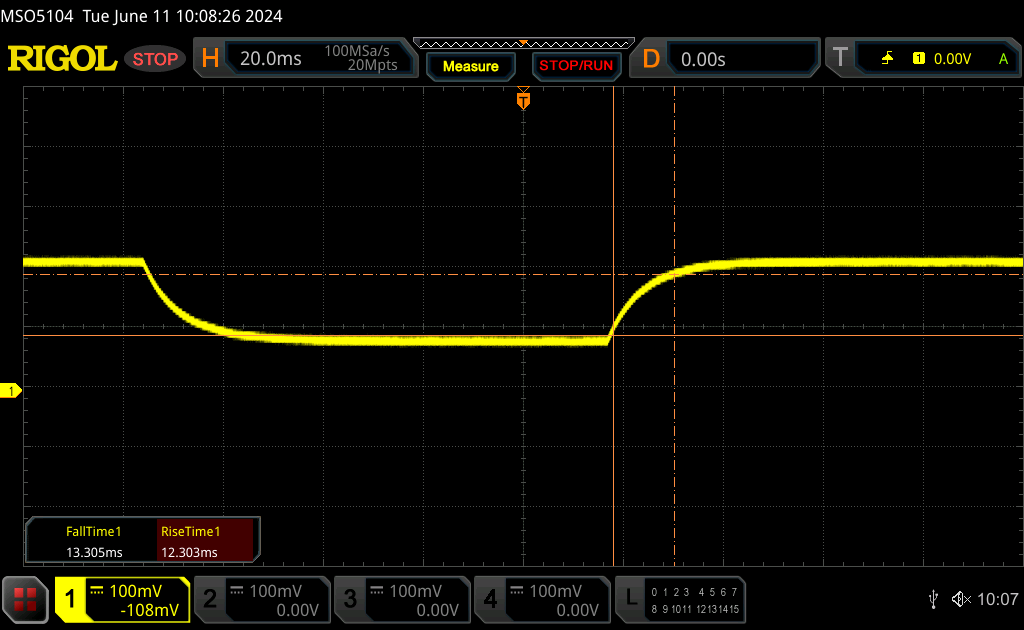 |
| ↘ 13.3 ms fall | ||
| The screen shows relatively slow response rates in our tests and may be too slow for gamers. In comparison, all tested devices range from 0.165 (minimum) to 636 (maximum) ms. » 33 % of all devices are better. This means that the measured response time is better than the average of all tested devices (32.5 ms). | ||
Screen Flickering / PWM (Pulse-Width Modulation)
| Screen flickering / PWM not detected | 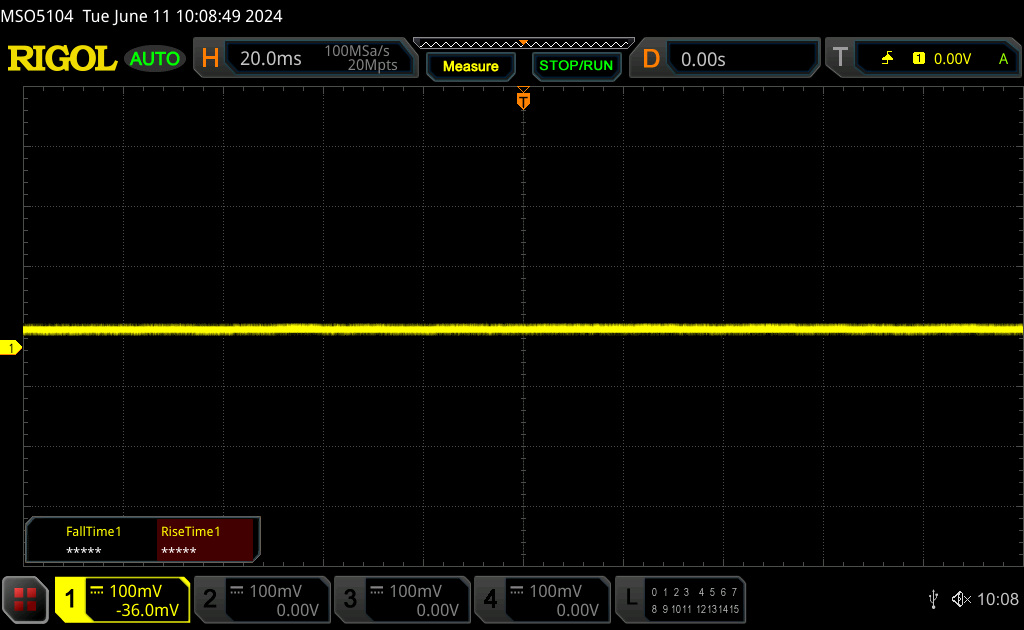 | ||
In comparison: 53 % of all tested devices do not use PWM to dim the display. If PWM was detected, an average of 8516 (minimum: 5 - maximum: 343500) Hz was measured. | |||

性能 - 人工智能就绪
测试条件
在运行以下基准测试之前,我们将 Windows 设置为性能模式。
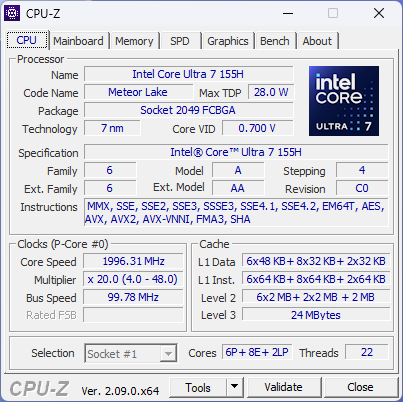
处理器
我们的 酷睿至尊 7 155H的性能非常出色,多线程性能比采用相同处理器的其他笔记本电脑快 15% 到 20%。与 酷睿 i7-13700H相比,较新的处理器仅快 10%左右,在绝大多数任务中都难以察觉。事实上,在处理单线程工作负载时,较旧的 CPU 似乎略胜一筹。
当然,酷睿至尊 7 155H 的亮点在于其集成的 NPU,一旦人工智能加速任务变得更容易获得,NPU 就会派上用场。不过,在撰写本文时,它的作用还非常有限。
Cinebench R15 Multi Loop
Cinebench R23: Multi Core | Single Core
Cinebench R20: CPU (Multi Core) | CPU (Single Core)
Cinebench R15: CPU Multi 64Bit | CPU Single 64Bit
Blender: v2.79 BMW27 CPU
7-Zip 18.03: 7z b 4 | 7z b 4 -mmt1
Geekbench 6.4: Multi-Core | Single-Core
Geekbench 5.5: Multi-Core | Single-Core
HWBOT x265 Benchmark v2.2: 4k Preset
LibreOffice : 20 Documents To PDF
R Benchmark 2.5: Overall mean
* ... smaller is better
AIDA64: FP32 Ray-Trace | FPU Julia | CPU SHA3 | CPU Queen | FPU SinJulia | FPU Mandel | CPU AES | CPU ZLib | FP64 Ray-Trace | CPU PhotoWorxx
| Performance Rating | |
| Lenovo Legion 5 16IRX G9 | |
| Asus VivoBook Pro 16 K6602VU | |
| Samsung Galaxy Book4 Ultra | |
| Dell Inspiron 16 Plus 7640 | |
| Average Intel Core Ultra 7 155H | |
| Dell Inspiron 16 Plus 7630 | |
| Dell Inspiron 16 Plus 7620 | |
| AIDA64 / FP32 Ray-Trace | |
| Lenovo Legion 5 16IRX G9 | |
| Dell Inspiron 16 Plus 7640 | |
| Dell Inspiron 16 Plus 7630 | |
| Asus VivoBook Pro 16 K6602VU | |
| Samsung Galaxy Book4 Ultra | |
| Average Intel Core Ultra 7 155H (6670 - 18470, n=50) | |
| Dell Inspiron 16 Plus 7620 | |
| AIDA64 / FPU Julia | |
| Lenovo Legion 5 16IRX G9 | |
| Asus VivoBook Pro 16 K6602VU | |
| Samsung Galaxy Book4 Ultra | |
| Dell Inspiron 16 Plus 7640 | |
| Average Intel Core Ultra 7 155H (40905 - 93181, n=50) | |
| Dell Inspiron 16 Plus 7630 | |
| Dell Inspiron 16 Plus 7620 | |
| AIDA64 / CPU SHA3 | |
| Lenovo Legion 5 16IRX G9 | |
| Dell Inspiron 16 Plus 7640 | |
| Asus VivoBook Pro 16 K6602VU | |
| Samsung Galaxy Book4 Ultra | |
| Average Intel Core Ultra 7 155H (1940 - 4436, n=50) | |
| Dell Inspiron 16 Plus 7630 | |
| Dell Inspiron 16 Plus 7620 | |
| AIDA64 / CPU Queen | |
| Dell Inspiron 16 Plus 7630 | |
| Lenovo Legion 5 16IRX G9 | |
| Asus VivoBook Pro 16 K6602VU | |
| Dell Inspiron 16 Plus 7620 | |
| Dell Inspiron 16 Plus 7640 | |
| Samsung Galaxy Book4 Ultra | |
| Average Intel Core Ultra 7 155H (64698 - 94181, n=50) | |
| AIDA64 / FPU SinJulia | |
| Lenovo Legion 5 16IRX G9 | |
| Dell Inspiron 16 Plus 7640 | |
| Samsung Galaxy Book4 Ultra | |
| Average Intel Core Ultra 7 155H (5639 - 10647, n=50) | |
| Dell Inspiron 16 Plus 7630 | |
| Asus VivoBook Pro 16 K6602VU | |
| Dell Inspiron 16 Plus 7620 | |
| AIDA64 / FPU Mandel | |
| Lenovo Legion 5 16IRX G9 | |
| Dell Inspiron 16 Plus 7640 | |
| Samsung Galaxy Book4 Ultra | |
| Average Intel Core Ultra 7 155H (18236 - 47685, n=50) | |
| Asus VivoBook Pro 16 K6602VU | |
| Dell Inspiron 16 Plus 7630 | |
| Dell Inspiron 16 Plus 7620 | |
| AIDA64 / CPU AES | |
| Asus VivoBook Pro 16 K6602VU | |
| Lenovo Legion 5 16IRX G9 | |
| Average Intel Core Ultra 7 155H (45713 - 152179, n=50) | |
| Samsung Galaxy Book4 Ultra | |
| Dell Inspiron 16 Plus 7640 | |
| Dell Inspiron 16 Plus 7620 | |
| Dell Inspiron 16 Plus 7630 | |
| AIDA64 / CPU ZLib | |
| Lenovo Legion 5 16IRX G9 | |
| Dell Inspiron 16 Plus 7640 | |
| Dell Inspiron 16 Plus 7620 | |
| Samsung Galaxy Book4 Ultra | |
| Asus VivoBook Pro 16 K6602VU | |
| Average Intel Core Ultra 7 155H (557 - 1250, n=50) | |
| Dell Inspiron 16 Plus 7630 | |
| AIDA64 / FP64 Ray-Trace | |
| Lenovo Legion 5 16IRX G9 | |
| Asus VivoBook Pro 16 K6602VU | |
| Dell Inspiron 16 Plus 7640 | |
| Dell Inspiron 16 Plus 7630 | |
| Samsung Galaxy Book4 Ultra | |
| Average Intel Core Ultra 7 155H (3569 - 9802, n=50) | |
| Dell Inspiron 16 Plus 7620 | |
| AIDA64 / CPU PhotoWorxx | |
| Samsung Galaxy Book4 Ultra | |
| Average Intel Core Ultra 7 155H (32719 - 54223, n=50) | |
| Dell Inspiron 16 Plus 7640 | |
| Asus VivoBook Pro 16 K6602VU | |
| Dell Inspiron 16 Plus 7630 | |
| Dell Inspiron 16 Plus 7620 | |
| Lenovo Legion 5 16IRX G9 | |
压力测试
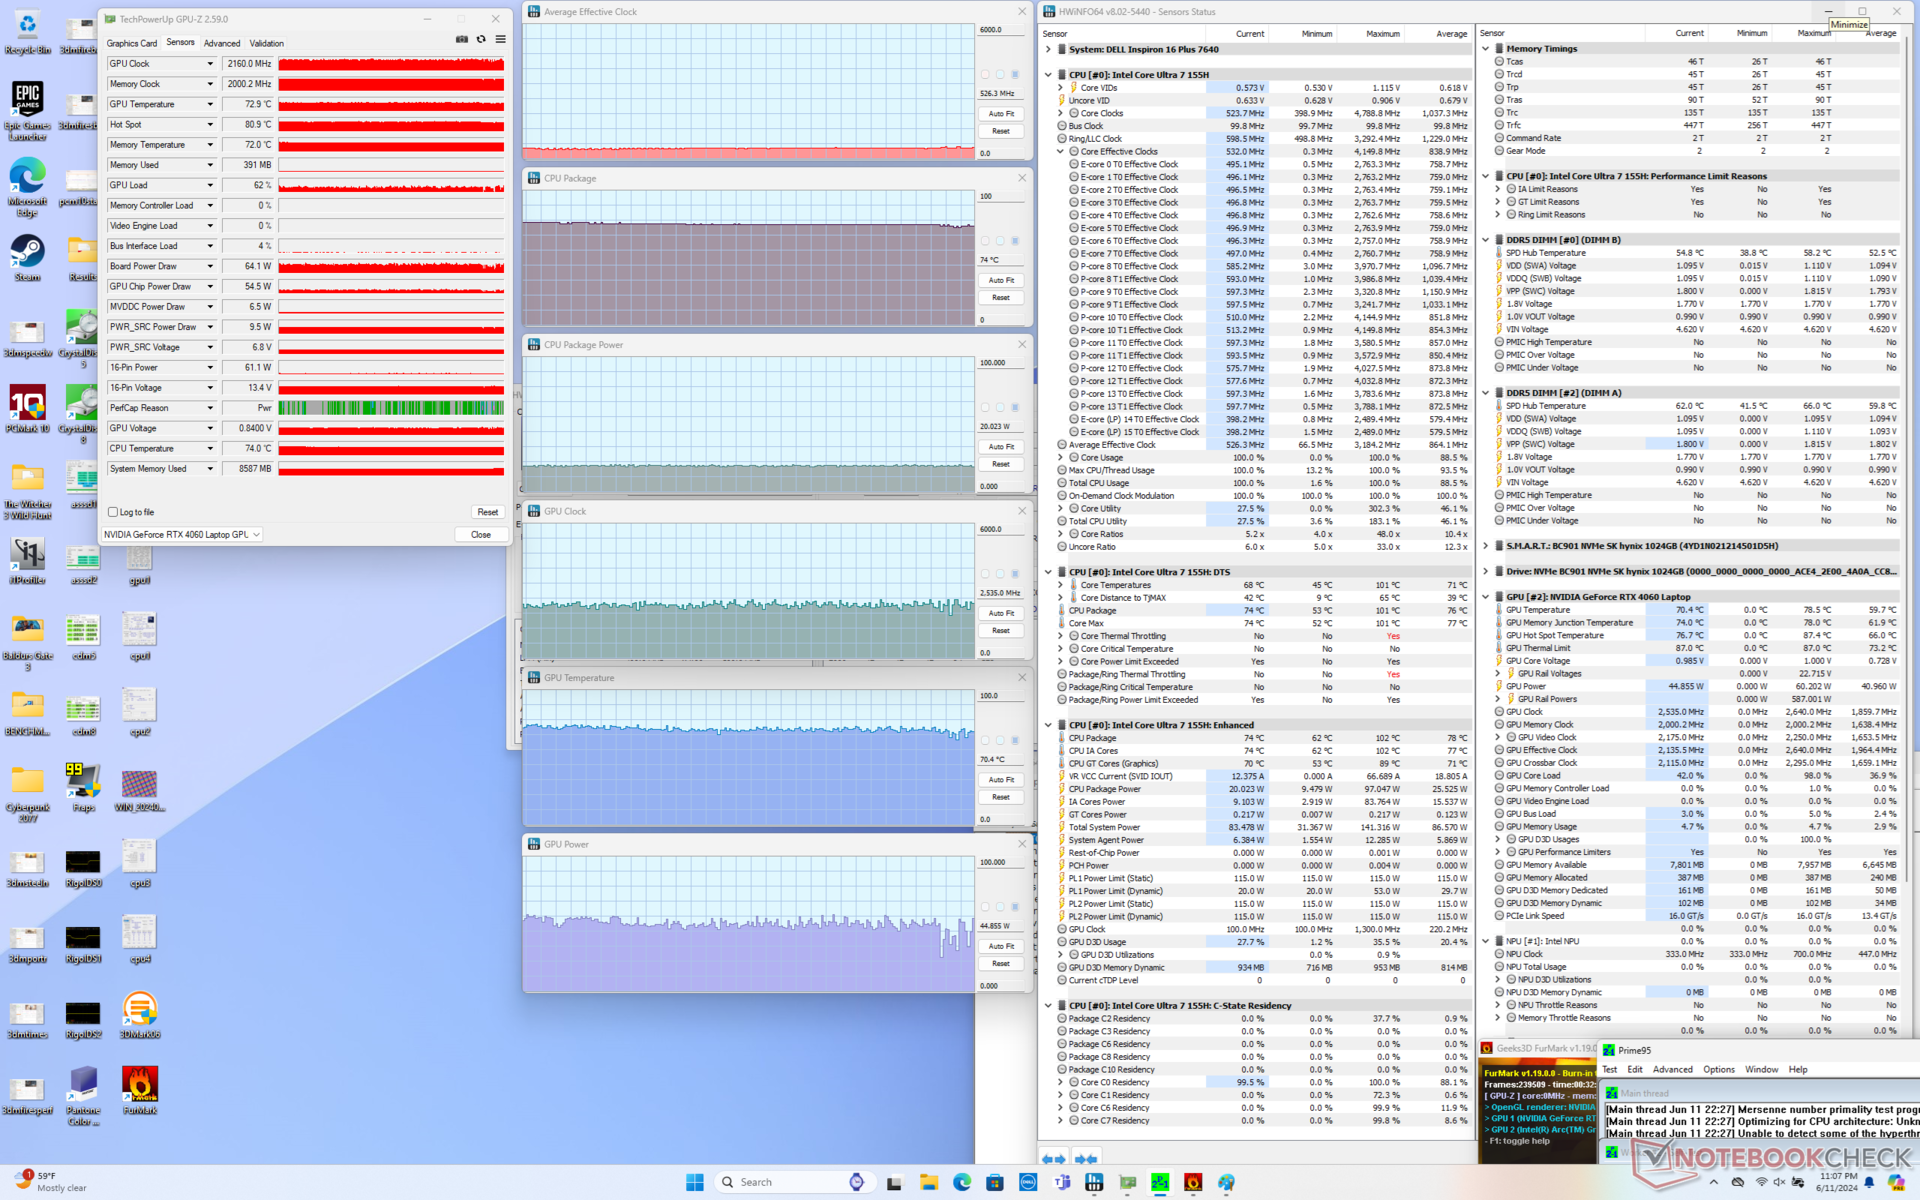
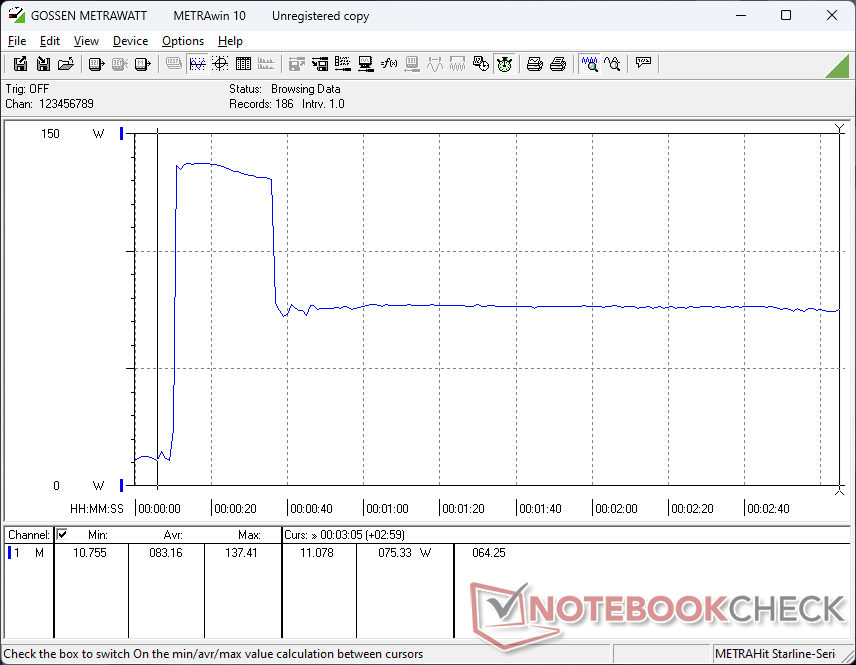
在启动 Prime95 压力测试时,CPU 会提升至平均 3.2 GHz、97 W 和 101 C,持续约 25 秒。因此,该系统的 Turbo Boost 性能持续时间很短,与我们在前代机型上观察到的情况类似。
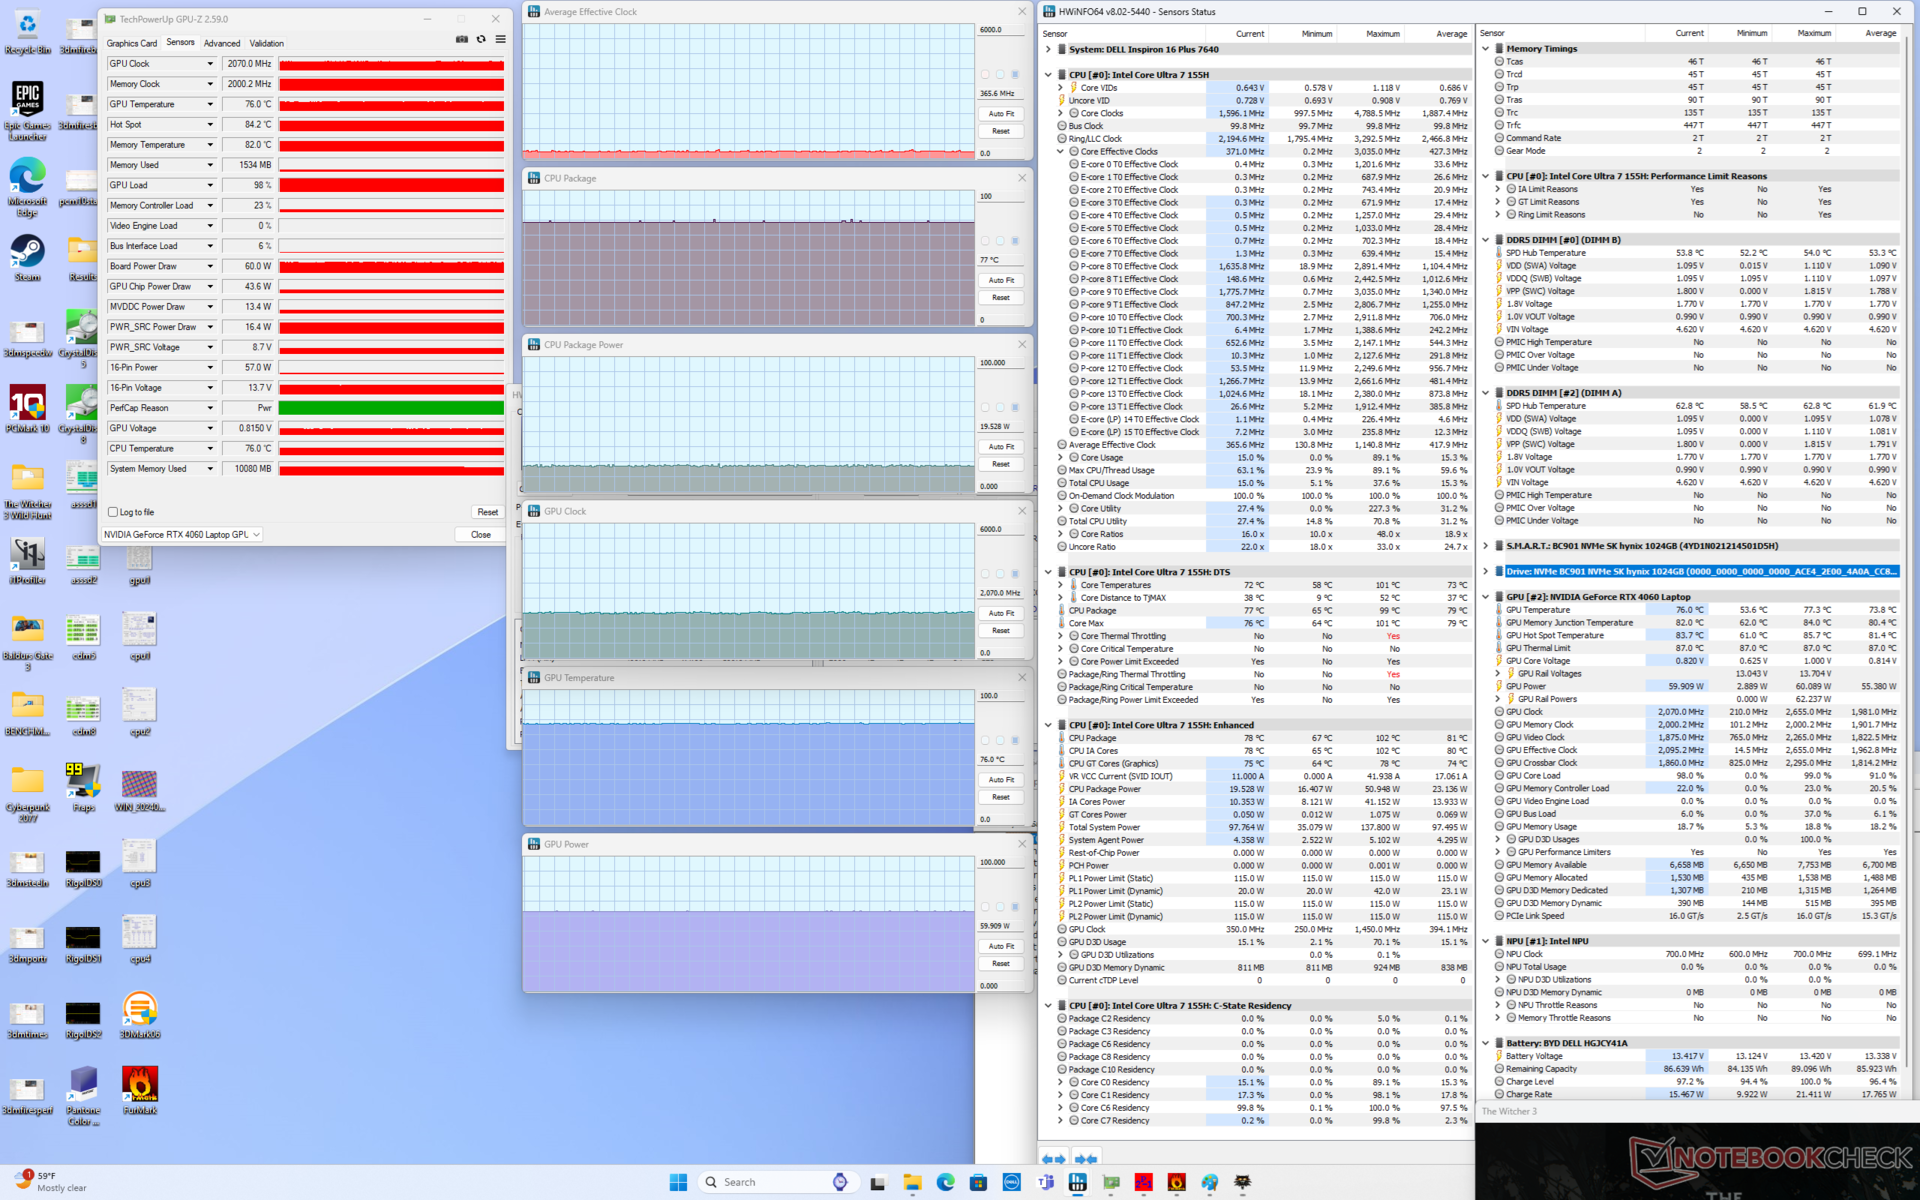
运行时,Nvidia GPU 将稳定在 2070 MHz、76 C 和 60 W。 Witcher 3而去年的机型在类似测试条件下的频率为 2250 MHz、温度为 72 C、功耗为 69 W。这些结果与下文游戏性能部分详述的游戏性能普遍较慢的情况相辅相成。即使设置为高性能模式,戴尔新机型的 GPU 功耗也会达到 60 W 上限,而戴尔旧机型的 GPU 功耗为 70 W。
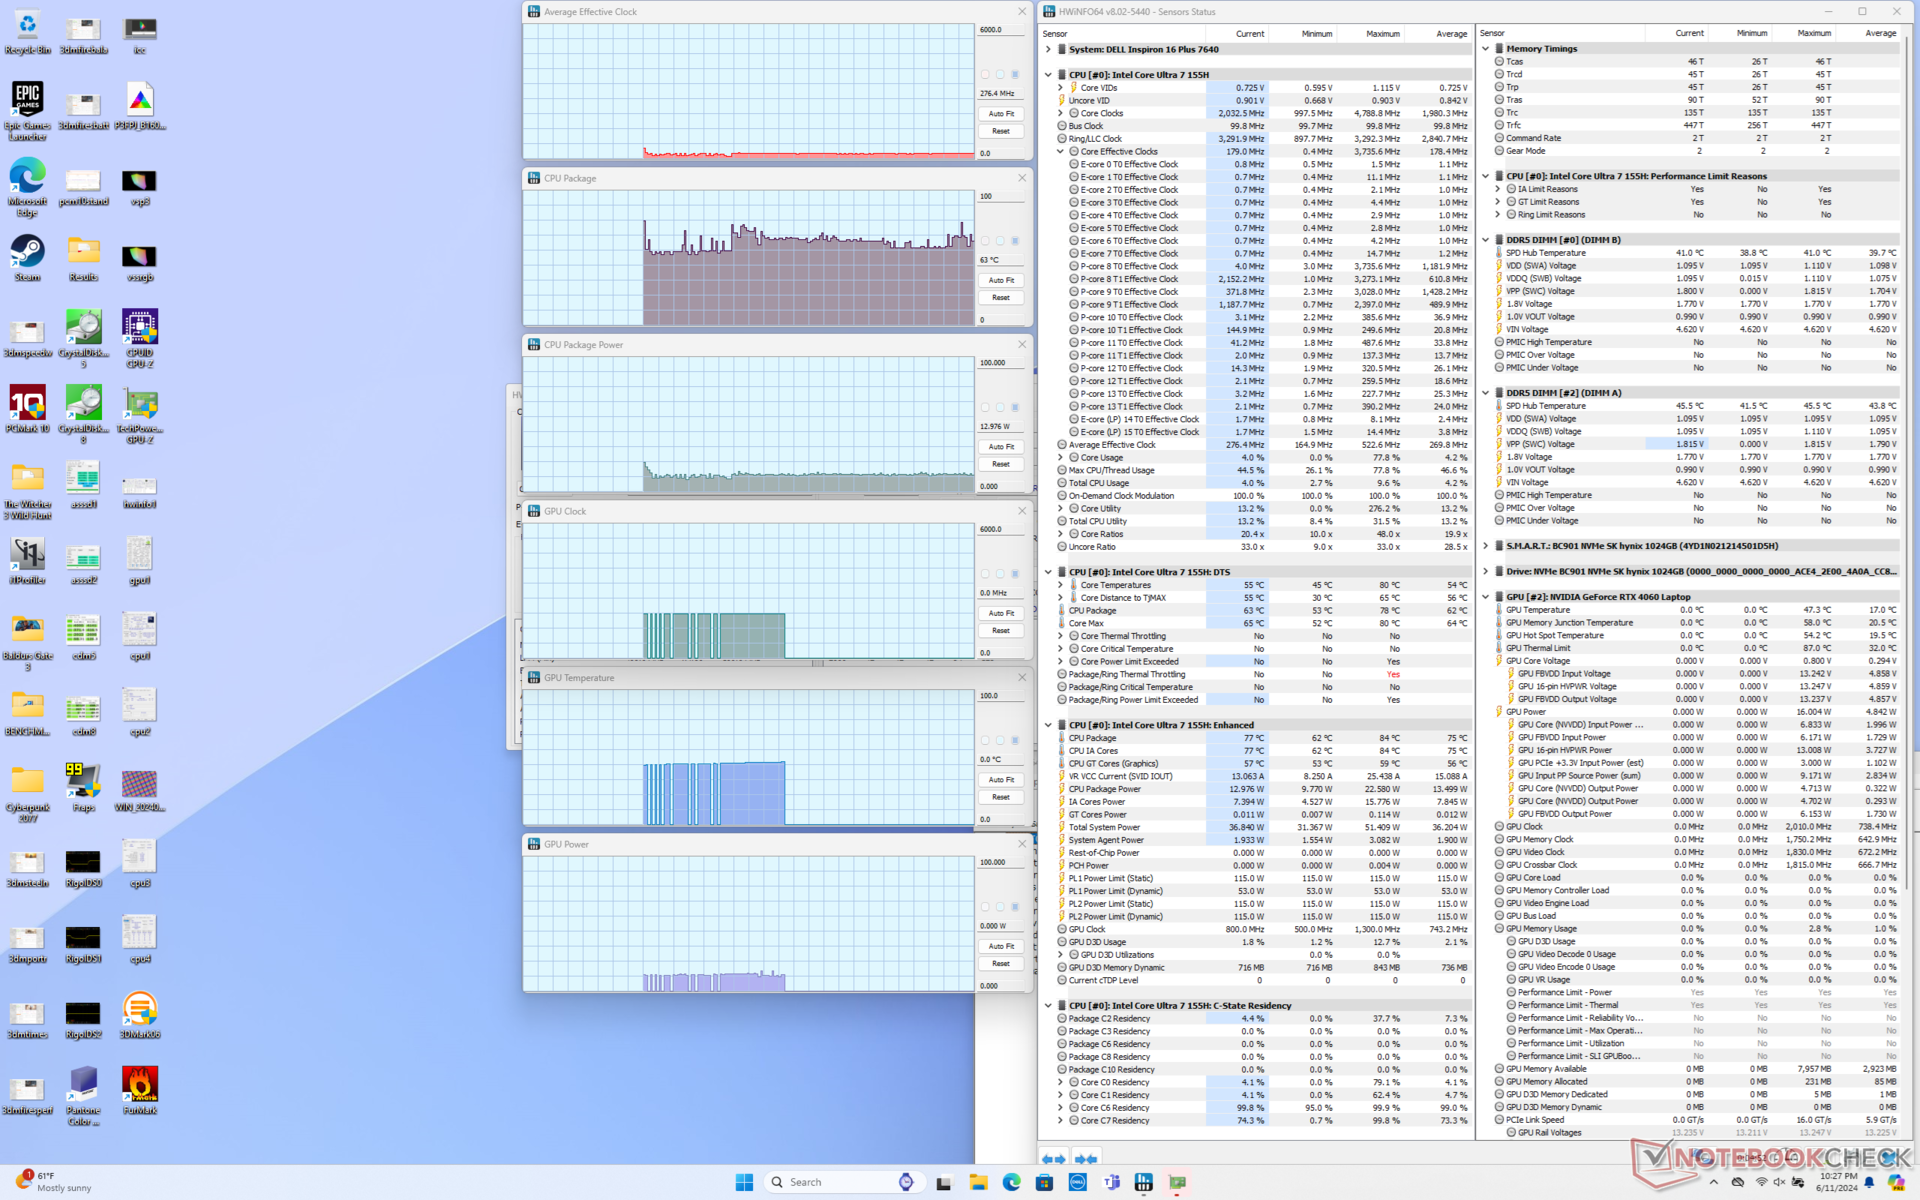

| 平均 CPU 时钟 (GHz) | GPU 时钟 (MHz) | 平均 CPU 温度 (°C) | 平均 GPU 温度(°C) | |
| 系统闲置 | -- | -- | 63 | 45 |
| Prime95 压力 | 2.1 - 2.4 | -- | 83 | 56 |
| Prime95 + FurMark 压力 | 0.5 | 2160 | 74 | 70 |
| Witcher 3 压力 | 0.4 | 2070 | 77 | 77 |
系统性能
尽管 CPU 进行了升级,但 PCMark 的结果与去年的机型相当,这表明在大多数日常操作中,更新的机型并不一定更快。

CrossMark: Overall | Productivity | Creativity | Responsiveness
WebXPRT 3: Overall
WebXPRT 4: Overall
Mozilla Kraken 1.1: Total
| PCMark 10 / Score | |
| Dell Inspiron 16 Plus 7630 | |
| Lenovo Legion 5 16IRX G9 | |
| Asus VivoBook Pro 16 K6602VU | |
| Dell Inspiron 16 Plus 7640 | |
| Average Intel Core Ultra 7 155H, NVIDIA GeForce RTX 4060 Laptop GPU (6751 - 7370, n=5) | |
| Samsung Galaxy Book4 Ultra | |
| Dell Inspiron 16 Plus 7620 | |
| PCMark 10 / Essentials | |
| Dell Inspiron 16 Plus 7630 | |
| Lenovo Legion 5 16IRX G9 | |
| Samsung Galaxy Book4 Ultra | |
| Dell Inspiron 16 Plus 7640 | |
| Asus VivoBook Pro 16 K6602VU | |
| Dell Inspiron 16 Plus 7620 | |
| Average Intel Core Ultra 7 155H, NVIDIA GeForce RTX 4060 Laptop GPU (9476 - 10446, n=5) | |
| PCMark 10 / Productivity | |
| Dell Inspiron 16 Plus 7630 | |
| Lenovo Legion 5 16IRX G9 | |
| Samsung Galaxy Book4 Ultra | |
| Dell Inspiron 16 Plus 7620 | |
| Average Intel Core Ultra 7 155H, NVIDIA GeForce RTX 4060 Laptop GPU (8079 - 9477, n=5) | |
| Asus VivoBook Pro 16 K6602VU | |
| Dell Inspiron 16 Plus 7640 | |
| PCMark 10 / Digital Content Creation | |
| Lenovo Legion 5 16IRX G9 | |
| Dell Inspiron 16 Plus 7630 | |
| Dell Inspiron 16 Plus 7640 | |
| Asus VivoBook Pro 16 K6602VU | |
| Average Intel Core Ultra 7 155H, NVIDIA GeForce RTX 4060 Laptop GPU (9811 - 11620, n=5) | |
| Samsung Galaxy Book4 Ultra | |
| Dell Inspiron 16 Plus 7620 | |
| CrossMark / Overall | |
| Lenovo Legion 5 16IRX G9 | |
| Dell Inspiron 16 Plus 7630 | |
| Dell Inspiron 16 Plus 7620 | |
| Samsung Galaxy Book4 Ultra | |
| Asus VivoBook Pro 16 K6602VU | |
| Dell Inspiron 16 Plus 7640 | |
| Average Intel Core Ultra 7 155H, NVIDIA GeForce RTX 4060 Laptop GPU (1540 - 1746, n=5) | |
| CrossMark / Productivity | |
| Lenovo Legion 5 16IRX G9 | |
| Dell Inspiron 16 Plus 7630 | |
| Asus VivoBook Pro 16 K6602VU | |
| Samsung Galaxy Book4 Ultra | |
| Dell Inspiron 16 Plus 7620 | |
| Average Intel Core Ultra 7 155H, NVIDIA GeForce RTX 4060 Laptop GPU (1436 - 1684, n=5) | |
| Dell Inspiron 16 Plus 7640 | |
| CrossMark / Creativity | |
| Lenovo Legion 5 16IRX G9 | |
| Dell Inspiron 16 Plus 7630 | |
| Samsung Galaxy Book4 Ultra | |
| Dell Inspiron 16 Plus 7640 | |
| Dell Inspiron 16 Plus 7620 | |
| Average Intel Core Ultra 7 155H, NVIDIA GeForce RTX 4060 Laptop GPU (1811 - 1929, n=5) | |
| Asus VivoBook Pro 16 K6602VU | |
| CrossMark / Responsiveness | |
| Lenovo Legion 5 16IRX G9 | |
| Dell Inspiron 16 Plus 7630 | |
| Asus VivoBook Pro 16 K6602VU | |
| Dell Inspiron 16 Plus 7620 | |
| Samsung Galaxy Book4 Ultra | |
| Average Intel Core Ultra 7 155H, NVIDIA GeForce RTX 4060 Laptop GPU (1165 - 1631, n=5) | |
| Dell Inspiron 16 Plus 7640 | |
| WebXPRT 3 / Overall | |
| Dell Inspiron 16 Plus 7630 | |
| Lenovo Legion 5 16IRX G9 | |
| Dell Inspiron 16 Plus 7620 | |
| Dell Inspiron 16 Plus 7640 | |
| Average Intel Core Ultra 7 155H, NVIDIA GeForce RTX 4060 Laptop GPU (274 - 290, n=5) | |
| Samsung Galaxy Book4 Ultra | |
| WebXPRT 4 / Overall | |
| Lenovo Legion 5 16IRX G9 | |
| Dell Inspiron 16 Plus 7630 | |
| Dell Inspiron 16 Plus 7620 | |
| Samsung Galaxy Book4 Ultra | |
| Dell Inspiron 16 Plus 7640 | |
| Average Intel Core Ultra 7 155H, NVIDIA GeForce RTX 4060 Laptop GPU (236 - 262, n=5) | |
| Asus VivoBook Pro 16 K6602VU | |
| Mozilla Kraken 1.1 / Total | |
| Average Intel Core Ultra 7 155H, NVIDIA GeForce RTX 4060 Laptop GPU (519 - 585, n=5) | |
| Asus VivoBook Pro 16 K6602VU | |
| Dell Inspiron 16 Plus 7620 | |
| Dell Inspiron 16 Plus 7640 | |
| Dell Inspiron 16 Plus 7630 | |
| Lenovo Legion 5 16IRX G9 | |
| Samsung Galaxy Book4 Ultra | |
* ... smaller is better
| PCMark 10 Score | 7042 points | |
Help | ||
| AIDA64 / Memory Copy | |
| Samsung Galaxy Book4 Ultra | |
| Average Intel Core Ultra 7 155H (62397 - 96791, n=50) | |
| Dell Inspiron 16 Plus 7640 | |
| Lenovo Legion 5 16IRX G9 | |
| Dell Inspiron 16 Plus 7630 | |
| Asus VivoBook Pro 16 K6602VU | |
| Dell Inspiron 16 Plus 7620 | |
| AIDA64 / Memory Read | |
| Samsung Galaxy Book4 Ultra | |
| Average Intel Core Ultra 7 155H (60544 - 90647, n=50) | |
| Dell Inspiron 16 Plus 7640 | |
| Lenovo Legion 5 16IRX G9 | |
| Dell Inspiron 16 Plus 7630 | |
| Asus VivoBook Pro 16 K6602VU | |
| Dell Inspiron 16 Plus 7620 | |
| AIDA64 / Memory Write | |
| Samsung Galaxy Book4 Ultra | |
| Average Intel Core Ultra 7 155H (58692 - 93451, n=50) | |
| Dell Inspiron 16 Plus 7640 | |
| Asus VivoBook Pro 16 K6602VU | |
| Dell Inspiron 16 Plus 7630 | |
| Dell Inspiron 16 Plus 7620 | |
| Lenovo Legion 5 16IRX G9 | |
| AIDA64 / Memory Latency | |
| Average Intel Core Ultra 7 155H (116.2 - 233, n=50) | |
| Samsung Galaxy Book4 Ultra | |
| Dell Inspiron 16 Plus 7640 | |
| Dell Inspiron 16 Plus 7620 | |
| Dell Inspiron 16 Plus 7630 | |
| Asus VivoBook Pro 16 K6602VU | |
| Lenovo Legion 5 16IRX G9 | |
* ... smaller is better
DPC 延迟
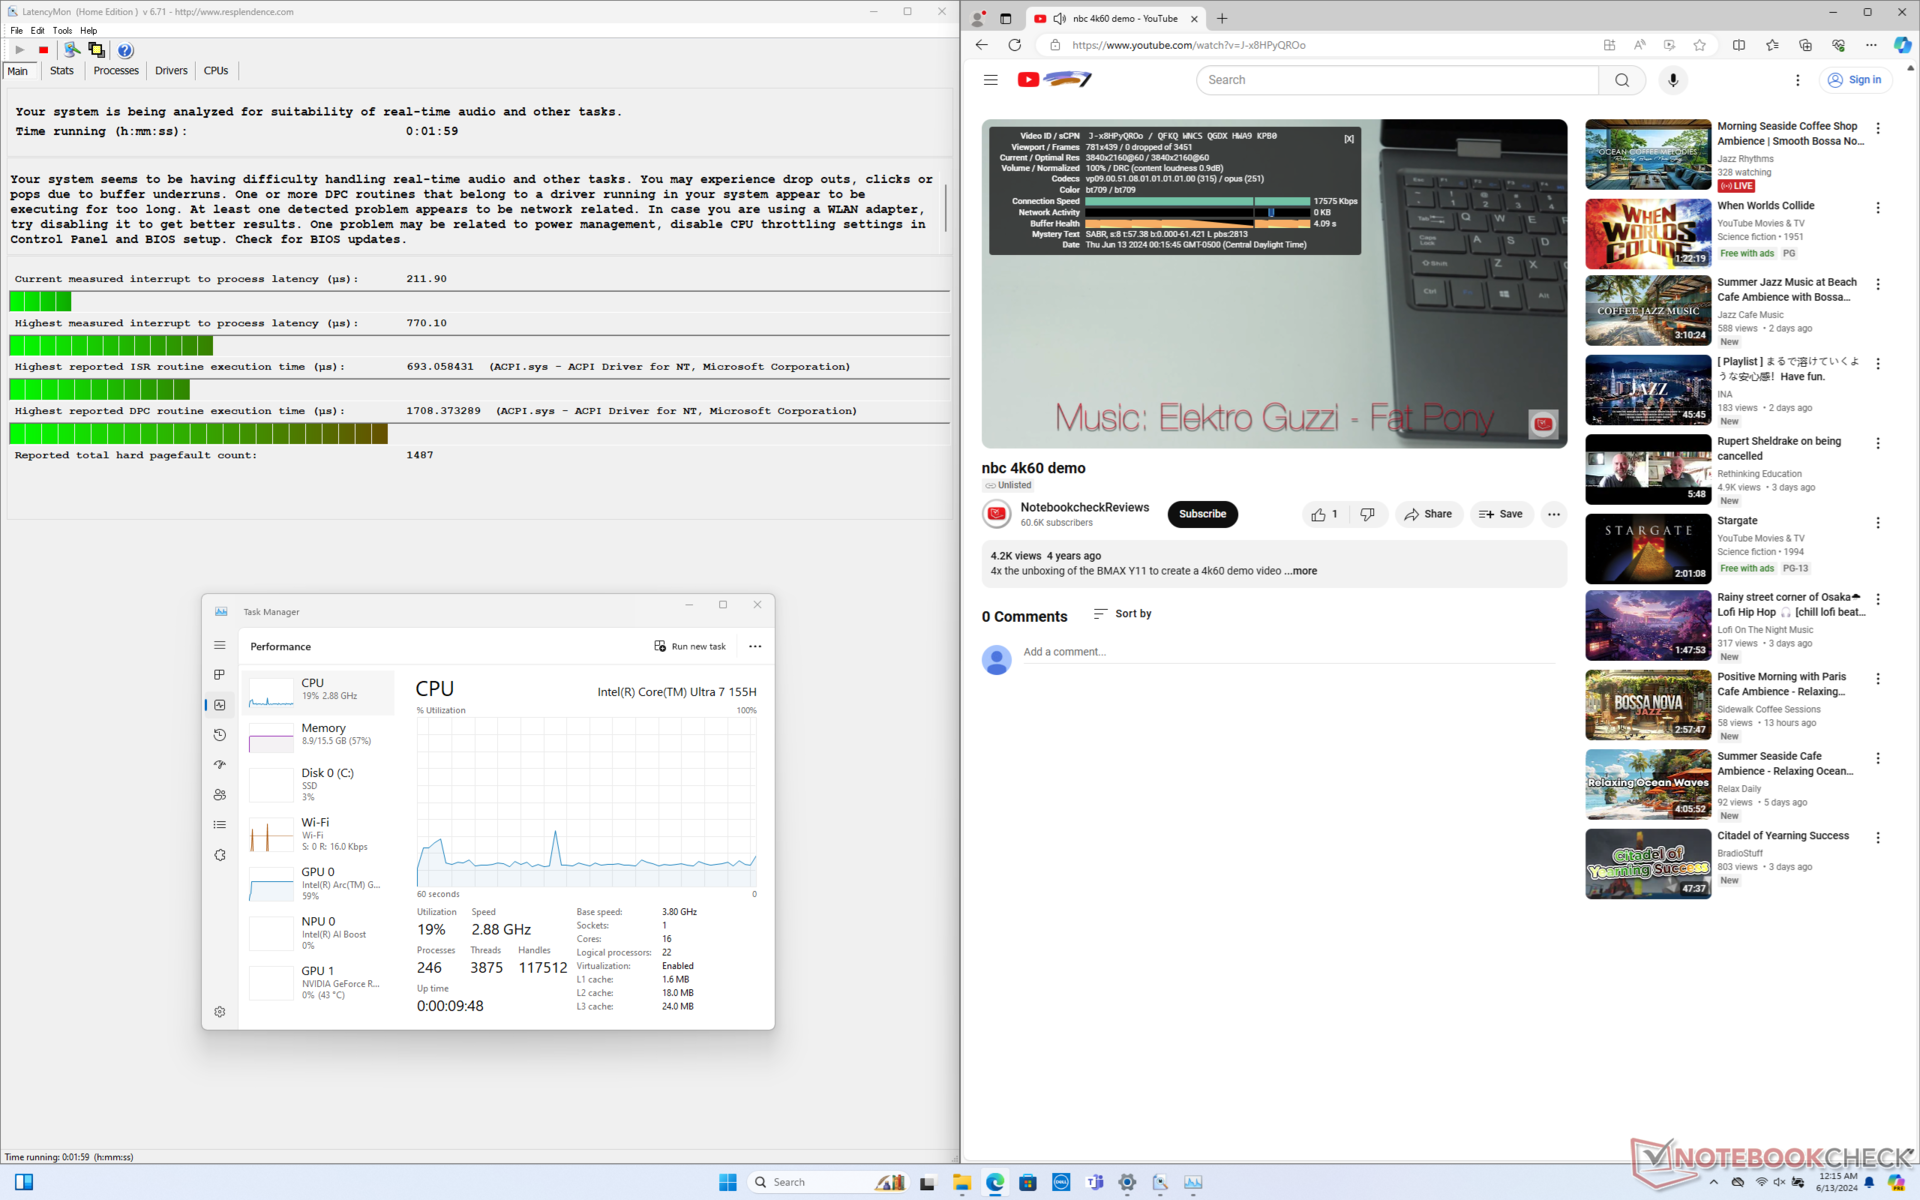
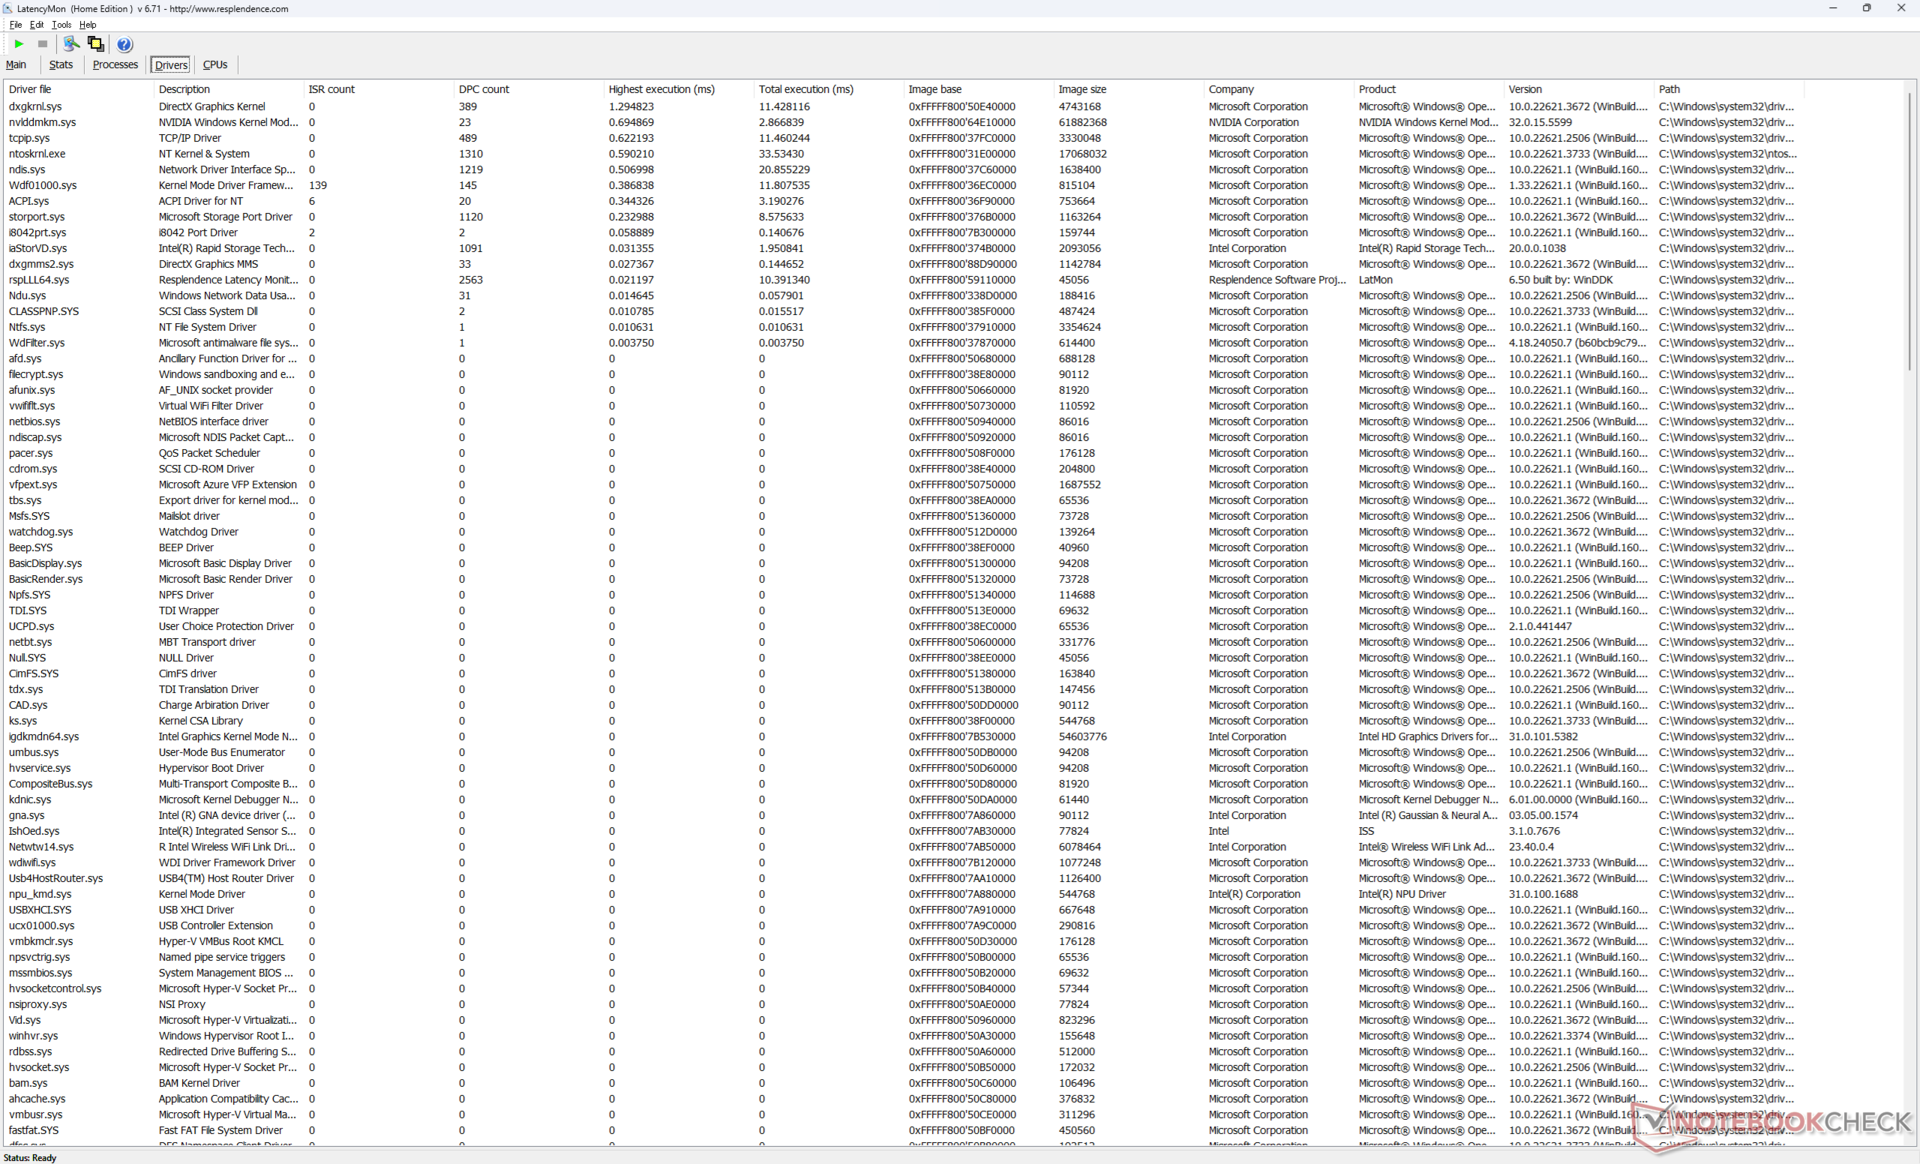
LatencyMon 仅在打开我们主页的多个浏览器标签时显示出轻微的 DPC 问题。在其他方面,以 60 FPS 播放 4K 视频也非常完美,没有掉帧记录。
| DPC Latencies / LatencyMon - interrupt to process latency (max), Web, Youtube, Prime95 | |
| Lenovo Legion 5 16IRX G9 | |
| Asus VivoBook Pro 16 K6602VU | |
| Dell Inspiron 16 Plus 7630 | |
| Dell Inspiron 16 Plus 7620 | |
| Dell Inspiron 16 Plus 7640 | |
| Samsung Galaxy Book4 Ultra | |
* ... smaller is better
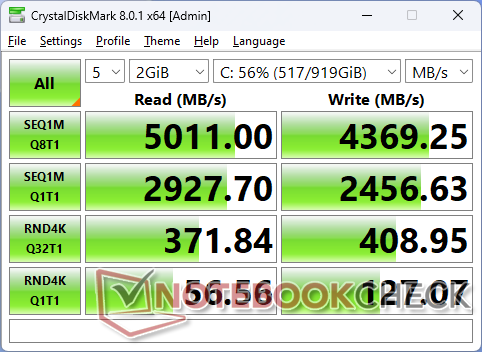
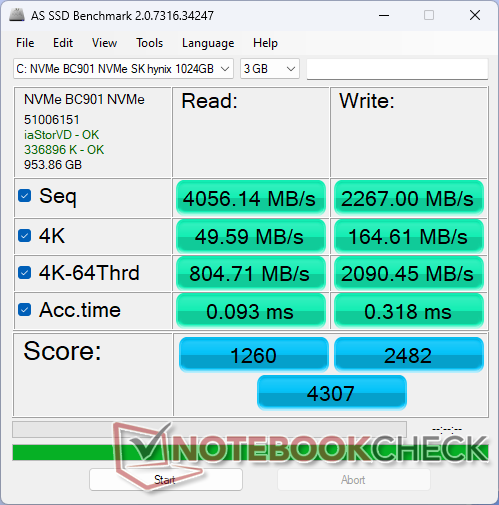
存储设备
我们的测试设备配备了 较慢的 SK Hynix 硬盘而不是去年型号上的西部数据硬盘。从我们的基准测试来看,SK Hynix 硬盘的速度明显较慢,但它没有任何性能节流问题,整体传输速率更加稳定。

| Drive Performance Rating - Percent | |
| Lenovo Legion 5 16IRX G9 | |
| Samsung Galaxy Book4 Ultra | |
| Dell Inspiron 16 Plus 7630 | |
| Asus VivoBook Pro 16 K6602VU | |
| Dell Inspiron 16 Plus 7640 | |
| Dell Inspiron 16 Plus 7620 | |
* ... smaller is better
Disk Throttling: DiskSpd Read Loop, Queue Depth 8
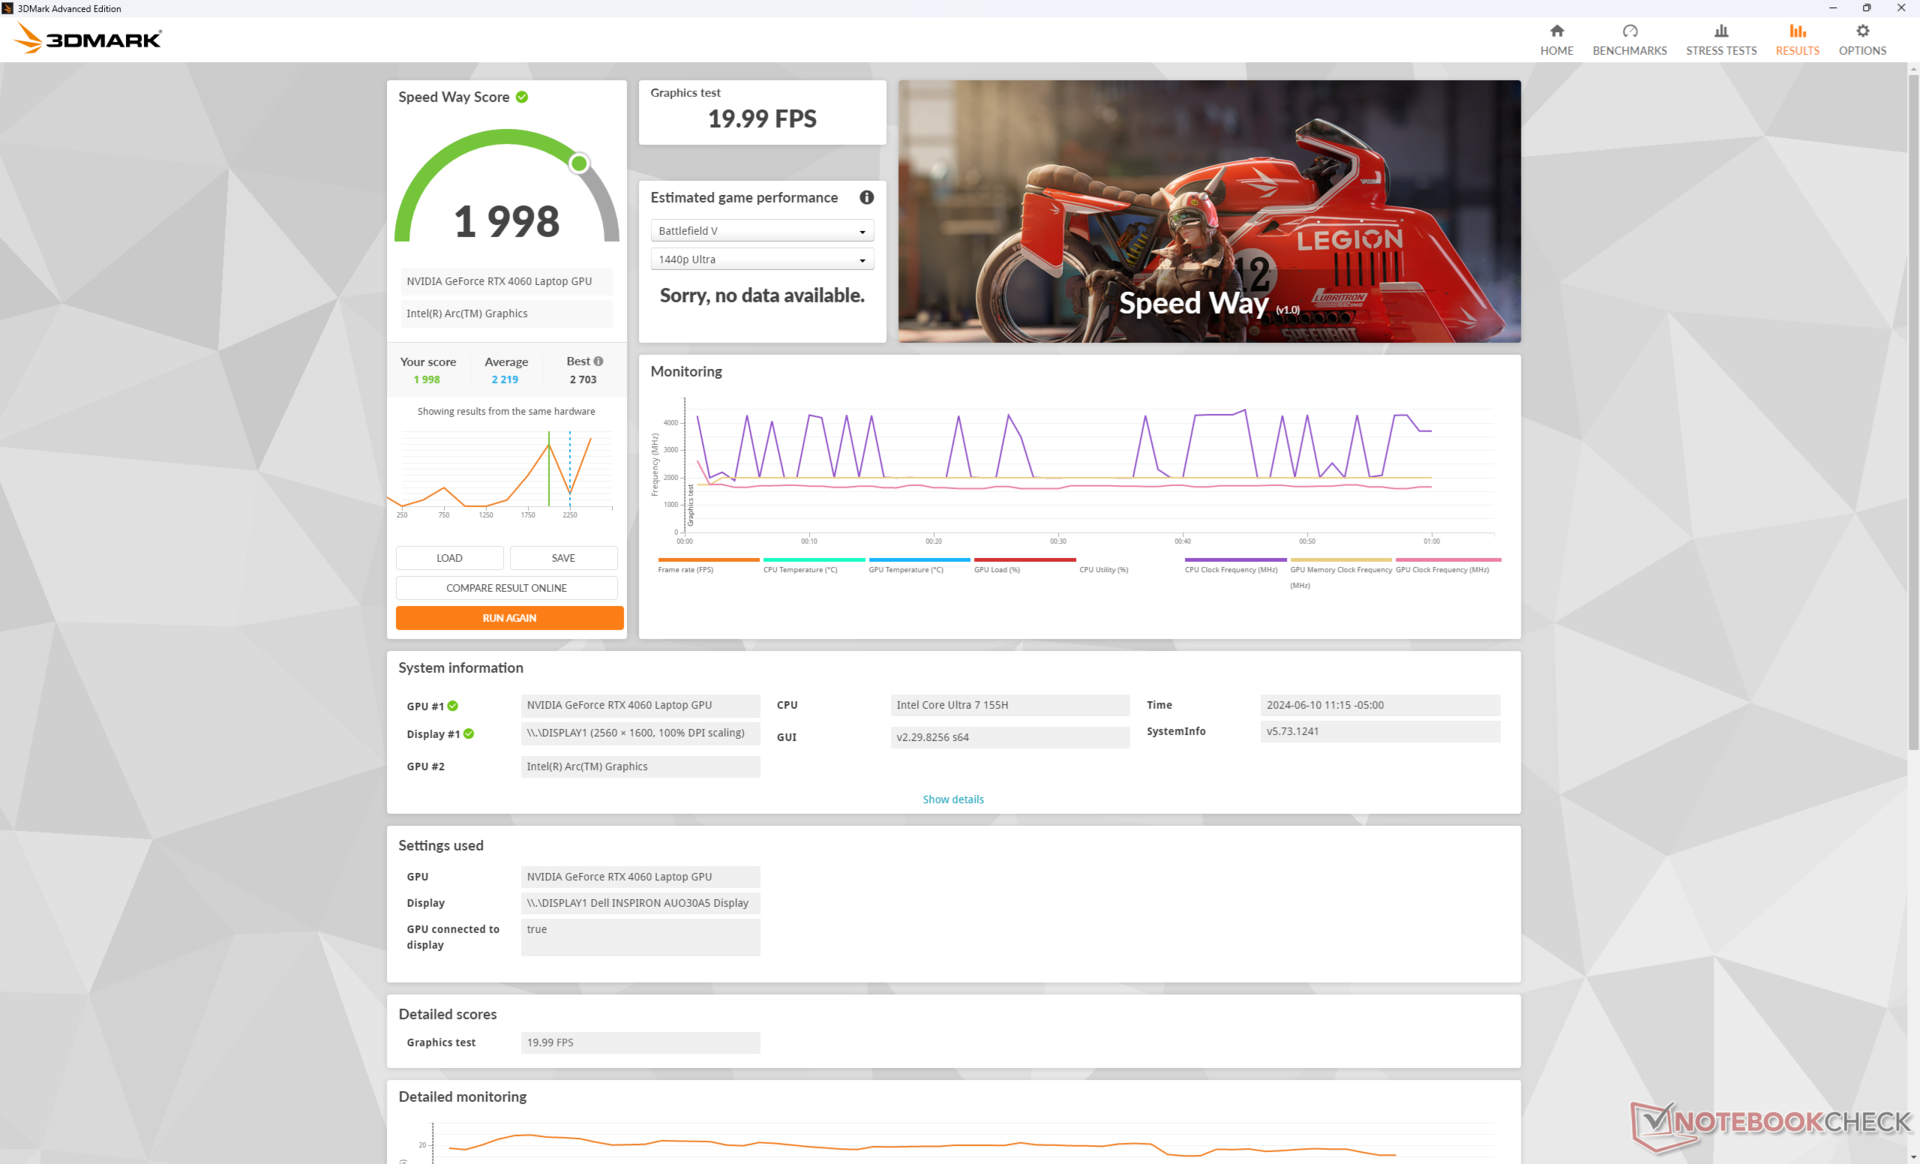
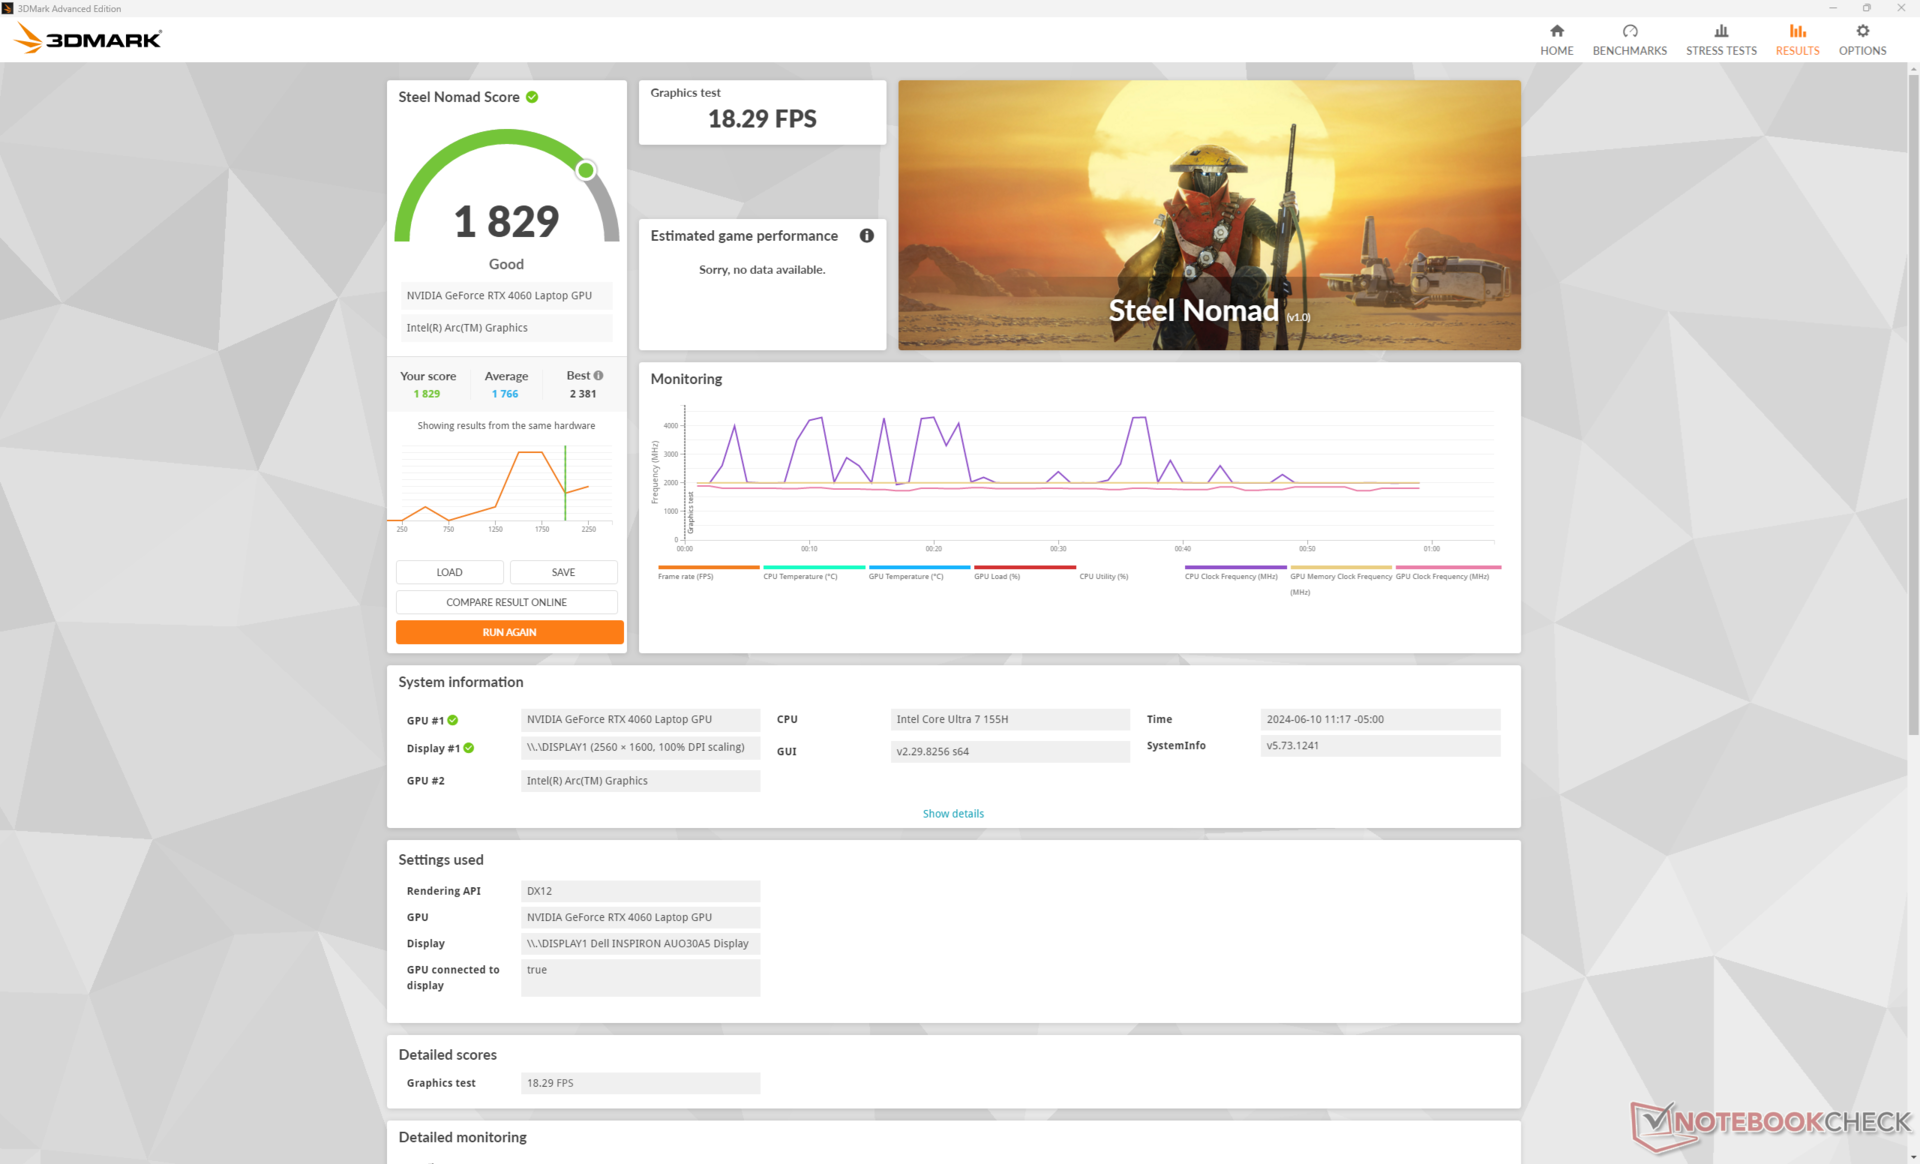
图形处理器性能
Nvidia GPU 选项保持不变,仍为 GeForce RTX 4050和 4060 选项。3DMark 结果比以前高出几个百分点,但遗憾的是,这并不能转化为实际的游戏性能。
降级到 RTX 4050 对性能的影响预计只有 10%。如果完全不选择独立显卡,性能将受到 60% 至 80% 的明显影响。
| 电源配置文件 | 图形分数 | 物理得分 | 综合得分 |
| 性能模式 | 22476 | 26317 | 10876 |
| 平衡模式 | 22542 (-0%) | 27226 (-0%) | 10829 (-0%) |
| 电池供电 | 21957 (-2%) | 26817 (-0%) | 9623 (-12%) |
如Fire Strike 上表所示,在平衡模式而非性能模式下运行似乎不会对性能产生明显影响。即使使用电池运行,也能很好地保持性能。
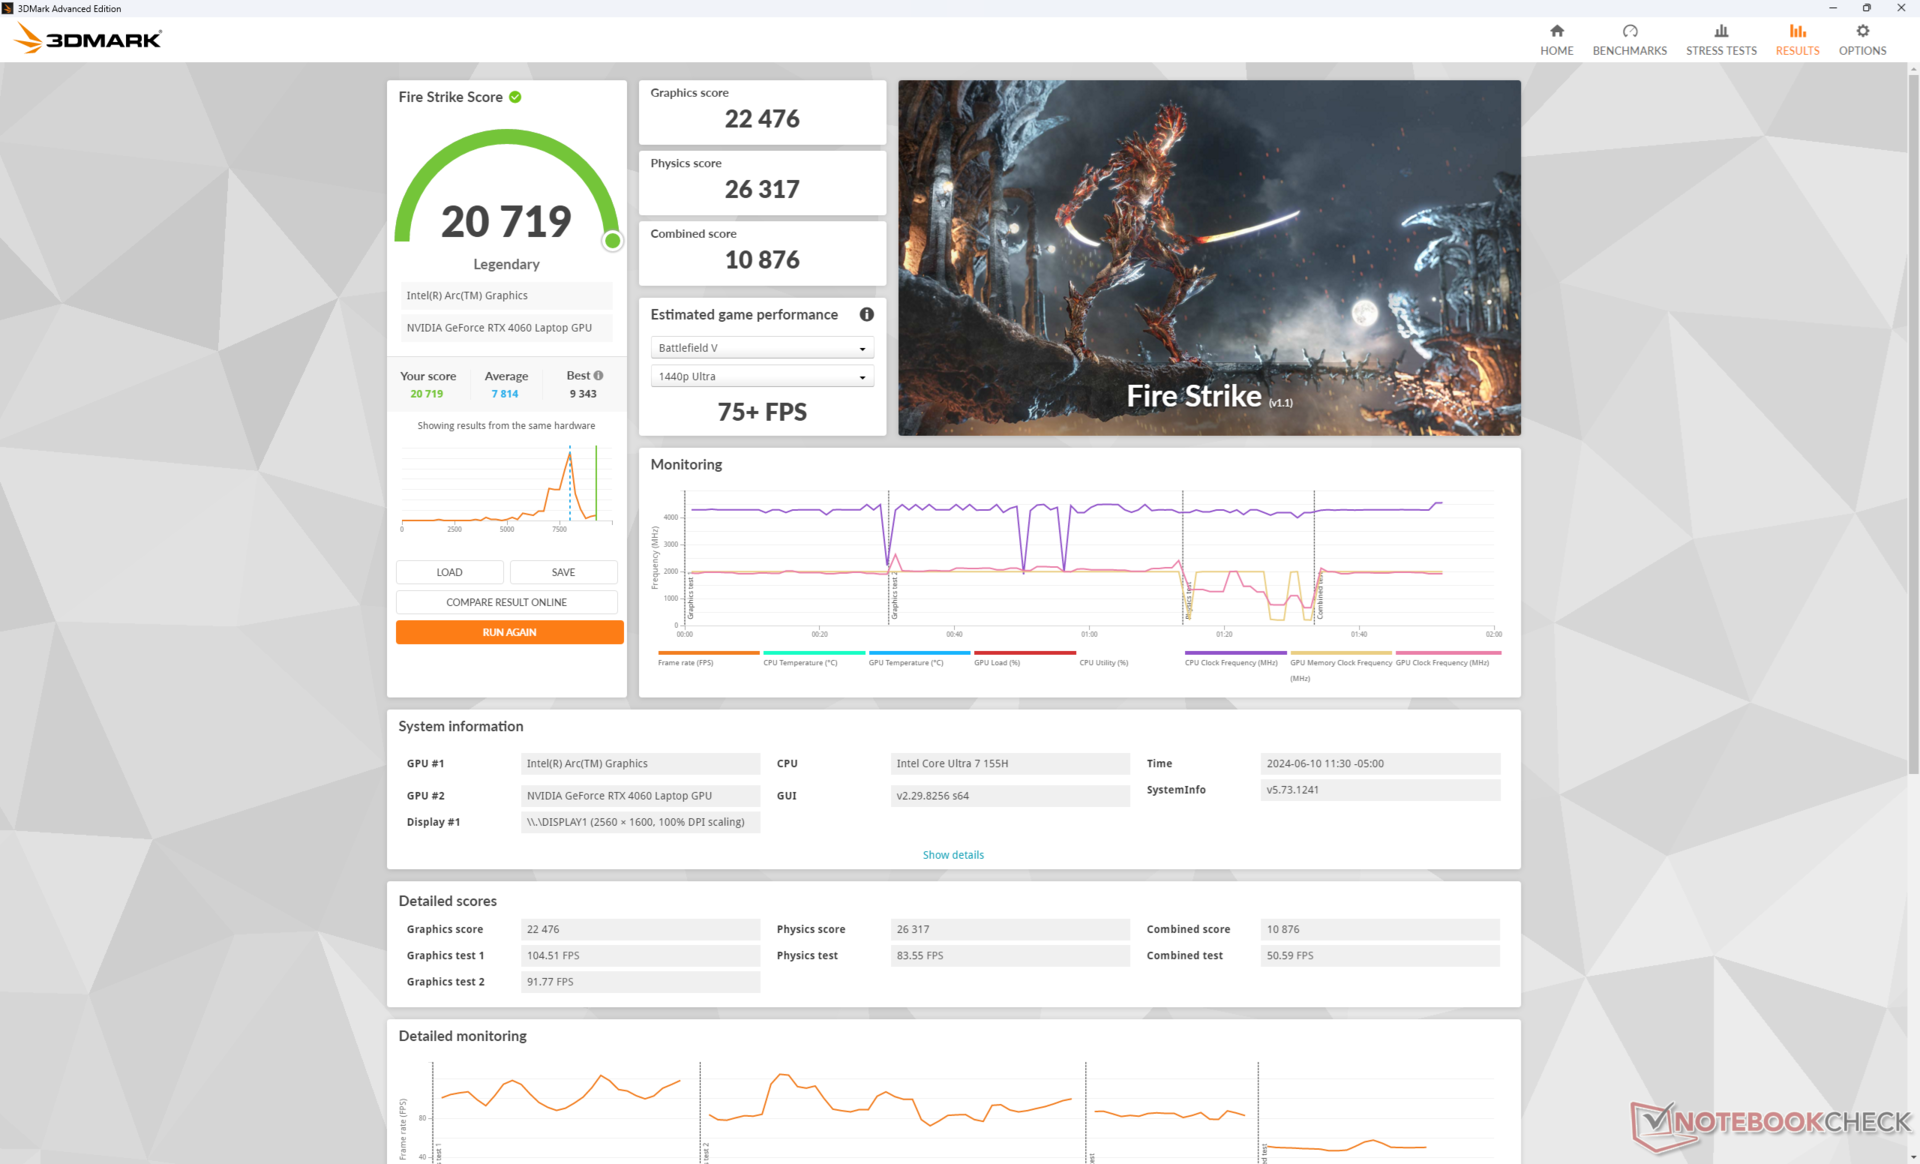
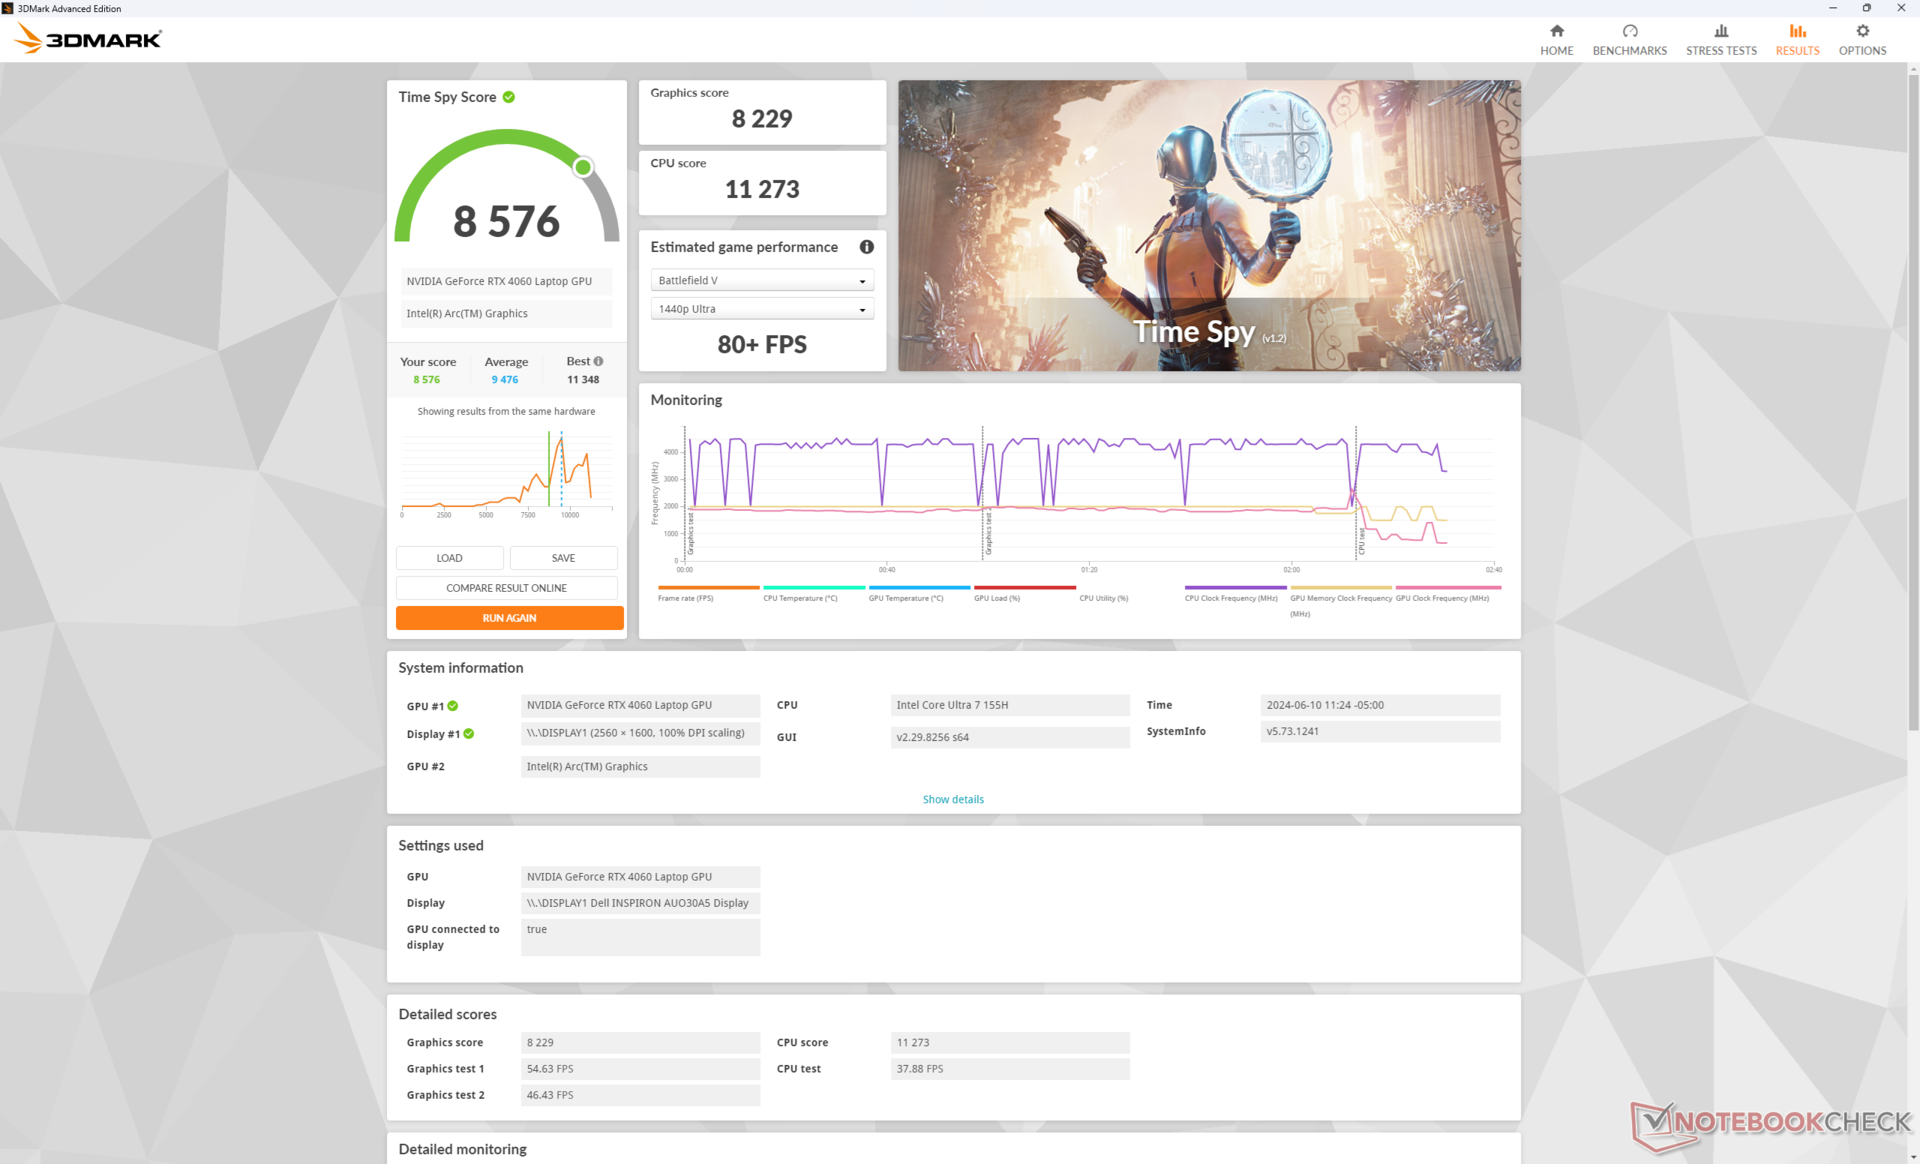
| 3DMark 11 Performance | 21491 points | |
| 3DMark Fire Strike Score | 20719 points | |
| 3DMark Time Spy Score | 8576 points | |
| 3DMark Steel Nomad Score | 1829 points | |
Help | ||
* ... smaller is better
游戏性能
游戏性能没有变化,甚至可能比以前略差。例如,《最终幻想 XV》的运行速度比 Inspiron 16 Plus 7630 慢 10%,其他游戏(包括《F1 22》和《奇异旅社》)的性能差距也较小。
| Performance Rating - Percent | |
| Lenovo Legion 5 16IRX G9 | |
| Dell Inspiron 16 Plus 7630 | |
| Dell Inspiron 16 Plus 7640 | |
| Asus VivoBook Pro 16 K6602VU | |
| Dell Inspiron 16 Plus 7620 -1! | |
| Samsung Galaxy Book4 Ultra | |
| The Witcher 3 - 1920x1080 Ultra Graphics & Postprocessing (HBAO+) | |
| Lenovo Legion 5 16IRX G9 | |
| Dell Inspiron 16 Plus 7630 | |
| Dell Inspiron 16 Plus 7640 | |
| Asus VivoBook Pro 16 K6602VU | |
| Dell Inspiron 16 Plus 7620 | |
| Samsung Galaxy Book4 Ultra | |
| Final Fantasy XV Benchmark - 1920x1080 High Quality | |
| Lenovo Legion 5 16IRX G9 | |
| Dell Inspiron 16 Plus 7630 | |
| Dell Inspiron 16 Plus 7640 | |
| Asus VivoBook Pro 16 K6602VU | |
| Samsung Galaxy Book4 Ultra | |
| Dell Inspiron 16 Plus 7620 | |
| Strange Brigade - 1920x1080 ultra AA:ultra AF:16 | |
| Lenovo Legion 5 16IRX G9 | |
| Dell Inspiron 16 Plus 7630 | |
| Dell Inspiron 16 Plus 7640 | |
| Asus VivoBook Pro 16 K6602VU | |
| Samsung Galaxy Book4 Ultra | |
| Dell Inspiron 16 Plus 7620 | |
| Dota 2 Reborn - 1920x1080 ultra (3/3) best looking | |
| Lenovo Legion 5 16IRX G9 | |
| Dell Inspiron 16 Plus 7630 | |
| Dell Inspiron 16 Plus 7620 | |
| Dell Inspiron 16 Plus 7640 | |
| Samsung Galaxy Book4 Ultra | |
| Asus VivoBook Pro 16 K6602VU | |
| X-Plane 11.11 - 1920x1080 high (fps_test=3) | |
| Lenovo Legion 5 16IRX G9 | |
| Dell Inspiron 16 Plus 7630 | |
| Asus VivoBook Pro 16 K6602VU | |
| Dell Inspiron 16 Plus 7620 | |
| Dell Inspiron 16 Plus 7640 | |
| Samsung Galaxy Book4 Ultra | |
| Far Cry 5 - 1920x1080 Ultra Preset AA:T | |
| Lenovo Legion 5 16IRX G9 | |
| Dell Inspiron 16 Plus 7640 | |
| Asus VivoBook Pro 16 K6602VU | |
| Dell Inspiron 16 Plus 7630 | |
| Samsung Galaxy Book4 Ultra | |
| Baldur's Gate 3 | |
| 1920x1080 Low Preset | |
| Average NVIDIA GeForce RTX 4060 Laptop GPU (102.8 - 160.3, n=15) | |
| Dell Inspiron 16 Plus 7640 | |
| Framework Laptop 16 | |
| Lenovo Yoga 7 2-in-1 16IML9 | |
| 1920x1080 Medium Preset | |
| Average NVIDIA GeForce RTX 4060 Laptop GPU (77.5 - 125.7, n=18) | |
| Dell Inspiron 16 Plus 7640 | |
| Framework Laptop 16 | |
| 1920x1080 High Preset | |
| Average NVIDIA GeForce RTX 4060 Laptop GPU (68.7 - 110.7, n=18) | |
| Dell Inspiron 16 Plus 7640 | |
| Framework Laptop 16 | |
| 1920x1080 Ultra Preset | |
| Average NVIDIA GeForce RTX 4060 Laptop GPU (66.5 - 105.5, n=19) | |
| Dell Inspiron 16 Plus 7640 | |
| Framework Laptop 16 | |
| 2560x1440 Ultra Preset | |
| Average NVIDIA GeForce RTX 4060 Laptop GPU (45.2 - 72.2, n=14) | |
| Dell Inspiron 16 Plus 7640 | |
| Framework Laptop 16 | |
| Cyberpunk 2077 2.2 Phantom Liberty | |
| 1920x1080 Low Preset (FSR off) | |
| Lenovo Legion 5 16IRX G9 | |
| Average NVIDIA GeForce RTX 4060 Laptop GPU (96.7 - 136.1, n=22) | |
| Framework Laptop 16 | |
| Dell Inspiron 16 Plus 7640 | |
| Lenovo Yoga 7 2-in-1 16IML9 | |
| 1920x1080 Medium Preset (FSR off) | |
| Lenovo Legion 5 16IRX G9 | |
| Average NVIDIA GeForce RTX 4060 Laptop GPU (77.7 - 110.4, n=23) | |
| Dell Inspiron 16 Plus 7640 | |
| Framework Laptop 16 | |
| Lenovo Yoga 7 2-in-1 16IML9 | |
| 1920x1080 High Preset (FSR off) | |
| Lenovo Legion 5 16IRX G9 | |
| Average NVIDIA GeForce RTX 4060 Laptop GPU (65.2 - 102, n=26) | |
| Dell Inspiron 16 Plus 7640 | |
| Framework Laptop 16 | |
| Lenovo Yoga 7 2-in-1 16IML9 | |
| 1920x1080 Ultra Preset (FSR off) | |
| Lenovo Legion 5 16IRX G9 | |
| Average NVIDIA GeForce RTX 4060 Laptop GPU (56.4 - 93.1, n=31) | |
| Framework Laptop 16 | |
| Dell Inspiron 16 Plus 7640 | |
| Lenovo Yoga 7 2-in-1 16IML9 | |
| 2560x1440 Ultra Preset (FSR off) | |
| Lenovo Legion 5 16IRX G9 | |
| Average NVIDIA GeForce RTX 4060 Laptop GPU (32.9 - 51.8, n=19) | |
| Framework Laptop 16 | |
| Dell Inspiron 16 Plus 7640 | |
Witcher 3 FPS Chart
| low | med. | high | ultra | QHD | |
|---|---|---|---|---|---|
| The Witcher 3 (2015) | 375.8 | 276.8 | 160.3 | 84.1 | 61.9 |
| Dota 2 Reborn (2015) | 173.5 | 152.1 | 143.2 | 135.1 | |
| Final Fantasy XV Benchmark (2018) | 137.6 | 98.4 | 78.8 | 58.8 | |
| X-Plane 11.11 (2018) | 123.7 | 109 | 86.5 | ||
| Far Cry 5 (2018) | 138 | 125 | 118 | 110 | 83 |
| Strange Brigade (2018) | 360 | 225 | 178.1 | 153.5 | 105.2 |
| Tiny Tina's Wonderlands (2022) | 177.4 | 116 | 91.9 | 71.1 | 48 |
| F1 22 (2022) | 197 | 184.3 | 151.3 | 51.8 | 32.1 |
| Baldur's Gate 3 (2023) | 111.1 | 93.2 | 82.4 | 76.7 | 53.2 |
| Cyberpunk 2077 2.2 Phantom Liberty (2023) | 96.8 | 83.1 | 69.9 | 59.8 | 36.8 |
排放量
系统噪音 - 玩游戏时声音很大
与去年的机型相比,内部风扇能够长时间保持安静。例如,在运行3DMark 06 时,风扇噪音在第一个基准测试场景结束时会徘徊在 29 dB(A)左右,而 Inspiron 16 Plus 7630 则会更大,达到 35 dB(A)。如果长时间运行游戏等要求较高的负载,这两款笔记本电脑的噪音将分别稳定在 50 分贝(A)以上。
Noise Level
| Idle |
| 24.2 / 24.2 / 24.2 dB(A) |
| Load |
| 28.9 / 51 dB(A) |
 | ||
30 dB silent 40 dB(A) audible 50 dB(A) loud |
||
min: | ||
| Dell Inspiron 16 Plus 7640 NVIDIA GeForce RTX 4060 Laptop GPU, Ultra 7 155H, SK hynix BC901 HFS001TEJ4X164N | Dell Inspiron 16 Plus 7630 NVIDIA GeForce RTX 4060 Laptop GPU, i7-13700H, WD PC SN740 SDDPTQD-1T00 | Dell Inspiron 16 Plus 7620 GeForce RTX 3050 Ti Laptop GPU, i7-12700H, Kioxia BG5 KBG50ZNS512G | Samsung Galaxy Book4 Ultra NVIDIA GeForce RTX 4050 Laptop GPU, Ultra 7 155H, Samsung PM9A1 MZVL2512HCJQ | Lenovo Legion 5 16IRX G9 NVIDIA GeForce RTX 4060 Laptop GPU, i7-14650HX, Samsung PM9A1 MZVL21T0HCLR | Asus VivoBook Pro 16 K6602VU NVIDIA GeForce RTX 4050 Laptop GPU, i9-13900H, Micron 2400 MTFDKBA1T0QFM | |
|---|---|---|---|---|---|---|
| Noise | -2% | -13% | 0% | -17% | -11% | |
| off / environment * | 23.8 | 23.2 3% | 23.3 2% | 24.2 -2% | 24 -1% | 20.96 12% |
| Idle Minimum * | 24.2 | 23.2 4% | 25.7 -6% | 24.2 -0% | 24 1% | 25.28 -4% |
| Idle Average * | 24.2 | 23.2 4% | 26.1 -8% | 24.2 -0% | 28.8 -19% | 25.28 -4% |
| Idle Maximum * | 24.2 | 23.2 4% | 30.6 -26% | 24.2 -0% | 32 -32% | 25.28 -4% |
| Load Average * | 28.9 | 35.1 -21% | 46.2 -60% | 37.9 -31% | 45.5 -57% | 51.88 -80% |
| Witcher 3 ultra * | 51 | 52.5 -3% | 49.2 4% | 41.7 18% | 53.1 -4% | 49 4% |
| Load Maximum * | 51 | 52.5 -3% | 49.4 3% | 41.7 18% | 55.7 -9% | 51.8 -2% |
* ... smaller is better
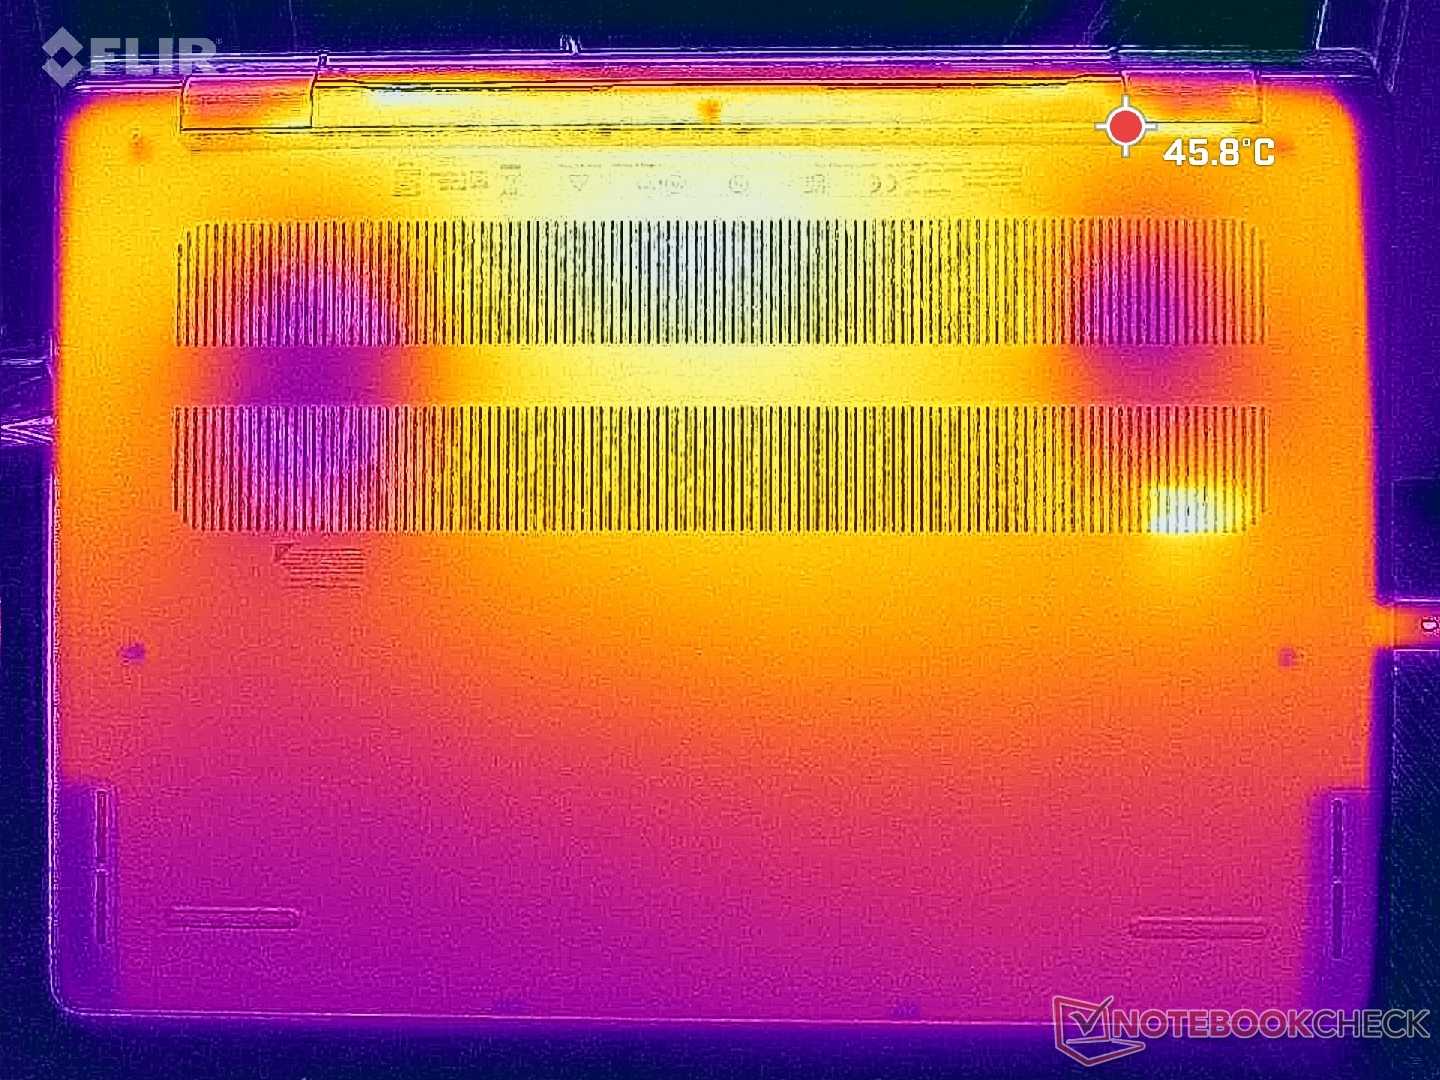
温度
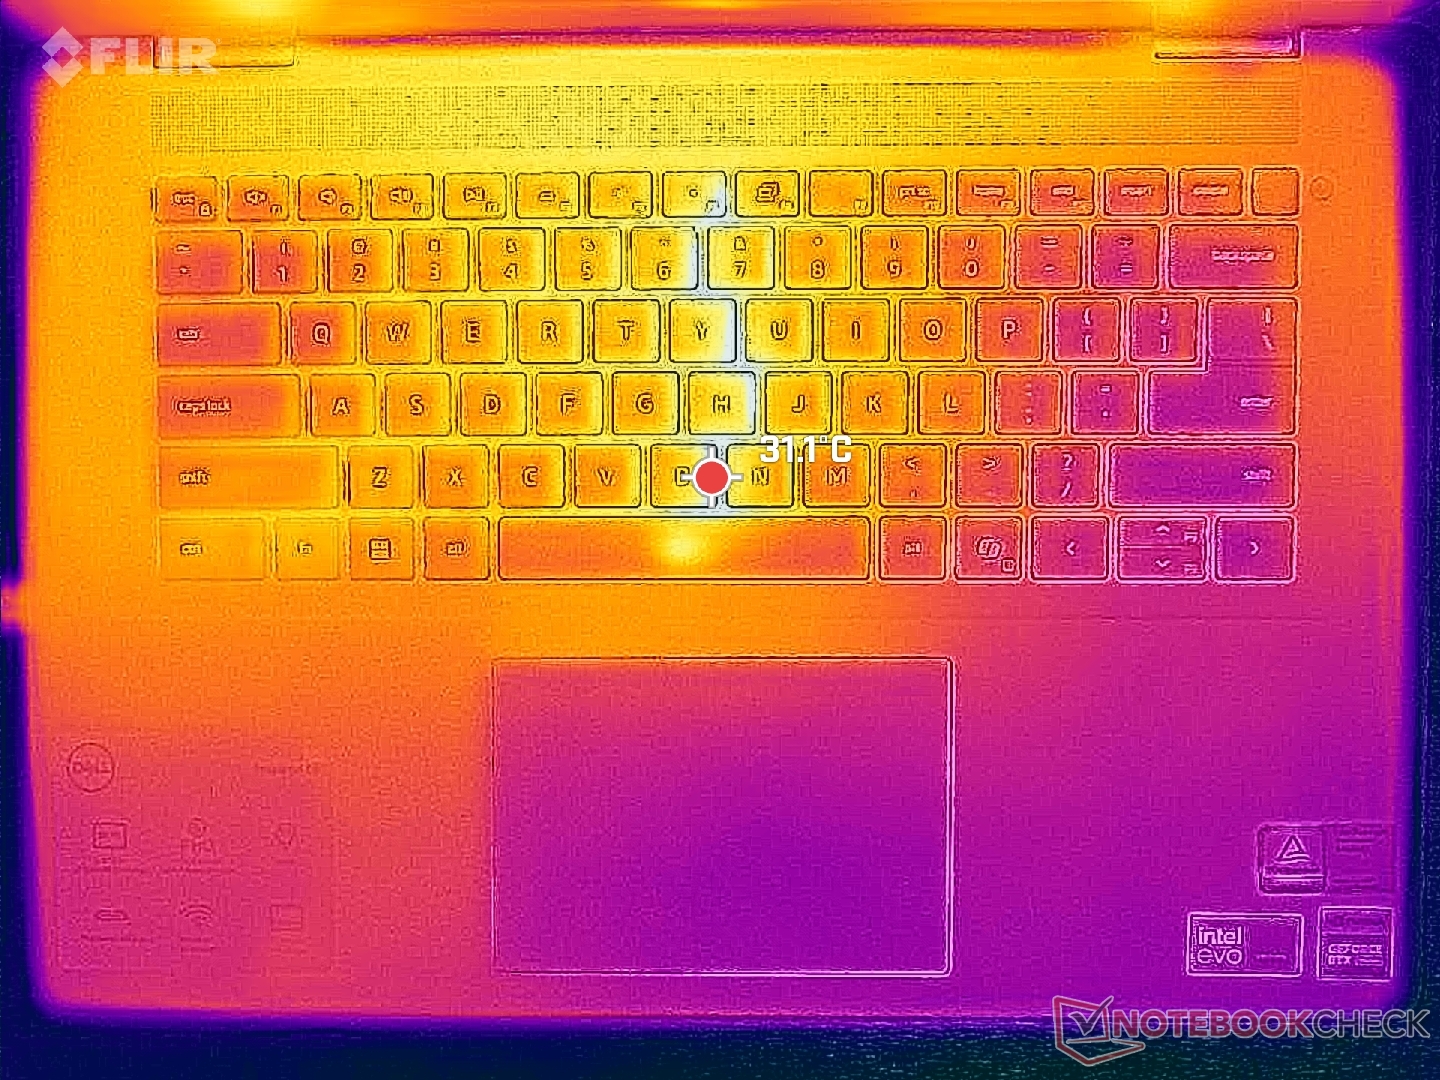
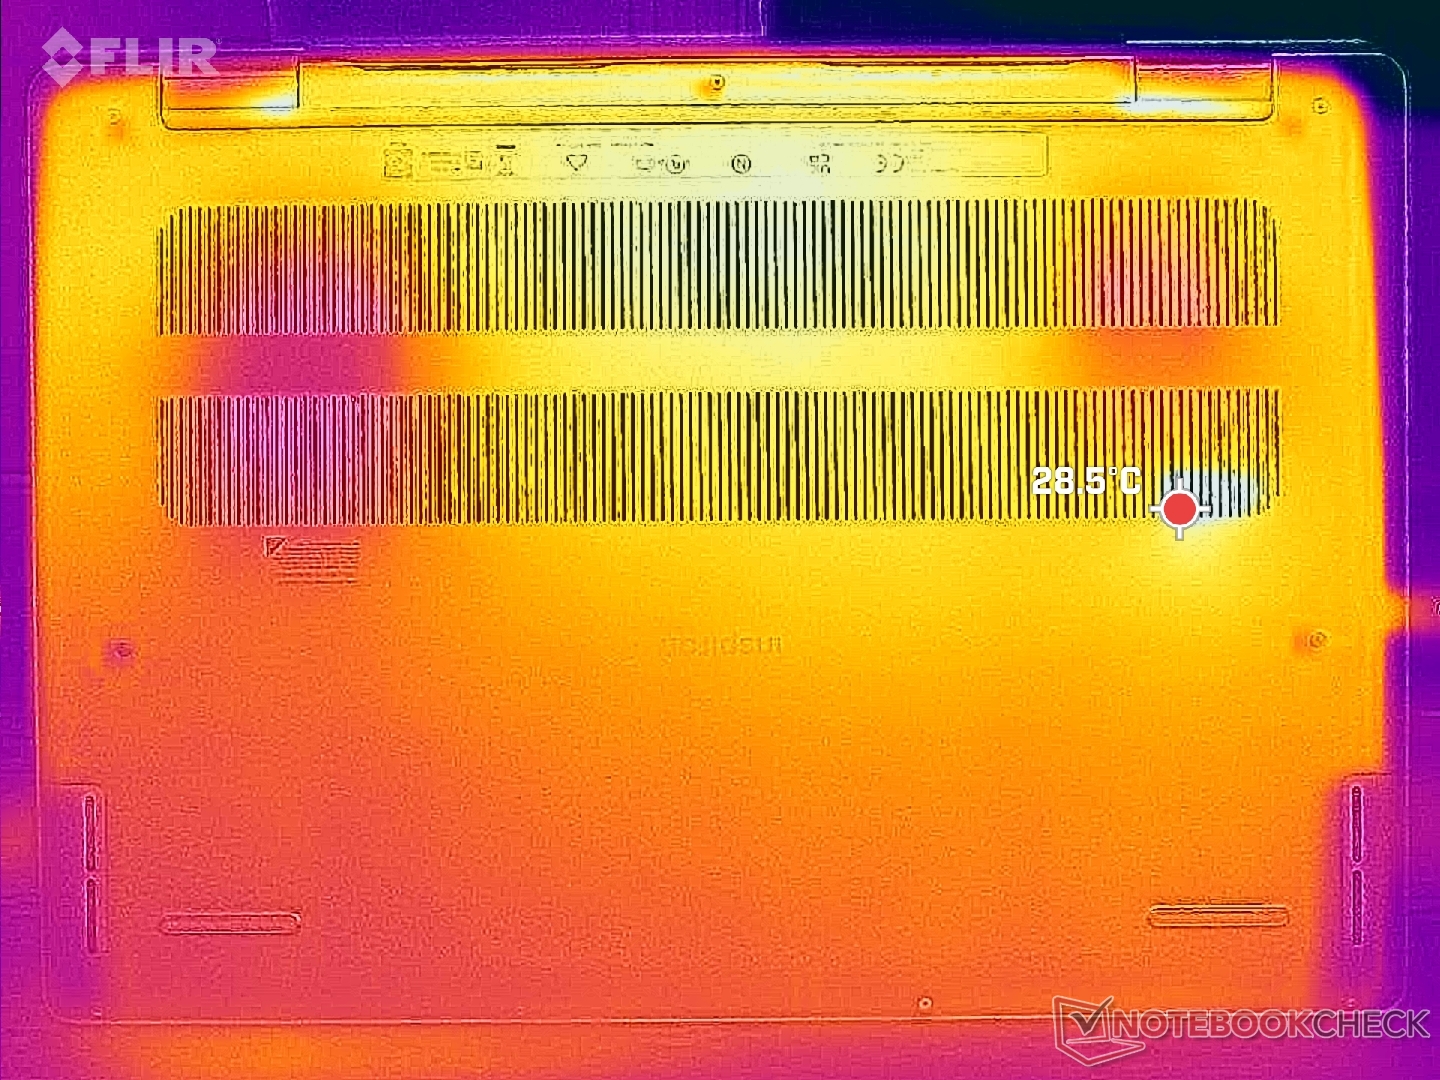
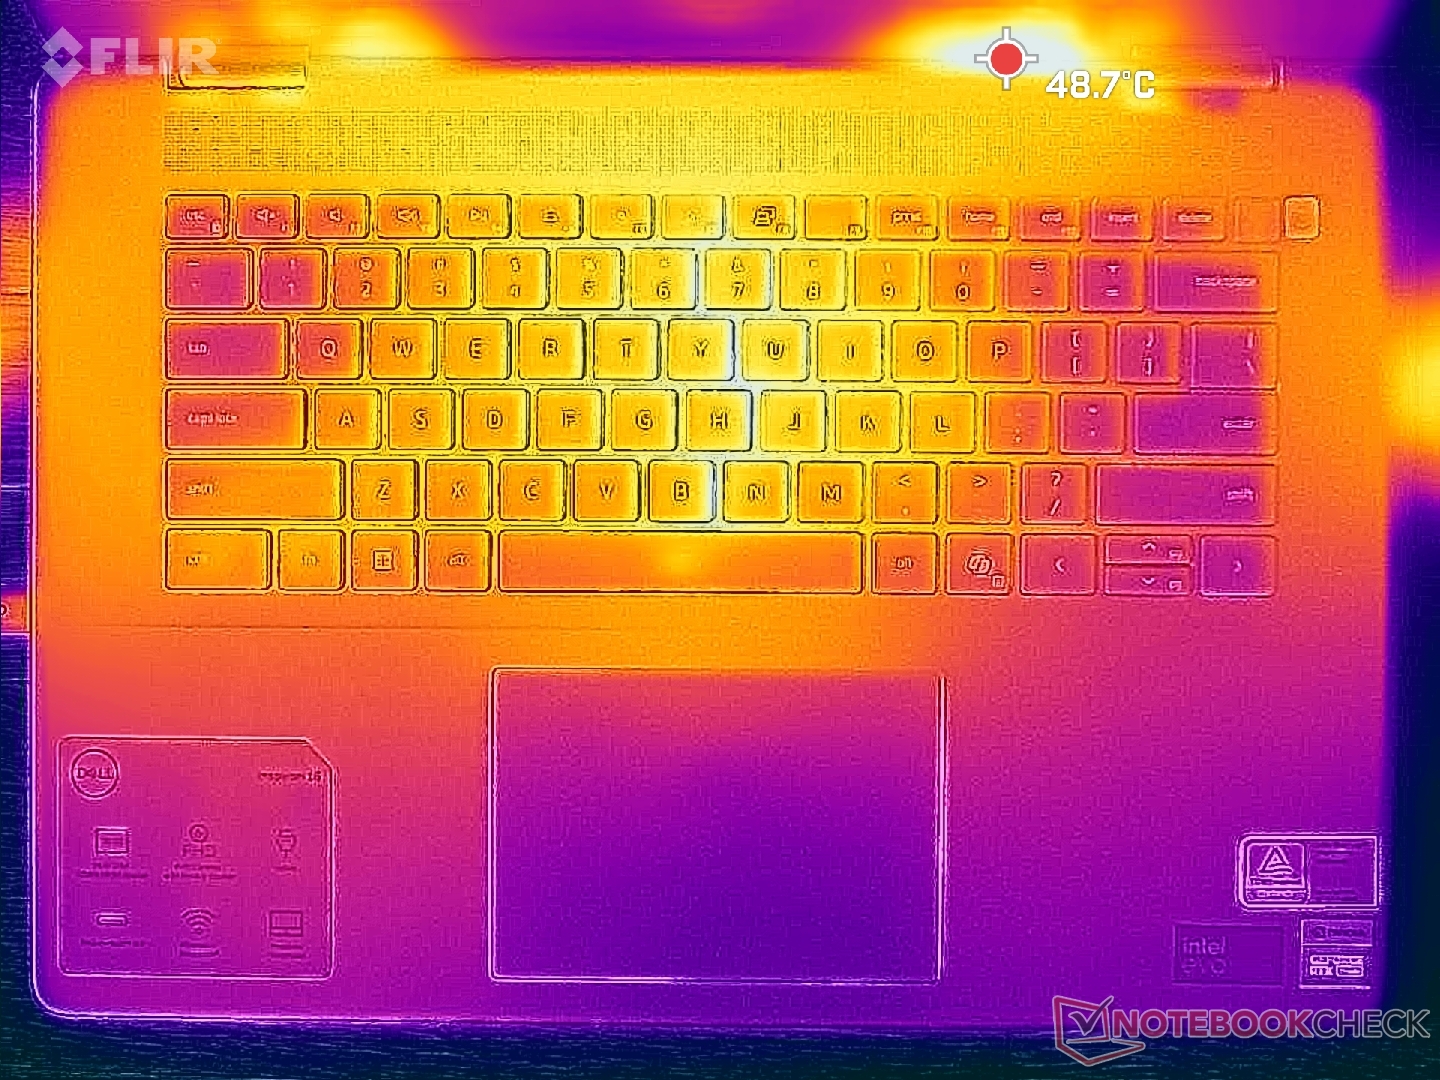
尽管机箱边缘有许多通风栅格,但表面温度仍然很高。游戏时,机箱 C 盖和 D 盖的热点温度可达 43 摄氏度,堪比 联想Legion 5i 16 G9游戏笔记本电脑相当。
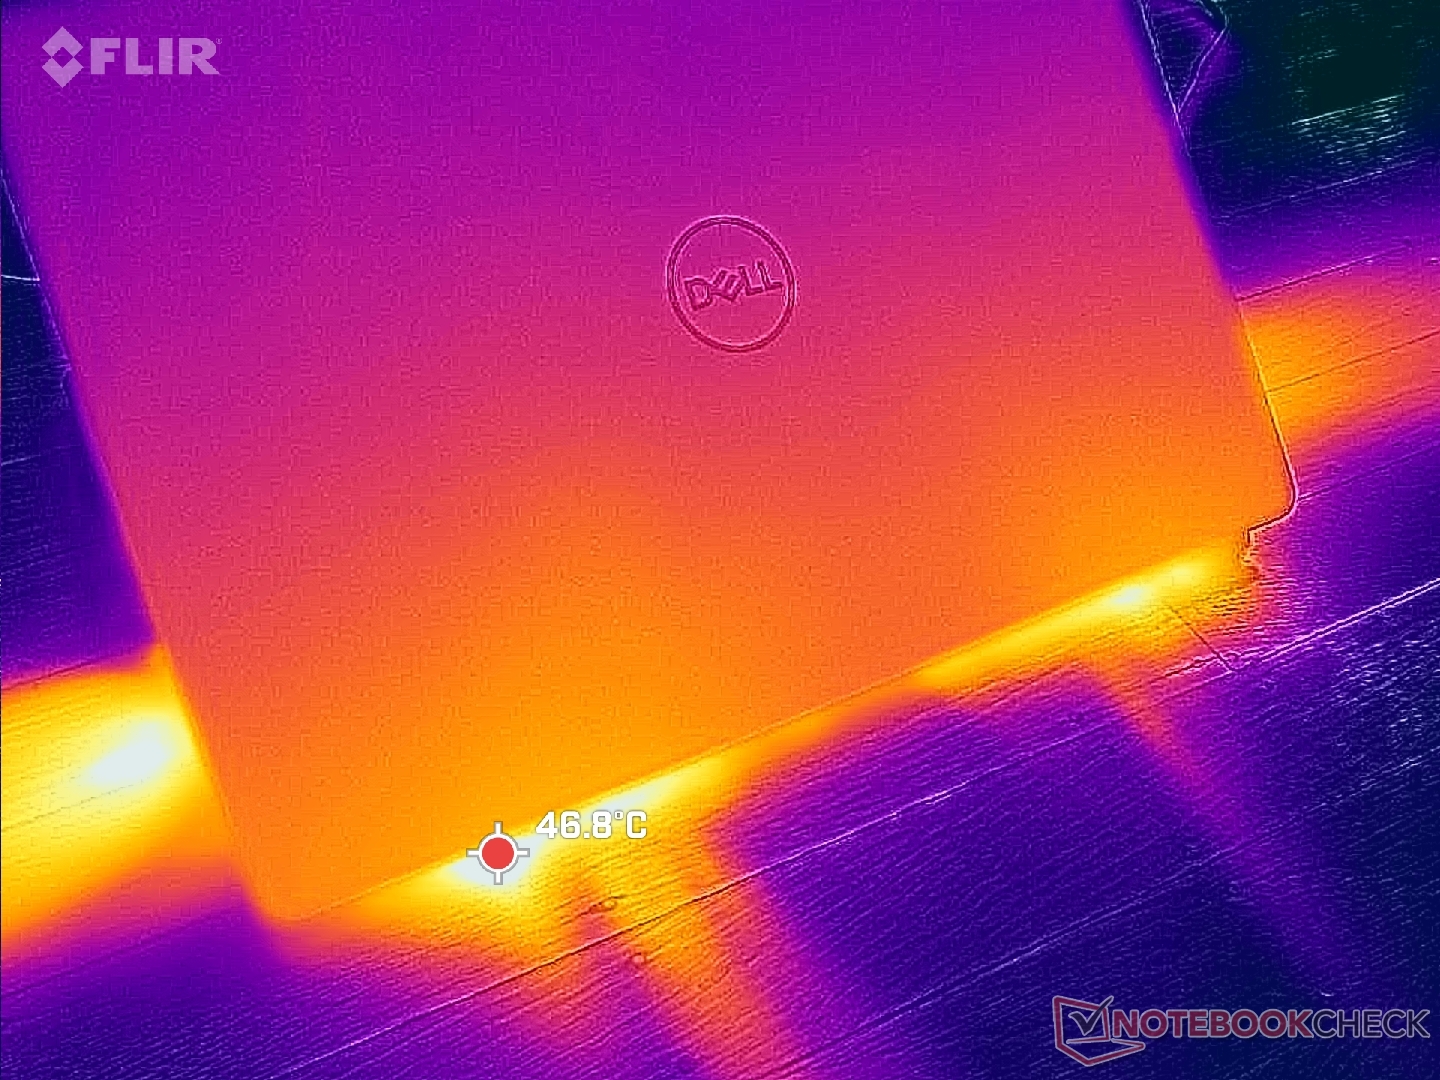
(±) The maximum temperature on the upper side is 43.4 °C / 110 F, compared to the average of 36.9 °C / 98 F, ranging from 21.1 to 71 °C for the class Multimedia.
(±) The bottom heats up to a maximum of 41.6 °C / 107 F, compared to the average of 39.2 °C / 103 F
(+) In idle usage, the average temperature for the upper side is 29.9 °C / 86 F, compared to the device average of 31.3 °C / 88 F.
(+) The palmrests and touchpad are reaching skin temperature as a maximum (35.2 °C / 95.4 F) and are therefore not hot.
(-) The average temperature of the palmrest area of similar devices was 28.8 °C / 83.8 F (-6.4 °C / -11.6 F).
| Dell Inspiron 16 Plus 7640 Intel Core Ultra 7 155H, NVIDIA GeForce RTX 4060 Laptop GPU | Dell Inspiron 16 Plus 7630 Intel Core i7-13700H, NVIDIA GeForce RTX 4060 Laptop GPU | Dell Inspiron 16 Plus 7620 Intel Core i7-12700H, NVIDIA GeForce RTX 3050 Ti Laptop GPU | Samsung Galaxy Book4 Ultra Intel Core Ultra 7 155H, NVIDIA GeForce RTX 4050 Laptop GPU | Lenovo Legion 5 16IRX G9 Intel Core i7-14650HX, NVIDIA GeForce RTX 4060 Laptop GPU | Asus VivoBook Pro 16 K6602VU Intel Core i9-13900H, NVIDIA GeForce RTX 4050 Laptop GPU | |
|---|---|---|---|---|---|---|
| Heat | -7% | -0% | 17% | 0% | -14% | |
| Maximum Upper Side * | 43.4 | 47.8 -10% | 46 -6% | 38.5 11% | 40.4 7% | 42.6 2% |
| Maximum Bottom * | 41.6 | 42.2 -1% | 45.8 -10% | 41.2 1% | 43.8 -5% | 48.4 -16% |
| Idle Upper Side * | 32.8 | 35.2 -7% | 29.2 11% | 23.5 28% | 30.3 8% | 39.4 -20% |
| Idle Bottom * | 32.4 | 35 -8% | 31 4% | 24.1 26% | 35.3 -9% | 39.8 -23% |
* ... smaller is better
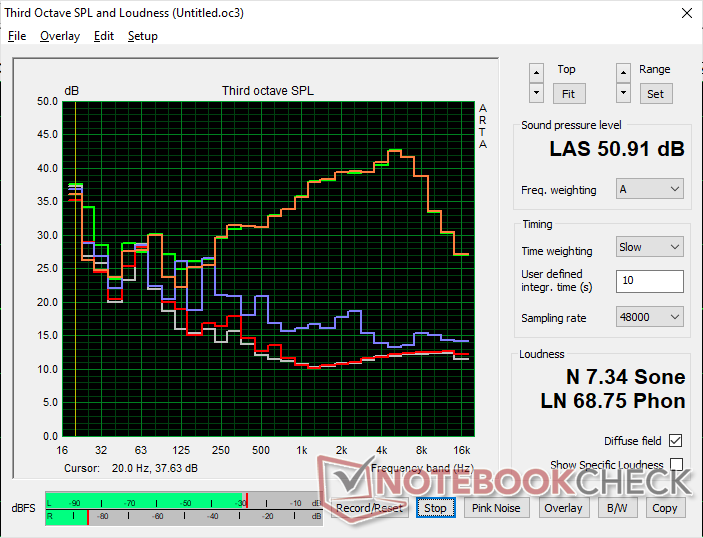
发言人
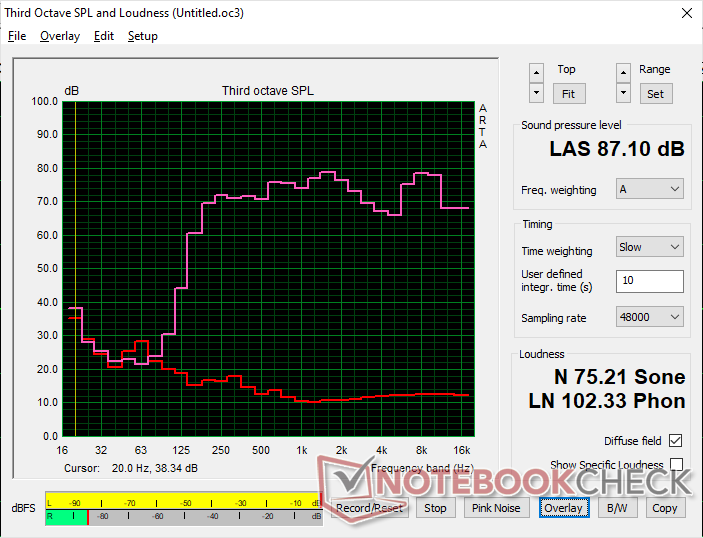
Dell Inspiron 16 Plus 7640 audio analysis
(+) | speakers can play relatively loud (87.1 dB)
Bass 100 - 315 Hz
(±) | reduced bass - on average 13.9% lower than median
(±) | linearity of bass is average (13.7% delta to prev. frequency)
Mids 400 - 2000 Hz
(+) | balanced mids - only 3.6% away from median
(+) | mids are linear (3.4% delta to prev. frequency)
Highs 2 - 16 kHz
(+) | balanced highs - only 4.3% away from median
(+) | highs are linear (5.7% delta to prev. frequency)
Overall 100 - 16.000 Hz
(+) | overall sound is linear (11.3% difference to median)
Compared to same class
» 13% of all tested devices in this class were better, 4% similar, 83% worse
» The best had a delta of 5%, average was 18%, worst was 45%
Compared to all devices tested
» 6% of all tested devices were better, 2% similar, 92% worse
» The best had a delta of 4%, average was 24%, worst was 134%
Apple MacBook Pro 16 2021 M1 Pro audio analysis
(+) | speakers can play relatively loud (84.7 dB)
Bass 100 - 315 Hz
(+) | good bass - only 3.8% away from median
(+) | bass is linear (5.2% delta to prev. frequency)
Mids 400 - 2000 Hz
(+) | balanced mids - only 1.3% away from median
(+) | mids are linear (2.1% delta to prev. frequency)
Highs 2 - 16 kHz
(+) | balanced highs - only 1.9% away from median
(+) | highs are linear (2.7% delta to prev. frequency)
Overall 100 - 16.000 Hz
(+) | overall sound is linear (4.6% difference to median)
Compared to same class
» 0% of all tested devices in this class were better, 0% similar, 100% worse
» The best had a delta of 5%, average was 18%, worst was 45%
Compared to all devices tested
» 0% of all tested devices were better, 0% similar, 100% worse
» The best had a delta of 4%, average was 24%, worst was 134%
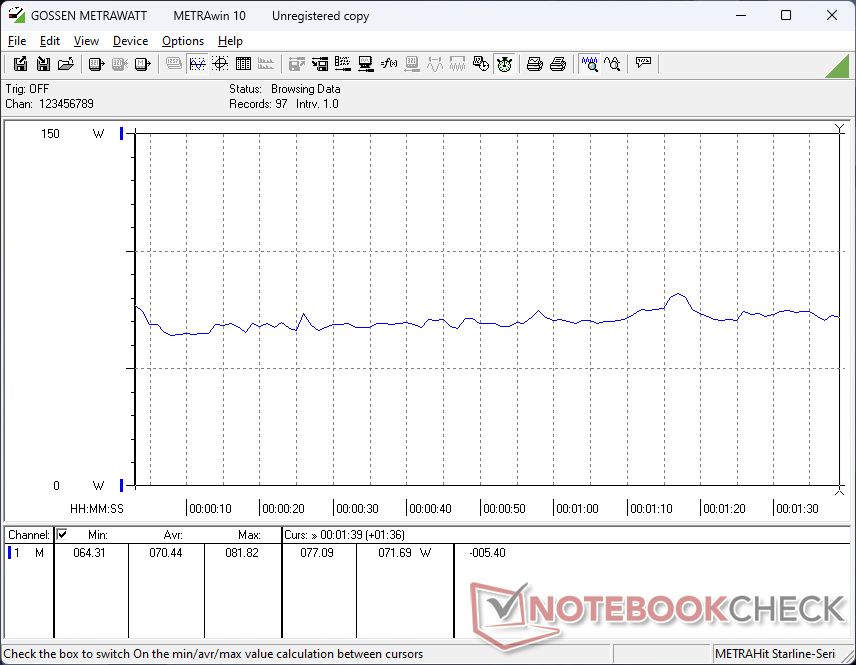
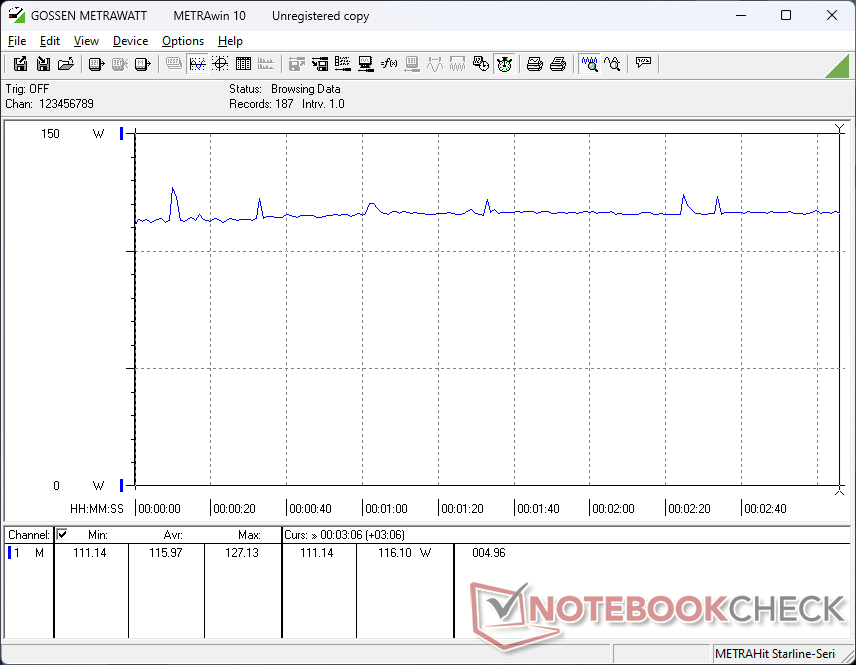
能源管理
耗电量
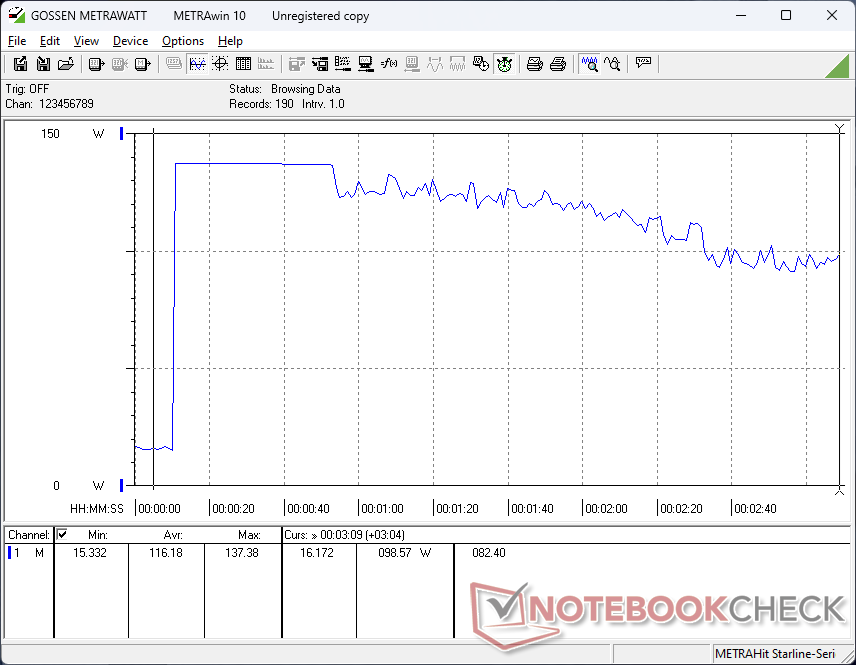
与去年的机型相比,Inspiron 16 Plus 7630 在台式机上闲置时的功耗明显降低,这也是下文将介绍的电池寿命普遍较长的原因。与 Inspiron 16 Plus 7630 的 16 W 至 21 W 相比,该系统的耗电量在 4 W 至 16 W 之间。运行游戏等要求更高的应用程序时,耗电量几乎相同,甚至略低几瓦。
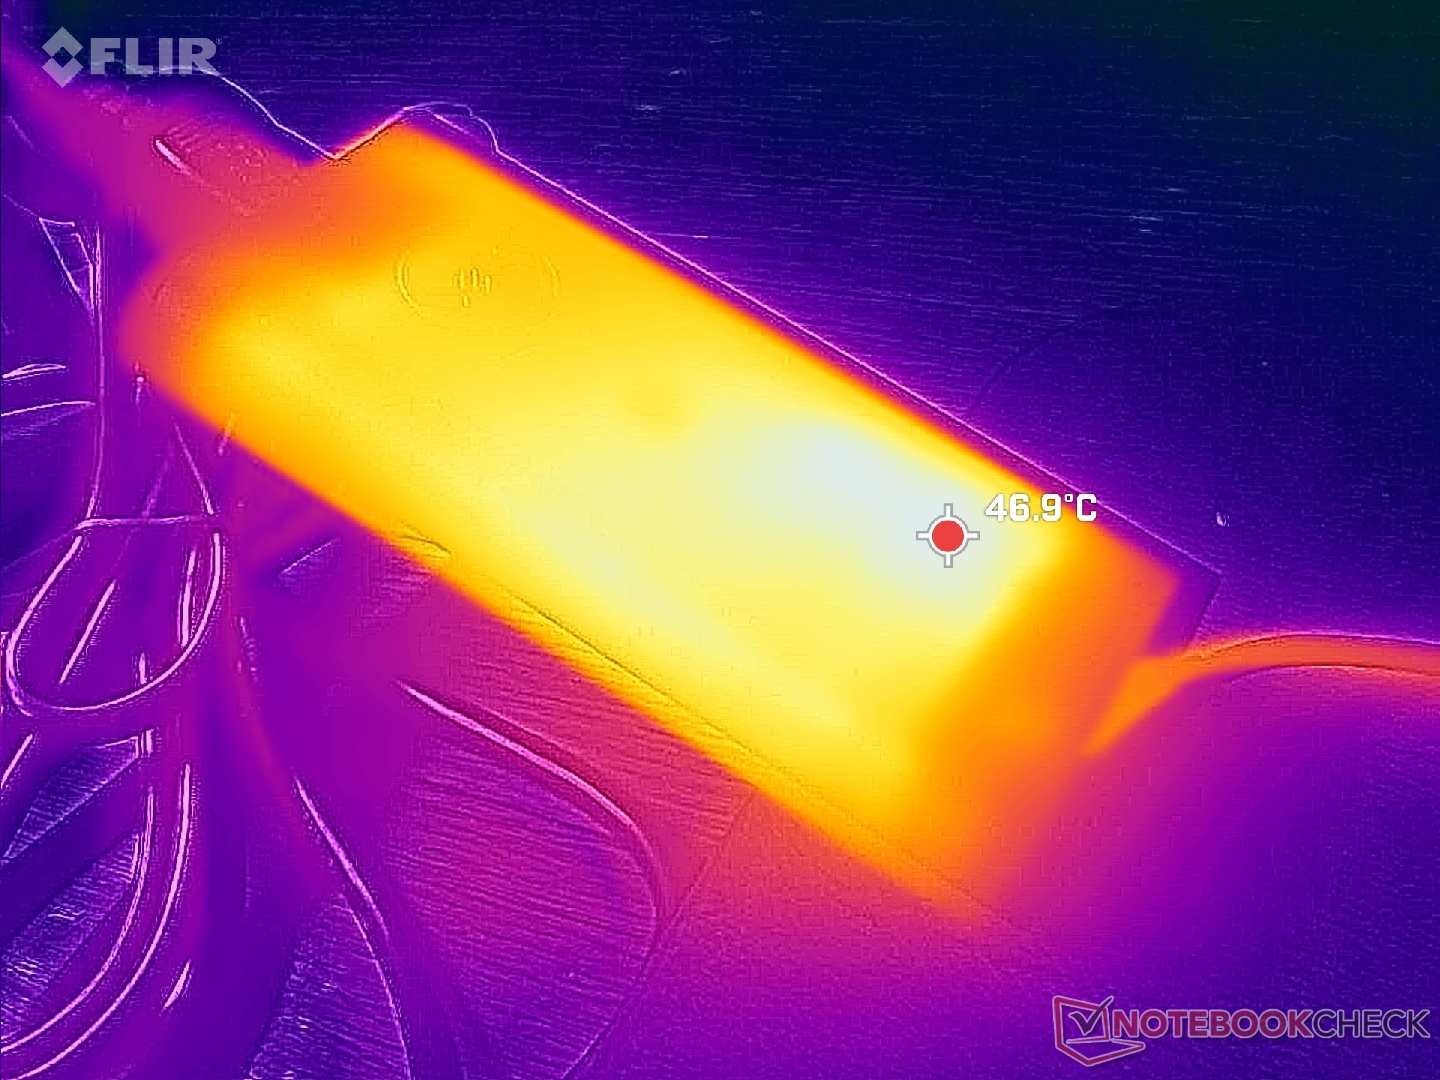
有趣的是,该机型配备了通用的 130 瓦 USB-C 交流适配器(约 14.3 x 6.5 x 2.2 厘米),而不是去年机型配备的 130 瓦专有交流桶式充电器。不过,桶式交流适配器端口仍然保留,这意味着您仍然可以通过兼容的桶式充电器为系统充电。同时运行 Prime95 和 FurMark 时,我们能够记录 138 W 的临时最大功耗。
| Off / Standby | |
| Idle | |
| Load |
|
Key:
min: | |
| Dell Inspiron 16 Plus 7640 Ultra 7 155H, NVIDIA GeForce RTX 4060 Laptop GPU, SK hynix BC901 HFS001TEJ4X164N, IPS, 2560x1600, 16" | Dell Inspiron 16 Plus 7630 i7-13700H, NVIDIA GeForce RTX 4060 Laptop GPU, WD PC SN740 SDDPTQD-1T00, IPS, 2560x1600, 16" | Dell Inspiron 16 Plus 7620 i7-12700H, GeForce RTX 3050 Ti Laptop GPU, Kioxia BG5 KBG50ZNS512G, IPS, 3072x1920, 16" | Samsung Galaxy Book4 Ultra Ultra 7 155H, NVIDIA GeForce RTX 4050 Laptop GPU, Samsung PM9A1 MZVL2512HCJQ, OLED, 2880x1800, 16" | Lenovo Legion 5 16IRX G9 i7-14650HX, NVIDIA GeForce RTX 4060 Laptop GPU, Samsung PM9A1 MZVL21T0HCLR, IPS, 2560x1600, 16" | Asus VivoBook Pro 16 K6602VU i9-13900H, NVIDIA GeForce RTX 4050 Laptop GPU, Micron 2400 MTFDKBA1T0QFM, OLED, 3200x2000, 16" | |
|---|---|---|---|---|---|---|
| Power Consumption | -82% | -30% | 9% | -113% | -116% | |
| Idle Minimum * | 4.2 | 15.6 -271% | 6.8 -62% | 4.8 -14% | 15.4 -267% | 21.06 -401% |
| Idle Average * | 6.9 | 17.7 -157% | 9.6 -39% | 7.5 -9% | 19.7 -186% | 24.27 -252% |
| Idle Maximum * | 15.2 | 20.6 -36% | 17 -12% | 7.9 48% | 20.7 -36% | 25.12 -65% |
| Load Average * | 70.4 | 87.4 -24% | 117.5 -67% | 79.3 -13% | 102.6 -46% | 52.4 26% |
| Witcher 3 ultra * | 115.9 | 121.7 -5% | 113.1 2% | 79.2 32% | 191.3 -65% | 110.2 5% |
| Load Maximum * | 137.4 | 138 -0% | 137.4 -0% | 125 9% | 246.6 -79% | 146 -6% |
* ... smaller is better
Power Consumption Witcher 3 / Stresstest
Power Consumption external Monitor
电池寿命
运行时间比以前长了很多,这可能是由于优化和改用新一代英特尔 CPU 的缘故。我们能够记录到实际 WLAN 电池续航时间接近 13.5 小时,而去年的机型仅为 9.5 小时。
使用附带的 USB-C 适配器,从空电到满电大约需要 2 个小时。
| Dell Inspiron 16 Plus 7640 Ultra 7 155H, NVIDIA GeForce RTX 4060 Laptop GPU, 90 Wh | Dell Inspiron 16 Plus 7630 i7-13700H, NVIDIA GeForce RTX 4060 Laptop GPU, 86 Wh | Dell Inspiron 16 Plus 7620 i7-12700H, GeForce RTX 3050 Ti Laptop GPU, 86 Wh | Samsung Galaxy Book4 Ultra Ultra 7 155H, NVIDIA GeForce RTX 4050 Laptop GPU, 76 Wh | Lenovo Legion 5 16IRX G9 i7-14650HX, NVIDIA GeForce RTX 4060 Laptop GPU, 80 Wh | Asus VivoBook Pro 16 K6602VU i9-13900H, NVIDIA GeForce RTX 4050 Laptop GPU, 96 Wh | |
|---|---|---|---|---|---|---|
| Battery Runtime | -29% | -28% | -18% | -44% | -24% | |
| WiFi v1.3 | 799 | 566 -29% | 575 -28% | 656 -18% | 444 -44% | 606 -24% |
| Reader / Idle | 1055 | 1114 | ||||
| Load | 85 | 69 | 78 | 46 | ||
| H.264 | 1076 | 576 | 585 |
Pros
Cons
结论--修补一些小漏洞
虽然 2024 Inspiron 16 Plus 7640 看起来很像 2023 版本,但除了每年一次的处理器升级外,它还带来了足够多的新功能,感兴趣的买家可能需要了解一下。更新的机型支持多达两个固态硬盘,提供更快的黑白灰响应时间、更长的电池续航时间以及人工智能加速。对于重视存储扩展、快节奏游戏、旅行以及 Co-Pilot 等人工智能辅助程序的发烧友来说,这些引擎盖下的变化非常重要。在这方面,Inspiron 16 Plus 7640 与前代产品相比毫无悬念。
Inspiron 16 Plus 7640 解决了前代产品的一些缺点,成为一款比以前更加出色的多媒体机器。不过,CPU 的单线程性能和游戏性能略有下降。
不幸的是,新机型的游戏性能受到了影响,因为大多数游戏的运行速度都比以前慢了一些。硬核玩家可能会对此感到失望,但这一不足应该不足以让休闲玩家望而却步,而 Inspiron 系列正是为休闲玩家设计的。真正想从笔记本电脑中榨取更多性能的游戏玩家将不得不考虑更大、更贵的机型,如 戴尔 G16 系列, 华硕 Zephyrus G16 系列或 雷蛇刀锋 16 系列TGP 通常可达三位数。
价格和供应情况
我们的 Core Ultra 7、RTX 4060 和 1600p 评测配置目前直接从戴尔出货,售价 1300 美元。与此同时,配备UHD Graphics SKU 的低端酷睿 i7 起价仅为 900 美元。
Dell Inspiron 16 Plus 7640
- 06/21/2024 v8
Allen Ngo
Transparency
The selection of devices to be reviewed is made by our editorial team. The test sample was provided to the author as a loan by the manufacturer or retailer for the purpose of this review. The lender had no influence on this review, nor did the manufacturer receive a copy of this review before publication. There was no obligation to publish this review. We never accept compensation or payment in return for our reviews. As an independent media company, Notebookcheck is not subjected to the authority of manufacturers, retailers or publishers.
This is how Notebookcheck is testing
Every year, Notebookcheck independently reviews hundreds of laptops and smartphones using standardized procedures to ensure that all results are comparable. We have continuously developed our test methods for around 20 years and set industry standards in the process. In our test labs, high-quality measuring equipment is utilized by experienced technicians and editors. These tests involve a multi-stage validation process. Our complex rating system is based on hundreds of well-founded measurements and benchmarks, which maintains objectivity. Further information on our test methods can be found here.
Price comparison

