

申克 XMG Evo 15 (M24) 笔记本电脑评测 - 拥有明亮显示屏和出色维护选项的德国超极本
迄今为止,XMG 笔记本电脑主要面向游戏玩家和需要快速专用显卡的客户。随着新款 XMG Evo 型号(14 和 15 英寸)的推出,这家德国制造商现在也推出了两款不带专用图形处理器的超极本。这些机箱更加紧凑,但同时也无需大量的维护选项。该制造商还为客户提供了 AMD 的 Ryzen 8000 CPU(1049 欧元起)或英特尔的 Meteor Lake 芯片(1199 欧元起)供选择,申克认为,这不会导致性能上的重大差异。显示屏始终采用哑光 WQHD 面板(2560 x 1600 像素),亮度为 500 尼特,频率为 240 赫兹。
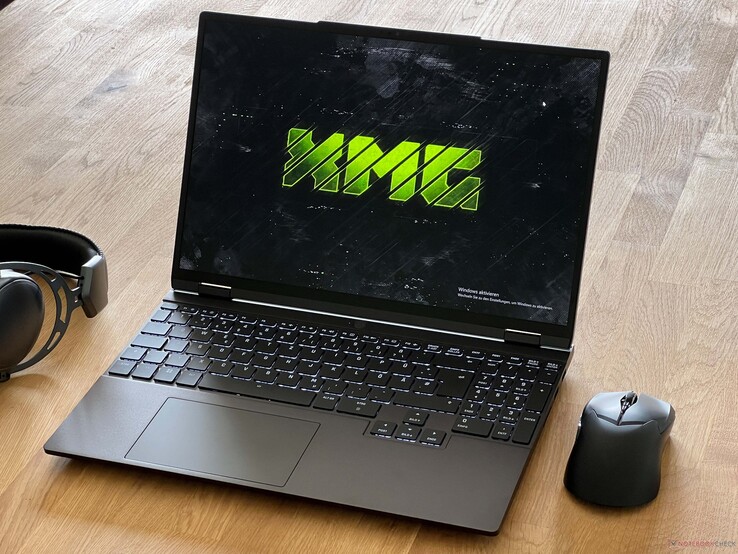
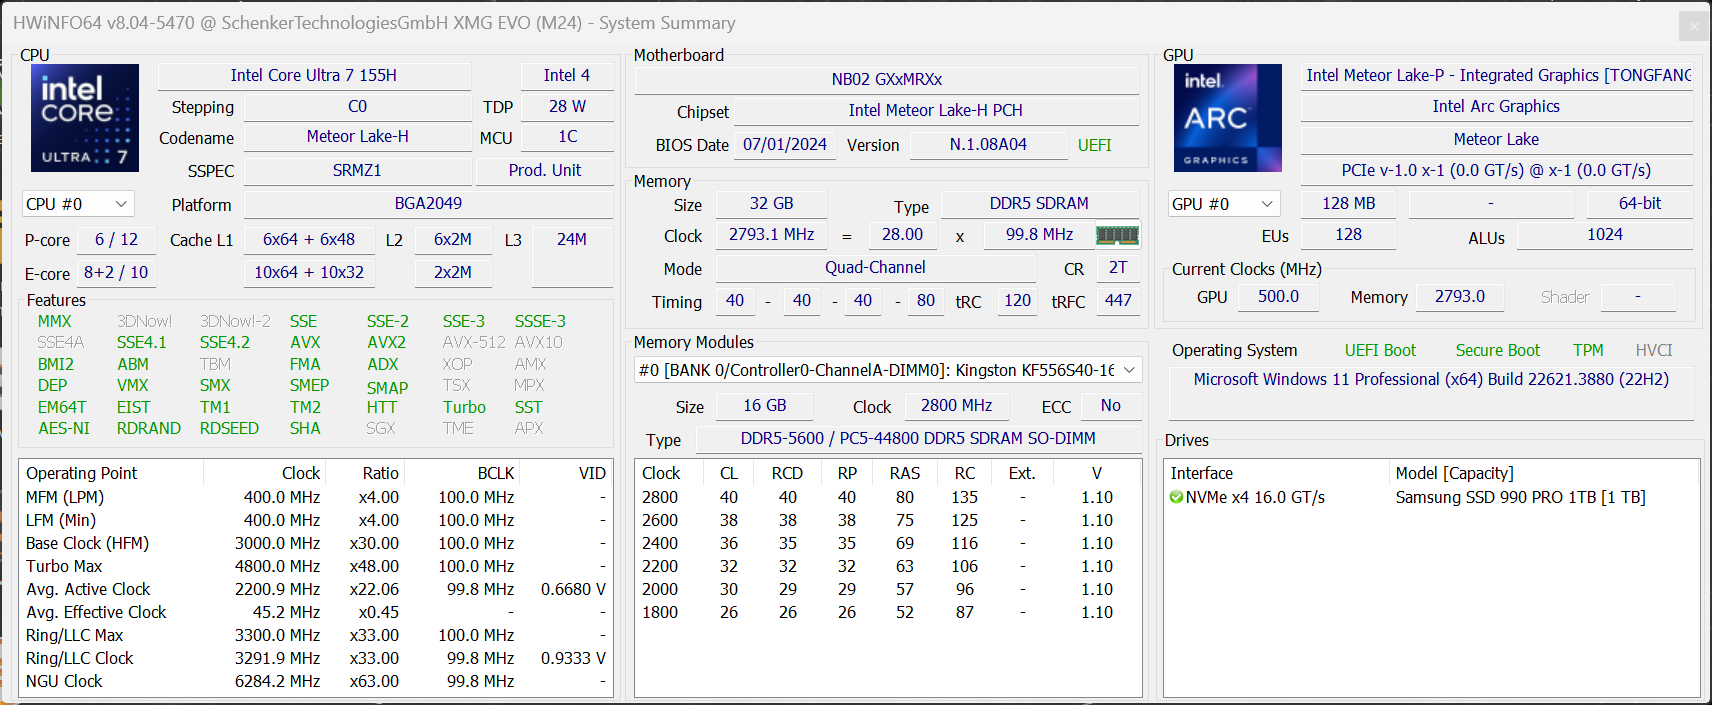
我们测试的新款 XMG Evo 15 (M24) 配备了 英特尔酷睿 7 155H包括 Arc Graphics iGPU,以及 32 GB 内存(DDR5-5600)和 1 TB 版本的 Samsung 990 Pro。在此配置下(包括预装 Windows 11),价格为 1,400 欧元。
潜在的竞争对手比较
Rating | Version | Date | Model | Weight | Height | Size | Resolution | Price |
|---|---|---|---|---|---|---|---|---|
| 84.7 % | v8 | 08 / 2024 | SCHENKER XMG Evo 15 (M24) Ultra 7 155H, Arc 8-Core | 1.7 kg | 19.9 mm | 15.30" | 2560x1600 | |
| 82.1 % | v8 | 07 / 2024 | Dell Inspiron 16 7640 2-in-1 Ultra 7 155H, Arc 8-Core | 2.1 kg | 18.99 mm | 16.00" | 2560x1600 | |
| 76.7 % | v8 | 07 / 2024 | Medion S10 OLED Ultra 7 155H, Arc 8-Core | 1.6 kg | 17.8 mm | 16.00" | 3840x2400 | |
| 89.7 % v7 (old) | v7 (old) | 04 / 2024 | Xiaomi RedmiBook Pro 16 2024 Ultra 7 155H, Arc 8-Core | 1.9 kg | 15.9 mm | 16.00" | 3072x1920 | |
| 87.9 % v7 (old) | v7 (old) | 05 / 2024 | Lenovo IdeaPad Pro 5 16IMH G9 Ultra 7 155H, Arc 8-Core | 1.9 kg | 17.5 mm | 16.00" | 2560x1600 | |
| 89.9 % v7 (old) | v7 (old) | 05 / 2024 | Lenovo ThinkPad T16 G2 21K70035GE R7 7840U, Radeon 780M | 1.8 kg | 23.8 mm | 16.00" | 1920x1200 |
注:我们最近更新了评级系统,第 8 版的结果与第 7 版的结果不具可比性。更多信息请点击 这里.
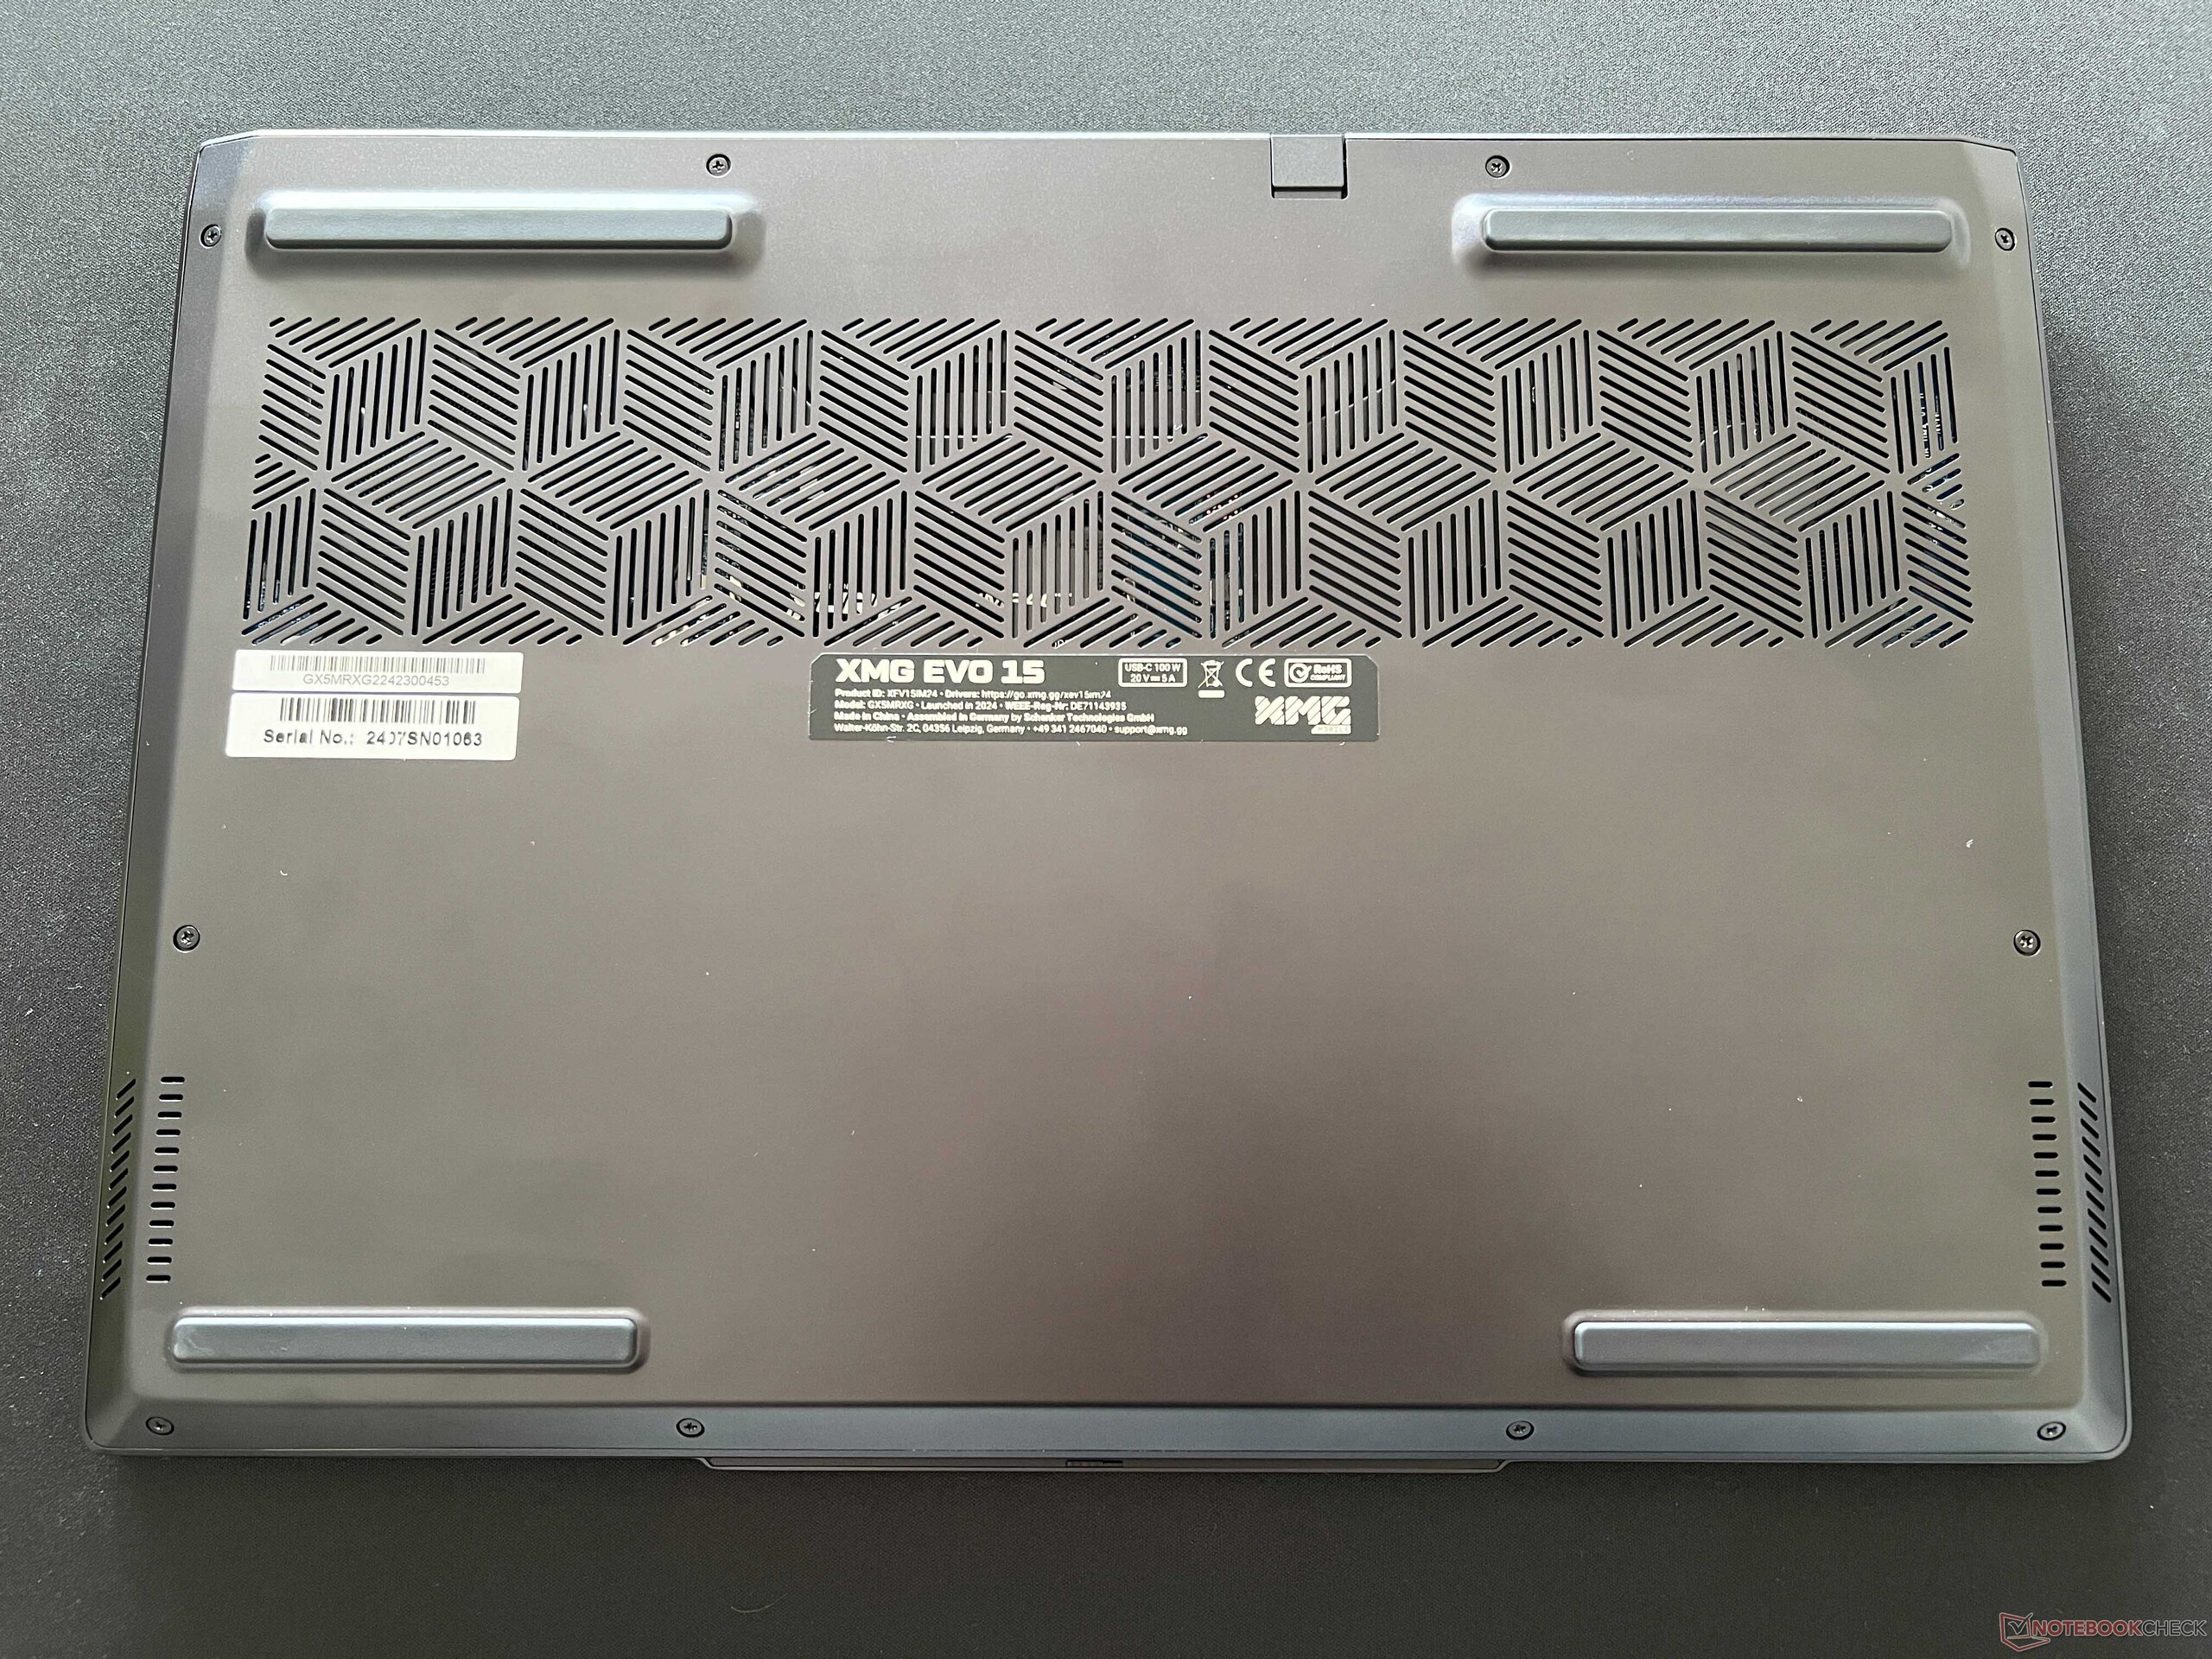
外壳 - 坚固的铝制外壳

XMG Evo 15 采用黑色铝制机身,与 XMG Fusion 15 有些相似。 XMG Fusion 15游戏机。不过,Evo 15 的机身更加紧凑(尤其是更薄),而且两侧也没有散热口。总体而言,这款笔记本看起来非常简洁,在专业环境中使用也没有任何问题;如果需要,还可以订购显示盖上没有徽标的笔记本。不过,铝制表面对指纹相当敏感,需要定期清洁。
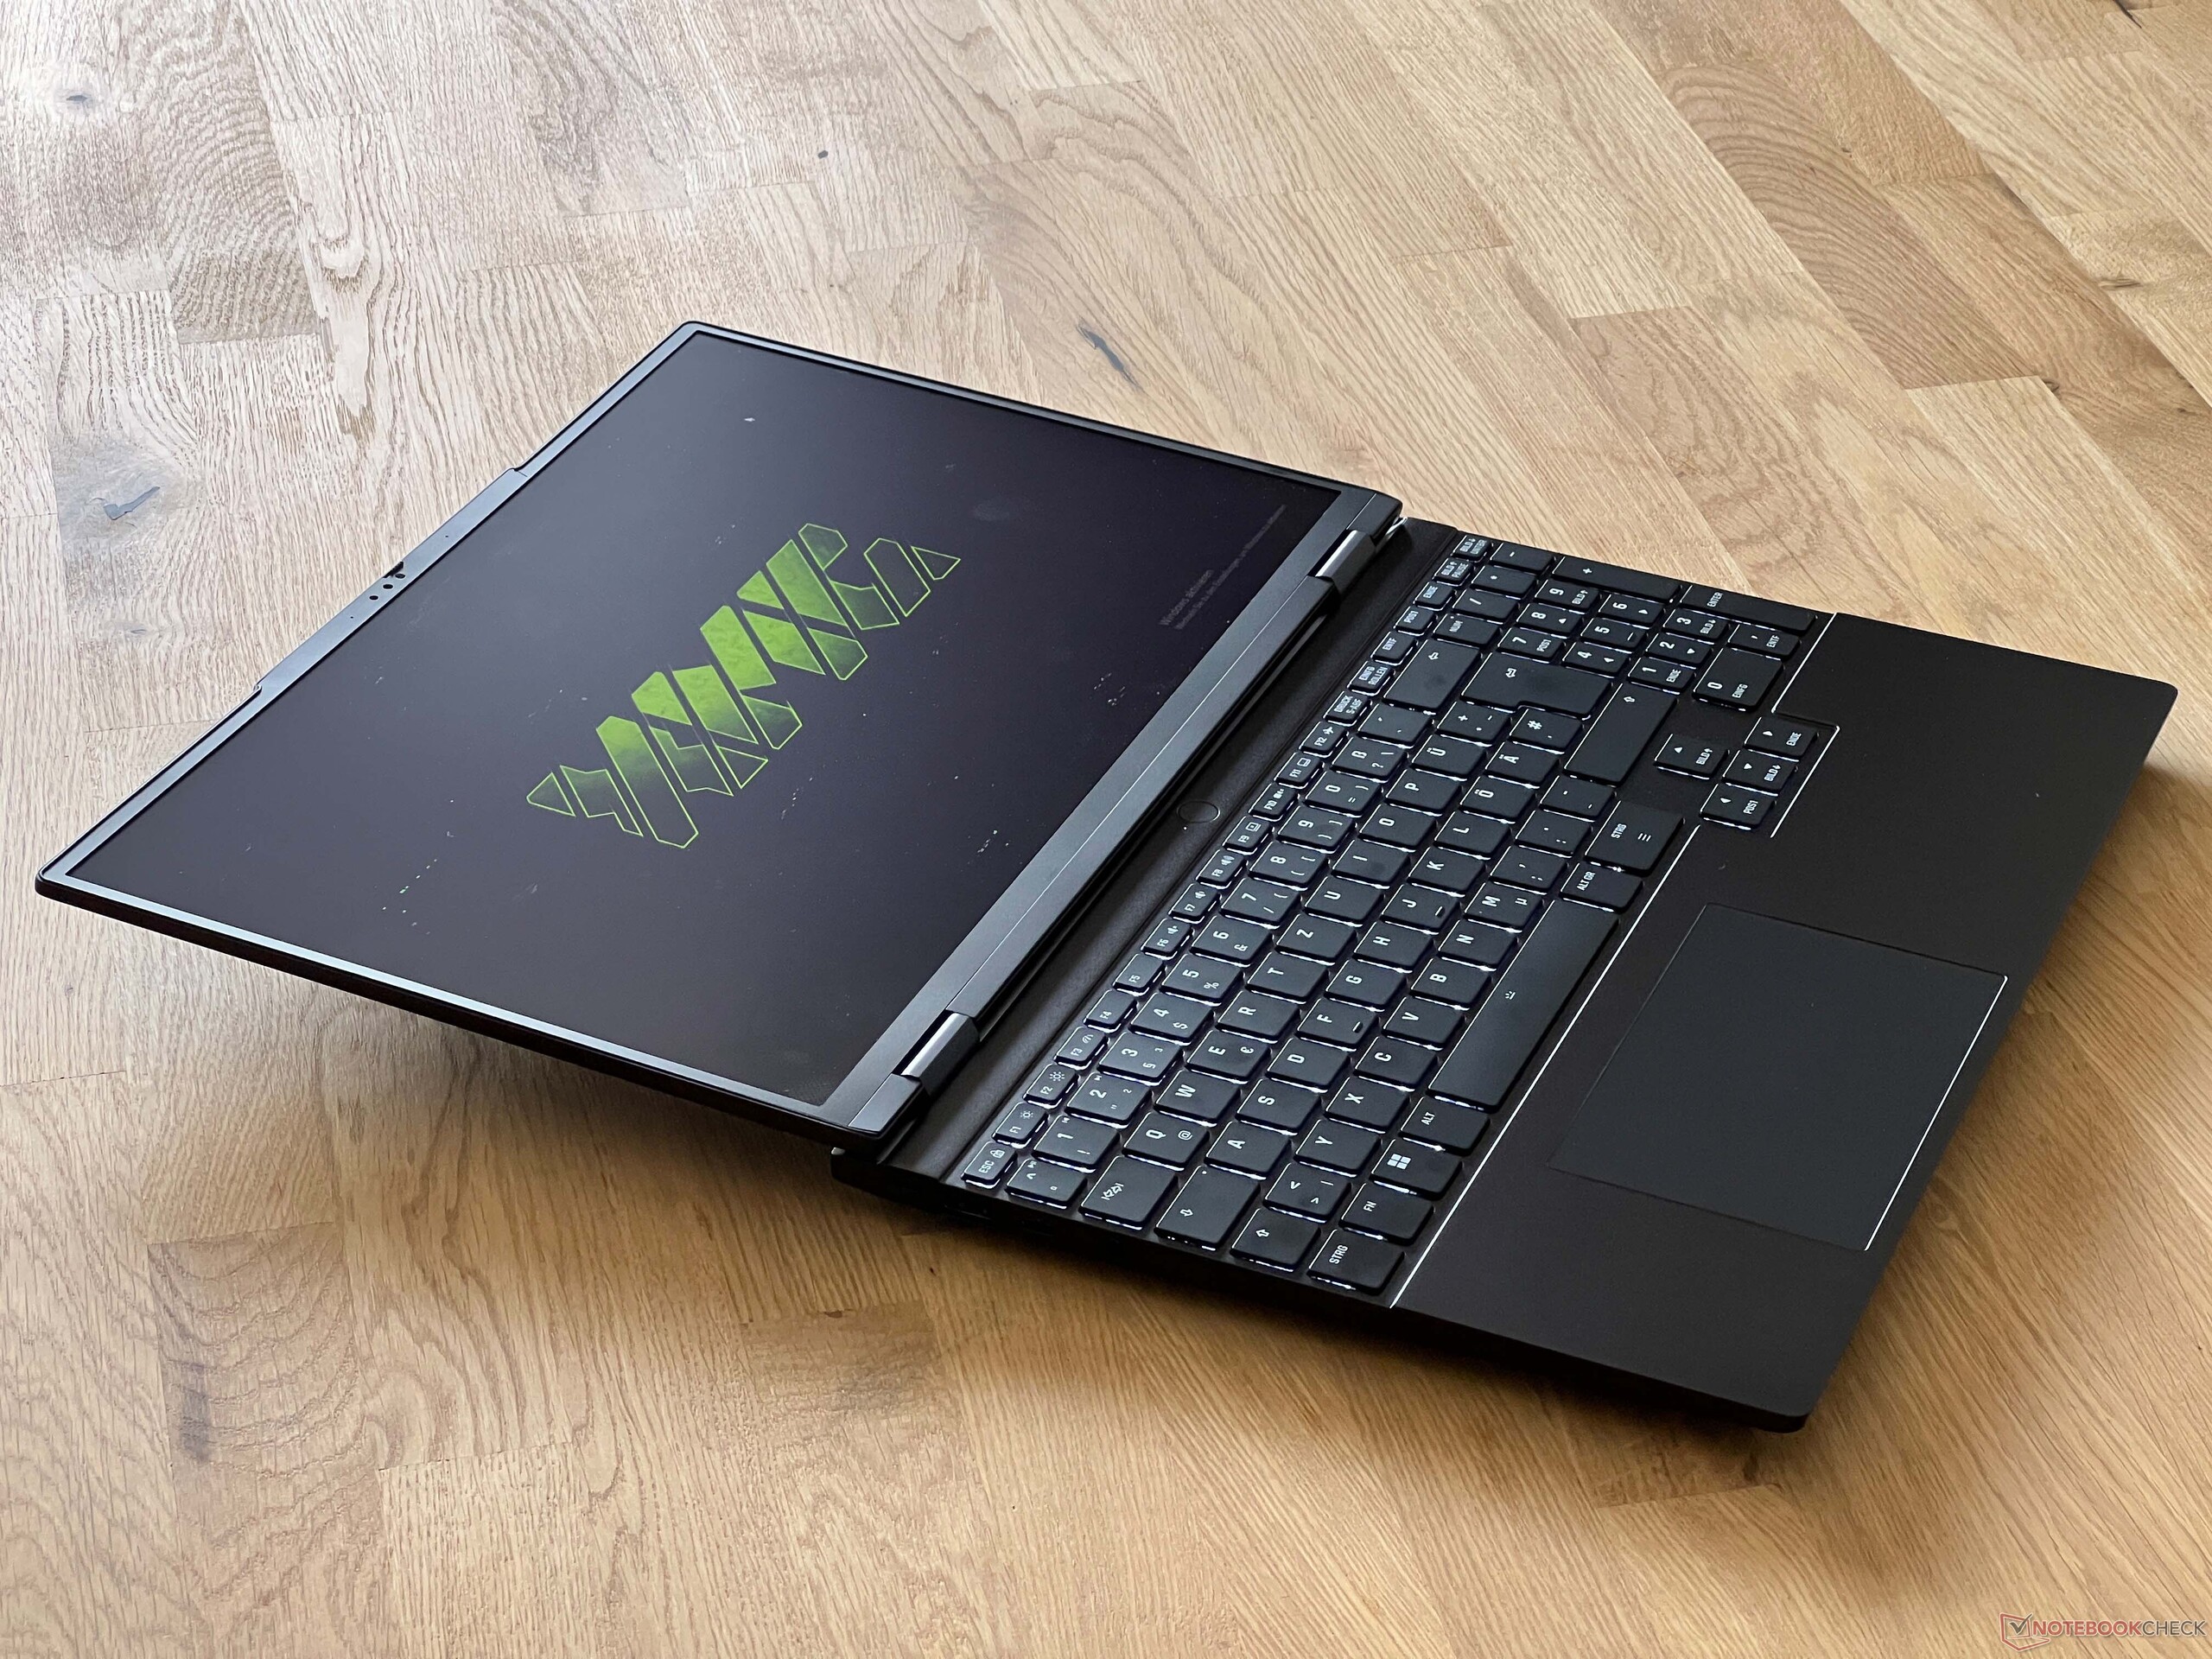
在质量方面,新款 Evo 15 表现出色,因为做工非常好,笔记本电脑整体给人一种高品质的印象。底座非常稳固,只有在中间键盘区域用手敲击时才会有一点凹陷。屏幕盖也很稳定,我们无法看到任何图像变形。最大打开角度为 180 度,铰链将屏幕稳稳地固定在原位,除了有轻微的弹跳外,单手打开也没有任何问题,这要归功于轻微的摄像头驼峰。

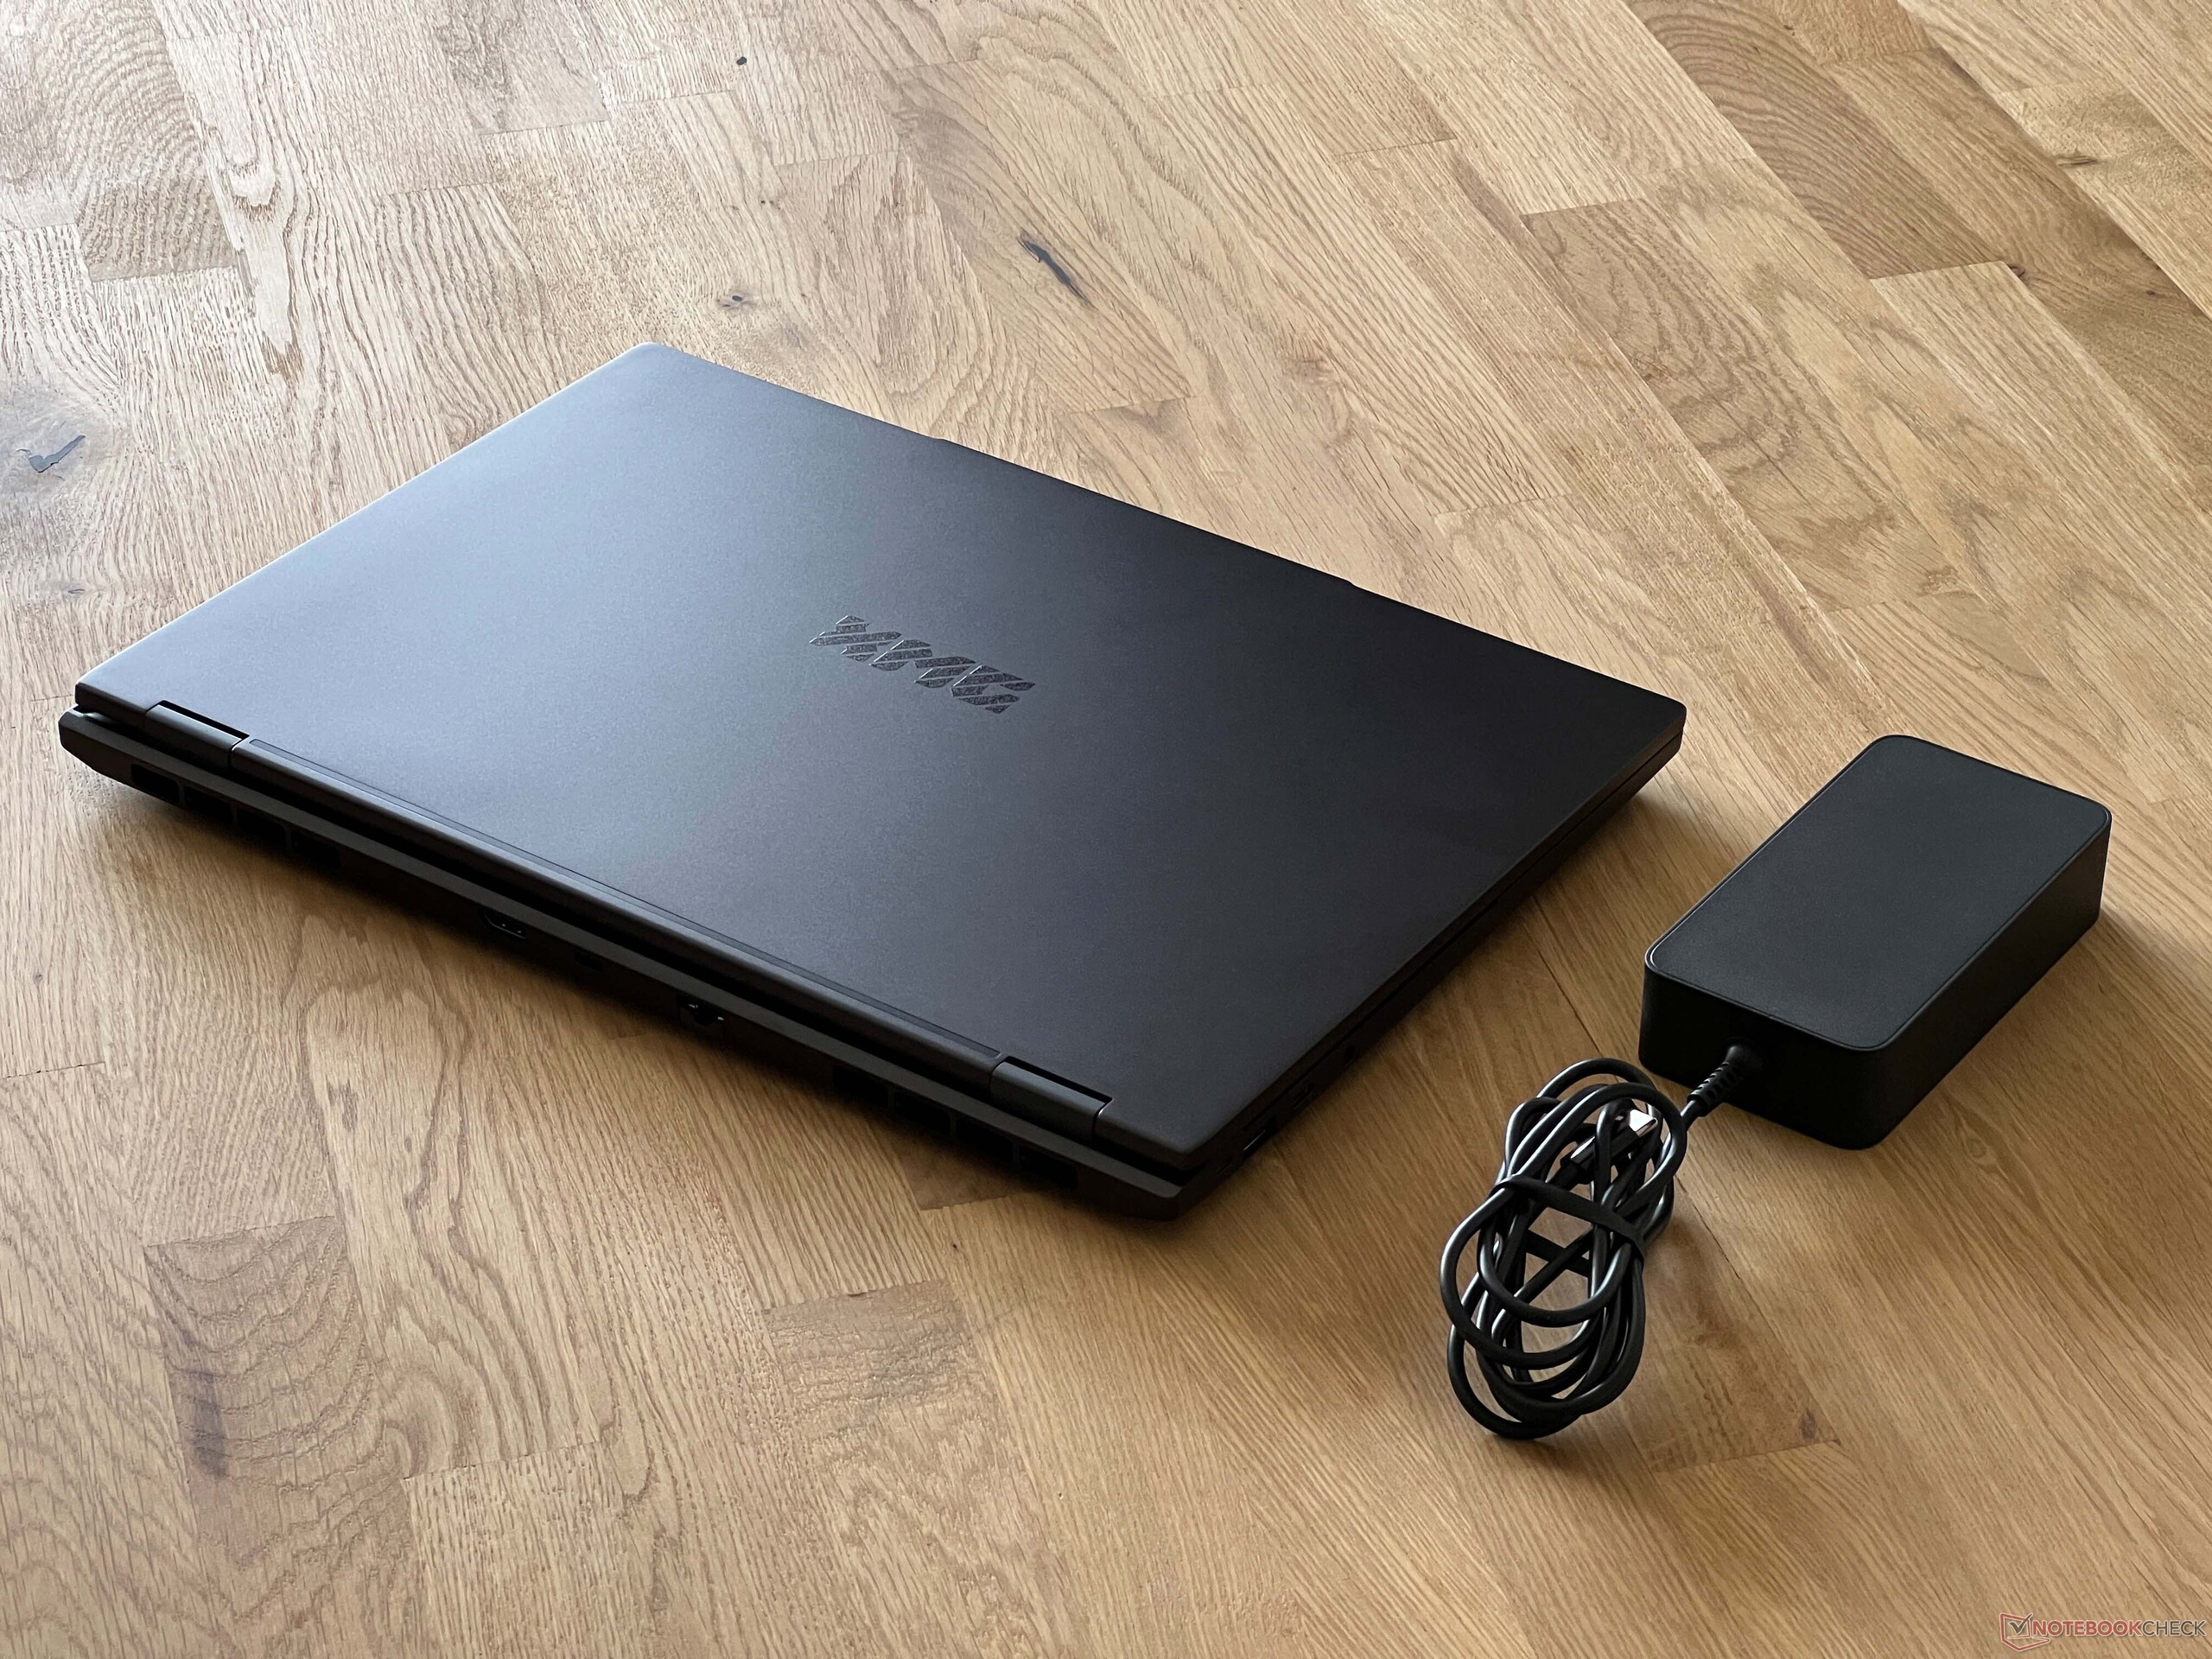
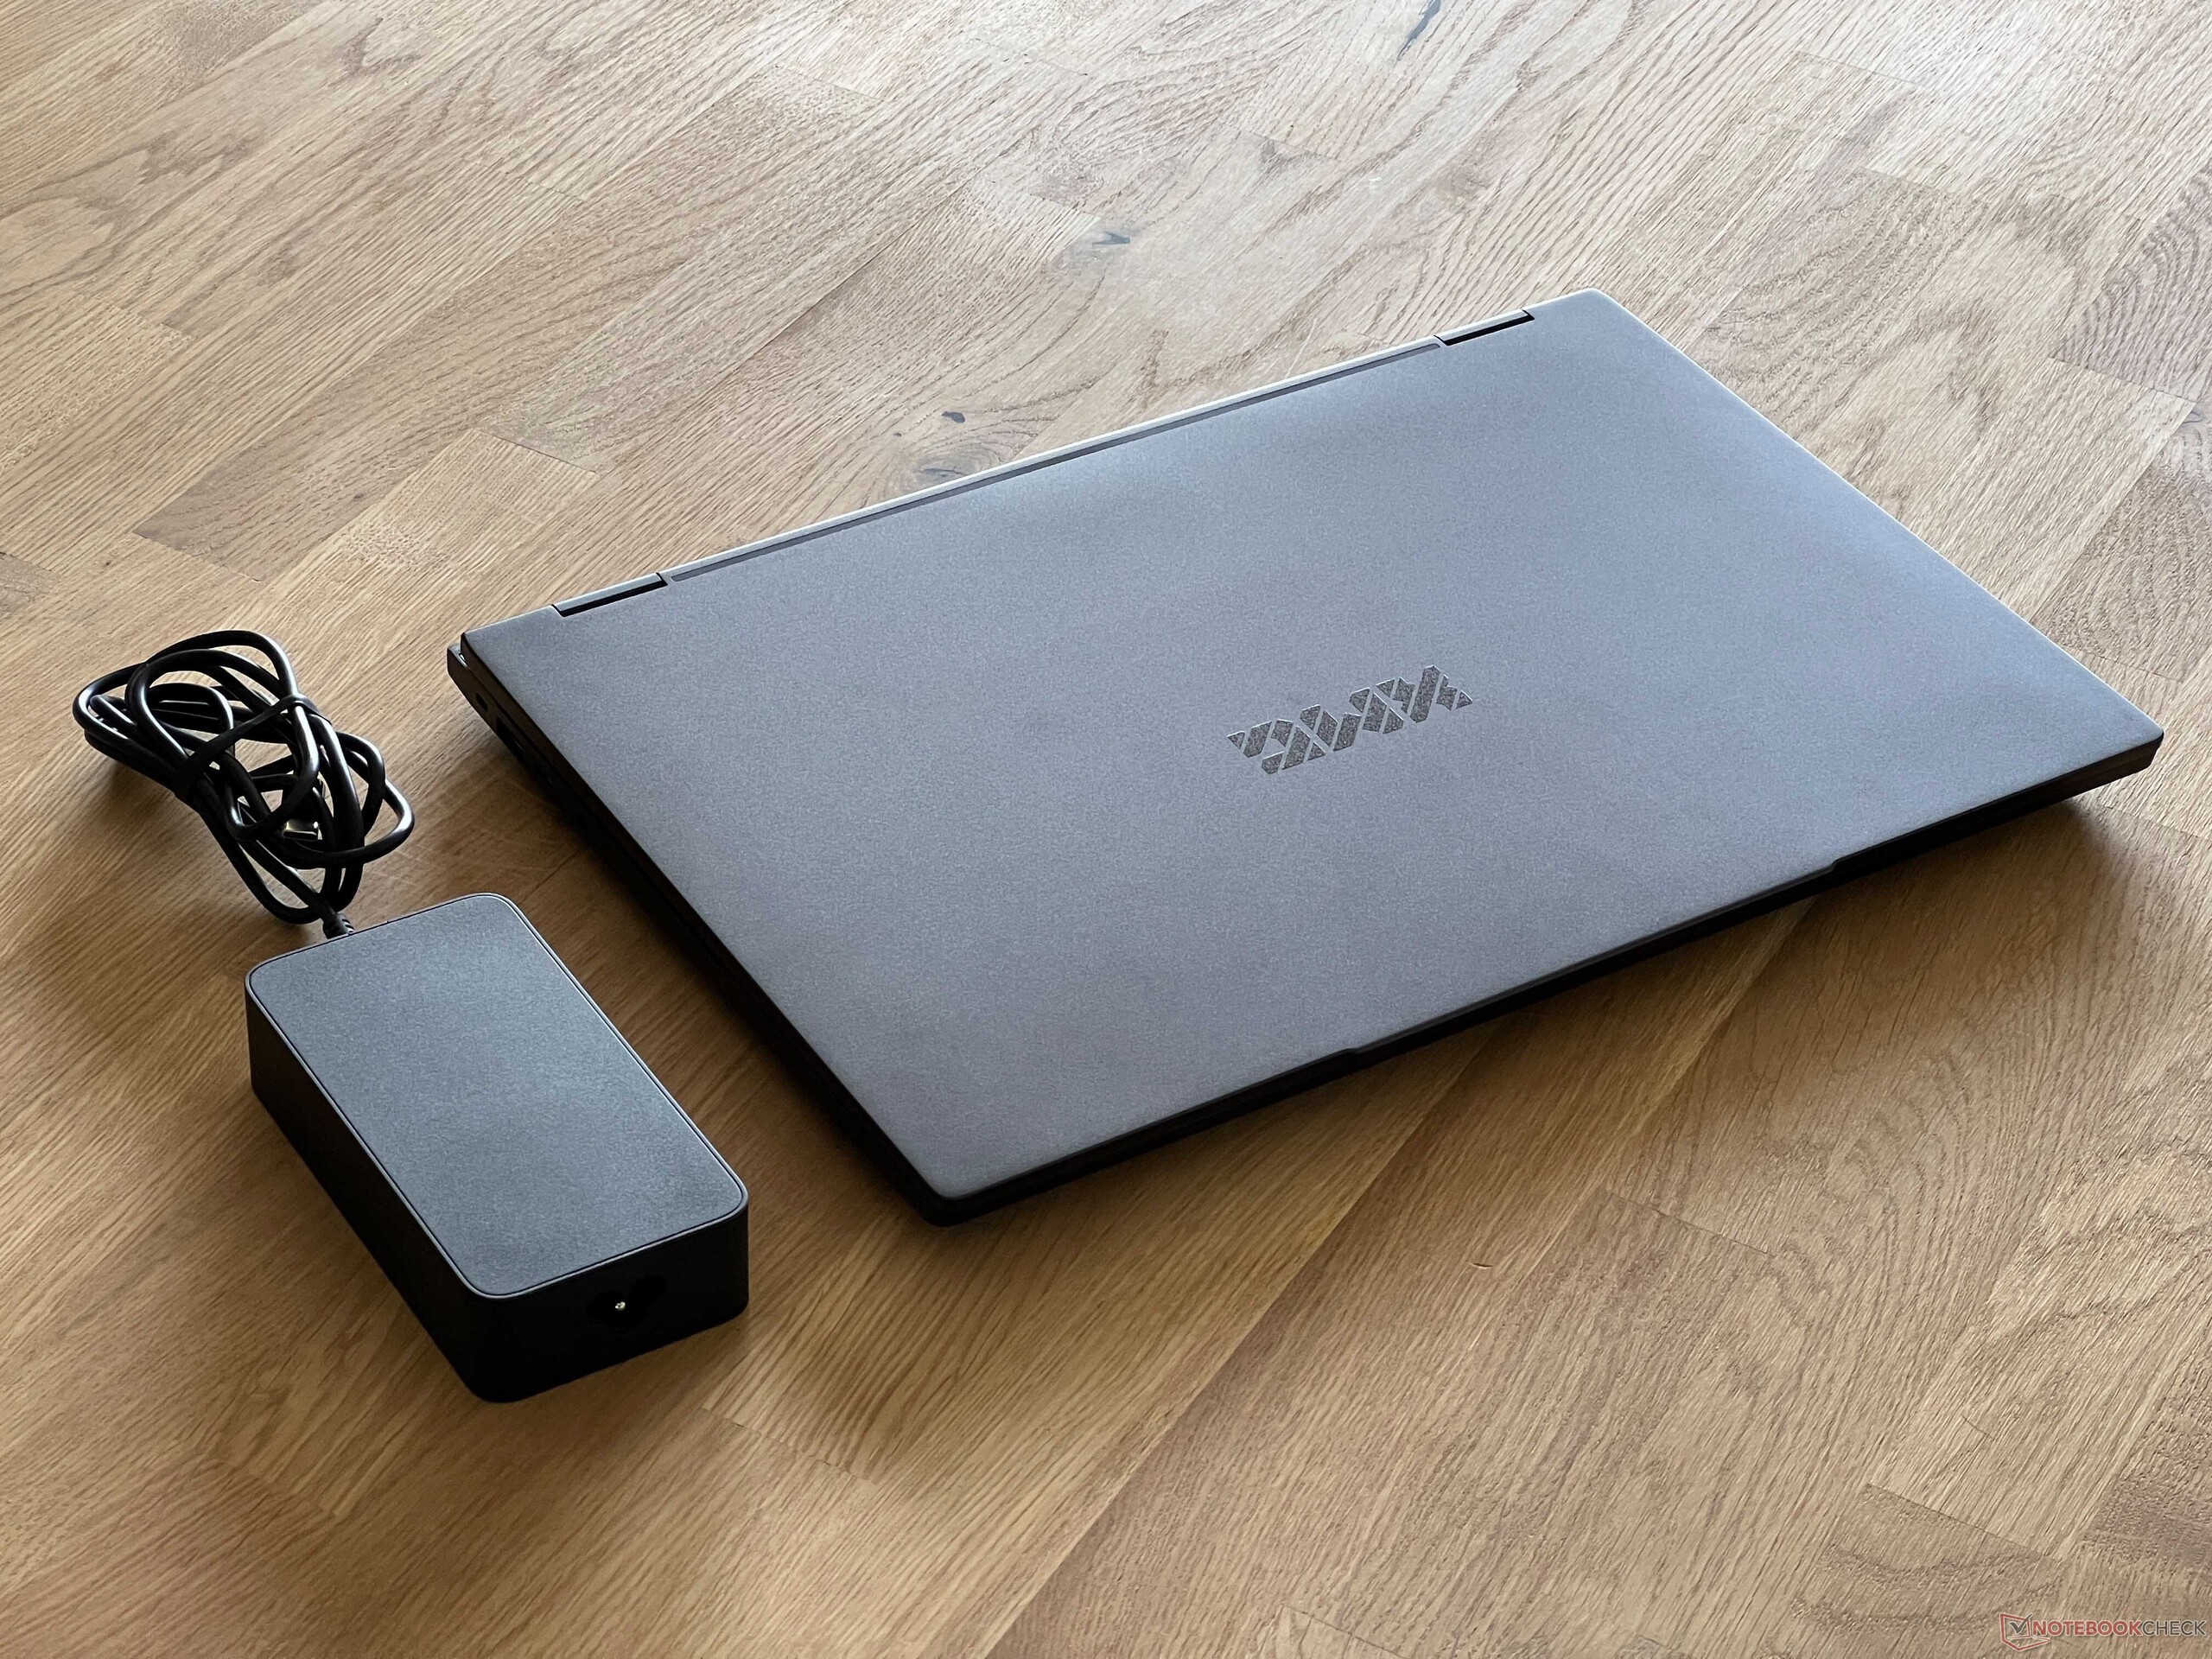
Evo 15 厚度约为 2 厘米,并不是最薄的笔记本,但也不追求最薄。不过,与同类 16 英寸笔记本相比,它的占地面积明显更小。Evo 15 的重量约为 1.7 千克,在我们的对比中也是较轻的机型之一。100 瓦的电源重量为 513 克,但这包括了长长的电源线(1.8 + 1.5 米)。
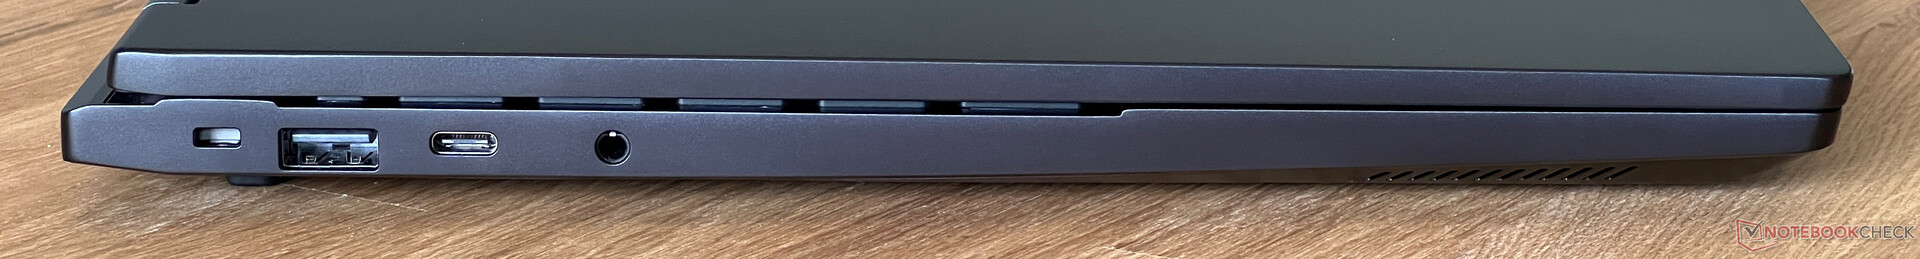
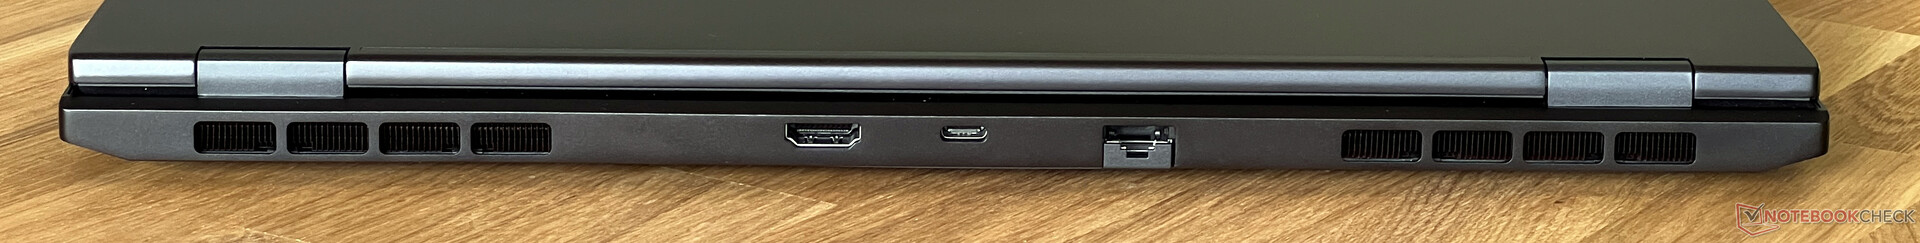
功能 - 雷电 4 和 USB 2.0
端口分布在后侧的两个区域和后部。原则上,包括 Thunderbolt 4(或 AMD 机型上的 USB 4.0)在内的所有现代标准都可用,USB 端口也很充足,但我们不知道 USB 2.0 端口在现代笔记本电脑上有什么用。至少只有一个,另外两个符合 USB 3.2 Gen1 标准。
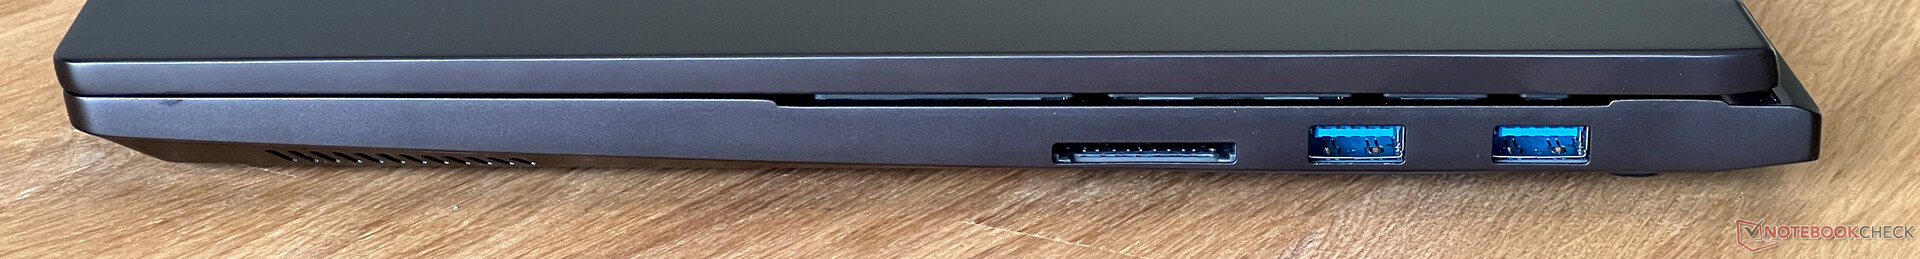
SD 读卡器
与我们的参考卡(Angelbird AV Pro V60)配合使用时,这款功能齐全的 SD 读卡器的传输速率高达 90 MB/s,复制数据时的传输速率约为 50 MB/s。总体而言,这些结果略低于平均水平。
| SD Card Reader | |
| average JPG Copy Test (av. of 3 runs) | |
| SCHENKER XMG Evo 15 (M24) (ADATA V90) | |
| SCHENKER XMG Evo 15 (M24) (Angelbird AV Pro V60) | |
| Average of class Multimedia (18.4 - 201, n=56, last 2 years) | |
| Lenovo IdeaPad Pro 5 16IMH G9 (Angelbird AV Pro V60) | |
| Dell Inspiron 16 7640 2-in-1 (Toshiba Exceria Pro SDXC 64 GB UHS-II) | |
| maximum AS SSD Seq Read Test (1GB) | |
| SCHENKER XMG Evo 15 (M24) (ADATA V90) | |
| SCHENKER XMG Evo 15 (M24) (Angelbird AV Pro V60) | |
| Average of class Multimedia (25.8 - 266, n=56, last 2 years) | |
| Lenovo IdeaPad Pro 5 16IMH G9 (Angelbird AV Pro V60) | |
| Dell Inspiron 16 7640 2-in-1 (Toshiba Exceria Pro SDXC 64 GB UHS-II) | |
交流
Evo 15 是少数仍配备 RJ45 千兆网络连接的现代多媒体笔记本之一。英特尔的 AX211 模块也可用于无线网络(Wi-Fi 6E)。与华硕的参考路由器配合使用,传输速率良好,测试期间 Wi-Fi 信号也没有问题。
| Networking | |
| SCHENKER XMG Evo 15 (M24) | |
| iperf3 transmit AXE11000 | |
| iperf3 receive AXE11000 | |
| Dell Inspiron 16 7640 2-in-1 | |
| iperf3 transmit AXE11000 | |
| iperf3 receive AXE11000 | |
| iperf3 transmit AXE11000 6GHz | |
| iperf3 receive AXE11000 6GHz | |
| Medion S10 OLED | |
| iperf3 transmit AXE11000 | |
| iperf3 receive AXE11000 | |
| Xiaomi RedmiBook Pro 16 2024 | |
| iperf3 transmit AXE11000 | |
| iperf3 receive AXE11000 | |
| Lenovo IdeaPad Pro 5 16IMH G9 | |
| iperf3 transmit AXE11000 | |
| iperf3 receive AXE11000 | |
| Lenovo ThinkPad T16 G2 21K70035GE | |
| iperf3 transmit AXE11000 | |
| iperf3 receive AXE11000 | |
| iperf3 transmit AXE11000 6GHz | |
| iperf3 receive AXE11000 6GHz | |
网络摄像头
屏幕顶部边缘内置了一个带机械快门的 200 万像素摄像头,图像质量一般。还支持 Microsoft Studio 特效,额外的红外摄像头可通过 Windows Hello 进行面部识别。

 Arc 8-Core, Ultra 7 155H, Samsung 990 Pro 1 TB")
 Arc 8-Core, Ultra 7 155H, Samsung 990 Pro 1 TB")
配件
除了 100 瓦的电源装置外,供货范围还包括一个带驱动程序的 USB 盘和一个大号织物 XMG 鼠标垫。
维护
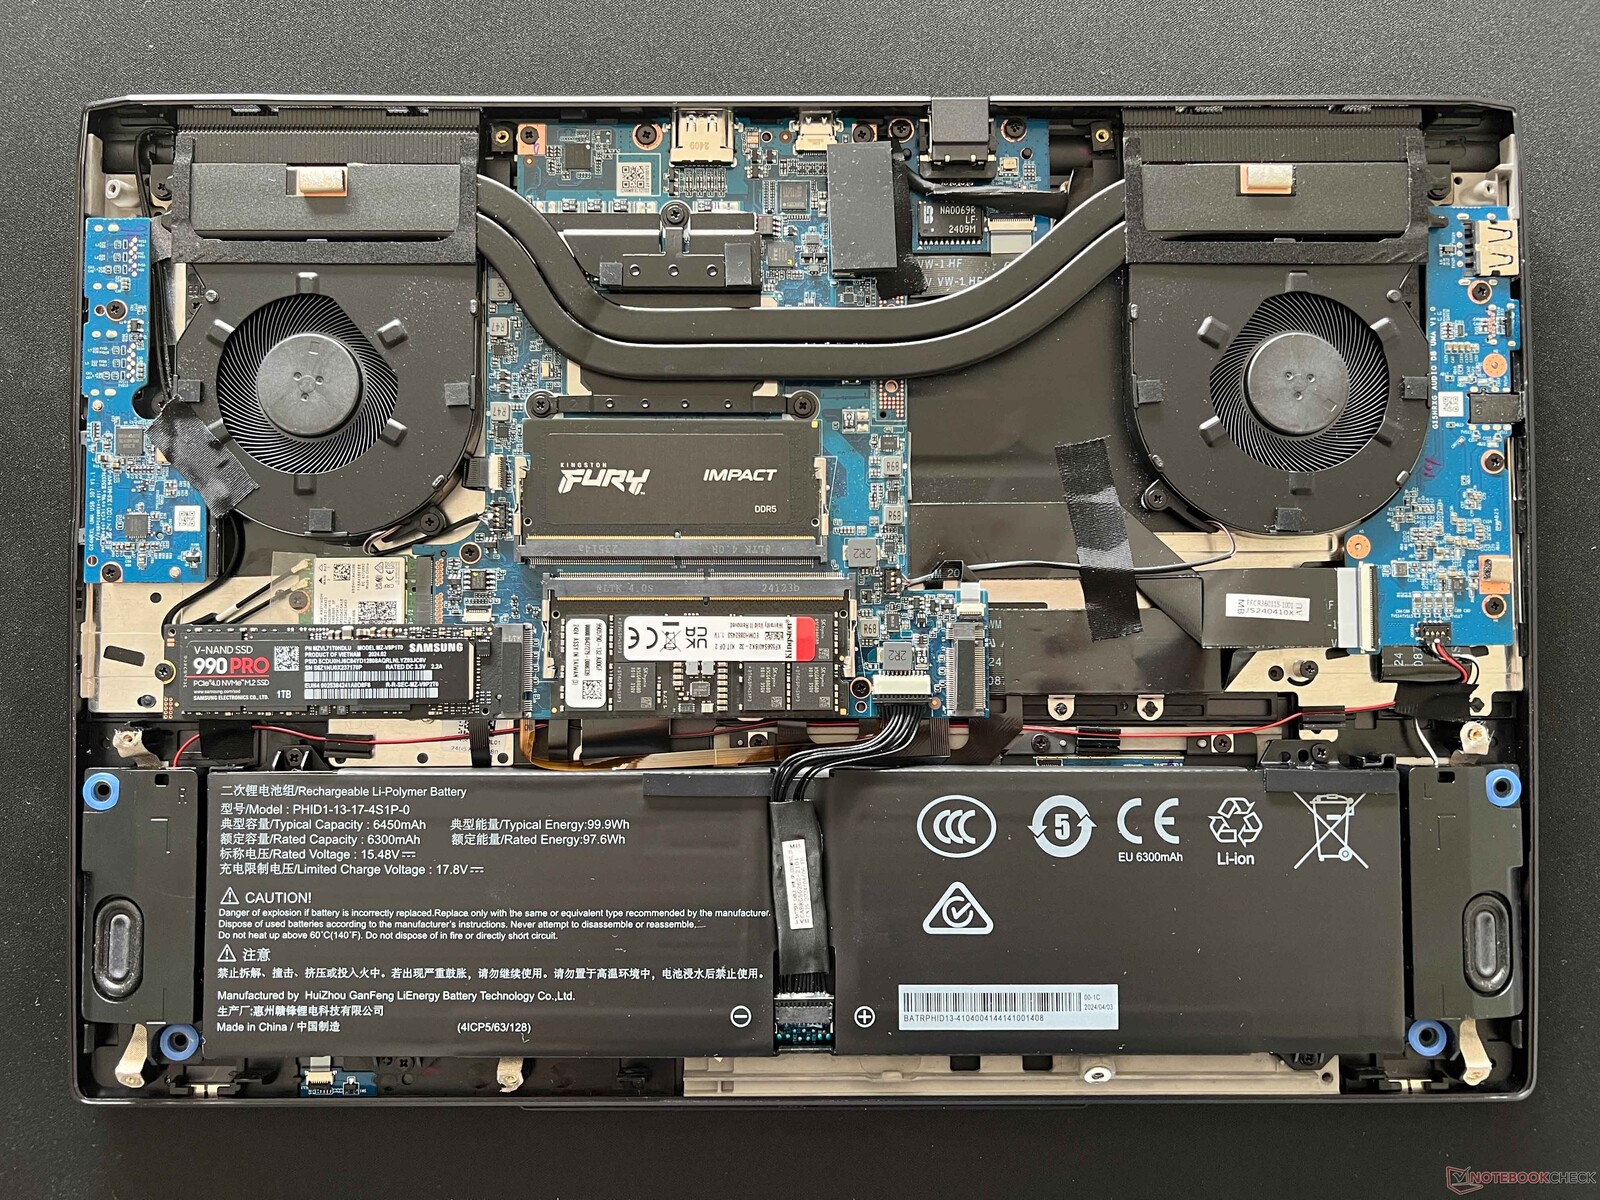
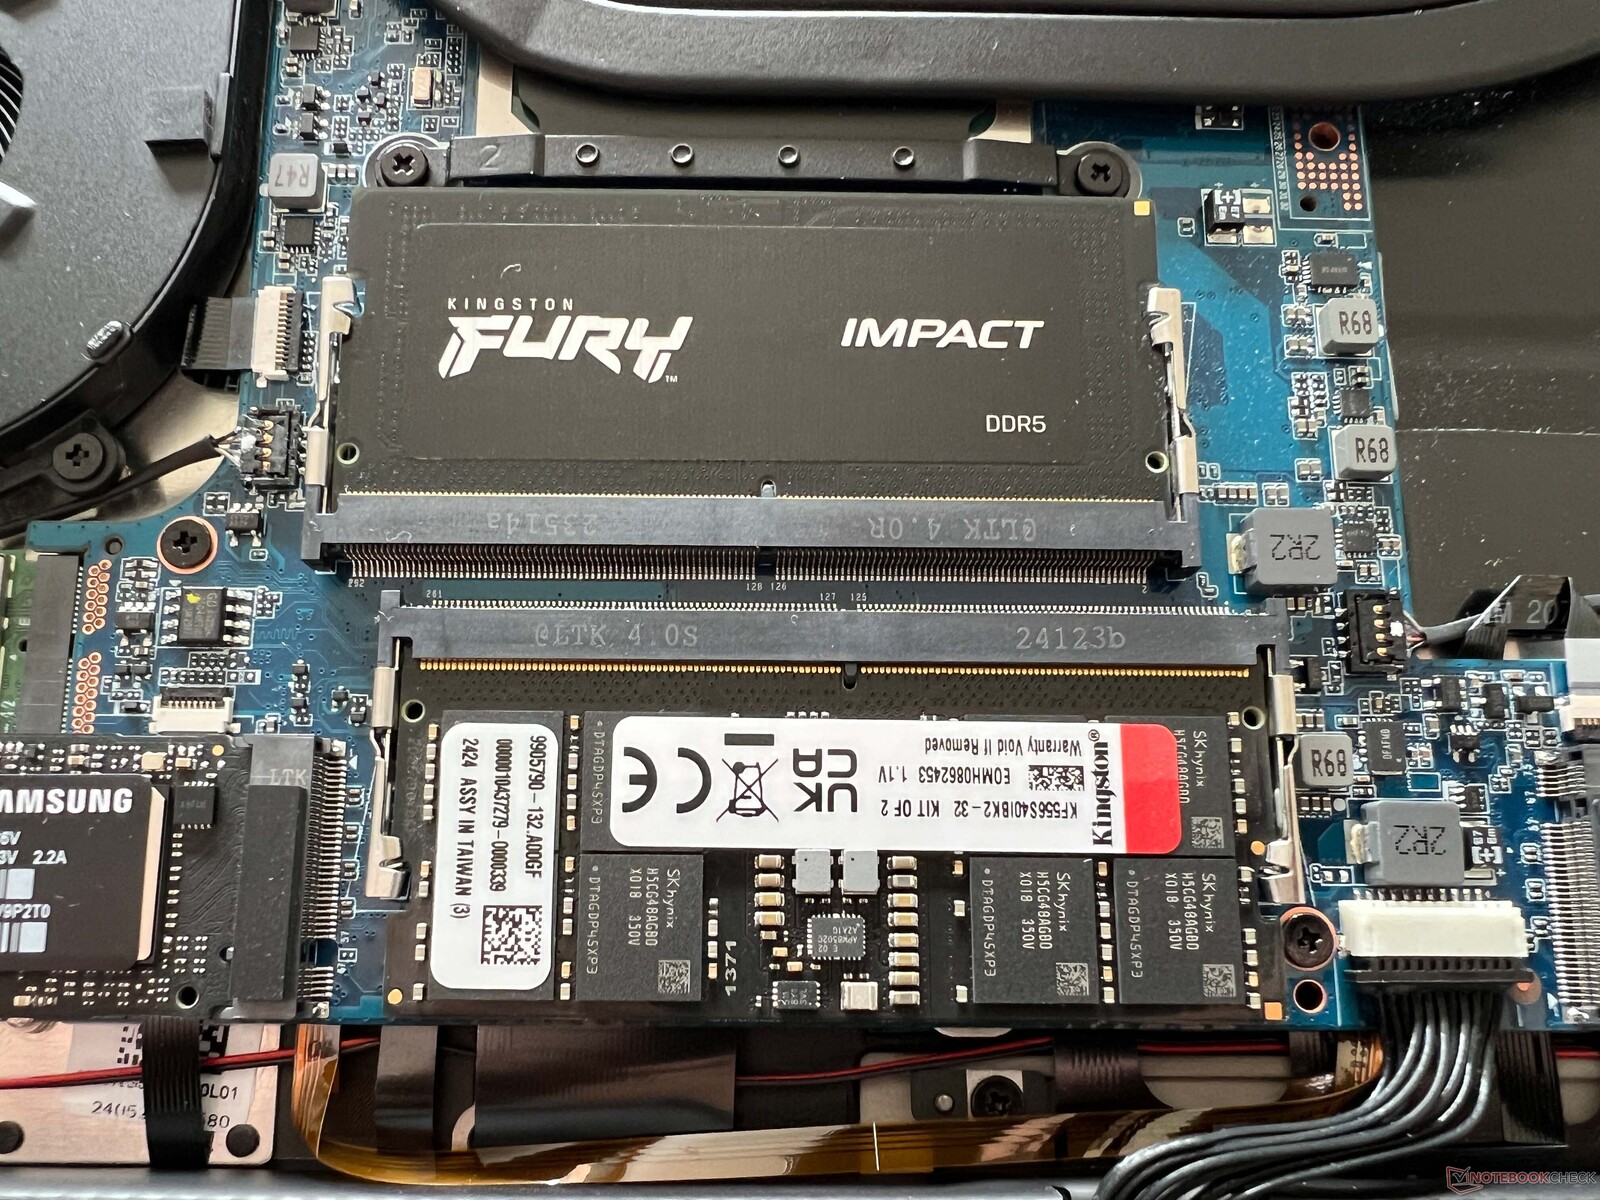
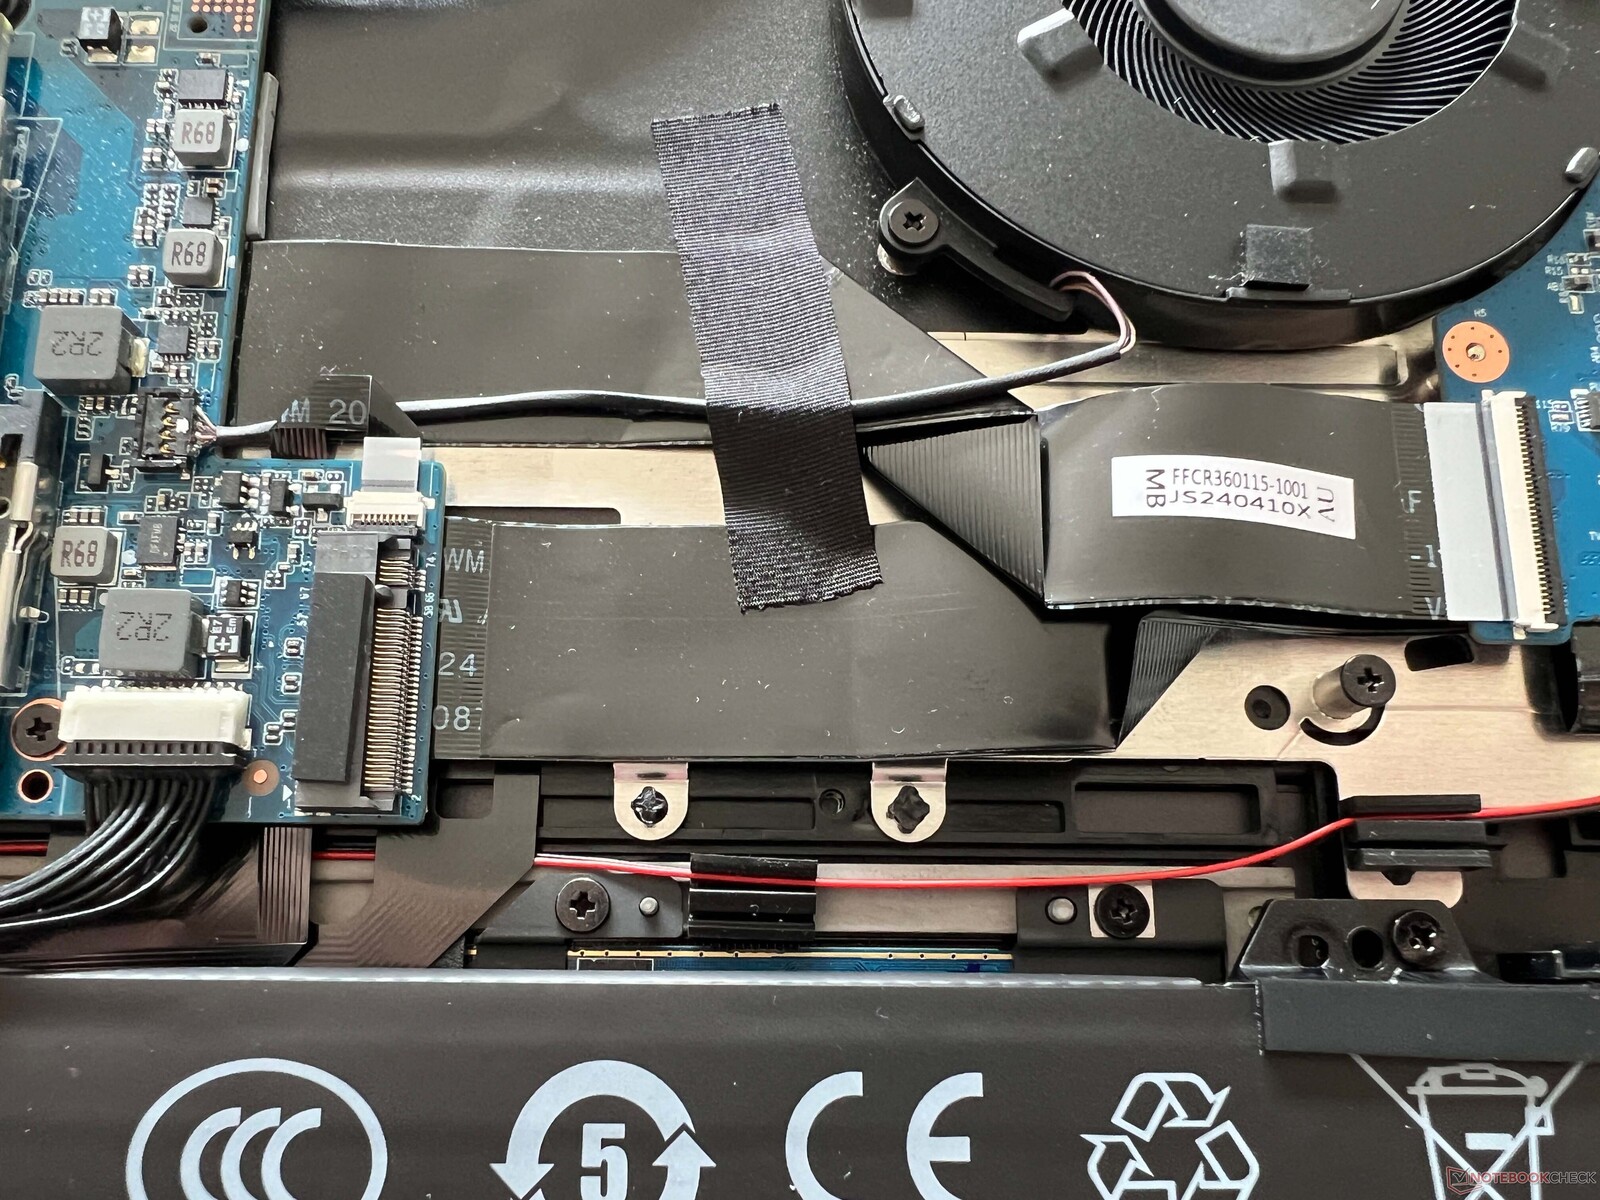
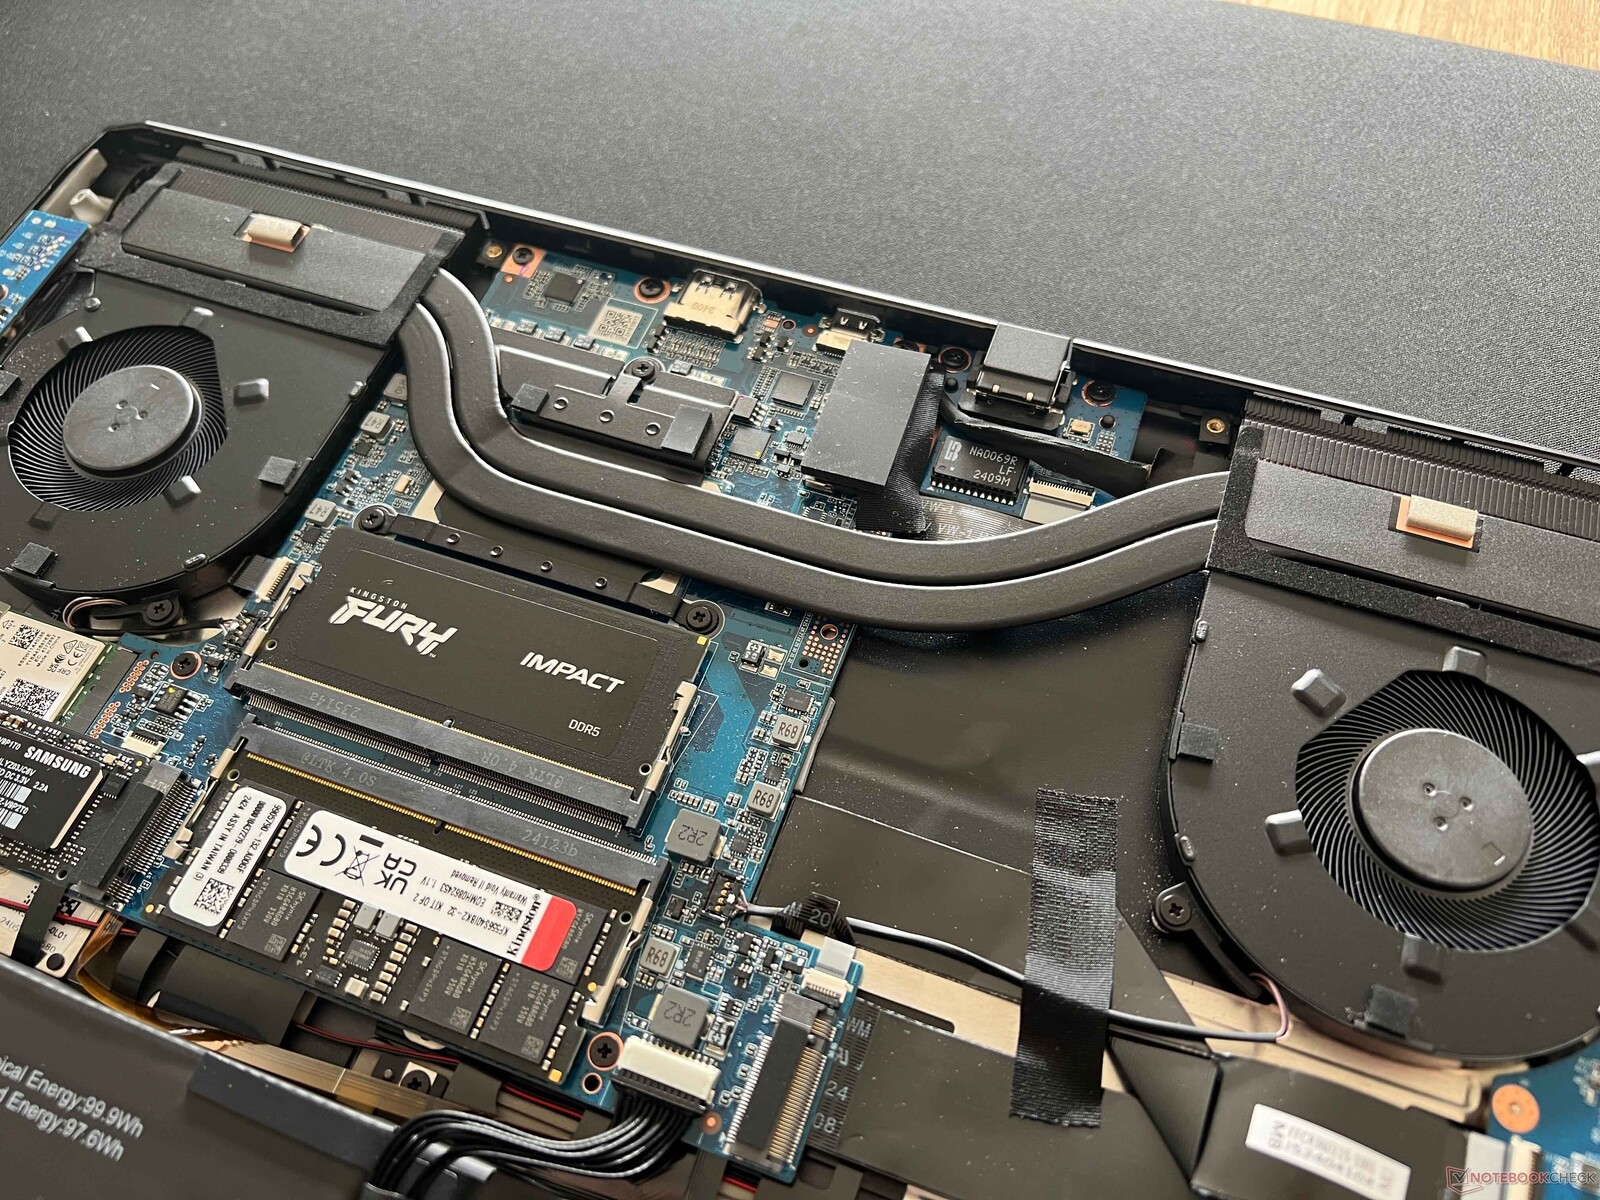
现在我们来看看 Evo 15 的亮点--维护选项。取下底盖(用普通十字螺丝固定)后,就可以接触到风扇和螺丝固定的电池,以及两个用于内存的 SO-DIMM 插槽和两个 M.2 2280 SSD 插槽,因此升级易如反掌。如有必要,还可以更换 WLAN 模块。
可持续性
全球国际货运公司(Schenker)的产品页面上没有任何关于笔记本电脑生产过程中产生的二氧化碳排放量的信息。包装主要由纸板和塑料制成。关于功耗,我们稍后再谈,但 1.4 瓦的待机功耗太高了。
输入设备 - 带数字键盘的大键盘
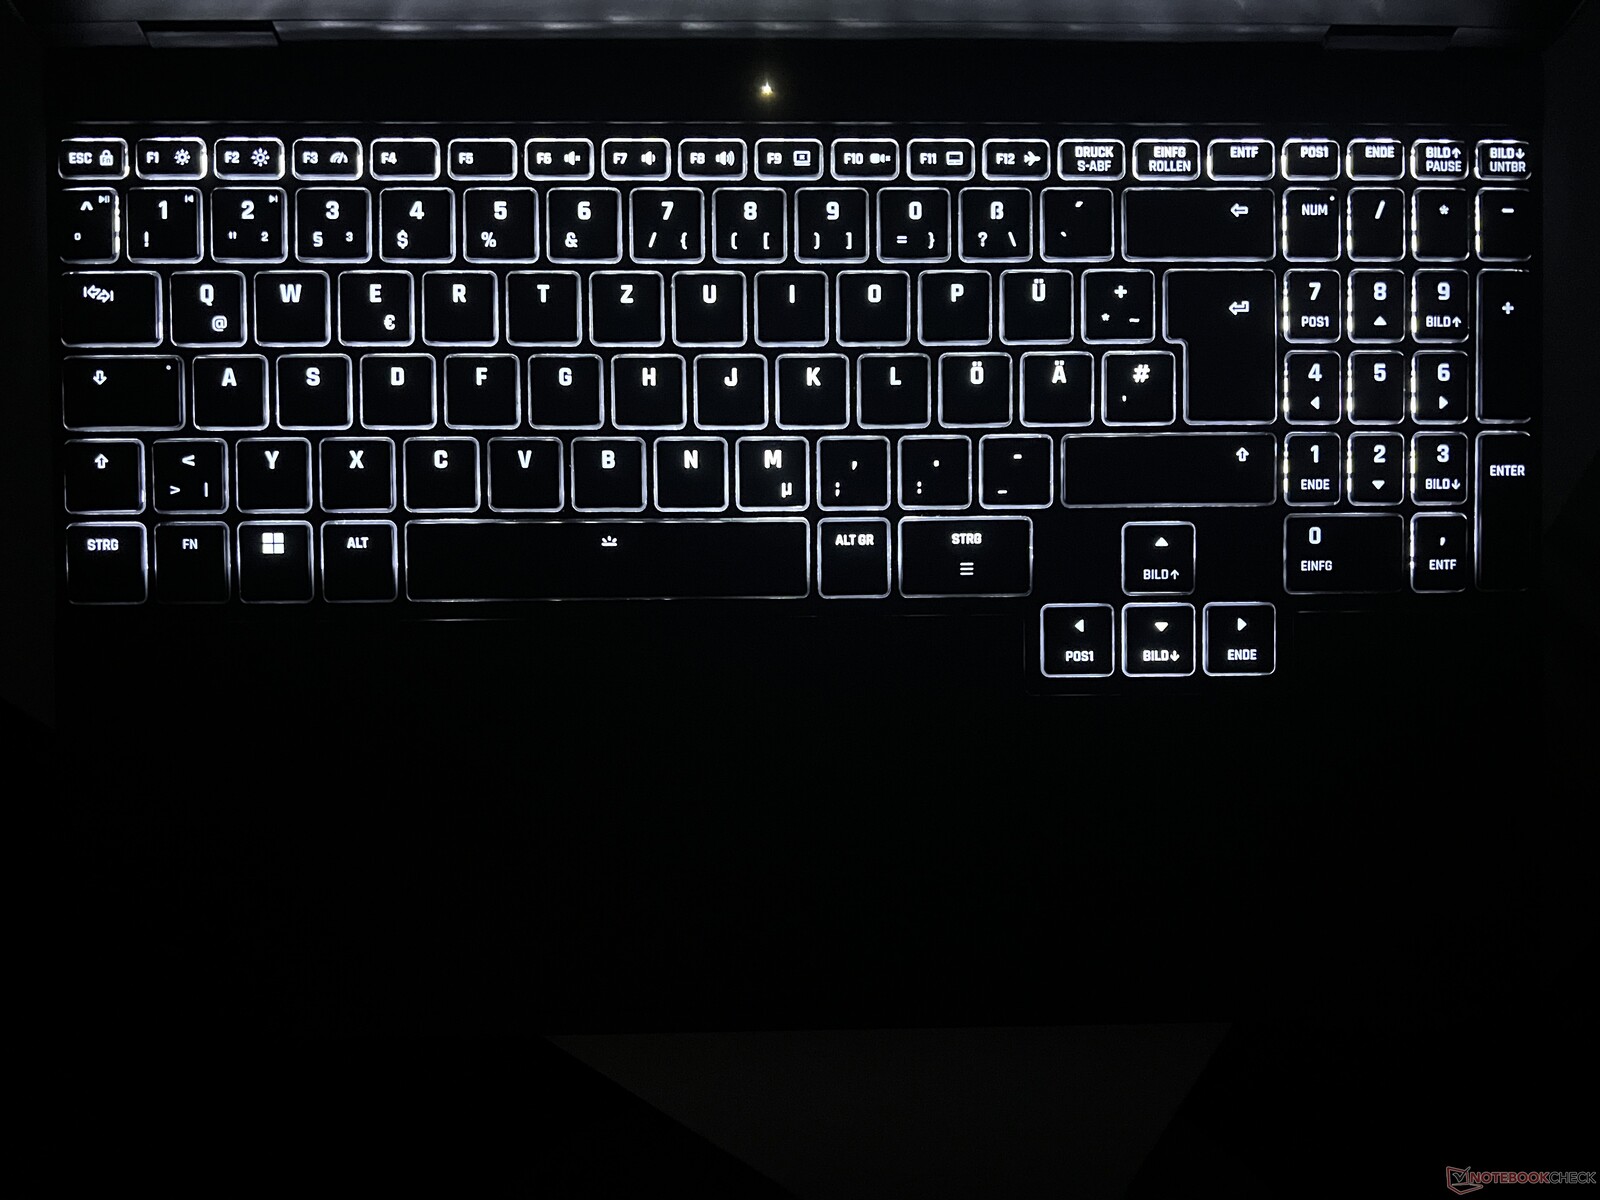
键盘占据了整个底座的宽度,还提供了一个专用数字小键盘,不过这些键的尺寸略小。不过,方向键的尺寸并没有缩小。整体输入体验非常舒适,即使是长篇文字也不成问题,尽管像 ThinkPad T16等商务笔记本电脑在这方面仍有优势。此外,特别是较大的按键声音较大,感觉有些摇晃。根据对客户的调查,全球国际货运公司决定不安装专用的副驾驶键。白色背光目前提供两个强度级别,但不久将发布更新,届时将提供四个强度级别。
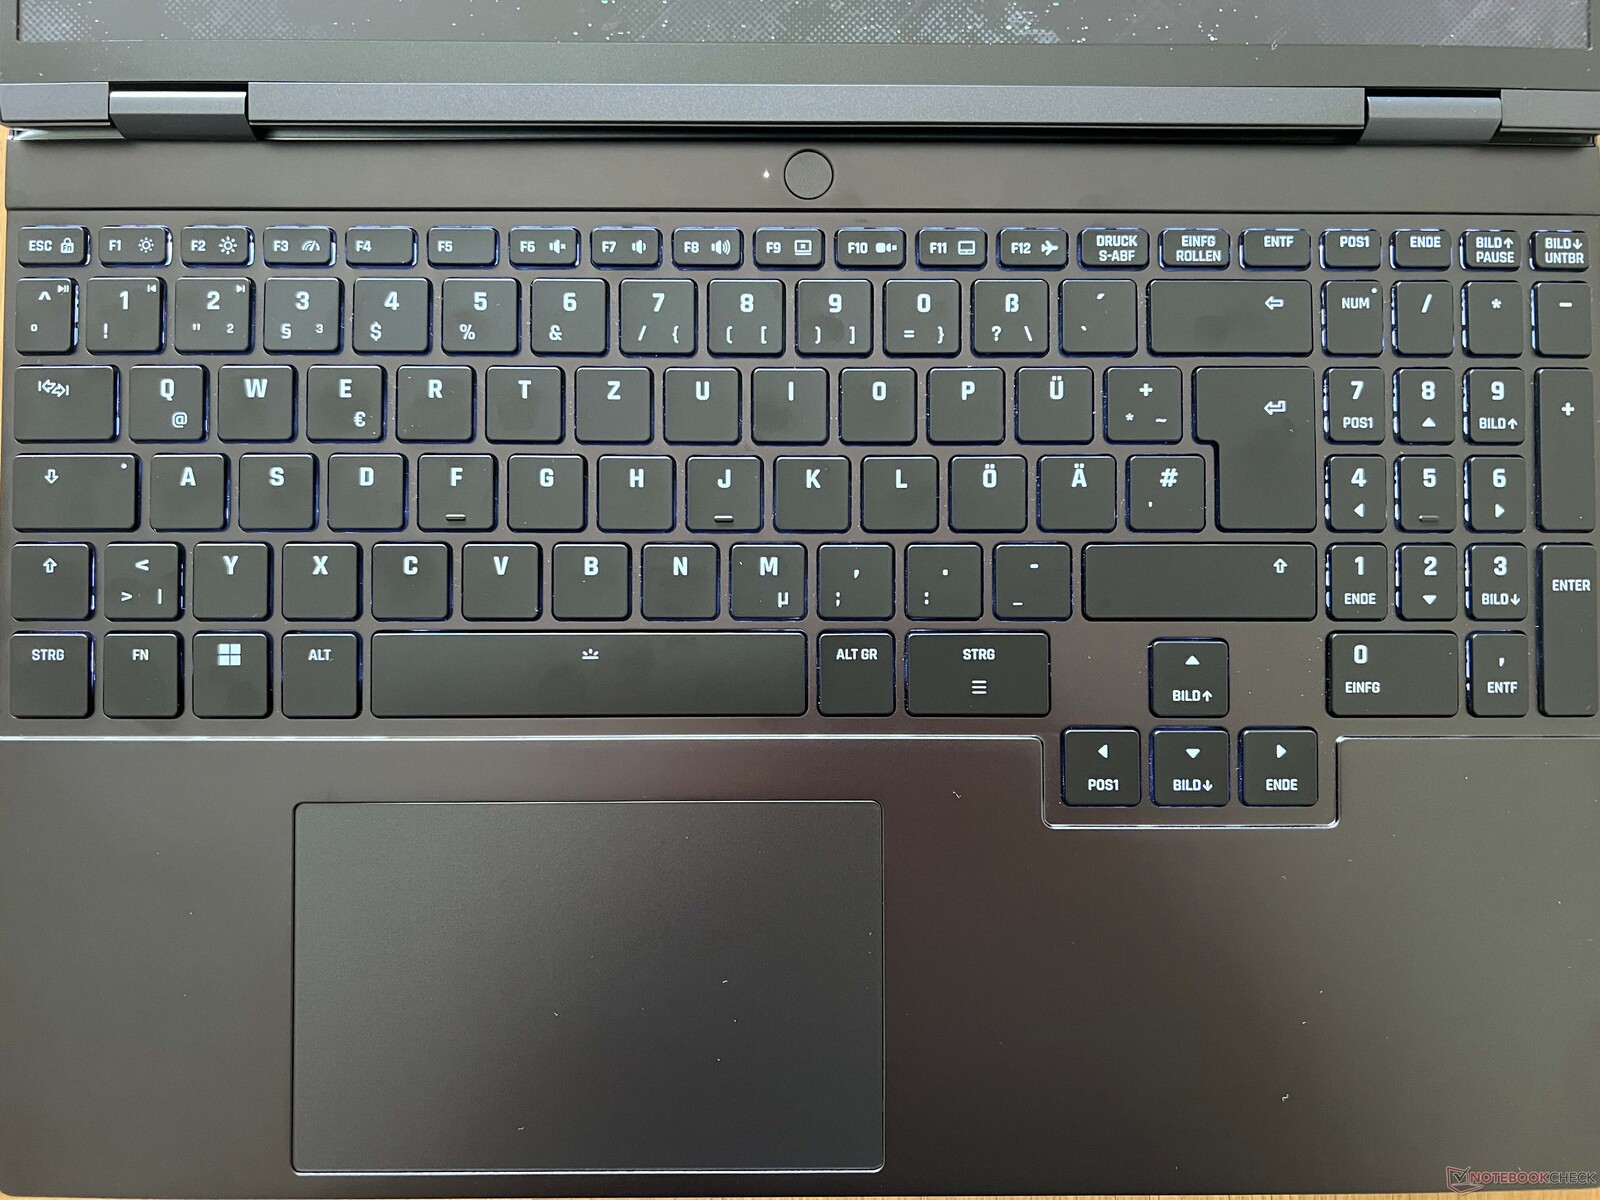
ClickPad 的尺寸为 12.3 x 7.7 厘米,为输入和指针控制提供了足够的空间,但明显偏左,这需要一些时间来适应。单击板可以在下部区域单击,但这样会产生响亮而廉价的声音。
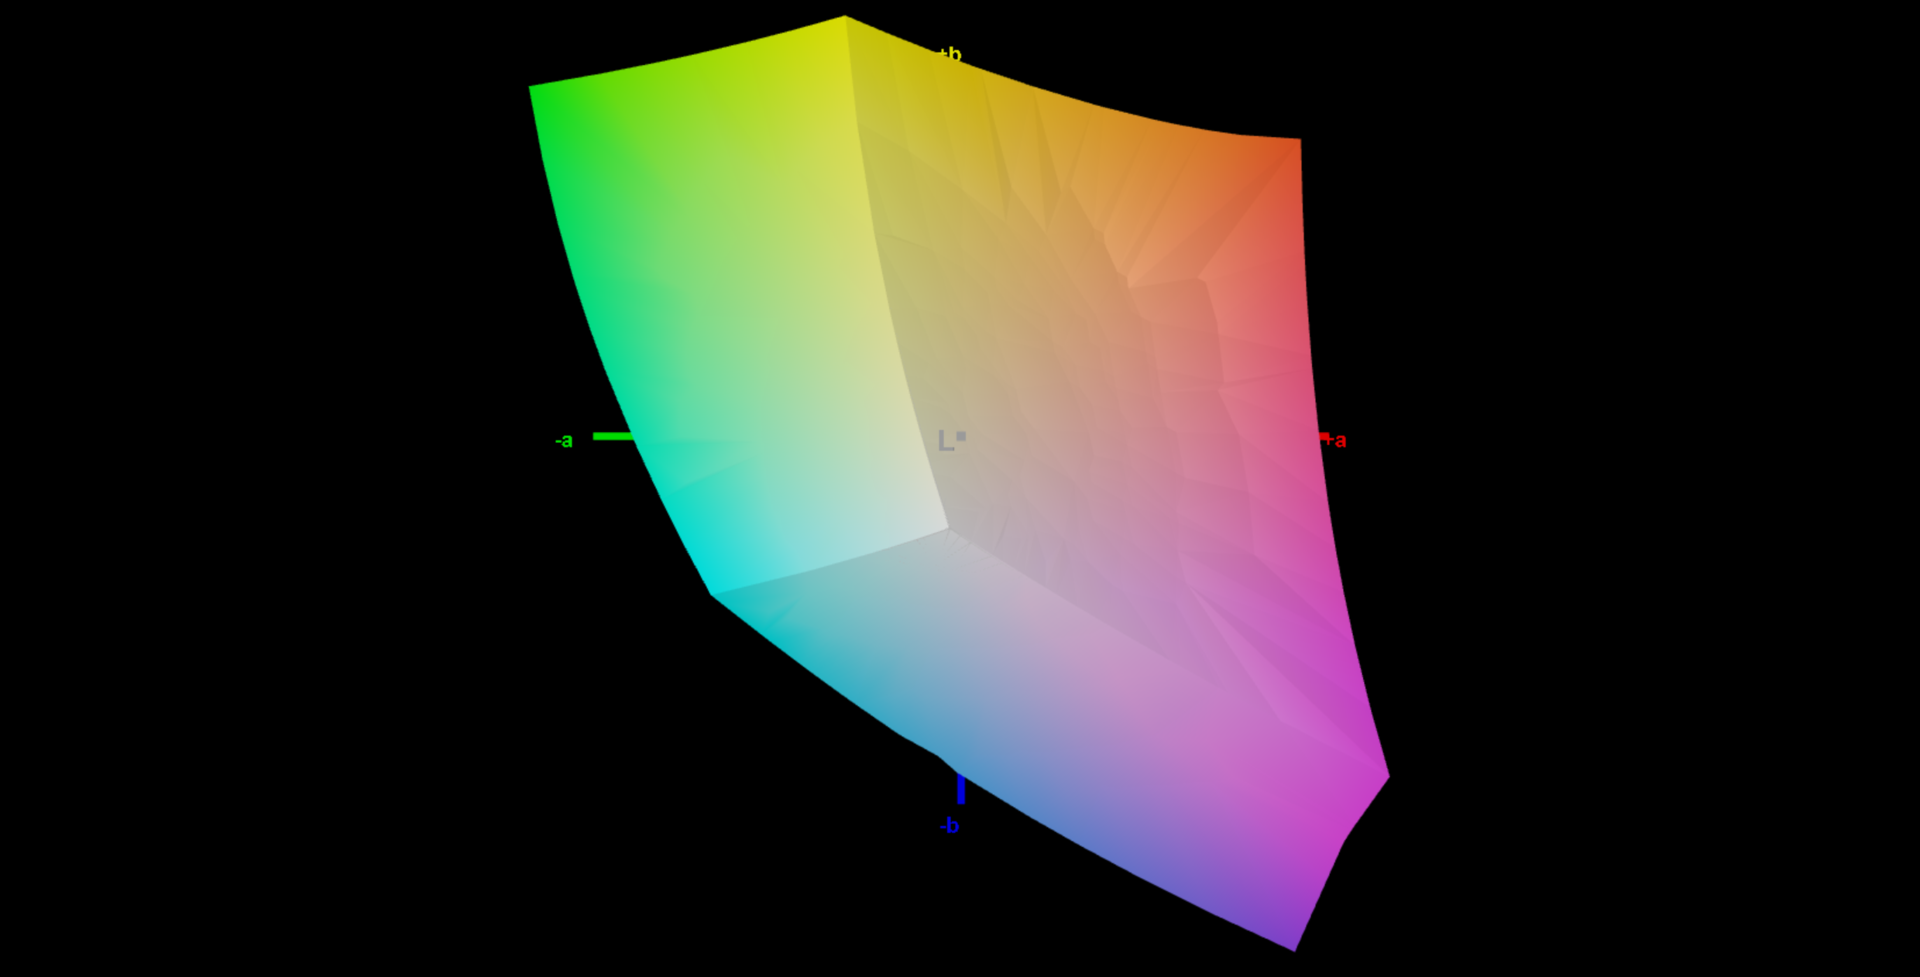
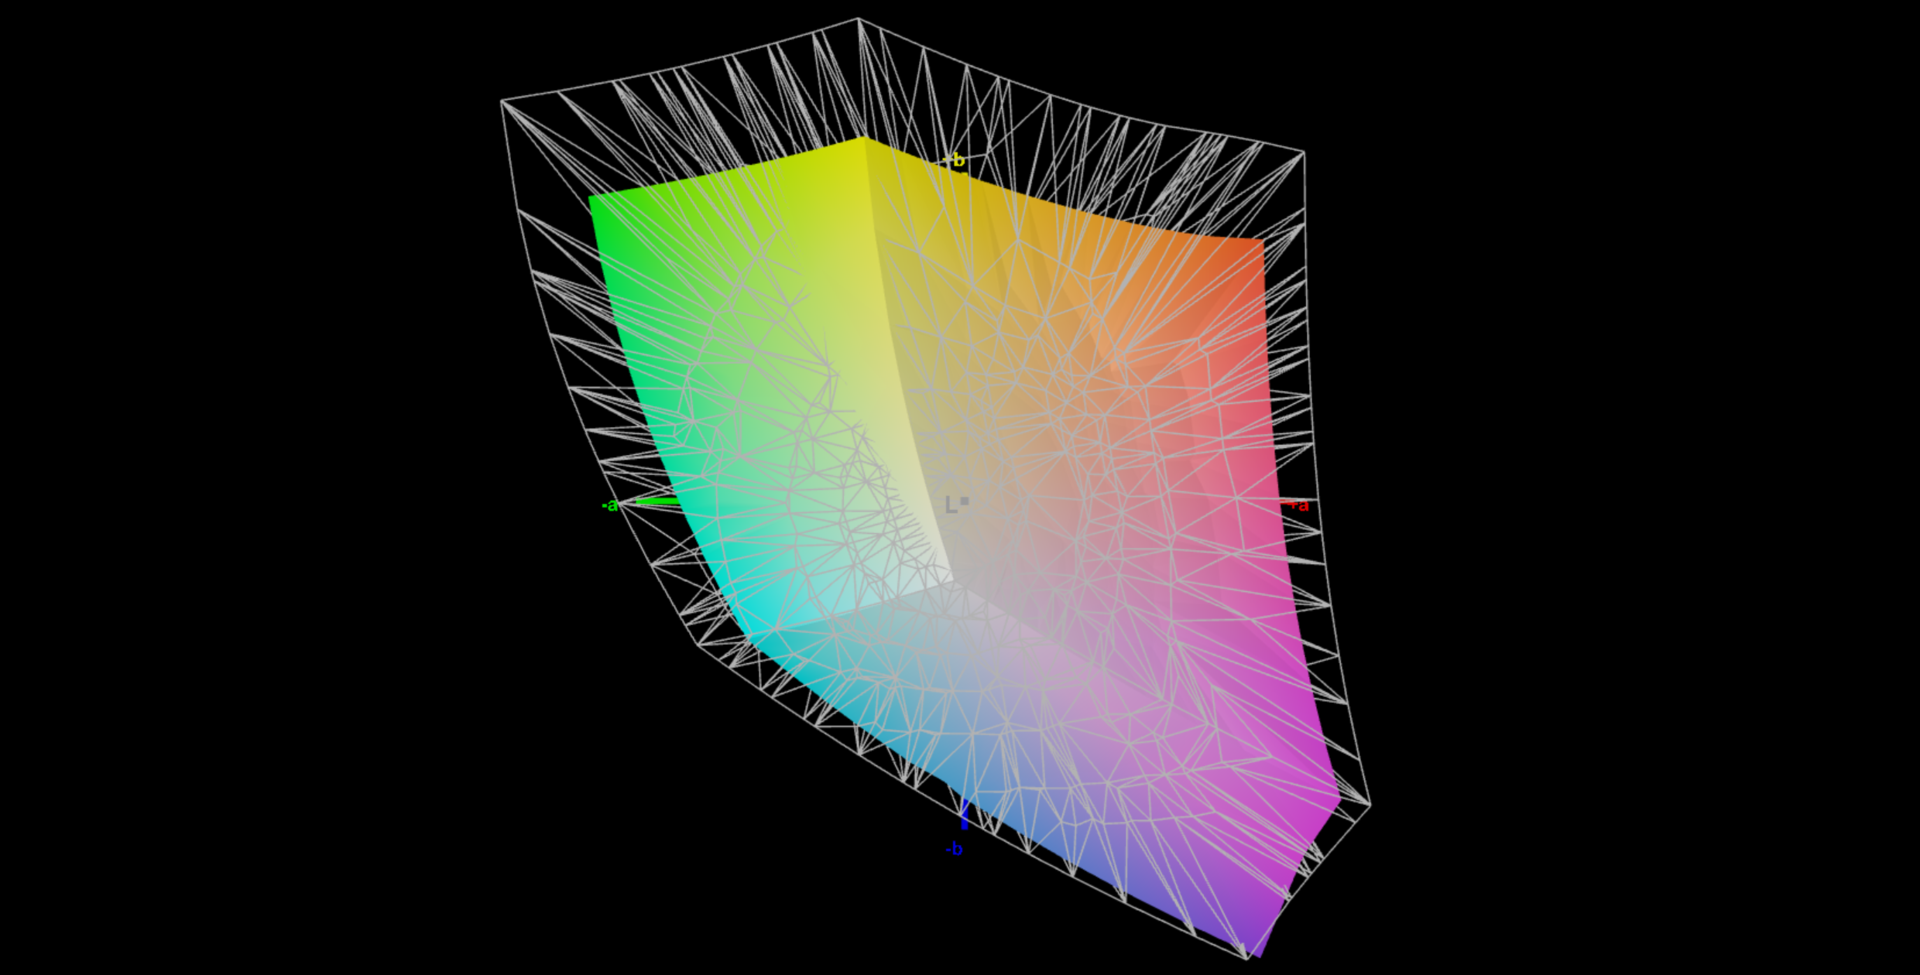
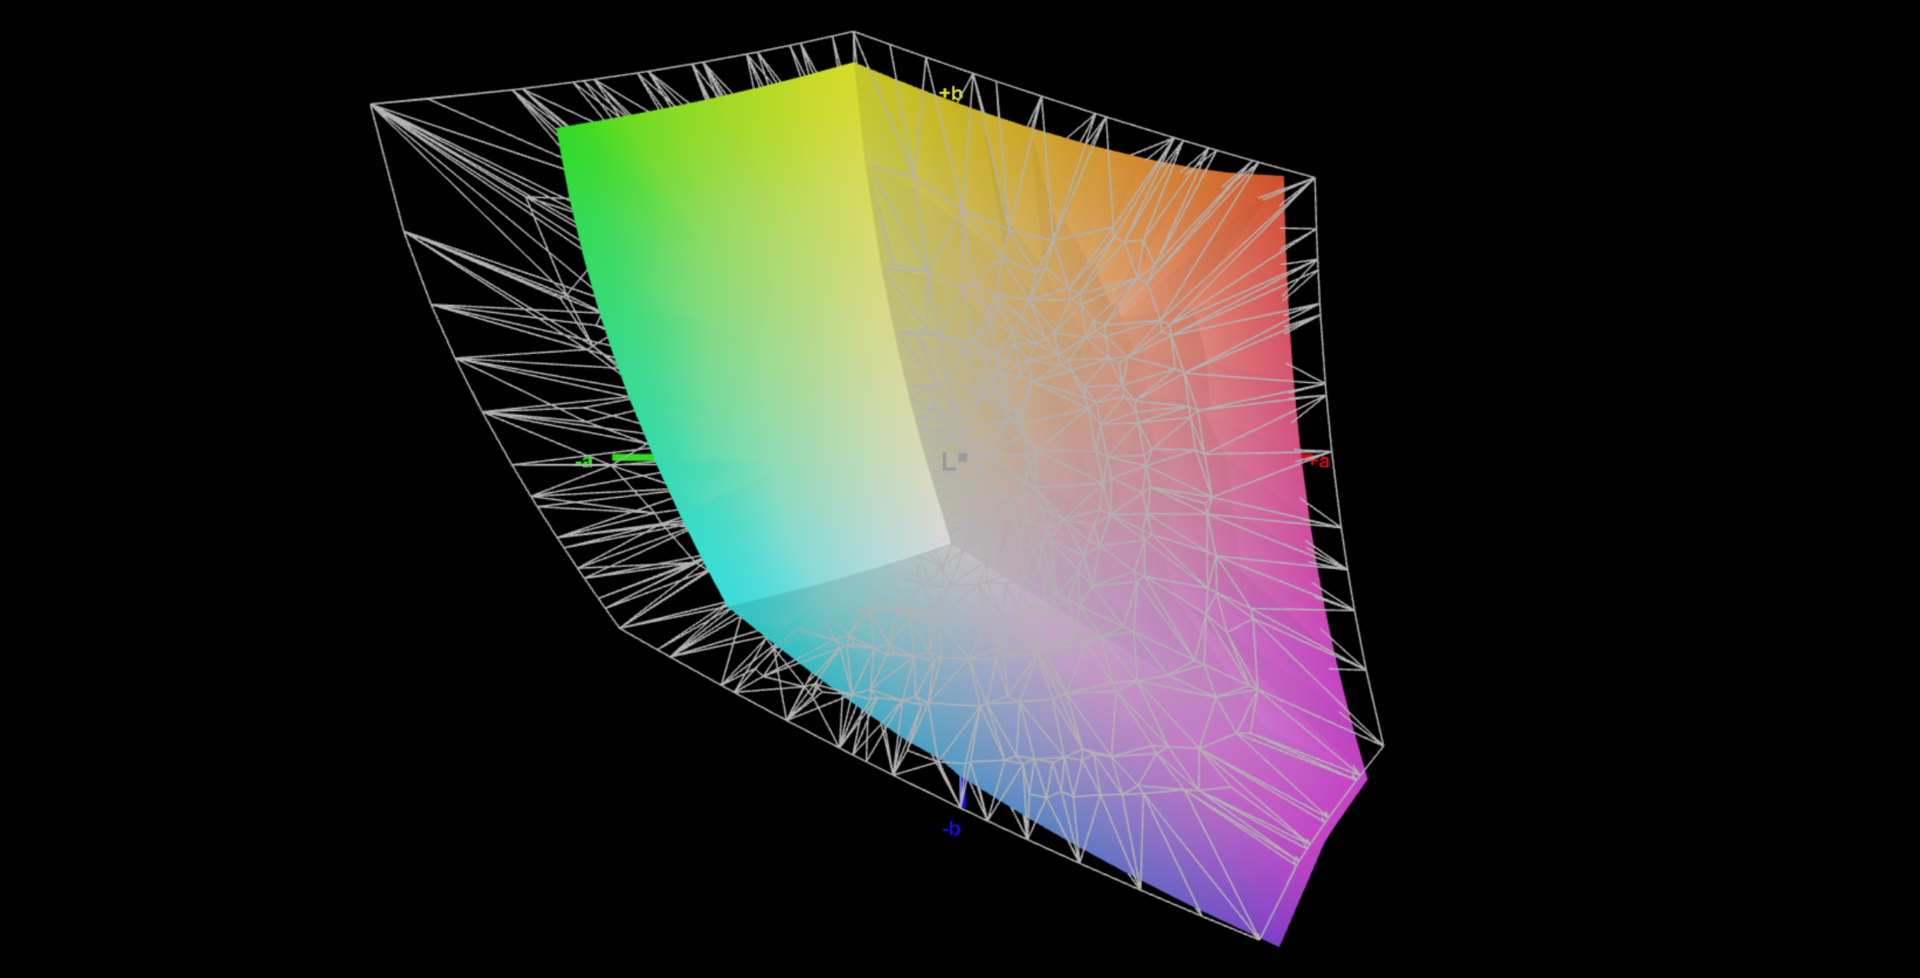
显示屏 - 240 赫兹的 IPS

申克采用了我们熟悉的 Fusion 15 的 240 Hz WQHD 面板,因此它是一款分辨率为 2,560 x 1,600 像素的哑光 IPS 面板。主观的画面印象非常好,所有内容都非常清晰,色彩还原也很好,当然,你不能期待 OLED 面板的鲜艳色彩。不过,也没有出现 PWM 闪烁,但响应时间仍然很快。尽管采用了磨砂表面,但由于频率较高,即使是明亮的表面也不会出现颗粒感,动作也非常流畅。此外还支持自适应同步,但没有安装亮度传感器。
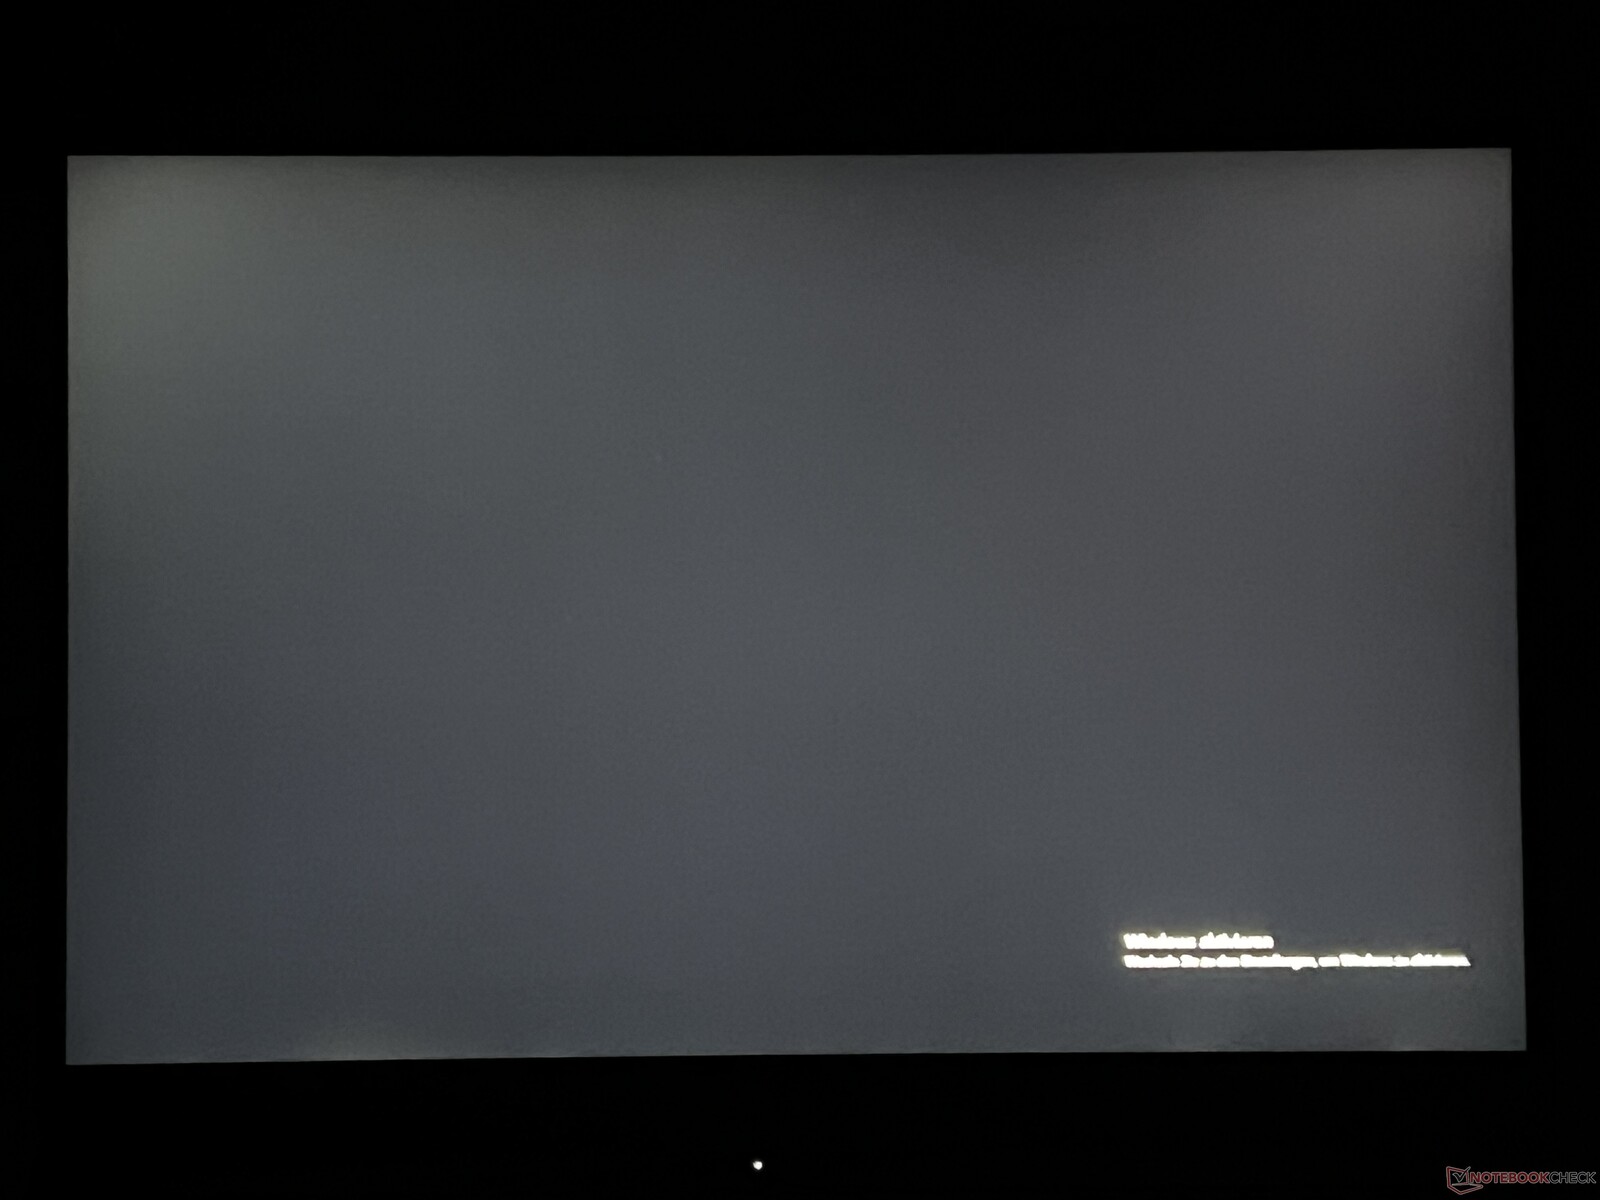
指定亮度为 500 cd/m²,但我们的测试设备达到了明显更好的效果,平均亮度为 585 cd/m²。不过,黑色值也因此受到影响,仅为 0.61 cd/m²,使黑色内容显得相当暗灰。此外,最大对比度仅为 ~1,000:1。
| |||||||||||||||||||||||||
Brightness Distribution: 93 %
Center on Battery: 608 cd/m²
Contrast: 997:1 (Black: 0.61 cd/m²)
ΔE Color 2.1 | 0.5-29.43 Ø4.87, calibrated: 1.2
ΔE Greyscale 2.7 | 0.5-98 Ø5.1
74.2% AdobeRGB 1998 (Argyll 2.2.0 3D)
100% sRGB (Argyll 2.2.0 3D)
73.6% Display P3 (Argyll 2.2.0 3D)
Gamma: 2.2
| SCHENKER XMG Evo 15 (M24) NE153QDM-NZ1, IPS, 2560x1600, 15.3", 240 Hz | Dell Inspiron 16 7640 2-in-1 AU Optronics B160QAT, Mini-LED, 2560x1600, 16", 90 Hz | Medion S10 OLED Samsung SDC4174, OLED, 3840x2400, 16", 60 Hz | Xiaomi RedmiBook Pro 16 2024 TL160MDMP03_0, IPS, 3072x1920, 16", 165 Hz | Lenovo IdeaPad Pro 5 16IMH G9 NE160QDM-NY2, IPS, 2560x1600, 16", 120 Hz | Lenovo ThinkPad T16 G2 21K70035GE B160UAN01.K, IPS LED, 1920x1200, 16", Hz | |
|---|---|---|---|---|---|---|
| Display | 20% | 23% | 18% | -10% | 2% | |
| Display P3 Coverage | 73.6 | 99.4 35% | 99.9 36% | 98.8 34% | 63.3 -14% | 75.9 3% |
| sRGB Coverage | 100 | 100 0% | 100 0% | 100 0% | 95.2 -5% | 98.2 -2% |
| AdobeRGB 1998 Coverage | 74.2 | 92.5 25% | 98.6 33% | 89.9 21% | 65.3 -12% | 77.2 4% |
| Response Times | -527% | 71% | -437% | -141% | -548% | |
| Response Time Grey 50% / Grey 80% * | 4.6 ? | 15.4 ? -235% | 1.7 ? 63% | 39.2 ? -752% | 15 ? -226% | 40.8 ? -787% |
| Response Time Black / White * | 6.6 ? | 60.6 ? -818% | 1.4 ? 79% | 14.6 ? -121% | 10.3 ? -56% | 26.9 ? -308% |
| PWM Frequency | 2753.7 ? | 60 ? | ||||
| Screen | 3% | 329% | -8% | -12% | -31% | |
| Brightness middle | 608 | 413 -32% | 307 -50% | 520 -14% | 368 -39% | 446 -27% |
| Brightness | 585 | 409 -30% | 307 -48% | 510 -13% | 368 -37% | 425 -27% |
| Brightness Distribution | 93 | 97 4% | 96 3% | 93 0% | 91 -2% | 91 -2% |
| Black Level * | 0.61 | 0.14 77% | 0.01 98% | 0.35 43% | 0.31 49% | 0.28 54% |
| Contrast | 997 | 2950 196% | 30700 2979% | 1486 49% | 1187 19% | 1593 60% |
| Colorchecker dE 2000 * | 2.1 | 3.48 -66% | 2.1 -0% | 2.9 -38% | 2.4 -14% | 3.7 -76% |
| Colorchecker dE 2000 max. * | 4.3 | 6.97 -62% | 4.87 -13% | 6.2 -44% | 6.5 -51% | 8.8 -105% |
| Colorchecker dE 2000 calibrated * | 1.2 | 2.08 -73% | 1.1 8% | 0.8 33% | 1.6 -33% | |
| Greyscale dE 2000 * | 2.7 | 4.5 -67% | 0.9 67% | 4.3 -59% | 4.5 -67% | 6 -122% |
| Gamma | 2.2 100% | 2.15 102% | 2.197 100% | 2.19 100% | 2.21 100% | 2.2 100% |
| CCT | 6168 105% | 6446 101% | 6513 100% | 7422 88% | 6324 103% | 6499 100% |
| Total Average (Program / Settings) | -168% /
-75% | 141% /
227% | -142% /
-63% | -54% /
-30% | -192% /
-98% |
* ... smaller is better
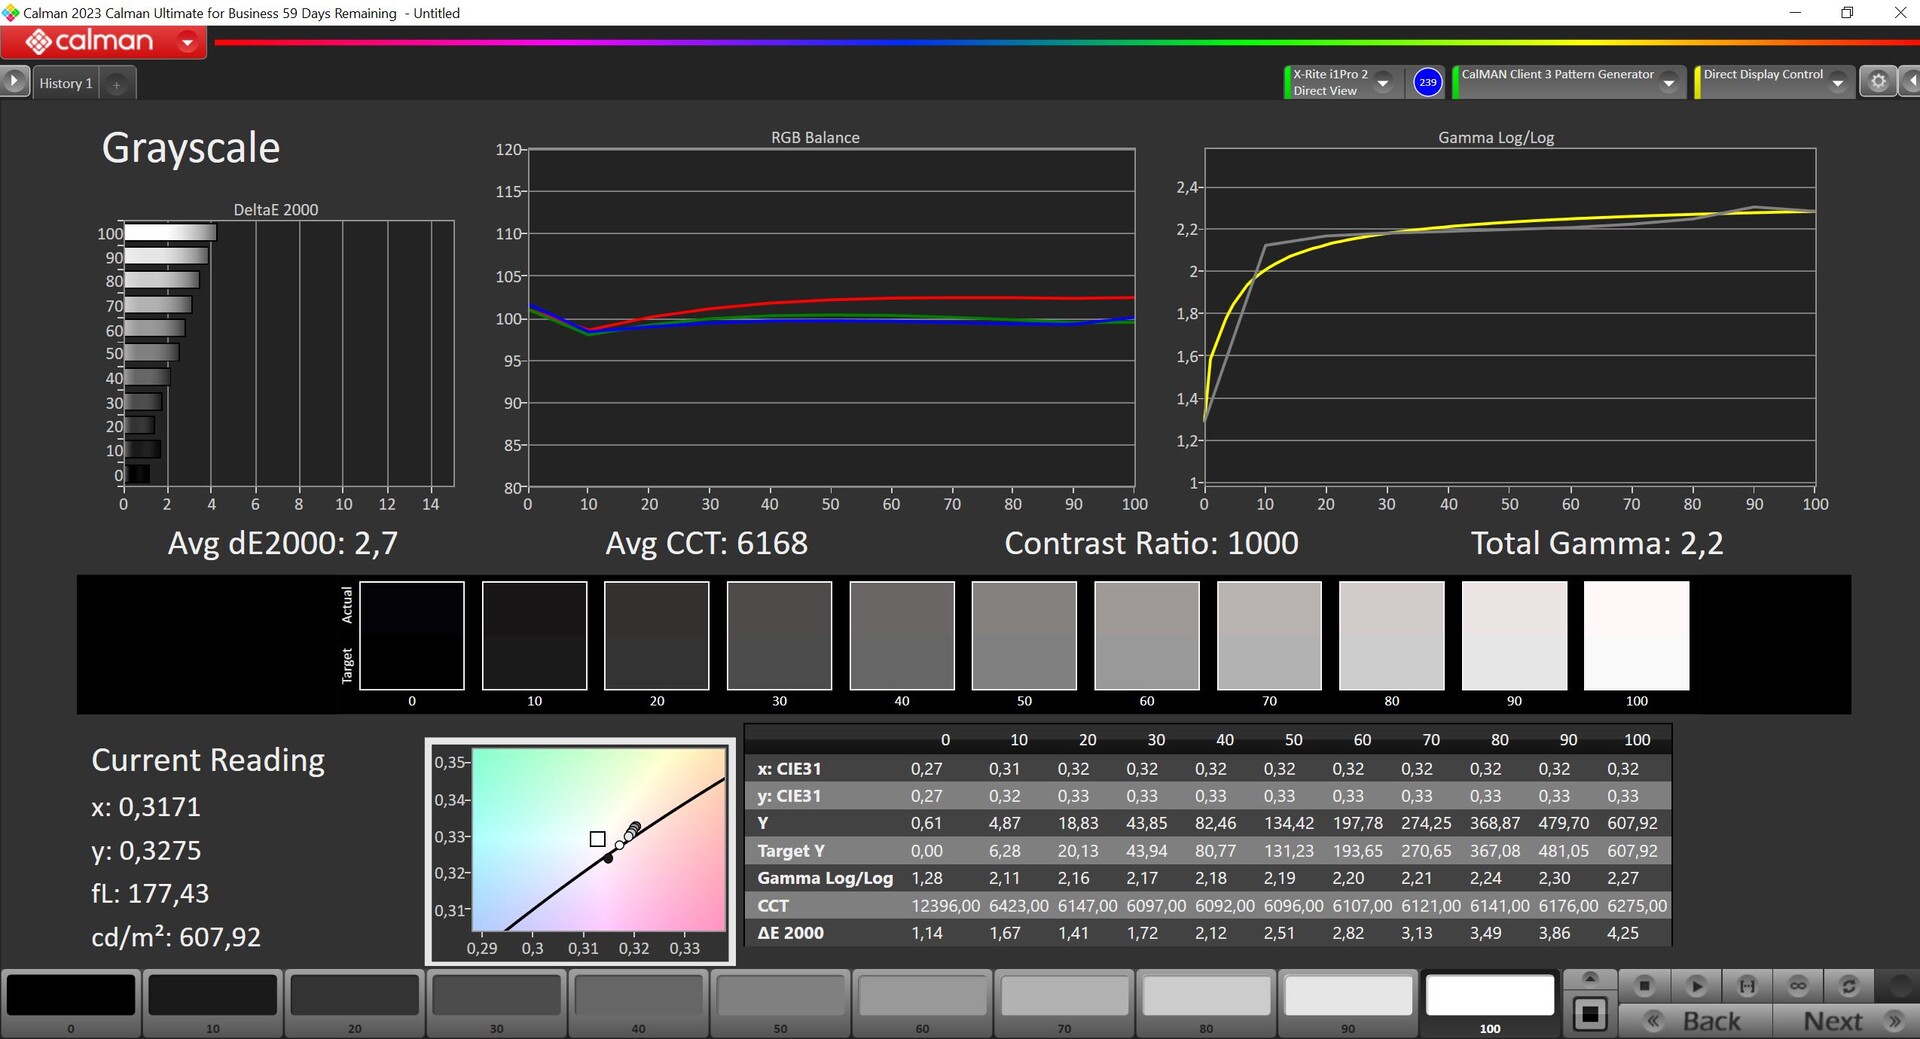
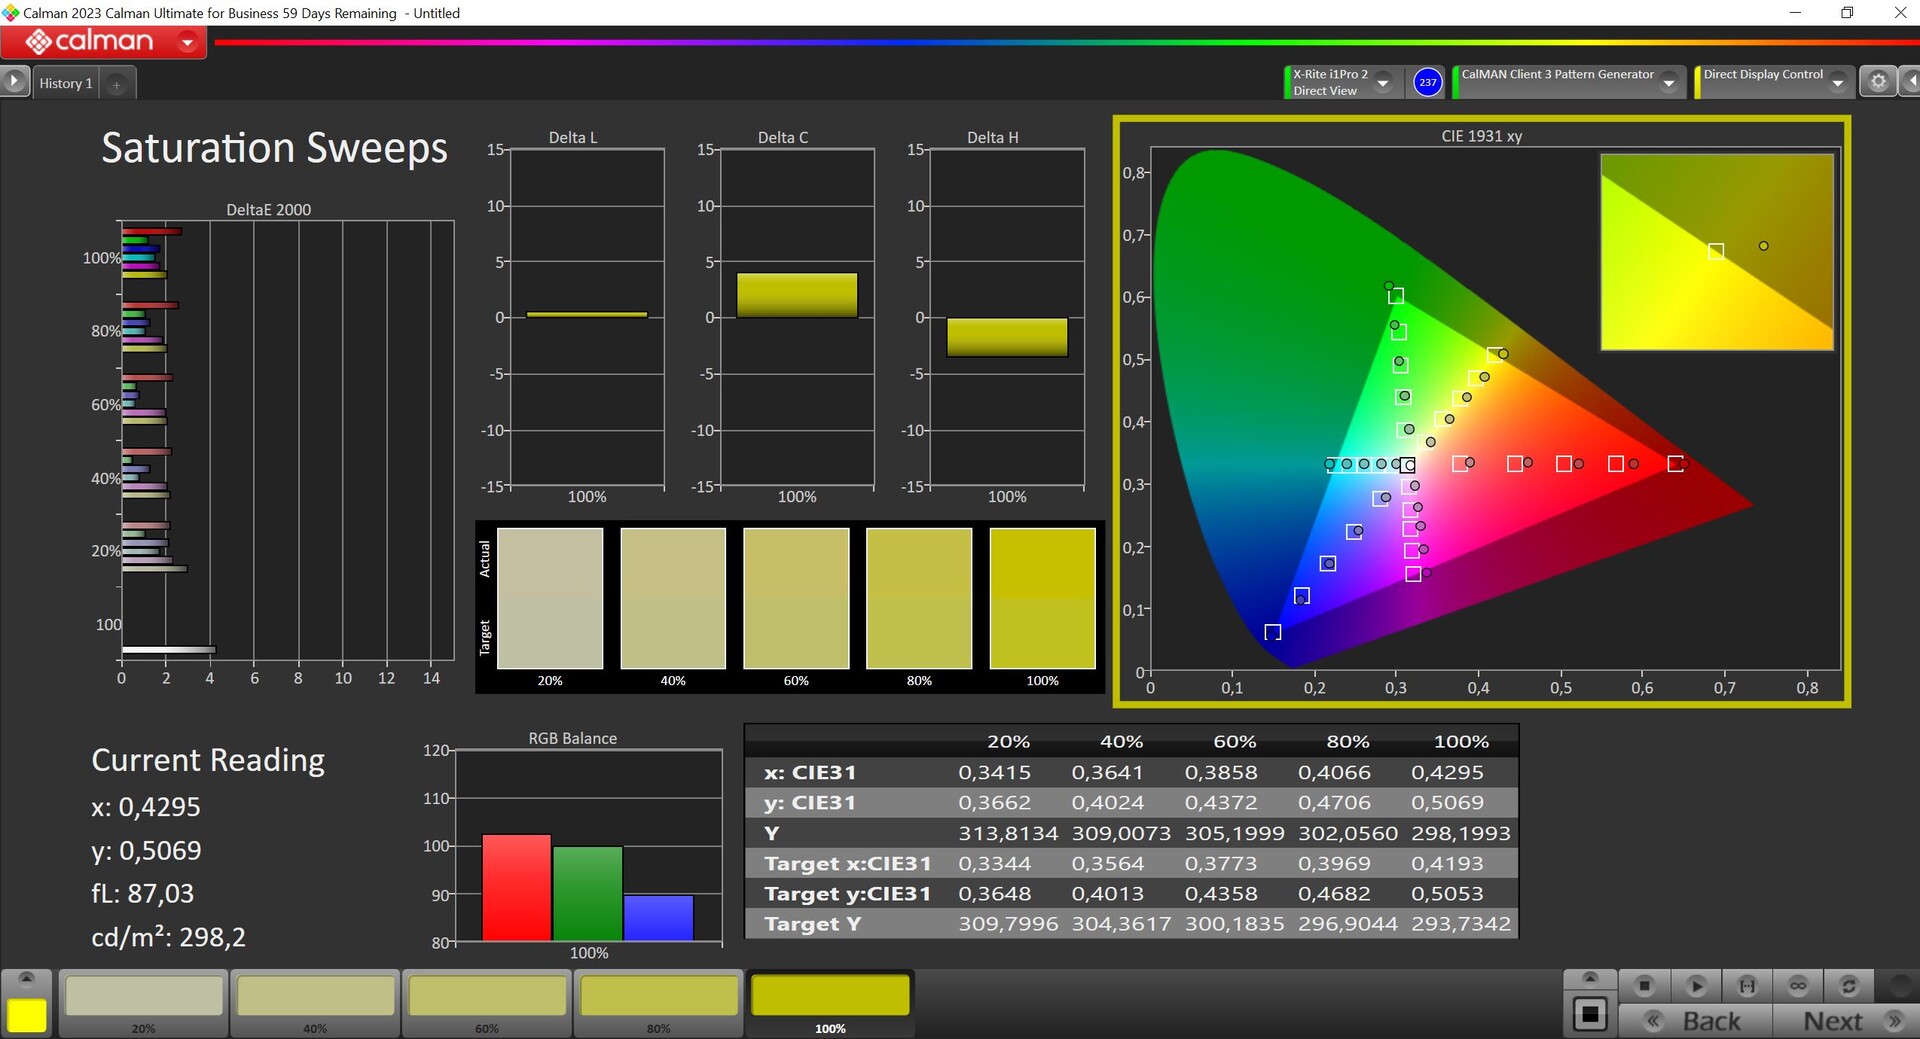
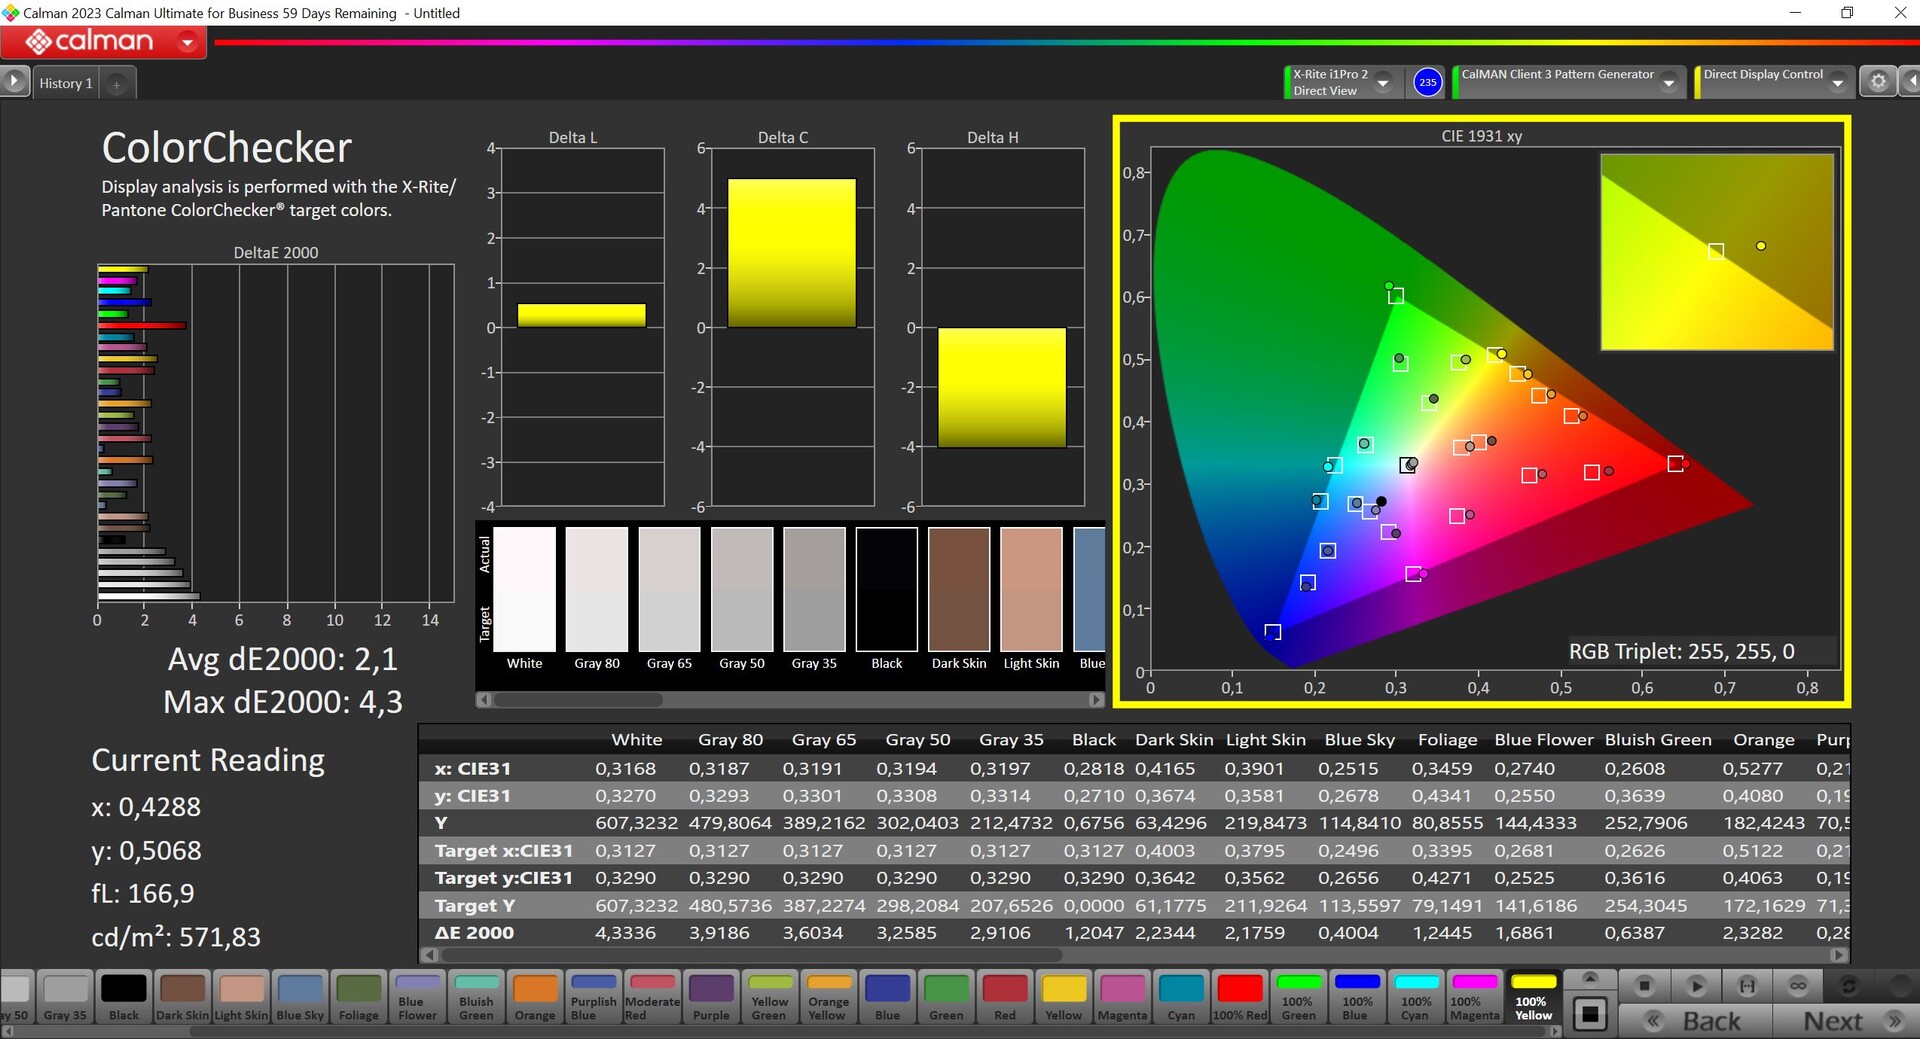
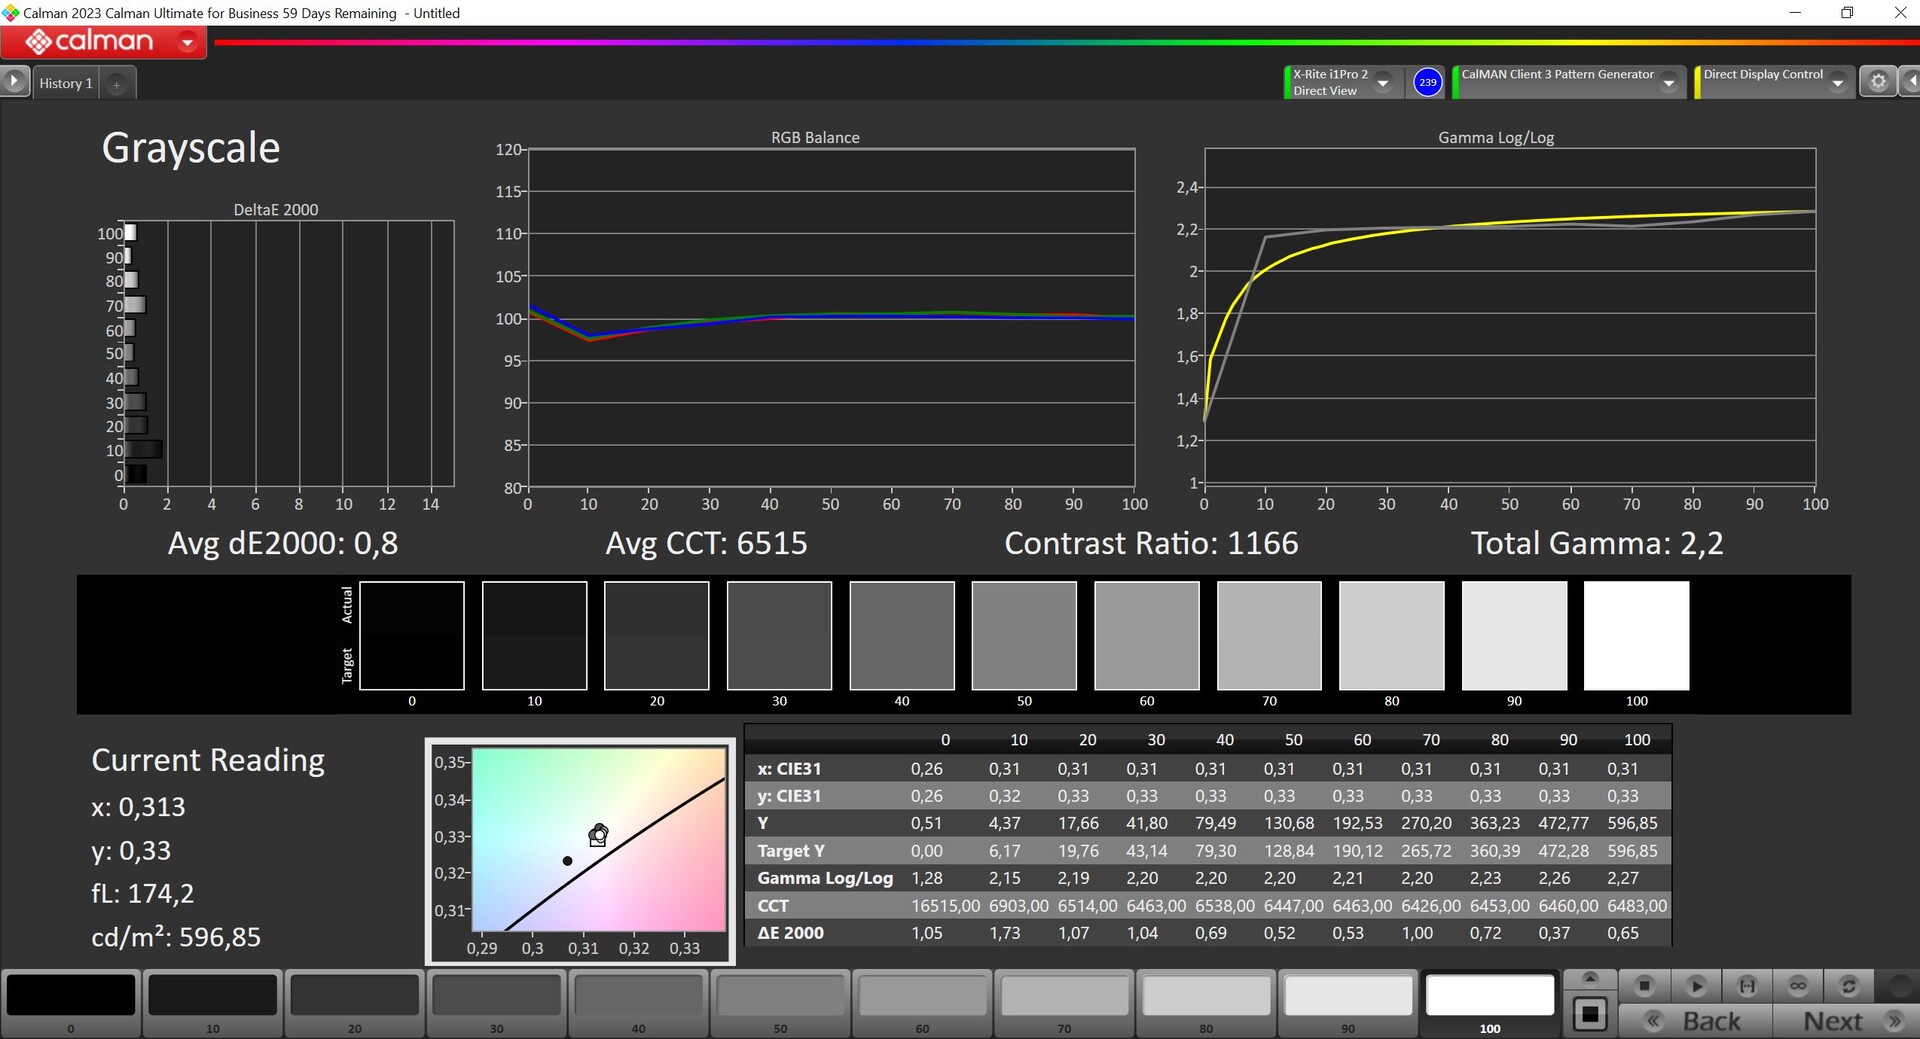
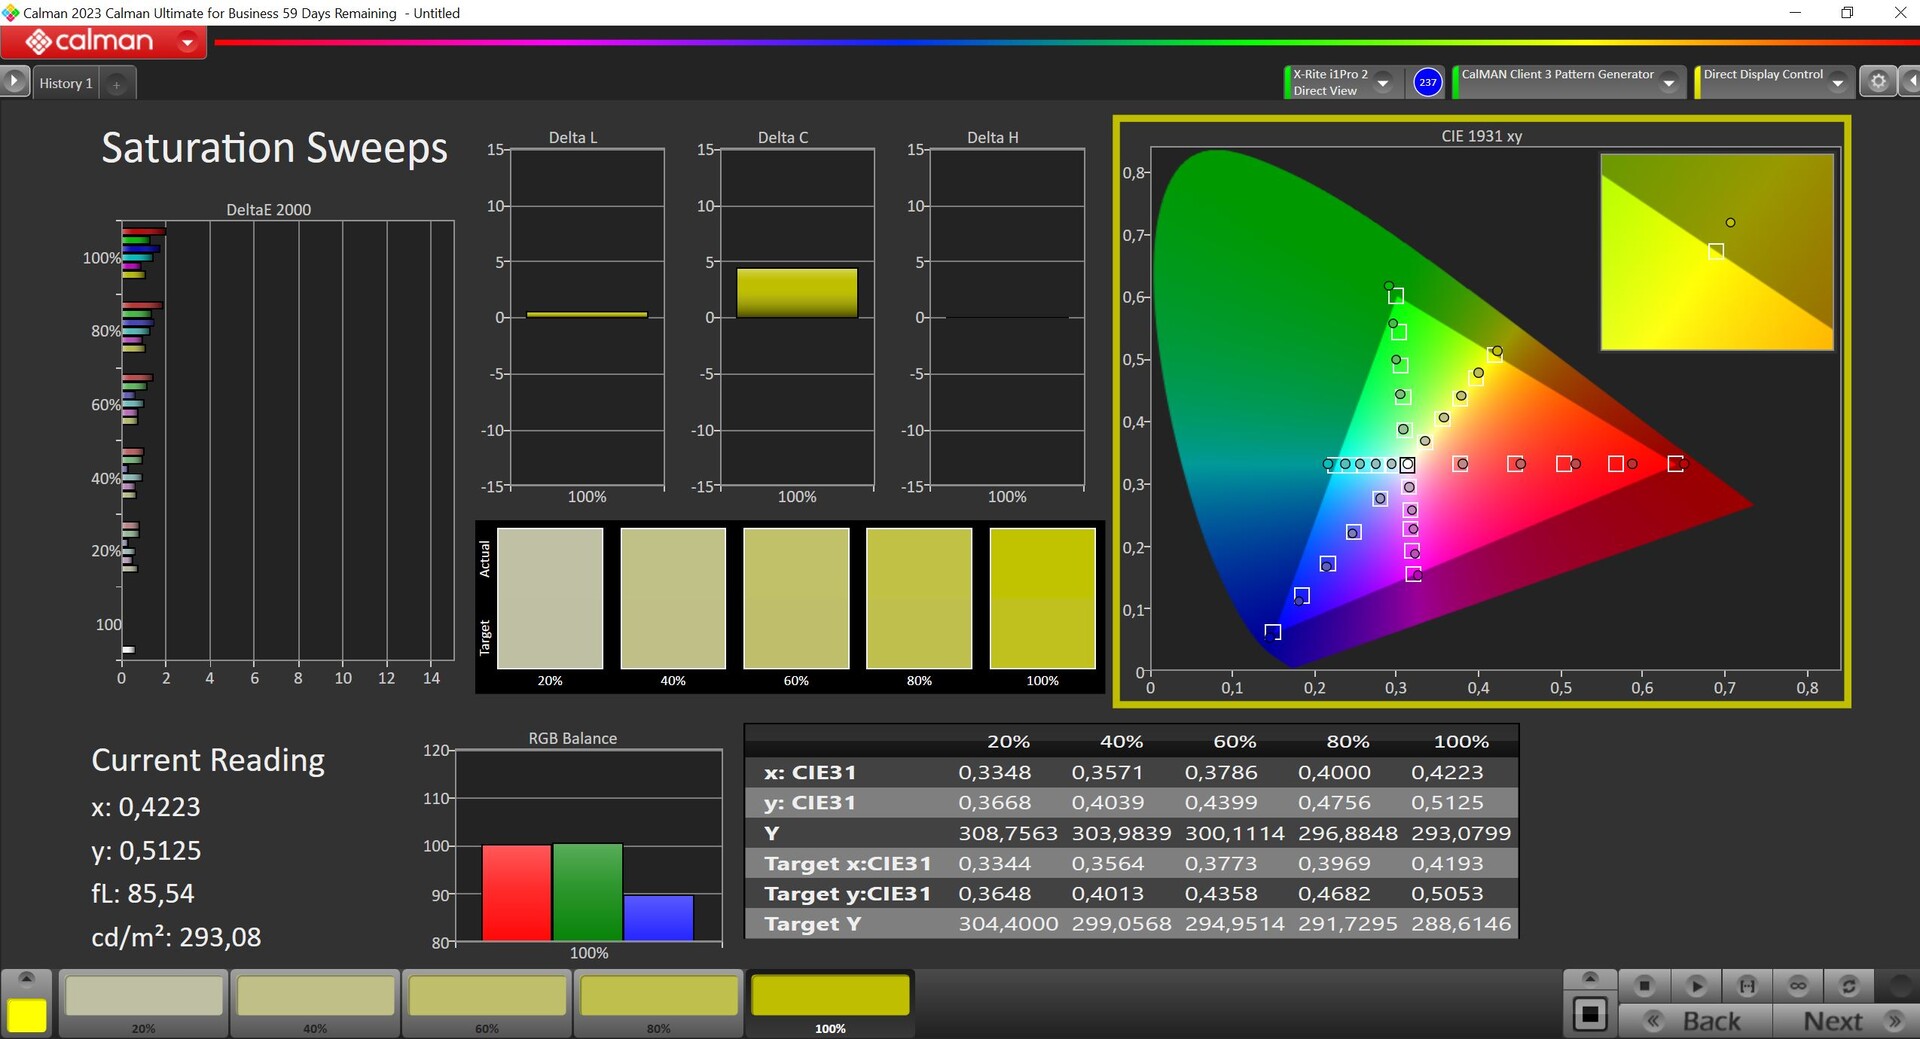
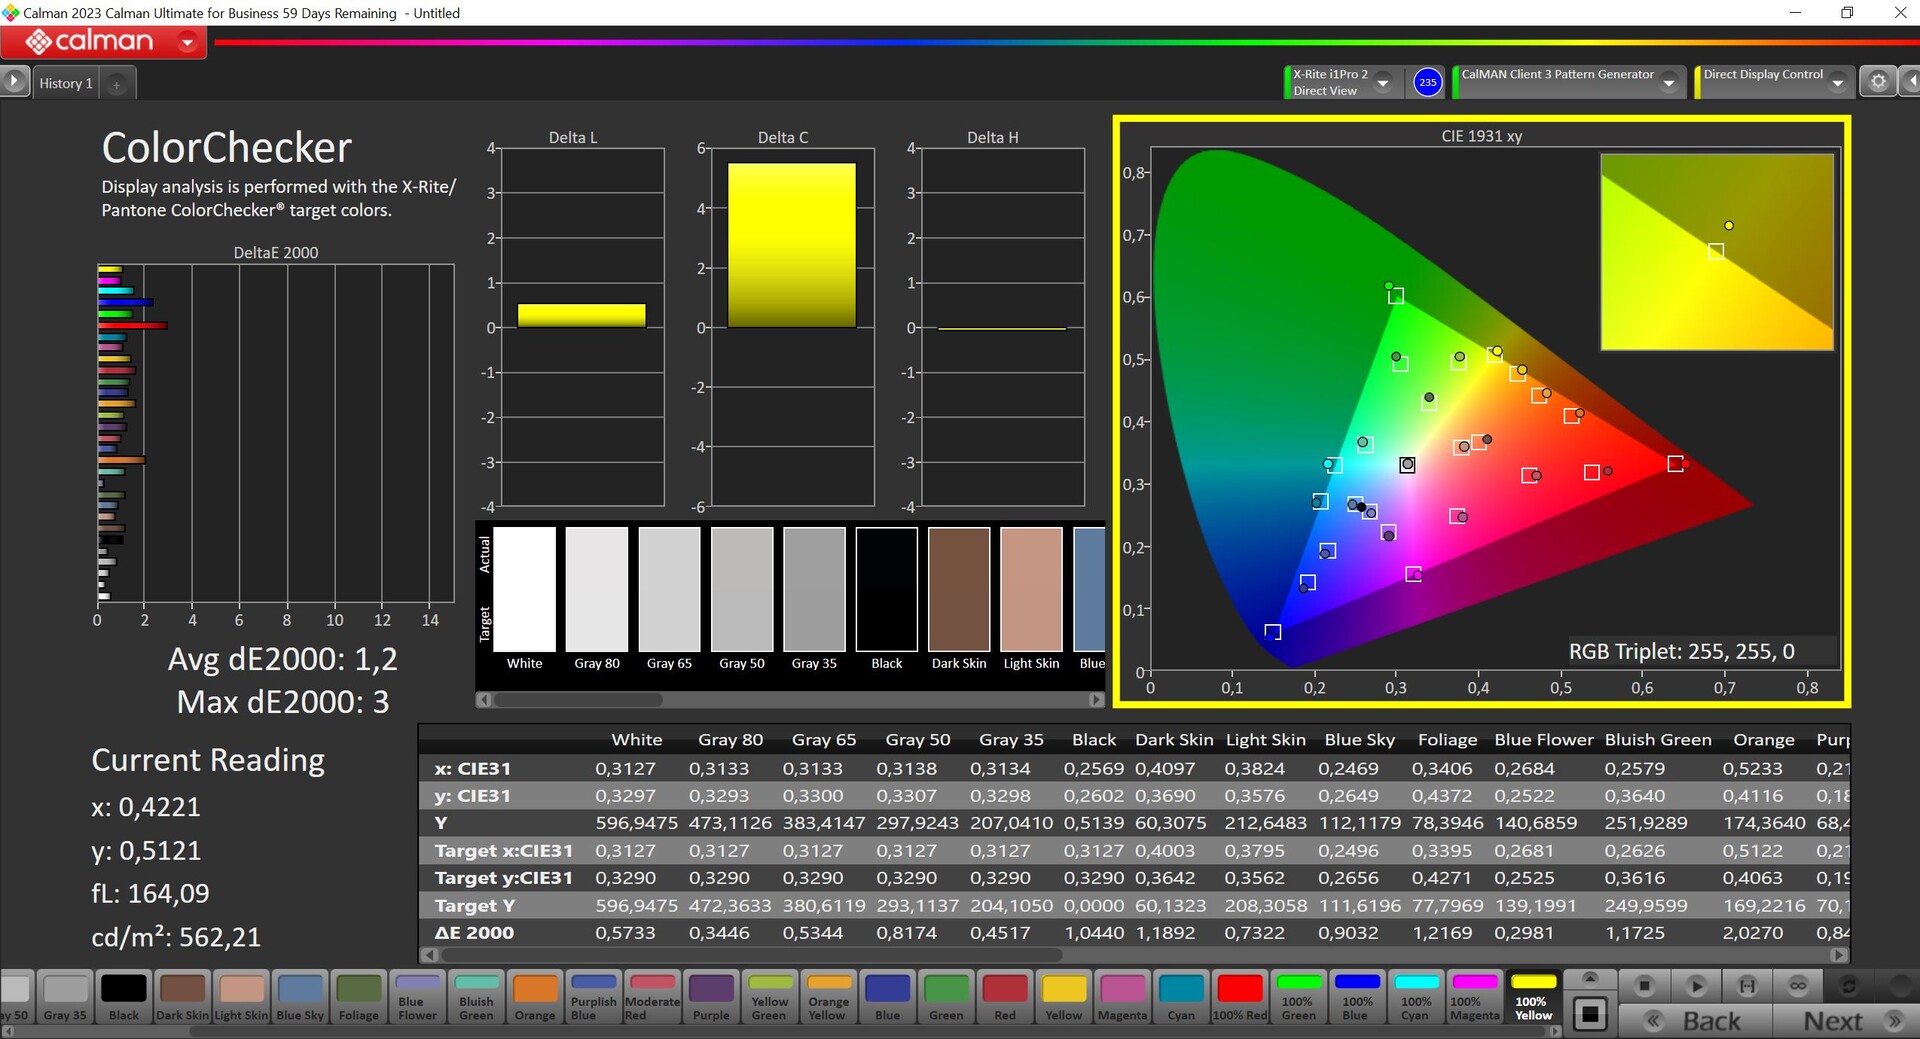
我们使用专业的 CalMAN 软件(X-Rite i1 Pro2)对面板进行了测量,您可以在控制中心下载制造商提供的预校准配置文件,我们也使用该配置文件进行了测量。不过,这里的色温有点偏暖,而且有些颜色和灰度值超过了 3 的目标值。通过我们自己的校准(可在上面免费下载配置文件),我们可以明显改善显示效果,而且所有值都在目标范围内。因此,Evo 15 也适用于无限制地编辑图像/视频。
Display Response Times
| ↔ Response Time Black to White | ||
|---|---|---|
| 6.6 ms ... rise ↗ and fall ↘ combined | ↗ 2.8 ms rise | 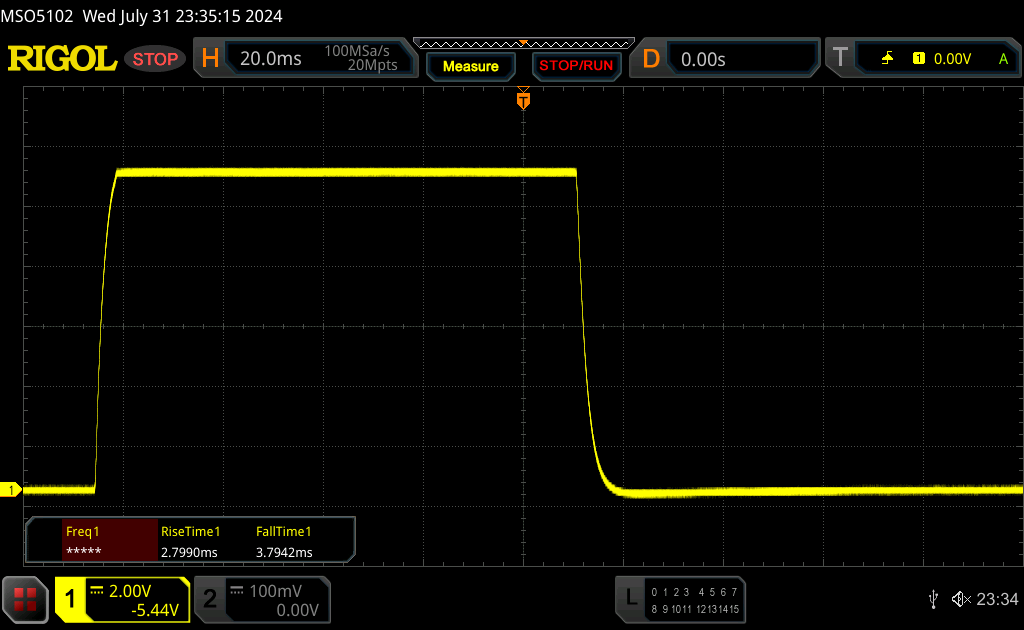 |
| ↘ 3.8 ms fall | ||
| The screen shows very fast response rates in our tests and should be very well suited for fast-paced gaming. In comparison, all tested devices range from 0.1 (minimum) to 240 (maximum) ms. » 18 % of all devices are better. This means that the measured response time is better than the average of all tested devices (20.8 ms). | ||
| ↔ Response Time 50% Grey to 80% Grey | ||
| 4.6 ms ... rise ↗ and fall ↘ combined | ↗ 1.3 ms rise | 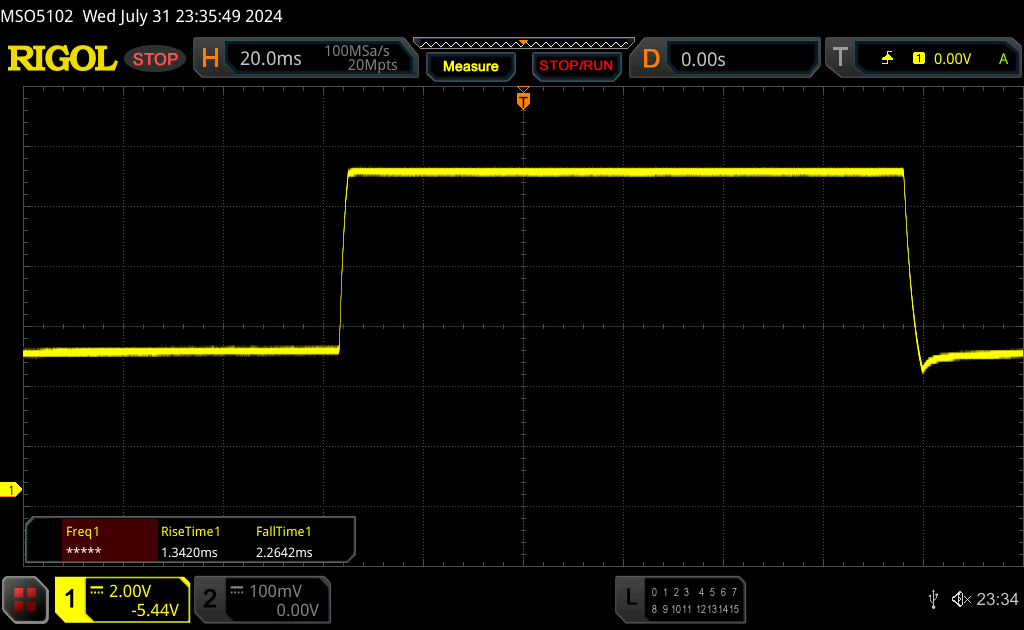 |
| ↘ 2.3 ms fall | ||
| The screen shows very fast response rates in our tests and should be very well suited for fast-paced gaming. In comparison, all tested devices range from 0.165 (minimum) to 636 (maximum) ms. » 13 % of all devices are better. This means that the measured response time is better than the average of all tested devices (32.5 ms). | ||
Screen Flickering / PWM (Pulse-Width Modulation)
| Screen flickering / PWM not detected | 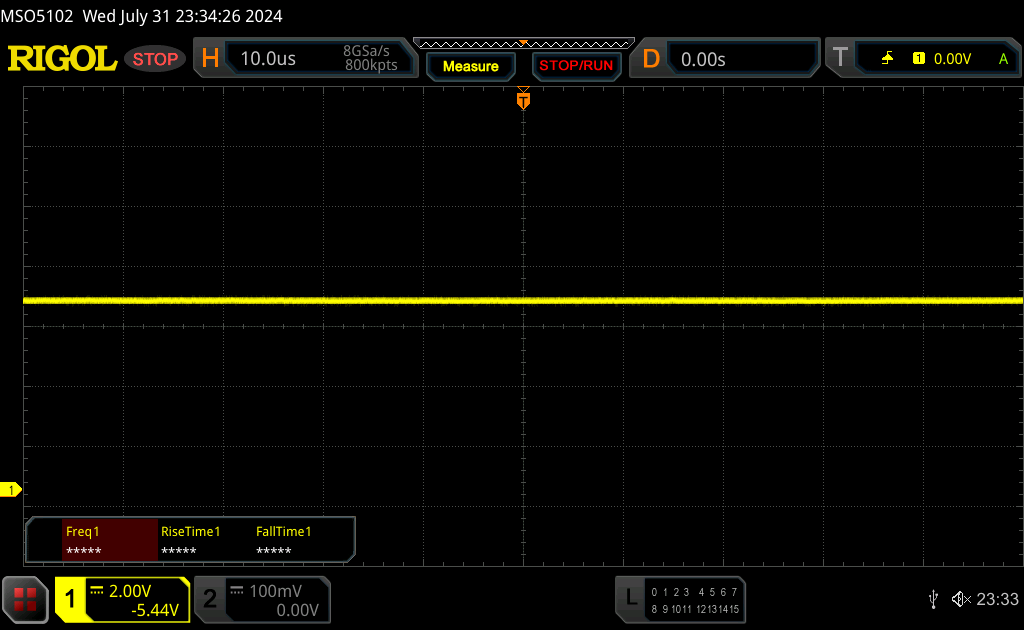 | ||
In comparison: 53 % of all tested devices do not use PWM to dim the display. If PWM was detected, an average of 8516 (minimum: 5 - maximum: 343500) Hz was measured. | |||
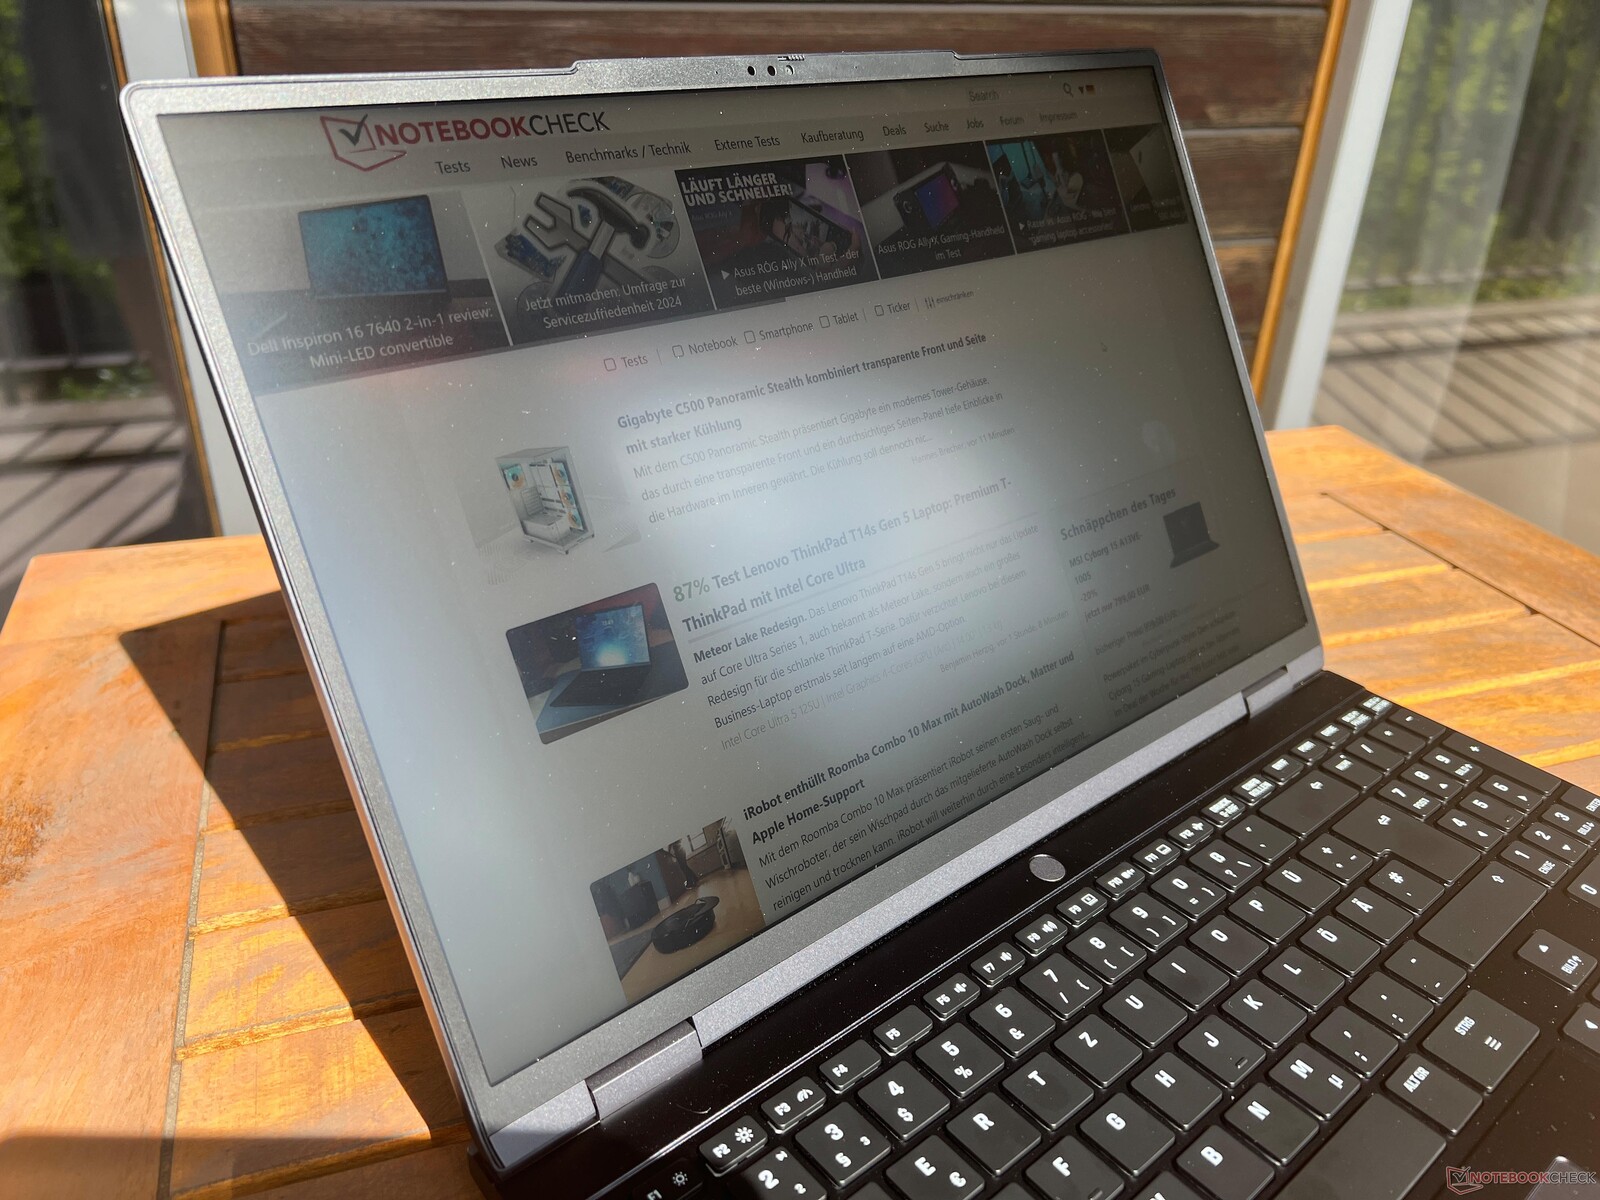
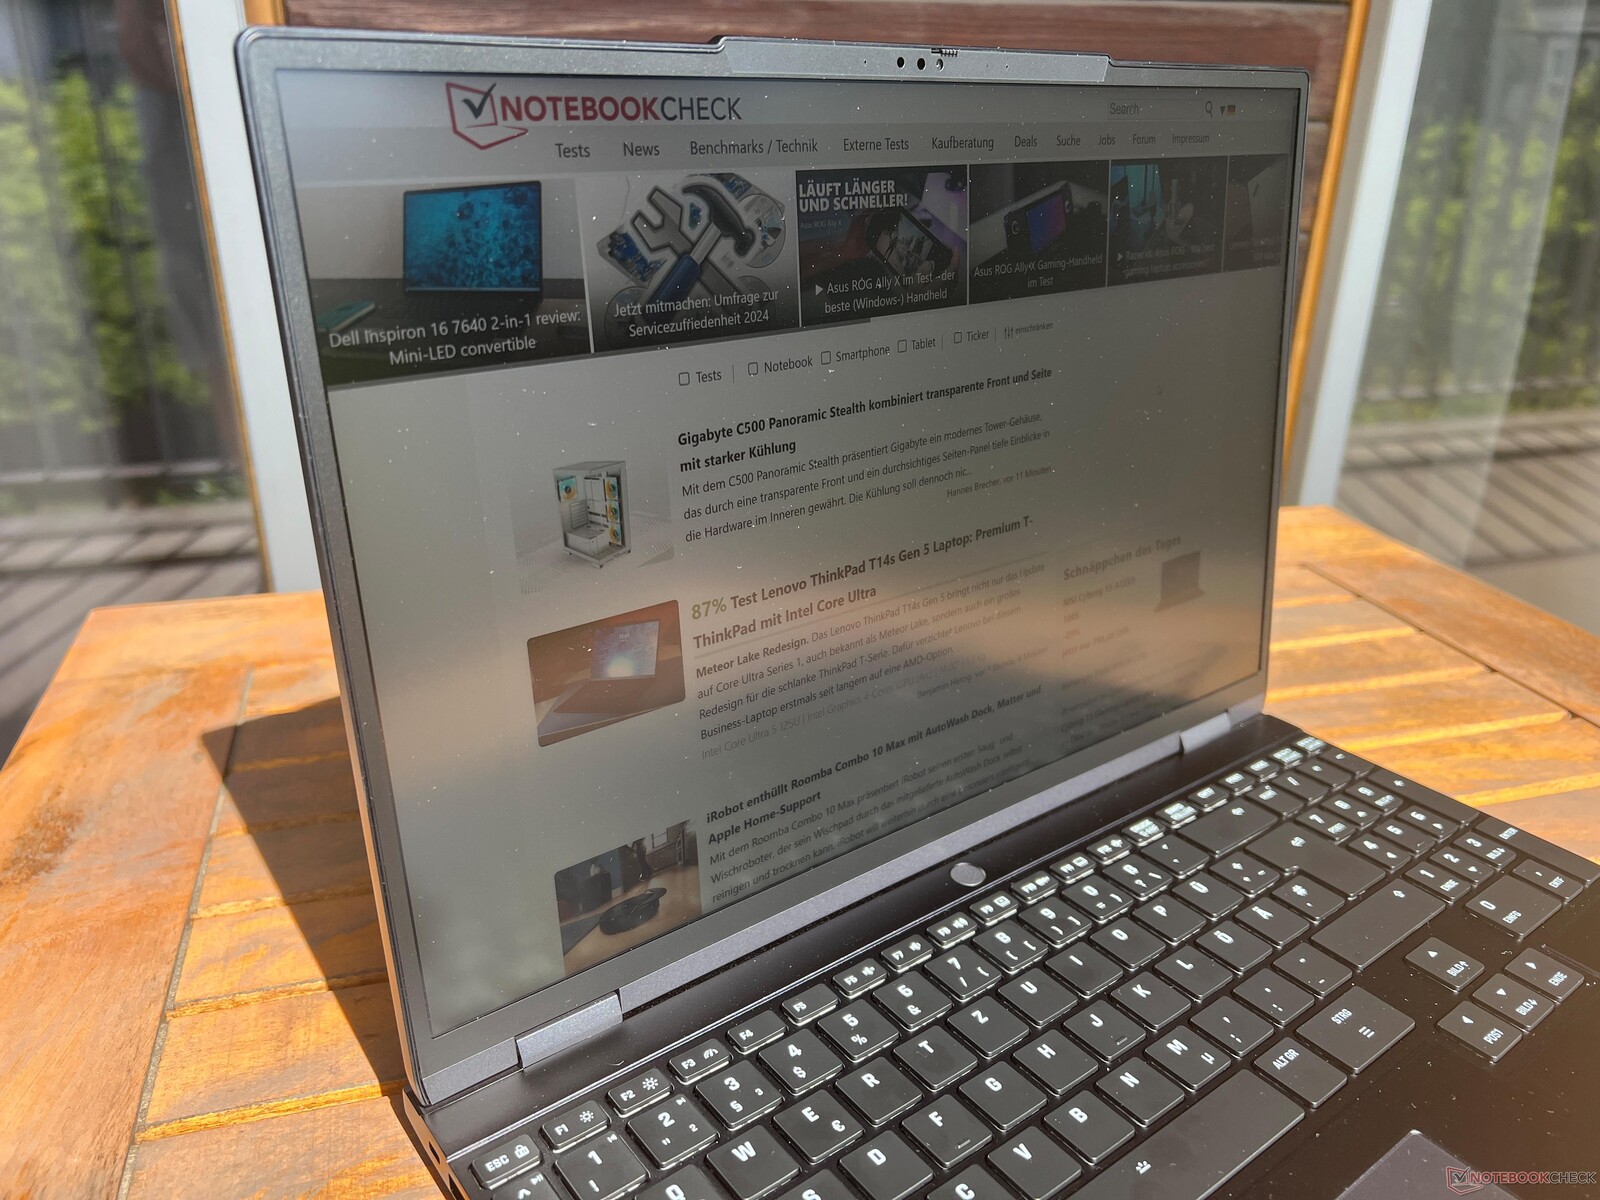
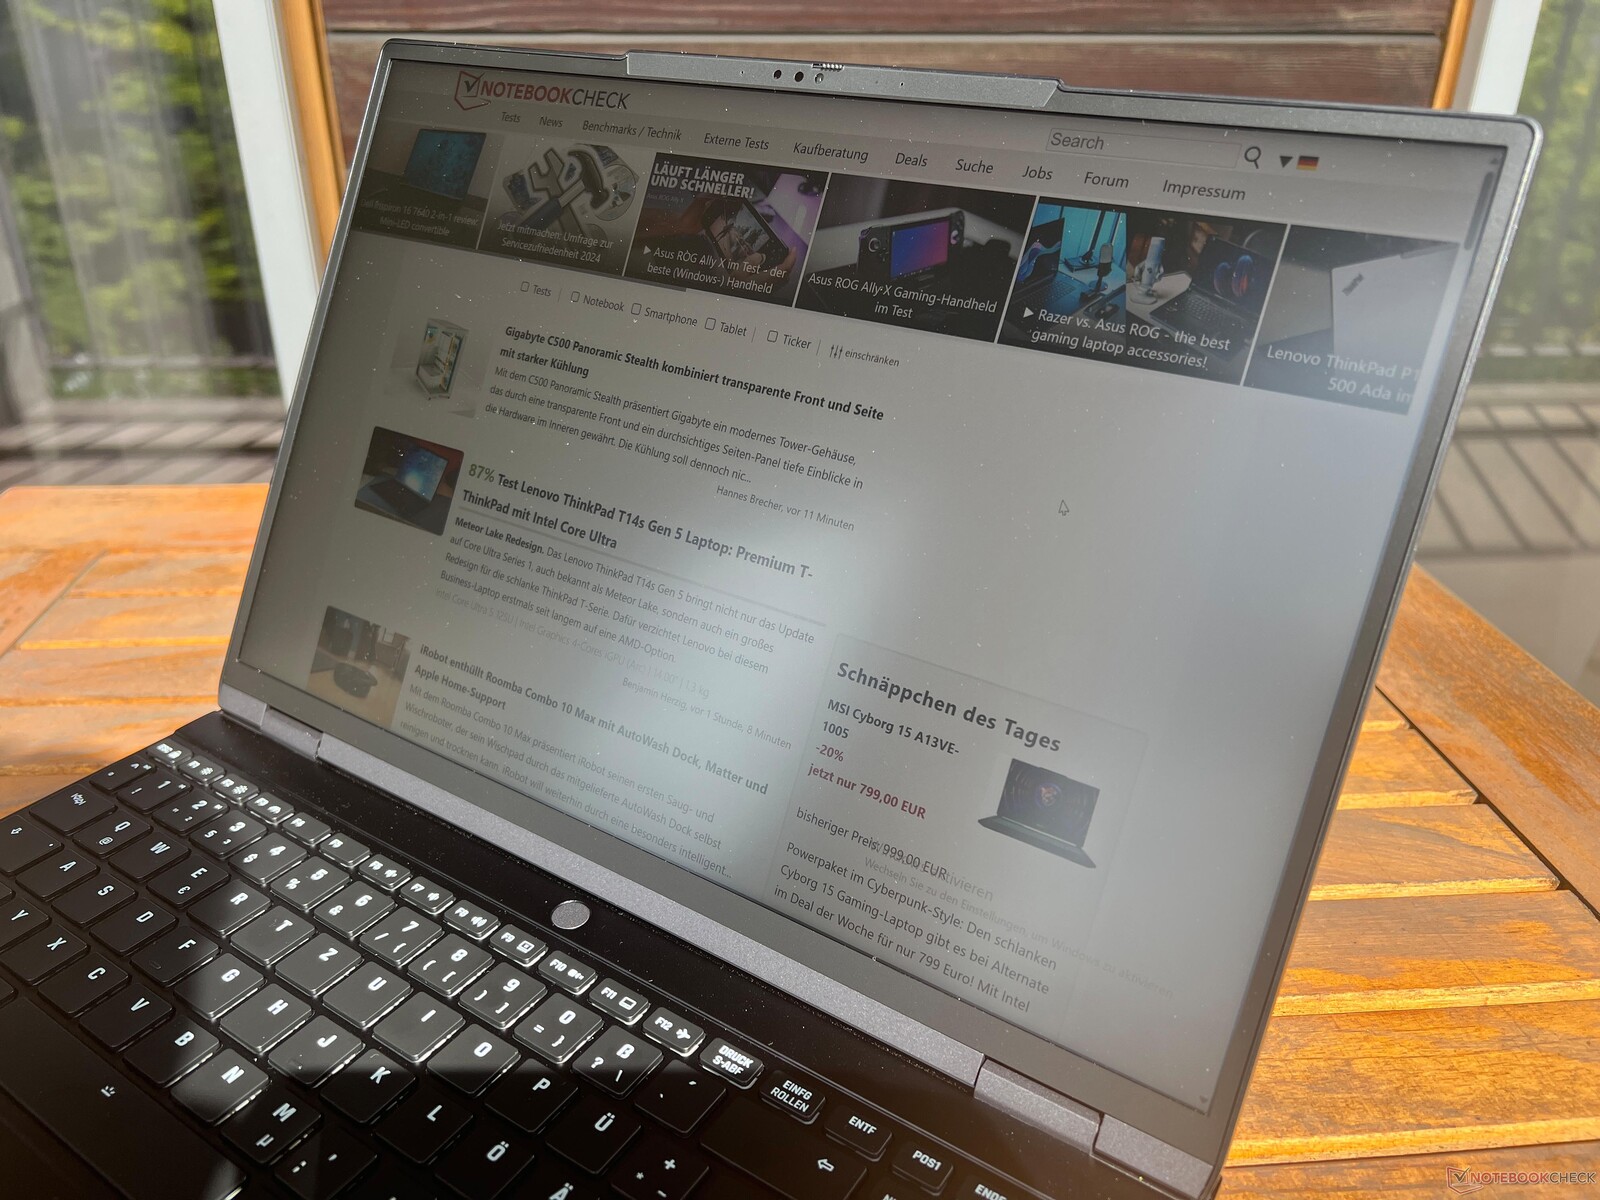


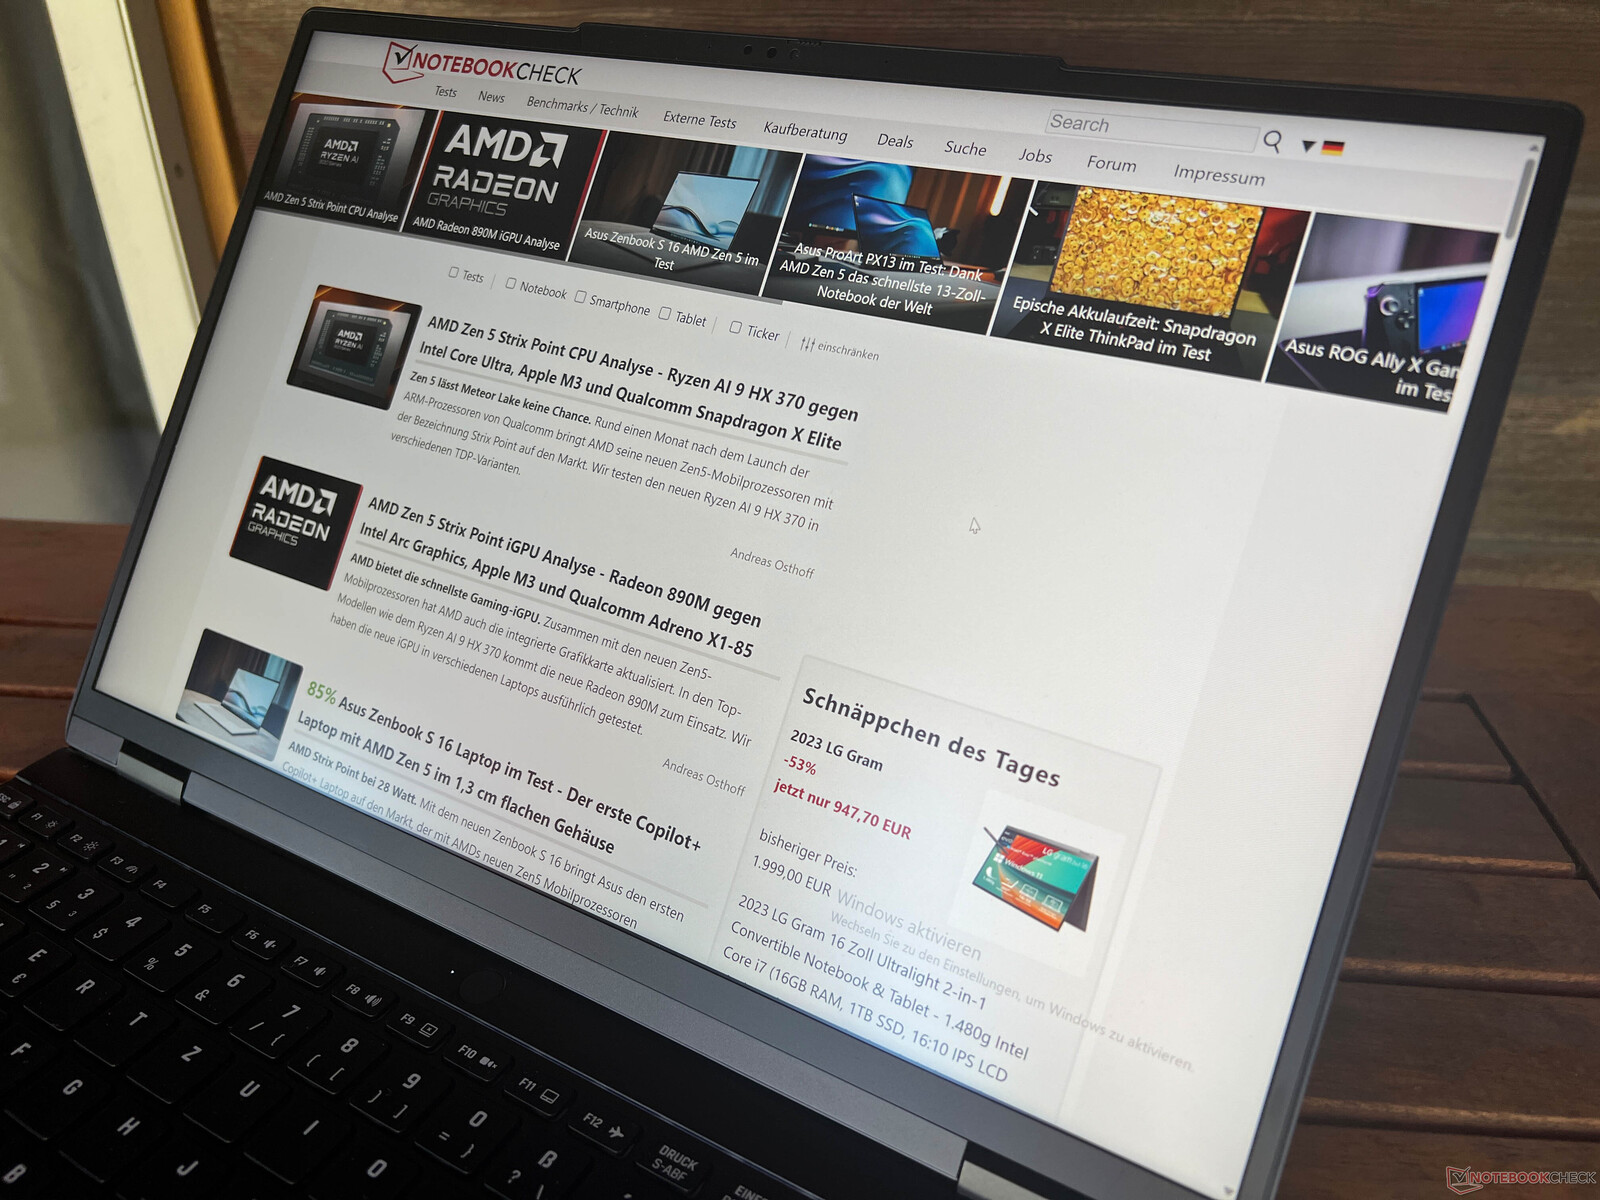
得益于高亮度,磨砂面板在户外的表现非常出色,即使在明亮的天气里,也能清晰地看到内容。IPS 面板的可视角度稳定性非常好。

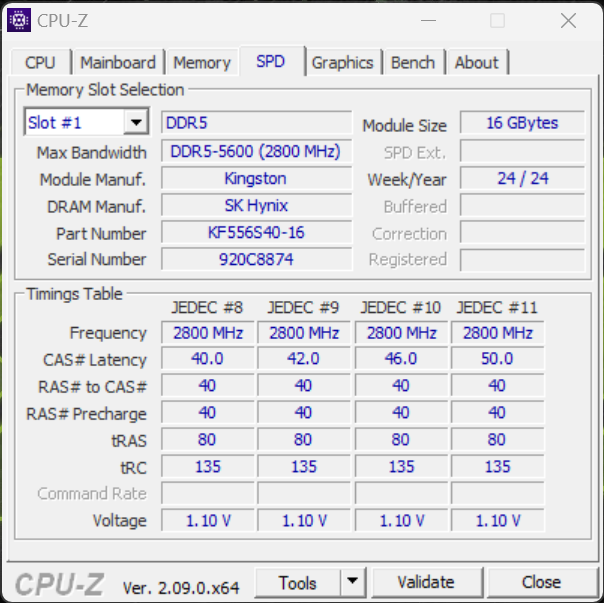
性能 - Meteor Lake 和高达 96GB 内存
XMG Evo 15 可配备 AMD Ryzen 7 8845HS或 英特尔酷睿 7 155H或英特尔酷睿 Ultra 7 155H。两个内存插槽最多可容纳 96 GB DDR5 内存,但由于散热限制,在使用 48 GB 模块时,频率从 5600 MHz 限制为 4800 MHz。
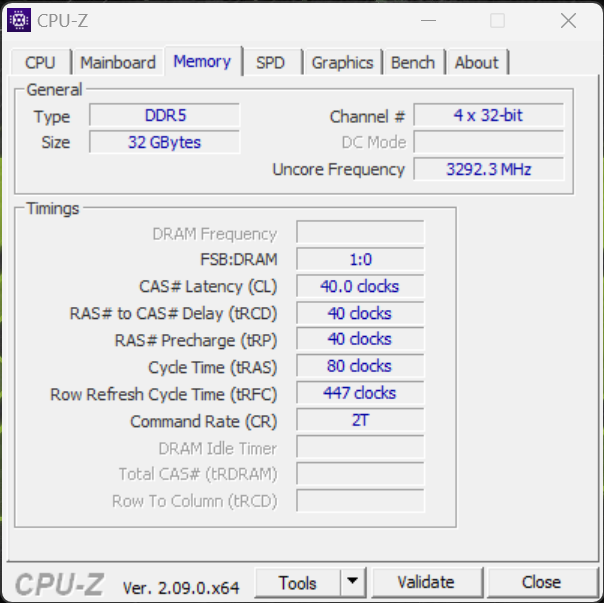
测试条件
预装的控制中心提供三种不同的能耗配置文件(平衡、发烧和超频),也可以使用 Fn+F3 组合键方便地进行切换。我们使用标准的Enthusiast 配置文件进行了基准测试和测量。我们在下表中总结了三种配置文件的性能值:
| 能源概况 | CPU TDP | CPU TDP(电池) | CB R23 Multi | Time Spy 图形 | max.风扇容量 |
|---|---|---|---|---|---|
| 平衡型 | 35 瓦 | 25 瓦 | 12,759 点 | 2,623 点 | 35.4 dB(A) |
| 发烧级 | 45 瓦 | 35 瓦 | 14,957 点 | 3,690 点 | 40.4 dB(A) |
| 超增压 | 70 瓦 | 35 瓦 | 18,790 分 | 3,633 分 | 48.1 dB(A) |
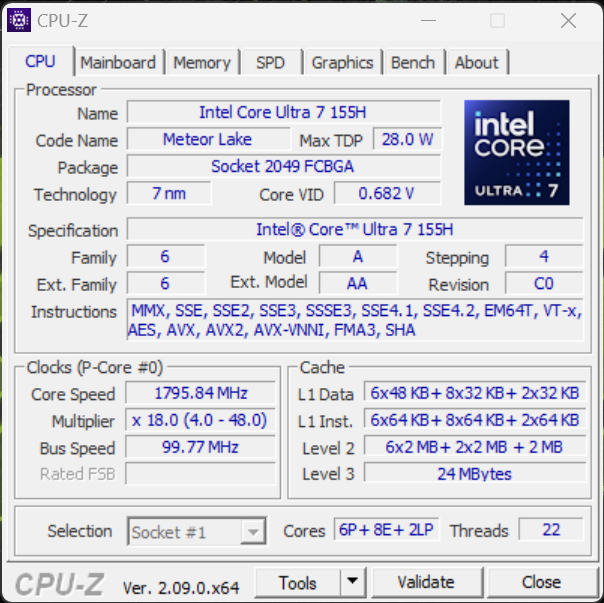
处理器 - Core Ultra 7 155H
英特尔 英特尔酷睿至尊 7 155H英特尔酷睿 Ultra 7 155H 目前用于许多笔记本电脑,但 XMG Evo 15 是为数不多的没有增加短期功耗限制的机型之一。在 "发烧友 "模式下,功耗为 45 瓦,且该值保持不变(这也适用于 70 瓦和 35 瓦的其他性能配置文件),在连续负载下性能不会下降。在 "发烧友 "模式下,性能已经非常出色,但如果需要更多功率,可以轻松使用 "超频 "模式(多核性能提升 25%)。不过,在电池模式下,最大功耗降至 35 瓦,性能降低了 15%。更多 CPU 基准测试请参见 技术部分.
Cinebench R15 Multi loop
Cinebench R23: Multi Core | Single Core
Cinebench R20: CPU (Multi Core) | CPU (Single Core)
Cinebench R15: CPU Multi 64Bit | CPU Single 64Bit
Blender: v2.79 BMW27 CPU
7-Zip 18.03: 7z b 4 | 7z b 4 -mmt1
Geekbench 6.4: Multi-Core | Single-Core
Geekbench 5.5: Multi-Core | Single-Core
HWBOT x265 Benchmark v2.2: 4k Preset
LibreOffice : 20 Documents To PDF
R Benchmark 2.5: Overall mean
| CPU Performance Rating | |
| Lenovo IdeaPad Pro 5 16IMH G9 | |
| Xiaomi RedmiBook Pro 16 2024 | |
| Average of class Multimedia | |
| Dell Inspiron 16 7640 2-in-1 | |
| SCHENKER XMG Evo 15 (M24) | |
| Medion S10 OLED | |
| Average Intel Core Ultra 7 155H | |
| Lenovo ThinkPad T16 G2 21K70035GE | |
| Cinebench R23 / Multi Core | |
| Lenovo IdeaPad Pro 5 16IMH G9 | |
| Xiaomi RedmiBook Pro 16 2024 | |
| Average of class Multimedia (4861 - 30789, n=96, last 2 years) | |
| Dell Inspiron 16 7640 2-in-1 | |
| Medion S10 OLED | |
| Average Intel Core Ultra 7 155H (9769 - 19007, n=52) | |
| SCHENKER XMG Evo 15 (M24) | |
| Lenovo ThinkPad T16 G2 21K70035GE | |
| Cinebench R23 / Single Core | |
| Average of class Multimedia (878 - 2290, n=87, last 2 years) | |
| Medion S10 OLED | |
| Lenovo IdeaPad Pro 5 16IMH G9 | |
| Xiaomi RedmiBook Pro 16 2024 | |
| Dell Inspiron 16 7640 2-in-1 | |
| SCHENKER XMG Evo 15 (M24) | |
| Average Intel Core Ultra 7 155H (1496 - 1815, n=52) | |
| Lenovo ThinkPad T16 G2 21K70035GE | |
| Cinebench R20 / CPU (Multi Core) | |
| Lenovo IdeaPad Pro 5 16IMH G9 | |
| Xiaomi RedmiBook Pro 16 2024 | |
| Dell Inspiron 16 7640 2-in-1 | |
| Medion S10 OLED | |
| Average of class Multimedia (1887 - 11924, n=80, last 2 years) | |
| Average Intel Core Ultra 7 155H (3798 - 7409, n=50) | |
| SCHENKER XMG Evo 15 (M24) | |
| Lenovo ThinkPad T16 G2 21K70035GE | |
| Cinebench R20 / CPU (Single Core) | |
| Lenovo IdeaPad Pro 5 16IMH G9 | |
| Medion S10 OLED | |
| SCHENKER XMG Evo 15 (M24) | |
| Lenovo ThinkPad T16 G2 21K70035GE | |
| Average of class Multimedia (341 - 853, n=80, last 2 years) | |
| Xiaomi RedmiBook Pro 16 2024 | |
| Dell Inspiron 16 7640 2-in-1 | |
| Average Intel Core Ultra 7 155H (601 - 696, n=50) | |
| Cinebench R15 / CPU Multi 64Bit | |
| Xiaomi RedmiBook Pro 16 2024 | |
| Lenovo IdeaPad Pro 5 16IMH G9 | |
| Dell Inspiron 16 7640 2-in-1 | |
| Average of class Multimedia (856 - 5224, n=87, last 2 years) | |
| Average Intel Core Ultra 7 155H (1932 - 2880, n=56) | |
| Medion S10 OLED | |
| SCHENKER XMG Evo 15 (M24) | |
| Lenovo ThinkPad T16 G2 21K70035GE | |
| Cinebench R15 / CPU Single 64Bit | |
| Lenovo IdeaPad Pro 5 16IMH G9 | |
| Lenovo ThinkPad T16 G2 21K70035GE | |
| SCHENKER XMG Evo 15 (M24) | |
| Average of class Multimedia (99.6 - 323, n=82, last 2 years) | |
| Medion S10 OLED | |
| Xiaomi RedmiBook Pro 16 2024 | |
| Dell Inspiron 16 7640 2-in-1 | |
| Average Intel Core Ultra 7 155H (99.6 - 268, n=52) | |
| Blender / v2.79 BMW27 CPU | |
| Average of class Multimedia (100 - 557, n=80, last 2 years) | |
| Lenovo ThinkPad T16 G2 21K70035GE | |
| Average Intel Core Ultra 7 155H (175 - 381, n=47) | |
| Dell Inspiron 16 7640 2-in-1 | |
| SCHENKER XMG Evo 15 (M24) | |
| Medion S10 OLED | |
| Lenovo IdeaPad Pro 5 16IMH G9 | |
| Xiaomi RedmiBook Pro 16 2024 | |
| 7-Zip 18.03 / 7z b 4 | |
| Lenovo IdeaPad Pro 5 16IMH G9 | |
| Xiaomi RedmiBook Pro 16 2024 | |
| Dell Inspiron 16 7640 2-in-1 | |
| SCHENKER XMG Evo 15 (M24) | |
| Average of class Multimedia (29095 - 130368, n=75, last 2 years) | |
| Average Intel Core Ultra 7 155H (41739 - 70254, n=50) | |
| Medion S10 OLED | |
| Lenovo ThinkPad T16 G2 21K70035GE | |
| 7-Zip 18.03 / 7z b 4 -mmt1 | |
| Lenovo ThinkPad T16 G2 21K70035GE | |
| Average of class Multimedia (3398 - 7545, n=75, last 2 years) | |
| SCHENKER XMG Evo 15 (M24) | |
| Medion S10 OLED | |
| Xiaomi RedmiBook Pro 16 2024 | |
| Lenovo IdeaPad Pro 5 16IMH G9 | |
| Dell Inspiron 16 7640 2-in-1 | |
| Average Intel Core Ultra 7 155H (4594 - 5621, n=50) | |
| Geekbench 6.4 / Multi-Core | |
| Average of class Multimedia (4983 - 25760, n=77, last 2 years) | |
| Xiaomi RedmiBook Pro 16 2024 | |
| Lenovo IdeaPad Pro 5 16IMH G9 | |
| SCHENKER XMG Evo 15 (M24) | |
| Average Intel Core Ultra 7 155H (7732 - 13656, n=55) | |
| Dell Inspiron 16 7640 2-in-1 | |
| Medion S10 OLED | |
| Lenovo ThinkPad T16 G2 21K70035GE | |
| Geekbench 6.4 / Single-Core | |
| Average of class Multimedia (1534 - 3927, n=73, last 2 years) | |
| Lenovo ThinkPad T16 G2 21K70035GE | |
| SCHENKER XMG Evo 15 (M24) | |
| Medion S10 OLED | |
| Lenovo IdeaPad Pro 5 16IMH G9 | |
| Xiaomi RedmiBook Pro 16 2024 | |
| Average Intel Core Ultra 7 155H (1901 - 2473, n=52) | |
| Dell Inspiron 16 7640 2-in-1 | |
| Geekbench 5.5 / Multi-Core | |
| Xiaomi RedmiBook Pro 16 2024 | |
| Lenovo IdeaPad Pro 5 16IMH G9 | |
| Dell Inspiron 16 7640 2-in-1 | |
| Average of class Multimedia (4652 - 23059, n=79, last 2 years) | |
| Average Intel Core Ultra 7 155H (10017 - 13556, n=52) | |
| SCHENKER XMG Evo 15 (M24) | |
| Medion S10 OLED | |
| Lenovo ThinkPad T16 G2 21K70035GE | |
| Geekbench 5.5 / Single-Core | |
| Average of class Multimedia (891 - 2555, n=79, last 2 years) | |
| SCHENKER XMG Evo 15 (M24) | |
| Lenovo IdeaPad Pro 5 16IMH G9 | |
| Xiaomi RedmiBook Pro 16 2024 | |
| Medion S10 OLED | |
| Dell Inspiron 16 7640 2-in-1 | |
| Lenovo ThinkPad T16 G2 21K70035GE | |
| Average Intel Core Ultra 7 155H (1462 - 1824, n=52) | |
| HWBOT x265 Benchmark v2.2 / 4k Preset | |
| Lenovo IdeaPad Pro 5 16IMH G9 | |
| Xiaomi RedmiBook Pro 16 2024 | |
| Dell Inspiron 16 7640 2-in-1 | |
| SCHENKER XMG Evo 15 (M24) | |
| Average of class Multimedia (5.26 - 34.3, n=74, last 2 years) | |
| Medion S10 OLED | |
| Average Intel Core Ultra 7 155H (9.93 - 21.2, n=50) | |
| Lenovo ThinkPad T16 G2 21K70035GE | |
| LibreOffice / 20 Documents To PDF | |
| Average of class Multimedia (23.9 - 146.7, n=76, last 2 years) | |
| Average Intel Core Ultra 7 155H (37.5 - 79.2, n=49) | |
| Medion S10 OLED | |
| Xiaomi RedmiBook Pro 16 2024 | |
| Dell Inspiron 16 7640 2-in-1 | |
| Lenovo ThinkPad T16 G2 21K70035GE | |
| SCHENKER XMG Evo 15 (M24) | |
| Lenovo IdeaPad Pro 5 16IMH G9 | |
| R Benchmark 2.5 / Overall mean | |
| Dell Inspiron 16 7640 2-in-1 | |
| Average Intel Core Ultra 7 155H (0.4457 - 0.53, n=49) | |
| Average of class Multimedia (0.3604 - 0.947, n=74, last 2 years) | |
| Lenovo ThinkPad T16 G2 21K70035GE | |
| Xiaomi RedmiBook Pro 16 2024 | |
| Medion S10 OLED | |
| Lenovo IdeaPad Pro 5 16IMH G9 | |
| SCHENKER XMG Evo 15 (M24) | |
* ... smaller is better
AIDA64: FP32 Ray-Trace | FPU Julia | CPU SHA3 | CPU Queen | FPU SinJulia | FPU Mandel | CPU AES | CPU ZLib | FP64 Ray-Trace | CPU PhotoWorxx
| Performance Rating | |
| Lenovo ThinkPad T16 G2 21K70035GE | |
| Lenovo IdeaPad Pro 5 16IMH G9 | |
| Xiaomi RedmiBook Pro 16 2024 | |
| Average of class Multimedia | |
| Dell Inspiron 16 7640 2-in-1 | |
| SCHENKER XMG Evo 15 (M24) | |
| Medion S10 OLED | |
| Average Intel Core Ultra 7 155H | |
| AIDA64 / FP32 Ray-Trace | |
| Lenovo ThinkPad T16 G2 21K70035GE | |
| Lenovo IdeaPad Pro 5 16IMH G9 | |
| Average of class Multimedia (5121 - 50388, n=73, last 2 years) | |
| Medion S10 OLED | |
| Dell Inspiron 16 7640 2-in-1 | |
| Xiaomi RedmiBook Pro 16 2024 | |
| Average Intel Core Ultra 7 155H (6670 - 18470, n=50) | |
| SCHENKER XMG Evo 15 (M24) | |
| AIDA64 / FPU Julia | |
| Lenovo ThinkPad T16 G2 21K70035GE | |
| Lenovo IdeaPad Pro 5 16IMH G9 | |
| Xiaomi RedmiBook Pro 16 2024 | |
| Medion S10 OLED | |
| Average of class Multimedia (14528 - 201874, n=74, last 2 years) | |
| Dell Inspiron 16 7640 2-in-1 | |
| SCHENKER XMG Evo 15 (M24) | |
| Average Intel Core Ultra 7 155H (40905 - 93181, n=50) | |
| AIDA64 / CPU SHA3 | |
| Lenovo IdeaPad Pro 5 16IMH G9 | |
| Lenovo ThinkPad T16 G2 21K70035GE | |
| Xiaomi RedmiBook Pro 16 2024 | |
| Average of class Multimedia (1188 - 8623, n=74, last 2 years) | |
| Medion S10 OLED | |
| Dell Inspiron 16 7640 2-in-1 | |
| SCHENKER XMG Evo 15 (M24) | |
| Average Intel Core Ultra 7 155H (1940 - 4436, n=50) | |
| AIDA64 / CPU Queen | |
| Lenovo ThinkPad T16 G2 21K70035GE | |
| Dell Inspiron 16 7640 2-in-1 | |
| Average of class Multimedia (21547 - 181505, n=74, last 2 years) | |
| Xiaomi RedmiBook Pro 16 2024 | |
| Lenovo IdeaPad Pro 5 16IMH G9 | |
| Average Intel Core Ultra 7 155H (64698 - 94181, n=50) | |
| SCHENKER XMG Evo 15 (M24) | |
| Medion S10 OLED | |
| AIDA64 / FPU SinJulia | |
| Lenovo ThinkPad T16 G2 21K70035GE | |
| Lenovo IdeaPad Pro 5 16IMH G9 | |
| Dell Inspiron 16 7640 2-in-1 | |
| Xiaomi RedmiBook Pro 16 2024 | |
| Average of class Multimedia (1240 - 28794, n=74, last 2 years) | |
| SCHENKER XMG Evo 15 (M24) | |
| Average Intel Core Ultra 7 155H (5639 - 10647, n=50) | |
| Medion S10 OLED | |
| AIDA64 / FPU Mandel | |
| Lenovo ThinkPad T16 G2 21K70035GE | |
| Lenovo IdeaPad Pro 5 16IMH G9 | |
| Medion S10 OLED | |
| Average of class Multimedia (9903 - 105740, n=73, last 2 years) | |
| Xiaomi RedmiBook Pro 16 2024 | |
| Dell Inspiron 16 7640 2-in-1 | |
| SCHENKER XMG Evo 15 (M24) | |
| Average Intel Core Ultra 7 155H (18236 - 47685, n=50) | |
| AIDA64 / CPU AES | |
| SCHENKER XMG Evo 15 (M24) | |
| Lenovo IdeaPad Pro 5 16IMH G9 | |
| Average Intel Core Ultra 7 155H (45713 - 152179, n=50) | |
| Average of class Multimedia (26066 - 169946, n=74, last 2 years) | |
| Lenovo ThinkPad T16 G2 21K70035GE | |
| Dell Inspiron 16 7640 2-in-1 | |
| Xiaomi RedmiBook Pro 16 2024 | |
| Medion S10 OLED | |
| AIDA64 / CPU ZLib | |
| Lenovo IdeaPad Pro 5 16IMH G9 | |
| Xiaomi RedmiBook Pro 16 2024 | |
| Dell Inspiron 16 7640 2-in-1 | |
| Medion S10 OLED | |
| Average of class Multimedia (440 - 2022, n=74, last 2 years) | |
| Average Intel Core Ultra 7 155H (557 - 1250, n=50) | |
| SCHENKER XMG Evo 15 (M24) | |
| Lenovo ThinkPad T16 G2 21K70035GE | |
| AIDA64 / FP64 Ray-Trace | |
| Lenovo ThinkPad T16 G2 21K70035GE | |
| Lenovo IdeaPad Pro 5 16IMH G9 | |
| Average of class Multimedia (2759 - 26875, n=74, last 2 years) | |
| Medion S10 OLED | |
| Dell Inspiron 16 7640 2-in-1 | |
| Xiaomi RedmiBook Pro 16 2024 | |
| SCHENKER XMG Evo 15 (M24) | |
| Average Intel Core Ultra 7 155H (3569 - 9802, n=50) | |
| AIDA64 / CPU PhotoWorxx | |
| Lenovo IdeaPad Pro 5 16IMH G9 | |
| Xiaomi RedmiBook Pro 16 2024 | |
| Average Intel Core Ultra 7 155H (32719 - 54223, n=50) | |
| SCHENKER XMG Evo 15 (M24) | |
| Dell Inspiron 16 7640 2-in-1 | |
| Average of class Multimedia (12860 - 58844, n=74, last 2 years) | |
| Medion S10 OLED | |
| Lenovo ThinkPad T16 G2 21K70035GE | |
系统性能
Evo 15 的整体系统性能非常出色,在日常使用中速度非常快。在测试期间,我们也没有遇到系统稳定性方面的问题。
CrossMark: Overall | Productivity | Creativity | Responsiveness
WebXPRT 3: Overall
WebXPRT 4: Overall
Mozilla Kraken 1.1: Total
| PCMark 10 / Score | |
| SCHENKER XMG Evo 15 (M24) | |
| Lenovo IdeaPad Pro 5 16IMH G9 | |
| Dell Inspiron 16 7640 2-in-1 | |
| Xiaomi RedmiBook Pro 16 2024 | |
| Average of class Multimedia (4325 - 8670, n=70, last 2 years) | |
| Average Intel Core Ultra 7 155H, Intel Arc 8-Core iGPU (4809 - 7529, n=34) | |
| Lenovo ThinkPad T16 G2 21K70035GE | |
| Medion S10 OLED | |
| PCMark 10 / Essentials | |
| Lenovo IdeaPad Pro 5 16IMH G9 | |
| SCHENKER XMG Evo 15 (M24) | |
| Dell Inspiron 16 7640 2-in-1 | |
| Xiaomi RedmiBook Pro 16 2024 | |
| Average of class Multimedia (8025 - 12420, n=70, last 2 years) | |
| Average Intel Core Ultra 7 155H, Intel Arc 8-Core iGPU (7605 - 11289, n=34) | |
| Lenovo ThinkPad T16 G2 21K70035GE | |
| Medion S10 OLED | |
| PCMark 10 / Productivity | |
| Average of class Multimedia (6089 - 10615, n=70, last 2 years) | |
| Lenovo IdeaPad Pro 5 16IMH G9 | |
| Lenovo ThinkPad T16 G2 21K70035GE | |
| SCHENKER XMG Evo 15 (M24) | |
| Dell Inspiron 16 7640 2-in-1 | |
| Average Intel Core Ultra 7 155H, Intel Arc 8-Core iGPU (6042 - 10591, n=34) | |
| Xiaomi RedmiBook Pro 16 2024 | |
| Medion S10 OLED | |
| PCMark 10 / Digital Content Creation | |
| SCHENKER XMG Evo 15 (M24) | |
| Xiaomi RedmiBook Pro 16 2024 | |
| Lenovo IdeaPad Pro 5 16IMH G9 | |
| Dell Inspiron 16 7640 2-in-1 | |
| Average of class Multimedia (3651 - 13548, n=70, last 2 years) | |
| Average Intel Core Ultra 7 155H, Intel Arc 8-Core iGPU (4985 - 10709, n=34) | |
| Medion S10 OLED | |
| Lenovo ThinkPad T16 G2 21K70035GE | |
| CrossMark / Overall | |
| SCHENKER XMG Evo 15 (M24) | |
| Xiaomi RedmiBook Pro 16 2024 | |
| Average of class Multimedia (866 - 2255, n=81, last 2 years) | |
| Dell Inspiron 16 7640 2-in-1 | |
| Medion S10 OLED | |
| Average Intel Core Ultra 7 155H, Intel Arc 8-Core iGPU (1366 - 1903, n=34) | |
| Lenovo ThinkPad T16 G2 21K70035GE | |
| Lenovo IdeaPad Pro 5 16IMH G9 | |
| CrossMark / Productivity | |
| SCHENKER XMG Evo 15 (M24) | |
| Xiaomi RedmiBook Pro 16 2024 | |
| Medion S10 OLED | |
| Average of class Multimedia (913 - 2050, n=81, last 2 years) | |
| Dell Inspiron 16 7640 2-in-1 | |
| Average Intel Core Ultra 7 155H, Intel Arc 8-Core iGPU (1291 - 1798, n=33) | |
| Lenovo ThinkPad T16 G2 21K70035GE | |
| Lenovo IdeaPad Pro 5 16IMH G9 | |
| CrossMark / Creativity | |
| Average of class Multimedia (907 - 2795, n=81, last 2 years) | |
| Xiaomi RedmiBook Pro 16 2024 | |
| Dell Inspiron 16 7640 2-in-1 | |
| SCHENKER XMG Evo 15 (M24) | |
| Lenovo IdeaPad Pro 5 16IMH G9 | |
| Average Intel Core Ultra 7 155H, Intel Arc 8-Core iGPU (1519 - 1929, n=33) | |
| Medion S10 OLED | |
| Lenovo ThinkPad T16 G2 21K70035GE | |
| CrossMark / Responsiveness | |
| SCHENKER XMG Evo 15 (M24) | |
| Xiaomi RedmiBook Pro 16 2024 | |
| Medion S10 OLED | |
| Average of class Multimedia (605 - 2094, n=81, last 2 years) | |
| Average Intel Core Ultra 7 155H, Intel Arc 8-Core iGPU (939 - 1802, n=33) | |
| Dell Inspiron 16 7640 2-in-1 | |
| Lenovo ThinkPad T16 G2 21K70035GE | |
| Lenovo IdeaPad Pro 5 16IMH G9 | |
| WebXPRT 3 / Overall | |
| Average of class Multimedia (136.4 - 545, n=81, last 2 years) | |
| Lenovo IdeaPad Pro 5 16IMH G9 | |
| Dell Inspiron 16 7640 2-in-1 | |
| SCHENKER XMG Evo 15 (M24) | |
| Xiaomi RedmiBook Pro 16 2024 | |
| Average Intel Core Ultra 7 155H, Intel Arc 8-Core iGPU (252 - 299, n=34) | |
| Lenovo ThinkPad T16 G2 21K70035GE | |
| Medion S10 OLED | |
| WebXPRT 4 / Overall | |
| Average of class Multimedia (133.2 - 353, n=75, last 2 years) | |
| SCHENKER XMG Evo 15 (M24) | |
| Lenovo IdeaPad Pro 5 16IMH G9 | |
| Dell Inspiron 16 7640 2-in-1 | |
| Xiaomi RedmiBook Pro 16 2024 | |
| Average Intel Core Ultra 7 155H, Intel Arc 8-Core iGPU (166.4 - 309, n=29) | |
| Medion S10 OLED | |
| Lenovo ThinkPad T16 G2 21K70035GE | |
| Mozilla Kraken 1.1 / Total | |
| Medion S10 OLED | |
| Medion S10 OLED | |
| Lenovo ThinkPad T16 G2 21K70035GE | |
| Average Intel Core Ultra 7 155H, Intel Arc 8-Core iGPU (517 - 614, n=35) | |
| SCHENKER XMG Evo 15 (M24) | |
| Dell Inspiron 16 7640 2-in-1 | |
| Xiaomi RedmiBook Pro 16 2024 | |
| Lenovo IdeaPad Pro 5 16IMH G9 | |
| Average of class Multimedia (254 - 1016, n=86, last 2 years) | |
* ... smaller is better
| PCMark 10 Score | 7331 points | |
Help | ||
| AIDA64 / Memory Copy | |
| Lenovo IdeaPad Pro 5 16IMH G9 | |
| Xiaomi RedmiBook Pro 16 2024 | |
| Average Intel Core Ultra 7 155H (62397 - 96791, n=50) | |
| Dell Inspiron 16 7640 2-in-1 | |
| Average of class Multimedia (21158 - 104459, n=74, last 2 years) | |
| SCHENKER XMG Evo 15 (M24) | |
| Lenovo ThinkPad T16 G2 21K70035GE | |
| Medion S10 OLED | |
| AIDA64 / Memory Read | |
| Lenovo IdeaPad Pro 5 16IMH G9 | |
| Xiaomi RedmiBook Pro 16 2024 | |
| Average Intel Core Ultra 7 155H (60544 - 90647, n=50) | |
| SCHENKER XMG Evo 15 (M24) | |
| Medion S10 OLED | |
| Dell Inspiron 16 7640 2-in-1 | |
| Average of class Multimedia (24312 - 125604, n=74, last 2 years) | |
| Lenovo ThinkPad T16 G2 21K70035GE | |
| AIDA64 / Memory Write | |
| Lenovo ThinkPad T16 G2 21K70035GE | |
| Dell Inspiron 16 7640 2-in-1 | |
| Lenovo IdeaPad Pro 5 16IMH G9 | |
| Average Intel Core Ultra 7 155H (58692 - 93451, n=50) | |
| Average of class Multimedia (23679 - 117933, n=74, last 2 years) | |
| SCHENKER XMG Evo 15 (M24) | |
| Xiaomi RedmiBook Pro 16 2024 | |
| Medion S10 OLED | |
| AIDA64 / Memory Latency | |
| Dell Inspiron 16 7640 2-in-1 | |
| Average Intel Core Ultra 7 155H (116.2 - 233, n=50) | |
| Medion S10 OLED | |
| Xiaomi RedmiBook Pro 16 2024 | |
| Lenovo IdeaPad Pro 5 16IMH G9 | |
| SCHENKER XMG Evo 15 (M24) | |
| Lenovo ThinkPad T16 G2 21K70035GE | |
| Average of class Multimedia (7 - 346, n=74, last 2 years) | |
* ... smaller is better
DPC 延迟
在我们的标准化延迟测试(上网、4K YouTube 播放、CPU 负载)中,使用当前 BIOS 版本的测试设备在使用实时音频应用程序时略有限制。
| DPC Latencies / LatencyMon - interrupt to process latency (max), Web, Youtube, Prime95 | |
| Medion S10 OLED | |
| SCHENKER XMG Evo 15 (M24) | |
| Dell Inspiron 16 7640 2-in-1 | |
| Lenovo IdeaPad Pro 5 16IMH G9 | |
| Lenovo ThinkPad T16 G2 21K70035GE | |
| Xiaomi RedmiBook Pro 16 2024 | |
* ... smaller is better
大容量存储器
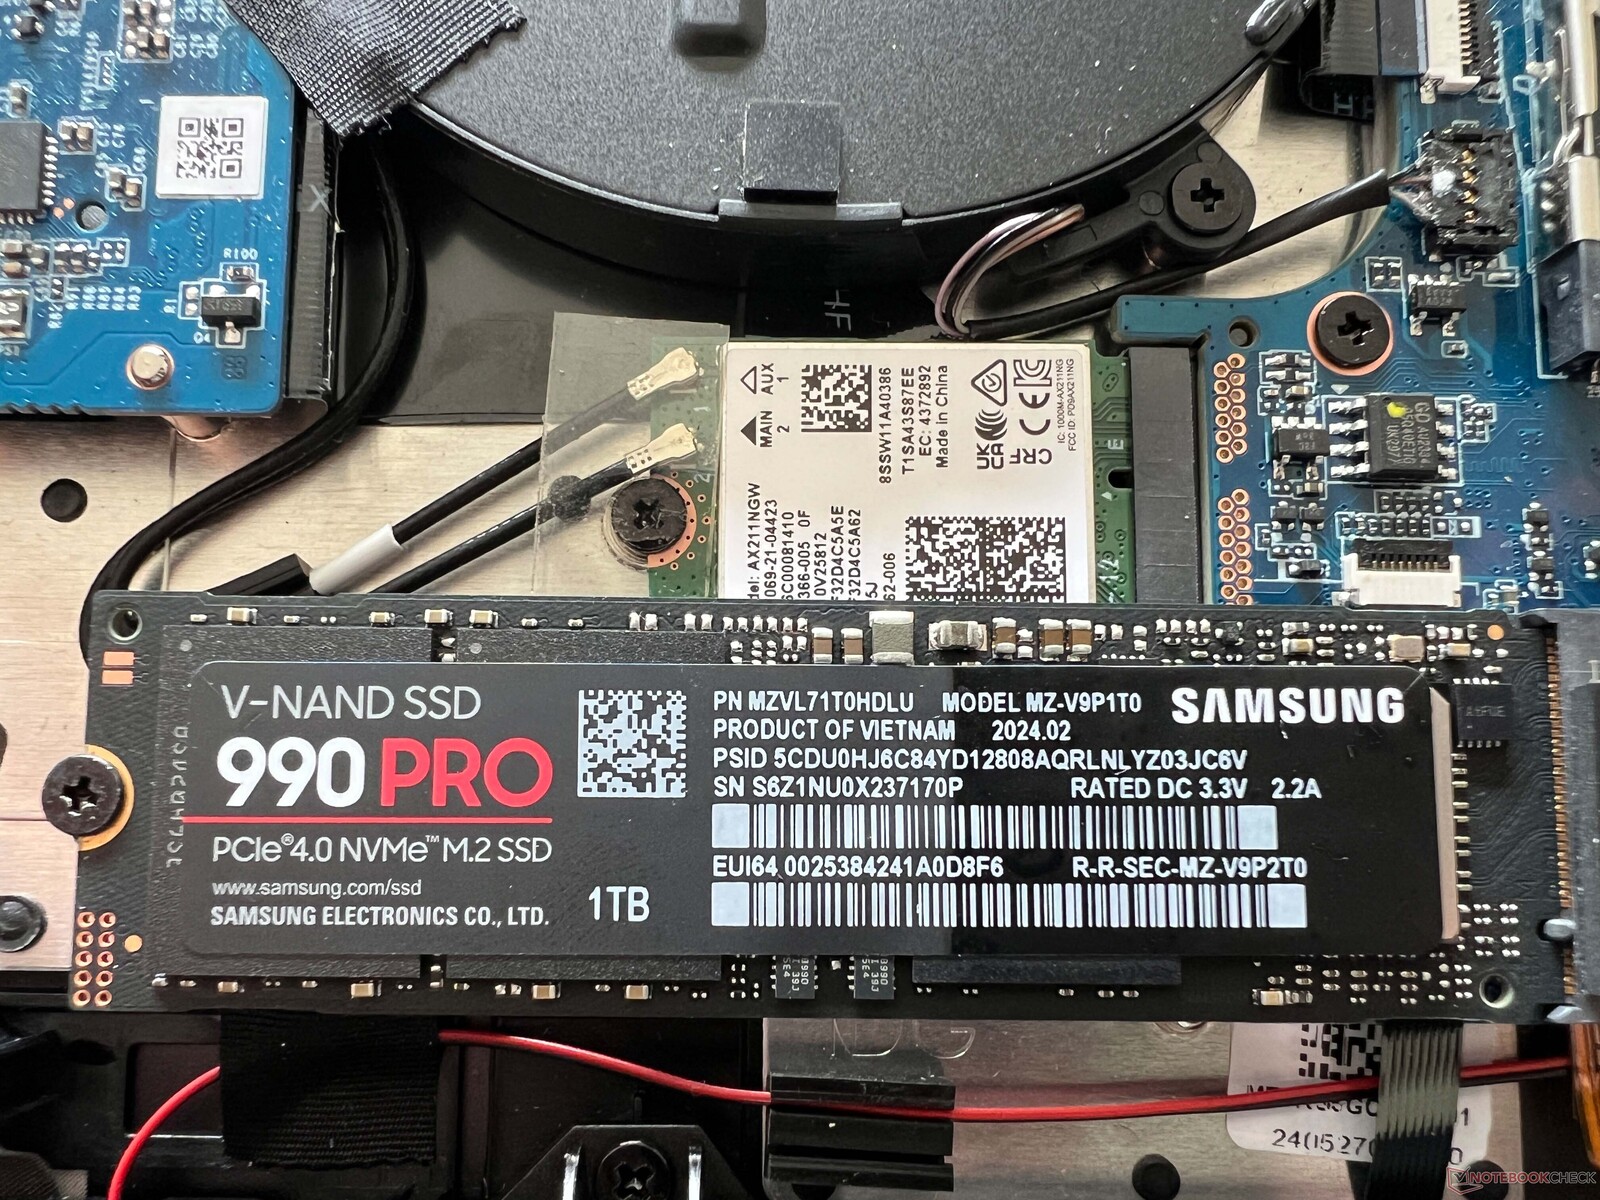
XMG Evo 15 (M24) 提供两个 M.2-2280 插槽,通过 PCIe 4.0 连接,还支持 RAID 阵列(0/1)。Evo 标配 500 GB WD Blue SN580,但我们的测试设备配备的是 1 TB 版本的三星 990 Pro,这是一款速度极快的固态硬盘,传输速率高达 7 GB/s。此外,即使在长时间负载的情况下,性能也能保持完全稳定,这并非理所当然。初始启动后,用户可支配的容量为 878 GB。更多固态硬盘基准测试 这里.

* ... smaller is better
Continuous read: DiskSpd Read Loop, Queue Depth 8
图形卡 - Intel Arc Graphics
Evo 15 使用集成的 弧形图形尽管这是配备 8 个 Xe 内核的快速版本。iGPU 得益于双通道内存配置,与采用更快的 7467 内存的竞争对手相比(如红米本 Pro 16),它的 iGPU 性能更胜一筹。 红米笔记本 Pro 16或 IdeaPad Pro 5 16)相比,合成基准测试中的图形性能总体上仅略低一些。图形性能 Radeon 780M在基准测试中刚刚被超越。在 GPU 表格中,我们还包括了 申克 Via 14 Pro的性能与配备 AMD 处理器的 XMG Evo 15 不相上下。
目前的英特尔 GPU 是日常多媒体的不错选择,最近几个月的驱动程序更新也提高了游戏性能,总的来说没有什么意外。不过,在实际游戏性能方面,Arc Graphics 失去了领先优势,iGPU 最终在性能上处于同一水平。
图形性能在持续负载下保持不变,但在电池模式下性能下降了约 26%。更多 GPU 基准测试可在 技术部分.
| 3DMark 11 Performance | 13430 points | |
| 3DMark Fire Strike Score | 7941 points | |
| 3DMark Time Spy Score | 4067 points | |
| 3DMark Steel Nomad Score | 757 points | |
| 3DMark Steel Nomad Light Score | 3248 points | |
Help | ||
| Blender / v3.3 Classroom CPU | |
| Average Intel Arc 8-Core iGPU (294 - 692, n=41) | |
| Average of class Multimedia (160 - 1042, n=80, last 2 years) | |
| Lenovo ThinkPad T16 G2 21K70035GE | |
| Dell Inspiron 16 7640 2-in-1 | |
| SCHENKER XMG Evo 15 (M24) | |
| Medion S10 OLED | |
| Xiaomi RedmiBook Pro 16 2024 | |
| Lenovo IdeaPad Pro 5 16IMH G9 | |
| Blender / v3.3 Classroom oneAPI/Intel | |
| Average of class Multimedia (203 - 401, n=5, last 2 years) | |
| Average Intel Arc 8-Core iGPU (208 - 309, n=16) | |
| Dell Inspiron 16 7640 2-in-1 | |
* ... smaller is better
| The Witcher 3 - 1920x1080 Ultra Graphics & Postprocessing (HBAO+) | |
| Average of class Multimedia (11 - 143.2, n=62, last 2 years) | |
| SCHENKER XMG Evo 15 (M24) | |
| Lenovo IdeaPad Pro 5 16IMH G9 | |
| Xiaomi RedmiBook Pro 16 2024 | |
| Lenovo ThinkPad T16 G2 21K70035GE | |
| Dell Inspiron 16 7640 2-in-1 | |
| GTA V - 1920x1080 Highest Settings possible AA:4xMSAA + FX AF:16x | |
| Average of class Multimedia (9.38 - 141.6, n=77, last 2 years) | |
| SCHENKER VIA 14 Pro (M24) | |
| Lenovo ThinkPad T16 G2 21K70035GE | |
| SCHENKER XMG Evo 15 (M24) | |
| Lenovo IdeaPad Pro 5 16IMH G9 | |
| Xiaomi RedmiBook Pro 16 2024 | |
| Medion S10 OLED | |
Cyberpunk 2077 Ultra FPS chart
| low | med. | high | ultra | |
|---|---|---|---|---|
| GTA V (2015) | 169.3 | 160.2 | 44.7 | 17.8 |
| The Witcher 3 (2015) | 152 | 93 | 49 | 26 |
| Dota 2 Reborn (2015) | 107.4 | 90.8 | 83.3 | 80.5 |
| Final Fantasy XV Benchmark (2018) | 77 | 40.3 | 29.2 | |
| X-Plane 11.11 (2018) | 54 | 40.4 | 35.8 | |
| Far Cry 5 (2018) | 77 | 43 | 41 | 38 |
| Strange Brigade (2018) | 171 | 73 | 62 | 52 |
| F1 22 (2022) | 96.1 | 87 | 65.2 | 16.9 |
| Baldur's Gate 3 (2023) | 40.3 | 31.1 | 27.5 | 26.2 |
| Cyberpunk 2077 2.2 Phantom Liberty (2023) | 37.9 | 31.4 | 26.7 | 23.7 |
| Total War Pharaoh (2023) | 101.4 | 77.6 | 58.9 | 52 |
排放 - 日常生活中的安静
噪音排放
Evo 15 的散热系统在空转或低负载时通常处于停用或非常安静的状态。如果笔记本电脑的负载较高,则取决于主动能源配置文件。在发烧友模式下,最大噪音为 40.4 dB(A),在平衡模式和电池模式下,最大噪音为 35.4 dB(A)。如果想在Overboost 模式下使用处理器的全部功率,散热会明显变大,最大可达 48.1 dB(A)。一旦负载阶段结束,风扇又会迅速降速(在每个配置文件中)。Evo 15 测试设备中没有其他电子噪音。
Noise Level
| Idle |
| 24.7 / 24.7 / 28.9 dB(A) |
| Load |
| 32.7 / 40.4 dB(A) |
 | ||
30 dB silent 40 dB(A) audible 50 dB(A) loud |
||
min: | ||
| SCHENKER XMG Evo 15 (M24) Arc 8-Core, Ultra 7 155H, Samsung 990 Pro 1 TB | Dell Inspiron 16 7640 2-in-1 Arc 8-Core, Ultra 7 155H, Micron 2550 1TB | Medion S10 OLED Arc 8-Core, Ultra 7 155H, Phison PS5019-E19 SSO1TBITC4-E19-V7 | Xiaomi RedmiBook Pro 16 2024 Arc 8-Core, Ultra 7 155H, YMTC PC300-1TB | Lenovo IdeaPad Pro 5 16IMH G9 Arc 8-Core, Ultra 7 155H, Samsung PM9C1a MZAL81T0HDLB | Lenovo ThinkPad T16 G2 21K70035GE Radeon 780M, R7 7840U, SK hynix PC801 HFS001TEJ9X162N | |
|---|---|---|---|---|---|---|
| Noise | -4% | -9% | 4% | -6% | 8% | |
| off / environment * | 24.7 | 22.9 7% | 25 -1% | 24.4 1% | 24.1 2% | 24.5 1% |
| Idle Minimum * | 24.7 | 22.9 7% | 26 -5% | 24.4 1% | 24.1 2% | 24.5 1% |
| Idle Average * | 24.7 | 22.9 7% | 27 -9% | 24.4 1% | 24.1 2% | 24.5 1% |
| Idle Maximum * | 28.9 | 25 13% | 28 3% | 24.4 16% | 28.2 2% | 24.5 15% |
| Load Average * | 32.7 | 45.1 -38% | 43 -31% | 32 2% | 44.4 -36% | 26.6 19% |
| Cyberpunk 2077 ultra * | 40.4 | 44.9 -11% | 42 -4% | |||
| Load Maximum * | 40.4 | 44.9 -11% | 48 -19% | 39.7 2% | 44.4 -10% | 35.5 12% |
| Witcher 3 ultra * | 30.6 | 36.5 | 37.2 |
* ... smaller is better
温度
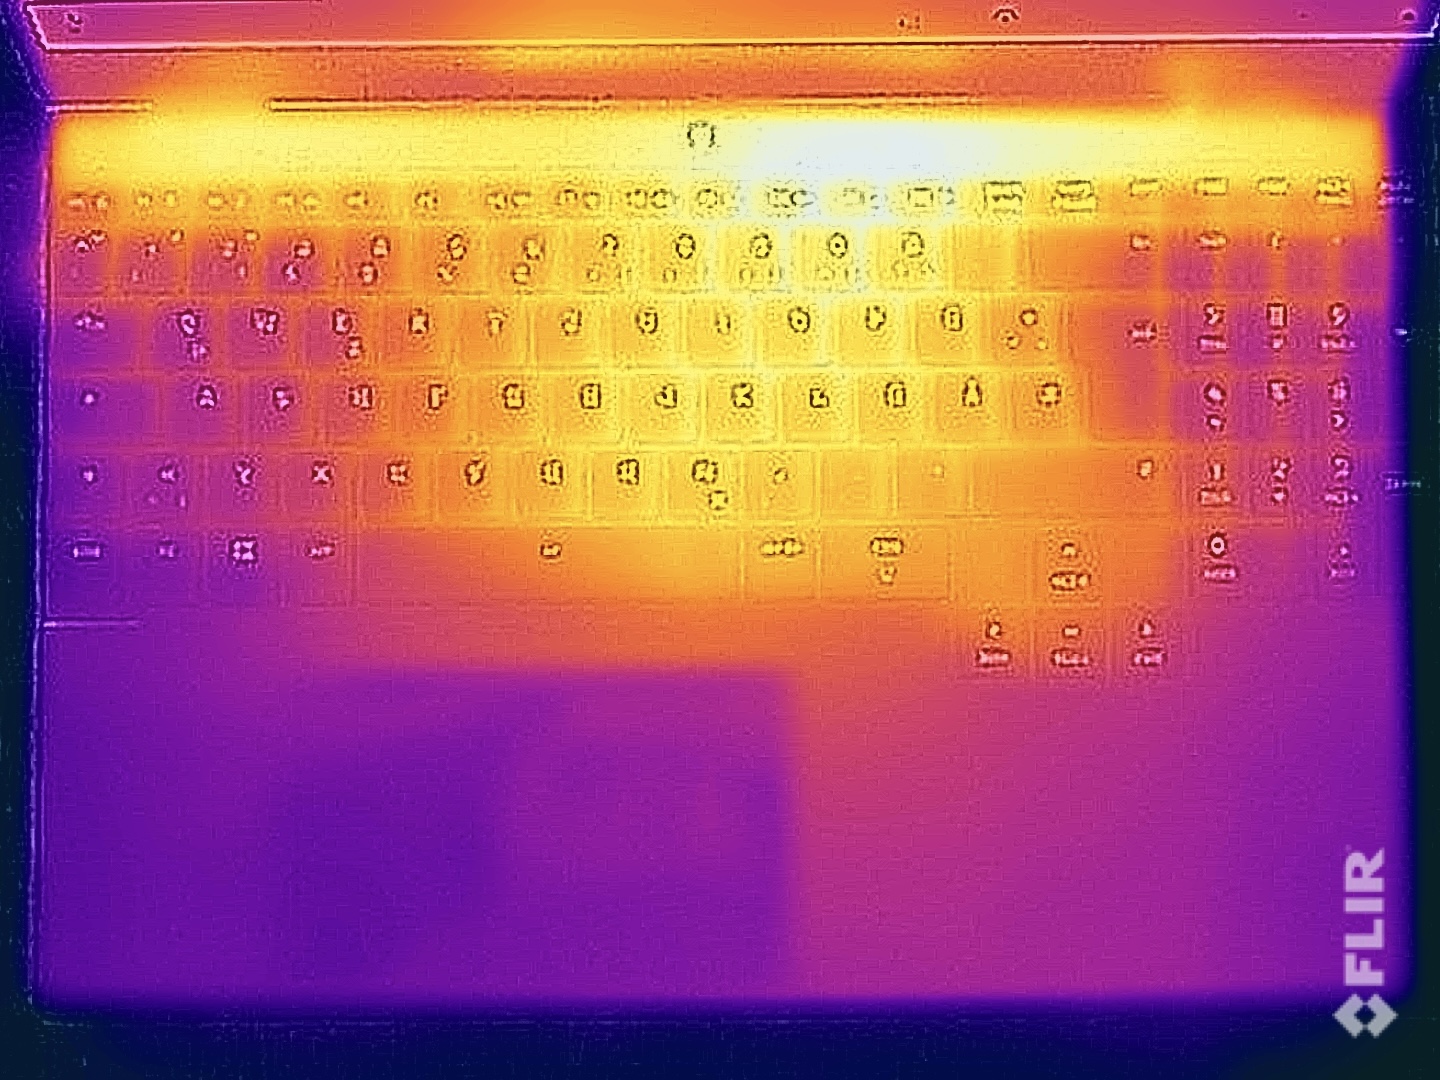
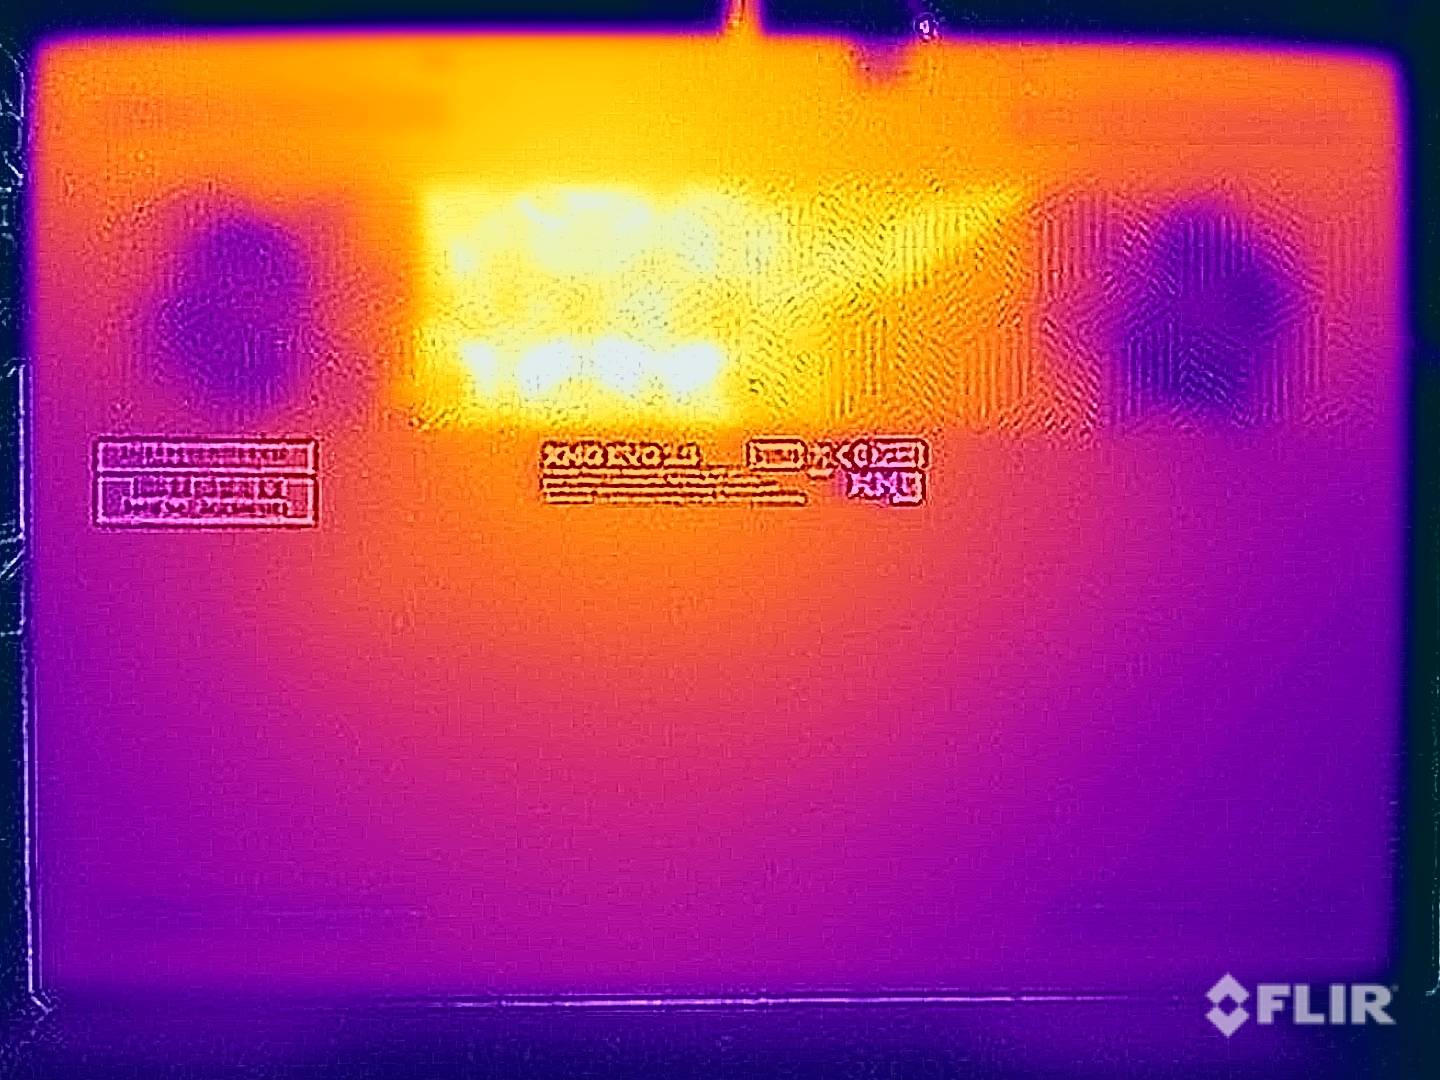
Evo 15 的铝制外壳在低负载时非常凉爽,即使在负载情况下也没有问题。在极端情况下,底部温度可达近 50 °C,但热点位于后部中间区域的底部。该设备甚至可以放在大腿上使用。键盘区域整体温度明显较低,即使在负载情况下也是如此,打字时没有任何限制。在压力测试中,处理器始终保持指定的 TDP 值。

(±) The maximum temperature on the upper side is 41.7 °C / 107 F, compared to the average of 36.9 °C / 98 F, ranging from 21.1 to 71 °C for the class Multimedia.
(-) The bottom heats up to a maximum of 49.6 °C / 121 F, compared to the average of 39.2 °C / 103 F
(+) In idle usage, the average temperature for the upper side is 29.5 °C / 85 F, compared to the device average of 31.3 °C / 88 F.
(±) 3: The average temperature for the upper side is 34.3 °C / 94 F, compared to the average of 31.3 °C / 88 F for the class Multimedia.
(+) The palmrests and touchpad are reaching skin temperature as a maximum (32 °C / 89.6 F) and are therefore not hot.
(-) The average temperature of the palmrest area of similar devices was 28.8 °C / 83.8 F (-3.2 °C / -5.8 F).
| SCHENKER XMG Evo 15 (M24) Intel Core Ultra 7 155H, Intel Arc 8-Core iGPU | Dell Inspiron 16 7640 2-in-1 Intel Core Ultra 7 155H, Intel Arc 8-Core iGPU | Medion S10 OLED Intel Core Ultra 7 155H, Intel Arc 8-Core iGPU | Xiaomi RedmiBook Pro 16 2024 Intel Core Ultra 7 155H, Intel Arc 8-Core iGPU | Lenovo IdeaPad Pro 5 16IMH G9 Intel Core Ultra 7 155H, Intel Arc 8-Core iGPU | Lenovo ThinkPad T16 G2 21K70035GE AMD Ryzen 7 7840U, AMD Radeon 780M | |
|---|---|---|---|---|---|---|
| Heat | -1% | -12% | 10% | 19% | 4% | |
| Maximum Upper Side * | 41.7 | 46.8 -12% | 55 -32% | 40.3 3% | 36.3 13% | 48.7 -17% |
| Maximum Bottom * | 49.6 | 45.6 8% | 55 -11% | 45.9 7% | 39.1 21% | 52 -5% |
| Idle Upper Side * | 31.1 | 32.2 -4% | 32 -3% | 26.3 15% | 24.9 20% | 26.4 15% |
| Idle Bottom * | 33.1 | 31.4 5% | 33 -0% | 27.9 16% | 26.1 21% | 26.3 21% |
* ... smaller is better
发言人
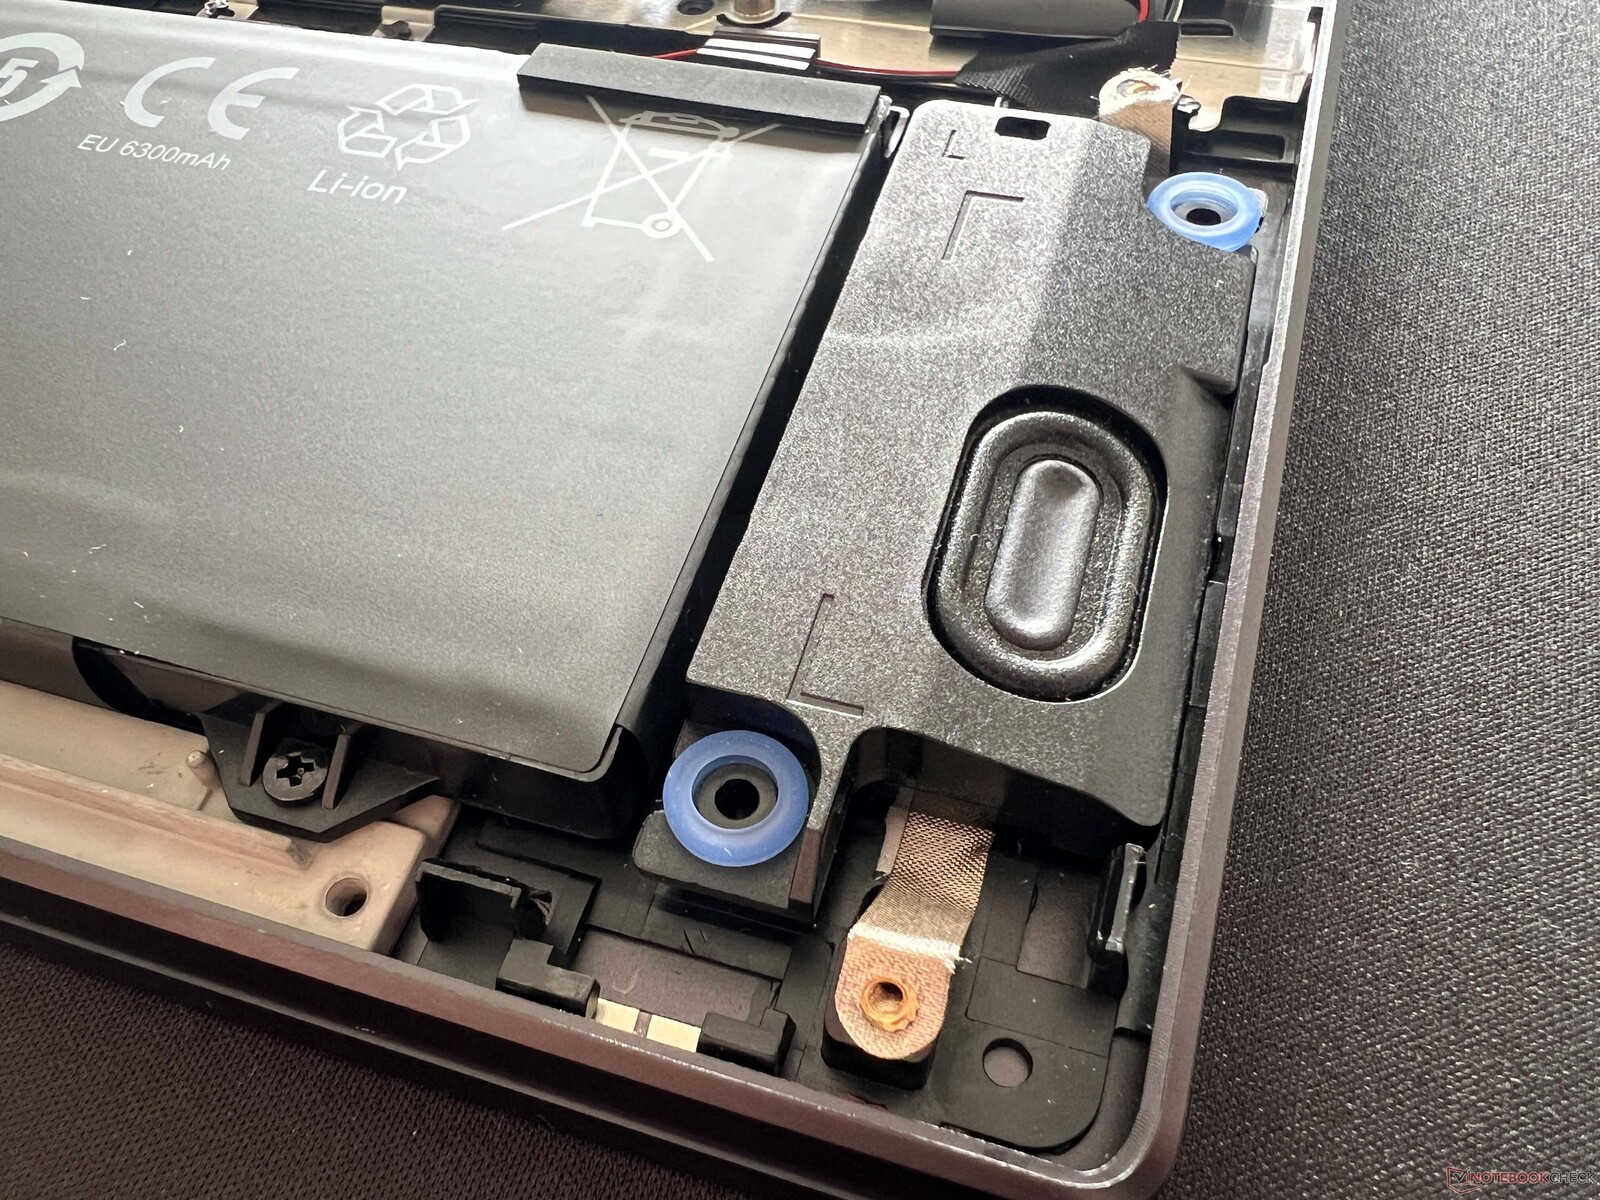
Evo 15 提供两个立体声扬声器,音质不错。虽然有一些多媒体笔记本电脑的音响系统更好(扬声器数量也更多),但在对比组中,Evo 是这方面最好的机型之一。整体音质清晰,只有低音部分有明显的衰减。
SCHENKER XMG Evo 15 (M24) audio analysis
(+) | speakers can play relatively loud (85.6 dB)
Bass 100 - 315 Hz
(-) | nearly no bass - on average 17.9% lower than median
(±) | linearity of bass is average (11.6% delta to prev. frequency)
Mids 400 - 2000 Hz
(+) | balanced mids - only 3.7% away from median
(+) | mids are linear (4.5% delta to prev. frequency)
Highs 2 - 16 kHz
(+) | balanced highs - only 2.2% away from median
(+) | highs are linear (6.5% delta to prev. frequency)
Overall 100 - 16.000 Hz
(+) | overall sound is linear (11.8% difference to median)
Compared to same class
» 15% of all tested devices in this class were better, 4% similar, 81% worse
» The best had a delta of 5%, average was 18%, worst was 45%
Compared to all devices tested
» 7% of all tested devices were better, 2% similar, 91% worse
» The best had a delta of 4%, average was 24%, worst was 134%
Dell Inspiron 16 7640 2-in-1 audio analysis
(+) | speakers can play relatively loud (84 dB)
Bass 100 - 315 Hz
(±) | reduced bass - on average 13.9% lower than median
(±) | linearity of bass is average (14% delta to prev. frequency)
Mids 400 - 2000 Hz
(+) | balanced mids - only 3.6% away from median
(+) | mids are linear (3.6% delta to prev. frequency)
Highs 2 - 16 kHz
(+) | balanced highs - only 4.5% away from median
(+) | highs are linear (2.8% delta to prev. frequency)
Overall 100 - 16.000 Hz
(+) | overall sound is linear (12% difference to median)
Compared to same class
» 11% of all tested devices in this class were better, 4% similar, 85% worse
» The best had a delta of 6%, average was 20%, worst was 57%
Compared to all devices tested
» 8% of all tested devices were better, 2% similar, 90% worse
» The best had a delta of 4%, average was 24%, worst was 134%
Medion S10 OLED audio analysis
(+) | speakers can play relatively loud (85 dB)
Bass 100 - 315 Hz
(-) | nearly no bass - on average 17.3% lower than median
(±) | linearity of bass is average (9.5% delta to prev. frequency)
Mids 400 - 2000 Hz
(+) | balanced mids - only 4.3% away from median
(+) | mids are linear (4.3% delta to prev. frequency)
Highs 2 - 16 kHz
(+) | balanced highs - only 1.2% away from median
(+) | highs are linear (5% delta to prev. frequency)
Overall 100 - 16.000 Hz
(+) | overall sound is linear (12.9% difference to median)
Compared to same class
» 21% of all tested devices in this class were better, 4% similar, 74% worse
» The best had a delta of 5%, average was 18%, worst was 45%
Compared to all devices tested
» 11% of all tested devices were better, 3% similar, 87% worse
» The best had a delta of 4%, average was 24%, worst was 134%
Xiaomi RedmiBook Pro 16 2024 audio analysis
(+) | speakers can play relatively loud (83.8 dB)
Bass 100 - 315 Hz
(±) | reduced bass - on average 13.6% lower than median
(±) | linearity of bass is average (7.9% delta to prev. frequency)
Mids 400 - 2000 Hz
(±) | higher mids - on average 5.3% higher than median
(+) | mids are linear (5% delta to prev. frequency)
Highs 2 - 16 kHz
(+) | balanced highs - only 2.8% away from median
(+) | highs are linear (5.3% delta to prev. frequency)
Overall 100 - 16.000 Hz
(+) | overall sound is linear (13% difference to median)
Compared to same class
» 22% of all tested devices in this class were better, 5% similar, 74% worse
» The best had a delta of 5%, average was 18%, worst was 45%
Compared to all devices tested
» 11% of all tested devices were better, 2% similar, 86% worse
» The best had a delta of 4%, average was 24%, worst was 134%
Lenovo IdeaPad Pro 5 16IMH G9 audio analysis
(±) | speaker loudness is average but good (81.1 dB)
Bass 100 - 315 Hz
(-) | nearly no bass - on average 22.3% lower than median
(±) | linearity of bass is average (10.5% delta to prev. frequency)
Mids 400 - 2000 Hz
(+) | balanced mids - only 2.6% away from median
(+) | mids are linear (4.6% delta to prev. frequency)
Highs 2 - 16 kHz
(+) | balanced highs - only 1.2% away from median
(+) | highs are linear (3.9% delta to prev. frequency)
Overall 100 - 16.000 Hz
(+) | overall sound is linear (13.9% difference to median)
Compared to same class
» 27% of all tested devices in this class were better, 4% similar, 69% worse
» The best had a delta of 5%, average was 18%, worst was 45%
Compared to all devices tested
» 14% of all tested devices were better, 4% similar, 82% worse
» The best had a delta of 4%, average was 24%, worst was 134%
Lenovo ThinkPad T16 G2 21K70035GE audio analysis
(±) | speaker loudness is average but good (75.1 dB)
Bass 100 - 315 Hz
(-) | nearly no bass - on average 23.9% lower than median
(±) | linearity of bass is average (13.8% delta to prev. frequency)
Mids 400 - 2000 Hz
(+) | balanced mids - only 3.9% away from median
(+) | mids are linear (6.9% delta to prev. frequency)
Highs 2 - 16 kHz
(+) | balanced highs - only 2.1% away from median
(+) | highs are linear (4.2% delta to prev. frequency)
Overall 100 - 16.000 Hz
(±) | linearity of overall sound is average (19.9% difference to median)
Compared to same class
» 39% of all tested devices in this class were better, 9% similar, 52% worse
» The best had a delta of 7%, average was 21%, worst was 53%
Compared to all devices tested
» 48% of all tested devices were better, 7% similar, 44% worse
» The best had a delta of 4%, average was 24%, worst was 134%
能源管理
耗电量
大而亮的显示屏对功耗有一定影响,我们测得空闲模式下的最大功耗略低于 14 瓦。在游戏和压力测试中,功耗均为 76-78 瓦,并且保持绝对稳定,因此 100 瓦的电源完全够用。在Overboost 配置文件中,我们测得的最大功率为 107.9 瓦,因此电源没有更多的余地为电池充电等。不过,电池在这里也不会被耗尽。如前所述,1.4 瓦的待机功耗过高。
| Off / Standby | |
| Idle | |
| Load |
|
Key:
min: | |
| SCHENKER XMG Evo 15 (M24) Ultra 7 155H, Arc 8-Core, Samsung 990 Pro 1 TB, IPS, 2560x1600, 15.3" | Dell Inspiron 16 7640 2-in-1 Ultra 7 155H, Arc 8-Core, Micron 2550 1TB, Mini-LED, 2560x1600, 16" | Medion S10 OLED Ultra 7 155H, Arc 8-Core, Phison PS5019-E19 SSO1TBITC4-E19-V7, OLED, 3840x2400, 16" | Xiaomi RedmiBook Pro 16 2024 Ultra 7 155H, Arc 8-Core, YMTC PC300-1TB, IPS, 3072x1920, 16" | Lenovo IdeaPad Pro 5 16IMH G9 Ultra 7 155H, Arc 8-Core, Samsung PM9C1a MZAL81T0HDLB, IPS, 2560x1600, 16" | Lenovo ThinkPad T16 G2 21K70035GE R7 7840U, Radeon 780M, SK hynix PC801 HFS001TEJ9X162N, IPS LED, 1920x1200, 16" | Average Intel Arc 8-Core iGPU | Average of class Multimedia | |
|---|---|---|---|---|---|---|---|---|
| Power Consumption | 3% | 10% | 1% | 20% | 40% | 20% | -4% | |
| Idle Minimum * | 7.7 | 6.1 21% | 7 9% | 4.2 45% | 3.5 55% | 3.7 52% | 5.34 ? 31% | 6.86 ? 11% |
| Idle Average * | 13.2 | 13.5 -2% | 10 24% | 11.6 12% | 9.6 27% | 7.2 45% | 8.54 ? 35% | 11.5 ? 13% |
| Idle Maximum * | 13.7 | 13.8 -1% | 19 -39% | 12.3 10% | 9.9 28% | 8.7 36% | 11.9 ? 13% | 13.5 ? 1% |
| Load Average * | 76.2 | 63.6 17% | 52 32% | 61.9 19% | 62.7 18% | 44.1 42% | 54 ? 29% | 71.4 ? 6% |
| Cyberpunk 2077 ultra * | 76.7 | 67 13% | 53.2 31% | |||||
| Cyberpunk 2077 ultra external monitor * | 72.7 | 64.6 11% | 49.2 32% | |||||
| Load Maximum * | 78.1 | 109.7 -40% | 95 -22% | 140.6 -80% | 101.2 -30% | 58.2 25% | 84.9 ? -9% | 116.6 ? -49% |
| Witcher 3 ultra * | 57 | 55.8 | 50.9 |
* ... smaller is better
Powr consumption Cyberpunk / Stress test
Power consumption with the external monitor
电池寿命
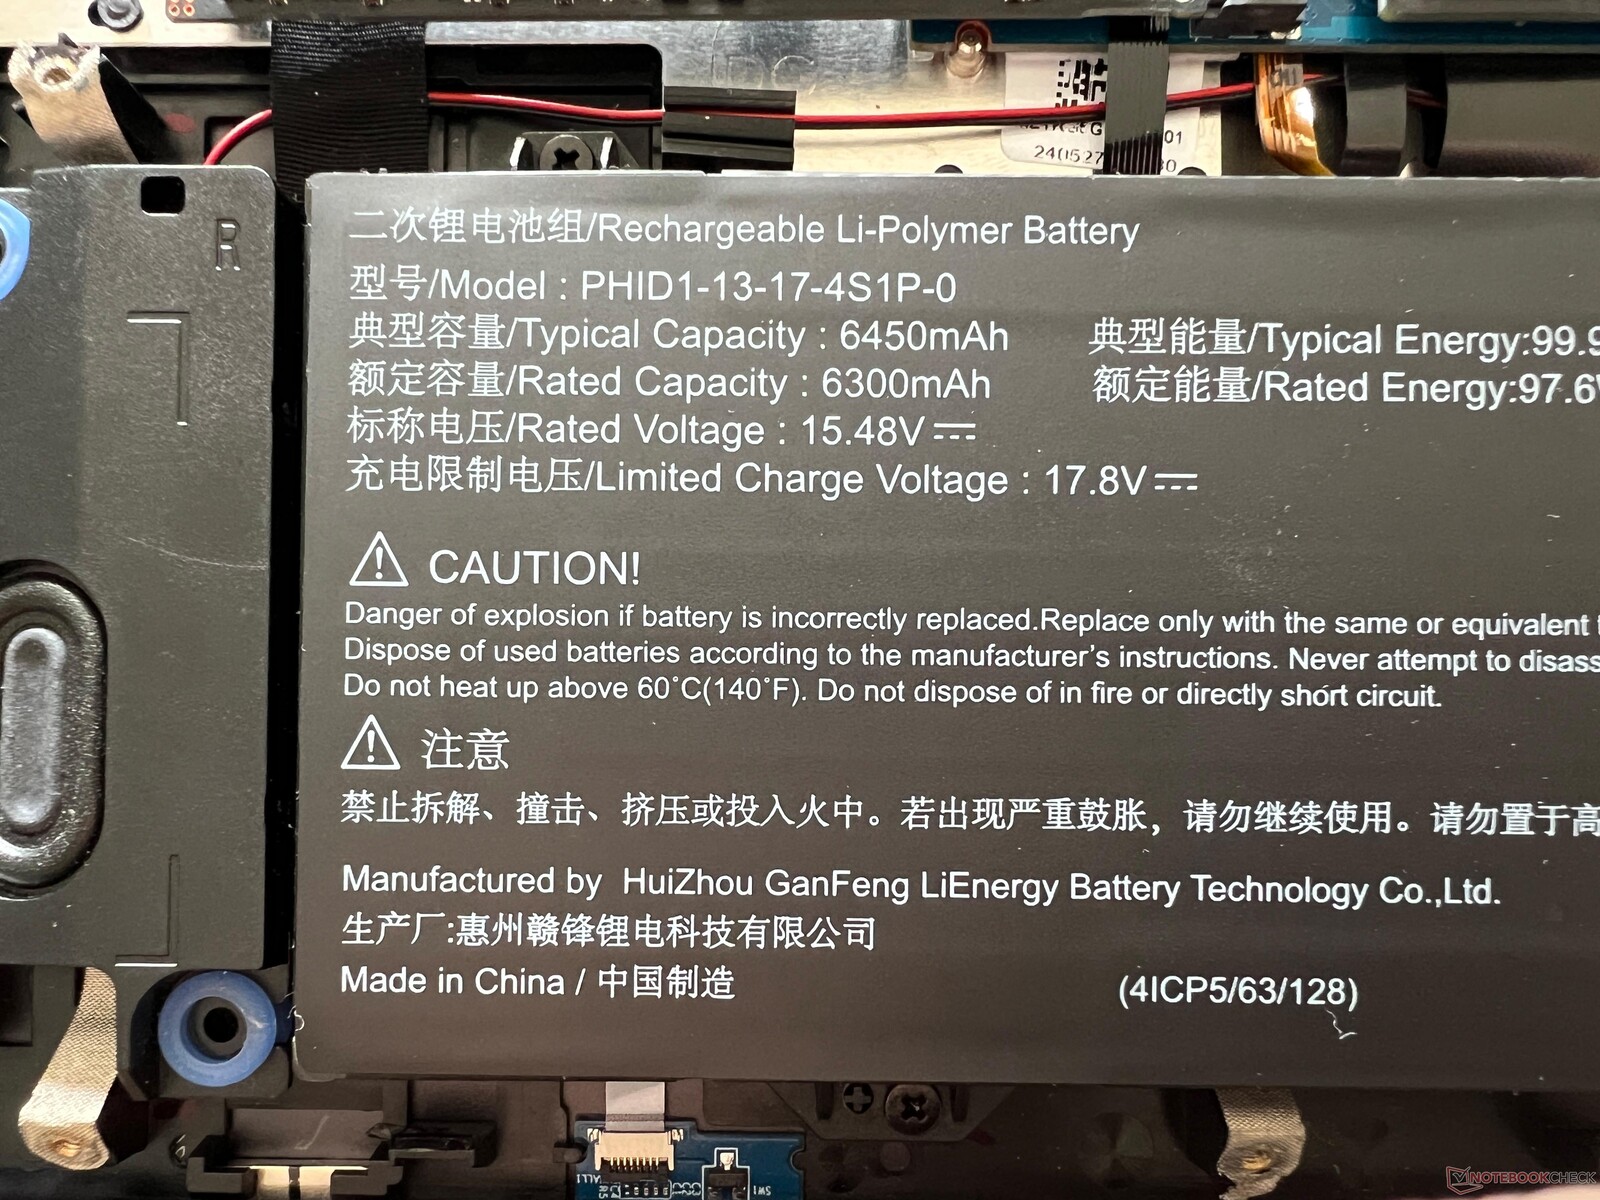
申克公司在 Evo 15 中安装了一块 99.8 瓦时的大容量电池,尽管显示屏耗电量大,但总体运行时间良好。 Medion S10的续航时间更长。在 150 cd/m²(相当于测试设备最大亮度的 58%)的 WLAN 测试中,我们在 60 Hz 下测得 10:25 小时,在 240 Hz 下测得 08:25 小时。在全亮度条件下,运行时间降至 8 小时(60 赫兹)或 6:39 小时(240 赫兹),因此您一定要降低电池模式下的使用频率。
视频测试的运行时间略高于 12 小时,在负载情况下,最坏的情况是 2:14 小时。设备开机时,充满电需要 165 分钟(130 分钟后充满 80%),而且没有快速充电功能。

| SCHENKER XMG Evo 15 (M24) Ultra 7 155H, Arc 8-Core, 99.9 Wh | Dell Inspiron 16 7640 2-in-1 Ultra 7 155H, Arc 8-Core, 90 Wh | Medion S10 OLED Ultra 7 155H, Arc 8-Core, 70 Wh | Xiaomi RedmiBook Pro 16 2024 Ultra 7 155H, Arc 8-Core, 99 Wh | Lenovo IdeaPad Pro 5 16IMH G9 Ultra 7 155H, Arc 8-Core, 84 Wh | Lenovo ThinkPad T16 G2 21K70035GE R7 7840U, Radeon 780M, 52.5 Wh | Average of class Multimedia | |
|---|---|---|---|---|---|---|---|
| Battery Runtime | -11% | -30% | 43% | 1% | -27% | -1% | |
| H.264 | 729 | 1308 79% | 957 31% | 864 ? 19% | |||
| WiFi v1.3 | 625 | 686 10% | 436 -30% | 983 57% | 756 21% | 658 5% | 645 ? 3% |
| Load | 134 | 93 -31% | 124 -7% | 68 -49% | 56 -58% | 99 ? -26% |
Pros
Cons
结论 - 无 dGPU 的最佳多媒体笔记本之一

德国制造商申克公司推出了新款 XMG Evo 15 (M24),这是一款无需专用显卡的优秀多媒体笔记本电脑。虽然它不是市场上最薄的笔记本电脑,但 Evo 15 并不以此为目标。另一方面,它有很好的维护选项,内存(最大 96 GB)和固态硬盘容量(2 个 M.2-2280 插槽)都可以轻松升级。此外,该机还配备了足够多的端口,不过我们不禁要问,一个老式的 USB 2.0 端口是如何出现在这款设备上的。不过,由于有大量其他快速 USB 端口(英特尔有 Thunderbolt 4,AMD 有 USB 4.0),这并不是什么大问题。在输入设备和扬声器方面,也没有什么可抱怨的。
说到显示屏,你会发现它与游戏的渊源以及与 XMG Fusion 15但这并不是缺点。雾面 IPS 面板具有高分辨率和 240 Hz 的快速频率。此外,没有 PWM,响应时间也很快。亮度非常好,接近 600 cd/m²,这反过来又影响了黑阶,从而影响了对比度。任何期待像 OLED 面板那样丰富黑色的人肯定会失望。校准后,色彩准确度非常出色,由于完全覆盖了 sRGB,该面板也适用于图像编辑。99.8 Wh 的大容量电池可以很好地补偿显示屏的功耗,总体而言,离开电源插座后的续航能力还算不错。
出色的维护选项、色彩准确的亮丽 IPS 显示屏、性能良好的数值以及连贯的能耗曲线:全新的申克 XMG Evo 15 是一款令人兴奋的多媒体笔记本电脑,没有专用显卡,可同时使用 AMD 和英特尔处理器,没有真正的弱点。
配备英特尔处理器的 Evo 15 整体性能非常出色,最重要的是性能稳定,因为没有过高的短期功耗限制。如果需要更高的性能,可以使用超频模式,但必须忍受更响的风扇声。但总的来说,Evo 15 是一款非常安静的产品,尤其适合日常工作。
有了这些优点,新款 Evo 15 在市场上几乎是无与伦比的。问题在于,你应该选择英特尔还是 AMD 型号。虽然 AMD 机型只有 USB 4.0 而不是 Thunderbolt 4,但制造商声称其性能(尽管 Ryzen 7 8845HS 的功耗限制略低于 AMD 机型)比英特尔机型更强。 Ryzen 7 8845HS性能相当。我们也不指望电池续航时间会有什么巨大差异,这就引出了一个问题:为什么消费者要多花 150 欧元购买英特尔处理器?AMD 型号的起价为 1,049 欧元,性价比无疑更高。
价格和供应情况
新型申克 XMG Evo 15 (M24) 现在可以从Bestware 订购。AMD 型号起价 1049 欧元,英特尔型号起价 1199 欧元。
注:我们最近更新了评级系统,第 8 版的结果与第 7 版的结果不具可比性。更多信息请点击 这里.
SCHENKER XMG Evo 15 (M24)
- 07/31/2024 v8
Andreas Osthoff
 Total Sustainability Score:
 Transparency
The selection of devices to be reviewed is made by our editorial team. The test sample was provided to the author as a loan by the manufacturer or retailer for the purpose of this review. The lender had no influence on this review, nor did the manufacturer receive a copy of this review before publication. There was no obligation to publish this review. We never accept compensation or payment in return for our reviews. As an independent media company, Notebookcheck is not subjected to the authority of manufacturers, retailers or publishers.
This is how Notebookcheck is testing
Every year, Notebookcheck independently reviews hundreds of laptops and smartphones using standardized procedures to ensure that all results are comparable. We have continuously developed our test methods for around 20 years and set industry standards in the process. In our test labs, high-quality measuring equipment is utilized by experienced technicians and editors. These tests involve a multi-stage validation process. Our complex rating system is based on hundreds of well-founded measurements and benchmarks, which maintains objectivity. Further information on our test methods can be found here.
Price comparison
