Notebookcheck Logo

AMD Ryzen AI Max+ 395 分析 - Strix Halo 将与Apple M4 Pro/Max 竞争,配备 16 个 Zen 5 内核和与 RTX 4070 笔记本电脑相当的 iGPU

Strix Halo 具有高达 96 GB 的显存。

新款 Ryzen AI Max+ 395 是 AMD 最新推出的高端移动处理器。Ryzen AI Max+ 拥有多达 16 个 Zen 5 内核、强大的 Radeon GPU、快速 NPU 和高达 128 GB 的内存,应该是游戏、内容创建和 AI 开发的理想伴侣。
AI AMD Laptop / Notebook Launch Zen 5 Windows

AMD 推出新款 Ryzen AI Max 芯片,作为新型移动处理器,它配备了强大的处理器和快速 iGPU,可使用共享内存。根据配置的不同,您可以分配多达 96 GB 的 VRAM,这对于要求苛刻的图片/视频编辑或人工智能开发来说是一个优势。我们评测了 Ryzen AI Max+ 395的性能,并与竞争对手的 CPU/GPU 性能进行比较。我们还检查了这一怪兽级 APU 处理游戏的能力,以及与 CPU 和专用 GPU 系统相比是否具有效率优势。

概述 - AMD Ryzen AI Max

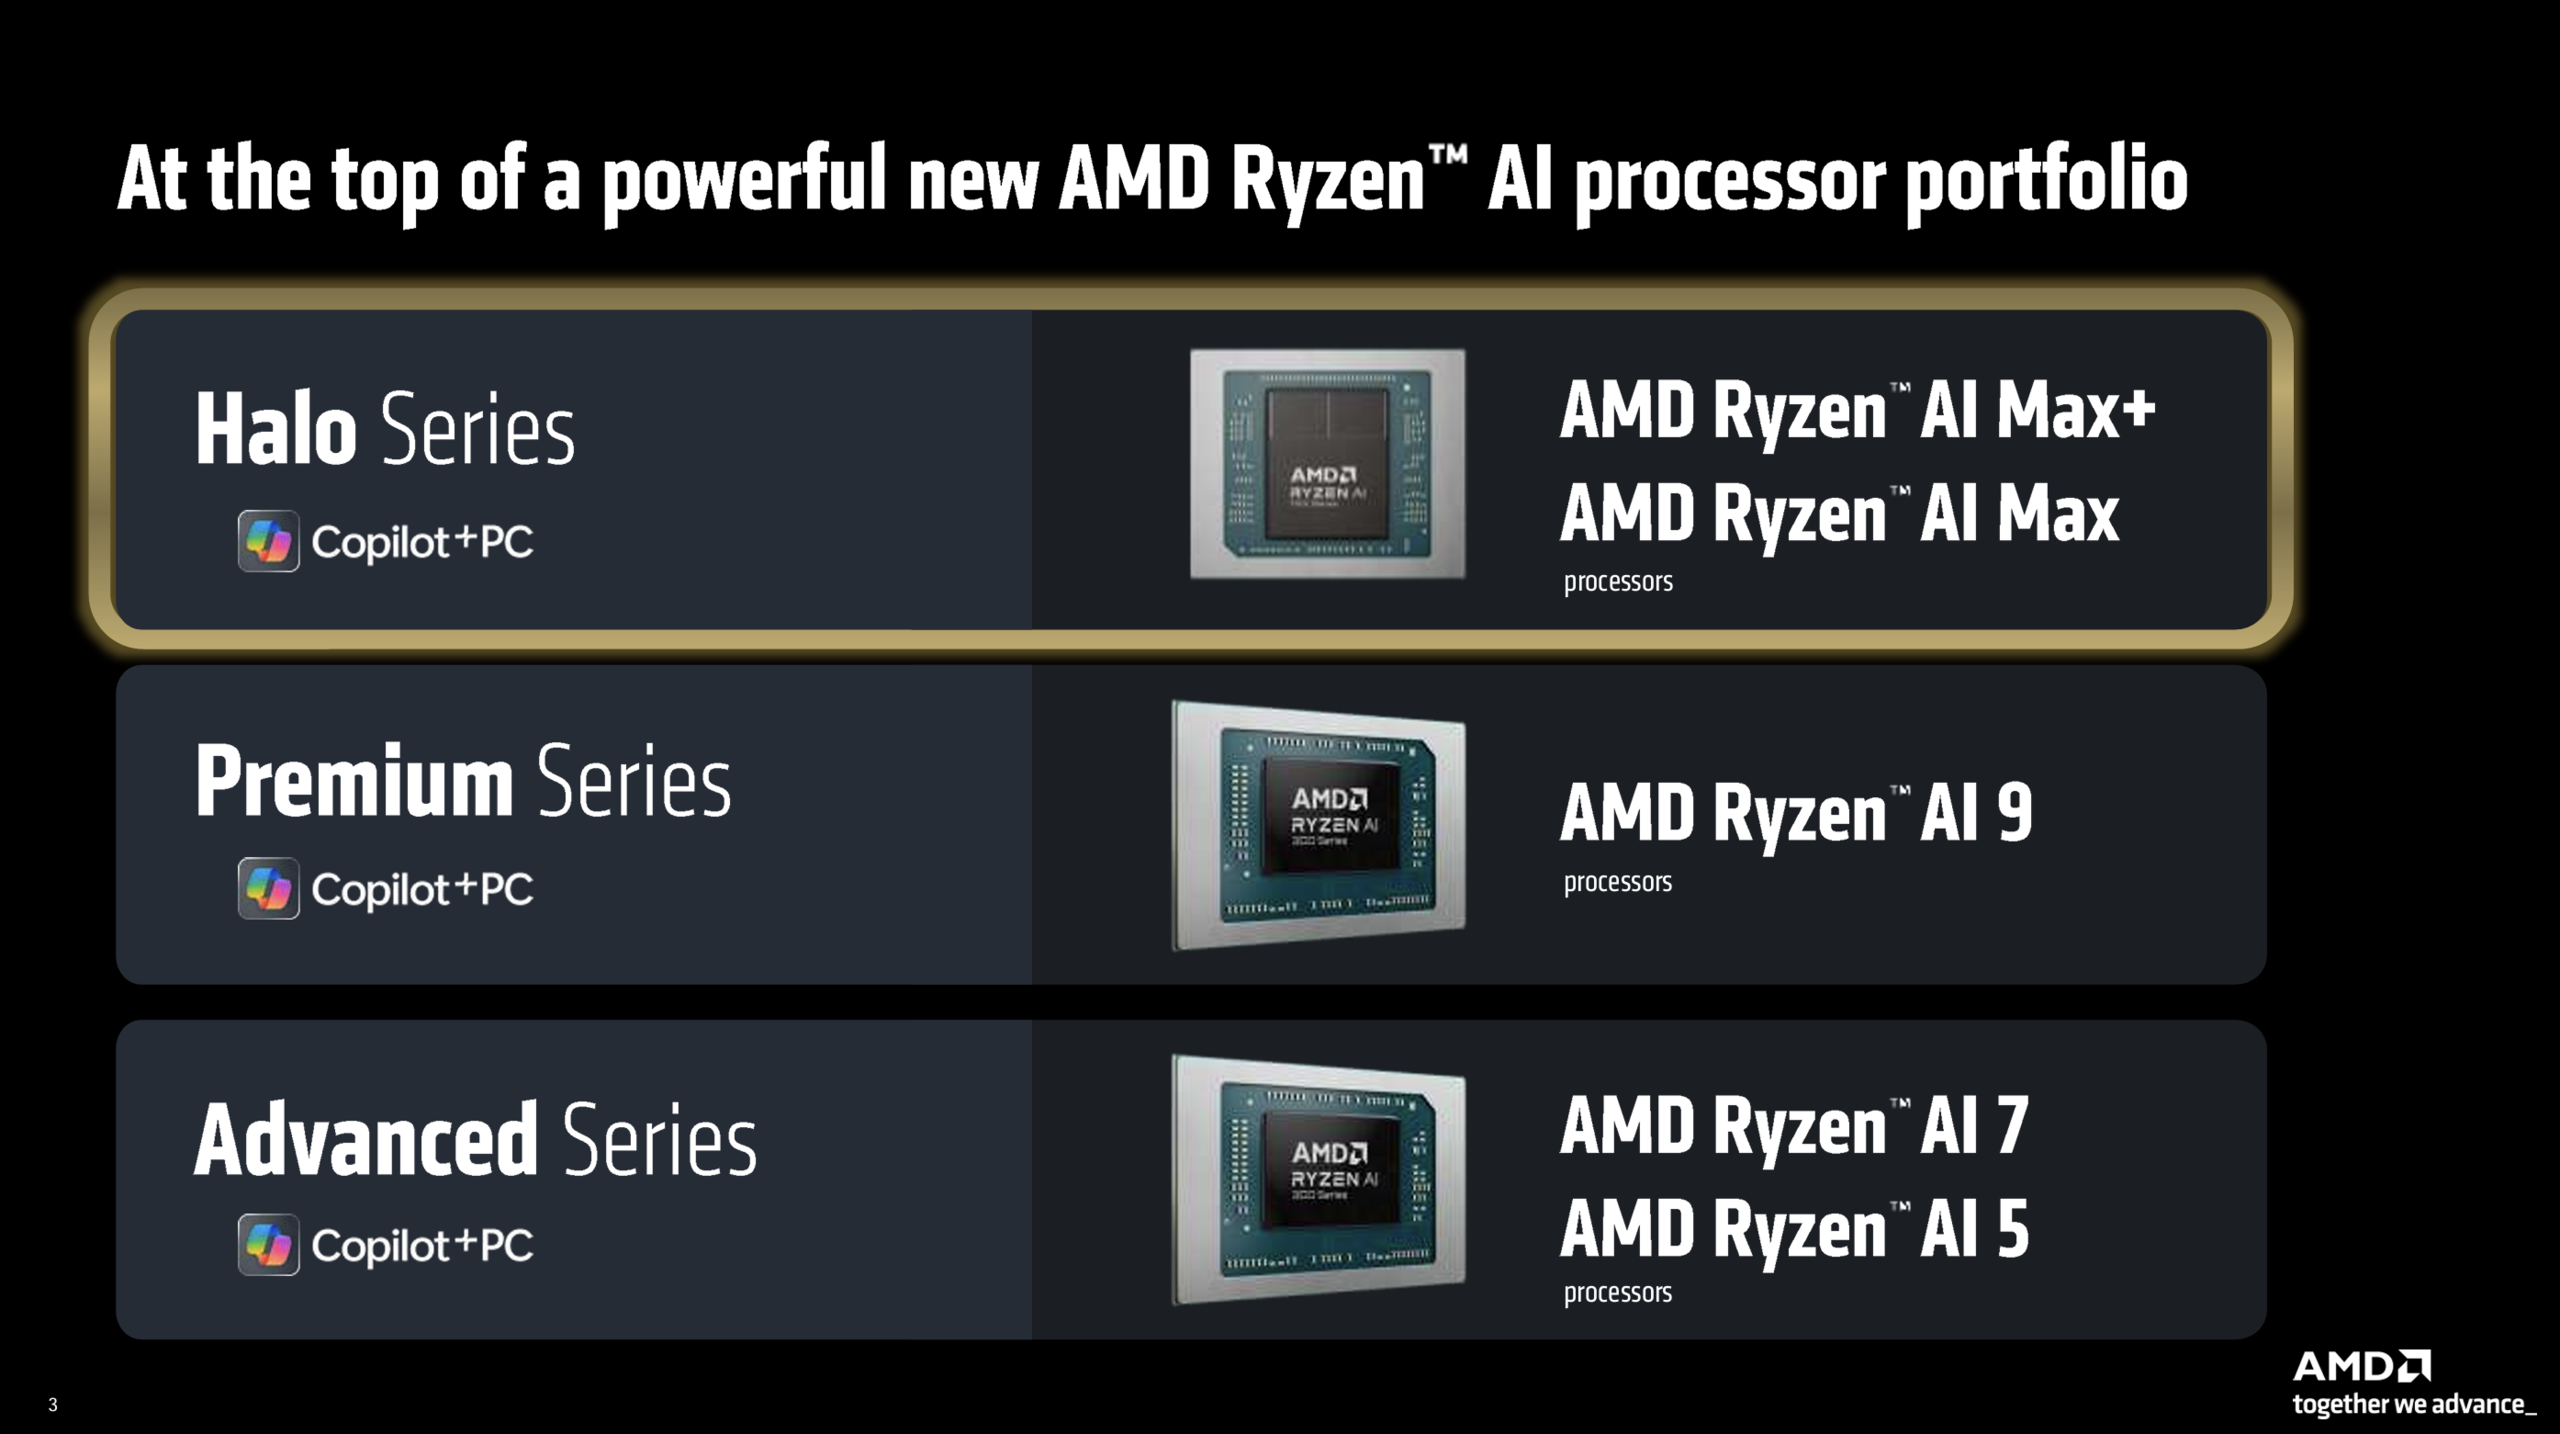
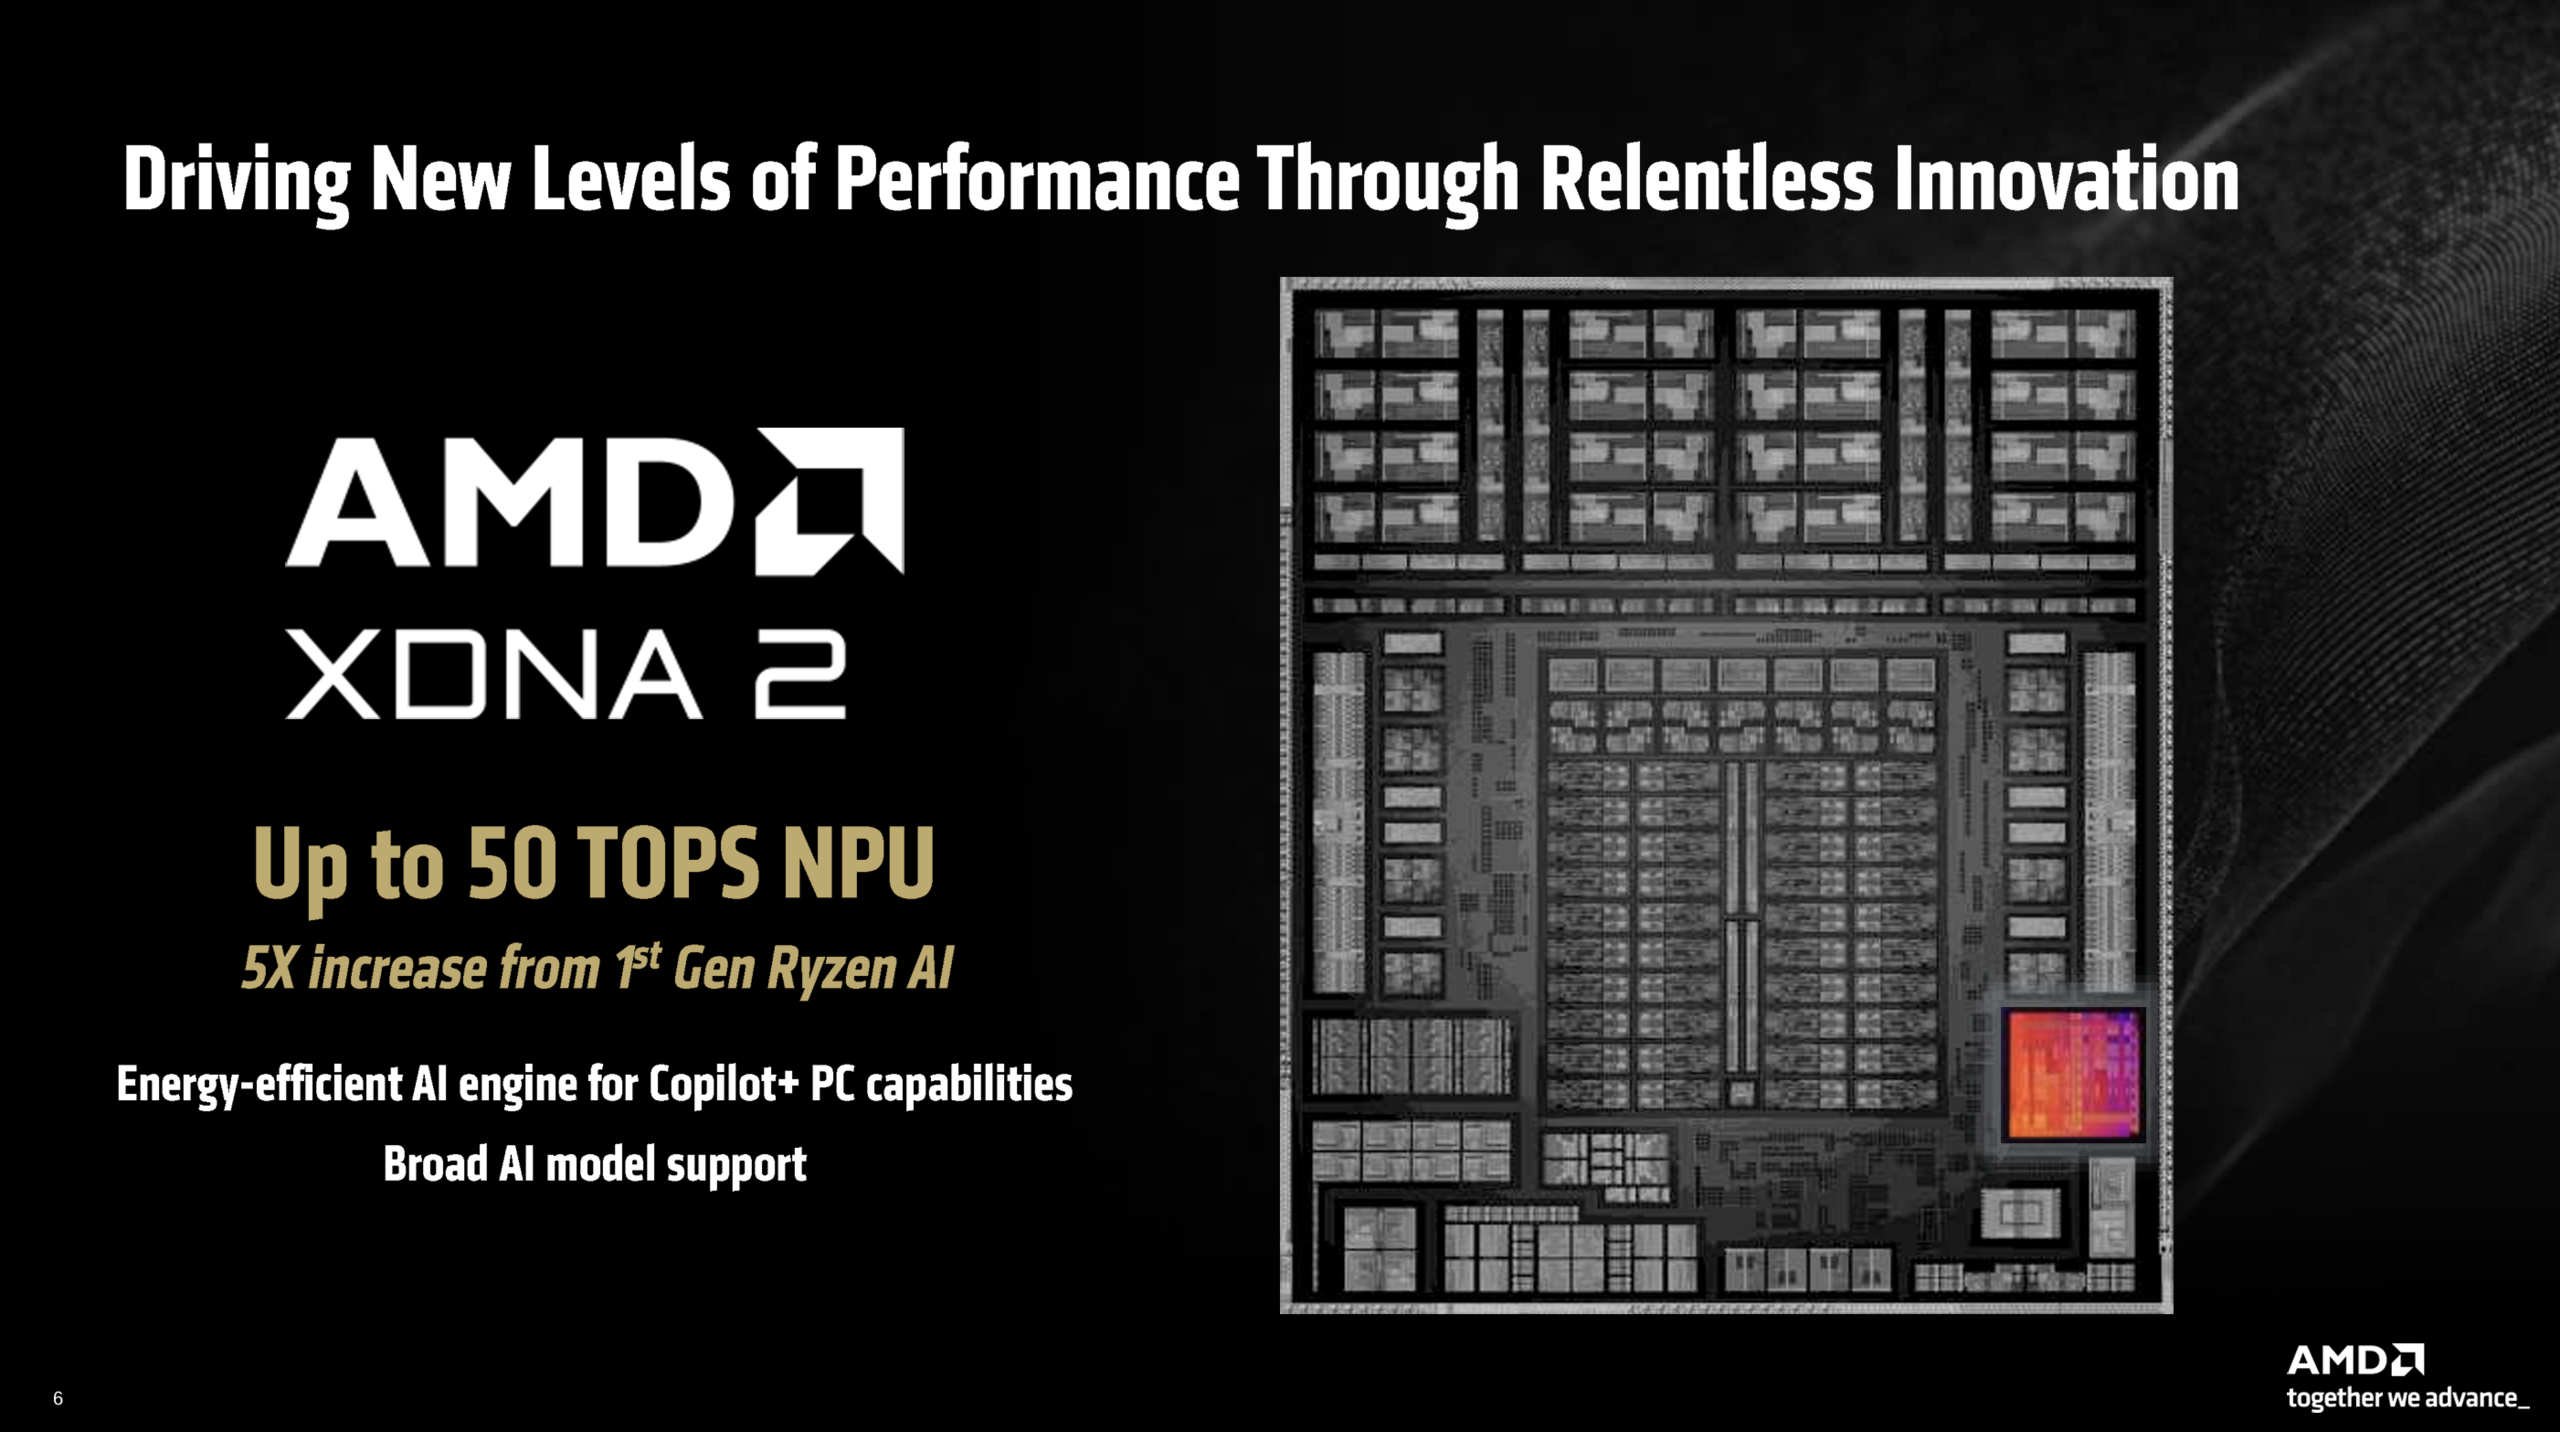
AMD 扩展其 APU 产品组合,推出功能更强大的 Ryzen AI Max APU。它仍然采用 Strix Point CPU 架构(4 纳米台积电)和 RDNA 3.5 GPU 架构。AMD 称新芯片为 Halo 系列,是其旗舰型号。因此,Ryzen AI Max APU 通常被称为 Strix Halo。在 Halo 系列下面,还有我们熟悉的 Premium 系列 Ryzen AI 9 APU(如 Ryzen AI 9 365)和高级系列中的 Ryzen AI 7/5 APU(如 Ryzen AI 7 Pro 360).所有 Ryzen AI APU 都配备了相同的 XDNA 2 NPU,性能达到 50 TOPS,因此所有型号都获得了 Copilot+ 认证。

Strix 光环概述(来源:AMD)
Strix 光环概述(来源:AMD)
Strix Halo 型号(来源:AMD)
Strix Halo CPU(来源:AMD)
Strix Halo GPU(图片来源:AMD)
Strix 光环 NPU(来源:AMD)
Strix 光环内存(来源:AMD)

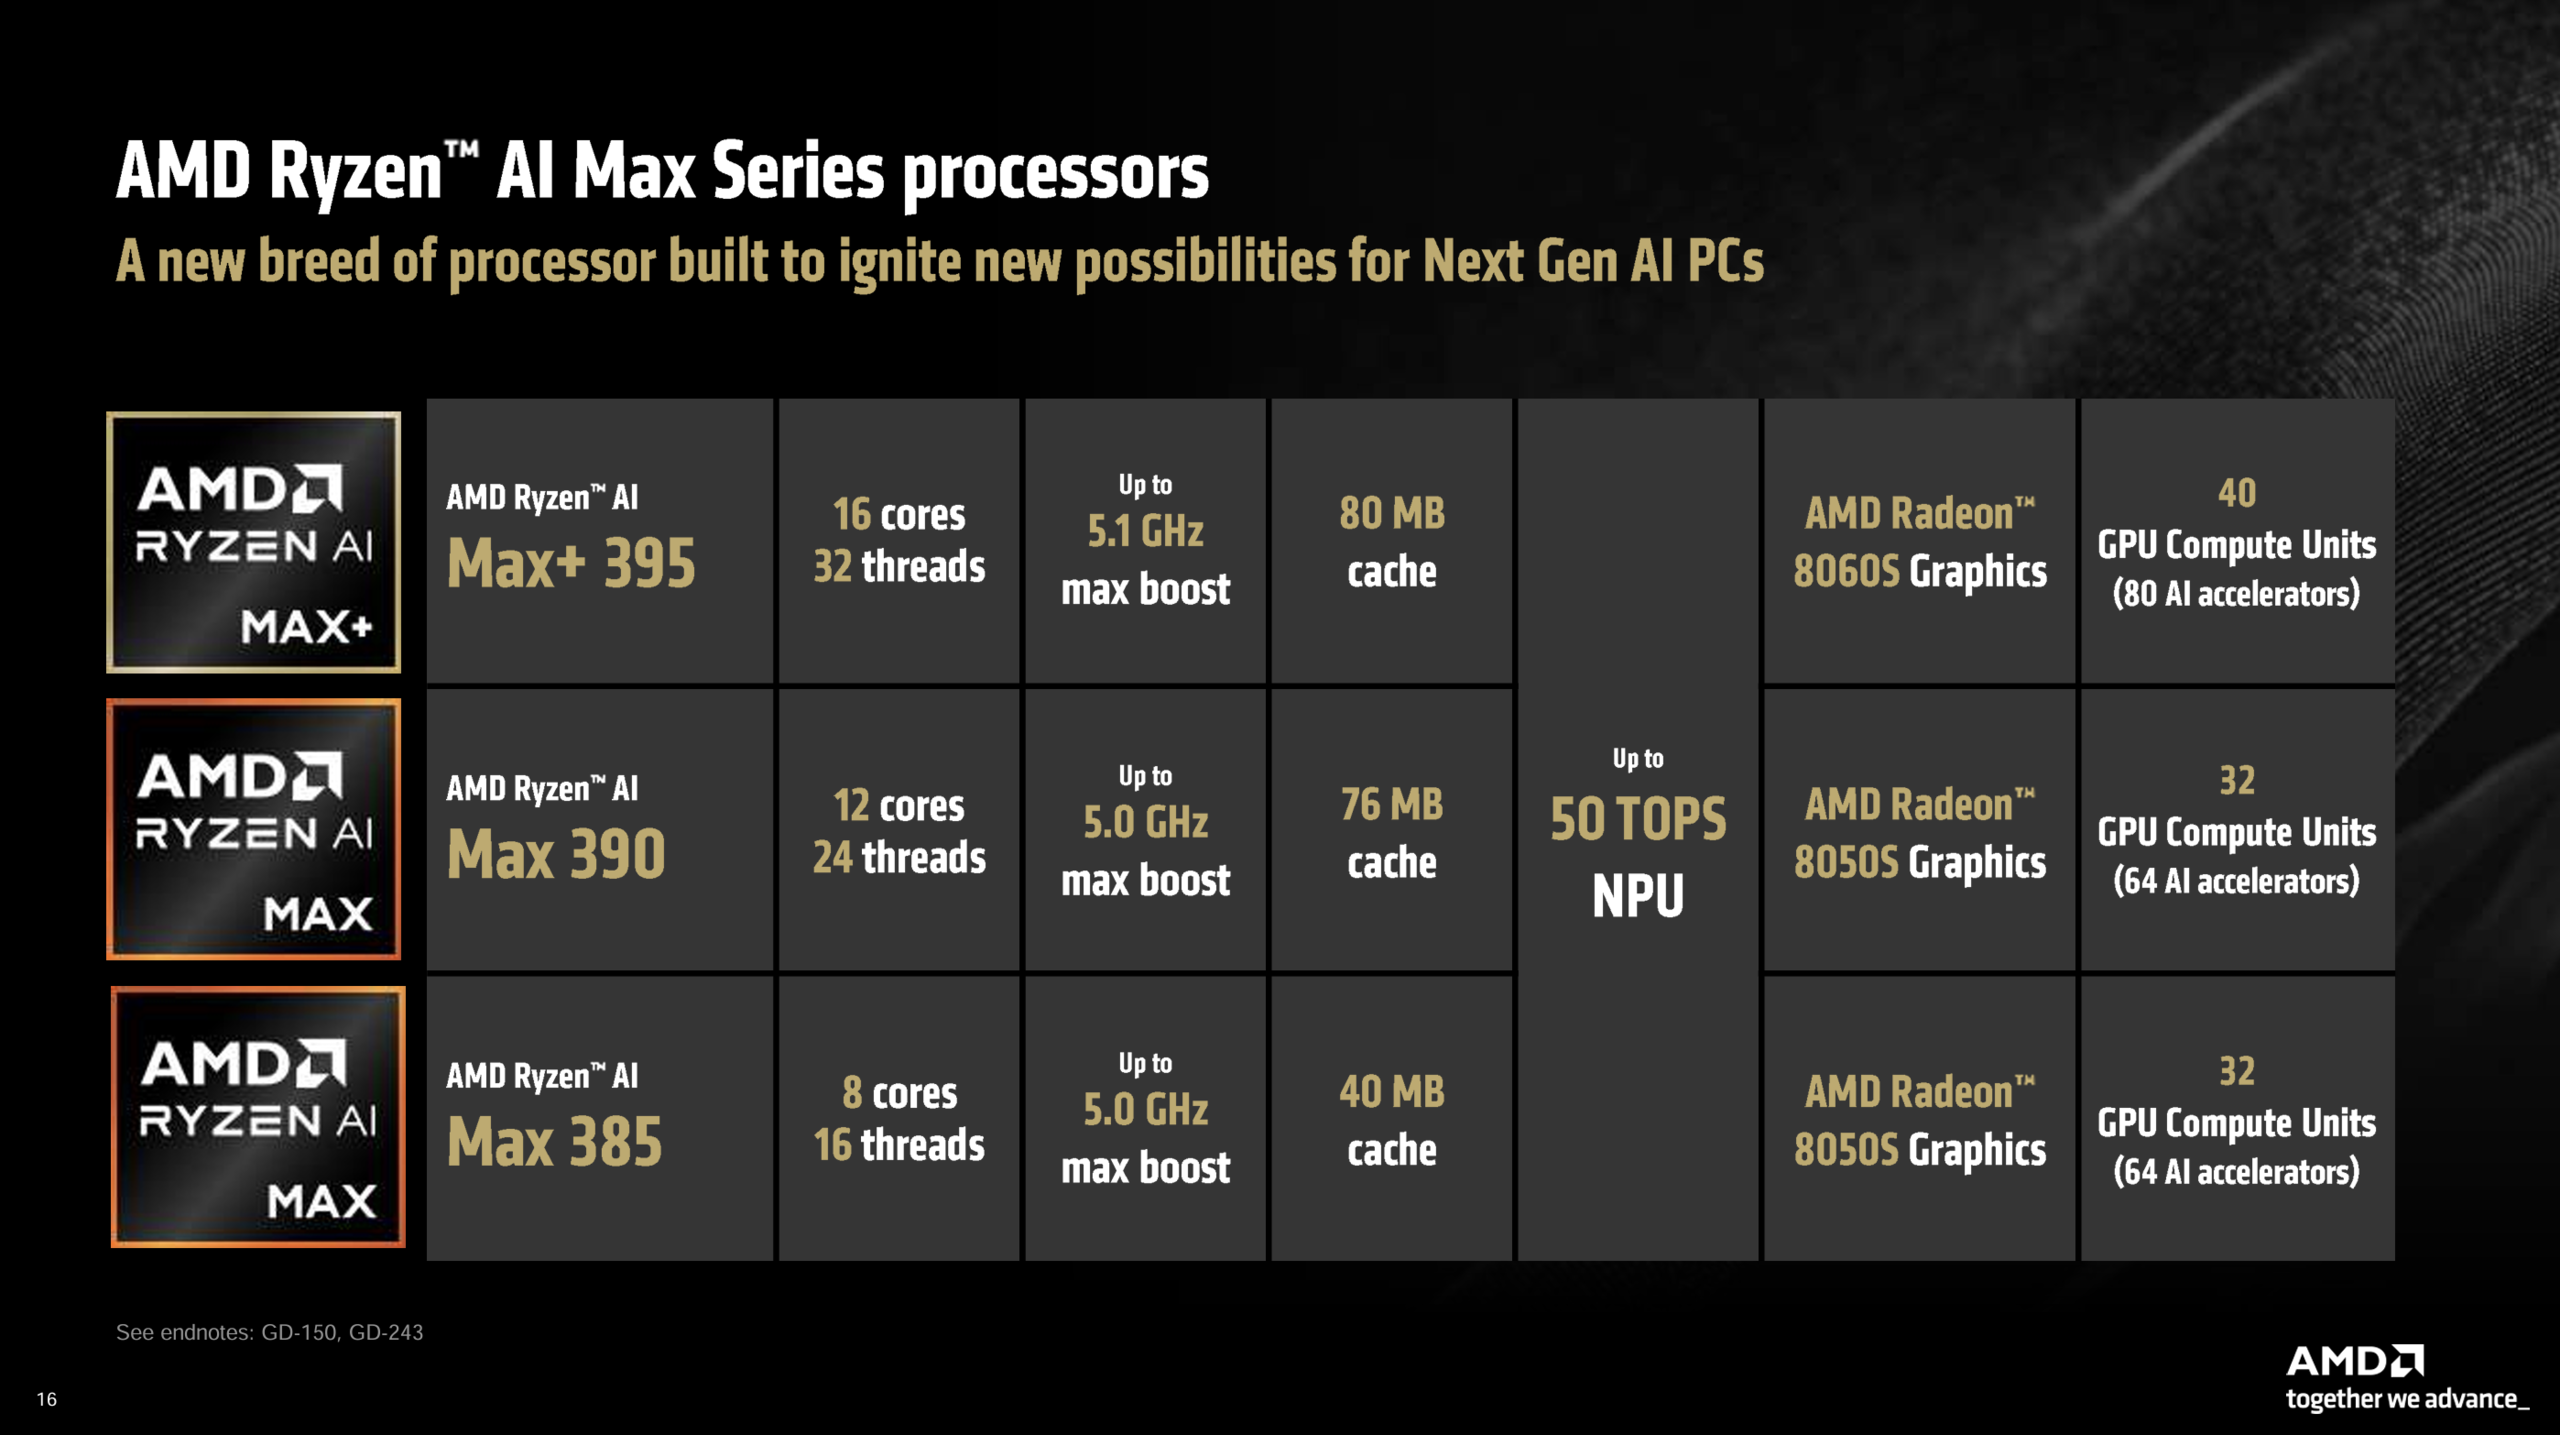
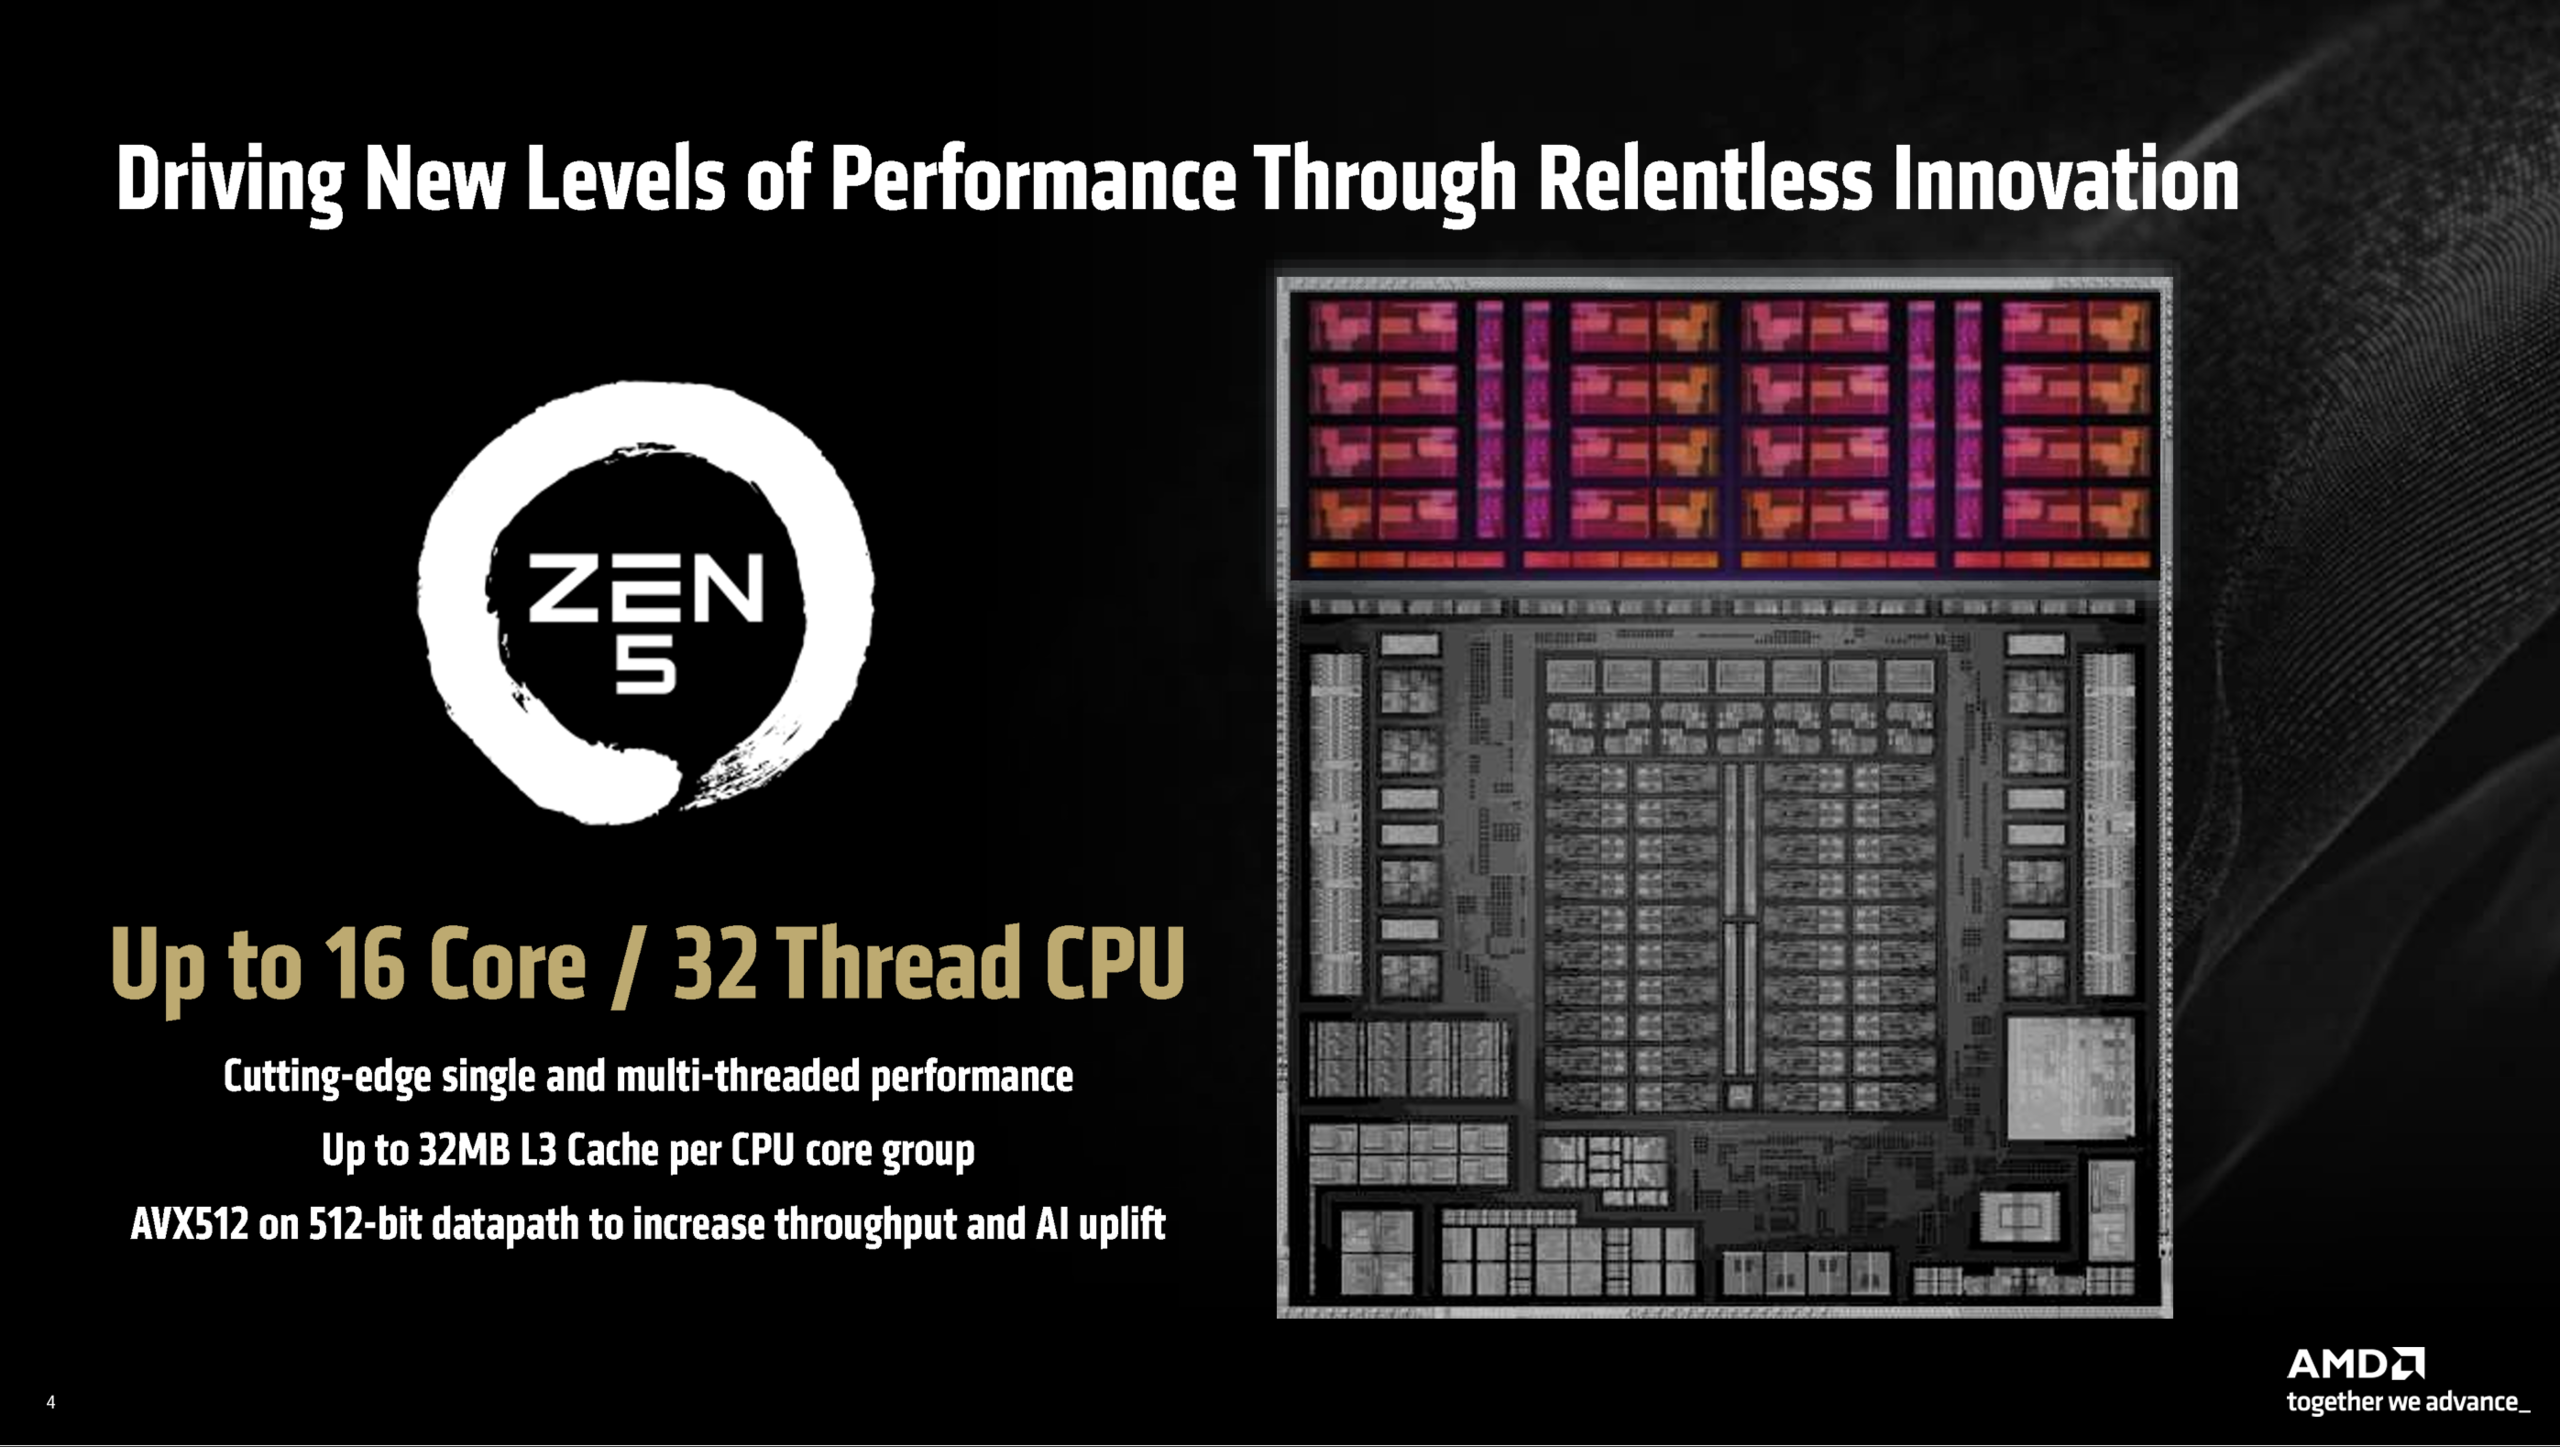
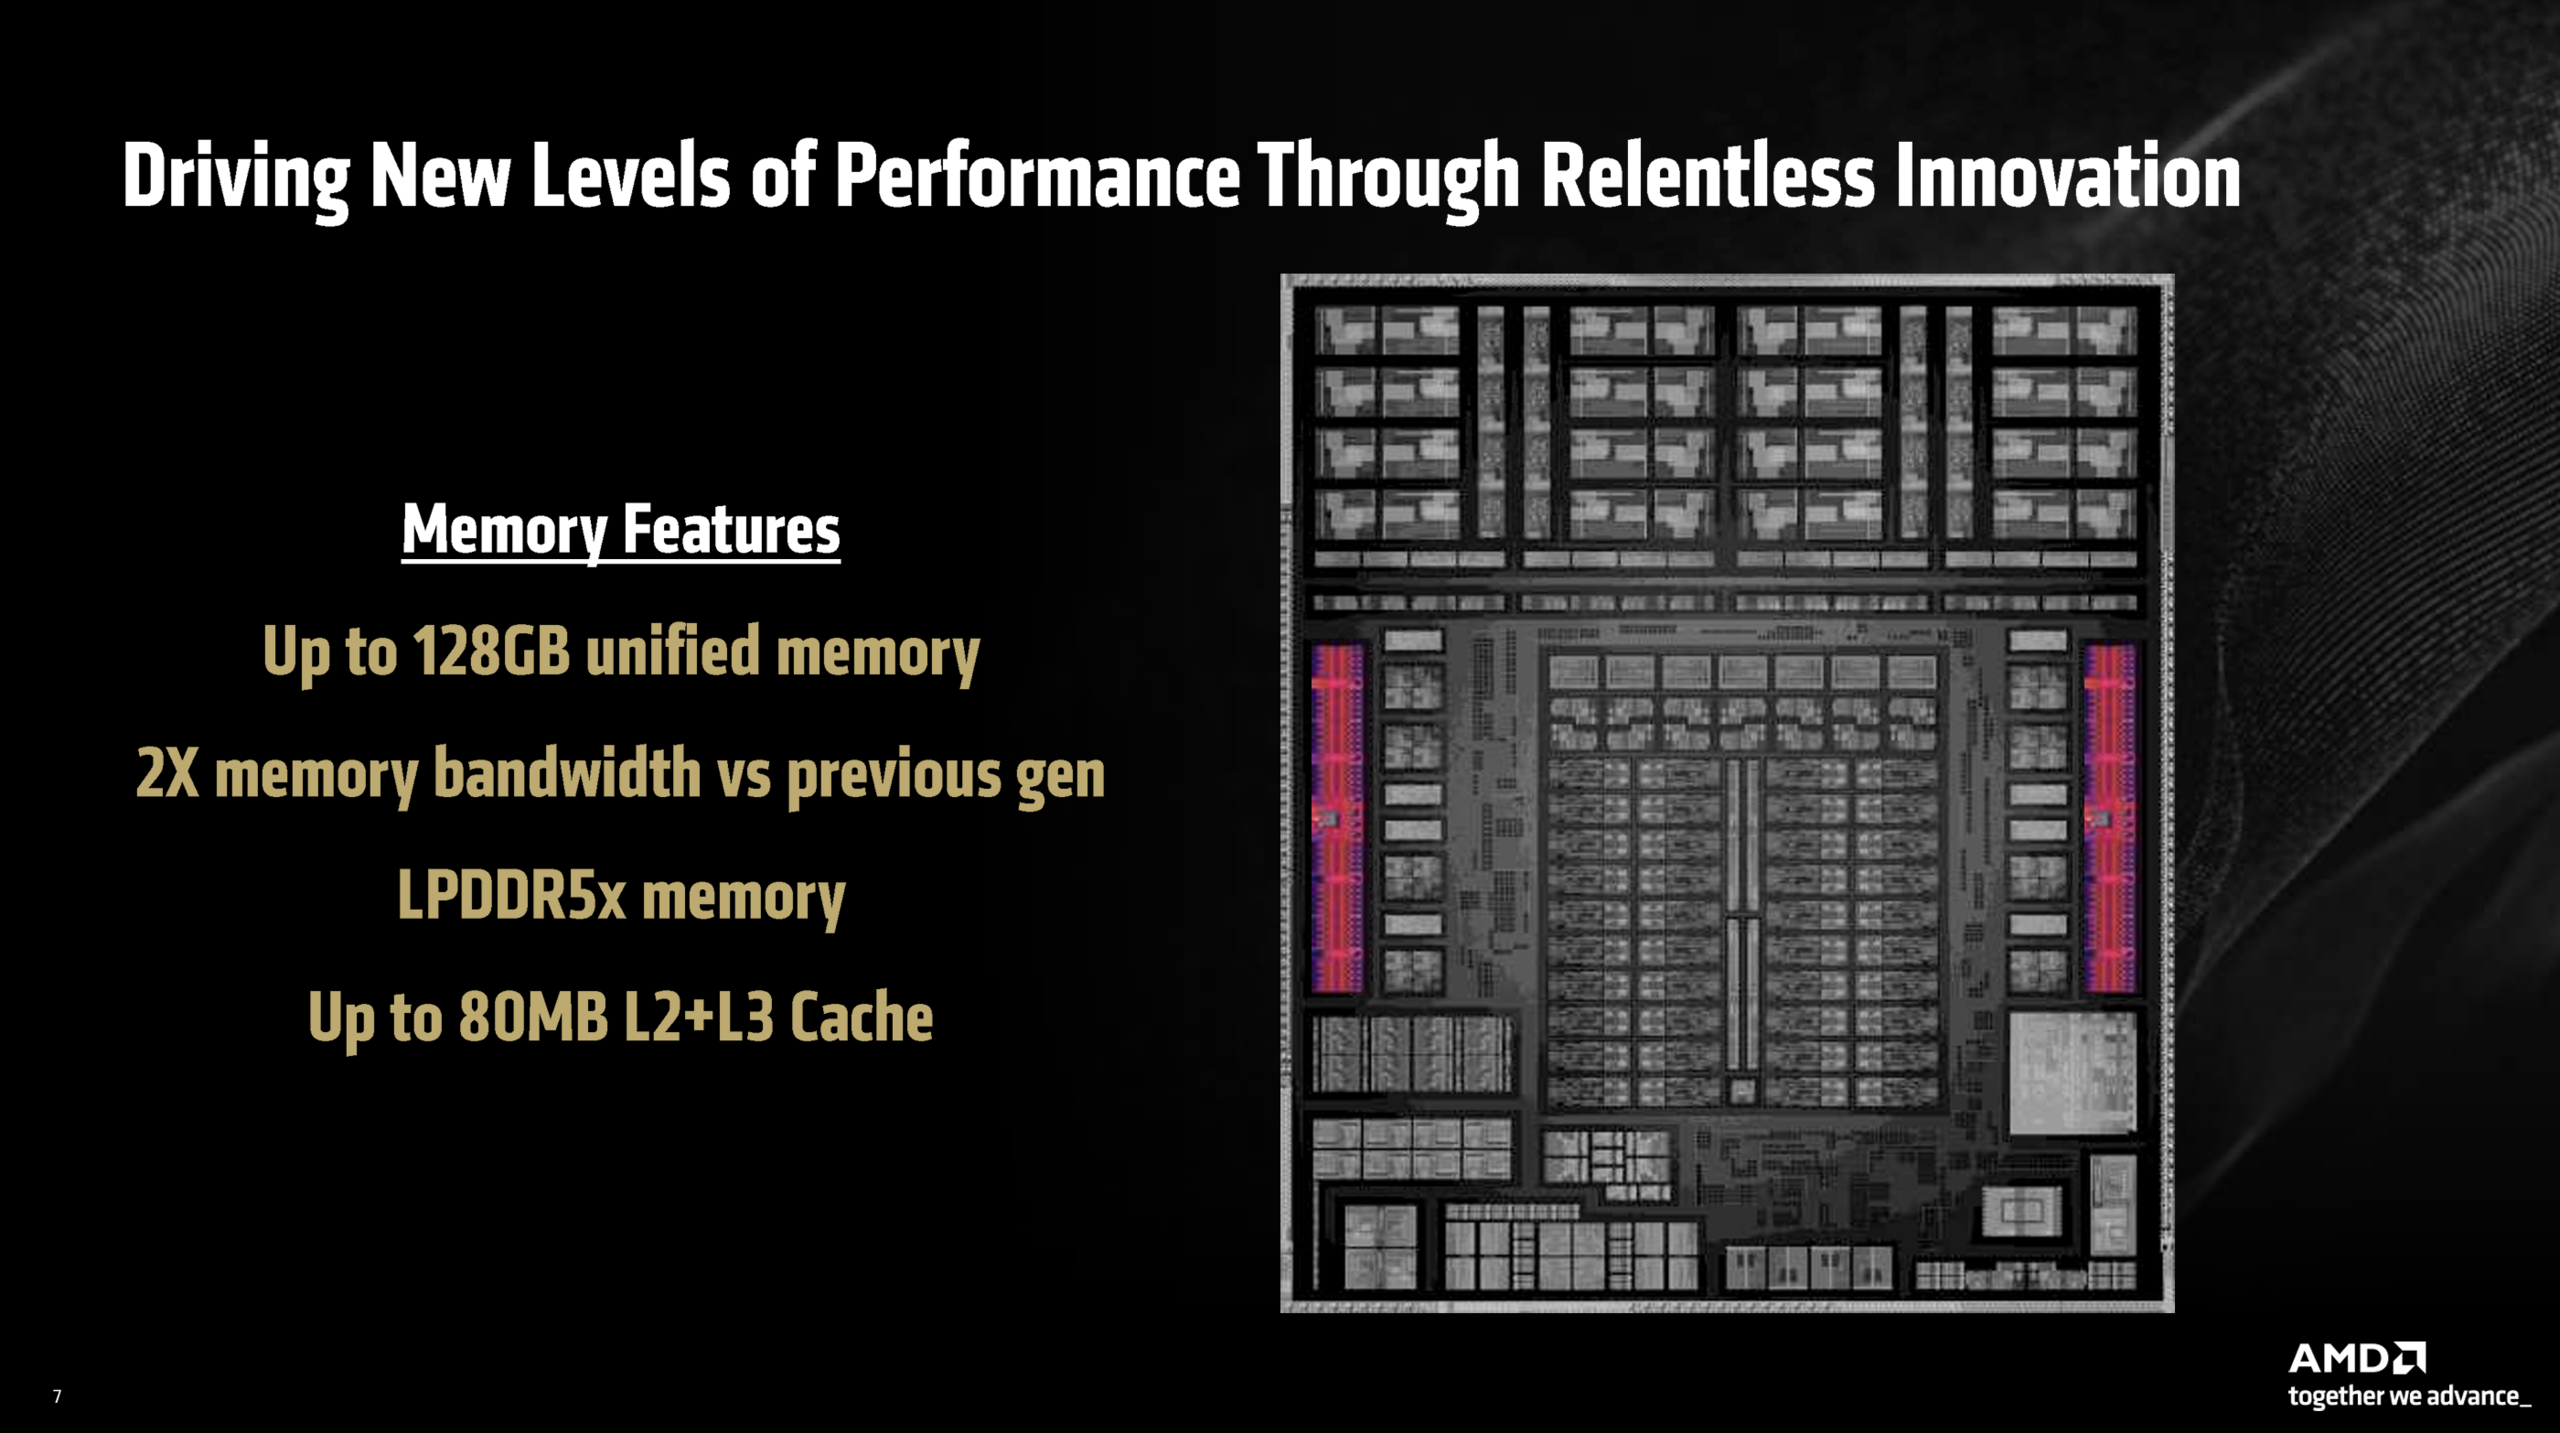
迄今为止,所有的 Strix Point APU 都使用了 Zen 5 核心和更紧凑、缓存更少的 Zen 5c 核心组合,而 Strix Halo APU 则只使用了完整的 Zen 5 核心,最高主频仍为 5.1 GHz。顶级型号 Ryzen AI Max+ 395 有 16 个内核,32 个线程,80 MB 缓存;Ryzen AI Max 390 有 12 个内核/24 个线程,64 MB 缓存;Ryzen AI Max 385 有 8 个内核/16 个线程,40 MB 缓存。内存(LPDDR5x-8000)也是 APU 的一部分,可以提供 32、64 或 128 GB。

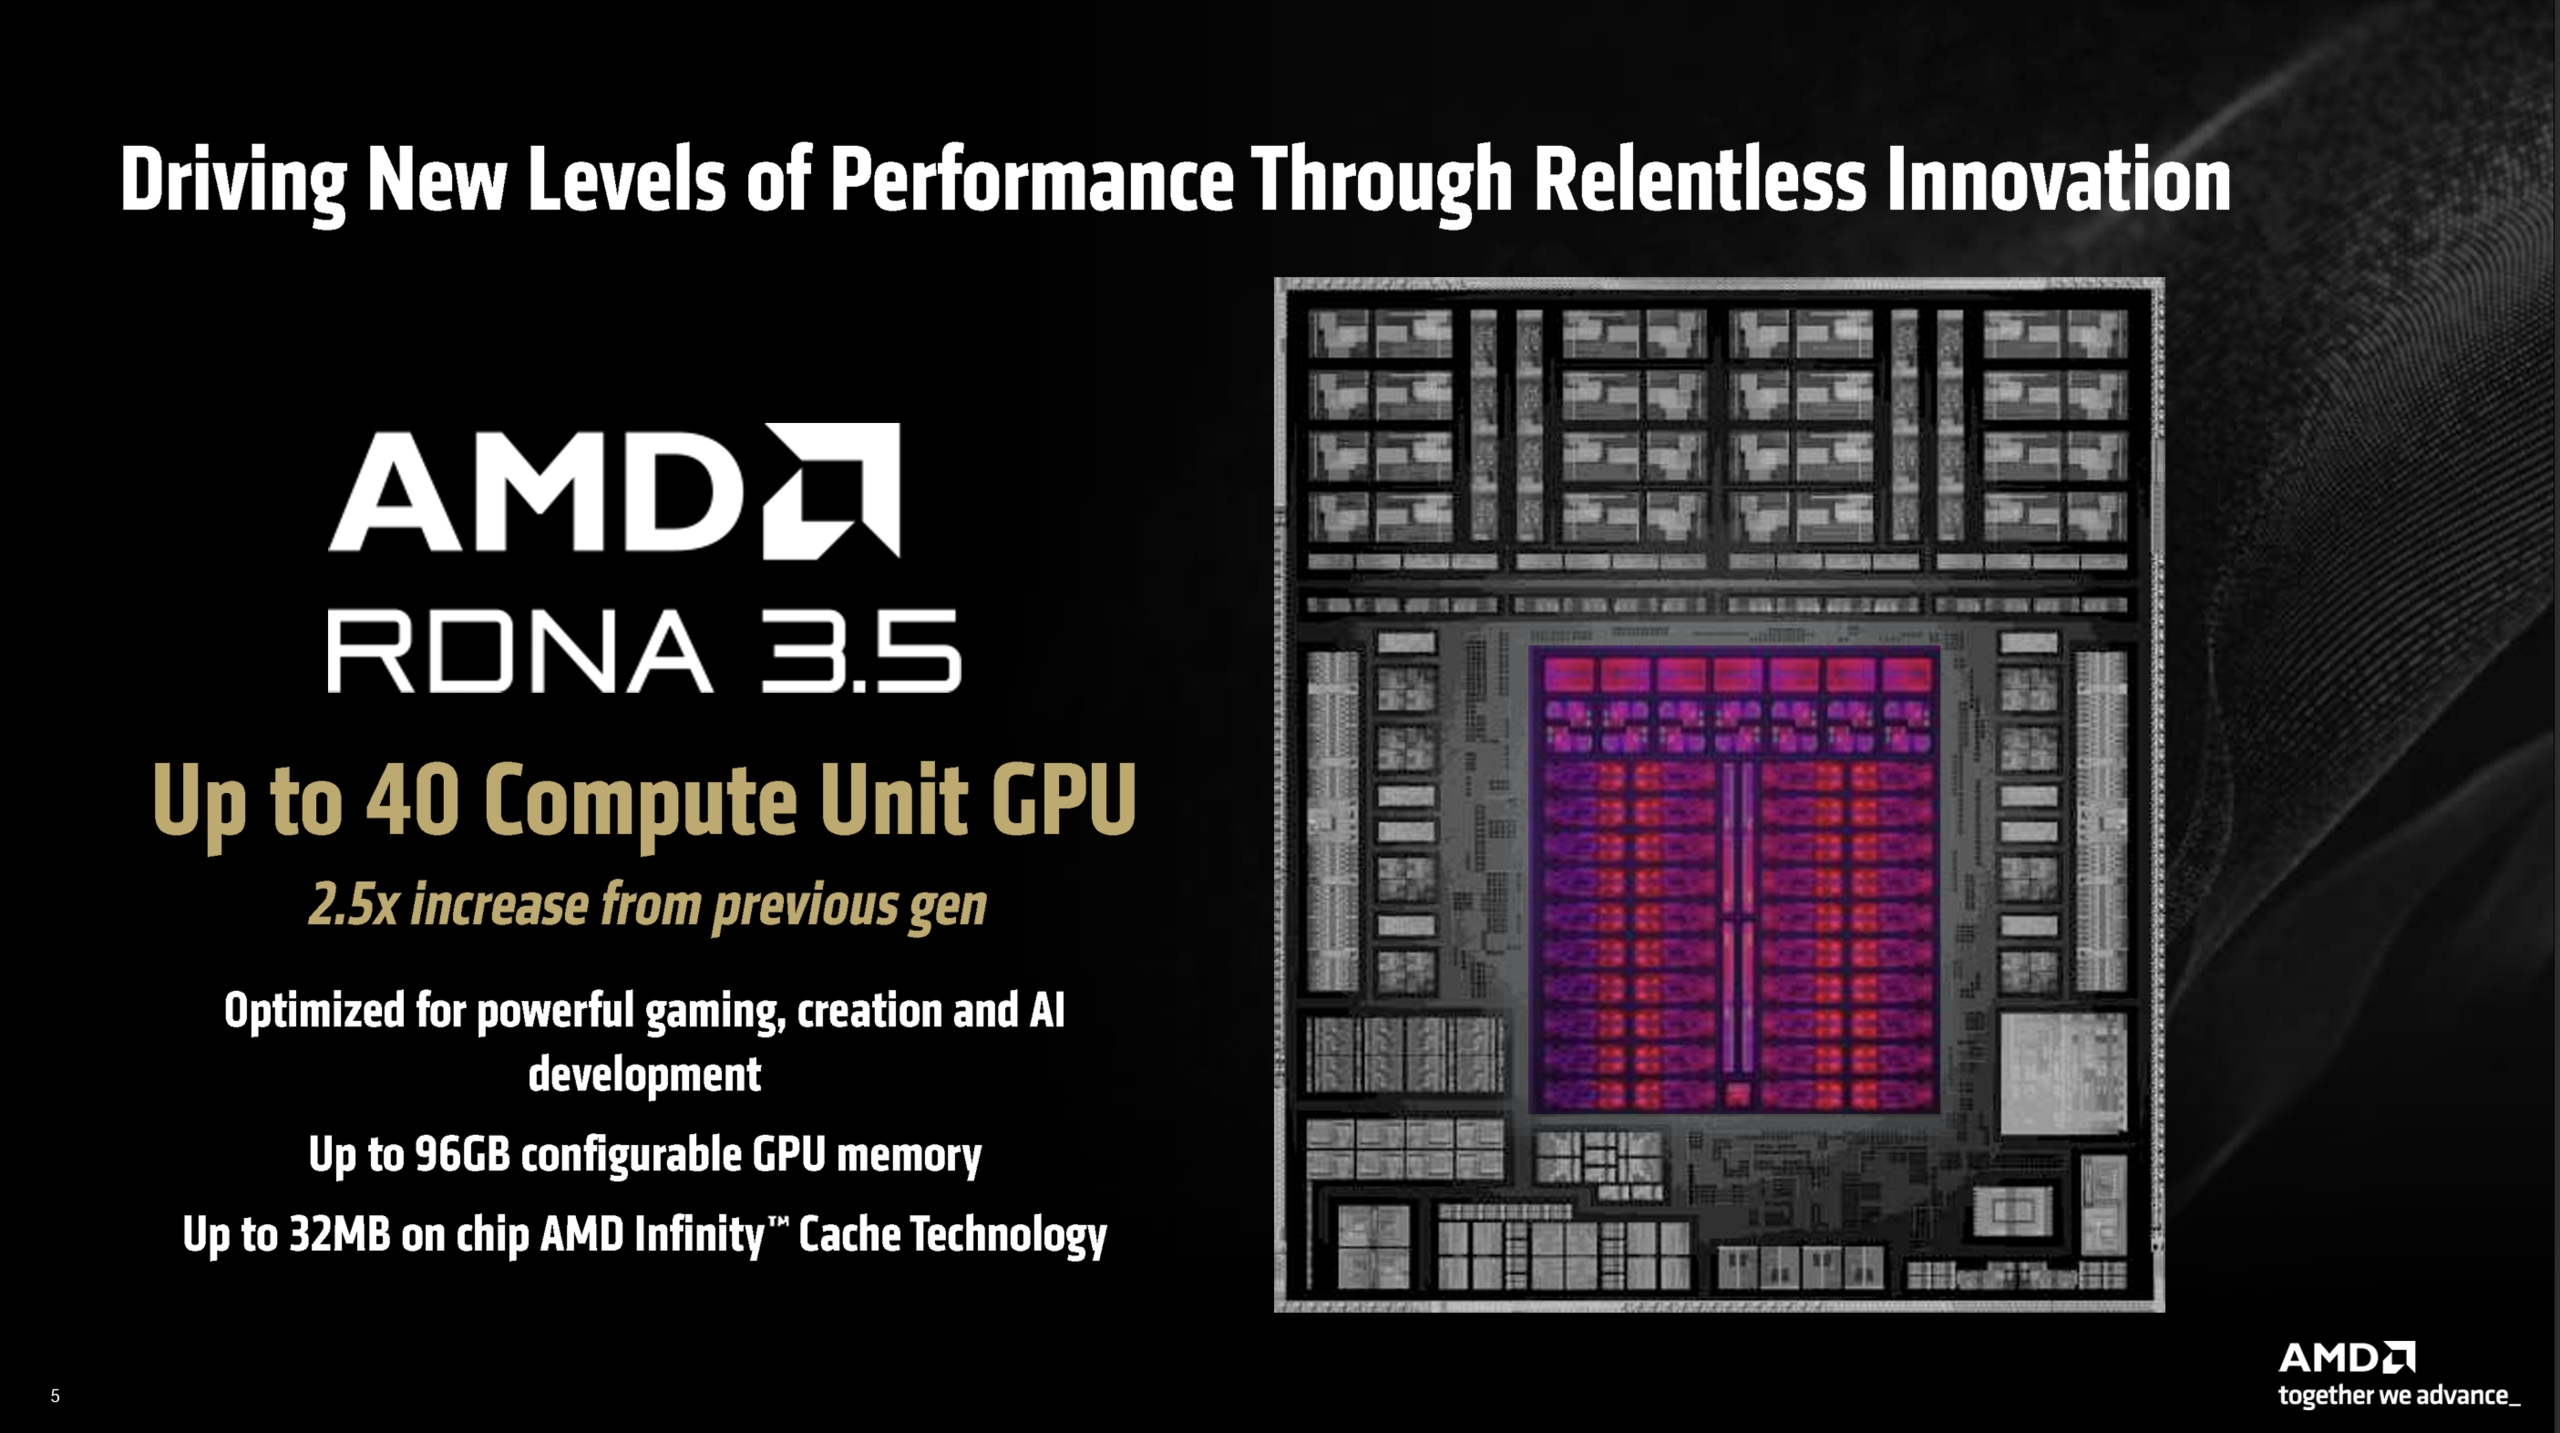
Strix Halo APU 还配备了基于 RDNA 3.5 架构的强大集成 GPU。顶级型号 Ryzen AI Max+ 395 配备了拥有 40 个计算单元的 Radeon 8060S,而其他两个型号则配备了拥有 32 个计算单元的 Radeon 8050S。根据内存配置,您可以为 GPU 分配专用 VRAM(32 GB SKU 最高 24 GB,64 GB SKU 最高 48 GB,128 GB SKU 最高 96 GB)。

AMD 规定的 TDP 范围在 45-125 瓦之间,因此新的 Strix Halo APU 主要是为配备相应散热解决方案的功能强大的多媒体笔记本电脑而设计的。根据 惠普 ZBook Ultra 14第四款 Strix Halo 芯片名为 Ryzen AI Max 380,配备 6 个内核以及速度更慢的 Radeon 8040S iGPU。

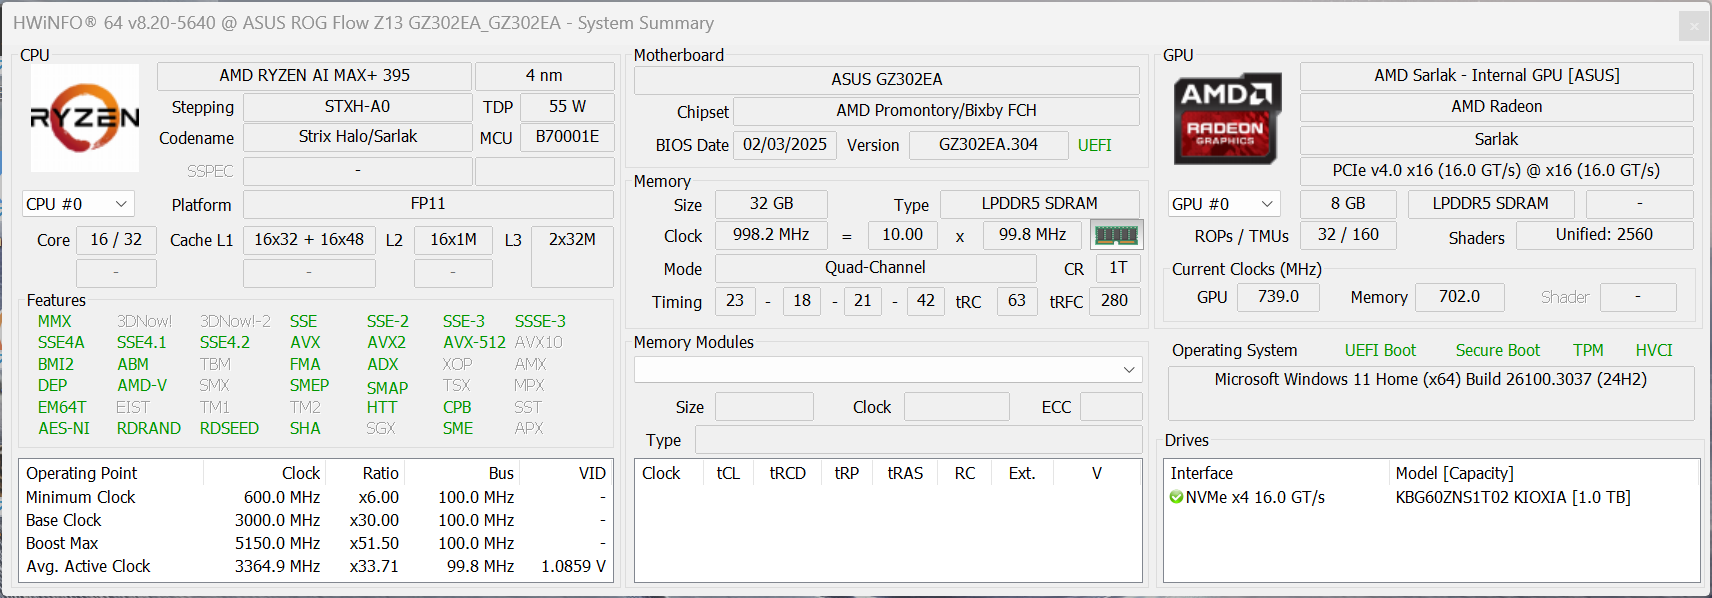
测试系统 - 华硕 ROG Flow Z13 GZ302

华硕 ROG Flow Z13 GZ302EA

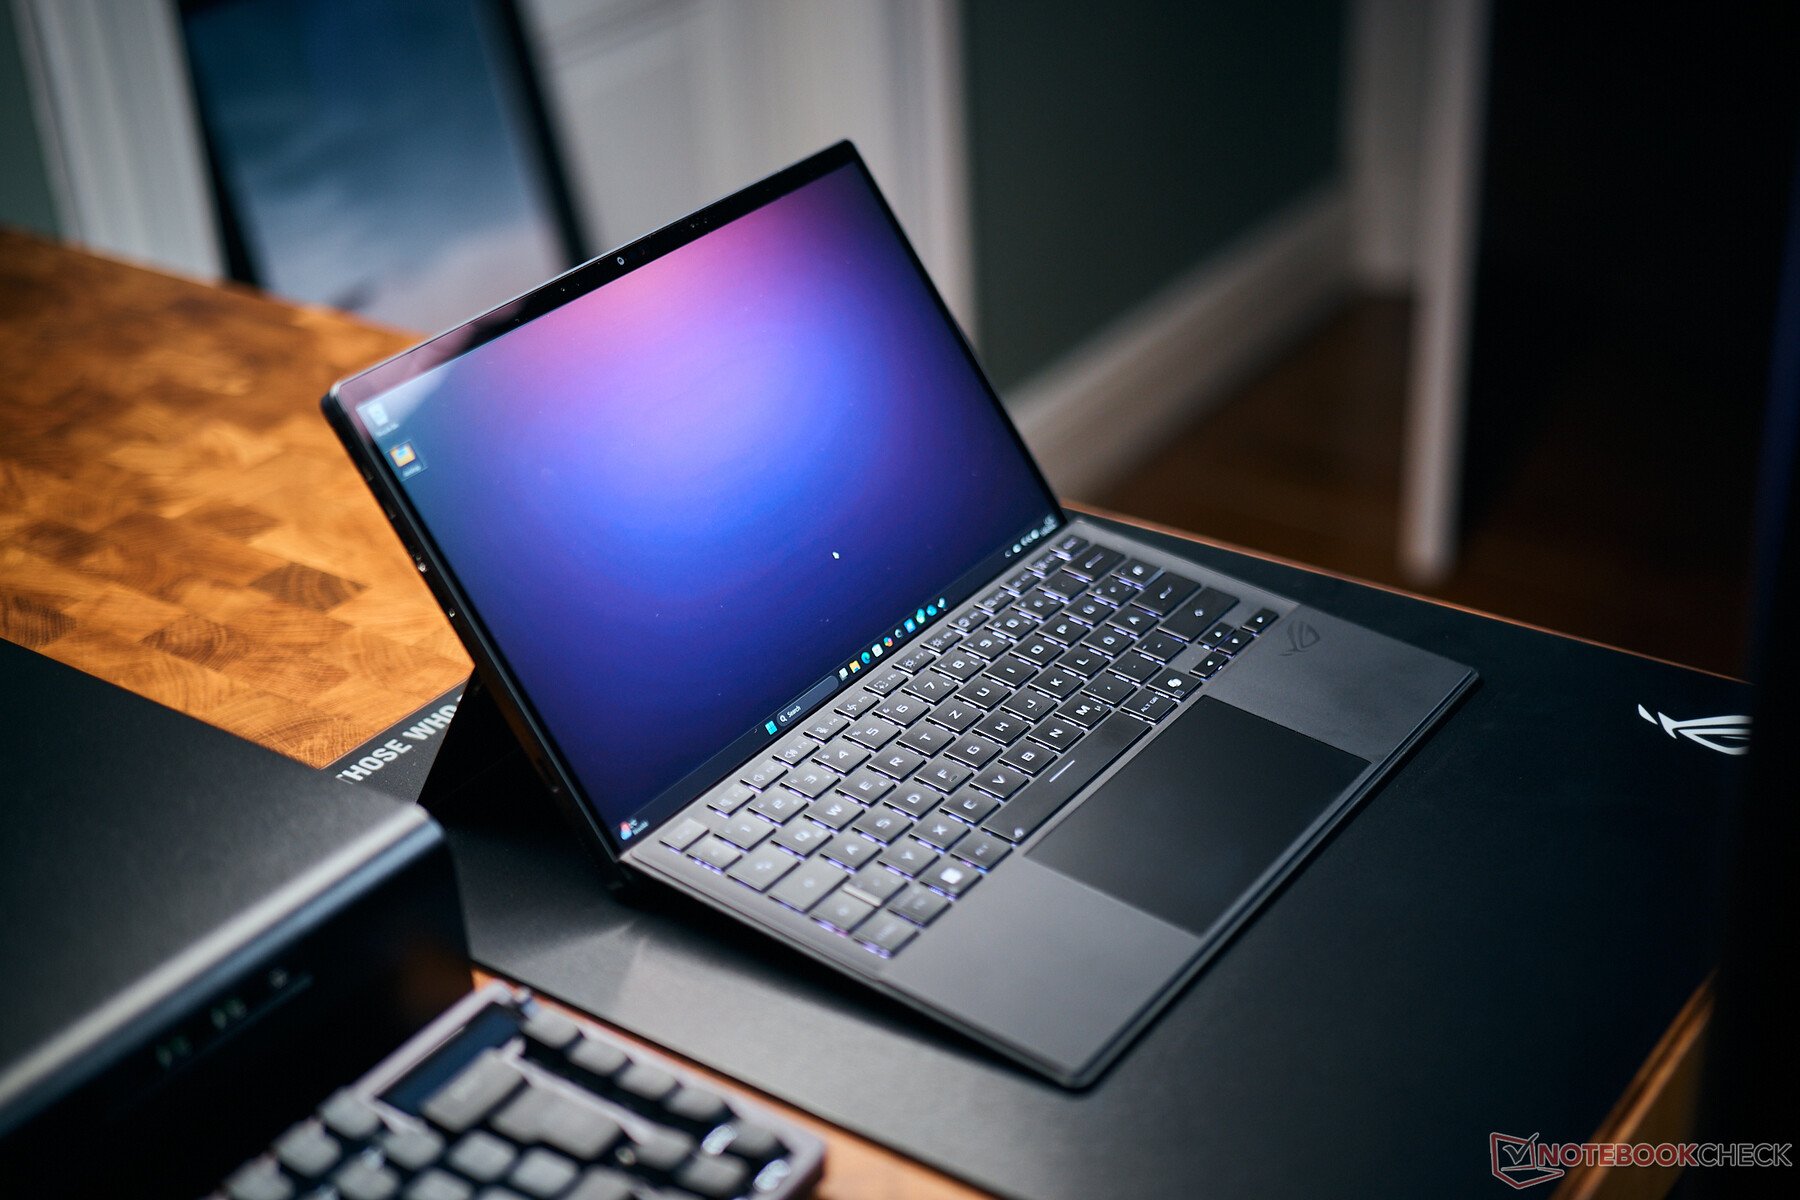
我们的测试系统是 2025 型号的游戏敞篷车 华硕 ROG Flow Z13 GZ302EA的 2025 型号。它配备了旗舰级 Ryzen AI Max+ 395、全新 Strix Halo 系列的旗舰型号,拥有 16 个 CPU 核心和 Radeon 8060S。它是配备 32 GB 内存(LPDDR5x-8000)的 SKU,GPU 也可以使用该内存。您还可以分配多达 24 GB 的专用 VRAM。专用 VRAM 可在某些游戏或创意应用程序中发挥积极作用,但自动模式在一般情况下也能很好地运行。我们按照华硕的建议,在基准测试中使用了 8GB 专用 VRAM。

使用 Turbo 模式时,Ryzen AI Max+ 395 的功耗可在短时间内达到 86 瓦,而当只对 CPU 或 GPU 施加压力时,功耗会稳定在 70 瓦。综合工作负载的 TDP 为 60 瓦。

HWiNFO 华硕 ROG Flow Z13,搭载 Ryzen AI Max+ 395

测试程序

为确保对不同处理器和显卡进行有意义的比较,我们在评估功耗的同时还评估了合成基准性能,从而确定整体效率。我们的功耗测量是使用外部显示器进行的,从而消除了不同内部显示器功耗的影响。不过,需要注意的是,我们测量的是系统总功耗,而非仅仅比较原始 TDP 值。

CPU 性能

我们从单核场景开始CPU性能部分。新 APU 使用我们熟悉的 Zen 5 内核,最高主频同样为 5.1 GHz,因此我们获得与其他 Zen 5 APU(如 Ryzen AI 9 HX 370在 Cinebench 测试中的结果与其他 Zen 5 APU(如 Ryzen AI 9 HX 370)不相上下。测试结果与老款 Dragon Range HX 系列(如 Ryzen 9 7945HX3D),但也慢于英特尔最新的 Arrow Lake 和 Lunar Lake 芯片(至少是快速的酷睿 Ultra 9 变体)。配备双核涡轮增压技术的快速骁龙 X Elite SoC (X1E-80-100及更快)也遥遥领先,但 ARM 型号 X1E-78-100Apple 的 M4 SoC 则完全不同,AMD 和英特尔的最新台式机 CPU 也比 Ryzen AI Max 395 更快。

新的 Strix Halo APU 在最新的 Geekbench 6 测试中表现更好,可以击败 AMD、英特尔和高通公司目前所有的移动处理器。旧款 Raptor Lake 酷睿 i9-14900HX不相上下;目前的台式机 CPU,尤其是Apple 的 M4 芯片再次领先。

Cinebench 2024: CPU Single Core | Cinebench R23: Single Core | Geekbench 6.3: Single-Core
Cinebench 2024 / CPU Single Core
Apple M4 Pro (14 cores)
Apple MacBook Pro 16 2024 M4 Pro
178 Points +52%
Apple M4 Max (16 cores)
Apple MacBook Pro 16 M4 Max
178 Points +52%
Intel Core Ultra 9 285K
144 Points +23%
AMD Ryzen 9 9900X
AMD Ryzen 9 9900X
138 Points +18%
AMD Ryzen 7 9700X
AMD Ryzen 7 9700X
136 Points +16%
AMD Ryzen 9 9950X
AMD Ryzen 9 9950X
136 Points +16%
Intel Core i9-14900HX
SCHENKER XMG Neo 17 E24
130 Points +11%
Intel Core i9-14900HX
Asus ROG Strix Scar 16 G634JZR
128 Points +10%
Qualcomm Snapdragon X Elite X1E-84-100
Samsung Galaxy Book4 Edge 16 X1E-84-100
127 Points +9%
Intel Core Ultra 9 285H
MSI Prestige 16 AI Evo B2HMG
127 Points +9%
Intel Core i9-14900HX
Lenovo Legion 7 16 IRX G9
126.4 Points +8%
Qualcomm Snapdragon X Elite X1E-80-100
Microsoft Surface Laptop 15 Snapdragon X Elite
123 Points +5%
Intel Core i9-14900HX
Acer Predator Helios 16 PH16-72
122.9 Points +5%
Intel Core Ultra 9 288V
Asus Zenbook S 14 UX5406 Core Ultra 9
122 Points +4%
Intel Core i7-14650HX
Lenovo Legion 5 16IRX G9
117 Points 0%
AMD Ryzen AI Max+ 395
Asus ROG Flow Z13 GZ302EA-RU073W
116.8 Points
AMD Ryzen AI 9 HX 370
Asus ProArt P16 H7606WI
116 Points -1%
AMD Ryzen 9 7945HX3D
Asus ROG Strix Scar 17 G733PYV-LL053X
115 Points -2%
AMD Ryzen 9 7945HX
Minisforum BD790i
114 Points -2%
AMD Ryzen AI 9 365
Lenovo Yoga Pro 7 14ASP G9
113.5 Points -3%
AMD Ryzen 9 7945HX
Tuxedo Gemini 17 Gen3 AMD
111 Points -5%
AMD Ryzen AI 7 PRO 360
Lenovo ThinkPad T14s Gen 6 21M2S00G00
108.5 Points -7%
Qualcomm Snapdragon X Elite X1E-78-100
Lenovo Yoga Slim 7X 14Q8X9
108 Points -8%
Intel Core i9-13900H
Minisforum MS-01
101 Points -14%
Cinebench R23 / Single Core
Intel Core Ultra 9 285K
2353 Points +16%
Apple M4 Pro (14 cores)
Apple MacBook Pro 16 2024 M4 Pro
2290 Points +13%
AMD Ryzen 9 9900X
AMD Ryzen 9 9900X
2253 Points +11%
Intel Core i9-14900HX
SCHENKER XMG Neo 17 E24
2233 Points +10%
AMD Ryzen 7 9700X
AMD Ryzen 7 9700X
2211 Points +9%
Apple M4 Max (16 cores)
Apple MacBook Pro 16 M4 Max
2209 Points +9%
AMD Ryzen 9 9950X
AMD Ryzen 9 9950X
2202 Points +8%
Intel Core i9-14900HX
Lenovo Legion 7 16 IRX G9
2195 Points +8%
Intel Core i9-14900HX
Asus ROG Strix Scar 16 G634JZR
2193 Points +8%
Intel Core Ultra 9 285H
MSI Prestige 16 AI Evo B2HMG
2126 Points +5%
Intel Core i9-14900HX
Acer Predator Helios 16 PH16-72
2122 Points +4%
Intel Core i9-13980HX
Asus ProArt Studiobook 16 OLED H7604
2110 Points +4%
AMD Ryzen AI 9 HX 370
Asus ProArt P16 H7606WI
2049 Points +1%
AMD Ryzen AI Max+ 395
Asus ROG Flow Z13 GZ302EA-RU073W
2034 Points
AMD Ryzen AI 9 365
Lenovo Yoga Pro 7 14ASP G9
1992 Points -2%
Intel Core i7-14650HX
Lenovo Legion 5 16IRX G9
1963 Points -3%
AMD Ryzen AI 7 PRO 360
Lenovo ThinkPad T14s Gen 6 21M2S00G00
1958 Points -4%
AMD Ryzen 9 7945HX
Minisforum BD790i
1942 Points -5%
AMD Ryzen 9 7945HX3D
Asus ROG Strix Scar 17 G733PYV-LL053X
1935 Points -5%
AMD Ryzen 9 7945HX
Tuxedo Gemini 17 Gen3 AMD
1861 Points -9%
Intel Core i9-13900H
Minisforum MS-01
1806 Points -11%
Qualcomm Snapdragon X Elite X1E-84-100
Samsung Galaxy Book4 Edge 16 X1E-84-100
1350 Points -34%
Qualcomm Snapdragon X Elite X1E-80-100
Microsoft Surface Laptop 15 Snapdragon X Elite
1297 Points -36%
Qualcomm Snapdragon X Elite X1E-78-100
Lenovo Yoga Slim 7X 14Q8X9
1130 Points -44%
Geekbench 6.3 / Single-Core
Apple M4 Max (16 cores)
Apple MacBook Pro 16 M4 Max
3880 Points +30%
Apple M4 Pro (14 cores)
Apple MacBook Pro 16 2024 M4 Pro
3836 Points +29%
AMD Ryzen 9 9900X
AMD Ryzen 9 9900X
3429 Points +15%
AMD Ryzen 9 9950X
AMD Ryzen 9 9950X
3408 Points +14%
AMD Ryzen 7 9700X
AMD Ryzen 7 9700X
3373 Points +13%
Intel Core Ultra 9 285K
3306 Points +11%
Intel Core i9-14900HX
SCHENKER XMG Neo 17 E24
3074 Points +3%
Intel Core i9-14900HX
Asus ROG Strix Scar 16 G634JZR
3025 Points +2%
Intel Core i9-14900HX
Lenovo Legion 7 16 IRX G9
2980 Points 0%
AMD Ryzen AI Max+ 395
Asus ROG Flow Z13 GZ302EA-RU073W
2978 Points
Intel Core i9-14900HX
Acer Predator Helios 16 PH16-72
2970 Points 0%
AMD Ryzen 9 7945HX
Minisforum BD790i
2940 Points -1%
AMD Ryzen 9 7945HX3D
Asus ROG Strix Scar 17 G733PYV-LL053X
2916 Points -2%
Intel Core Ultra 9 285H
MSI Prestige 16 AI Evo B2HMG
2912 Points -2%
Intel Core Ultra 9 288V
Asus Zenbook S 14 UX5406 Core Ultra 9
2864 Points -4%
AMD Ryzen AI 9 HX 370
Asus ProArt P16 H7606WI
2857 Points -4%
Qualcomm Snapdragon X Elite X1E-84-100
Samsung Galaxy Book4 Edge 16 X1E-84-100
2834 Points -5%
AMD Ryzen AI 9 365
Lenovo Yoga Pro 7 14ASP G9
2815 Points -5%
Qualcomm Snapdragon X Elite X1E-80-100
Microsoft Surface Laptop 15 Snapdragon X Elite
2812 Points -6%
Qualcomm Snapdragon X Elite X1E-80-100
Microsoft Surface Laptop 15 Snapdragon X Elite
1896 Points -36%
Qualcomm Snapdragon X Elite X1E-80-100
Microsoft Surface Laptop 15 Snapdragon X Elite
1896 Points -36%
AMD Ryzen 9 7945HX
Tuxedo Gemini 17 Gen3 AMD
2797 Points -6%
Intel Core i7-14650HX
Lenovo Legion 5 16IRX G9
2761 Points -7%
AMD Ryzen AI 7 PRO 360
Lenovo ThinkPad T14s Gen 6 21M2S00G00
2699 Points -9%
Intel Core i9-13900H
Minisforum MS-01
2624 Points -12%
Qualcomm Snapdragon X Elite X1E-78-100
Lenovo Yoga Slim 7X 14Q8X9
2464 Points -17%
Cinebench 2024: CPU Single Core | Cinebench R23: Single Core | Geekbench 6.3: Single-Core

在单核效率比较中,我们使用了 Cinebench 2024 和较早的 Cinebench R23,因为后者有更多的比较数据(尤其是 HX CPU)。在 Cinebench 2024 中,新的 Ryzen AI Max+ 395 明显不如当前的其他移动 CPU(Ryzen AI 和英特尔 Arrow Lake-H/Lunar Lake-V)。来自Apple 和高通公司的 ARM 竞争对手在单核场景下的效率也要高得多。只有台式机芯片的效率更低。

较早的 Cinebench R23 测试也显示了当前移动处理器的优势,但较早的 HX 系列芯片(在整体性能上更接近 Ryzen AI Max)明显被 Strix Halo APU 击败。AMD 和英特尔目前的台式机 CPU 也是如此。

Power Consumption / Cinebench 2024 Single Power Efficiency - external Monitor
Apple M4 Pro (14 cores)
Apple MacBook Pro 16 2024 M4 Pro
9.52 Points per Watt +263%
Apple M4 Max (16 cores)
Apple MacBook Pro 16 M4 Max
8.24 Points per Watt +215%
Qualcomm Snapdragon X Elite X1E-78-100
Lenovo Yoga Slim 7X 14Q8X9
6.84 Points per Watt +161%
Qualcomm Snapdragon X Elite X1E-84-100
Samsung Galaxy Book4 Edge 16 X1E-84-100
6.32 Points per Watt +141%
Qualcomm Snapdragon X Elite X1E-80-100
Microsoft Surface Laptop 7 13.8 Copilot+
5.89 Points per Watt +125%
Intel Core Ultra 9 288V
Asus Zenbook S 14 UX5406 Core Ultra 9
4.78 Points per Watt +82%
AMD Ryzen AI 9 365
Lenovo Yoga Pro 7 14ASP G9
4.01 Points per Watt +53%
Intel Core Ultra 9 285H
MSI Prestige 16 AI Evo B2HMG
3.76 Points per Watt +44%
AMD Ryzen AI 7 PRO 360
Lenovo ThinkPad T14s Gen 6 21M2S00G00
3.65 Points per Watt +39%
AMD Ryzen AI 9 HX 370
Asus ProArt P16 H7606WI
3.4 Points per Watt +30%
AMD Ryzen AI Max+ 395
Asus ROG Flow Z13 GZ302EA-RU073W
2.62 Points per Watt
Intel Core Ultra 9 285K
1.321 Points per Watt -50%
AMD Ryzen 7 9700X
AMD Ryzen 7 9700X
1.236 Points per Watt -53%
AMD Ryzen 9 9900X
AMD Ryzen 9 9900X
1.095 Points per Watt -58%
AMD Ryzen 9 9950X
AMD Ryzen 9 9950X
0.997 Points per Watt -62%
Power Consumption / Cinebench R23 Single Power Efficiency - external Monitor
Apple M4 Pro (14 cores)
Apple MacBook Pro 16 2024 M4 Pro
131.6 Points per Watt +188%
Apple M4 Max (16 cores)
Apple MacBook Pro 16 M4 Max
109.4 Points per Watt +139%
Qualcomm Snapdragon X Elite X1E-78-100
Lenovo Yoga Slim 7X 14Q8X9
70.6 Points per Watt +54%
AMD Ryzen AI 9 365
Lenovo Yoga Pro 7 14ASP G9
67.3 Points per Watt +47%
AMD Ryzen AI 7 PRO 360
Lenovo ThinkPad T14s Gen 6 21M2S00G00
66.4 Points per Watt +45%
Intel Core Ultra 9 285H
MSI Prestige 16 AI Evo B2HMG
63.7 Points per Watt +39%
Qualcomm Snapdragon X Elite X1E-80-100
Microsoft Surface Laptop 7 13.8 Copilot+
61.2 Points per Watt +34%
Qualcomm Snapdragon X Elite X1E-84-100
Samsung Galaxy Book4 Edge 16 X1E-84-100
59.2 Points per Watt +30%
AMD Ryzen AI 9 HX 370
Asus ProArt P16 H7606WI
58.9 Points per Watt +29%
AMD Ryzen AI Max+ 395
Asus ROG Flow Z13 GZ302EA-RU073W
45.7 Points per Watt
Intel Core i9-13900H
Minisforum MS-01
36.4 Points per Watt -20%
AMD Ryzen 9 7945HX
Minisforum BD790i
34 Points per Watt -26%
Intel Core i9-14900HX
Lenovo Legion 7 16 IRX G9
32.7 Points per Watt -28%
Intel Core i7-14650HX
Lenovo Legion 5 16IRX G9
31.9 Points per Watt -30%
Intel Core i9-14900HX
SCHENKER XMG Neo 17 E24
28.4 Points per Watt -38%
AMD Ryzen 9 7945HX
Tuxedo Gemini 17 Gen3 AMD
27.7 Points per Watt -39%
AMD Ryzen 9 7945HX3D
Asus ROG Strix Scar 17 G733PYV-LL053X
26.9 Points per Watt -41%
Intel Core i9-14900HX
Asus ROG Strix Scar 16 G634JZR
26.3 Points per Watt -42%
Intel Core i9-13980HX
Asus ProArt Studiobook 16 OLED H7604
25.4 Points per Watt -44%
Intel Core i9-14900HX
Acer Predator Helios 16 PH16-72
23.9 Points per Watt -48%
Intel Core Ultra 9 285K
21.2 Points per Watt -54%
AMD Ryzen 7 9700X
AMD Ryzen 7 9700X
19.7 Points per Watt -57%
AMD Ryzen 9 9900X
AMD Ryzen 9 9900X
17.6 Points per Watt -61%
AMD Ryzen 9 9950X
AMD Ryzen 9 9950X
15.8 Points per Watt -65%

不出所料,新的 Ryzen AI Max+ 395 在多核情况下的性能要好得多,但请记住,我们是在功率受限(86/70 瓦)的 13 英寸可转换机上测试新芯片的。如果使用 125 瓦的全功率,性能会明显提高。目前 AMD、英特尔和高通的移动芯片都不占优势,只有 HX 系列 CPU 可与之媲美(但通常功耗要高得多,尤其是酷睿 i9-14900HX 的对手)。Apple ,M4 Pro 稍占优势,而目前大多数台式机芯片的速度也更快。

新的 Ryzen AI Max+ 395 在 Geekbench 中的表现再次大幅提升,成为速度最快的机型之一。AppleM4 Pro 和 M4 Max SoC 保持领先,但 Ryzen AI Max+ 395 却被英特尔酷睿超 9 285K 或 AMD Ryzen 9950X 等当前台式机芯片所包围。

Cinebench 2024: CPU Multi Core | Cinebench R23: Multi Core | Geekbench 6.3: Multi-Core
Cinebench 2024 / CPU Multi Core
Intel Core Ultra 9 285K
2436 Points +48%
AMD Ryzen 9 9950X
AMD Ryzen 9 9950X
2254 Points +37%
Apple M4 Max (16 cores)
Apple MacBook Pro 16 M4 Max
2069 Points +26%
Apple M4 Max (16 cores)
Apple MacBook Pro 16 M4 Max
2015 Points +22%
AMD Ryzen 9 7945HX
Minisforum BD790i
1828 Points +11%
AMD Ryzen 9 9900X
AMD Ryzen 9 9900X
1818 Points +10%
AMD Ryzen 9 7945HX3D
Asus ROG Strix Scar 17 G733PYV-LL053X
1772 Points +8%
Intel Core i9-14900HX
SCHENKER XMG Neo 17 E24
1731 Points +5%
Apple M4 Pro (14 cores)
Apple MacBook Pro 16 2024 M4 Pro
1729 Points +5%
AMD Ryzen 9 7945HX
Tuxedo Gemini 17 Gen3 AMD
1677 Points +2%
AMD Ryzen AI Max+ 395
Asus ROG Flow Z13 GZ302EA-RU073W
1648 Points
Intel Core i9-14900HX
Asus ROG Strix Scar 16 G634JZR
1639 Points -1%
Intel Core i9-14900HX
Acer Predator Helios 16 PH16-72
1479 Points -10%
Intel Core i9-14900HX
Lenovo Legion 7 16 IRX G9
1450 Points -12%
AMD Ryzen 7 9800X3D
AMD Ryzen 7 9800X3D
1358 Points -18%
Intel Core i7-14650HX
Lenovo Legion 5 16IRX G9
1235 Points -25%
AMD Ryzen AI 9 HX 370
Asus ProArt P16 H7606WI
1213 Points -26%
AMD Ryzen 7 9700X
AMD Ryzen 7 9700X
1203 Points -27%
AMD Ryzen AI 9 365
Lenovo Yoga Pro 7 14ASP G9
996 Points -40%
Intel Core Ultra 9 285H
MSI Prestige 16 AI Evo B2HMG
991 Points -40%
Qualcomm Snapdragon X Elite X1E-84-100
Samsung Galaxy Book4 Edge 16 X1E-84-100
866 Points -47%
Intel Core i9-13900H
Minisforum MS-01
818 Points -50%
AMD Ryzen AI 7 PRO 360
Lenovo ThinkPad T14s Gen 6 21M2S00G00
708 Points -57%
Intel Core Ultra 9 288V
Asus Zenbook S 14 UX5406 Core Ultra 9
598 Points -64%
Cinebench R23 / Multi Core
Intel Core Ultra 9 285K
42705 Points +47%
AMD Ryzen 9 9950X
AMD Ryzen 9 9950X
40924 Points +41%
AMD Ryzen 9 7945HX
Minisforum BD790i
33459 Points +15%
AMD Ryzen 9 7945HX3D
Asus ROG Strix Scar 17 G733PYV-LL053X
32782 Points +13%
AMD Ryzen 9 9900X
AMD Ryzen 9 9900X
32172 Points +11%
Intel Core i9-14900HX
SCHENKER XMG Neo 17 E24
31740 Points +9%
Intel Core i9-14900HX
Lenovo Legion 7 16 IRX G9
31127 Points +7%
Intel Core i9-13980HX
Asus ProArt Studiobook 16 OLED H7604
30789 Points +6%
AMD Ryzen 9 7945HX
Tuxedo Gemini 17 Gen3 AMD
30783 Points +6%
Intel Core i9-14900HX
Asus ROG Strix Scar 16 G634JZR
30411 Points +5%
Intel Core i9-14900HX
Acer Predator Helios 16 PH16-72
30155 Points +4%
AMD Ryzen AI Max+ 395
Asus ROG Flow Z13 GZ302EA-RU073W
29063 Points
Apple M4 Max (16 cores)
Apple MacBook Pro 16 M4 Max
27595 Points -5%
Intel Core i7-14650HX
Lenovo Legion 5 16IRX G9
24455 Points -16%
AMD Ryzen AI 9 HX 370
Asus ProArt P16 H7606WI
23786 Points -18%
Apple M4 Pro (14 cores)
Apple MacBook Pro 16 2024 M4 Pro
23437 Points -19%
AMD Ryzen 7 9800X3D
AMD Ryzen 7 9800X3D
23230 Points -20%
AMD Ryzen 7 9700X
AMD Ryzen 7 9700X
20485 Points -30%
Intel Core Ultra 9 285H
MSI Prestige 16 AI Evo B2HMG
20442 Points -30%
AMD Ryzen AI 9 365
Lenovo Yoga Pro 7 14ASP G9
18748 Points -35%
Intel Core i9-13900H
Minisforum MS-01
16209 Points -44%
AMD Ryzen AI 7 PRO 360
Lenovo ThinkPad T14s Gen 6 21M2S00G00
13794 Points -53%
Qualcomm Snapdragon X Elite X1E-84-100
Samsung Galaxy Book4 Edge 16 X1E-84-100
9471 Points -67%
Geekbench 6.3 / Multi-Core
Apple M4 Max (16 cores)
Apple MacBook Pro 16 M4 Max
25760 Points +21%
Apple M4 Pro (14 cores)
Apple MacBook Pro 16 2024 M4 Pro
22509 Points +6%
Intel Core Ultra 9 285K
21688 Points +2%
AMD Ryzen 9 9950X
AMD Ryzen 9 9950X
21383 Points +1%
AMD Ryzen AI Max+ 395
Asus ROG Flow Z13 GZ302EA-RU073W
21269 Points
AMD Ryzen 9 9900X
AMD Ryzen 9 9900X
20380 Points -4%
Intel Core i9-14900HX
Asus ROG Strix Scar 16 G634JZR
18590 Points -13%
Intel Core i9-14900HX
SCHENKER XMG Neo 17 E24
18572 Points -13%
Intel Core i9-14900HX
Lenovo Legion 7 16 IRX G9
18079 Points -15%
AMD Ryzen 7 9800X3D
AMD Ryzen 7 9800X3D
18074 Points -15%
AMD Ryzen 9 7945HX
Minisforum BD790i
17892 Points -16%
Intel Core i9-14900HX
Acer Predator Helios 16 PH16-72
17654 Points -17%
Intel Core Ultra 9 285H
MSI Prestige 16 AI Evo B2HMG
17262 Points -19%
AMD Ryzen 9 7945HX3D
Asus ROG Strix Scar 17 G733PYV-LL053X
16957 Points -20%
AMD Ryzen 7 9700X
AMD Ryzen 7 9700X
16817 Points -21%
AMD Ryzen 9 7945HX
Tuxedo Gemini 17 Gen3 AMD
16223 Points -24%
Intel Core i7-14650HX
Lenovo Legion 5 16IRX G9
16010 Points -25%
Qualcomm Snapdragon X Elite X1E-84-100
Samsung Galaxy Book4 Edge 16 X1E-84-100
15665 Points -26%
AMD Ryzen AI 9 HX 370
Asus ProArt P16 H7606WI
15221 Points -28%
AMD Ryzen AI 9 365
Lenovo Yoga Pro 7 14ASP G9
14118 Points -34%
Intel Core i9-13900H
Minisforum MS-01
12677 Points -40%
AMD Ryzen AI 7 PRO 360
Lenovo ThinkPad T14s Gen 6 21M2S00G00
12344 Points -42%
Intel Core Ultra 9 288V
Asus Zenbook S 14 UX5406 Core Ultra 9
11069 Points -48%
Cinebench 2024: CPU Multi Core | Cinebench R23: Multi Core | Geekbench 6.3: Multi-Core

我们再次从 Cinebench 2024 的效率入手,Ryzen AI Max 在这方面表现出色,仅次于新的 Arrow Lake-H 芯片 Core Ultra 9 285H击败。所有其他型号的效率要么与之相当,要么更差,但 ARM 竞争对手的效率再次更高。

较早的 R23 Multi 测试对于与 x86 竞争对手的比较更有意义,因为 ARM CPU 会模拟这一基准,从而影响性能。在这种情况下,新的 Ryzen AI Max APU 是效率最高的芯片之一,击败了所有 HX 竞争对手以及台式机型号。

Power Consumption / Cinebench 2024 Multi Power Efficiency - external Monitor
Apple M4 Max (16 cores)
Apple MacBook Pro 16 M4 Max
22.4 Points per Watt +52%
Qualcomm Snapdragon X Elite X1E-80-100
Microsoft Surface Laptop 7 13.8 Copilot+
22.2 Points per Watt +51%
Qualcomm Snapdragon X Elite X1E-84-100
Samsung Galaxy Book4 Edge 16 X1E-84-100
22.1 Points per Watt +50%
Apple M4 Pro (14 cores)
Apple MacBook Pro 16 2024 M4 Pro
20.2 Points per Watt +37%
Intel Core Ultra 9 285H
MSI Prestige 16 AI Evo B2HMG
19.1 Points per Watt +30%
Qualcomm Snapdragon X Elite X1E-78-100
Lenovo Yoga Slim 7X 14Q8X9
18 Points per Watt +22%
AMD Ryzen AI 7 PRO 360
Lenovo ThinkPad T14s Gen 6 21M2S00G00
15 Points per Watt +2%
AMD Ryzen AI Max+ 395
Asus ROG Flow Z13 GZ302EA-RU073W
14.7 Points per Watt
Intel Core Ultra 9 288V
Asus Zenbook S 14 UX5406 Core Ultra 9
14 Points per Watt -5%
AMD Ryzen AI 9 365
Lenovo Yoga Pro 7 14ASP G9
12.5 Points per Watt -15%
AMD Ryzen AI 9 HX 370
Asus ProArt P16 H7606WI
10.2 Points per Watt -31%
Intel Core Ultra 9 285K
7.43 Points per Watt -49%
AMD Ryzen 9 9950X
AMD Ryzen 9 9950X
7.18 Points per Watt -51%
AMD Ryzen 7 9700X
AMD Ryzen 7 9700X
6.86 Points per Watt -53%
AMD Ryzen 9 9900X
AMD Ryzen 9 9900X
6.61 Points per Watt -55%
Power Consumption / Cinebench R23 Multi Power Efficiency - external Monitor
Apple M4 Pro (14 cores)
Apple MacBook Pro 16 2024 M4 Pro
296 Points per Watt +19%
Apple M4 Max (16 cores)
Apple MacBook Pro 16 M4 Max
281 Points per Watt +13%
AMD Ryzen AI 7 PRO 360
Lenovo ThinkPad T14s Gen 6 21M2S00G00
259 Points per Watt +4%
AMD Ryzen AI Max+ 395
Asus ROG Flow Z13 GZ302EA-RU073W
249 Points per Watt
Qualcomm Snapdragon X Elite X1E-80-100
Microsoft Surface Laptop 7 13.8 Copilot+
247 Points per Watt -1%
AMD Ryzen 9 7945HX
Minisforum BD790i
237 Points per Watt -5%
AMD Ryzen AI 9 365
Lenovo Yoga Pro 7 14ASP G9
235 Points per Watt -6%
Qualcomm Snapdragon X Elite X1E-84-100
Samsung Galaxy Book4 Edge 16 X1E-84-100
234 Points per Watt -6%
Intel Core Ultra 9 285H
MSI Prestige 16 AI Evo B2HMG
218 Points per Watt -12%
AMD Ryzen AI 9 HX 370
Asus ProArt P16 H7606WI
208 Points per Watt -16%
AMD Ryzen 9 7945HX3D
Asus ROG Strix Scar 17 G733PYV-LL053X
207 Points per Watt -17%
AMD Ryzen 9 7945HX
Tuxedo Gemini 17 Gen3 AMD
198 Points per Watt -20%
Qualcomm Snapdragon X Elite X1E-78-100
Lenovo Yoga Slim 7X 14Q8X9
173.7 Points per Watt -30%
Intel Core i9-13900H
Minisforum MS-01
164.2 Points per Watt -34%
Intel Core i9-14900HX
Lenovo Legion 7 16 IRX G9
158.6 Points per Watt -36%
Intel Core i9-14900HX
Asus ROG Strix Scar 16 G634JZR
144.8 Points per Watt -42%
Intel Core i7-14650HX
Lenovo Legion 5 16IRX G9
143.3 Points per Watt -42%
Intel Core i9-14900HX
SCHENKER XMG Neo 17 E24
142.3 Points per Watt -43%
Intel Core i9-14900HX
Acer Predator Helios 16 PH16-72
139.6 Points per Watt -44%
Intel Core i9-13980HX
Asus ProArt Studiobook 16 OLED H7604
135 Points per Watt -46%
AMD Ryzen 9 9950X
AMD Ryzen 9 9950X
129.5 Points per Watt -48%
Intel Core Ultra 9 285K
127.5 Points per Watt -49%
AMD Ryzen 9 9900X
AMD Ryzen 9 9900X
117 Points per Watt -53%
AMD Ryzen 7 9700X
AMD Ryzen 7 9700X
116.9 Points per Watt -53%
AMD Ryzen 7 9800X3D
AMD Ryzen 7 9800X3D
96.4 Points per Watt -61%

图形处理器性能

除了功能强大的 CPU 之外,还有一块名为 Radeon 8060S 的强大集成显卡。AMD 声称它是最快的 x86-iGPU,我们可以立即确认这一点,因为无论是 Radeon 890M英特尔弧形图形 140V/140T都无法与全新的 Radeon 8060S 相抗衡。

我们从不同的 3DMark 基准测试开始,它们清楚地表明,Radeon 8060S 的 TGP 值在 65-75 瓦之间,与GeForce RTX 4070 笔记本电脑相当。3DMark 11 以及 3DMarkFire Strike 和Time Spy 的情况也是如此,但 Radeon 8060S 与 RTX 4070 笔记本电脑相比还是有一些差距。 RTX 4070 笔记本电脑相比,Radeon 8060S 在 Speed Way 和Steel Nomad 测试中略逊一筹。

3DMark 11 / Performance GPU
NVIDIA GeForce RTX 4070 Laptop GPU
Razer Blade 14 RZ09-0508, R9 8945HS, 140
44315 Points +9%
NVIDIA GeForce RTX 4070 Laptop GPU
Razer Blade 14 RTX 4070, R9 7940HS, 140
42318 Points +4%
AMD Radeon RX 8060S
Asus ROG Flow Z13 GZ302EA-RU073W, Ryzen AI Max+ 395, 80
40732 Points
NVIDIA GeForce RTX 4070 Laptop GPU
Asus ProArt PX13 HN7306, Ryzen AI 9 HX 370, 75
38156 Points -6%
NVIDIA GeForce RTX 4060 Laptop GPU
Acer Nitro 14 AN14-41-R3MX, R5 8645HS, 110
37827 Points -7%
NVIDIA GeForce RTX 4070 Laptop GPU
Asus ROG Zephyrus G14 2024 GA403U, R9 8945HS, 90
37023 Points -9%
NVIDIA GeForce RTX 4070 Laptop GPU
Acer Predator Helios Neo 14 (2024), Ultra 9 185H, 125
36209 Points -11%
NVIDIA GeForce RTX 4070 Laptop GPU
Asus ROG Flow Z13 ACRNM, i9-13900H, 65
32783 Points -20%
NVIDIA GeForce RTX 4060 Laptop GPU
Asus ROG Flow Z13 GZ301V, i9-13900H, 65
28200 Points -31%
AMD Radeon 890M
Beelink SER9, Ryzen AI 9 HX 370, 0
16800 Points -59%
Intel Arc Graphics 140V
Asus Zenbook S 14 UX5406 Core Ultra 9, Core Ultra 9 288V, 0
11102 Points -73%
3DMark / Fire Strike Graphics
NVIDIA GeForce RTX 4070 Laptop GPU
Razer Blade 14 RZ09-0508, R9 8945HS, 140
33451 Points +29%
NVIDIA GeForce RTX 4070 Laptop GPU
Razer Blade 14 RTX 4070, R9 7940HS, 140
30668 Points +18%
NVIDIA GeForce RTX 4060 Laptop GPU
Acer Nitro 14 AN14-41-R3MX, R5 8645HS, 110
28191 Points +8%
NVIDIA GeForce RTX 4070 Laptop GPU
Asus ProArt PX13 HN7306, Ryzen AI 9 HX 370, 75
28172 Points +8%
NVIDIA GeForce RTX 4070 Laptop GPU
Asus ROG Zephyrus G14 2024 GA403U, R9 8945HS, 90
27525 Points +6%
NVIDIA GeForce RTX 4070 Laptop GPU
Acer Predator Helios Neo 14 (2024), Ultra 9 185H, 125
26653 Points +3%
AMD Radeon RX 8060S
Asus ROG Flow Z13 GZ302EA-RU073W, Ryzen AI Max+ 395, 80
25992 Points
NVIDIA GeForce RTX 4070 Laptop GPU
Asus ROG Flow Z13 ACRNM, i9-13900H, 65
23000 Points -12%
NVIDIA GeForce RTX 4060 Laptop GPU
Asus ROG Flow Z13 GZ301V, i9-13900H, 65
20533 Points -21%
AMD Radeon 890M
Beelink SER9, Ryzen AI 9 HX 370, 0
10037 Points -61%
Intel Arc Graphics 140V
Asus Zenbook S 14 UX5406 Core Ultra 9, Core Ultra 9 288V, 0
9831 Points -62%
3DMark / Time Spy Graphics
NVIDIA GeForce RTX 4070 Laptop GPU
Razer Blade 14 RZ09-0508, R9 8945HS, 140
13215 Points +29%
NVIDIA GeForce RTX 4070 Laptop GPU
Razer Blade 14 RTX 4070, R9 7940HS, 140
12153 Points +19%
NVIDIA GeForce RTX 4060 Laptop GPU
Acer Nitro 14 AN14-41-R3MX, R5 8645HS, 110
10799 Points +6%
NVIDIA GeForce RTX 4070 Laptop GPU
Asus ProArt PX13 HN7306, Ryzen AI 9 HX 370, 75
10693 Points +5%
NVIDIA GeForce RTX 4070 Laptop GPU
Asus ROG Zephyrus G14 2024 GA403U, R9 8945HS, 90
10392 Points +2%
AMD Radeon RX 8060S
Asus ROG Flow Z13 GZ302EA-RU073W, Ryzen AI Max+ 395, 80
10224 Points
NVIDIA GeForce RTX 4070 Laptop GPU
Acer Predator Helios Neo 14 (2024), Ultra 9 185H, 125
10182 Points 0%
NVIDIA GeForce RTX 4070 Laptop GPU
Asus ROG Flow Z13 ACRNM, i9-13900H, 65
9513 Points -7%
NVIDIA GeForce RTX 4060 Laptop GPU
Asus ROG Flow Z13 GZ301V, i9-13900H, 65
7655 Points -25%
Intel Arc Graphics 140V
Asus Zenbook S 14 UX5406 Core Ultra 9, Core Ultra 9 288V, 0
4227 Points -59%
AMD Radeon 890M
Beelink SER9, Ryzen AI 9 HX 370, 0
3546 Points -65%
3DMark / Steel Nomad Light Score
NVIDIA GeForce RTX 4070 Laptop GPU
Asus ProArt PX13 HN7306, Ryzen AI 9 HX 370, 75
10952 Points +13%
NVIDIA GeForce RTX 4070 Laptop GPU
Asus ROG Flow Z13 ACRNM, i9-13900H, 65
9949 Points +3%
AMD Radeon RX 8060S
Asus ROG Flow Z13 GZ302EA-RU073W, Ryzen AI Max+ 395, 80
9653 Points
Intel Arc Graphics 140V
Asus Zenbook S 14 UX5406 Core Ultra 9, Core Ultra 9 288V, 0
3406 Points -65%
3DMark / Steel Nomad Score
NVIDIA GeForce RTX 4070 Laptop GPU
Asus ProArt PX13 HN7306, Ryzen AI 9 HX 370, 75
2386 Points +27%
NVIDIA GeForce RTX 4060 Laptop GPU
Acer Nitro 14 AN14-41-R3MX, R5 8645HS, 110
2351 Points +25%
NVIDIA GeForce RTX 4070 Laptop GPU
Acer Predator Helios Neo 14 (2024), Ultra 9 185H, 125
2230 Points +19%
NVIDIA GeForce RTX 4070 Laptop GPU
Asus ROG Flow Z13 ACRNM, i9-13900H, 65
2228 Points +19%
AMD Radeon RX 8060S
Asus ROG Flow Z13 GZ302EA-RU073W, Ryzen AI Max+ 395, 80
1874 Points
Intel Arc Graphics 140V
Asus Zenbook S 14 UX5406 Core Ultra 9, Core Ultra 9 288V, 0
915 Points -51%
AMD Radeon 890M
Beelink SER9, Ryzen AI 9 HX 370, 0
502 Points -73%
3DMark / Solar Bay Score
NVIDIA GeForce RTX 4070 Laptop GPU
Acer Predator Helios Neo 14 (2024), Ultra 9 185H, 125
44190 Points
NVIDIA GeForce RTX 4070 Laptop GPU
Razer Blade 14 RTX 4070, R9 7940HS, 140
29.13 Points
3DMark / Speed Way Score
NVIDIA GeForce RTX 4070 Laptop GPU
Razer Blade 14 RZ09-0508, R9 8945HS, 140
3054 Points +127%
NVIDIA GeForce RTX 4070 Laptop GPU
Razer Blade 14 RTX 4070, R9 7940HS, 140
2913 Points +117%
NVIDIA GeForce RTX 4070 Laptop GPU
Asus ROG Zephyrus G14 2024 GA403U, R9 8945HS, 90
2566 Points +91%
NVIDIA GeForce RTX 4070 Laptop GPU
Acer Predator Helios Neo 14 (2024), Ultra 9 185H, 125
2515 Points +87%
NVIDIA GeForce RTX 4070 Laptop GPU
Asus ROG Flow Z13 ACRNM, i9-13900H, 65
2477 Points +84%
AMD Radeon RX 8060S
Asus ROG Flow Z13 GZ302EA-RU073W, Ryzen AI Max+ 395, 80
1343 Points
AMD Radeon 890M
Beelink SER9, Ryzen AI 9 HX 370, 0
328 Points -76%

我们还测试了新款 Radeon 8060S 与 ARM 竞争对手(来自Apple 和高通公司)的对战情况。最快版本的高通 Adreno X1-85(4.6 TFLOPS)在新的 Strix Halo iGPU面前毫无胜算。与Apple的 GPU 相比,情况发生了变化,根据不同的基准测试,8060S 分别位于两个 M4 Pro GPU 之间或略微领先。而 M4 Max GPU 则遥不可及。

3DMark / Wild Life Extreme Unlimited
Apple MacBook Pro 16 M4 Max
M4 Max 40-Core GPU, M4 Max (16 cores), Apple SSD AP1024Z
37434 Points +91%
Apple MacBook Pro 14 2023 M3 Max
M3 Max 40-Core GPU, Apple M3 Max 16-Core, Apple SSD AP2048Z
31403 Points +60%
Asus ROG Flow Z13 GZ302EA-RU073W
Radeon RX 8060S, Ryzen AI Max+ 395, Kioxia BG6 KBG60ZNS1T02
19615 Points
Apple MacBook Pro 16 2024 M4 Pro
M4 Pro 20-Core GPU, M4 Pro (14 cores), Apple SSD AP2048Z
19345 Points -1%
Apple MacBook Pro 16 2023 M3 Pro
M3 Pro 18-Core GPU, Apple M3 Pro 12-Core, Apple SSD AP0512Z
14545 Points -26%
Apple MacBook Pro 14 2023 M3 Pro
M3 Pro 14-Core GPU, Apple M3 Pro 11-Core, Apple SSD AP0512Z
12094 Points -38%
Samsung Galaxy Book4 Edge 16 X1E-84-100
Adreno X1-85 4.6 TFLOPS, SD X Elite X1E-84-100
6978 Points -64%
3DMark / Steel Nomad Light Score
Apple MacBook Pro 16 M4 Max
M4 Max 40-Core GPU, M4 Max (16 cores), Apple SSD AP1024Z
13989 Points +45%
Asus ROG Flow Z13 GZ302EA-RU073W
Radeon RX 8060S, Ryzen AI Max+ 395, Kioxia BG6 KBG60ZNS1T02
9653 Points
Apple MacBook Pro 16 2024 M4 Pro
M4 Pro 20-Core GPU, M4 Pro (14 cores), Apple SSD AP2048Z
7781 Points -19%
Apple MacBook Pro 14 2024 M4 Pro Entry
M4 Pro 16-Core GPU, M4 Pro (12 cores), Apple SSD AP1024Z
6739 Points -30%
Samsung Galaxy Book4 Edge 16 X1E-84-100
Adreno X1-85 4.6 TFLOPS, SD X Elite X1E-84-100
2467 Points -74%
GFXBench / 4K Aztec Ruins High Tier Offscreen
Apple MacBook Pro 16 M4 Max
M4 Max 40-Core GPU, M4 Max (16 cores), Apple SSD AP1024Z
231.7 fps +103%
Apple MacBook Pro 14 2023 M3 Max
M3 Max 40-Core GPU, Apple M3 Max 16-Core, Apple SSD AP2048Z
188.2 fps +65%
Apple MacBook Pro 16 2024 M4 Pro
M4 Pro 20-Core GPU, M4 Pro (14 cores), Apple SSD AP2048Z
125.8 fps +10%
Asus ROG Flow Z13 GZ302EA-RU073W
Radeon RX 8060S, Ryzen AI Max+ 395, Kioxia BG6 KBG60ZNS1T02
114.1 fps
Apple MacBook Pro 14 2024 M4 Pro Entry
M4 Pro 16-Core GPU, M4 Pro (12 cores), Apple SSD AP1024Z
103.3 fps -9%
Apple MacBook Pro 16 2023 M3 Pro
M3 Pro 18-Core GPU, Apple M3 Pro 12-Core, Apple SSD AP0512Z
97.8 fps -14%
Apple MacBook Pro 14 2023 M3 Pro
M3 Pro 14-Core GPU, Apple M3 Pro 11-Core, Apple SSD AP0512Z
79 fps -31%
GFXBench / Aztec Ruins High Tier Onscreen
Apple MacBook Pro 16 M4 Max
M4 Max 40-Core GPU, M4 Max (16 cores), Apple SSD AP1024Z
120 fps +5%
Apple MacBook Pro 14 2023 M3 Max
M3 Max 40-Core GPU, Apple M3 Max 16-Core, Apple SSD AP2048Z
119.8 fps +5%
Apple MacBook Pro 14 2024 M4 Pro Entry
M4 Pro 16-Core GPU, M4 Pro (12 cores), Apple SSD AP1024Z
119.8 fps +5%
Asus ROG Flow Z13 GZ302EA-RU073W
Radeon RX 8060S, Ryzen AI Max+ 395, Kioxia BG6 KBG60ZNS1T02
114.2 fps
Apple MacBook Pro 14 2023 M3 Pro
M3 Pro 14-Core GPU, Apple M3 Pro 11-Core, Apple SSD AP0512Z
109.2 fps -4%
Apple MacBook Pro 16 2023 M3 Pro
M3 Pro 18-Core GPU, Apple M3 Pro 12-Core, Apple SSD AP0512Z
104.9 fps -8%
Apple MacBook Pro 16 2024 M4 Pro
M4 Pro 20-Core GPU, M4 Pro (14 cores), Apple SSD AP2048Z
94.7 fps -17%
Geekbench 6.3 / GPU OpenCL
Apple MacBook Pro 16 M4 Max
M4 Max 40-Core GPU, M4 Max (16 cores), Apple SSD AP1024Z
116455 Points +29%
Apple MacBook Pro 14 2023 M3 Max
M3 Max 40-Core GPU, Apple M3 Max 16-Core, Apple SSD AP2048Z
91418 Points +1%
Asus ROG Flow Z13 GZ302EA-RU073W
Radeon RX 8060S, Ryzen AI Max+ 395, Kioxia BG6 KBG60ZNS1T02
90181 Points
Apple MacBook Pro 16 2024 M4 Pro
M4 Pro 20-Core GPU, M4 Pro (14 cores), Apple SSD AP2048Z
69778 Points -23%
Apple MacBook Pro 14 2024 M4 Pro Entry
M4 Pro 16-Core GPU, M4 Pro (12 cores), Apple SSD AP1024Z
60506 Points -33%
Apple MacBook Pro 16 2023 M3 Pro
M3 Pro 18-Core GPU, Apple M3 Pro 12-Core, Apple SSD AP0512Z
50373 Points -44%
Apple MacBook Pro 14 2023 M3 Pro
M3 Pro 14-Core GPU, Apple M3 Pro 11-Core, Apple SSD AP0512Z
42798 Points -53%
Samsung Galaxy Book4 Edge 16 X1E-84-100
Adreno X1-85 4.6 TFLOPS, SD X Elite X1E-84-100
23854 Points -74%

游戏性能

我们在每次笔记本评测中都会进行一些游戏基准测试,Radeon 8060S 与 Radeon RX 7600M XT相当,略高于最快版本的 GeForce RTX 4050 笔记本电脑(90W TGP)。两款同类 RTX 4070 笔记本电脑设备华硕 ROG Flow Z13 和华硕 ProArt PX13 略占优势,但这主要是由于在《GTA V》等旧基准测试中的一些结果造成的。在《赛博朋克 2077》和《博德之门 3》这两款较新的游戏中,Radeon 8060S 的成绩更好。总而言之,你几乎可以在 1080p 和最高细节下玩所有游戏,而有些游戏对 QHD 分辨率的要求有点过高(下文将详细介绍)。

Performance Rating - Percent
NVIDIA RTX 3500 Ada Generation Laptop GPU
HP ZBook Fury 16 G11, i9-14900HX, 105
100 pt
NVIDIA GeForce RTX 4060 Laptop GPU
Asus TUF Gaming A16 FA608WV, Ryzen AI 9 HX 370, 140
83.4 pt
NVIDIA GeForce RTX 4070 Laptop GPU
Acer Predator Helios Neo 14 (2024), Ultra 9 185H, 125
83.1 pt
NVIDIA GeForce RTX 4060 Laptop GPU
Acer Nitro 14 AN14-41-R3MX, R5 8645HS, 110
81.4 pt
NVIDIA GeForce RTX 4070 Laptop GPU
Asus ROG Flow Z13 ACRNM, i9-13900H, 65
81.1 pt
NVIDIA GeForce RTX 4070 Laptop GPU
Asus ProArt PX13 HN7306, Ryzen AI 9 HX 370, 75
77.5 pt
AMD Radeon RX 7600M XT
Minisforum MS-A1 (MGA1 Radeon RX 7600M XT @OCuLink) , Ryzen 7 8700G, 120
76.8 pt
AMD Radeon RX 8060S
Asus ROG Flow Z13 GZ302EA-RU073W, Ryzen AI Max+ 395, 80
76.1 pt
NVIDIA GeForce RTX 4050 Laptop GPU
Lenovo IdeaPad Pro 5 16IMH G9 RTX 4050, Ultra 9 185H, 90
74.8 pt
NVIDIA GeForce RTX 4060 Laptop GPU
SCHENKER Key 14 (M24), Ultra 7 155H, 100
71.5 pt
NVIDIA RTX 2000 Ada Generation Laptop GPU
HP ZBook Power 16 G11 A, R7 8845HS, 50
61.5 pt
NVIDIA GeForce RTX 3050 4GB Laptop GPU
HP Envy 17-da0076ng, Ultra 7 155U, 0
37.3 pt
Intel Arc Graphics 140T
MSI Prestige 16 AI Evo B2HMG, Ultra 9 285H, 0
29.7 pt
AMD Radeon 890M
Asus ProArt PX13 HN7306, Ryzen AI 9 HX 370, 0
29 pt
Intel Arc Graphics 140V
Asus Zenbook S 14 UX5406, Core Ultra 7 258V, 0
26 pt
Average of class Convertible
 
23.8 pt
Cyberpunk 2077 2.1 Phantom Liberty - 1920x1080 Ultra Preset (FSR off)
NVIDIA RTX 3500 Ada Generation Laptop GPU
HP ZBook Fury 16 G11, i9-14900HX, 105
90.3 (73.1min) fps +19%
NVIDIA GeForce RTX 4060 Laptop GPU
Acer Nitro 14 AN14-41-R3MX, R5 8645HS, 110
75.8 (63.1min) fps 0%
NVIDIA GeForce RTX 4060 Laptop GPU
Asus TUF Gaming A16 FA608WV, Ryzen AI 9 HX 370, 140
75.6 (62.9min) fps 0%
AMD Radeon RX 8060S
Asus ROG Flow Z13 GZ302EA-RU073W, Ryzen AI Max+ 395, 80
75.6 (62min) fps
NVIDIA GeForce RTX 4070 Laptop GPU
Asus ProArt PX13 HN7306, Ryzen AI 9 HX 370, 75
74.1 (60.8min) fps -2%
AMD Radeon RX 7600M XT
Minisforum MS-A1 (MGA1 Radeon RX 7600M XT @OCuLink) , Ryzen 7 8700G, 120
73.2 (60.3min) fps -3%
NVIDIA GeForce RTX 4070 Laptop GPU
Acer Predator Helios Neo 14 (2024), Ultra 9 185H, 125
72.4 (59.8min) fps -4%
NVIDIA GeForce RTX 4070 Laptop GPU
Asus ROG Flow Z13 ACRNM, i9-13900H, 65
66.79 (52.29min) fps -12%
NVIDIA GeForce RTX 4050 Laptop GPU
Lenovo IdeaPad Pro 5 16IMH G9 RTX 4050, Ultra 9 185H, 90
59.8 (49.3min) fps -21%
NVIDIA GeForce RTX 4060 Laptop GPU
SCHENKER Key 14 (M24), Ultra 7 155H, 100
56.4 (39.3min) fps -25%
NVIDIA RTX 2000 Ada Generation Laptop GPU
HP ZBook Power 16 G11 A, R7 8845HS, 50
44.8 (37.6min) fps -41%
AMD Radeon 890M
Asus ProArt PX13 HN7306, Ryzen AI 9 HX 370, 0
27.8 (23.1min) fps -63%
Intel Arc Graphics 140T
MSI Prestige 16 AI Evo B2HMG, Ultra 9 285H, 0
27.3 (23.6min) fps -64%
NVIDIA GeForce RTX 3050 4GB Laptop GPU
HP Envy 17-da0076ng, Ultra 7 155U, 0
26.4 (10.2min) fps -65%
NVIDIA GeForce RTX 3050 4GB Laptop GPU
HP Envy 17-da0076ng, Ultra 7 155U, 0
21.1 (8.56min, 12.4P0.1, 18P1) fps -72%
Intel Arc Graphics 140V
Asus Zenbook S 14 UX5406, Core Ultra 7 258V, 0
24.3 (19.9min) fps -68%
Average of class Convertible
  (8.2 - 83.5, n=31, last 2 years)
20.9 fps -72%
Baldur's Gate 3 - 1920x1080 Ultra Preset
NVIDIA RTX 3500 Ada Generation Laptop GPU
HP ZBook Fury 16 G11, i9-14900HX, 105
117.3 fps +38%
NVIDIA GeForce RTX 4070 Laptop GPU
Acer Predator Helios Neo 14 (2024), Ultra 9 185H, 125
107.9 (57.2min, 71.4P0.1, 87.3P1) fps +26%
NVIDIA GeForce RTX 4060 Laptop GPU
Acer Nitro 14 AN14-41-R3MX, R5 8645HS, 110
100.4 (33.6min, 83P0.1, 88.8P1) fps +18%
NVIDIA GeForce RTX 4060 Laptop GPU
Asus TUF Gaming A16 FA608WV, Ryzen AI 9 HX 370, 140
99 fps +16%
AMD Radeon RX 7600M XT
Minisforum MS-A1 (MGA1 Radeon RX 7600M XT @OCuLink) , Ryzen 7 8700G, 120
87.7 (37.2min, 74.4P0.1, 79.1P1) fps +3%
NVIDIA GeForce RTX 4070 Laptop GPU
Asus ROG Flow Z13 ACRNM, i9-13900H, 65
86.1 (50.7P0.1, 70.2P1) fps +1%
AMD Radeon RX 8060S
Asus ROG Flow Z13 GZ302EA-RU073W, Ryzen AI Max+ 395, 80
85.3 fps
NVIDIA GeForce RTX 4050 Laptop GPU
Lenovo IdeaPad Pro 5 16IMH G9 RTX 4050, Ultra 9 185H, 90
78.6 fps -8%
NVIDIA GeForce RTX 4060 Laptop GPU
SCHENKER Key 14 (M24), Ultra 7 155H, 100
66.9 fps -22%
NVIDIA GeForce RTX 4070 Laptop GPU
Asus ProArt PX13 HN7306, Ryzen AI 9 HX 370, 75
66.7 fps -22%
NVIDIA RTX 2000 Ada Generation Laptop GPU
HP ZBook Power 16 G11 A, R7 8845HS, 50
66.1 fps -23%
NVIDIA GeForce RTX 3050 4GB Laptop GPU
HP Envy 17-da0076ng, Ultra 7 155U, 0
35.7 fps -58%
AMD Radeon 890M
Asus ProArt PX13 HN7306, Ryzen AI 9 HX 370, 0
29.1 fps -66%
Intel Arc Graphics 140T
MSI Prestige 16 AI Evo B2HMG, Ultra 9 285H, 0
26.4 fps -69%
Average of class Convertible
  (9.2 - 85.3, n=21, last 2 years)
23.5 fps -72%
Intel Arc Graphics 140V
Asus Zenbook S 14 UX5406, Core Ultra 7 258V, 0
23 fps -73%
GTA V - 1920x1080 Highest Settings possible AA:4xMSAA + FX AF:16x
NVIDIA RTX 3500 Ada Generation Laptop GPU
HP ZBook Fury 16 G11, i9-14900HX, 105
115.5 (4.64min, 76.9P1) fps +38%
NVIDIA GeForce RTX 4060 Laptop GPU
Asus TUF Gaming A16 FA608WV, Ryzen AI 9 HX 370, 140
114 (4.02min, 71.4P1) fps +37%
NVIDIA GeForce RTX 4070 Laptop GPU
Acer Predator Helios Neo 14 (2024), Ultra 9 185H, 125
104.8 (4.53min, 71.4P1) fps +26%
NVIDIA GeForce RTX 4070 Laptop GPU
Asus ProArt PX13 HN7306, Ryzen AI 9 HX 370, 75
104.5 (9.04min, 66.7P1) fps +25%
NVIDIA GeForce RTX 4060 Laptop GPU
Acer Nitro 14 AN14-41-R3MX, R5 8645HS, 110
100.6 (7.3min, 71.4P1) fps +20%
NVIDIA GeForce RTX 4050 Laptop GPU
Lenovo IdeaPad Pro 5 16IMH G9 RTX 4050, Ultra 9 185H, 90
98.7 (4.28min, 66.7P1) fps +18%
AMD Radeon RX 7600M XT
Minisforum MS-A1 (MGA1 Radeon RX 7600M XT @OCuLink) , Ryzen 7 8700G, 120
97.2 (8.06min, 62.5P1) fps +16%
NVIDIA GeForce RTX 4070 Laptop GPU
Asus ROG Flow Z13 ACRNM, i9-13900H, 65
94.8 (4.6min, 62.5P1) fps +14%
NVIDIA RTX 2000 Ada Generation Laptop GPU
HP ZBook Power 16 G11 A, R7 8845HS, 50
90.3 (5.49min, 55.6P1) fps +8%
AMD Radeon RX 8060S
Asus ROG Flow Z13 GZ302EA-RU073W, Ryzen AI Max+ 395, 80
83.5 (7.23min, 55.6P1) fps
NVIDIA GeForce RTX 4060 Laptop GPU
SCHENKER Key 14 (M24), Ultra 7 155H, 100
79.7 (4.26min, 47.6P1) fps -5%
NVIDIA GeForce RTX 3050 4GB Laptop GPU
HP Envy 17-da0076ng, Ultra 7 155U, 0
48.3 (11.4min, 30.3P1) fps -42%
AMD Radeon 890M
Asus ProArt PX13 HN7306, Ryzen AI 9 HX 370, 0
31.6 (2.04min, 22.7P1) fps -62%
Intel Arc Graphics 140V
Asus Zenbook S 14 UX5406, Core Ultra 7 258V, 0
23.4 (2.44min, 13.3P1) fps -72%
Average of class Convertible
  (7.2 - 114.3, n=49, last 2 years)
19.4 fps -77%
Intel Arc Graphics 140T
MSI Prestige 16 AI Evo B2HMG, Ultra 9 285H, 0
17 (6.65min, 13P1) fps -80%
Final Fantasy XV Benchmark - 1920x1080 High Quality
NVIDIA RTX 3500 Ada Generation Laptop GPU
HP ZBook Fury 16 G11, i9-14900HX, 105
128.9 fps +49%
NVIDIA GeForce RTX 4060 Laptop GPU
Acer Nitro 14 AN14-41-R3MX, R5 8645HS, 110
106 fps +22%
NVIDIA GeForce RTX 4070 Laptop GPU
Acer Predator Helios Neo 14 (2024), Ultra 9 185H, 125
104.6 fps +21%
NVIDIA GeForce RTX 4070 Laptop GPU
Asus ProArt PX13 HN7306, Ryzen AI 9 HX 370, 75
104 fps +20%
NVIDIA GeForce RTX 4060 Laptop GPU
Asus TUF Gaming A16 FA608WV, Ryzen AI 9 HX 370, 140
102.5 fps +18%
NVIDIA GeForce RTX 4060 Laptop GPU
SCHENKER Key 14 (M24), Ultra 7 155H, 100
94 fps +9%
AMD Radeon RX 7600M XT
Minisforum MS-A1 (MGA1 Radeon RX 7600M XT @OCuLink) , Ryzen 7 8700G, 120
93.6 fps +8%
NVIDIA GeForce RTX 4070 Laptop GPU
Asus ROG Flow Z13 ACRNM, i9-13900H, 65
93.3 fps +8%
NVIDIA GeForce RTX 4050 Laptop GPU
Lenovo IdeaPad Pro 5 16IMH G9 RTX 4050, Ultra 9 185H, 90
87.8 fps +1%
AMD Radeon RX 8060S
Asus ROG Flow Z13 GZ302EA-RU073W, Ryzen AI Max+ 395, 80
86.6 fps
NVIDIA RTX 2000 Ada Generation Laptop GPU
HP ZBook Power 16 G11 A, R7 8845HS, 50
66.3 fps -23%
NVIDIA GeForce RTX 3050 4GB Laptop GPU
HP Envy 17-da0076ng, Ultra 7 155U, 0
39.5 fps -54%
AMD Radeon 890M
Asus ProArt PX13 HN7306, Ryzen AI 9 HX 370, 0
33.2 fps -62%
Intel Arc Graphics 140T
MSI Prestige 16 AI Evo B2HMG, Ultra 9 285H, 0
30.6 fps -65%
Intel Arc Graphics 140V
Asus Zenbook S 14 UX5406, Core Ultra 7 258V, 0
30 fps -65%
Average of class Convertible
  (4.48 - 107.1, n=59, last 2 years)
23.2 fps -73%
Strange Brigade - 1920x1080 ultra AA:ultra AF:16
NVIDIA RTX 3500 Ada Generation Laptop GPU
HP ZBook Fury 16 G11, i9-14900HX, 105
223 (52.5min, 159.8P1) fps +33%
NVIDIA GeForce RTX 4060 Laptop GPU
Acer Nitro 14 AN14-41-R3MX, R5 8645HS, 110
193.2 (28.8min, 141.1P1) fps +15%
NVIDIA GeForce RTX 4060 Laptop GPU
Asus TUF Gaming A16 FA608WV, Ryzen AI 9 HX 370, 140
191.9 (103.2min, 137.2P1) fps +14%
NVIDIA GeForce RTX 4070 Laptop GPU
Asus ProArt PX13 HN7306, Ryzen AI 9 HX 370, 75
191.7 (74.9min, 144.8P1) fps +14%
NVIDIA GeForce RTX 4060 Laptop GPU
SCHENKER Key 14 (M24), Ultra 7 155H, 100
186 fps +11%
NVIDIA GeForce RTX 4070 Laptop GPU
Acer Predator Helios Neo 14 (2024), Ultra 9 185H, 125
183 (33.8min, 138.5P1) fps +9%
AMD Radeon RX 7600M XT
Minisforum MS-A1 (MGA1 Radeon RX 7600M XT @OCuLink) , Ryzen 7 8700G, 120
179.5 (125.3min, 133.7P1) fps +7%
NVIDIA GeForce RTX 4070 Laptop GPU
Asus ROG Flow Z13 ACRNM, i9-13900H, 65
174.8 (57min, 127.6P1) fps +4%
AMD Radeon RX 8060S
Asus ROG Flow Z13 GZ302EA-RU073W, Ryzen AI Max+ 395, 80
167.9 (68.9min, 108.1P1) fps
NVIDIA GeForce RTX 4050 Laptop GPU
Lenovo IdeaPad Pro 5 16IMH G9 RTX 4050, Ultra 9 185H, 90
149.4 (44.5min, 115.4P1) fps -11%
NVIDIA RTX 2000 Ada Generation Laptop GPU
HP ZBook Power 16 G11 A, R7 8845HS, 50
138.5 (80.1min, 104.4P1) fps -18%
Intel Arc Graphics 140T
MSI Prestige 16 AI Evo B2HMG, Ultra 9 285H, 0
61.6 (45.2min, 49.5P1) fps -63%
NVIDIA GeForce RTX 3050 4GB Laptop GPU
HP Envy 17-da0076ng, Ultra 7 155U, 0
60.4 (44.9min, 47.5P1) fps -64%
AMD Radeon 890M
Asus ProArt PX13 HN7306, Ryzen AI 9 HX 370, 0
55.7 (36min, 42.8P1) fps -67%
Intel Arc Graphics 140V
Asus Zenbook S 14 UX5406, Core Ultra 7 258V, 0
54 (32min, 42.8P1) fps -68%
Average of class Convertible
  (10.8 - 196.9, n=54, last 2 years)
42.1 fps -75%
Dota 2 Reborn - 1920x1080 ultra (3/3) best looking
NVIDIA RTX 3500 Ada Generation Laptop GPU
HP ZBook Fury 16 G11, i9-14900HX, 105
153.9 (131.9min) fps +8%
AMD Radeon RX 8060S
Asus ROG Flow Z13 GZ302EA-RU073W, Ryzen AI Max+ 395, 80
142 (123.4min) fps
NVIDIA GeForce RTX 4050 Laptop GPU
Lenovo IdeaPad Pro 5 16IMH G9 RTX 4050, Ultra 9 185H, 90
137.4 (115.6min) fps -3%
NVIDIA GeForce RTX 4060 Laptop GPU
Asus TUF Gaming A16 FA608WV, Ryzen AI 9 HX 370, 140
136.2 (117.8min) fps -4%
NVIDIA GeForce RTX 4070 Laptop GPU
Asus ROG Flow Z13 ACRNM, i9-13900H, 65
135 (117.4min) fps -5%
NVIDIA GeForce RTX 4070 Laptop GPU
Acer Predator Helios Neo 14 (2024), Ultra 9 185H, 125
130.8 (114.6min) fps -8%
NVIDIA GeForce RTX 4070 Laptop GPU
Asus ProArt PX13 HN7306, Ryzen AI 9 HX 370, 75
122.8 (106.2min) fps -14%
NVIDIA GeForce RTX 4060 Laptop GPU
SCHENKER Key 14 (M24), Ultra 7 155H, 100
122.6 (97.3min) fps -14%
AMD Radeon RX 7600M XT
Minisforum MS-A1 (MGA1 Radeon RX 7600M XT @OCuLink) , Ryzen 7 8700G, 120
120.8 (106.1min) fps -15%
NVIDIA GeForce RTX 4060 Laptop GPU
Acer Nitro 14 AN14-41-R3MX, R5 8645HS, 110
120.5 (104.4min) fps -15%
NVIDIA RTX 2000 Ada Generation Laptop GPU
HP ZBook Power 16 G11 A, R7 8845HS, 50
119.9 (104.6min) fps -16%
NVIDIA GeForce RTX 3050 4GB Laptop GPU
HP Envy 17-da0076ng, Ultra 7 155U, 0
90 (77.6min) fps -37%
Intel Arc Graphics 140T
MSI Prestige 16 AI Evo B2HMG, Ultra 9 285H, 0
83.8 (45.3min) fps -41%
Intel Arc Graphics 140V
Asus Zenbook S 14 UX5406, Core Ultra 7 258V, 0
62.9 fps -56%
Average of class Convertible
  (18.8 - 158.3, n=60, last 2 years)
61.2 fps -57%
AMD Radeon 890M
Asus ProArt PX13 HN7306, Ryzen AI 9 HX 370, 0
36 (20.4min) fps -75%
X-Plane 11.11 - 1920x1080 high (fps_test=3)
NVIDIA RTX 3500 Ada Generation Laptop GPU
HP ZBook Fury 16 G11, i9-14900HX, 105
110.9 fps +45%
NVIDIA GeForce RTX 4070 Laptop GPU
Asus ROG Flow Z13 ACRNM, i9-13900H, 65
110.3 fps +44%
NVIDIA GeForce RTX 4050 Laptop GPU
Lenovo IdeaPad Pro 5 16IMH G9 RTX 4050, Ultra 9 185H, 90
89 fps +16%
NVIDIA GeForce RTX 4060 Laptop GPU
SCHENKER Key 14 (M24), Ultra 7 155H, 100
84.6 fps +10%
NVIDIA GeForce RTX 4070 Laptop GPU
Acer Predator Helios Neo 14 (2024), Ultra 9 185H, 125
78 fps +2%
AMD Radeon RX 8060S
Asus ROG Flow Z13 GZ302EA-RU073W, Ryzen AI Max+ 395, 80
76.7 fps
NVIDIA GeForce RTX 4070 Laptop GPU
Asus ProArt PX13 HN7306, Ryzen AI 9 HX 370, 75
74.1 fps -3%
NVIDIA GeForce RTX 4060 Laptop GPU
Acer Nitro 14 AN14-41-R3MX, R5 8645HS, 110
73.4 fps -4%
AMD Radeon RX 7600M XT
Minisforum MS-A1 (MGA1 Radeon RX 7600M XT @OCuLink) , Ryzen 7 8700G, 120
73.2 fps -5%
NVIDIA GeForce RTX 4060 Laptop GPU
Asus TUF Gaming A16 FA608WV, Ryzen AI 9 HX 370, 140
69.9 fps -9%
NVIDIA RTX 2000 Ada Generation Laptop GPU
HP ZBook Power 16 G11 A, R7 8845HS, 50
60.6 fps -21%
NVIDIA GeForce RTX 3050 4GB Laptop GPU
HP Envy 17-da0076ng, Ultra 7 155U, 0
51.6 fps -33%
AMD Radeon 890M
Asus ProArt PX13 HN7306, Ryzen AI 9 HX 370, 0
51.1 fps -33%
Intel Arc Graphics 140T
MSI Prestige 16 AI Evo B2HMG, Ultra 9 285H, 0
38.4 fps -50%
Average of class Convertible
  (12.8 - 101.4, n=59, last 2 years)
33.5 fps -56%
Intel Arc Graphics 140V
Asus Zenbook S 14 UX5406, Core Ultra 7 258V, 0
29.8 fps -61%

我们还有旧的 流 Z13和 RTX 4070 笔记本电脑,因此我们用它在现代游戏中进行了直接的正面对比(两款设备均采用 Turbo 模式)。新款 Radeon 8060S 在 1080p 和最大细节下的表现更好。在《赛博朋克 2077》或《使命召唤黑色行动 6》等游戏中,AMD GPU 的优势为 13%-17%,而许多游戏的效果不相上下。也有一些负面的例子,如《GTA V》或《F1 24》(-12% 到 -21%)。总而言之,两款设备的性能基本相当。

Gaming 1080p Ultra Performance Rating - Percent
Asus ROG Flow Z13 ACRNM
Intel Core i9-13900H, NVIDIA GeForce RTX 4070 Laptop GPU
97 pt
Asus ROG Flow Z13 GZ302EA-RU073W
AMD Ryzen AI Max+ 395, AMD Radeon RX 8060S
94.7 pt
Cyberpunk 2077 2.1 Phantom Liberty - 1920x1080 Ultra Preset (FSR off)
Asus ROG Flow Z13 GZ302EA-RU073W
AMD Ryzen AI Max+ 395, AMD Radeon RX 8060S
75.6 (62min - 97.7max) fps
Asus ROG Flow Z13 ACRNM
Intel Core i9-13900H, NVIDIA GeForce RTX 4070 Laptop GPU
66.79 (52.29min - 85.64max) fps -12%
Baldur's Gate 3 - 1920x1080 Ultra Preset
Asus ROG Flow Z13 ACRNM
Intel Core i9-13900H, NVIDIA GeForce RTX 4070 Laptop GPU
86.1 (50.7P0.1, 70.2P1) fps +1%
Asus ROG Flow Z13 GZ302EA-RU073W
AMD Ryzen AI Max+ 395, AMD Radeon RX 8060S
85.3 fps
GTA V - 1920x1080 Highest Settings possible AA:4xMSAA + FX AF:16x
Asus ROG Flow Z13 ACRNM
Intel Core i9-13900H, NVIDIA GeForce RTX 4070 Laptop GPU
94.8 (4.6min, 62.5P1 - 170.5max) fps +14%
Asus ROG Flow Z13 GZ302EA-RU073W
AMD Ryzen AI Max+ 395, AMD Radeon RX 8060S
83.5 (7.23min, 55.6P1 - 146.4max) fps
Horizon Forbidden West - 1920x1080 Very High Preset AA:T
Asus ROG Flow Z13 ACRNM
Intel Core i9-13900H, NVIDIA GeForce RTX 4070 Laptop GPU
56.1 (39.5P0.1, 45.4P1) fps +15%
Asus ROG Flow Z13 GZ302EA-RU073W
AMD Ryzen AI Max+ 395, AMD Radeon RX 8060S
48.7 (34.9P0.1, 38.9P1) fps
F1 24 - 1920x1080 Ultra High Preset AA:T AF:16x
Asus ROG Flow Z13 ACRNM
Intel Core i9-13900H, NVIDIA GeForce RTX 4070 Laptop GPU
58.4 (48min, 47P1 - 70max) fps +27%
Asus ROG Flow Z13 GZ302EA-RU073W
AMD Ryzen AI Max+ 395, AMD Radeon RX 8060S
46 (34min - 56max) fps
Black Myth: Wukong - 1920x1080 cinematic TSR 100
Asus ROG Flow Z13 GZ302EA-RU073W
AMD Ryzen AI Max+ 395, AMD Radeon RX 8060S
27 (22min - 31max) fps
Asus ROG Flow Z13 ACRNM
Intel Core i9-13900H, NVIDIA GeForce RTX 4070 Laptop GPU
25 (7min - 28max) fps -7%
God of War Ragnarök - 1920x1080 Ultra Preset AA:T
Asus ROG Flow Z13 ACRNM
Intel Core i9-13900H, NVIDIA GeForce RTX 4070 Laptop GPU
76.2 (42.7P0.1, 51.2P1) fps 0%
Asus ROG Flow Z13 GZ302EA-RU073W
AMD Ryzen AI Max+ 395, AMD Radeon RX 8060S
76.1 fps
Call of Duty Black Ops 6 - 1920x1080 Extreme Preset
Asus ROG Flow Z13 GZ302EA-RU073W
AMD Ryzen AI Max+ 395, AMD Radeon RX 8060S
83 fps
Asus ROG Flow Z13 ACRNM
Intel Core i9-13900H, NVIDIA GeForce RTX 4070 Laptop GPU
71 (50P0.1) fps -14%
Ghost of Tsushima - 1920x1080 Very High Preset AA:T
Asus ROG Flow Z13 ACRNM
Intel Core i9-13900H, NVIDIA GeForce RTX 4070 Laptop GPU
55.3 (32.8P0.1, 41.6P1) fps +8%
Asus ROG Flow Z13 GZ302EA-RU073W
AMD Ryzen AI Max+ 395, AMD Radeon RX 8060S
51.2 fps
Monster Hunter Wilds - 1920x1080 ultra, RT: high, no upscaling
Asus ROG Flow Z13 ACRNM
Intel Core i9-13900H, NVIDIA GeForce RTX 4070 Laptop GPU
39.7 fps +1%
Asus ROG Flow Z13 GZ302EA-RU073W
AMD Ryzen AI Max+ 395, AMD Radeon RX 8060S
39.2 fps
Indiana Jones and the Great Circle - 1920x1080 Very Ultra Preset
Asus ROG Flow Z13 GZ302EA-RU073W
AMD Ryzen AI Max+ 395, AMD Radeon RX 8060S
40.3 (28.5P0.1, 33.3P1) fps
Asus ROG Flow Z13 ACRNM
Intel Core i9-13900H, NVIDIA GeForce RTX 4070 Laptop GPU
39.4 (24.9P0.1, 31.4P1) fps -2%
Star Wars Outlaws - 1920x1080 cinem. ultra
Asus ROG Flow Z13 ACRNM
Intel Core i9-13900H, NVIDIA GeForce RTX 4070 Laptop GPU
35.4 (18.1P0.1, 25.9P1) fps +8%
Asus ROG Flow Z13 GZ302EA-RU073W
AMD Ryzen AI Max+ 395, AMD Radeon RX 8060S
32.7 (11.7P0.1, 16P1) fps

在 QHD 分辨率下,情况非常相似,尽管GeForce Flow Z13 稍微领先(+5%)。许多游戏一般都能在 QHD 和最高细节下正常运行,只有《黑色神话:悟空传》、《星球大战外传》、《夺宝奇兵》或《怪物猎人荒野》等要求非常高的游戏才会低于 30 帧/秒。

Gaming QHD Ultra Performance Rating - Percent
Asus ROG Flow Z13 ACRNM
Intel Core i9-13900H, NVIDIA GeForce RTX 4070 Laptop GPU
96.2 pt
Asus ROG Flow Z13 GZ302EA-RU073W
AMD Ryzen AI Max+ 395, AMD Radeon RX 8060S
91.9 pt
Cyberpunk 2077 2.1 Phantom Liberty - 2560x1440 Ultra Preset (FSR off)
Asus ROG Flow Z13 GZ302EA-RU073W
AMD Ryzen AI Max+ 395, AMD Radeon RX 8060S
46.4 (39.2min - 60.2max) fps
Asus ROG Flow Z13 ACRNM
Intel Core i9-13900H, NVIDIA GeForce RTX 4070 Laptop GPU
40.1 (33.3min - 52.6max) fps -14%
Baldur's Gate 3 - 2560x1440 Ultra Preset
Asus ROG Flow Z13 ACRNM
Intel Core i9-13900H, NVIDIA GeForce RTX 4070 Laptop GPU
62.3 (48.5P0.1, 52P1) fps +13%
Asus ROG Flow Z13 GZ302EA-RU073W
AMD Ryzen AI Max+ 395, AMD Radeon RX 8060S
55.2 fps
GTA V - 2560x1440 Highest Settings possible AA:4xMSAA + FX AF:16x
Asus ROG Flow Z13 ACRNM
Intel Core i9-13900H, NVIDIA GeForce RTX 4070 Laptop GPU
75.9 (3.4min, 43.5P1 - 128.1max) fps +18%
Asus ROG Flow Z13 GZ302EA-RU073W
AMD Ryzen AI Max+ 395, AMD Radeon RX 8060S
64.3 (8.92min, 45.5P1 - 110.8max) fps
Horizon Forbidden West - 2560x1440 Very High Preset AA:T
Asus ROG Flow Z13 ACRNM
Intel Core i9-13900H, NVIDIA GeForce RTX 4070 Laptop GPU
45.5 (33.7P0.1, 36.4P1) fps +19%
Asus ROG Flow Z13 GZ302EA-RU073W
AMD Ryzen AI Max+ 395, AMD Radeon RX 8060S
38.3 (27P0.1, 31.2P1) fps
F1 24 - 2560x1440 Ultra High Preset AA:T AF:16x
Asus ROG Flow Z13 ACRNM
Intel Core i9-13900H, NVIDIA GeForce RTX 4070 Laptop GPU
36.8 (31min, 30P1 - 44max) fps +28%
Asus ROG Flow Z13 GZ302EA-RU073W
AMD Ryzen AI Max+ 395, AMD Radeon RX 8060S
28.8 (19min, 14P1 - 36max) fps
Black Myth: Wukong - 2560x1440 cinematic TSR 100
Asus ROG Flow Z13 GZ302EA-RU073W
AMD Ryzen AI Max+ 395, AMD Radeon RX 8060S
20 (16min - 22max) fps
Asus ROG Flow Z13 ACRNM
Intel Core i9-13900H, NVIDIA GeForce RTX 4070 Laptop GPU
18 (15min - 20max) fps -10%
God of War Ragnarök - 2560x1440 Ultra Preset AA:T
Asus ROG Flow Z13 ACRNM
Intel Core i9-13900H, NVIDIA GeForce RTX 4070 Laptop GPU
60.5 (40.2P0.1, 47.1P1) fps +5%
Asus ROG Flow Z13 GZ302EA-RU073W
AMD Ryzen AI Max+ 395, AMD Radeon RX 8060S
57.5 fps
Call of Duty Black Ops 6 - 2560x1440 Extreme Preset
Asus ROG Flow Z13 GZ302EA-RU073W
AMD Ryzen AI Max+ 395, AMD Radeon RX 8060S
64 fps
Asus ROG Flow Z13 ACRNM
Intel Core i9-13900H, NVIDIA GeForce RTX 4070 Laptop GPU
52 (38P0.1) fps -19%
Ghost of Tsushima - 2560x1440 Very High Preset AA:T
Asus ROG Flow Z13 ACRNM
Intel Core i9-13900H, NVIDIA GeForce RTX 4070 Laptop GPU
43.6 (28.7P0.1, 36.2P1) fps +9%
Asus ROG Flow Z13 GZ302EA-RU073W
AMD Ryzen AI Max+ 395, AMD Radeon RX 8060S
40.1 fps
Monster Hunter Wilds - 2560x1440 ultra, RT: high, no upscaling
Asus ROG Flow Z13 ACRNM
Intel Core i9-13900H, NVIDIA GeForce RTX 4070 Laptop GPU
29 fps +1%
Asus ROG Flow Z13 GZ302EA-RU073W
AMD Ryzen AI Max+ 395, AMD Radeon RX 8060S
28.8 fps
Star Wars Outlaws - 2560x1440 cinem. ultra
Asus ROG Flow Z13 ACRNM
Intel Core i9-13900H, NVIDIA GeForce RTX 4070 Laptop GPU
25.9 (14.2P0.1, 19.3P1) fps +12%
Asus ROG Flow Z13 GZ302EA-RU073W
AMD Ryzen AI Max+ 395, AMD Radeon RX 8060S
23.1 (5.3P0.1, 12.4P1) fps

一些游戏也支持 FSR 3 升频以提高性能,但与 Nvidia 的 DLSS 技术相比,支持的范围更为有限。我们检查了一些现代游戏的效果,尽管 FSR 3 已经明显改善了性能,但在额外帧生成的情况下,你会看到最大的改进。原生帧数往往能达到两倍以上,即使是《黑色神话悟空 》、《怪物猎人荒野》或《星球大战外传》等要求苛刻的游戏也能达到流畅的帧数。 至少在理论上是这样,因为游戏体验会有很大差异。例如,《星球大战外传》或《地平线西部禁区》就出现了明显的伪影和图像失真,尤其是在移动过程中。

Gaming performance QHD Ultra settings
游戏 本机 FSR 3 FSR3 + FG
Ghost of Tsushima 40.1 fps 52.4 fps 90.8 fps
GoW Ragnarök 57.5 fps 49.7 fps 81.4 fps
赛博朋克 2077 46.4 帧/秒 64.5 帧/秒 109.7 帧/秒
怪物猎人荒野》 28.4 帧/秒 36.4 帧/秒 59.3 帧/秒
地平线禁西 38.3 帧/秒 44.8 帧/秒 69 帧/秒
黑色神话:悟空 16 帧/秒 25 帧/秒 48 帧/秒
星球大战亡命之徒 19.8 帧/秒 27.4 帧/秒 54.3 帧/秒
CoD Black Ops 6 64 fps 79 fps 114 fps
lowmed.highultraQHD FSRQHD4K
GTA V (2015) 166.9 83.5 64.3 72.9
The Witcher 3 (2015) 101
Dota 2 Reborn (2015) 223 192.3 164.4 142 87
Final Fantasy XV Benchmark (2018) 182.7 117.6 86.6 63.6 34.7
X-Plane 11.11 (2018) 138.8 104.9 76.7 60.4
Strange Brigade (2018) 453 221 192.7 167.9 109.9 57.6
Baldur's Gate 3 (2023) 128.8 100.9 87.9 85.3 55.2 28.6
Cyberpunk 2077 2.1 Phantom Liberty (2023) 124.8 105.3 85 75.6 46.4 18.8
Horizon Forbidden West (2024) 48.7 44.8 38.3
Ghost of Tsushima (2024) 78.1 65.1 59.2 51.2 40.1 23
F1 24 (2024) 207 185.6 147.7 46 28.8 13
Black Myth: Wukong (2024) 27 28 20
Star Wars Outlaws (2024) 32.7 33.3 23.1
God of War Ragnarök (2024) 111.8 96.4 82.8 76.1 49.7 57.5 33.2
Call of Duty Black Ops 6 (2024) 83 79 64
Indiana Jones and the Great Circle (2024) 77.2 49.4 40.3 27.4
Monster Hunter Wilds (2025) 59.8 50.2 39.2 28.8 15.9

我们使用《赛博朋克 2077》来评估 GPU 的效率,我们有当前所有平台的数据,但请记住,该游戏是在 ARM 系统上模拟的,这会影响性能和效率。在Apple 硅平台上,当游戏的原生版本发布后,这种情况很快就会改变。为了完整起见,我们仍将数据包括在内。

Radeon 8060S iGPU 是我们数据库中效率最高的型号之一,仅次于某些版本的 Arc Graphics 140V,但整体性能水平无法与 Strix Halo iGPU 相提并论。微星 Katana(配备 AMD CPU)中的 RTX 4070 Laptop 也可与之媲美,但其他GeForce GPU 则更差,尤其是与英特尔 CPU 结合使用时。

Power Consumption / Cyberpunk 2077 ultra Efficiency
Intel Arc Graphics 140V
Asus Zenbook S 14 UX5406, Core Ultra 7 258V, 0
0.696 fps per Watt +24%
AMD Radeon RX 8060S
Asus ROG Flow Z13 GZ302EA-RU073W, Ryzen AI Max+ 395, 80
0.562 fps per Watt
NVIDIA GeForce RTX 4070 Laptop GPU
MSI Katana A17 AI B8VG, R7 8845HS, 105
0.552 fps per Watt -2%
Intel Arc Graphics 140V
MSI Prestige 13 AI Plus Evo A2VMG, Core Ultra 7 258V, 0
0.542 fps per Watt -4%
NVIDIA GeForce RTX 4070 Laptop GPU
MSI Katana A15 AI B8VG, R9 8945HS, 105
0.507 fps per Watt -10%
NVIDIA GeForce RTX 4050 Laptop GPU
Lenovo Yoga Pro 7 14IMH9, RTX 4050, Ultra 7 155H, 60
0.4984 fps per Watt -11%
Apple M4 Pro 20-Core GPU
Apple MacBook Pro 14 2024 M4 Pro, M4 Pro (14 cores), 32
0.4547 fps per Watt -19%
Apple M4 Max 40-Core GPU
Apple MacBook Pro 16 M4 Max, M4 Max (16 cores), 75
0.4496 fps per Watt -20%
NVIDIA RTX 4000 Ada Generation Laptop GPU
Lenovo ThinkPad P16 Gen 2, i7-14700HX, 130
0.4466 fps per Watt -21%
NVIDIA GeForce RTX 4050 Laptop GPU
Lenovo IdeaPad Pro 5 16IMH G9 RTX 4050, Ultra 9 185H, 90
0.4205 fps per Watt -25%
AMD Radeon 890M
Asus Zenbook S 16 UM5606-RK333W, Ryzen AI 9 HX 370, 0
0.4176 fps per Watt -26%
NVIDIA GeForce RTX 4060 Laptop GPU
Gigabyte G5 KF5 2024, i7-13620H, 75
0.3965 fps per Watt -29%
NVIDIA GeForce RTX 4070 Laptop GPU
Tuxedo Gemini 17 Gen3 AMD, R9 7945HX, 125
0.3749 fps per Watt -33%
Intel Arc Graphics 140T
MSI Prestige 16 AI Evo B2HMG, Ultra 9 285H, 0
0.368 fps per Watt -35%
NVIDIA GeForce RTX 4080 Laptop GPU
SCHENKER XMG Neo 17 E24, i9-14900HX, 175
0.3616 fps per Watt -36%
AMD Radeon 880M
Lenovo ThinkBook 16 G7+ AMD, Ryzen AI 9 365, 0
0.3226 fps per Watt -43%
Qualcomm SD X Adreno X1-85 3.8 TFLOPS
Microsoft Surface Laptop 15 Snapdragon X Elite, SD X Elite X1E-80-100, 0
0.3171 fps per Watt -44%
NVIDIA GeForce RTX 4060 Laptop GPU
Lenovo ThinkBook 16p G5 IRX 21N50011GE, i9-14900HX, 115
0.3004 fps per Watt -47%
NVIDIA GeForce RTX 4060 Laptop GPU
Lenovo ThinkPad P1 Gen 7 21KV001SGE, Ultra 7 155H, 80
0.277 fps per Watt -51%

系统性能与创意应用程序

在所有基准测试中,系统性能都非常出色。在 PCMark 10 和 CrossMark 中,配备 Ryzen AI Max+ 395 的 ROG Flow Z13 击败了包括 MacBook Pro 16 M4 Max 在内的所有对手。Apple 和高通公司的 ARM 竞争对手(至少是骁龙 X Elite 的快速版本)在浏览器测试中的表现略胜一筹。

PCMark 10 / Score
Ryzen AI Max+ 395, Radeon RX 8060S
Asus ROG Flow Z13 GZ302EA-RU073W, 32768
9125 Points
Average AMD Ryzen AI Max+ 395, AMD Radeon RX 8060S
  ()
9125 Points 0%
R9 8945HS, NVIDIA GeForce RTX 4070 Laptop GPU
Razer Blade 14 RZ09-0508, 32768
8312 Points -9%
R9 7940HS, NVIDIA GeForce RTX 4070 Laptop GPU
Razer Blade 14 RTX 4070, 16384
8205 Points -10%
i9-13900H, NVIDIA GeForce RTX 4070 Laptop GPU
Asus ROG Flow Z13 ACRNM, 32768
8018 Points -12%
Ryzen AI 9 HX 370, NVIDIA GeForce RTX 4070 Laptop GPU
Asus ProArt PX13 HN7306, 32768
7696 Points -16%
Ultra 9 185H, NVIDIA GeForce RTX 4070 Laptop GPU
Acer Predator Helios Neo 14 (2024), 32768
7490 Points -18%
R5 8645HS, NVIDIA GeForce RTX 4060 Laptop GPU
Acer Nitro 14 AN14-41-R3MX, 16384
7453 Points -18%
R9 8945HS, NVIDIA GeForce RTX 4070 Laptop GPU
Asus ROG Zephyrus G14 2024 GA403U, 32768
7436 Points -19%
i7-13700H, NVIDIA GeForce RTX 4060 Laptop GPU
Microsoft Surface Laptop Studio 2 RTX 4060, 65536
7351 Points -19%
Average of class Convertible
  (3229 - 9125, n=57, last 2 years)
6209 Points -32%
PCMark 10 / Essentials
Ryzen AI Max+ 395, Radeon RX 8060S
Asus ROG Flow Z13 GZ302EA-RU073W, 32768
12005 Points
Average AMD Ryzen AI Max+ 395, AMD Radeon RX 8060S
  ()
12005 Points 0%
R9 8945HS, NVIDIA GeForce RTX 4070 Laptop GPU
Razer Blade 14 RZ09-0508, 32768
11290 Points -6%
i9-13900H, NVIDIA GeForce RTX 4070 Laptop GPU
Asus ROG Flow Z13 ACRNM, 32768
11088 Points -8%
R9 7940HS, NVIDIA GeForce RTX 4070 Laptop GPU
Razer Blade 14 RTX 4070, 16384
10952 Points -9%
Ultra 9 185H, NVIDIA GeForce RTX 4070 Laptop GPU
Acer Predator Helios Neo 14 (2024), 32768
10752 Points -10%
Average of class Convertible
  (7233 - 12005, n=57, last 2 years)
10706 Points -11%
i7-13700H, NVIDIA GeForce RTX 4060 Laptop GPU
Microsoft Surface Laptop Studio 2 RTX 4060, 65536
10696 Points -11%
Ryzen AI 9 HX 370, NVIDIA GeForce RTX 4070 Laptop GPU
Asus ProArt PX13 HN7306, 32768
10144 Points -16%
R9 8945HS, NVIDIA GeForce RTX 4070 Laptop GPU
Asus ROG Zephyrus G14 2024 GA403U, 32768
9861 Points -18%
R5 8645HS, NVIDIA GeForce RTX 4060 Laptop GPU
Acer Nitro 14 AN14-41-R3MX, 16384
9861 Points -18%
PCMark 10 / Productivity
R9 7940HS, NVIDIA GeForce RTX 4070 Laptop GPU
Razer Blade 14 RTX 4070, 16384
10805 Points +4%
Ryzen AI Max+ 395, Radeon RX 8060S
Asus ROG Flow Z13 GZ302EA-RU073W, 32768
10377 Points
Average AMD Ryzen AI Max+ 395, AMD Radeon RX 8060S
  ()
10377 Points 0%
R9 8945HS, NVIDIA GeForce RTX 4070 Laptop GPU
Razer Blade 14 RZ09-0508, 32768
10332 Points 0%
Ryzen AI 9 HX 370, NVIDIA GeForce RTX 4070 Laptop GPU
Asus ProArt PX13 HN7306, 32768
10027 Points -3%
R5 8645HS, NVIDIA GeForce RTX 4060 Laptop GPU
Acer Nitro 14 AN14-41-R3MX, 16384
9972 Points -4%
i9-13900H, NVIDIA GeForce RTX 4070 Laptop GPU
Asus ROG Flow Z13 ACRNM, 32768
9882 Points -5%
R9 8945HS, NVIDIA GeForce RTX 4070 Laptop GPU
Asus ROG Zephyrus G14 2024 GA403U, 32768
9502 Points -8%
i7-13700H, NVIDIA GeForce RTX 4060 Laptop GPU
Microsoft Surface Laptop Studio 2 RTX 4060, 65536
9364 Points -10%
Ultra 9 185H, NVIDIA GeForce RTX 4070 Laptop GPU
Acer Predator Helios Neo 14 (2024), 32768
9330 Points -10%
Average of class Convertible
  (4777 - 10800, n=57, last 2 years)
8266 Points -20%
PCMark 10 / Digital Content Creation
Ryzen AI Max+ 395, Radeon RX 8060S
Asus ROG Flow Z13 GZ302EA-RU073W, 32768
16551 Points
Average AMD Ryzen AI Max+ 395, AMD Radeon RX 8060S
  ()
16551 Points 0%
R9 8945HS, NVIDIA GeForce RTX 4070 Laptop GPU
Razer Blade 14 RZ09-0508, 32768
13363 Points -19%
i9-13900H, NVIDIA GeForce RTX 4070 Laptop GPU
Asus ROG Flow Z13 ACRNM, 32768
12766 Points -23%
R9 7940HS, NVIDIA GeForce RTX 4070 Laptop GPU
Razer Blade 14 RTX 4070, 16384
12666 Points -23%
Ryzen AI 9 HX 370, NVIDIA GeForce RTX 4070 Laptop GPU
Asus ProArt PX13 HN7306, 32768
12165 Points -26%
R9 8945HS, NVIDIA GeForce RTX 4070 Laptop GPU
Asus ROG Zephyrus G14 2024 GA403U, 32768
11907 Points -28%
R5 8645HS, NVIDIA GeForce RTX 4060 Laptop GPU
Acer Nitro 14 AN14-41-R3MX, 16384
11428 Points -31%
Ultra 9 185H, NVIDIA GeForce RTX 4070 Laptop GPU
Acer Predator Helios Neo 14 (2024), 32768
11369 Points -31%
i7-13700H, NVIDIA GeForce RTX 4060 Laptop GPU
Microsoft Surface Laptop Studio 2 RTX 4060, 65536
10763 Points -35%
Average of class Convertible
  (2496 - 16551, n=57, last 2 years)
7529 Points -55%
CrossMark / Overall
Ryzen AI Max+ 395, Radeon RX 8060S
Asus ROG Flow Z13 GZ302EA-RU073W, 32768
2274 Points
Average AMD Ryzen AI Max+ 395, AMD Radeon RX 8060S
  ()
2274 Points 0%
M4 Max (16 cores), M4 Max 40-Core GPU
Apple MacBook Pro 16 M4 Max, 49152
2255 Points -1%
M4 Pro (14 cores), M4 Pro 20-Core GPU
Apple MacBook Pro 16 2024 M4 Pro, 49152
2148 Points -6%
M4 Pro (12 cores), M4 Pro 16-Core GPU
Apple MacBook Pro 14 2024 M4 Pro Entry, 24576
2123 Points -7%
M4 (10 cores), M4 10-Core GPU
Apple MacBook Pro 14 2024 M4, 16384
2066 Points -9%
i9-13900H, NVIDIA GeForce RTX 4070 Laptop GPU
Asus ROG Flow Z13 ACRNM, 32768
1937 Points -15%
Ultra 9 185H, NVIDIA GeForce RTX 4070 Laptop GPU
Acer Predator Helios Neo 14 (2024), 32768
1917 Points -16%
R9 8945HS, NVIDIA GeForce RTX 4070 Laptop GPU
Razer Blade 14 RZ09-0508, 32768
1830 Points -20%
R9 7940HS, NVIDIA GeForce RTX 4070 Laptop GPU
Razer Blade 14 RTX 4070, 16384
1812 Points -20%
Ryzen AI 9 HX 370, NVIDIA GeForce RTX 4070 Laptop GPU
Asus ProArt PX13 HN7306, 32768
1785 Points -22%
R9 8945HS, NVIDIA GeForce RTX 4070 Laptop GPU
Asus ROG Zephyrus G14 2024 GA403U, 32768
1767 Points -22%
R5 8645HS, NVIDIA GeForce RTX 4060 Laptop GPU
Acer Nitro 14 AN14-41-R3MX, 16384
1765 Points -22%
i7-13700H, NVIDIA GeForce RTX 4060 Laptop GPU
Microsoft Surface Laptop Studio 2 RTX 4060, 65536
1733 Points -24%
Average of class Convertible
  (524 - 2274, n=60, last 2 years)
1500 Points -34%
SD X Elite X1E-84-100, Adreno X1-85 4.6 TFLOPS
Samsung Galaxy Book4 Edge 16 X1E-84-100, 16384
1416 Points -38%
SD X Elite X1E-80-100, Adreno X1-85 3.8 TFLOPS
Microsoft Surface Laptop 15 Snapdragon X Elite, 16384
1385 Points -39%
SD X Elite X1E-78-100, Adreno X1-85 3.8 TFLOPS
Lenovo Yoga Slim 7X 14Q8X9, 32768
1255 Points -45%
CrossMark / Productivity
M4 Max (16 cores), M4 Max 40-Core GPU
Apple MacBook Pro 16 M4 Max, 49152
2042 Points +6%
M4 Pro (14 cores), M4 Pro 20-Core GPU
Apple MacBook Pro 16 2024 M4 Pro, 49152
1980 Points +3%
M4 Pro (12 cores), M4 Pro 16-Core GPU
Apple MacBook Pro 14 2024 M4 Pro Entry, 24576
1936 Points +1%
M4 (10 cores), M4 10-Core GPU
Apple MacBook Pro 14 2024 M4, 16384
1933 Points 0%
Ryzen AI Max+ 395, Radeon RX 8060S
Asus ROG Flow Z13 GZ302EA-RU073W, 32768
1925 Points
Average AMD Ryzen AI Max+ 395, AMD Radeon RX 8060S
  ()
1925 Points 0%
Ultra 9 185H, NVIDIA GeForce RTX 4070 Laptop GPU
Acer Predator Helios Neo 14 (2024), 32768
1849 Points -4%
i9-13900H, NVIDIA GeForce RTX 4070 Laptop GPU
Asus ROG Flow Z13 ACRNM, 32768
1820 Points -5%
R9 8945HS, NVIDIA GeForce RTX 4070 Laptop GPU
Razer Blade 14 RZ09-0508, 32768
1783 Points -7%
R9 7940HS, NVIDIA GeForce RTX 4070 Laptop GPU
Razer Blade 14 RTX 4070, 16384
1762 Points -8%
R5 8645HS, NVIDIA GeForce RTX 4060 Laptop GPU
Acer Nitro 14 AN14-41-R3MX, 16384
1736 Points -10%
R9 8945HS, NVIDIA GeForce RTX 4070 Laptop GPU
Asus ROG Zephyrus G14 2024 GA403U, 32768
1686 Points -12%
i7-13700H, NVIDIA GeForce RTX 4060 Laptop GPU
Microsoft Surface Laptop Studio 2 RTX 4060, 65536
1618 Points -16%
Ryzen AI 9 HX 370, NVIDIA GeForce RTX 4070 Laptop GPU
Asus ProArt PX13 HN7306, 32768
1611 Points -16%
Average of class Convertible
  (554 - 1925, n=60, last 2 years)
1456 Points -24%
SD X Elite X1E-84-100, Adreno X1-85 4.6 TFLOPS
Samsung Galaxy Book4 Edge 16 X1E-84-100, 16384
1330 Points -31%
SD X Elite X1E-80-100, Adreno X1-85 3.8 TFLOPS
Microsoft Surface Laptop 15 Snapdragon X Elite, 16384
1303 Points -32%
SD X Elite X1E-78-100, Adreno X1-85 3.8 TFLOPS
Lenovo Yoga Slim 7X 14Q8X9, 32768
1152 Points -40%
CrossMark / Creativity
Ryzen AI Max+ 395, Radeon RX 8060S
Asus ROG Flow Z13 GZ302EA-RU073W, 32768
2949 Points
Average AMD Ryzen AI Max+ 395, AMD Radeon RX 8060S
  ()
2949 Points 0%
M4 Max (16 cores), M4 Max 40-Core GPU
Apple MacBook Pro 16 M4 Max, 49152
2795 Points -5%
M4 Pro (12 cores), M4 Pro 16-Core GPU
Apple MacBook Pro 14 2024 M4 Pro Entry, 24576
2594 Points -12%
M4 Pro (14 cores), M4 Pro 20-Core GPU
Apple MacBook Pro 16 2024 M4 Pro, 49152
2590 Points -12%
M4 (10 cores), M4 10-Core GPU
Apple MacBook Pro 14 2024 M4, 16384
2420 Points -18%
Ryzen AI 9 HX 370, NVIDIA GeForce RTX 4070 Laptop GPU
Asus ProArt PX13 HN7306, 32768
2212 Points -25%
i9-13900H, NVIDIA GeForce RTX 4070 Laptop GPU
Asus ROG Flow Z13 ACRNM, 32768
2172 Points -26%
Ultra 9 185H, NVIDIA GeForce RTX 4070 Laptop GPU
Acer Predator Helios Neo 14 (2024), 32768
2008 Points -32%
i7-13700H, NVIDIA GeForce RTX 4060 Laptop GPU
Microsoft Surface Laptop Studio 2 RTX 4060, 65536
2001 Points -32%
R9 8945HS, NVIDIA GeForce RTX 4070 Laptop GPU
Asus ROG Zephyrus G14 2024 GA403U, 32768
1960 Points -34%
R9 7940HS, NVIDIA GeForce RTX 4070 Laptop GPU
Razer Blade 14 RTX 4070, 16384
1952 Points -34%
R9 8945HS, NVIDIA GeForce RTX 4070 Laptop GPU
Razer Blade 14 RZ09-0508, 32768
1935 Points -34%
R5 8645HS, NVIDIA GeForce RTX 4060 Laptop GPU
Acer Nitro 14 AN14-41-R3MX, 16384
1823 Points -38%
Average of class Convertible
  (550 - 2949, n=60, last 2 years)
1629 Points -45%
SD X Elite X1E-84-100, Adreno X1-85 4.6 TFLOPS
Samsung Galaxy Book4 Edge 16 X1E-84-100, 16384
1595 Points -46%
SD X Elite X1E-80-100, Adreno X1-85 3.8 TFLOPS
Microsoft Surface Laptop 15 Snapdragon X Elite, 16384
1496 Points -49%
SD X Elite X1E-78-100, Adreno X1-85 3.8 TFLOPS
Lenovo Yoga Slim 7X 14Q8X9, 32768
1423 Points -52%
CrossMark / Responsiveness
Ultra 9 185H, NVIDIA GeForce RTX 4070 Laptop GPU
Acer Predator Helios Neo 14 (2024), 32768
1856 Points +8%
Ryzen AI Max+ 395, Radeon RX 8060S
Asus ROG Flow Z13 GZ302EA-RU073W, 32768
1719 Points
Average AMD Ryzen AI Max+ 395, AMD Radeon RX 8060S
  ()
1719 Points 0%
R5 8645HS, NVIDIA GeForce RTX 4060 Laptop GPU
Acer Nitro 14 AN14-41-R3MX, 16384
1681 Points -2%
R9 8945HS, NVIDIA GeForce RTX 4070 Laptop GPU
Razer Blade 14 RZ09-0508, 32768
1672 Points -3%
i9-13900H, NVIDIA GeForce RTX 4070 Laptop GPU
Asus ROG Flow Z13 ACRNM, 32768
1654 Points -4%
M4 Max (16 cores), M4 Max 40-Core GPU
Apple MacBook Pro 16 M4 Max, 49152
1595 Points -7%
R9 7940HS, NVIDIA GeForce RTX 4070 Laptop GPU
Razer Blade 14 RTX 4070, 16384
1575 Points -8%
M4 (10 cores), M4 10-Core GPU
Apple MacBook Pro 14 2024 M4, 16384
1569 Points -9%
M4 Pro (14 cores), M4 Pro 20-Core GPU
Apple MacBook Pro 16 2024 M4 Pro, 49152
1566 Points -9%
M4 Pro (12 cores), M4 Pro 16-Core GPU
Apple MacBook Pro 14 2024 M4 Pro Entry, 24576
1533 Points -11%
R9 8945HS, NVIDIA GeForce RTX 4070 Laptop GPU
Asus ROG Zephyrus G14 2024 GA403U, 32768
1489 Points -13%
i7-13700H, NVIDIA GeForce RTX 4060 Laptop GPU
Microsoft Surface Laptop Studio 2 RTX 4060, 65536
1381 Points -20%
SD X Elite X1E-80-100, Adreno X1-85 3.8 TFLOPS
Microsoft Surface Laptop 15 Snapdragon X Elite, 16384
1320 Points -23%
Ryzen AI 9 HX 370, NVIDIA GeForce RTX 4070 Laptop GPU
Asus ProArt PX13 HN7306, 32768
1274 Points -26%
Average of class Convertible
  (381 - 1868, n=60, last 2 years)
1264 Points -26%
SD X Elite X1E-84-100, Adreno X1-85 4.6 TFLOPS
Samsung Galaxy Book4 Edge 16 X1E-84-100, 16384
1197 Points -30%
SD X Elite X1E-78-100, Adreno X1-85 3.8 TFLOPS
Lenovo Yoga Slim 7X 14Q8X9, 32768
1116 Points -35%
WebXPRT 3 / Overall
M4 Max (16 cores), M4 Max 40-Core GPU
Apple MacBook Pro 16 M4 Max, 49152
543 Points +52%
M4 Pro (12 cores), M4 Pro 16-Core GPU
Apple MacBook Pro 14 2024 M4 Pro Entry, 24576
525 Points +47%
M4 Pro (14 cores), M4 Pro 20-Core GPU
Apple MacBook Pro 16 2024 M4 Pro, 49152
525 Points +47%
SD X Elite X1E-84-100, Adreno X1-85 4.6 TFLOPS
Samsung Galaxy Book4 Edge 16 X1E-84-100, 16384
476 Points +33%
M4 (10 cores), M4 10-Core GPU
Apple MacBook Pro 14 2024 M4, 16384
469 Points +31%
SD X Elite X1E-80-100, Adreno X1-85 3.8 TFLOPS
Microsoft Surface Laptop 15 Snapdragon X Elite, 16384
444 Points +24%
SD X Elite X1E-78-100, Adreno X1-85 3.8 TFLOPS
Lenovo Yoga Slim 7X 14Q8X9, 32768
421 Points +18%
Ryzen AI Max+ 395, Radeon RX 8060S
Asus ROG Flow Z13 GZ302EA-RU073W, 32768
358 Points
Average AMD Ryzen AI Max+ 395, AMD Radeon RX 8060S
  ()
358 Points 0%
R9 8945HS, NVIDIA GeForce RTX 4070 Laptop GPU
Razer Blade 14 RZ09-0508, 32768
324 Points -9%
R9 7940HS, NVIDIA GeForce RTX 4070 Laptop GPU
Razer Blade 14 RTX 4070, 16384
317 Points -11%
i9-13900H, NVIDIA GeForce RTX 4070 Laptop GPU
Asus ROG Flow Z13 ACRNM, 32768
314 Points -12%
i7-13700H, NVIDIA GeForce RTX 4060 Laptop GPU
Microsoft Surface Laptop Studio 2 RTX 4060, 65536
303 Points -15%
R9 8945HS, NVIDIA GeForce RTX 4070 Laptop GPU
Asus ROG Zephyrus G14 2024 GA403U, 32768
303 Points -15%
R5 8645HS, NVIDIA GeForce RTX 4060 Laptop GPU
Acer Nitro 14 AN14-41-R3MX, 16384
295 Points -18%
Ultra 9 185H, NVIDIA GeForce RTX 4070 Laptop GPU
Acer Predator Helios Neo 14 (2024), 32768
287 Points -20%
Ryzen AI 9 HX 370, NVIDIA GeForce RTX 4070 Laptop GPU
Asus ProArt PX13 HN7306, 32768
282 Points -21%
Average of class Convertible
  (171 - 426, n=61, last 2 years)
278 Points -22%
WebXPRT 4 / Overall
M4 Max (16 cores), M4 Max 40-Core GPU
Apple MacBook Pro 16 M4 Max, 49152
353 Points +11%
M4 Pro (12 cores), M4 Pro 16-Core GPU
Apple MacBook Pro 14 2024 M4 Pro Entry, 24576
338 Points +7%
M4 Pro (14 cores), M4 Pro 20-Core GPU
Apple MacBook Pro 16 2024 M4 Pro, 49152
337 Points +6%
SD X Elite X1E-84-100, Adreno X1-85 4.6 TFLOPS
Samsung Galaxy Book4 Edge 16 X1E-84-100, 16384
334 Points +5%
M4 (10 cores), M4 10-Core GPU
Apple MacBook Pro 14 2024 M4, 16384
333 Points +5%
Ryzen AI Max+ 395, Radeon RX 8060S
Asus ROG Flow Z13 GZ302EA-RU073W, 32768
317 Points
Average AMD Ryzen AI Max+ 395, AMD Radeon RX 8060S
  ()
317 Points 0%
SD X Elite X1E-80-100, Adreno X1-85 3.8 TFLOPS
Microsoft Surface Laptop 15 Snapdragon X Elite, 16384
313 Points -1%
SD X Elite X1E-78-100, Adreno X1-85 3.8 TFLOPS
Lenovo Yoga Slim 7X 14Q8X9, 32768
291 Points -8%
i9-13900H, NVIDIA GeForce RTX 4070 Laptop GPU
Asus ROG Flow Z13 ACRNM, 32768
288 Points -9%
i7-13700H, NVIDIA GeForce RTX 4060 Laptop GPU
Microsoft Surface Laptop Studio 2 RTX 4060, 65536
272 Points -14%
R9 8945HS, NVIDIA GeForce RTX 4070 Laptop GPU
Razer Blade 14 RZ09-0508, 32768
269 Points -15%
R9 7940HS, NVIDIA GeForce RTX 4070 Laptop GPU
Razer Blade 14 RTX 4070, 16384
260 Points -18%
Ultra 9 185H, NVIDIA GeForce RTX 4070 Laptop GPU
Acer Predator Helios Neo 14 (2024), 32768
260 Points -18%
R9 8945HS, NVIDIA GeForce RTX 4070 Laptop GPU
Asus ROG Zephyrus G14 2024 GA403U, 32768
250 Points -21%
R5 8645HS, NVIDIA GeForce RTX 4060 Laptop GPU
Acer Nitro 14 AN14-41-R3MX, 16384
248 Points -22%
Ryzen AI 9 HX 370, NVIDIA GeForce RTX 4070 Laptop GPU
Asus ProArt PX13 HN7306, 32768
247 Points -22%
Average of class Convertible
  (91.2 - 317, n=58, last 2 years)
238 Points -25%
Mozilla Kraken 1.1 / Total
Average of class Convertible
  (407 - 1089, n=61, last 2 years)
560 ms * -32%
R5 8645HS, NVIDIA GeForce RTX 4060 Laptop GPU
Acer Nitro 14 AN14-41-R3MX, 16384
547 ms * -29%
R9 8945HS, NVIDIA GeForce RTX 4070 Laptop GPU
Asus ROG Zephyrus G14 2024 GA403U, 32768
509 ms * -20%
Ultra 9 185H, NVIDIA GeForce RTX 4070 Laptop GPU
Acer Predator Helios Neo 14 (2024), 32768
508 ms * -20%
R9 7940HS, NVIDIA GeForce RTX 4070 Laptop GPU
Razer Blade 14 RTX 4070, 16384
499 ms * -17%
i7-13700H, NVIDIA GeForce RTX 4060 Laptop GPU
Microsoft Surface Laptop Studio 2 RTX 4060, 65536
495 ms * -16%
R9 8945HS, NVIDIA GeForce RTX 4070 Laptop GPU
Razer Blade 14 RZ09-0508, 32768
488 ms * -15%
i9-13900H, NVIDIA GeForce RTX 4070 Laptop GPU
Asus ROG Flow Z13 ACRNM, 32768
469 ms * -10%
Ryzen AI 9 HX 370, NVIDIA GeForce RTX 4070 Laptop GPU
Asus ProArt PX13 HN7306, 32768
460 ms * -8%
SD X Elite X1E-78-100, Adreno X1-85 3.8 TFLOPS
Lenovo Yoga Slim 7X 14Q8X9, 32768
453.1 ms * -7%
Ryzen AI Max+ 395, Radeon RX 8060S
Asus ROG Flow Z13 GZ302EA-RU073W, 32768
425 ms *
Average AMD Ryzen AI Max+ 395, AMD Radeon RX 8060S
  ()
425 ms * -0%
SD X Elite X1E-80-100, Adreno X1-85 3.8 TFLOPS
Microsoft Surface Laptop 15 Snapdragon X Elite, 16384
399.4 ms * +6%
SD X Elite X1E-84-100, Adreno X1-85 4.6 TFLOPS
Samsung Galaxy Book4 Edge 16 X1E-84-100, 16384
381.2 ms * +10%
M4 (10 cores), M4 10-Core GPU
Apple MacBook Pro 14 2024 M4, 16384
263.7 ms * +38%
M4 Max (16 cores), M4 Max 40-Core GPU
Apple MacBook Pro 16 M4 Max, 49152
256.2 ms * +40%
M4 Pro (12 cores), M4 Pro 16-Core GPU
Apple MacBook Pro 14 2024 M4 Pro Entry, 24576
256 ms * +40%
M4 Pro (14 cores), M4 Pro 20-Core GPU
Apple MacBook Pro 16 2024 M4 Pro, 49152
254.3 ms * +40%

* ... smaller is better

Adobe Photoshop 和 Premiere Pro 的两项 PugetBench 测试结果也不错,但 DaVinci Resolve 的测试结果受到了限制。与 RTX 4070 Laptop 的竞争对手相比,Basic 基准测试结果要好一些,但我们在编辑一个评测视频时遇到了两次崩溃,而 Nvidia GPU 几乎从未出现过这种情况。目前,我们还无法确认这个问题是由软件还是 GPU 驱动程序造成的。

Photoshop PugetBench: Overall Score 1.01 | Premiere Pro PugetBench: Overall Score 1.1 | DaVinci Resolve PugetBench: Basic Score 1.1
Photoshop PugetBench / Overall Score 1.01
M4 Max (16 cores), M4 Max 40-Core GPU
Apple MacBook Pro 16 M4 Max, 49152
13859 Points +27%
M4 Pro (14 cores), M4 Pro 20-Core GPU
Apple MacBook Pro 16 2024 M4 Pro, 49152
12494 Points +15%
Ryzen AI Max+ 395, Radeon RX 8060S
Asus ROG Flow Z13 GZ302EA-RU073W, 32768
10901 Points
M4 (10 cores), M4 10-Core GPU
Apple MacBook Pro 14 2024 M4, 16384
10502 Points -4%
R9 7945HX, NVIDIA GeForce RTX 4070 Laptop GPU
Tuxedo Gemini 17 Gen3 AMD, 32768
8197 Points -25%
Ultra 9 285H, Arc 140T
Asus ZenBook Duo OLED UX8406CA, 32768
7934 Points -27%
i9-13900H, NVIDIA GeForce RTX 4070 Laptop GPU
Asus ROG Flow Z13 ACRNM, 32768
7829 Points -28%
Ryzen AI 7 PRO 360, Radeon 880M
Lenovo ThinkPad T14s Gen 6 21M2S00G00, 32768
7343 Points -33%
Core Ultra 7 256V, Arc 140V
Dell XPS 13 9350, 16384
6854 Points -37%
Premiere Pro PugetBench / Overall Score 1.1
M4 Max (16 cores), M4 Max 40-Core GPU
Apple MacBook Pro 16 M4 Max, 49152
12412 Points +63%
R9 7945HX, NVIDIA GeForce RTX 4070 Laptop GPU
Tuxedo Gemini 17 Gen3 AMD, 32768
9303 Points +22%
M4 Pro (14 cores), M4 Pro 20-Core GPU
Apple MacBook Pro 16 2024 M4 Pro, 49152
8835 Points +16%
Ryzen AI Max+ 395, Radeon RX 8060S
Asus ROG Flow Z13 GZ302EA-RU073W, 32768
7632 Points
i9-13900H, NVIDIA GeForce RTX 4070 Laptop GPU
Asus ROG Flow Z13 ACRNM, 32768
7436 Points -3%
M4 (10 cores), M4 10-Core GPU
Apple MacBook Pro 14 2024 M4, 16384
4903 Points -36%
Ultra 9 285H, Arc 140T
Asus ZenBook Duo OLED UX8406CA, 32768
3627 Points -52%
Core Ultra 7 256V, Arc 140V
Dell XPS 13 9350, 16384
3330 Points -56%
Ryzen AI 7 PRO 360, Radeon 880M
Lenovo ThinkPad T14s Gen 6 21M2S00G00, 32768
2661 Points -65%
DaVinci Resolve PugetBench / Basic Score 1.1
i9-14900HX, NVIDIA GeForce RTX 4090 Laptop GPU
Razer Blade 16 2024, RTX 4090, 32768
8573 Points +16%
Ryzen AI Max+ 395, Radeon RX 8060S
Asus ROG Flow Z13 GZ302EA-RU073W, 32768
7387 Points
Ryzen AI 9 HX 370, NVIDIA GeForce RTX 4070 Laptop GPU
Asus ROG Zephyrus G16 GA605WI, 32768
6998 Points -5%
i9-13900H, NVIDIA GeForce RTX 4070 Laptop GPU
Asus ROG Flow Z13 ACRNM, 32768
6659 Points -10%
Ultra 9 285H, Arc 140T
Asus ZenBook Duo OLED UX8406CA, 32768
2762 Points -63%
Photoshop PugetBench: Overall Score 1.01 | Premiere Pro PugetBench: Overall Score 1.1 | DaVinci Resolve PugetBench: Basic Score 1.1

评语:性能令人印象深刻,但供应和价格问题依然存在

新款 AMD Ryzen AI Max+ 395是一款令人印象深刻的硬件,它绝对是速度最快的 x86iGPU。Radeon 8060S 的多核 CPU 性能也非常出色,在类似的 TDP 范围内可以与GeForce RTX 4070 笔记本电脑的游戏性能相媲美。该芯片还适用于更紧凑的设备,因为你只需安装一个处理器。得益于共享内存,它在图片/视频编辑方面也有优势,目前 dGPU 的 8-12 GB VRAM 很快就会成为限制。与Apple 当前的 M4 系列相比,旗舰型号 Ryzen AI Max+ 395 可以与速度更快的 M4 Pro变体(除了单核性能之外,Apple 在这方面击败了所有竞争对手),但 M4 Max却遥不可及。

由于两款较小的 Strix Halo APU 提供的 CPU 内核较少,Radeon 8050S iGPU 也较慢,因此还有一些问题尚未解决。这些 APU 能否取得成功,尤其是考虑到高昂的价格,还有待观察。配备 Ryzen AI Max+ 395 和 32 GB 内存的 ROG Flow Z13 售价已达 2499 欧元,尽管它是内存容量最小的 SKU。我们还没有 64 或 128 GB 机型的价格。

这就带来了下一个问题,即供货问题。到目前为止,只有 华硕 ROG Flow Z13 GZ302以及 惠普 ZBook Ultra 14 G1a已宣布采用 Strix Halo APU。如果把所有这些因素综合起来看,Strix Halo 可能会相当罕见,多媒体设备可能是个例外,英特尔 CPU 和 Nvidia GPU 的组合很可能会再次占据主导地位。

Please share our article, every link counts!
Mail Logo
> Notebookcheck中文版(NBC中国) > 评测 > AMD Ryzen AI Max+ 395 分析 - Strix Halo 将与Apple M4 Pro/Max 竞争,配备 16 个 Zen 5 内核和与 RTX 4070 笔记本电脑相当的 iGPU
Andreas Osthoff, 2025-02-19 (Update: 2025-02-19)