

联想 Yoga Pro 9 16IMH9 笔记本电脑评测:75 WGeForce RTX 4050 性能超群

Yoga Pro 9 系列是联想多媒体笔记本电脑的旗舰阵容,高于中高档产品 Yoga 7 16 系列和低端 IdeaPad Pro 5 16 系列.最近,我们对最高端的 最高端的 Yoga Pro 9 配置配备迷你 LED 和GeForce RTX 4070 显卡。这次,我们要评测的是配备标准 IPS 和GeForce RTX 4050 显卡的较便宜的 SKU。
我们这次评测的配置在网上售价约为 1700 美元。其他选择包括其他 16 英寸多媒体或以工作室为中心的笔记本电脑,如 微星隐形 16,HP Envy x360 2-in-1 16, 戴尔 XPS 16 9640或 三星Galaxy Book4 Ultra.
更多联想评论:
潜在的竞争对手比较
Rating | Date | Model | Weight | Height | Size | Resolution | Price |
|---|---|---|---|---|---|---|---|
| 91.7 % v7 (old) | 06 / 2024 | Lenovo Yoga Pro 9 16IMH9 RTX 4050 Ultra 9 185H, NVIDIA GeForce RTX 4050 Laptop GPU | 2.1 kg | 18.3 mm | 16.00" | 3200x2000 | from EUR 1900 |
| 88.7 % v7 (old) | 04 / 2024 | Lenovo Yoga Pro 9 16IMH9 Ultra 9 185H, NVIDIA GeForce RTX 4070 Laptop GPU | 2.1 kg | 18.3 mm | 16.00" | 3200x2000 | from EUR 2700 |
| 87.2 % v7 (old) | 05 / 2024 | HP Envy x360 2-in-1 16-ad0097nr R7 8840HS, Radeon 780M | 1.8 kg | 18.3 mm | 16.00" | 2880x1800 | |
| 88.6 % v7 (old) | 04 / 2024 | Dell XPS 16 9640 Ultra 7 155H, NVIDIA GeForce RTX 4070 Laptop GPU | 2.3 kg | 18.7 mm | 16.30" | 3840x2400 | |
| 90.4 % v7 (old) | 03 / 2024 | Samsung Galaxy Book4 Ultra Ultra 7 155H, NVIDIA GeForce RTX 4050 Laptop GPU | 1.8 kg | 17 mm | 16.00" | 2880x1800 | from EUR 2799 |
| 87.6 % v7 (old) | 11 / 2023 | Asus VivoBook Pro 16 K6602VU i9-13900H, NVIDIA GeForce RTX 4050 Laptop GPU | 1.9 kg | 19 mm | 16.00" | 3200x2000 |
案例


连接性


SD 读卡器
| SD Card Reader | |
| average JPG Copy Test (av. of 3 runs) | |
| Asus VivoBook Pro 16 K6602VU (Angelbird AV Pro V60) | |
| Dell XPS 16 9640 (Angelbird AV Pro V60) | |
| Lenovo Yoga Pro 9 16IMH9 RTX 4050 (Angelbird AV Pro V60) | |
| Samsung Galaxy Book4 Ultra (Angelbird AV Pro V60) | |
| Lenovo Yoga Pro 9 16IMH9 (Angelbird AV Pro V60) | |
| maximum AS SSD Seq Read Test (1GB) | |
| Asus VivoBook Pro 16 K6602VU (Angelbird AV Pro V60) | |
| Dell XPS 16 9640 (Angelbird AV Pro V60) | |
| Lenovo Yoga Pro 9 16IMH9 RTX 4050 (Angelbird AV Pro V60) | |
| Lenovo Yoga Pro 9 16IMH9 (Angelbird AV Pro V60) | |
| Samsung Galaxy Book4 Ultra (Angelbird AV Pro V60) | |
交流
网络摄像头


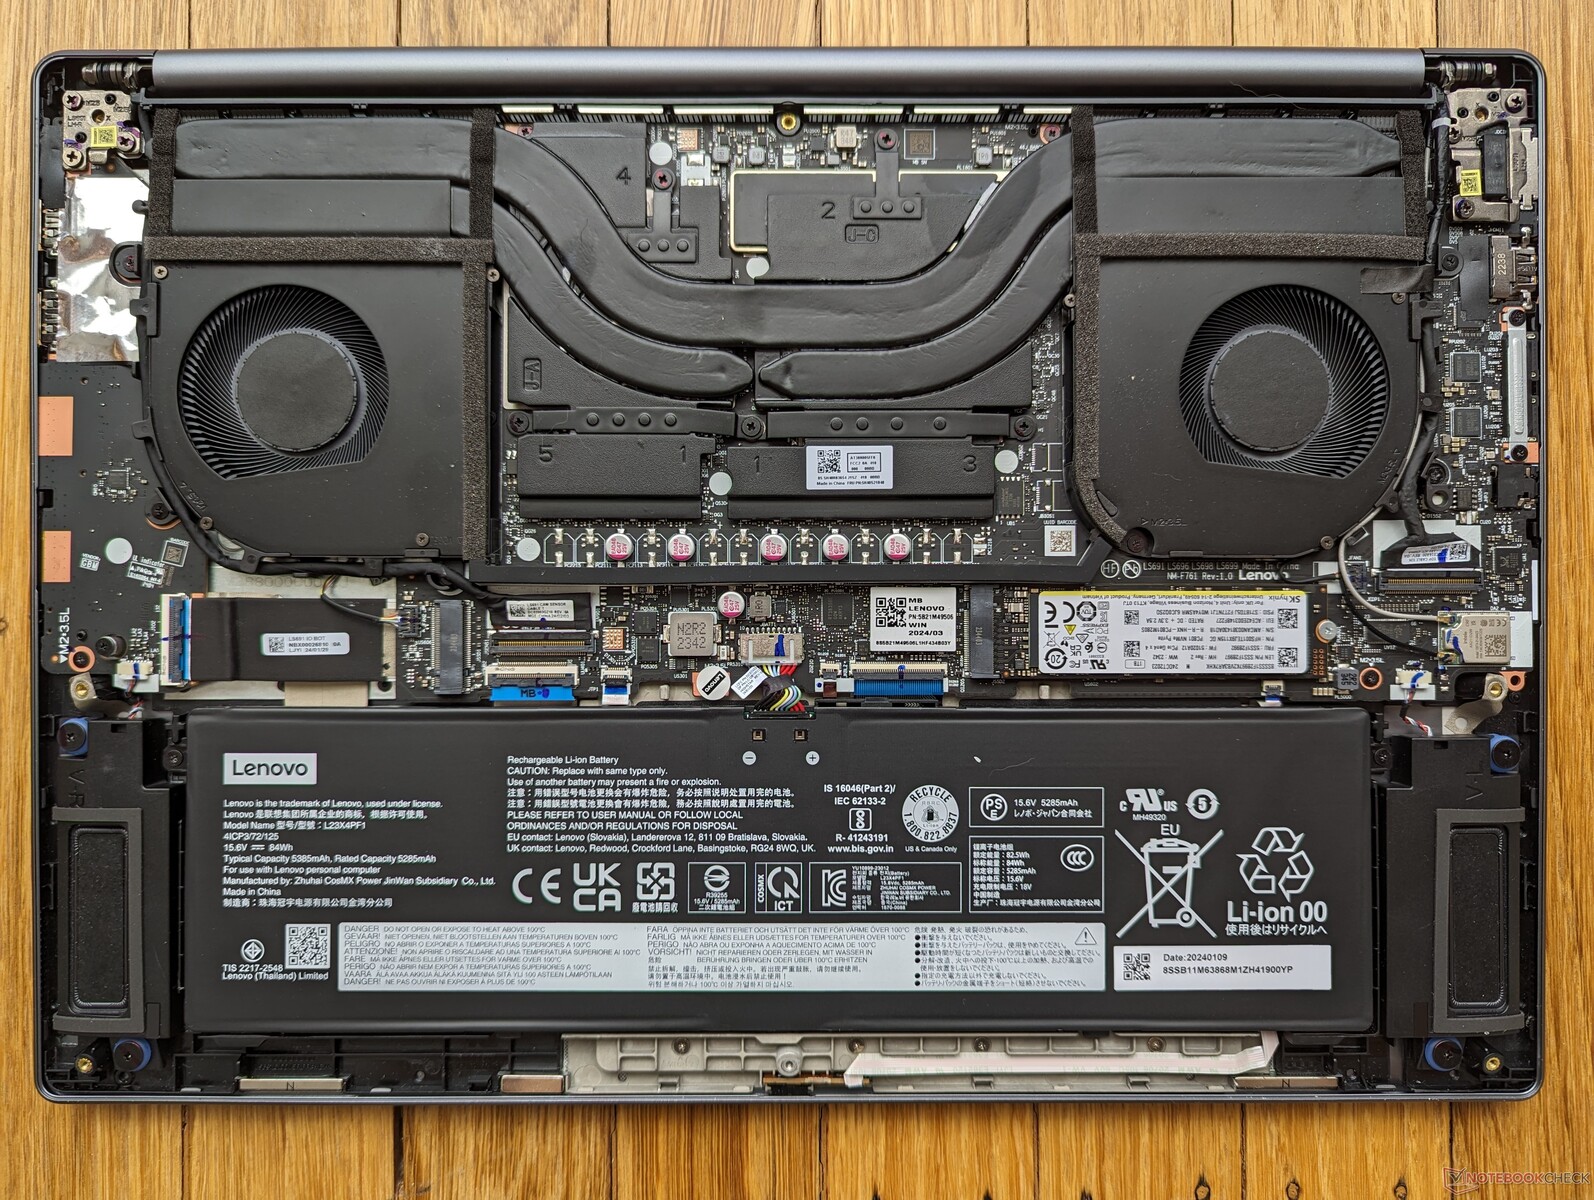
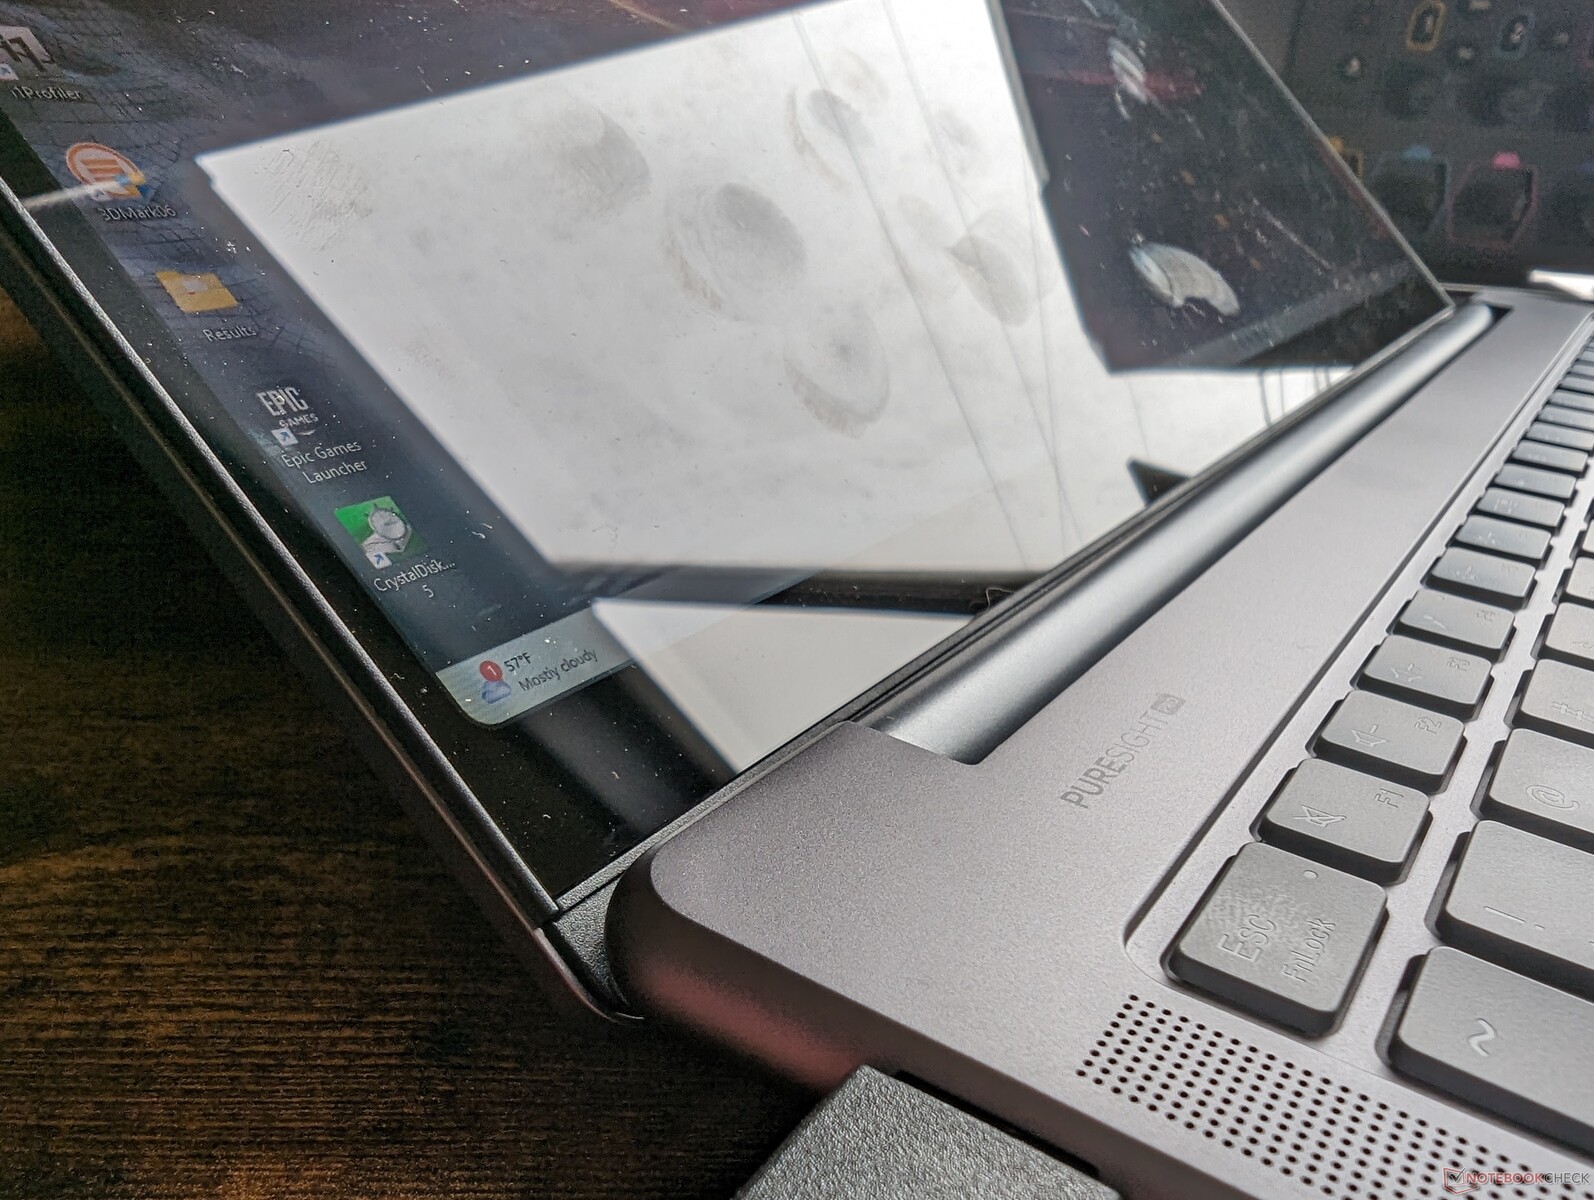
维护

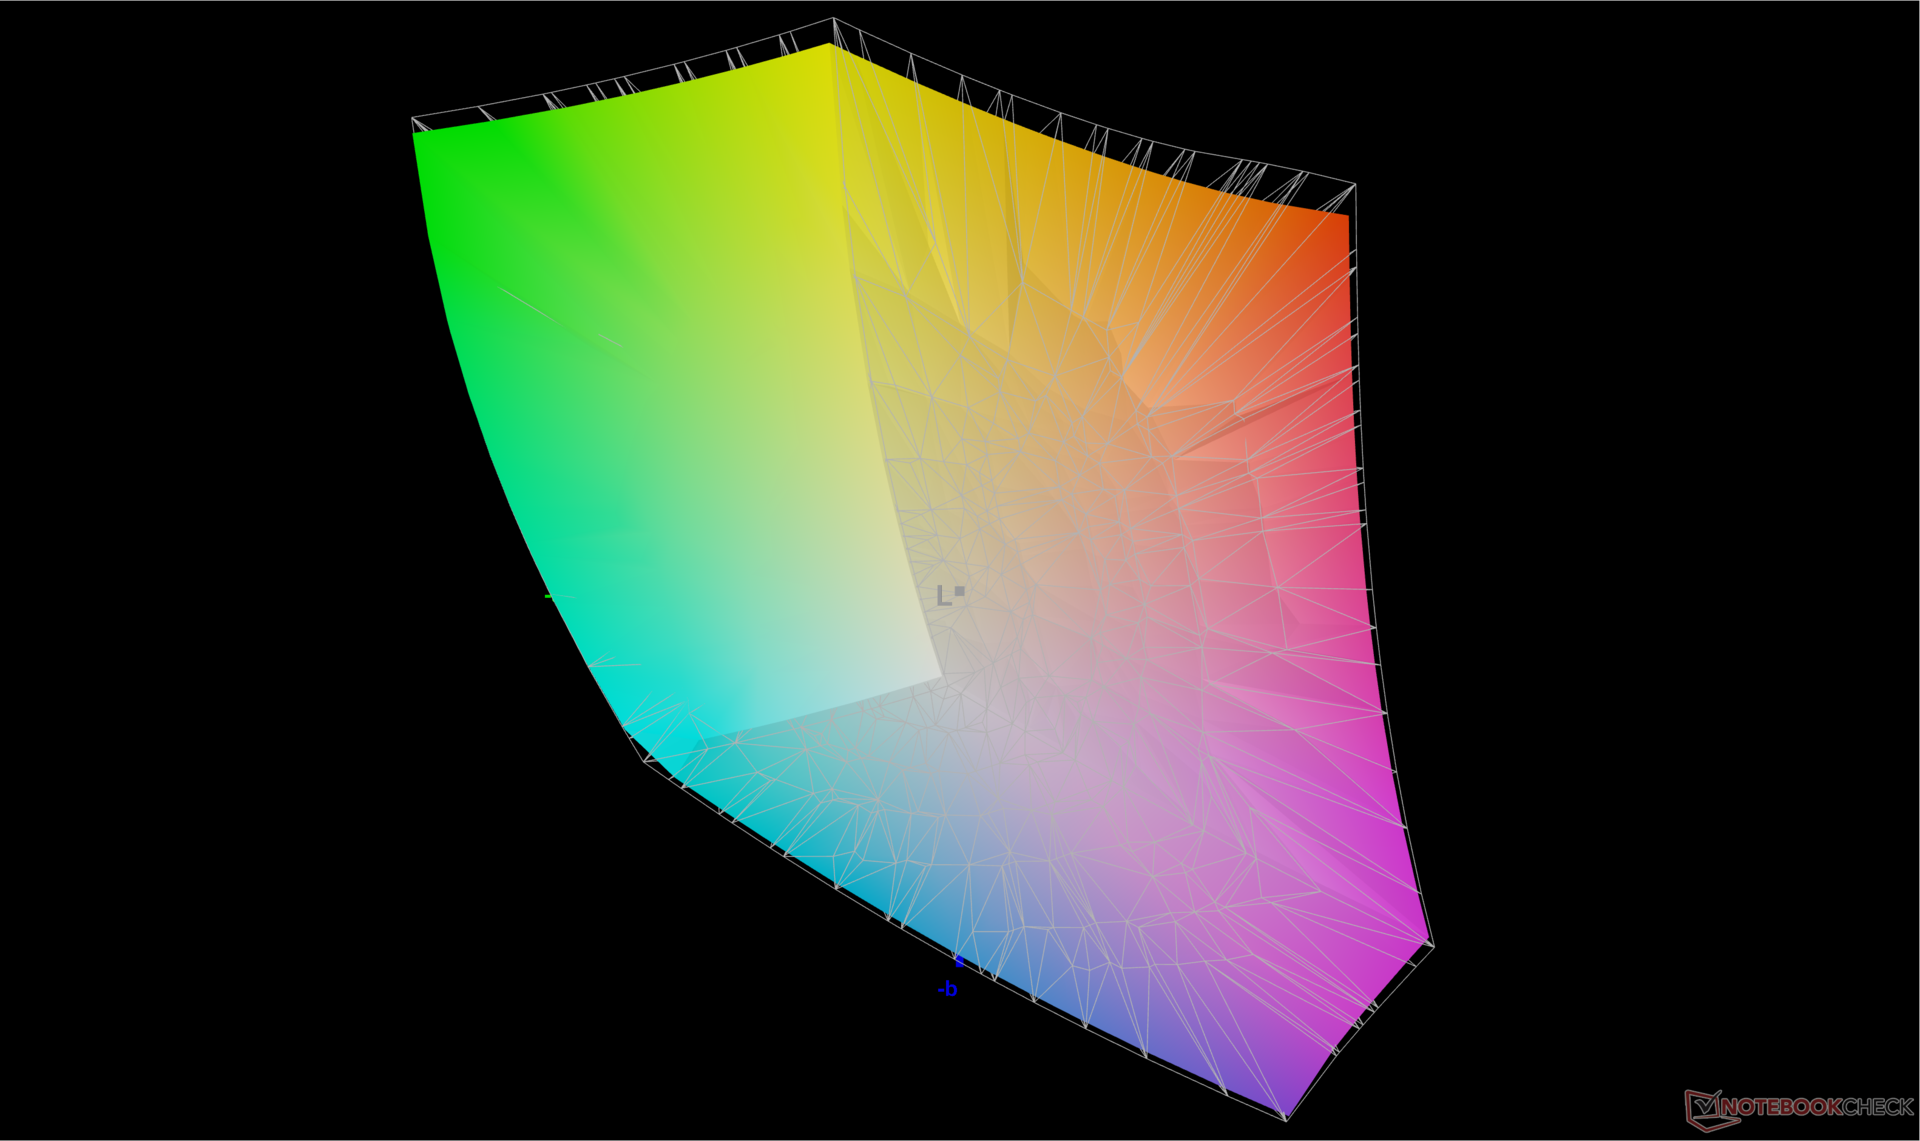
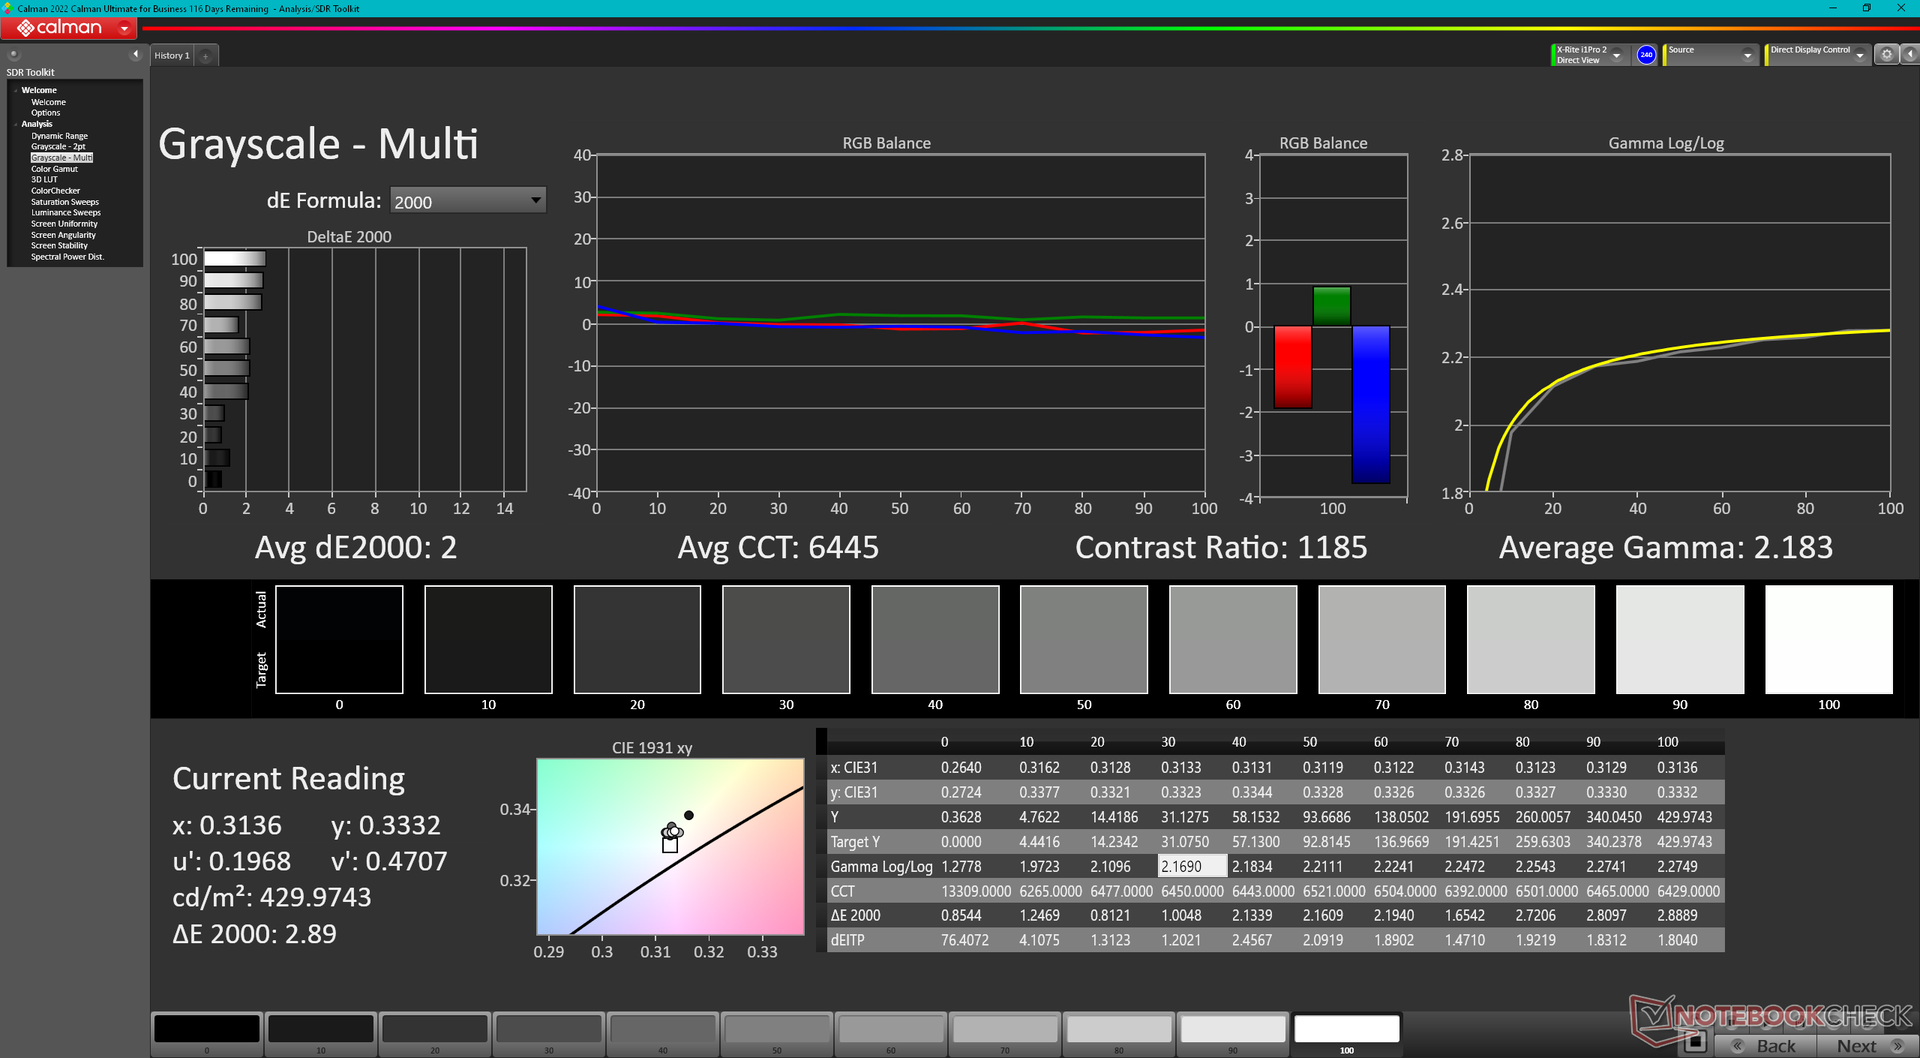
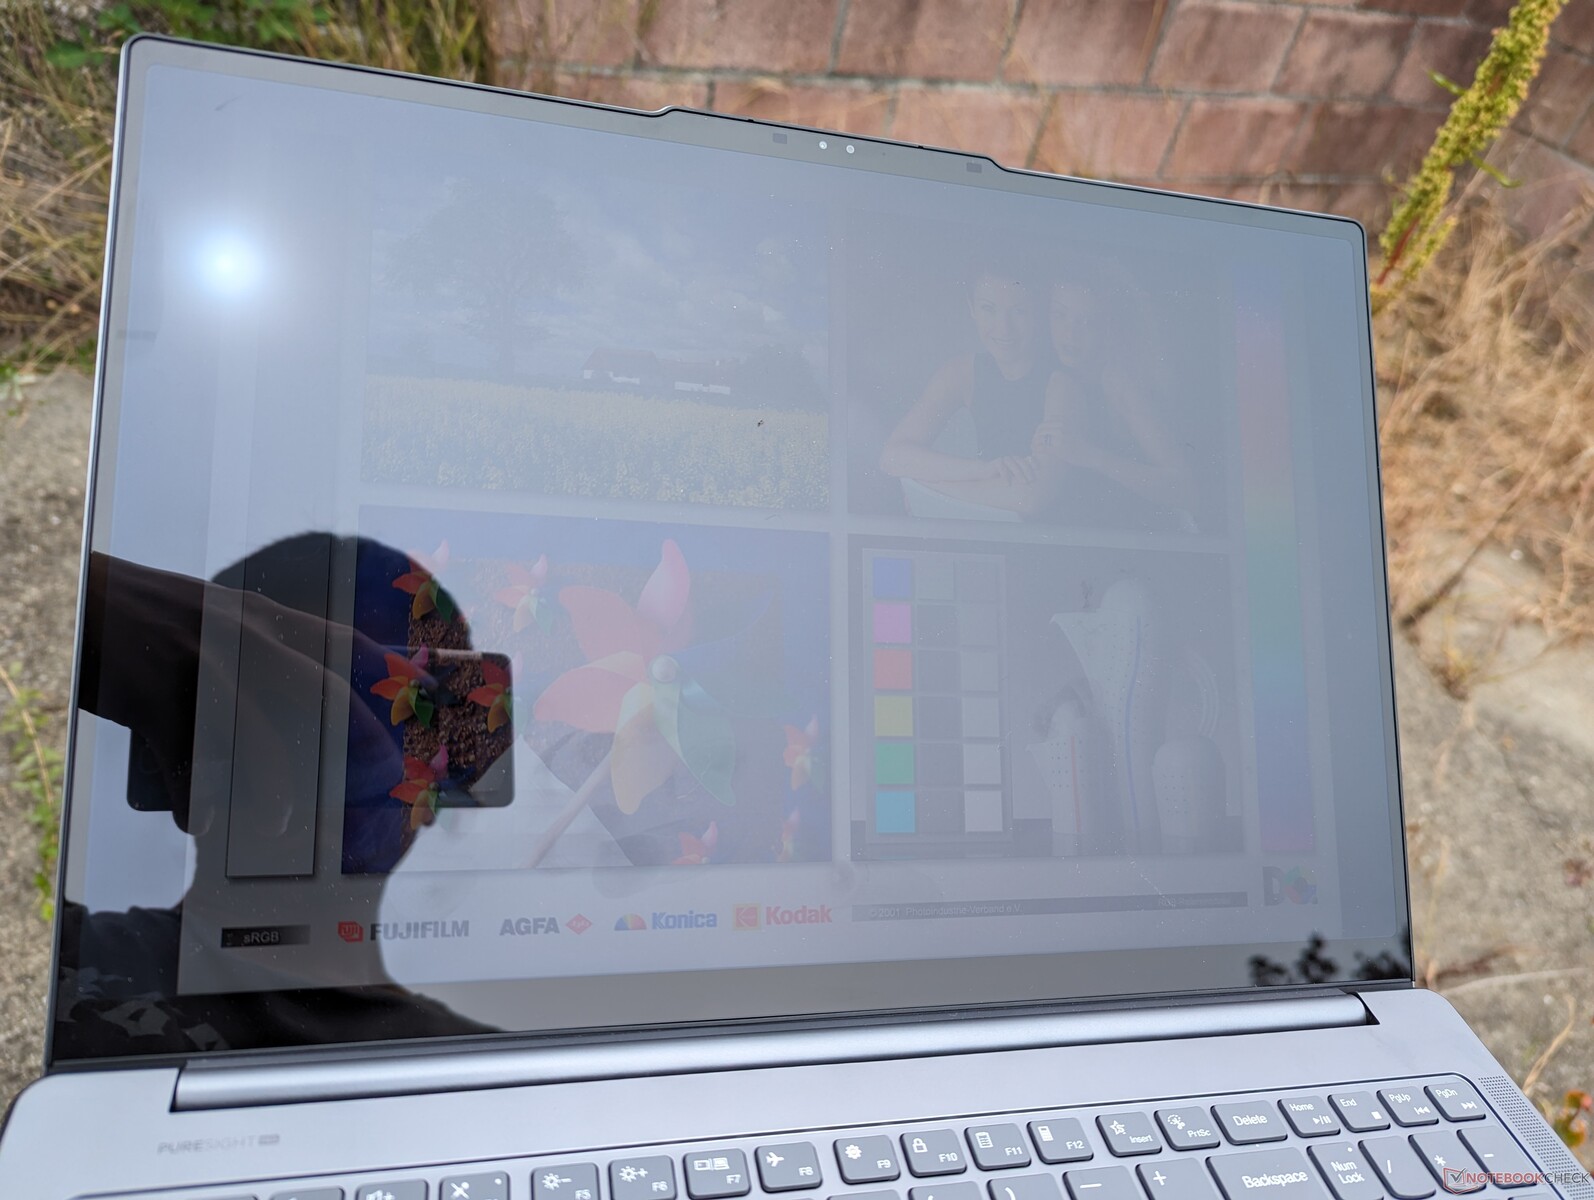
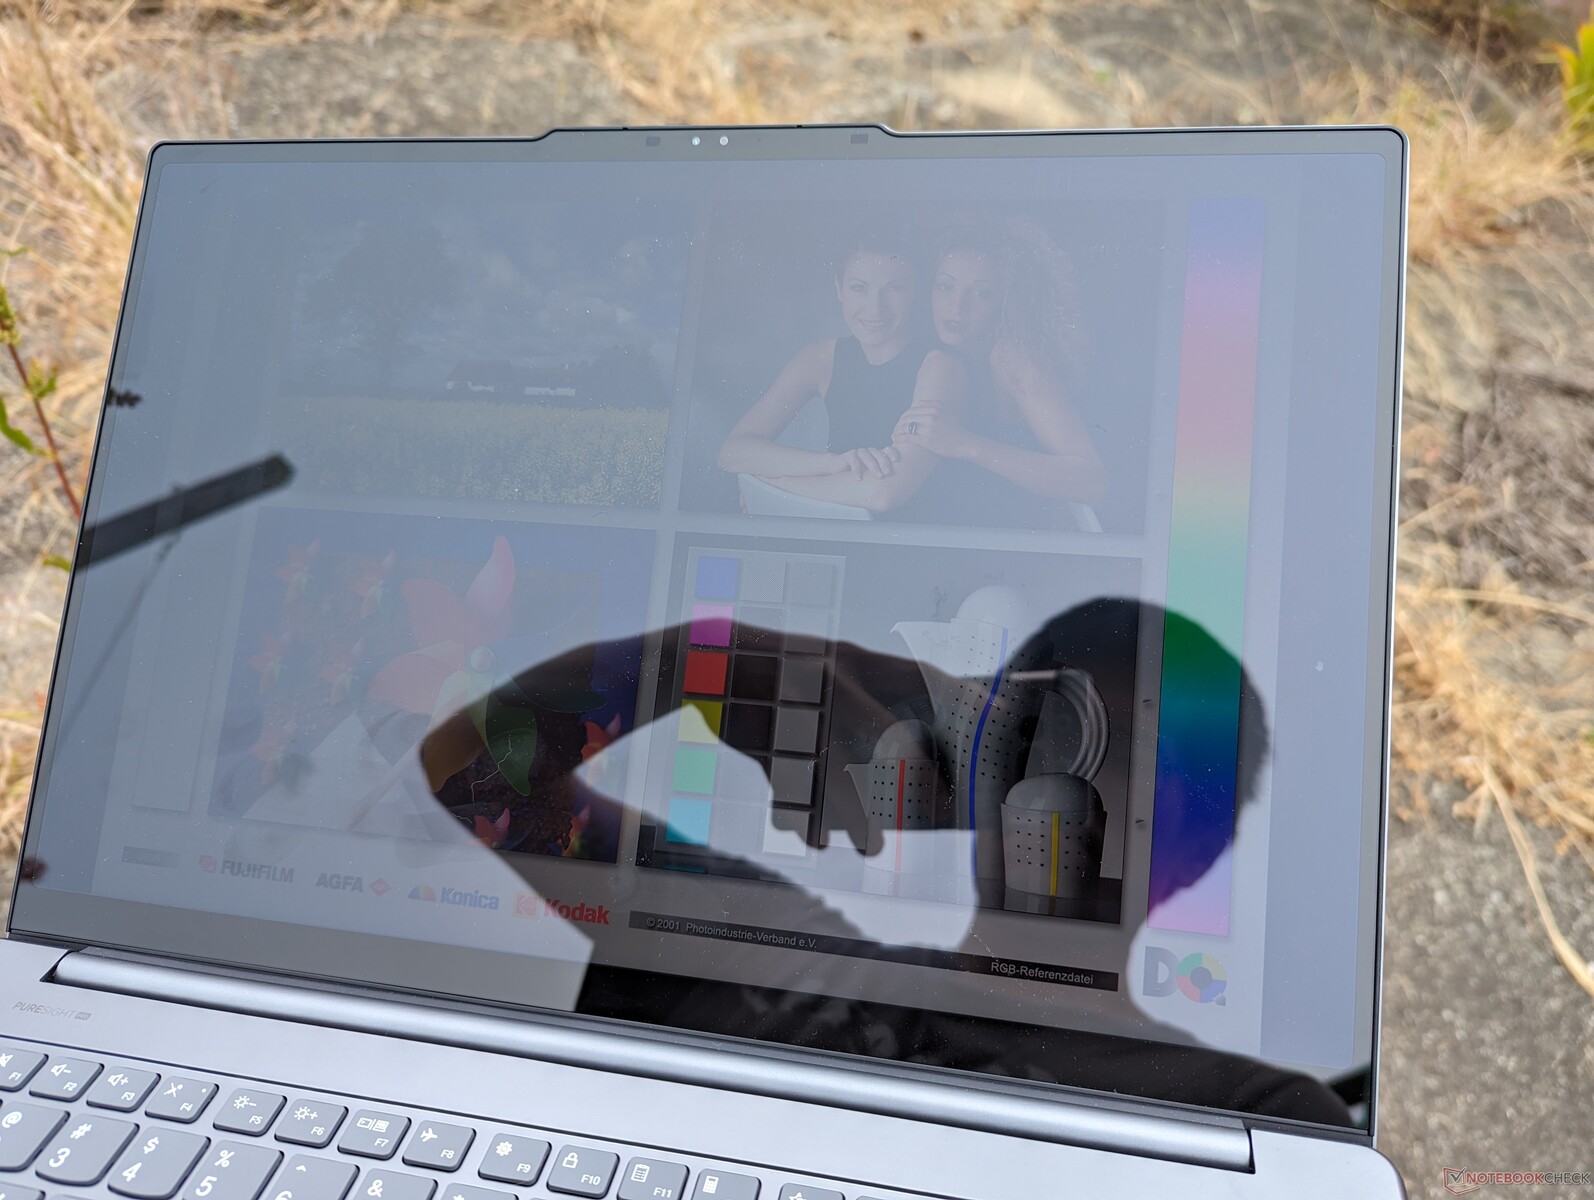
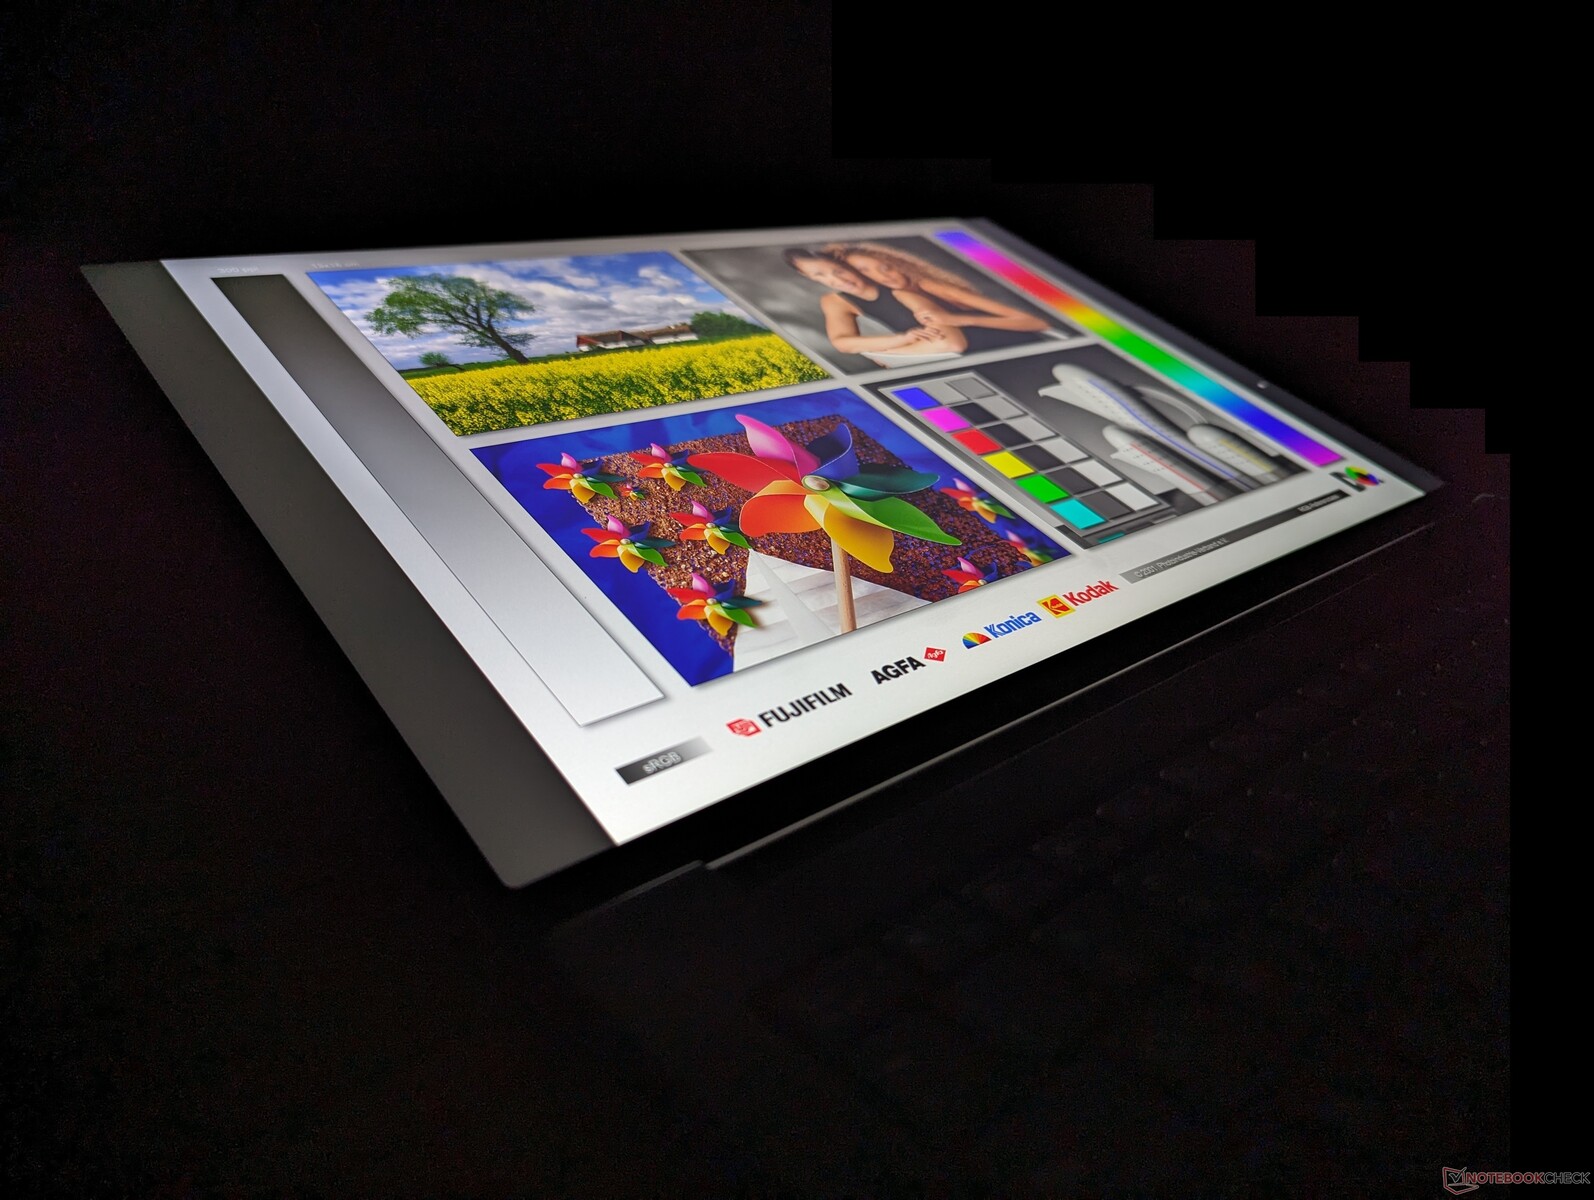
显示屏 - 3.2K IPS 和 Mini-LED 选项
联想提供以下三种显示屏选项。所有面板都具有相同的 3200 x 2000 原始分辨率和刷新率,支持高级 Optimus,但不支持 G-Sync。我们的测试机采用了下面加粗的选项,而更高端的 RTX 4070 配置则采用了迷你 LED 选项。
- 3.2K、165 Hz、IPS、400 尼特、100% P3、雾面、非触摸式
- 3.2K,165 Hz,IPS,400 尼特,100% P3,亮面,触摸
- 3.2K,165 Hz,Mini-LED,1200 尼特,100% P3,亮面,触摸
IPS 和迷你 LED 的视觉体验出奇地相似,因为它们的色彩范围和刷新率基本相同。不过,与迷你 LED 相比,IPS 的优势在于黑白响应时间更快,而且没有明显的光晕效应问题。在运行支持 HDR 的内容时,它们之间的差异反而会被放大,而这正是 mini-LED 凭借其出色的对比度和亮度水平真正大放异彩的地方。因此,观看或播放大量 HDR 媒体的用户可能更喜欢 mini-LED,而那些想省钱或不介意放弃 HDR 的用户则可以使用 IPS 获得更传统的体验。

| |||||||||||||||||||||||||
Brightness Distribution: 91 %
Center on Battery: 404.9 cd/m²
Contrast: 1012:1 (Black: 0.4 cd/m²)
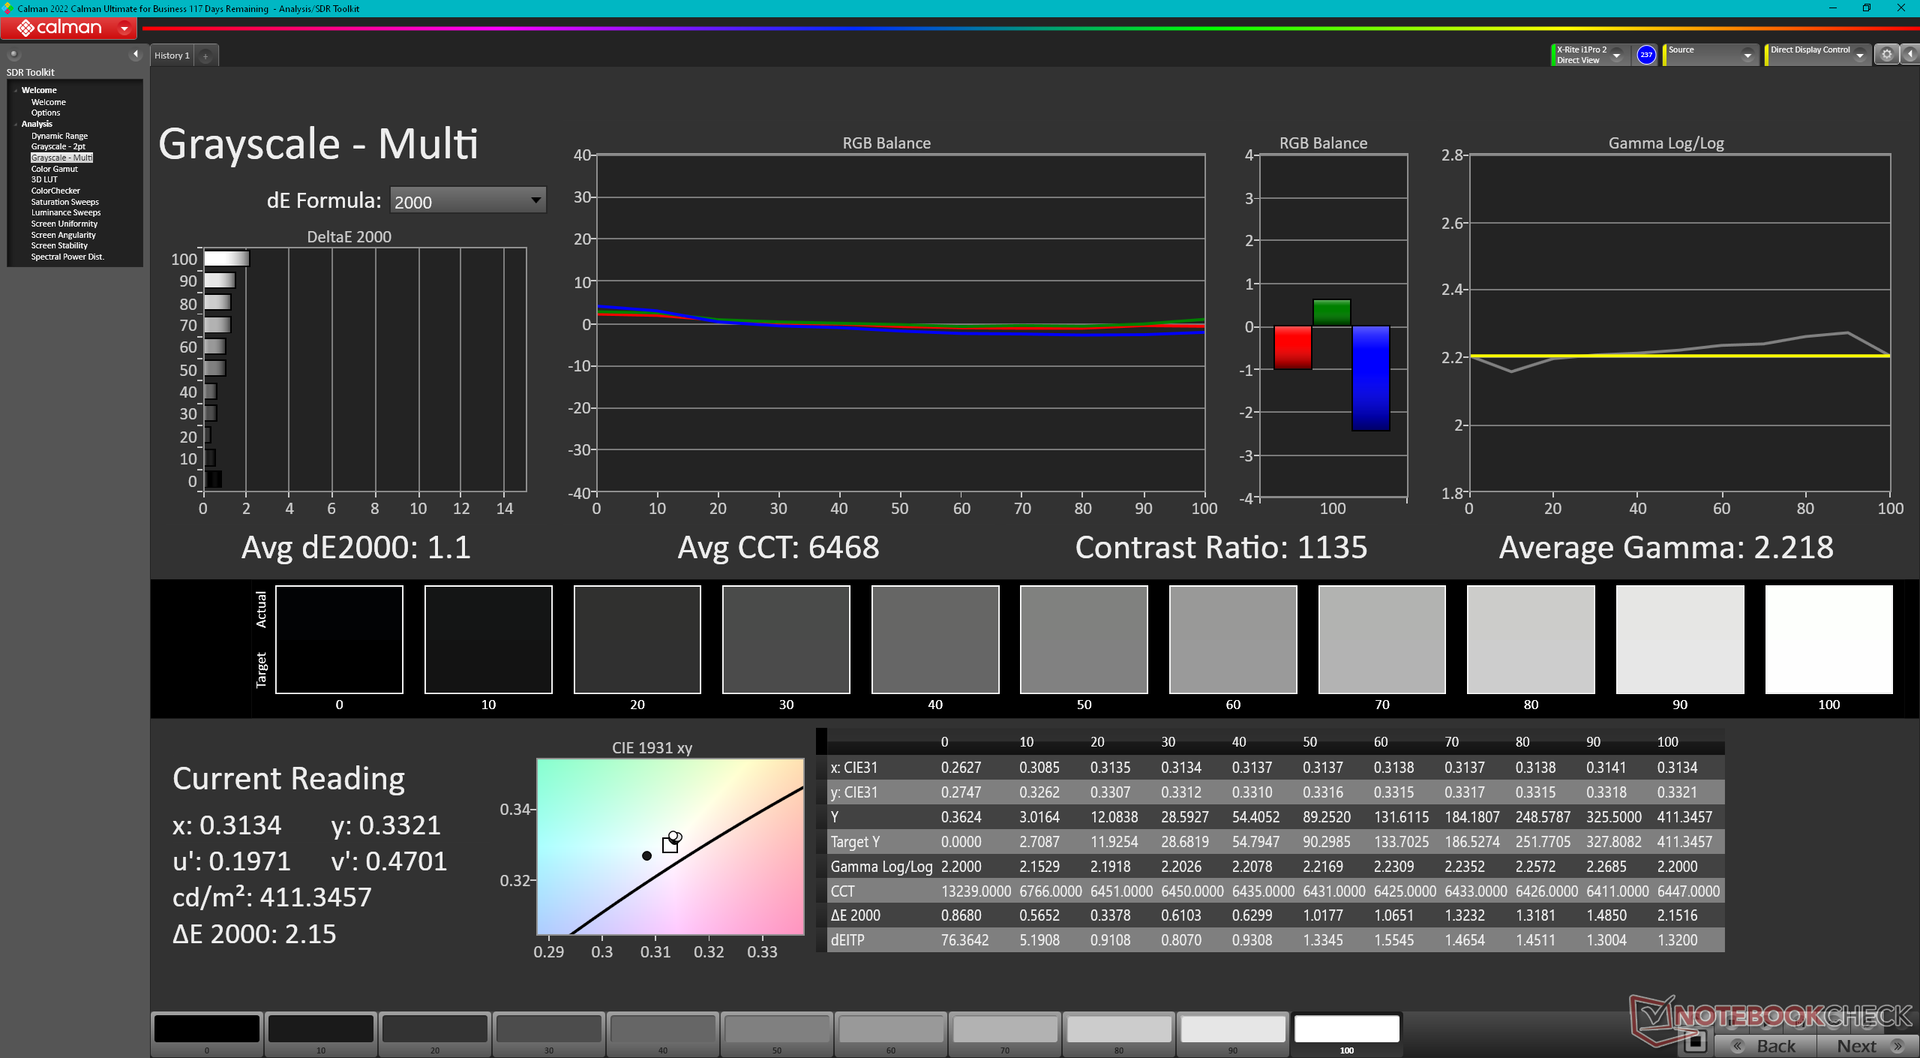
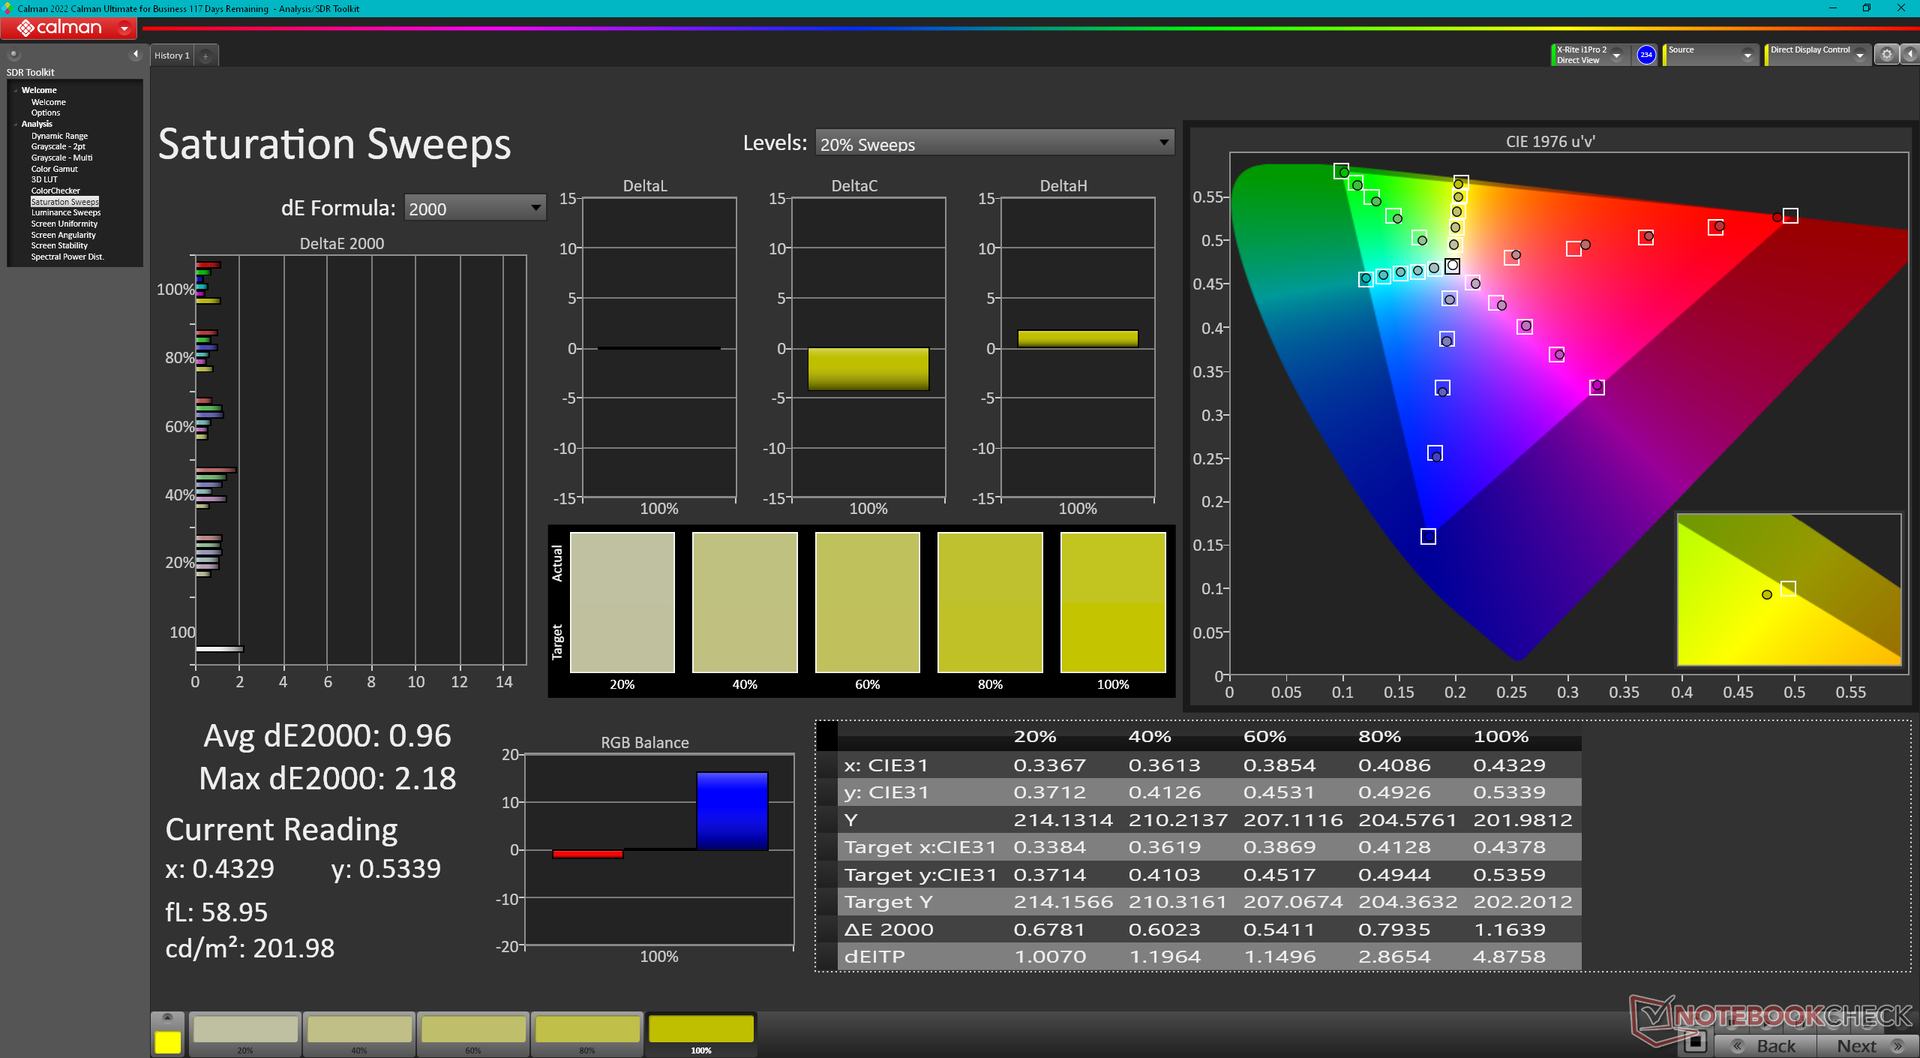
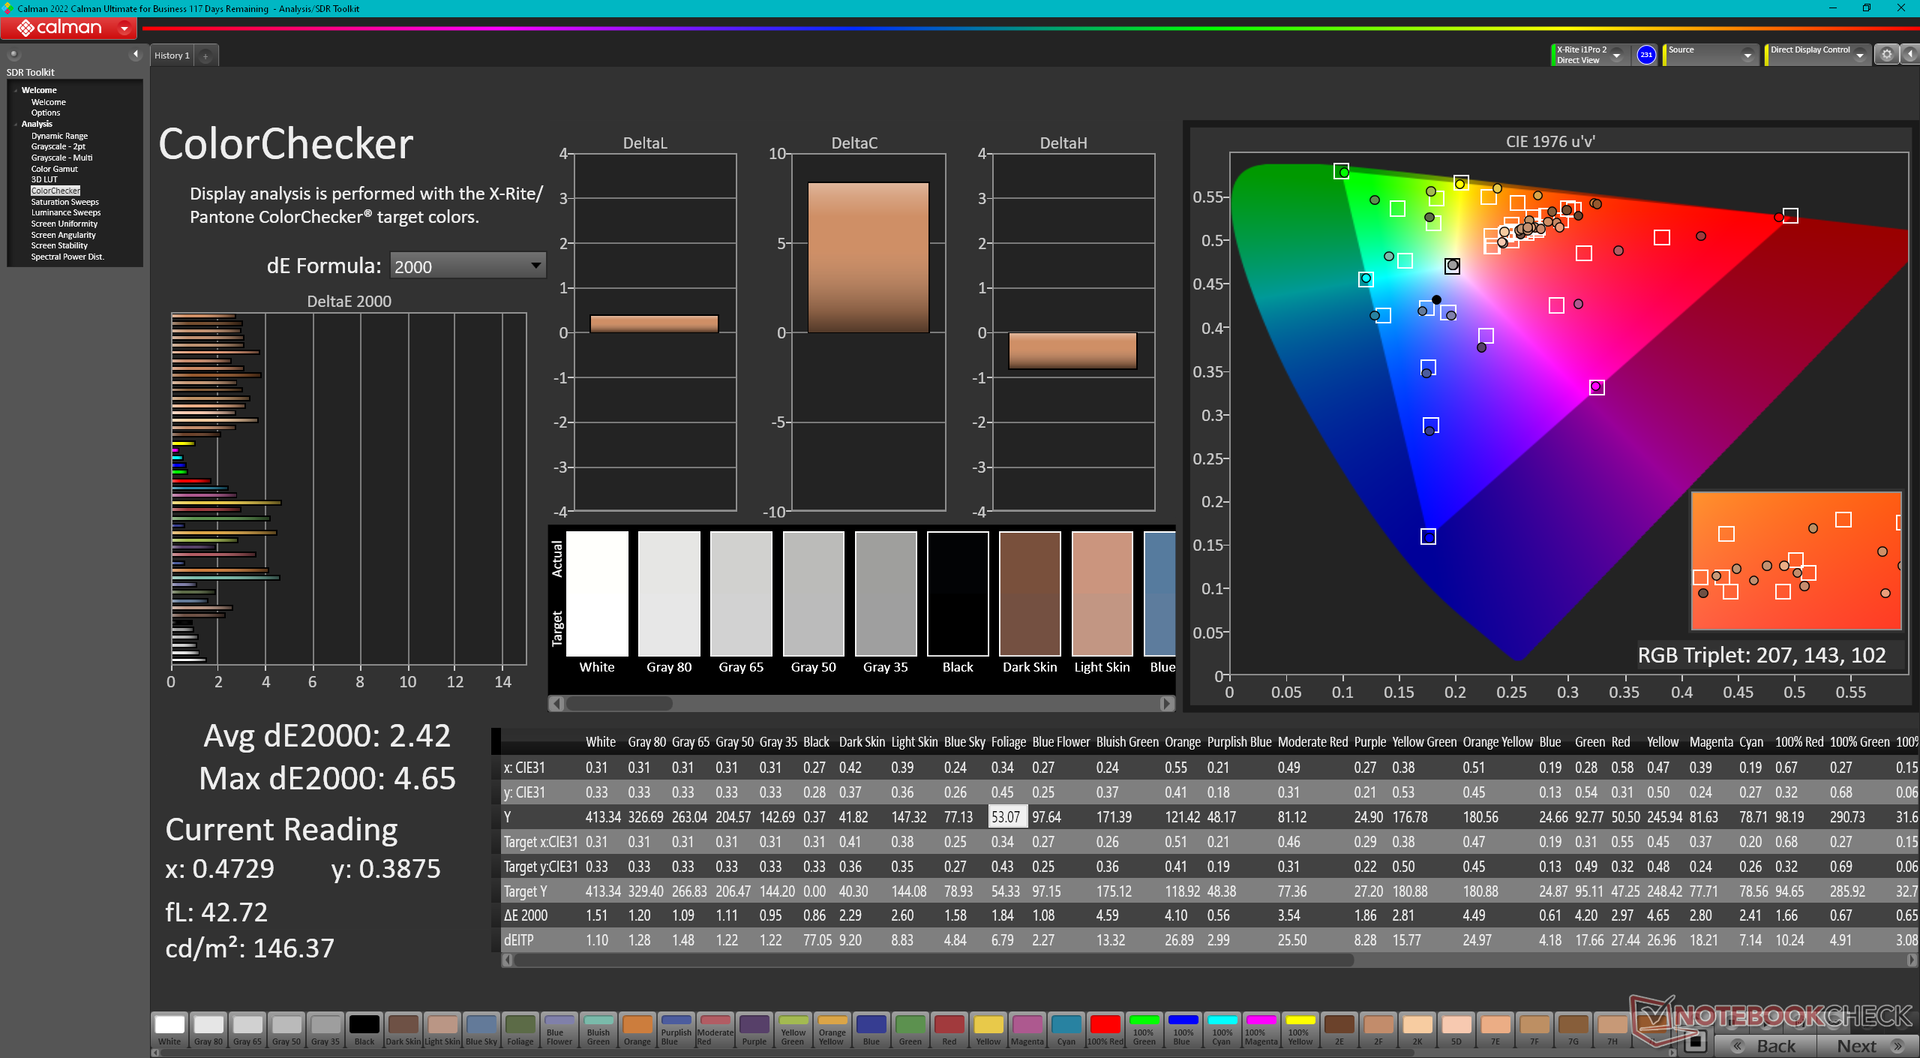
ΔE Color 2.42 | 0.5-29.43 Ø4.87, calibrated: 0.93
ΔE Greyscale 1.1 | 0.5-98 Ø5.1
86.5% AdobeRGB 1998 (Argyll 2.2.0 3D)
99.9% sRGB (Argyll 2.2.0 3D)
95.6% Display P3 (Argyll 2.2.0 3D)
Gamma: 2.22
| Lenovo Yoga Pro 9 16IMH9 RTX 4050 LEN160-3.2K, IPS, 3200x2000, 16" | Lenovo Yoga Pro 9 16IMH9 LEN160-3.2K, Mini-LED, 3200x2000, 16" | HP Envy x360 2-in-1 16-ad0097nr Samsung SDC41A6, OLED, 2880x1800, 16" | Dell XPS 16 9640 SDC4196, OLED, 3840x2400, 16.3" | Samsung Galaxy Book4 Ultra ATNA60CL07-0, OLED, 2880x1800, 16" | Asus VivoBook Pro 16 K6602VU Samsung ATNA60BX01-1, OLED, 3200x2000, 16" | |
|---|---|---|---|---|---|---|
| Display | 0% | 5% | 2% | 2% | 5% | |
| Display P3 Coverage | 95.6 | 97 1% | 99.6 4% | 98.3 3% | 98.6 3% | 98.7 3% |
| sRGB Coverage | 99.9 | 99.9 0% | 100 0% | 100 0% | 99.9 0% | 99.7 0% |
| AdobeRGB 1998 Coverage | 86.5 | 86.6 0% | 96.5 12% | 87.8 2% | 88.5 2% | 96.5 12% |
| Response Times | -85% | 92% | 92% | 94% | 24% | |
| Response Time Grey 50% / Grey 80% * | 12.4 ? | 22.2 ? -79% | 0.8 ? 94% | 0.82 ? 93% | 0.54 ? 96% | 0.68 ? 95% |
| Response Time Black / White * | 8.9 ? | 17 ? -91% | 0.89 ? 90% | 0.85 ? 90% | 0.69 ? 92% | 13.2 ? -48% |
| PWM Frequency | 4840 ? | 491.8 ? | 360 ? | 240 ? | 240 ? | |
| Screen | 30% | -16% | -7% | -0% | -61% | |
| Brightness middle | 404.9 | 651 61% | 399.4 -1% | 366 -10% | 390 -4% | 353 -13% |
| Brightness | 390 | 673 73% | 405 4% | 367 -6% | 393 1% | 354 -9% |
| Brightness Distribution | 91 | 93 2% | 98 8% | 96 5% | 98 8% | 98 8% |
| Black Level * | 0.4 | 0.22 45% | ||||
| Contrast | 1012 | 2959 192% | ||||
| Colorchecker dE 2000 * | 2.42 | 1.9 21% | 4.05 -67% | 1.3 46% | 1.4 42% | 4.23 -75% |
| Colorchecker dE 2000 max. * | 4.65 | 4.2 10% | 6.69 -44% | 3.6 23% | 2.7 42% | 7.13 -53% |
| Colorchecker dE 2000 calibrated * | 0.93 | 0.6 35% | 1.02 -10% | 1 -8% | 2.42 -160% | |
| Greyscale dE 2000 * | 1.1 | 3 -173% | 1.1 -0% | 2.2 -100% | 2.1 -91% | 2.5 -127% |
| Gamma | 2.22 99% | 2.18 101% | 2.27 97% | 2.14 103% | 2.27 97% | 2.4 92% |
| CCT | 6468 100% | 6738 96% | 6419 101% | 6680 97% | 6431 101% | 6642 98% |
| Total Average (Program / Settings) | -18% /
7% | 27% /
8% | 29% /
12% | 32% /
17% | -11% /
-31% |
* ... smaller is better

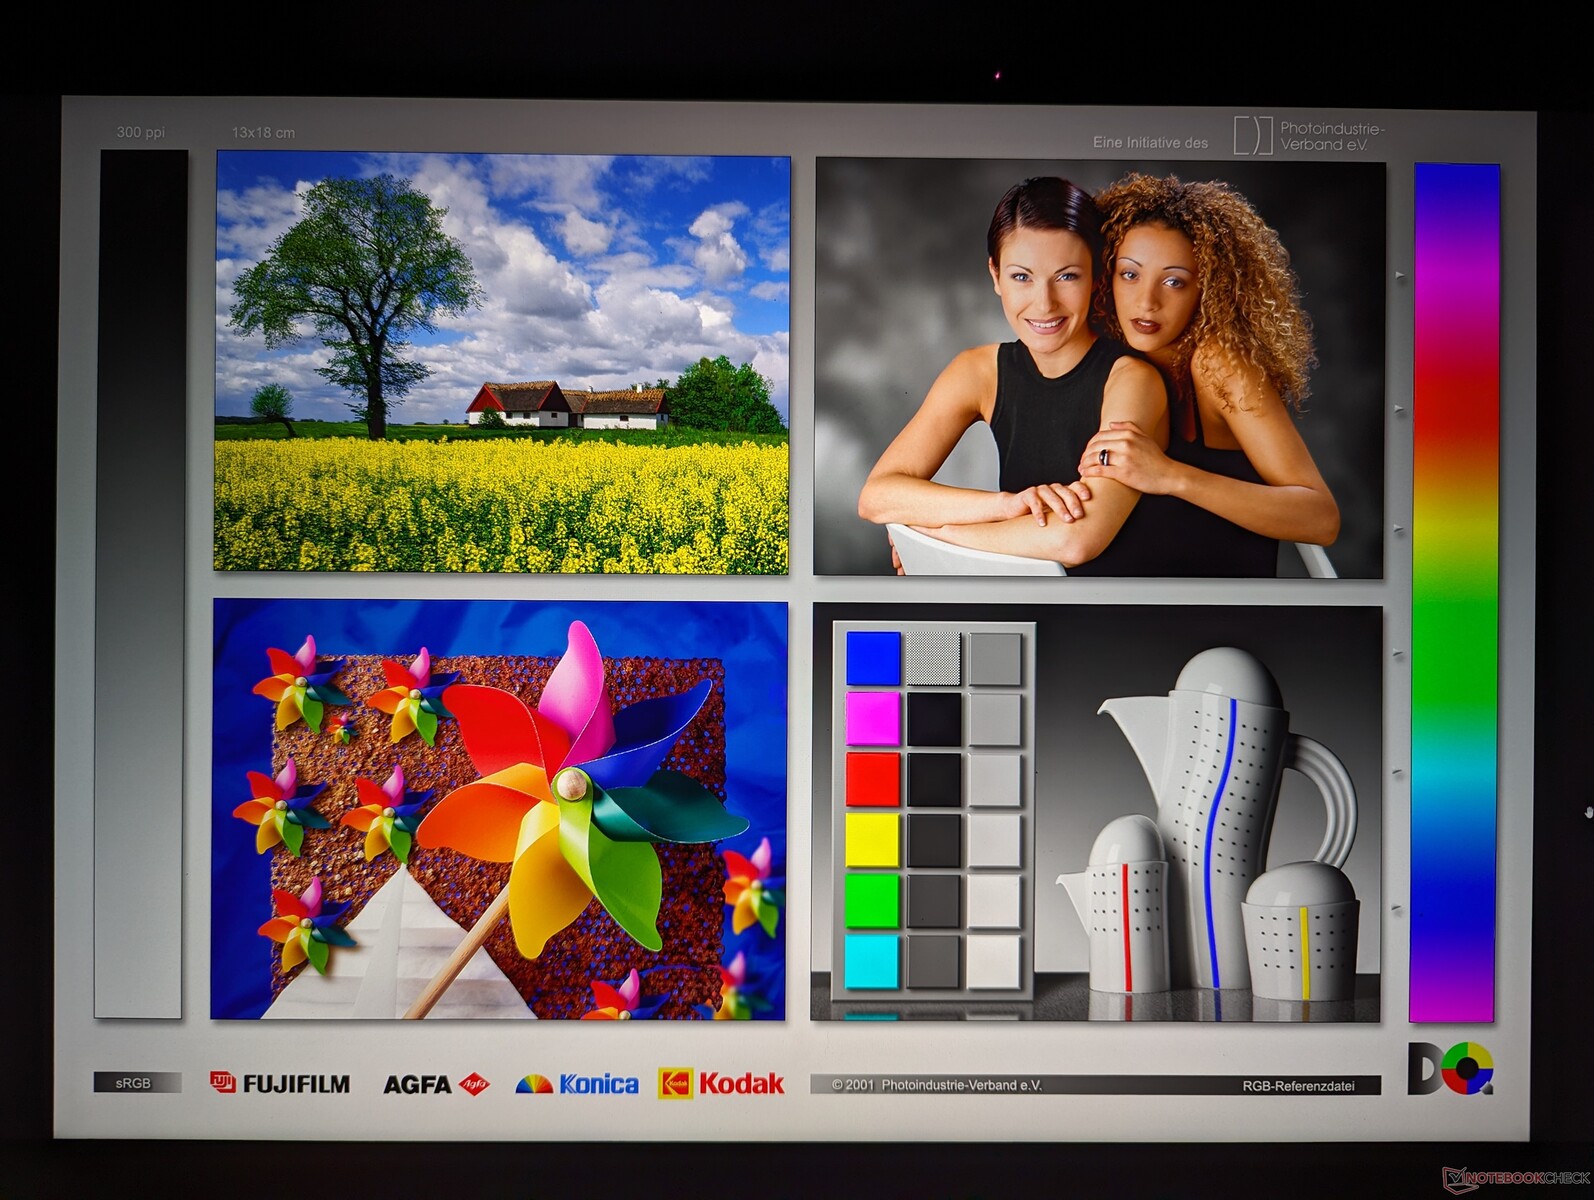
显示器开箱即按照 P3 标准校准,平均灰度和色彩 deltaE 值分别仅为 1.1 和 2.42。因此,对于大多数用户来说,无需进行最终用户校准。
Display Response Times
| ↔ Response Time Black to White | ||
|---|---|---|
| 8.9 ms ... rise ↗ and fall ↘ combined | ↗ 4.8 ms rise | 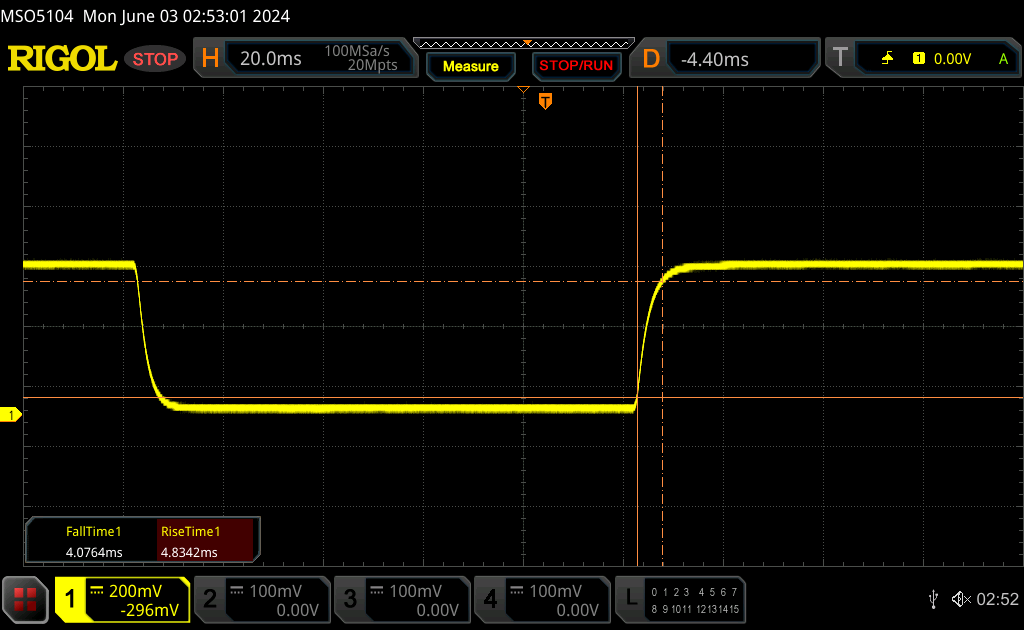 |
| ↘ 4.1 ms fall | ||
| The screen shows fast response rates in our tests and should be suited for gaming. In comparison, all tested devices range from 0.1 (minimum) to 240 (maximum) ms. » 22 % of all devices are better. This means that the measured response time is better than the average of all tested devices (20.7 ms). | ||
| ↔ Response Time 50% Grey to 80% Grey | ||
| 12.4 ms ... rise ↗ and fall ↘ combined | ↗ 6.3 ms rise | 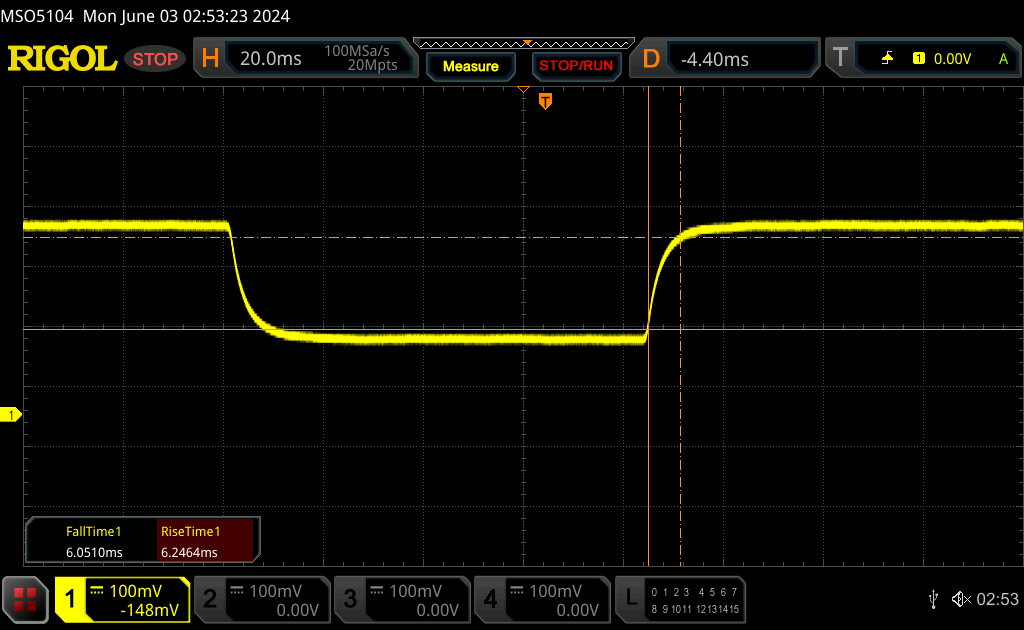 |
| ↘ 6.1 ms fall | ||
| The screen shows good response rates in our tests, but may be too slow for competitive gamers. In comparison, all tested devices range from 0.165 (minimum) to 636 (maximum) ms. » 23 % of all devices are better. This means that the measured response time is better than the average of all tested devices (32.5 ms). | ||
Screen Flickering / PWM (Pulse-Width Modulation)
| Screen flickering / PWM not detected | 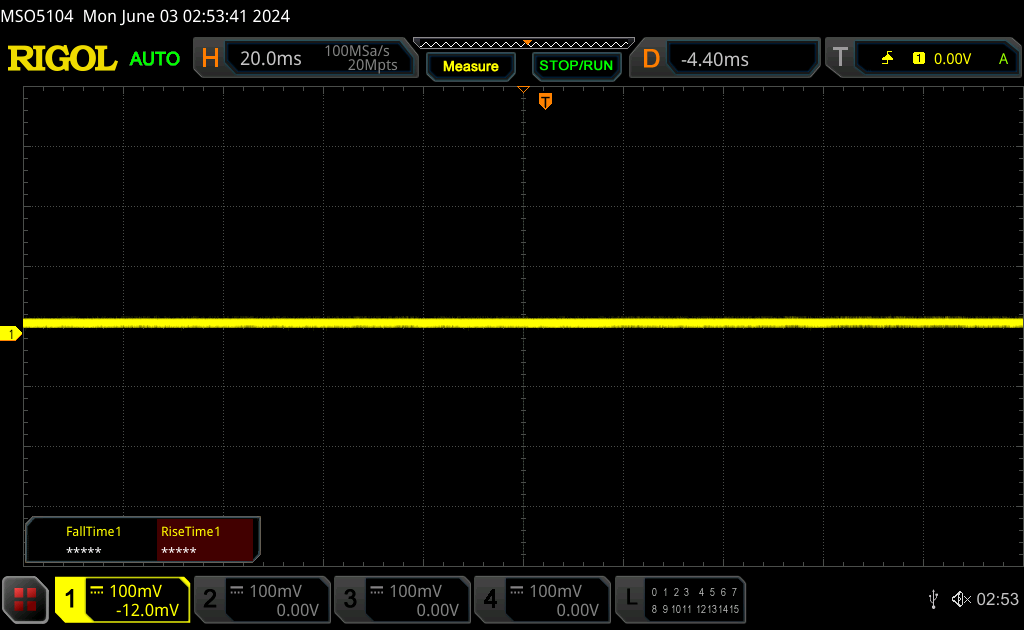 | ||
In comparison: 53 % of all tested devices do not use PWM to dim the display. If PWM was detected, an average of 8492 (minimum: 5 - maximum: 343500) Hz was measured. | |||


性能 - 全能型多媒体游戏机
测试条件
在运行下面的基准测试之前,我们将联想 Vantage 设置为性能模式,将 Nvidia 设置为 dGPU 模式。
请注意,虽然 GPU 可以设置为独立模式,但 Nvidia 控制面板上并没有 "仅限 iGPU "模式。
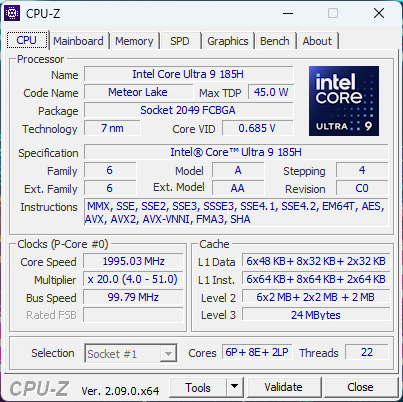
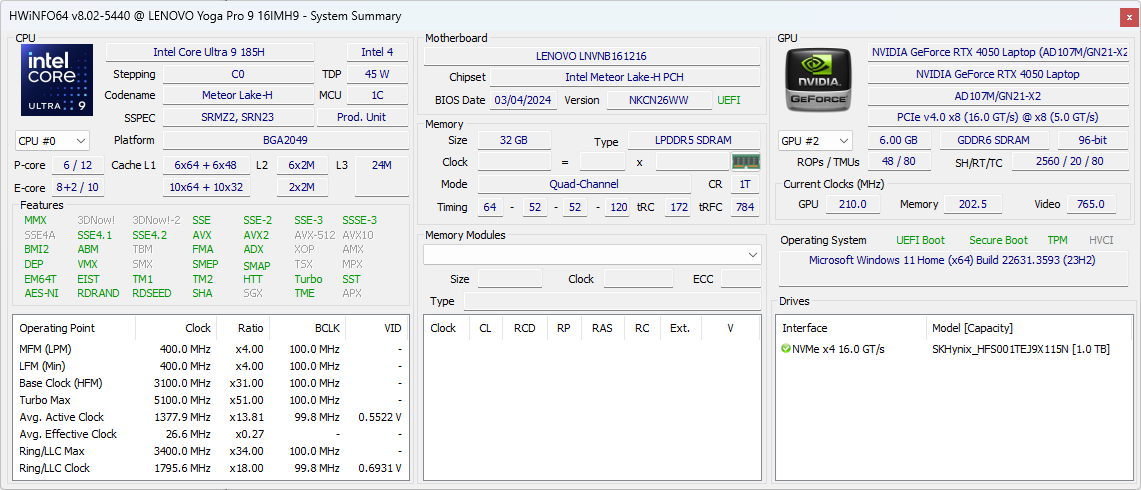
处理器
核心 Core Ultra 9 185H在我们的 RTX 4050 配置中,其性能与更高端的 RTX 4070 配置中的同款 CPU 相差不到 3 个百分点。它的性能比即将推出的 酷睿 i7-13900H更快的性能,同时还集成了用于人工智能加速任务的 NPU。降级到 酷睿至尊 7 155H配置预计只会对性能产生 5% 至 10% 的影响。 戴尔 XPS 16 9640.
Cinebench R15 Multi Loop
Cinebench R23: Multi Core | Single Core
Cinebench R20: CPU (Multi Core) | CPU (Single Core)
Cinebench R15: CPU Multi 64Bit | CPU Single 64Bit
Blender: v2.79 BMW27 CPU
7-Zip 18.03: 7z b 4 | 7z b 4 -mmt1
Geekbench 6.4: Multi-Core | Single-Core
Geekbench 5.5: Multi-Core | Single-Core
HWBOT x265 Benchmark v2.2: 4k Preset
LibreOffice : 20 Documents To PDF
R Benchmark 2.5: Overall mean
* ... smaller is better
AIDA64: FP32 Ray-Trace | FPU Julia | CPU SHA3 | CPU Queen | FPU SinJulia | FPU Mandel | CPU AES | CPU ZLib | FP64 Ray-Trace | CPU PhotoWorxx
| Performance Rating | |
| Lenovo Yoga Pro 9 16IMH9 | |
| Lenovo Yoga Pro 9 16IMH9 RTX 4050 | |
| Dell XPS 16 9640 | |
| HP Envy x360 2-in-1 16-ad0097nr | |
| Average Intel Core Ultra 9 185H | |
| Asus VivoBook Pro 16 K6602VU | |
| Samsung Galaxy Book4 Ultra | |
压力测试
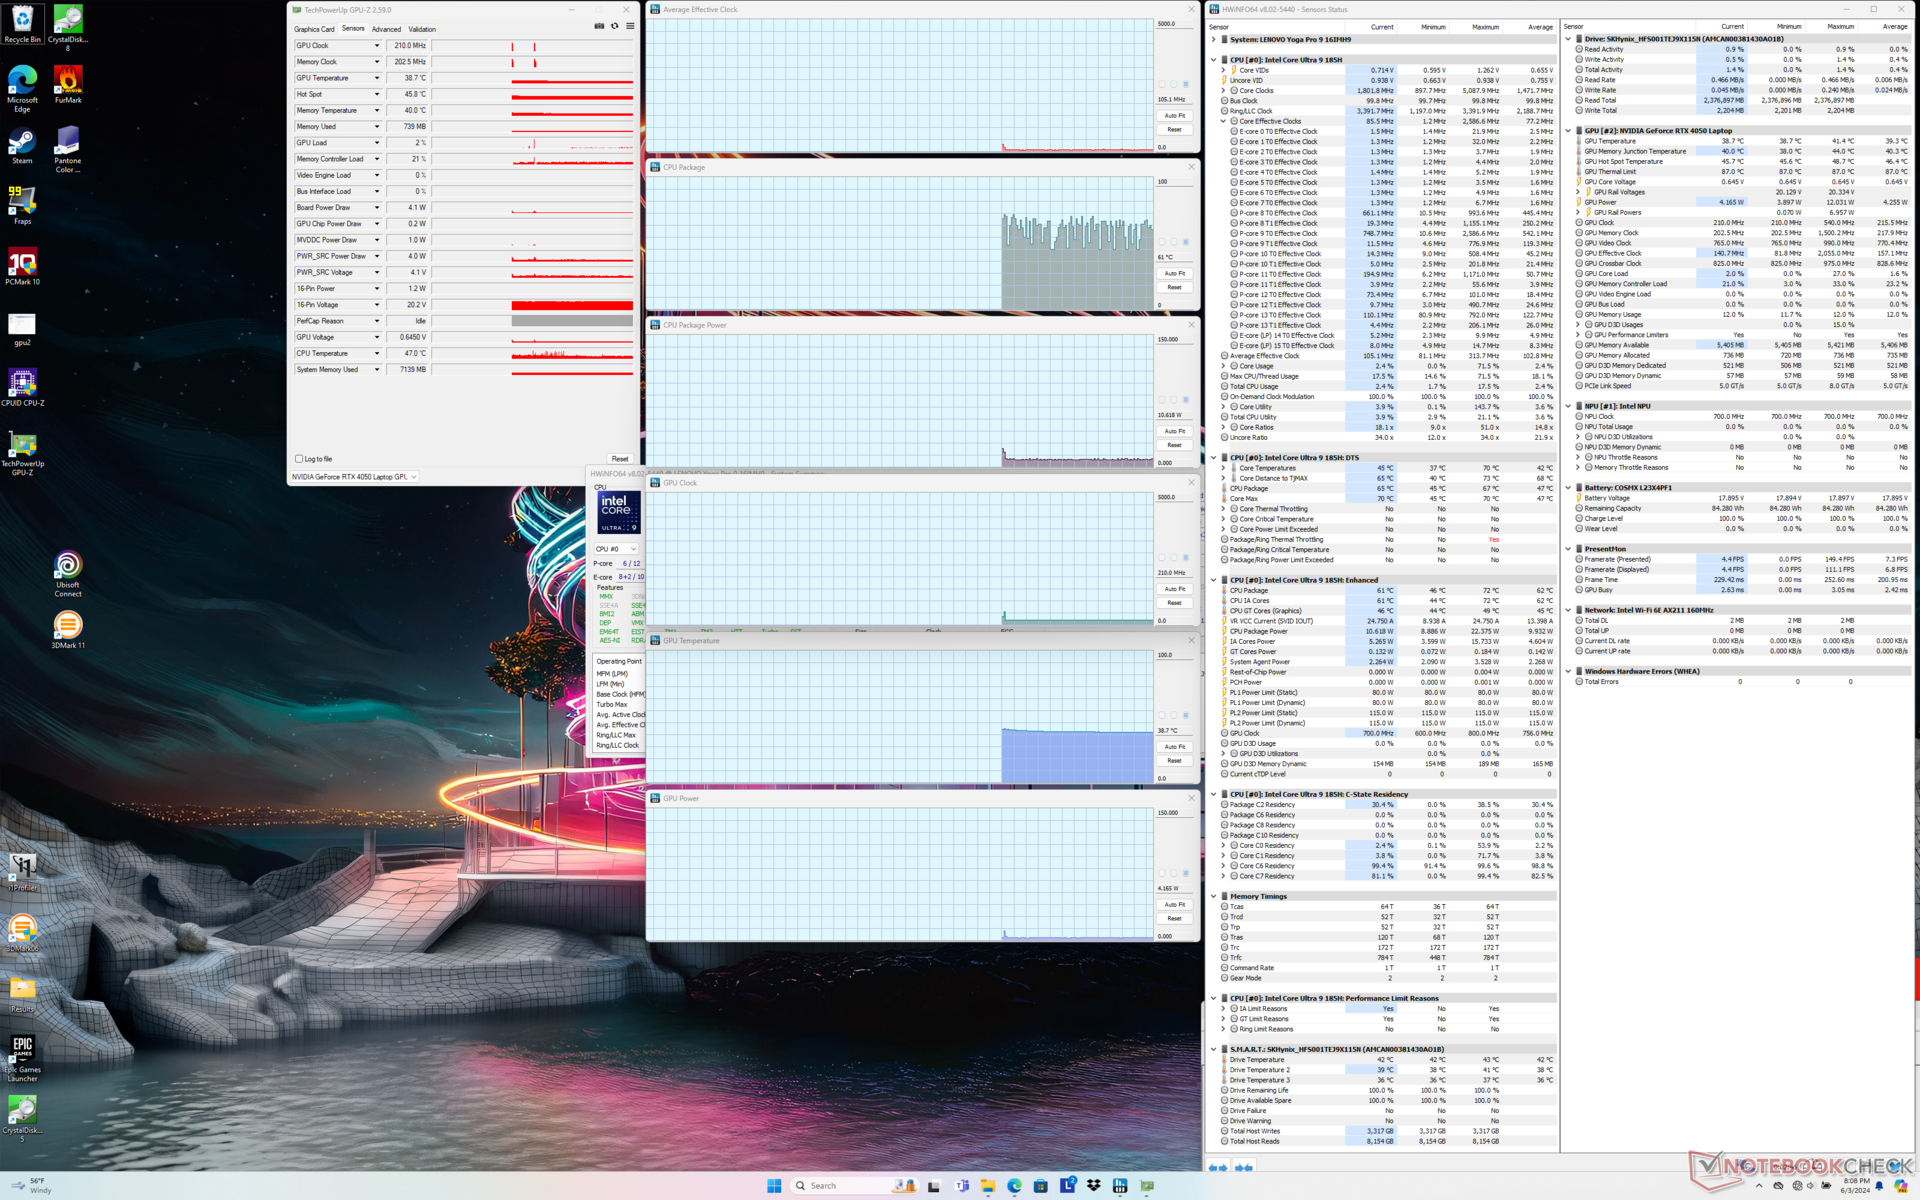
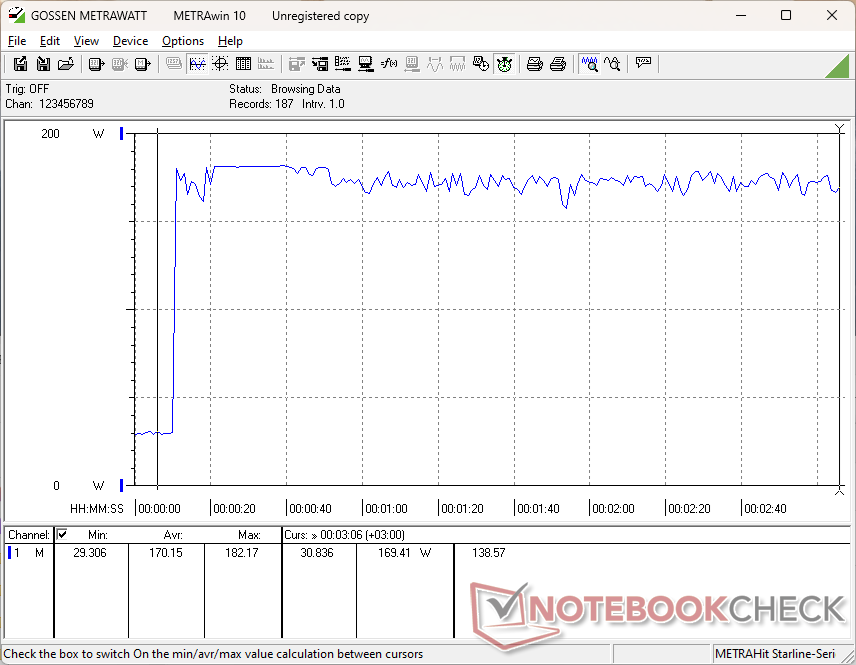
在启动 Prime95 压力模式后,CPU 会提升至 3.6 GHz、100 C 和 120 W,然后在大约 70 秒后下降并稳定在 3.1 GHz、90 C 和 83 W。
如果在平衡模式而非性能模式下运行,图形性能会受到影响,这与下面的 GPU 性能结果相辅相成。在性能模式下运行时,Nvidia GPU 的频率为 2855 MHz,功耗为 78 W。 Witcher 3而在平衡模式下则为 2385 MHz 和 63 W。在性能模式下,GPU 的温度也会更高。
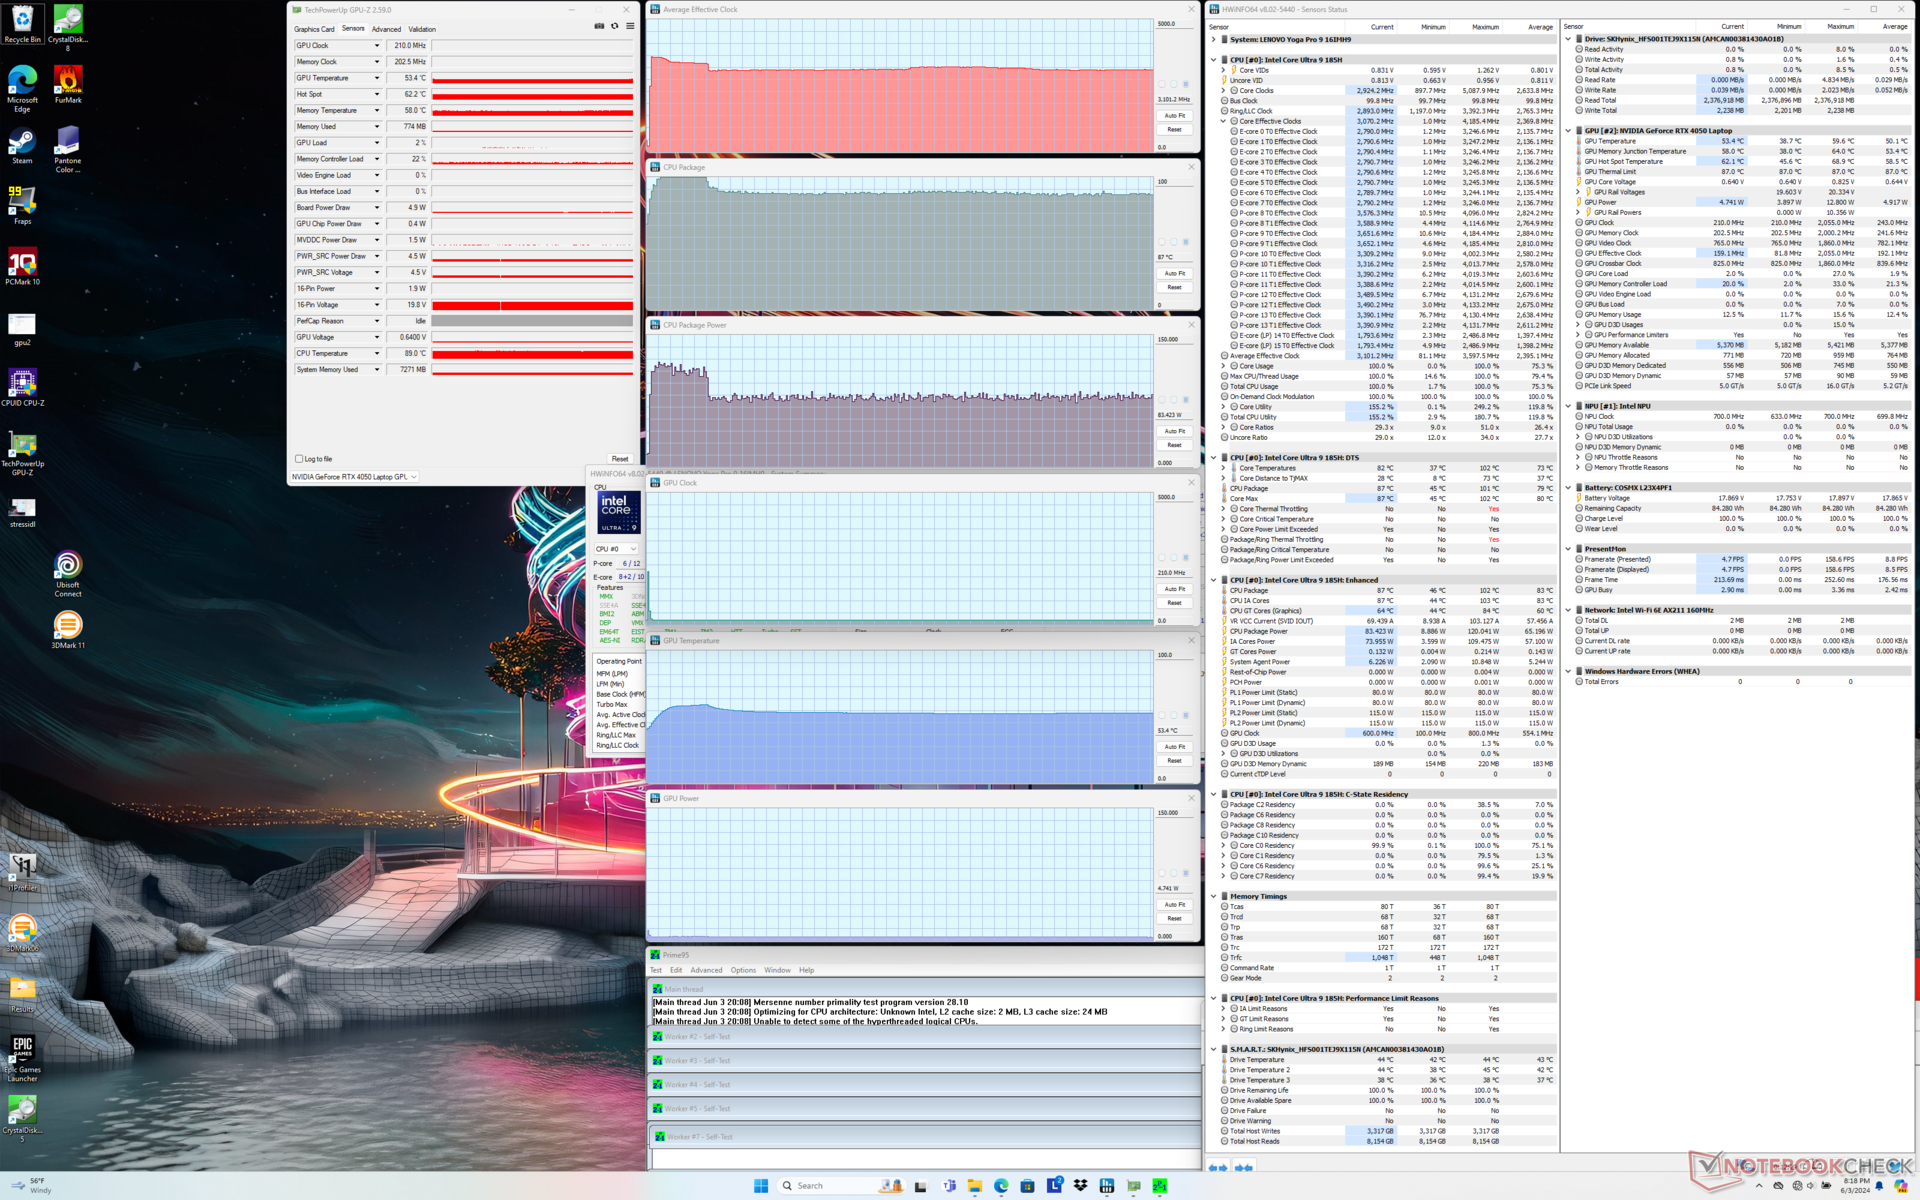
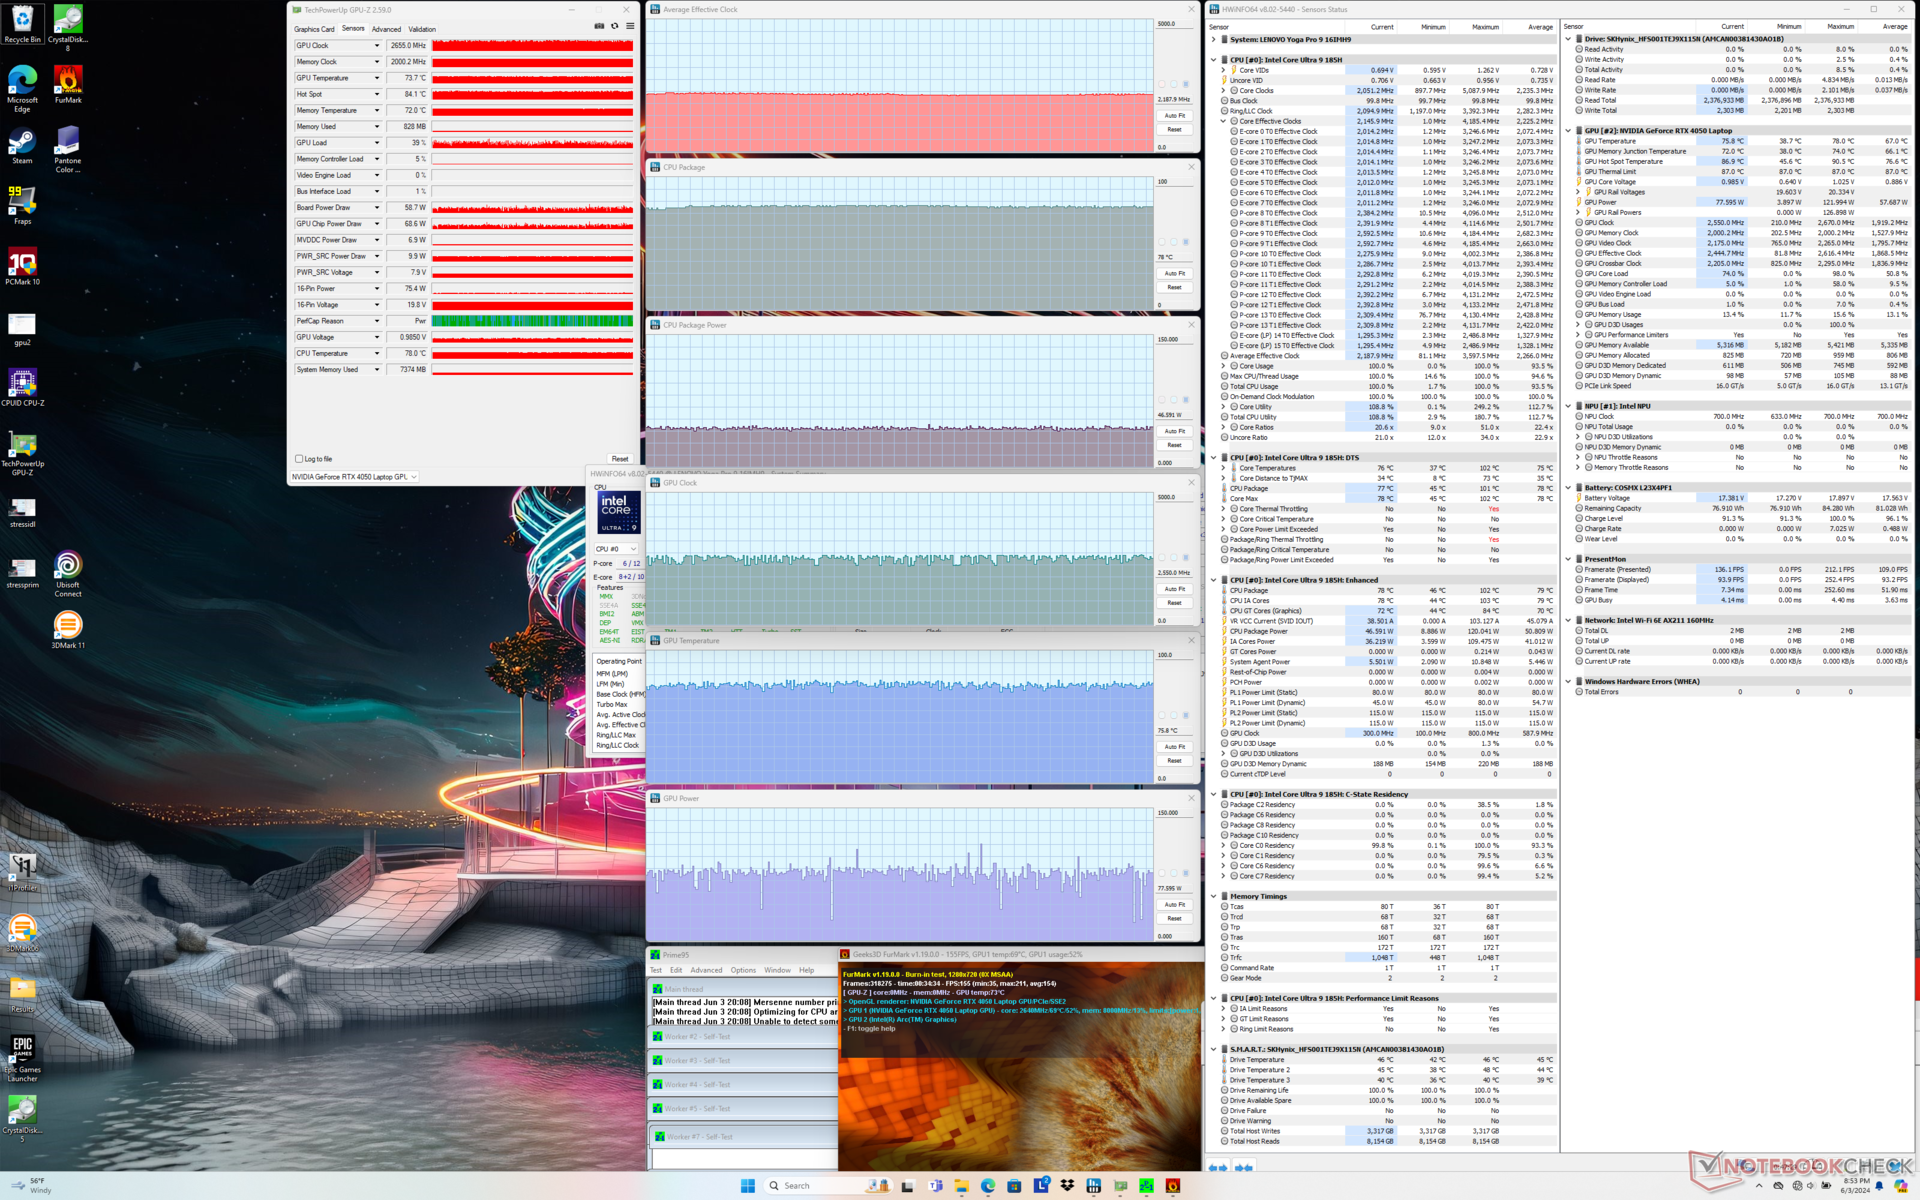
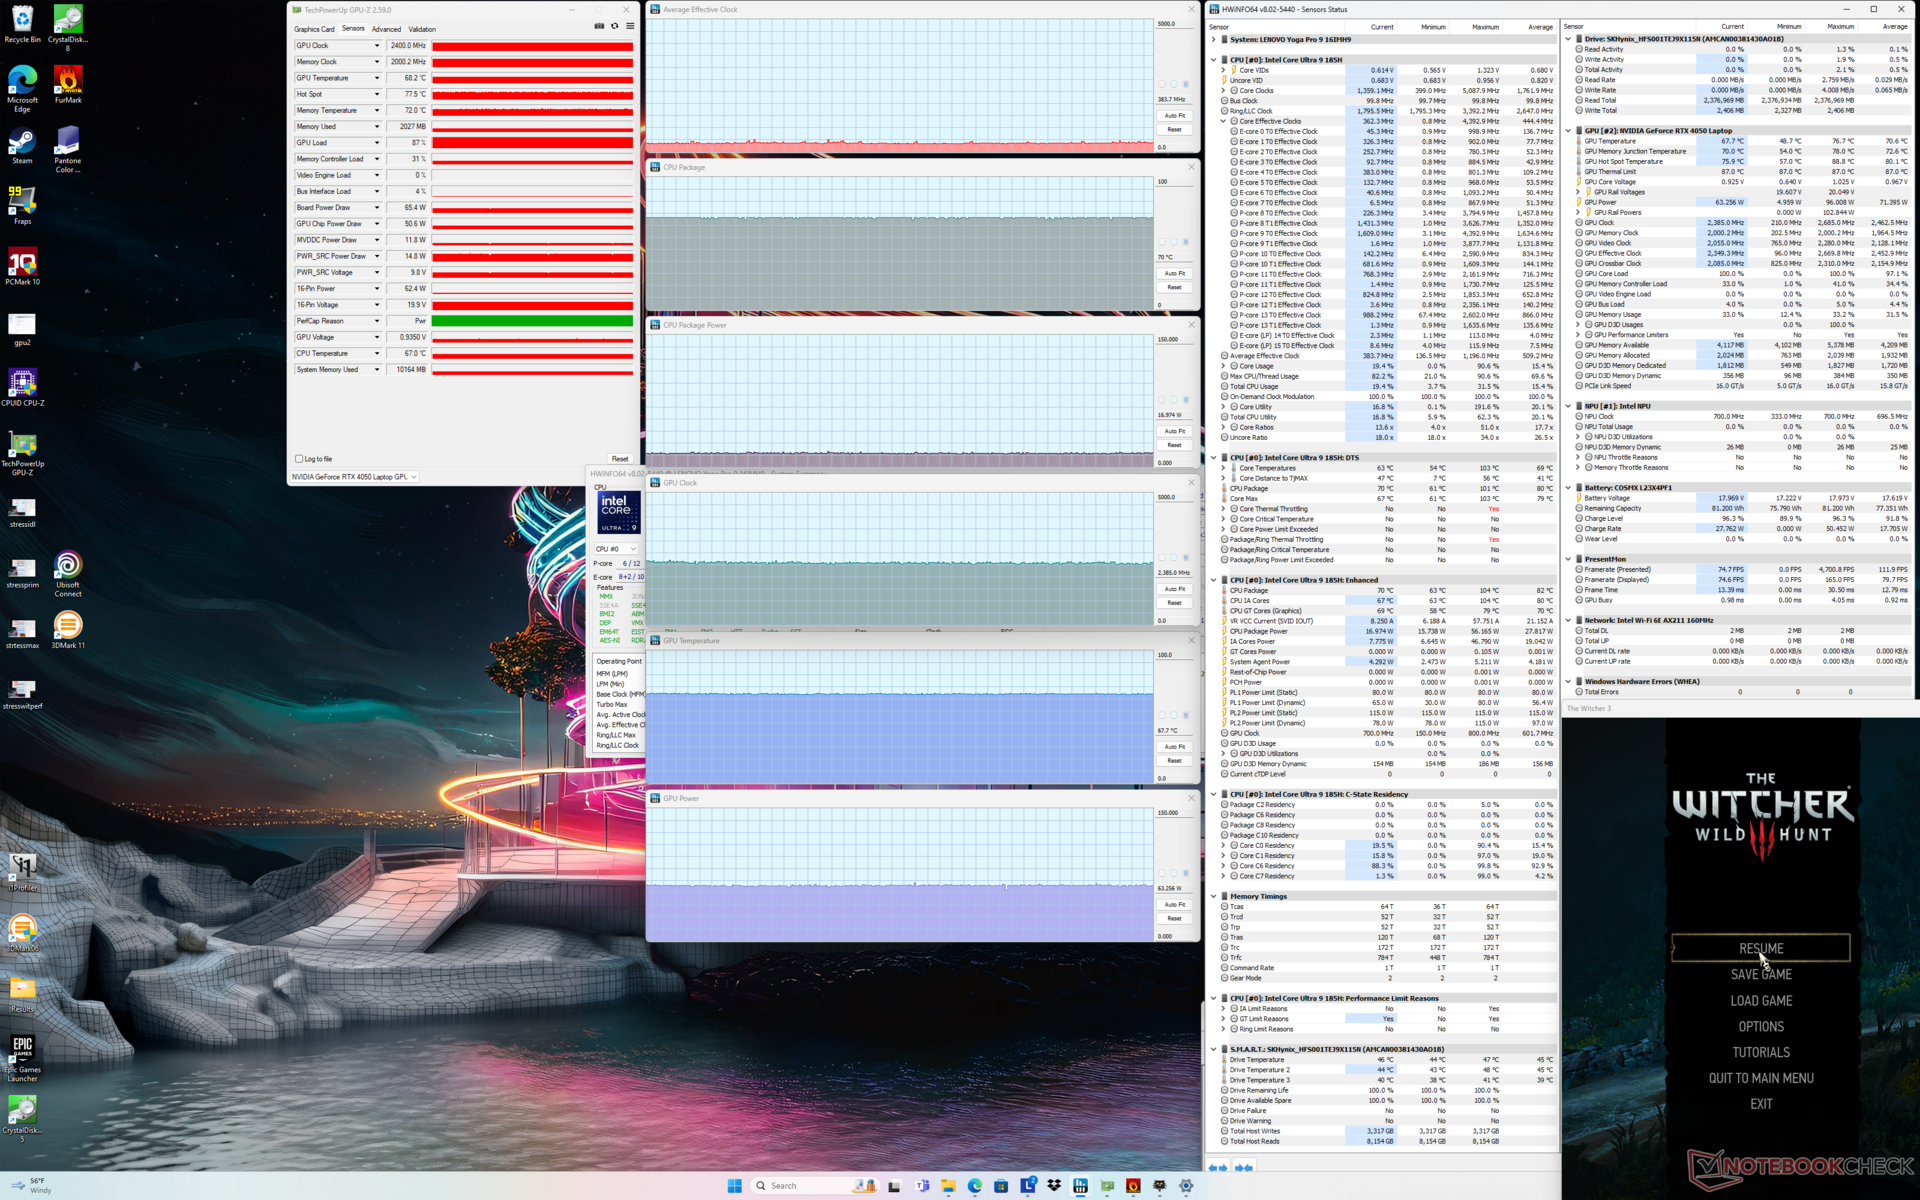

| 平均 CPU 时钟 (GHz) | GPU 时钟 (MHz) | 平均 CPU 温度 (°C) | 平均 GPU 温度(°C) | |
| 系统闲置 | -- | -- | 61 | 39 |
| Prime95 压力 | 3.1 | -- | 87 | 53 |
| Prime95 + FurMark 压力 | 2.2 | 2550 | 78 | 76 |
| Witcher 3 压力(平衡模式) | 0.4 | 2385 | 70 | 68 |
| Witcher 3 压力(性能模式) | 0.7 | 2655 | 99 | 76 |
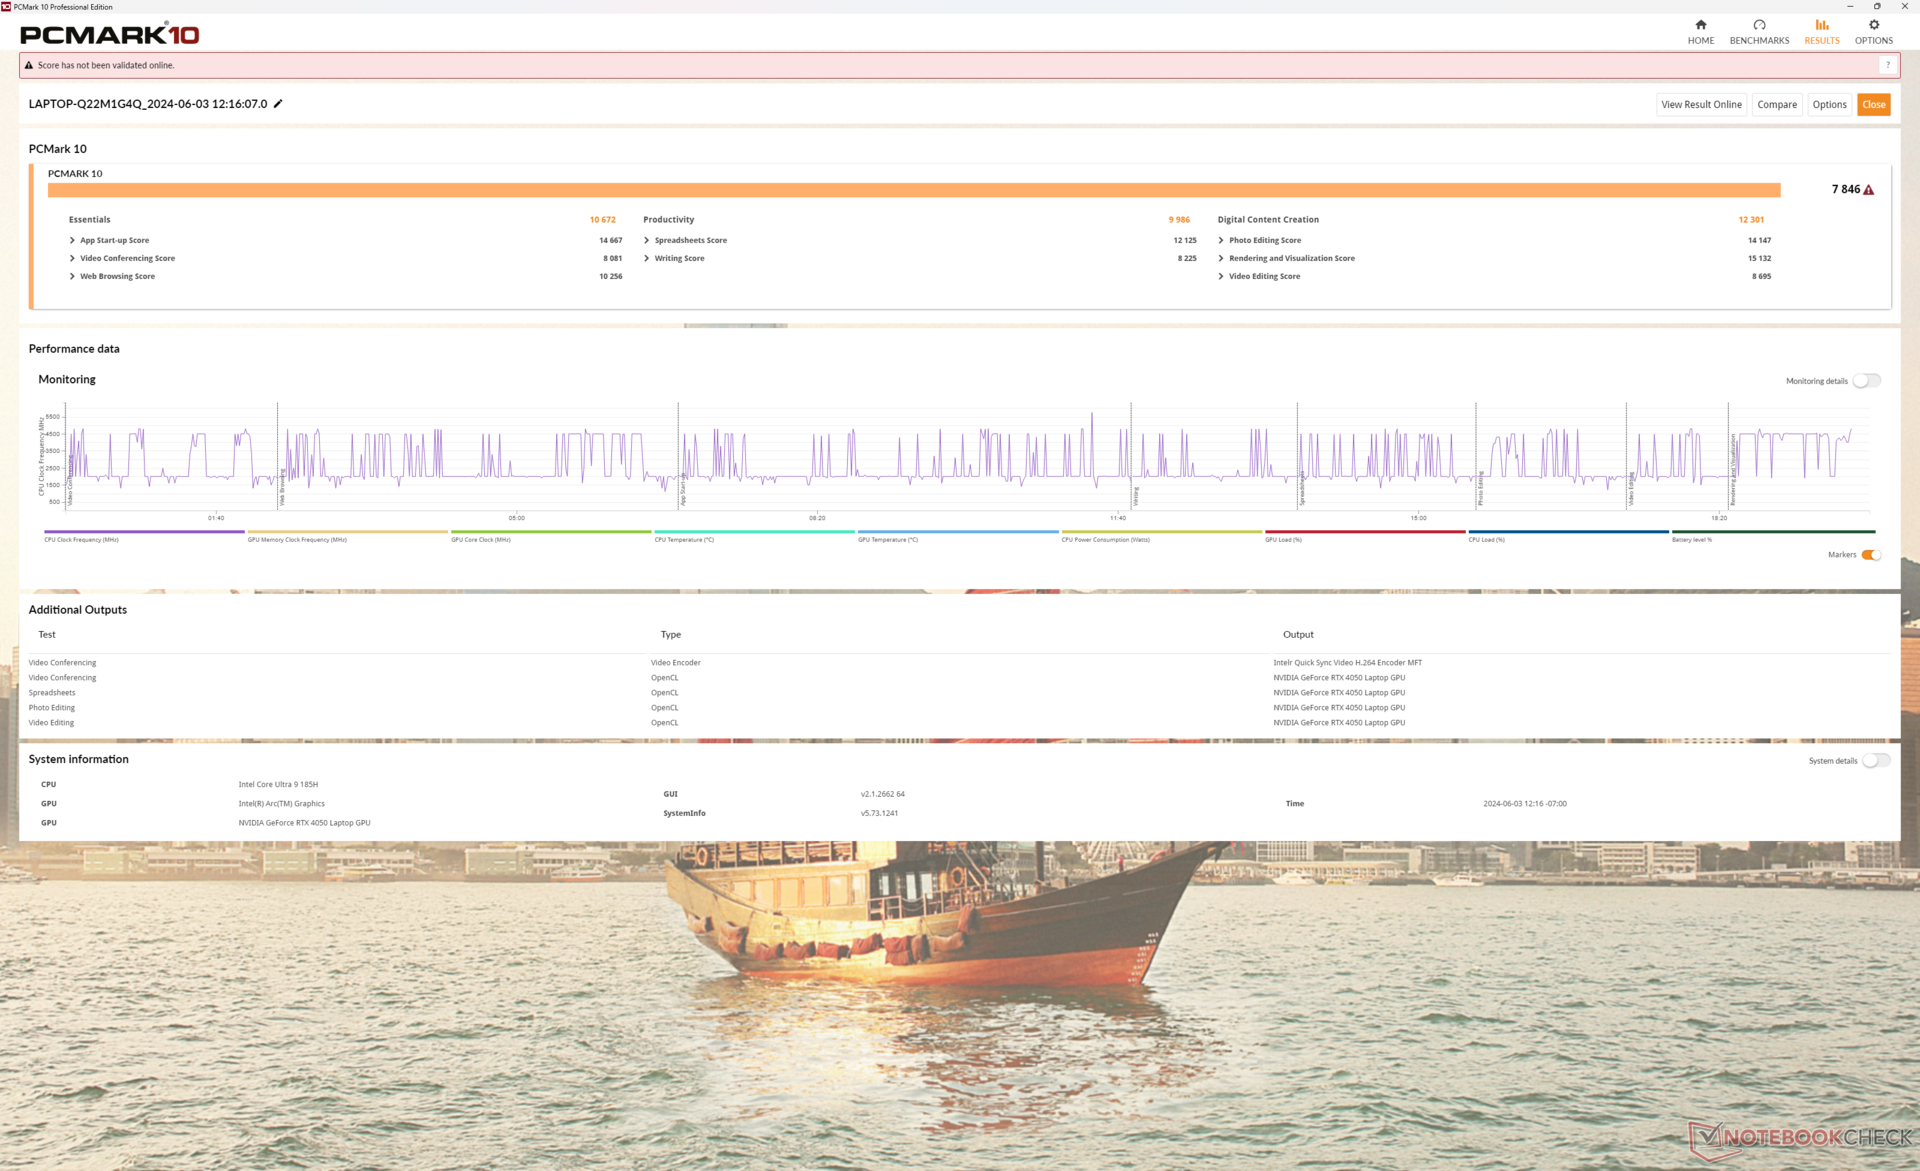
系统性能
PCMark 分数与大多数其他多媒体笔记本电脑相当,表明联想在大多数日常工作负载或编辑任务中的速度并不明显较慢,尽管我们采用了较低端的 RTX 4050 配置。
CrossMark: Overall | Productivity | Creativity | Responsiveness
WebXPRT 3: Overall
WebXPRT 4: Overall
Mozilla Kraken 1.1: Total
| PCMark 10 / Score | |
| Lenovo Yoga Pro 9 16IMH9 RTX 4050 | |
| Average Intel Core Ultra 9 185H, NVIDIA GeForce RTX 4050 Laptop GPU (7431 - 7846, n=2) | |
| Lenovo Yoga Pro 9 16IMH9 | |
| Dell XPS 16 9640 | |
| Asus VivoBook Pro 16 K6602VU | |
| Samsung Galaxy Book4 Ultra | |
| HP Envy x360 2-in-1 16-ad0097nr | |
* ... smaller is better
| PCMark 10 Score | 7846 points | |
Help | ||
| AIDA64 / Memory Copy | |
| Lenovo Yoga Pro 9 16IMH9 | |
| Lenovo Yoga Pro 9 16IMH9 RTX 4050 | |
| Dell XPS 16 9640 | |
| Samsung Galaxy Book4 Ultra | |
| Average Intel Core Ultra 9 185H (69929 - 95718, n=19) | |
| HP Envy x360 2-in-1 16-ad0097nr | |
| Asus VivoBook Pro 16 K6602VU | |
* ... smaller is better
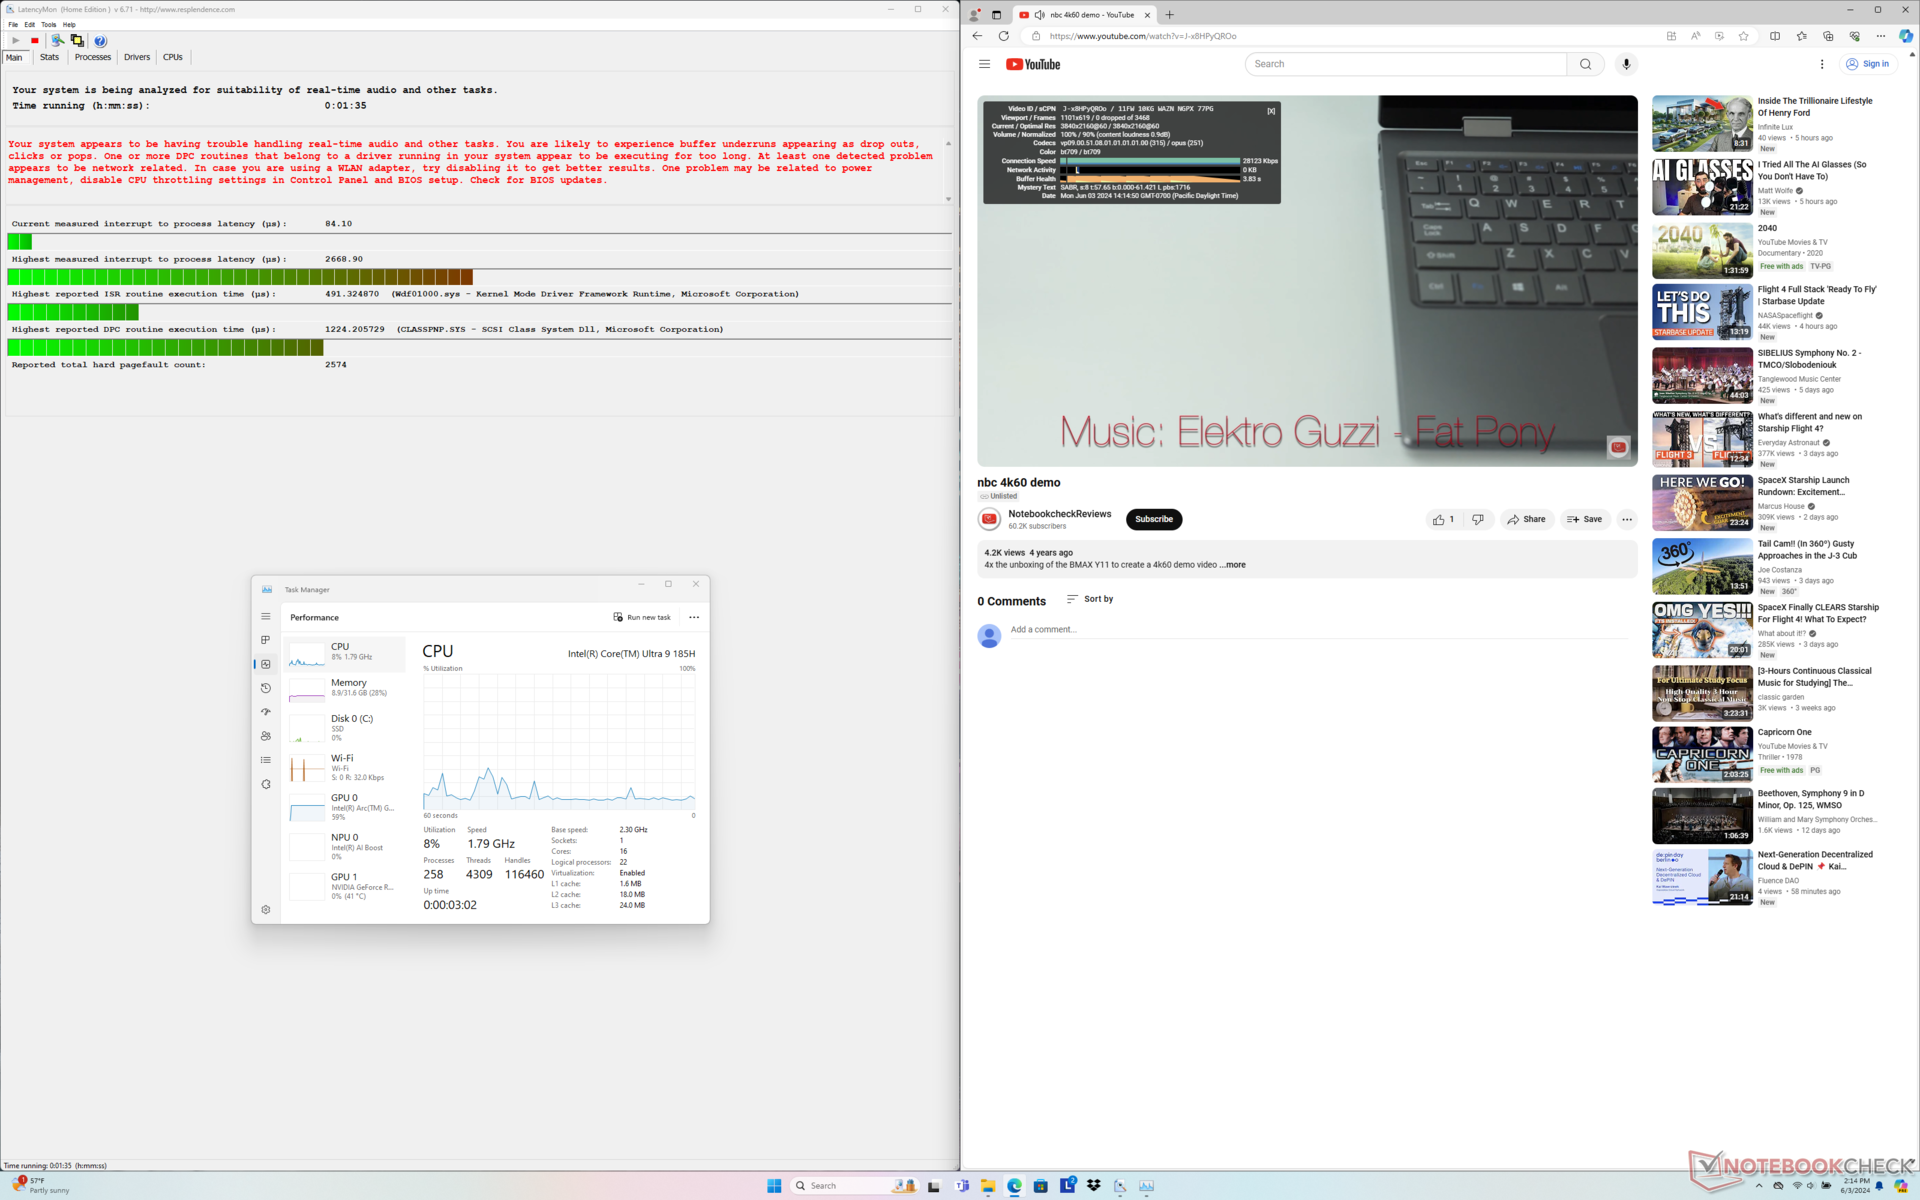
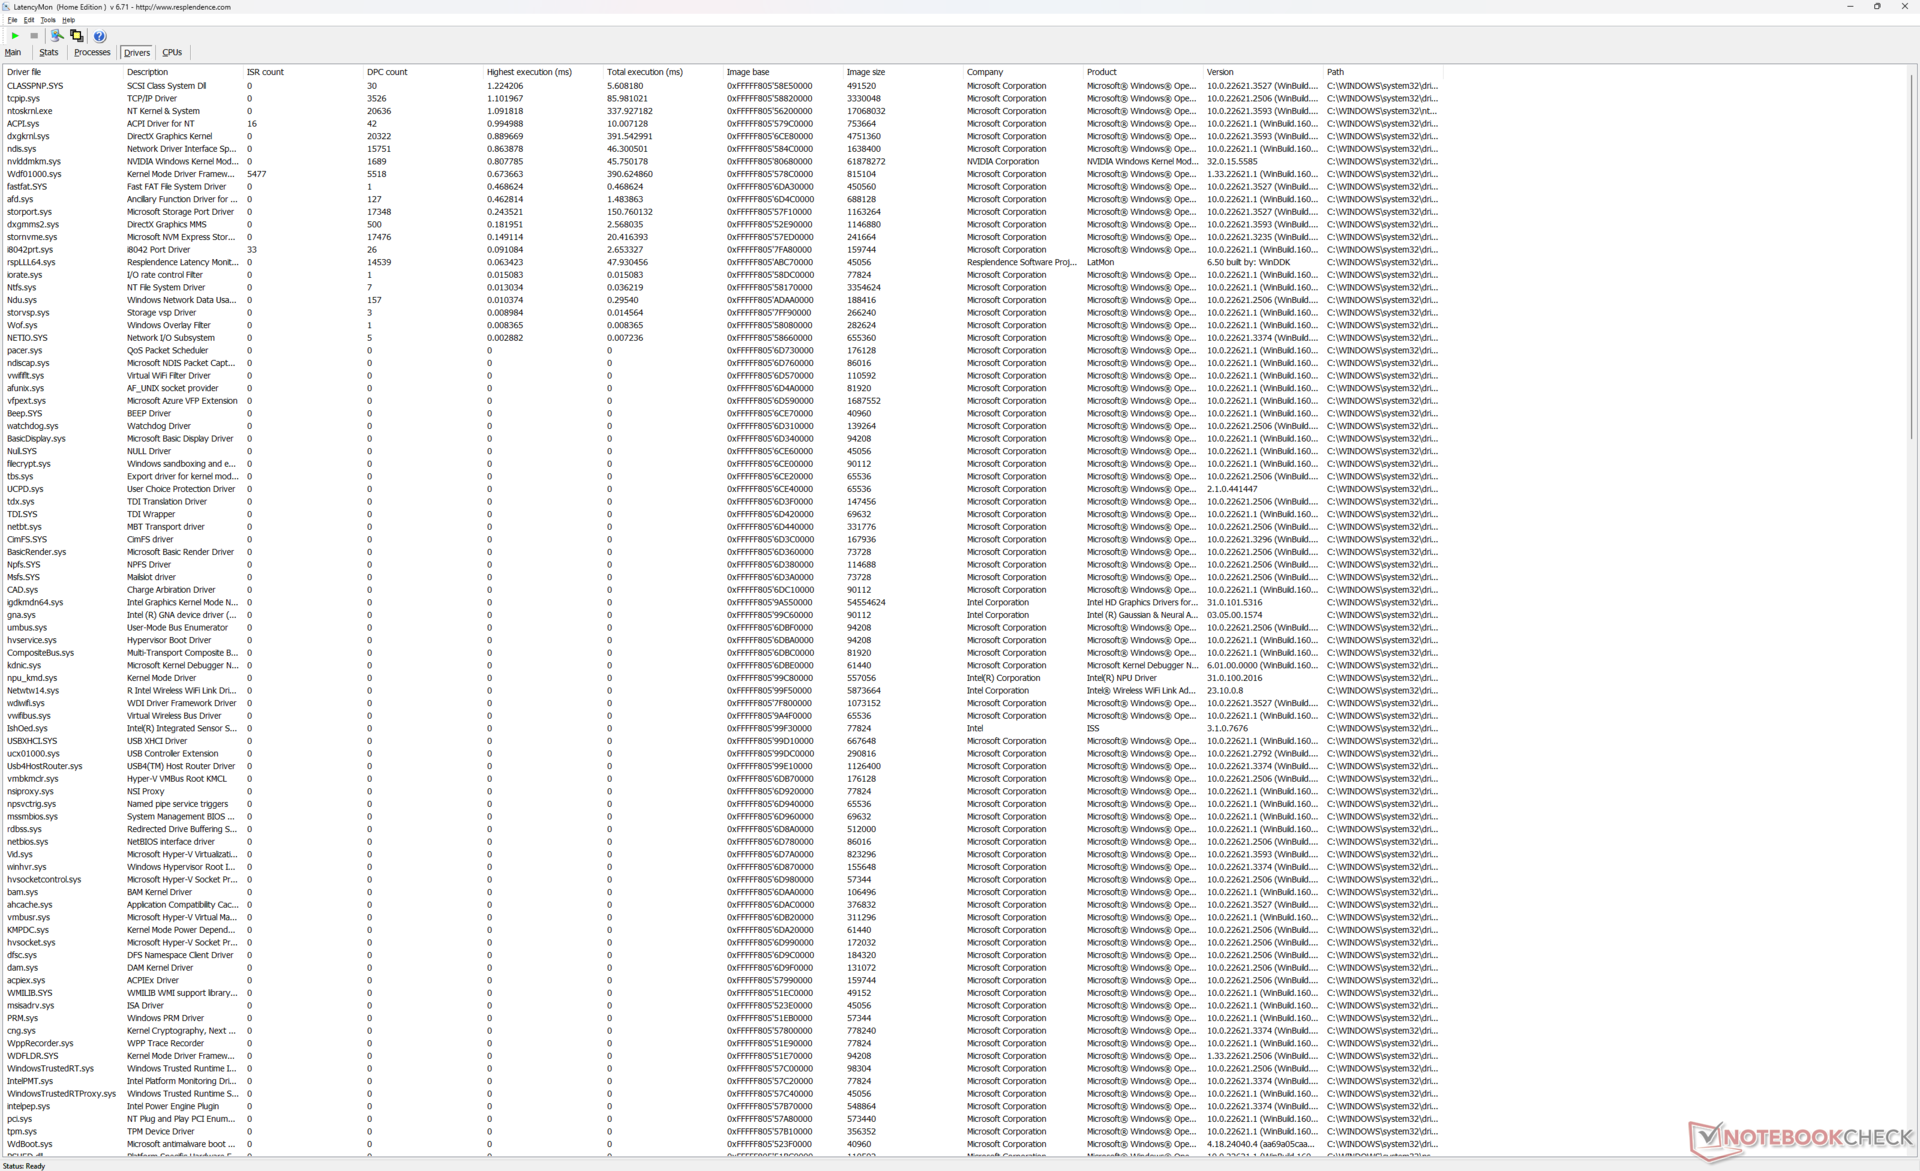
DPC 延迟
在打开我们主页的多个浏览器标签页时,LatencyMon 显示的 DPC 问题比 RTX 4070 配置更多。在其他方面,以 60 FPS 播放 4K 视频也非常完美,没有掉帧记录。
| DPC Latencies / LatencyMon - interrupt to process latency (max), Web, Youtube, Prime95 | |
| Lenovo Yoga Pro 9 16IMH9 RTX 4050 | |
| Asus VivoBook Pro 16 K6602VU | |
| HP Envy x360 2-in-1 16-ad0097nr | |
| Dell XPS 16 9640 | |
| Samsung Galaxy Book4 Ultra | |
| Lenovo Yoga Pro 9 16IMH9 | |
* ... smaller is better
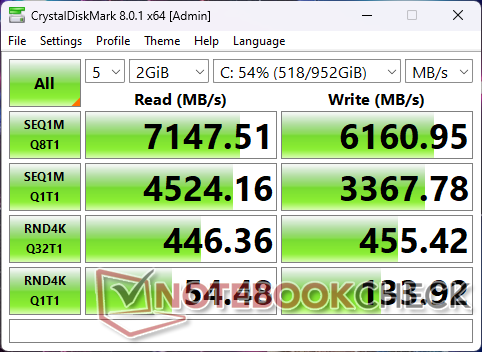
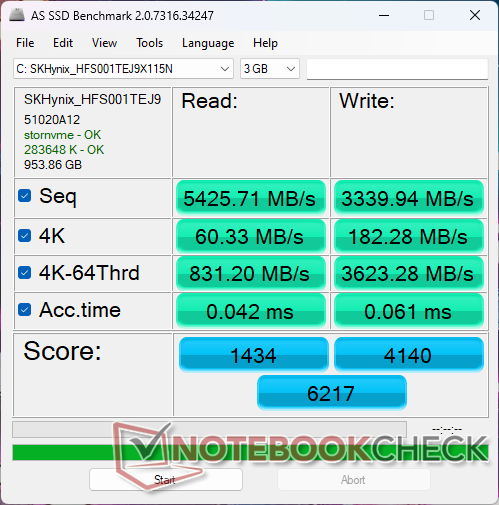
存储设备
联想出货量相同 SK Hynix HFS001TEJ9X115NPCIe4 NVMe 固态硬盘。

| Drive Performance Rating - Percent | |
| Dell XPS 16 9640 | |
| Samsung Galaxy Book4 Ultra | |
| Lenovo Yoga Pro 9 16IMH9 RTX 4050 | |
| Lenovo Yoga Pro 9 16IMH9 | |
| Asus VivoBook Pro 16 K6602VU | |
| HP Envy x360 2-in-1 16-ad0097nr | |
* ... smaller is better
Disk Throttling: DiskSpd Read Loop, Queue Depth 8
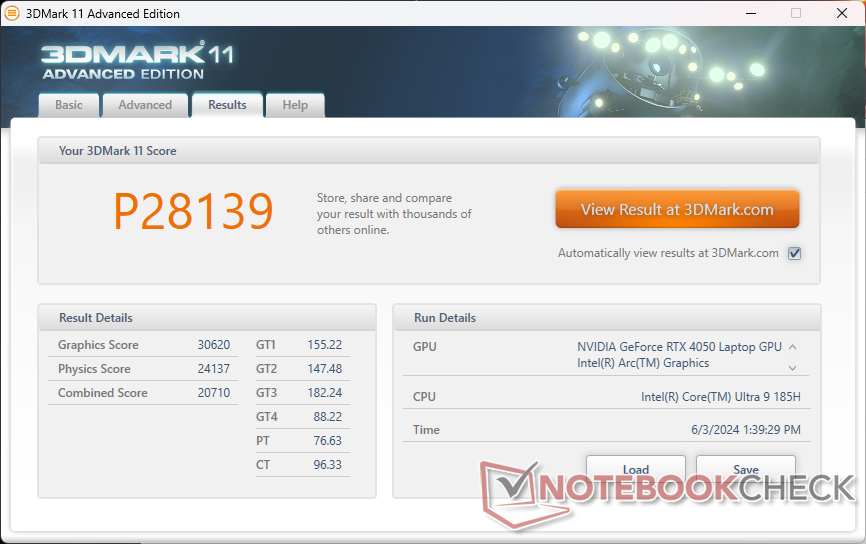
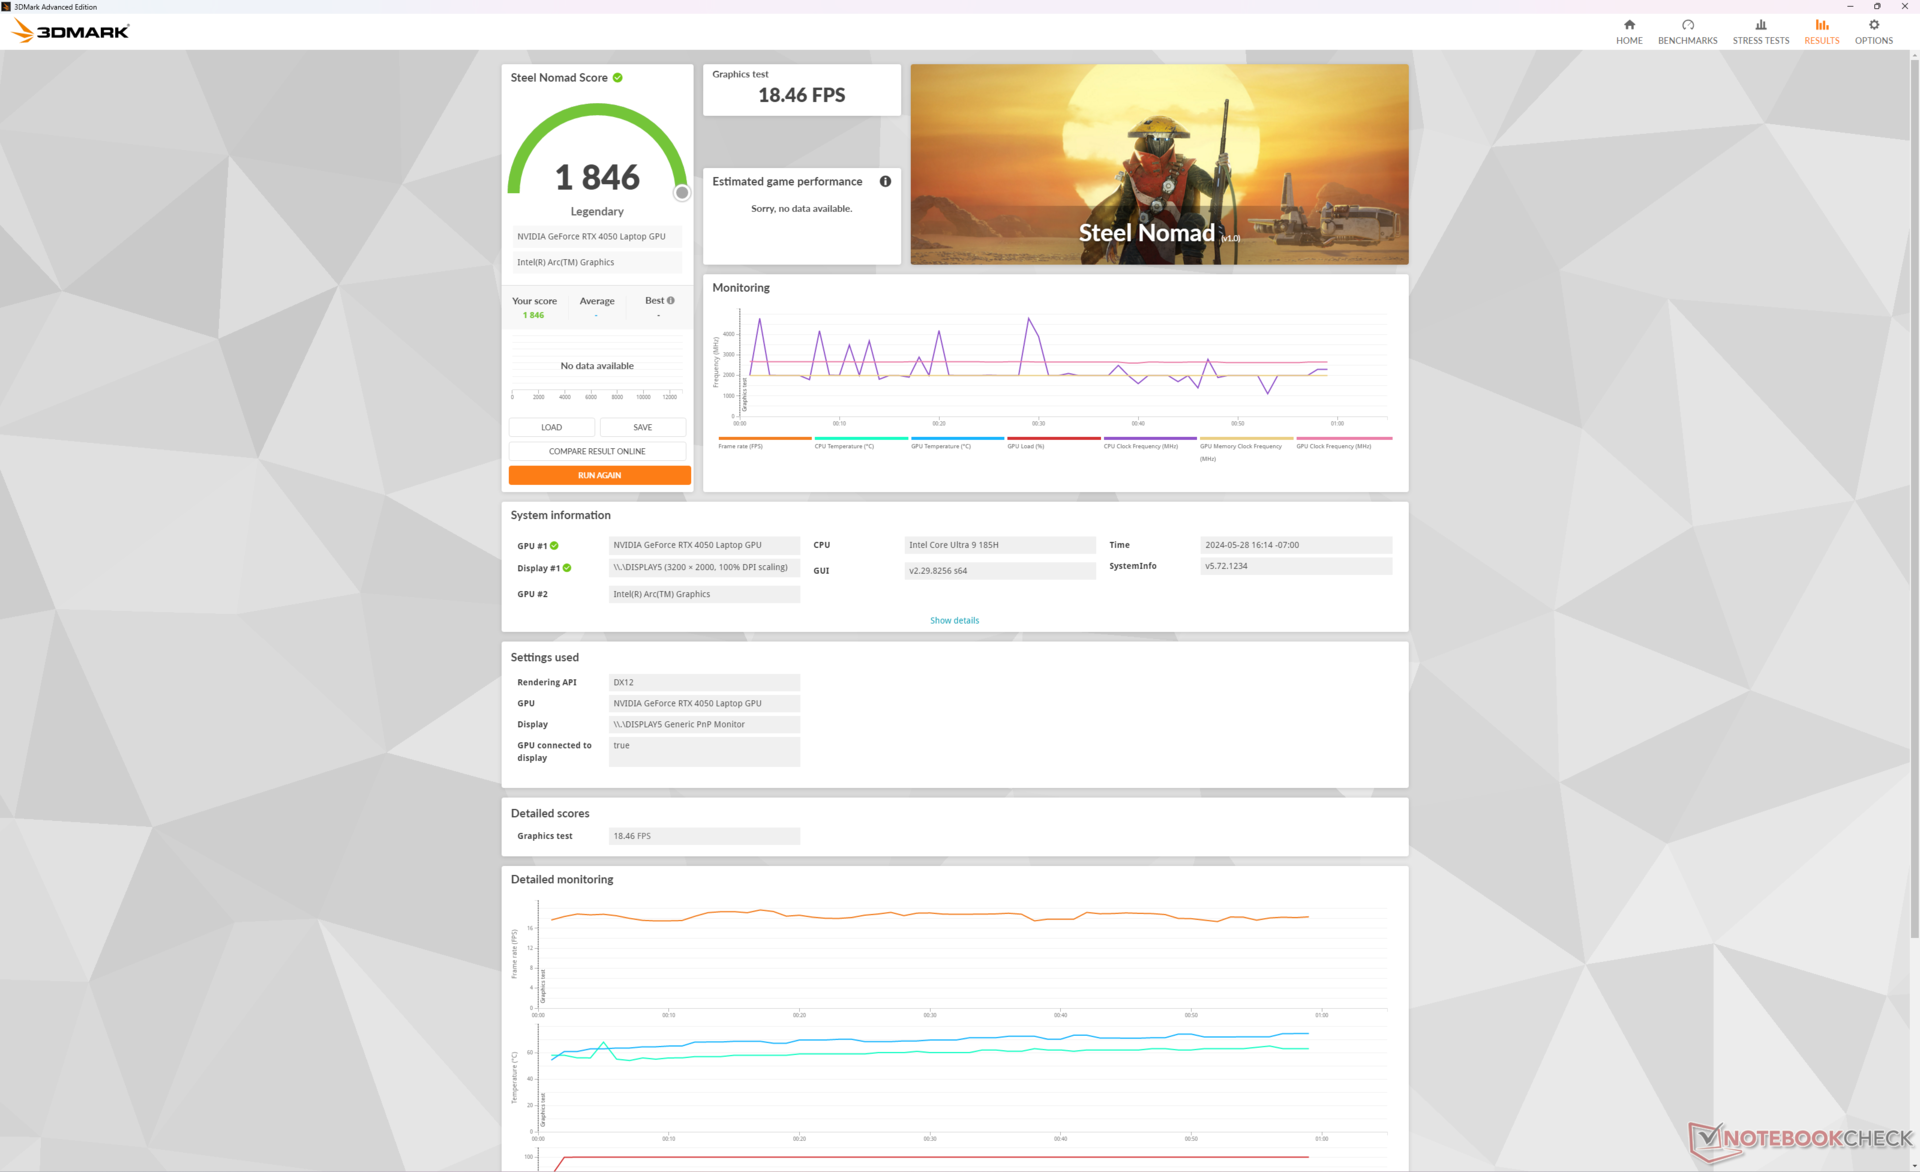
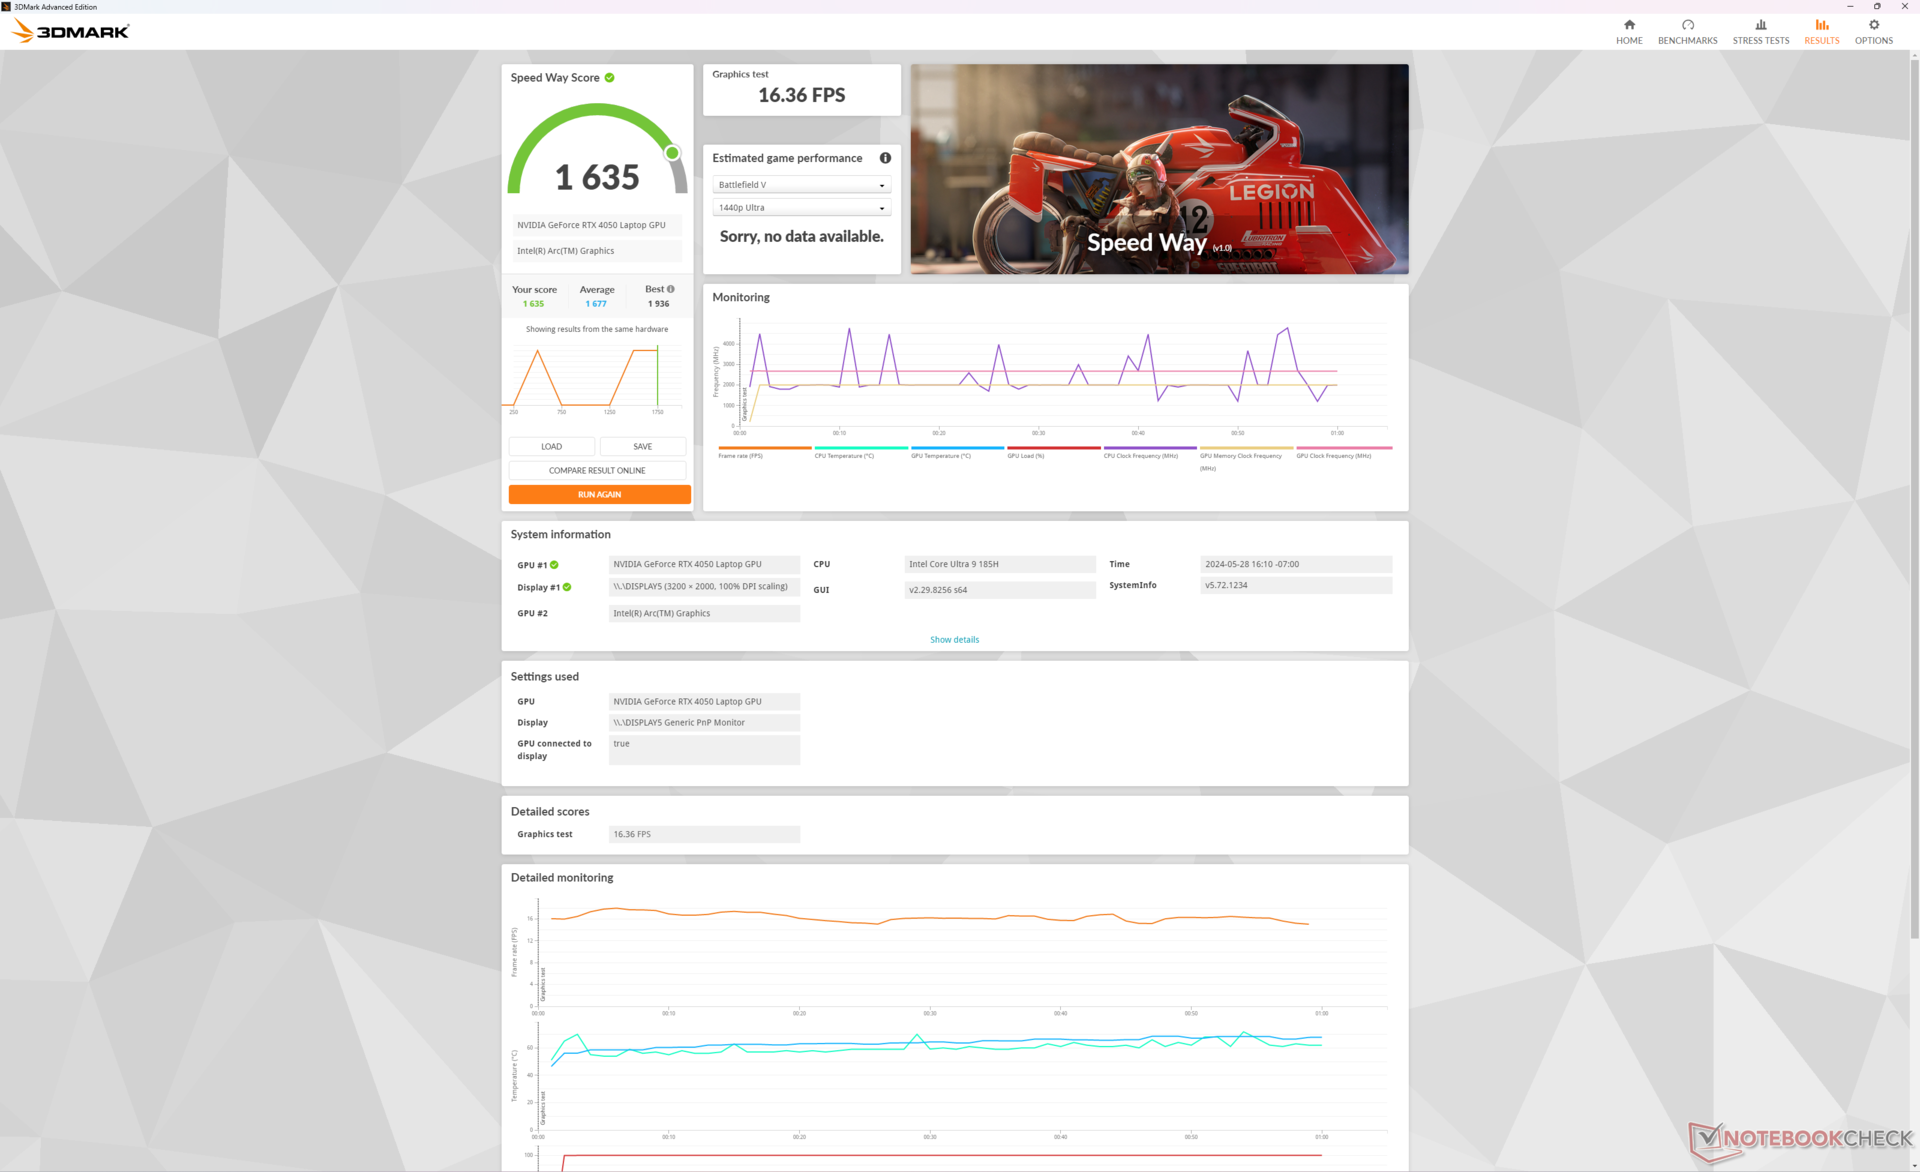
图形处理器性能
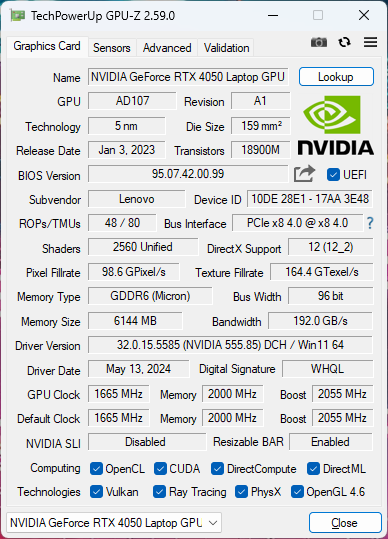
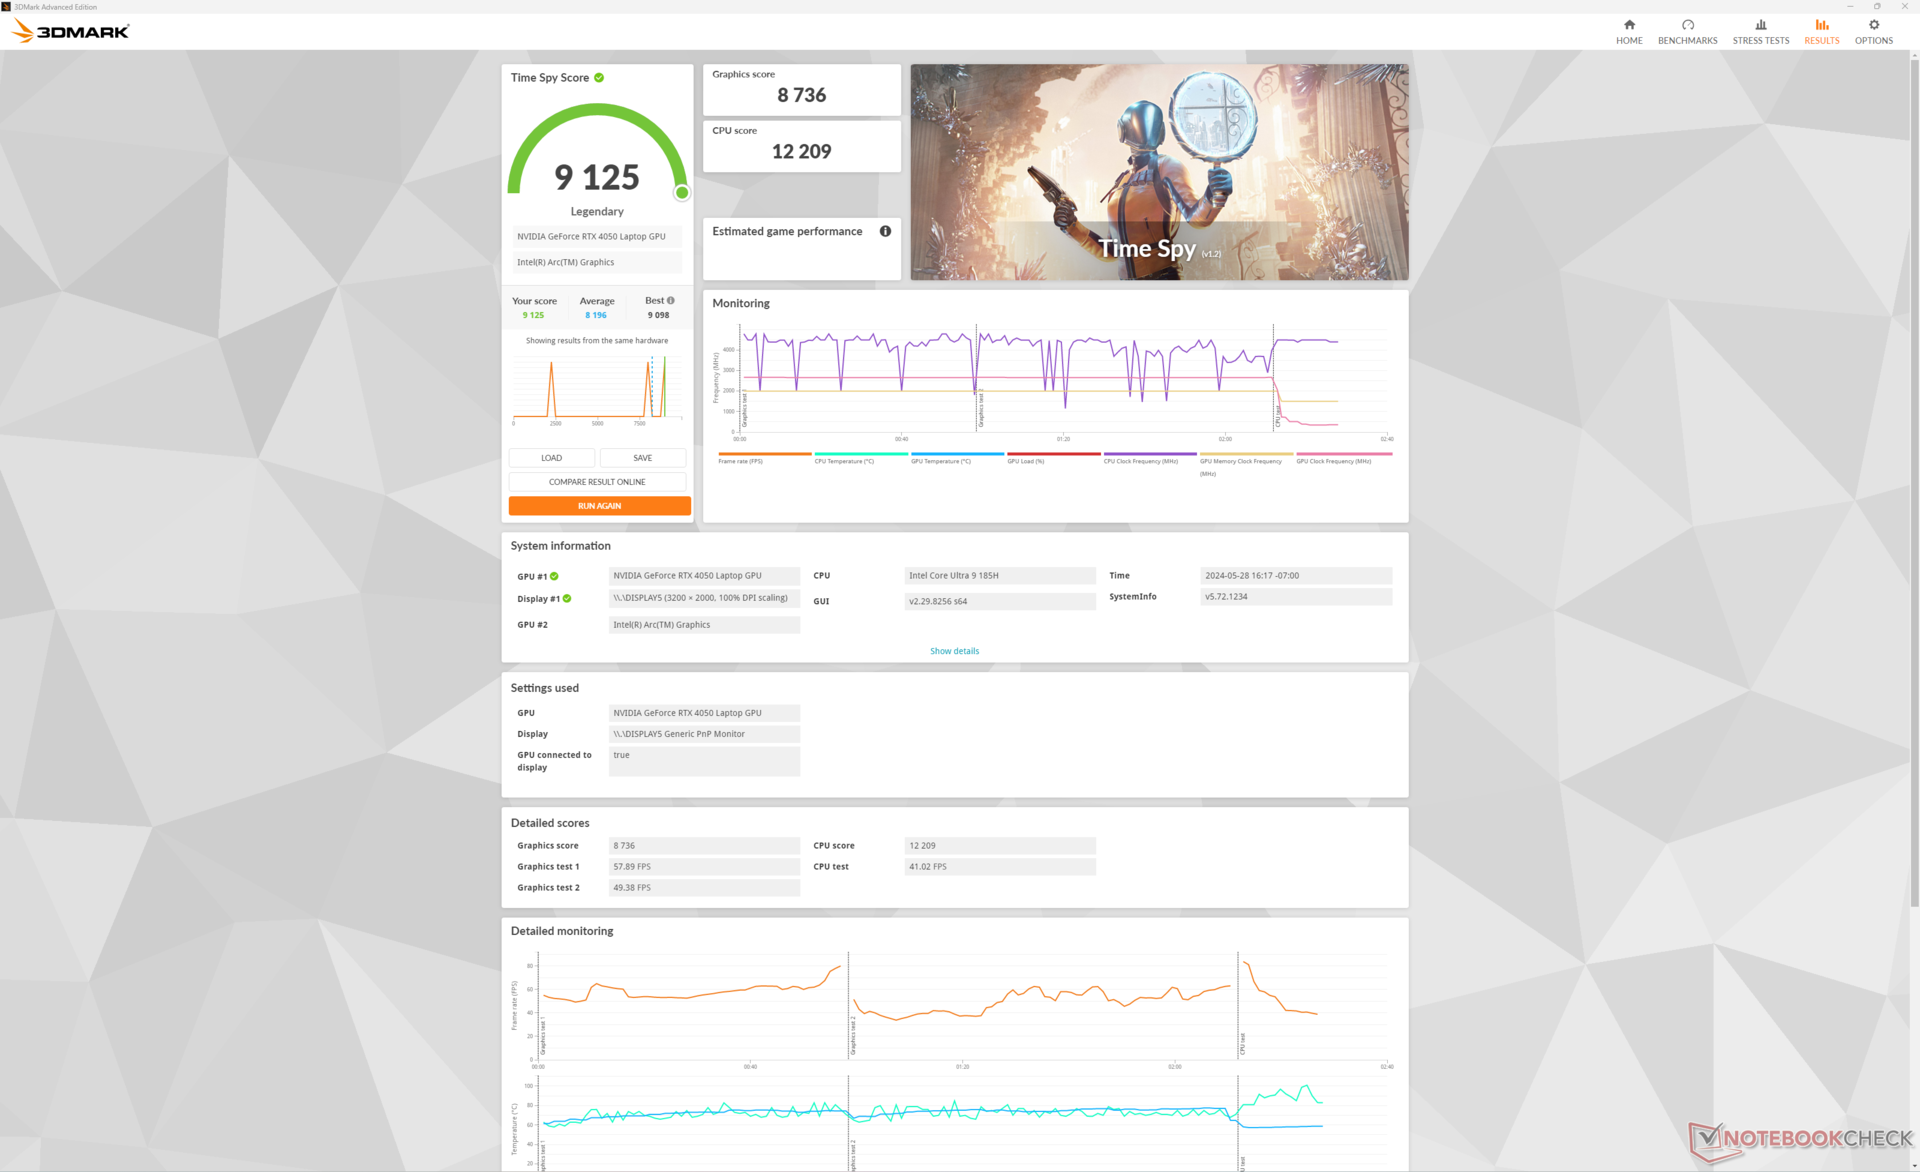
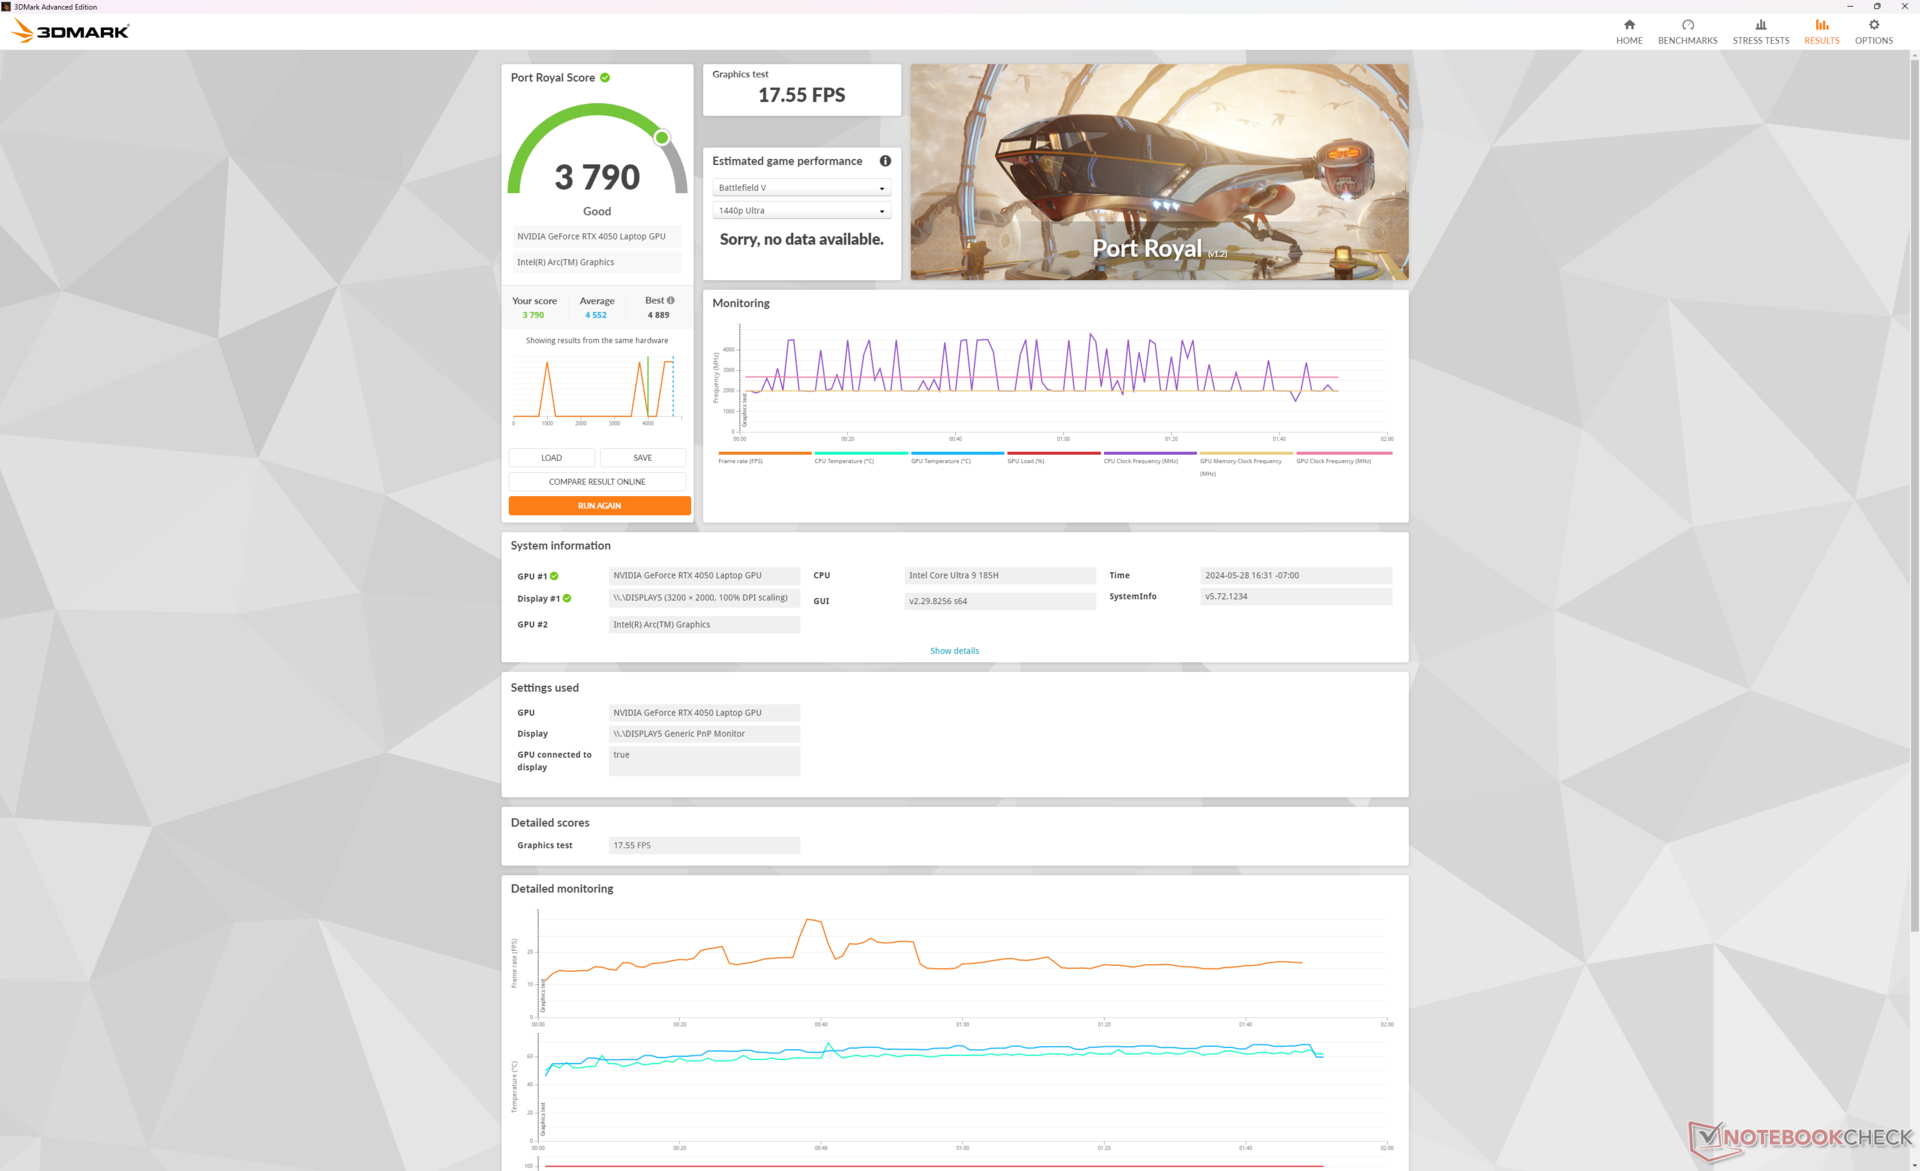
图形性能比预期的要好,3DMark 分数比我们数据库中配备相同GeForce RTX 4050 GPU 的普通笔记本电脑快 10%左右。这一优势在很大程度上归功于联想 75 W 至 100 W 的 TGP 目标值,因为采用相同 GPU 的大多数其他笔记本电脑的 TGP 上限都较低。虽然 Nvidia 控制面板声称 RTX 4050 的总显卡功耗为 100 W,但在运行游戏时,它通常会稳定在 75 W 至 85 W 左右,这在我们上面的压力测试部分得到了体现。
总体性能比RTX 4070 配置低约 25%至 30%,后者可以达到 90 瓦至 100 瓦之间的较高功率范围。这一点对于下面的功耗部分每瓦性能分析非常重要。
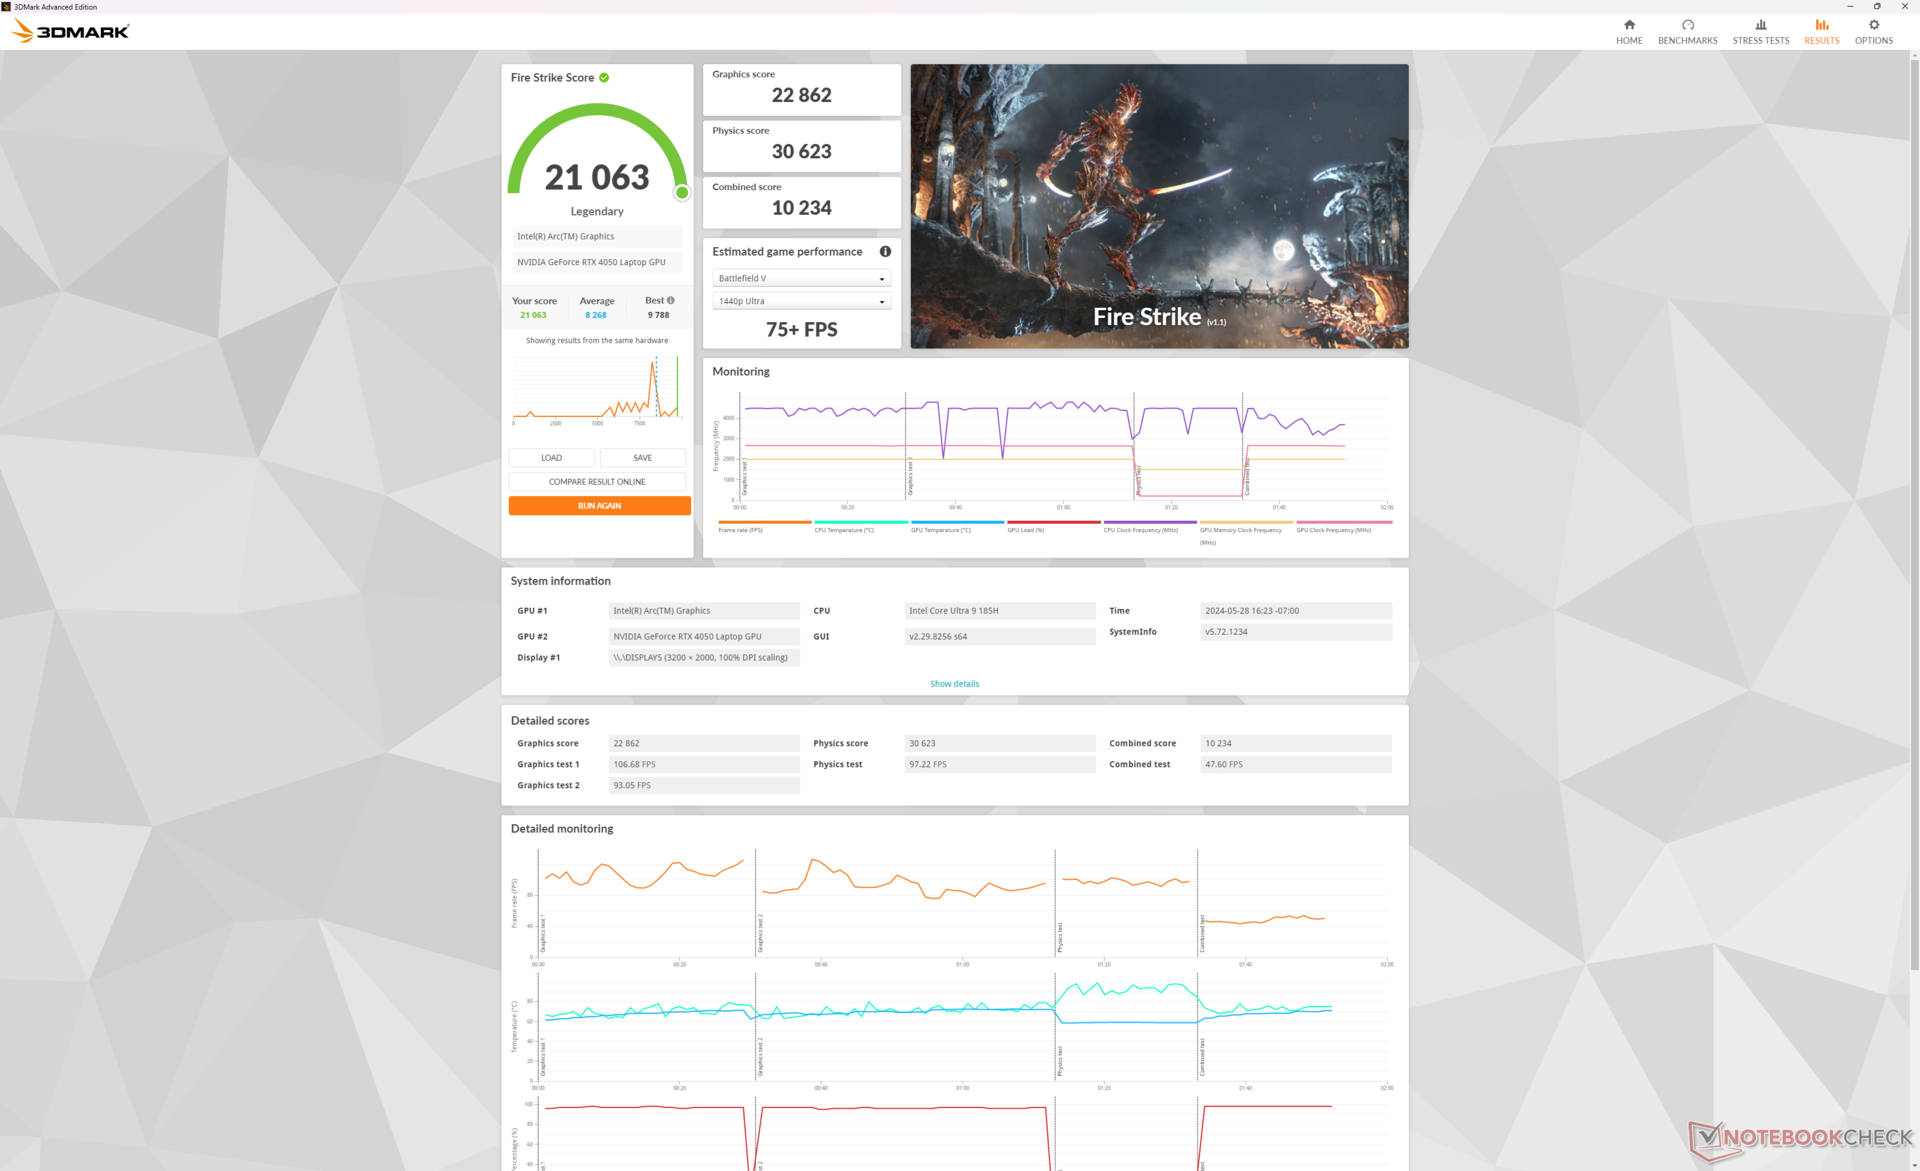
| 电源配置文件 | 图形得分 | 物理得分 | 综合得分 |
| 性能模式 | 22862 | 30623 | 10234 |
| 均衡模式 | 21008 (-8%) | 29772 (-3%) | 8401 (-18%) |
| 电池电量 | 20095 (-12%) | 30278 (-1%) | 7999 (-22%) |
如Fire Strike 结果表所示,在平衡模式下运行对 GPU 性能的影响大于 CPU 性能。
| 3DMark Performance Rating - Percent | |
| Lenovo Legion 9 16IRX9, RTX 4090 -2! | |
| Alienware m16 R1 AMD -1! | |
| Lenovo Yoga Pro 9 16IMH9 -2! | |
| Lenovo Yoga Pro 9 16IMH9 RTX 4050 | |
| HP Victus 16 (2024) -2! | |
| Average NVIDIA GeForce RTX 4050 Laptop GPU | |
| Dell XPS 16 9640 -2! | |
| Framework Laptop 16 -1! | |
| Asus ZenBook Pro 16X OLED UX7602ZM-ME115W -2! | |
| Asus VivoBook Pro 16 K6602VU -1! | |
| Samsung Galaxy Book4 Ultra -2! | |
| MSI Stealth 15M A11SEK -2! | |
| HP Pavilion Plus 16-ab0456tx -3! | |
| HP Envy x360 2-in-1 16-ad0097nr -1! | |
| Lenovo Yoga 7 2-in-1 16IML9 -2! | |
| 3DMark 11 Performance | 28139 points | |
| 3DMark Fire Strike Score | 21063 points | |
| 3DMark Time Spy Score | 9125 points | |
| 3DMark Steel Nomad Score | 1846 points | |
Help | ||
* ... smaller is better
游戏性能
该系统功能强大,足以在原生 3200 x 2000 分辨率下以中等或较低设置运行《赛博朋克 2077》等要求苛刻的游戏。不过,为了获得最佳效果,建议尽可能启用 DLSS,以提高帧率,使其接近 60+ FPS。
| Performance Rating - Percent | |
| Lenovo Yoga Pro 9 16IMH9 | |
| Lenovo Yoga Pro 9 16IMH9 RTX 4050 | |
| Asus VivoBook Pro 16 K6602VU | |
| Dell XPS 16 9640 | |
| Samsung Galaxy Book4 Ultra | |
| HP Envy x360 2-in-1 16-ad0097nr | |
Witcher 3 FPS Chart
| low | med. | high | ultra | QHD | |
|---|---|---|---|---|---|
| The Witcher 3 (2015) | 395.6 | 290.5 | 164 | 83.7 | 61 |
| Dota 2 Reborn (2015) | 174.6 | 148.7 | 145.1 | 138.5 | |
| Final Fantasy XV Benchmark (2018) | 182.4 | 121.5 | 84.2 | 61.6 | |
| X-Plane 11.11 (2018) | 134.8 | 117.7 | 89.4 | ||
| Far Cry 5 (2018) | 151 | 129 | 121 | 113 | 86 |
| Strange Brigade (2018) | 432 | 213 | 170.9 | 150 | 99.7 |
| Tiny Tina's Wonderlands (2022) | 181.1 | 141.8 | 93.3 | 72.3 | 49.5 |
| F1 22 (2022) | 221 | 219 | 171.5 | 53.4 | 34 |
| Baldur's Gate 3 (2023) | 112.3 | 91.9 | 83.5 | 81.3 | 55 |
| Cyberpunk 2077 2.2 Phantom Liberty (2023) | 101.9 | 79.6 | 67.8 | 58.3 | 36.4 |
排放量
系统噪音
风扇噪音表现与我们在较高的 RTX 4070 配置上记录到的噪音几乎完全相同,这表明较弱的 RTX 4050 配置尽管 GPU 速度较慢,但噪音并没有降低。
Noise Level
| Idle |
| 23.6 / 25.4 / 25.4 dB(A) |
| Load |
| 44.2 / 52.6 dB(A) |
 | ||
30 dB silent 40 dB(A) audible 50 dB(A) loud |
||
min: | ||
| Lenovo Yoga Pro 9 16IMH9 RTX 4050 NVIDIA GeForce RTX 4050 Laptop GPU, Ultra 9 185H, SK Hynix HFS001TEJ9X115N | Lenovo Yoga Pro 9 16IMH9 NVIDIA GeForce RTX 4070 Laptop GPU, Ultra 9 185H, SK Hynix HFS001TEJ9X115N | HP Envy x360 2-in-1 16-ad0097nr Radeon 780M, R7 8840HS, KIOXIA BG5 KBG50ZNV1T02 | Dell XPS 16 9640 NVIDIA GeForce RTX 4070 Laptop GPU, Ultra 7 155H, Kioxia XG8 KXG80ZNV1T02 | Samsung Galaxy Book4 Ultra NVIDIA GeForce RTX 4050 Laptop GPU, Ultra 7 155H, Samsung PM9A1 MZVL2512HCJQ | Asus VivoBook Pro 16 K6602VU NVIDIA GeForce RTX 4050 Laptop GPU, i9-13900H, Micron 2400 MTFDKBA1T0QFM | |
|---|---|---|---|---|---|---|
| Noise | -2% | 14% | 0% | 8% | -2% | |
| off / environment * | 23.6 | 24.3 -3% | 22.9 3% | 24.5 -4% | 24.2 -3% | 20.96 11% |
| Idle Minimum * | 23.6 | 24.3 -3% | 23 3% | 24.5 -4% | 24.2 -3% | 25.28 -7% |
| Idle Average * | 25.4 | 24.3 4% | 23 9% | 24.5 4% | 24.2 5% | 25.28 -0% |
| Idle Maximum * | 25.4 | 25.8 -2% | 23 9% | 27.5 -8% | 24.2 5% | 25.28 -0% |
| Load Average * | 44.2 | 48.1 -9% | 23.8 46% | 39.6 10% | 37.9 14% | 51.88 -17% |
| Witcher 3 ultra * | 48.9 | 49.7 -2% | 43.8 10% | 49.7 -2% | 41.7 15% | 49 -0% |
| Load Maximum * | 52.6 | 53.9 -2% | 43.8 17% | 49.7 6% | 41.7 21% | 51.8 2% |
* ... smaller is better
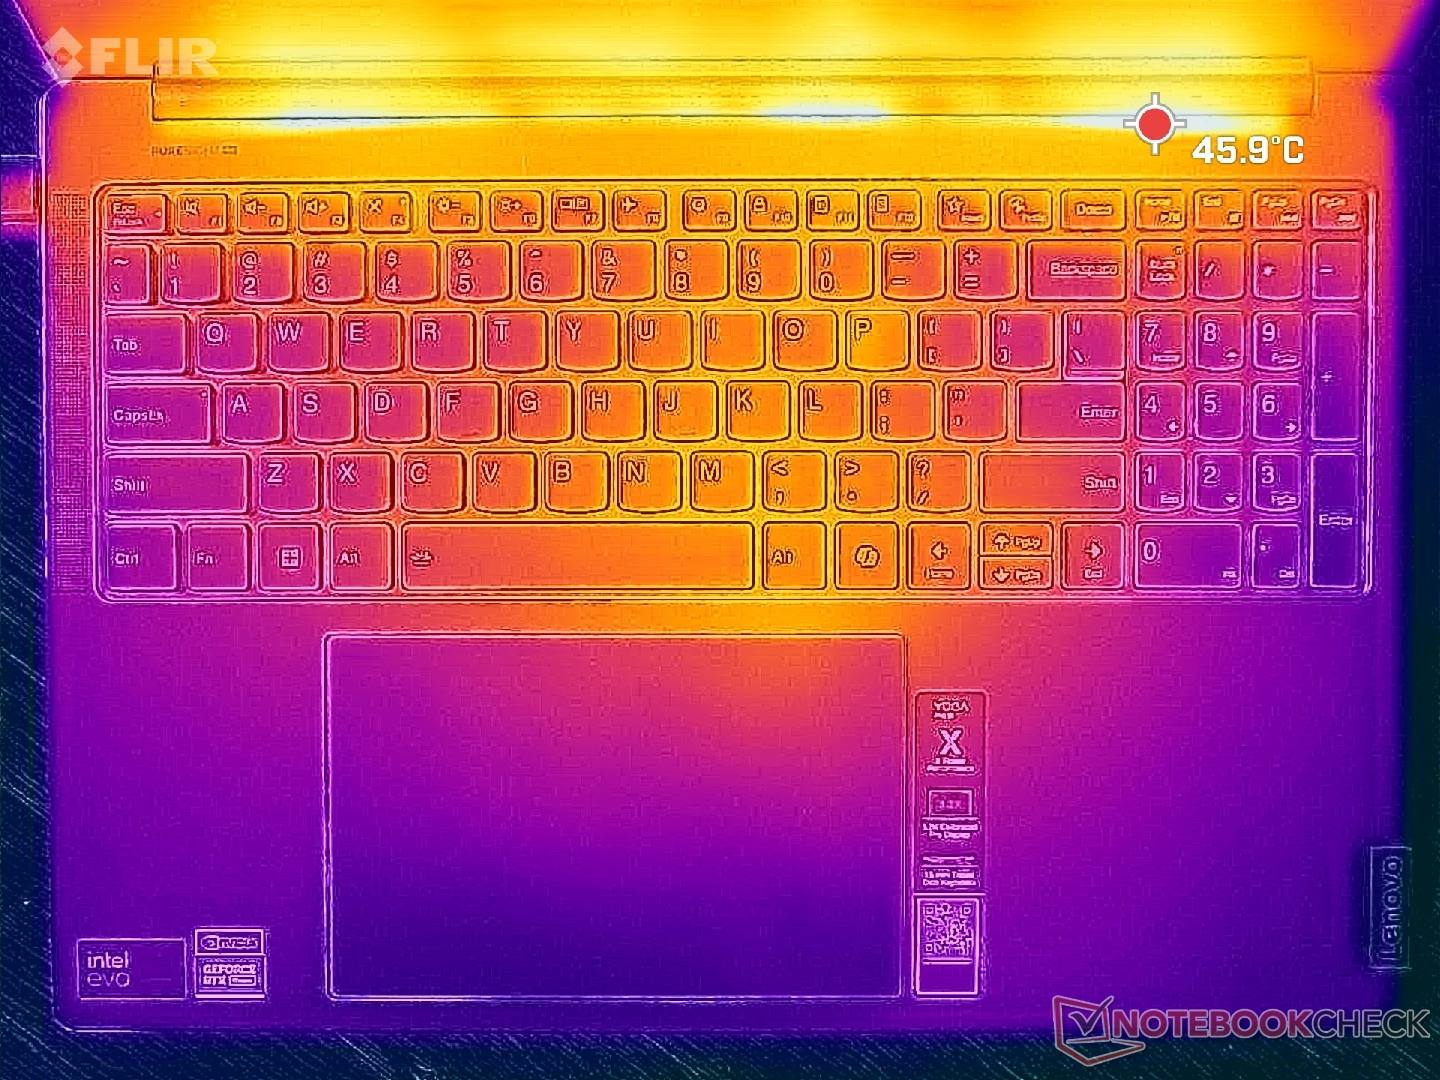
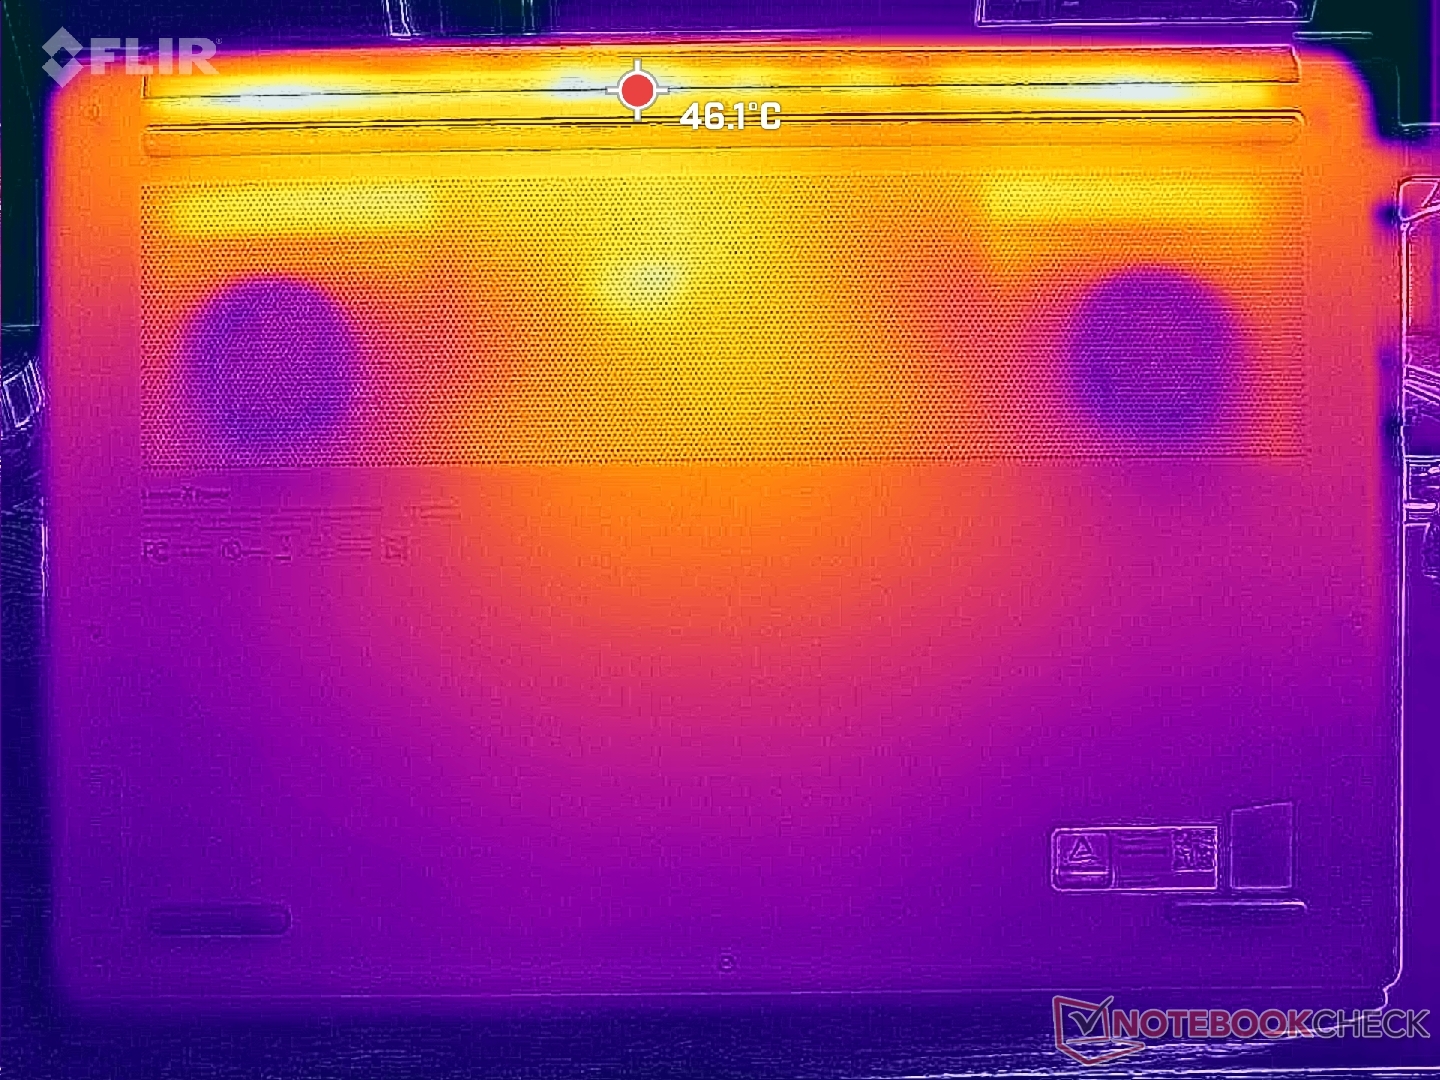
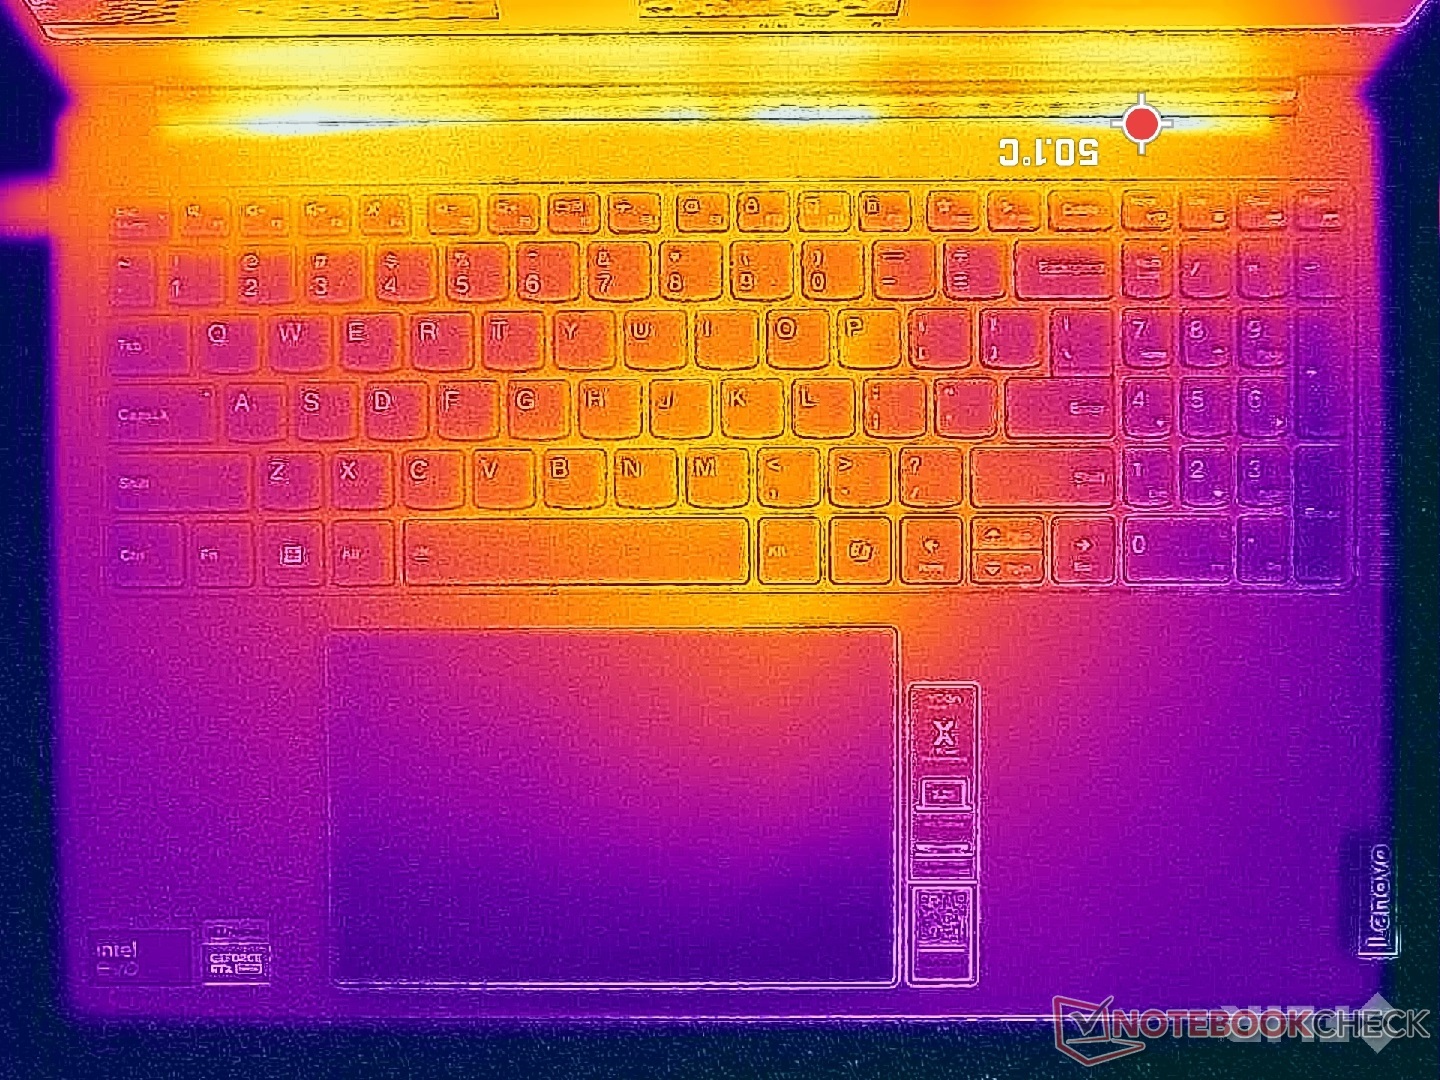
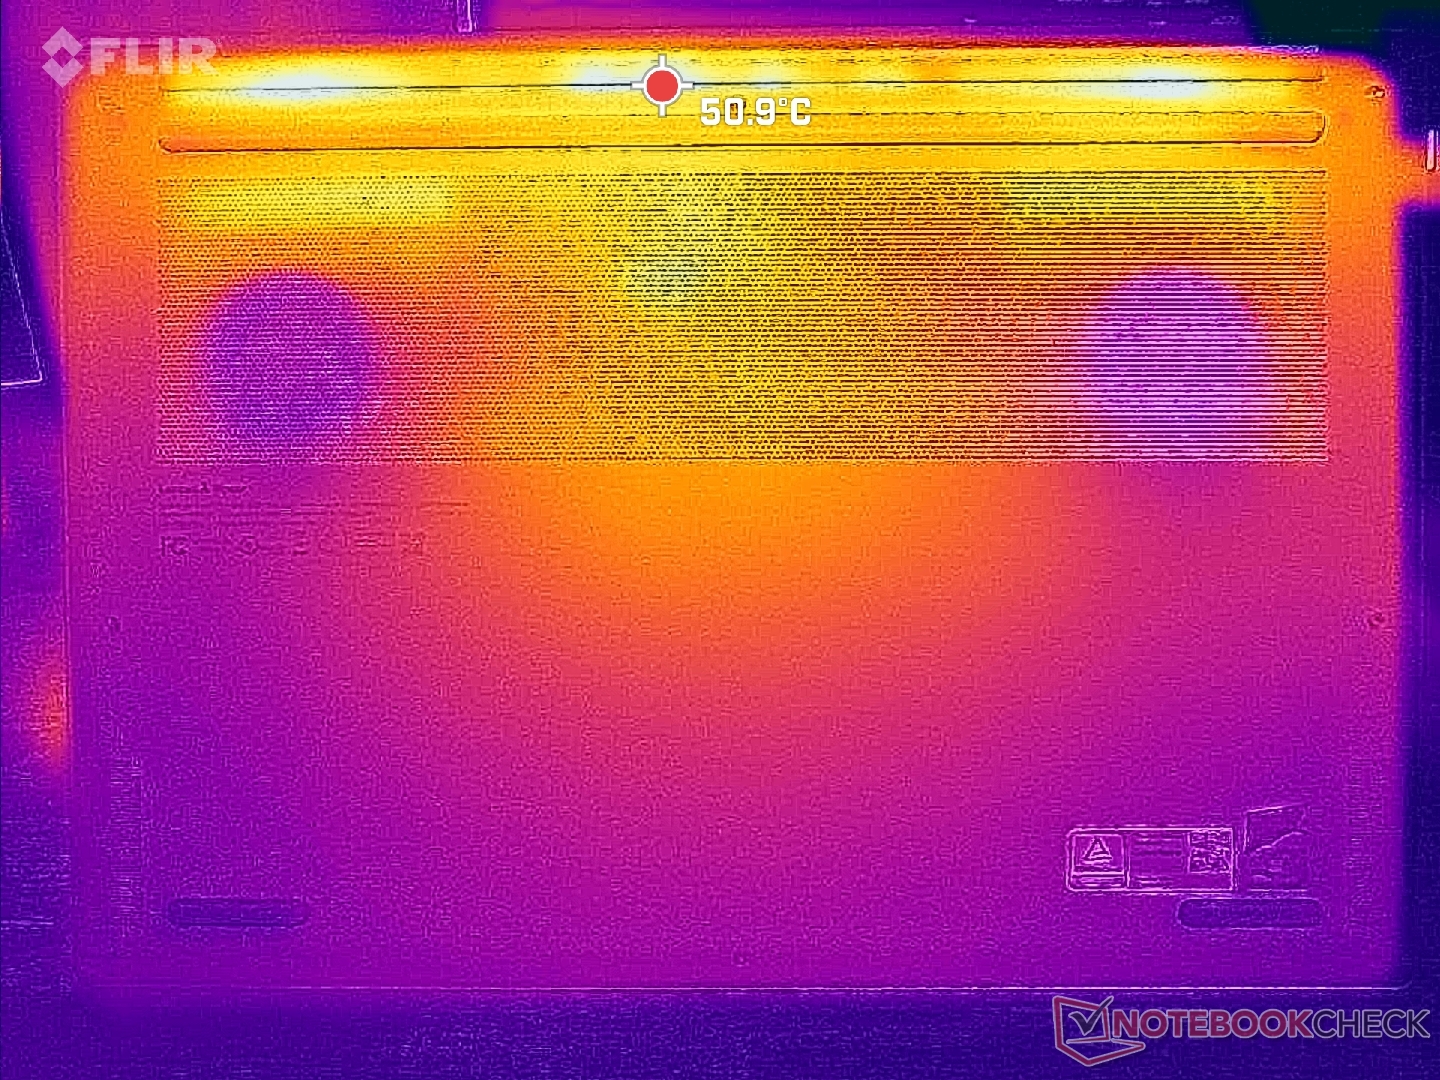
温度
在运行苛刻的负载时,热点温度可达 41 摄氏度以上,这比我们在 VivoBook Pro 16 上记录的温度低几度。 华硕 VivoBook Pro 16的温度还要低几度。
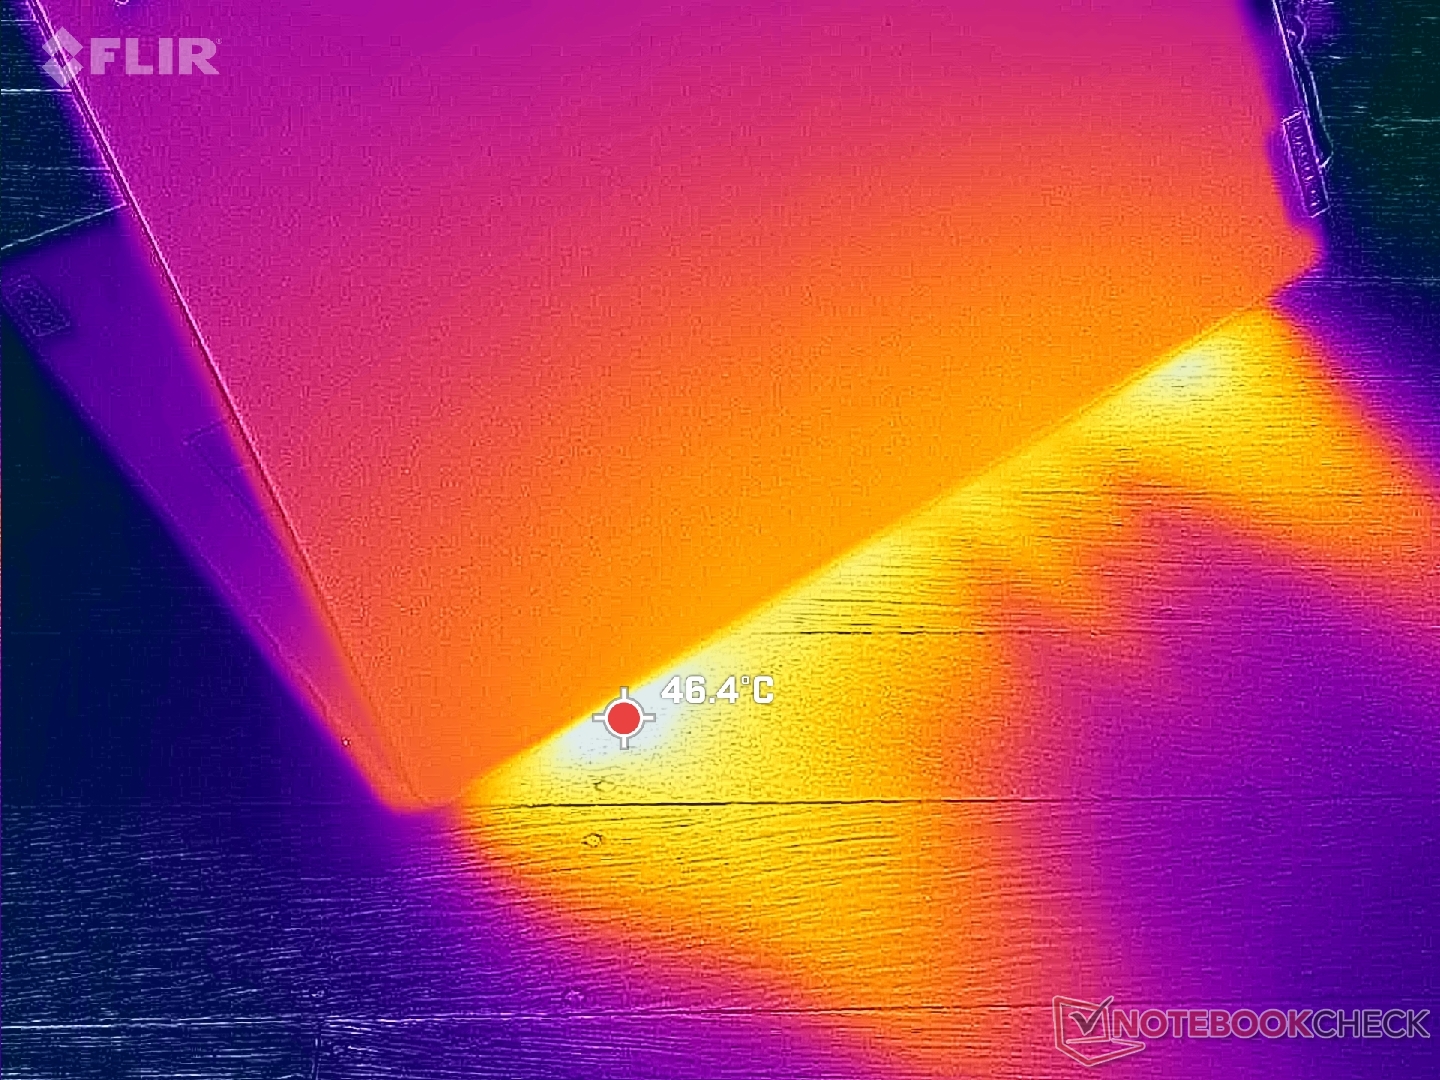
(±) The maximum temperature on the upper side is 41 °C / 106 F, compared to the average of 40.4 °C / 105 F, ranging from 21.2 to 68.8 °C for the class Gaming.
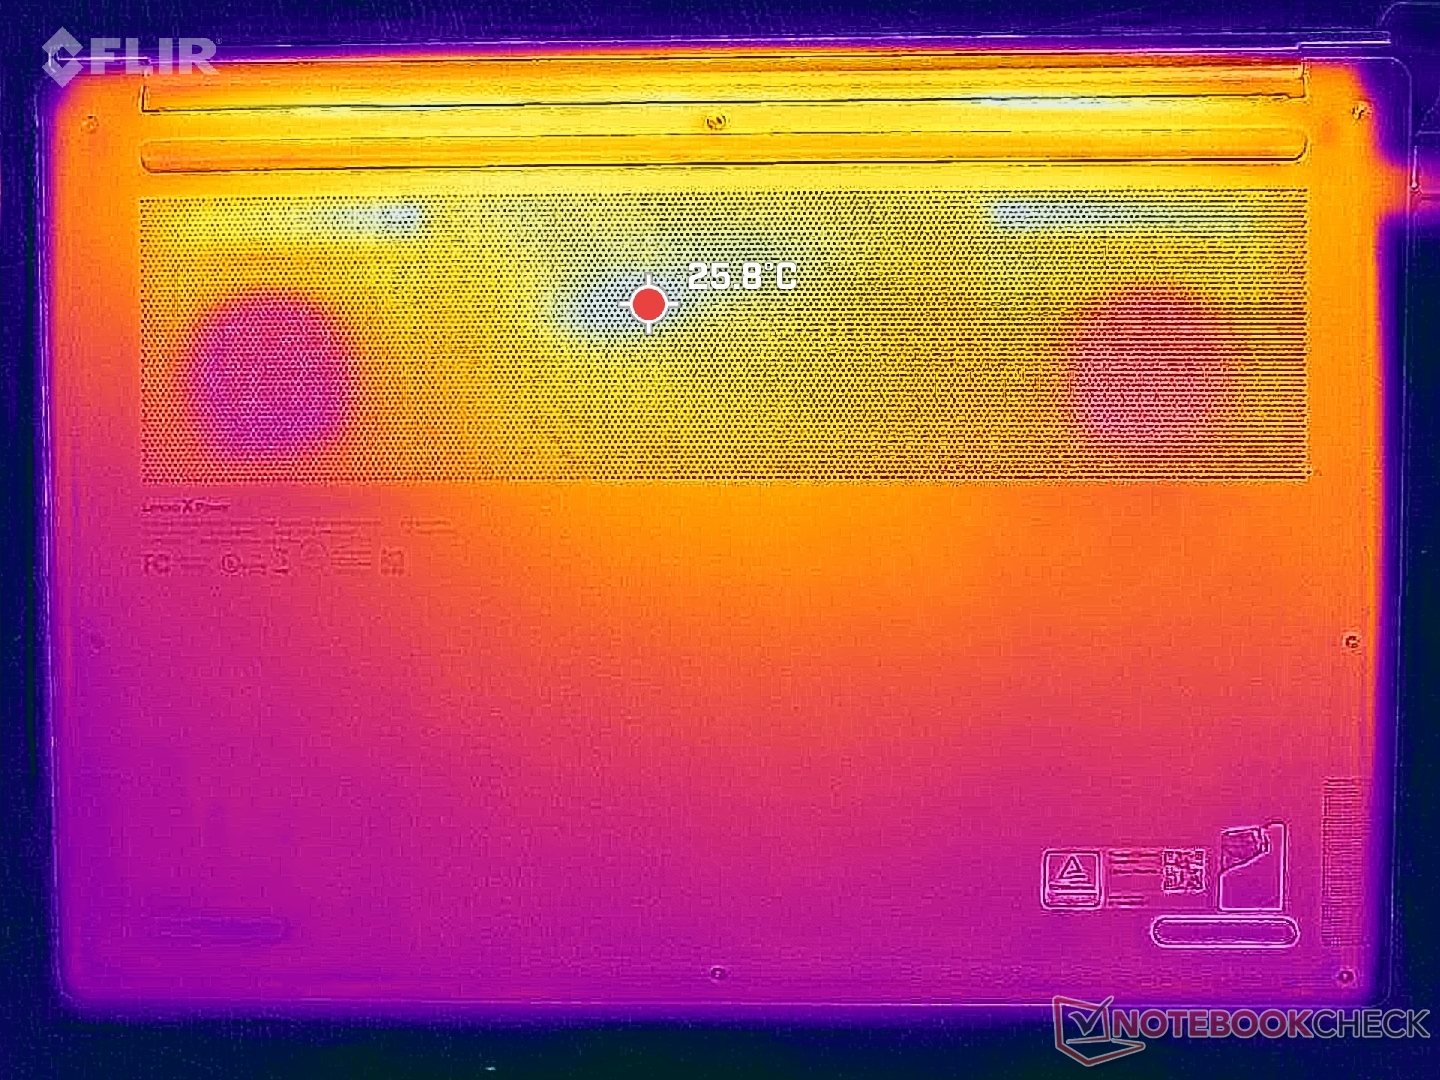
(±) The bottom heats up to a maximum of 40.6 °C / 105 F, compared to the average of 43.2 °C / 110 F
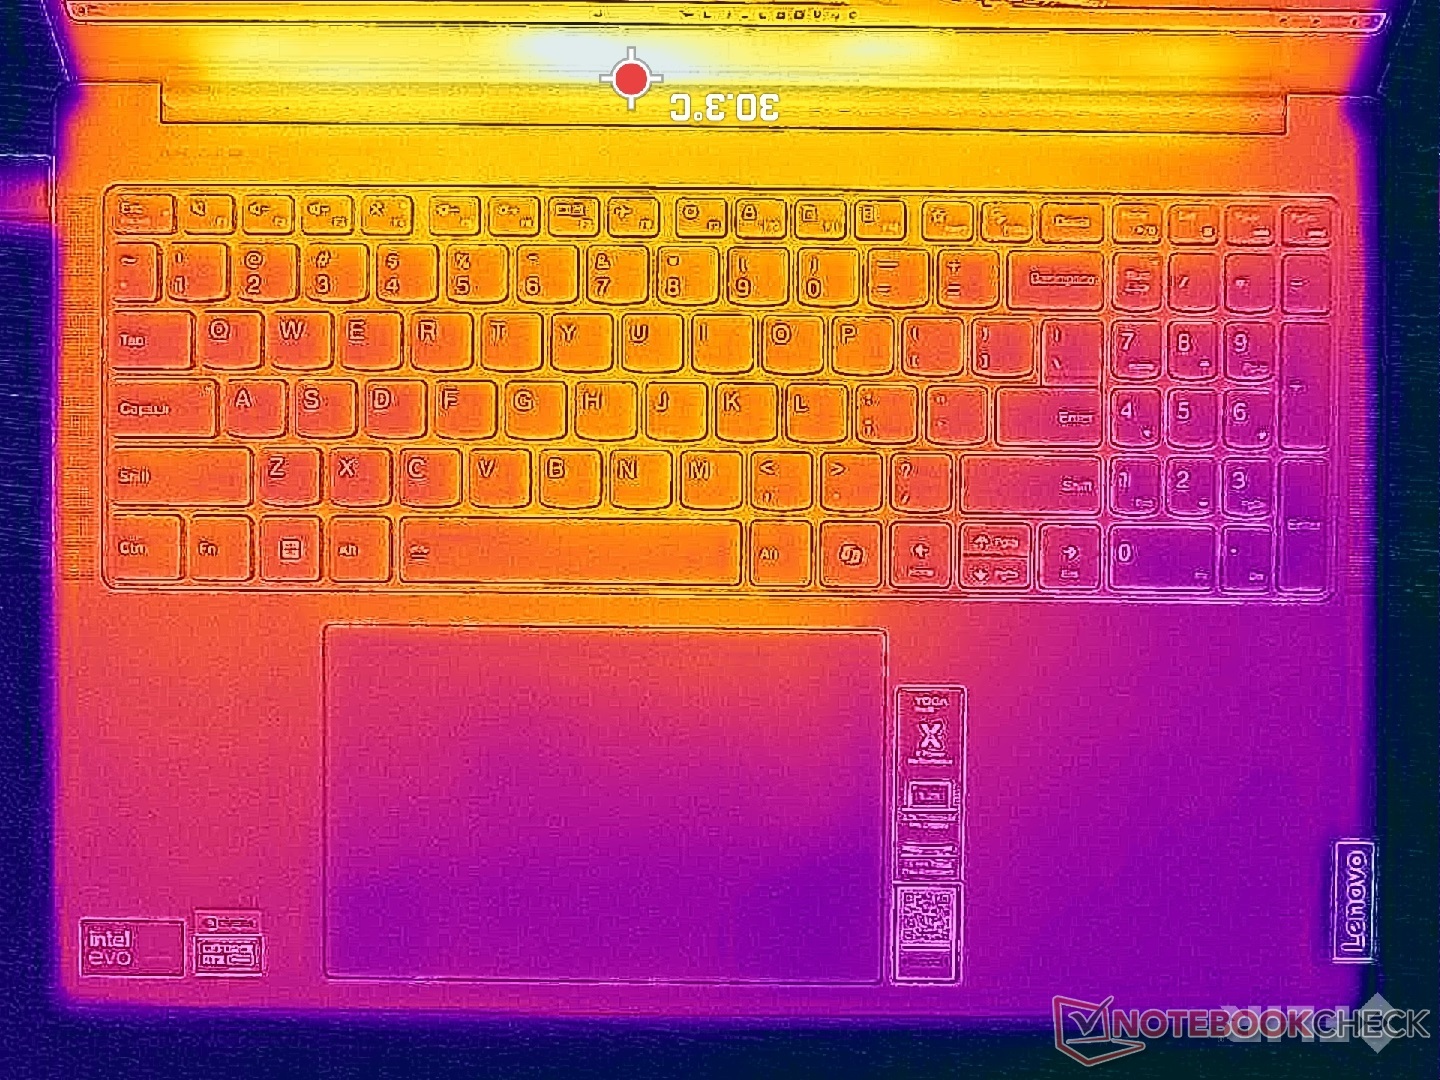
(+) In idle usage, the average temperature for the upper side is 27.8 °C / 82 F, compared to the device average of 33.9 °C / 93 F.
(±) Playing The Witcher 3, the average temperature for the upper side is 33 °C / 91 F, compared to the device average of 33.9 °C / 93 F.
(+) The palmrests and touchpad are cooler than skin temperature with a maximum of 29.6 °C / 85.3 F and are therefore cool to the touch.
(±) The average temperature of the palmrest area of similar devices was 28.9 °C / 84 F (-0.7 °C / -1.3 F).
| Lenovo Yoga Pro 9 16IMH9 RTX 4050 Intel Core Ultra 9 185H, NVIDIA GeForce RTX 4050 Laptop GPU | Lenovo Yoga Pro 9 16IMH9 Intel Core Ultra 9 185H, NVIDIA GeForce RTX 4070 Laptop GPU | HP Envy x360 2-in-1 16-ad0097nr AMD Ryzen 7 8840HS, AMD Radeon 780M | Dell XPS 16 9640 Intel Core Ultra 7 155H, NVIDIA GeForce RTX 4070 Laptop GPU | Samsung Galaxy Book4 Ultra Intel Core Ultra 7 155H, NVIDIA GeForce RTX 4050 Laptop GPU | Asus VivoBook Pro 16 K6602VU Intel Core i9-13900H, NVIDIA GeForce RTX 4050 Laptop GPU | |
|---|---|---|---|---|---|---|
| Heat | 3% | -1% | 8% | 13% | -20% | |
| Maximum Upper Side * | 41 | 41.7 -2% | 42.6 -4% | 39.4 4% | 38.5 6% | 42.6 -4% |
| Maximum Bottom * | 40.6 | 46.3 -14% | 47.8 -18% | 36.9 9% | 41.2 -1% | 48.4 -19% |
| Idle Upper Side * | 30.2 | 26.2 13% | 27.4 9% | 28.2 7% | 23.5 22% | 39.4 -30% |
| Idle Bottom * | 31.4 | 27.2 13% | 27.8 11% | 27.4 13% | 24.1 23% | 39.8 -27% |
* ... smaller is better
发言人
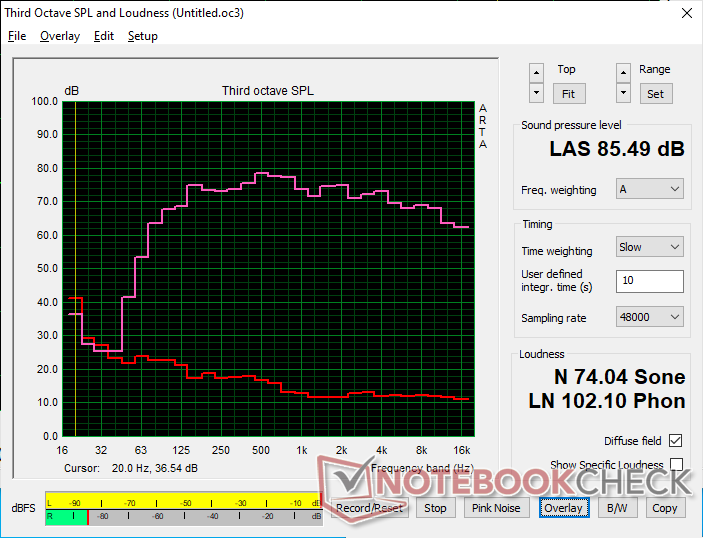
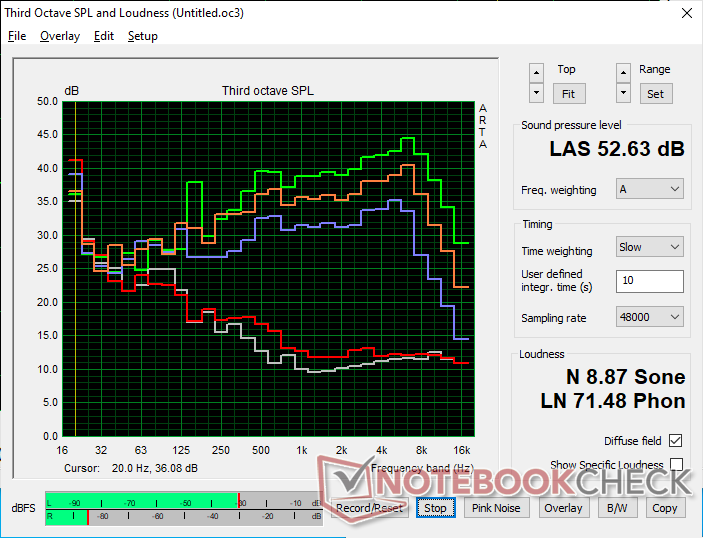
Lenovo Yoga Pro 9 16IMH9 RTX 4050 audio analysis
(+) | speakers can play relatively loud (85.5 dB)
Bass 100 - 315 Hz
(+) | good bass - only 2.1% away from median
(+) | bass is linear (3.8% delta to prev. frequency)
Mids 400 - 2000 Hz
(+) | balanced mids - only 2.6% away from median
(+) | mids are linear (3.1% delta to prev. frequency)
Highs 2 - 16 kHz
(+) | balanced highs - only 3.1% away from median
(+) | highs are linear (3% delta to prev. frequency)
Overall 100 - 16.000 Hz
(+) | overall sound is linear (5.8% difference to median)
Compared to same class
» 0% of all tested devices in this class were better, 0% similar, 100% worse
» The best had a delta of 6%, average was 18%, worst was 132%
Compared to all devices tested
» 0% of all tested devices were better, 0% similar, 100% worse
» The best had a delta of 4%, average was 24%, worst was 134%
Apple MacBook Pro 16 2021 M1 Pro audio analysis
(+) | speakers can play relatively loud (84.7 dB)
Bass 100 - 315 Hz
(+) | good bass - only 3.8% away from median
(+) | bass is linear (5.2% delta to prev. frequency)
Mids 400 - 2000 Hz
(+) | balanced mids - only 1.3% away from median
(+) | mids are linear (2.1% delta to prev. frequency)
Highs 2 - 16 kHz
(+) | balanced highs - only 1.9% away from median
(+) | highs are linear (2.7% delta to prev. frequency)
Overall 100 - 16.000 Hz
(+) | overall sound is linear (4.6% difference to median)
Compared to same class
» 0% of all tested devices in this class were better, 0% similar, 100% worse
» The best had a delta of 5%, average was 18%, worst was 45%
Compared to all devices tested
» 0% of all tested devices were better, 0% similar, 100% worse
» The best had a delta of 4%, average was 24%, worst was 134%
能源管理
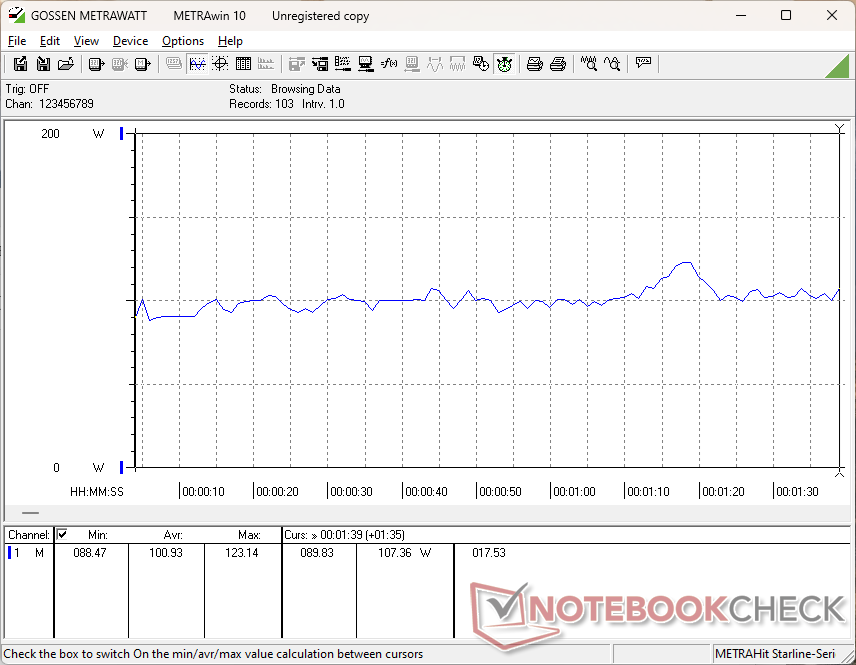
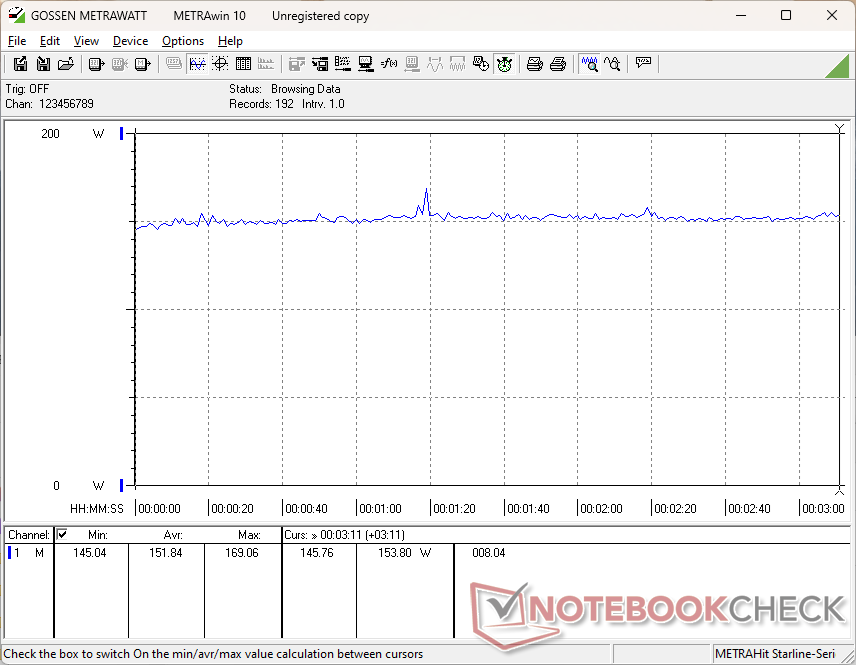
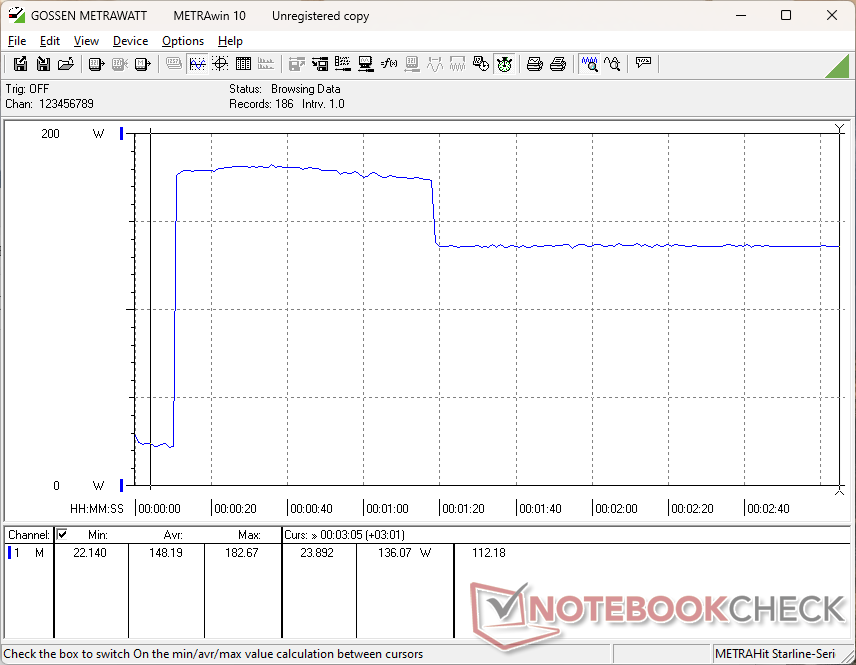
耗电量
总体消耗水平非常接近我们在更高端的 Mini-LED RTX 4070 配置上记录的水平。运行 Witcher 3例如,我们的低端配置平均耗电量仅比 RTX 4070 低 5%,但图形性能却比 RTX 4070 低 25% 至 30%。因此,每瓦性能对 RTX 4070 来说非常有利。
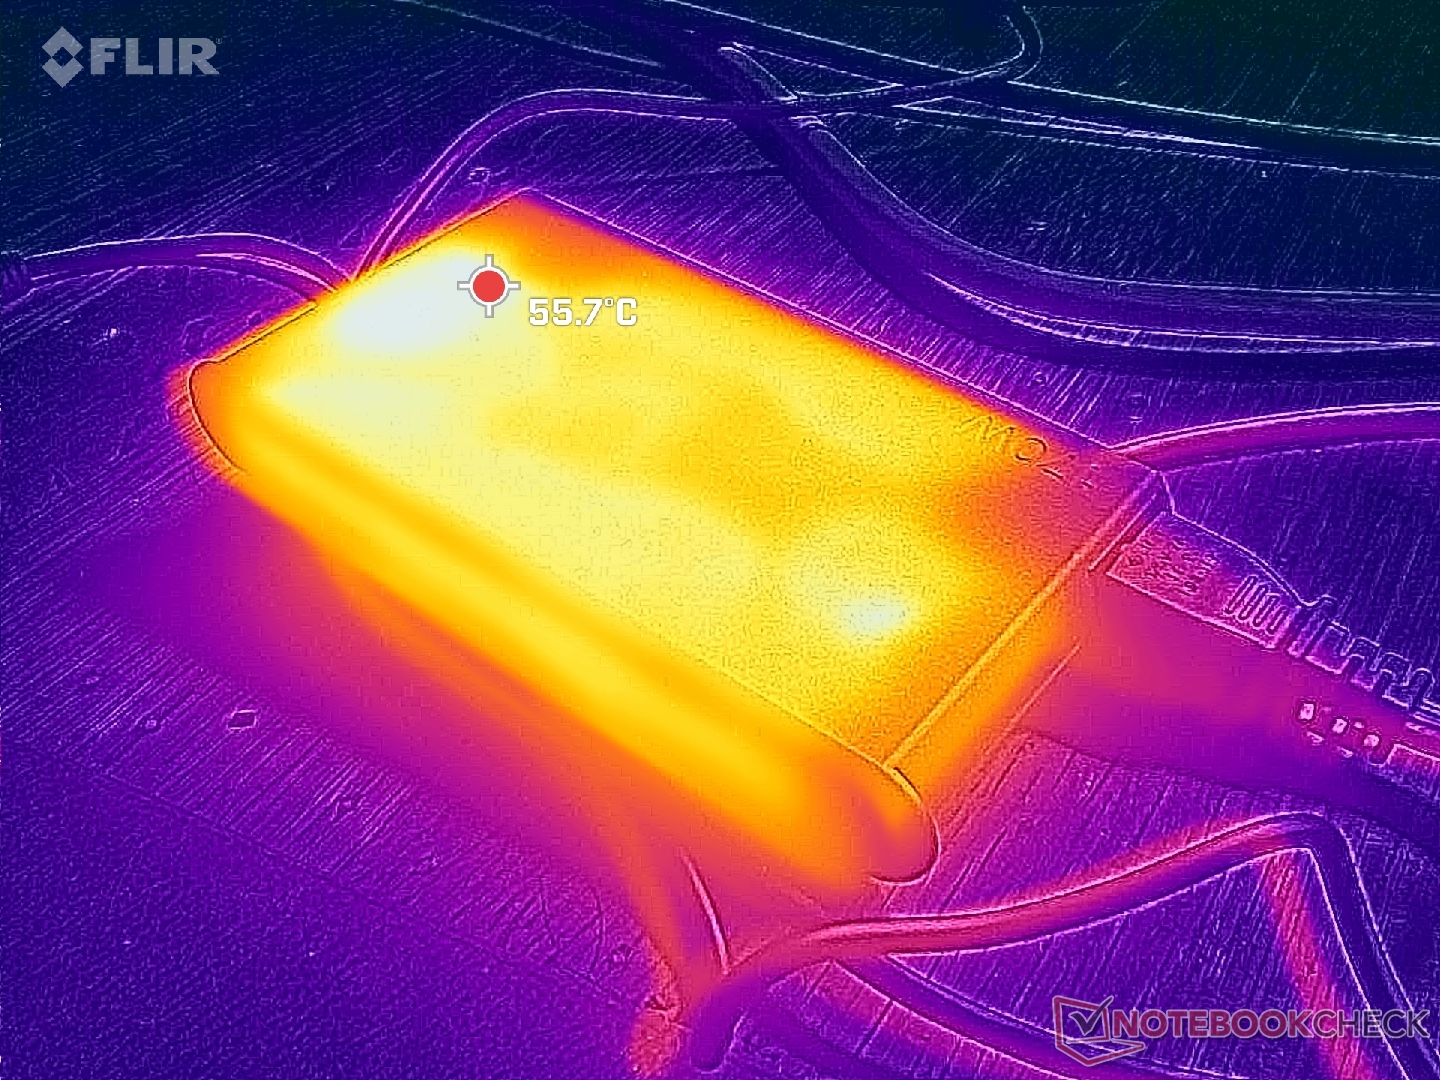
用户应该记住,交流适配器的额定功率仅为 170 瓦。由于游戏对功率的要求已经在 150 瓦到 160 瓦之间,因此尝试在游戏时为笔记本电脑充电将导致充电速度非常缓慢。
| Off / Standby | |
| Idle | |
| Load |
|
Key:
min: | |
| Lenovo Yoga Pro 9 16IMH9 RTX 4050 Ultra 9 185H, NVIDIA GeForce RTX 4050 Laptop GPU, SK Hynix HFS001TEJ9X115N, IPS, 3200x2000, 16" | Lenovo Yoga Pro 9 16IMH9 Ultra 9 185H, NVIDIA GeForce RTX 4070 Laptop GPU, SK Hynix HFS001TEJ9X115N, Mini-LED, 3200x2000, 16" | HP Envy x360 2-in-1 16-ad0097nr R7 8840HS, Radeon 780M, KIOXIA BG5 KBG50ZNV1T02, OLED, 2880x1800, 16" | Dell XPS 16 9640 Ultra 7 155H, NVIDIA GeForce RTX 4070 Laptop GPU, Kioxia XG8 KXG80ZNV1T02, OLED, 3840x2400, 16.3" | Samsung Galaxy Book4 Ultra Ultra 7 155H, NVIDIA GeForce RTX 4050 Laptop GPU, Samsung PM9A1 MZVL2512HCJQ, OLED, 2880x1800, 16" | Asus VivoBook Pro 16 K6602VU i9-13900H, NVIDIA GeForce RTX 4050 Laptop GPU, Micron 2400 MTFDKBA1T0QFM, OLED, 3200x2000, 16" | |
|---|---|---|---|---|---|---|
| Power Consumption | -2% | 57% | 32% | 47% | -8% | |
| Idle Minimum * | 9.9 | 10.3 -4% | 5 49% | 7.7 22% | 4.8 52% | 21.06 -113% |
| Idle Average * | 16.6 | 21.9 -32% | 6.2 63% | 10.3 38% | 7.5 55% | 24.27 -46% |
| Idle Maximum * | 29.2 | 22.4 23% | 14.7 50% | 10.6 64% | 7.9 73% | 25.12 14% |
| Load Average * | 100.9 | 96.9 4% | 49.9 51% | 76.5 24% | 79.3 21% | 52.4 48% |
| Witcher 3 ultra * | 151.8 | 159.6 -5% | 54.5 64% | 126.4 17% | 79.2 48% | 110.2 27% |
| Load Maximum * | 182.2 | 173.8 5% | 65 64% | 138.5 24% | 125 31% | 146 20% |
* ... smaller is better
Power Consumption Witcher 3 / Stresstest
Power Consumption external Monitor
电池寿命
在平衡模式和 Optimus 模式下,显示器设置为 150 尼特时的 WLAN 运行时间与价格更高的 RTX 4070 Mini-LED 配置的运行时间差不多。从表面上看,这个结果有点出人意料,因为 Mini-LED 和 RTX 4070 GPU 比 IPS 和 RTX 4050 对功耗的要求更高,但一旦考虑到 Optimus 模式和测试期间相似的亮度设置,这个数据就很合理了。对于配备独立显卡的 16 英寸多媒体笔记本电脑来说,9 小时的浏览时间仍然是非常不错的,即使比戴尔 XPS 16 或其他竞争对手稍短一些。 三星Galaxy Book4 Ultra.
| Lenovo Yoga Pro 9 16IMH9 RTX 4050 Ultra 9 185H, NVIDIA GeForce RTX 4050 Laptop GPU, 84 Wh | Lenovo Yoga Pro 9 16IMH9 Ultra 9 185H, NVIDIA GeForce RTX 4070 Laptop GPU, 84 Wh | HP Envy x360 2-in-1 16-ad0097nr R7 8840HS, Radeon 780M, 68 Wh | Dell XPS 16 9640 Ultra 7 155H, NVIDIA GeForce RTX 4070 Laptop GPU, 99.5 Wh | Samsung Galaxy Book4 Ultra Ultra 7 155H, NVIDIA GeForce RTX 4050 Laptop GPU, 76 Wh | Asus VivoBook Pro 16 K6602VU i9-13900H, NVIDIA GeForce RTX 4050 Laptop GPU, 96 Wh | |
|---|---|---|---|---|---|---|
| Battery Runtime | -3% | -15% | 16% | 21% | 12% | |
| WiFi v1.3 | 540 | 526 -3% | 459 -15% | 629 16% | 656 21% | 606 12% |
| H.264 | 692 | 988 | 1076 | 585 | ||
| Load | 73 | 116 | 87 | 78 | ||
| Reader / Idle | 935 |
Pros
Cons
结论 - 如果您愿意付费,联想最好的产品之一
Yoga Pro 9 16IMH9 是迄今为止该系列中最令人印象深刻的机型,即使是在没有 RTX 4070 显卡或花哨的迷你 LED 屏幕的低端配置下,它也是 XPS 16 的真正替代品。 XPS 16或 MacBook Pro 16.它的 IPS 显示屏、性能和尺寸均可与戴尔或Apple 的同类产品媲美,而且更易于维护,键盘也比 XPS 好。当然,我们也很欣赏它的各种端口,而这两款竞争机型只有 USB-C。
电池续航时间和风扇噪音等其他因素与更高端的 RTX 4070 配置相比,并没有明显延长或降低。
支持 AI 的联想 Yoga Pro 9 16IMH9 不仅是戴尔 XPS 16 或 MacBook Pro 16 的绝佳替代品,而且在一些方面比这两款产品做得更好。
RTX 4050 配置的 1700 美元零售价有点高,因为采用相同 GPU 的游戏笔记本电脑,如 微星超薄 GF63 或 宏碁 Nitro V都能以低于 1000 美元的价格买到。不过,与竞争对手 XPS 16 或 MacBook Pro 15 相比,联想的价格要便宜几百美元,对于那些希望在保留优质用户体验的同时节省一些现金的人来说,这不失为一种有吸引力的解决方案。
价格和供应情况
百思买目前正在销售联想 Yoga Pro 9 16 配置,评测价格为 1700 美元。
Lenovo Yoga Pro 9 16IMH9 RTX 4050
- 06/06/2024 v7 (old)
Allen Ngo
Transparency
The selection of devices to be reviewed is made by our editorial team. The test sample was provided to the author as a loan by the manufacturer or retailer for the purpose of this review. The lender had no influence on this review, nor did the manufacturer receive a copy of this review before publication. There was no obligation to publish this review. We never accept compensation or payment in return for our reviews. As an independent media company, Notebookcheck is not subjected to the authority of manufacturers, retailers or publishers.
This is how Notebookcheck is testing
Every year, Notebookcheck independently reviews hundreds of laptops and smartphones using standardized procedures to ensure that all results are comparable. We have continuously developed our test methods for around 20 years and set industry standards in the process. In our test labs, high-quality measuring equipment is utilized by experienced technicians and editors. These tests involve a multi-stage validation process. Our complex rating system is based on hundreds of well-founded measurements and benchmarks, which maintains objectivity. Further information on our test methods can be found here.
Price comparison

