

16 英寸可转换机上的迷你 LED:戴尔 Inspiron 16 7640 2 合 1 评测

2024 Inspiron 16 7640 2-in-1 继承了 2023 Inspiron 16 7630 2-in-1,更新了英特尔第 14 代内核,并在外观上做了一些改动。也许最值得注意的是,今年的机型配备了 90 Hz 1600p miniLED 触摸屏,取代了 Inspiron 16 7630 2 合 1 上的 2400p OLED 触摸屏。同时,Inspiron 16 7635 2 合 1 上的 60 Hz 1200p IPS 触摸屏在部分低端机型上重新回归。
我们的测试机是高端配置,配备流星湖-H 酷睿至尊 7 155H CPU 和集成 Arc 8 图形处理器,售价约为 1000 美元。较低端的配置是 Core Ultra 5 125U,采用较旧的 60 Hz 1200p IPS 面板,价格低 200 美元,但这两种配置都没有独立 GPU 选项。有趣的是,Inspiron 16 7640 2 合 1 是为数不多的同时提供 Core-U 和 Core-H 处理器选项的可转换机型之一,因为大多数可转换机型只提供其中一种,而不提供另一种。
到目前为止,还没有 AMD Zen 4 SKU。如果将来有的话,型号可能是 Inspiron 16 7645 2 合 1,它将接替基于 AMD 处理器的 Inspiron 16 7635 2 合 1。
Inspiron 16 7640 2 合 1 的竞争对手包括其他中端到中上端的 16 英寸可转换笔记本电脑,如 惠普 Envy x360 2 合 116 英寸或 联想 Yoga 7 2-in-1 16.不过,戴尔的迷你 LED 显示屏是独一无二的。
更多戴尔评测:
潜在的竞争对手比较
Rating | Version | Date | Model | Weight | Height | Size | Resolution | Price |
|---|---|---|---|---|---|---|---|---|
| 82.1 % | v8 | 07 / 2024 | Dell Inspiron 16 7640 2-in-1 Ultra 7 155H, Arc 8-Core | 2.1 kg | 18.99 mm | 16.00" | 2560x1600 | |
| 83.4 % | v8 | 06 / 2024 | Dell Inspiron 16 Plus 7640 Ultra 7 155H, NVIDIA GeForce RTX 4060 Laptop GPU | 2.2 kg | 19.9 mm | 16.00" | 2560x1600 | |
| 87.2 % v7 (old) | v7 (old) | 05 / 2024 | HP Envy x360 2-in-1 16-ad0097nr R7 8840HS, Radeon 780M | 1.8 kg | 18.3 mm | 16.00" | 2880x1800 | |
| 87.9 % v7 (old) | v7 (old) | 05 / 2024 | Lenovo IdeaPad Pro 5 16IMH G9 Ultra 7 155H, Arc 8-Core | 1.9 kg | 17.5 mm | 16.00" | 2560x1600 | |
| 88.7 % v7 (old) | v7 (old) | 02 / 2024 | HP Pavilion Plus 16-ab0456tx i7-13700H, GeForce RTX 3050 6GB Laptop GPU | 1.9 kg | 19.9 mm | 16.00" | 2560x1600 | |
| 87.6 % v7 (old) | v7 (old) | 11 / 2023 | Asus VivoBook Pro 16 K6602VU i9-13900H, NVIDIA GeForce RTX 4050 Laptop GPU | 1.9 kg | 19 mm | 16.00" | 3200x2000 |
外壳 - 坚固但沉重
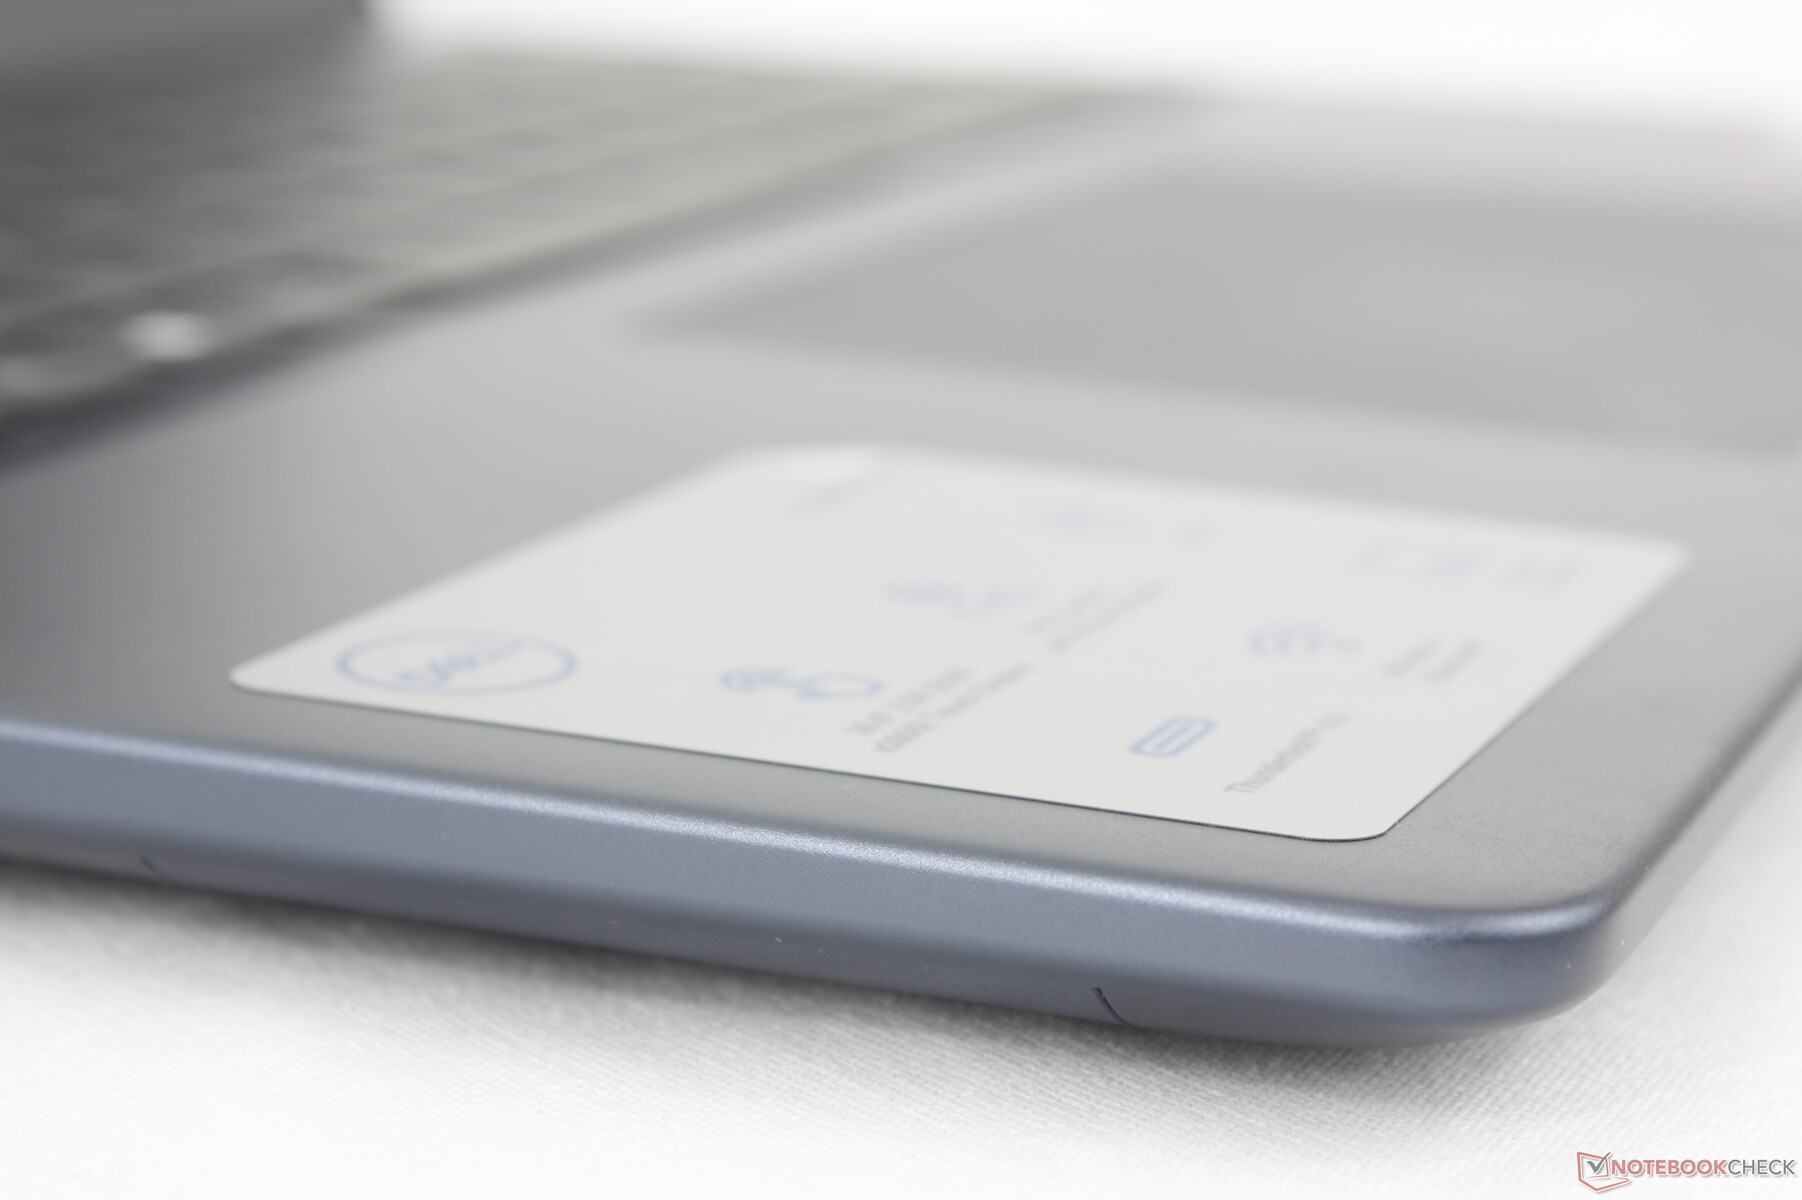
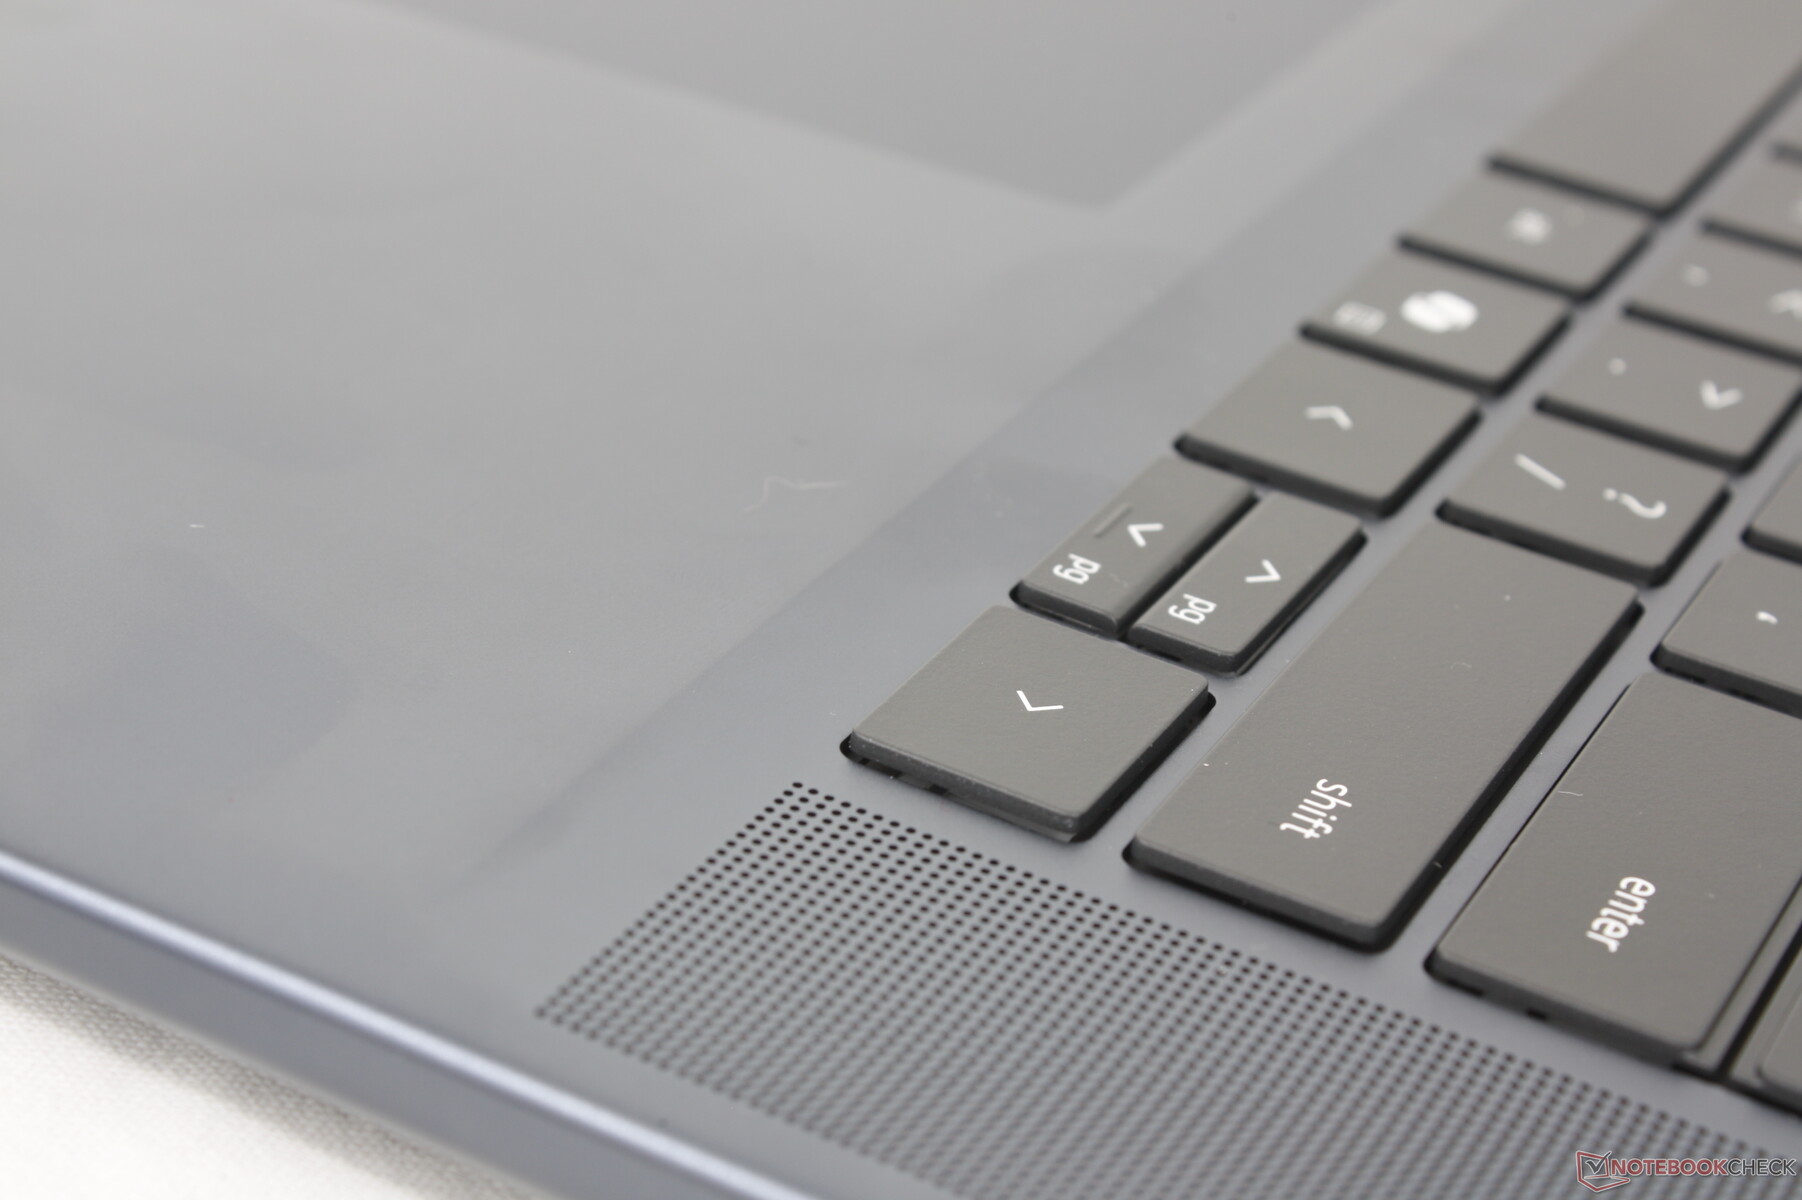
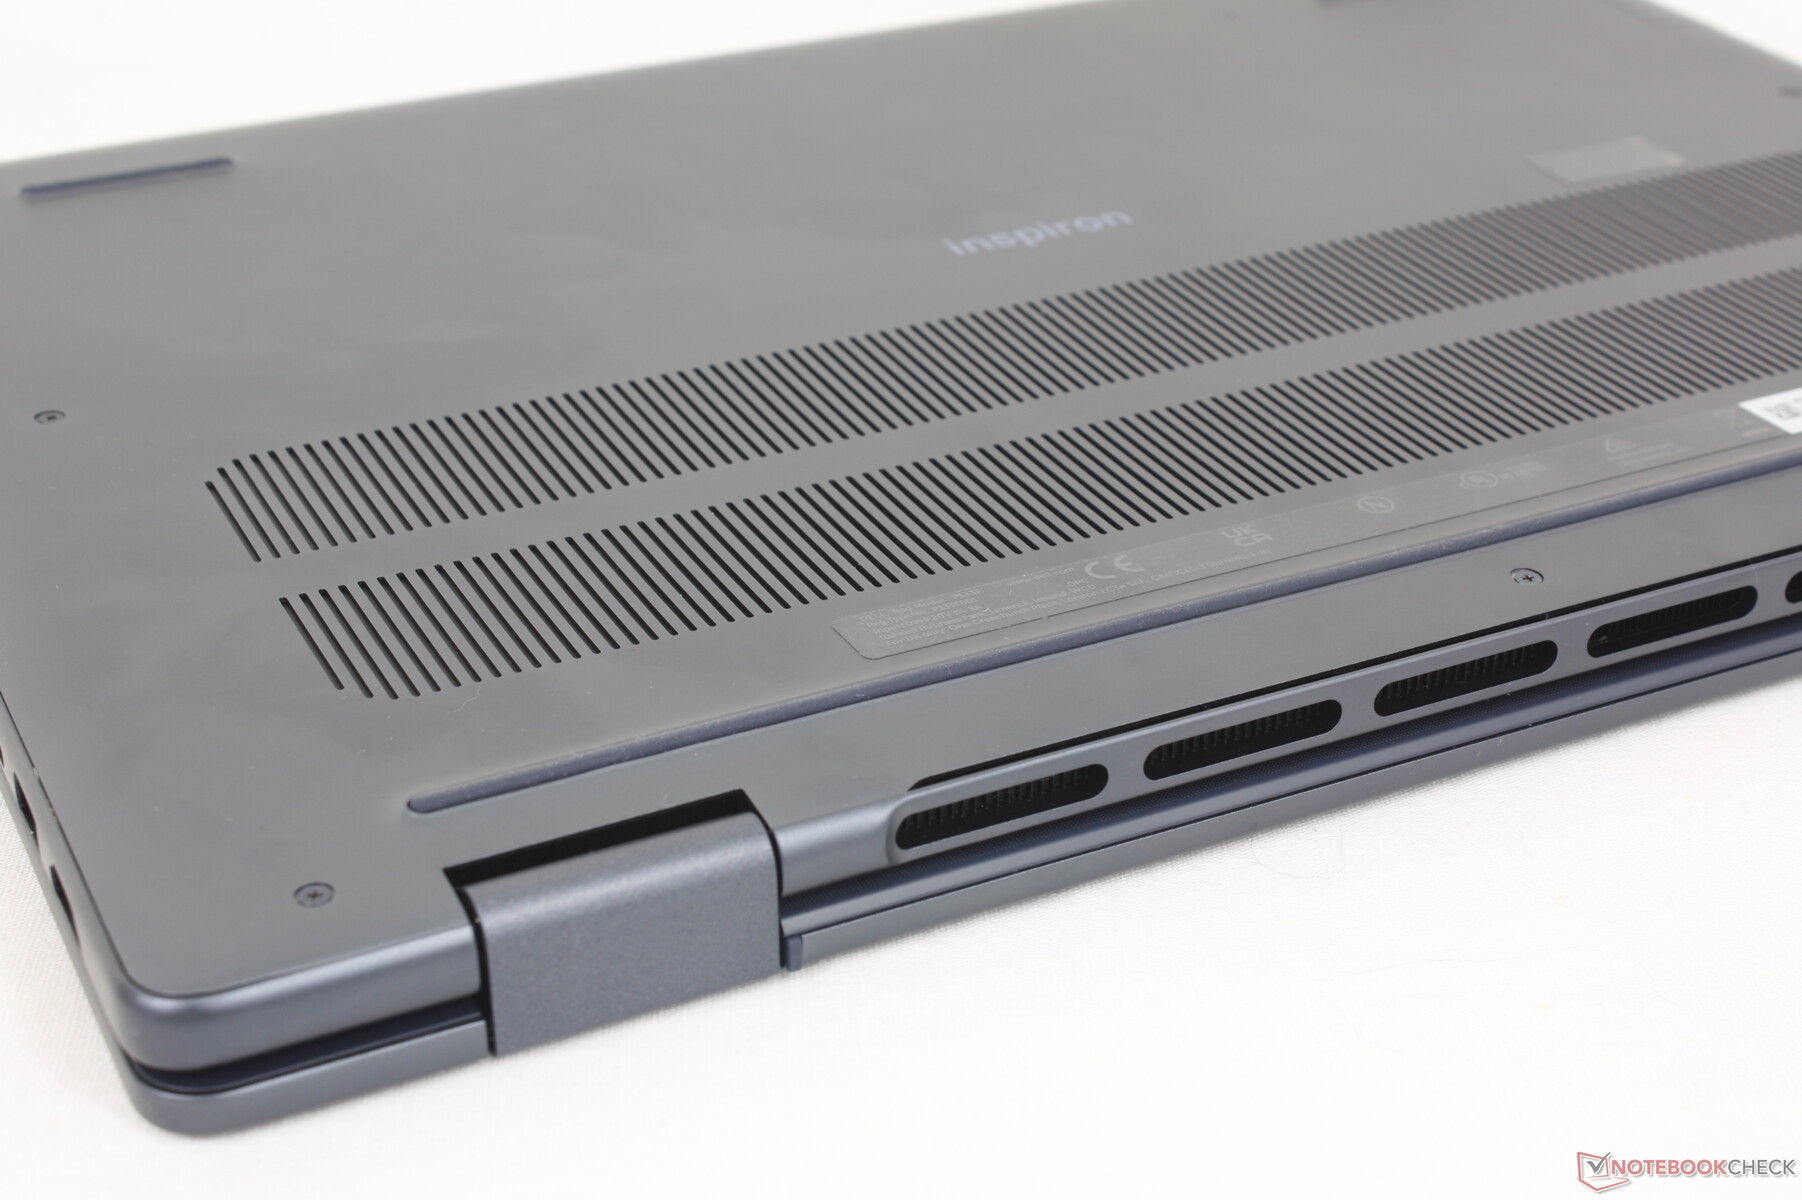
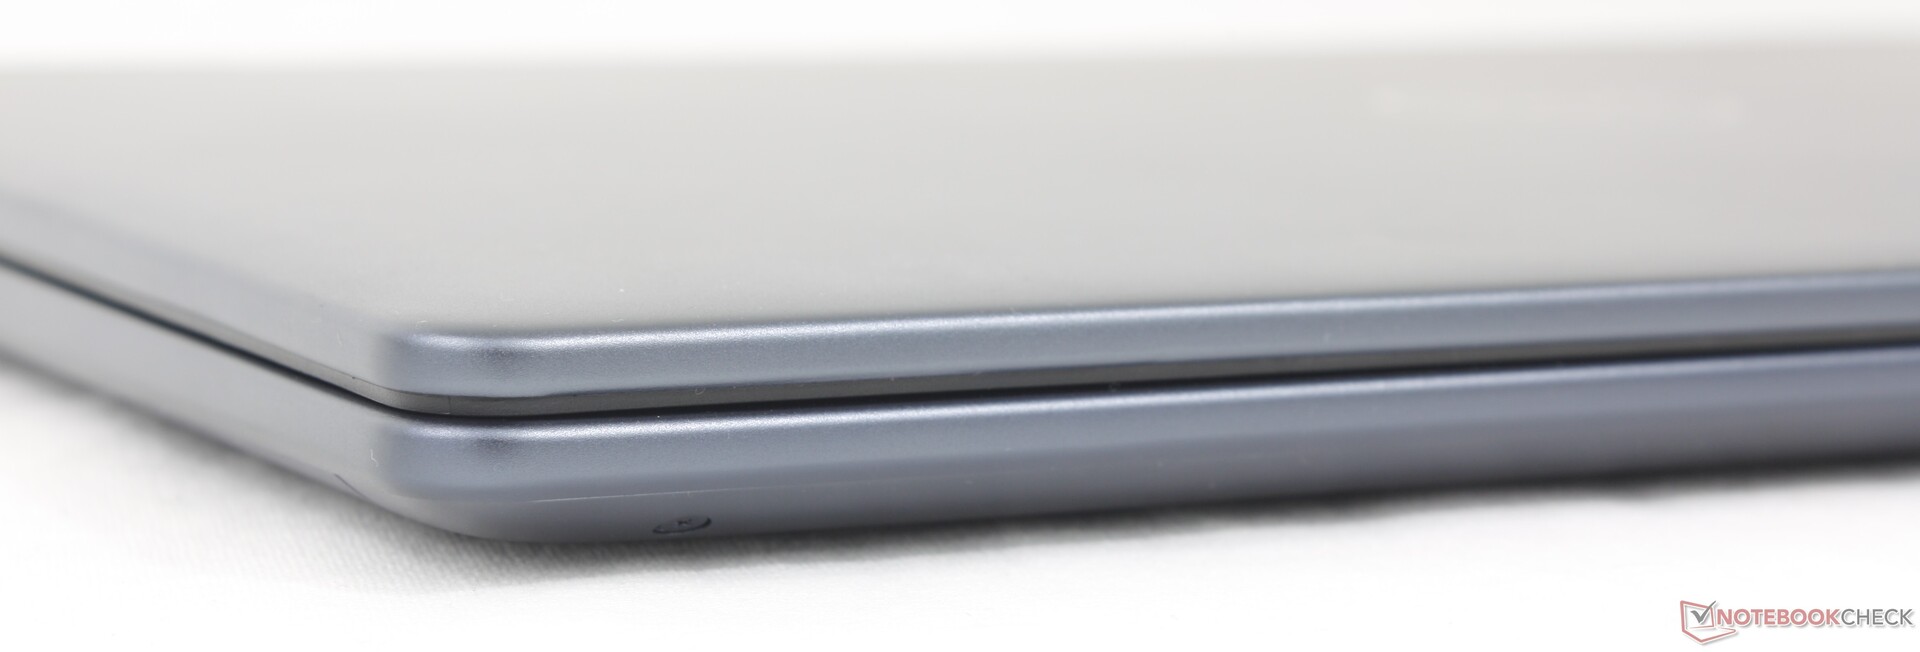
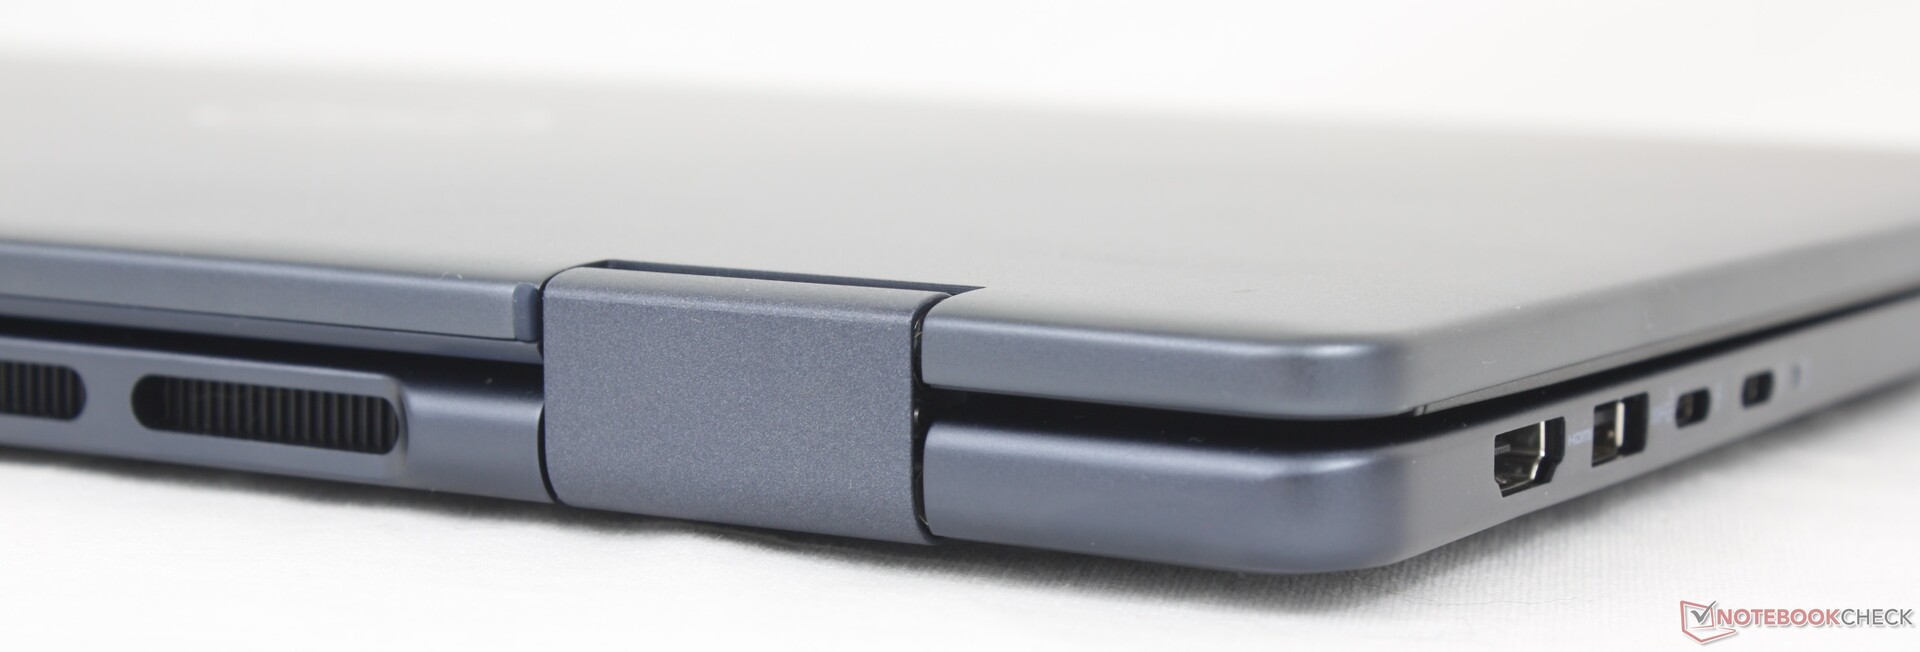
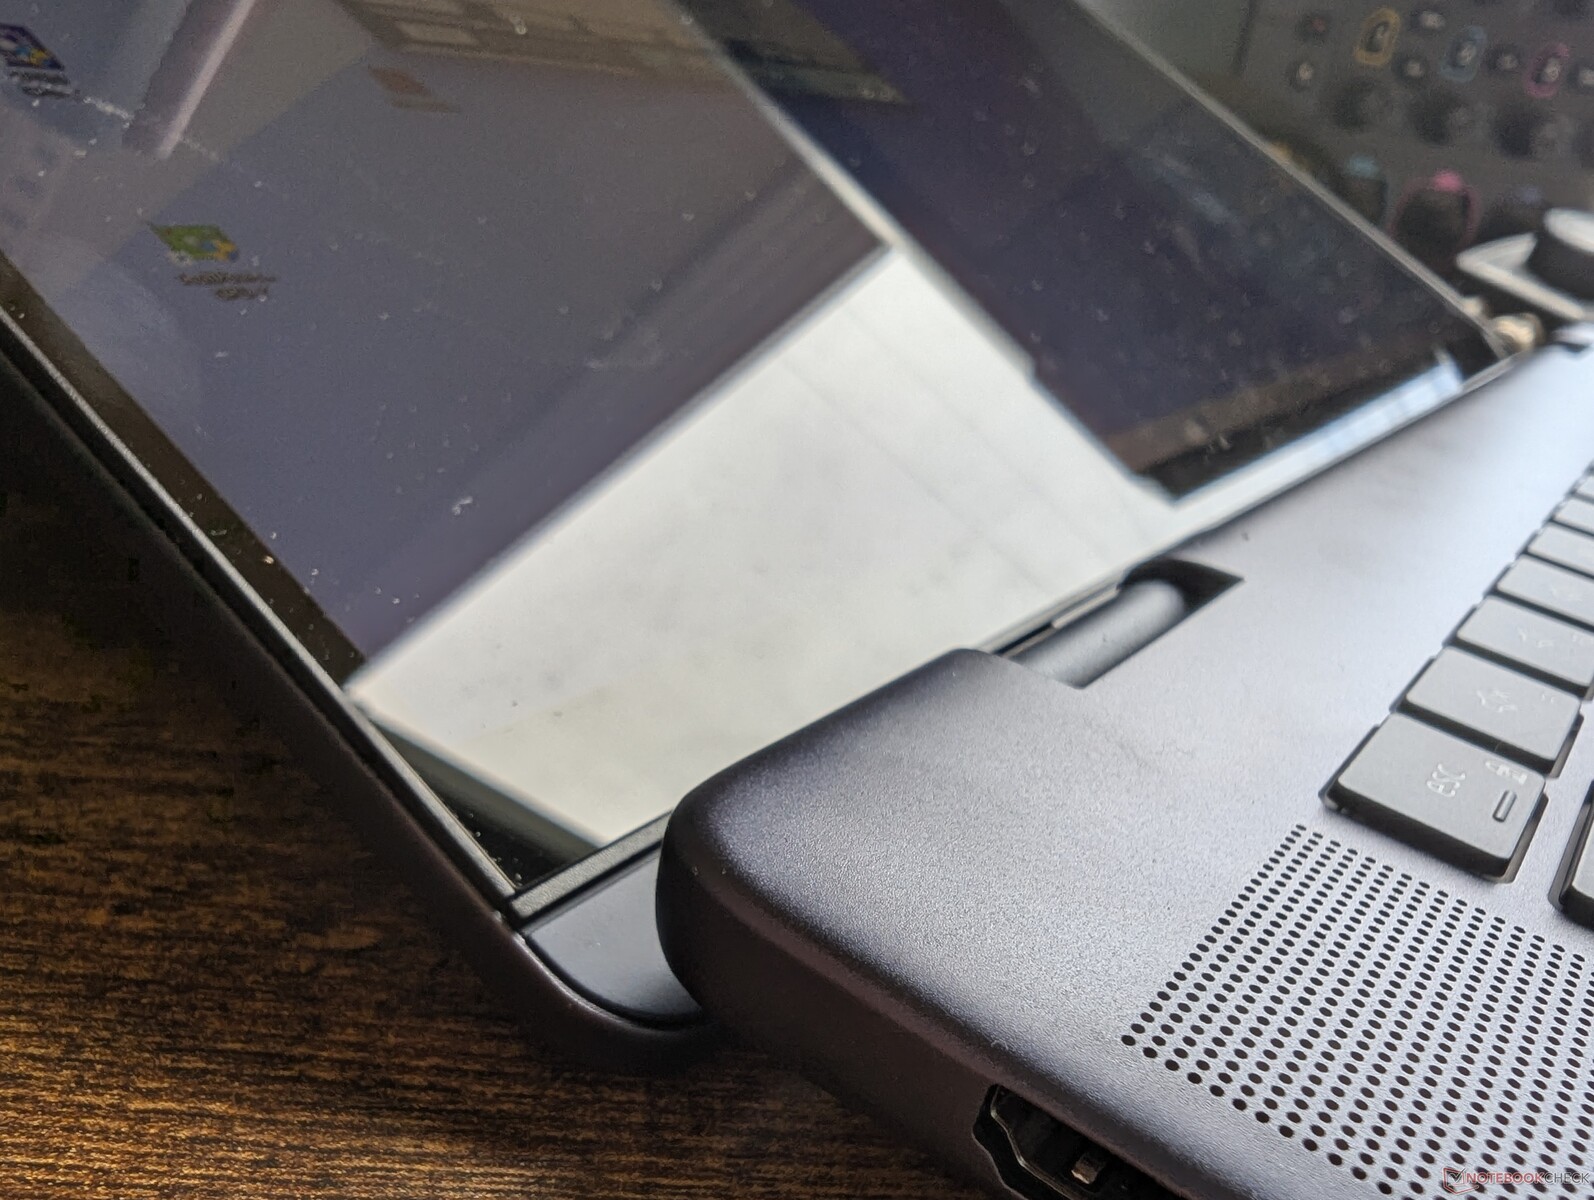
与老款产品相比,这款产品在外观上有几处变化。首先,掌托部分不再凸起,使其与键盘面板之间的边缘更加整洁。其次,底部和后边缘的通风栅经过重新设计,尺寸略有增大。第三,机身后缘的设计更加大胆,使机身显得更加方正。
除上述美学变化外,机箱材料与以前一样,在刚性和质量方面没有重大改进。盖子和底座仍然分别由铝合金和塑料组成,具有良好的抗扭曲和抗凹陷性,尤其是对于一款中端机型来说,给人的第一印象非常扎实。我们并不太担心该机型的制造质量,而是担心它在平板模式下使用时有多重。
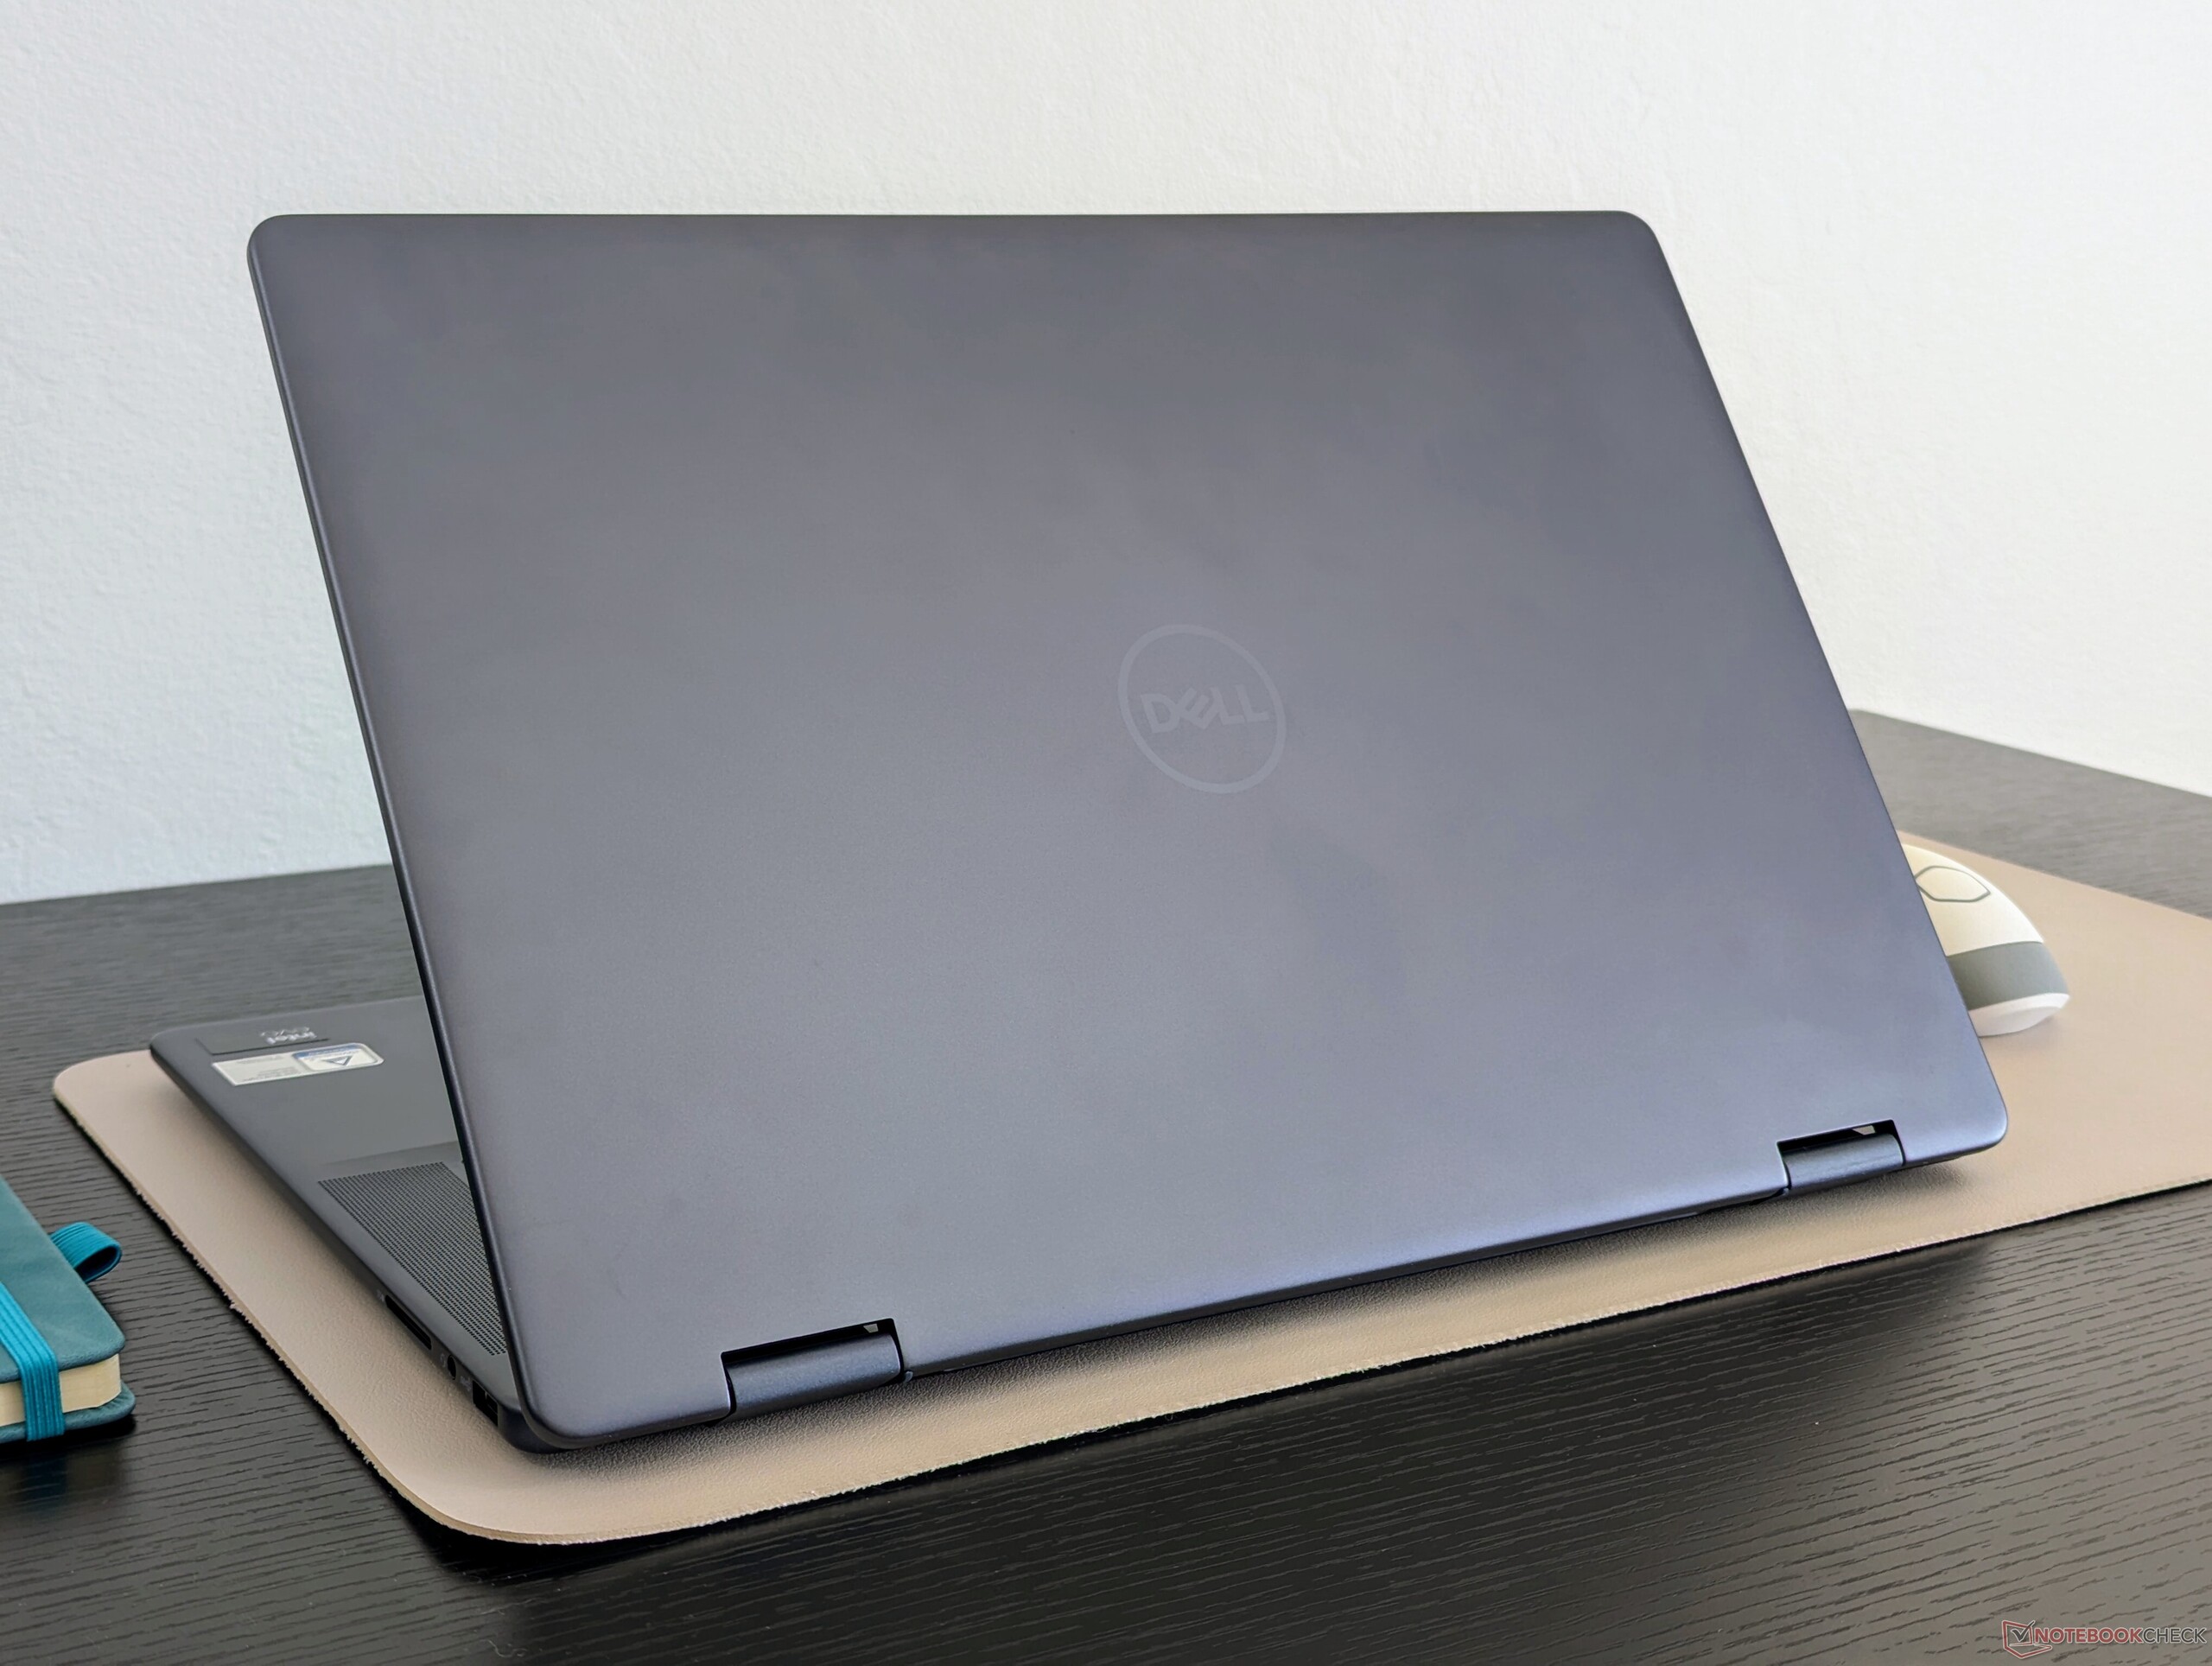
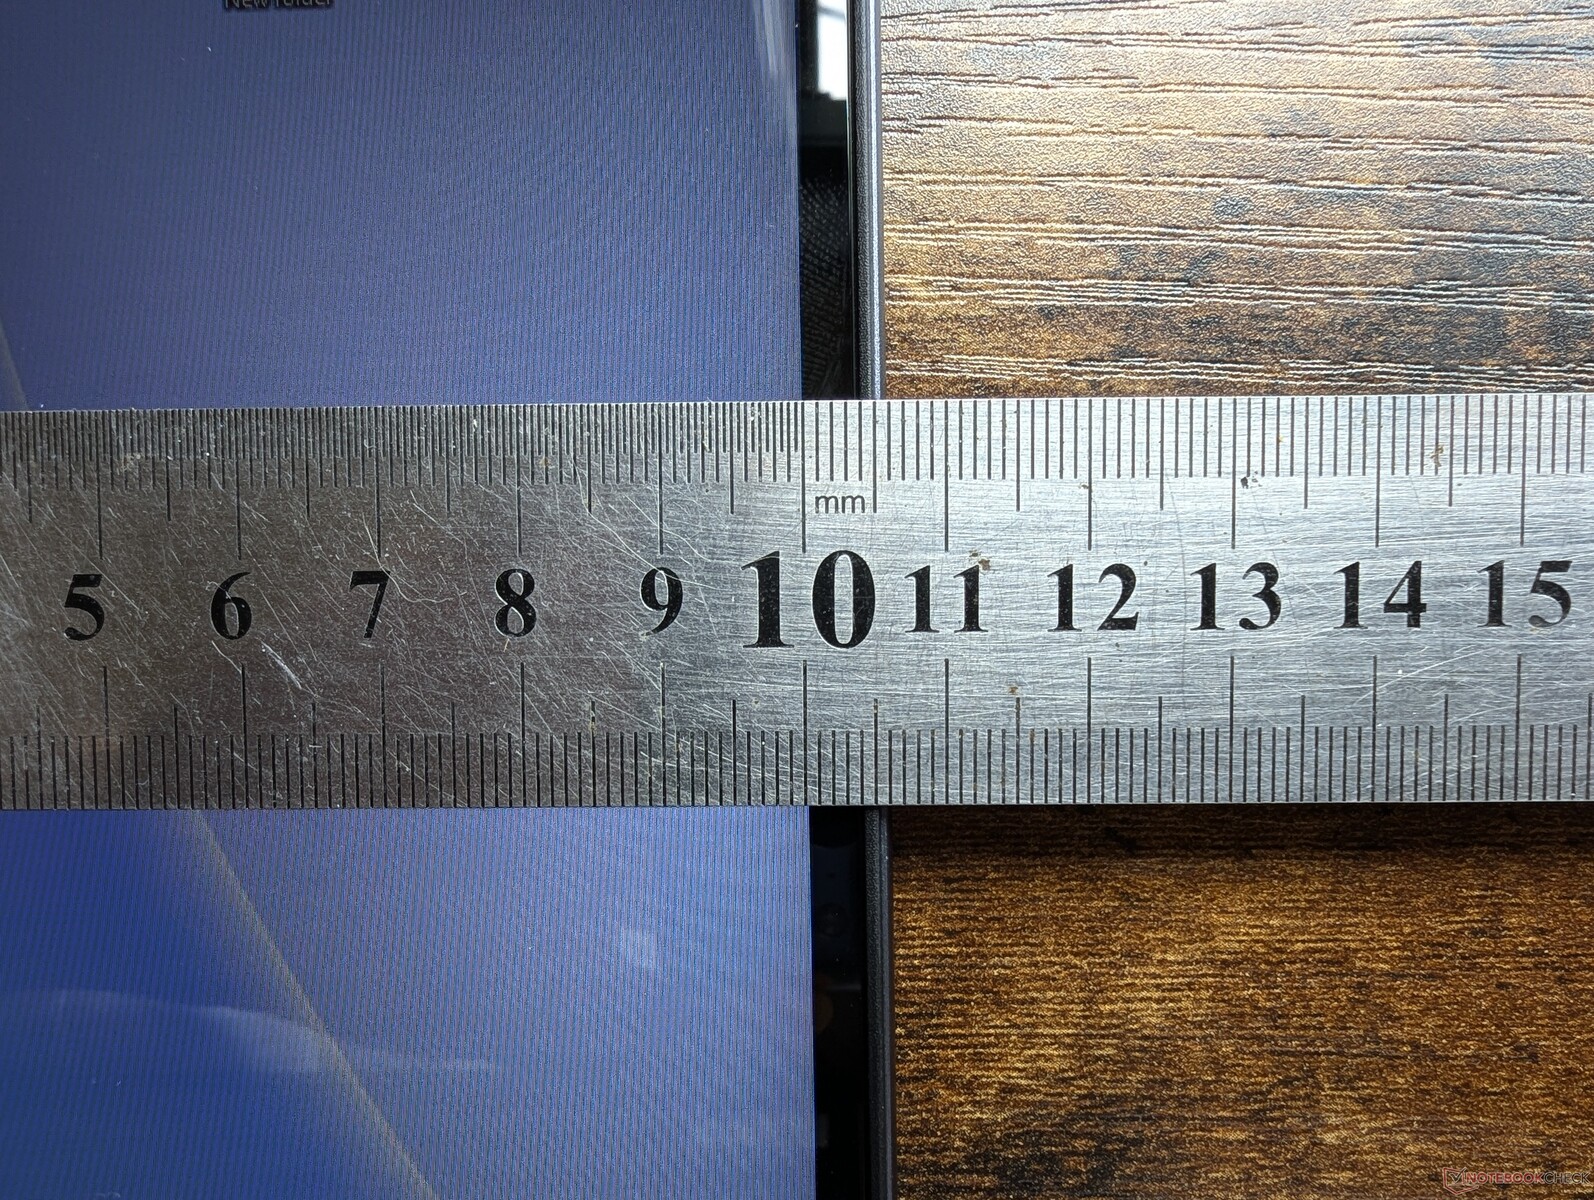
尺寸和重量几乎与 2023 Inspiron 16 7630 二合一和 2024 Inspiron 16 Plus 7640 Clamshell 尽管后者包含独立 GPU 选项。由于 16 英寸 HP Envy x360 16 和 2024 Inspiron 16 Plus 7640 都采用了独立 GPU 选项,因此我们更倾向于采用更轻的设计。 三星Galaxy Book4 Pro 360都明显比戴尔轻。虽然无论如何,16 英寸可折叠本都会相对较重,但 Inspiron 16 7640 2 合 1 可能是最不适合旅行的机型之一。

连接性
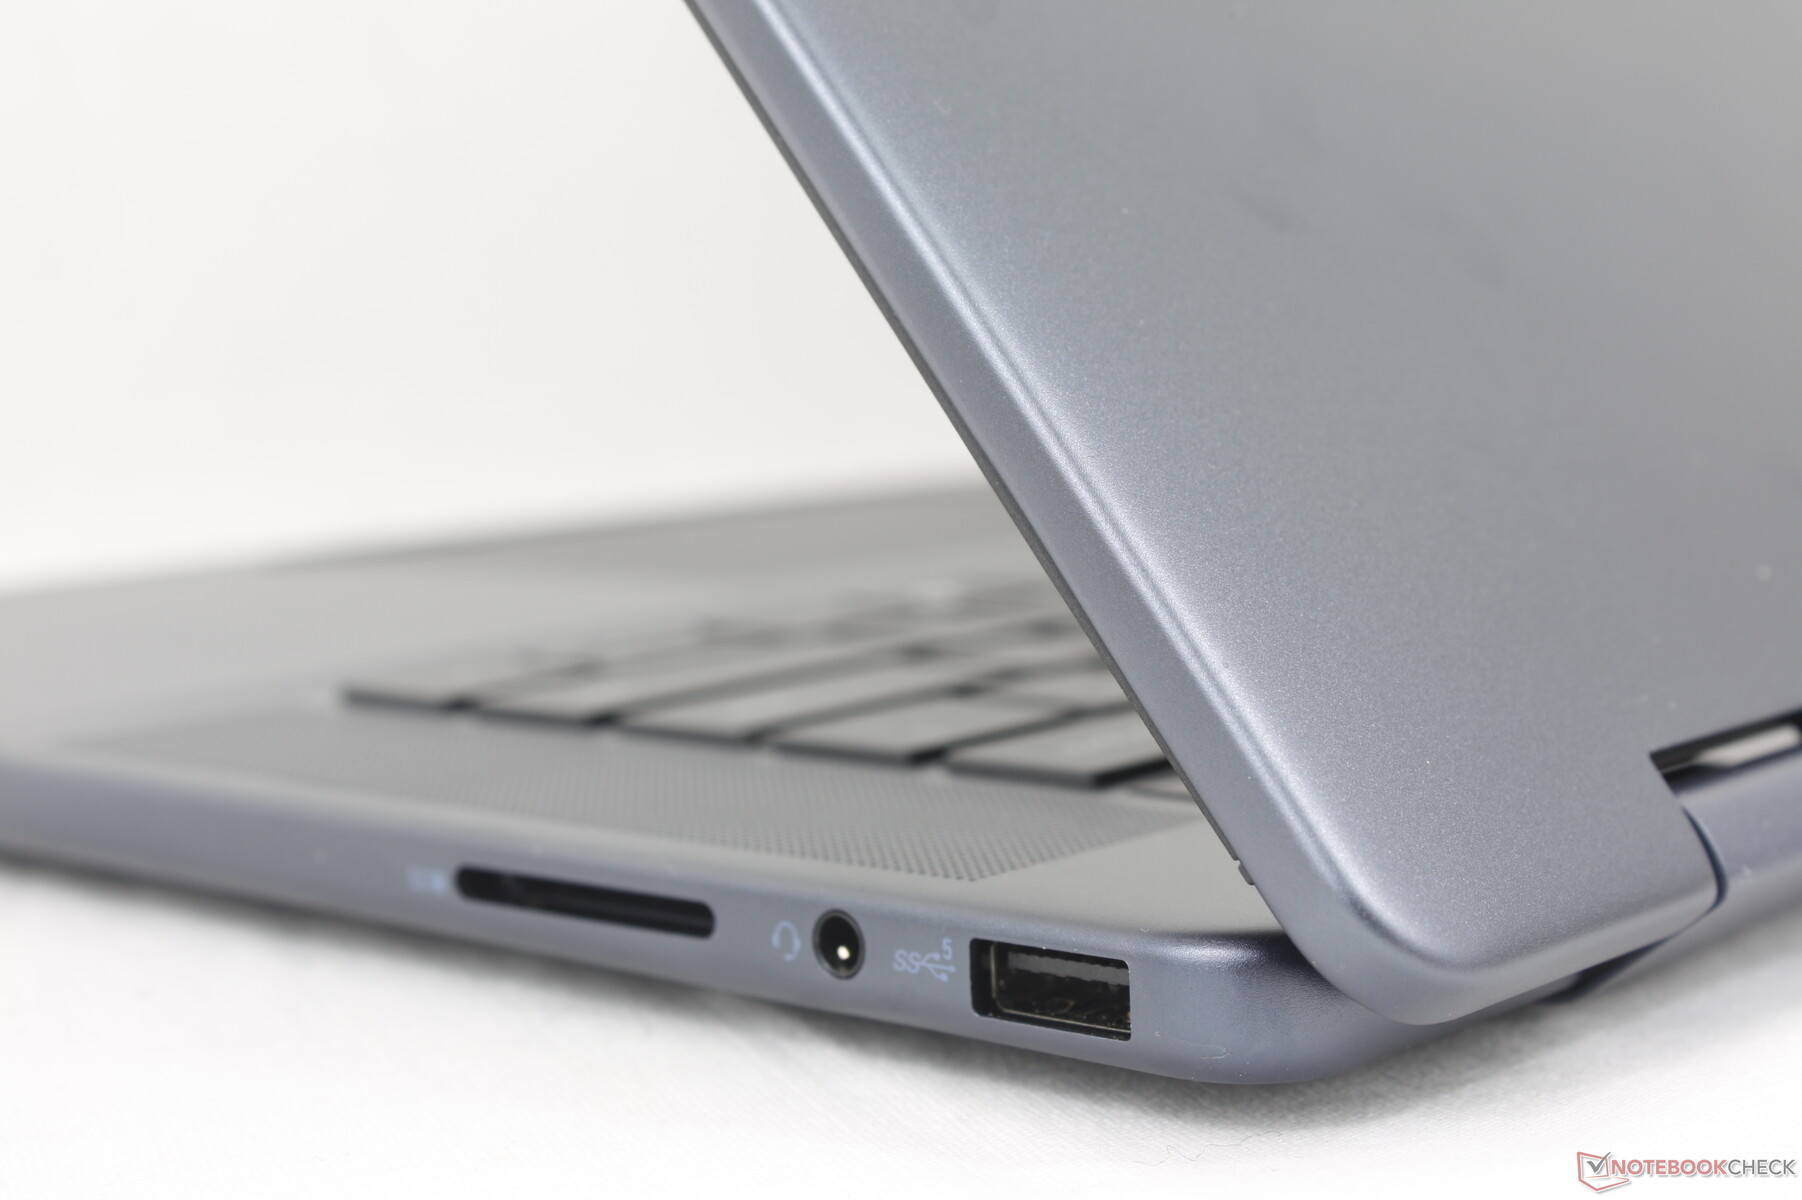
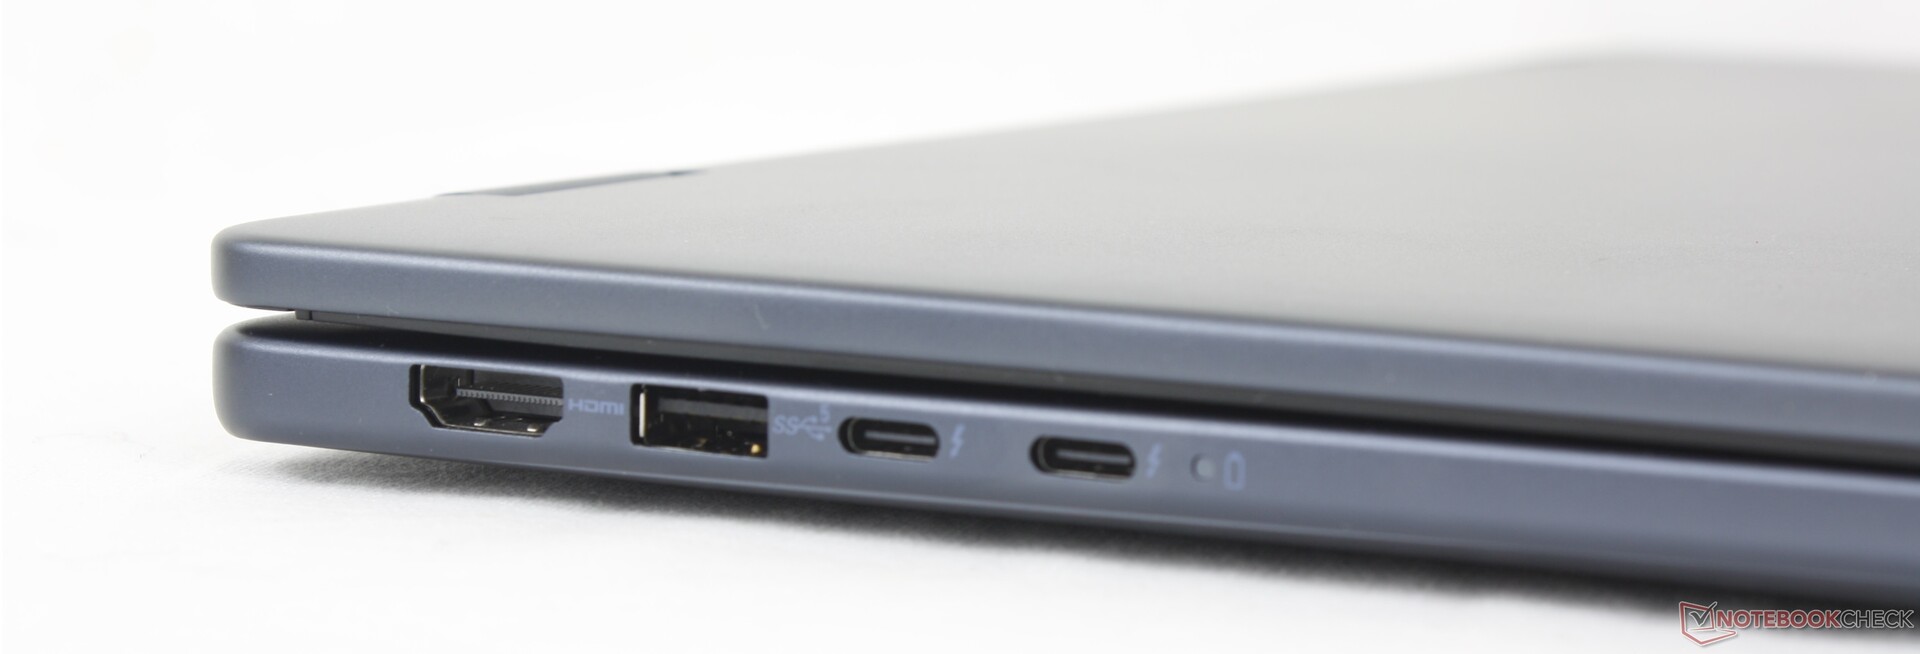
端口选项和位置与 Inspiron 16 7635 二合一或 7630 2-in-1 的端口选项和位置保持一致。需要注意的是,Thunderbolt 4 仍然只在英特尔 SKU 上提供,HDMI 端口仍然只有 1.4 版本。
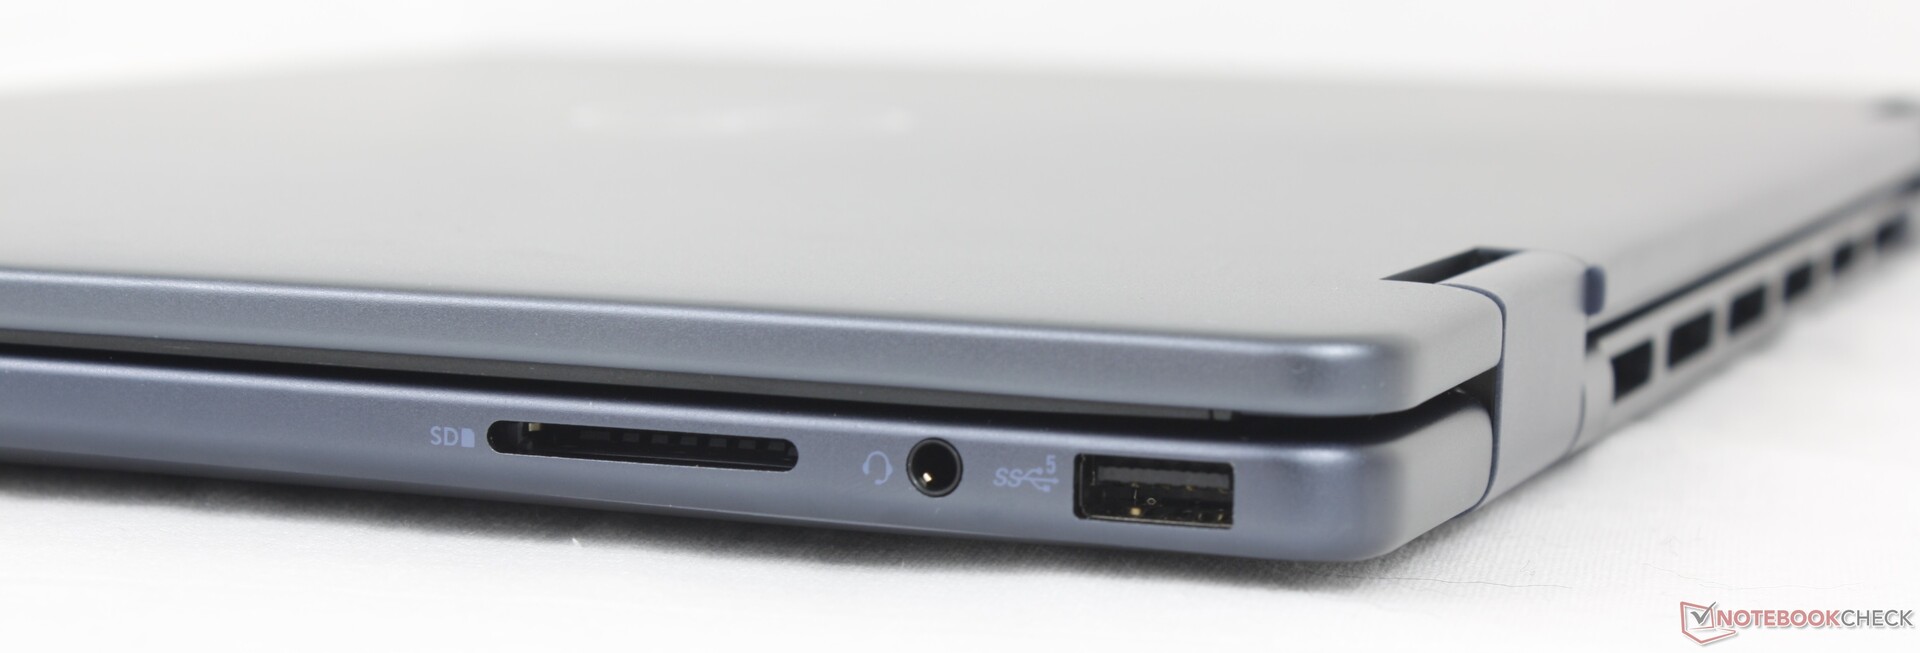
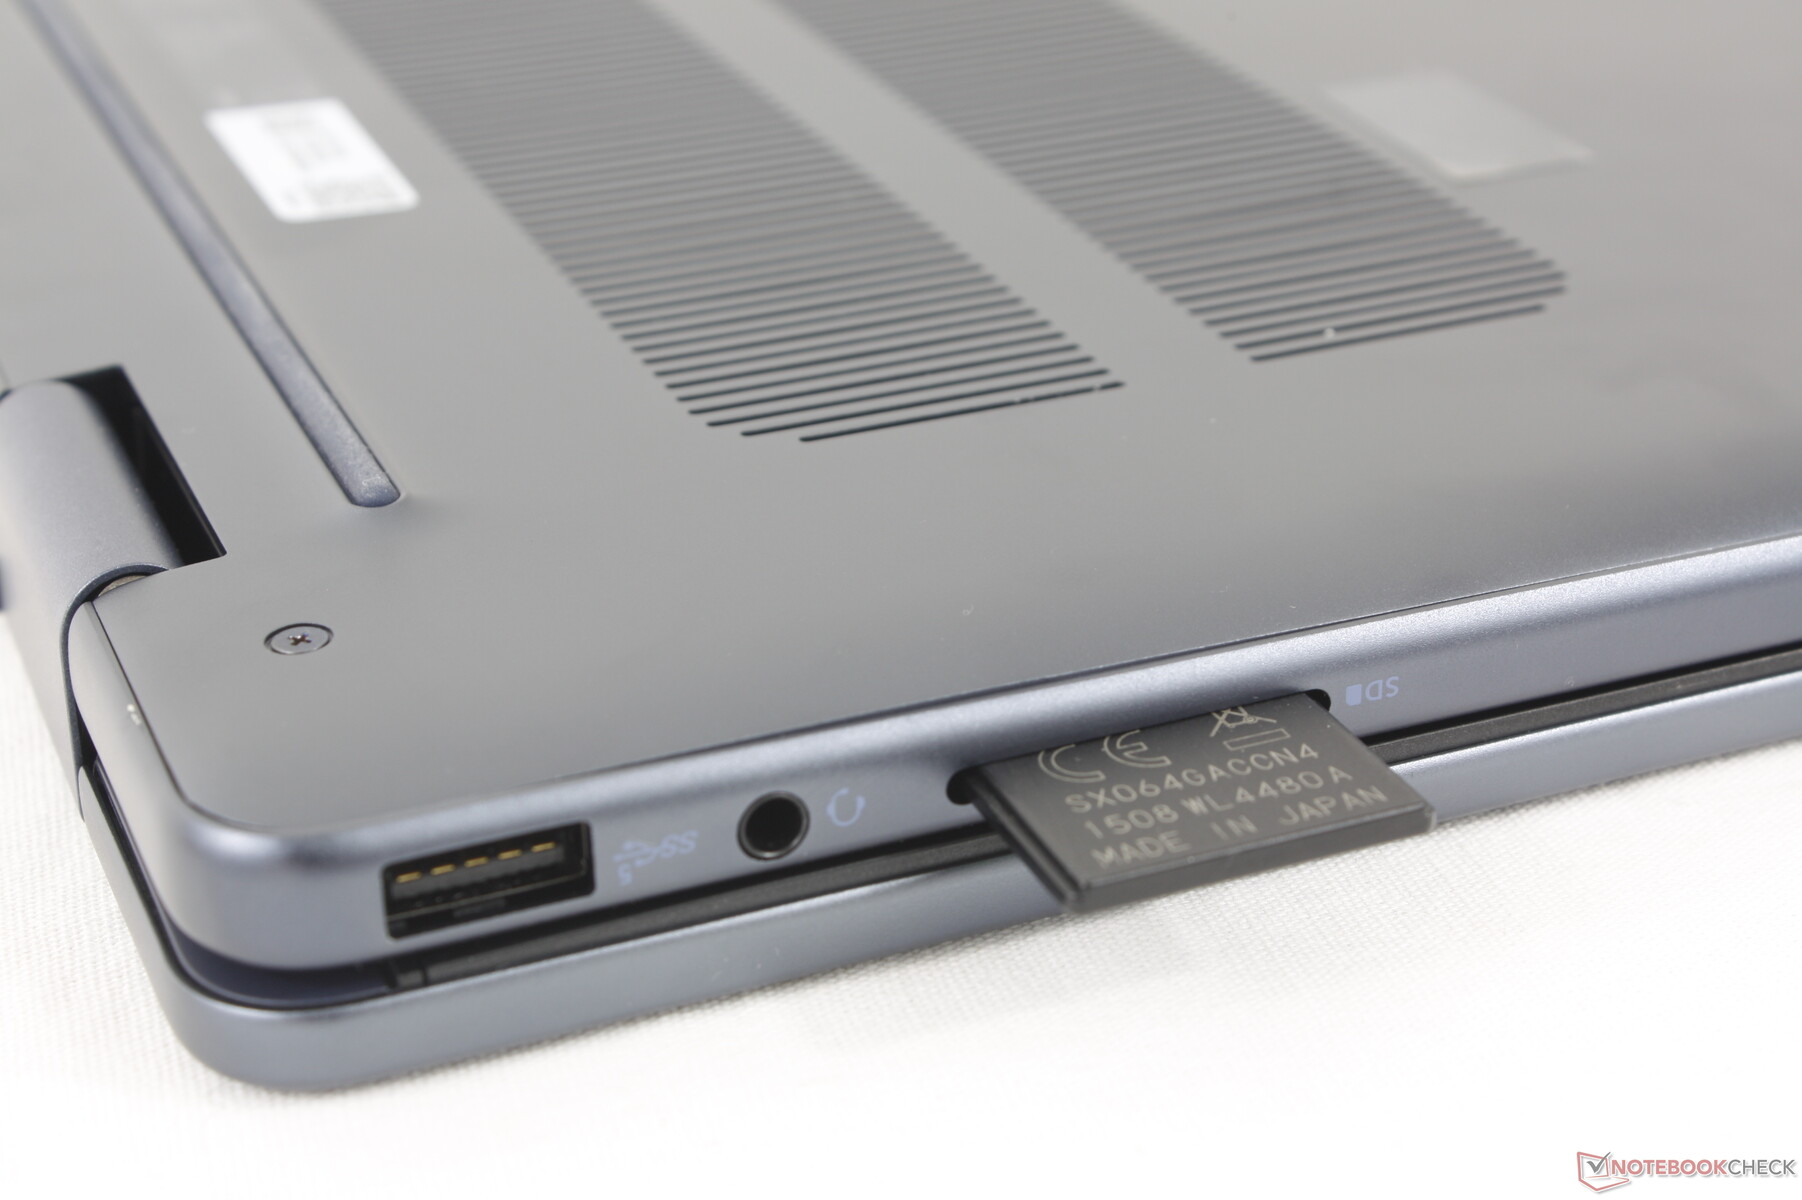
SD 读卡器
与去年的机型相比,集成 SD 读卡器的传输速率没有提高,只有不到 30 MB/s。联想 IdeaPad Pro 5 16 等 16 英寸蛤壳机的传输速度可提高 2 倍以上,而 XPS 16则更快。依赖 SD 卡的用户可能会喜欢 Inspiron 上方便的集成读卡器,但他们也可能会对其缓慢的速度感到失望。
| SD Card Reader | |
| average JPG Copy Test (av. of 3 runs) | |
| Samsung Galaxy Book4 Pro 360 (Angelbird AV Pro V60) | |
| Lenovo IdeaPad Pro 5 16IMH G9 (Angelbird AV Pro V60) | |
| Dell Inspiron 16 7635 2-in-1 (PNY EliteX-Pro60 V60 256 GB) | |
| Dell Inspiron 16 7640 2-in-1 (Toshiba Exceria Pro SDXC 64 GB UHS-II) | |
| Dell Inspiron 16 Plus 7640 (Angelbird AV Pro V60) | |
| maximum AS SSD Seq Read Test (1GB) | |
| Lenovo IdeaPad Pro 5 16IMH G9 (Angelbird AV Pro V60) | |
| Samsung Galaxy Book4 Pro 360 (Angelbird AV Pro V60) | |
| Dell Inspiron 16 7635 2-in-1 (PNY EliteX-Pro60 V60 256 GB) | |
| Dell Inspiron 16 7640 2-in-1 (Toshiba Exceria Pro SDXC 64 GB UHS-II) | |
| Dell Inspiron 16 Plus 7640 (Angelbird AV Pro V60) | |
交流
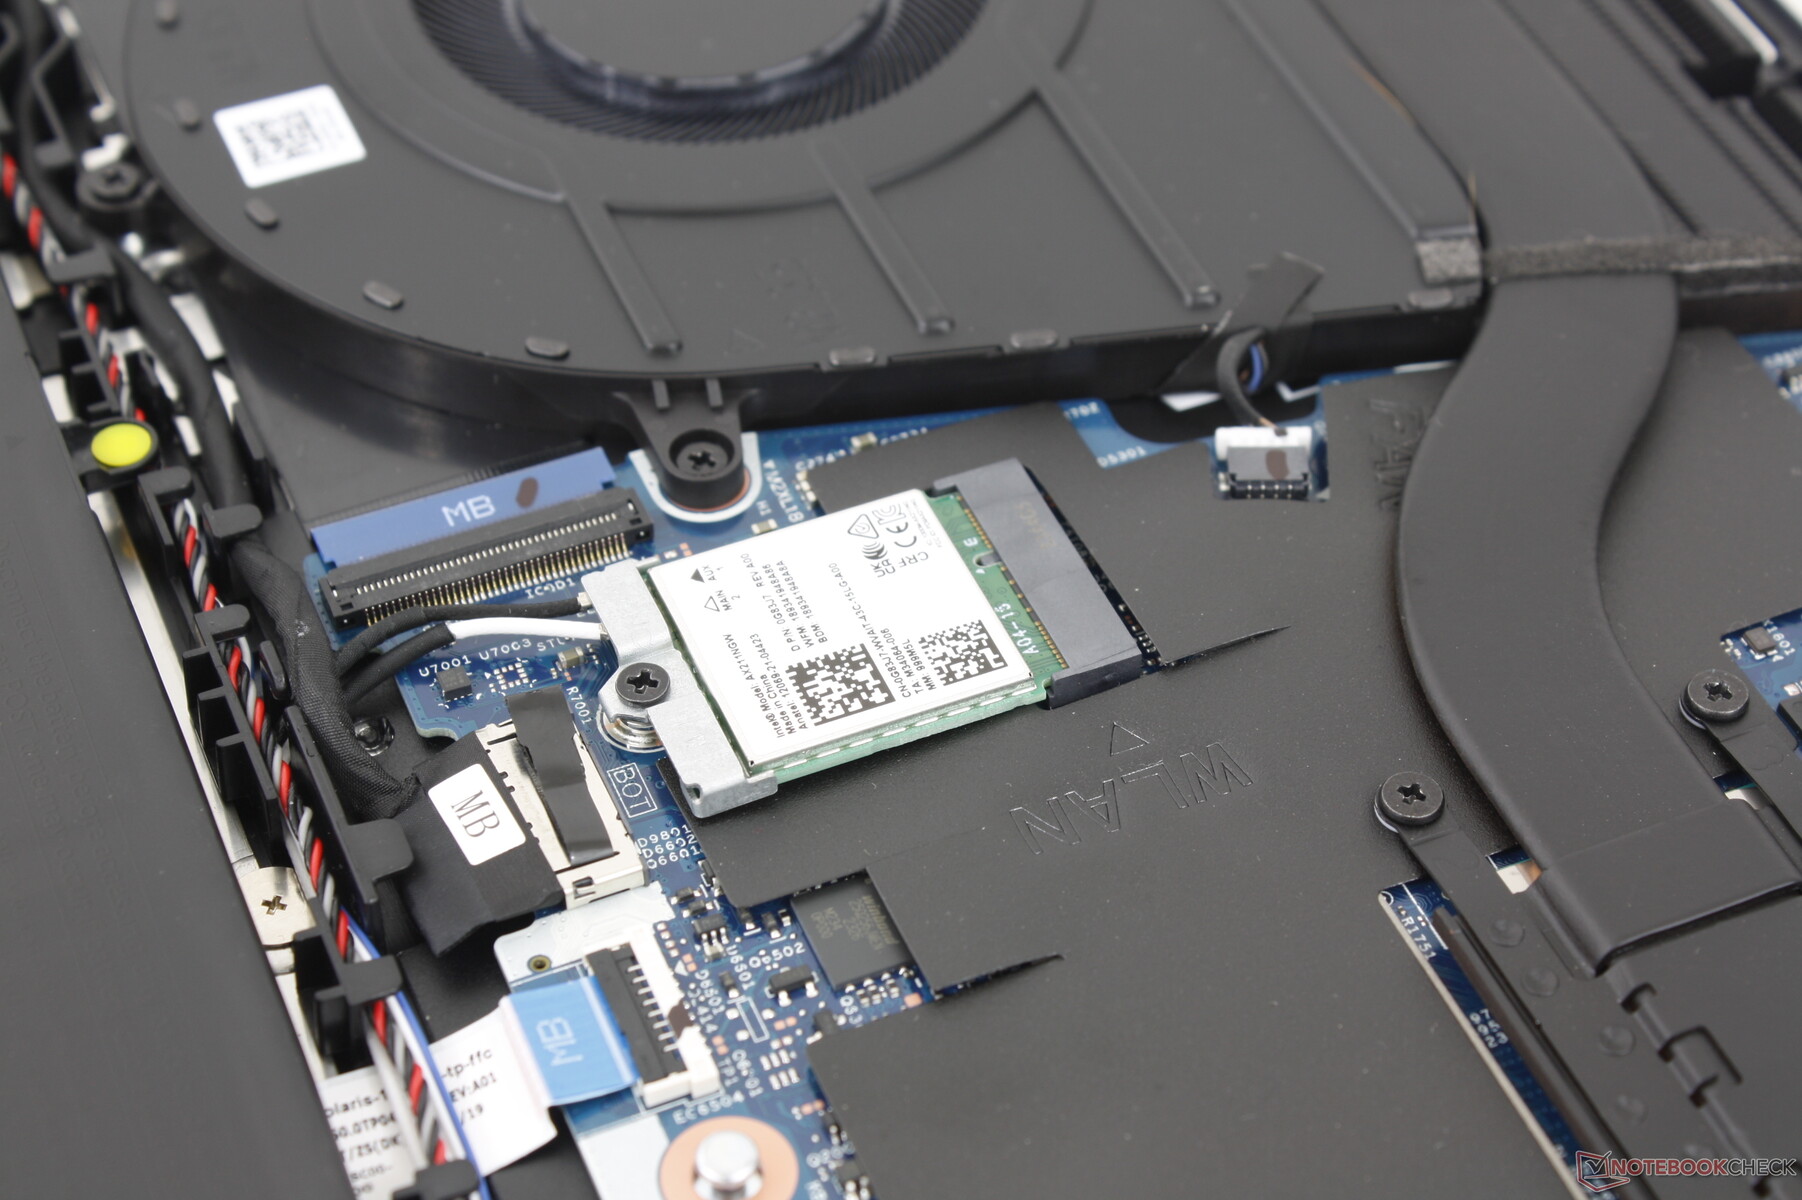
该机型配备了与 Inspiron 16 7640 Clamshell 相同的英特尔 AX211 WLAN 模块,可实现 Wi-Fi 6E 和蓝牙 5.3 连接。与华硕 AXE11000 测试路由器配对后,性能表现稳定,但 6 GHz 网络传输速率可能会更快。
网络摄像头
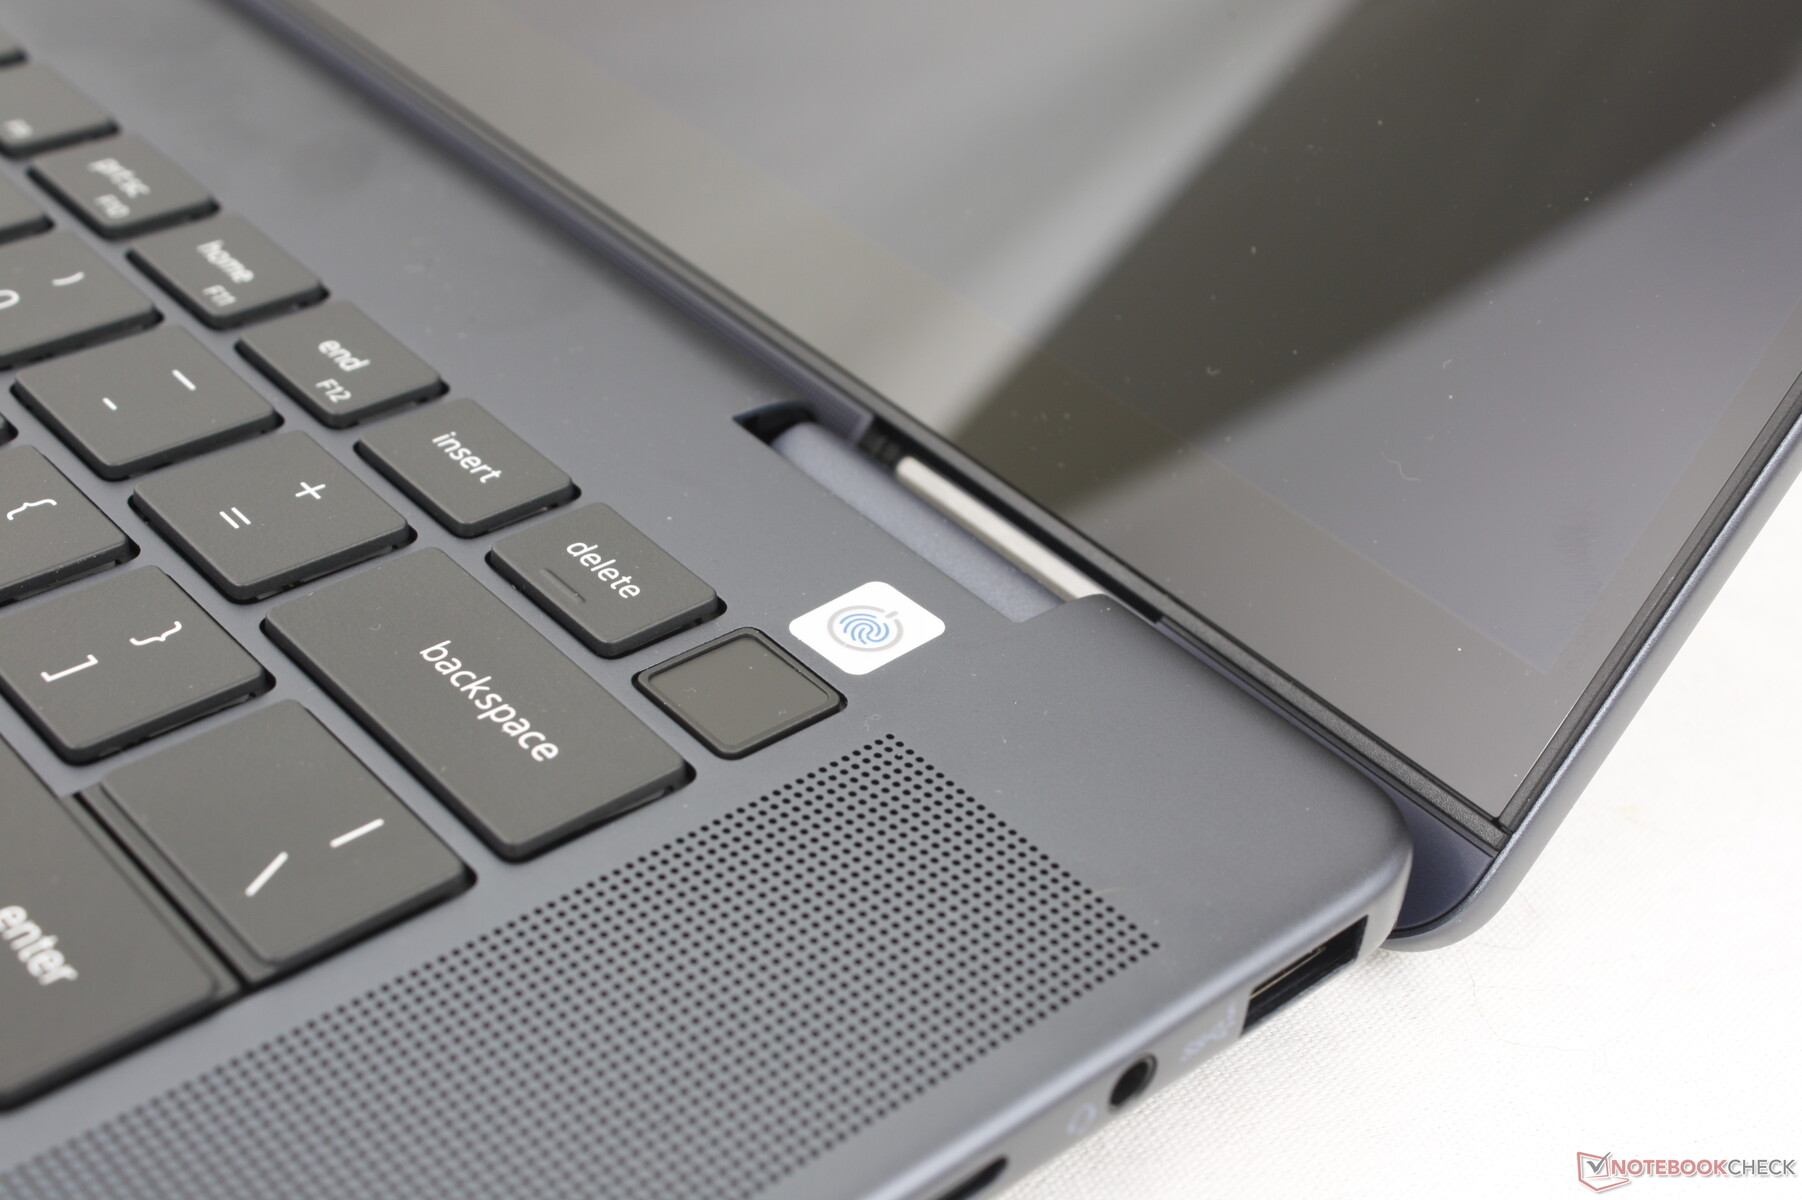
200 万像素网络摄像头再次标配红外传感器和物理快门。


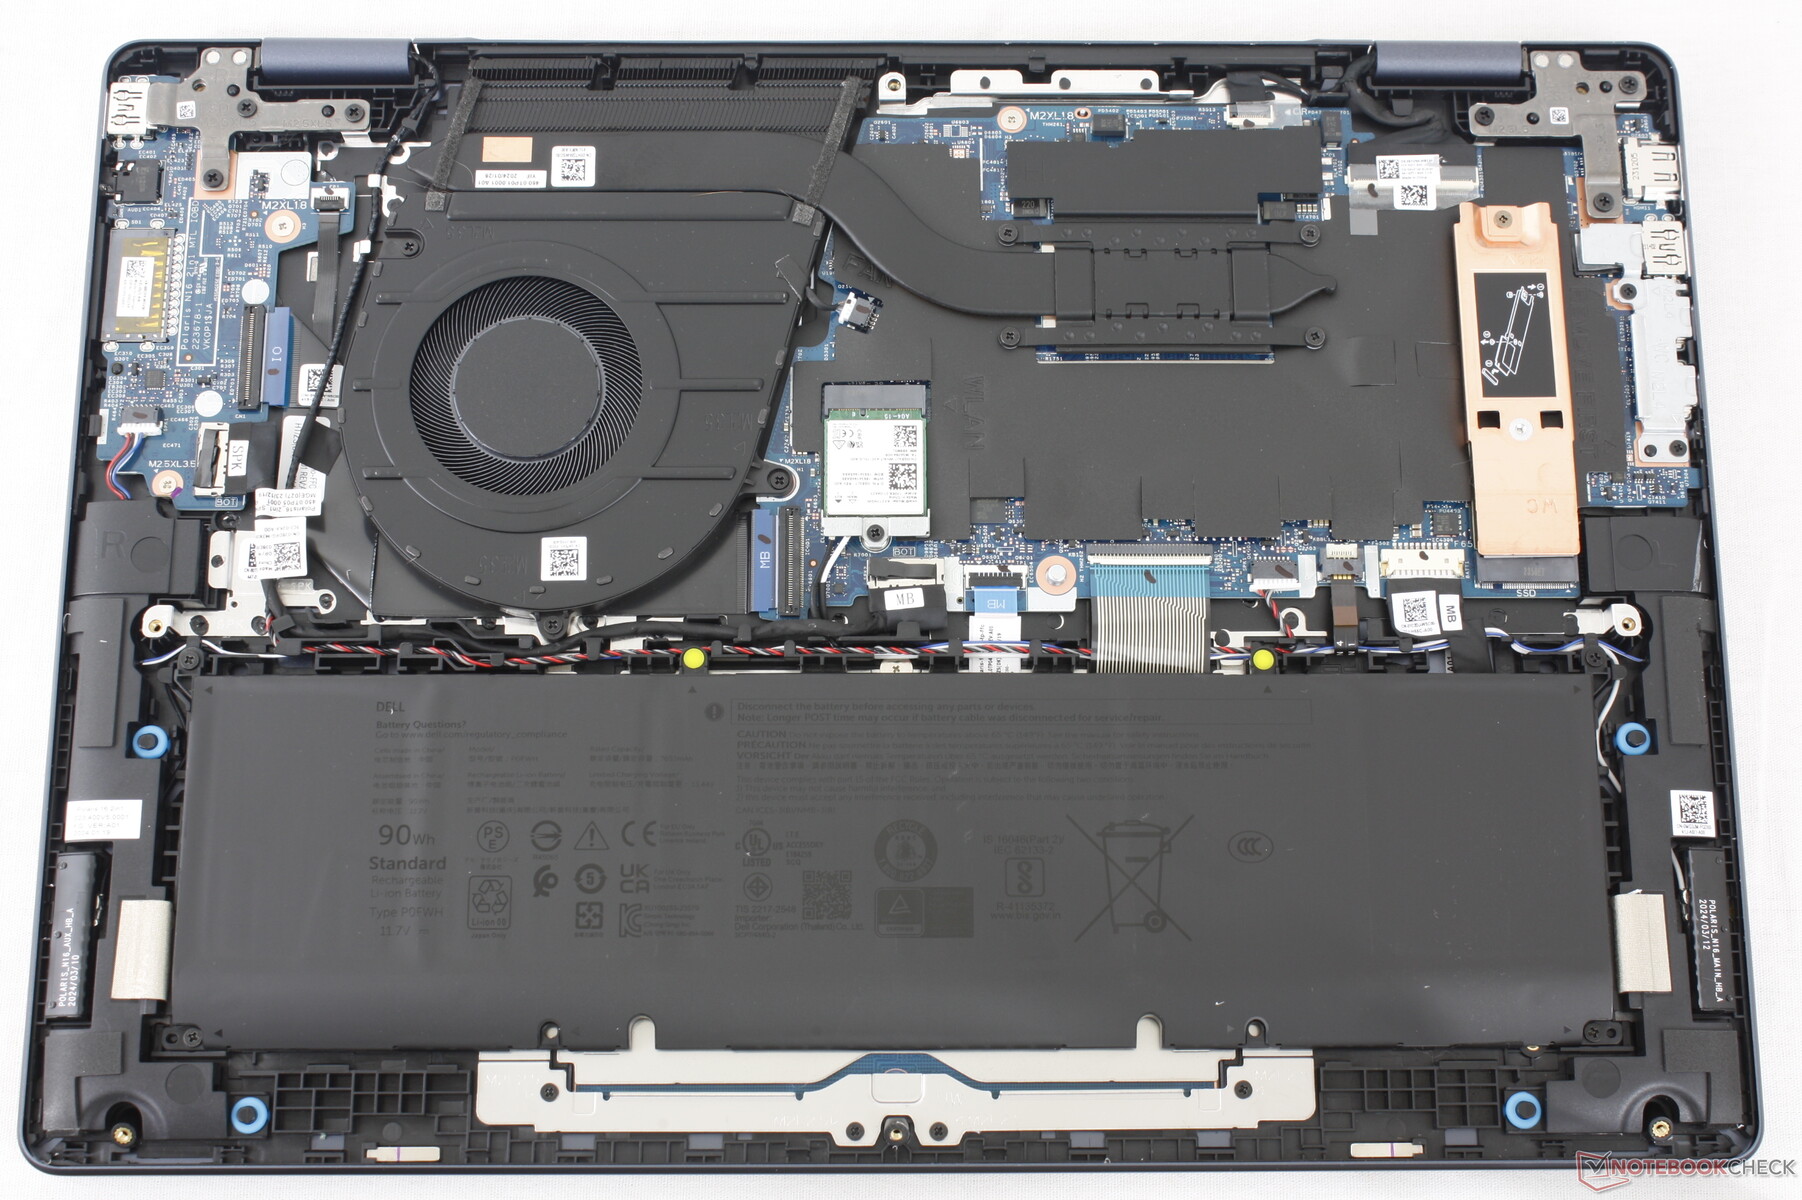
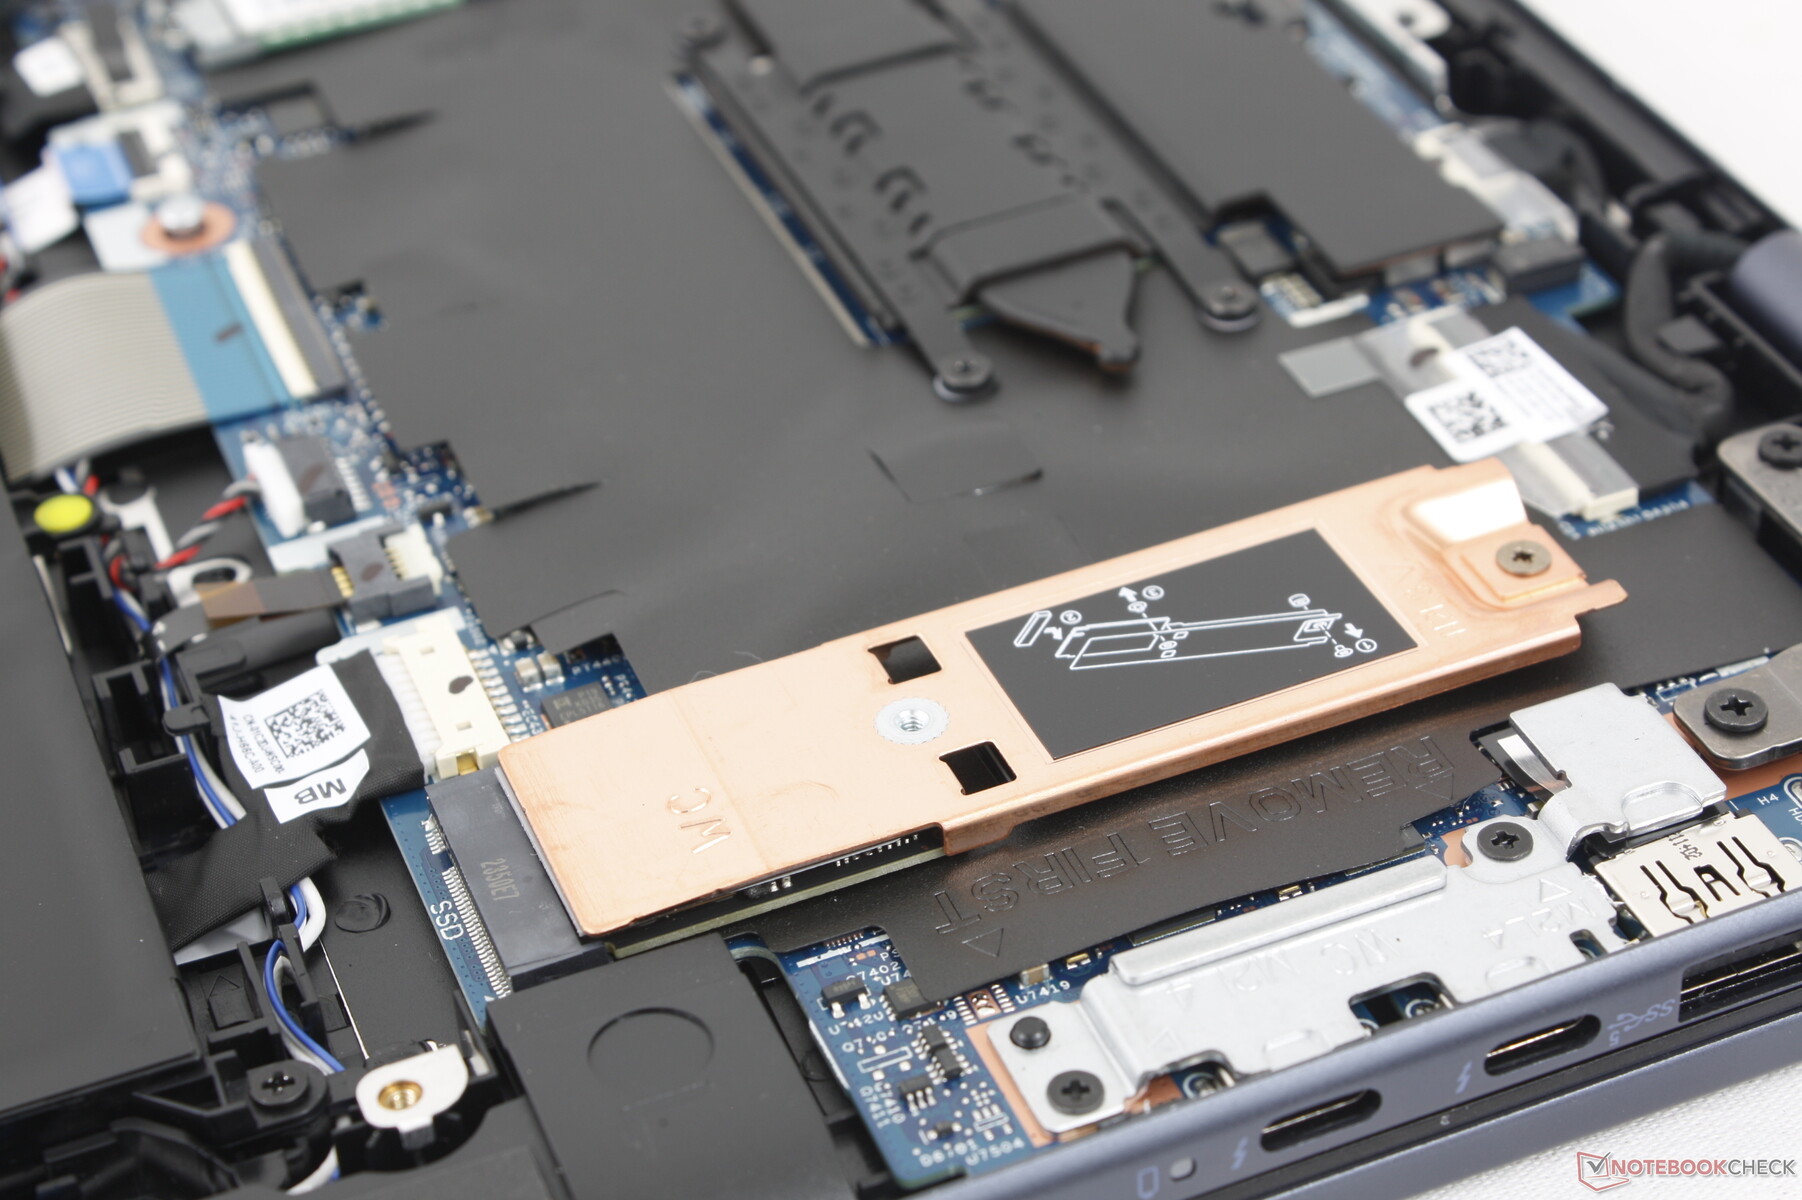
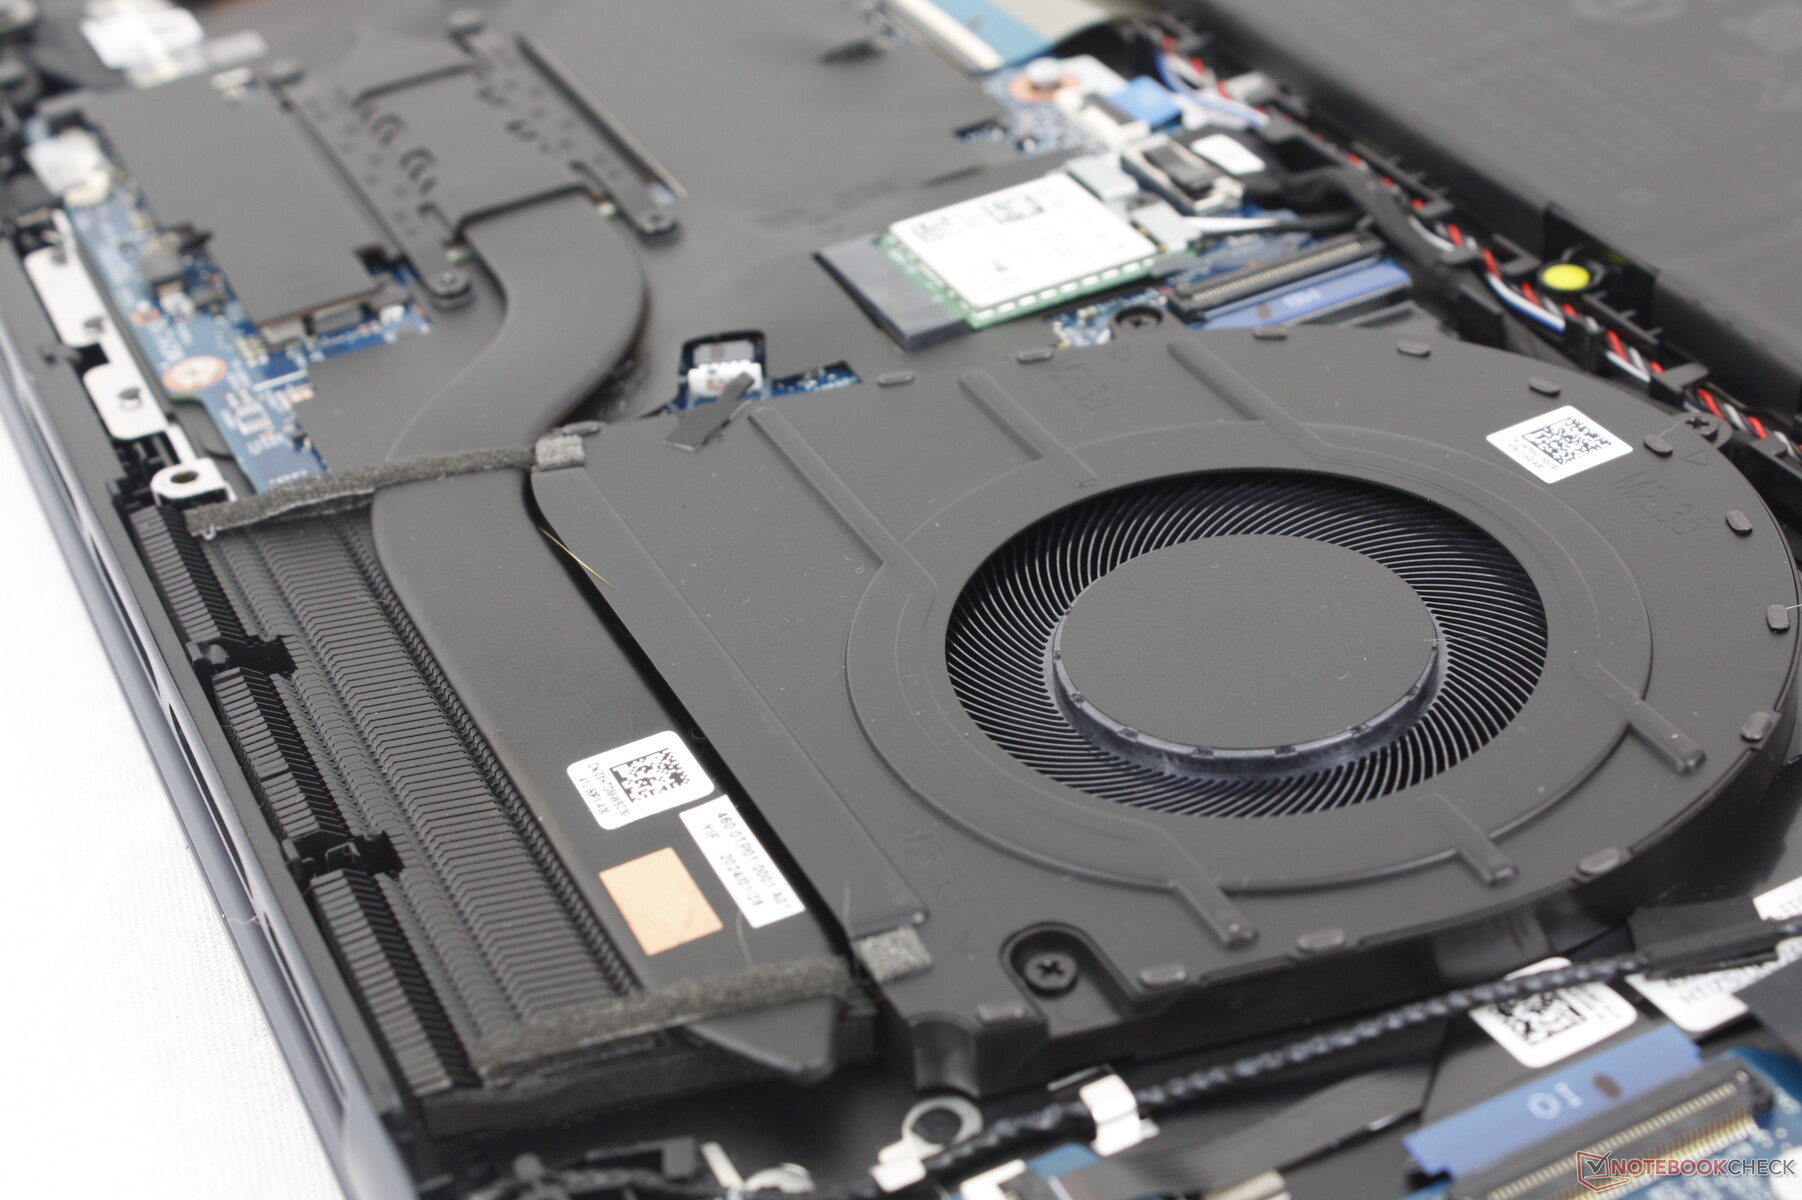
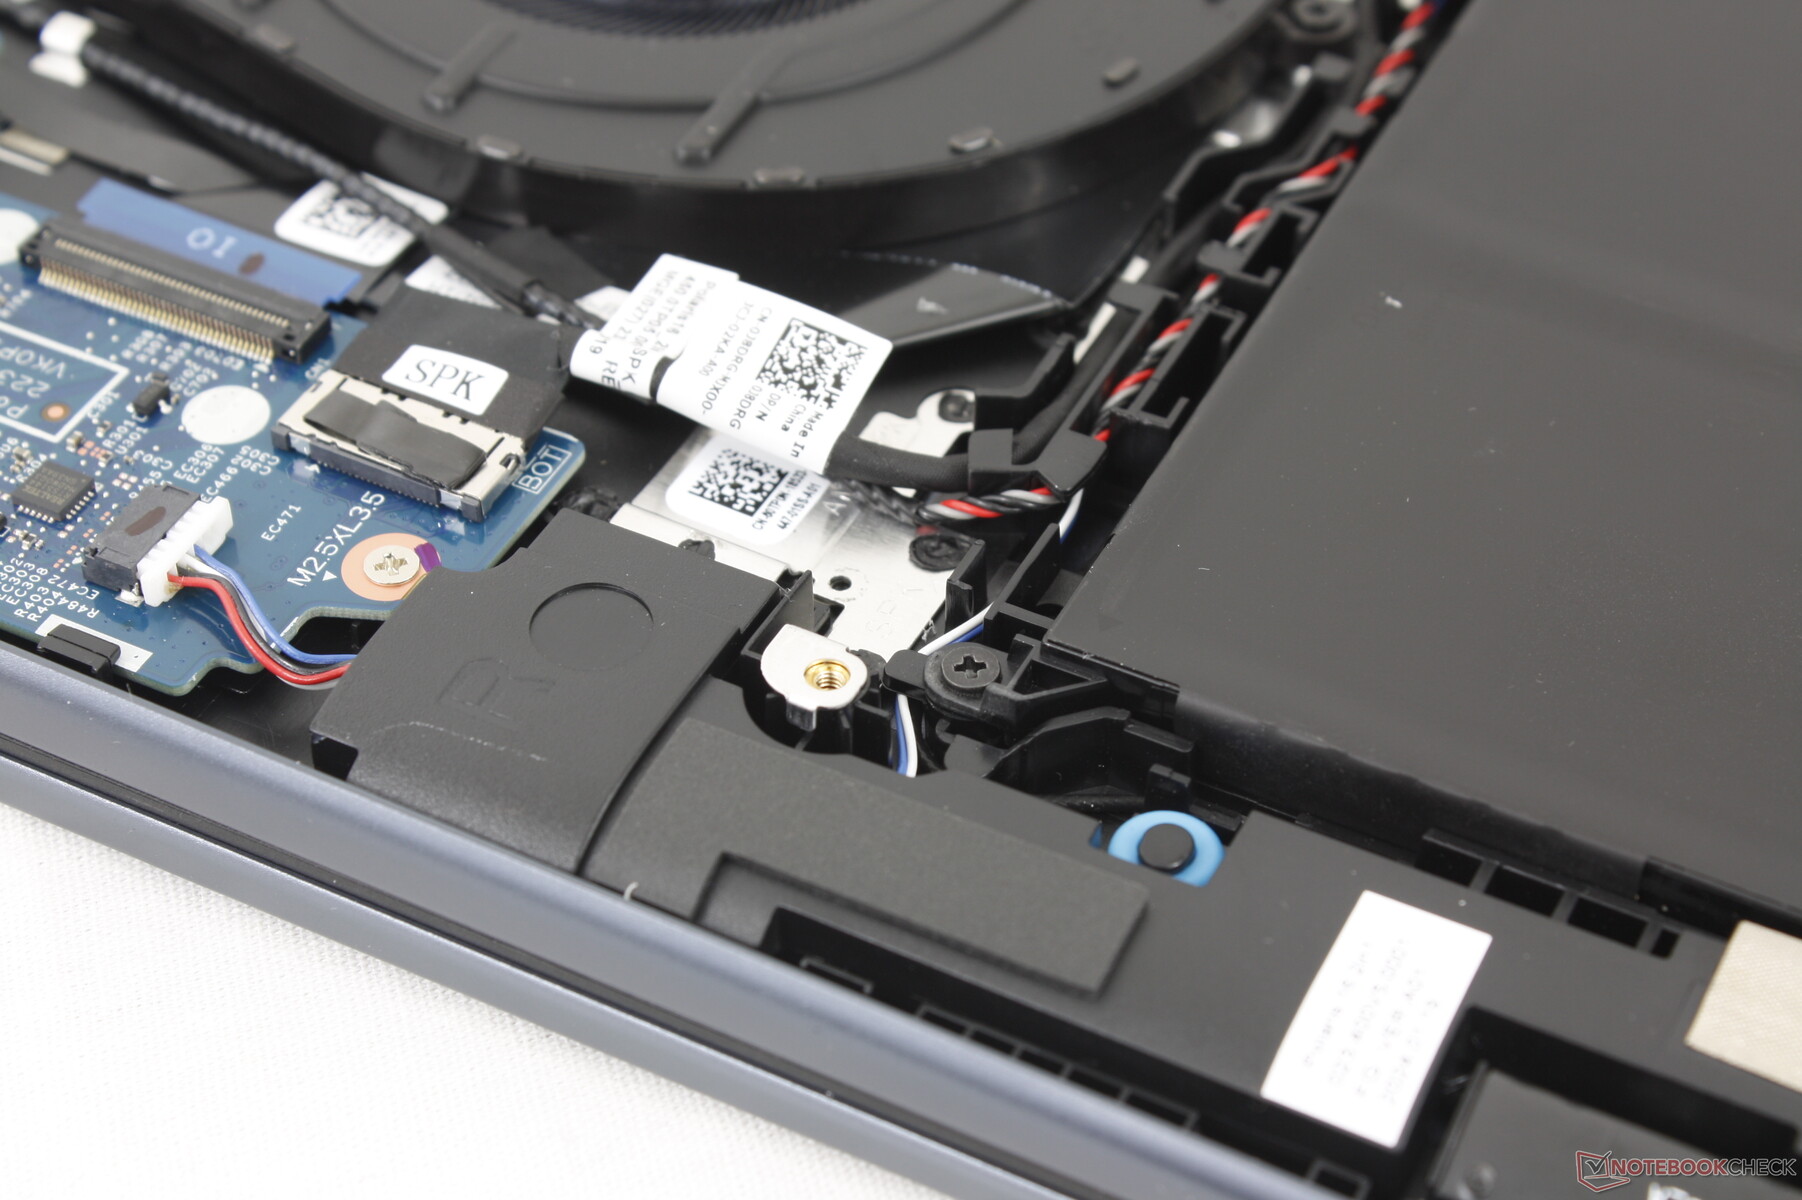
维护
我们的机型与去年的 Inspiron 16 7635 2 合 1 有几处内部差异。特别是固态硬盘的位置进行了调整,以便为更大的风扇和电池腾出空间,而热管现在略微变粗,以补偿较短的长度。仍然不支持二级固态硬盘,用户也无法升级内存。

配件和保修
零售包装盒中除了文件和交流适配器外,还包括一支有源触控笔 (PN5122W)) 和交流适配器。如果在美国购买,则适用标准的一年有限保修服务。
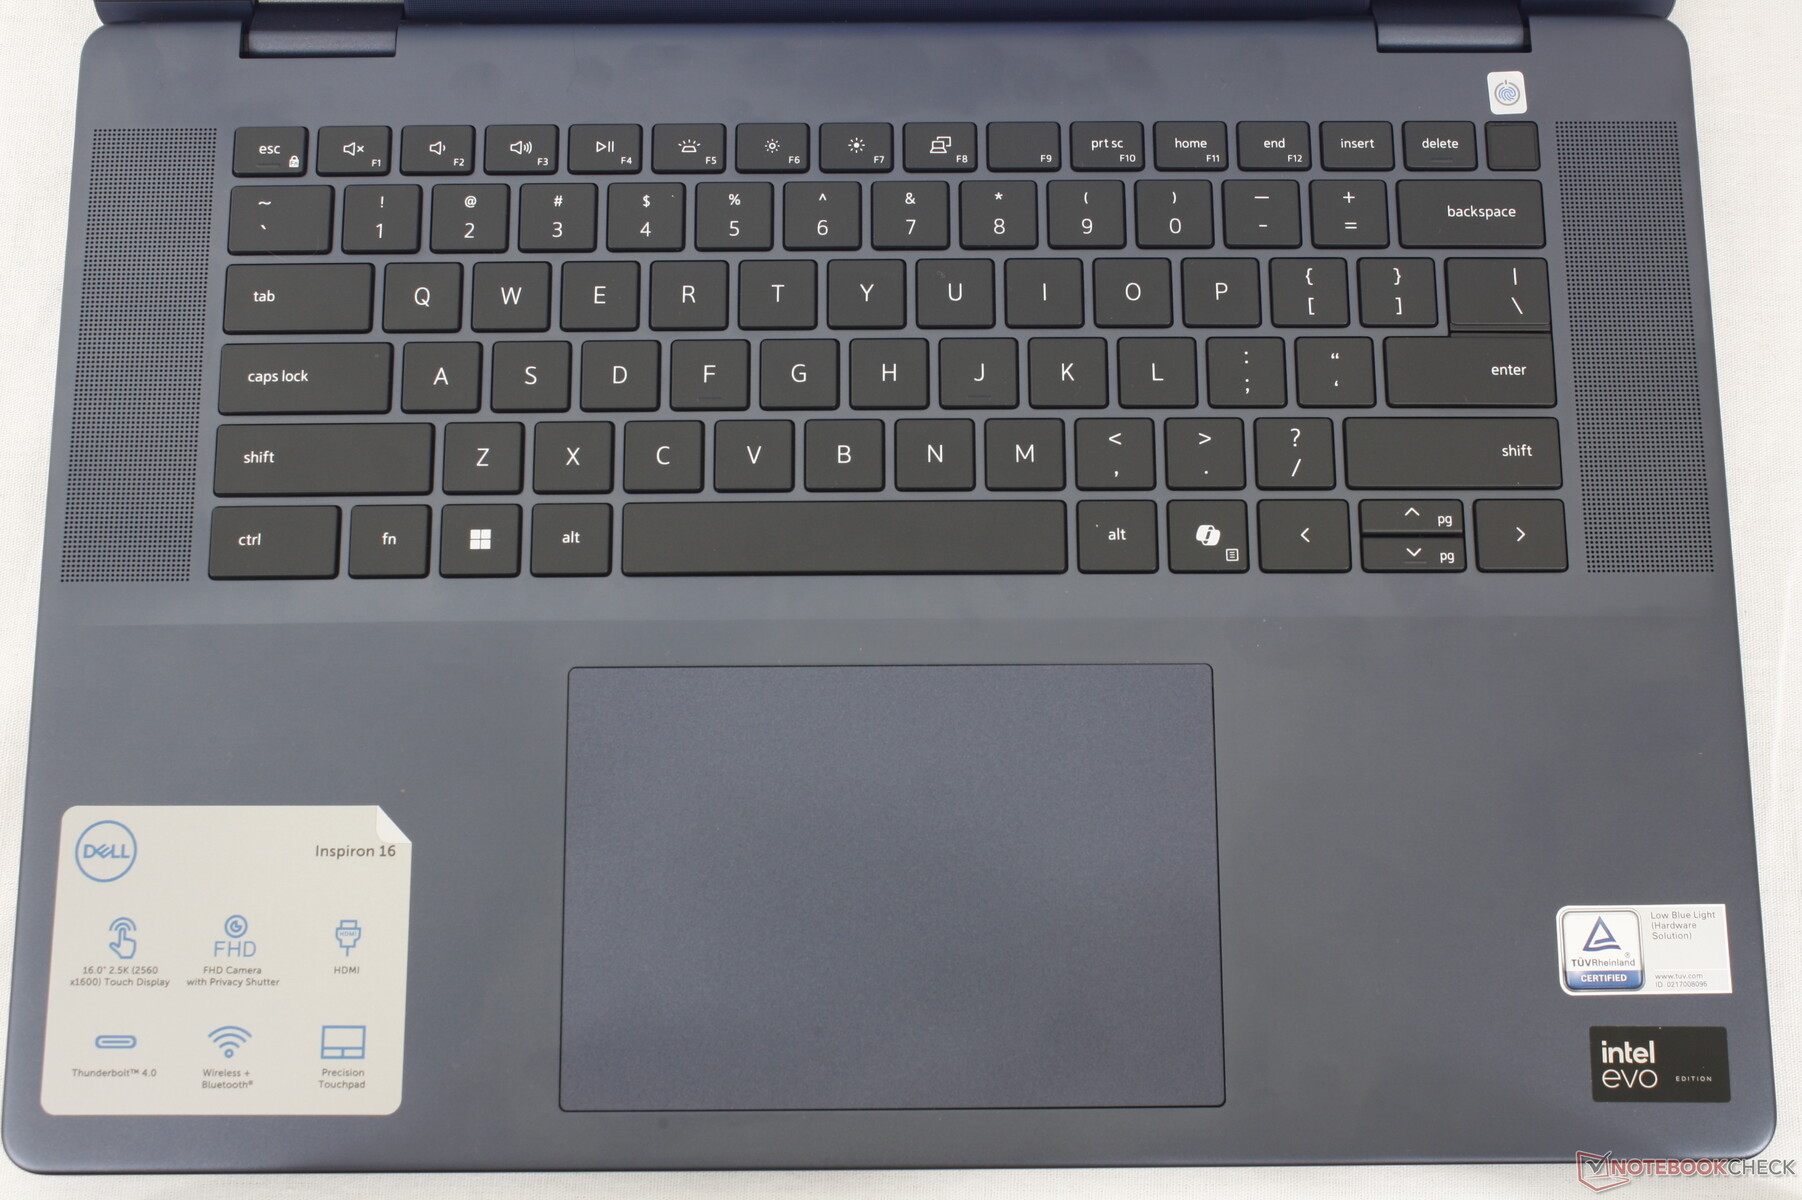
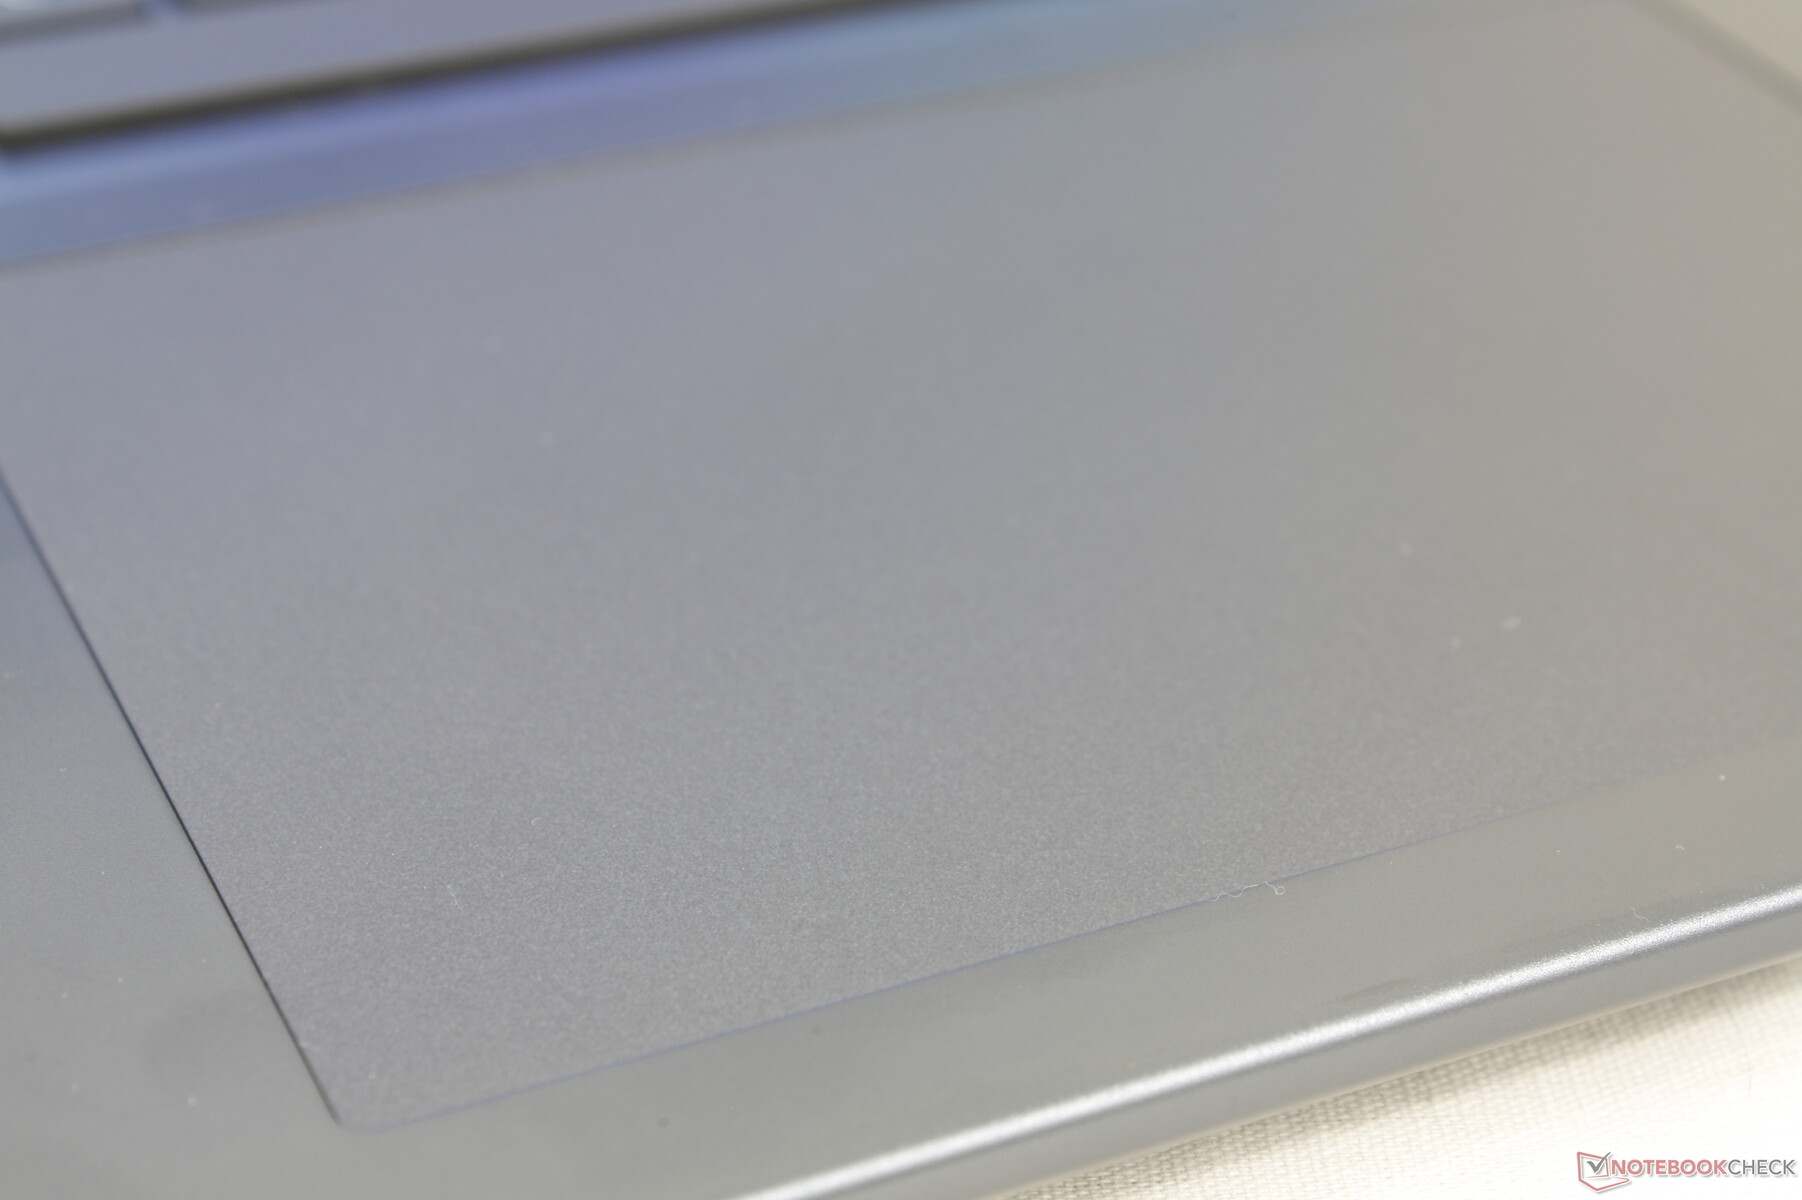
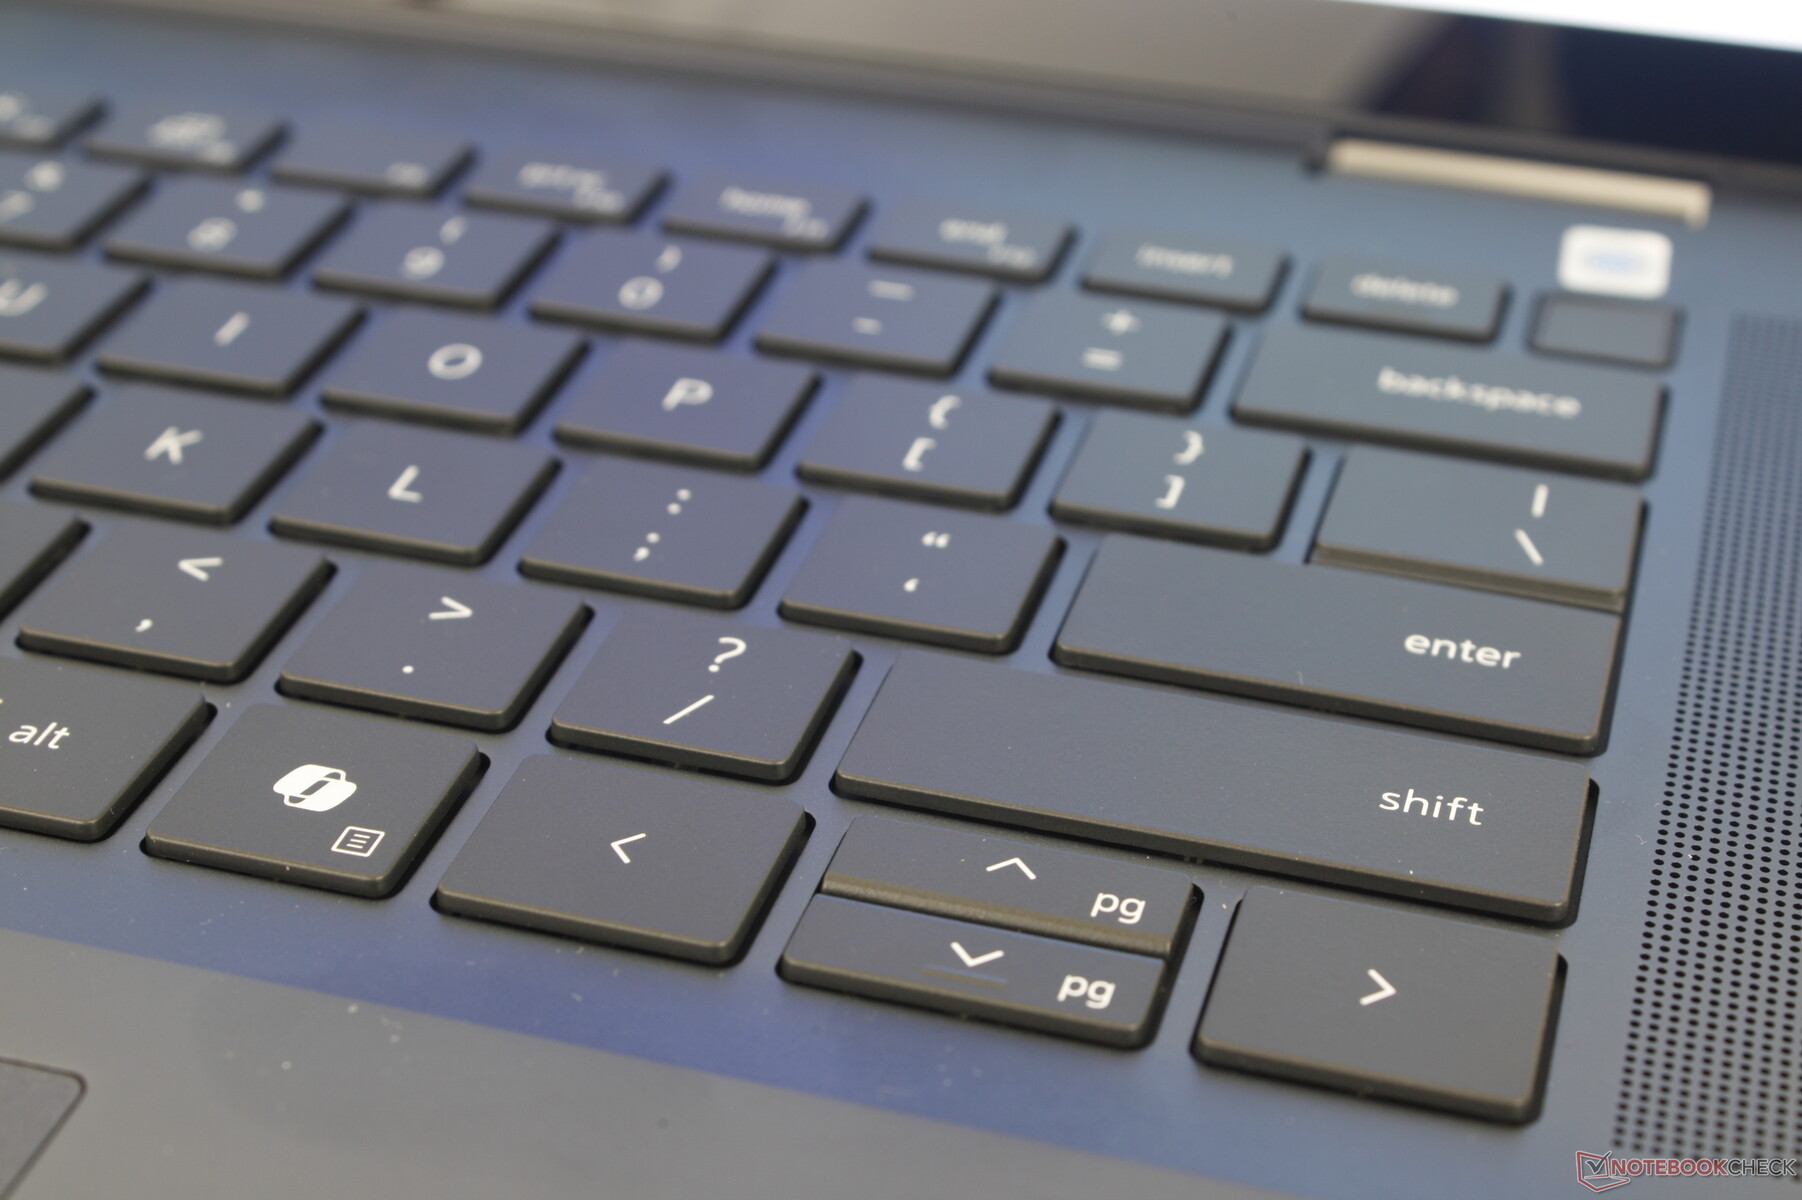
输入设备--不错,但仍有点松散
键盘和触摸板
尽管 Inspiron 7630 2 合 1 系列机身上的其他地方发生了物理变化,但键盘和触摸板与 Inspiron 7630 2 合 1 系列相比没有任何变化。虽然有一些细微的差别,比如我们的新机型上的电源键略微小了一些,并引入了专用的副驾驶键,但从触控板尺寸(13.3 x 9 厘米)到按键反馈都与去年的机型相同。如果能在这方面有所改进就更好了,因为我们仍然觉得 Inspiron 的按键和点击板更松软,反馈不如惠普 Envy 系列的按键和点击板令人满意。

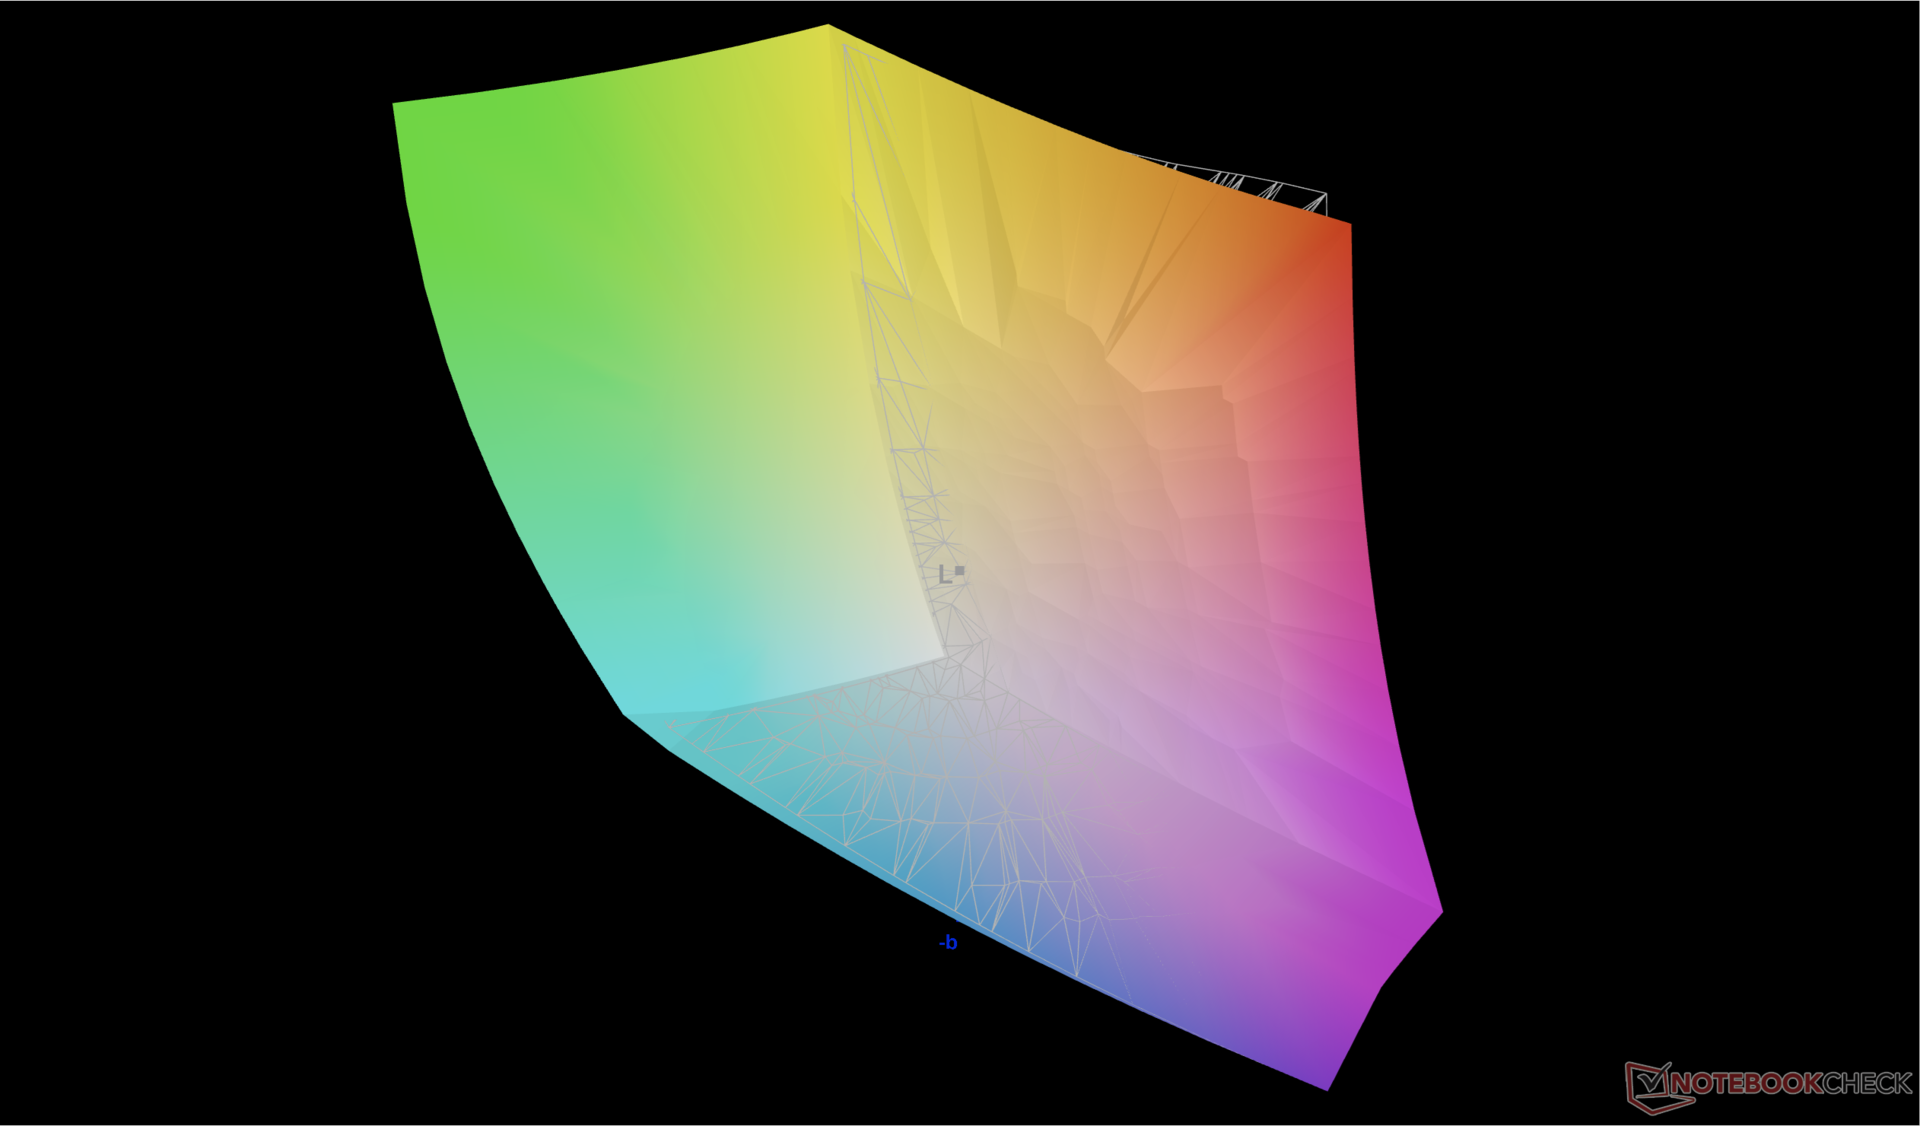
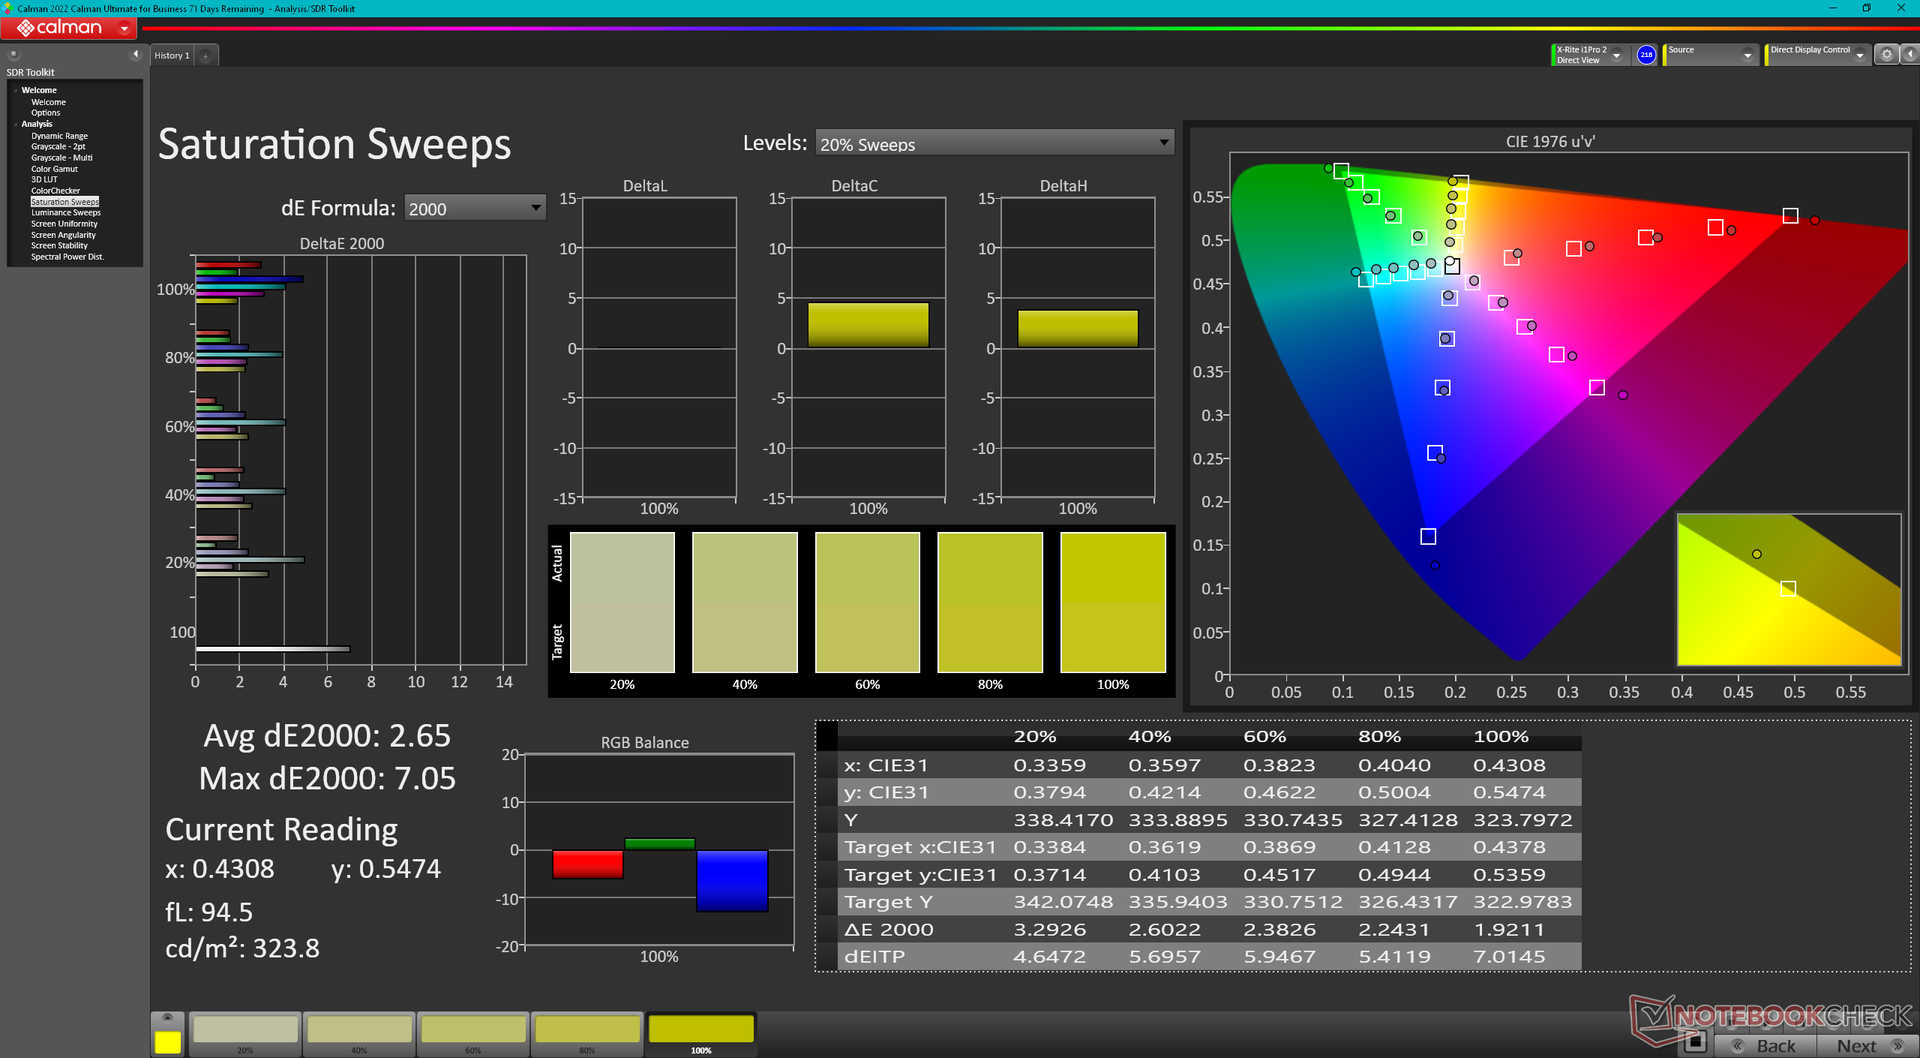
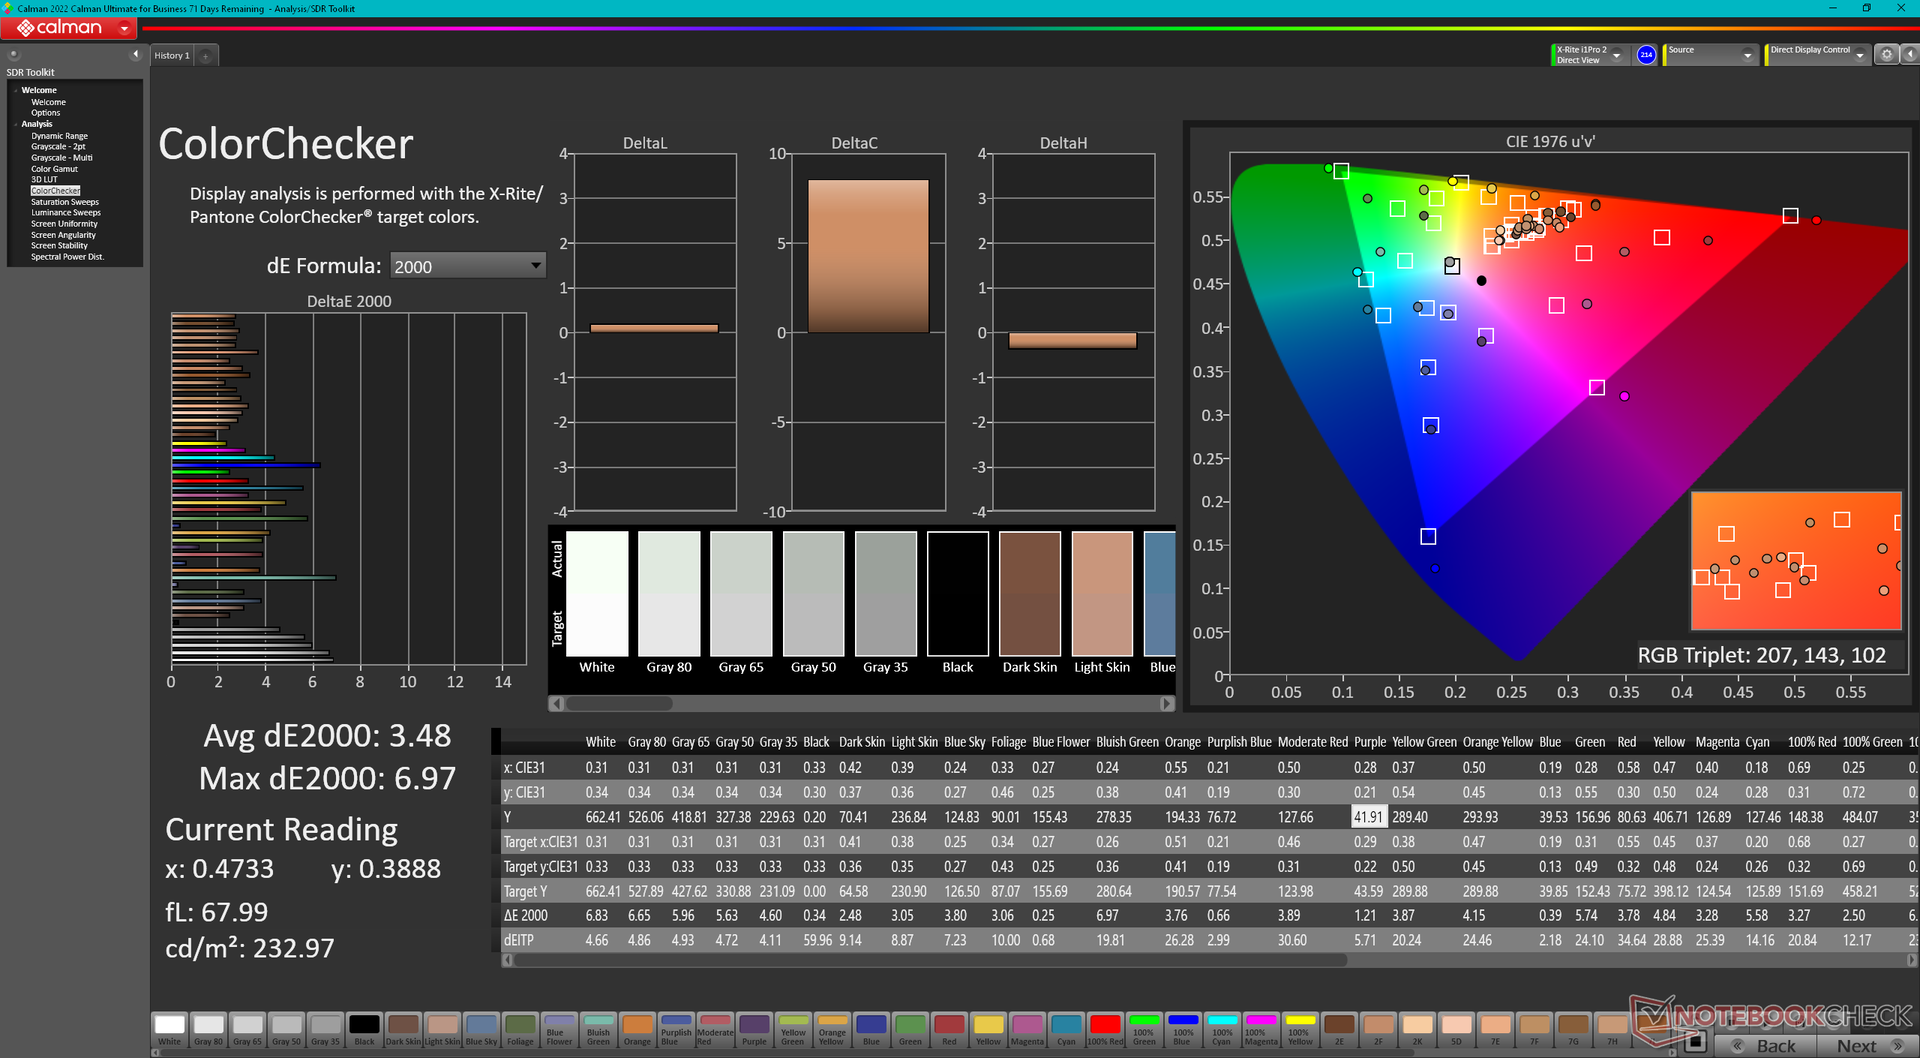
显示屏 - 2.5K Mini-LED HDR600
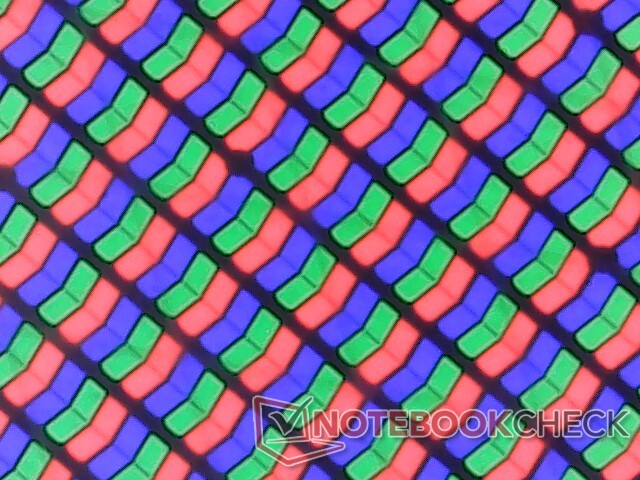
可选的 Mini-LED 面板是今年 Inspiron 16 2 合 1 的主要卖点。虽然它可能无法像某些极端游戏笔记本电脑那样提供 4K 和 HDR1000 极端游戏笔记本电脑对于一款零售价在 1000 美元左右的 16 英寸可转换笔记本电脑来说,它的 2.5K 分辨率和 HDR600 支持仍然令人印象深刻。用户仍然可以获得与大多数其他价格较高的笔记本电脑的迷你 LED 面板一样出色的 3000:1 对比度和全 DCI-P3 色彩。
关闭 HDR 时,色彩和亮度会自动分别设置为 sRGB 和 400 尼特最大值。当播放 HDR 内容时,启用 HDR 会将色彩配置文件更改为 DCI-P3,同时将最大亮度提升至 663 尼特。
原生 90 Hz 刷新率值得称赞,但面板不支持自适应同步和 Windows 可变刷新率以节省能耗。
| |||||||||||||||||||||||||
Brightness Distribution: 97 %
Center on Battery: 413 cd/m²
Contrast: 2950:1 (Black: 0.14 cd/m²)
ΔE Color 3.48 | 0.5-29.43 Ø4.87
ΔE Greyscale 4.5 | 0.5-98 Ø5.1
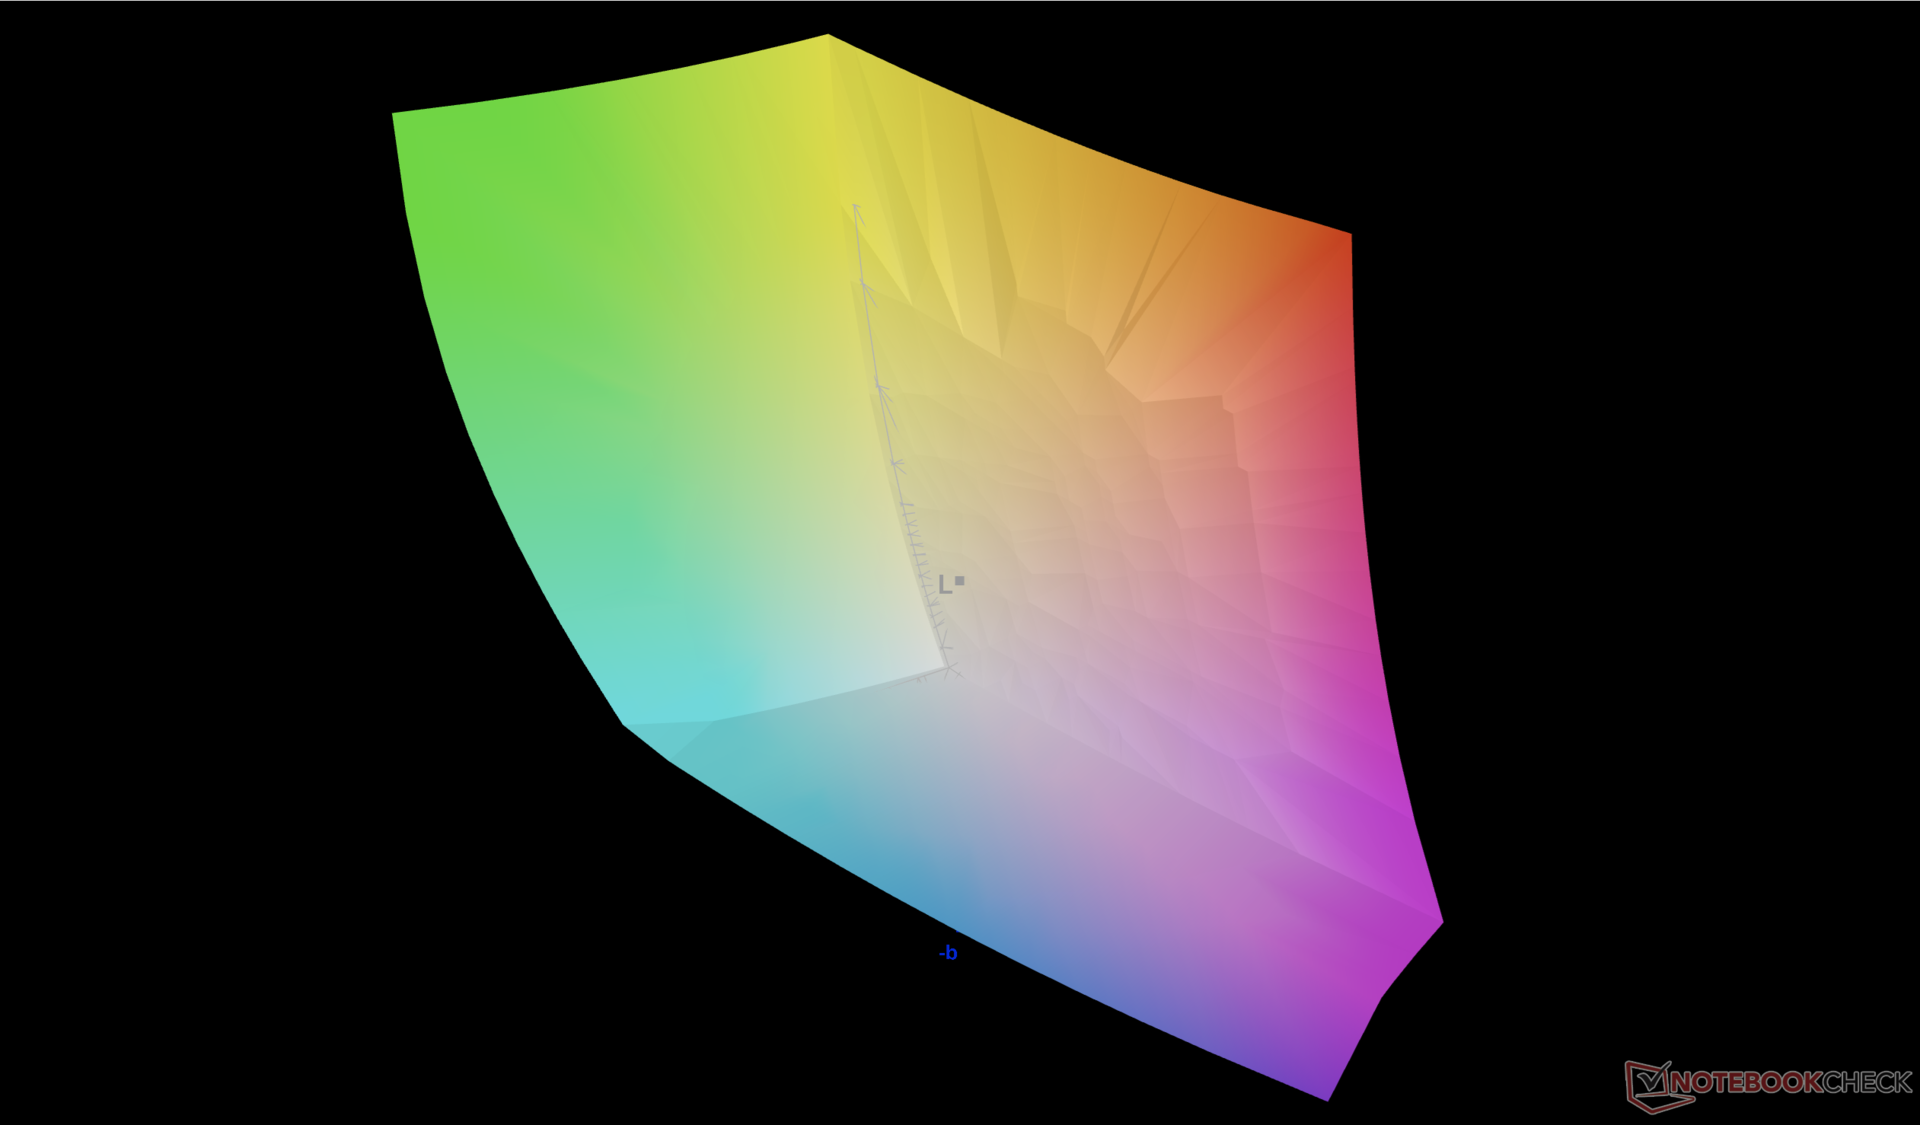
92.5% AdobeRGB 1998 (Argyll 2.2.0 3D)
100% sRGB (Argyll 2.2.0 3D)
99.4% Display P3 (Argyll 2.2.0 3D)
Gamma: 2.15
| Dell Inspiron 16 7640 2-in-1 AU Optronics B160QAT, Mini-LED, 2560x1600, 16", 90 Hz | Dell Inspiron 16 Plus 7640 AU Optronics B160QAN, IPS, 2560x1600, 16", 120 Hz | Dell Inspiron 16 7635 2-in-1 Chi Mei 160JCA, IPS, 1920x1200, 16", 60 Hz | HP Envy x360 2-in-1 16-ad0097nr Samsung SDC41A6, OLED, 2880x1800, 16", 120 Hz | Lenovo IdeaPad Pro 5 16IMH G9 NE160QDM-NY2, IPS, 2560x1600, 16", 120 Hz | Samsung Galaxy Book4 Pro 360 ATNA60CL09-0, OLED, 2880x1800, 16", 120 Hz | |
|---|---|---|---|---|---|---|
| Display | -14% | -20% | 1% | -23% | 2% | |
| Display P3 Coverage | 99.4 | 76 -24% | 67.4 -32% | 99.6 0% | 63.3 -36% | 99.9 1% |
| sRGB Coverage | 100 | 99.8 0% | 98.2 -2% | 100 0% | 95.2 -5% | 100 0% |
| AdobeRGB 1998 Coverage | 92.5 | 76.7 -17% | 69.5 -25% | 96.5 4% | 65.3 -29% | 96.6 4% |
| Response Times | 3% | -5% | 37% | 43% | 35% | |
| Response Time Grey 50% / Grey 80% * | 15.4 ? | 25.6 ? -66% | 27.6 ? -79% | 0.8 ? 95% | 15 ? 3% | 0.49 ? 97% |
| Response Time Black / White * | 60.6 ? | 17.6 ? 71% | 18.2 ? 70% | 0.89 ? 99% | 10.3 ? 83% | 0.67 ? 99% |
| PWM Frequency | 2753.7 ? | 491.8 ? -82% | 240 ? -91% | |||
| Screen | -5% | -25% | 10% | -21% | 33% | |
| Brightness middle | 413 | 314.7 -24% | 301.3 -27% | 399.4 -3% | 368 -11% | 387 -6% |
| Brightness | 409 | 291 -29% | 269 -34% | 405 -1% | 368 -10% | 392 -4% |
| Brightness Distribution | 97 | 89 -8% | 79 -19% | 98 1% | 91 -6% | 98 1% |
| Black Level * | 0.14 | 0.28 -100% | 0.28 -100% | 0.31 -121% | ||
| Contrast | 2950 | 1124 -62% | 1076 -64% | 1187 -60% | ||
| Colorchecker dE 2000 * | 3.48 | 1.62 53% | 3.1 11% | 4.05 -16% | 2.4 31% | 1 71% |
| Colorchecker dE 2000 max. * | 6.97 | 2.94 58% | 5.5 21% | 6.69 4% | 6.5 7% | 1.9 73% |
| Greyscale dE 2000 * | 4.5 | 1.3 71% | 3.9 13% | 1.1 76% | 4.5 -0% | 1.7 62% |
| Gamma | 2.15 102% | 2.26 97% | 2.19 100% | 2.27 97% | 2.21 100% | 2.25 98% |
| CCT | 6446 101% | 6385 102% | 6186 105% | 6419 101% | 6324 103% | 6325 103% |
| Colorchecker dE 2000 calibrated * | 1.08 | 0.49 | 1.02 | 0.8 | ||
| Total Average (Program / Settings) | -5% /
-6% | -17% /
-21% | 16% /
15% | -0% /
-12% | 23% /
26% |
* ... smaller is better
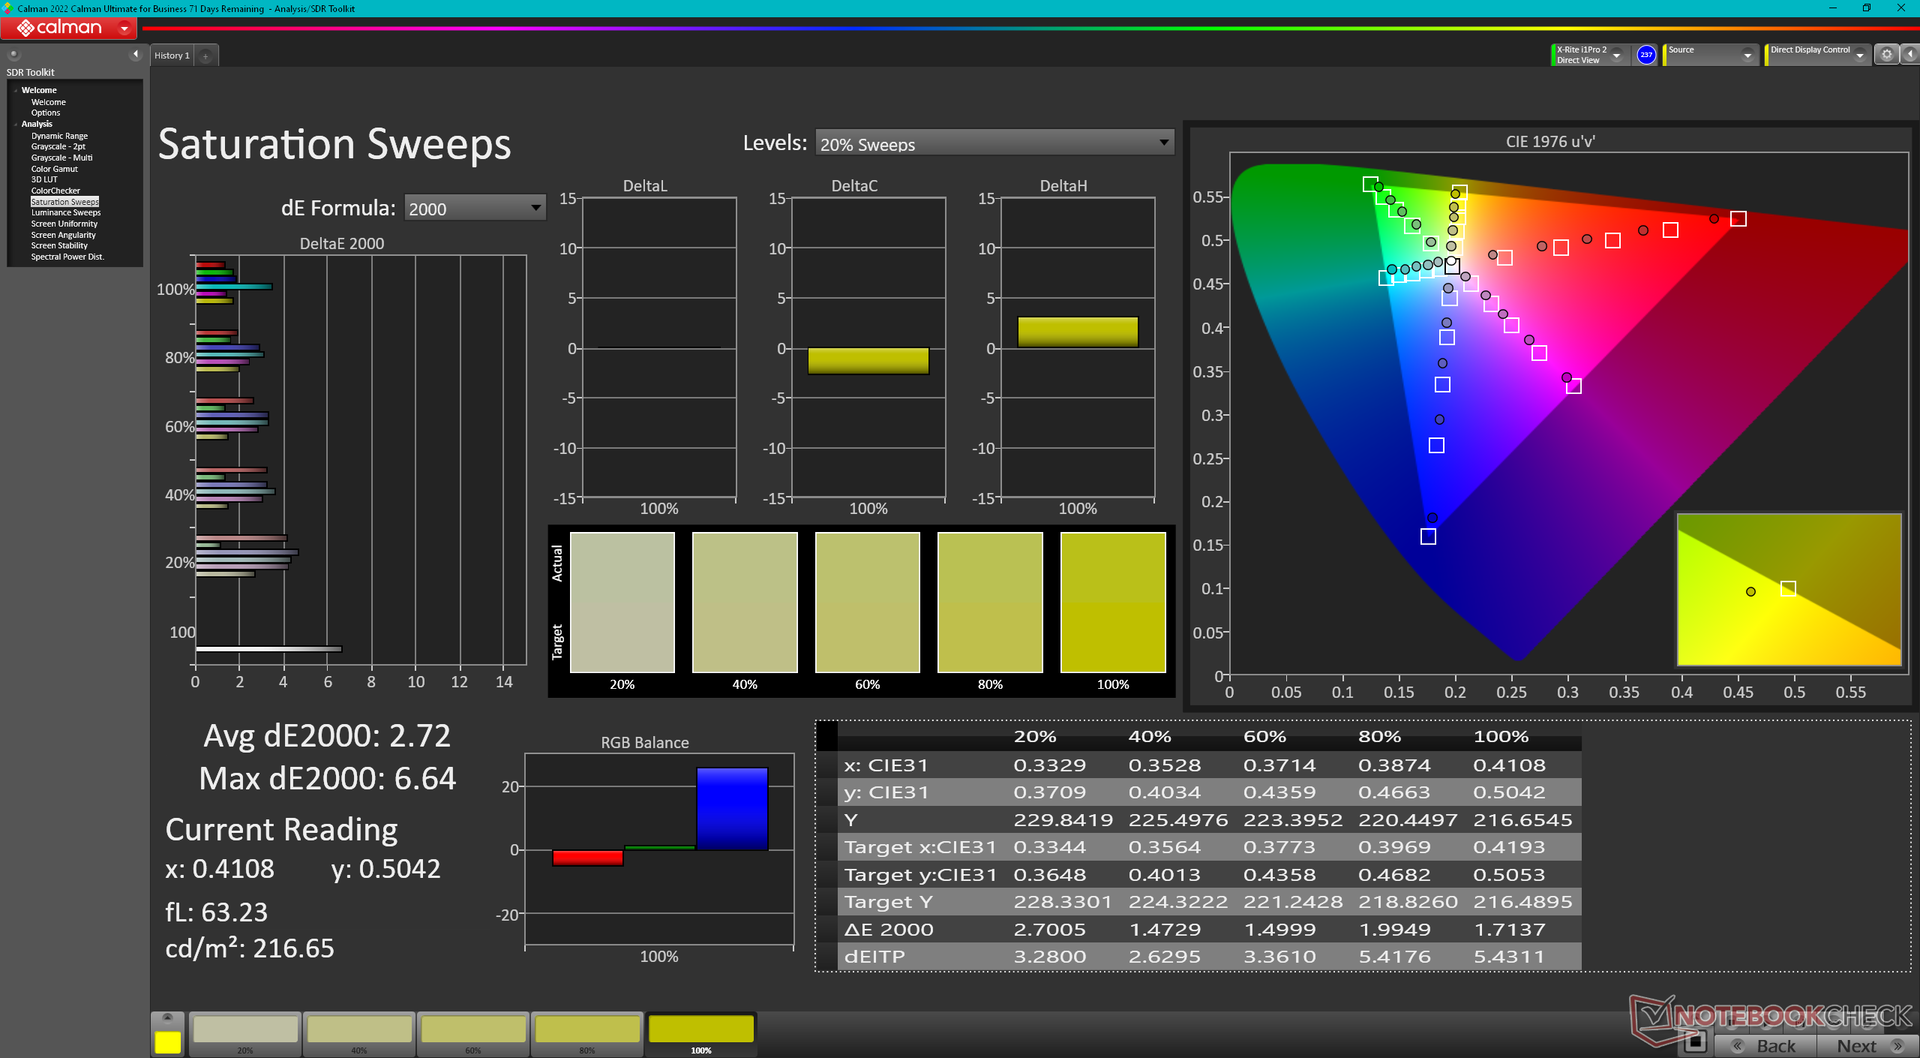
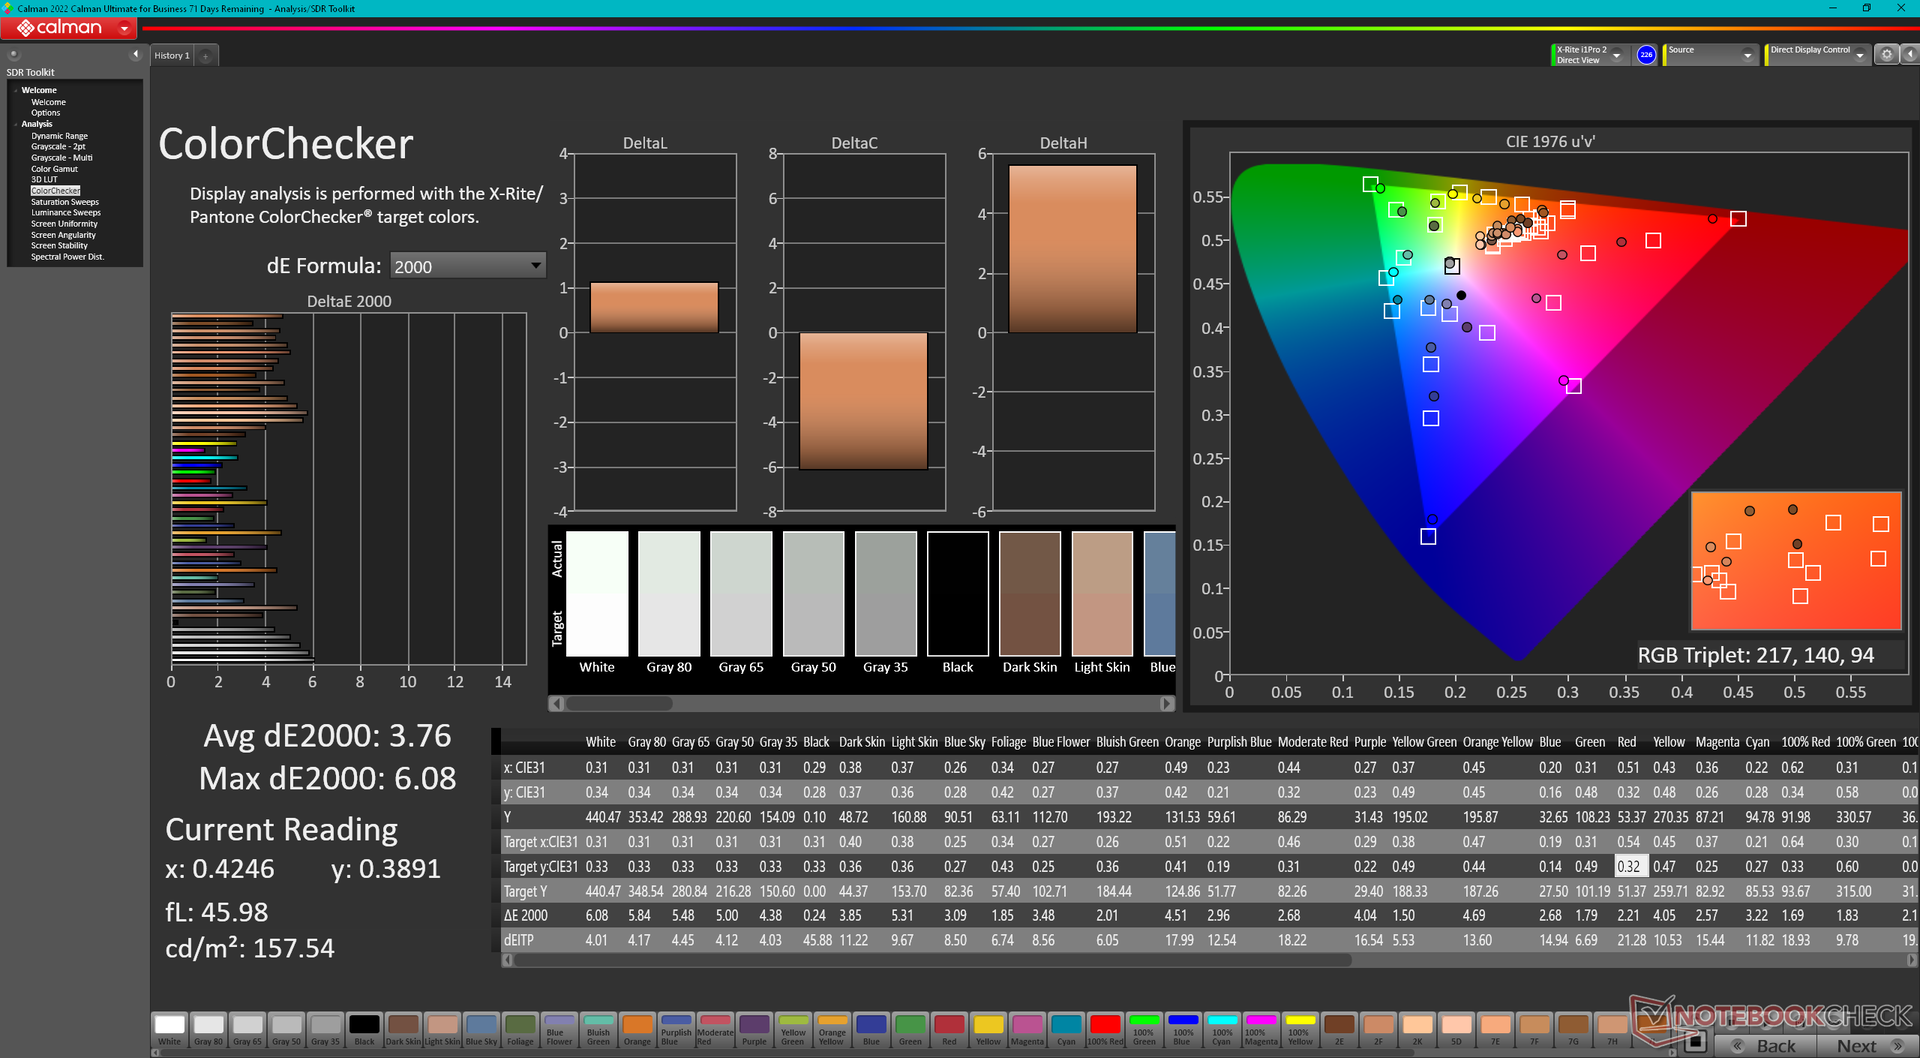
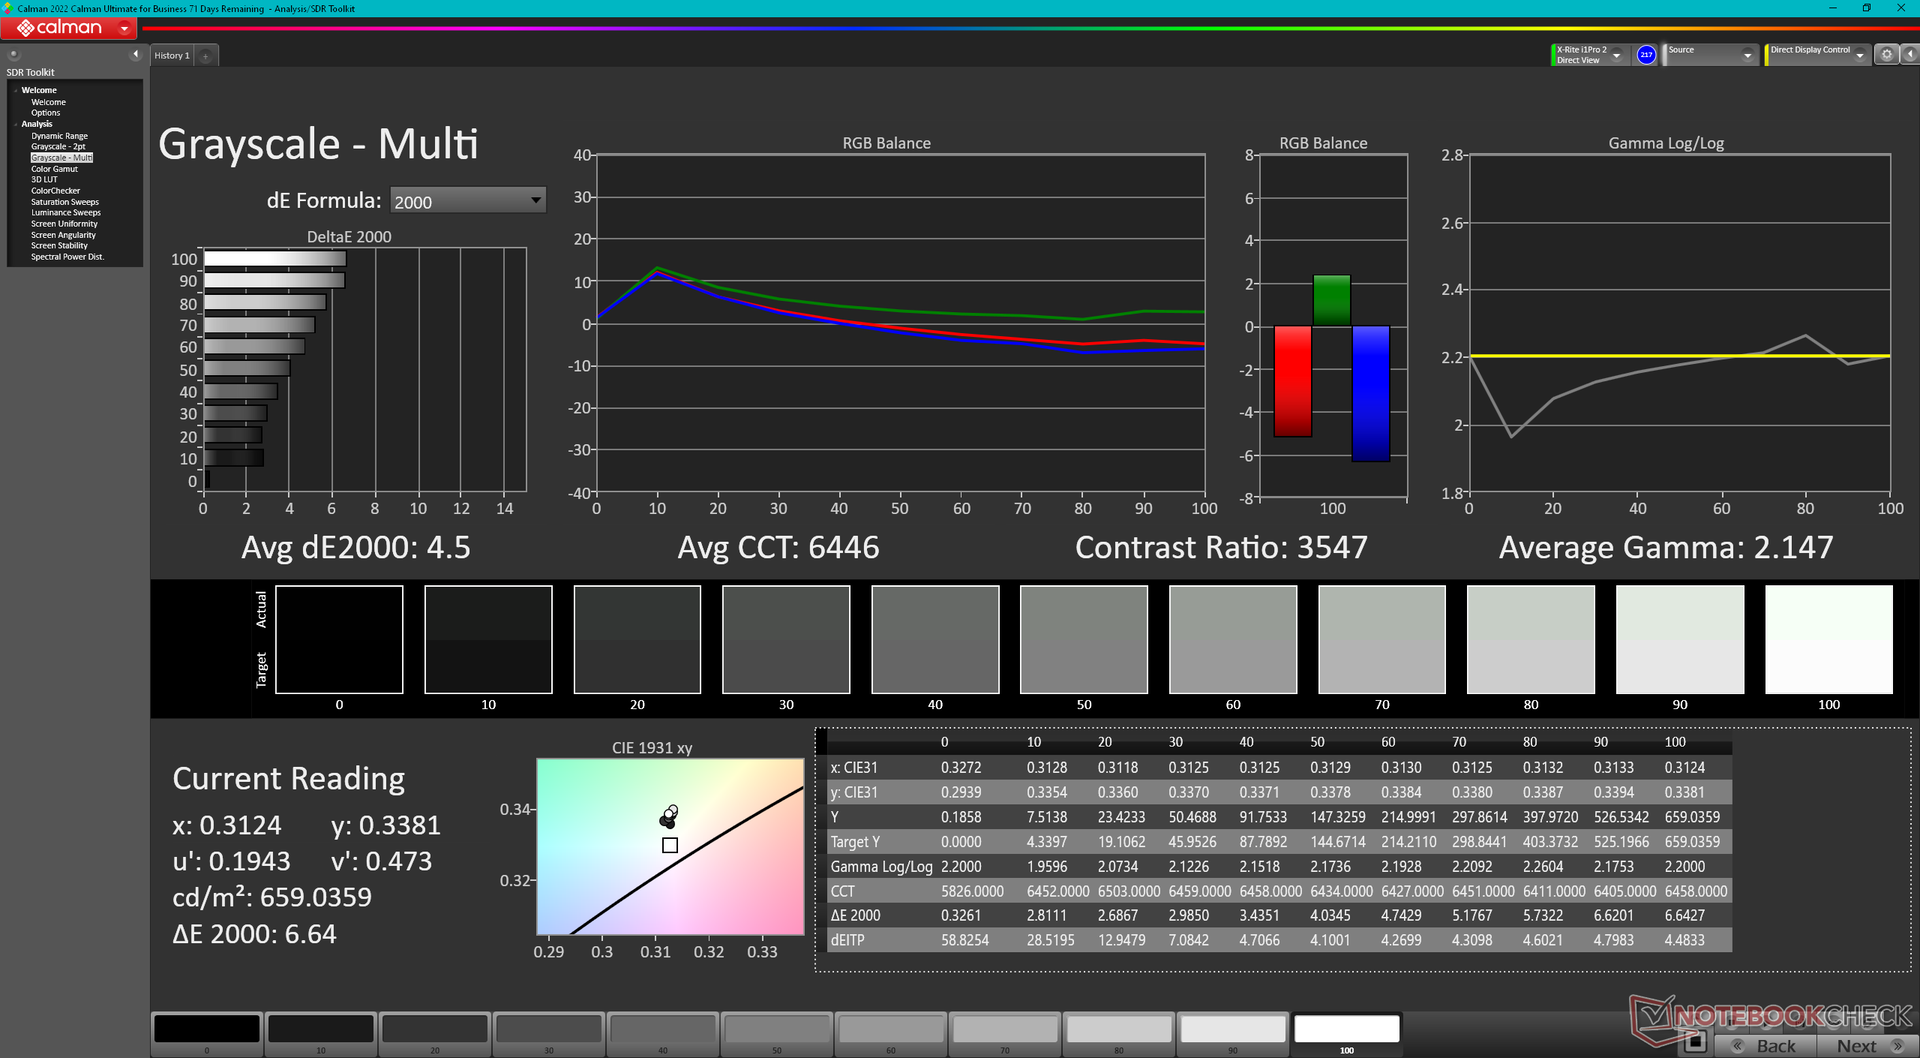
对于一台中端电脑来说,显示效果还算准确,平均灰度和色彩 DeltaE 值分别为 4.2 和 3.76。启用 HDR 后,系统会自动切换到 DCI-P3 色彩,这些值将保持相对稳定。无论哪种情况,6500K 左右的色温都略显偏冷。

Display Response Times
| ↔ Response Time Black to White | ||
|---|---|---|
| 60.6 ms ... rise ↗ and fall ↘ combined | ↗ 56.2 ms rise | 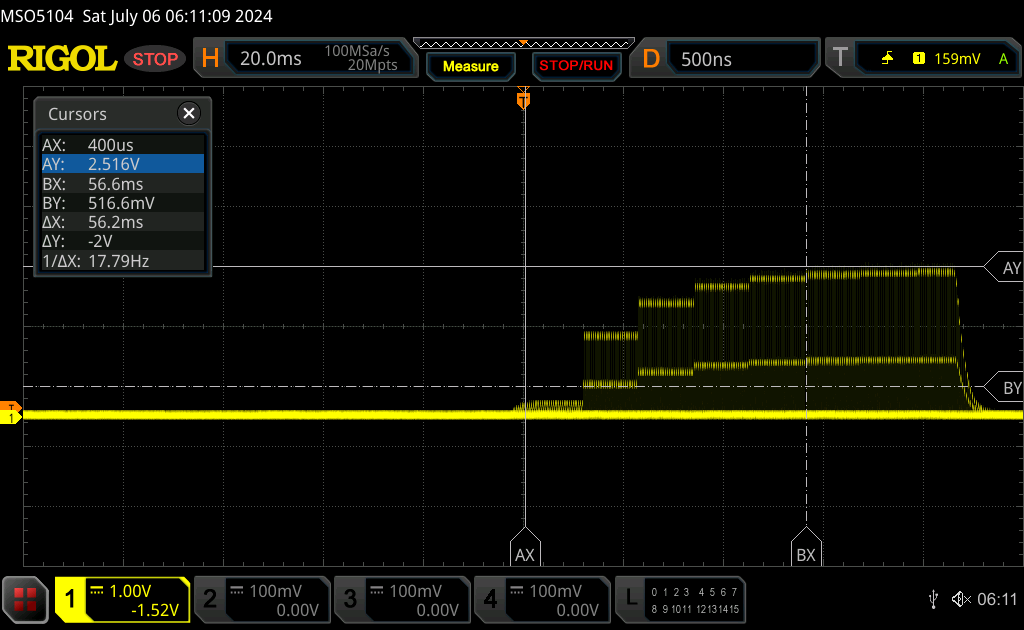 |
| ↘ 4.4 ms fall | ||
| The screen shows slow response rates in our tests and will be unsatisfactory for gamers. In comparison, all tested devices range from 0.1 (minimum) to 240 (maximum) ms. » 100 % of all devices are better. This means that the measured response time is worse than the average of all tested devices (20.8 ms). | ||
| ↔ Response Time 50% Grey to 80% Grey | ||
| 15.4 ms ... rise ↗ and fall ↘ combined | ↗ 8.6 ms rise | 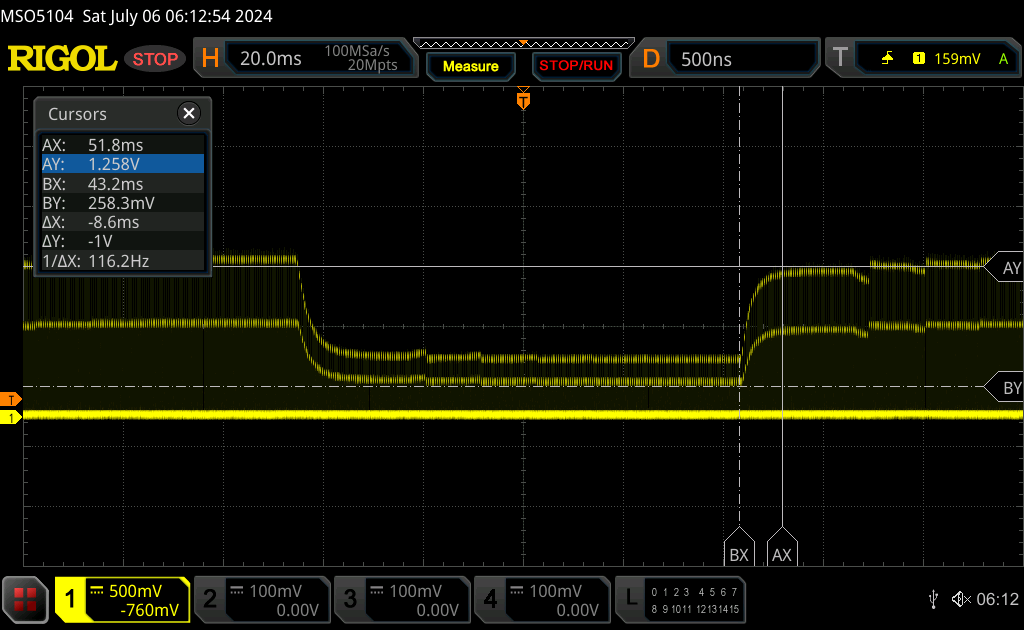 |
| ↘ 6.8 ms fall | ||
| The screen shows good response rates in our tests, but may be too slow for competitive gamers. In comparison, all tested devices range from 0.165 (minimum) to 636 (maximum) ms. » 27 % of all devices are better. This means that the measured response time is better than the average of all tested devices (32.5 ms). | ||
Screen Flickering / PWM (Pulse-Width Modulation)
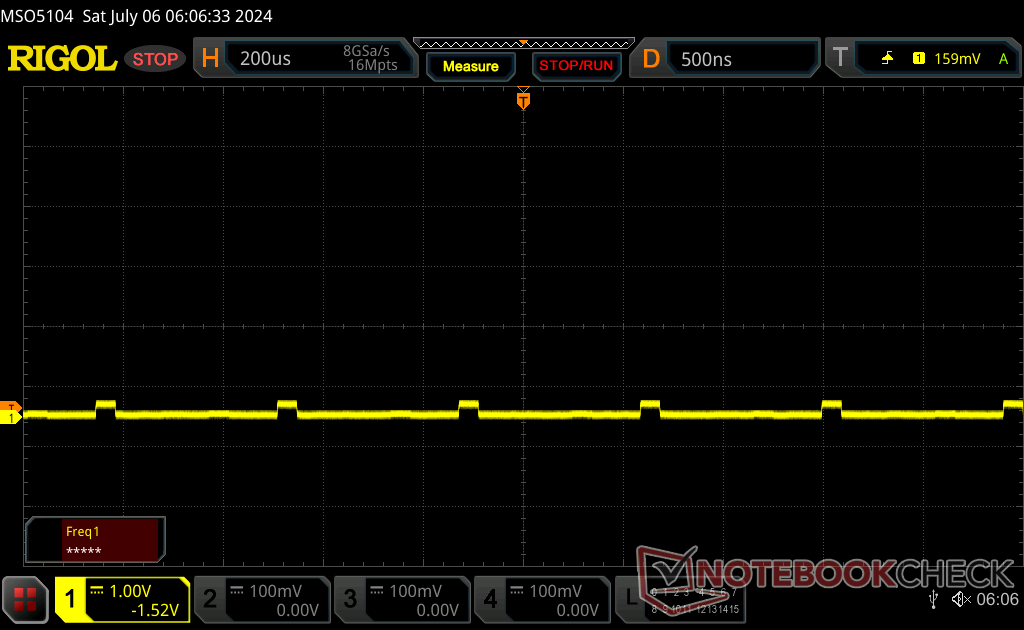
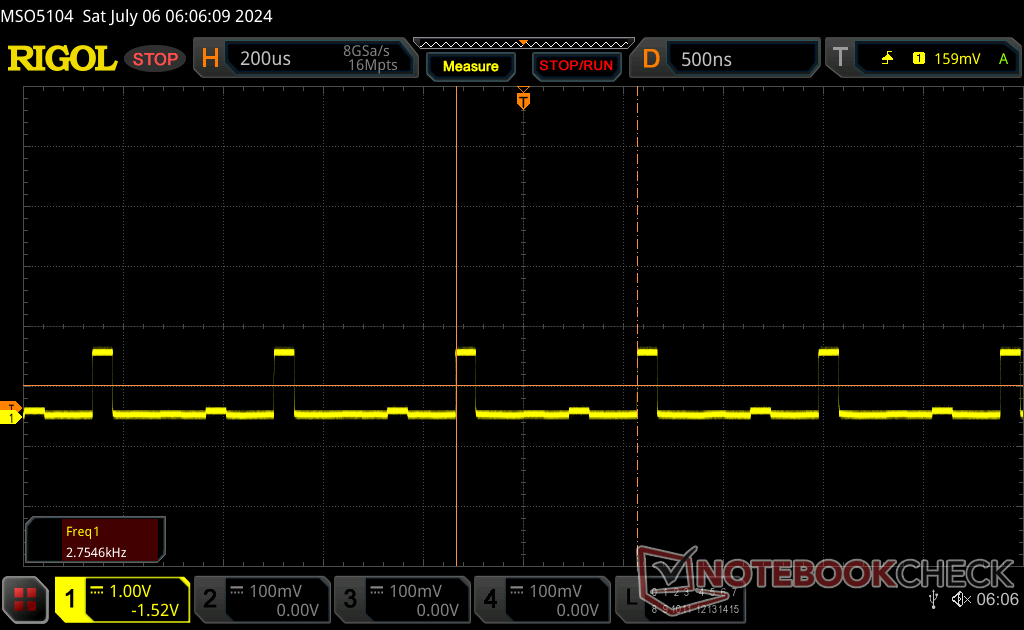
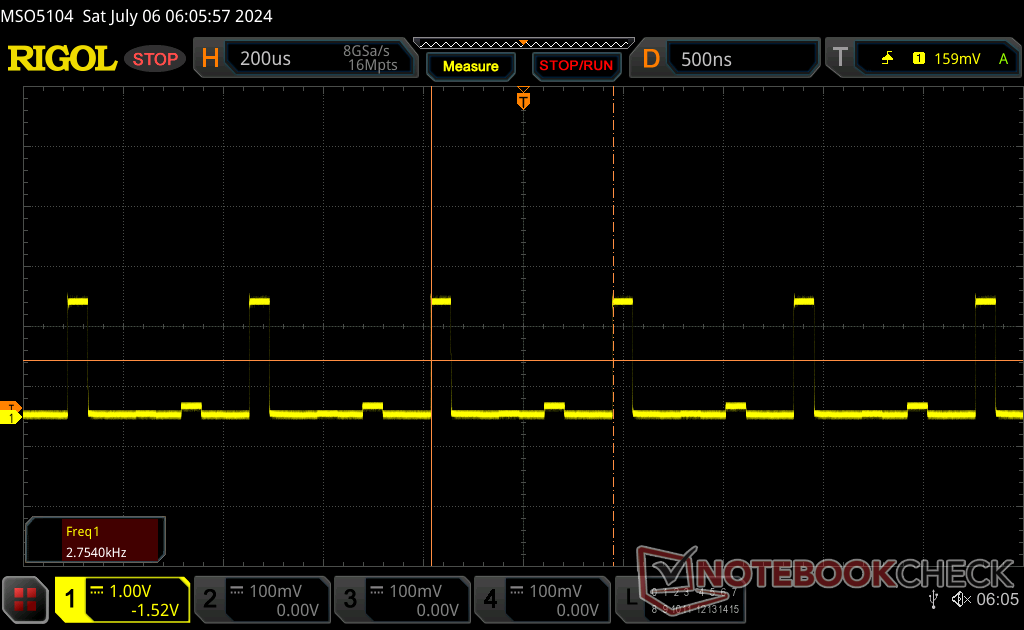
| Screen flickering / PWM detected | 2753.7 Hz | ≤ 100 % brightness setting | 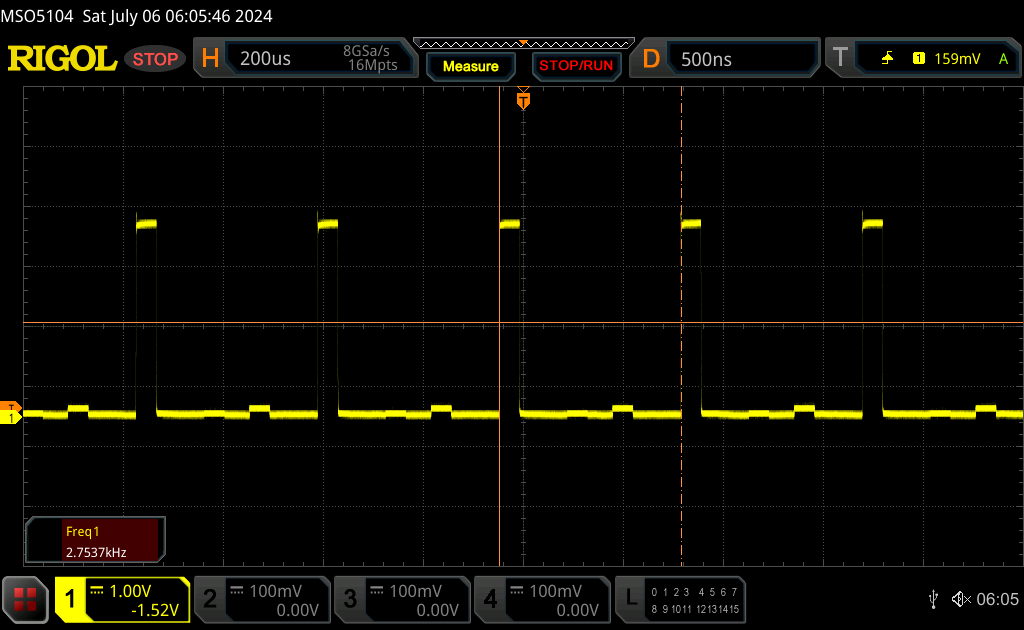 |
The display backlight flickers at 2753.7 Hz (worst case, e.g., utilizing PWM) Flickering detected at a brightness setting of 100 % and below. There should be no flickering or PWM above this brightness setting. The frequency of 2753.7 Hz is quite high, so most users sensitive to PWM should not notice any flickering. In comparison: 53 % of all tested devices do not use PWM to dim the display. If PWM was detected, an average of 8516 (minimum: 5 - maximum: 343500) Hz was measured. | |||
脉宽调制或闪烁以 2753 Hz 的恒定频率出现在所有亮度级别上。对于微型 LED 面板来说,这种现象是意料之中的,幸好频率足够快,大多数观众不会察觉。

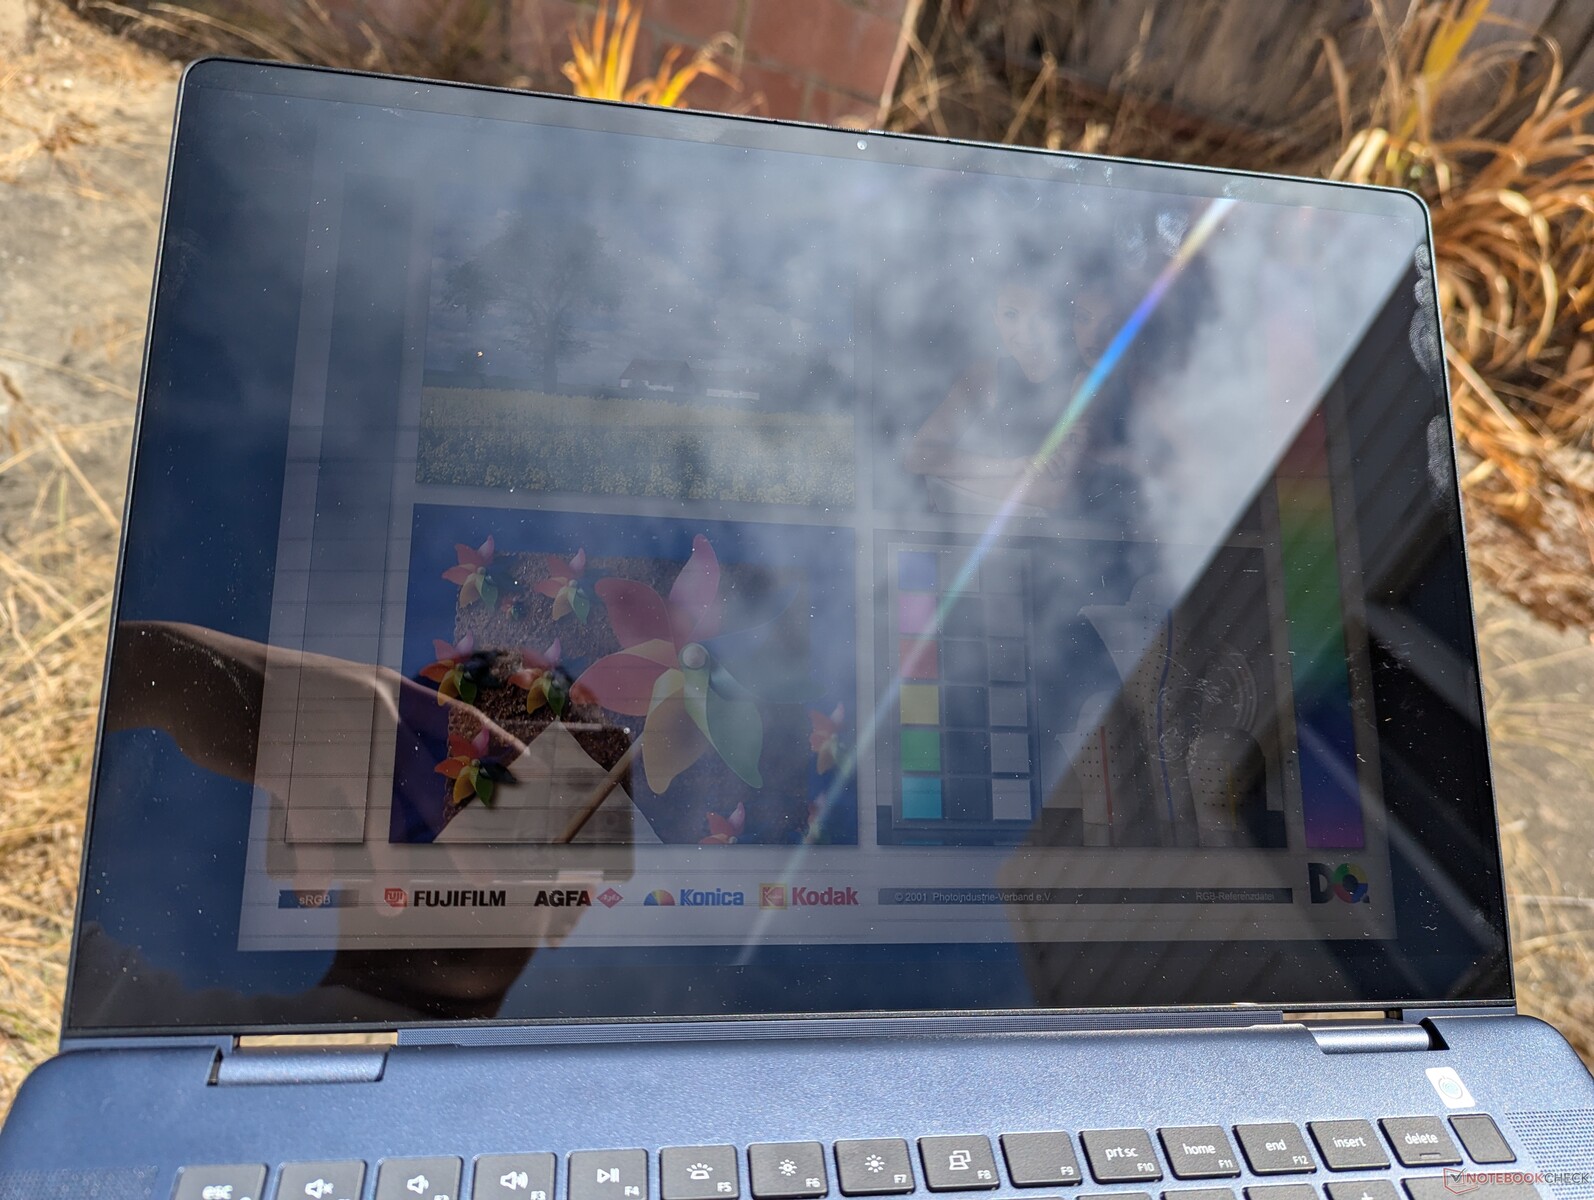
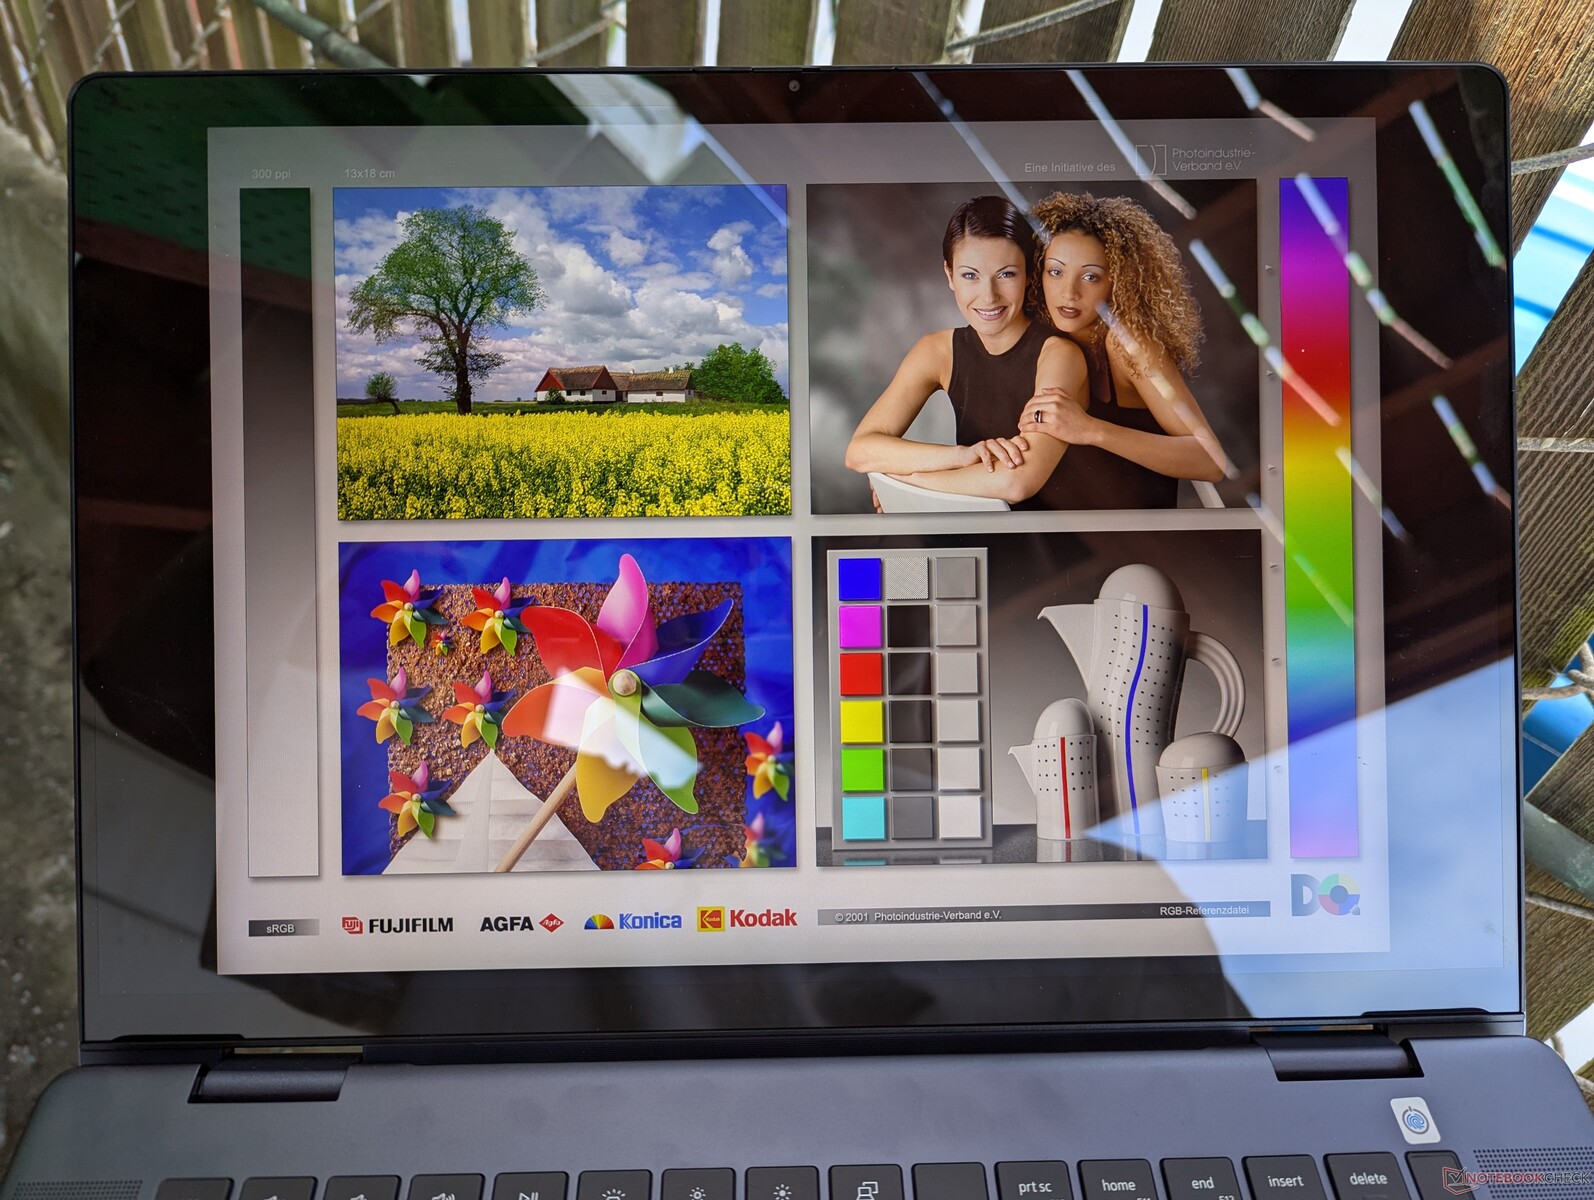
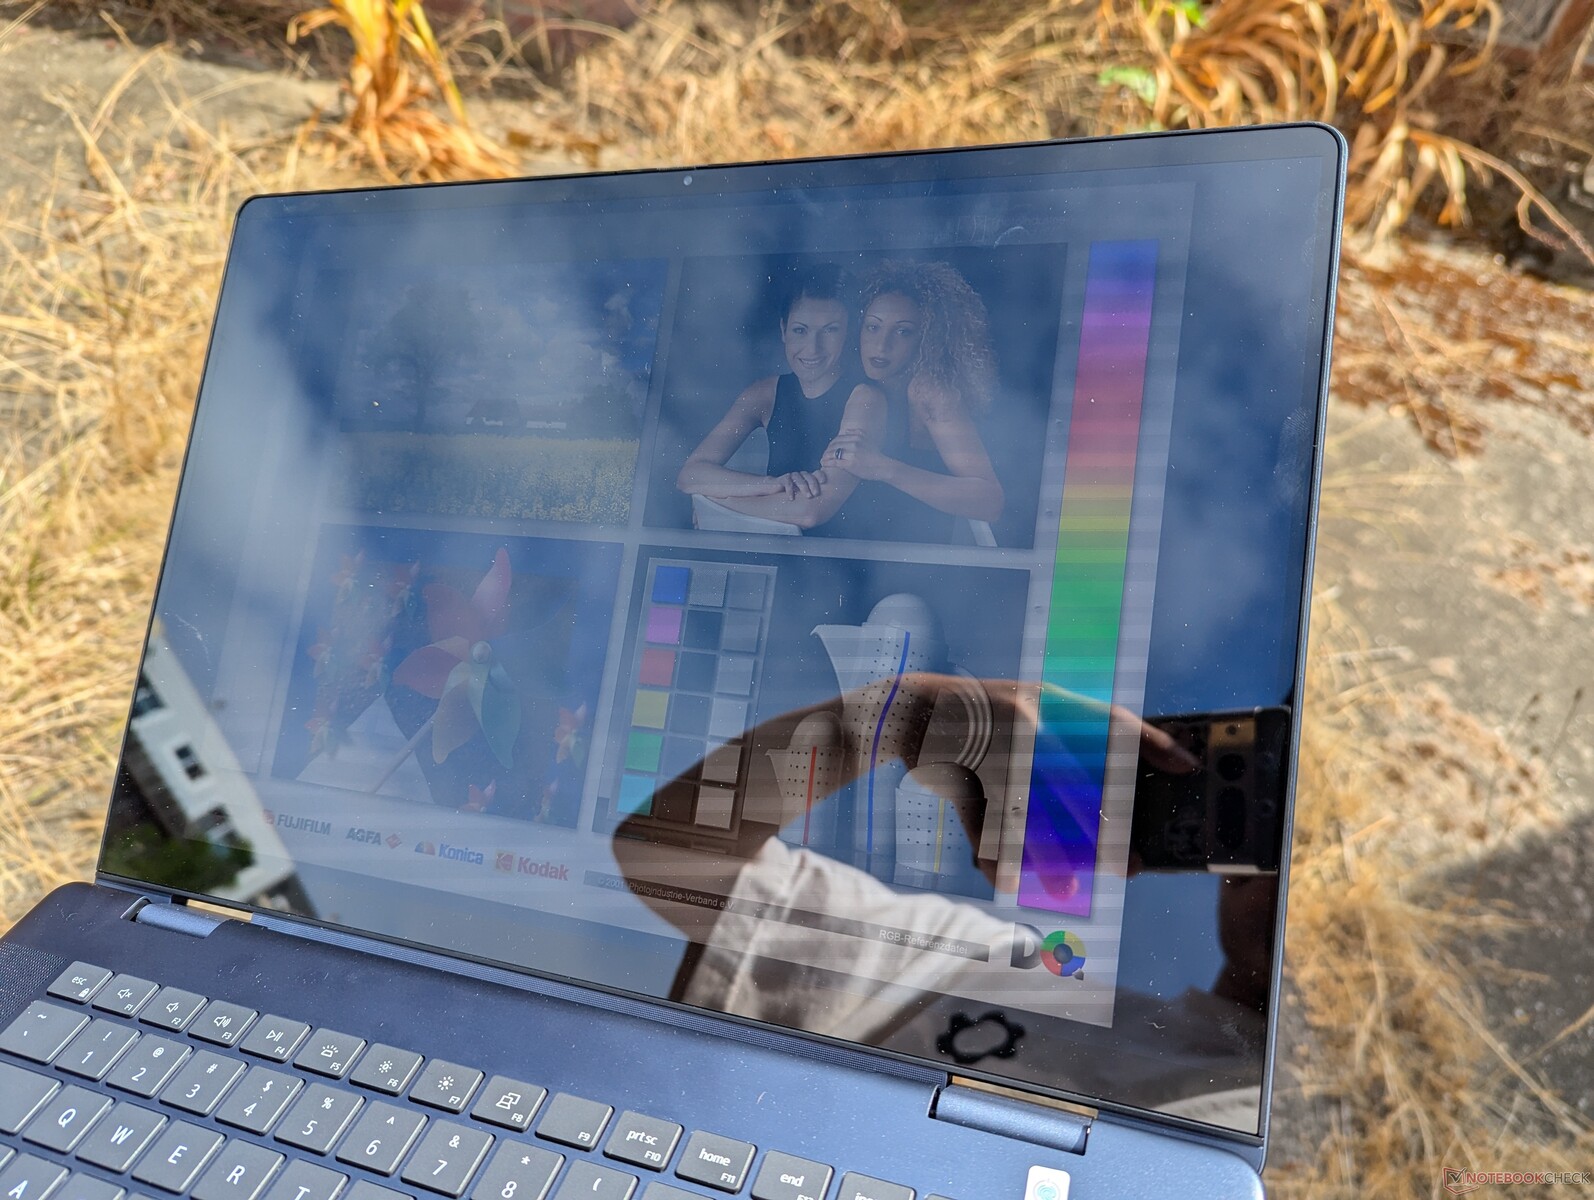
该屏幕在 SDR 模式下为 400 尼特,在 HDR 模式下为 600 尼特,亮度均高于旧机型的基本 IPS 选件和 OLED 选件。尽管如此,Inspiron 16 2 合 1 的亮度仍然不足以应付室外环境,因为眩光很快就会成为问题。你可能会认为启用 HDR 可以缓解这一问题,因为它可以提高亮度上限,但请记住,Windows HDR 模式在电池供电时不可用。
性能--对于敞篷车来说速度很快
测试条件
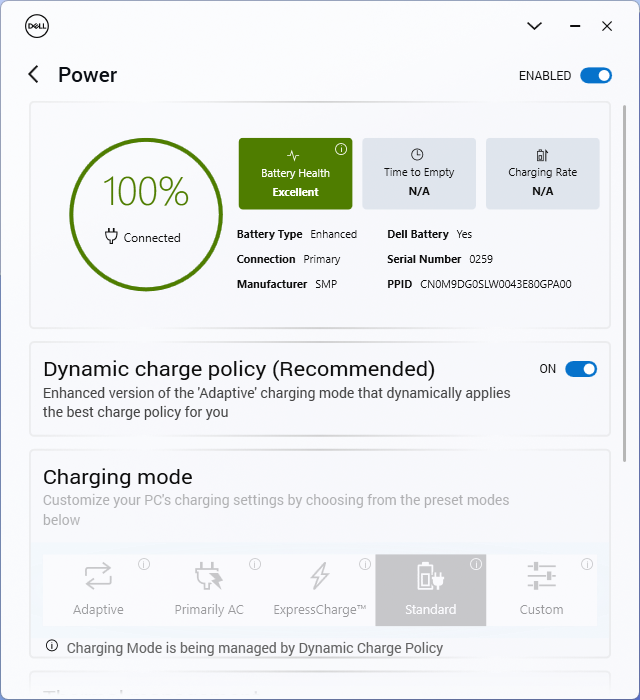
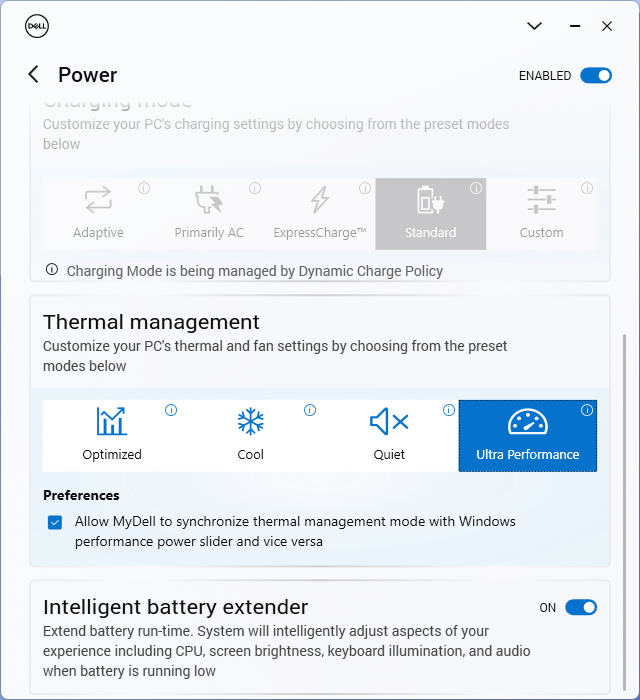
在运行以下基准测试之前,我们将 MyDell 设置为性能模式。该软件有一个方便的切换按钮,可将戴尔电源配置文件与 Windows 电源配置文件同步,从而简化电源设置之间的切换过程。
处理器
在可转换外形中采用酷睿 H 系列 CPU 有时会令人担忧,因为制造商可能会对其性能进行超频。值得庆幸的是,Inspiron 16 7640 2 合 1 似乎没有出现这种情况,因为它的 酷睿至尊 7 155H的性能与我们数据库中配备相同处理器的普通电脑相比,相差不到 5%。这使得戴尔的这款机型成为 16 英寸可折叠电脑中速度最快的机型之一,超越了诸如 Ryzen 7 8840HS中的 HP Envy x360 16 2-in-1.值得注意的是,许多游戏笔记本电脑也采用了相同的 CPU,这表明戴尔这款可转换笔记本电脑在处理器性能方面并不逊色。
Turbo Boost 可持续性很好,但并不完美。当循环运行 CineBench R15 xT 时,我们最初的 2680 分仅在运行三次后就会下降约 15%。像联想 联想 IdeaPad Pro 5 16或 Inspiron 16 Plus 7640 等采用相同 CPU 的 16 英寸蛤壳机能够在较长时间内保持较高的 Turbo Boost 时钟速率,如下图所示。
选择低端的 酷睿至尊 5 125U配置预计会对多线程性能产生 40% 的显著影响。 联想 Yoga 7 2 合 1 16.不过,对于那些喜欢电池续航时间而非原始性能的用户来说,酷睿 U 系列仍然是理想之选。
Cinebench R15 Multi Loop
Cinebench R23: Multi Core | Single Core
Cinebench R20: CPU (Multi Core) | CPU (Single Core)
Cinebench R15: CPU Multi 64Bit | CPU Single 64Bit
Blender: v2.79 BMW27 CPU
7-Zip 18.03: 7z b 4 | 7z b 4 -mmt1
Geekbench 6.4: Multi-Core | Single-Core
Geekbench 5.5: Multi-Core | Single-Core
HWBOT x265 Benchmark v2.2: 4k Preset
LibreOffice : 20 Documents To PDF
R Benchmark 2.5: Overall mean
* ... smaller is better
AIDA64: FP32 Ray-Trace | FPU Julia | CPU SHA3 | CPU Queen | FPU SinJulia | FPU Mandel | CPU AES | CPU ZLib | FP64 Ray-Trace | CPU PhotoWorxx
| Performance Rating | |
| Lenovo IdeaPad Pro 5 16IMH G9 | |
| HP Envy x360 2-in-1 16-ad0097nr | |
| Dell Inspiron 16 7640 2-in-1 | |
| Dell Inspiron 16 Plus 7640 | |
| Average Intel Core Ultra 7 155H | |
| Dell Inspiron 16 7635 2-in-1 | |
| Samsung Galaxy Book4 Pro 360 | |
| AIDA64 / FP32 Ray-Trace | |
| HP Envy x360 2-in-1 16-ad0097nr | |
| Lenovo IdeaPad Pro 5 16IMH G9 | |
| Dell Inspiron 16 7640 2-in-1 | |
| Dell Inspiron 16 Plus 7640 | |
| Average Intel Core Ultra 7 155H (6670 - 18470, n=50) | |
| Dell Inspiron 16 7635 2-in-1 | |
| Samsung Galaxy Book4 Pro 360 | |
| AIDA64 / FPU Julia | |
| Lenovo IdeaPad Pro 5 16IMH G9 | |
| HP Envy x360 2-in-1 16-ad0097nr | |
| Dell Inspiron 16 7640 2-in-1 | |
| Dell Inspiron 16 Plus 7640 | |
| Average Intel Core Ultra 7 155H (40905 - 93181, n=50) | |
| Dell Inspiron 16 7635 2-in-1 | |
| Samsung Galaxy Book4 Pro 360 | |
| AIDA64 / CPU SHA3 | |
| Lenovo IdeaPad Pro 5 16IMH G9 | |
| HP Envy x360 2-in-1 16-ad0097nr | |
| Dell Inspiron 16 7640 2-in-1 | |
| Dell Inspiron 16 Plus 7640 | |
| Average Intel Core Ultra 7 155H (1940 - 4436, n=50) | |
| Samsung Galaxy Book4 Pro 360 | |
| Dell Inspiron 16 7635 2-in-1 | |
| AIDA64 / CPU Queen | |
| HP Envy x360 2-in-1 16-ad0097nr | |
| Dell Inspiron 16 7640 2-in-1 | |
| Dell Inspiron 16 Plus 7640 | |
| Lenovo IdeaPad Pro 5 16IMH G9 | |
| Average Intel Core Ultra 7 155H (64698 - 94181, n=50) | |
| Samsung Galaxy Book4 Pro 360 | |
| Dell Inspiron 16 7635 2-in-1 | |
| AIDA64 / FPU SinJulia | |
| HP Envy x360 2-in-1 16-ad0097nr | |
| Lenovo IdeaPad Pro 5 16IMH G9 | |
| Dell Inspiron 16 7640 2-in-1 | |
| Dell Inspiron 16 Plus 7640 | |
| Average Intel Core Ultra 7 155H (5639 - 10647, n=50) | |
| Dell Inspiron 16 7635 2-in-1 | |
| Samsung Galaxy Book4 Pro 360 | |
| AIDA64 / FPU Mandel | |
| HP Envy x360 2-in-1 16-ad0097nr | |
| Lenovo IdeaPad Pro 5 16IMH G9 | |
| Dell Inspiron 16 7640 2-in-1 | |
| Dell Inspiron 16 Plus 7640 | |
| Dell Inspiron 16 7635 2-in-1 | |
| Average Intel Core Ultra 7 155H (18236 - 47685, n=50) | |
| Samsung Galaxy Book4 Pro 360 | |
| AIDA64 / CPU AES | |
| Lenovo IdeaPad Pro 5 16IMH G9 | |
| Average Intel Core Ultra 7 155H (45713 - 152179, n=50) | |
| Dell Inspiron 16 7640 2-in-1 | |
| HP Envy x360 2-in-1 16-ad0097nr | |
| Dell Inspiron 16 Plus 7640 | |
| Samsung Galaxy Book4 Pro 360 | |
| Dell Inspiron 16 7635 2-in-1 | |
| AIDA64 / CPU ZLib | |
| Lenovo IdeaPad Pro 5 16IMH G9 | |
| Dell Inspiron 16 Plus 7640 | |
| Dell Inspiron 16 7640 2-in-1 | |
| Average Intel Core Ultra 7 155H (557 - 1250, n=50) | |
| HP Envy x360 2-in-1 16-ad0097nr | |
| Samsung Galaxy Book4 Pro 360 | |
| Dell Inspiron 16 7635 2-in-1 | |
| AIDA64 / FP64 Ray-Trace | |
| HP Envy x360 2-in-1 16-ad0097nr | |
| Lenovo IdeaPad Pro 5 16IMH G9 | |
| Dell Inspiron 16 7640 2-in-1 | |
| Dell Inspiron 16 Plus 7640 | |
| Average Intel Core Ultra 7 155H (3569 - 9802, n=50) | |
| Dell Inspiron 16 7635 2-in-1 | |
| Samsung Galaxy Book4 Pro 360 | |
| AIDA64 / CPU PhotoWorxx | |
| Lenovo IdeaPad Pro 5 16IMH G9 | |
| Average Intel Core Ultra 7 155H (32719 - 54223, n=50) | |
| Samsung Galaxy Book4 Pro 360 | |
| Dell Inspiron 16 7640 2-in-1 | |
| Dell Inspiron 16 Plus 7640 | |
| HP Envy x360 2-in-1 16-ad0097nr | |
| Dell Inspiron 16 7635 2-in-1 | |
压力测试
CPU 主频升至 3.2 GHz,功耗为 88 W,仅持续了几秒钟就达到了 109 C(!)的极高核心封装温度,然后迅速降至 2.3 GHz,功耗为 44 W,以保持较低的核心温度(86 C)。尽管如此,这些温度范围还是比我们在 Inspiron 16 7635 2-in-1 上记录的温度范围要高,尤其是在运行游戏时,CPU 的温度会稳定在 90 摄氏度以上,而旧款 Inspiron 16 7635 2-in-1 的温度范围为 70 摄氏度。如下文温度部分所示,这一差异也会导致整体表面温度升高。
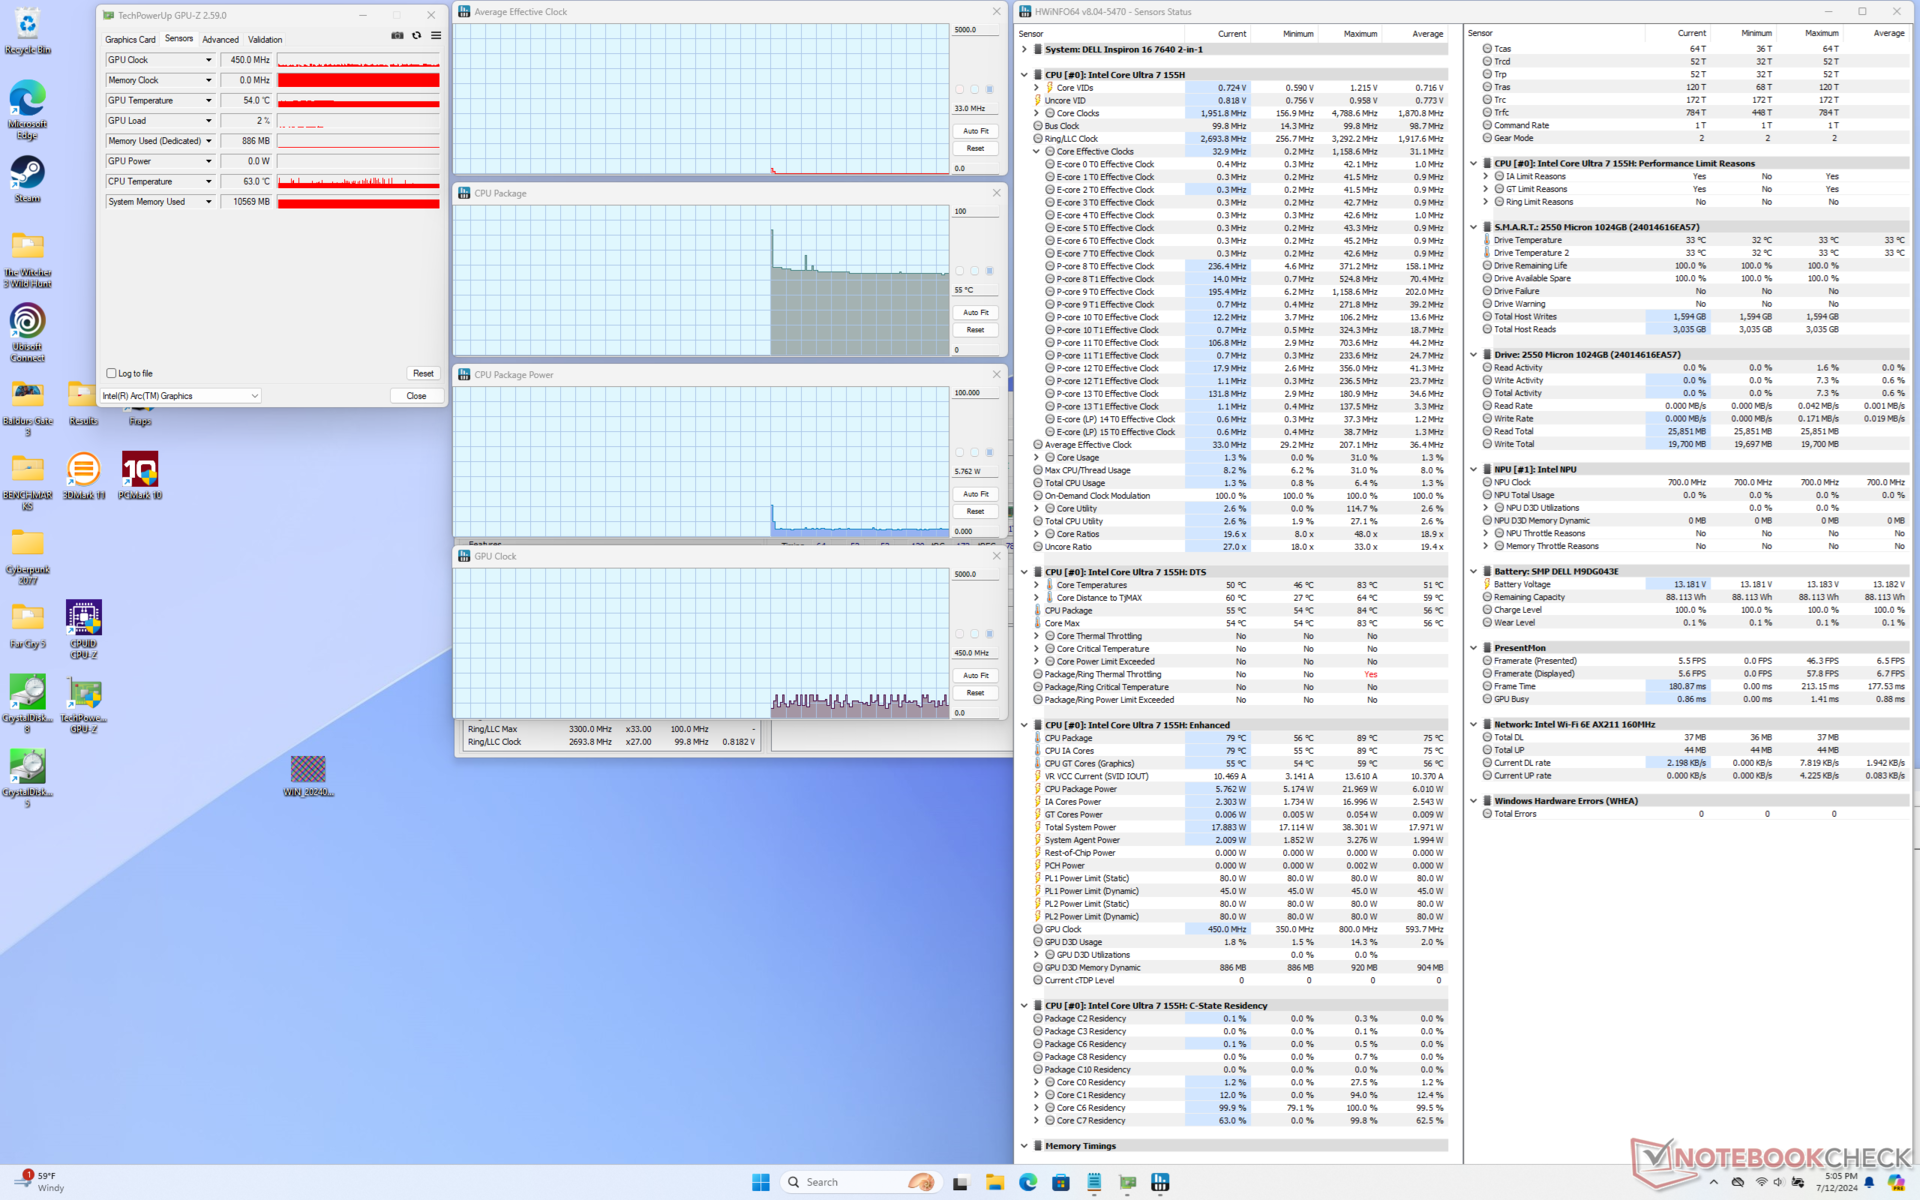
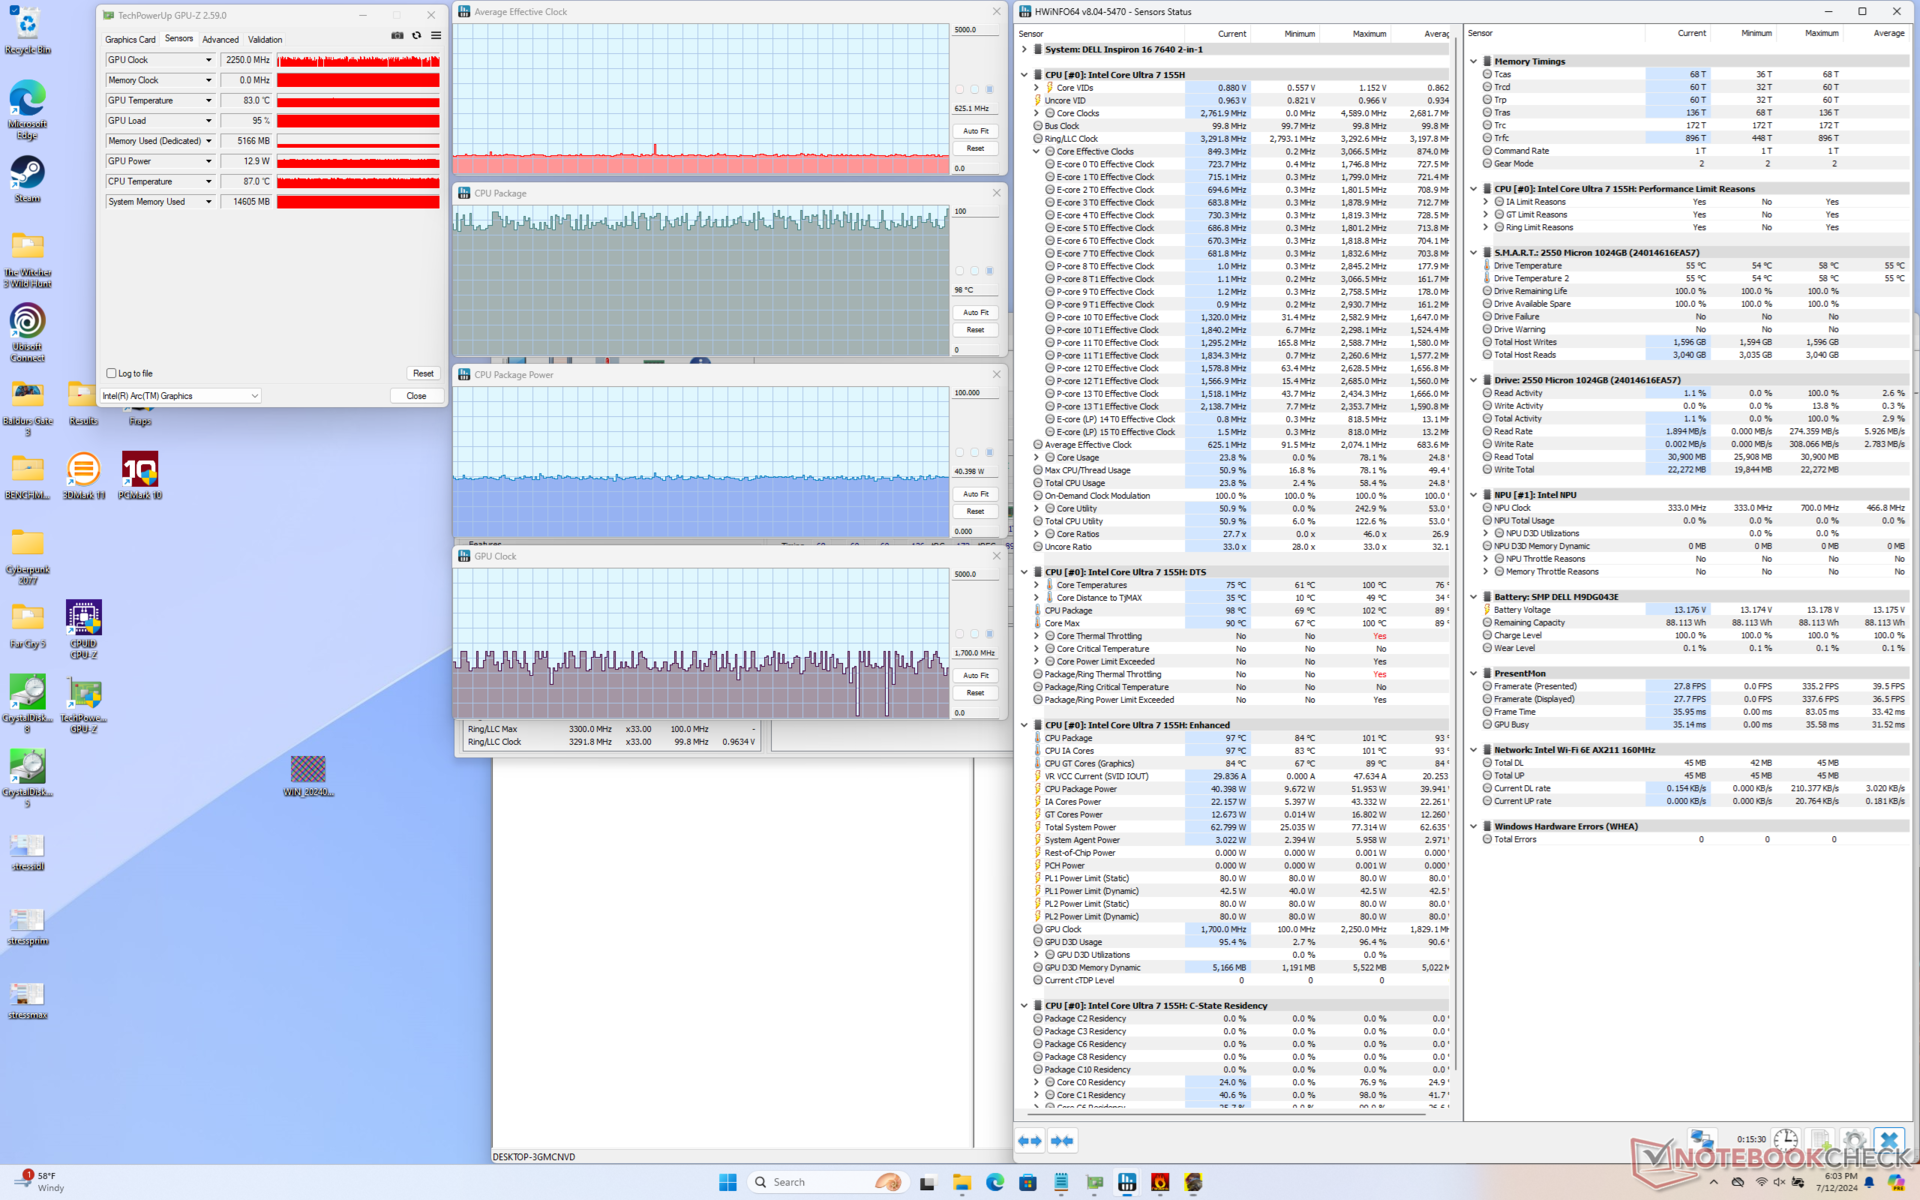
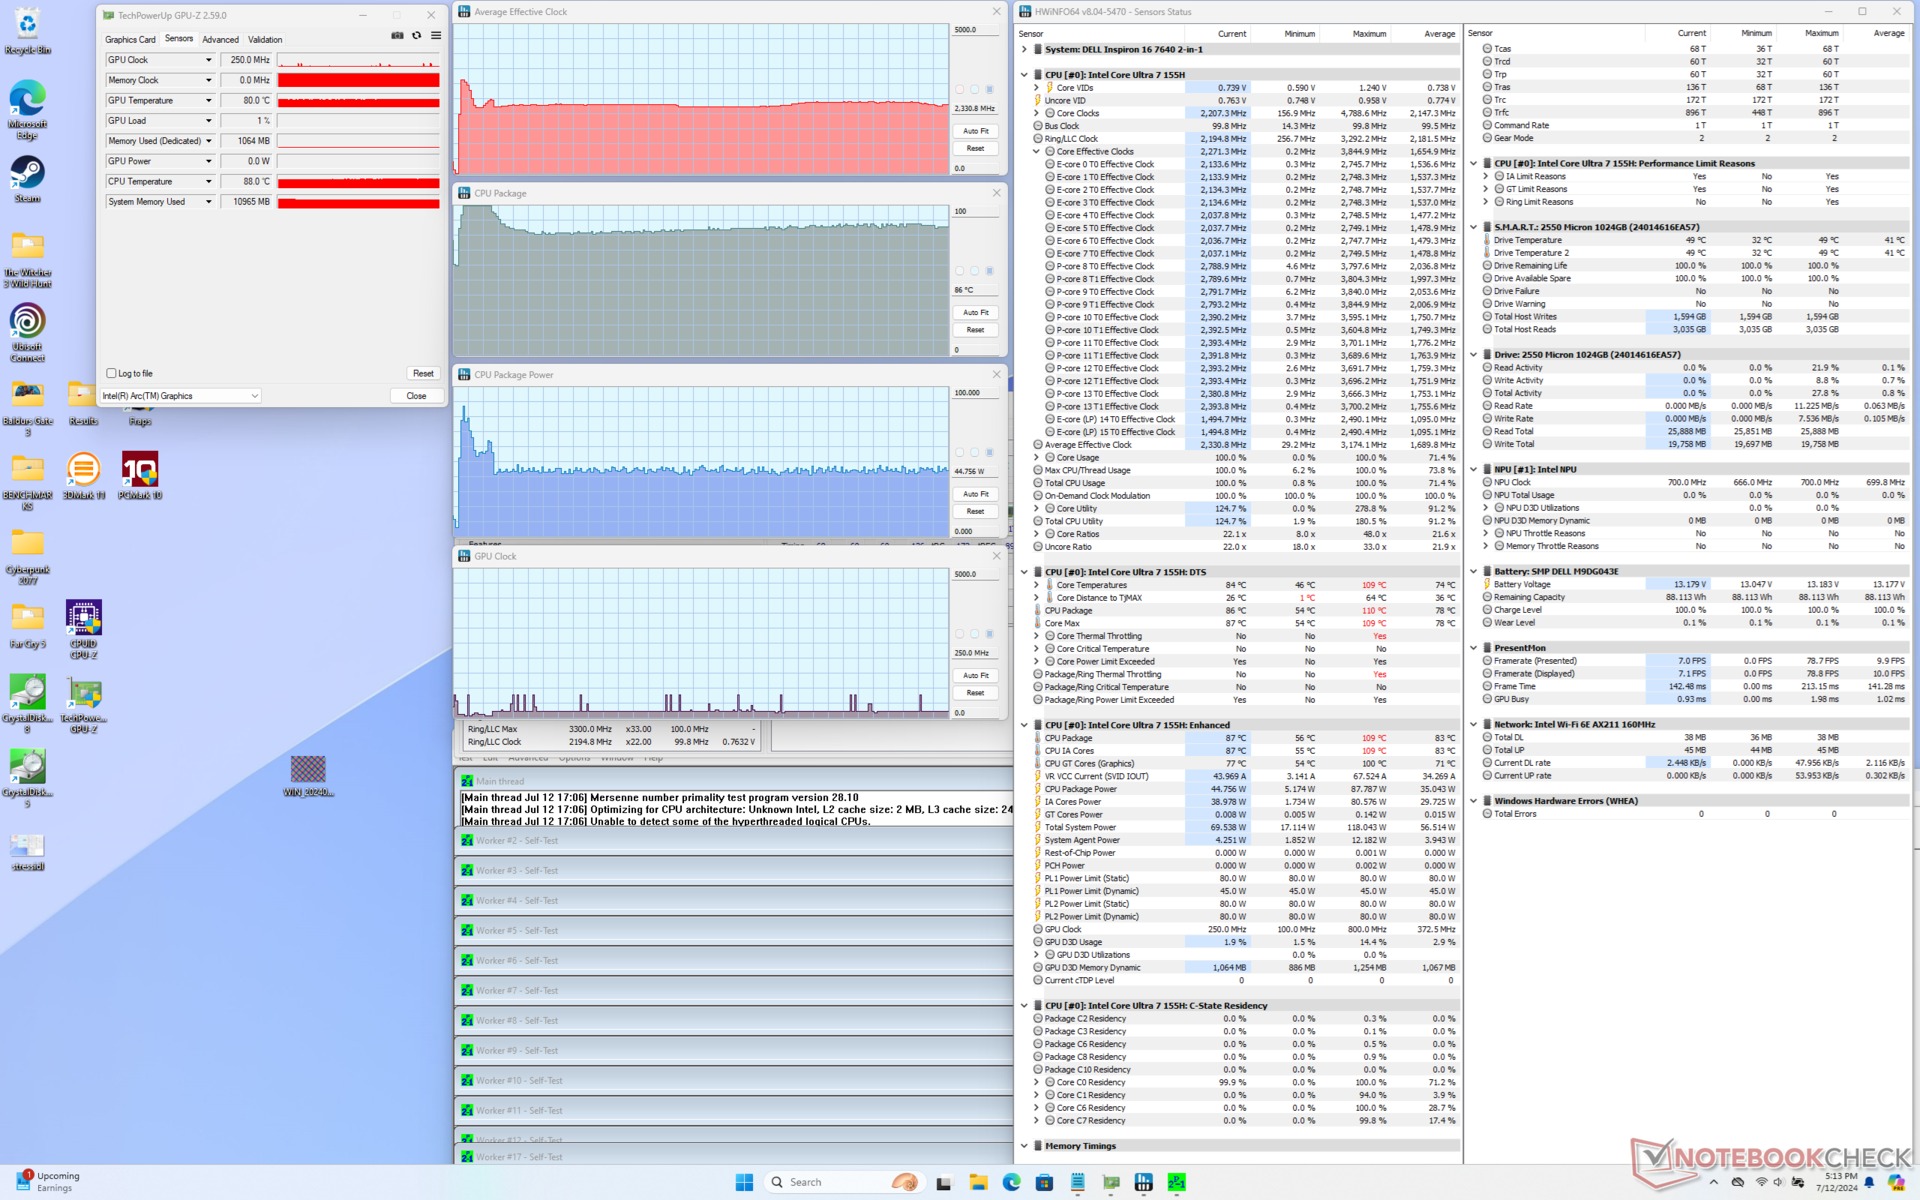
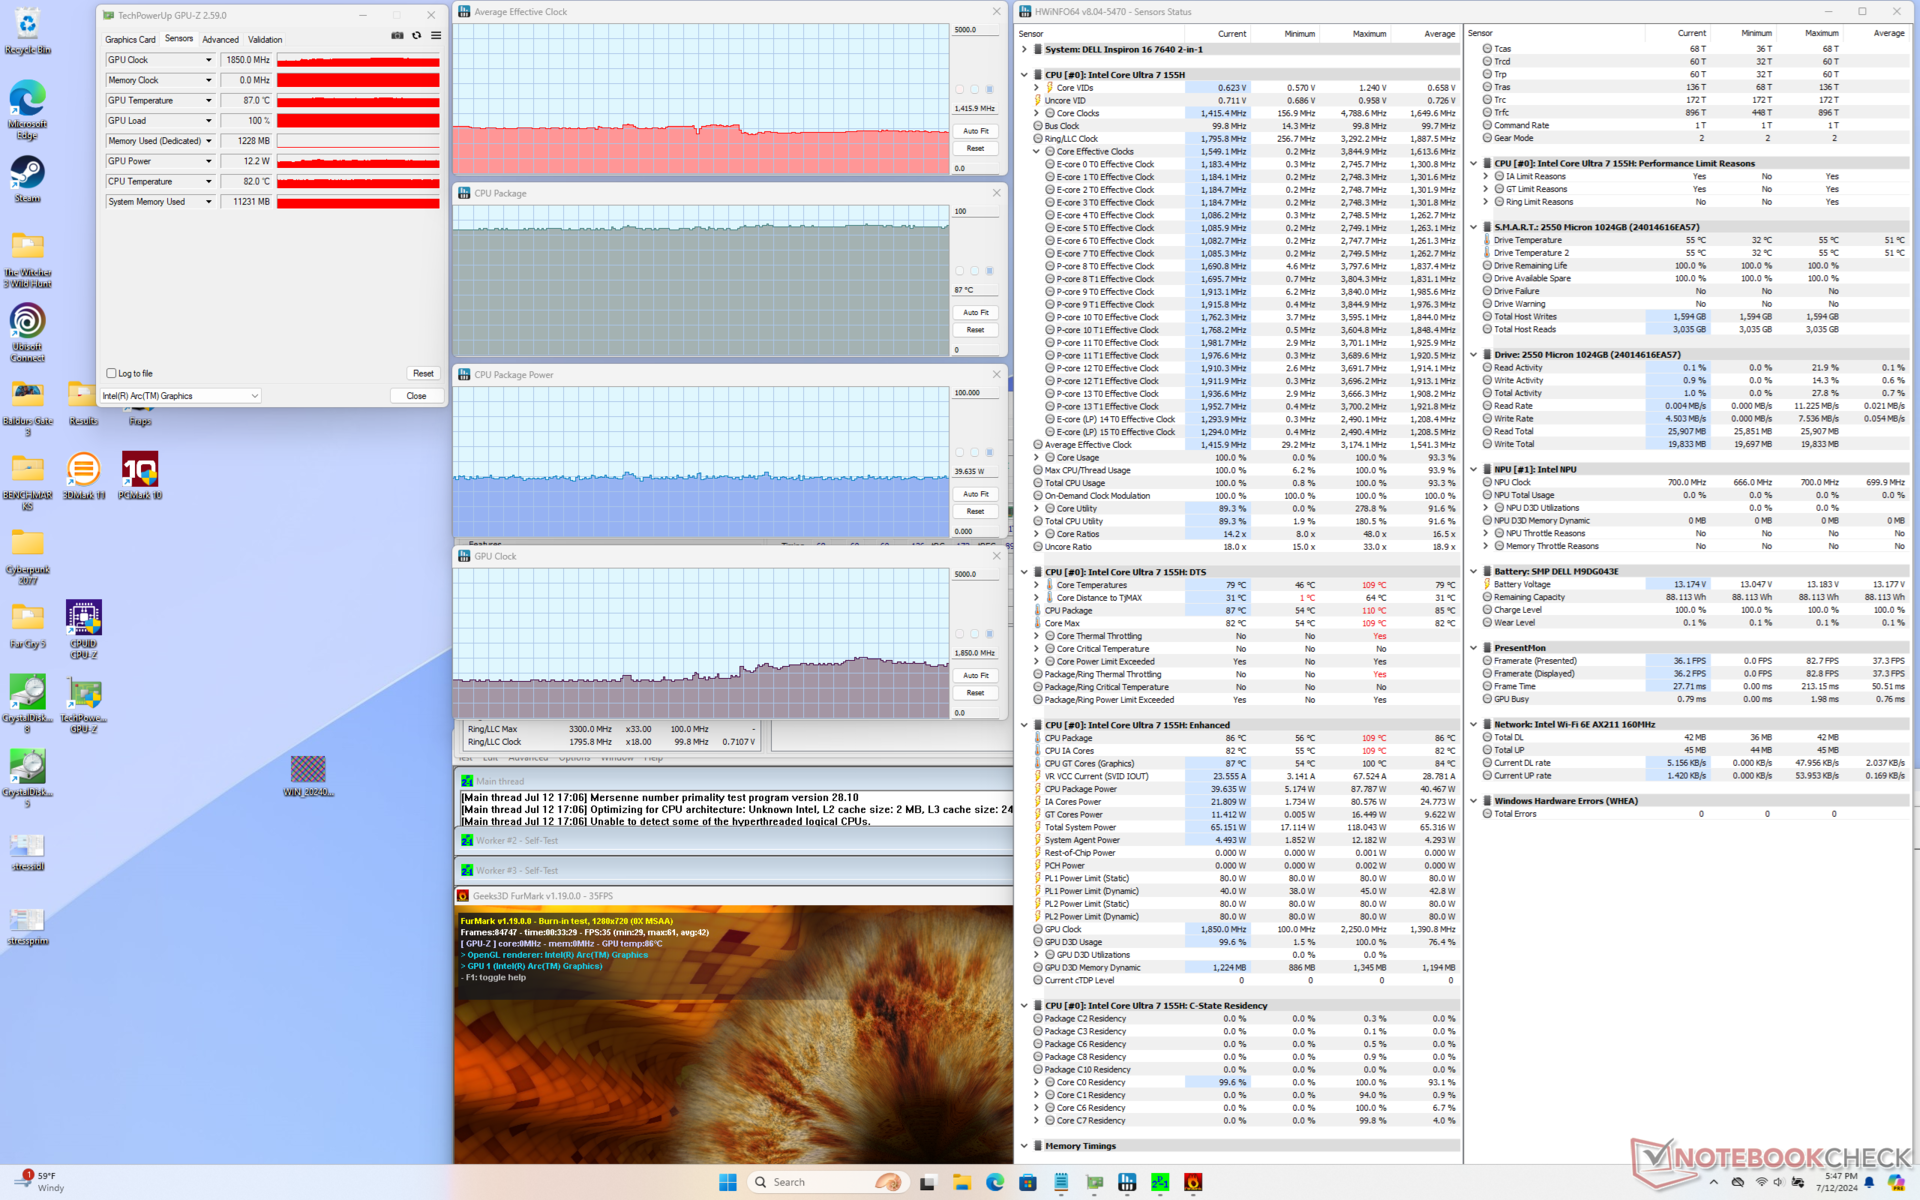
| CPU 平均时钟 (GHz) | GPU 时钟 (MHz) | CPU 平均温度 (°C) | |
| 系统闲置 | -- | -- | 55 |
| Prime95 压力 | 2.3 | -- | 86 |
| Prime95 + FurMark Stress | 1.4 | 1250 - 1850 | 87 |
| 赛博朋克 2077》压力 | 0.6 | 1650 - 2250 | 90 - 98 |
系统性能
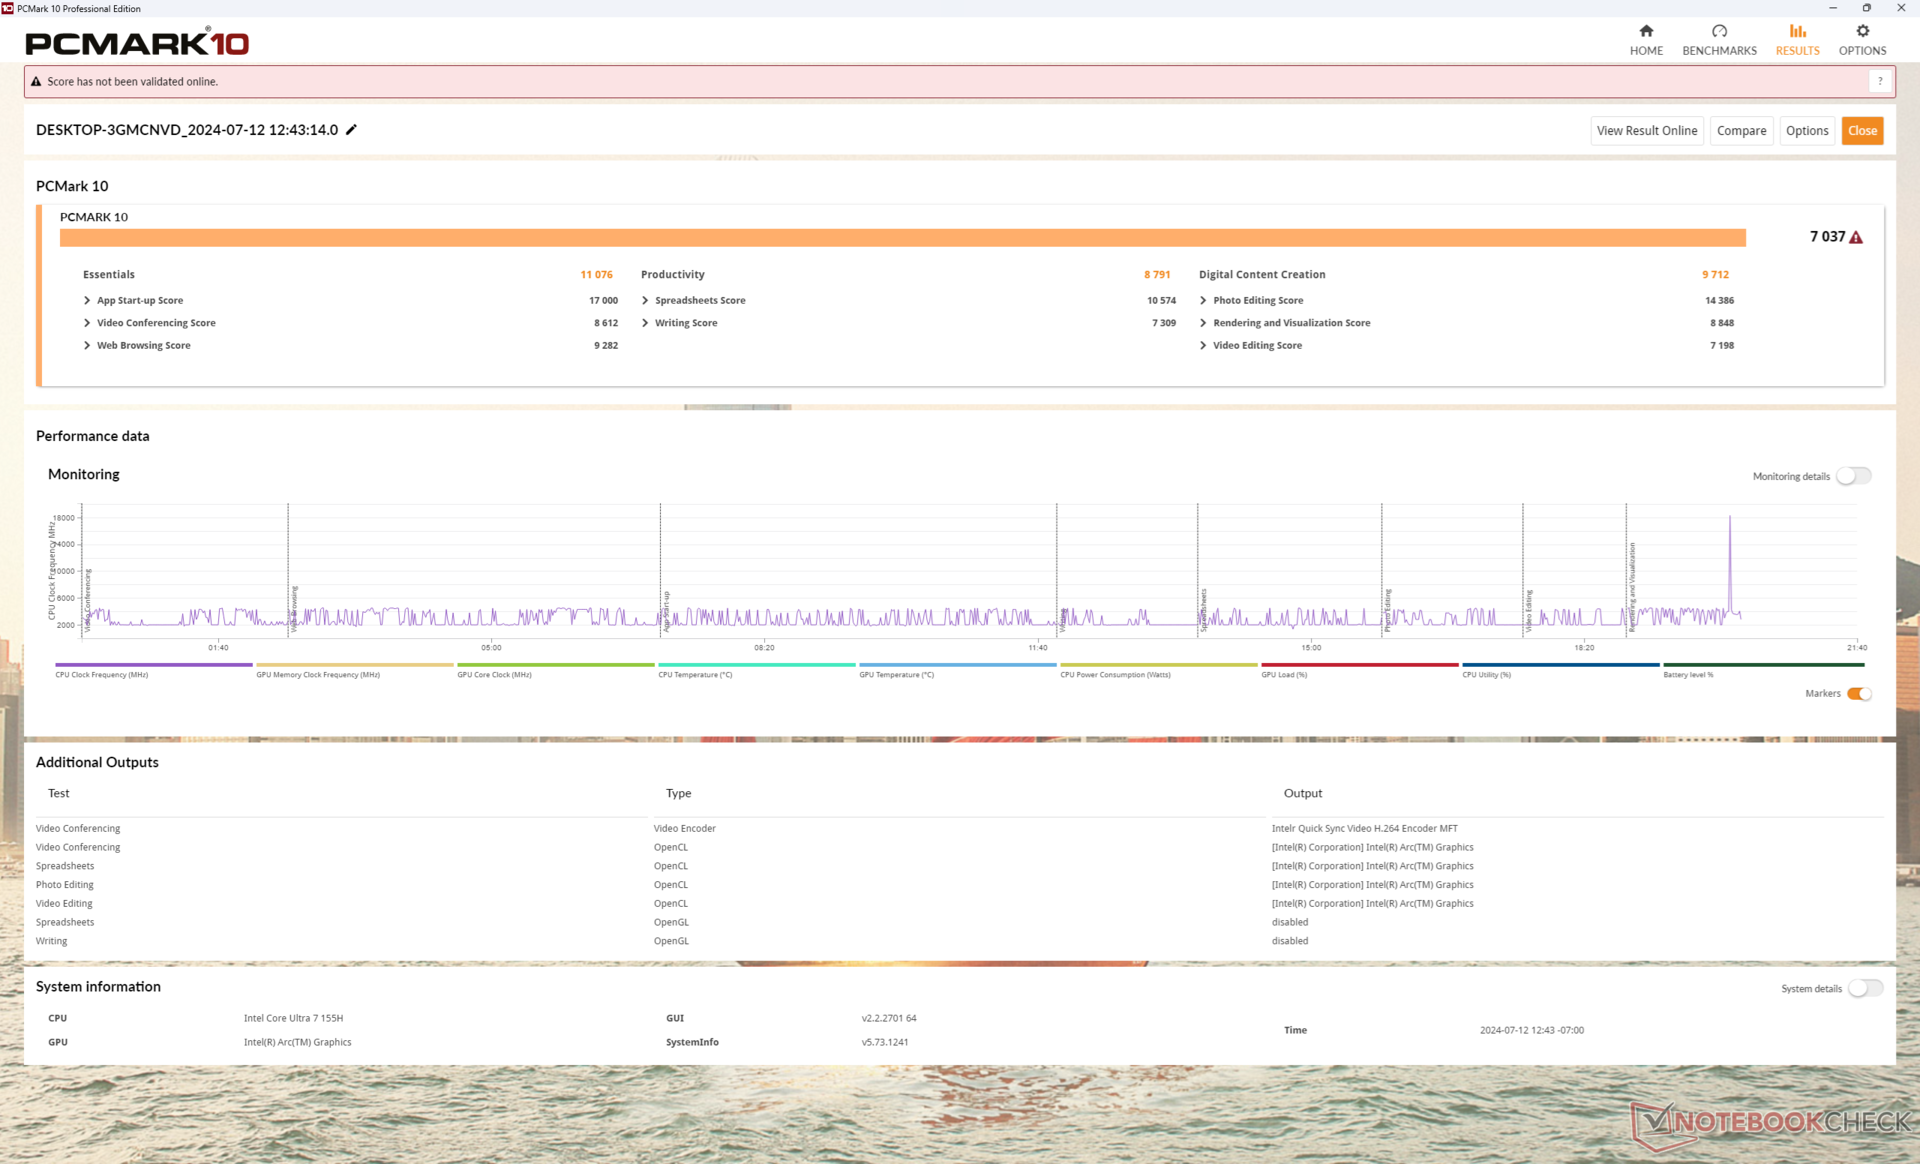
PCMark 测试结果非常出色,可与我们数据库中采用相同 CPU 和集成 GPU 的其他机器媲美。戴尔的平均得分是所有 16 英寸可折叠机中最高的之一,但采用独立 GPU 的其他机型,如 惠普 Spectre x360 16等采用独立 GPU 的产品仍将提供更快的图形性能。
CrossMark: Overall | Productivity | Creativity | Responsiveness
WebXPRT 3: Overall
WebXPRT 4: Overall
Mozilla Kraken 1.1: Total
| PCMark 10 / Score | |
| Lenovo IdeaPad Pro 5 16IMH G9 | |
| Dell Inspiron 16 Plus 7640 | |
| Dell Inspiron 16 7640 2-in-1 | |
| HP Envy x360 2-in-1 16-ad0097nr | |
| Average Intel Core Ultra 7 155H, Intel Arc 8-Core iGPU (4809 - 7529, n=34) | |
| Samsung Galaxy Book4 Pro 360 | |
| Dell Inspiron 16 7635 2-in-1 | |
| PCMark 10 / Essentials | |
| Lenovo IdeaPad Pro 5 16IMH G9 | |
| Dell Inspiron 16 7640 2-in-1 | |
| Dell Inspiron 16 7635 2-in-1 | |
| Samsung Galaxy Book4 Pro 360 | |
| HP Envy x360 2-in-1 16-ad0097nr | |
| Average Intel Core Ultra 7 155H, Intel Arc 8-Core iGPU (7605 - 11289, n=34) | |
| Dell Inspiron 16 Plus 7640 | |
| PCMark 10 / Productivity | |
| HP Envy x360 2-in-1 16-ad0097nr | |
| Dell Inspiron 16 7635 2-in-1 | |
| Lenovo IdeaPad Pro 5 16IMH G9 | |
| Dell Inspiron 16 7640 2-in-1 | |
| Average Intel Core Ultra 7 155H, Intel Arc 8-Core iGPU (6042 - 10591, n=34) | |
| Dell Inspiron 16 Plus 7640 | |
| Samsung Galaxy Book4 Pro 360 | |
| PCMark 10 / Digital Content Creation | |
| Dell Inspiron 16 Plus 7640 | |
| Lenovo IdeaPad Pro 5 16IMH G9 | |
| Dell Inspiron 16 7640 2-in-1 | |
| Average Intel Core Ultra 7 155H, Intel Arc 8-Core iGPU (4985 - 10709, n=34) | |
| HP Envy x360 2-in-1 16-ad0097nr | |
| Samsung Galaxy Book4 Pro 360 | |
| Dell Inspiron 16 7635 2-in-1 | |
| CrossMark / Overall | |
| Dell Inspiron 16 7640 2-in-1 | |
| Dell Inspiron 16 Plus 7640 | |
| Average Intel Core Ultra 7 155H, Intel Arc 8-Core iGPU (1366 - 1903, n=34) | |
| HP Envy x360 2-in-1 16-ad0097nr | |
| Samsung Galaxy Book4 Pro 360 | |
| Lenovo IdeaPad Pro 5 16IMH G9 | |
| Dell Inspiron 16 7635 2-in-1 | |
| CrossMark / Productivity | |
| Dell Inspiron 16 7640 2-in-1 | |
| HP Envy x360 2-in-1 16-ad0097nr | |
| Dell Inspiron 16 Plus 7640 | |
| Average Intel Core Ultra 7 155H, Intel Arc 8-Core iGPU (1291 - 1798, n=33) | |
| Samsung Galaxy Book4 Pro 360 | |
| Lenovo IdeaPad Pro 5 16IMH G9 | |
| Dell Inspiron 16 7635 2-in-1 | |
| CrossMark / Creativity | |
| Dell Inspiron 16 Plus 7640 | |
| Dell Inspiron 16 7640 2-in-1 | |
| Lenovo IdeaPad Pro 5 16IMH G9 | |
| Average Intel Core Ultra 7 155H, Intel Arc 8-Core iGPU (1519 - 1929, n=33) | |
| HP Envy x360 2-in-1 16-ad0097nr | |
| Samsung Galaxy Book4 Pro 360 | |
| Dell Inspiron 16 7635 2-in-1 | |
| CrossMark / Responsiveness | |
| Samsung Galaxy Book4 Pro 360 | |
| Average Intel Core Ultra 7 155H, Intel Arc 8-Core iGPU (939 - 1802, n=33) | |
| Dell Inspiron 16 7640 2-in-1 | |
| HP Envy x360 2-in-1 16-ad0097nr | |
| Dell Inspiron 16 Plus 7640 | |
| Lenovo IdeaPad Pro 5 16IMH G9 | |
| Dell Inspiron 16 7635 2-in-1 | |
| WebXPRT 3 / Overall | |
| HP Envy x360 2-in-1 16-ad0097nr | |
| Dell Inspiron 16 Plus 7640 | |
| Lenovo IdeaPad Pro 5 16IMH G9 | |
| Dell Inspiron 16 7640 2-in-1 | |
| Average Intel Core Ultra 7 155H, Intel Arc 8-Core iGPU (252 - 299, n=34) | |
| Dell Inspiron 16 7635 2-in-1 | |
| Samsung Galaxy Book4 Pro 360 | |
| WebXPRT 4 / Overall | |
| Lenovo IdeaPad Pro 5 16IMH G9 | |
| Dell Inspiron 16 7640 2-in-1 | |
| Dell Inspiron 16 Plus 7640 | |
| Average Intel Core Ultra 7 155H, Intel Arc 8-Core iGPU (166.4 - 309, n=29) | |
| HP Envy x360 2-in-1 16-ad0097nr | |
| Samsung Galaxy Book4 Pro 360 | |
| Dell Inspiron 16 7635 2-in-1 | |
| Mozilla Kraken 1.1 / Total | |
| Dell Inspiron 16 7635 2-in-1 | |
| Samsung Galaxy Book4 Pro 360 | |
| Average Intel Core Ultra 7 155H, Intel Arc 8-Core iGPU (517 - 614, n=35) | |
| HP Envy x360 2-in-1 16-ad0097nr | |
| Dell Inspiron 16 7640 2-in-1 | |
| Dell Inspiron 16 Plus 7640 | |
| Lenovo IdeaPad Pro 5 16IMH G9 | |
* ... smaller is better
| PCMark 10 Score | 7037 points | |
Help | ||
| AIDA64 / Memory Copy | |
| Lenovo IdeaPad Pro 5 16IMH G9 | |
| Samsung Galaxy Book4 Pro 360 | |
| Average Intel Core Ultra 7 155H (62397 - 96791, n=50) | |
| Dell Inspiron 16 7640 2-in-1 | |
| HP Envy x360 2-in-1 16-ad0097nr | |
| Dell Inspiron 16 Plus 7640 | |
| Dell Inspiron 16 7635 2-in-1 | |
| AIDA64 / Memory Read | |
| Lenovo IdeaPad Pro 5 16IMH G9 | |
| Average Intel Core Ultra 7 155H (60544 - 90647, n=50) | |
| Dell Inspiron 16 Plus 7640 | |
| Samsung Galaxy Book4 Pro 360 | |
| Dell Inspiron 16 7640 2-in-1 | |
| HP Envy x360 2-in-1 16-ad0097nr | |
| Dell Inspiron 16 7635 2-in-1 | |
| AIDA64 / Memory Write | |
| HP Envy x360 2-in-1 16-ad0097nr | |
| Dell Inspiron 16 7640 2-in-1 | |
| Lenovo IdeaPad Pro 5 16IMH G9 | |
| Average Intel Core Ultra 7 155H (58692 - 93451, n=50) | |
| Samsung Galaxy Book4 Pro 360 | |
| Dell Inspiron 16 Plus 7640 | |
| Dell Inspiron 16 7635 2-in-1 | |
| AIDA64 / Memory Latency | |
| Dell Inspiron 16 7640 2-in-1 | |
| Average Intel Core Ultra 7 155H (116.2 - 233, n=50) | |
| Lenovo IdeaPad Pro 5 16IMH G9 | |
| Samsung Galaxy Book4 Pro 360 | |
| HP Envy x360 2-in-1 16-ad0097nr | |
| Dell Inspiron 16 Plus 7640 | |
| Dell Inspiron 16 7635 2-in-1 | |
* ... smaller is better
DPC 延迟
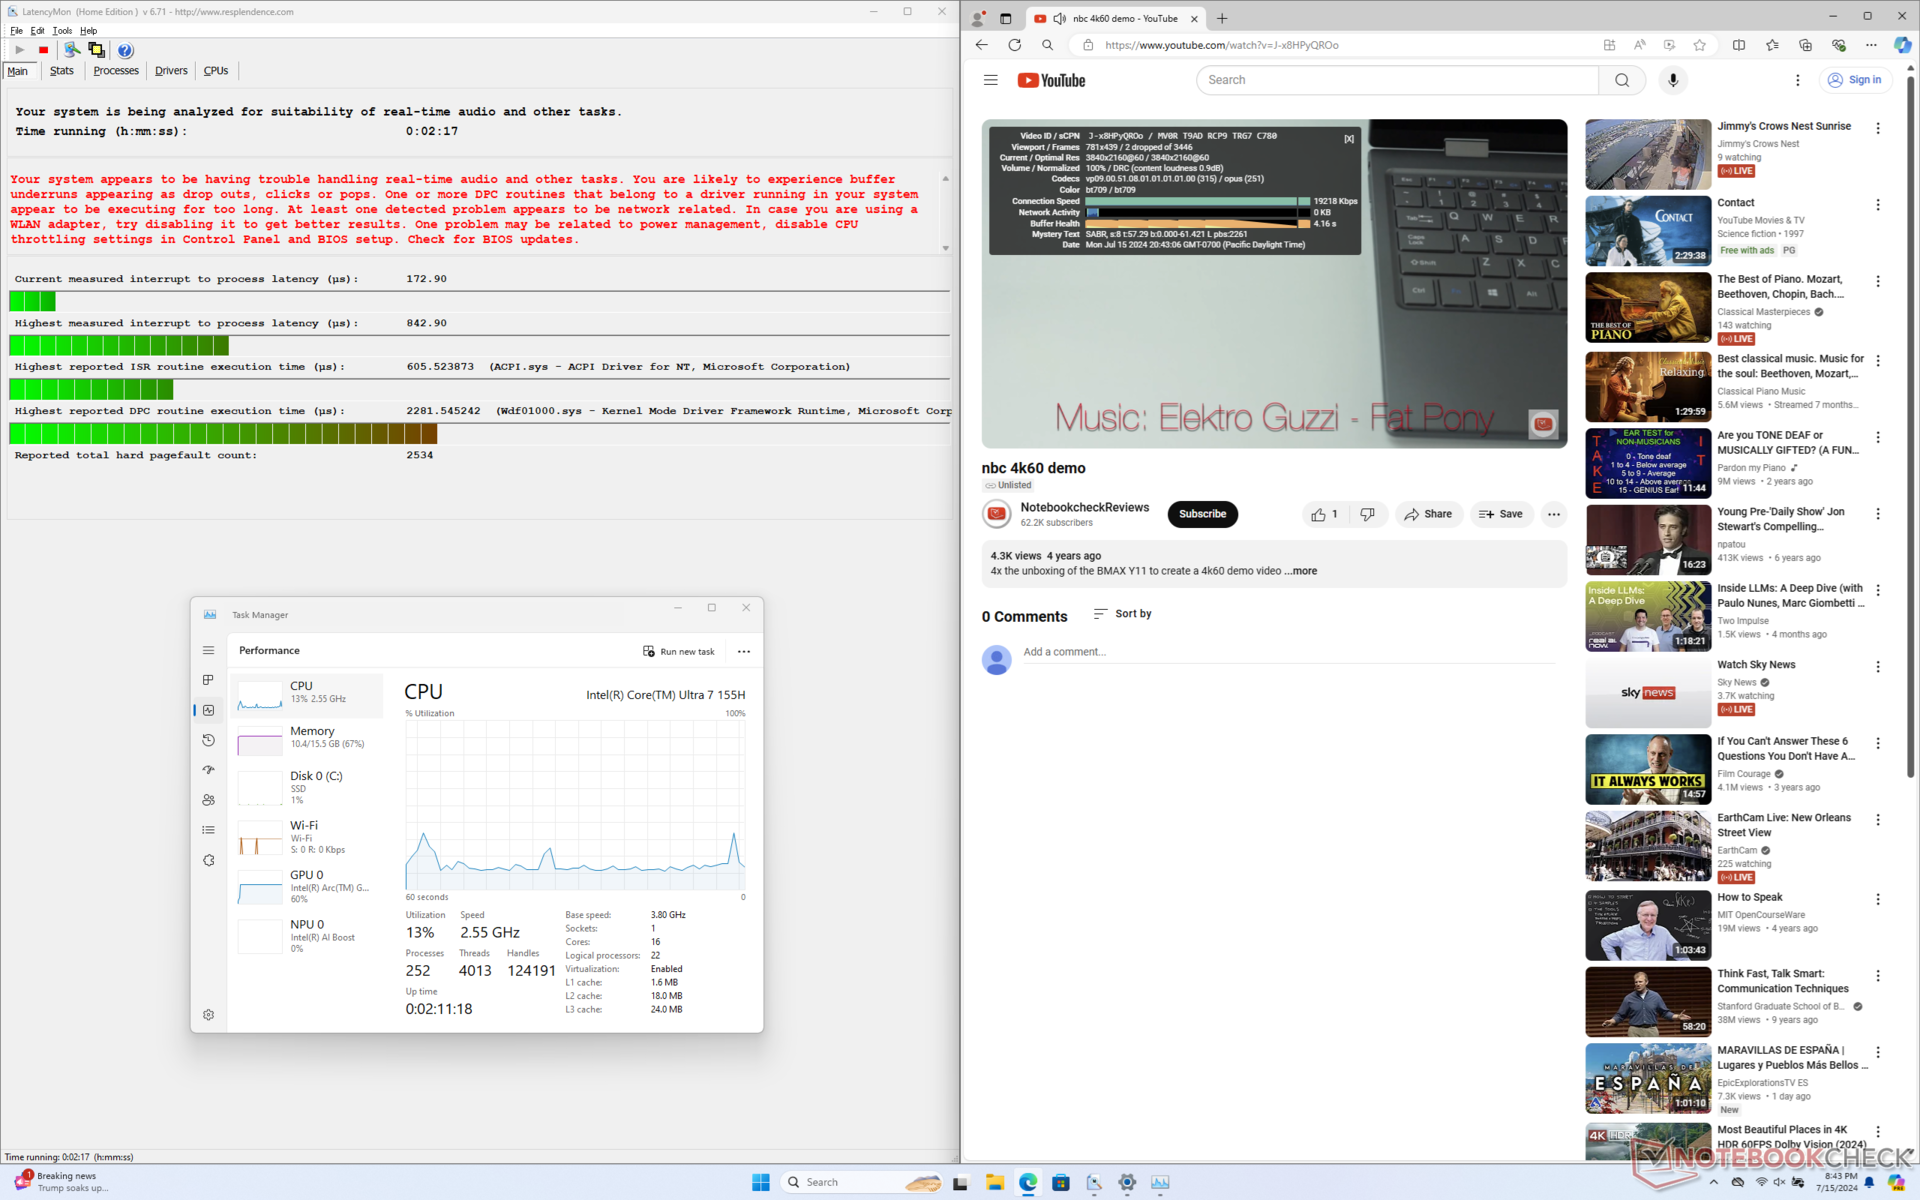
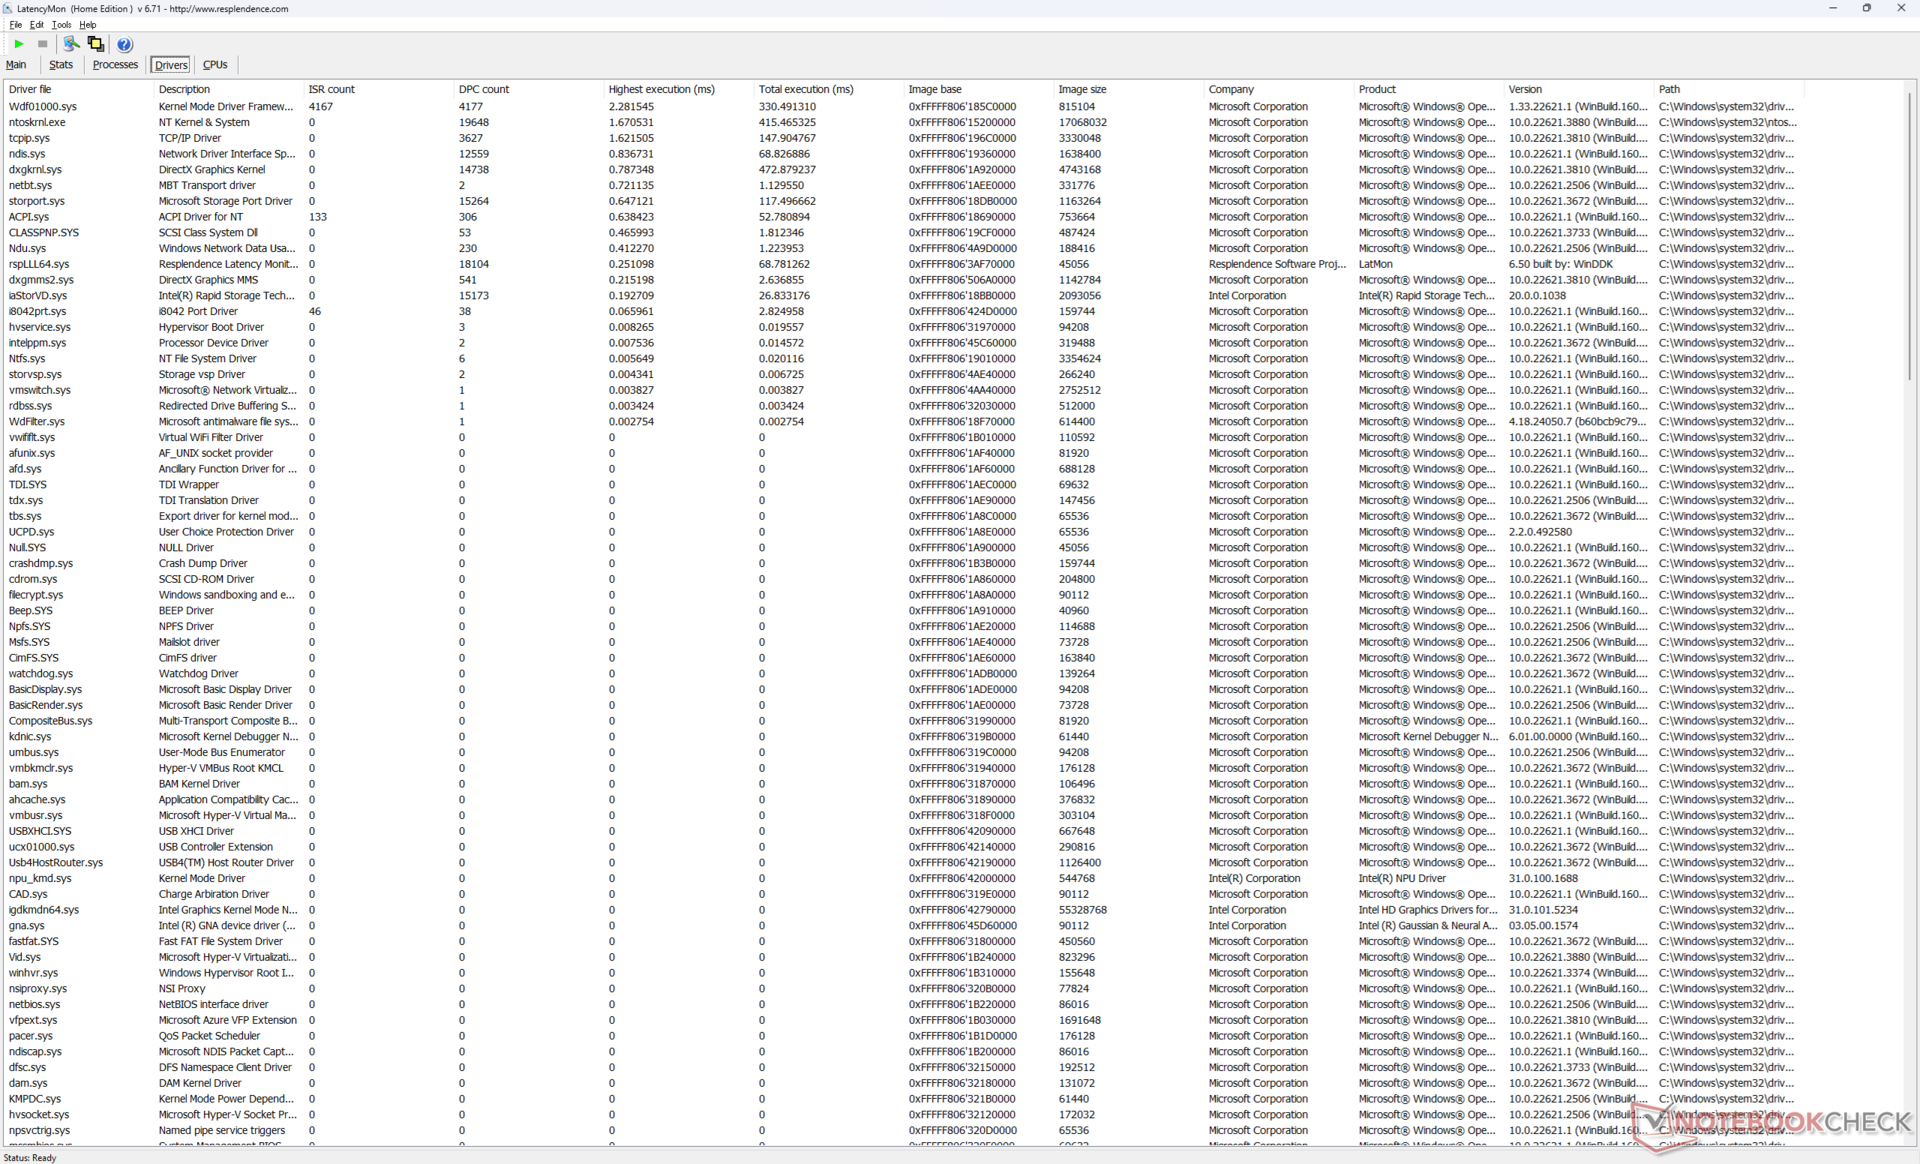
在打开主页的多个浏览器标签页时,LatencyMon 发现了轻微的 DPC 问题。在长达一分钟的 4K60 视频测试中,我们还能记录到 2 个丢帧,而理想情况下应该是 0。
| DPC Latencies / LatencyMon - interrupt to process latency (max), Web, Youtube, Prime95 | |
| Samsung Galaxy Book4 Pro 360 | |
| HP Envy x360 2-in-1 16-ad0097nr | |
| Dell Inspiron 16 7640 2-in-1 | |
| Lenovo IdeaPad Pro 5 16IMH G9 | |
| Dell Inspiron 16 Plus 7640 | |
| Dell Inspiron 16 7635 2-in-1 | |
* ... smaller is better
存储设备
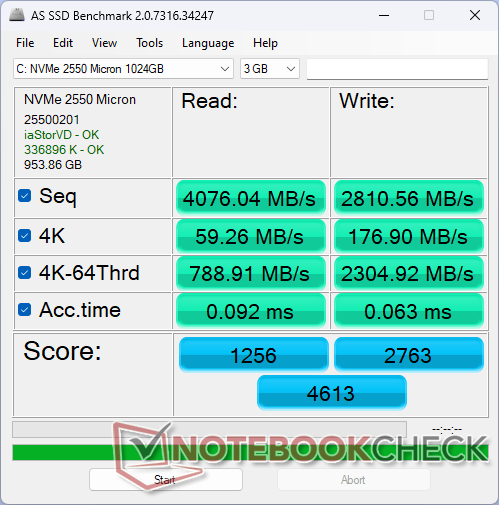
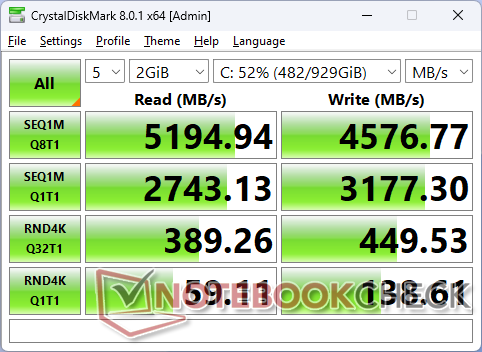
戴尔为其 Inspiron 系列产品从多家供应商处采购固态硬盘,包括 Kioxia、SK Hynix 和 Micron。我们的特定测试设备配备了 美光 2550这是一款中端 PCIe4 NVMe SSD,读取速度高达 5200 MB/s。相比之下,三星 PM9A1 等更昂贵的硬盘可以达到 7000 MB/s 以上,但美光 2550 对于我们的 Inspiron 16 2-in-1 这样的中端机型来说已经足够合适。
即使考虑到受压时的节流,传输速率也远远超过去年 Inspiron 16 7635 2 合 1 中的 Kioxia BG5。

* ... smaller is better
Disk Throttling: DiskSpd Read Loop, Queue Depth 8
图形处理器性能
图形处理性能相当不错,在不使用独立选件的情况下,是速度最快的可转换机之一。弧 Arc 8图形处理器可与 Radeon 780M相媲美,并远远领先于较早的 Iris Xe 96 EUs或 Radeon RX Vega解决方案,在许多情况下都超过其 2 倍。例如,去年 Inspiron 16 7635 2 合 1 中的 Radeon RX Vega 7 几乎落后 60%。
需要游戏级性能和 CUDA 加速的用户可以考虑 Spectre x360 16,配备 GeForce RTX 4050与 Arc 8 相比,图形性能又提升了 2 倍。当然,Spectre 也比戴尔贵很多。
请记住,Arc 8 GPU 仅适用于酷睿至尊 7 155H 配置。如果选择酷睿至尊 5 125U,就意味着只能使用 Arc 4这意味着图形性能将大幅降低 40% 至 45%。
| 电源配置文件 | Fire Strike 图形分数 | Fire Strike 物理得分 | 综合得分 |
| 性能模式 | 8567 | 25687 | 2982 |
| 均衡模式 | 8640 (-0%) | 26567 (-0%) | 2781 (-7%) |
| 电池电量 | 7734 (-10%) | 25155 (-2%) | 2886 (-3%) |
根据上表中Fire Strike 的结果,在平衡模式下运行对性能的影响最多只会很小。使用电池供电时的性能损失低于预期,仅为 10%,不同供电模式之间具有良好的一致性。
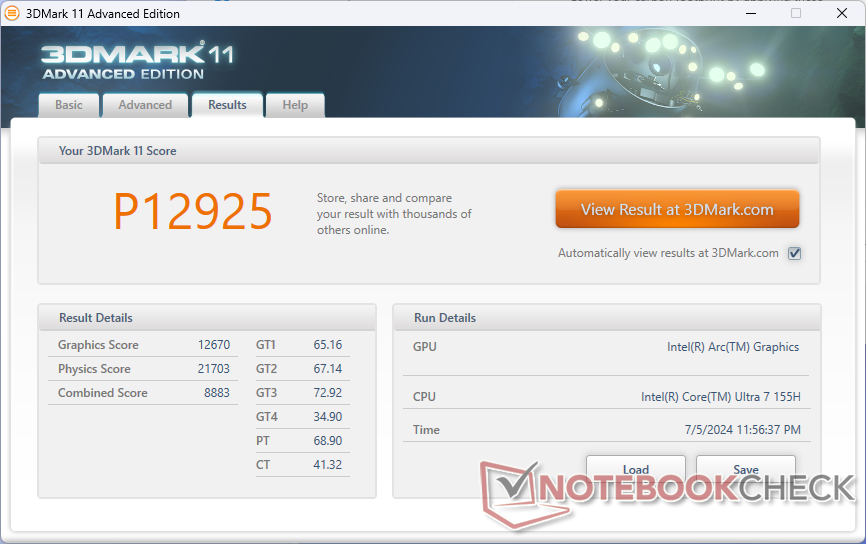
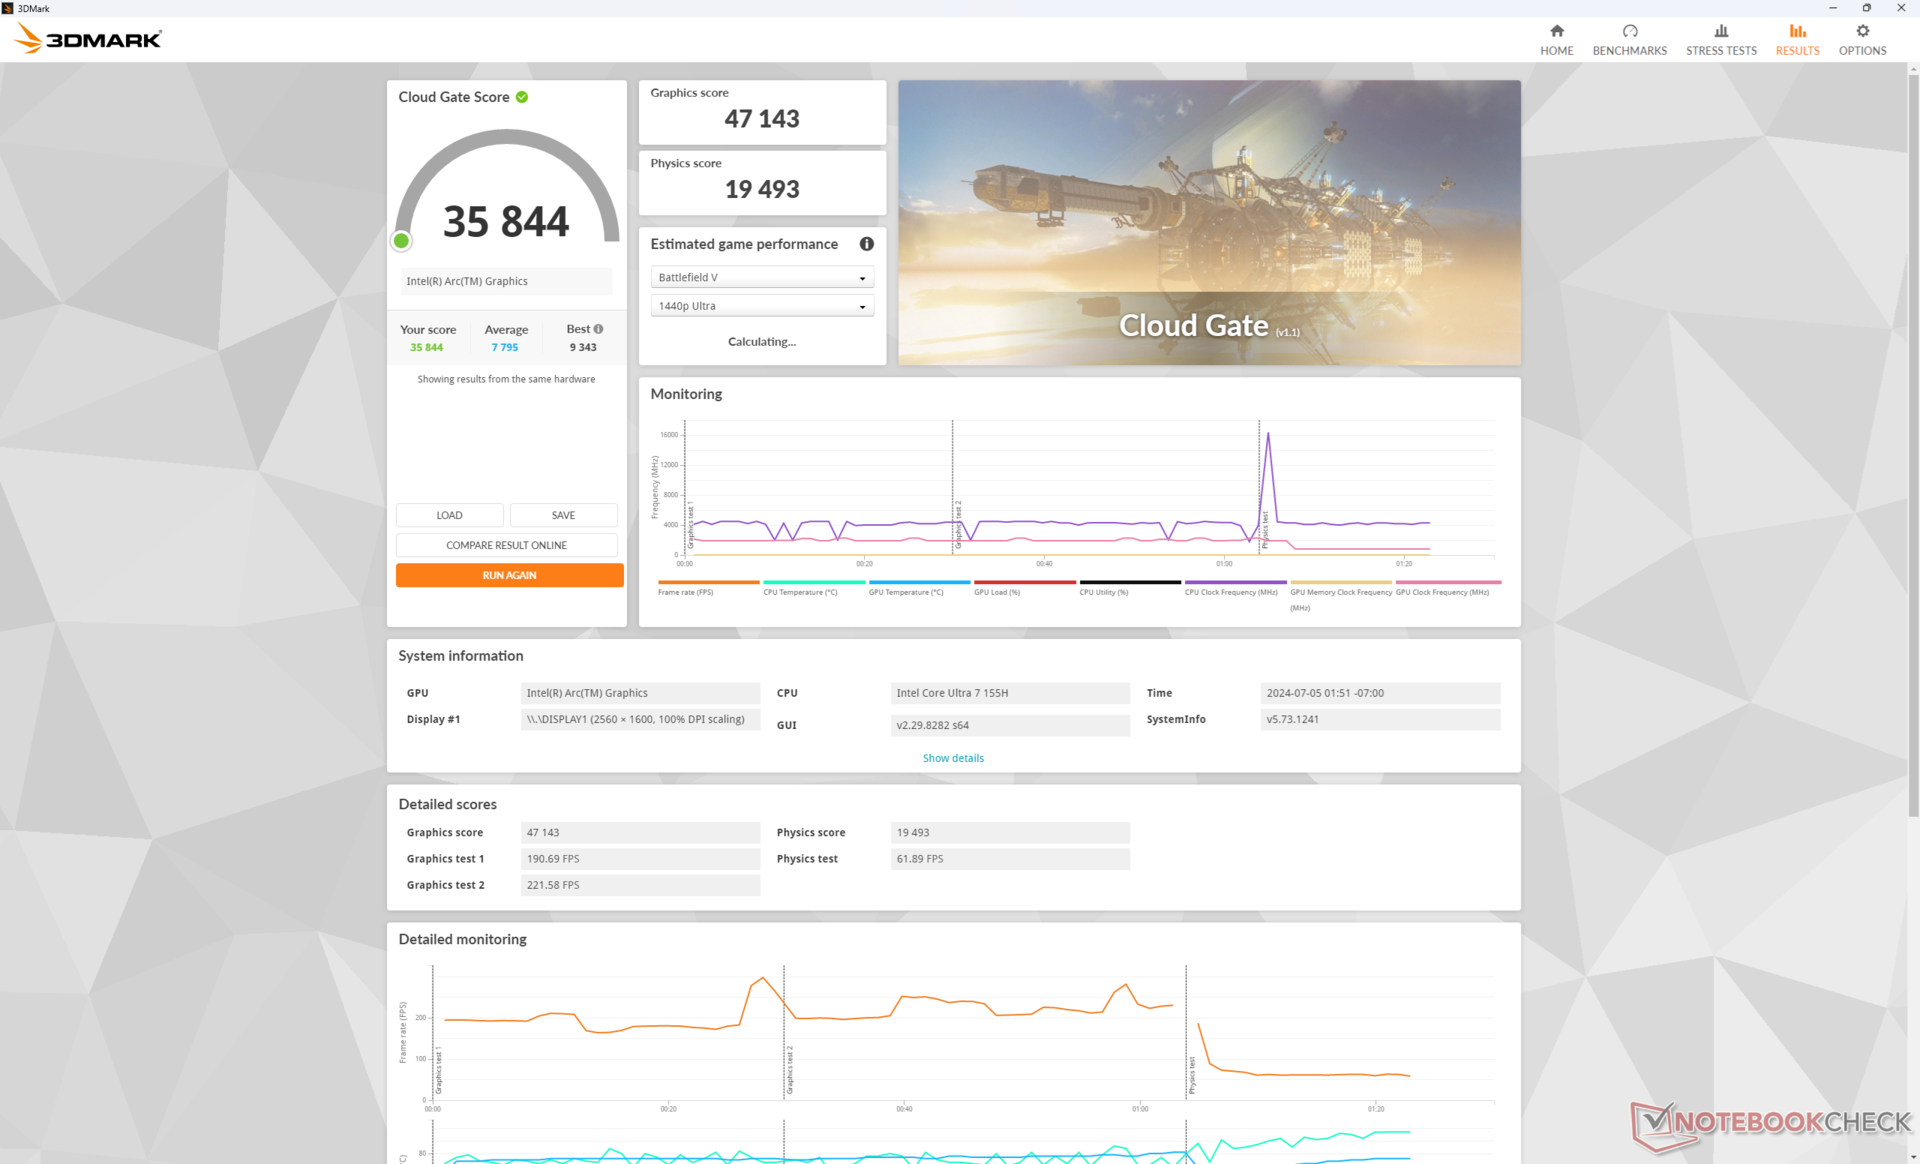
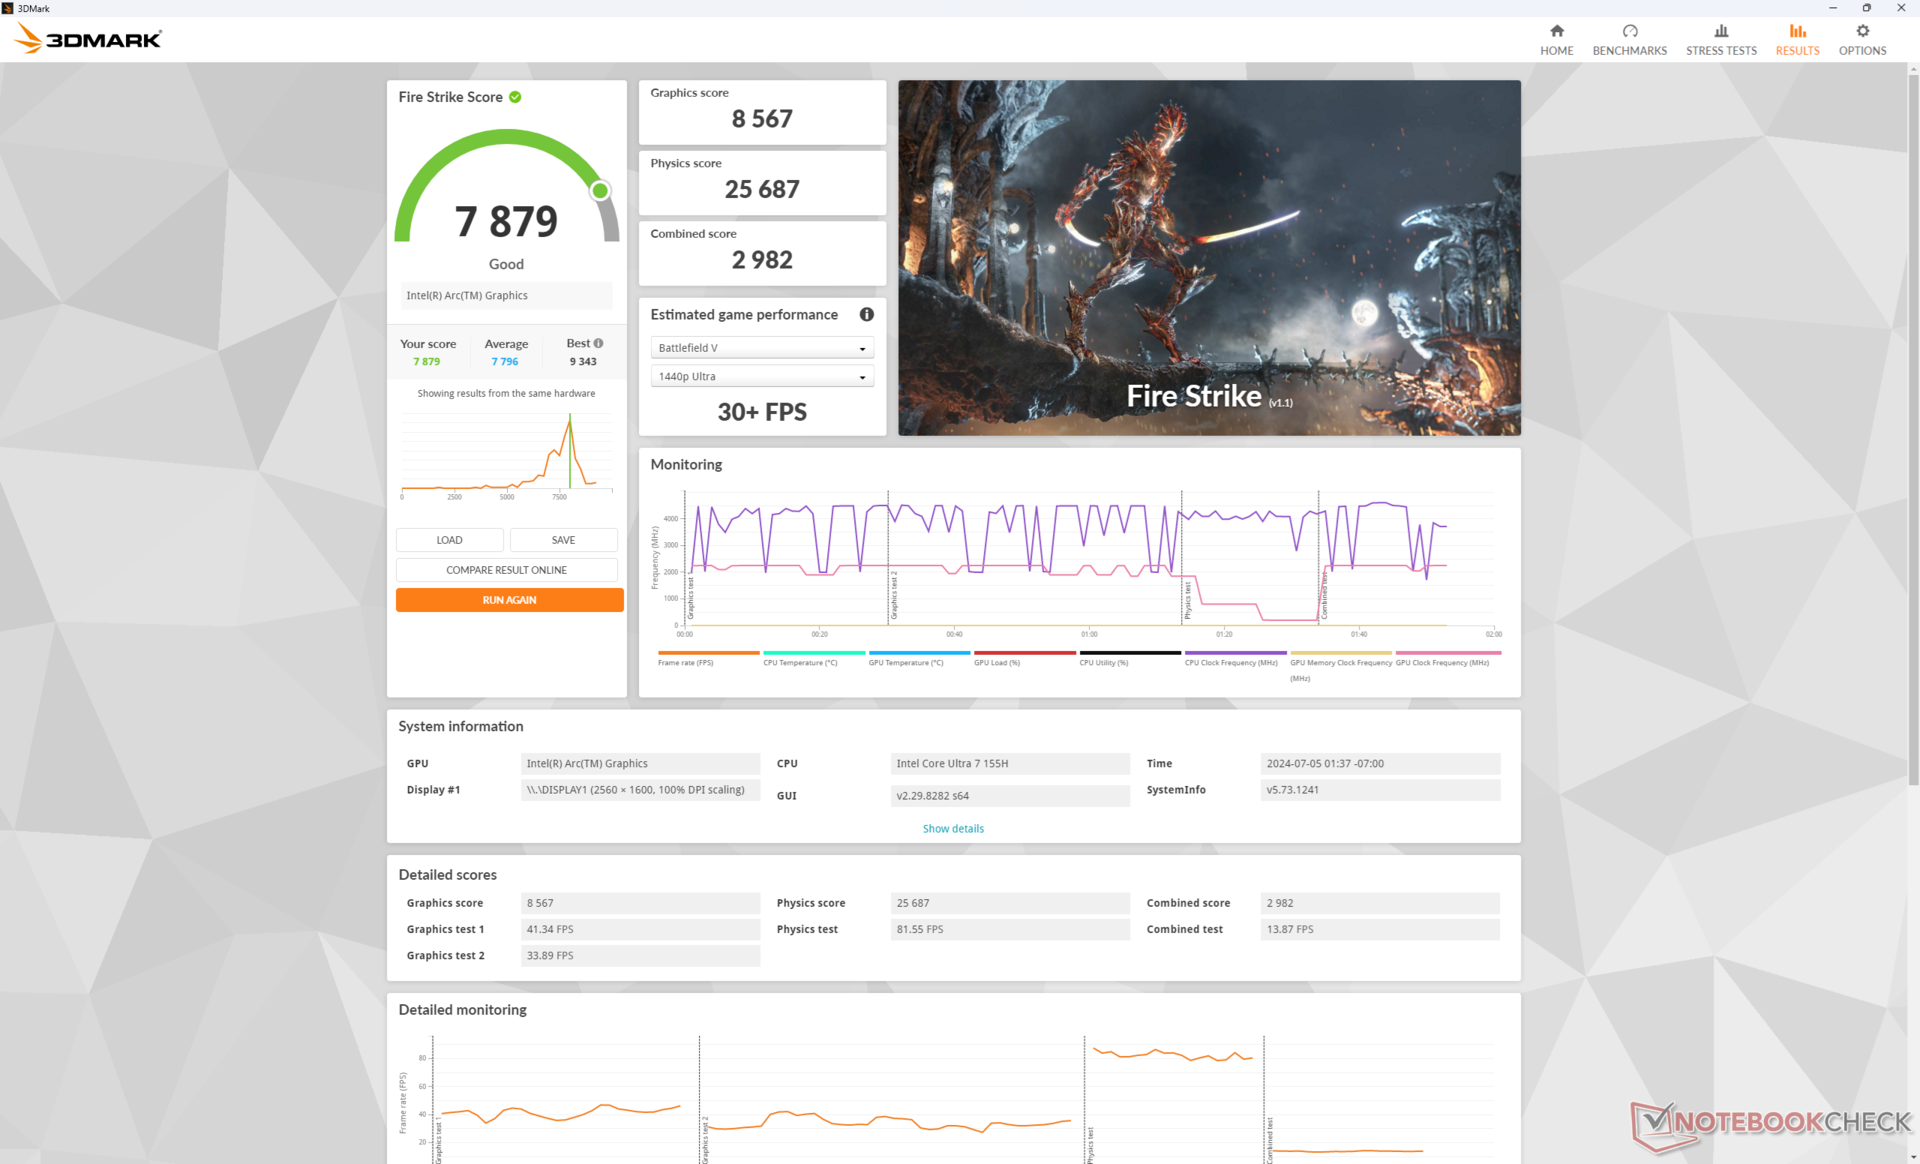
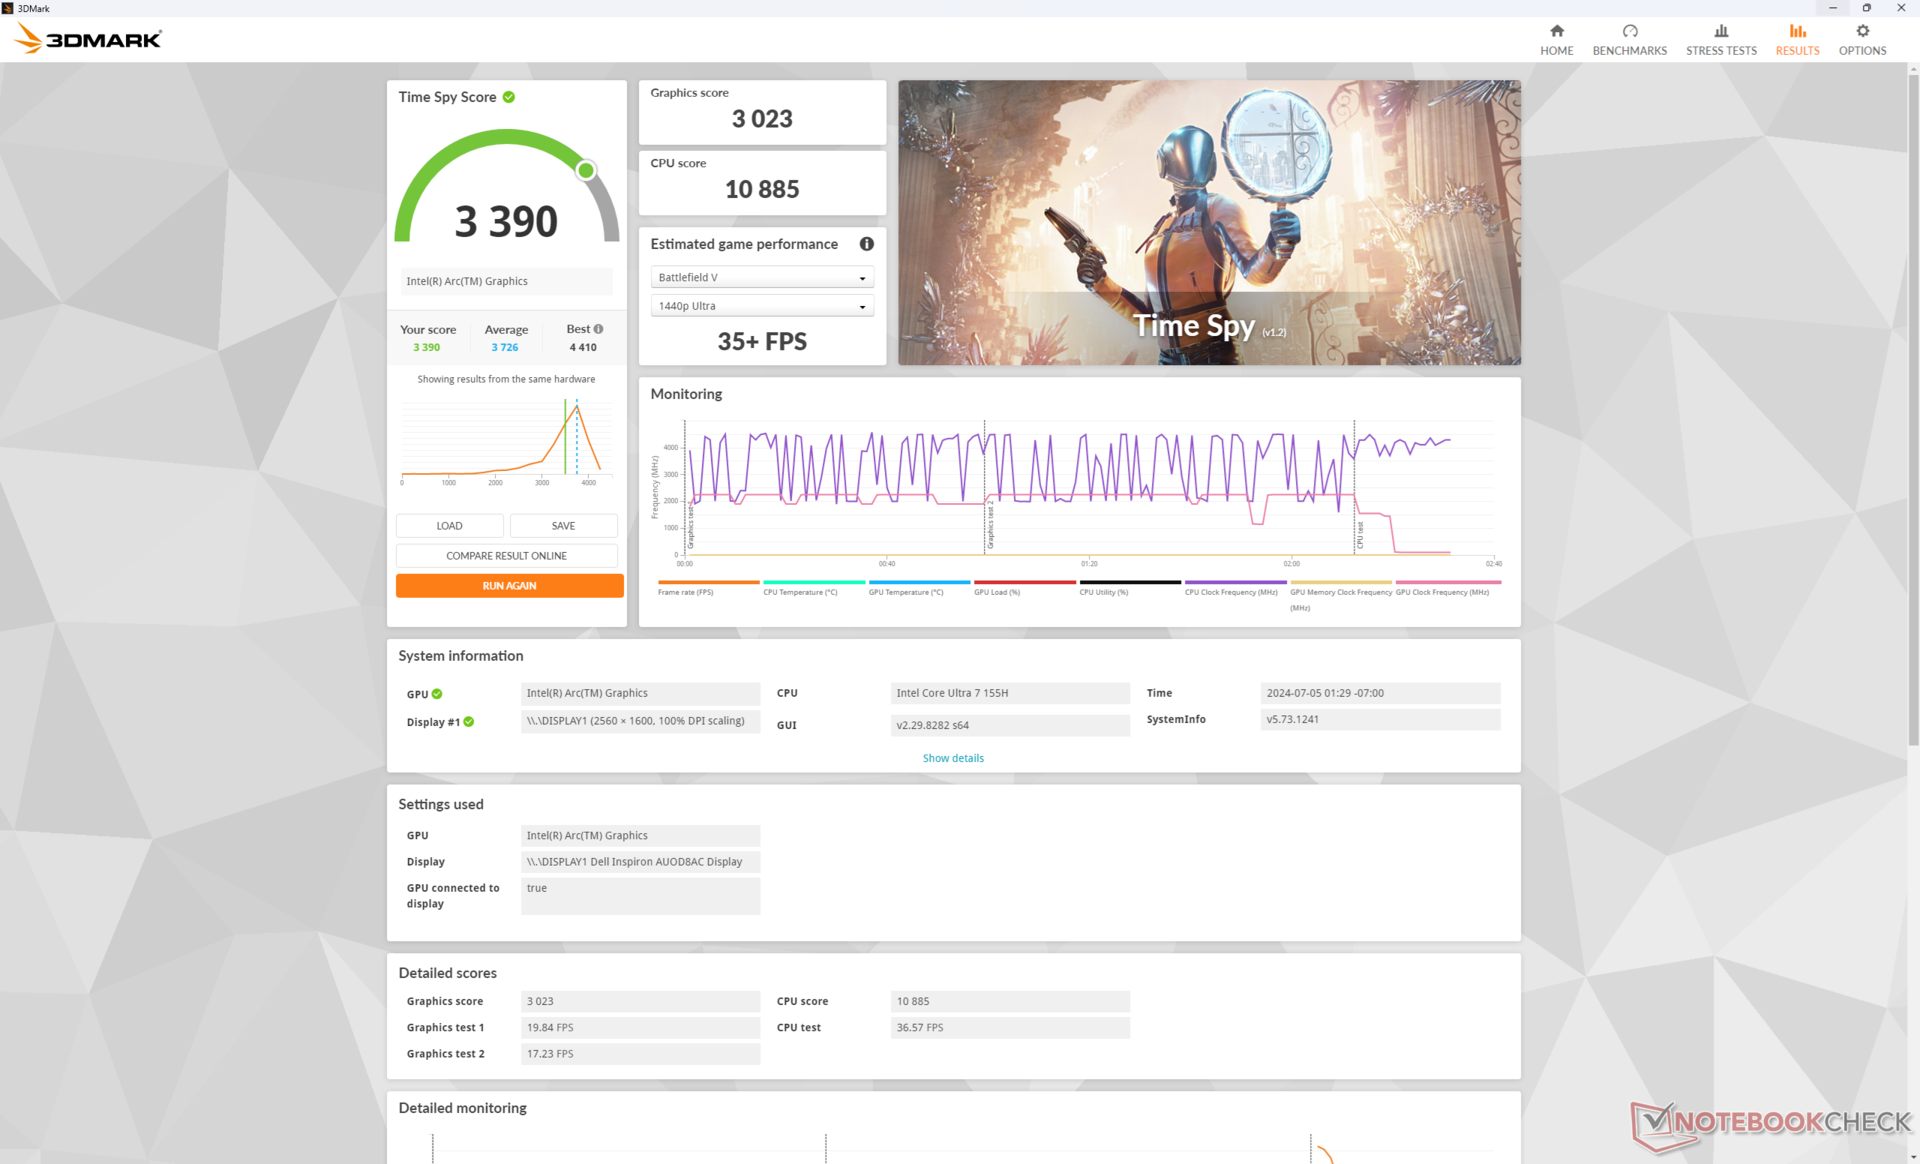
| 3DMark 11 Performance | 12925 points | |
| 3DMark Cloud Gate Standard Score | 35844 points | |
| 3DMark Fire Strike Score | 7879 points | |
| 3DMark Time Spy Score | 3390 points | |
Help | ||
* ... smaller is better
| The Witcher 3 - 1920x1080 Ultra Graphics & Postprocessing (HBAO+) | |
| Dell Inspiron 16 Plus 7640 | |
| HP Envy x360 2-in-1 16-ad0097nr | |
| Lenovo IdeaPad Pro 5 16IMH G9 | |
| Dell Inspiron 16 7640 2-in-1 | |
| Samsung Galaxy Book4 Pro 360 | |
| Dell Inspiron 16 7635 2-in-1 | |
| Final Fantasy XV Benchmark - 1920x1080 High Quality | |
| Dell Inspiron 16 Plus 7640 | |
| Lenovo IdeaPad Pro 5 16IMH G9 | |
| Dell Inspiron 16 7640 2-in-1 | |
| HP Envy x360 2-in-1 16-ad0097nr | |
| Samsung Galaxy Book4 Pro 360 | |
| Dell Inspiron 16 7635 2-in-1 | |
| Strange Brigade - 1920x1080 ultra AA:ultra AF:16 | |
| Dell Inspiron 16 Plus 7640 | |
| Lenovo IdeaPad Pro 5 16IMH G9 | |
| Dell Inspiron 16 7640 2-in-1 | |
| HP Envy x360 2-in-1 16-ad0097nr | |
| Samsung Galaxy Book4 Pro 360 | |
| Dell Inspiron 16 7635 2-in-1 | |
| Dota 2 Reborn - 1920x1080 ultra (3/3) best looking | |
| Dell Inspiron 16 Plus 7640 | |
| Lenovo IdeaPad Pro 5 16IMH G9 | |
| Dell Inspiron 16 7640 2-in-1 | |
| HP Envy x360 2-in-1 16-ad0097nr | |
| Samsung Galaxy Book4 Pro 360 | |
| Dell Inspiron 16 7635 2-in-1 | |
| X-Plane 11.11 - 1920x1080 high (fps_test=3) | |
| Dell Inspiron 16 Plus 7640 | |
| Dell Inspiron 16 7640 2-in-1 | |
| Lenovo IdeaPad Pro 5 16IMH G9 | |
| Samsung Galaxy Book4 Pro 360 | |
| HP Envy x360 2-in-1 16-ad0097nr | |
| Dell Inspiron 16 7635 2-in-1 | |
| Far Cry 5 - 1920x1080 Ultra Preset AA:T | |
| Dell Inspiron 16 Plus 7640 | |
| Lenovo IdeaPad Pro 5 16IMH G9 | |
| Dell Inspiron 16 7640 2-in-1 | |
| HP Envy x360 2-in-1 16-ad0097nr | |
Cyberpunk 2077 ultra FPS Chart
| low | med. | high | ultra | |
|---|---|---|---|---|
| The Witcher 3 (2015) | 141.5 | 81.2 | 44.5 | 23.9 |
| Dota 2 Reborn (2015) | 101.5 | 93.3 | 77.8 | 78 |
| Final Fantasy XV Benchmark (2018) | 65 | 36.5 | 26.8 | |
| X-Plane 11.11 (2018) | 50.8 | 40.8 | 40.1 | |
| Far Cry 5 (2018) | 68 | 38 | 36 | 34 |
| Strange Brigade (2018) | 145.6 | 71.8 | 55.4 | 45.4 |
| Tiny Tina's Wonderlands (2022) | 49.2 | 37.3 | 26.4 | 21.2 |
| F1 22 (2022) | 68.8 | 65.6 | ||
| Baldur's Gate 3 (2023) | 30.8 | 27.4 | 23.7 | 22 |
| Cyberpunk 2077 2.2 Phantom Liberty (2023) | 31 | 26.3 | 21.9 |
排放量
系统噪音 - 大声而自豪
尽管我们对处理器的要求更高,但与 2023 机型相比,散热解决方案并无重大变化,因此内部风扇的运行声音必须和以前一样大或更大,而这正是我们在测试中记录到的情况。当负载加重时,Inspiron 16 7640 2 合 1 的风扇更容易从静音加速到大声运转。例如,在3DMark 06第一个基准测试场景进行到一半时,我们记录到的风扇噪音为 45 dB(A),而 Inspiron 16 7635 2 合 1 则为 45 dB(A)。 Inspiron 16 7635 二合一的最高噪音为 40 分贝(A)。运行游戏时的风扇噪音也达到了 45 dB(A),使戴尔成为市场上噪音较大的 16 英寸可折叠电脑之一。

Noise Level
| Idle |
| 22.9 / 22.9 / 25 dB(A) |
| Load |
| 45.1 / 44.9 dB(A) |
 | ||
30 dB silent 40 dB(A) audible 50 dB(A) loud |
||
min: | ||
| Dell Inspiron 16 7640 2-in-1 Arc 8-Core, Ultra 7 155H, Micron 2550 1TB | Dell Inspiron 16 Plus 7640 NVIDIA GeForce RTX 4060 Laptop GPU, Ultra 7 155H, SK hynix BC901 HFS001TEJ4X164N | Dell Inspiron 16 7635 2-in-1 Vega 7, R5 7530U, Kioxia BG5 KBG50ZNS512G | HP Envy x360 2-in-1 16-ad0097nr Radeon 780M, R7 8840HS, KIOXIA BG5 KBG50ZNV1T02 | Lenovo IdeaPad Pro 5 16IMH G9 Arc 8-Core, Ultra 7 155H, Samsung PM9C1a MZAL81T0HDLB | Samsung Galaxy Book4 Pro 360 Arc 7-Core, Ultra 5 125H, Samsung PM9B1 512GB MZVL4512HBLU | |
|---|---|---|---|---|---|---|
| Noise | 2% | 2% | 10% | -4% | 2% | |
| off / environment * | 22.9 | 23.8 -4% | 23.6 -3% | 22.9 -0% | 24.1 -5% | 24.1 -5% |
| Idle Minimum * | 22.9 | 24.2 -6% | 23.6 -3% | 23 -0% | 24.1 -5% | 24.1 -5% |
| Idle Average * | 22.9 | 24.2 -6% | 23.6 -3% | 23 -0% | 24.1 -5% | 24.1 -5% |
| Idle Maximum * | 25 | 24.2 3% | 23.6 6% | 23 8% | 28.2 -13% | 26.4 -6% |
| Load Average * | 45.1 | 28.9 36% | 40.3 11% | 23.8 47% | 44.4 2% | 35.2 22% |
| Cyberpunk 2077 ultra * | 44.9 | |||||
| Load Maximum * | 44.9 | 51 -14% | 44.2 2% | 43.8 2% | 44.4 1% | 39.2 13% |
| Witcher 3 ultra * | 51 | 44.2 | 43.8 | 36.5 | 38.5 |
* ... smaller is better
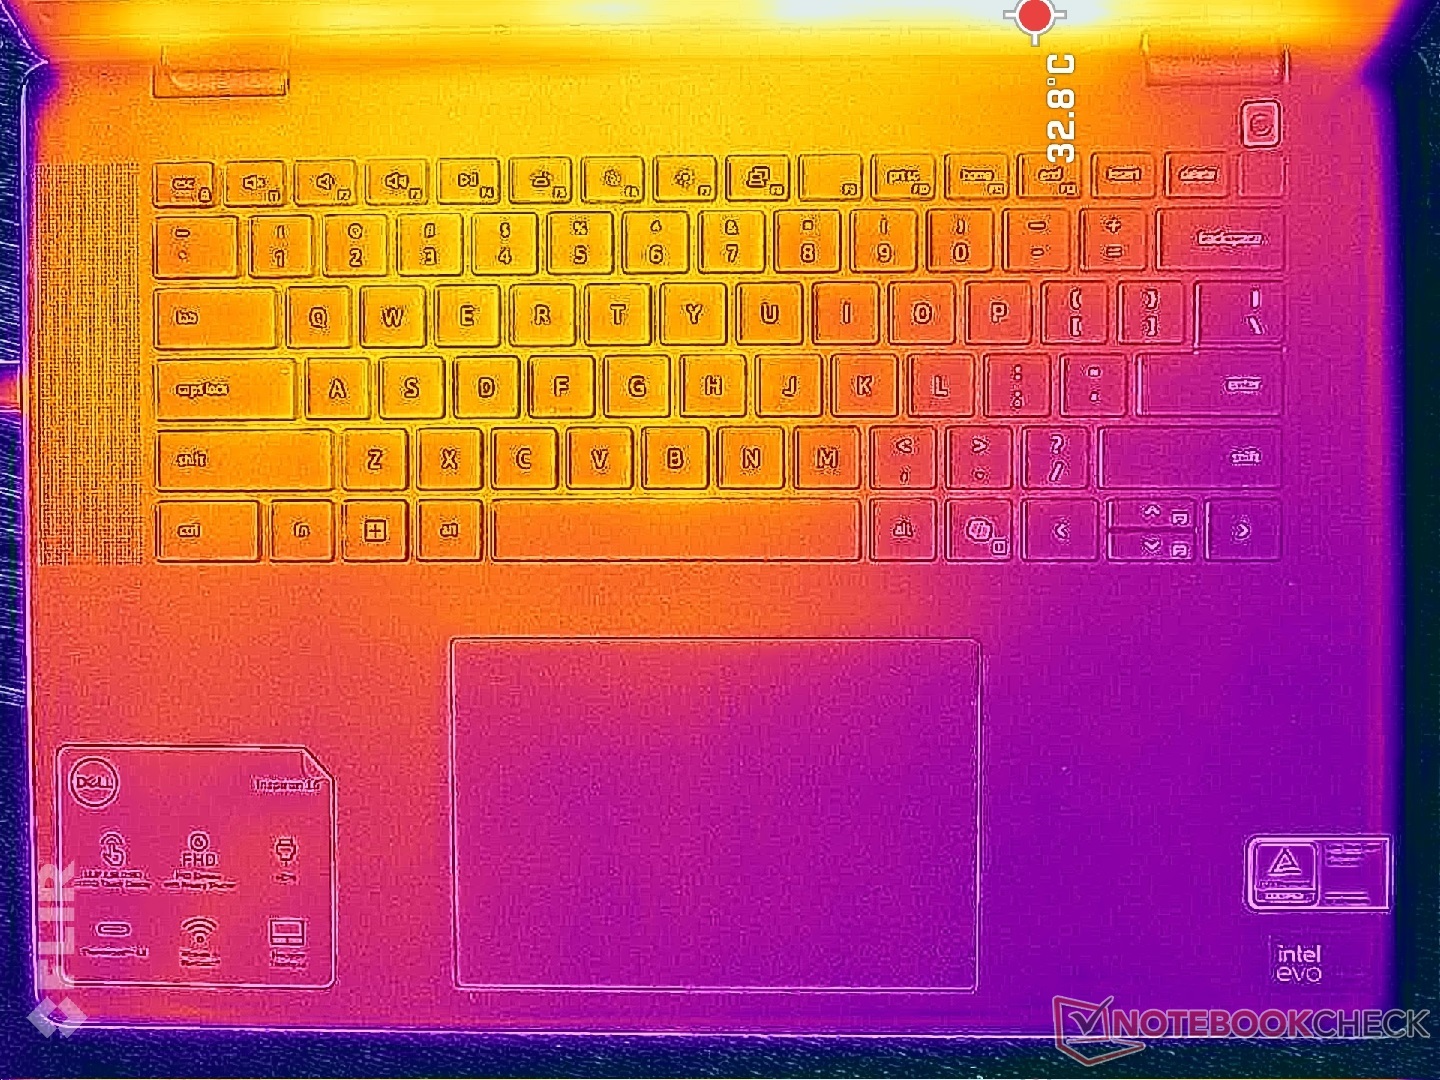
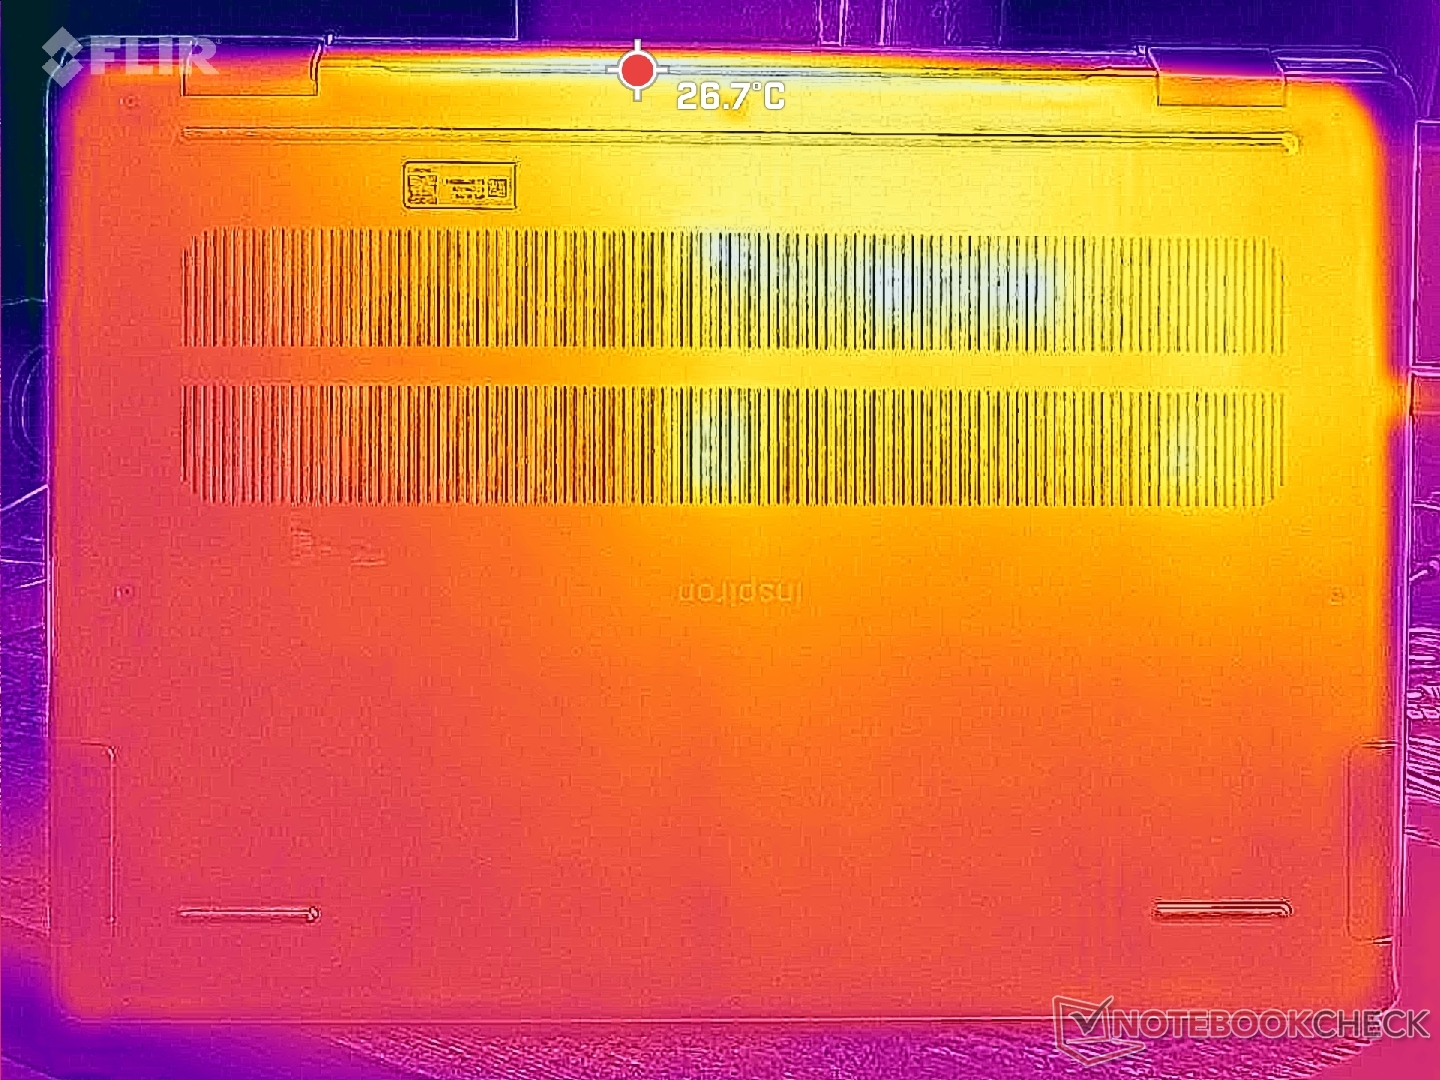
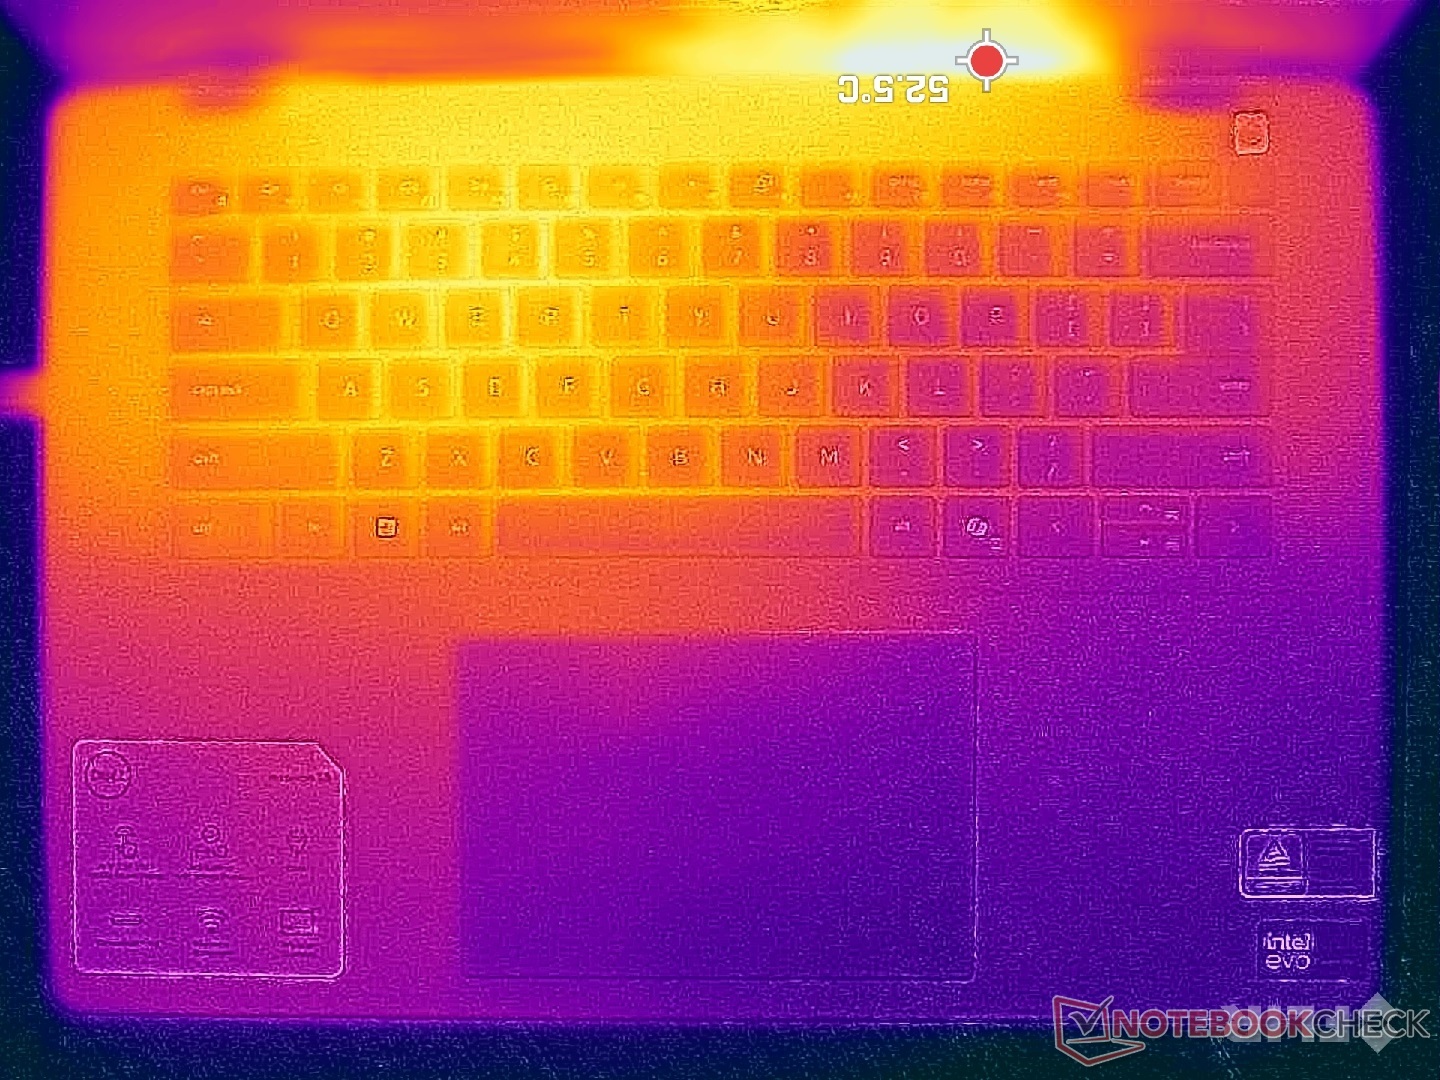
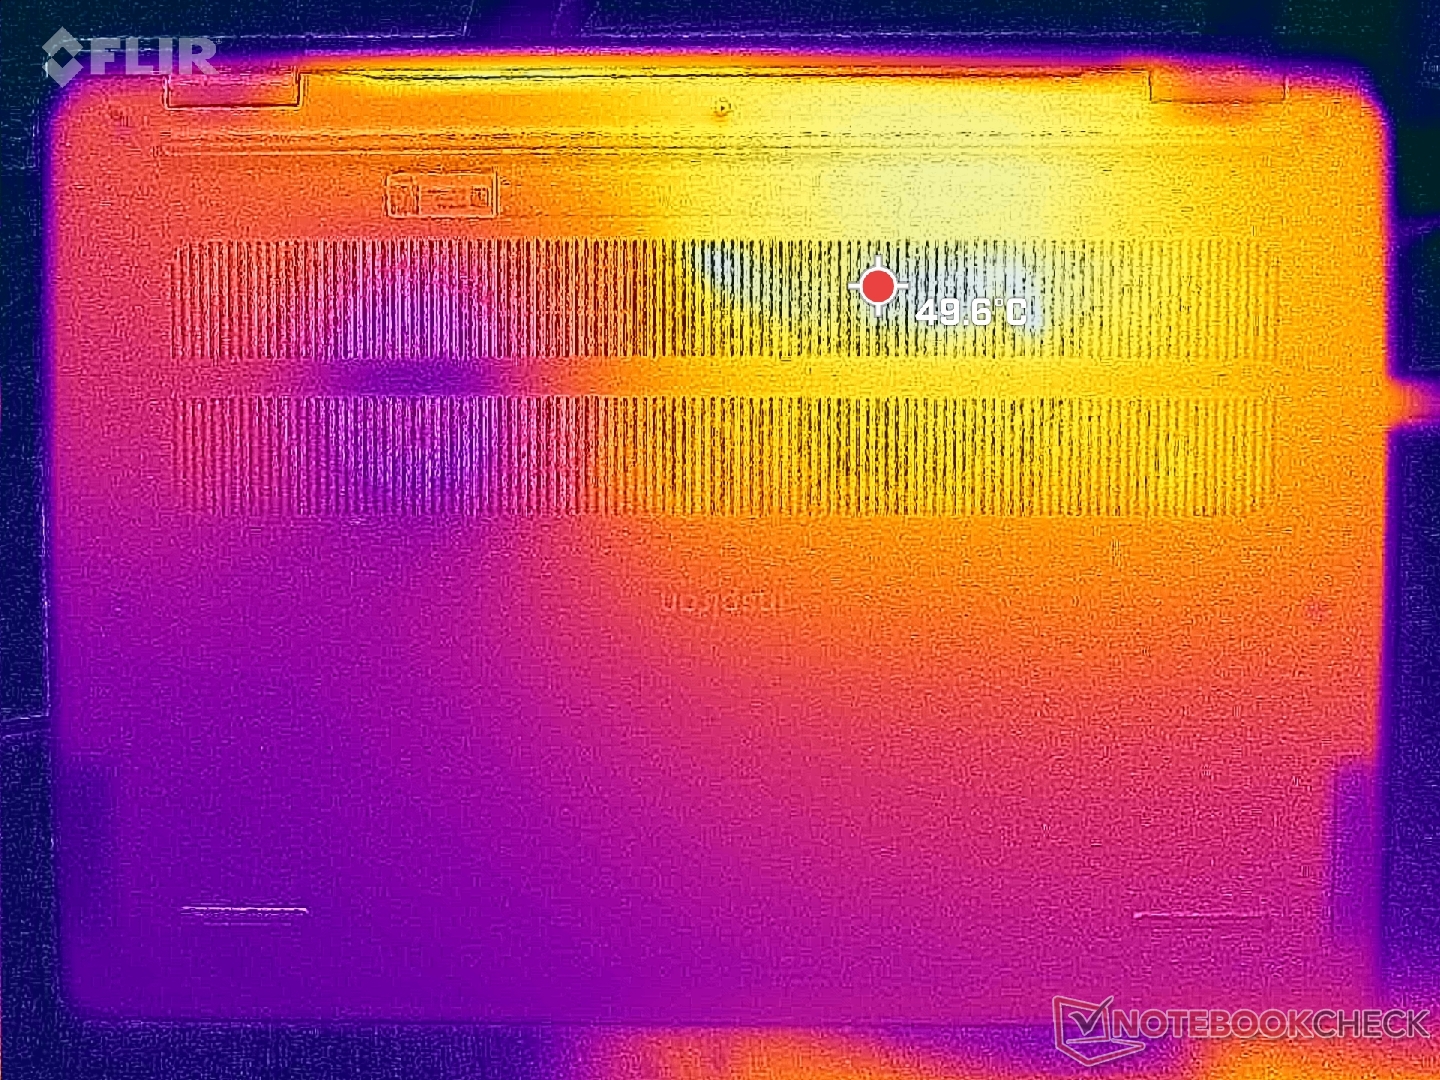
温度
由于采用了不对称散热解决方案,机箱左半部分的表面温度再次高于右半部分。不过,由于采用了性能更强的酷睿 H 系列 CPU,这次的平均温度要比以前高得多。以我们的机型为例,C 盖和 D 盖的热点温度可达 47 摄氏度,而去年的机型仅为 39 摄氏度至 42 摄氏度。值得庆幸的是,这些热点都位于机身后部,手指不太容易接触到。
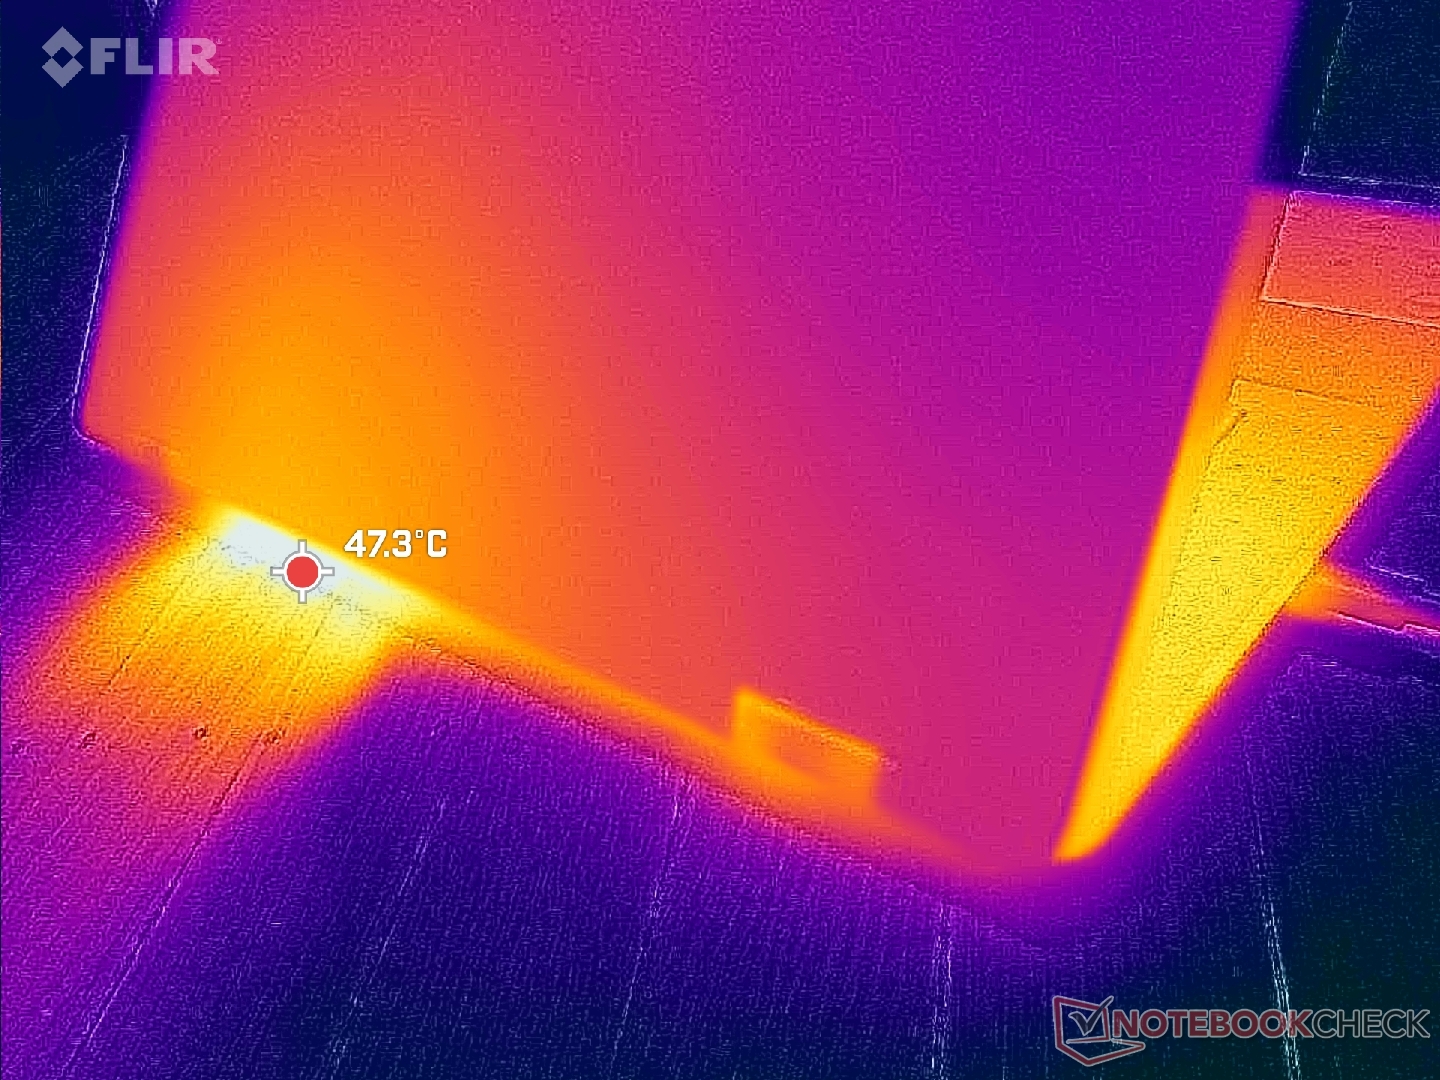
(-) The maximum temperature on the upper side is 46.8 °C / 116 F, compared to the average of 35.3 °C / 96 F, ranging from 19.6 to 60 °C for the class Convertible.
(-) The bottom heats up to a maximum of 45.6 °C / 114 F, compared to the average of 36.8 °C / 98 F
(+) In idle usage, the average temperature for the upper side is 29.9 °C / 86 F, compared to the device average of 30.3 °C / 87 F.
(+) The palmrests and touchpad are reaching skin temperature as a maximum (33.8 °C / 92.8 F) and are therefore not hot.
(-) The average temperature of the palmrest area of similar devices was 28 °C / 82.4 F (-5.8 °C / -10.4 F).
| Dell Inspiron 16 7640 2-in-1 Intel Core Ultra 7 155H, Intel Arc 8-Core iGPU | Dell Inspiron 16 Plus 7640 Intel Core Ultra 7 155H, NVIDIA GeForce RTX 4060 Laptop GPU | Dell Inspiron 16 7635 2-in-1 AMD Ryzen 5 7530U, AMD Radeon RX Vega 7 | HP Envy x360 2-in-1 16-ad0097nr AMD Ryzen 7 8840HS, AMD Radeon 780M | Lenovo IdeaPad Pro 5 16IMH G9 Intel Core Ultra 7 155H, Intel Arc 8-Core iGPU | Samsung Galaxy Book4 Pro 360 Intel Core Ultra 5 125H, Intel Arc 7-Core iGPU | |
|---|---|---|---|---|---|---|
| Heat | 3% | 11% | 8% | 19% | 18% | |
| Maximum Upper Side * | 46.8 | 43.4 7% | 41.6 11% | 42.6 9% | 36.3 22% | 38.6 18% |
| Maximum Bottom * | 45.6 | 41.6 9% | 39 14% | 47.8 -5% | 39.1 14% | 39.2 14% |
| Idle Upper Side * | 32.2 | 32.8 -2% | 29.4 9% | 27.4 15% | 24.9 23% | 25.2 22% |
| Idle Bottom * | 31.4 | 32.4 -3% | 28.6 9% | 27.8 11% | 26.1 17% | 25.7 18% |
* ... smaller is better
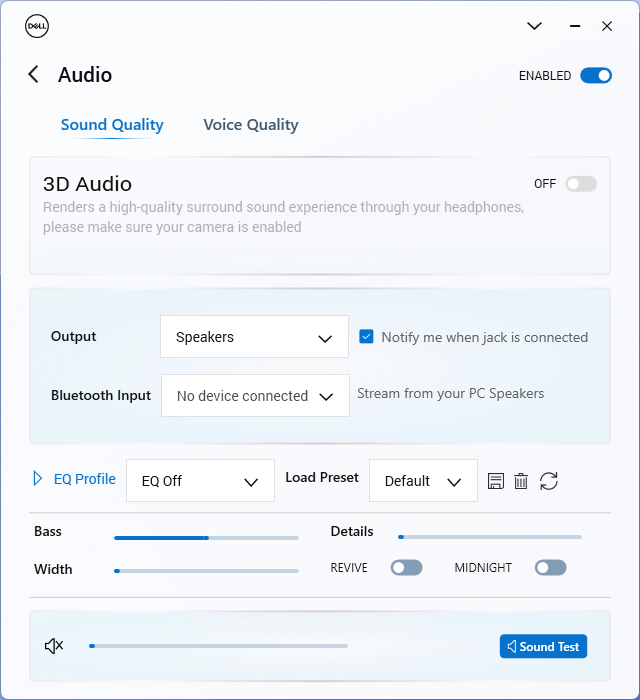
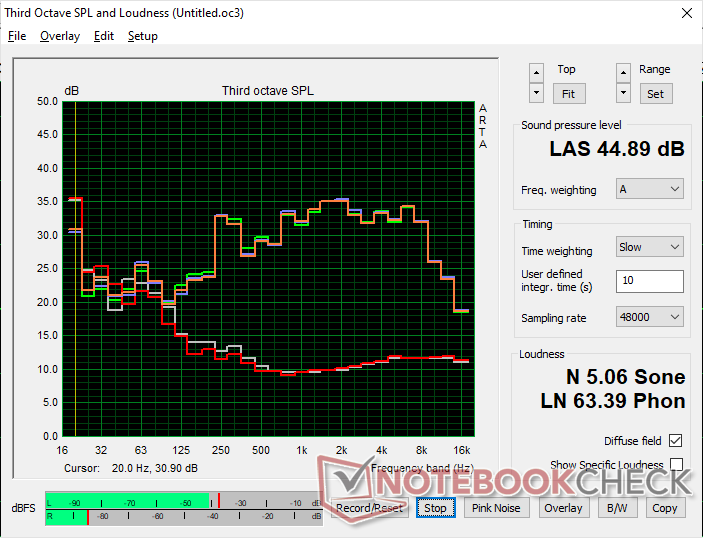
发言人
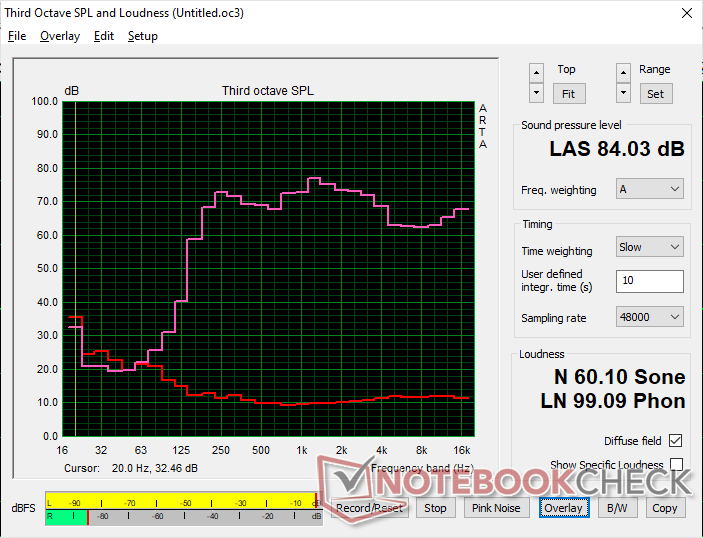
Dell Inspiron 16 7640 2-in-1 audio analysis
(+) | speakers can play relatively loud (84 dB)
Bass 100 - 315 Hz
(±) | reduced bass - on average 13.9% lower than median
(±) | linearity of bass is average (14% delta to prev. frequency)
Mids 400 - 2000 Hz
(+) | balanced mids - only 3.6% away from median
(+) | mids are linear (3.6% delta to prev. frequency)
Highs 2 - 16 kHz
(+) | balanced highs - only 4.5% away from median
(+) | highs are linear (2.8% delta to prev. frequency)
Overall 100 - 16.000 Hz
(+) | overall sound is linear (12% difference to median)
Compared to same class
» 11% of all tested devices in this class were better, 4% similar, 85% worse
» The best had a delta of 6%, average was 20%, worst was 57%
Compared to all devices tested
» 8% of all tested devices were better, 2% similar, 90% worse
» The best had a delta of 4%, average was 24%, worst was 134%
Apple MacBook Pro 16 2021 M1 Pro audio analysis
(+) | speakers can play relatively loud (84.7 dB)
Bass 100 - 315 Hz
(+) | good bass - only 3.8% away from median
(+) | bass is linear (5.2% delta to prev. frequency)
Mids 400 - 2000 Hz
(+) | balanced mids - only 1.3% away from median
(+) | mids are linear (2.1% delta to prev. frequency)
Highs 2 - 16 kHz
(+) | balanced highs - only 1.9% away from median
(+) | highs are linear (2.7% delta to prev. frequency)
Overall 100 - 16.000 Hz
(+) | overall sound is linear (4.6% difference to median)
Compared to same class
» 0% of all tested devices in this class were better, 0% similar, 100% worse
» The best had a delta of 5%, average was 18%, worst was 45%
Compared to all devices tested
» 0% of all tested devices were better, 0% similar, 100% worse
» The best had a delta of 4%, average was 24%, worst was 134%
能源管理--Core-H 和 Mini-LED 要求很高
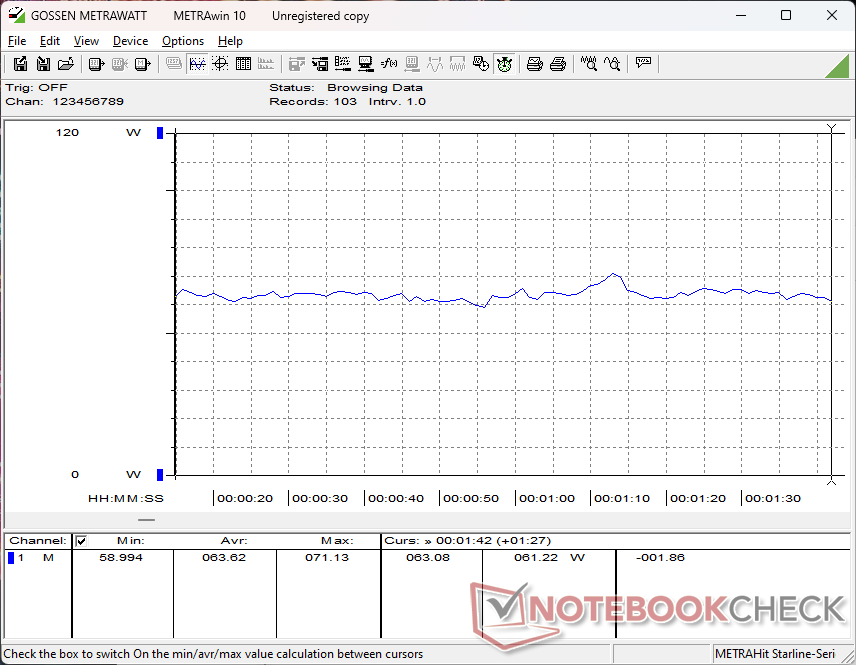
耗电量
在台式机上空转时,根据亮度设置的不同,需要 6 瓦至 14 瓦的功率,比我们在 Inspiron 16 7635 2-in-1 上记录的功率高出几瓦。 Inspiron 16 7635 二合一.当然,要求更高的 H 系列 CPU 和分辨率更高的迷你 LED 面板都是导致耗电量普遍较高的原因。
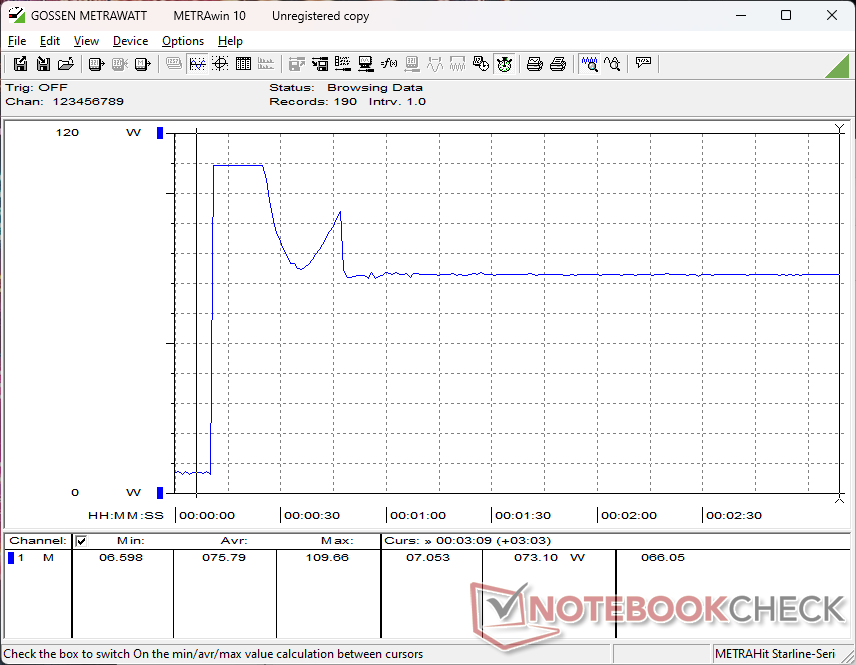
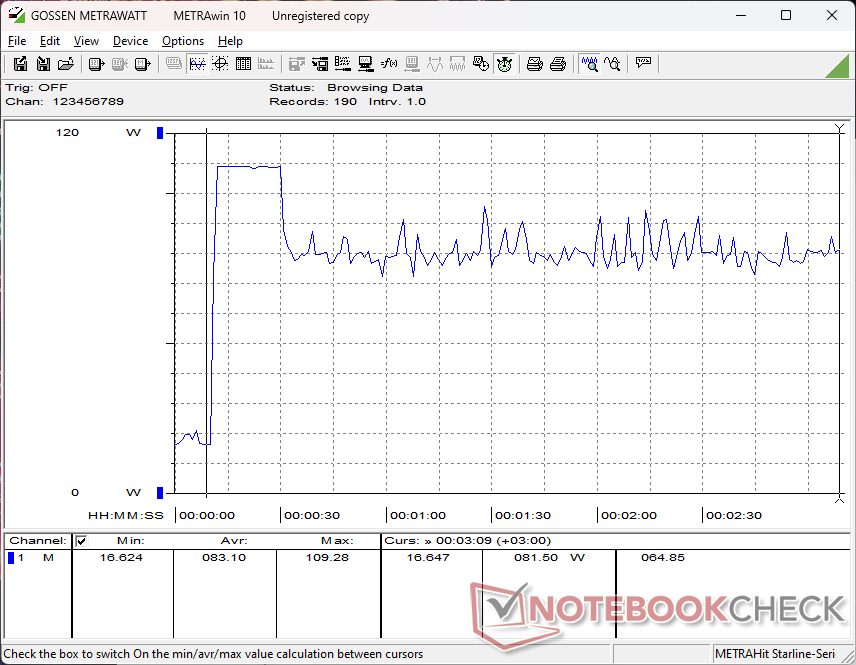
在运行游戏等要求更高的应用程序时,耗电量比 Inspiron 16 7635 2-in-1 高出 40% 以上。不过,由于 GPU 性能比 RX Vega 7 提升了 2 倍多,对于大多数用户来说,消耗的增加是值得的。在运行 Prime95 时,CPU 密集型任务也可以得出类似的结论。如果电池续航时间比性能更重要,那么选择更便宜、更慢速的 Core Ultra 5 125U 配置有望在这方面节省大量电能。
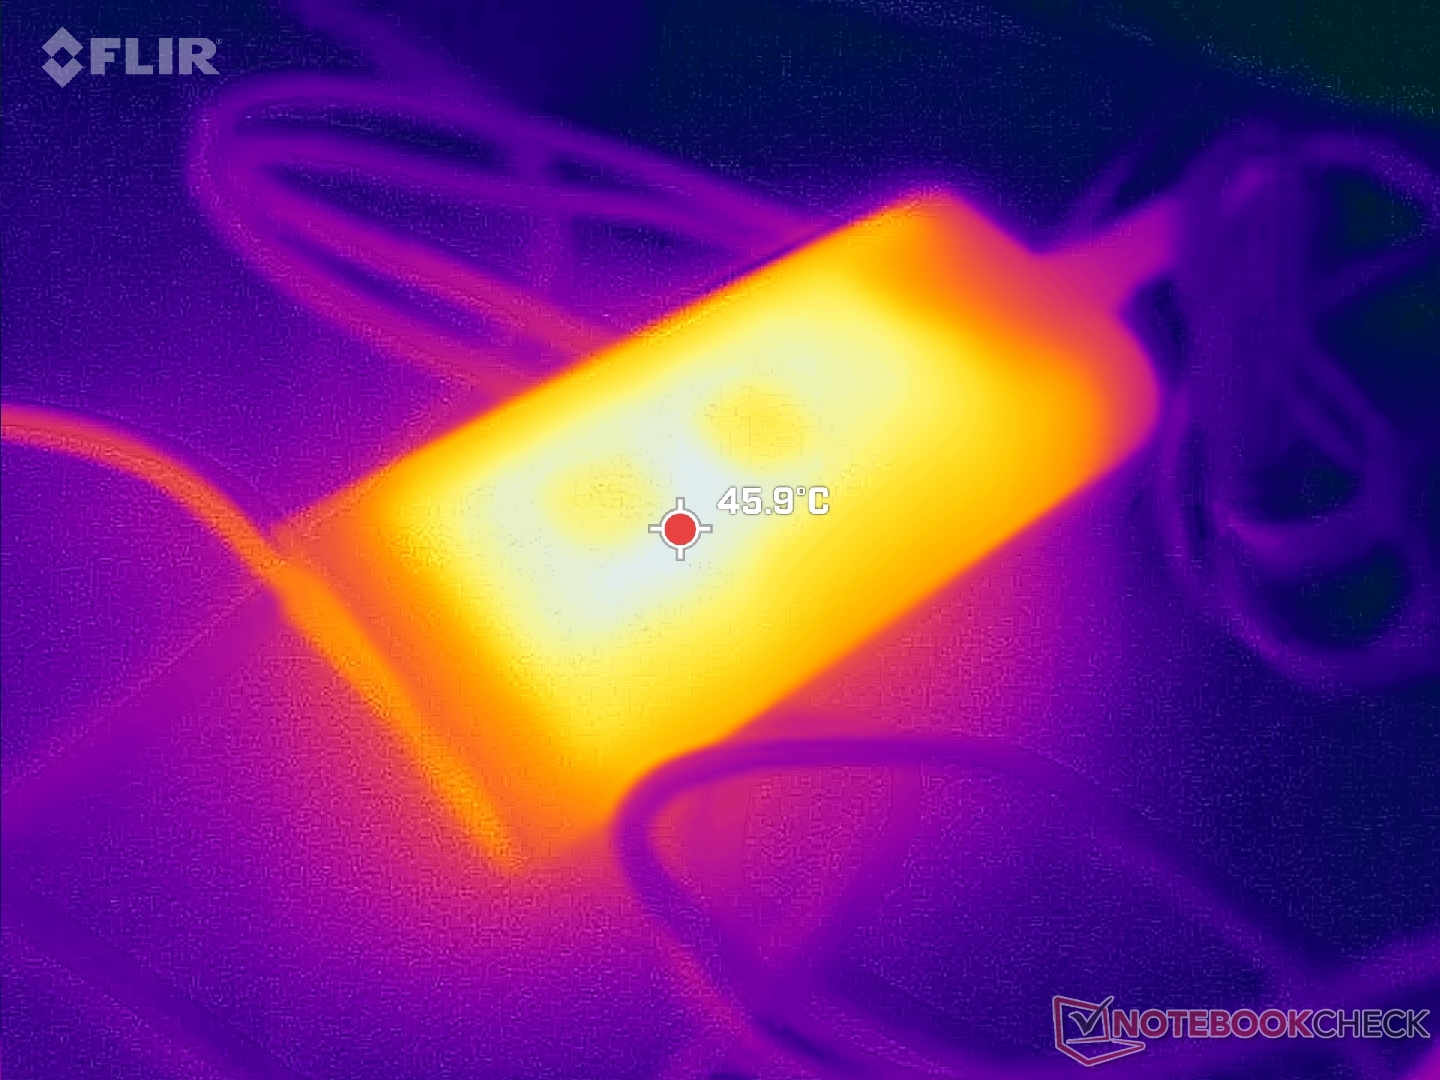
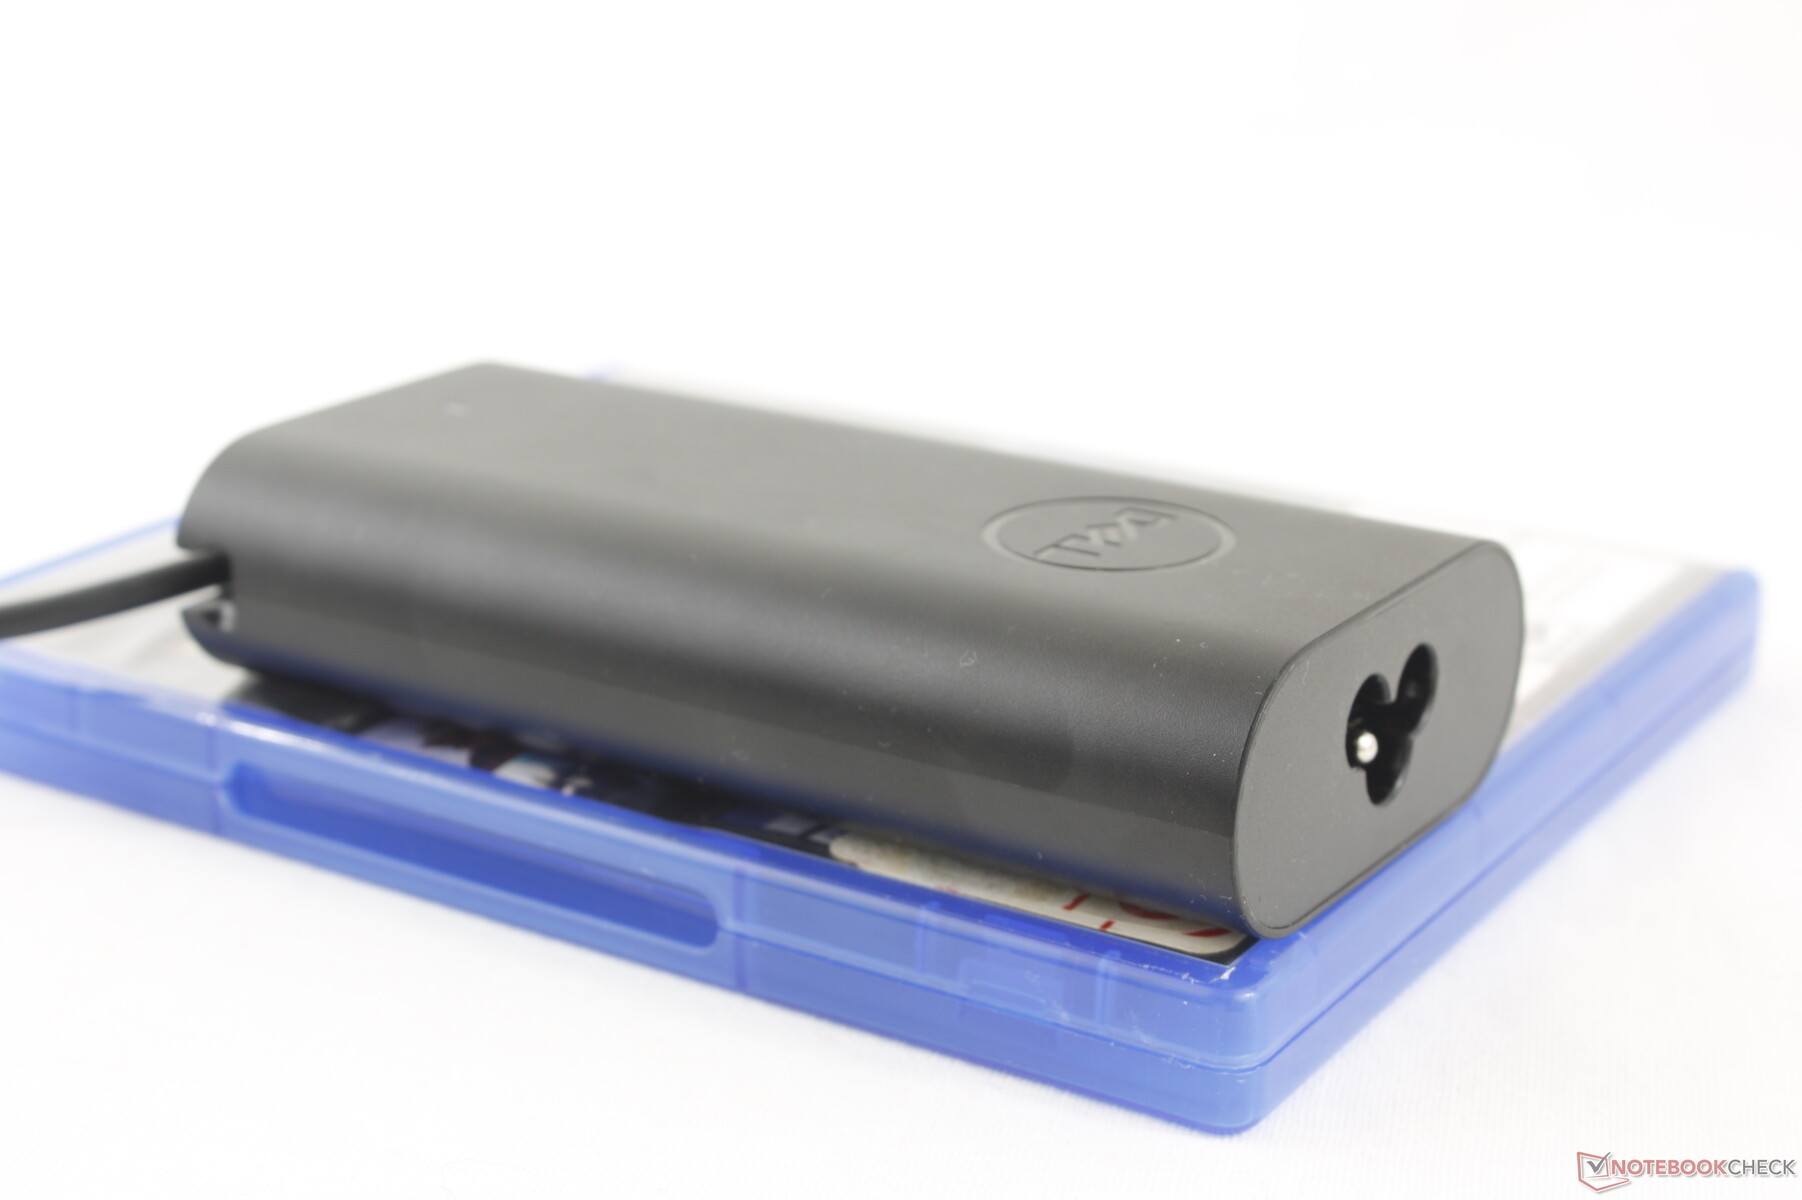
尽管中小型(约 12.2 x 5.9 x 2.7 厘米)USB-C 交流适配器的额定功率仅为 100 瓦,但我们仍能记录到 110 瓦的最大功耗。不过,由于酷睿 H 系列处理器具有更高的 Turbo Boost 潜能,它比我们在 Inspiron 16 7635 2 合 1 上记录的功率要高得多。

| Off / Standby | |
| Idle | |
| Load |
|
Key:
min: | |
| Dell Inspiron 16 7640 2-in-1 Ultra 7 155H, Arc 8-Core, Micron 2550 1TB, Mini-LED, 2560x1600, 16" | Dell Inspiron 16 Plus 7640 Ultra 7 155H, NVIDIA GeForce RTX 4060 Laptop GPU, SK hynix BC901 HFS001TEJ4X164N, IPS, 2560x1600, 16" | Dell Inspiron 16 7635 2-in-1 R5 7530U, Vega 7, Kioxia BG5 KBG50ZNS512G, IPS, 1920x1200, 16" | HP Envy x360 2-in-1 16-ad0097nr R7 8840HS, Radeon 780M, KIOXIA BG5 KBG50ZNV1T02, OLED, 2880x1800, 16" | Lenovo IdeaPad Pro 5 16IMH G9 Ultra 7 155H, Arc 8-Core, Samsung PM9C1a MZAL81T0HDLB, IPS, 2560x1600, 16" | Samsung Galaxy Book4 Pro 360 Ultra 5 125H, Arc 7-Core, Samsung PM9B1 512GB MZVL4512HBLU, OLED, 2880x1800, 16" | |
|---|---|---|---|---|---|---|
| Power Consumption | 7% | 35% | 26% | 22% | 44% | |
| Idle Minimum * | 6.1 | 4.2 31% | 4.8 21% | 5 18% | 3.5 43% | 3 51% |
| Idle Average * | 13.5 | 6.9 49% | 7.6 44% | 6.2 54% | 9.6 29% | 6.3 53% |
| Idle Maximum * | 13.8 | 15.2 -10% | 8.7 37% | 14.7 -7% | 9.9 28% | 6.5 53% |
| Load Average * | 63.6 | 70.4 -11% | 47.1 26% | 49.9 22% | 62.7 1% | 49.3 22% |
| Cyberpunk 2077 ultra external monitor * | 64.6 | |||||
| Cyberpunk 2077 ultra * | 67 | |||||
| Load Maximum * | 109.7 | 137.4 -25% | 56.4 49% | 65 41% | 101.2 8% | 65.5 40% |
| Witcher 3 ultra * | 115.9 | 46.6 | 54.5 | 55.8 | 45.9 |
* ... smaller is better
Power Consumption Cyberpunk / Stress Test
Power Consumption external Monitor
电池寿命
90 Wh 的电池组比去年 Inspiron 16 7635 2 合 1 的 64 Wh 大。即便如此,在我们的浏览测试中,由于显示屏和 CPU 的要求更高(如上所述),运行时间还是缩短了近 3 个小时。即使将屏幕亮度设置为相同的 150 尼特,运行时间的差异依然存在。
大容量电池组从空电到满电的充电时间约为 2.5 小时,相对较慢,而其他大多数超极本的充电时间为 1.5 小时。
| Dell Inspiron 16 7640 2-in-1 Ultra 7 155H, Arc 8-Core, 90 Wh | Dell Inspiron 16 Plus 7640 Ultra 7 155H, NVIDIA GeForce RTX 4060 Laptop GPU, 90 Wh | Dell Inspiron 16 7635 2-in-1 R5 7530U, Vega 7, 64 Wh | HP Envy x360 2-in-1 16-ad0097nr R7 8840HS, Radeon 780M, 68 Wh | Lenovo IdeaPad Pro 5 16IMH G9 Ultra 7 155H, Arc 8-Core, 84 Wh | Samsung Galaxy Book4 Pro 360 Ultra 5 125H, Arc 7-Core, 76 Wh | |
|---|---|---|---|---|---|---|
| Battery Runtime | 16% | 23% | -12% | -9% | 0% | |
| Reader / Idle | 1310 | 1560 19% | 935 -29% | |||
| WiFi v1.3 | 686 | 799 16% | 869 27% | 459 -33% | 756 10% | 531 -23% |
| Load | 93 | 114 23% | 116 25% | 68 -27% | 114 23% | |
| H.264 | 957 | 881 |
Pros
Cons
结论 - 尺寸大、性能好
Inspiron 16 7640 2 合 1 有几个优点。首先,搭载酷睿至尊 7 155H 的 Inspiron 16 7640 性能一流,尤其是与其他采用集成显卡的 16 英寸可转换机型相比。这是一款游戏级 CPU,不会出现严重的节流问题,它可以快速处理任何内容或多任务应用程序。其次,迷你 LED 面板将该机型打造成了一款高端多媒体播放器,并配备了方便的 2 合 1 外形和活动笔。
Inspiron 16 7640 2 合 1 外形庞大,功能强大。虽然它的性能和显示屏与价格相比令人印象深刻,但用户却要为笨重的机身和较短的电池续航时间付出代价。
更高的性能和更亮的显示屏必然会带来更高的功耗。与去年的机型相比,要求更高的组件会产生更多的热量,导致风扇噪音更大、运行时间更短。正如我们上面的测试和测量结果所显示的那样,这些差异并不小。
此外,该机型庞大的尺寸和沉重的重量也不容忽视。更轻便的 16 英寸可转换机型包括 LG Gram 16 2 合 1或 三星Galaxy Book4 Pro 360为您带来更方便的旅行体验。戴尔甚至比惠普 Spectre x360 16 英寸笔记本电脑更大更重。 惠普 Spectre x360 16GeForce 独立显卡。
不过,Inspiron 16 7640 2 合 1 尽管存在缺陷,但其合理的 1000 美元售价仍然很有吸引力。与同价位的其他笔记本电脑相比,它在速度和图像质量方面表现出色。
价格和供应情况
配备酷睿至尊 5 125U 和标准 1200p IPS 触摸屏的基本配置起价为 800 美元,而酷睿至尊 7 155H 和 2.5K mini-LED 配置目前的出货价为 1000 美元。
Dell Inspiron 16 7640 2-in-1
- 07/19/2024 v8
Allen Ngo
 Total Sustainability Score:
 Transparency
The selection of devices to be reviewed is made by our editorial team. The test sample was provided to the author as a loan by the manufacturer or retailer for the purpose of this review. The lender had no influence on this review, nor did the manufacturer receive a copy of this review before publication. There was no obligation to publish this review. We never accept compensation or payment in return for our reviews. As an independent media company, Notebookcheck is not subjected to the authority of manufacturers, retailers or publishers.
This is how Notebookcheck is testing
Every year, Notebookcheck independently reviews hundreds of laptops and smartphones using standardized procedures to ensure that all results are comparable. We have continuously developed our test methods for around 20 years and set industry standards in the process. In our test labs, high-quality measuring equipment is utilized by experienced technicians and editors. These tests involve a multi-stage validation process. Our complex rating system is based on hundreds of well-founded measurements and benchmarks, which maintains objectivity. Further information on our test methods can be found here.
Price comparison

