

宏碁 Aspire 14 AI 评测:基本的家用和办公笔记本电脑
物美价廉的精益机器
这款价格低廉的笔记本电脑拥有高效的处理器和超长的电池续航时间,可以满足学生或基本办公需求。不过,如果你需要进行图形编辑,IPS 显示屏可能会让你失望。Allen Ngo, 👁 Allen Ngo (translated by DeepL / Ninh Duy) Published 🇺🇸 🇫🇷 ...
结论 - 大众的月湖
今年,英特尔 Lunar Lake 处理器的效率提升使得多媒体设备更精简、更持久。虽然与大多数 AMD Zen 5 替代产品相比,它们不一定拥有最快的处理器性能,但英特尔架构即使在低功耗环境下也能很好地平衡 CPU、GPU 和 RAM 性能。基本办公、网页浏览、流媒体、轻度游戏和日常多任务处理在这款经济型宏碁电脑上都表现出色。
尤其是与更高端的 Swift 14 AI 相比,这款产品有很多不足之处。尤其是 IPS 面板,色彩狭窄,背光暗淡,不适合大多数图形编辑人员使用,而沉闷的塑料底座即使不平淡无奇,也是中规中矩。要求色彩更准确的用户可以考虑 Swift 14 AI,它提供了类似的输入体验,但采用了 OLED、更高分辨率的网络摄像头、更小的设计以及 Wi-Fi 7 兼容性。竞争对手如 惠普Pavilion Plus 14 等竞争对手的产品也更坚固耐用,在旅行时更有弹性。
Pros
Cons
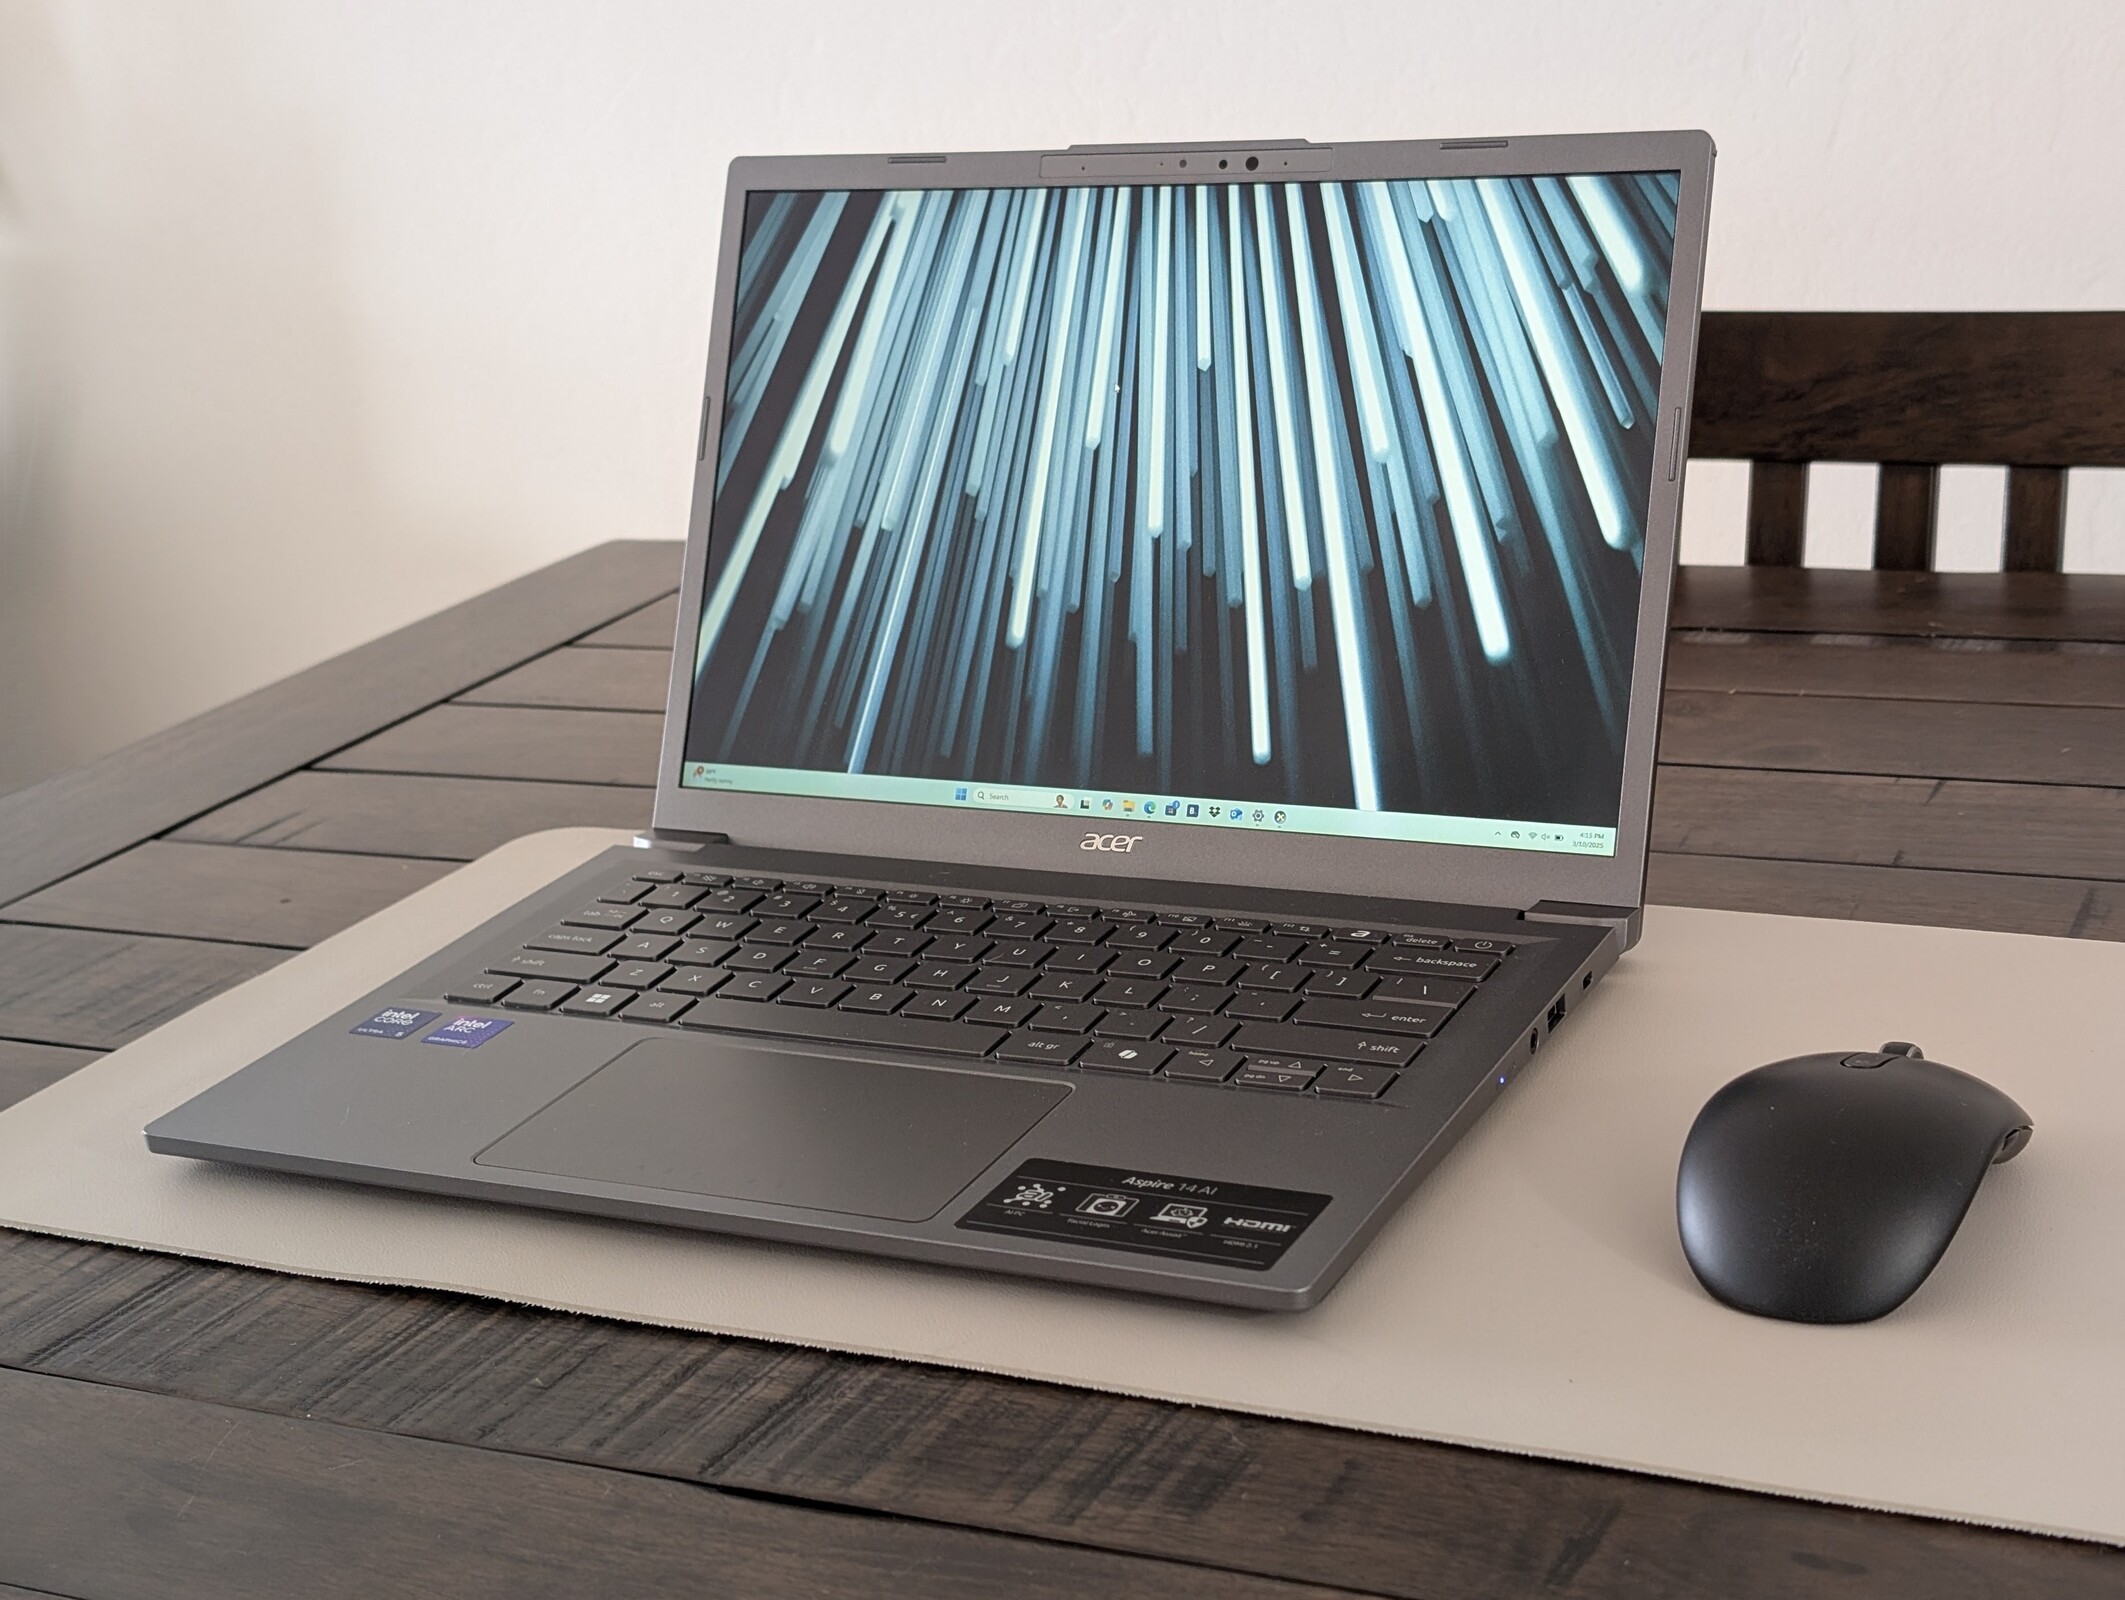
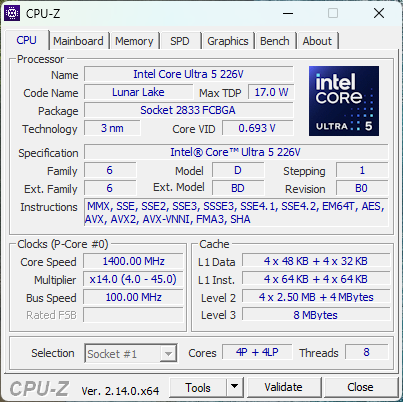
Aspire 14 AI 是宏碁最便宜的 AI 多媒体笔记本电脑之一,配备了英特尔最新的 Lunar Lake 处理器。它本质上是更昂贵的 Swift 14 AI 的低配版本。
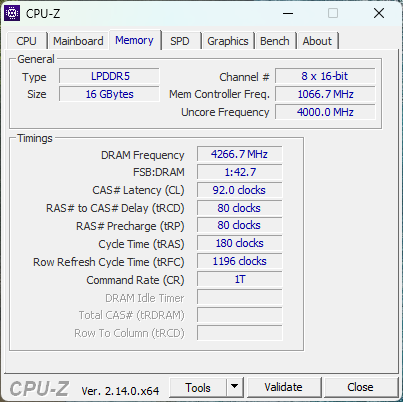
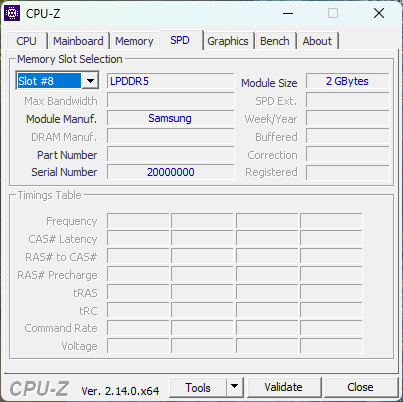
我们的测试机是低端配置,配备酷睿至强 5 226V CPU、集成 Arc 130V GPU、1200p 雾面 IPS 触摸屏和 16GB 焊接 LPDDR5x 内存,零售价约为 700 美元。高端配置可能包括 OLED、双倍内存和 Core Ultra 7 258V。
更多宏碁评论:
规格
外壳 - 暗灰色塑料
Aspire 14 AI 比更昂贵的 Swift 14 AI 稍微大一些,也重一些。由于采用了金属外盖,它在关闭状态下看起来很时尚,但在近距离使用笔记本电脑时,较廉价的塑料底座就会变得很明显。机箱和盖子也都比竞争对手(如惠普 惠普Pavilion 14或戴尔 Inspiron 14 Plus 等竞争对手相比,机箱和盖子都更容易扭曲。

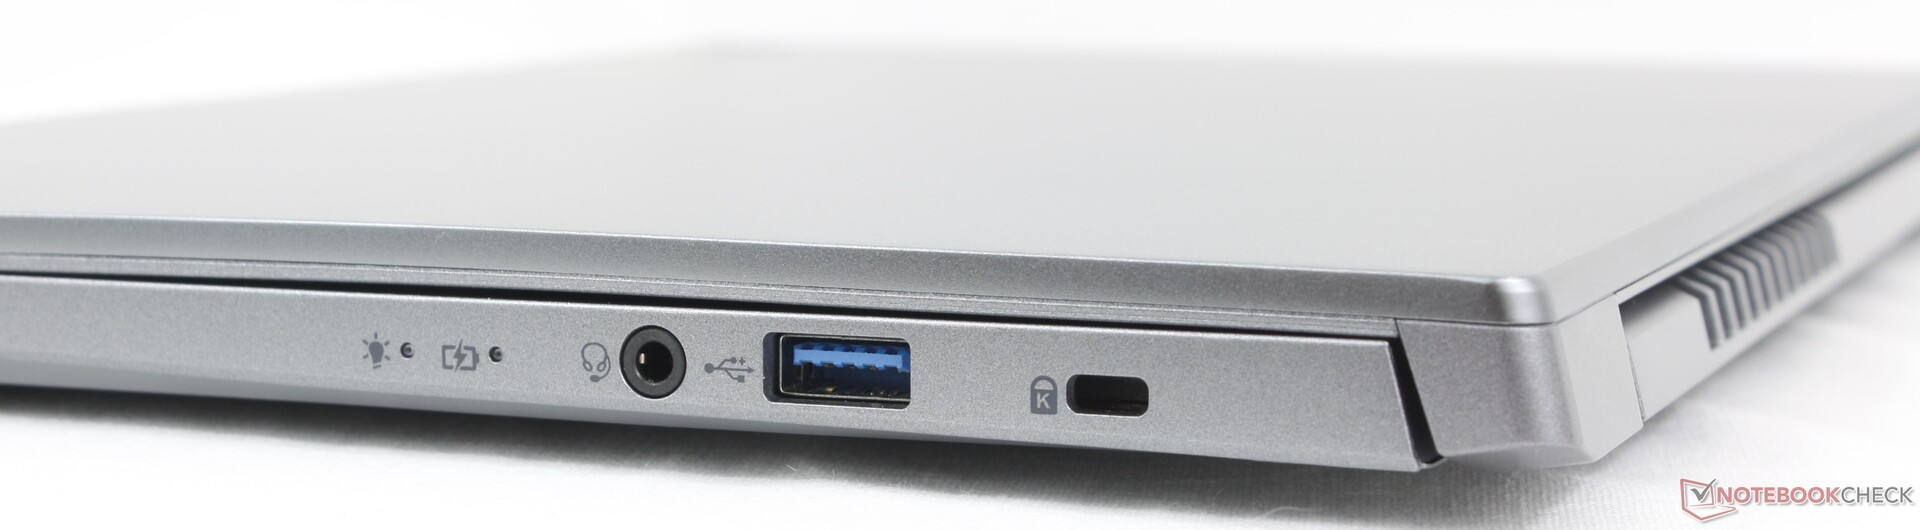
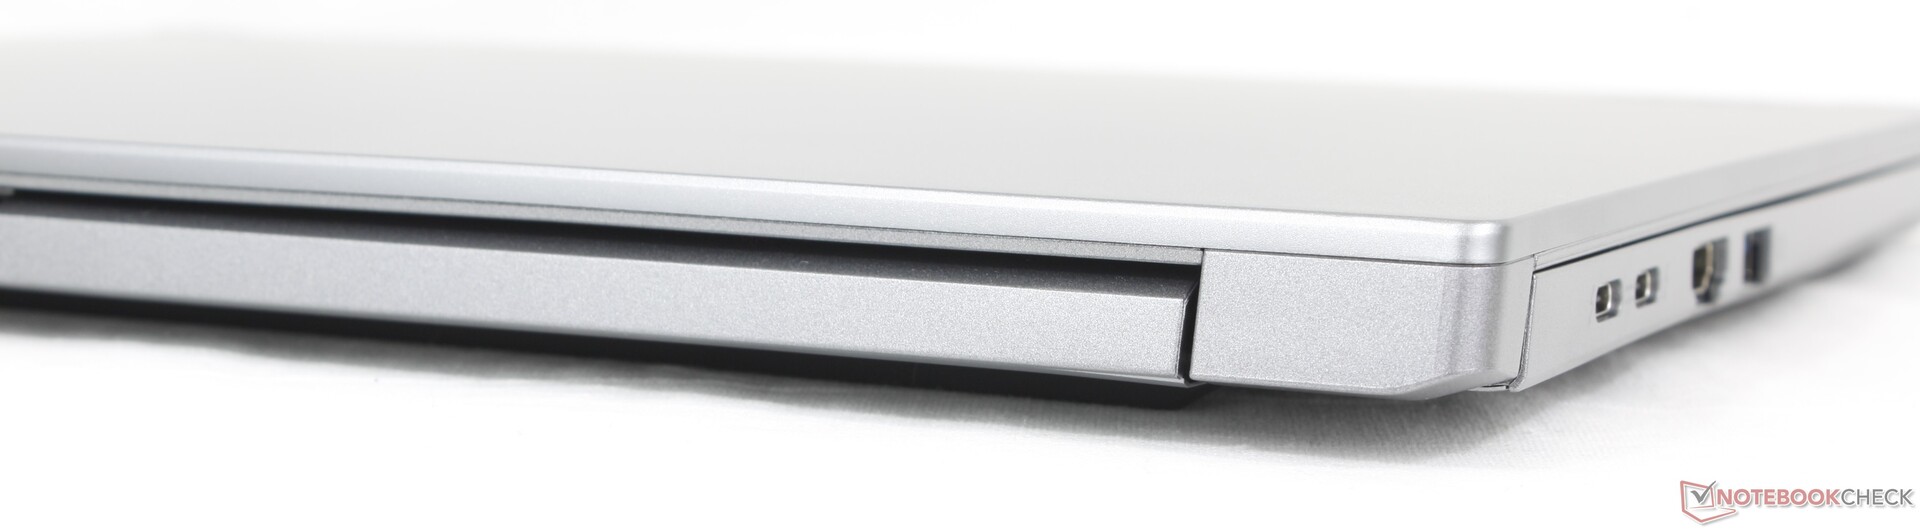
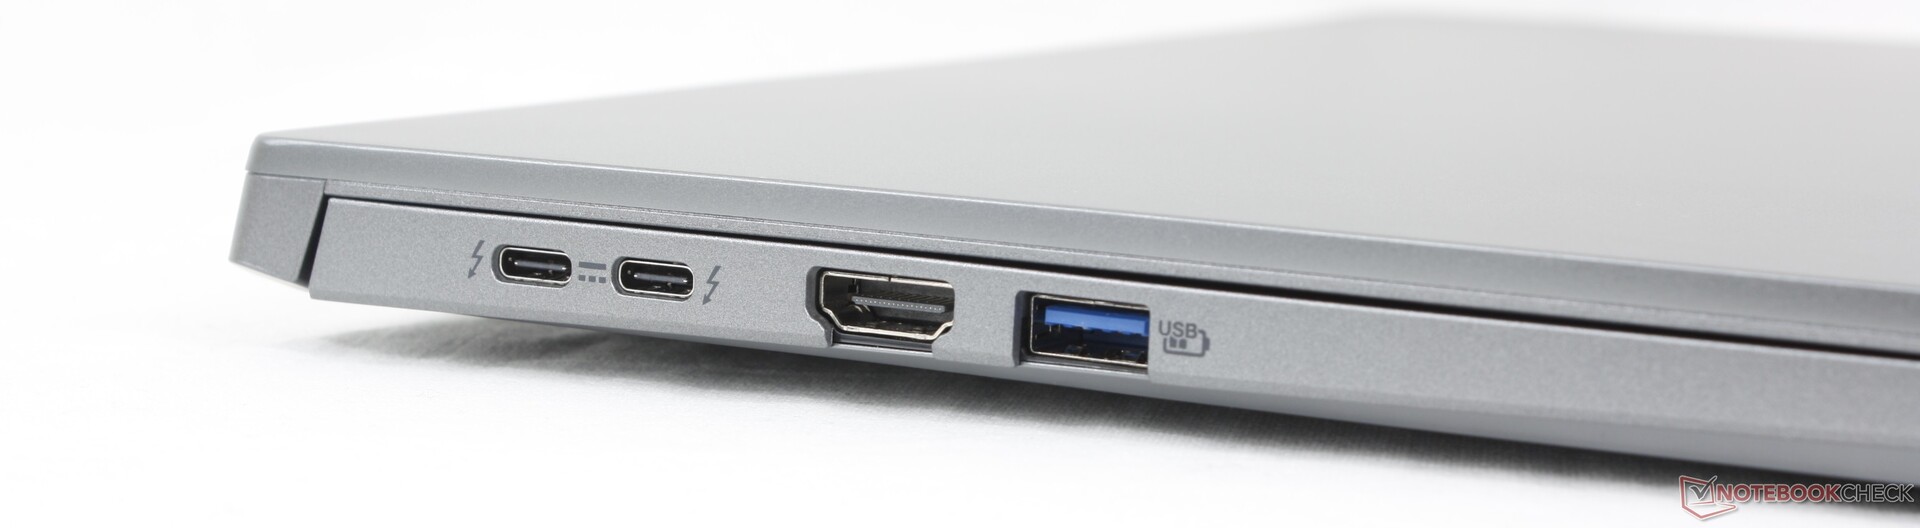
连接性
端口选项与 Swift 14 AI 相同,但增加了一个 Kensington Lock 端口。
交流
标配的英特尔 AX211 支持 Wi-Fi 6、6E 和蓝牙 5.3 连接。
网络摄像头
标配 200 万像素网络摄像头和红外摄像头。不过,该机型缺少隐私快门。


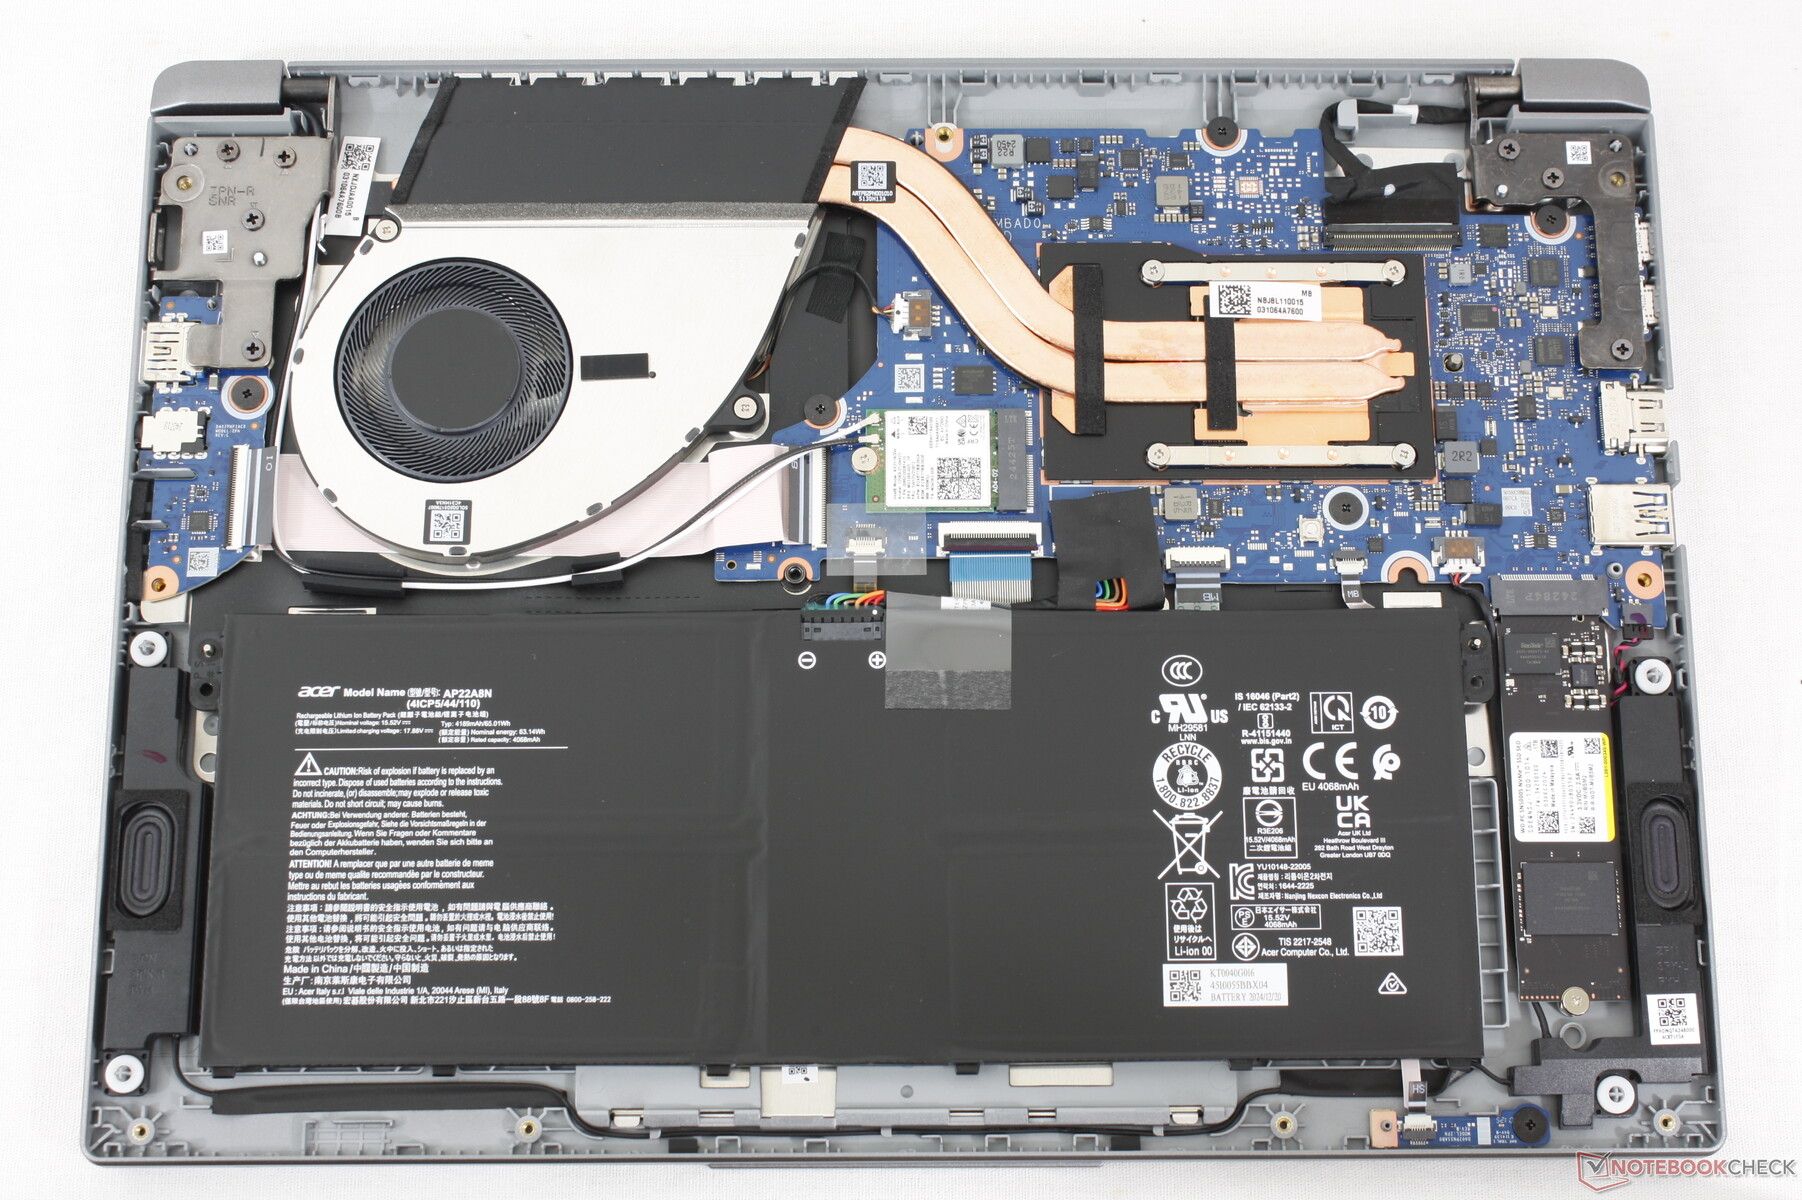
维护
底部面板只需一把 Phllips 螺丝刀即可轻松维修。不过,由于内存是焊接的,而且该机型仅支持一个 M.2 2280 固态硬盘,因此没有什么可升级的。
可持续性
宏碁没有宣传在生产该产品时采取了任何可持续发展措施。零售包装主要是纸板和纸张,还有一些塑料包装。
配件和保修
除了常见的交流适配器和文件外,零售包装盒还包括一个便携套。如果在美国购买,制造商提供一年有限保修。
输入设备
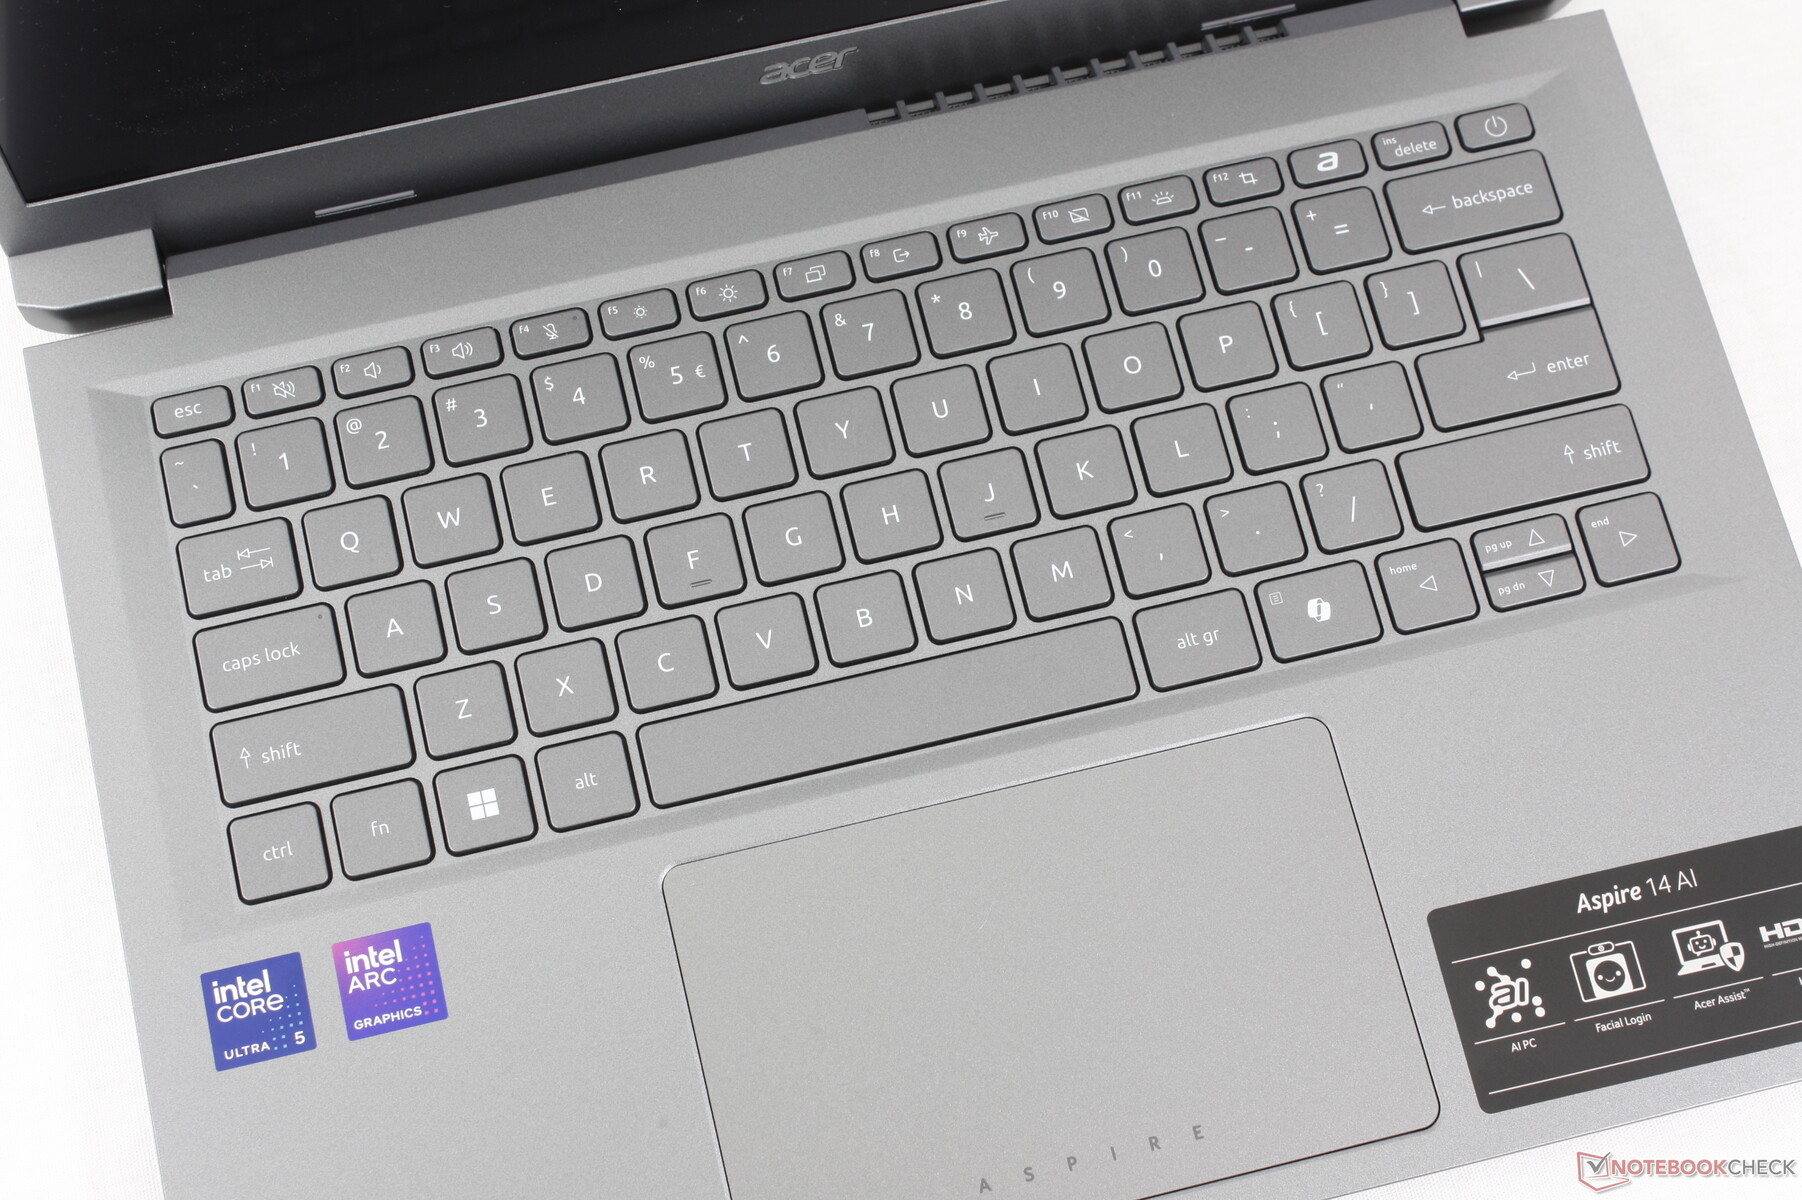
键盘
Aspire 14 AI 和 Swift 14 AI 的键盘甚至连辅助功能都完全相同。Swift 14 AI 的平庸键盘没有给我们留下深刻印象,Aspire 14 AI 也是如此。不过,由于后者的价格更低,所以键盘在预算有限的情况下还是可以忍受的。
触摸板
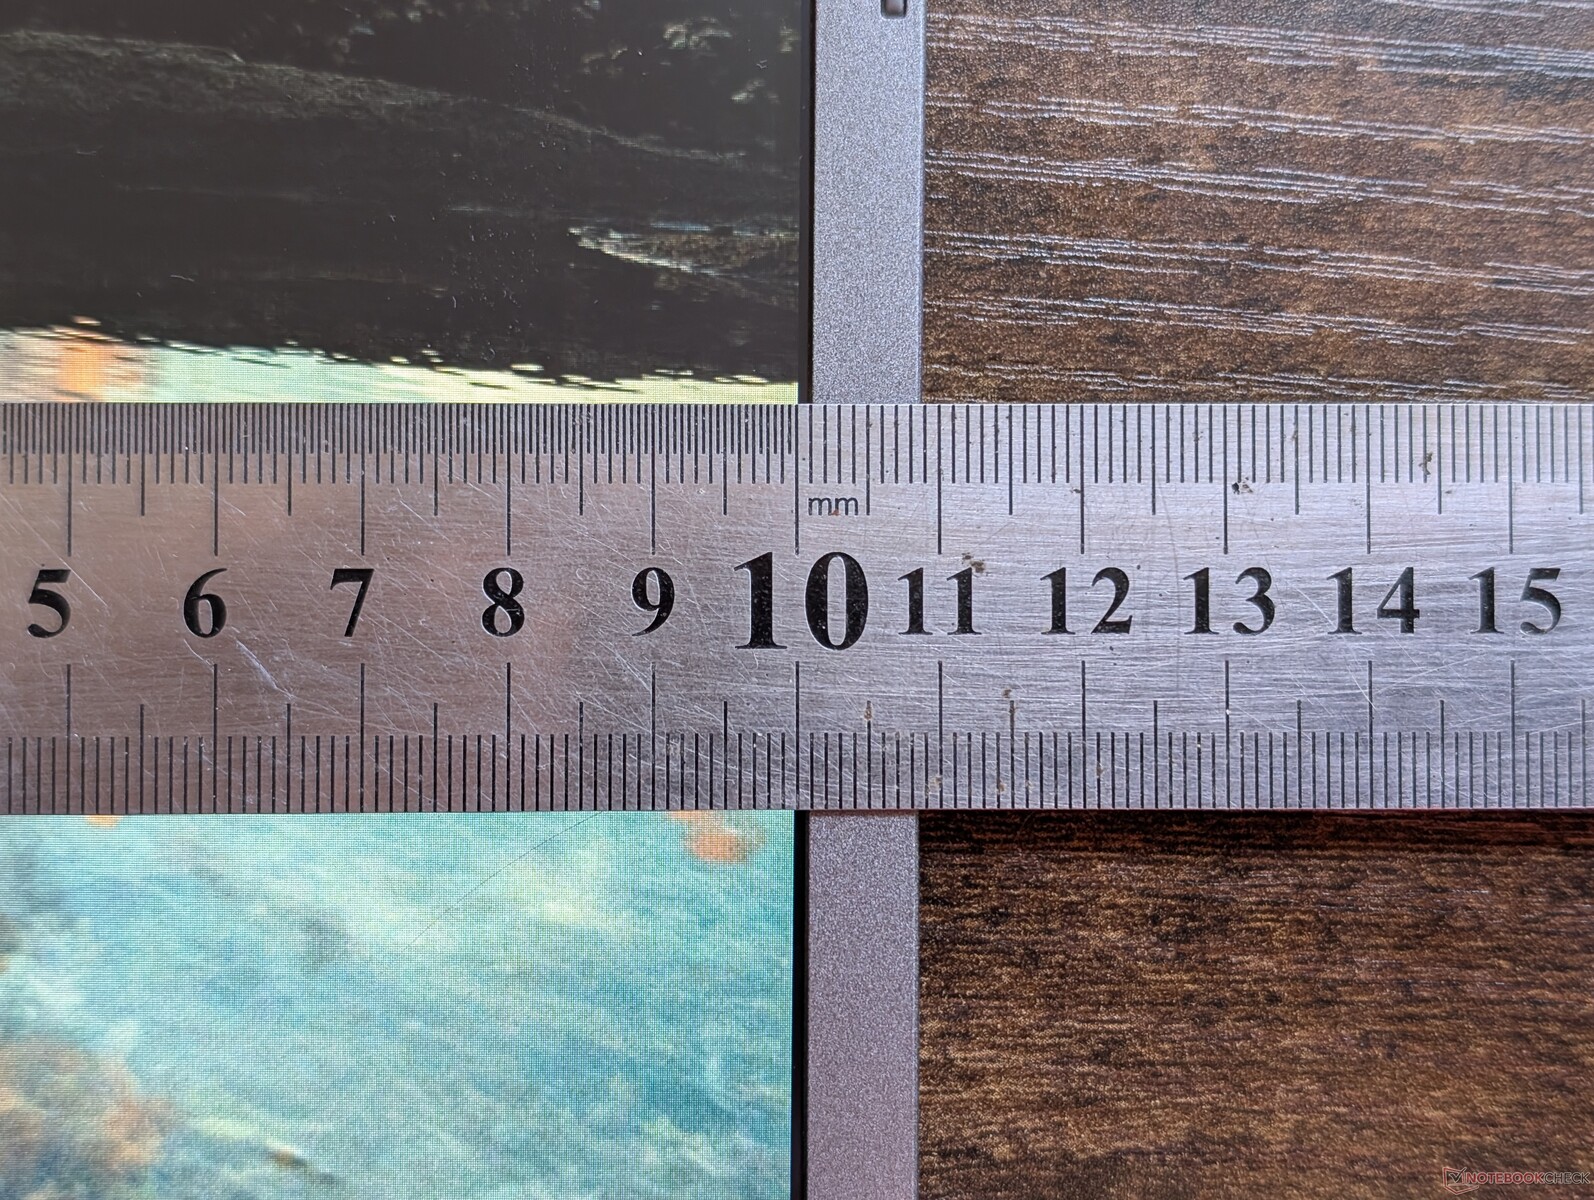
点击板尺寸与更昂贵的 Swift 14 AI 相同,为 12.6 x 7.8 厘米。反馈也很相似,包括底部四角和表面正中间不均匀的反馈。
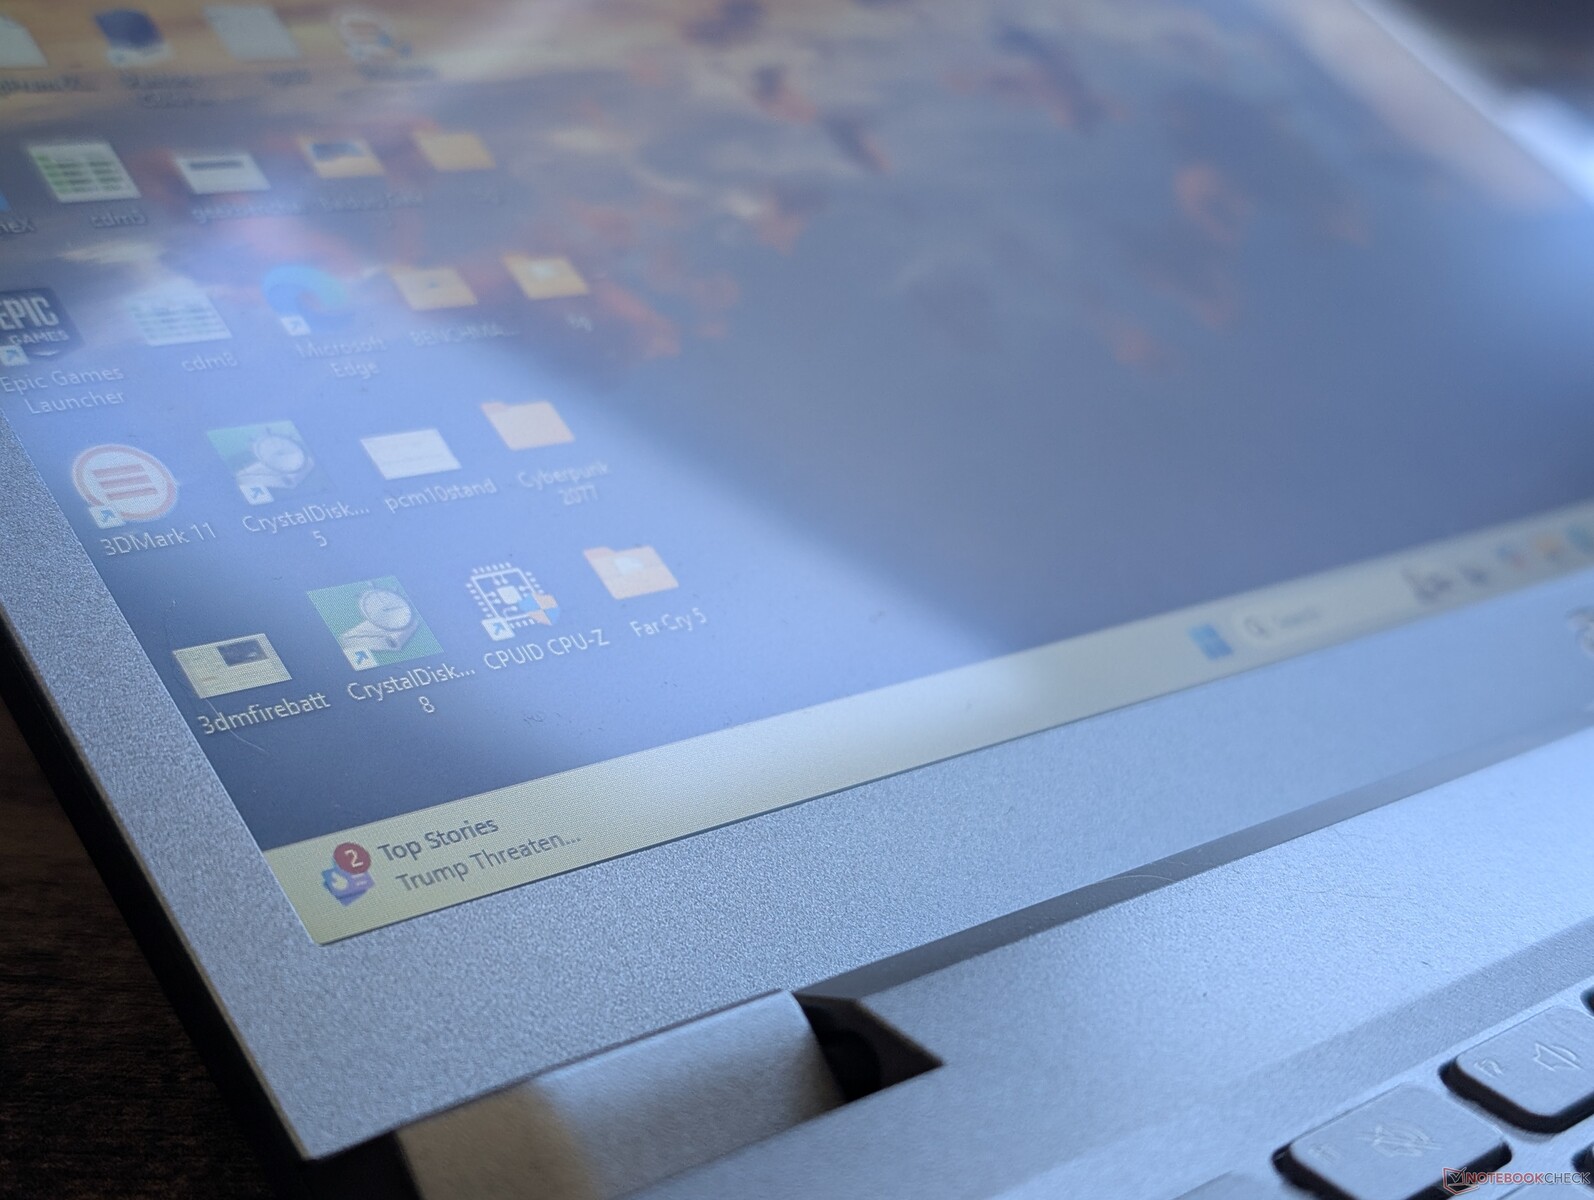
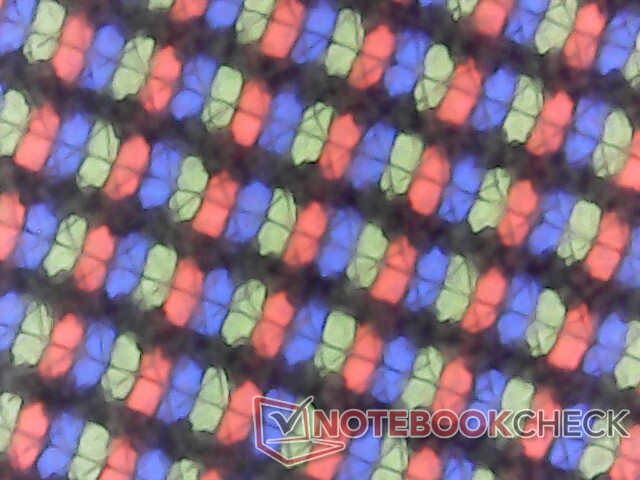
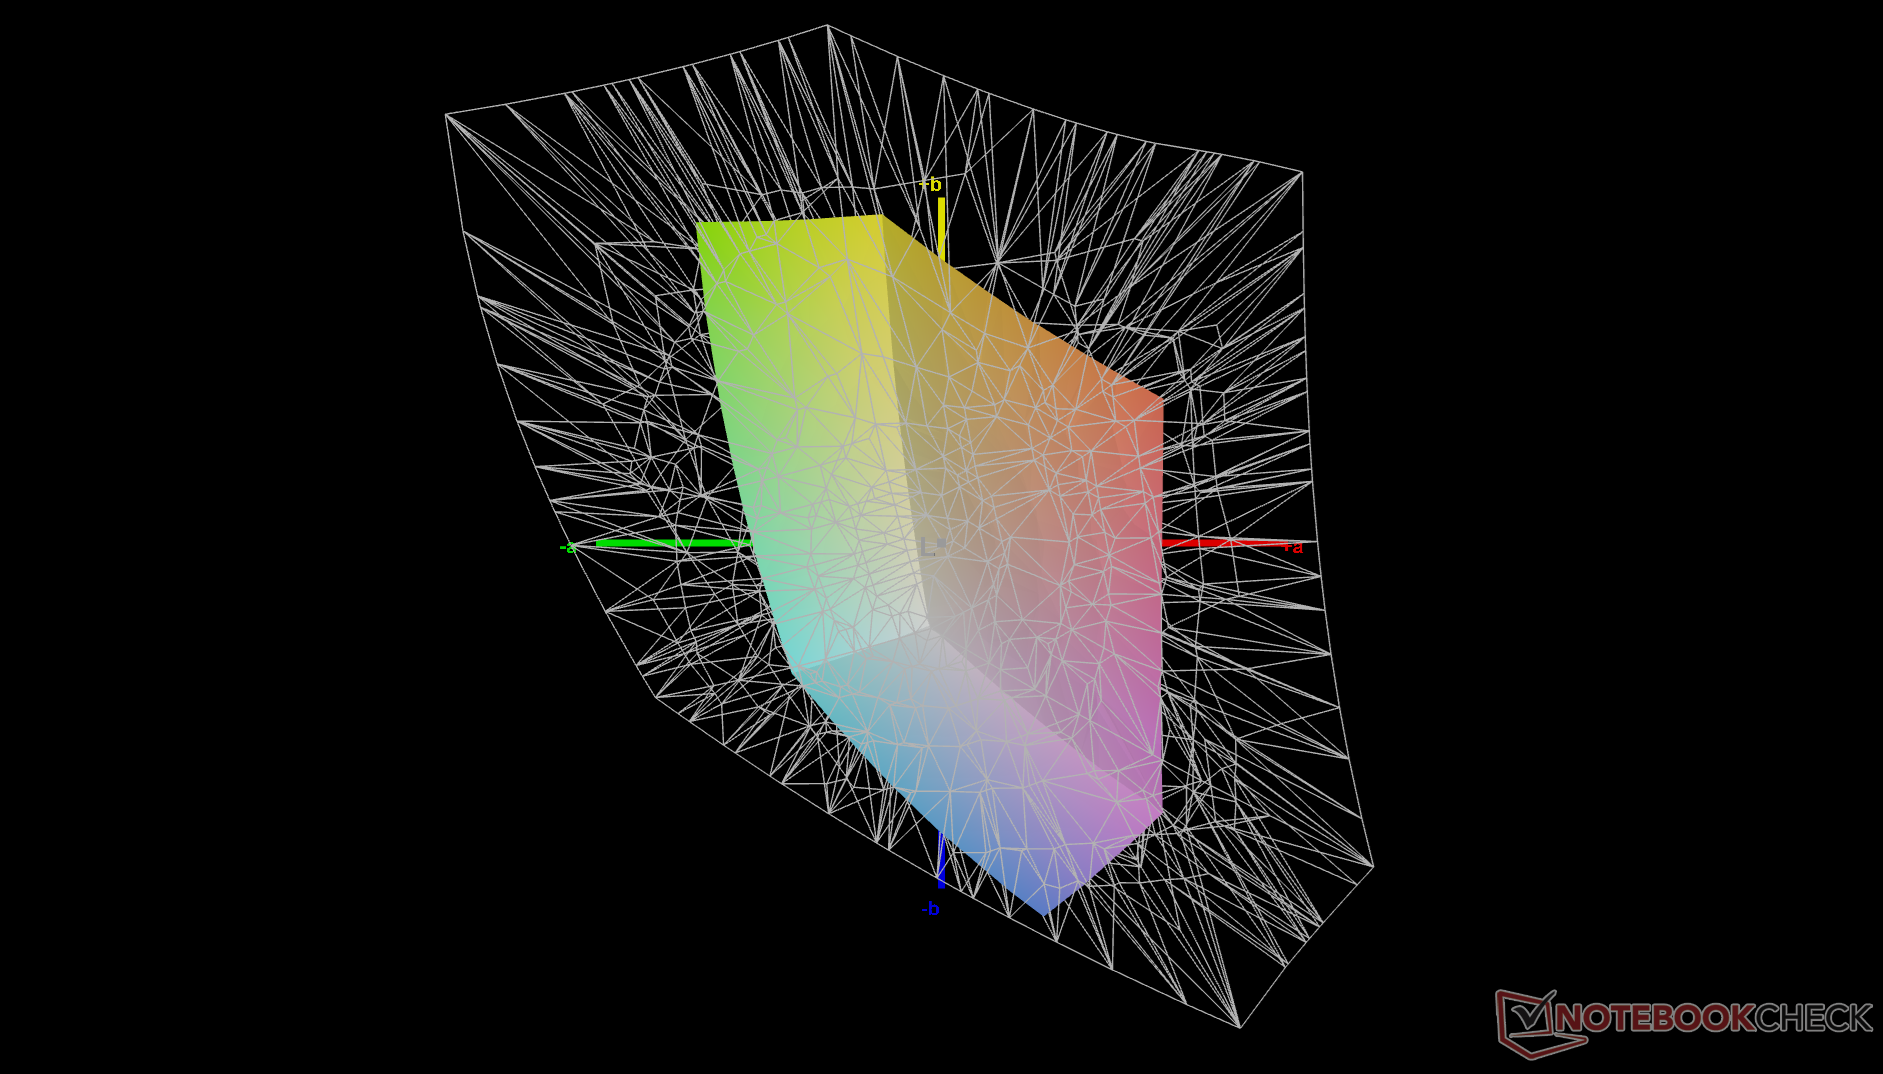
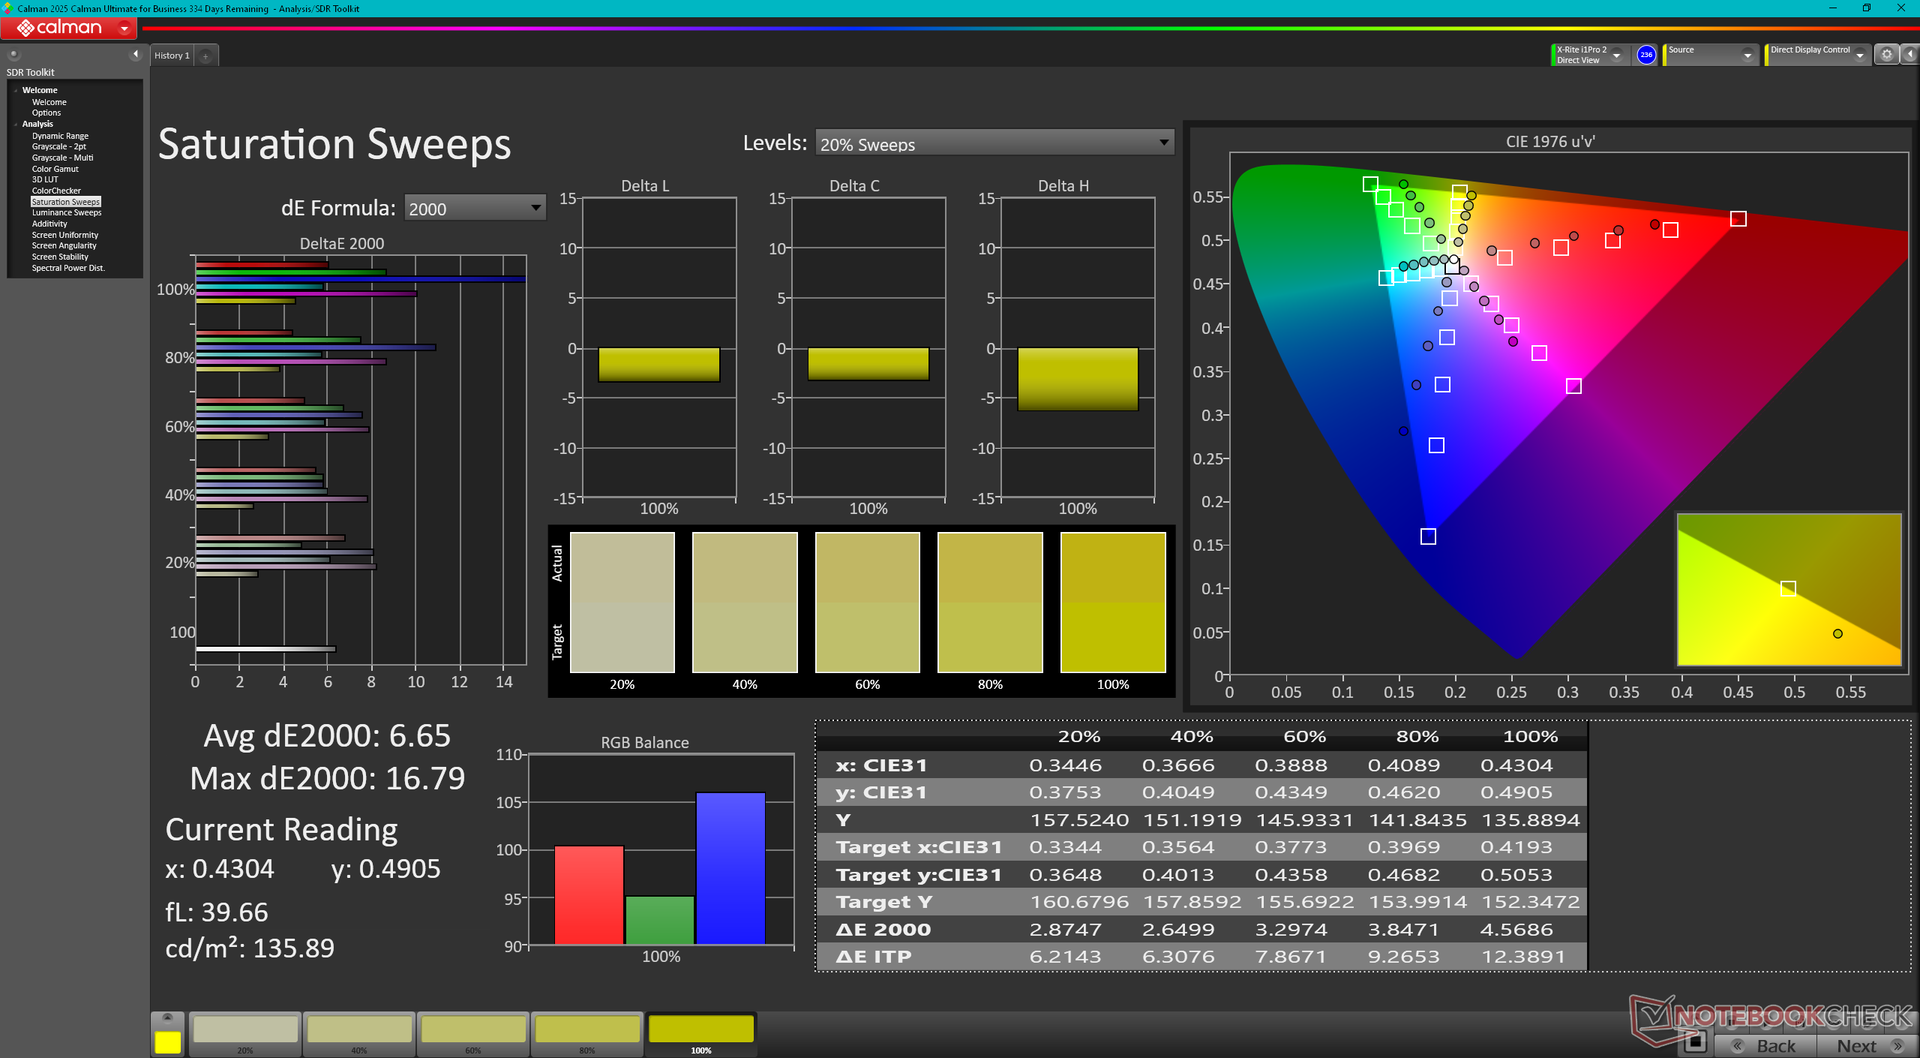
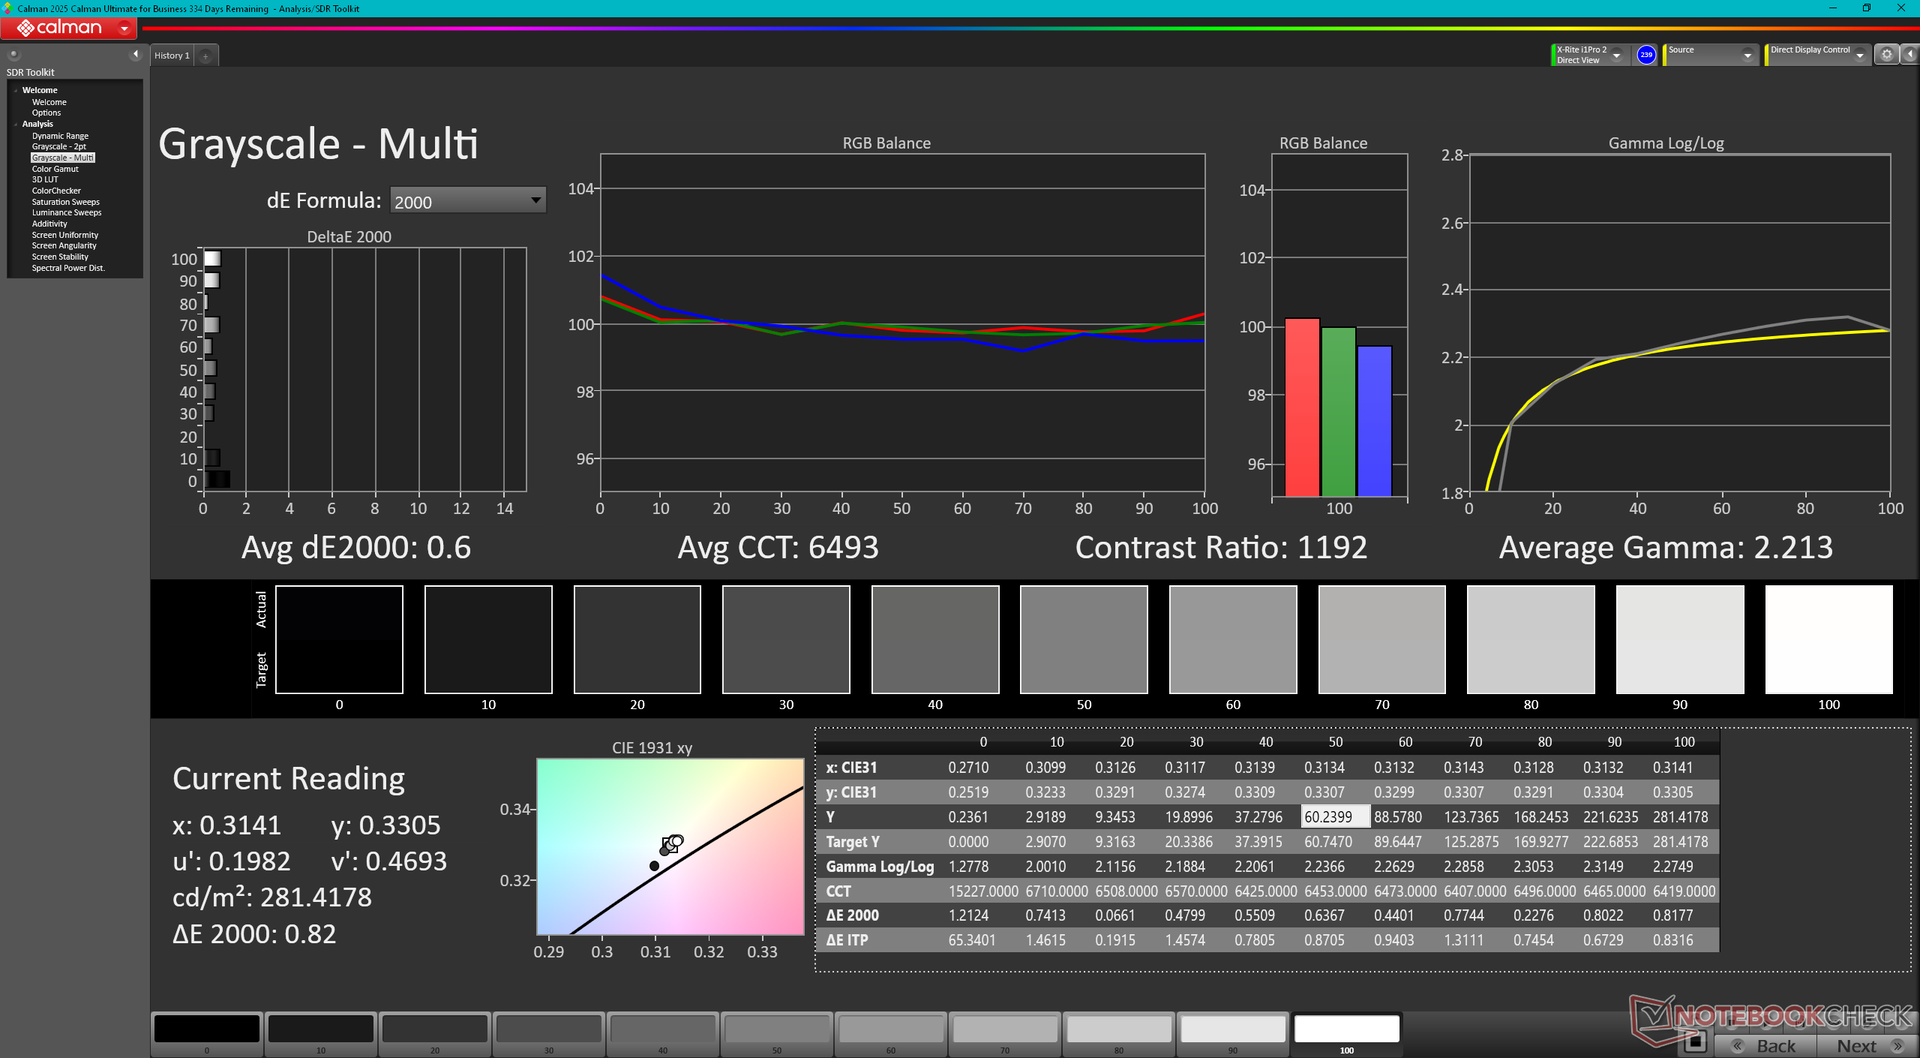
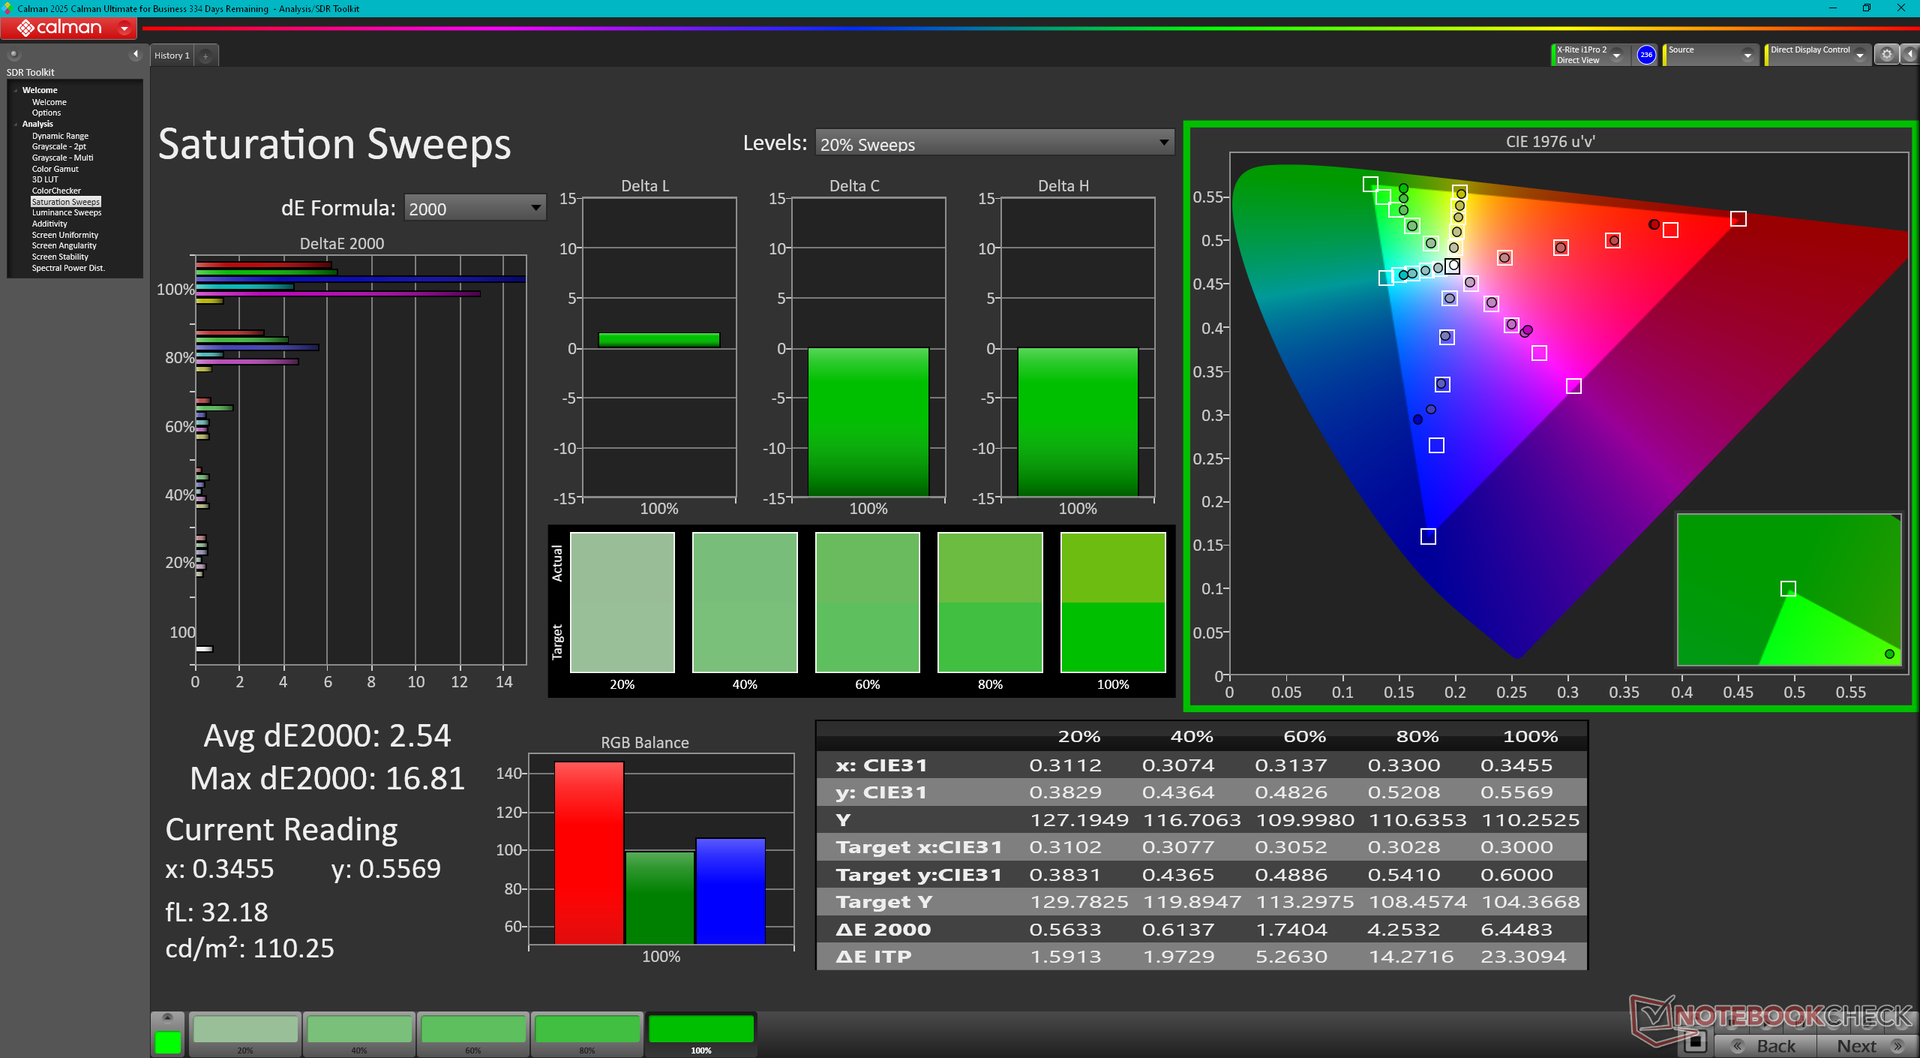
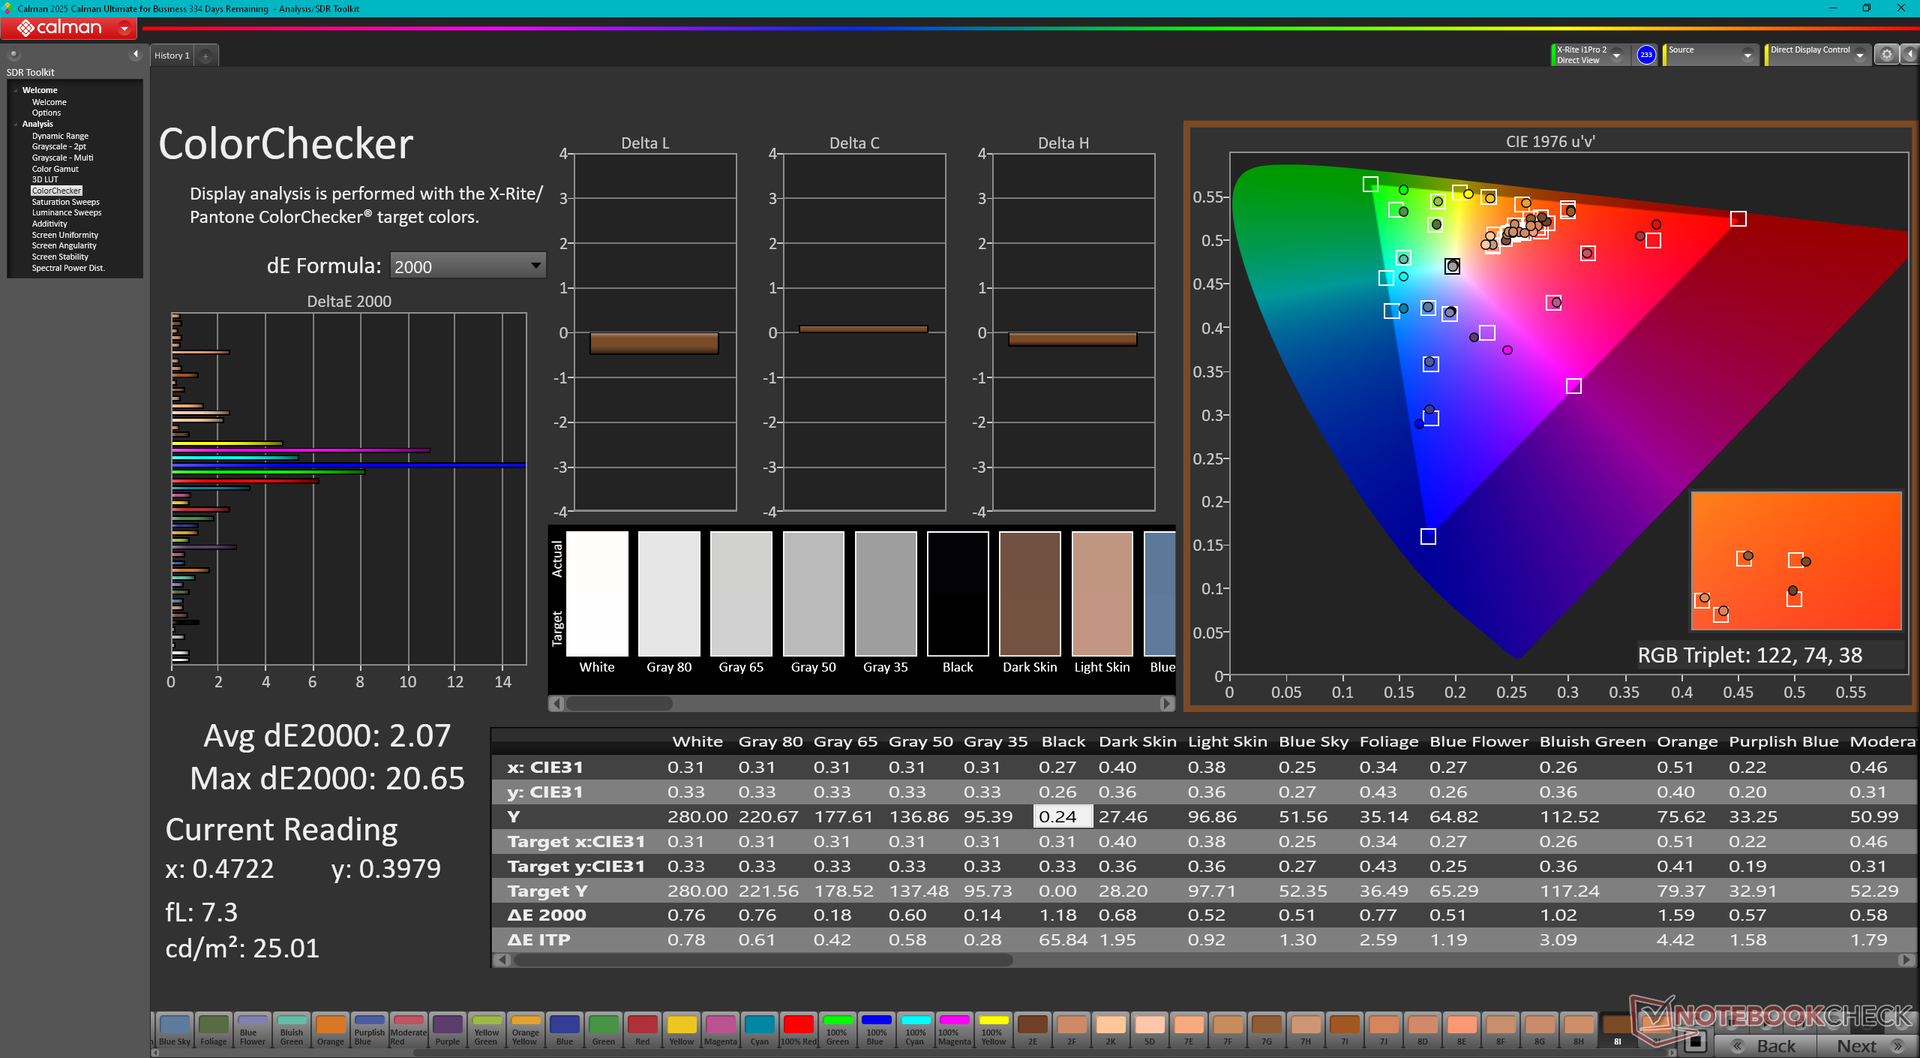
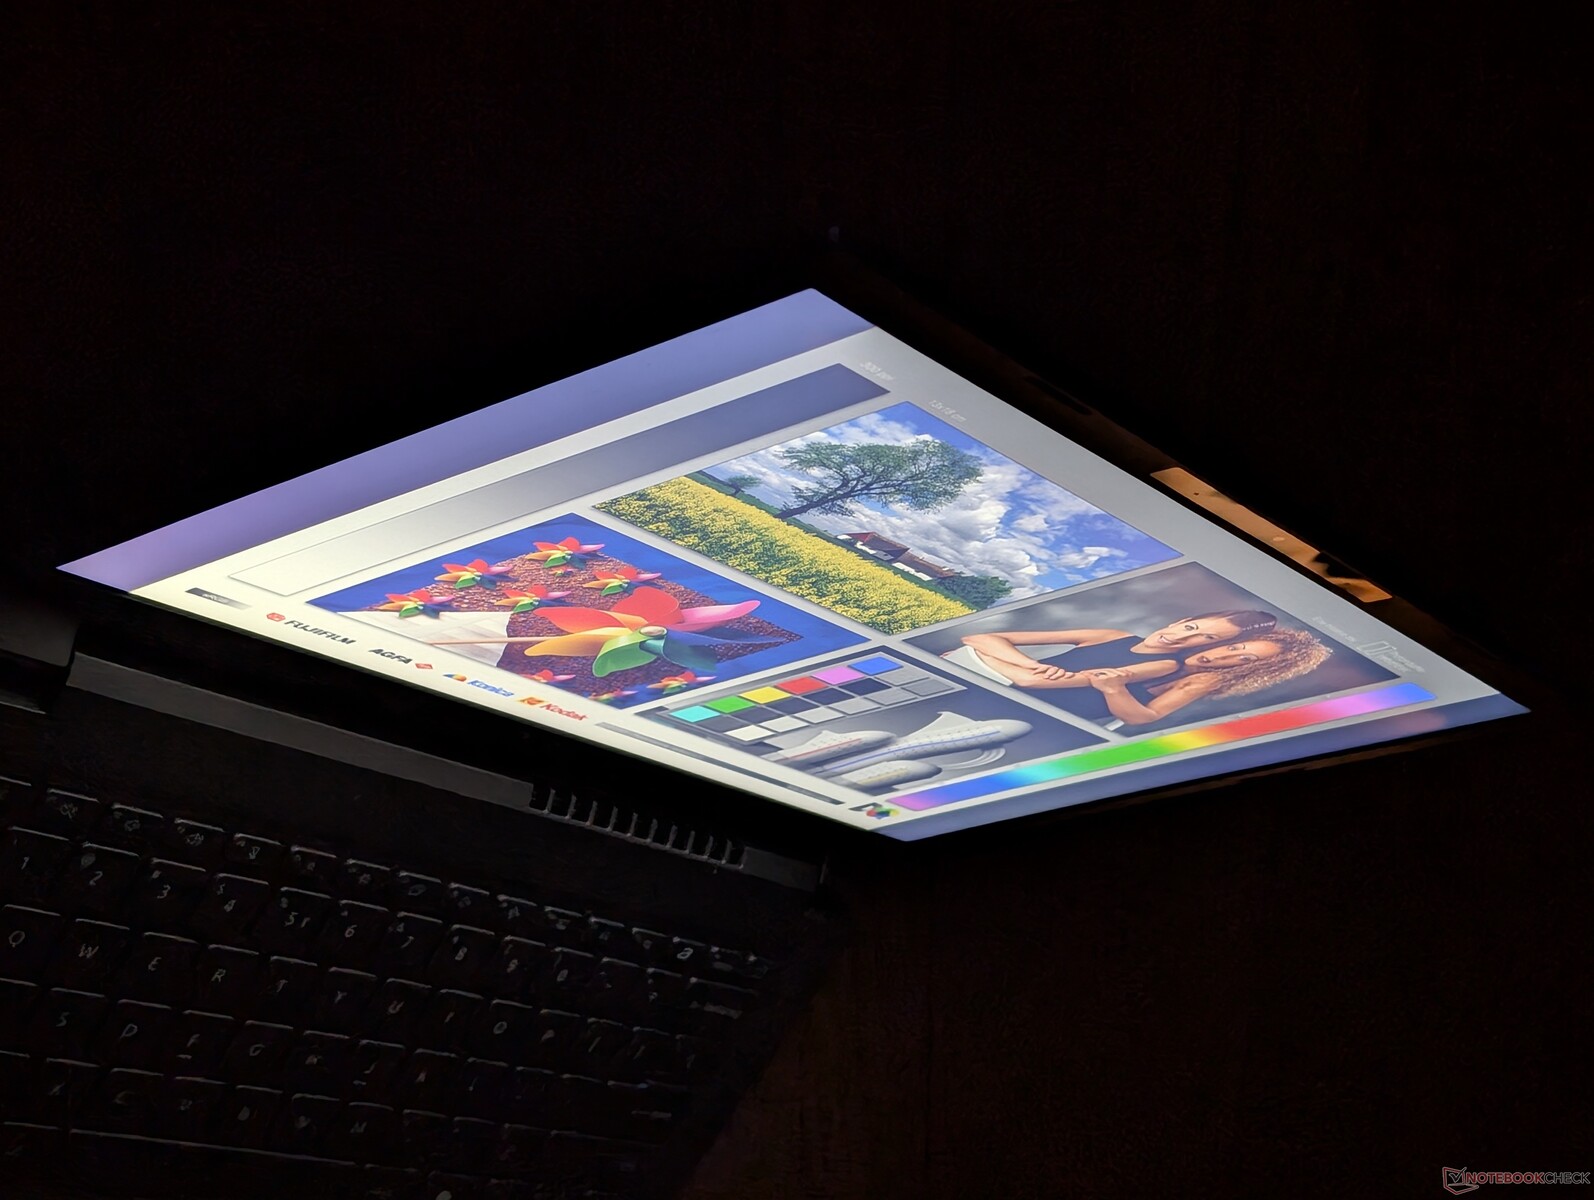
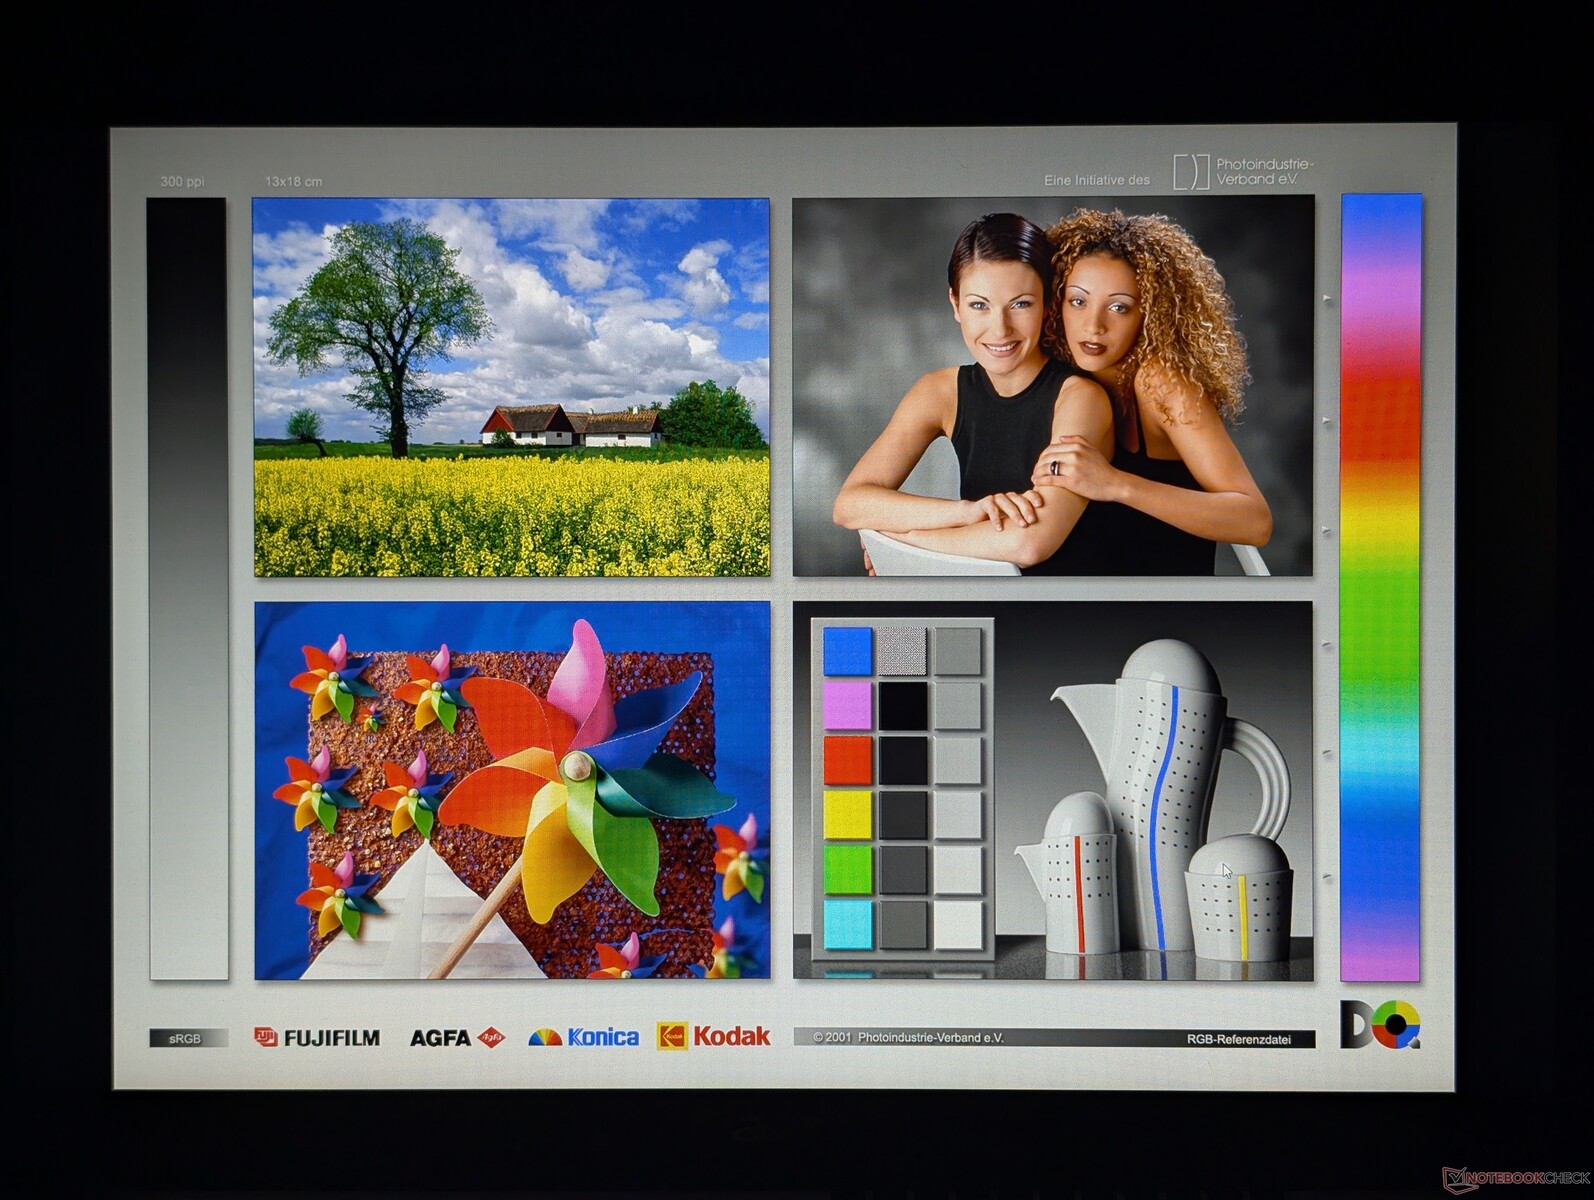
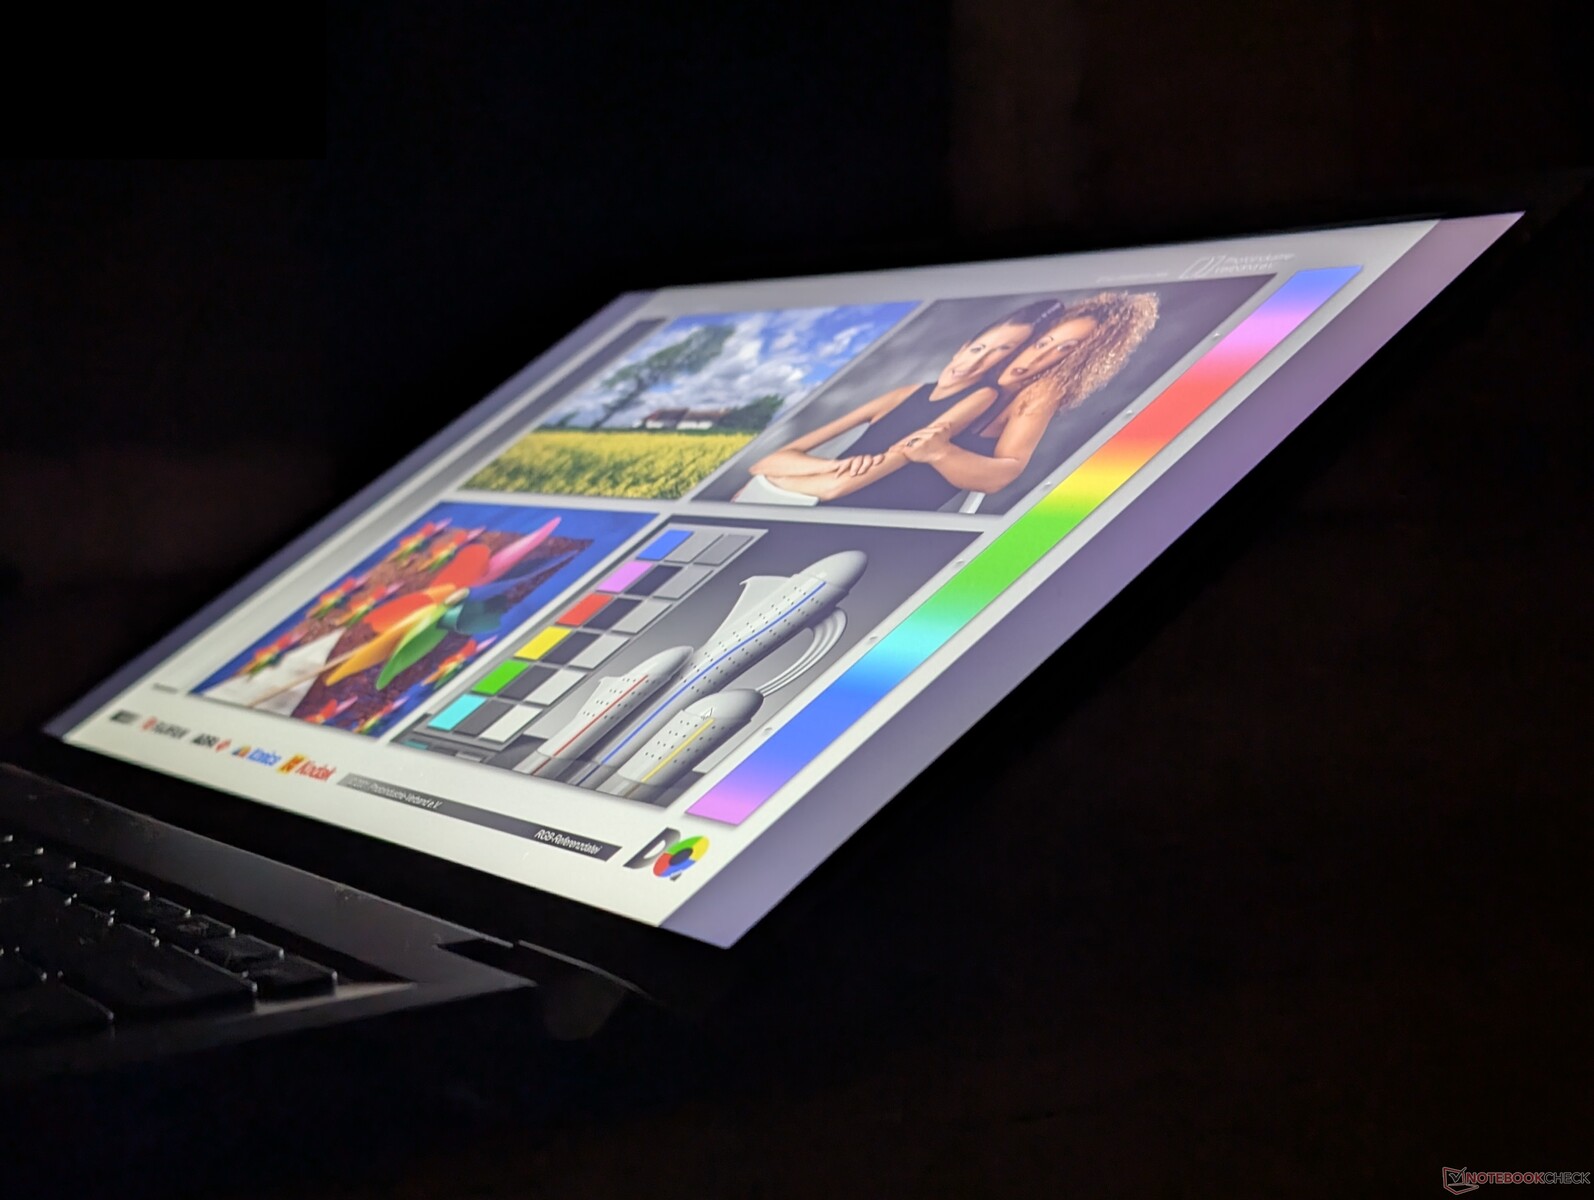
显示屏 - 廉价 IPS 触摸屏
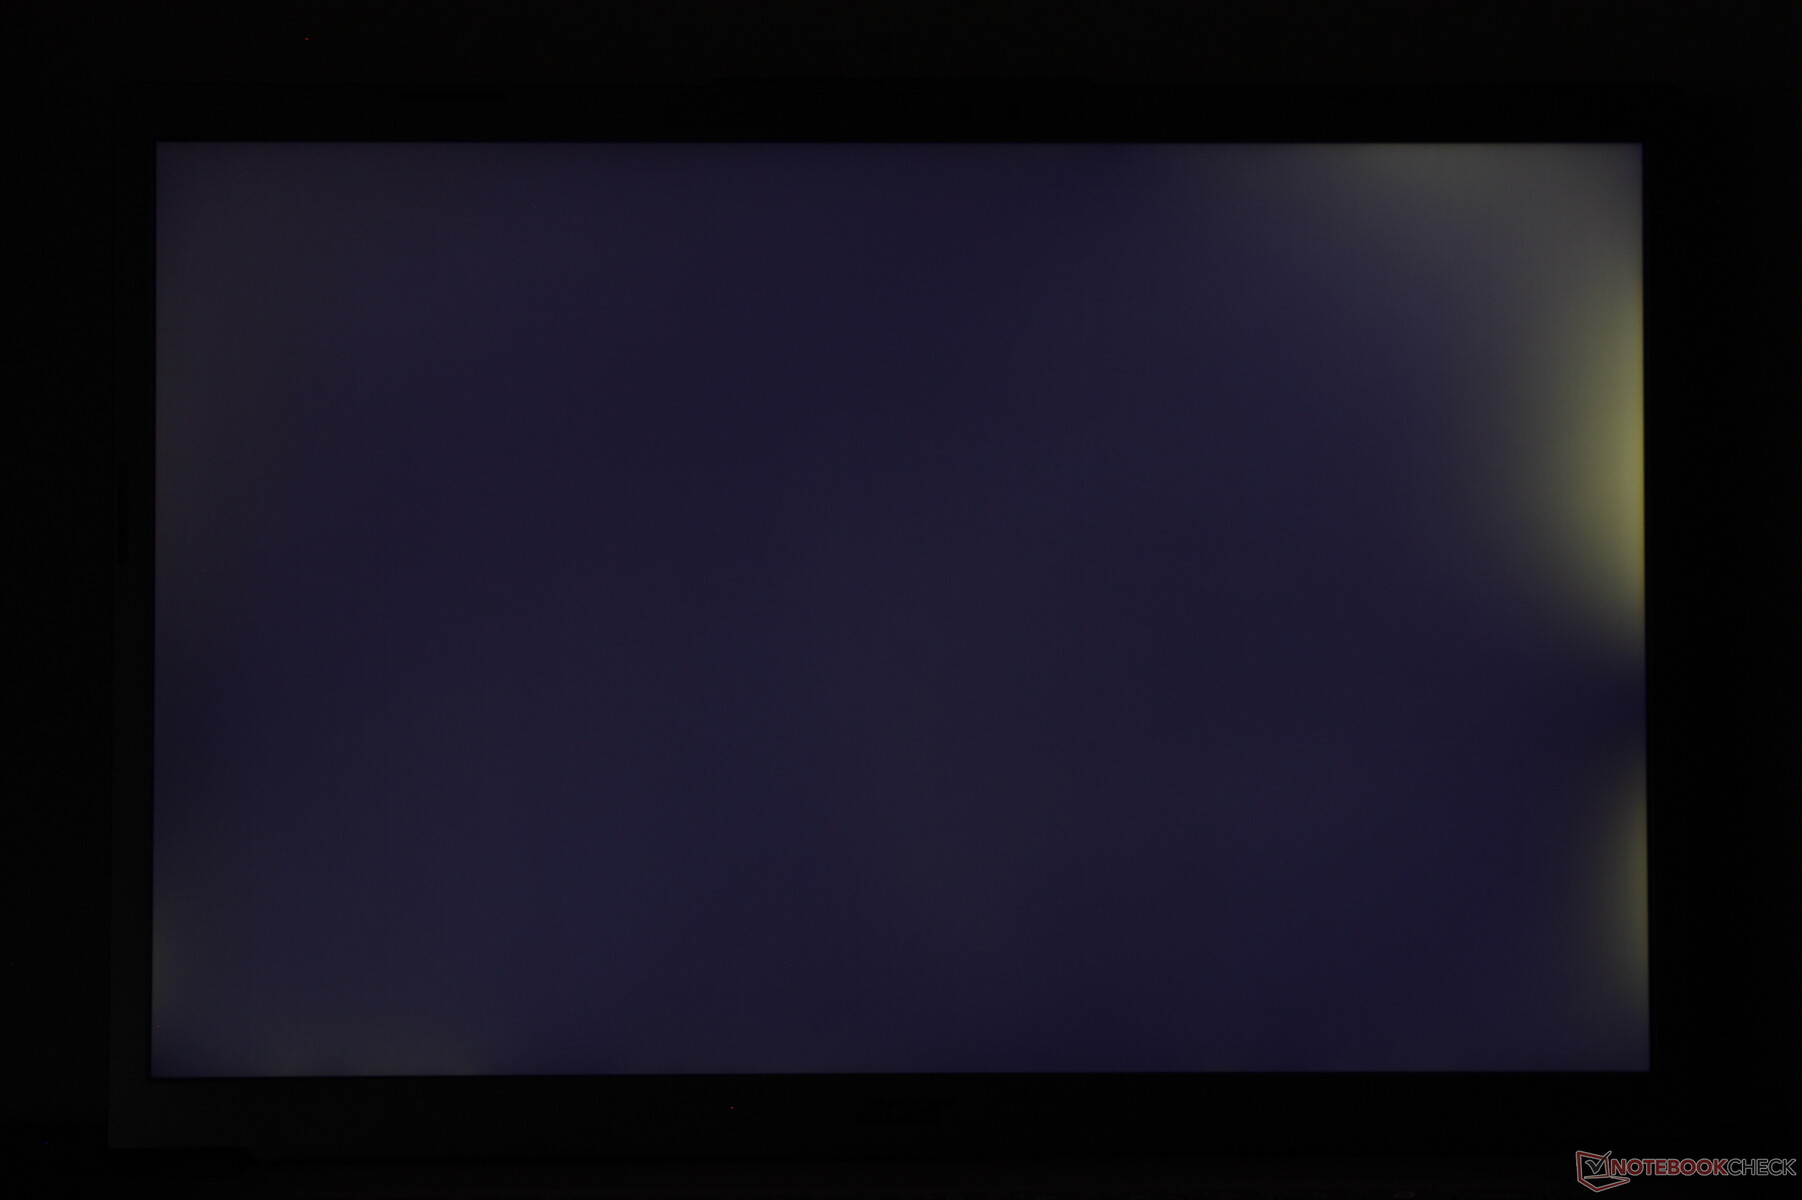
Aspire 14 AI 的 IPS 显示屏属于经济型产品,其色彩小于 60% sRGB,刷新率仅为 60 Hz,亮度和响应时间水平一般。如下图所示,我们的设备还存在中等程度的背光不均匀出血问题。
| |||||||||||||||||||||||||
Brightness Distribution: 93 %
Center on Battery: 312.1 cd/m²
Contrast: 1040:1 (Black: 0.3 cd/m²)
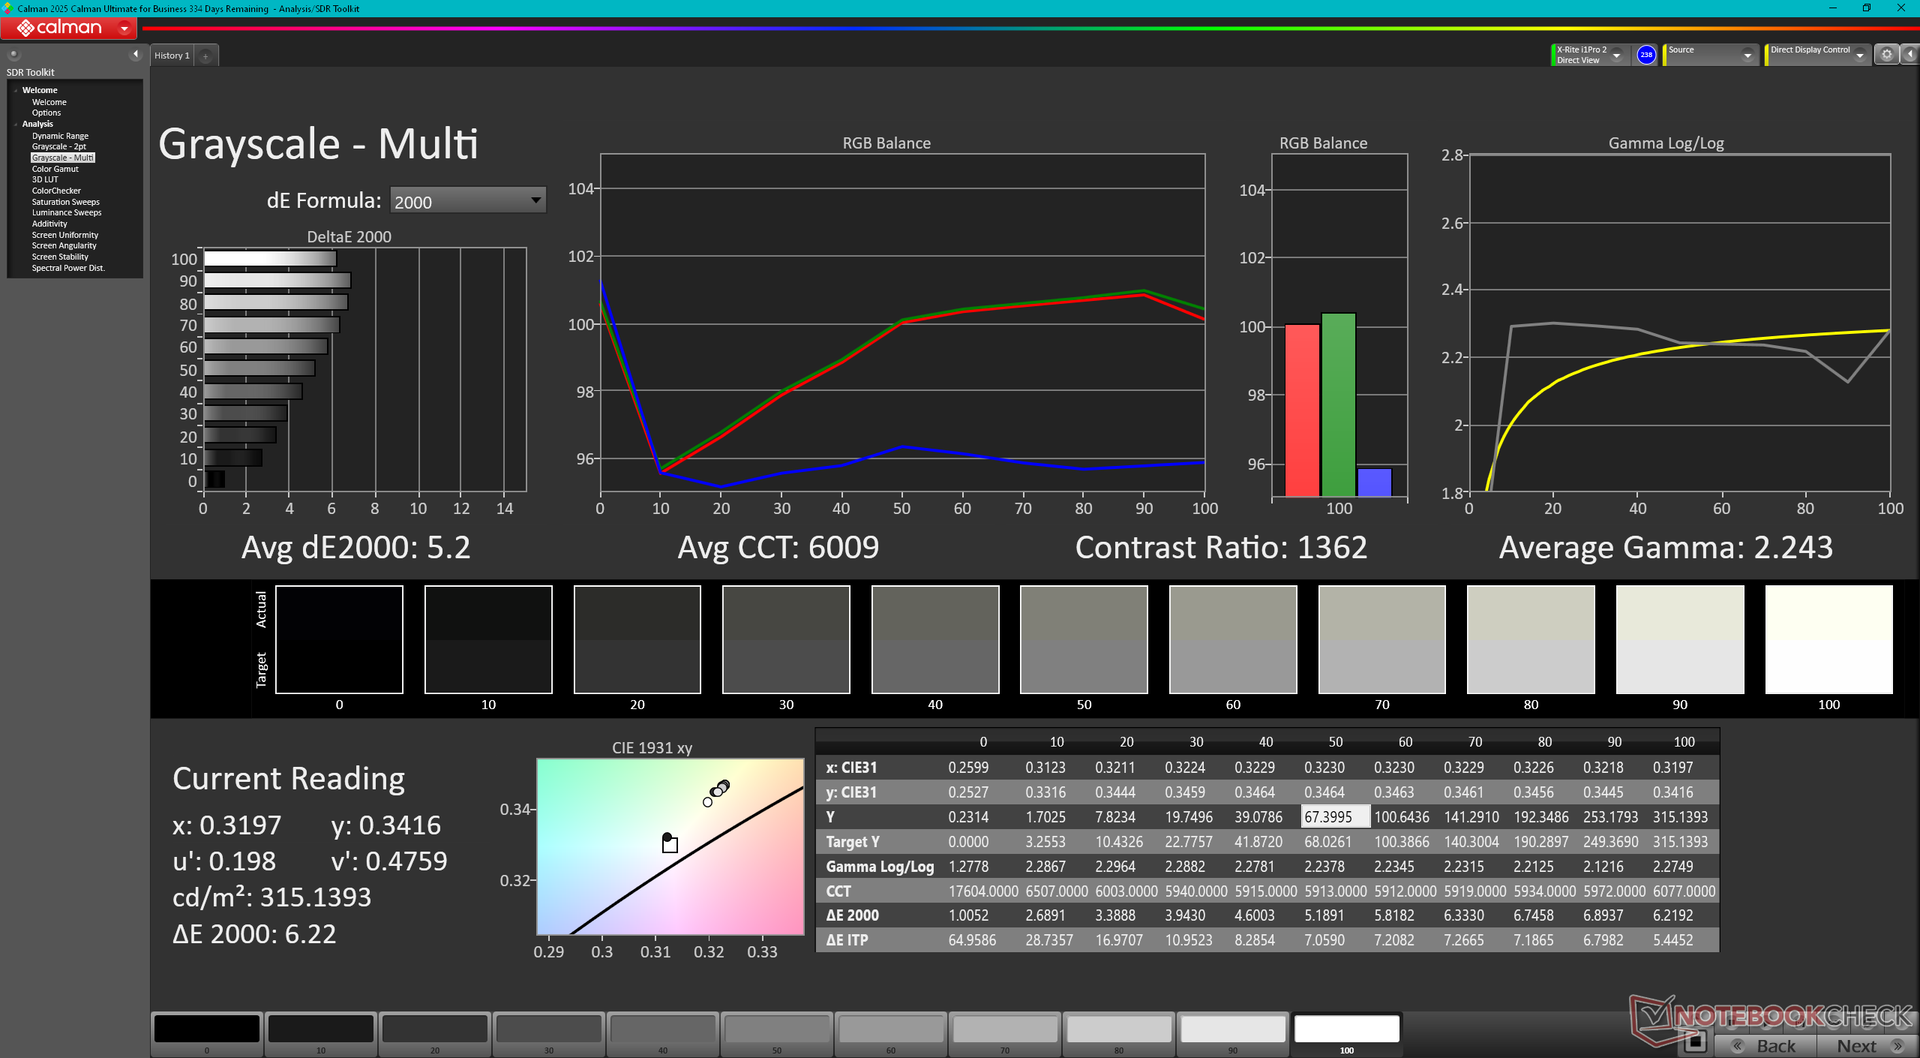
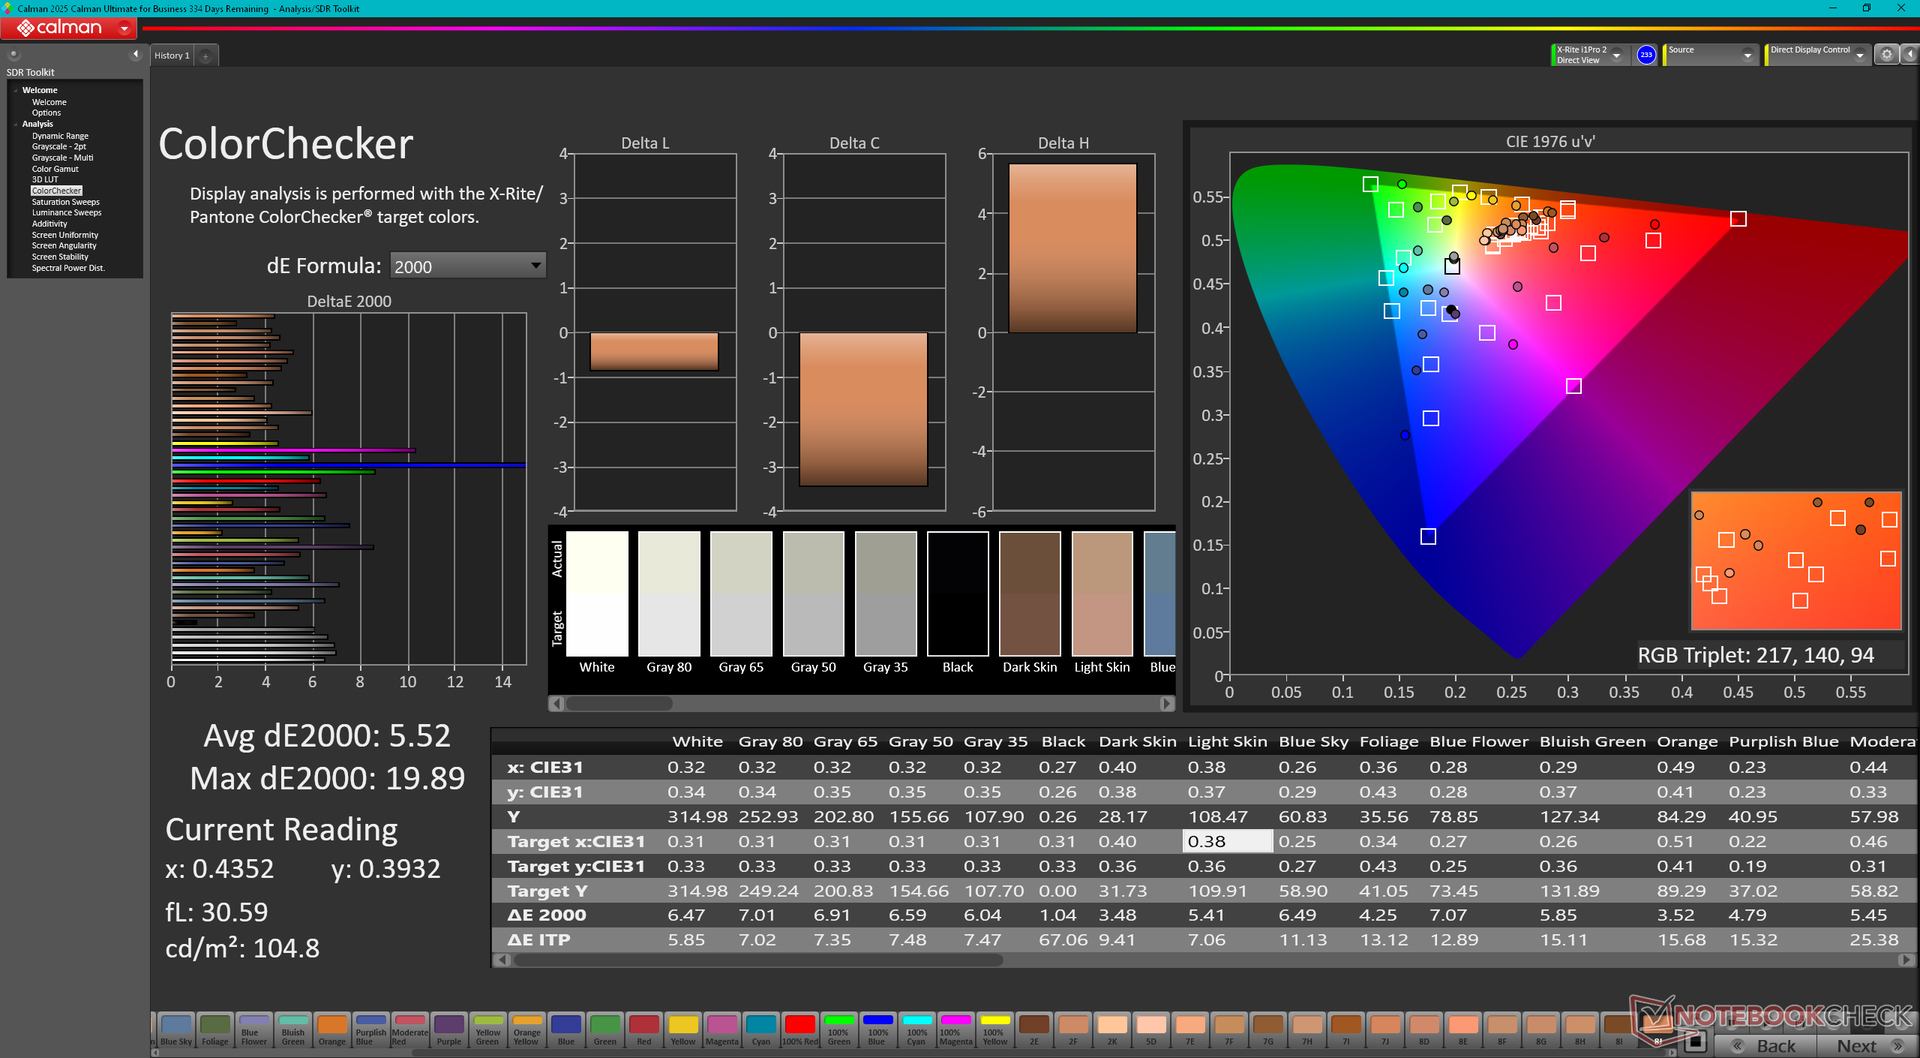
ΔE Color 5.52 | 0.5-29.43 Ø4.87, calibrated: 2.07
ΔE Greyscale 5.2 | 0.5-98 Ø5.1
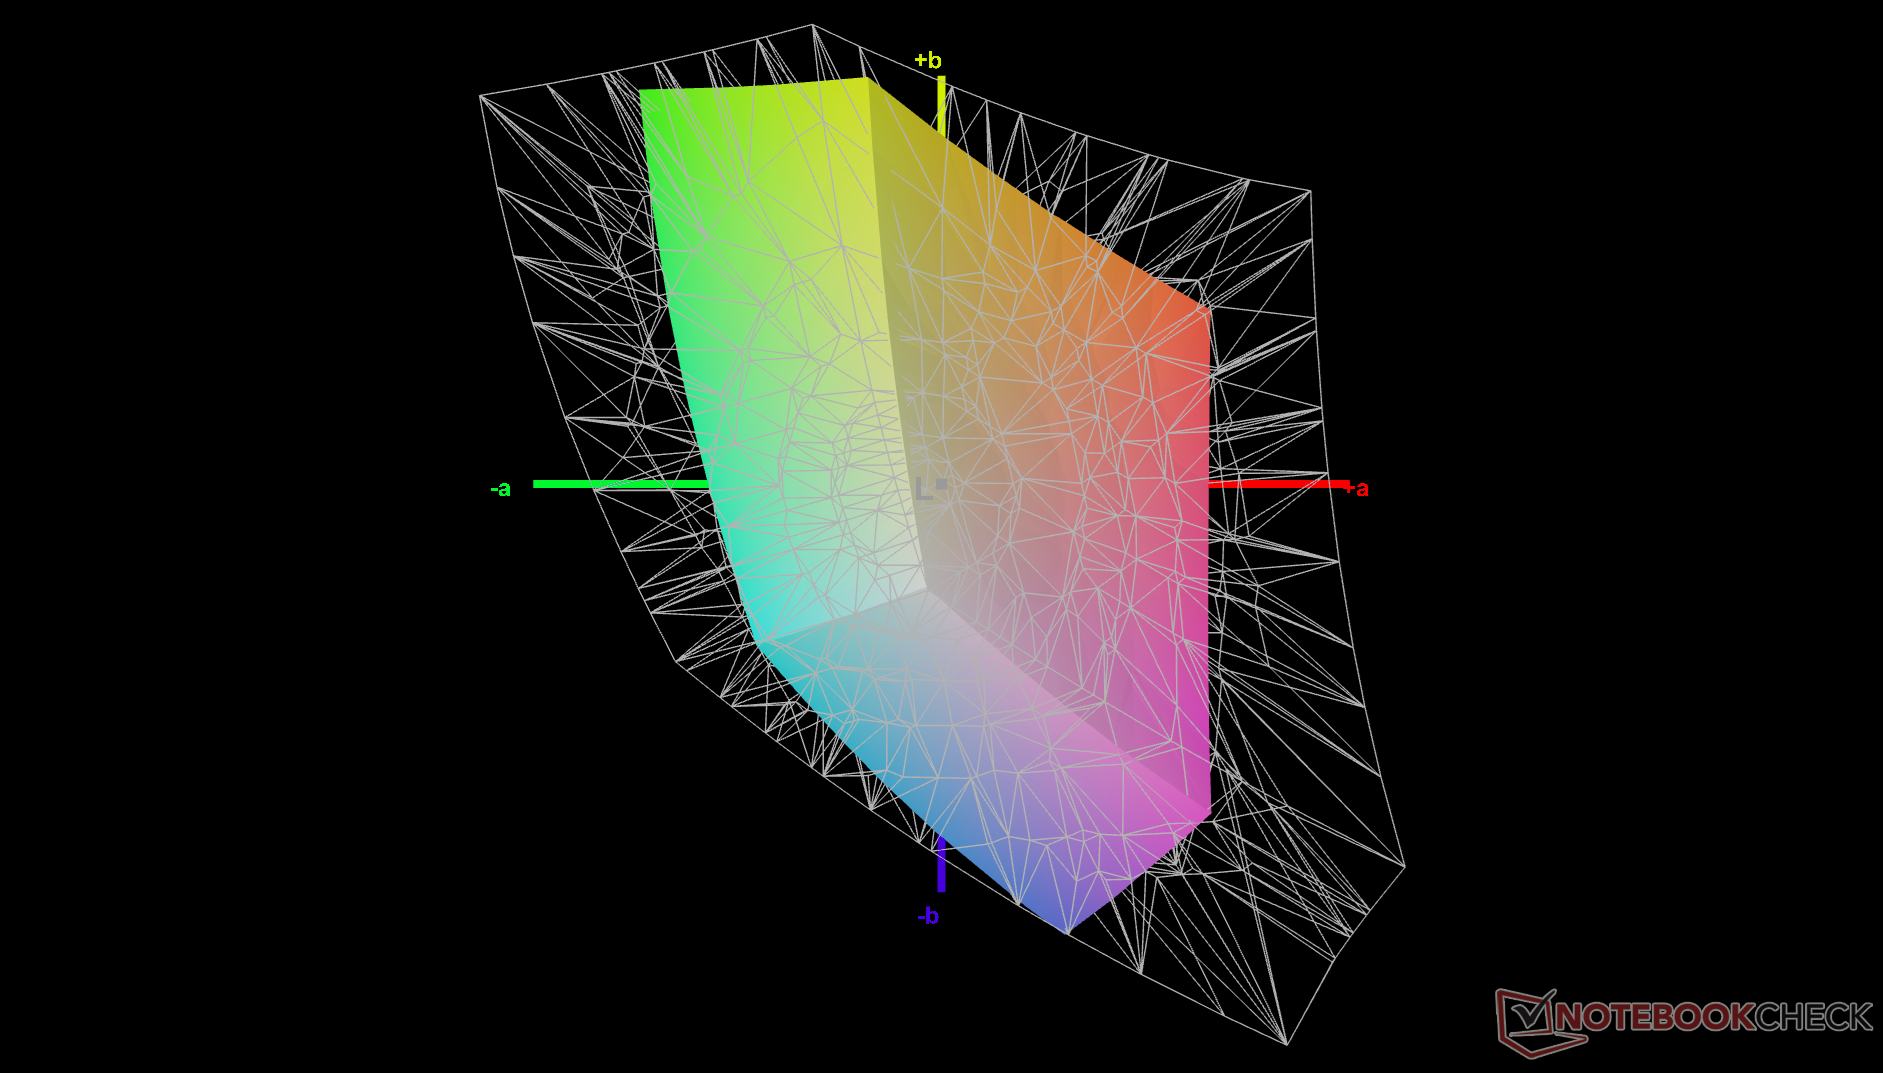
38.1% AdobeRGB 1998 (Argyll 2.2.0 3D)
55.2% sRGB (Argyll 2.2.0 3D)
36.8% Display P3 (Argyll 2.2.0 3D)
Gamma: 2.24
| Acer Aspire 14 AI N24Q14 AU Optronics B140UAK02.5, IPS, 1920x1200, 14", 60 Hz | Acer Swift 14 AI SF14-51-58TU Samsung ATNA40YK11-0 (SDC4181), OLED, 2880x1800, 14", 90 Hz | Lenovo IdeaPad Slim 3 14 AHP G10 LEN140WUXGA, IPS, 1920x1200, 14", 60 Hz | Asus VivoBook S 14 OLED M5406WA ATNA40CT02-0 (SDC41A0), OLED, 1920x1200, 14", 60 Hz | Dell Inspiron 14 Plus 7440 BOE NV14N44, IPS, 2240x1400, 14", 60 Hz | HP Pavilion Plus 14-ew0153TU Samsung SDC4197, OLED, 2880x1800, 14", 120 Hz | |
|---|---|---|---|---|---|---|
| Display | 136% | 6% | 136% | 85% | 129% | |
| Display P3 Coverage | 36.8 | 99.9 171% | 39.1 6% | 99.9 171% | 69.3 88% | 97.9 166% |
| sRGB Coverage | 55.2 | 100 81% | 58.4 6% | 100 81% | 99.5 80% | 99.6 80% |
| AdobeRGB 1998 Coverage | 38.1 | 97.6 156% | 40.4 6% | 97.2 155% | 71.4 87% | 92.1 142% |
| Response Times | 47% | -64% | 97% | -109% | 25% | |
| Response Time Grey 50% / Grey 80% * | 22 ? | 0.8 ? 96% | 31.4 ? -43% | 1.3 ? 94% | 41 ? -86% | 10.8 ? 51% |
| Response Time Black / White * | 11.6 ? | 0.8 ? 93% | 21.3 ? -84% | 1.2 ? 90% | 26.8 ? -131% | 9.29 ? 20% |
| PWM Frequency | 115.4 | 60 ? -48% | 240 ? 108% | 120 ? 4% | ||
| Screen | 564% | -8% | 169% | 28% | 444% | |
| Brightness middle | 312.1 | 500 60% | 304 -3% | 385 23% | 403.2 29% | 387 24% |
| Brightness | 300 | 499 66% | 281 -6% | 382 27% | 388 29% | 387 29% |
| Brightness Distribution | 93 | 97 4% | 89 -4% | 95 2% | 93 0% | 97 4% |
| Black Level * | 0.3 | 0.01 97% | 0.22 27% | 0.03 90% | 0.27 10% | 0.01 97% |
| Contrast | 1040 | 50000 4708% | 1382 33% | 12833 1134% | 1493 44% | 38700 3621% |
| Colorchecker dE 2000 * | 5.52 | 3.55 36% | 5.9 -7% | 1.99 64% | 4.15 25% | 2.03 63% |
| Colorchecker dE 2000 max. * | 19.89 | 6.38 68% | 19.2 3% | 3.69 81% | 6.92 65% | 3.86 81% |
| Colorchecker dE 2000 calibrated * | 2.07 | 2.55 -23% | 4.7 -127% | 1.79 14% | 1.04 50% | 1.6 23% |
| Greyscale dE 2000 * | 5.2 | 2.2 58% | 4.5 13% | 0.8 85% | 5.1 2% | 2.3 56% |
| Gamma | 2.24 98% | 1.94 113% | 2.21 100% | 2.204 100% | 2.2 100% | 2.23 99% |
| CCT | 6009 108% | 6405 101% | 6098 107% | 6474 100% | 6677 97% | 6523 100% |
| Total Average (Program / Settings) | 249% /
375% | -22% /
-13% | 134% /
148% | 1% /
21% | 199% /
297% |
* ... smaller is better
显示器在开箱时并未校准。不过,我们仍然建议使用上述经过校准的 ICM 配置文件,以显著提高平均灰度 deltaE。
Display Response Times
| ↔ Response Time Black to White | ||
|---|---|---|
| 11.6 ms ... rise ↗ and fall ↘ combined | ↗ 5.1 ms rise | 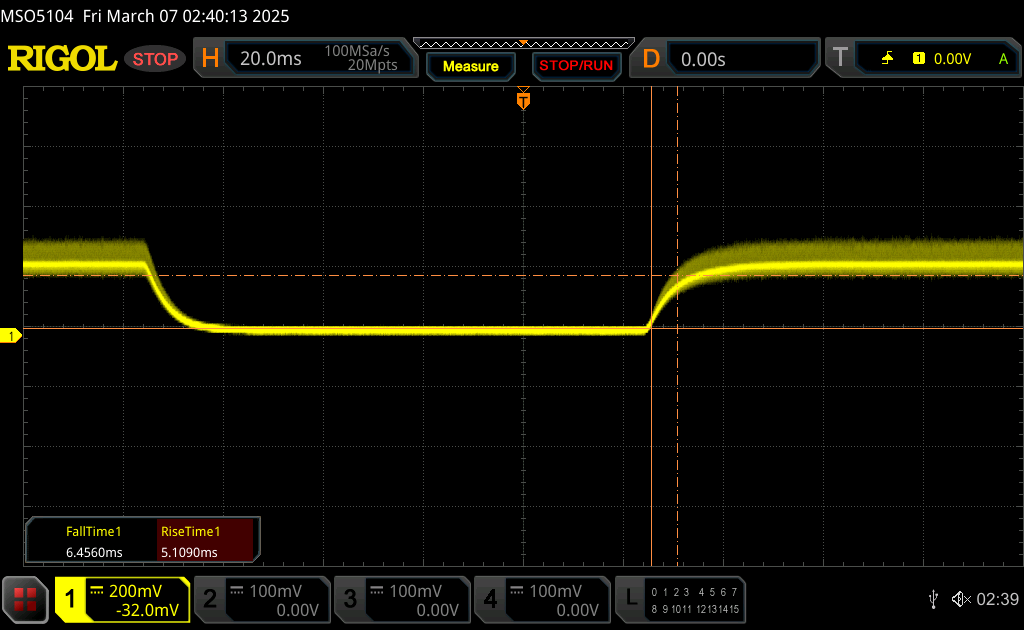 |
| ↘ 6.5 ms fall | ||
| The screen shows good response rates in our tests, but may be too slow for competitive gamers. In comparison, all tested devices range from 0.1 (minimum) to 240 (maximum) ms. » 28 % of all devices are better. This means that the measured response time is better than the average of all tested devices (20.8 ms). | ||
| ↔ Response Time 50% Grey to 80% Grey | ||
| 22 ms ... rise ↗ and fall ↘ combined | ↗ 11 ms rise | 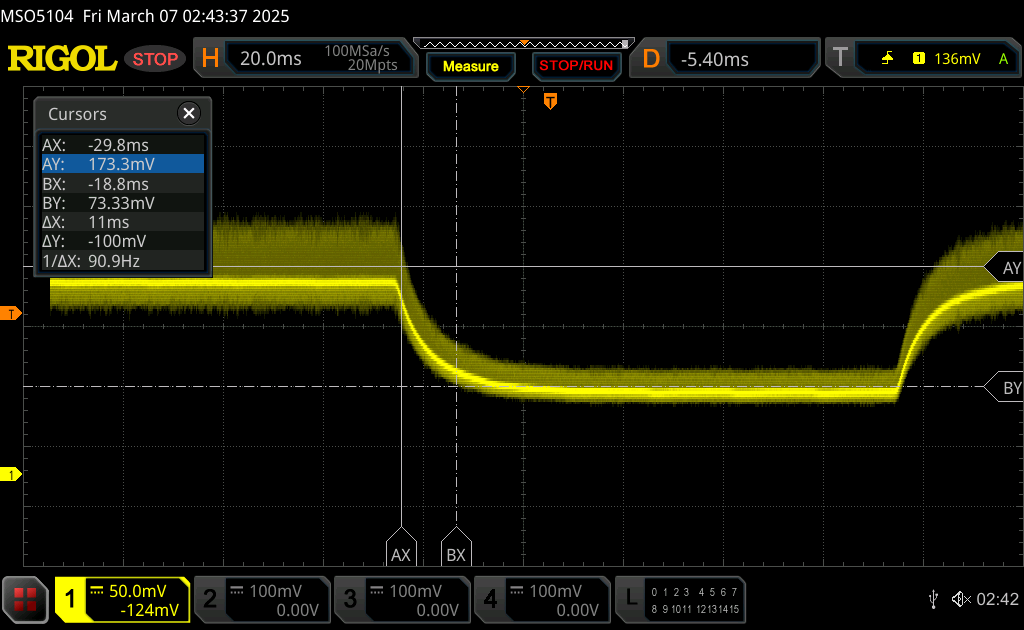 |
| ↘ 11 ms fall | ||
| The screen shows good response rates in our tests, but may be too slow for competitive gamers. In comparison, all tested devices range from 0.165 (minimum) to 636 (maximum) ms. » 31 % of all devices are better. This means that the measured response time is better than the average of all tested devices (32.5 ms). | ||
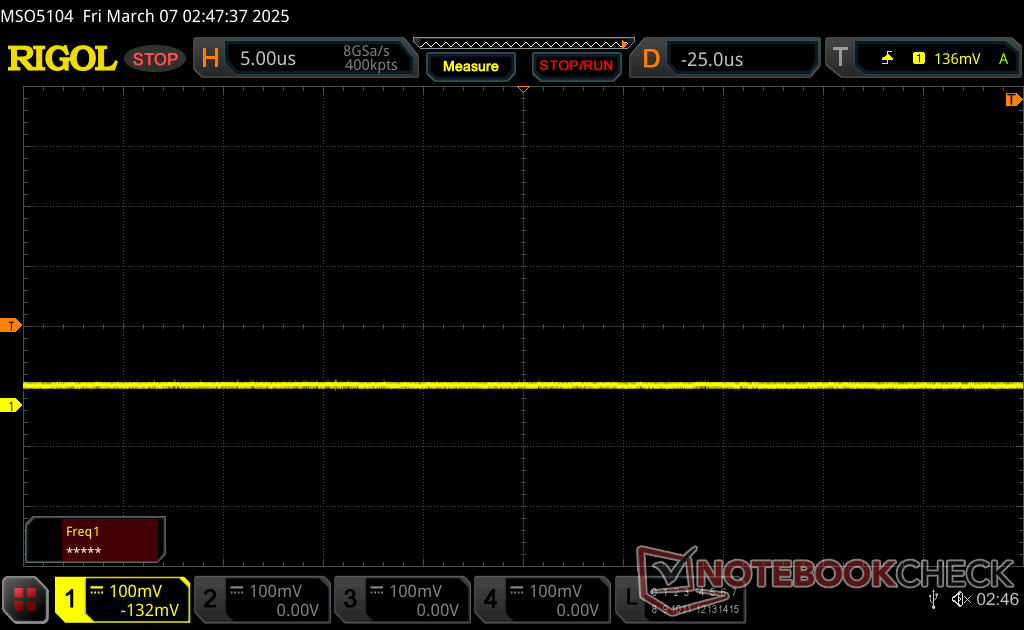
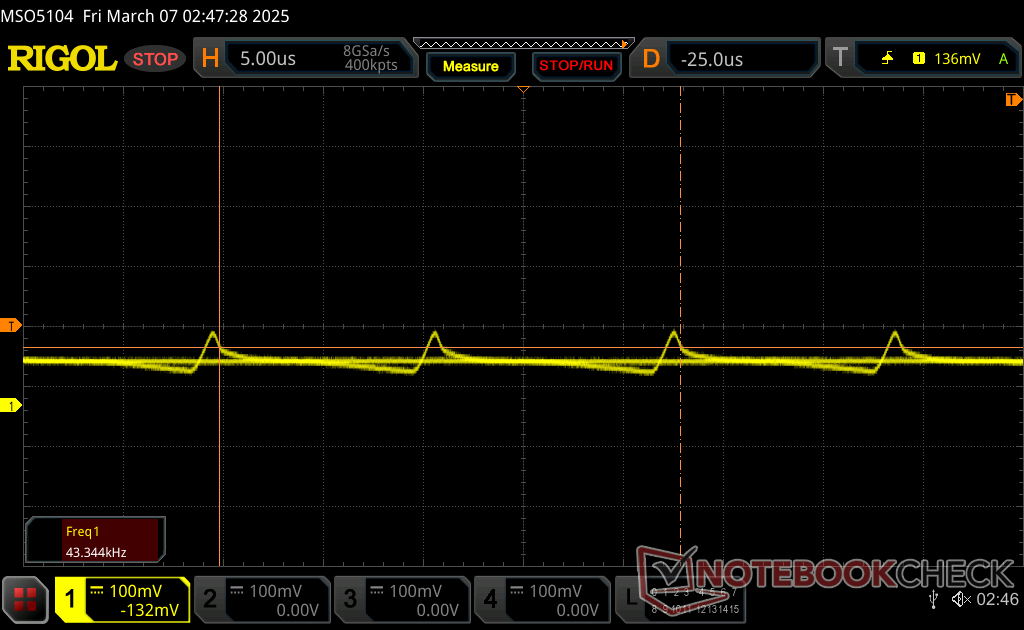
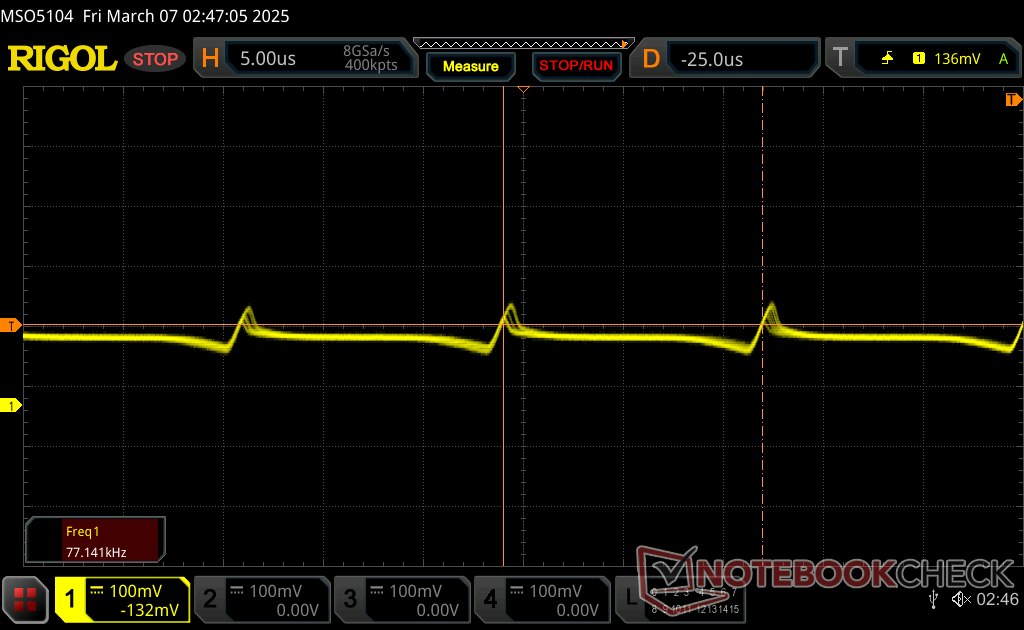
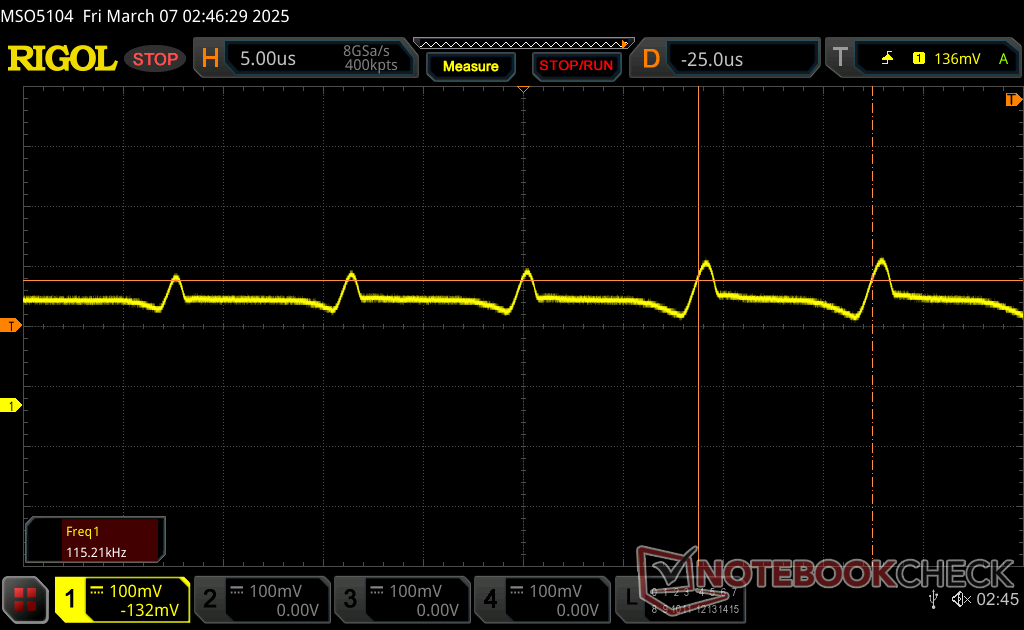
Screen Flickering / PWM (Pulse-Width Modulation)
| Screen flickering / PWM detected | 115.4 Hz Amplitude: 53 % | 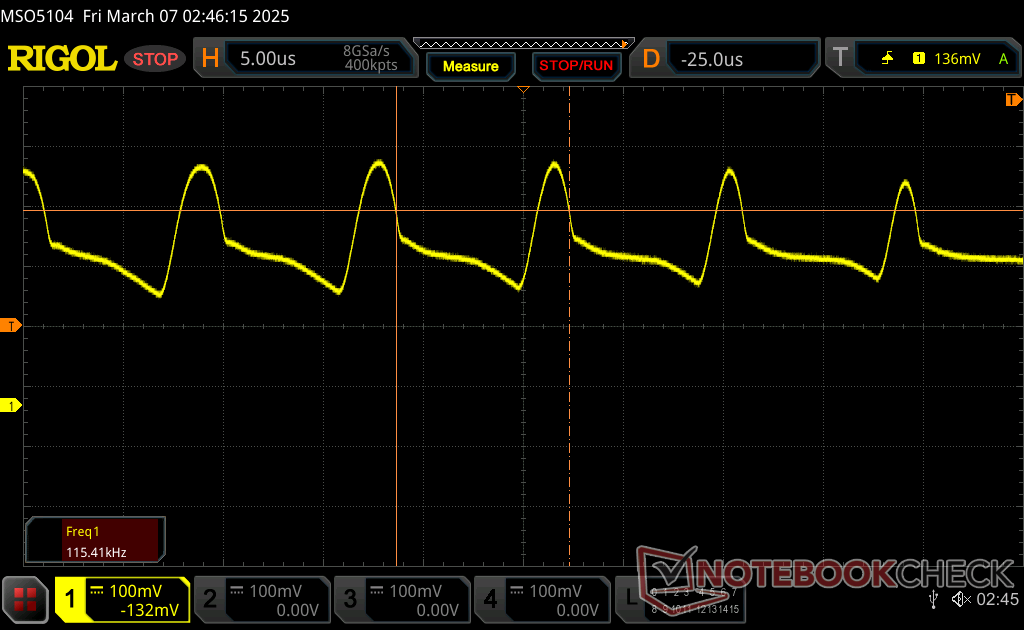 | |
The display backlight flickers at 115.4 Hz (worst case, e.g., utilizing PWM) . The frequency of 115.4 Hz is very low, so the flickering may cause eyestrain and headaches after extended use. In comparison: 53 % of all tested devices do not use PWM to dim the display. If PWM was detected, an average of 8523 (minimum: 5 - maximum: 343500) Hz was measured. | |||
所有亮度级别(包括最大设置)都有脉宽调制 (PWM)。
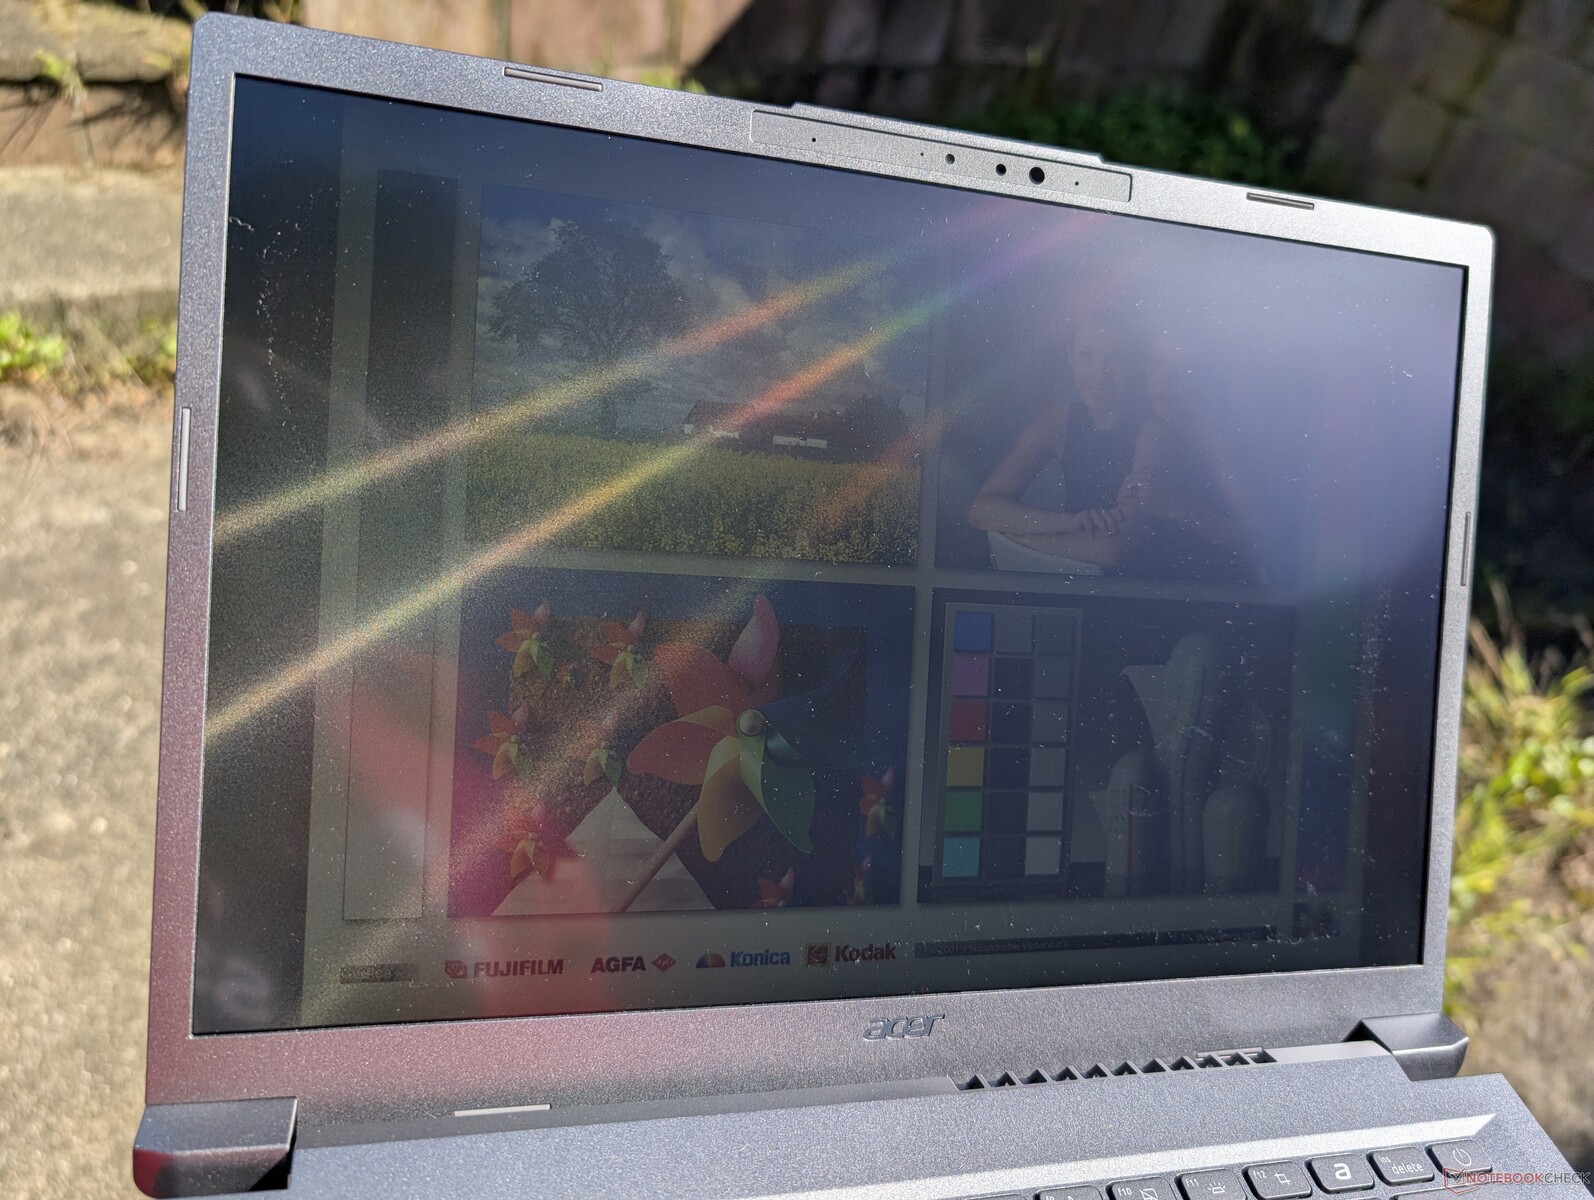
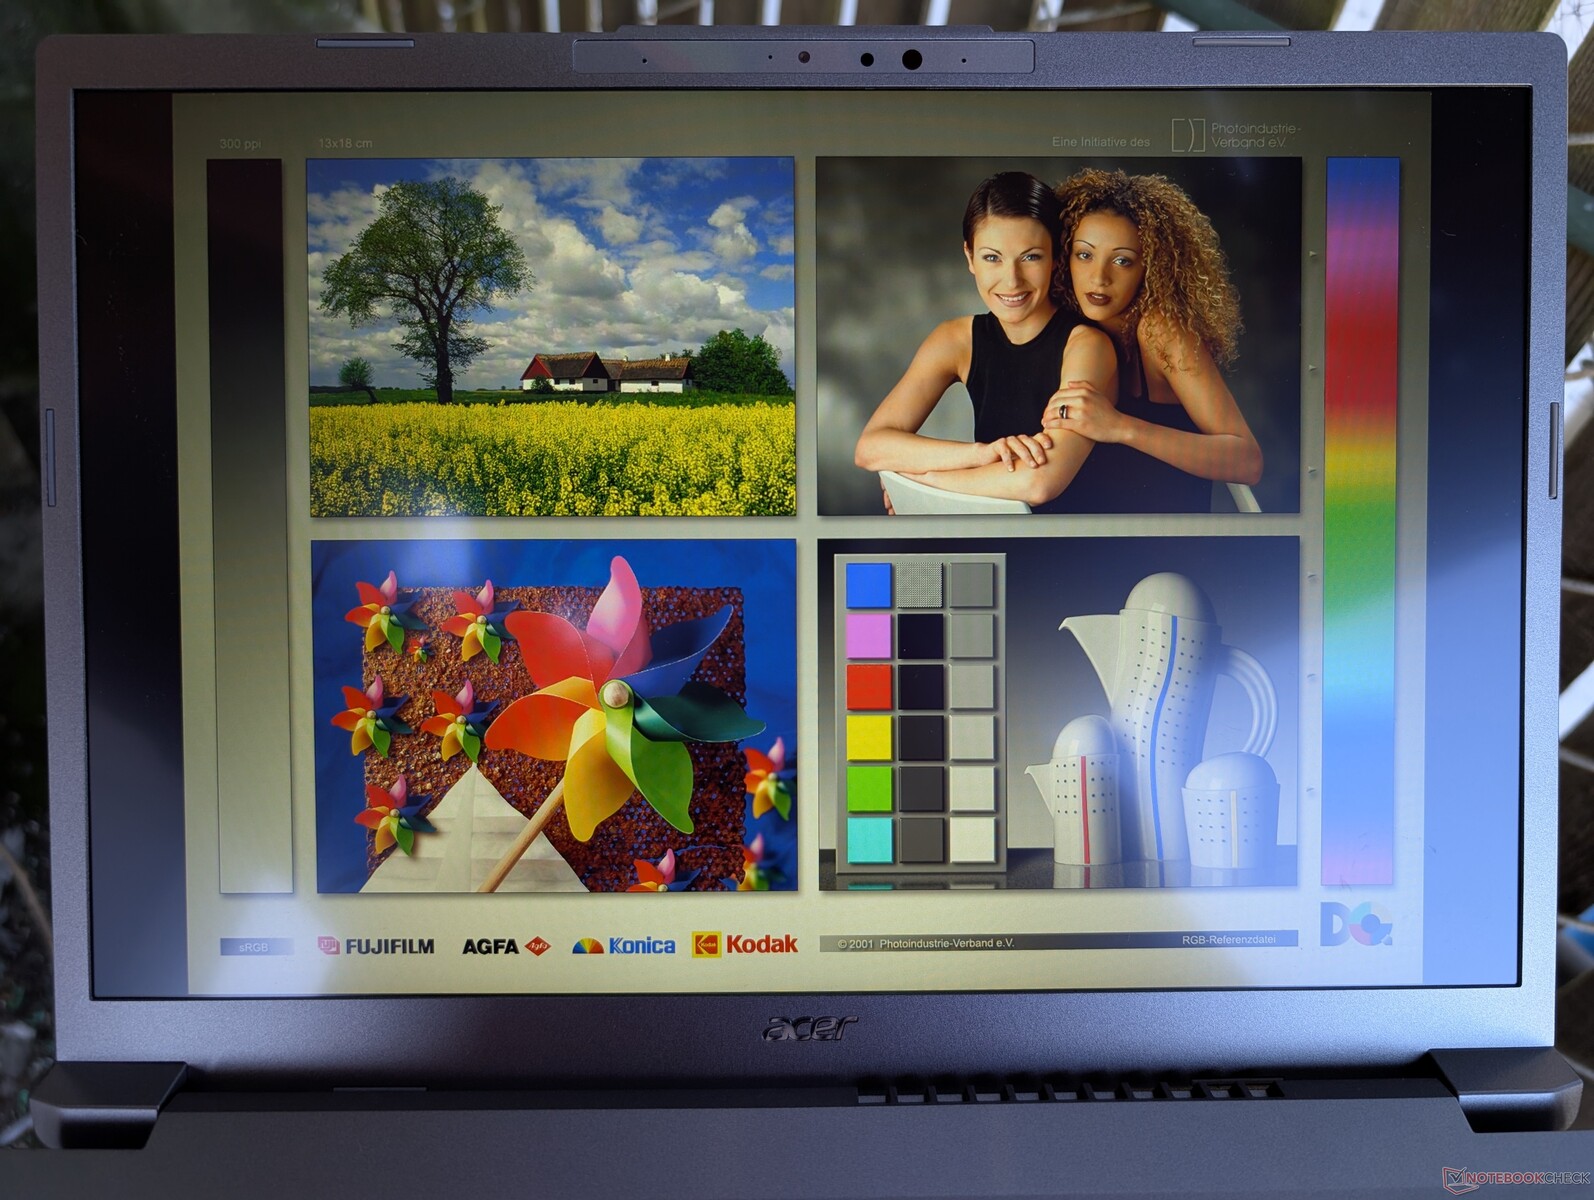
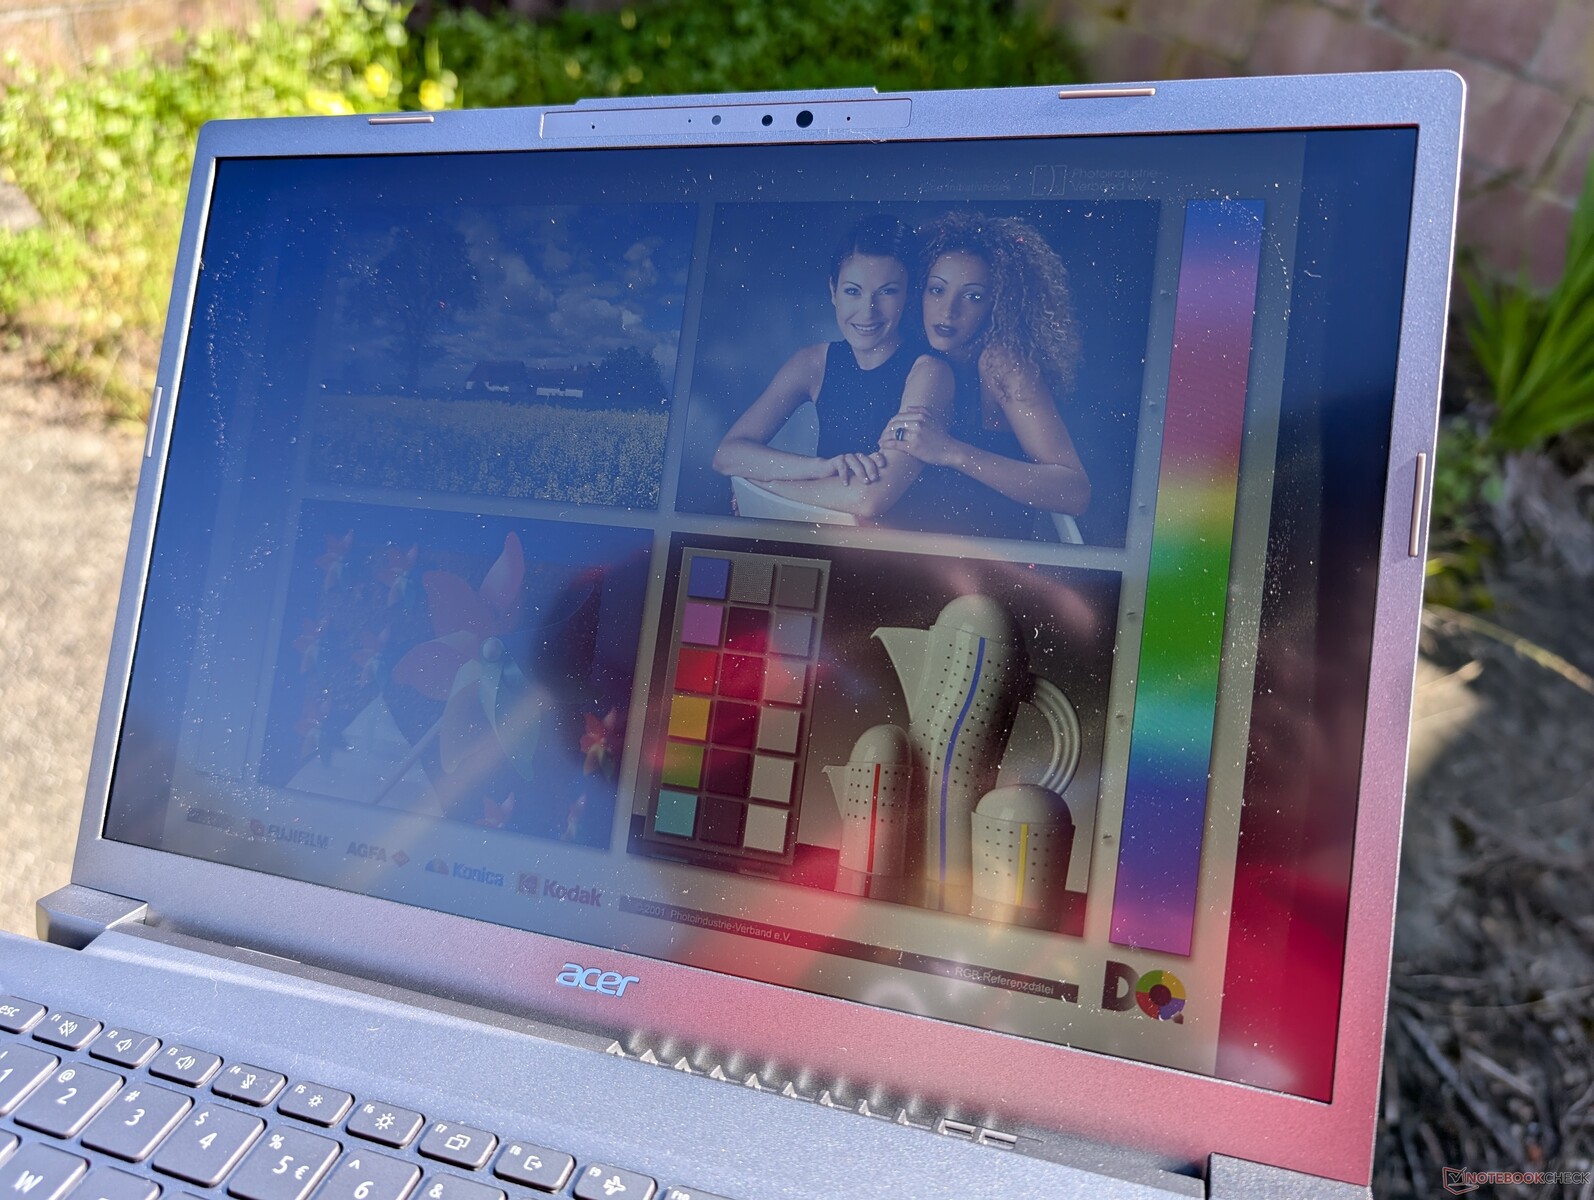
由于 300 尼特的亮度有限,室外能见度最多只能算一般。
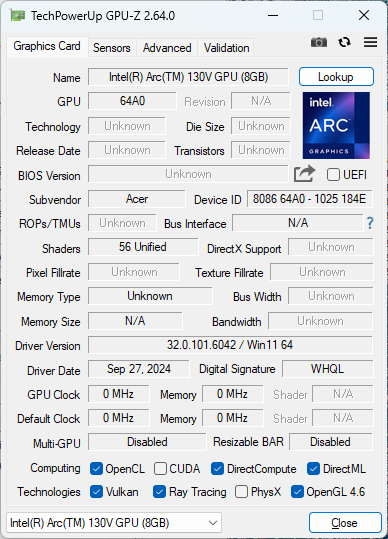
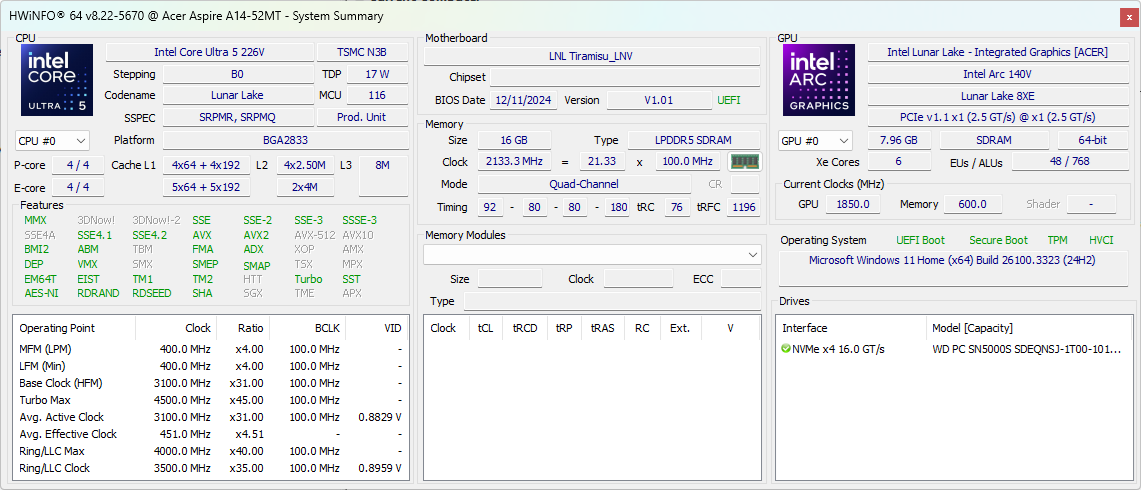
性能 - 高效 Lunar Lake 处理器
测试条件
在运行以下基准测试之前,我们将 Windows 设置为性能模式。
处理器
核心 Core Ultra 5 226V相比,性能优势微乎其微 酷睿 i7-1355U的性能优势微乎其微。它的优势在于集成 NPU、更快的集成 GPU 和更省电的嵌入式 RAM。
根据我们使用HP OmniBook Ultra Flip 14 的情况,升级到Core Ultra 7 258V 配置预计只能将处理器性能略微提高 5%至 10%。
Cinebench R15 Multi Loop
Cinebench R23: Multi Core | Single Core
Cinebench R20: CPU (Multi Core) | CPU (Single Core)
Cinebench R15: CPU Multi 64Bit | CPU Single 64Bit
Blender: v2.79 BMW27 CPU
7-Zip 18.03: 7z b 4 | 7z b 4 -mmt1
Geekbench 6.4: Multi-Core | Single-Core
Geekbench 5.5: Multi-Core | Single-Core
HWBOT x265 Benchmark v2.2: 4k Preset
LibreOffice : 20 Documents To PDF
R Benchmark 2.5: Overall mean
* ... smaller is better
AIDA64: FP32 Ray-Trace | FPU Julia | CPU SHA3 | CPU Queen | FPU SinJulia | FPU Mandel | CPU AES | CPU ZLib | FP64 Ray-Trace | CPU PhotoWorxx
| Performance Rating | |
| Lenovo IdeaPad Slim 3 14 AHP G10 | |
| Dell Inspiron 14 Plus 7440 | |
| Acer Swift 14 AI SF14-51-58TU | |
| Asus Vivobook S 14 OLED S5406SA | |
| Average Intel Core Ultra 5 226V | |
| Acer Aspire 14 AI N24Q14 | |
| HP Pavilion Plus 14-ew0153TU | |
| AIDA64 / FP32 Ray-Trace | |
| Lenovo IdeaPad Slim 3 14 AHP G10 | |
| Dell Inspiron 14 Plus 7440 | |
| Asus Vivobook S 14 OLED S5406SA | |
| Average Intel Core Ultra 5 226V (11849 - 12147, n=4) | |
| Acer Swift 14 AI SF14-51-58TU | |
| Acer Aspire 14 AI N24Q14 | |
| HP Pavilion Plus 14-ew0153TU | |
| AIDA64 / FPU Julia | |
| Lenovo IdeaPad Slim 3 14 AHP G10 | |
| Dell Inspiron 14 Plus 7440 | |
| Acer Swift 14 AI SF14-51-58TU | |
| Asus Vivobook S 14 OLED S5406SA | |
| Average Intel Core Ultra 5 226V (59169 - 60179, n=4) | |
| Acer Aspire 14 AI N24Q14 | |
| HP Pavilion Plus 14-ew0153TU | |
| AIDA64 / CPU SHA3 | |
| Lenovo IdeaPad Slim 3 14 AHP G10 | |
| Dell Inspiron 14 Plus 7440 | |
| Acer Swift 14 AI SF14-51-58TU | |
| Average Intel Core Ultra 5 226V (2551 - 2570, n=4) | |
| Asus Vivobook S 14 OLED S5406SA | |
| Acer Aspire 14 AI N24Q14 | |
| HP Pavilion Plus 14-ew0153TU | |
| AIDA64 / CPU Queen | |
| Lenovo IdeaPad Slim 3 14 AHP G10 | |
| Dell Inspiron 14 Plus 7440 | |
| HP Pavilion Plus 14-ew0153TU | |
| Acer Swift 14 AI SF14-51-58TU | |
| Acer Aspire 14 AI N24Q14 | |
| Average Intel Core Ultra 5 226V (46991 - 47087, n=4) | |
| Asus Vivobook S 14 OLED S5406SA | |
| AIDA64 / FPU SinJulia | |
| Lenovo IdeaPad Slim 3 14 AHP G10 | |
| Dell Inspiron 14 Plus 7440 | |
| HP Pavilion Plus 14-ew0153TU | |
| Asus Vivobook S 14 OLED S5406SA | |
| Average Intel Core Ultra 5 226V (3909 - 3918, n=4) | |
| Acer Swift 14 AI SF14-51-58TU | |
| Acer Aspire 14 AI N24Q14 | |
| AIDA64 / FPU Mandel | |
| Lenovo IdeaPad Slim 3 14 AHP G10 | |
| Asus Vivobook S 14 OLED S5406SA | |
| Acer Swift 14 AI SF14-51-58TU | |
| Average Intel Core Ultra 5 226V (31207 - 32239, n=4) | |
| Dell Inspiron 14 Plus 7440 | |
| Acer Aspire 14 AI N24Q14 | |
| HP Pavilion Plus 14-ew0153TU | |
| AIDA64 / CPU AES | |
| Lenovo IdeaPad Slim 3 14 AHP G10 | |
| Dell Inspiron 14 Plus 7440 | |
| Acer Swift 14 AI SF14-51-58TU | |
| Average Intel Core Ultra 5 226V (34159 - 36373, n=4) | |
| Acer Aspire 14 AI N24Q14 | |
| Asus Vivobook S 14 OLED S5406SA | |
| HP Pavilion Plus 14-ew0153TU | |
| AIDA64 / CPU ZLib | |
| Dell Inspiron 14 Plus 7440 | |
| Lenovo IdeaPad Slim 3 14 AHP G10 | |
| Acer Aspire 14 AI N24Q14 | |
| Asus Vivobook S 14 OLED S5406SA | |
| Average Intel Core Ultra 5 226V (539 - 572, n=4) | |
| Acer Swift 14 AI SF14-51-58TU | |
| HP Pavilion Plus 14-ew0153TU | |
| AIDA64 / FP64 Ray-Trace | |
| Lenovo IdeaPad Slim 3 14 AHP G10 | |
| Asus Vivobook S 14 OLED S5406SA | |
| Acer Swift 14 AI SF14-51-58TU | |
| Average Intel Core Ultra 5 226V (6477 - 6673, n=4) | |
| Dell Inspiron 14 Plus 7440 | |
| Acer Aspire 14 AI N24Q14 | |
| HP Pavilion Plus 14-ew0153TU | |
| AIDA64 / CPU PhotoWorxx | |
| Acer Swift 14 AI SF14-51-58TU | |
| Asus Vivobook S 14 OLED S5406SA | |
| Average Intel Core Ultra 5 226V (50038 - 50232, n=4) | |
| Acer Aspire 14 AI N24Q14 | |
| Dell Inspiron 14 Plus 7440 | |
| HP Pavilion Plus 14-ew0153TU | |
| Lenovo IdeaPad Slim 3 14 AHP G10 | |
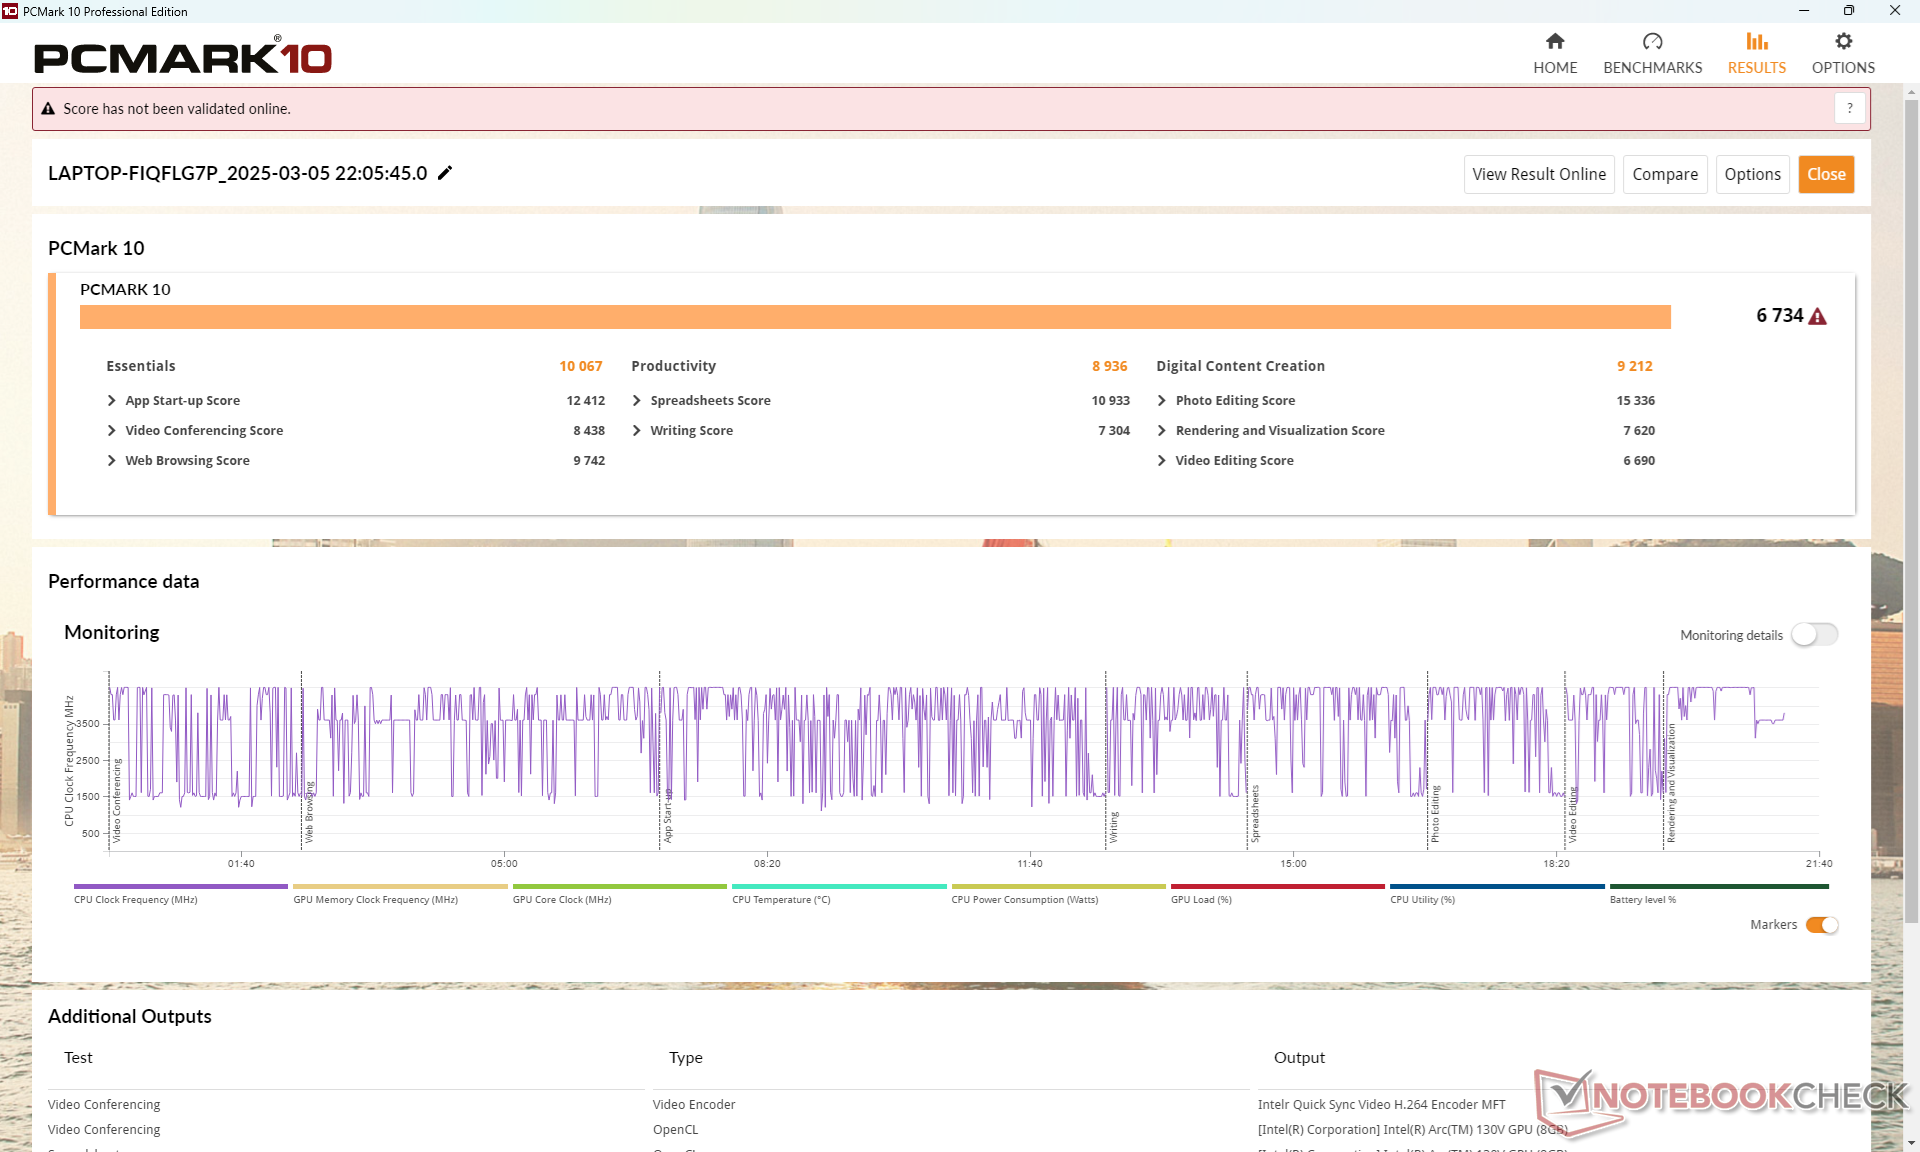
系统性能
PCMark 分数与 戴尔 Inspiron 14 Plus 7440在要求更高的 Ultra 7 155H 上运行。内存性能也相当快,这也是 Lunar Lake 设计所期望的。
CrossMark: Overall | Productivity | Creativity | Responsiveness
WebXPRT 3: Overall
WebXPRT 4: Overall
Mozilla Kraken 1.1: Total
| PCMark 10 / Score | |
| Asus VivoBook S 14 OLED M5406WA | |
| Lenovo IdeaPad Slim 3 14 AHP G10 | |
| Acer Aspire 14 AI N24Q14 | |
| Dell Inspiron 14 Plus 7440 | |
| Average Intel Core Ultra 5 226V, Intel Arc Graphics 130V (6445 - 6734, n=4) | |
| Acer Swift 14 AI SF14-51-58TU | |
| HP Pavilion Plus 14-ew0153TU | |
| PCMark 10 / Essentials | |
| Asus VivoBook S 14 OLED M5406WA | |
| HP Pavilion Plus 14-ew0153TU | |
| Lenovo IdeaPad Slim 3 14 AHP G10 | |
| Dell Inspiron 14 Plus 7440 | |
| Acer Aspire 14 AI N24Q14 | |
| Average Intel Core Ultra 5 226V, Intel Arc Graphics 130V (9363 - 10067, n=4) | |
| Acer Swift 14 AI SF14-51-58TU | |
| PCMark 10 / Productivity | |
| Asus VivoBook S 14 OLED M5406WA | |
| Lenovo IdeaPad Slim 3 14 AHP G10 | |
| Acer Aspire 14 AI N24Q14 | |
| Average Intel Core Ultra 5 226V, Intel Arc Graphics 130V (8457 - 8977, n=4) | |
| Dell Inspiron 14 Plus 7440 | |
| Acer Swift 14 AI SF14-51-58TU | |
| HP Pavilion Plus 14-ew0153TU | |
| PCMark 10 / Digital Content Creation | |
| Asus VivoBook S 14 OLED M5406WA | |
| Dell Inspiron 14 Plus 7440 | |
| Acer Aspire 14 AI N24Q14 | |
| Average Intel Core Ultra 5 226V, Intel Arc Graphics 130V (8983 - 9239, n=4) | |
| Acer Swift 14 AI SF14-51-58TU | |
| Lenovo IdeaPad Slim 3 14 AHP G10 | |
| HP Pavilion Plus 14-ew0153TU | |
| CrossMark / Overall | |
| Dell Inspiron 14 Plus 7440 | |
| Lenovo IdeaPad Slim 3 14 AHP G10 | |
| Average Intel Core Ultra 5 226V, Intel Arc Graphics 130V (1555 - 1582, n=3) | |
| Acer Aspire 14 AI N24Q14 | |
| HP Pavilion Plus 14-ew0153TU | |
| CrossMark / Productivity | |
| Lenovo IdeaPad Slim 3 14 AHP G10 | |
| Dell Inspiron 14 Plus 7440 | |
| HP Pavilion Plus 14-ew0153TU | |
| Average Intel Core Ultra 5 226V, Intel Arc Graphics 130V (1517 - 1539, n=3) | |
| Acer Aspire 14 AI N24Q14 | |
| CrossMark / Creativity | |
| Dell Inspiron 14 Plus 7440 | |
| Lenovo IdeaPad Slim 3 14 AHP G10 | |
| Average Intel Core Ultra 5 226V, Intel Arc Graphics 130V (1720 - 1740, n=3) | |
| Acer Aspire 14 AI N24Q14 | |
| HP Pavilion Plus 14-ew0153TU | |
| CrossMark / Responsiveness | |
| Lenovo IdeaPad Slim 3 14 AHP G10 | |
| Dell Inspiron 14 Plus 7440 | |
| HP Pavilion Plus 14-ew0153TU | |
| Average Intel Core Ultra 5 226V, Intel Arc Graphics 130V (1225 - 1289, n=3) | |
| Acer Aspire 14 AI N24Q14 | |
| WebXPRT 3 / Overall | |
| Lenovo IdeaPad Slim 3 14 AHP G10 | |
| Dell Inspiron 14 Plus 7440 | |
| Acer Aspire 14 AI N24Q14 | |
| Average Intel Core Ultra 5 226V, Intel Arc Graphics 130V (272 - 286, n=3) | |
| HP Pavilion Plus 14-ew0153TU | |
| WebXPRT 4 / Overall | |
| Acer Aspire 14 AI N24Q14 | |
| Acer Aspire 14 AI N24Q14 | |
| Asus VivoBook S 14 OLED M5406WA | |
| Average Intel Core Ultra 5 226V, Intel Arc Graphics 130V (249 - 266, n=6) | |
| Dell Inspiron 14 Plus 7440 | |
| HP Pavilion Plus 14-ew0153TU | |
| Lenovo IdeaPad Slim 3 14 AHP G10 | |
| Acer Swift 14 AI SF14-51-58TU | |
| Acer Swift 14 AI SF14-51-58TU | |
| Mozilla Kraken 1.1 / Total | |
| Acer Swift 14 AI SF14-51-58TU | |
| Acer Swift 14 AI SF14-51-58TU | |
| Lenovo IdeaPad Slim 3 14 AHP G10 | |
| Dell Inspiron 14 Plus 7440 | |
| Average Intel Core Ultra 5 226V, Intel Arc Graphics 130V (507 - 543, n=5) | |
| HP Pavilion Plus 14-ew0153TU | |
| Acer Aspire 14 AI N24Q14 | |
| Asus VivoBook S 14 OLED M5406WA | |
| Asus VivoBook S 14 OLED M5406WA | |
* ... smaller is better
| PCMark 10 Score | 6734 points | |
Help | ||
| AIDA64 / Memory Copy | |
| Acer Aspire 14 AI N24Q14 | |
| Average Intel Core Ultra 5 226V (99512 - 100584, n=4) | |
| Acer Swift 14 AI SF14-51-58TU | |
| Asus VivoBook S 14 OLED M5406WA | |
| Dell Inspiron 14 Plus 7440 | |
| Lenovo IdeaPad Slim 3 14 AHP G10 | |
| HP Pavilion Plus 14-ew0153TU | |
| AIDA64 / Memory Read | |
| Asus VivoBook S 14 OLED M5406WA | |
| Acer Aspire 14 AI N24Q14 | |
| Average Intel Core Ultra 5 226V (83885 - 84864, n=4) | |
| Acer Swift 14 AI SF14-51-58TU | |
| Dell Inspiron 14 Plus 7440 | |
| Lenovo IdeaPad Slim 3 14 AHP G10 | |
| HP Pavilion Plus 14-ew0153TU | |
| AIDA64 / Memory Write | |
| Acer Aspire 14 AI N24Q14 | |
| Acer Swift 14 AI SF14-51-58TU | |
| Average Intel Core Ultra 5 226V (106434 - 111517, n=4) | |
| Asus VivoBook S 14 OLED M5406WA | |
| Lenovo IdeaPad Slim 3 14 AHP G10 | |
| HP Pavilion Plus 14-ew0153TU | |
| Dell Inspiron 14 Plus 7440 | |
| AIDA64 / Memory Latency | |
| Dell Inspiron 14 Plus 7440 | |
| Asus VivoBook S 14 OLED M5406WA | |
| HP Pavilion Plus 14-ew0153TU | |
| Acer Aspire 14 AI N24Q14 | |
| Average Intel Core Ultra 5 226V (91.1 - 95.6, n=4) | |
| Acer Swift 14 AI SF14-51-58TU | |
| Lenovo IdeaPad Slim 3 14 AHP G10 | |
* ... smaller is better
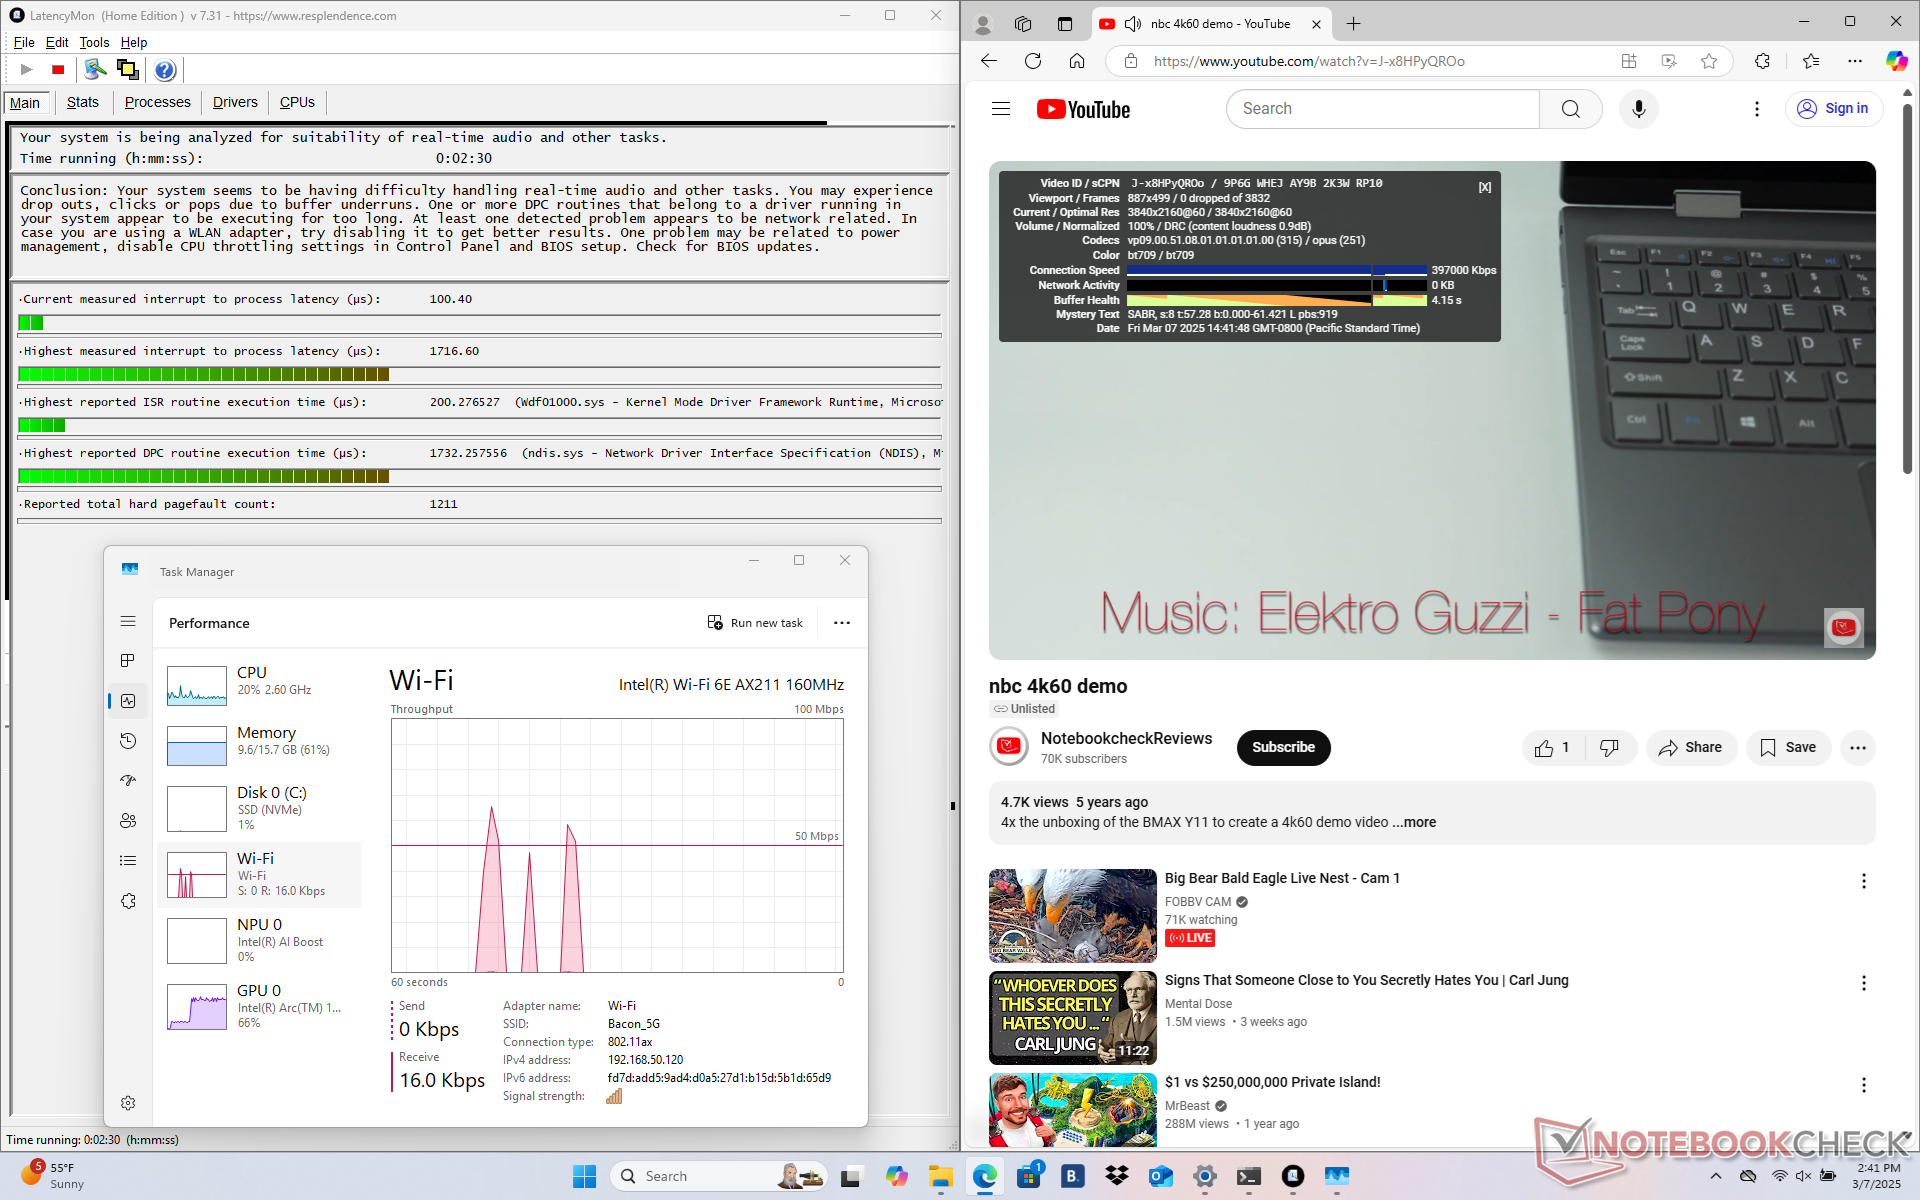
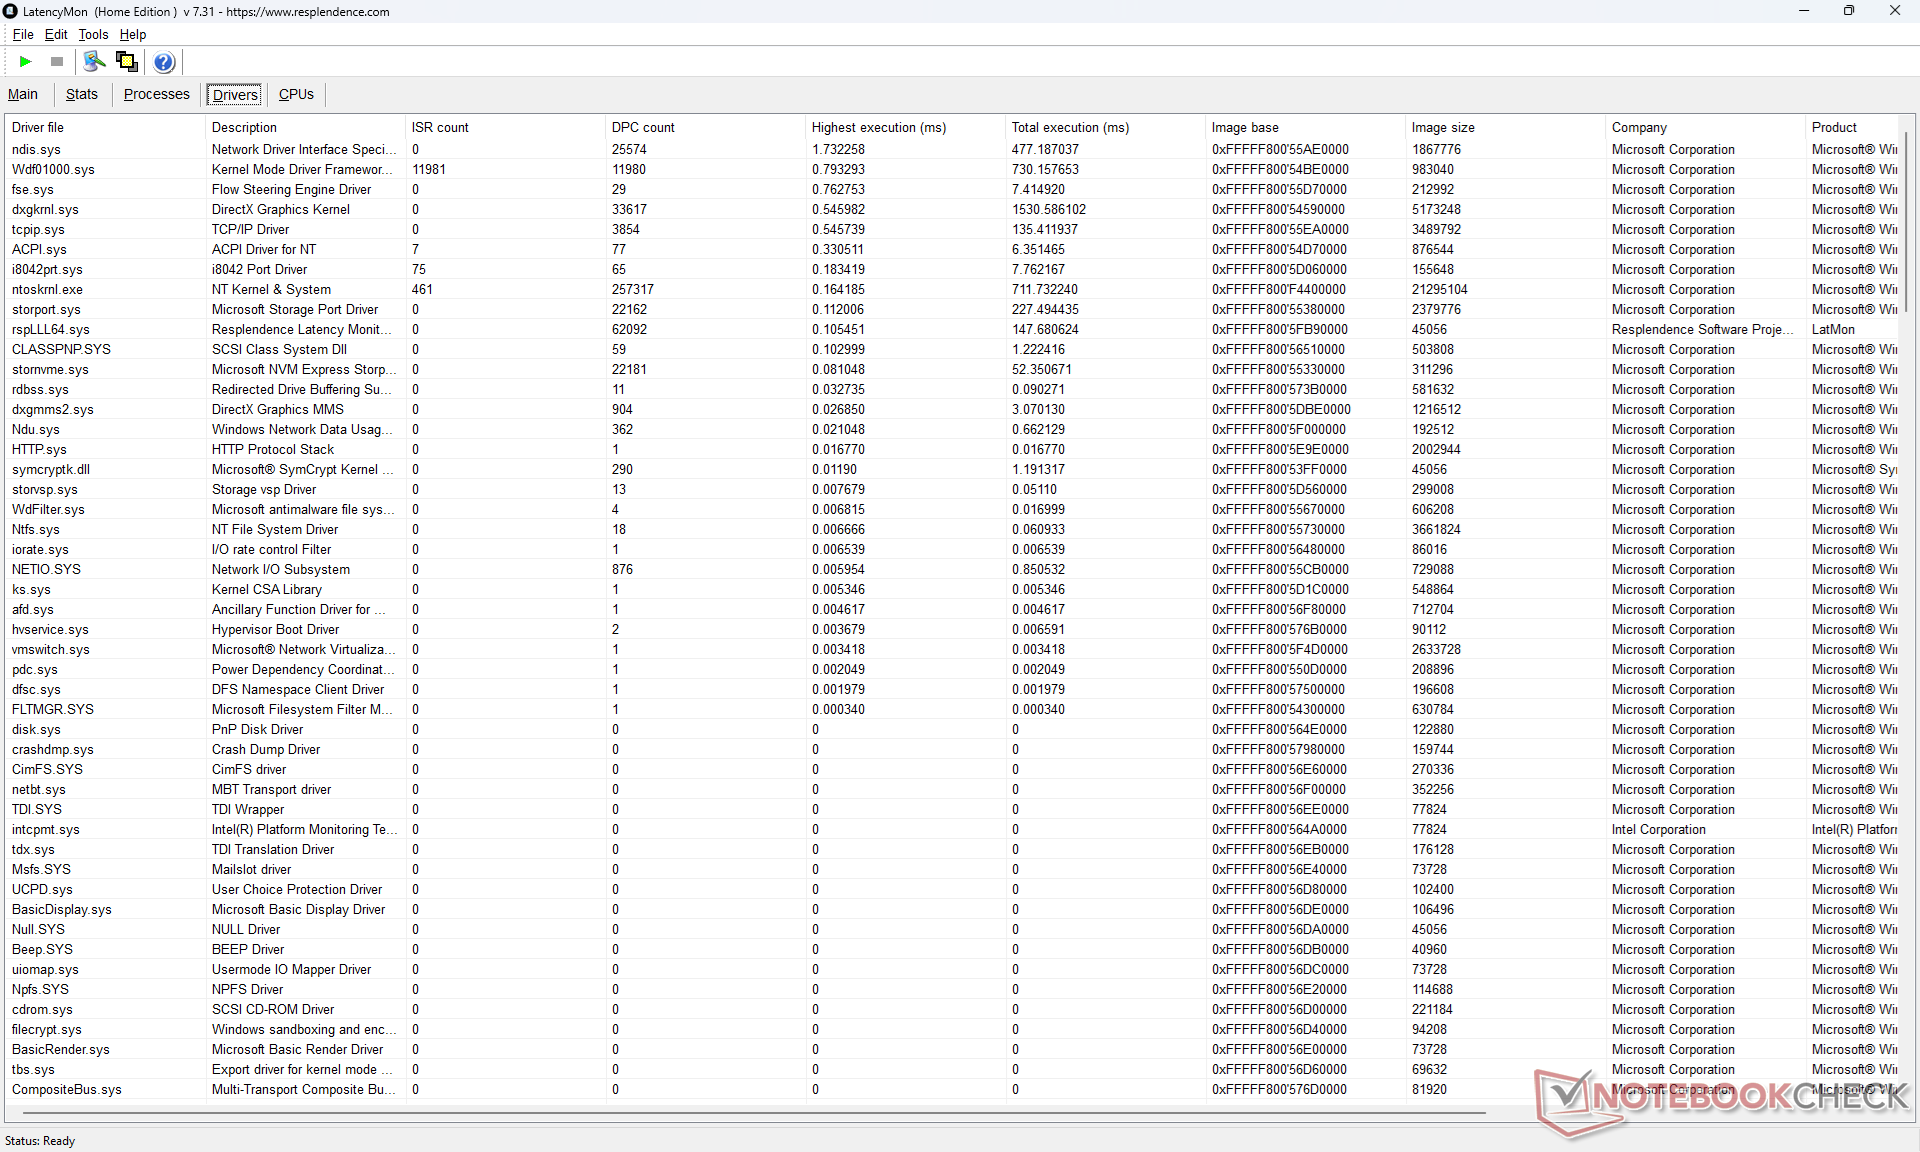
DPC 延迟
LatencyMon 显示,在打开我们主页的多个浏览器标签页时会出现轻微的 DPC 问题,但在播放 4K60 视频时不会出现掉帧现象。
| DPC Latencies / LatencyMon - interrupt to process latency (max), Web, Youtube, Prime95 | |
| Dell Inspiron 14 Plus 7440 | |
| HP Pavilion Plus 14-ew0153TU | |
| Acer Aspire 14 AI N24Q14 | |
| Acer Swift 14 AI SF14-51-58TU | |
| Lenovo IdeaPad Slim 3 14 AHP G10 | |
| Asus Vivobook S 14 OLED S5406SA | |
* ... smaller is better
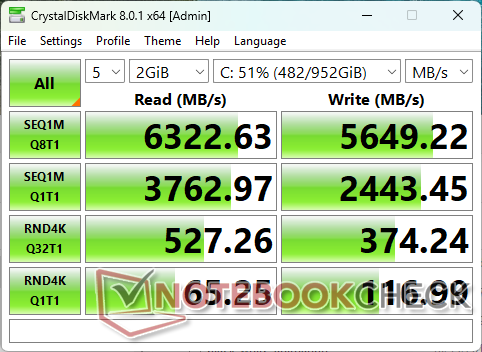
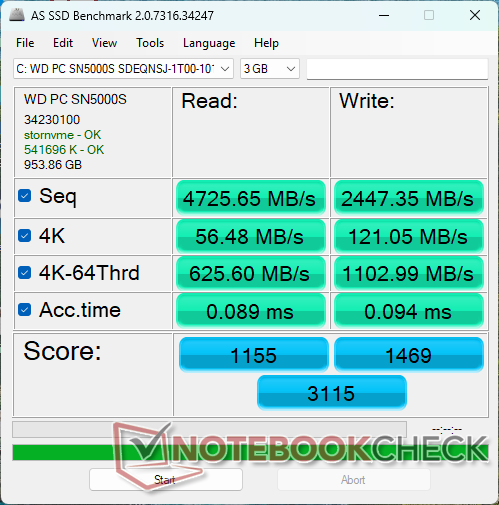
存储设备
WD SN5000S WD SN5000S在我们的测试设备中,它的速度最高可达 6400 MB/s,但只持续了几分钟,然后就降到了 5000 MB/s。尽管如此,它仍然略胜于 Swift 14 AI 中的 Micron 2550。

* ... smaller is better
Disk Throttling: DiskSpd Read Loop, Queue Depth 8
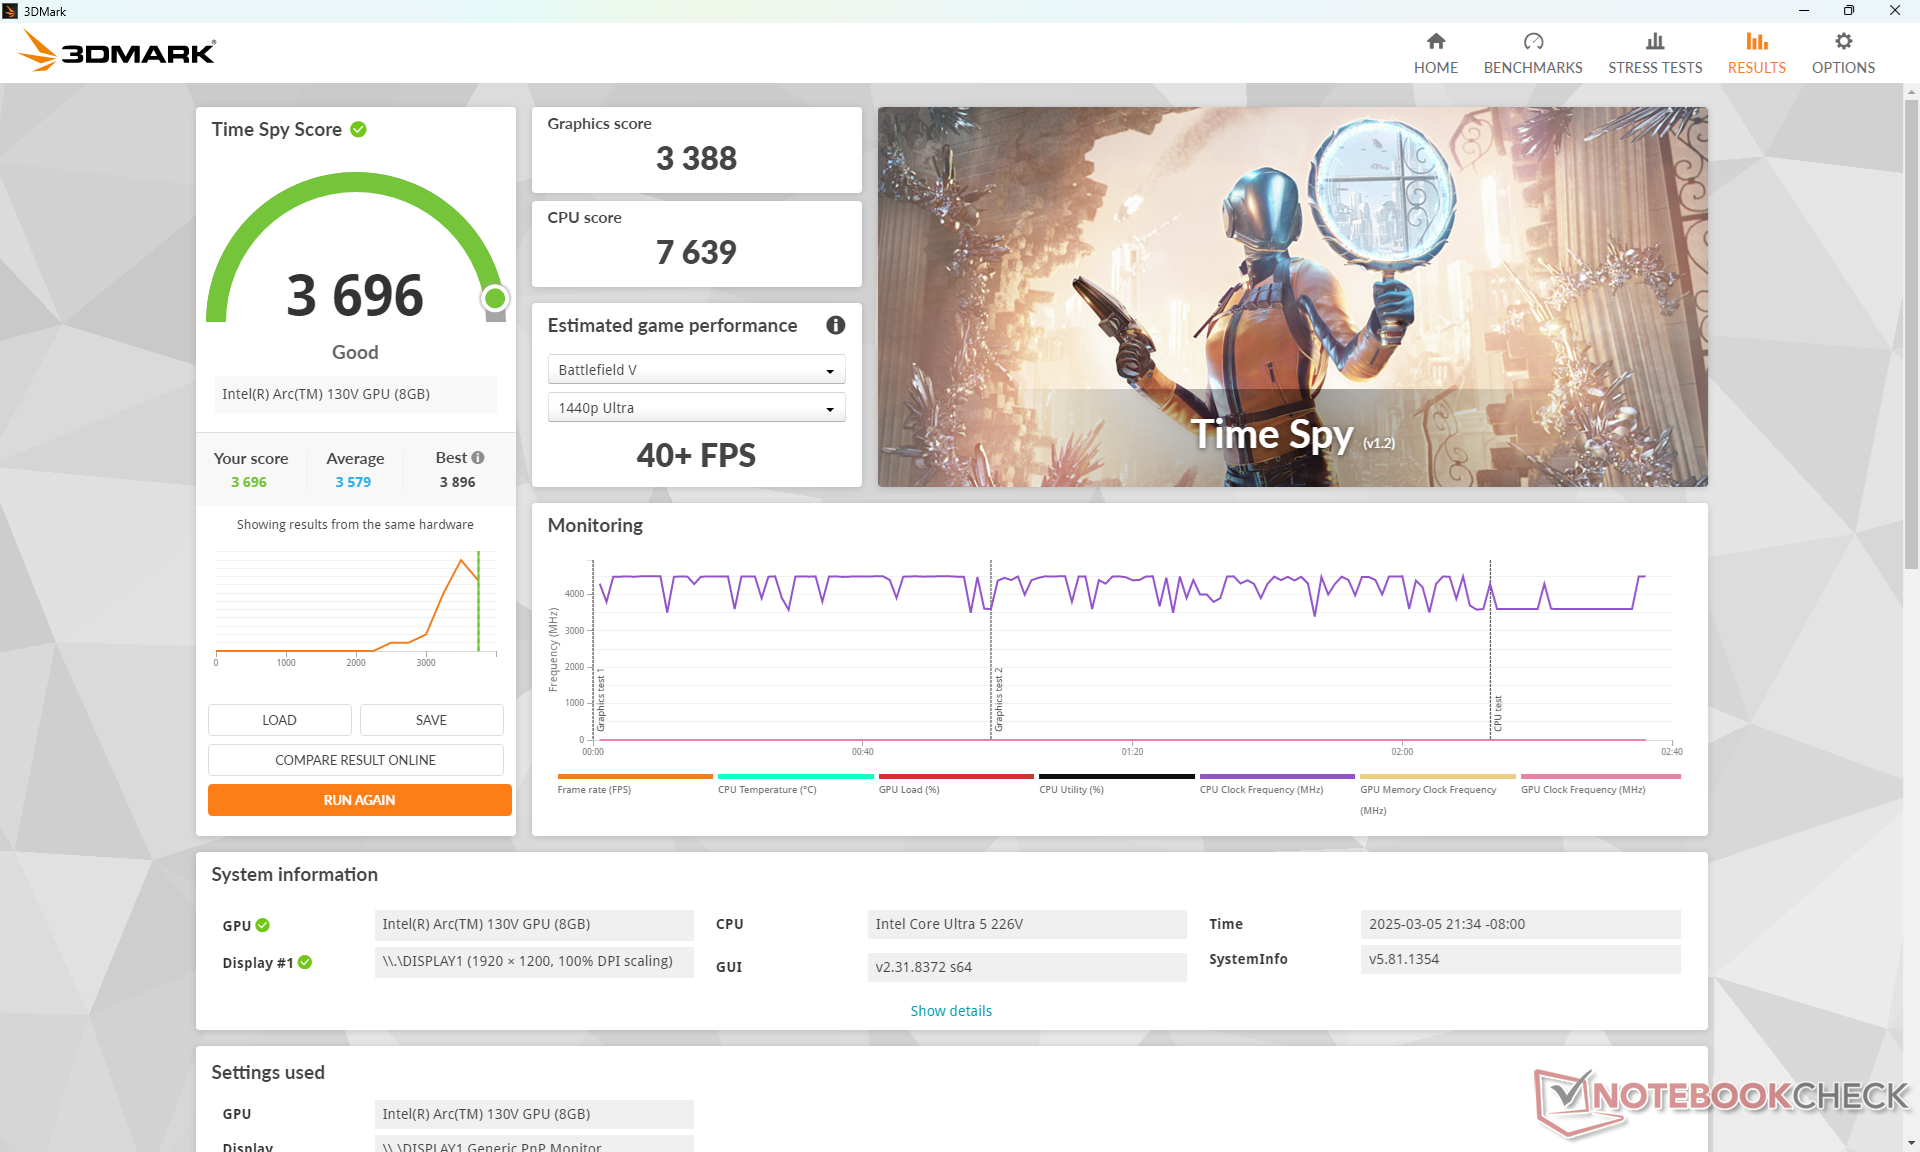
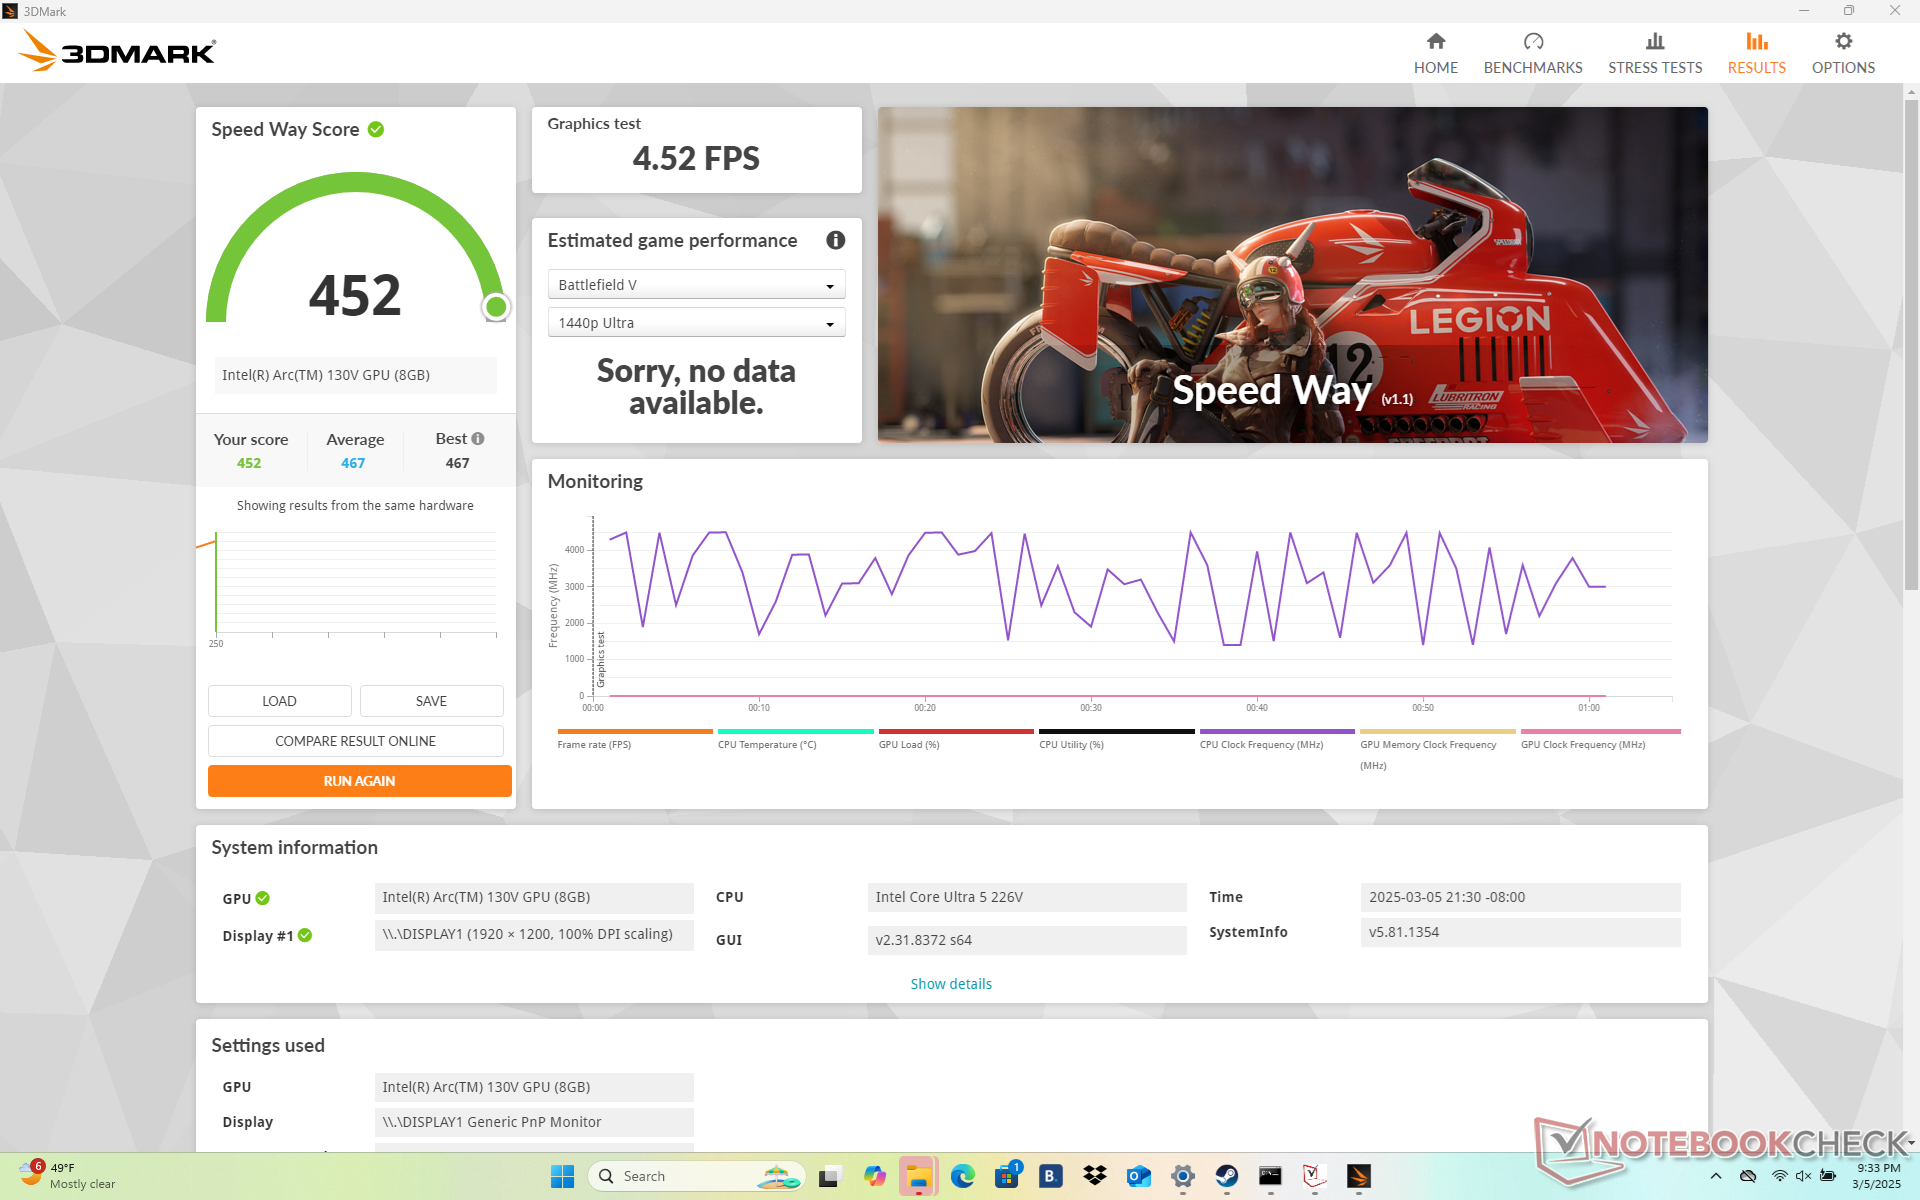
图形处理器性能
我们的集成 弧 130V 比 Arc 140V 慢 10%至 15%。 Arc 140V在酷睿 Ultra 7 配置中比 Arc 140V 慢约 15%,与去年的 Arc 8.即便如此,它仍然比常见的 Iris Xe Graphics G7 96EU在支持 DX12 的游戏中大约快 2 倍。
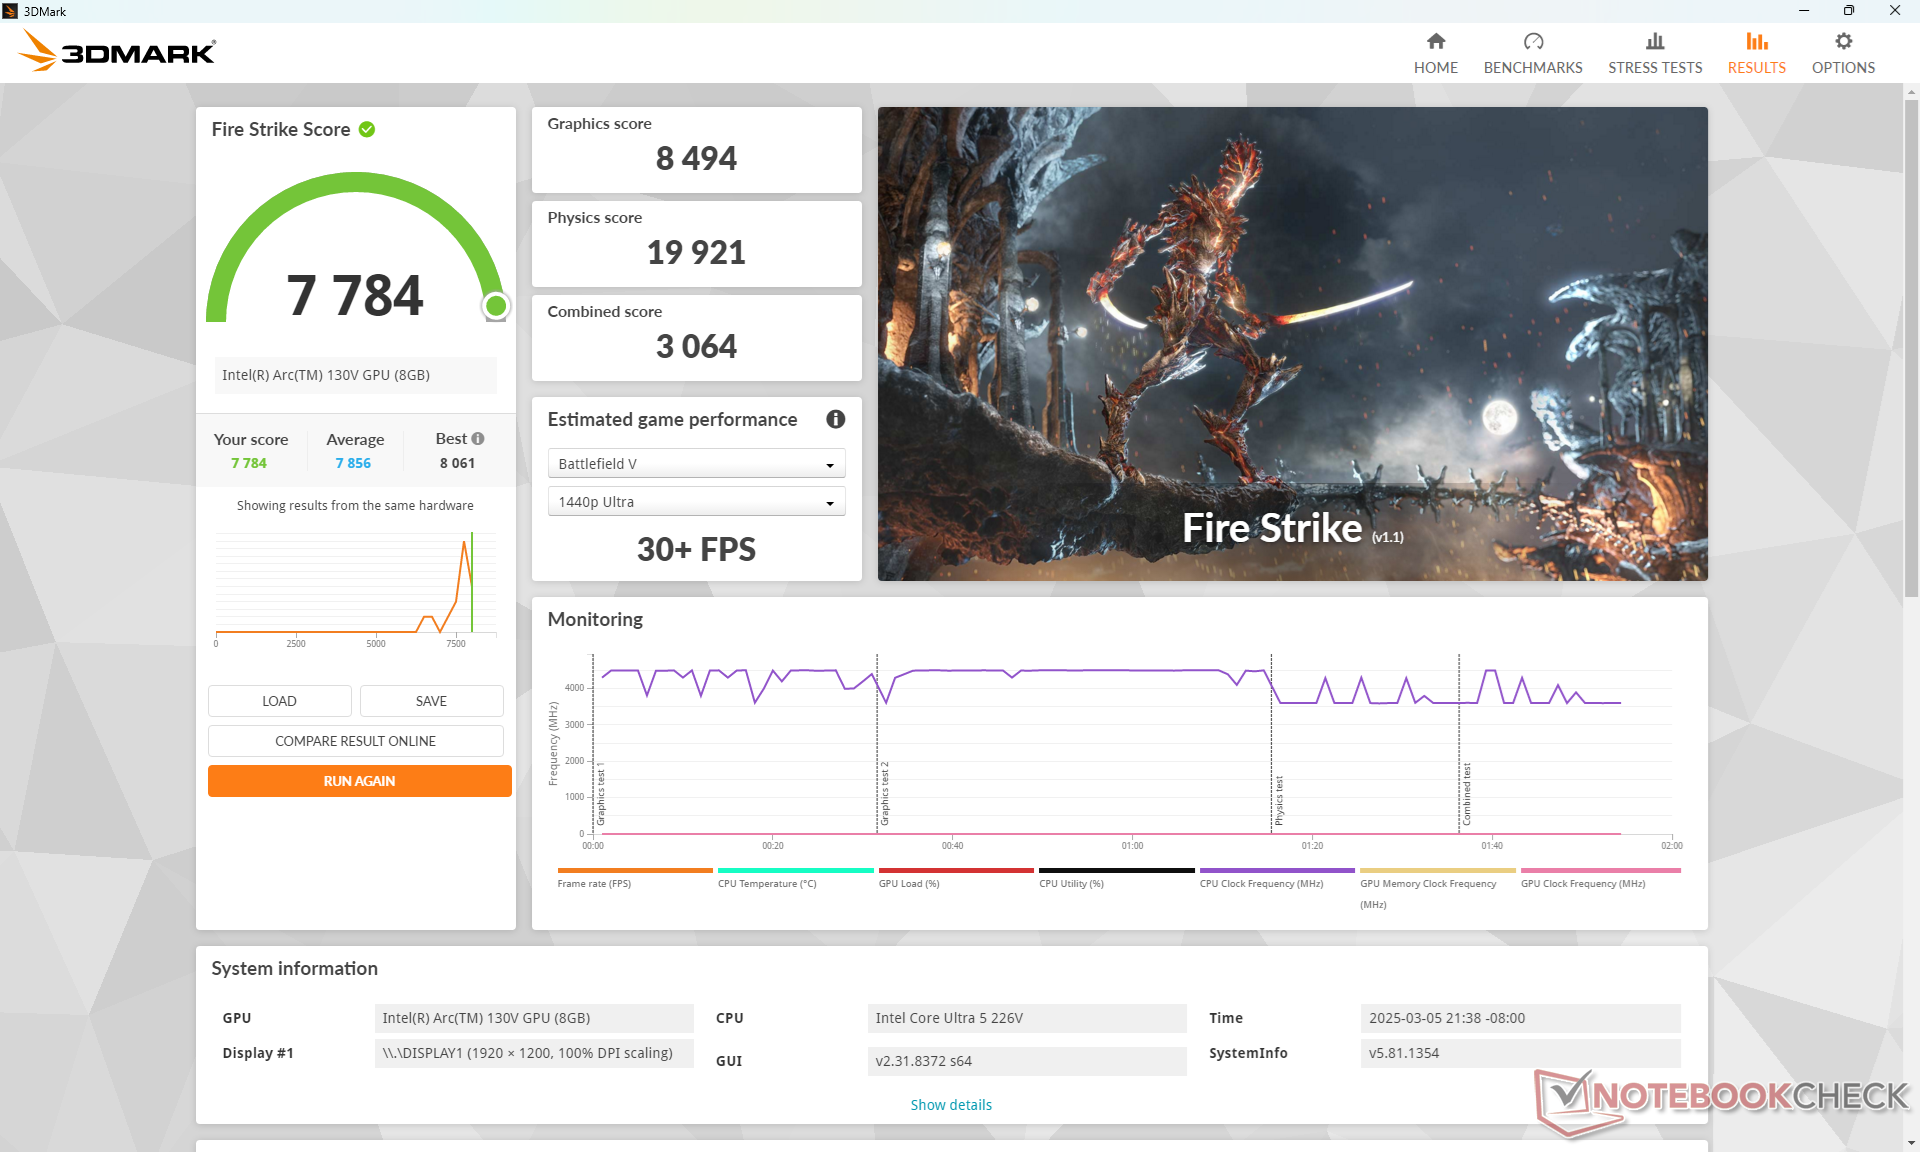
| 电源配置文件 | 图形得分 | 物理得分 | 综合得分 |
| 性能模式 | 8494 | 19921 | 3064 |
| 均衡模式 | 8622 | 19892 | 3075 |
| 电池供电 | 8467 | 19877 | 3150 |
如Fire Strike 上表所示,不同功率配置文件的性能水平最多只有微小差别。
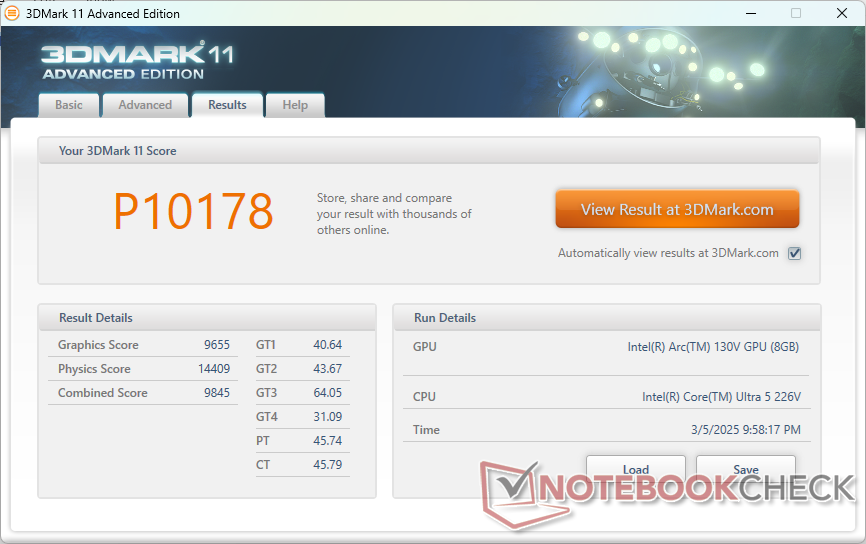
| 3DMark 11 Performance | 10178 points | |
| 3DMark Cloud Gate Standard Score | 31095 points | |
| 3DMark Fire Strike Score | 7784 points | |
| 3DMark Time Spy Score | 3696 points | |
Help | ||
* ... smaller is better
| F1 22 | |
| 1280x720 Ultra Low Preset AA:T AF:16x | |
| HP OmniBook Ultra Flip 14 | |
| Acer Aspire 14 AI N24Q14 | |
| Average Intel Arc Graphics 130V (n=1) | |
| Dell Inspiron 14 Plus 7440 | |
| HP Pavilion Plus 14-ew0153TU | |
| 1920x1080 Low Preset AA:T AF:16x | |
| HP OmniBook Ultra Flip 14 | |
| Acer Aspire 14 AI N24Q14 | |
| Average Intel Arc Graphics 130V (n=1) | |
| Dell Inspiron 14 Plus 7440 | |
| HP Pavilion Plus 14-ew0153TU | |
| 1920x1080 Medium Preset AA:T AF:16x | |
| HP OmniBook Ultra Flip 14 | |
| Acer Aspire 14 AI N24Q14 | |
| Average Intel Arc Graphics 130V (n=1) | |
| Dell Inspiron 14 Plus 7440 | |
| HP Pavilion Plus 14-ew0153TU | |
| 1920x1080 High Preset AA:T AF:16x | |
| HP OmniBook Ultra Flip 14 | |
| Acer Aspire 14 AI N24Q14 | |
| Average Intel Arc Graphics 130V (n=1) | |
| HP Pavilion Plus 14-ew0153TU | |
| 1920x1080 Ultra High Preset AA:T AF:16x | |
| HP OmniBook Ultra Flip 14 | |
| HP Pavilion Plus 14-ew0153TU | |
| Acer Aspire 14 AI N24Q14 | |
| Average Intel Arc Graphics 130V (n=1) | |
| Tiny Tina's Wonderlands | |
| 1280x720 Lowest Preset (DX12) | |
| Acer Aspire 14 AI N24Q14 | |
| Average Intel Arc Graphics 130V (n=1) | |
| HP OmniBook Ultra Flip 14 | |
| Dell Inspiron 14 Plus 7440 | |
| 1920x1080 Low Preset (DX12) | |
| HP OmniBook Ultra Flip 14 | |
| Acer Aspire 14 AI N24Q14 | |
| Average Intel Arc Graphics 130V (n=1) | |
| Dell Inspiron 14 Plus 7440 | |
| 1920x1080 Medium Preset (DX12) | |
| HP OmniBook Ultra Flip 14 | |
| Acer Aspire 14 AI N24Q14 | |
| Average Intel Arc Graphics 130V (n=1) | |
| Dell Inspiron 14 Plus 7440 | |
| 1920x1080 High Preset (DX12) | |
| HP OmniBook Ultra Flip 14 | |
| Acer Aspire 14 AI N24Q14 | |
| Average Intel Arc Graphics 130V (n=1) | |
| Dell Inspiron 14 Plus 7440 | |
| 1920x1080 Badass Preset (DX12) | |
| HP OmniBook Ultra Flip 14 | |
| Acer Aspire 14 AI N24Q14 | |
| Average Intel Arc Graphics 130V (n=1) | |
| Dell Inspiron 14 Plus 7440 | |
Cyberpunk 2077 ultra FPS Chart
| low | med. | high | ultra | |
|---|---|---|---|---|
| GTA V (2015) | 151.2 | 133.6 | 58.1 | 22.7 |
| Dota 2 Reborn (2015) | 90.9 | 82.8 | 78.5 | 82.9 |
| Final Fantasy XV Benchmark (2018) | 73.5 | 41.4 | 30 | |
| X-Plane 11.11 (2018) | 43.3 | 33.5 | 29.7 | |
| Far Cry 5 (2018) | 80 | 45 | 41 | 38 |
| Strange Brigade (2018) | 205 | 76.7 | 62 | 51.8 |
| Tiny Tina's Wonderlands (2022) | 61.1 | 43.6 | 27.2 | 21.2 |
| F1 22 (2022) | 91.2 | 81.3 | 59.7 | 18 |
| Baldur's Gate 3 (2023) | 27.3 | 24.6 | 23.8 | |
| Cyberpunk 2077 2.2 Phantom Liberty (2023) | 39.3 | 30.5 | 26.9 | 23.9 |
排放量
系统噪音
风扇噪音低于同类产品,尤其是使用 AMD 硬件或英特尔 H 系列 CPU 的产品。风扇加速所需的时间也更长,因此在风扇噪音变得明显之前,机器能安静运行更长时间。
Noise Level
| Idle |
| 23.7 / 23.7 / 26.2 dB(A) |
| Load |
| 33.5 / 38.3 dB(A) |
 | ||
30 dB silent 40 dB(A) audible 50 dB(A) loud |
||
min: | ||
| Acer Aspire 14 AI N24Q14 Arc 130V, Core Ultra 5 226V, Western Digital PC SN5000S SDEQNSJ-1T00 | Acer Swift 14 AI SF14-51-58TU Arc 130V, Core Ultra 5 226V, Micron 2550 512GB | Lenovo IdeaPad Slim 3 14 AHP G10 Radeon 780M, R7 8840HS, Micron 2500 MTFDKBA512QGN | Asus Vivobook S 14 OLED S5406SA Arc 130V, Core Ultra 5 226V, Micron 2500 MTFDKBA512QGN | Dell Inspiron 14 Plus 7440 Arc 8-Core, Ultra 7 155H, WD PC SN740 SDDPTQD-1T00 | HP Pavilion Plus 14-ew0153TU Iris Xe G7 96EUs, i7-1355U, SK hynix PC801 HFS001TEJ9X101N | |
|---|---|---|---|---|---|---|
| Noise | -9% | -6% | -1% | -10% | 14% | |
| off / environment * | 23.7 | 25 -5% | 24.2 -2% | 24.2 -2% | 23.6 -0% | 19.35 18% |
| Idle Minimum * | 23.7 | 25 -5% | 24.2 -2% | 24.2 -2% | 23.7 -0% | 20.57 13% |
| Idle Average * | 23.7 | 26 -10% | 24.2 -2% | 24.2 -2% | 23.7 -0% | 20.57 13% |
| Idle Maximum * | 26.2 | 29 -11% | 26.8 -2% | 24.2 8% | 27 -3% | 20.57 21% |
| Load Average * | 33.5 | 40 -19% | 40.8 -22% | 28.8 14% | 41.8 -25% | 32.18 4% |
| Cyberpunk 2077 ultra * | 37 | 40 -8% | 38 -3% | 37.6 -2% | ||
| Load Maximum * | 38.3 | 41 -7% | 40.8 -7% | 45.6 -19% | 50.7 -32% | 32.26 16% |
| Witcher 3 ultra * | 45.7 | 29.44 |
* ... smaller is better
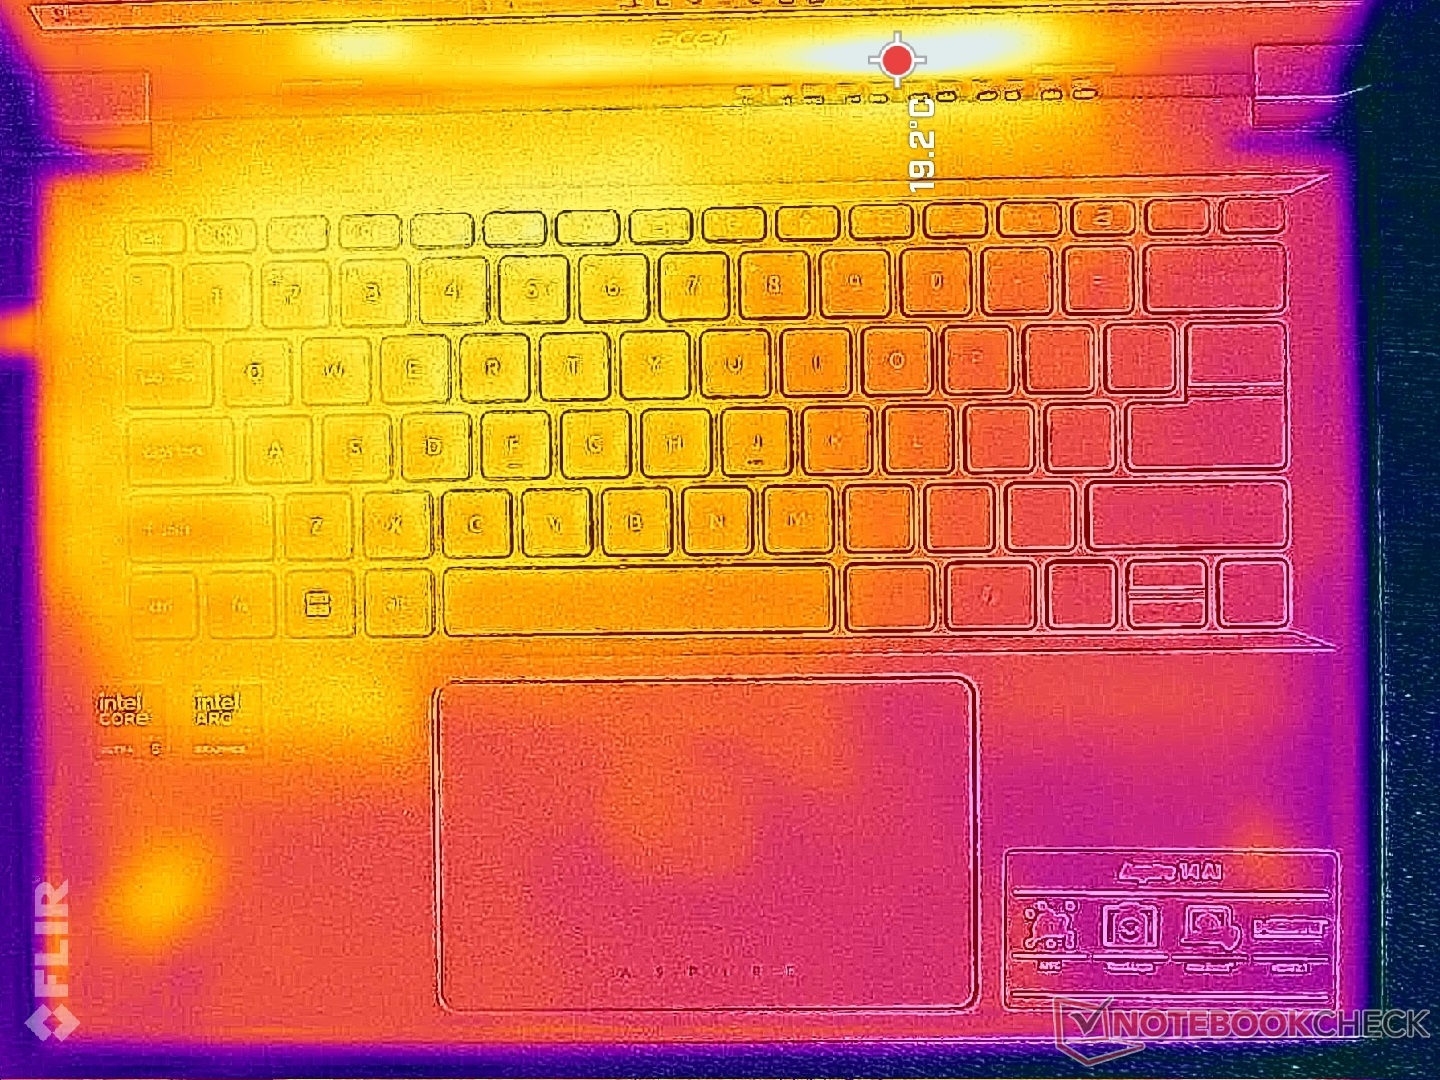
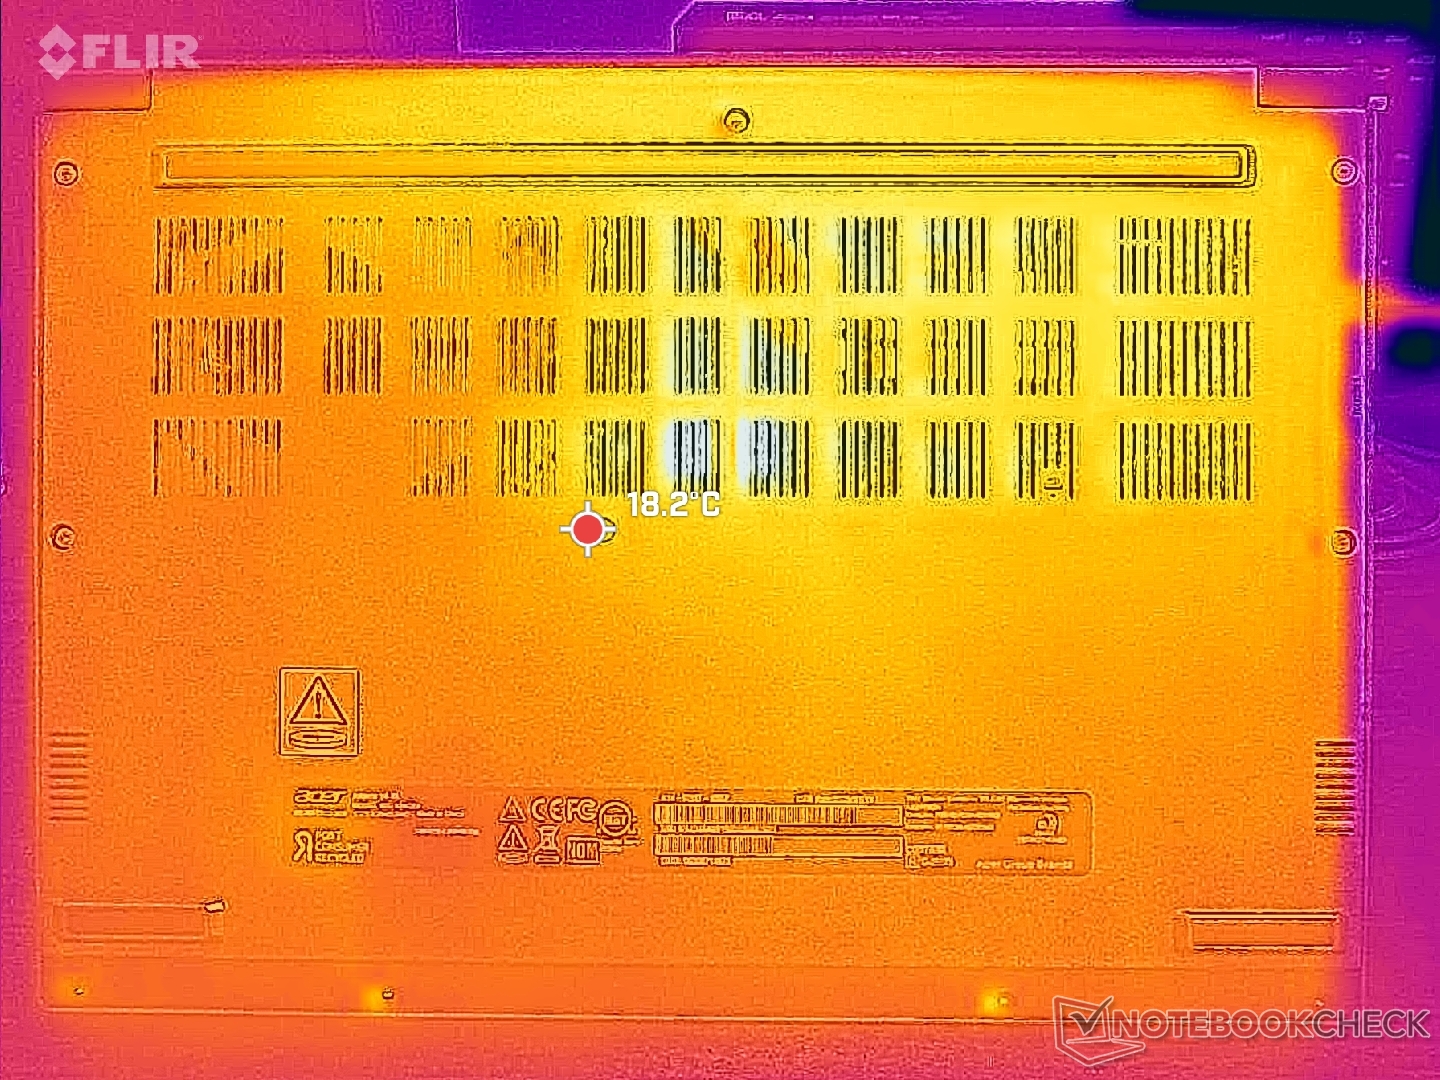
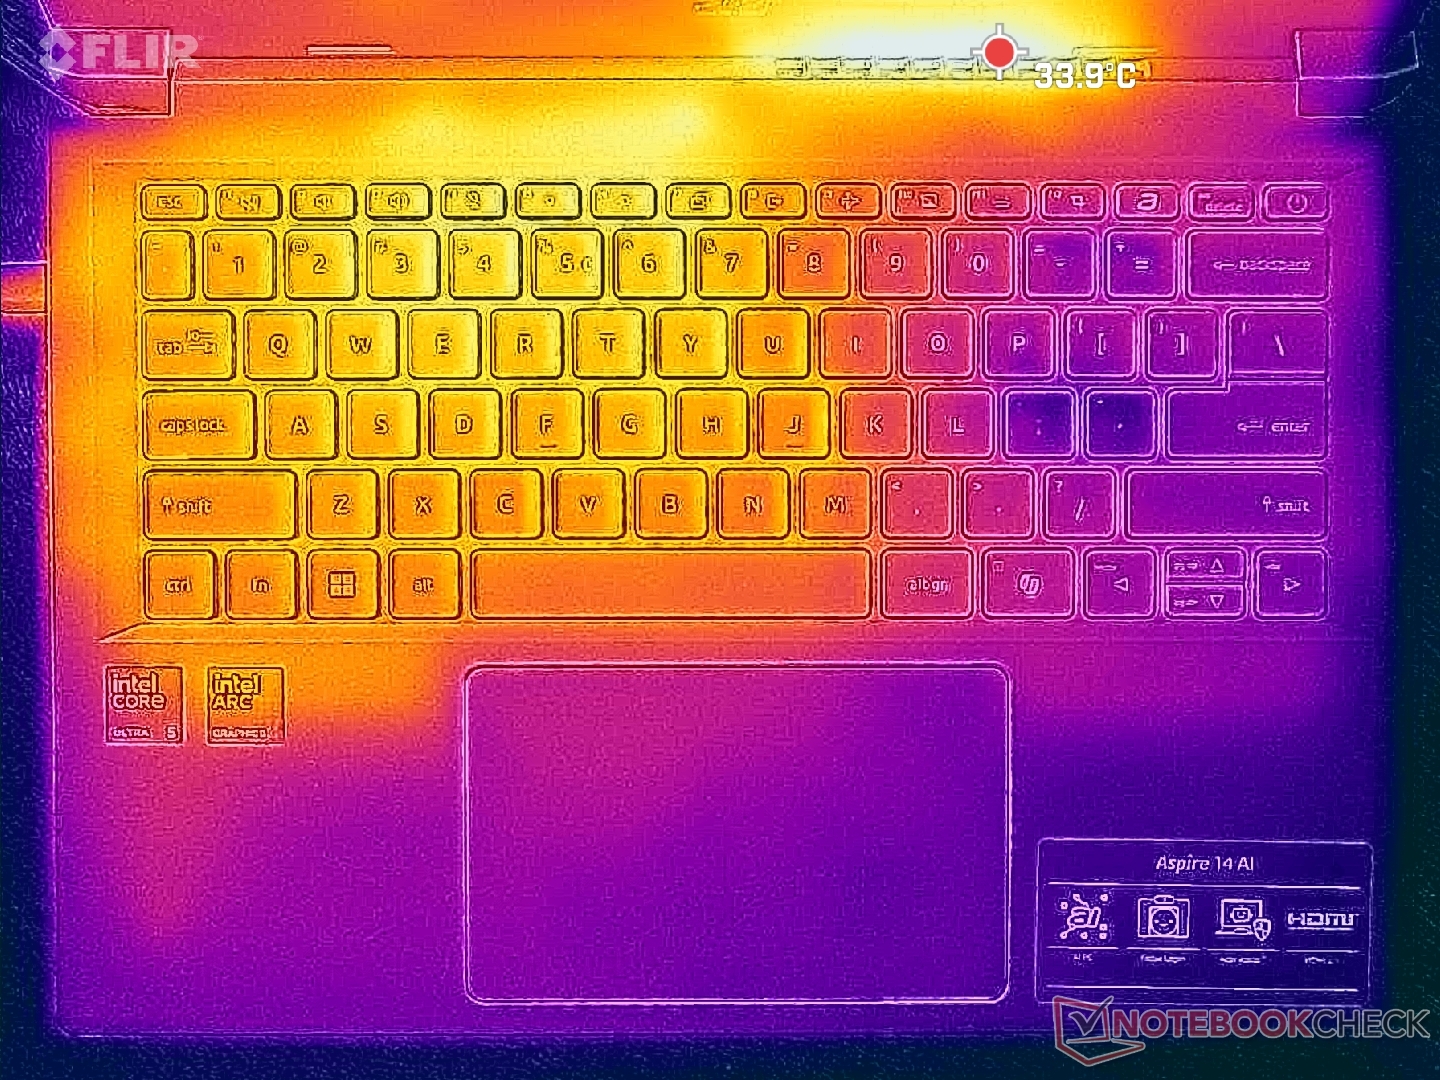
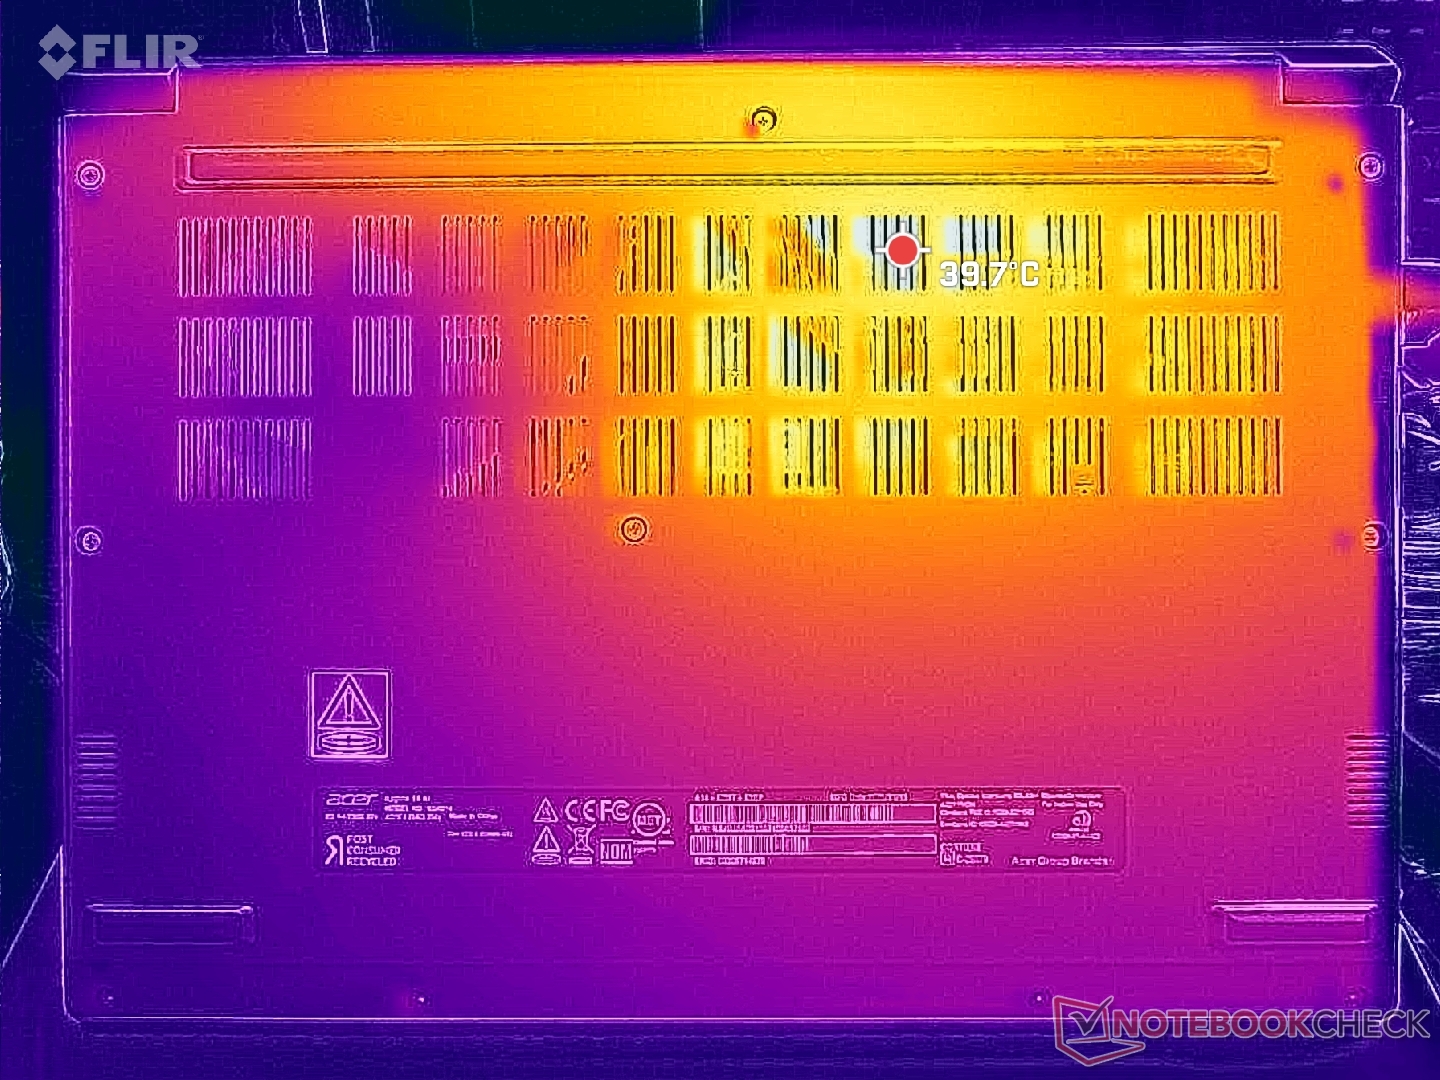
温度
机箱左半部分的表面温度最高,热点温度可达 35 摄氏度。与采用相同处理器、价格更贵但厚度更薄的 Swift 14 AI 相比,该系统的运行温度明显更低。
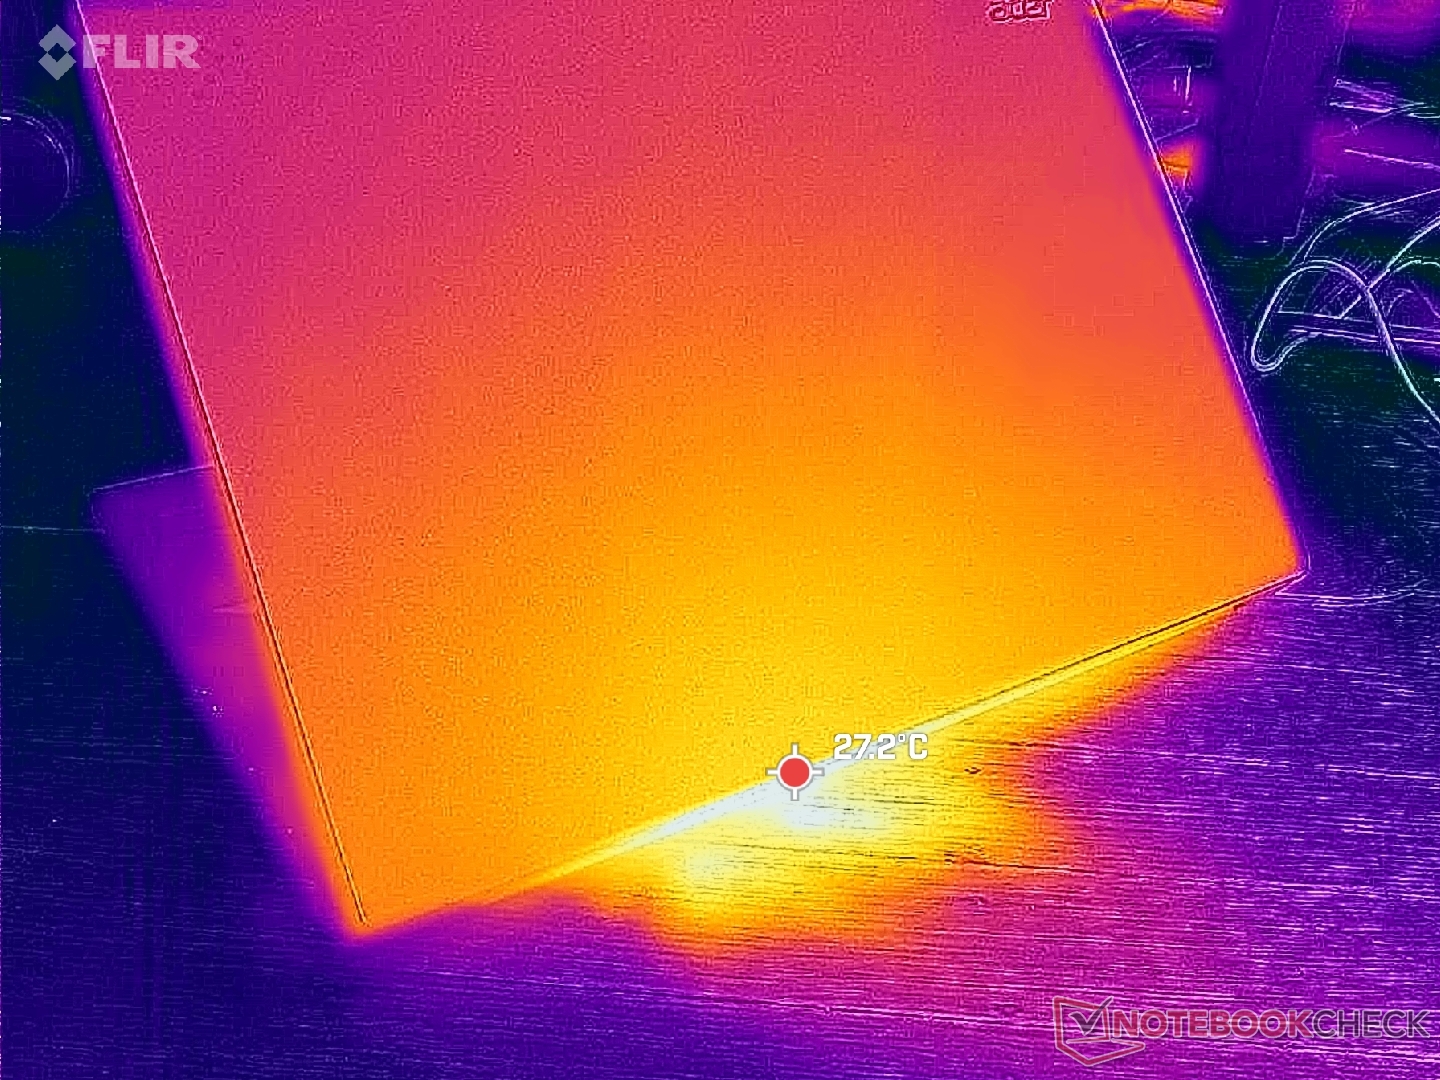
(+) The maximum temperature on the upper side is 35 °C / 95 F, compared to the average of 35.9 °C / 97 F, ranging from 21.4 to 59 °C for the class Subnotebook.
(+) The bottom heats up to a maximum of 34.6 °C / 94 F, compared to the average of 39.3 °C / 103 F
(+) In idle usage, the average temperature for the upper side is 22 °C / 72 F, compared to the device average of 30.8 °C / 87 F.
(+) The palmrests and touchpad are cooler than skin temperature with a maximum of 25 °C / 77 F and are therefore cool to the touch.
(+) The average temperature of the palmrest area of similar devices was 28.2 °C / 82.8 F (+3.2 °C / 5.8 F).
| Acer Aspire 14 AI N24Q14 Intel Core Ultra 5 226V, Intel Arc Graphics 130V | Acer Swift 14 AI SF14-51-58TU Intel Core Ultra 5 226V, Intel Arc Graphics 130V | Lenovo IdeaPad Slim 3 14 AHP G10 AMD Ryzen 7 8840HS, AMD Radeon 780M | Asus VivoBook S 14 OLED M5406WA AMD Ryzen AI 9 HX 370, AMD Radeon 890M | Dell Inspiron 14 Plus 7440 Intel Core Ultra 7 155H, Intel Arc 8-Core iGPU | HP Pavilion Plus 14-ew0153TU Intel Core i7-1355U, Intel Iris Xe Graphics G7 96EUs | |
|---|---|---|---|---|---|---|
| Heat | -19% | -23% | -38% | -13% | -18% | |
| Maximum Upper Side * | 35 | 41 -17% | 38.3 -9% | 49 -40% | 39.2 -12% | 36.6 -5% |
| Maximum Bottom * | 34.6 | 45 -30% | 51.5 -49% | 59 -71% | 41 -18% | 37.2 -8% |
| Idle Upper Side * | 23.6 | 26 -10% | 25.8 -9% | 28 -19% | 25.4 -8% | 31.6 -34% |
| Idle Bottom * | 23.8 | 28 -18% | 29.5 -24% | 29 -22% | 26.8 -13% | 30 -26% |
* ... smaller is better
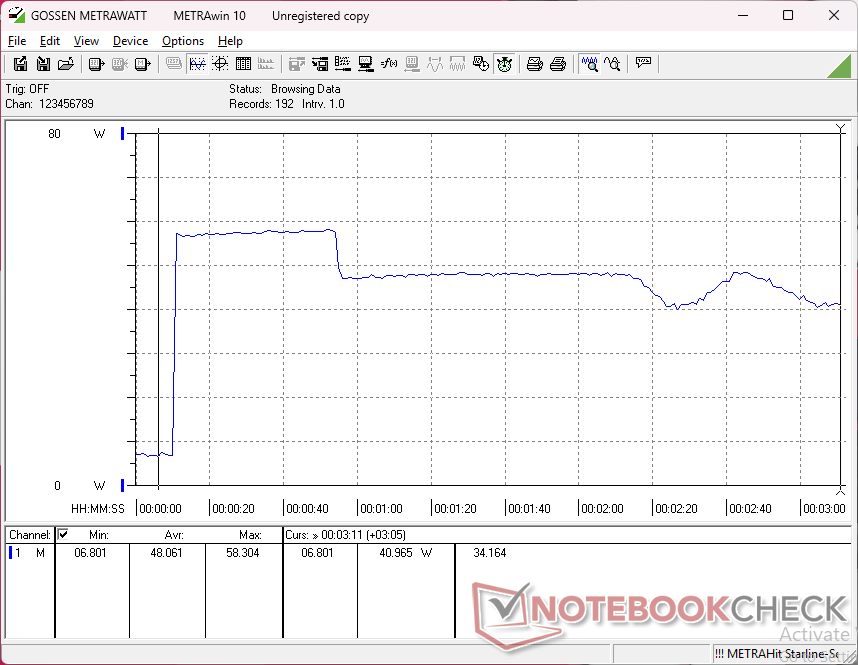
压力测试
此后,处理器将在 2.5 GHz 和 25 W 之间徘徊,以保持 61 C 的核心温度。核心温度与 Swift 14 AI 在负载情况下的温度大致相同。
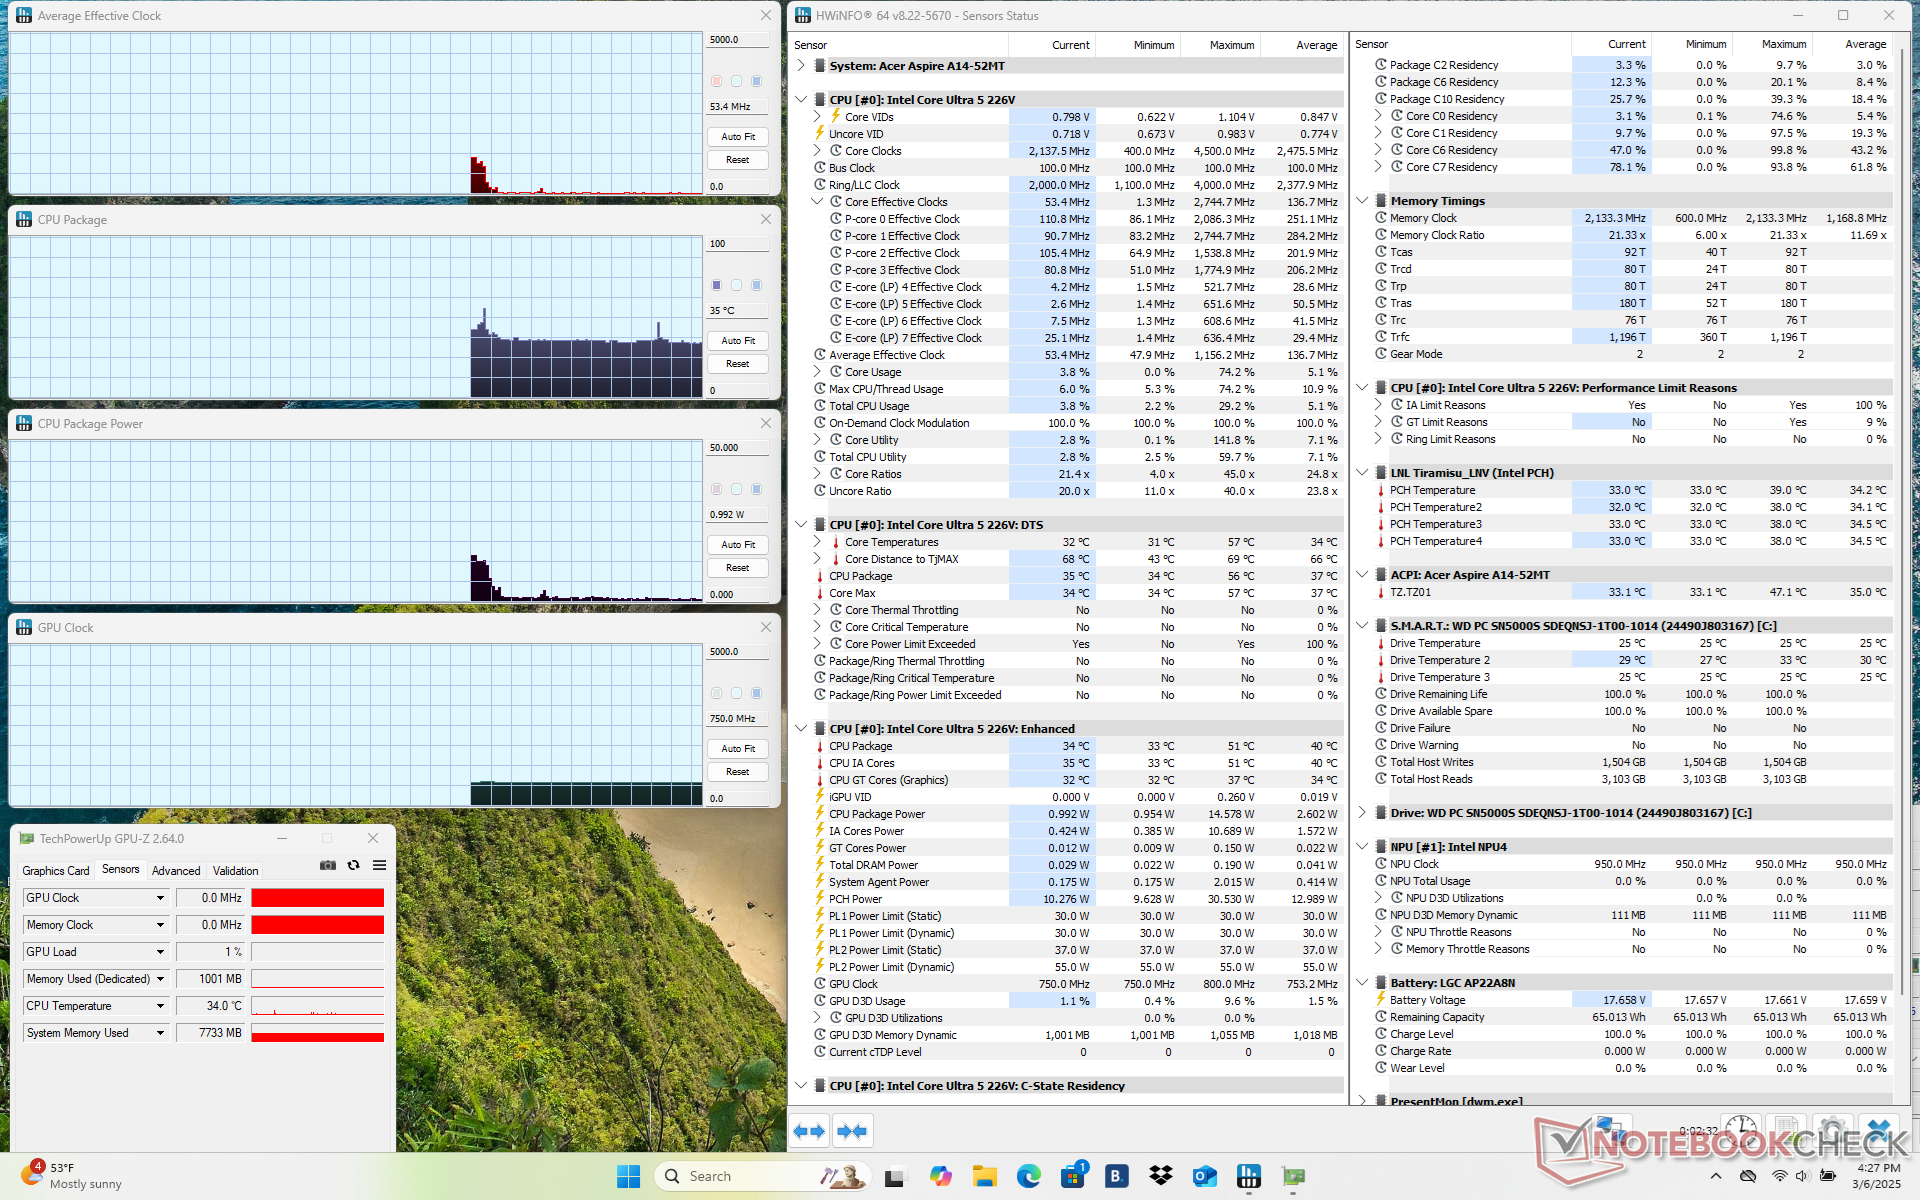
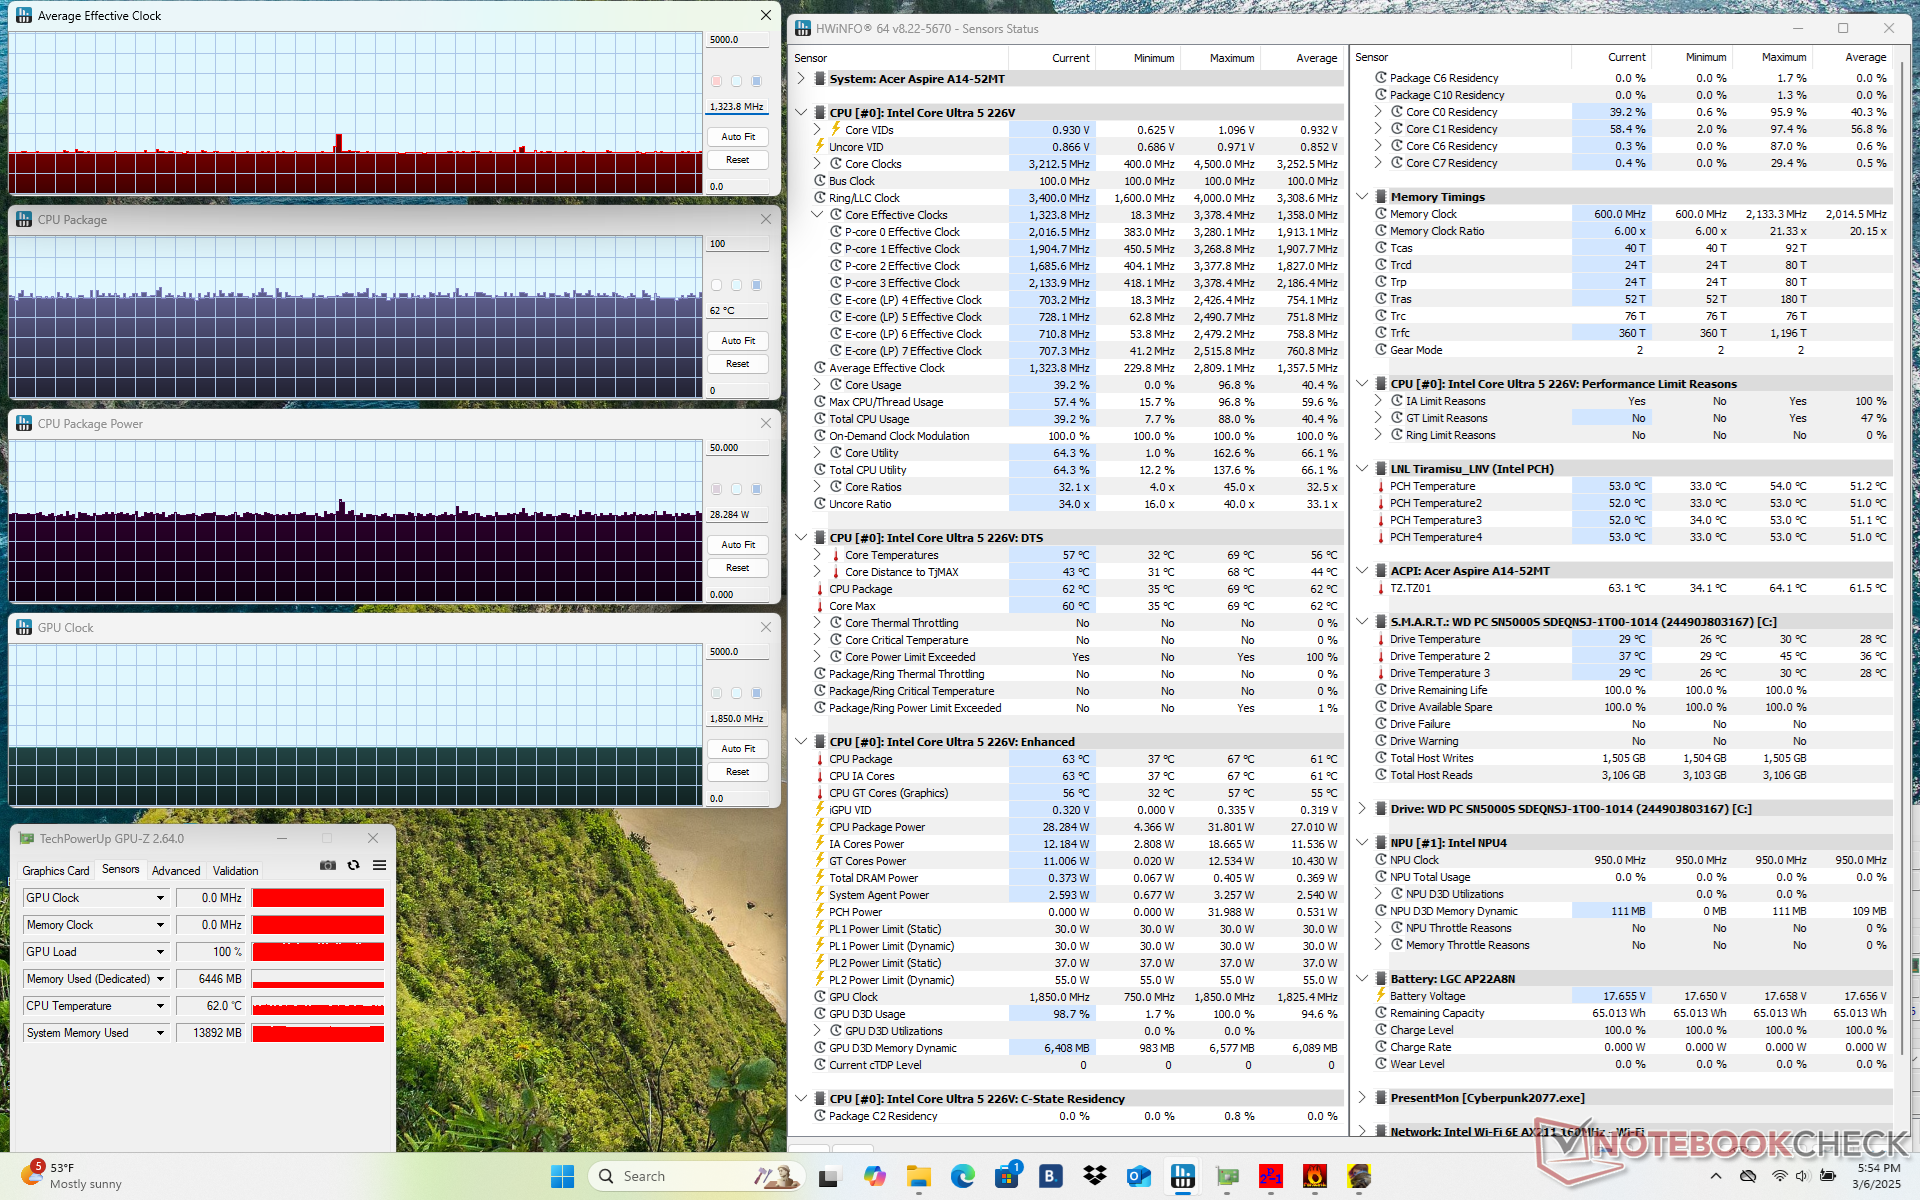
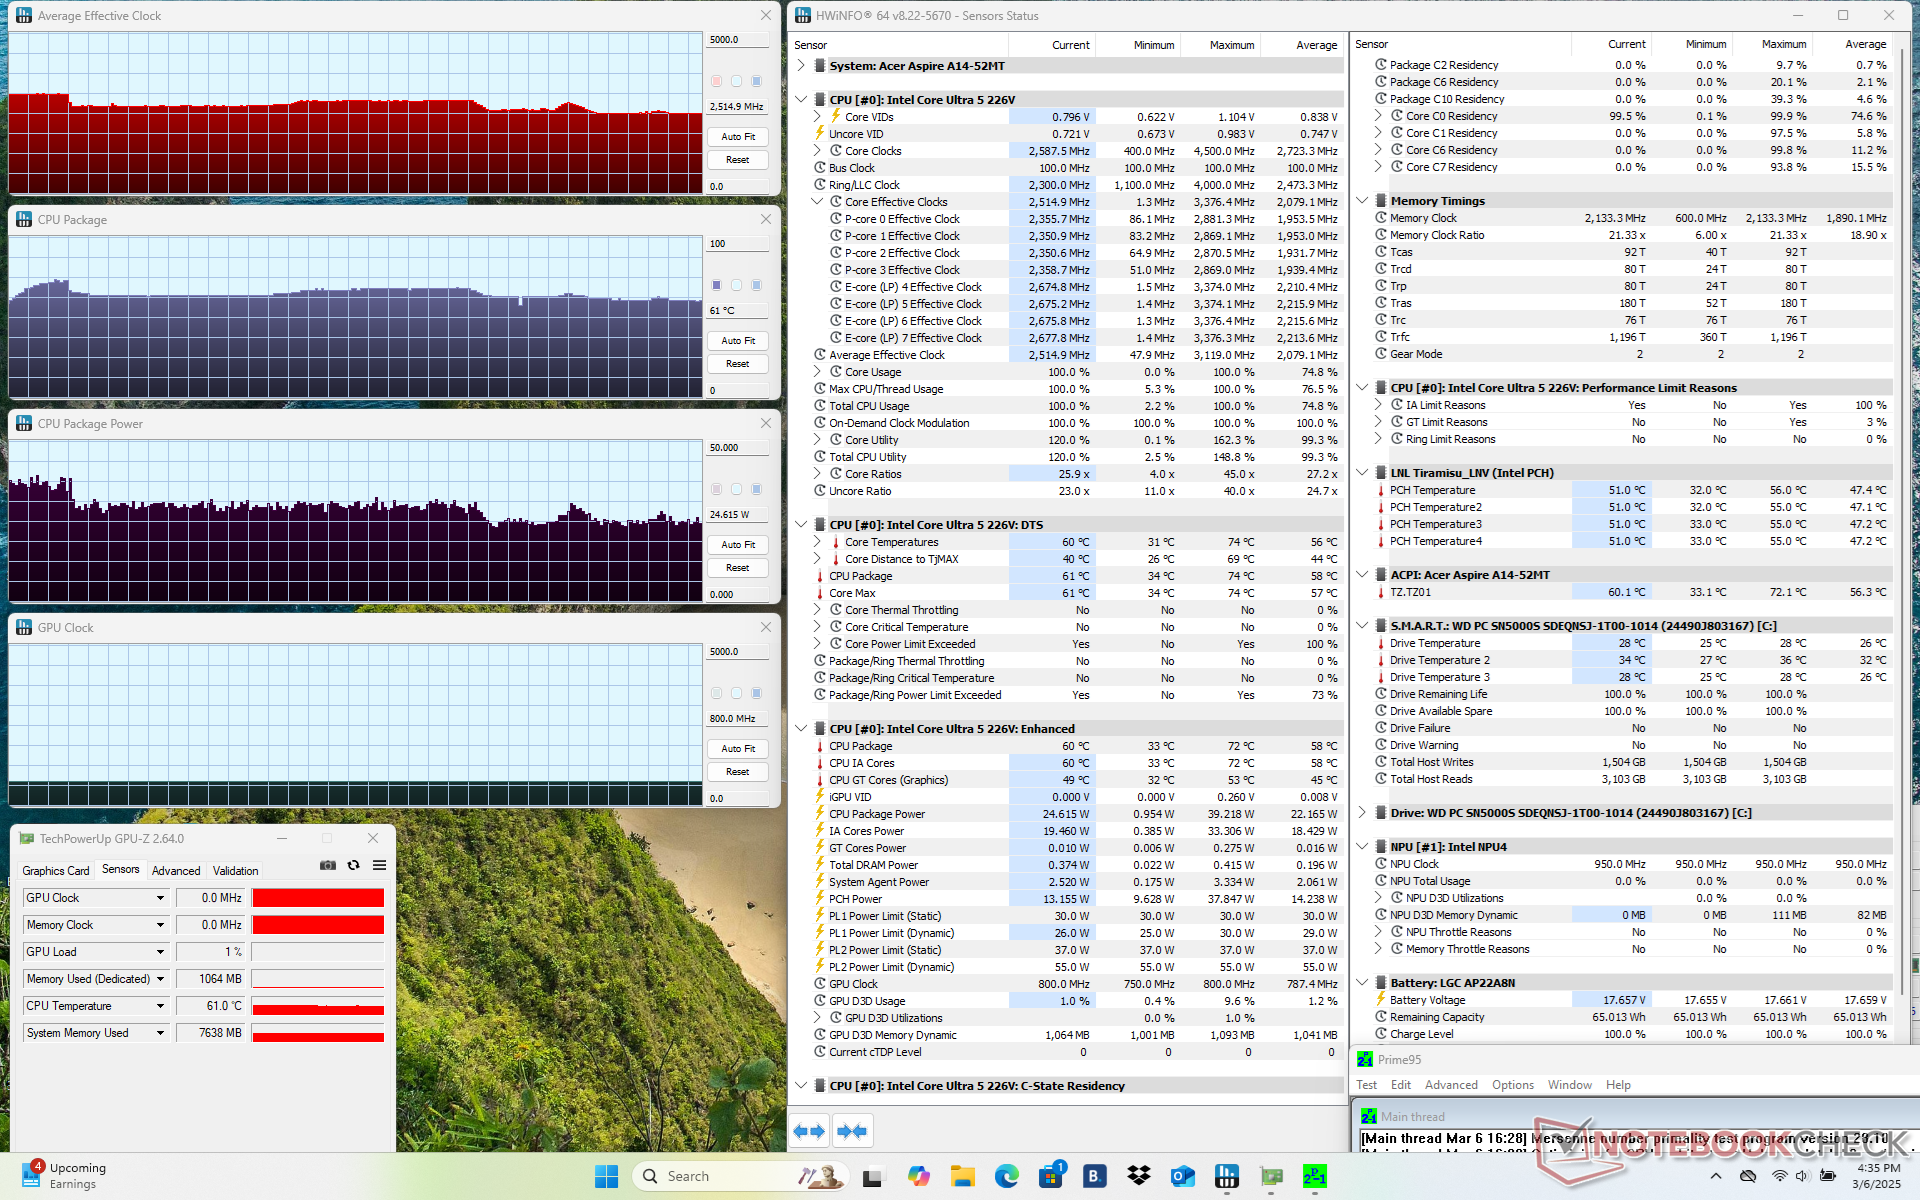
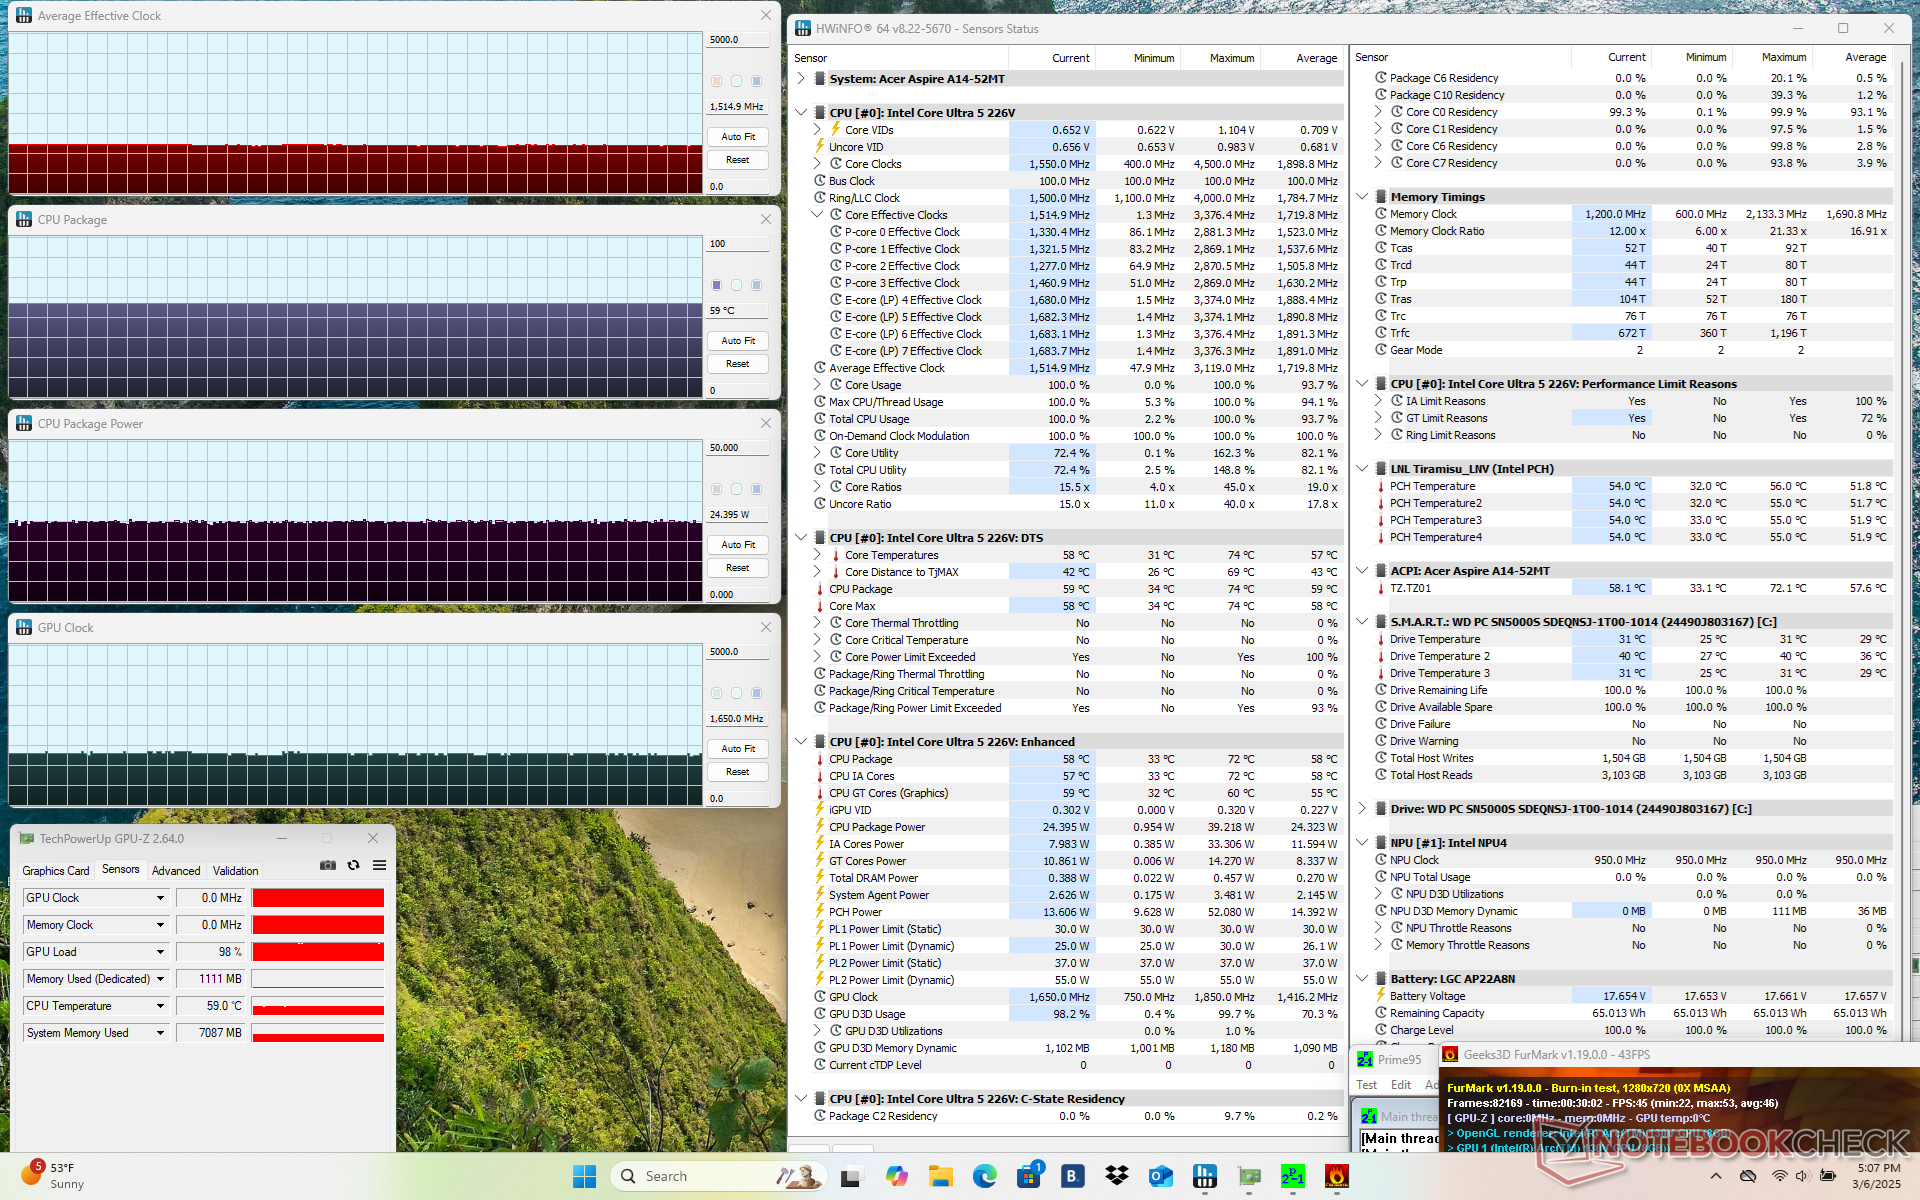
| CPU 平均时钟 (GHz) | GPU 时钟 (MHz) | CPU 平均温度 (°C) | |
| 系统闲置 | -- | -- | 35 |
| Prime95 压力 | 2.5 | -- | 61 |
| Prime95 + FurMark Stress | 1.5 | 1650 | 59 |
| 赛博朋克 2077》压力 | 1.3 | 1850 | 62 |
发言人
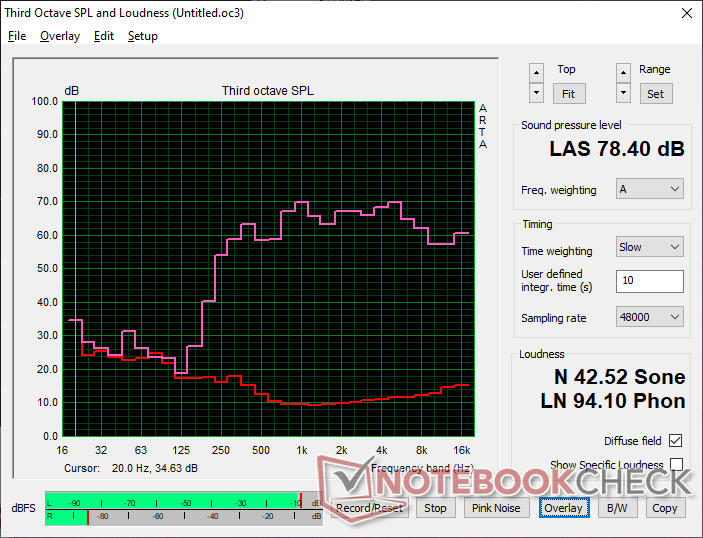
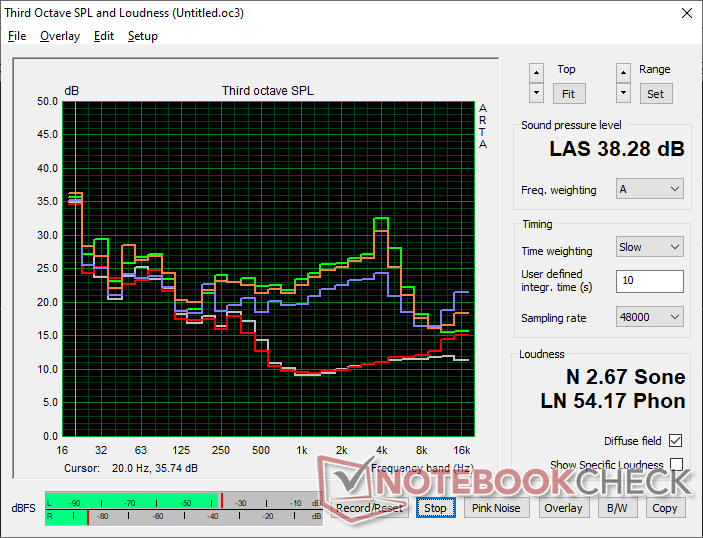
Acer Aspire 14 AI N24Q14 audio analysis
(±) | speaker loudness is average but good (78.4 dB)
Bass 100 - 315 Hz
(-) | nearly no bass - on average 25.1% lower than median
(-) | bass is not linear (15% delta to prev. frequency)
Mids 400 - 2000 Hz
(+) | balanced mids - only 3.8% away from median
(±) | linearity of mids is average (7.7% delta to prev. frequency)
Highs 2 - 16 kHz
(+) | balanced highs - only 4.3% away from median
(+) | highs are linear (5% delta to prev. frequency)
Overall 100 - 16.000 Hz
(±) | linearity of overall sound is average (20.3% difference to median)
Compared to same class
» 63% of all tested devices in this class were better, 9% similar, 28% worse
» The best had a delta of 5%, average was 19%, worst was 53%
Compared to all devices tested
» 50% of all tested devices were better, 8% similar, 42% worse
» The best had a delta of 4%, average was 24%, worst was 134%
Apple MacBook Pro 16 2021 M1 Pro audio analysis
(+) | speakers can play relatively loud (84.7 dB)
Bass 100 - 315 Hz
(+) | good bass - only 3.8% away from median
(+) | bass is linear (5.2% delta to prev. frequency)
Mids 400 - 2000 Hz
(+) | balanced mids - only 1.3% away from median
(+) | mids are linear (2.1% delta to prev. frequency)
Highs 2 - 16 kHz
(+) | balanced highs - only 1.9% away from median
(+) | highs are linear (2.7% delta to prev. frequency)
Overall 100 - 16.000 Hz
(+) | overall sound is linear (4.6% difference to median)
Compared to same class
» 0% of all tested devices in this class were better, 0% similar, 100% worse
» The best had a delta of 5%, average was 18%, worst was 45%
Compared to all devices tested
» 0% of all tested devices were better, 0% similar, 100% worse
» The best had a delta of 4%, average was 24%, worst was 134%
能源管理
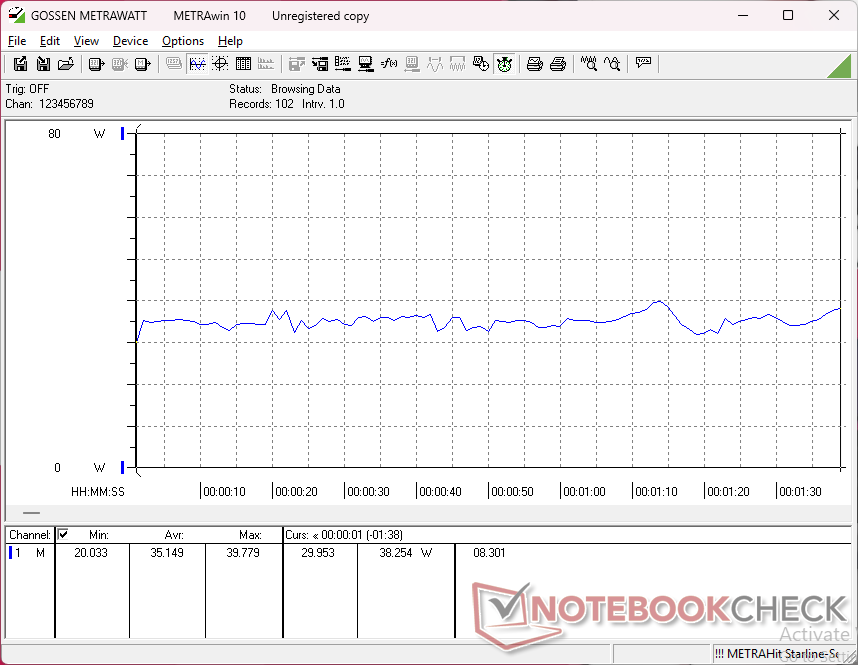
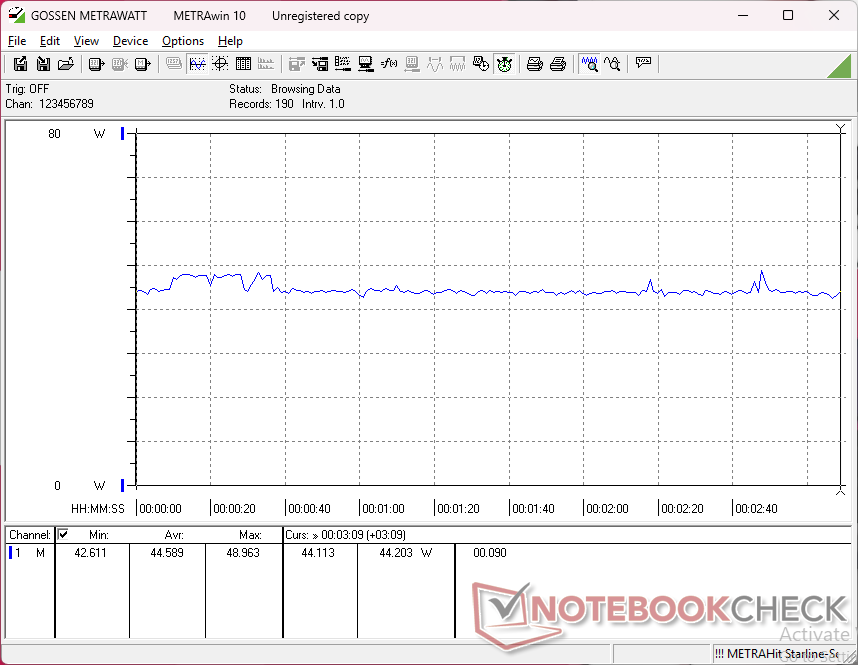
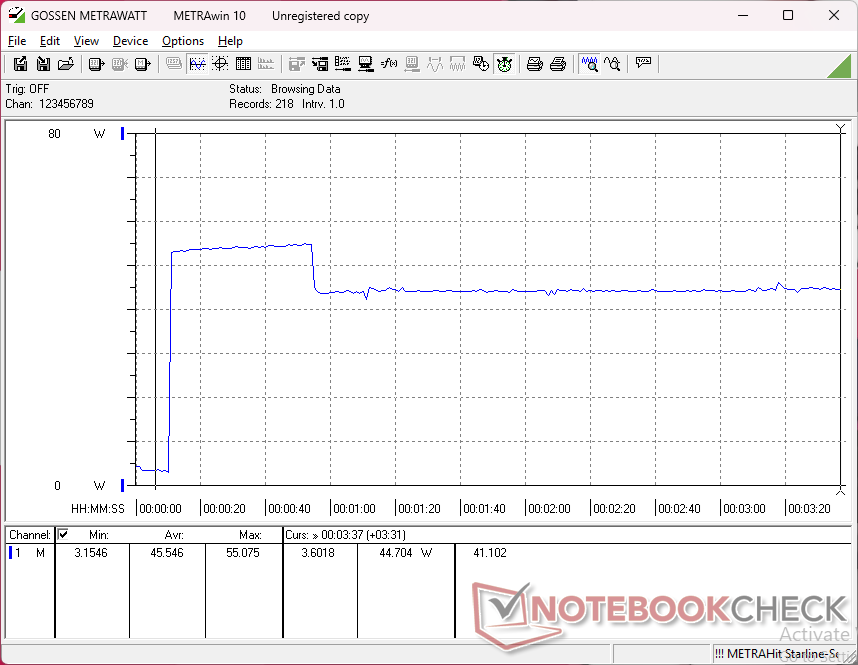
耗电量
空转时的功耗为 2 瓦至 7 瓦,而配备 OLED 显示屏的 Swift 14 AI 为 5 瓦至 10 瓦。尽管显示技术不同,但在运行要求更高的负载时,差异仍然很小。
有趣的是,宏碁的耗电量比 IdeaPad Slim 3 14 AHP G10在运行 Prime95 时,尽管联想提供了更快的多线程性能,但宏碁的耗电量仍高于 IdeaPad Slim 3 14 AHP G10。在运行《赛博朋克 2077》时,宏碁同样需要更多的电量,但它比联想提供了更快的图形性能来弥补。
| Off / Standby | |
| Idle | |
| Load |
|
Key:
min: | |
| Acer Aspire 14 AI N24Q14 Core Ultra 5 226V, Arc 130V, Western Digital PC SN5000S SDEQNSJ-1T00, IPS, 1920x1200, 14" | Acer Swift 14 AI SF14-51-58TU Core Ultra 5 226V, Arc 130V, Micron 2550 512GB, OLED, 2880x1800, 14" | Lenovo IdeaPad Slim 3 14 AHP G10 R7 8840HS, Radeon 780M, Micron 2500 MTFDKBA512QGN, IPS, 1920x1200, 14" | Asus VivoBook S 14 OLED M5406WA Ryzen AI 9 HX 370, Radeon 890M, Micron 2400 MTFDKBA1T0QFM, OLED, 1920x1200, 14" | Dell Inspiron 14 Plus 7440 Ultra 7 155H, Arc 8-Core, WD PC SN740 SDDPTQD-1T00, IPS, 2240x1400, 14" | HP Pavilion Plus 14-ew0153TU i7-1355U, Iris Xe G7 96EUs, SK hynix PC801 HFS001TEJ9X101N, OLED, 2880x1800, 14" | |
|---|---|---|---|---|---|---|
| Power Consumption | -18% | -3% | -74% | -53% | -55% | |
| Idle Minimum * | 2.7 | 5 -85% | 3.3 -22% | 6 -122% | 3.5 -30% | 6.7 -148% |
| Idle Average * | 6.2 | 6 3% | 6.3 -2% | 8 -29% | 7.9 -27% | 7.16 -15% |
| Idle Maximum * | 6.6 | 10 -52% | 6.8 -3% | 14 -112% | 8.8 -33% | 11.17 -69% |
| Load Average * | 35.2 | 36 -2% | 45.7 -30% | 76 -116% | 66.4 -89% | 46.5 -32% |
| Cyberpunk 2077 ultra external monitor * | 40.7 | 38.2 6% | 35.8 12% | 61.9 -52% | ||
| Cyberpunk 2077 ultra * | 44.6 | 41.6 7% | 38.2 14% | 58.6 -31% | ||
| Load Maximum * | 59 | 60 -2% | 51.7 12% | 94 -59% | 110.3 -87% | 64.36 -9% |
| Witcher 3 ultra * | 55.7 | 37.2 |
* ... smaller is better
Power Consumption Cyberpunk / Stress Test
Power Consumption external Monitor
电池寿命
电池容量与 Swift 14 AI 相同,持续 WLAN 浏览近 13 小时的续航时间也与 Swift 14 AI 相近。
| Acer Aspire 14 AI N24Q14 Core Ultra 5 226V, Arc 130V, 65 Wh | Acer Swift 14 AI SF14-51-58TU Core Ultra 5 226V, Arc 130V, 65 Wh | Lenovo IdeaPad Slim 3 14 AHP G10 R7 8840HS, Radeon 780M, 60 Wh | Asus Vivobook S 14 OLED S5406SA Core Ultra 5 226V, Arc 130V, 75 Wh | Dell Inspiron 14 Plus 7440 Ultra 7 155H, Arc 8-Core, 64 Wh | HP Pavilion Plus 14-ew0153TU i7-1355U, Iris Xe G7 96EUs, 68 Wh | |
|---|---|---|---|---|---|---|
| Battery Runtime | -2% | -16% | 34% | -2% | -25% | |
| WiFi v1.3 | 768 | 753 -2% | 643 -16% | 1030 34% | 749 -2% | 578 -25% |
| H.264 | 840 | 1199 | 720 | |||
| Load | 174 | 78 | ||||
| Reader / Idle | 1971 |
笔记本检查评级
Acer Aspire 14 AI N24Q14
- 03/11/2025 v8
Allen Ngo
 Total Sustainability Score:
 Potential Competitors in Comparison
Image | Model / Review | Price | Weight | Height | Display |
|---|---|---|---|---|---|
1. 82.5%  | Acer Aspire 14 AI N24Q14 Intel Core Ultra 5 226V ⎘ Intel Arc Graphics 130V ⎘ 16 GB Memory, 1024 GB SSD | Amazon: 1. $879.99 acer Aspire 14 AI Copilot+ P... List Price: 700 USD | 1.4 kg | 17 mm | 14.00" 1920x1200 162 PPI IPS |
2. 83.5% 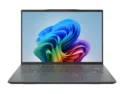 | Acer Swift 14 AI SF14-51-58TU Intel Core Ultra 5 226V ⎘ Intel Arc Graphics 130V ⎘ 16 GB Memory, 512 GB SSD | List Price: 1200 EUR | 1.3 kg | 16 mm | 14.00" 2880x1800 243 PPI OLED |
3. 81.1% 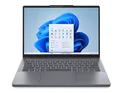 | Lenovo IdeaPad Slim 3 14 AHP G10 AMD Ryzen 7 8840HS ⎘ AMD Radeon 780M ⎘ 16 GB Memory, 512 GB SSD | Amazon: 1. $9.99 Charger for Lenovo IdeaPad 3... 2. $8.99 Supershieldz (3 Pack) Design... 3. $320.00 Lenovo IdeaPad Slim 3 - Ever... List Price: 649€ | 1.5 kg | 17.9 mm | 14.00" 1920x1200 162 PPI IPS |
4. 85.9% 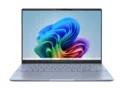 | Asus Vivobook S 14 OLED S5406SA Intel Core Ultra 5 226V ⎘ Intel Arc Graphics 130V ⎘ 16 GB Memory, 512 GB SSD | Amazon: 1. $949.49 ASUS Vivobook S 14 Copilot+ ... 2. $1,159.00 ASUS Vivobook S 14 Copilot+ ... 3. $588.00 ASUS Vivobook S 14 AI Powere... List Price: 1099€ | 1.3 kg | 15.9 mm | 14.00" 1920x1200 162 PPI OLED |
5. 85.2% v7 (old) 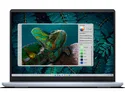 | Dell Inspiron 14 Plus 7440 Intel Core Ultra 7 155H ⎘ Intel Arc 8-Core iGPU ⎘ 16 GB Memory, 1024 GB SSD | Amazon: 1. $699.99 Dell Inspiron 14 Plus 7440 L... 2. $688.00 DELL Inspiron 14 7440 2-in-1... 3. $749.99 Dell Inspiron 5440 Laptop - ... List Price: 1000 USD | 1.6 kg | 18.99 mm | 14.00" 2240x1400 189 PPI IPS |
6. 87.5% v7 (old)  | HP Pavilion Plus 14-ew0153TU Intel Core i7-1355U ⎘ Intel Iris Xe Graphics G7 96EUs ⎘ 16 GB Memory, 1024 GB SSD | Amazon: 1. $1,139.40 HP Pavilion Plus 14 inch Lap... 2. $58.99 ZTHY WE04XL Battery Replacem... 3. $698.00 HP Pavilion Plus 14 inch Lap... List Price: 1020 USD | 1.4 kg | 17.5 mm | 14.00" 2880x1800 243 PPI OLED |
Transparency
The selection of devices to be reviewed is made by our editorial team. The test sample was freely purchased by the author at his/her own expense. The lender had no influence on this review, nor did the manufacturer receive a copy of this review before publication. There was no obligation to publish this review. We never accept compensation or payment in return for our reviews. As an independent media company, Notebookcheck is not subjected to the authority of manufacturers, retailers or publishers.
This is how Notebookcheck is testing
Every year, Notebookcheck independently reviews hundreds of laptops and smartphones using standardized procedures to ensure that all results are comparable. We have continuously developed our test methods for around 20 years and set industry standards in the process. In our test labs, high-quality measuring equipment is utilized by experienced technicians and editors. These tests involve a multi-stage validation process. Our complex rating system is based on hundreds of well-founded measurements and benchmarks, which maintains objectivity. Further information on our test methods can be found here.

