

联想 ThinkPad P1 7 代评测:无 TrackPoint 按钮,配备 NvidiaGeForce RTX 4060
P1 带有 ThinkPad Z 的影子。
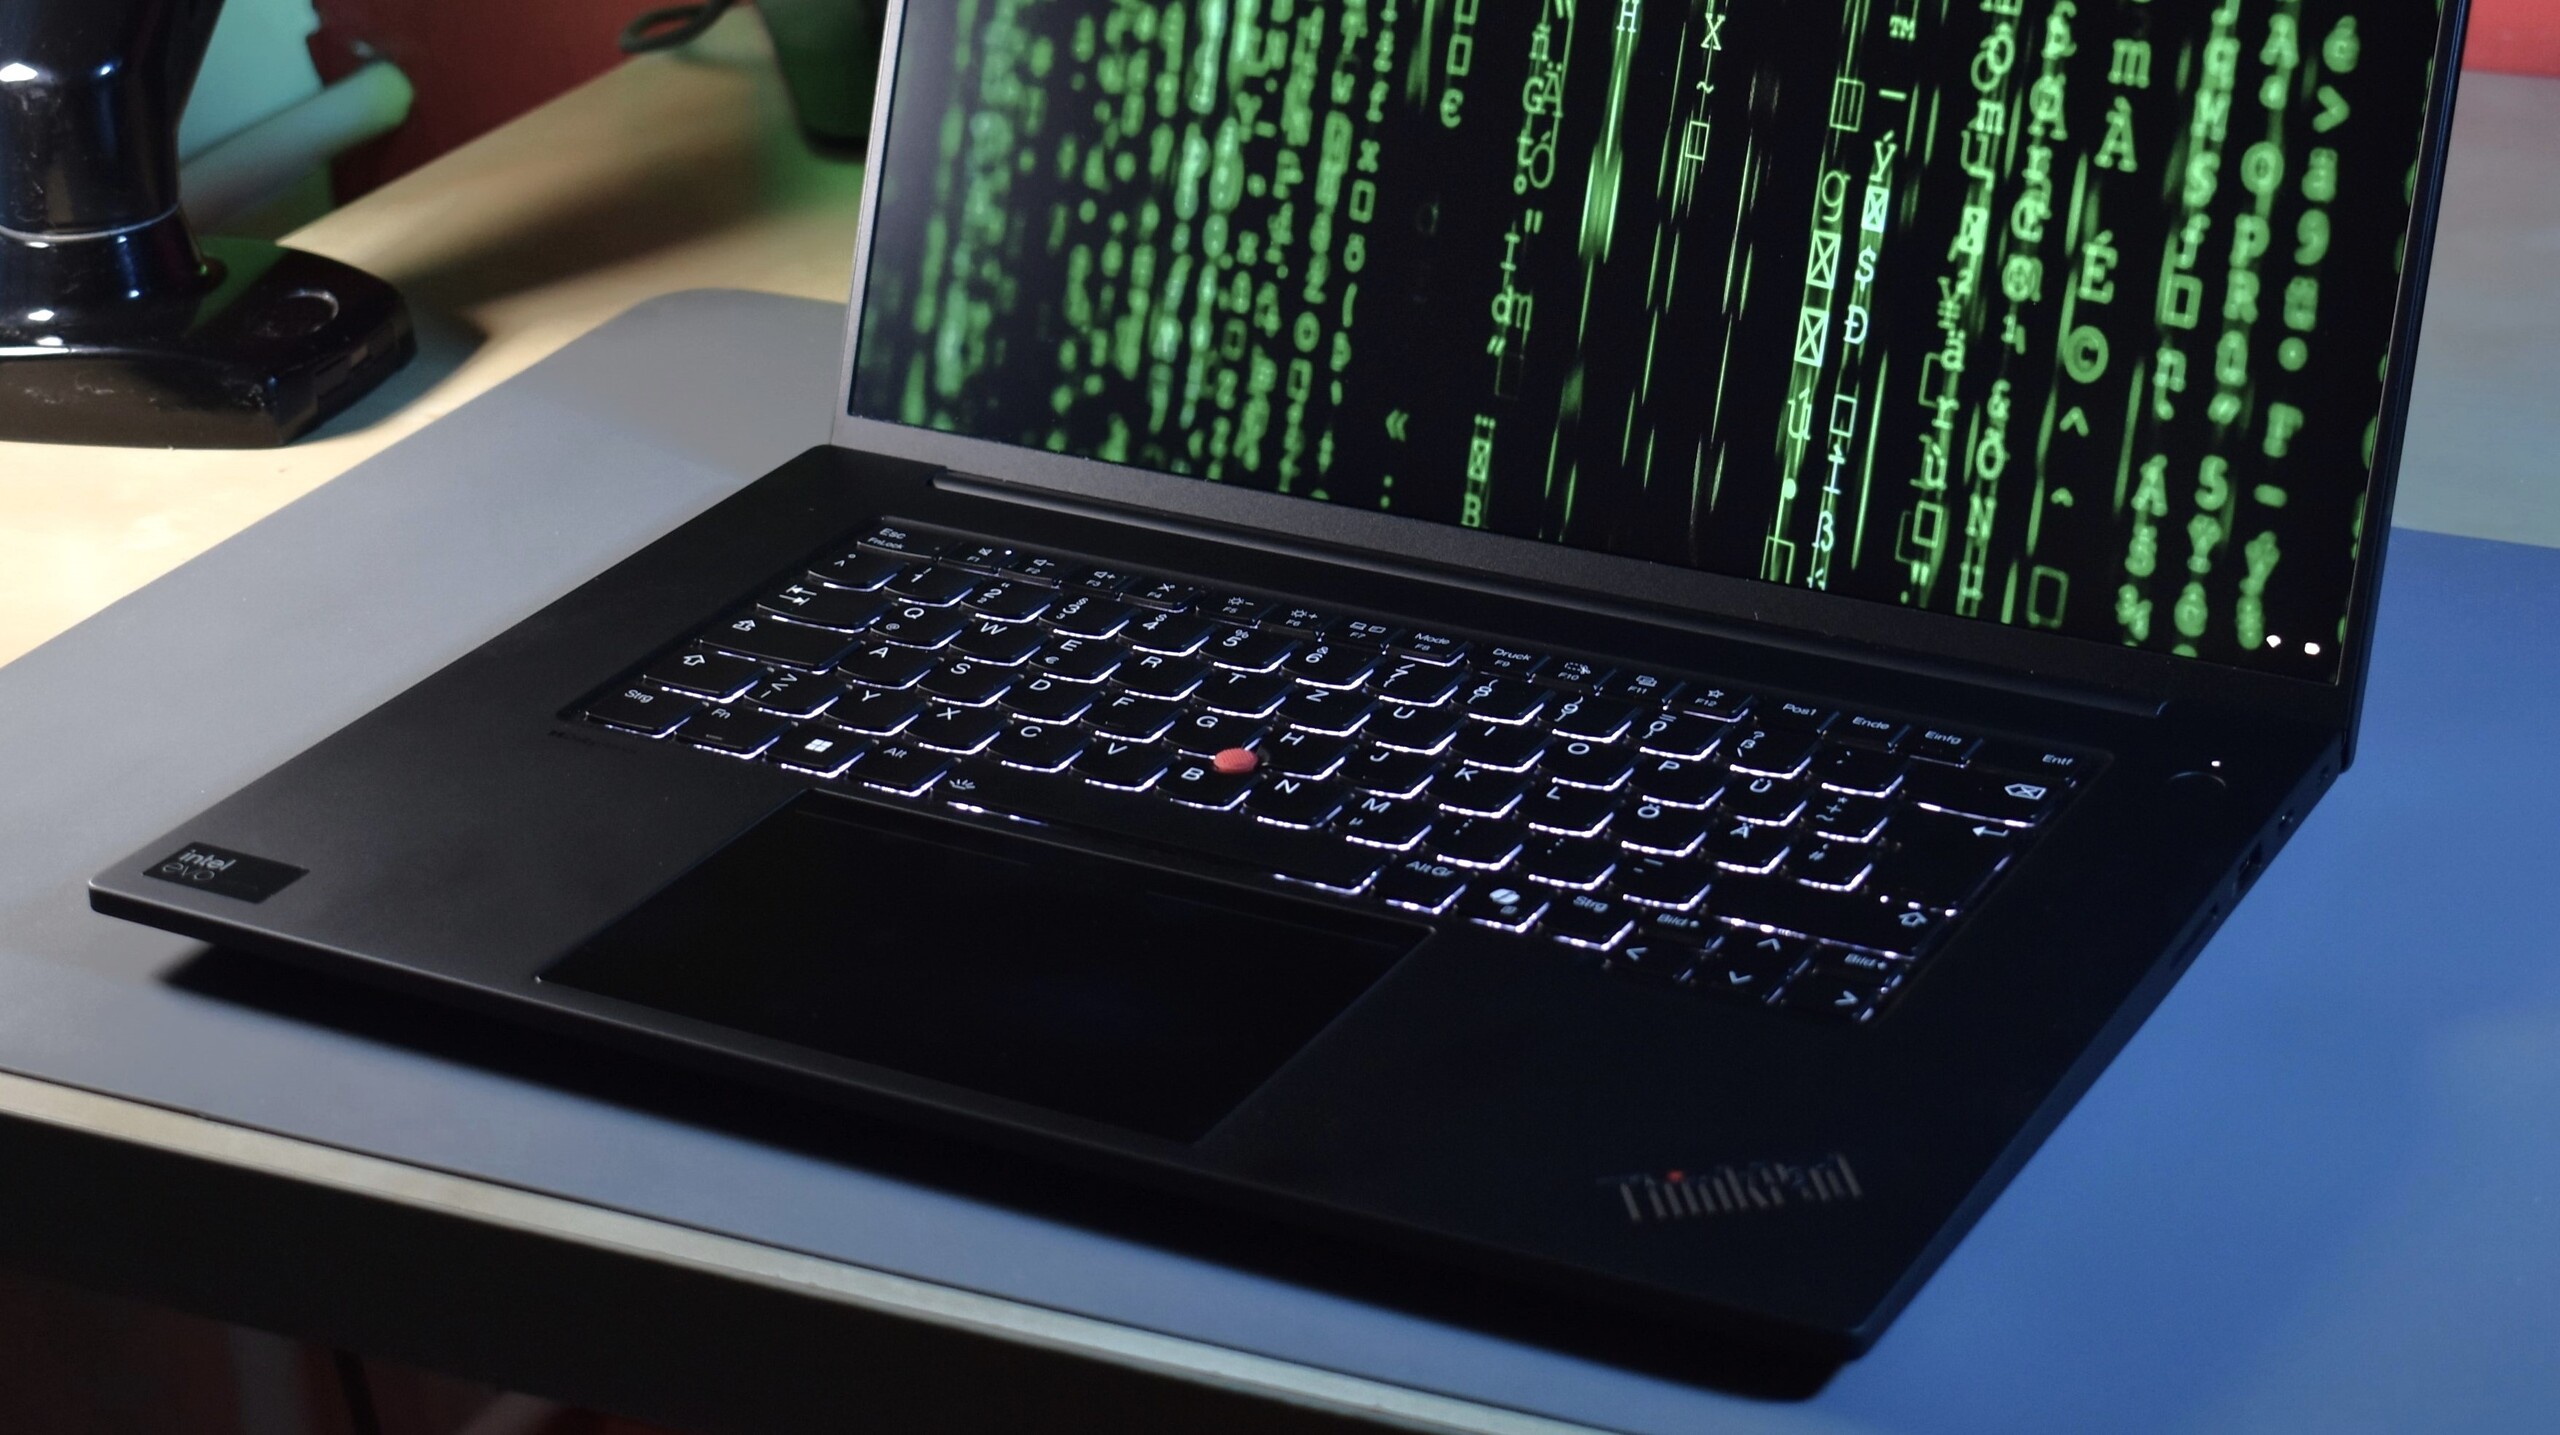
对于新款联想ThinkPad P1 Gen 7来说,全新的设计是最大的亮点。这款高端工作站更高档、更易维修、更易使用。其核心是全新的触觉 Sensel 触摸板,它成功地取代了以前专用 TrackPoint 按钮的功能。Benjamin Herzig, 👁 Benjamin Herzig (translated by DeepL / Ninh Duy) Published 🇺🇸 🇩🇪 ...
结论现代设计,但 GPU 性能较低
在大多数情况下,原有 PC 系列的新笔记本电脑型号仅仅是前代产品的更新,只是采用了更新的处理器。ThinkPad P1 7 代却不是这样:联想从根本上改变了其高端工作站的设计,将重点从最高性能上转移--不再提供前代产品的高端 GPU 选项。取而代之的是,现在每个型号都有两个 M.2 2280 SSD 插槽,而且新的 P1 G7 还采用了创新的 LPCAMM2 内存类型。
从外观上看,ThinkPad Z16 采用了很多设计元素,尤其是铝制盖子和大触觉触控板,效果非常好。再加上更薄的屏幕边框,设计看起来更加清新时尚,同时又不失 ThinkPad 的设计魅力。新的 CPU 平台 Meteor Lake 在单核性能上并没有达到 Raptor Lake 的水平,但在效率和电池续航方面有所提升。总的来说,与前代产品相比,联想 ThinkPad P1 7 代很好地实现了向更高端设计的转变,移动性也得到了提升。为了实现更圆润的整体包装,联想在高端产品上牺牲了一些 GPU 性能,但这对大多数用户来说可能并无大碍。
Pros
Cons
定价和可用性
在我们的贷款供应商 Campuspoint,您可以在德国以 3,359 欧元的价格购买联想 ThinkPad P1 Gen 7,学生价为 2,859 欧元。亚马逊网站上的 ThinkPad P1 Gen 7 售价为 2548 美元。
Price comparison
潜在的竞争对手比较
Image | Model / Review | Price | Weight | Height | Display |
|---|---|---|---|---|---|
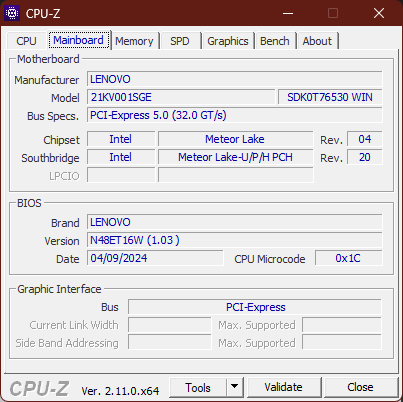
1. 83.5%  | Lenovo ThinkPad P1 Gen 7 21KV001SGE Intel Core Ultra 7 155H ⎘ NVIDIA GeForce RTX 4060 Laptop GPU ⎘ 32 GB Memory, 1024 GB SSD | from EUR 3239 | 2 kg | 20.5 mm | 16.00" 2560x1600 189 PPI IPS LED |
2. 90.1% v7 (old)  | Lenovo ThinkPad P1 G6 21FV001KUS Intel Core i7-13800H ⎘ NVIDIA GeForce RTX 4080 Laptop GPU ⎘ 32 GB Memory, 1024 GB SSD | 1.9 kg | 17.5 mm | 16.00" 3480x2400 264 PPI OLED | |
3. 93.7% v7 (old)  | Apple MacBook Pro 16 2023 M3 Pro Apple M3 Pro 12-Core ⎘ Apple M3 Pro 18-Core GPU ⎘ 18 GB Memory, 512 GB SSD | from EUR 2999 | 2.1 kg | 16.9 mm | 16.20" 3456x2234 254 PPI Mini-LED |
4. 88.6% v7 (old)  | Dell XPS 16 9640 Intel Core Ultra 7 155H ⎘ NVIDIA GeForce RTX 4070 Laptop GPU ⎘ 32 GB Memory, 1024 GB SSD | 2.3 kg | 18.7 mm | 16.30" 3840x2400 139 PPI OLED | |
5. 88.3% v7 (old)  | Dell Precision 5690 Intel Core Ultra 9 185H ⎘ Nvidia RTX 5000 Ada Generation Laptop GPU ⎘ 32 GB Memory, 2048 GB SSD | from EUR 5900 | 2.3 kg | 22.17 mm | 16.00" 3840x2400 283 PPI OLED |
2018 年,联想发布了全新的 ThinkPad 系列:The ThinkPad P1超薄高端工作站,以及 ThinkPad X1 Extreme,它的多媒体对应产品。X1 Extreme 系列已经夭折,但 ThinkPad P1 依然存在。随着 ThinkPad P1 第 7 代的推出,我们已经拥有了这款高端设备的七代产品。最新版本拥有许多新功能,因为联想几乎完全重新修改了设计--这在该系列历史上只是第二次。加上英特尔流星湖 H CPU,这是一个非常有趣的组合,联想将其与 Apple MacBook Pro 16, 戴尔 XPS 16或惠普 ZBook Studio。
Specifications: Core Ultra 7 155H meets GeForce RTX 4060
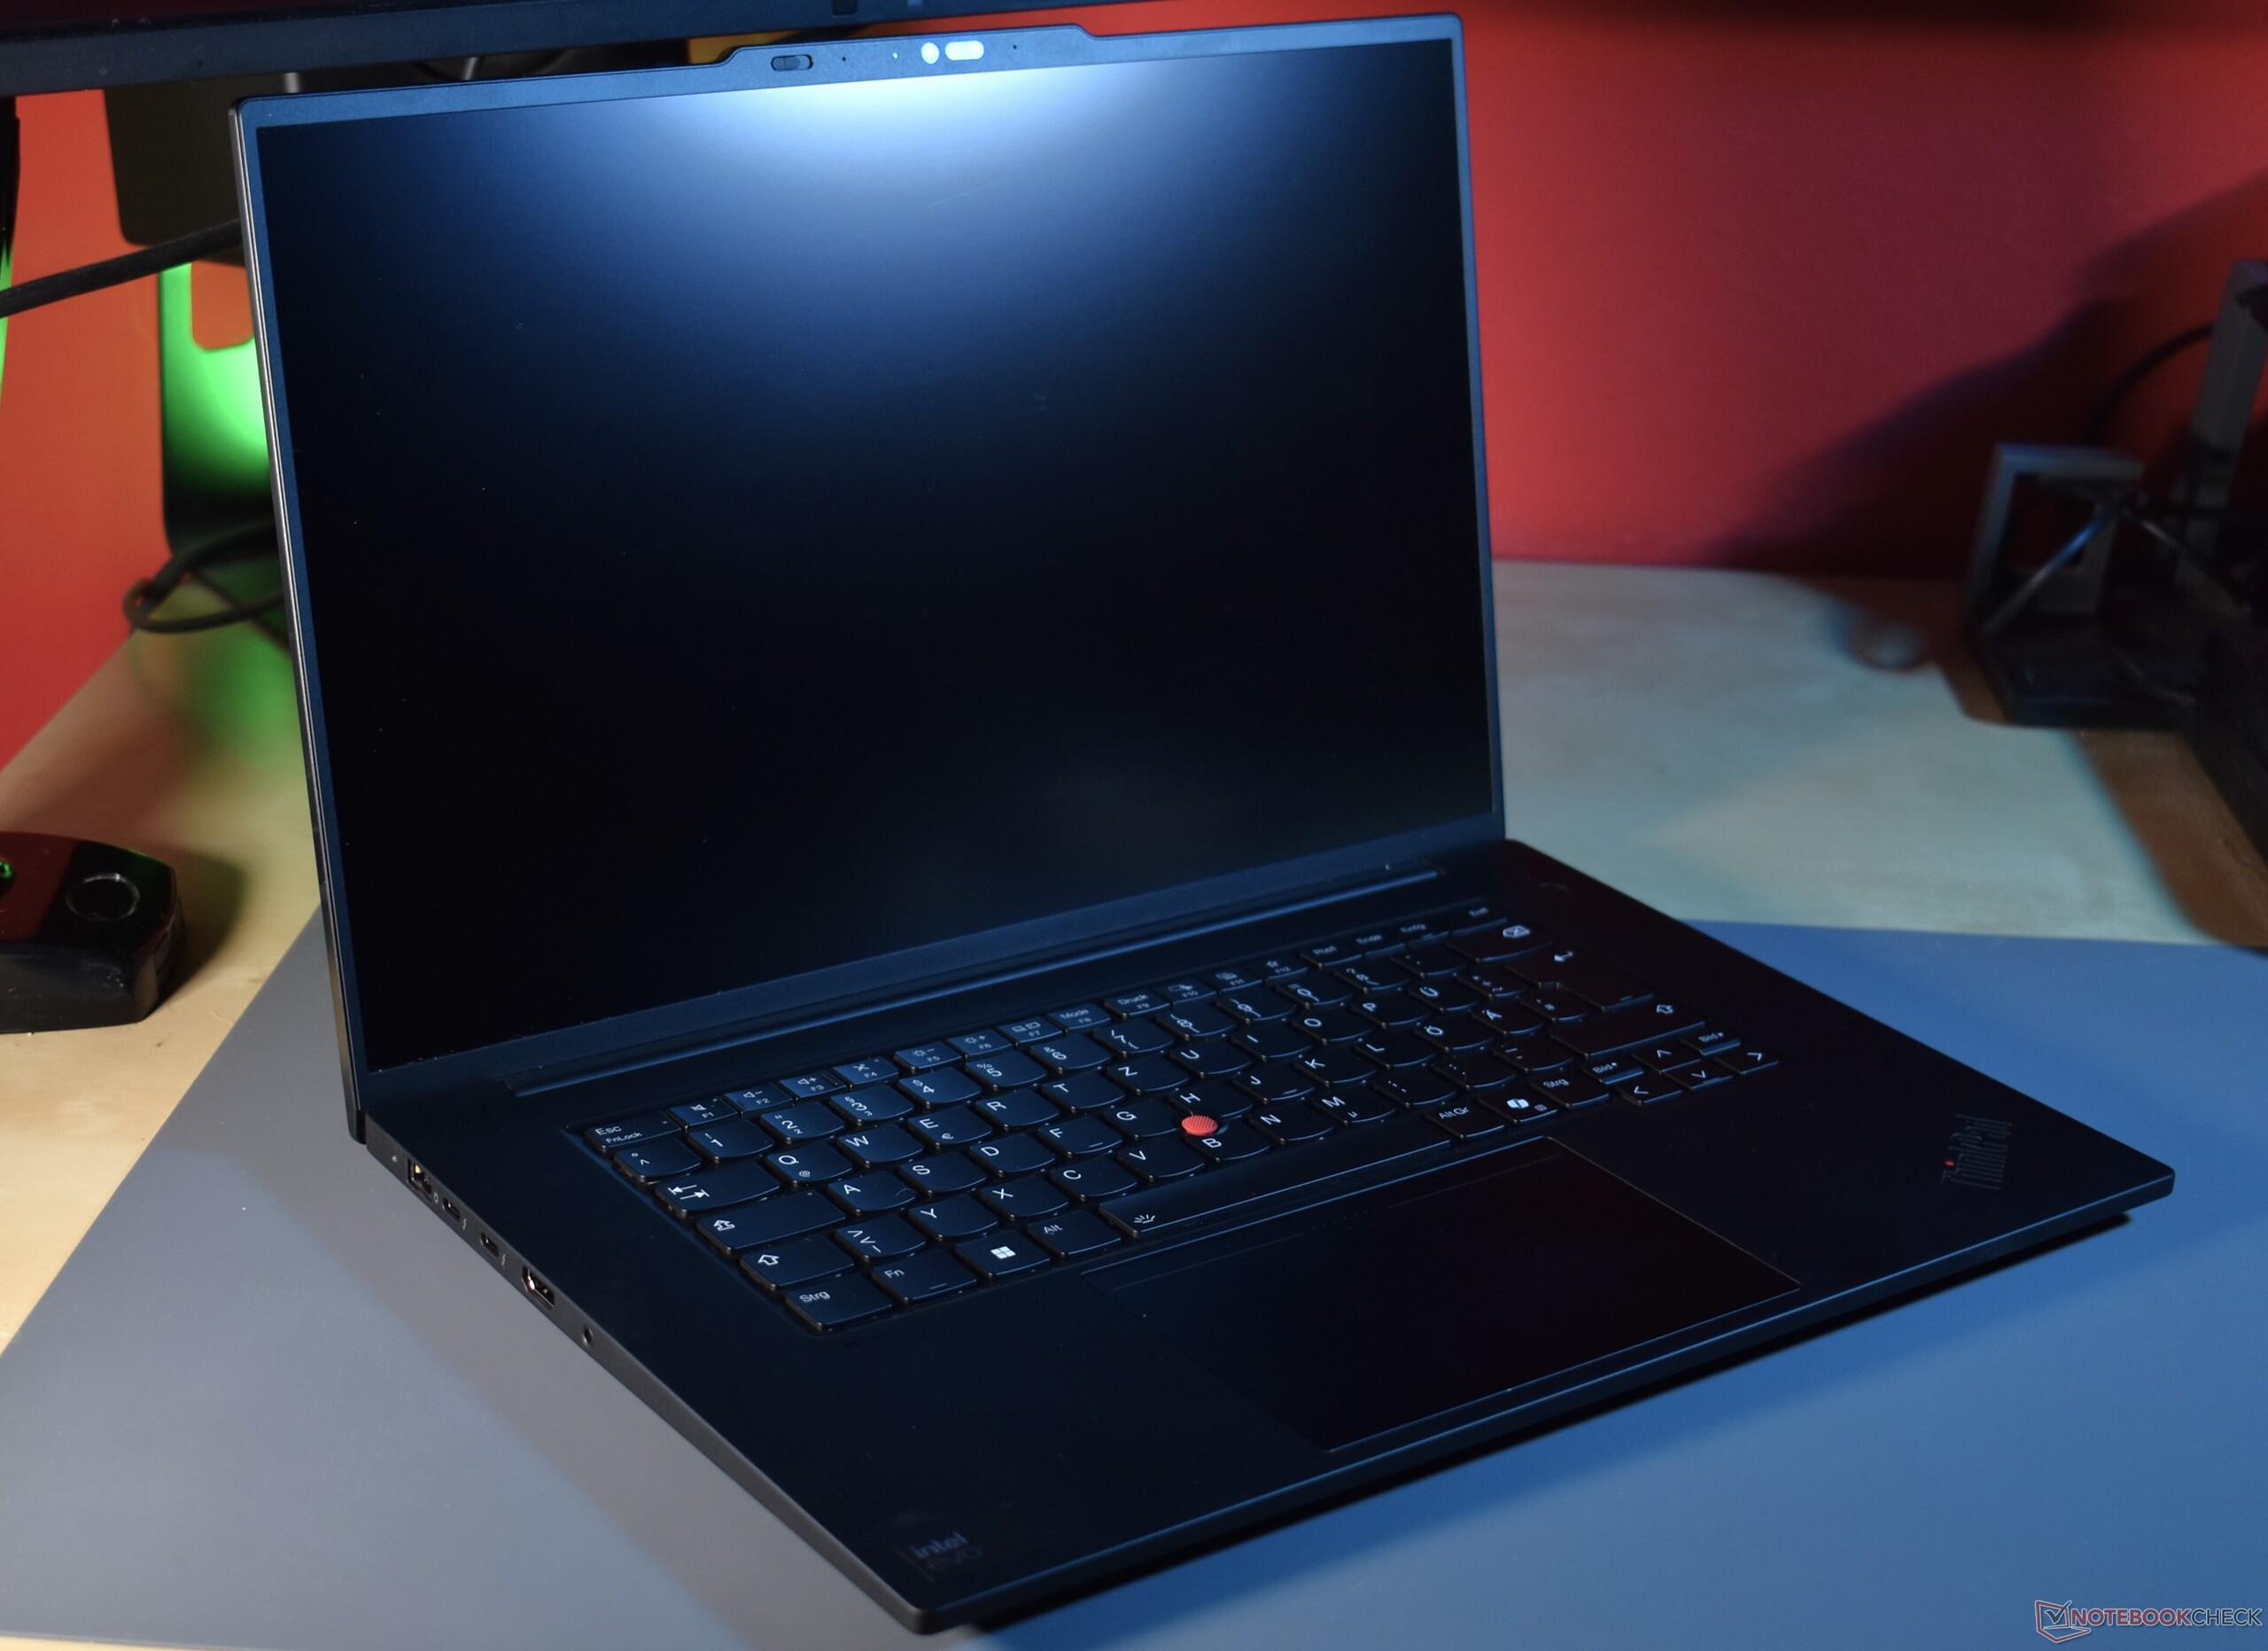
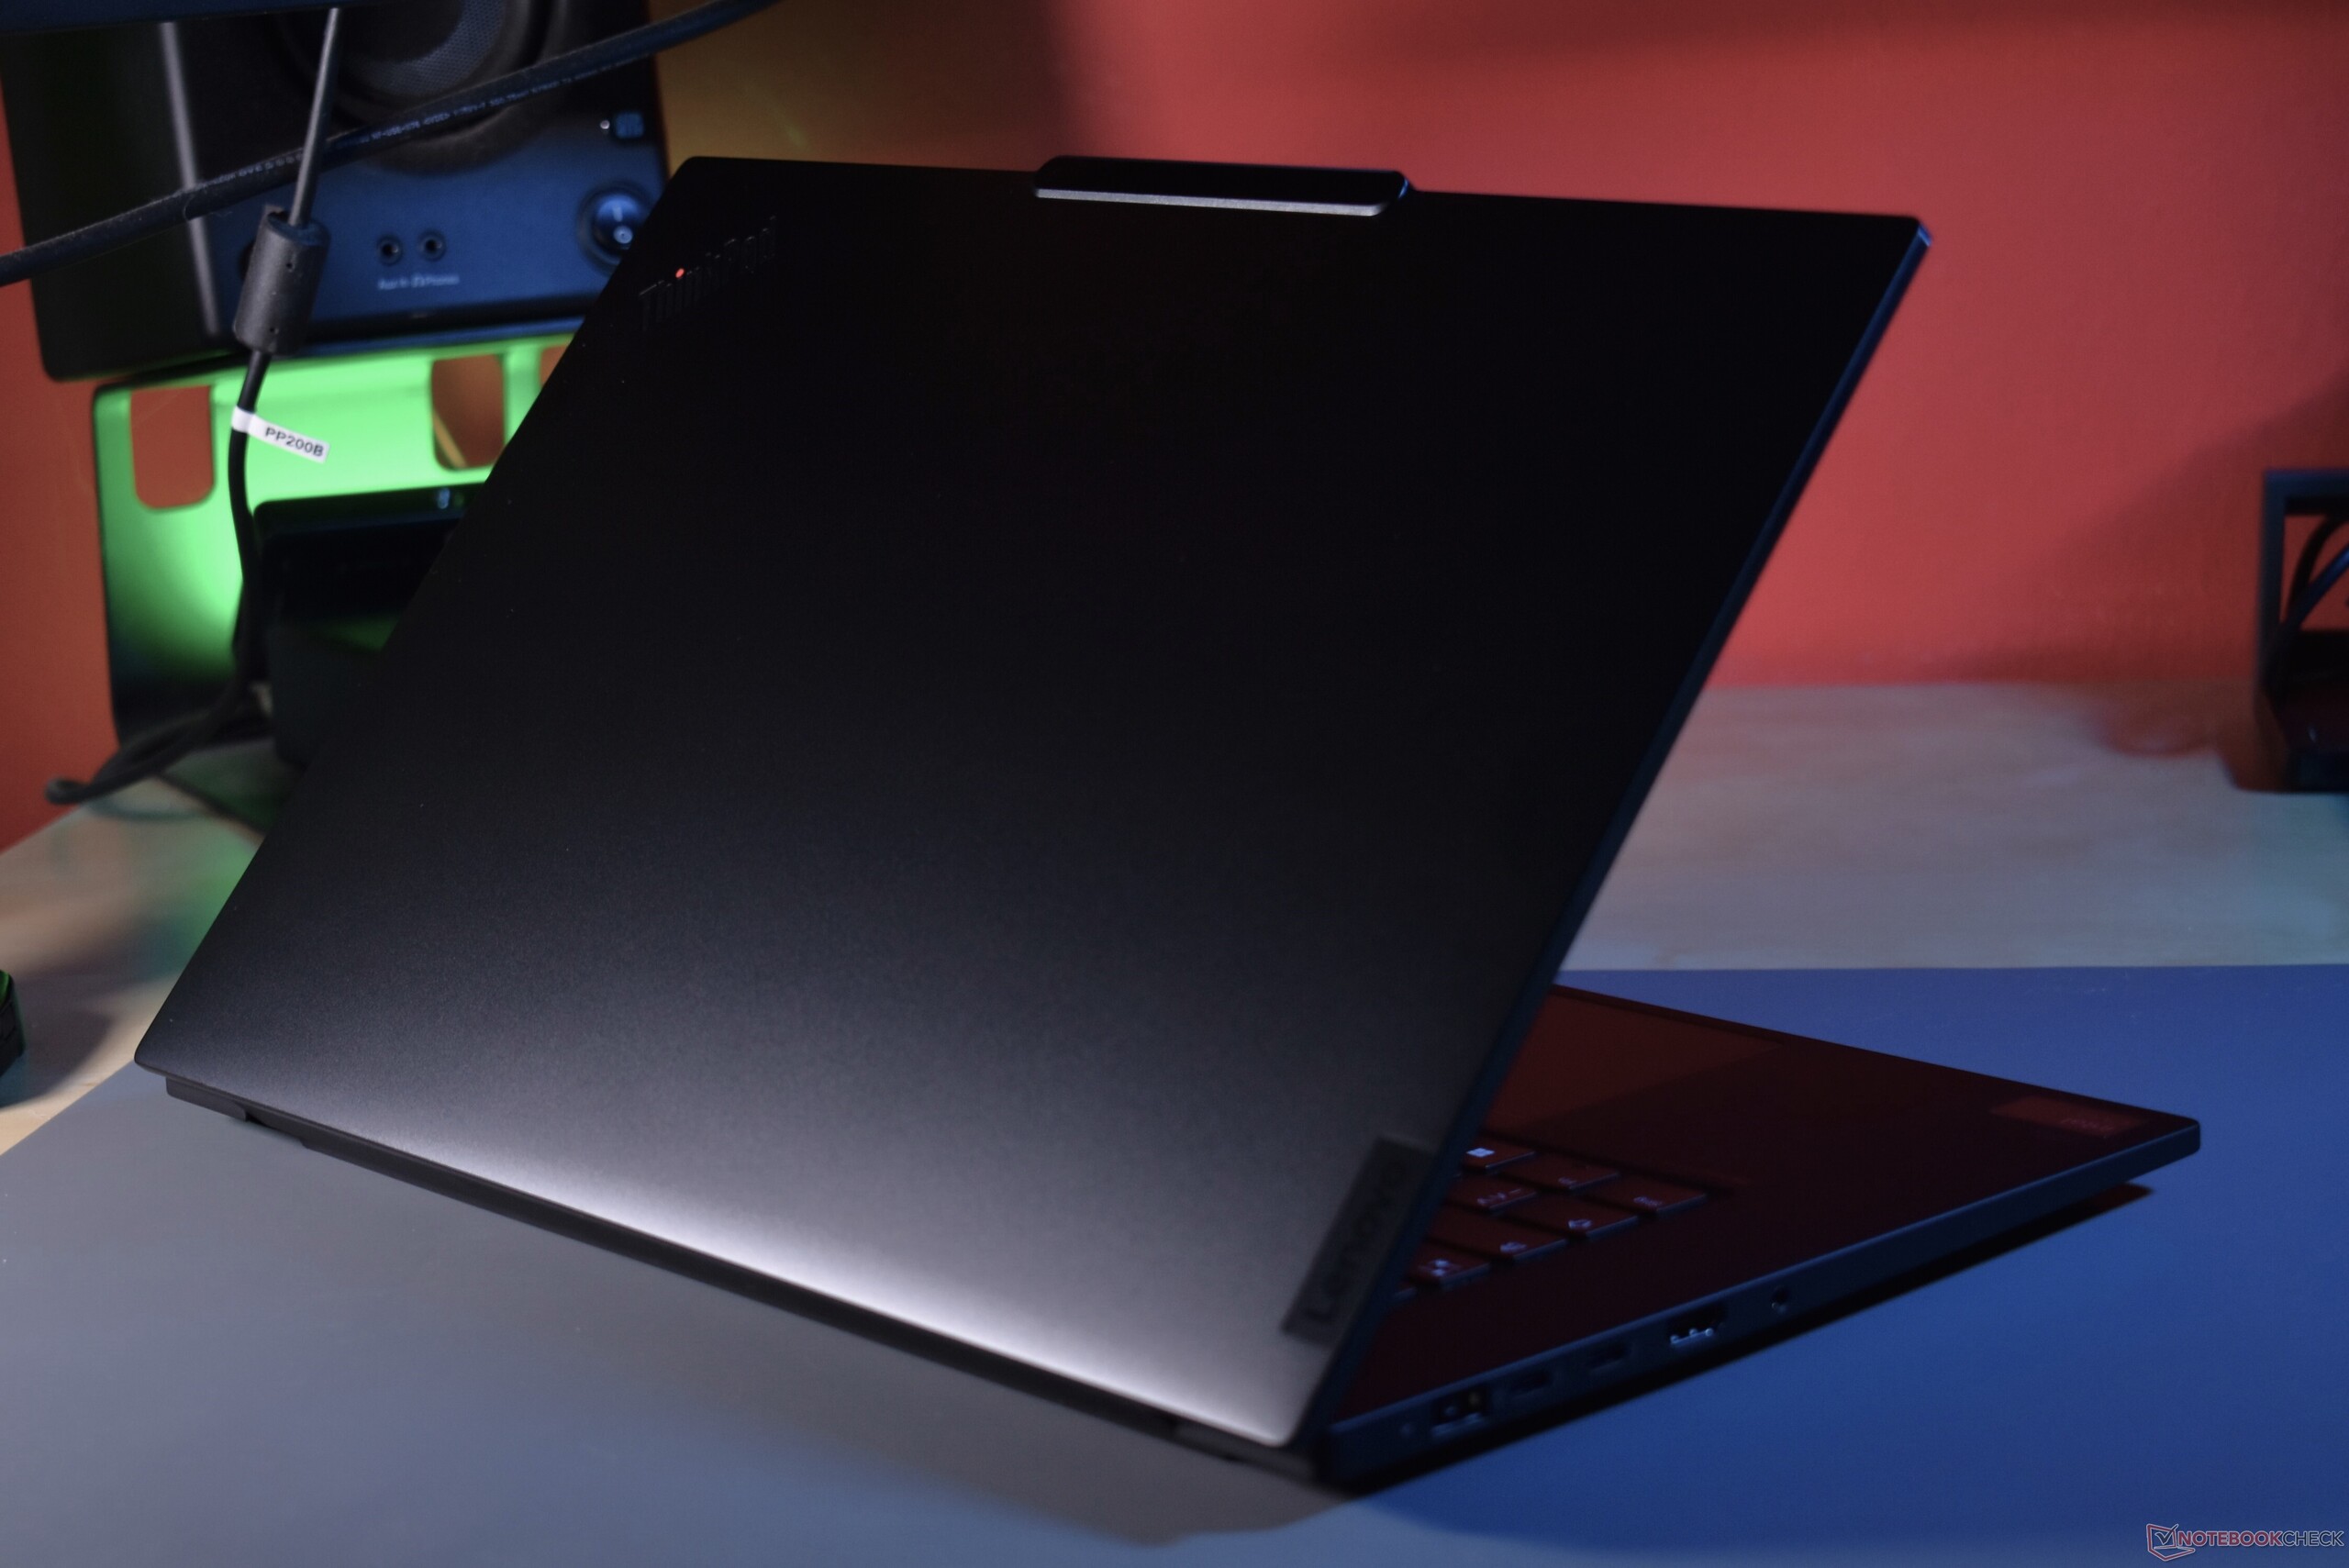
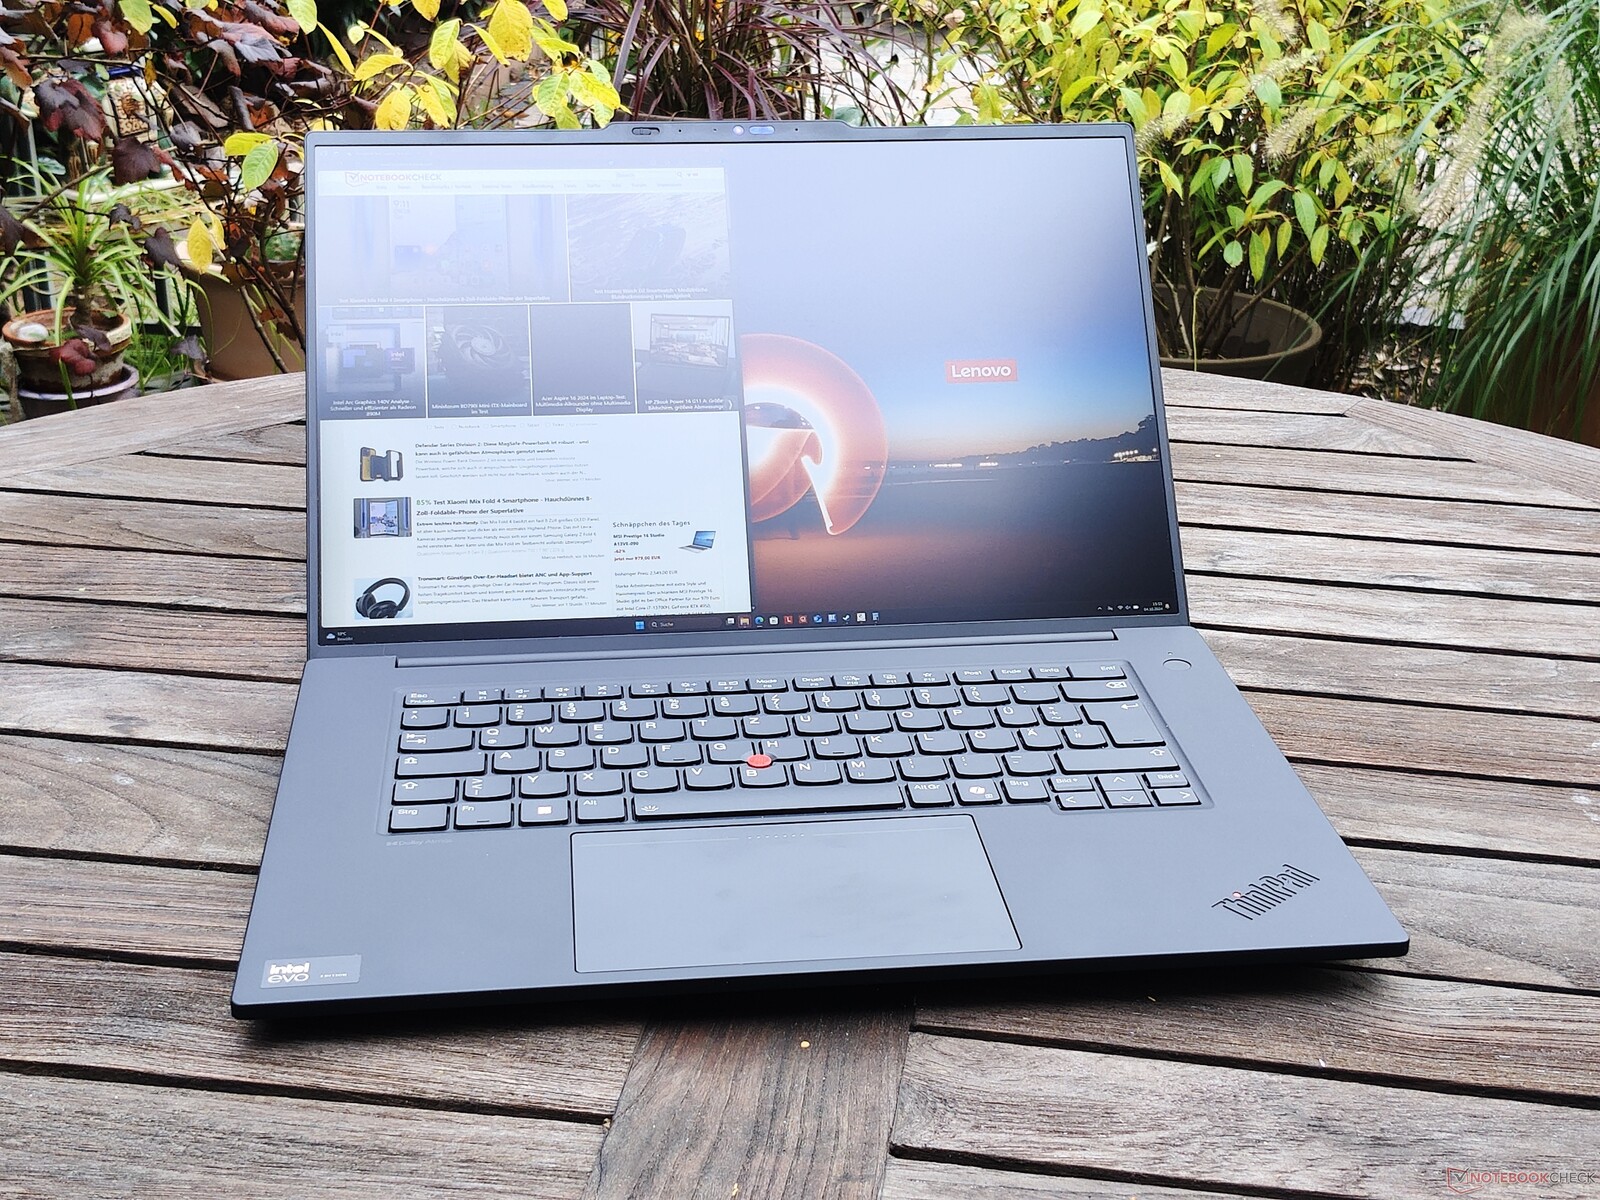
机箱:ThinkPad P1 采用铝合金机身,而非碳纤维机身
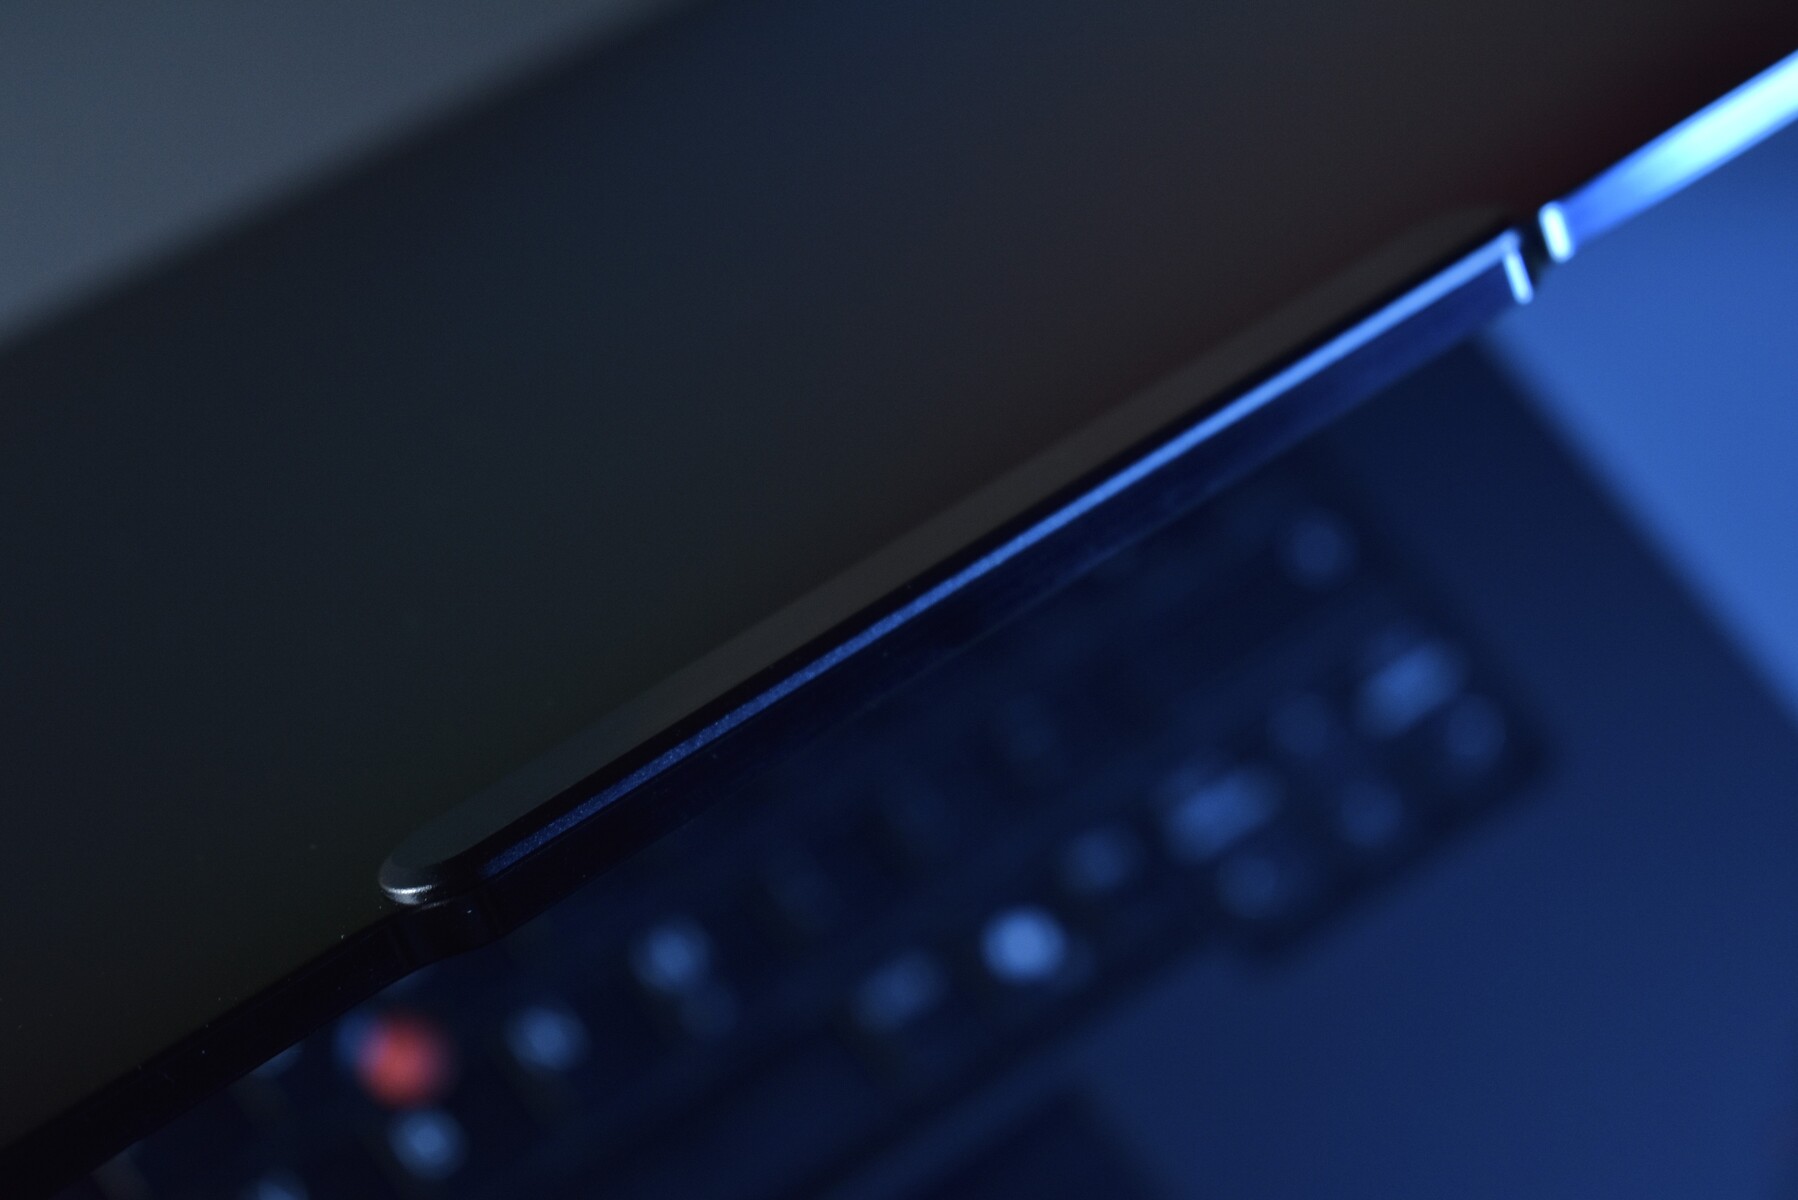
从一开始,联想 ThinkPad P1 基本上就是更大的 ThinkPad X1 Carbon。它采用了与小尺寸超极本相同的结构和材料,只是更厚一些,尺寸也更大,为 15.6 或 16 英寸(因为联想 ThinkPad P1 4 代是 15.6 英寸)。 联想 ThinkPad P1 第 4 代).在 ThinkPad P1 Gen 7 上,联想打破了这一规则,至少是一点点。联想不再使用经典的碳纤维橡胶顶盖,而是采用了黑色阳极氧化铝和钻石切割边。其他设计上的变化也借鉴了 ThinkPad X1 Carbon G12如摄像头凸起。与以前大不相同的还有新的触觉触摸板,它集成了 TrackPoint 按钮--更多内容请参阅输入设备部分,但总的来说,我们可以说 ThinkPad P1 现在看起来更像 ThinkPad Z16相比。其中之一就是屏幕边框更加纤薄。屏幕与机身的比例从 81% 增加到 87%。
在质量方面,重新设计的机型要比之前的机型高出一个档次,这是因为铝制屏幕盖提供了更高的硬度。ThinkPad 笔记本电脑的任何地方都不会凹陷,几乎不会弯曲。对于这样一款高端机型来说,做工是完美无瑕的。小缺点无论是橡胶底座还是金属屏幕盖,黑色 ThinkPad 配色的防污性依然存在。
屏幕可完全打开 180 度。两个铰链为宽大的单件式条形,足够平滑,可以单手打开,并且足够坚硬,可以防止屏幕晃动。 在打开盖子时,摄像头凸起成为一个有用的握把。

重量略有增加,但 X/Y 基底面却变小了。重量增加的原因是盖子采用了密度更大的铝材料。另一方面,由于屏幕边框更加纤薄,P1 7 代明显比 P1 6 代更加小巧。所有竞争对手都更重。以 戴尔 XPS 16的差异则非常明显。
连接性:联想用 LPCAMM2 取代 SO-DIMM
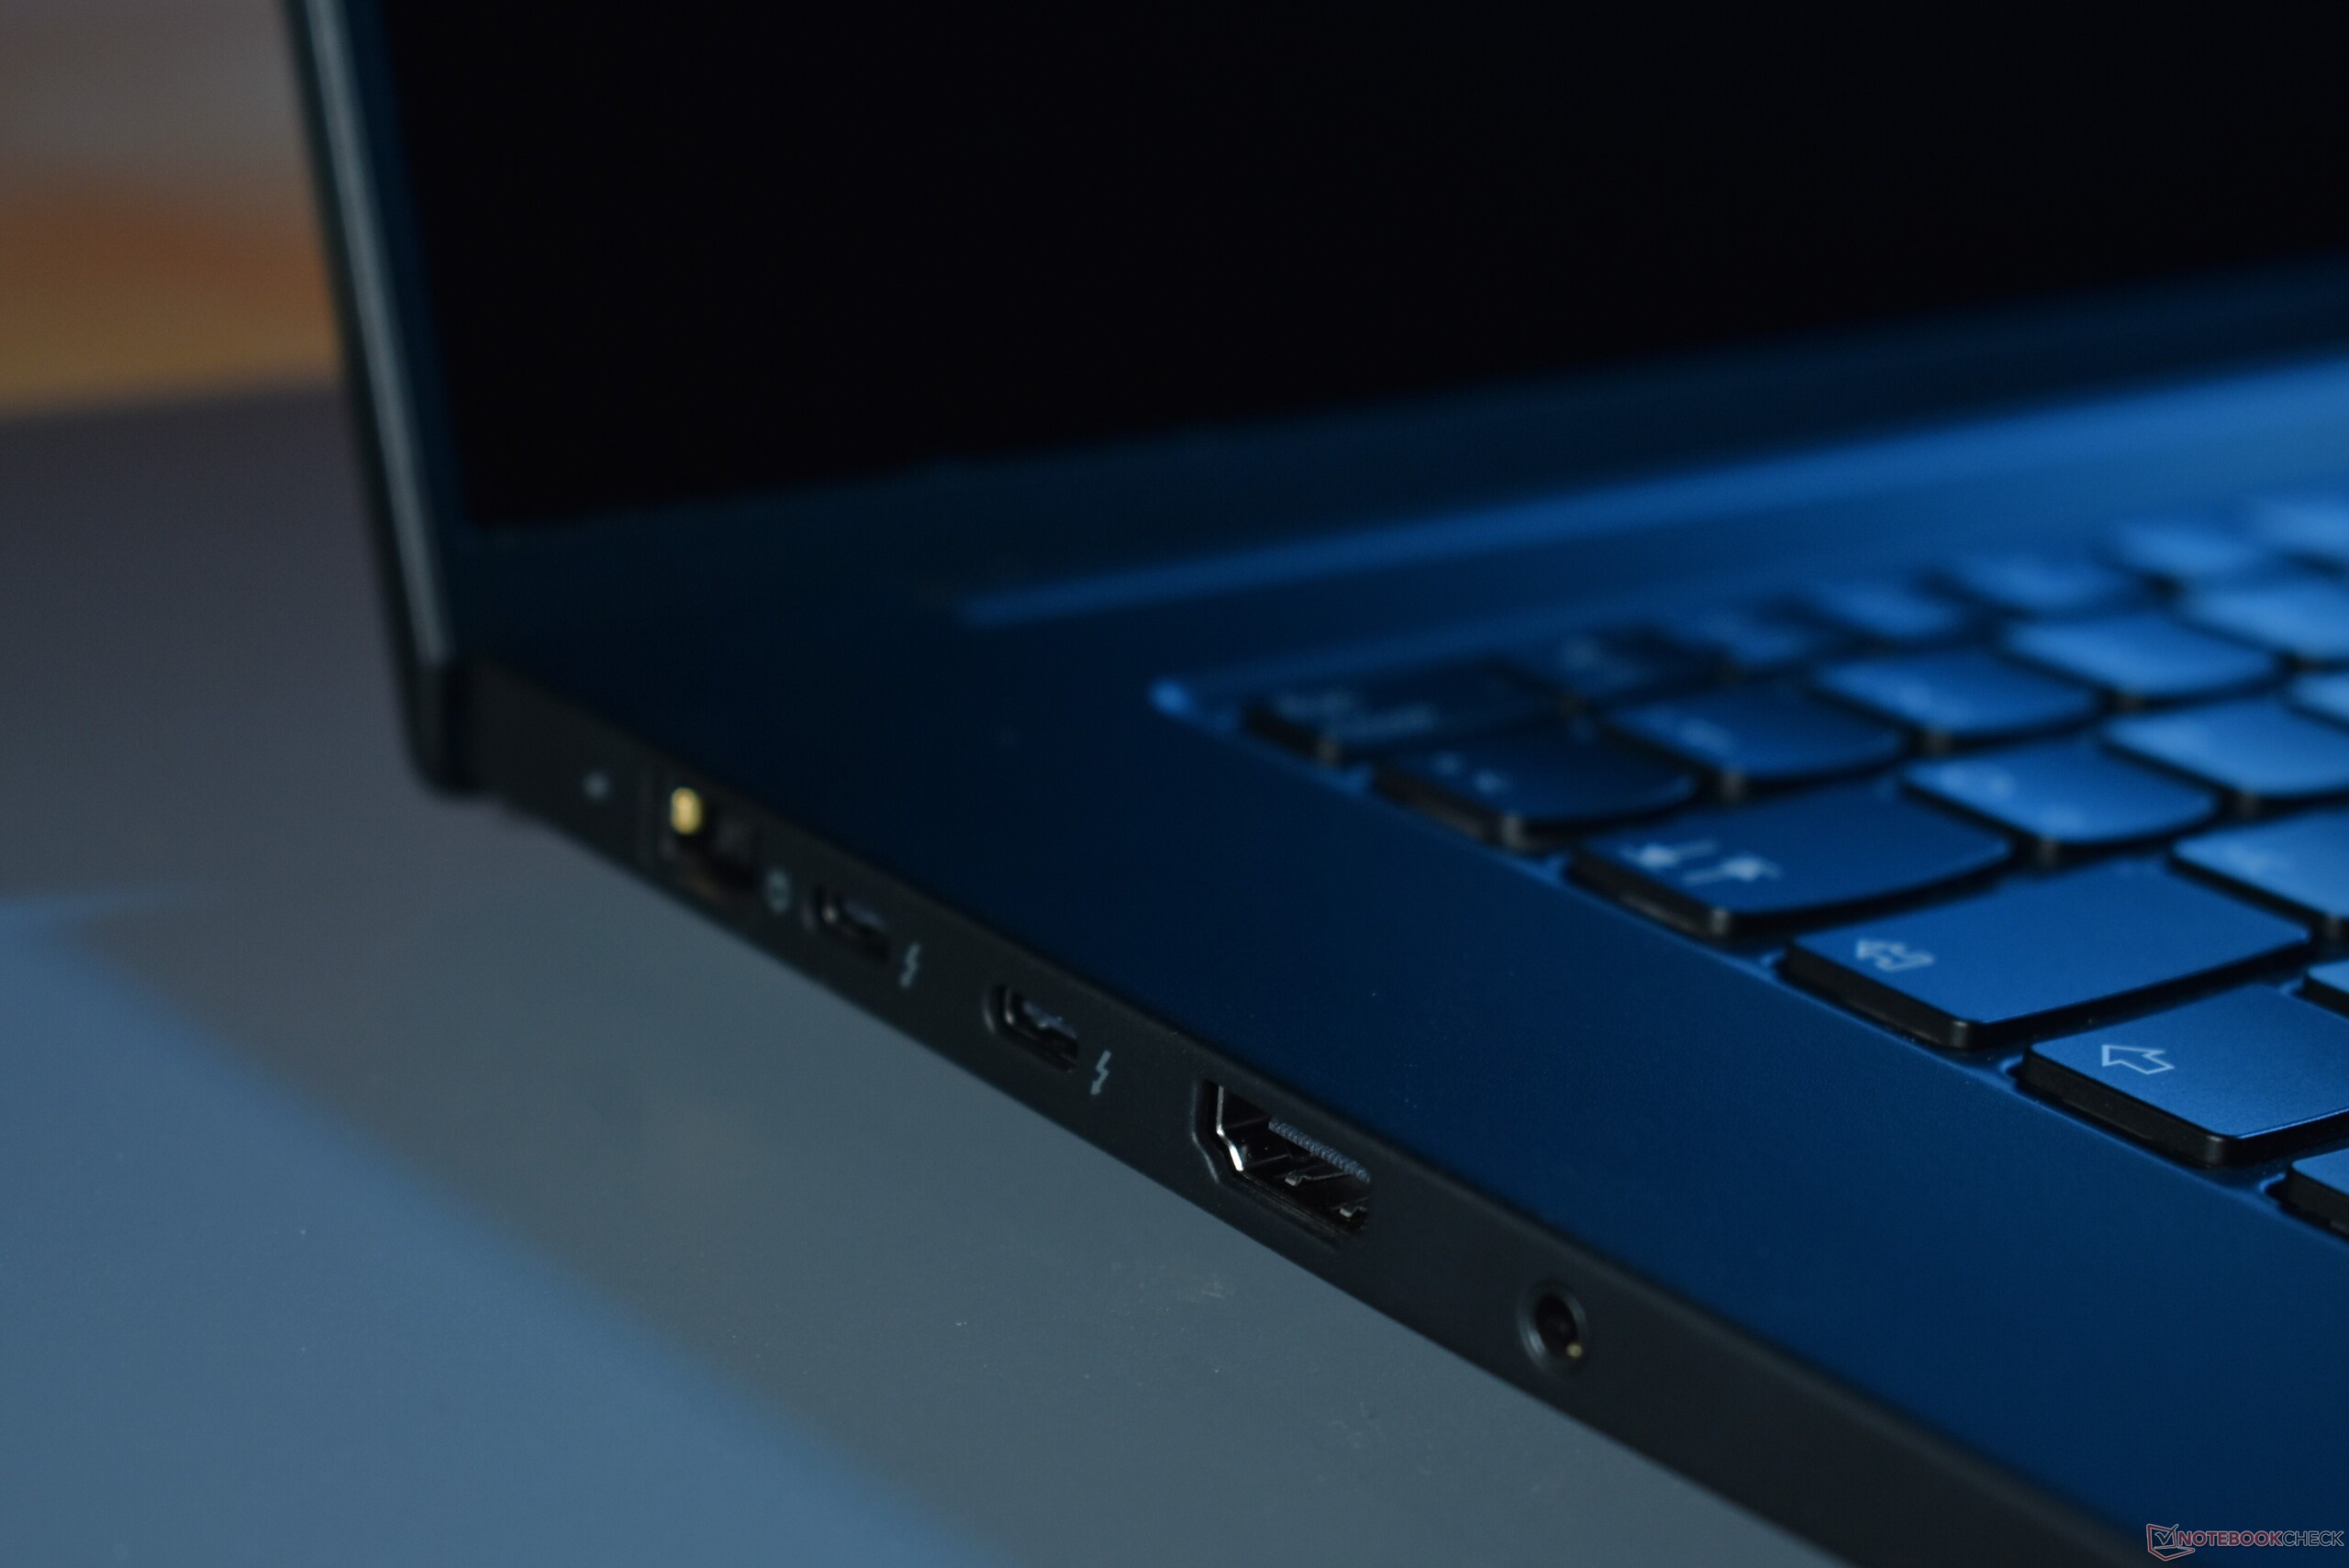
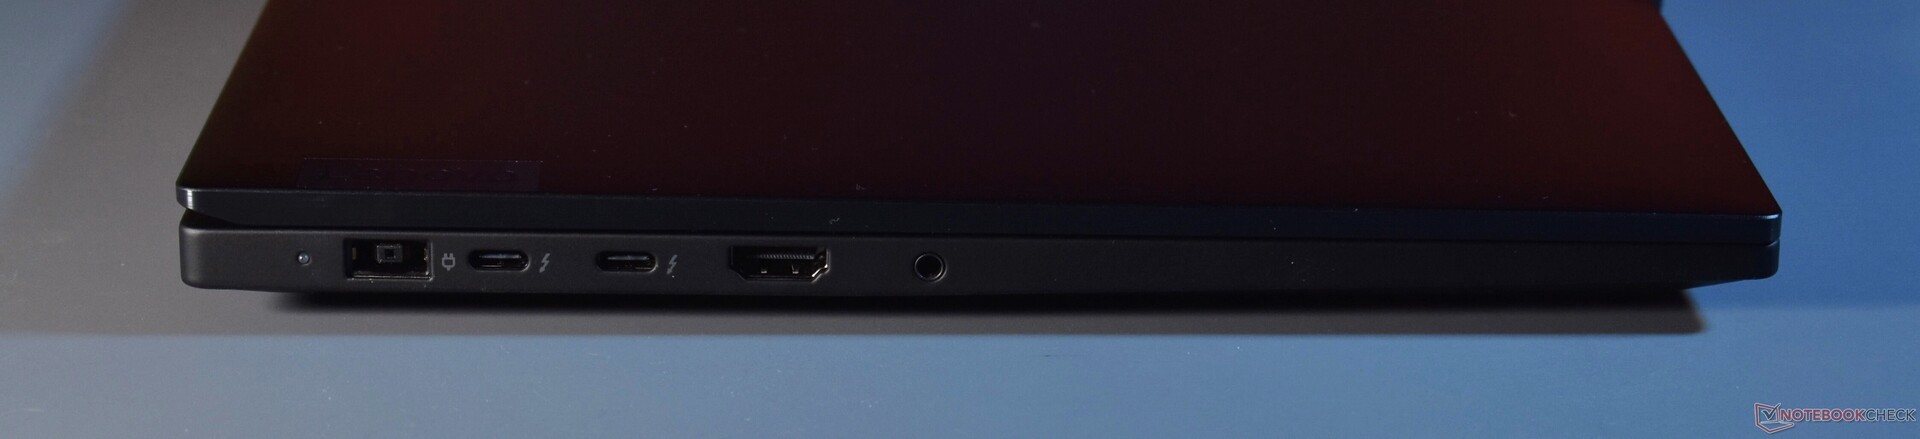
端口方面没有大的革新,联想保留了许多传统的连接器。唯一的实质性变化是:两个 USB-A 端口中的一个被 USB-C 端口取代。其中,没有三个端口,左边的两个端口支持 Thunderbolt 4。右侧的新端口至少支持 DisplayPort。
每个 USB-C 端口都可以充电,不过还有一个专用的 Slim tip 充电接口。使用 100 W USB-C 充电器,P1 G7 可以正常工作。只有在最大负载情况下,性能才会有所下降。65 瓦的充电器也能为 P1 充电,但 ThinkPad 笔记本电脑会抱怨,提示 "充电器速度慢"。
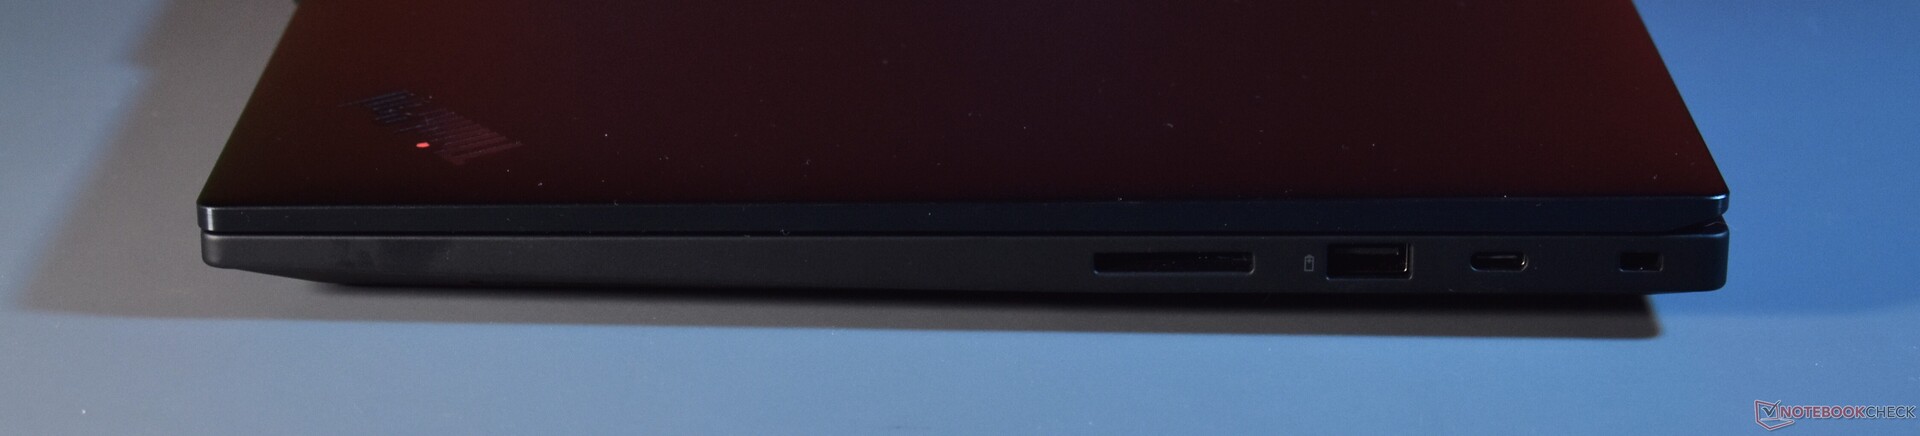
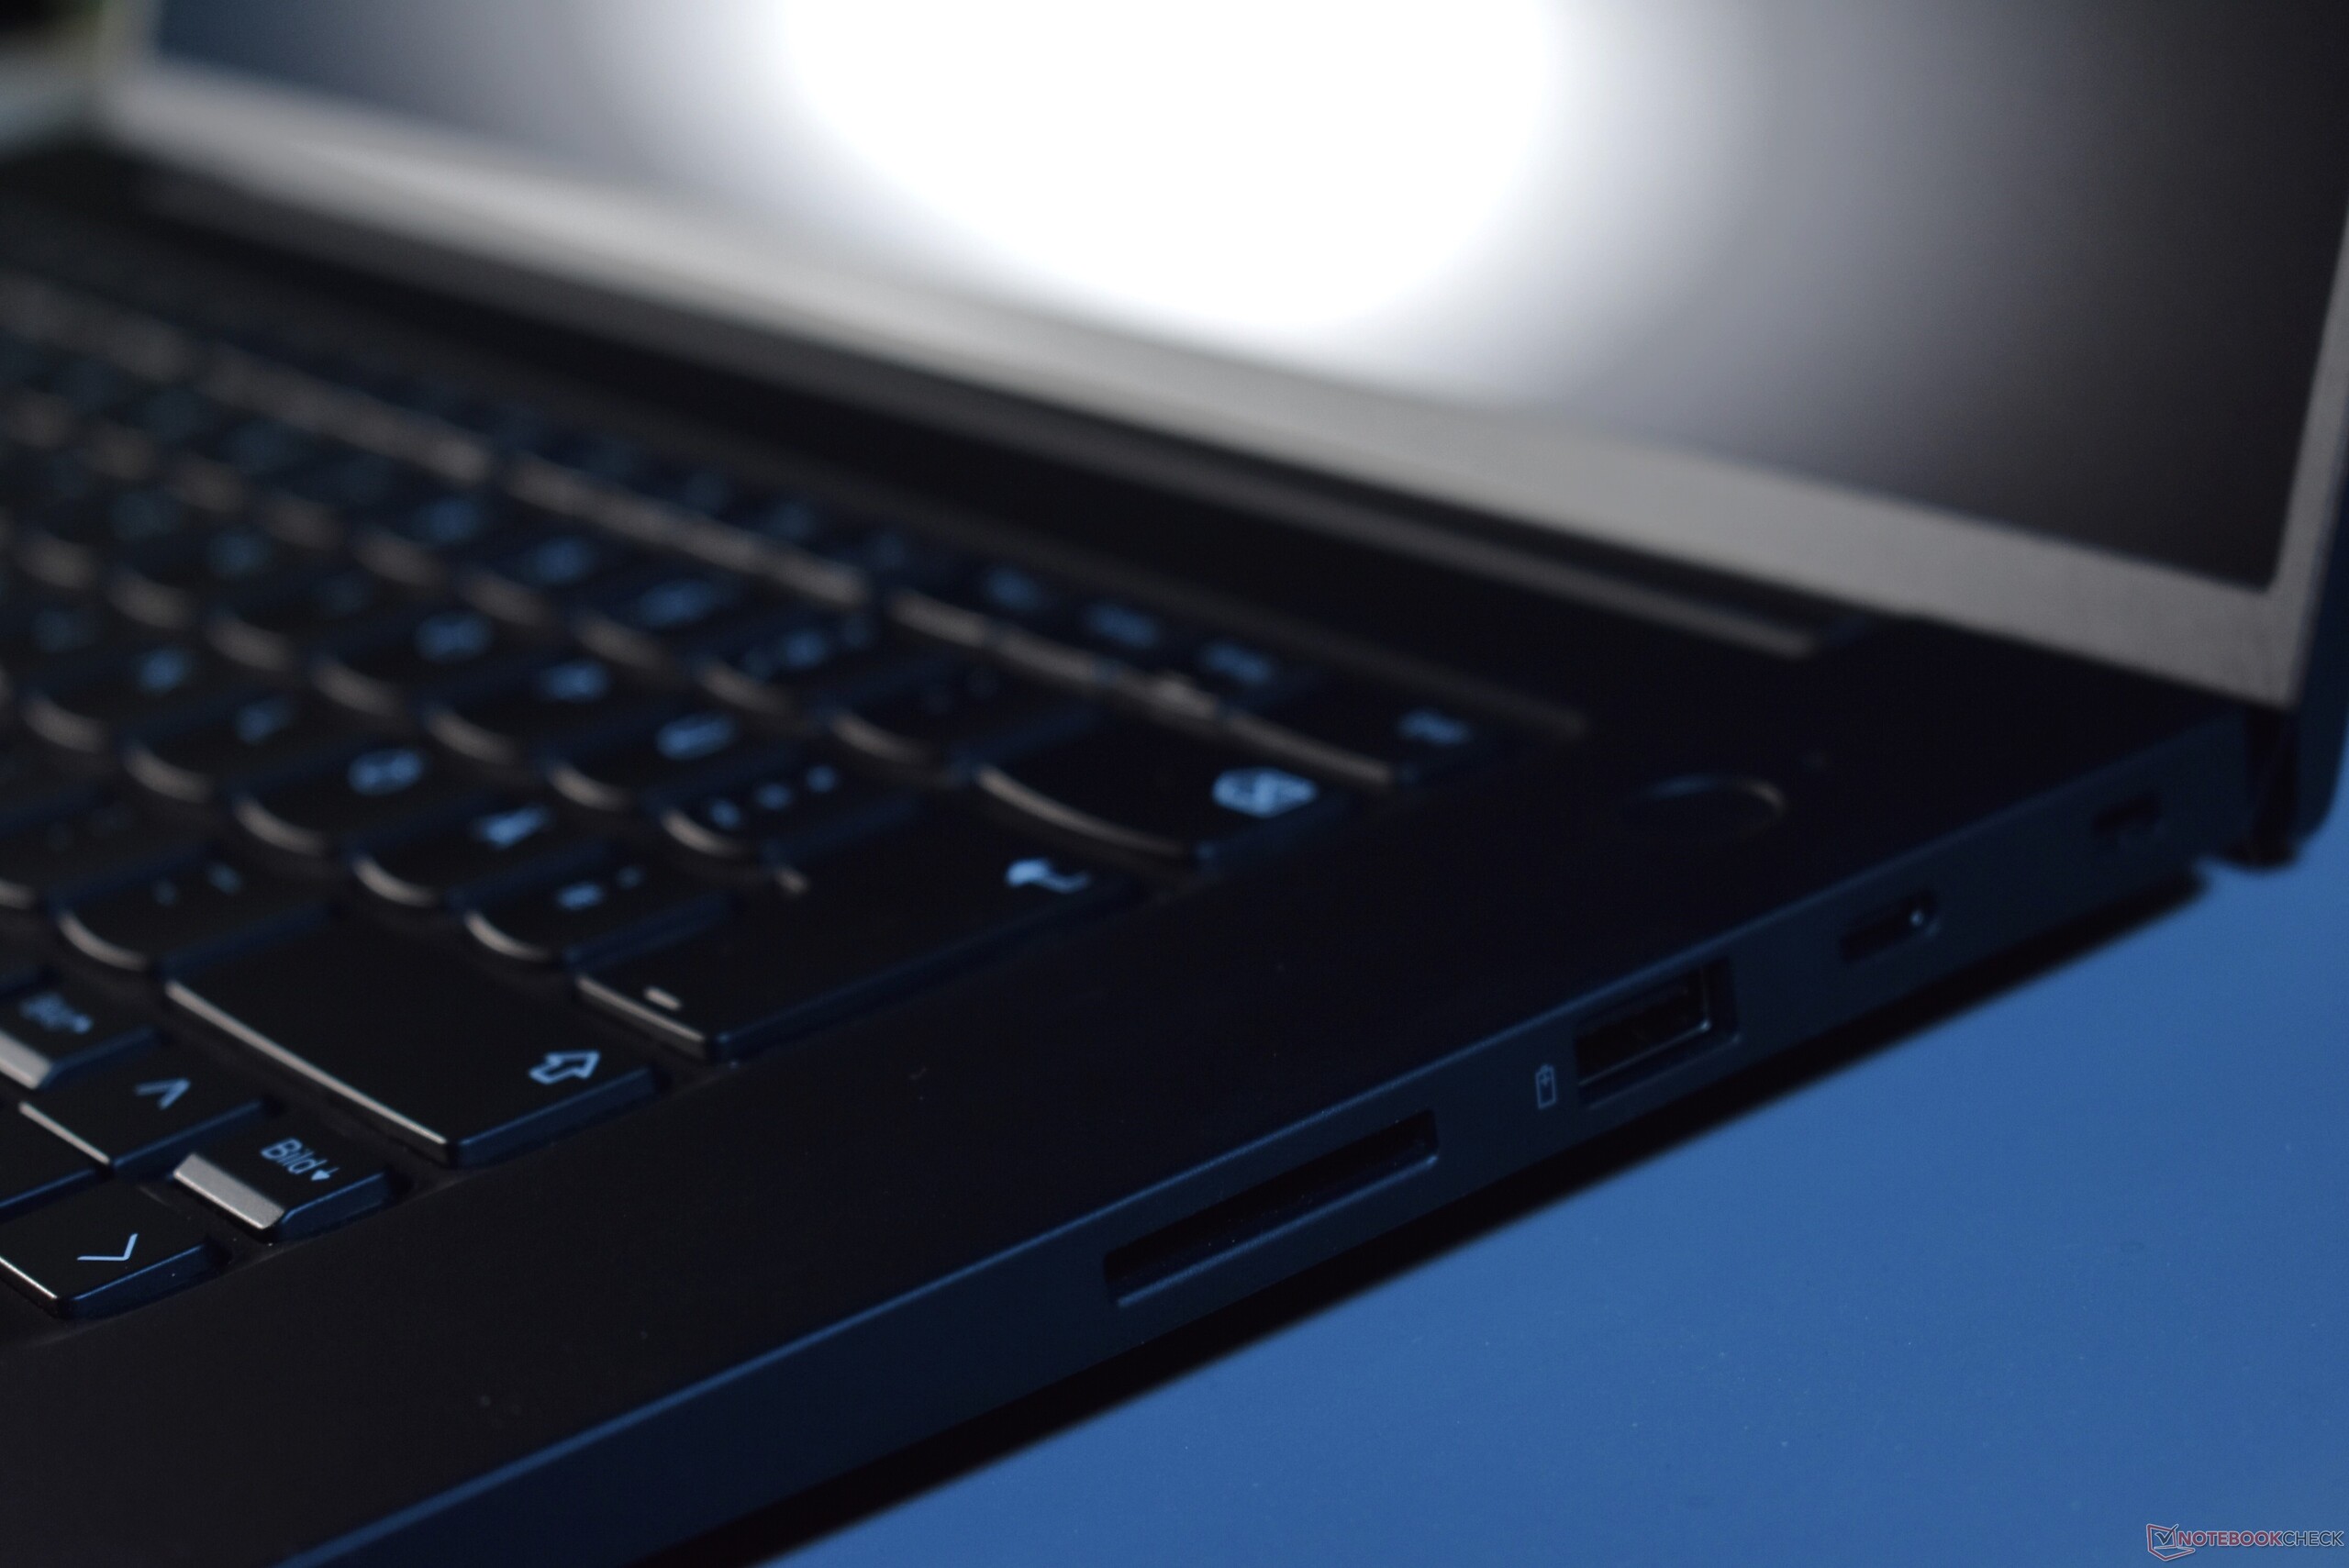
SD 读卡器
令人惊喜:联想 ThinkPad P1 第 7 代的读卡器可以再次完全接收 SD 卡,这对永久存储扩展非常有用。比较令人失望的是传输速率,我使用 Angelbird AV Pro V60 参考卡进行了测量。SD 读卡器的速度一般。
| SD Card Reader | |
| average JPG Copy Test (av. of 3 runs) | |
| Dell XPS 16 9640 (Angelbird AV Pro V60) | |
| Average of class Workstation (49.6 - 200, n=12, last 2 years) | |
| Lenovo ThinkPad P1 G6 21FV001KUS (Toshiba Exceria Pro SDXC 64 GB UHS-II) | |
| Lenovo ThinkPad P1 Gen 7 21KV001SGE (AV Pro V60) | |
| maximum AS SSD Seq Read Test (1GB) | |
| Dell XPS 16 9640 (Angelbird AV Pro V60) | |
| Average of class Workstation (85.1 - 227, n=12, last 2 years) | |
| Lenovo ThinkPad P1 G6 21FV001KUS (Toshiba Exceria Pro SDXC 64 GB UHS-II) | |
| Lenovo ThinkPad P1 Gen 7 21KV001SGE (AV Pro V60) | |
交流
ThinkPad P1 Gen 7 的 Wi-Fi 解决方案面向未来。联想采用了英特尔的 Wi-Fi 7 解决方案 BE200。它能产生很高的传输速率。
除了 Wi-Fi,这款 ThinkPad 工作站只提供蓝牙 5.4。没有 RJ45 以太网,也没有 WWAN。4G 或 5G 早在几年前就从 P1 系列中停产了,而且看起来这一功能不会在短期内再次出现。
网络摄像头
联想 ThinkPad P1 7 代的网络摄像头分辨率为 500 万像素。在前代机型上,这仍然是一个可选的升级。作为一款笔记本电脑,网络摄像头的质量相对较好,在光线充足的情况下,照片相当清晰。


安全
由于这是一款企业机型,联想 ThinkPad P1 Gen 7 提供了 T 系列等用于办公任务的标准机型所具备的大部分安全功能。在这些功能中,我们发现了肯辛顿锁插槽、电源按钮中的指纹识别器以及 dTPM 芯片、底盖底部防拆检测和用于 Windows Hello 的红外摄像头。与 ThinkPad Z16 不同的是,联想为 ThinkPad P1 G7 配备了物理摄像头快门,以提高私密性。智能卡读卡器不在包装内。
配件
在充电器方面,联想则更胜一筹。P1 G7 没有配备 230 W 的充电器,而只配备了 170 W 的充电器,更加轻便小巧。它仍然是一个带有 Slim tip 接头的专有充电器,但 USB-C 充电功率也可高达 100 W。
维护
联想让接触 ThinkPad 内部变得非常容易,因为固定底盖的六颗螺丝都是固定的,可以防止丢失。螺丝采用飞利浦标准头,无需特殊工具。螺丝松开后,底座可以从背面的铰链处开始打开。这里的夹子实际上是自己打开的。
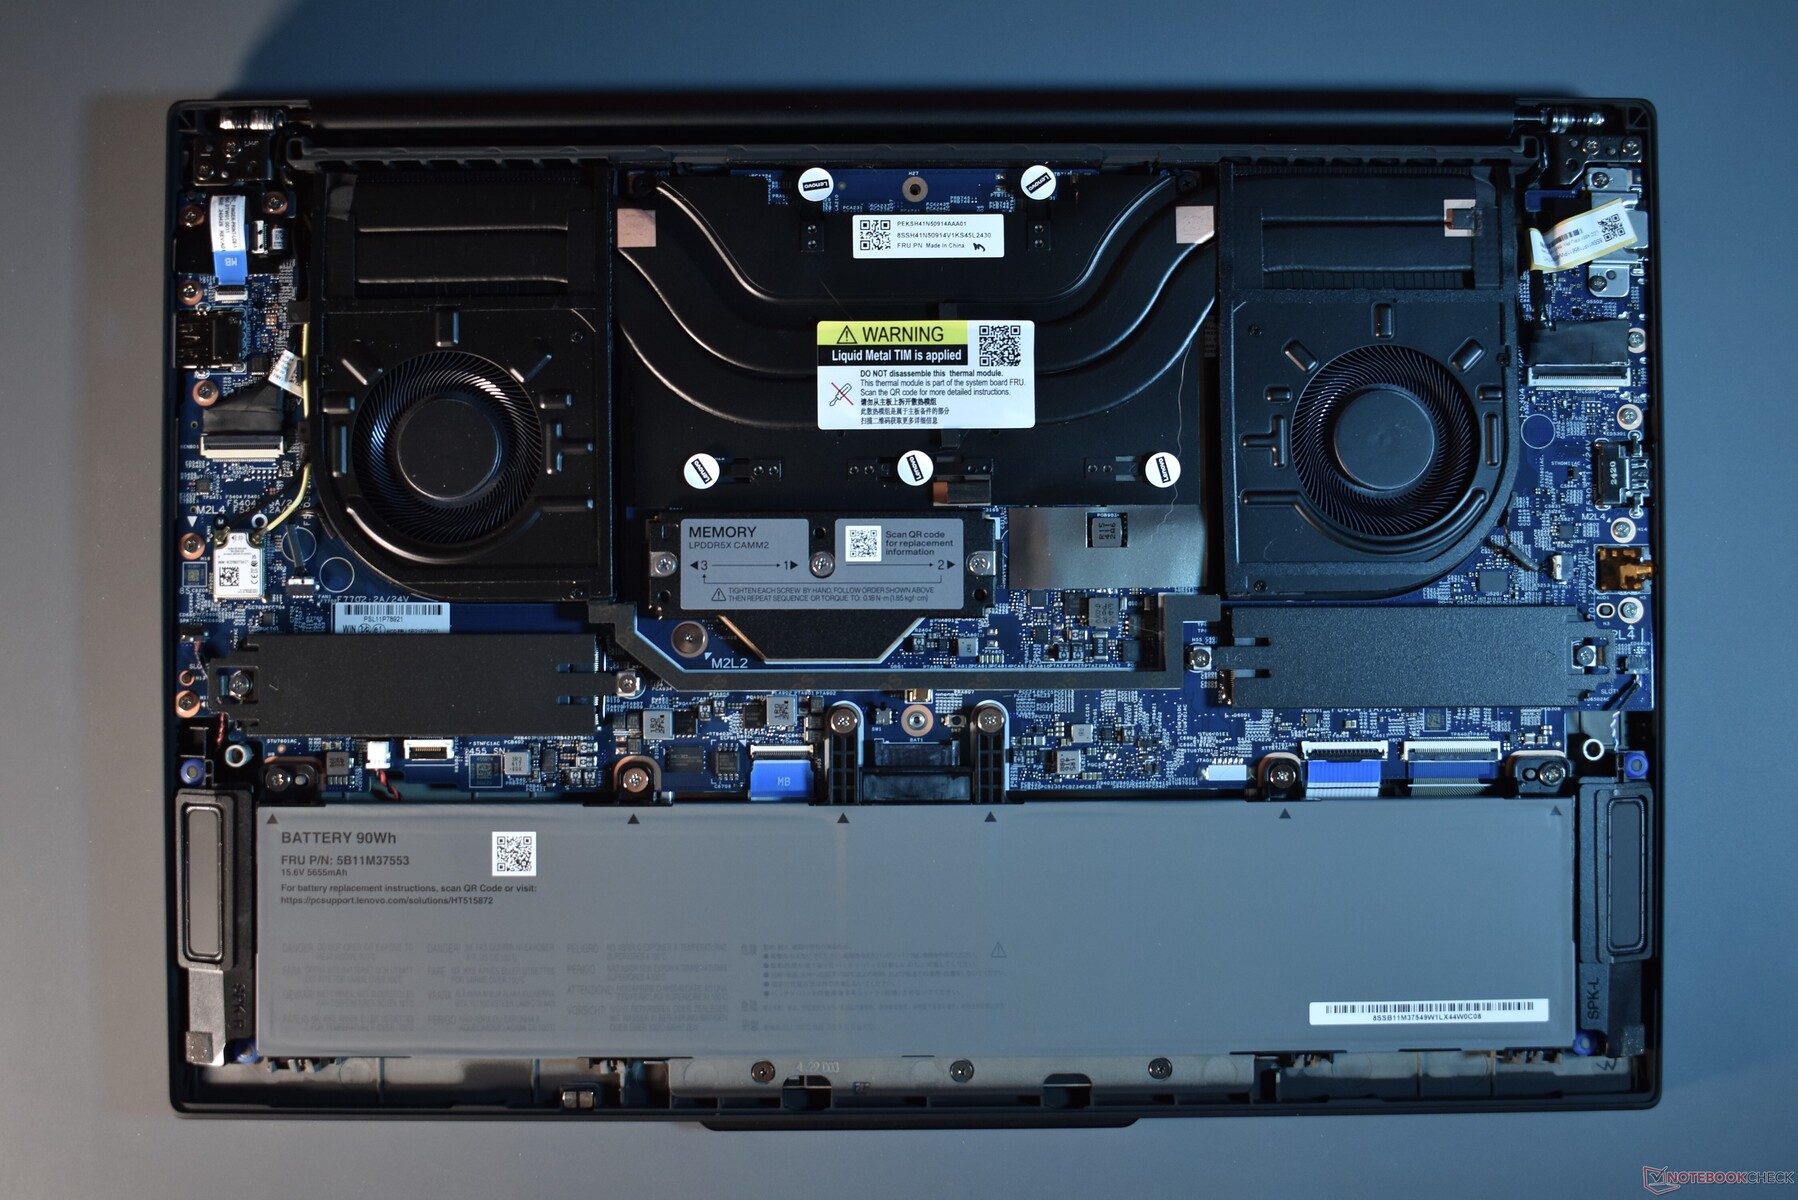
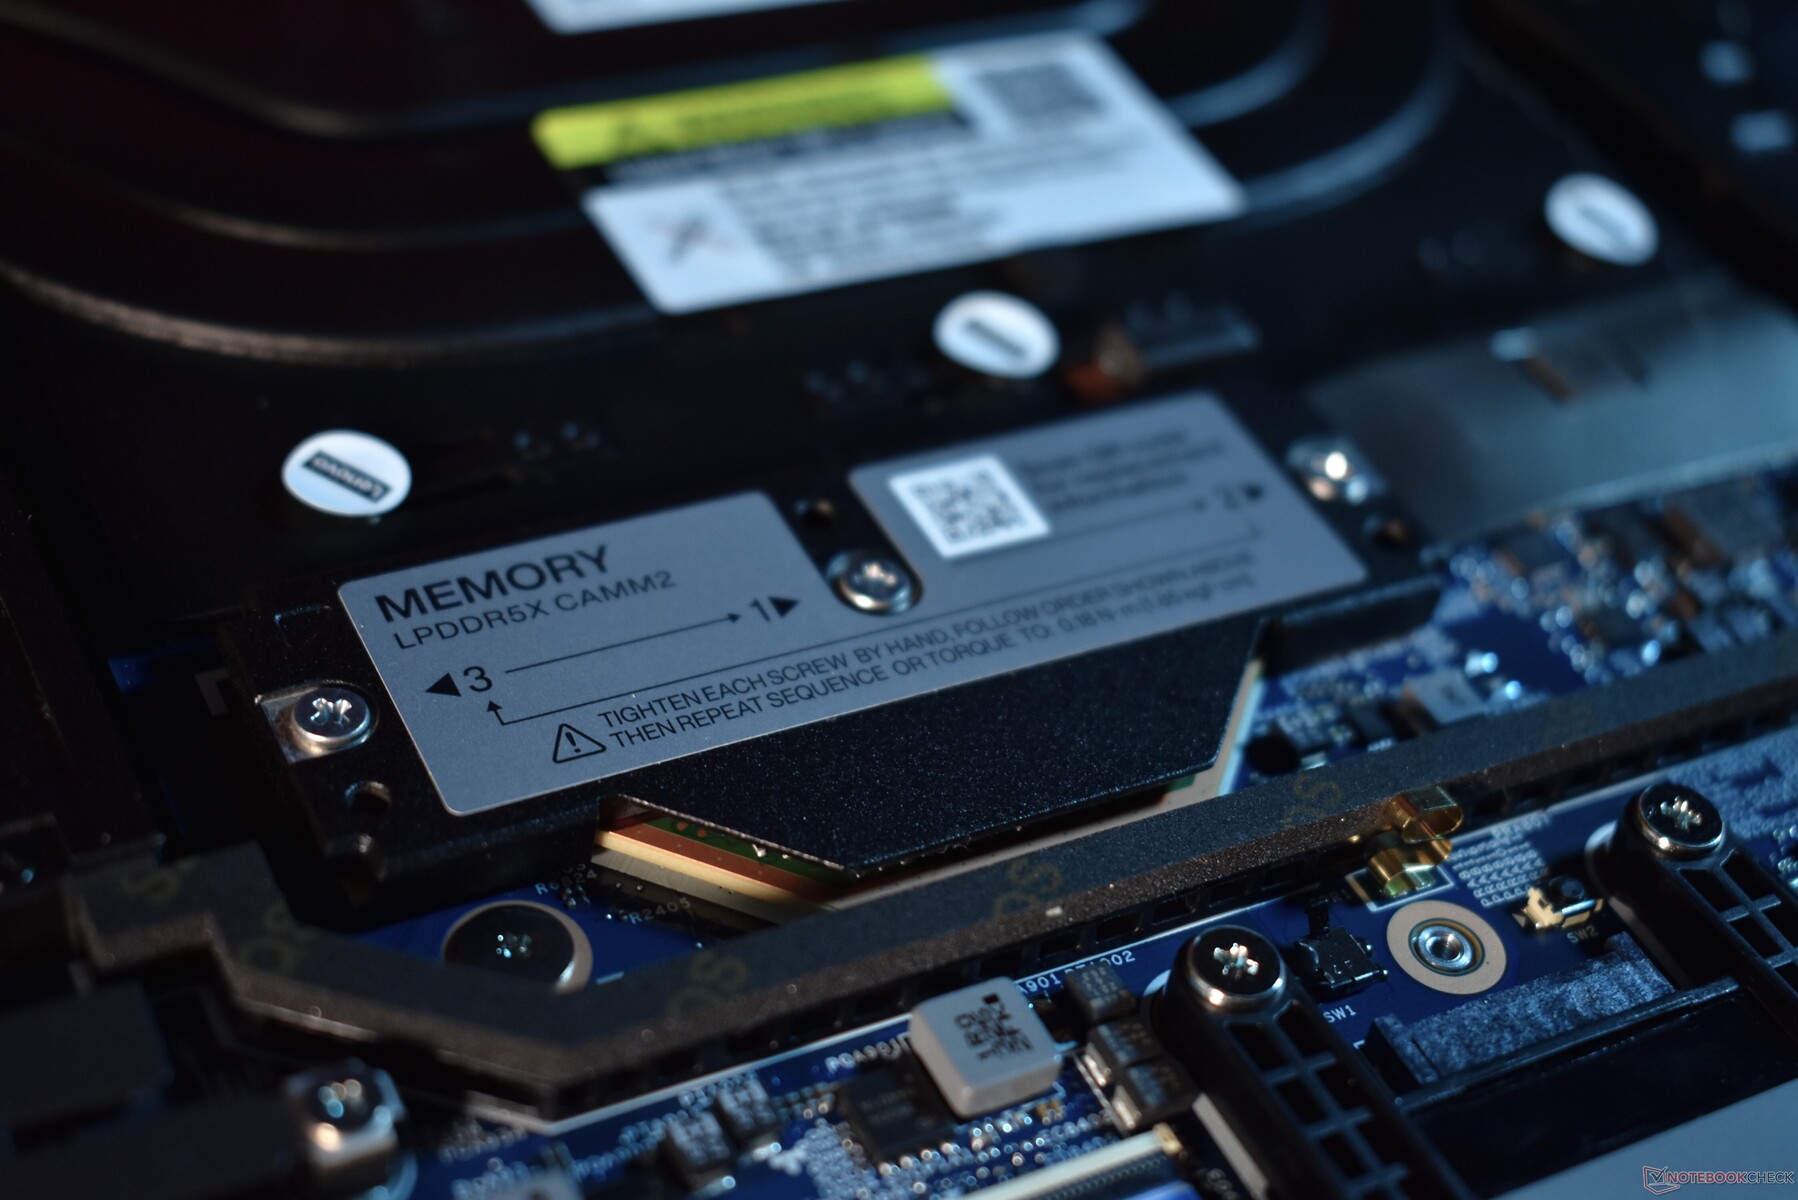
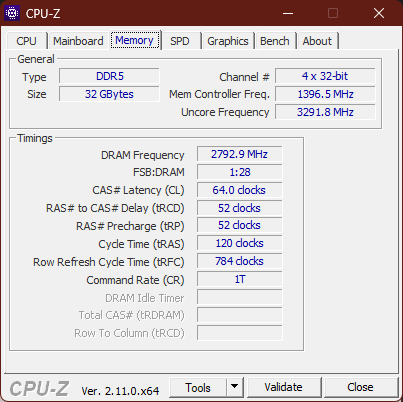
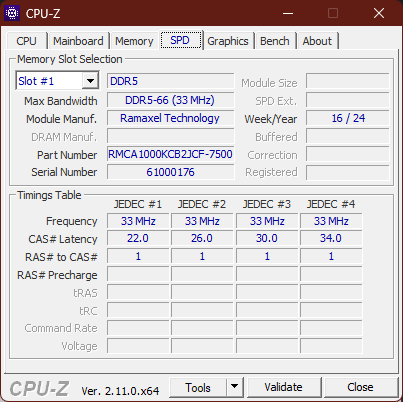
联想完全重新设计了内部结构。冷却系统比前代产品略小 ThinkPad P1 6 代.作为一项增益,ThinkPad P1 Gen 7 始终拥有两个 M.2 2280 插槽,而只有 P1 Gen 6 的最弱版本才有这种插槽。此外,两个 SO-DIMM 插槽也不见踪影。相反,联想采用了单个 LPCAMM2 模块--联想 ThinkPad P1 Gen 7 是有史以来第一款采用这种内存类型的笔记本电脑。单个模块搭载低功耗内存,有 16、32 和 64 GB 三种规格。虽然 SO-DIMM 模块也占用了更多空间,但采用更低效 DDR5 内存的前代产品确实提供了高达 96 GB 的容量。要卸下 LPCAMM2 内存,必须拧松三颗螺丝。内存模块上的二维码提供了操作指南。
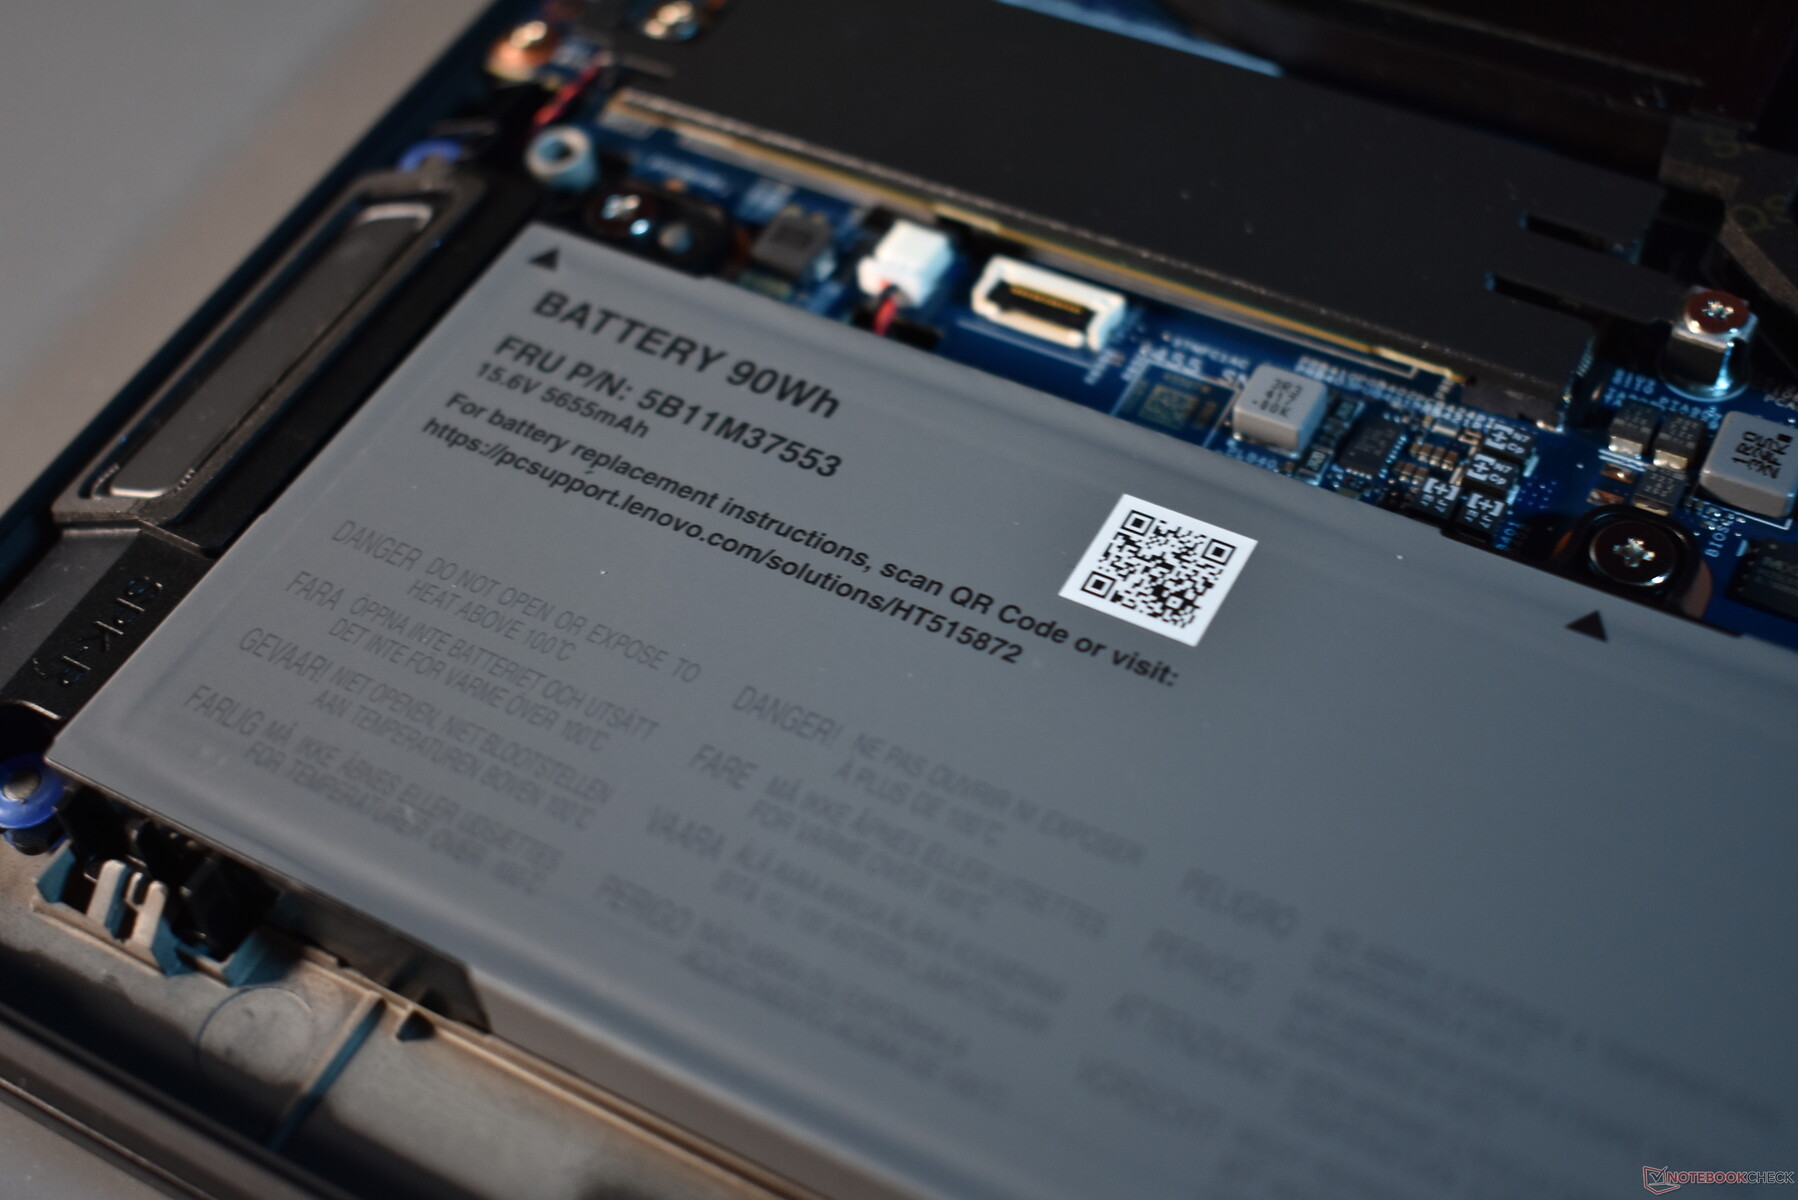
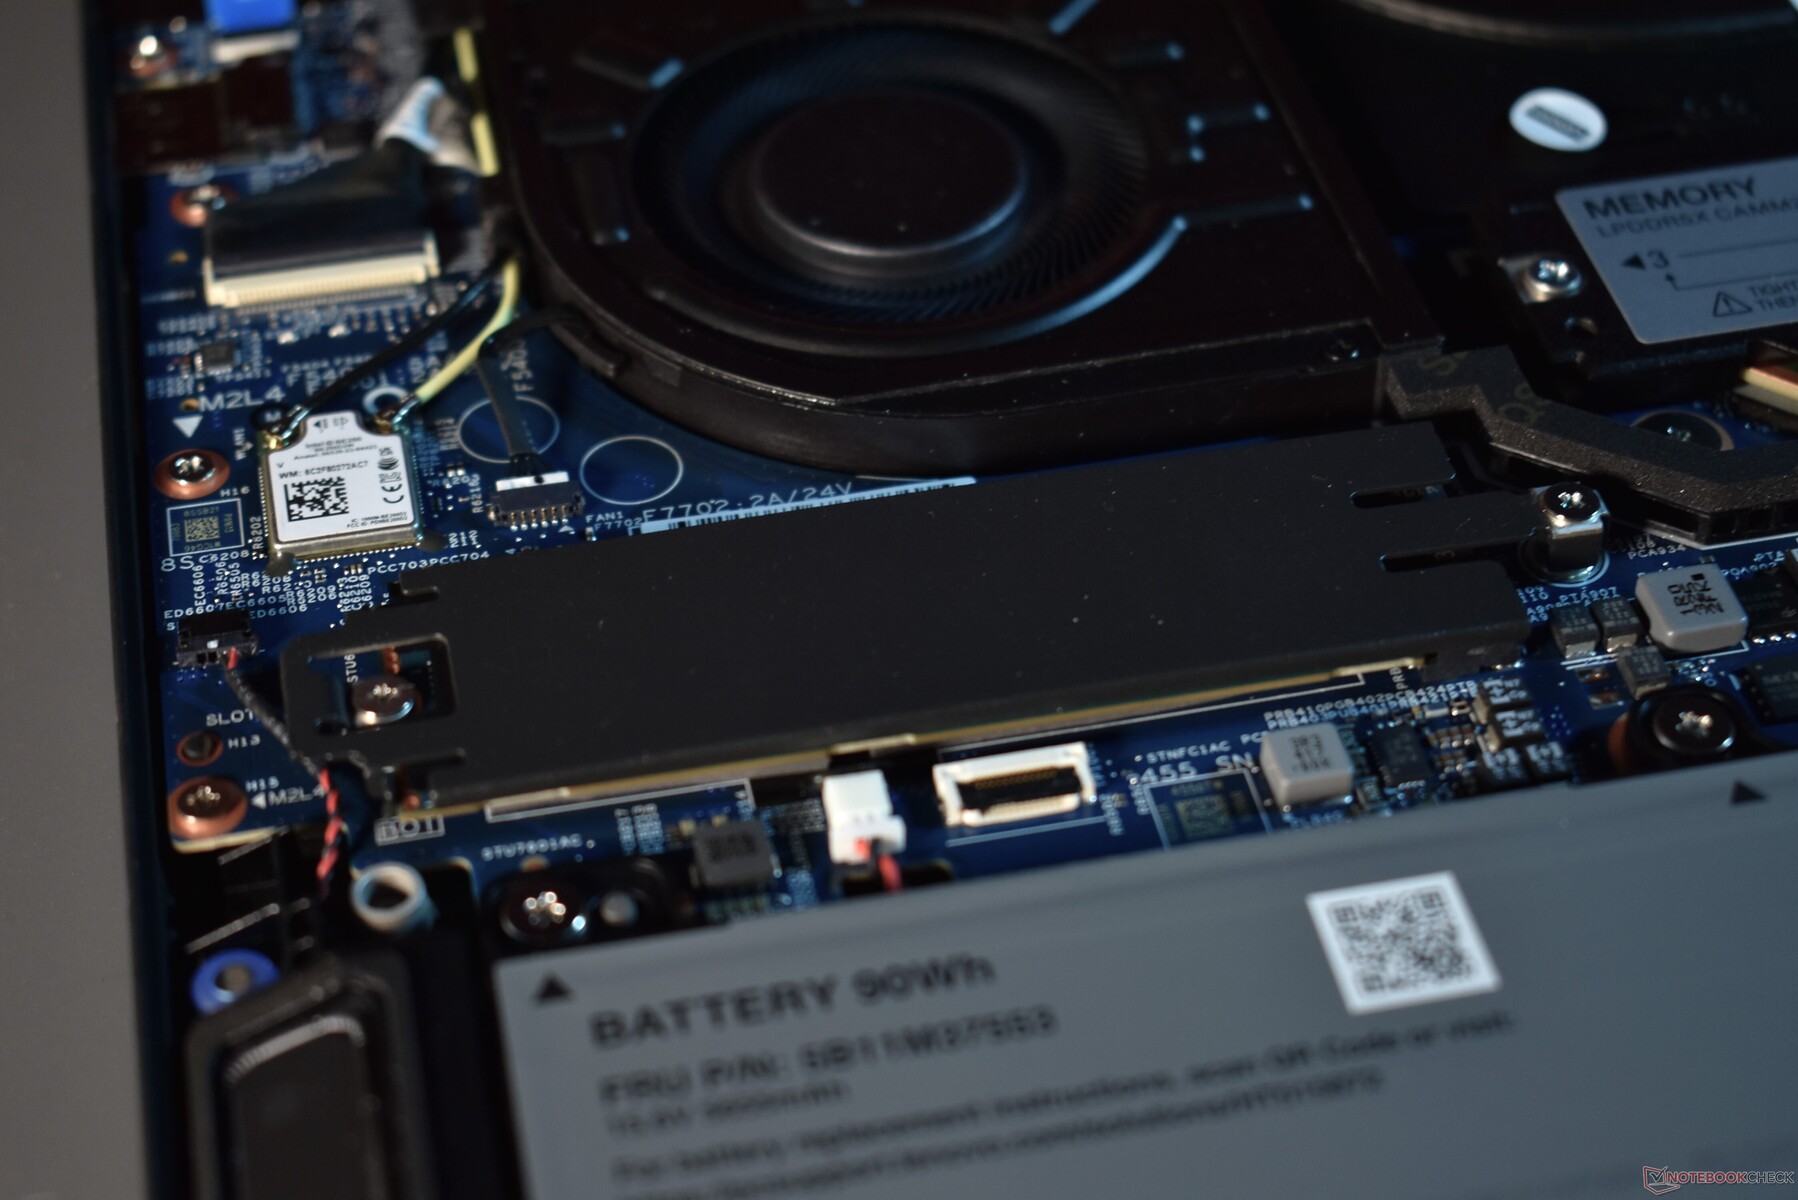
Wi-Fi 模块已焊接好。P1 系列中已经很久没有 WWAN 了,因此没有额外的 M.2 插槽。更换电池非常简单,联想取消了电缆连接器。电池只需直接插入即可。当然,它仍然用螺丝固定。这里还有一个说明书的二维码。在 P1 系列产品中,用户首次可以在保修期内更换电池,因为它现在是客户可更换单元(CRU)。
不容易更换的是键盘,要更换键盘必须更换整个底座。此外,由于使用了液态金属冷却膏,冷却系统也不再容易拆卸--联想警告用户不要拆卸冷却系统。
可持续性
大多数 2024 代 ThinkPad 笔记本电脑的外壳部分都使用了可回收材料。而 ThinkPad P1 Gen 7 并非如此,只有按键等少数塑料部件采用了可回收材料。至少,ThinkPad 笔记本电脑的包装是完全可堆肥的。联想提供最长五年的保修服务,因此也有五年的软件更新和更换部件支持。ThinkPad P1 G7 的二氧化碳产值为 214 千克/二氧化碳当量。
保修
正如可持续发展部分所述,保修期最长可达五年。我们的设备已经有三年的现场服务标准。在国际上,保修期为三年。
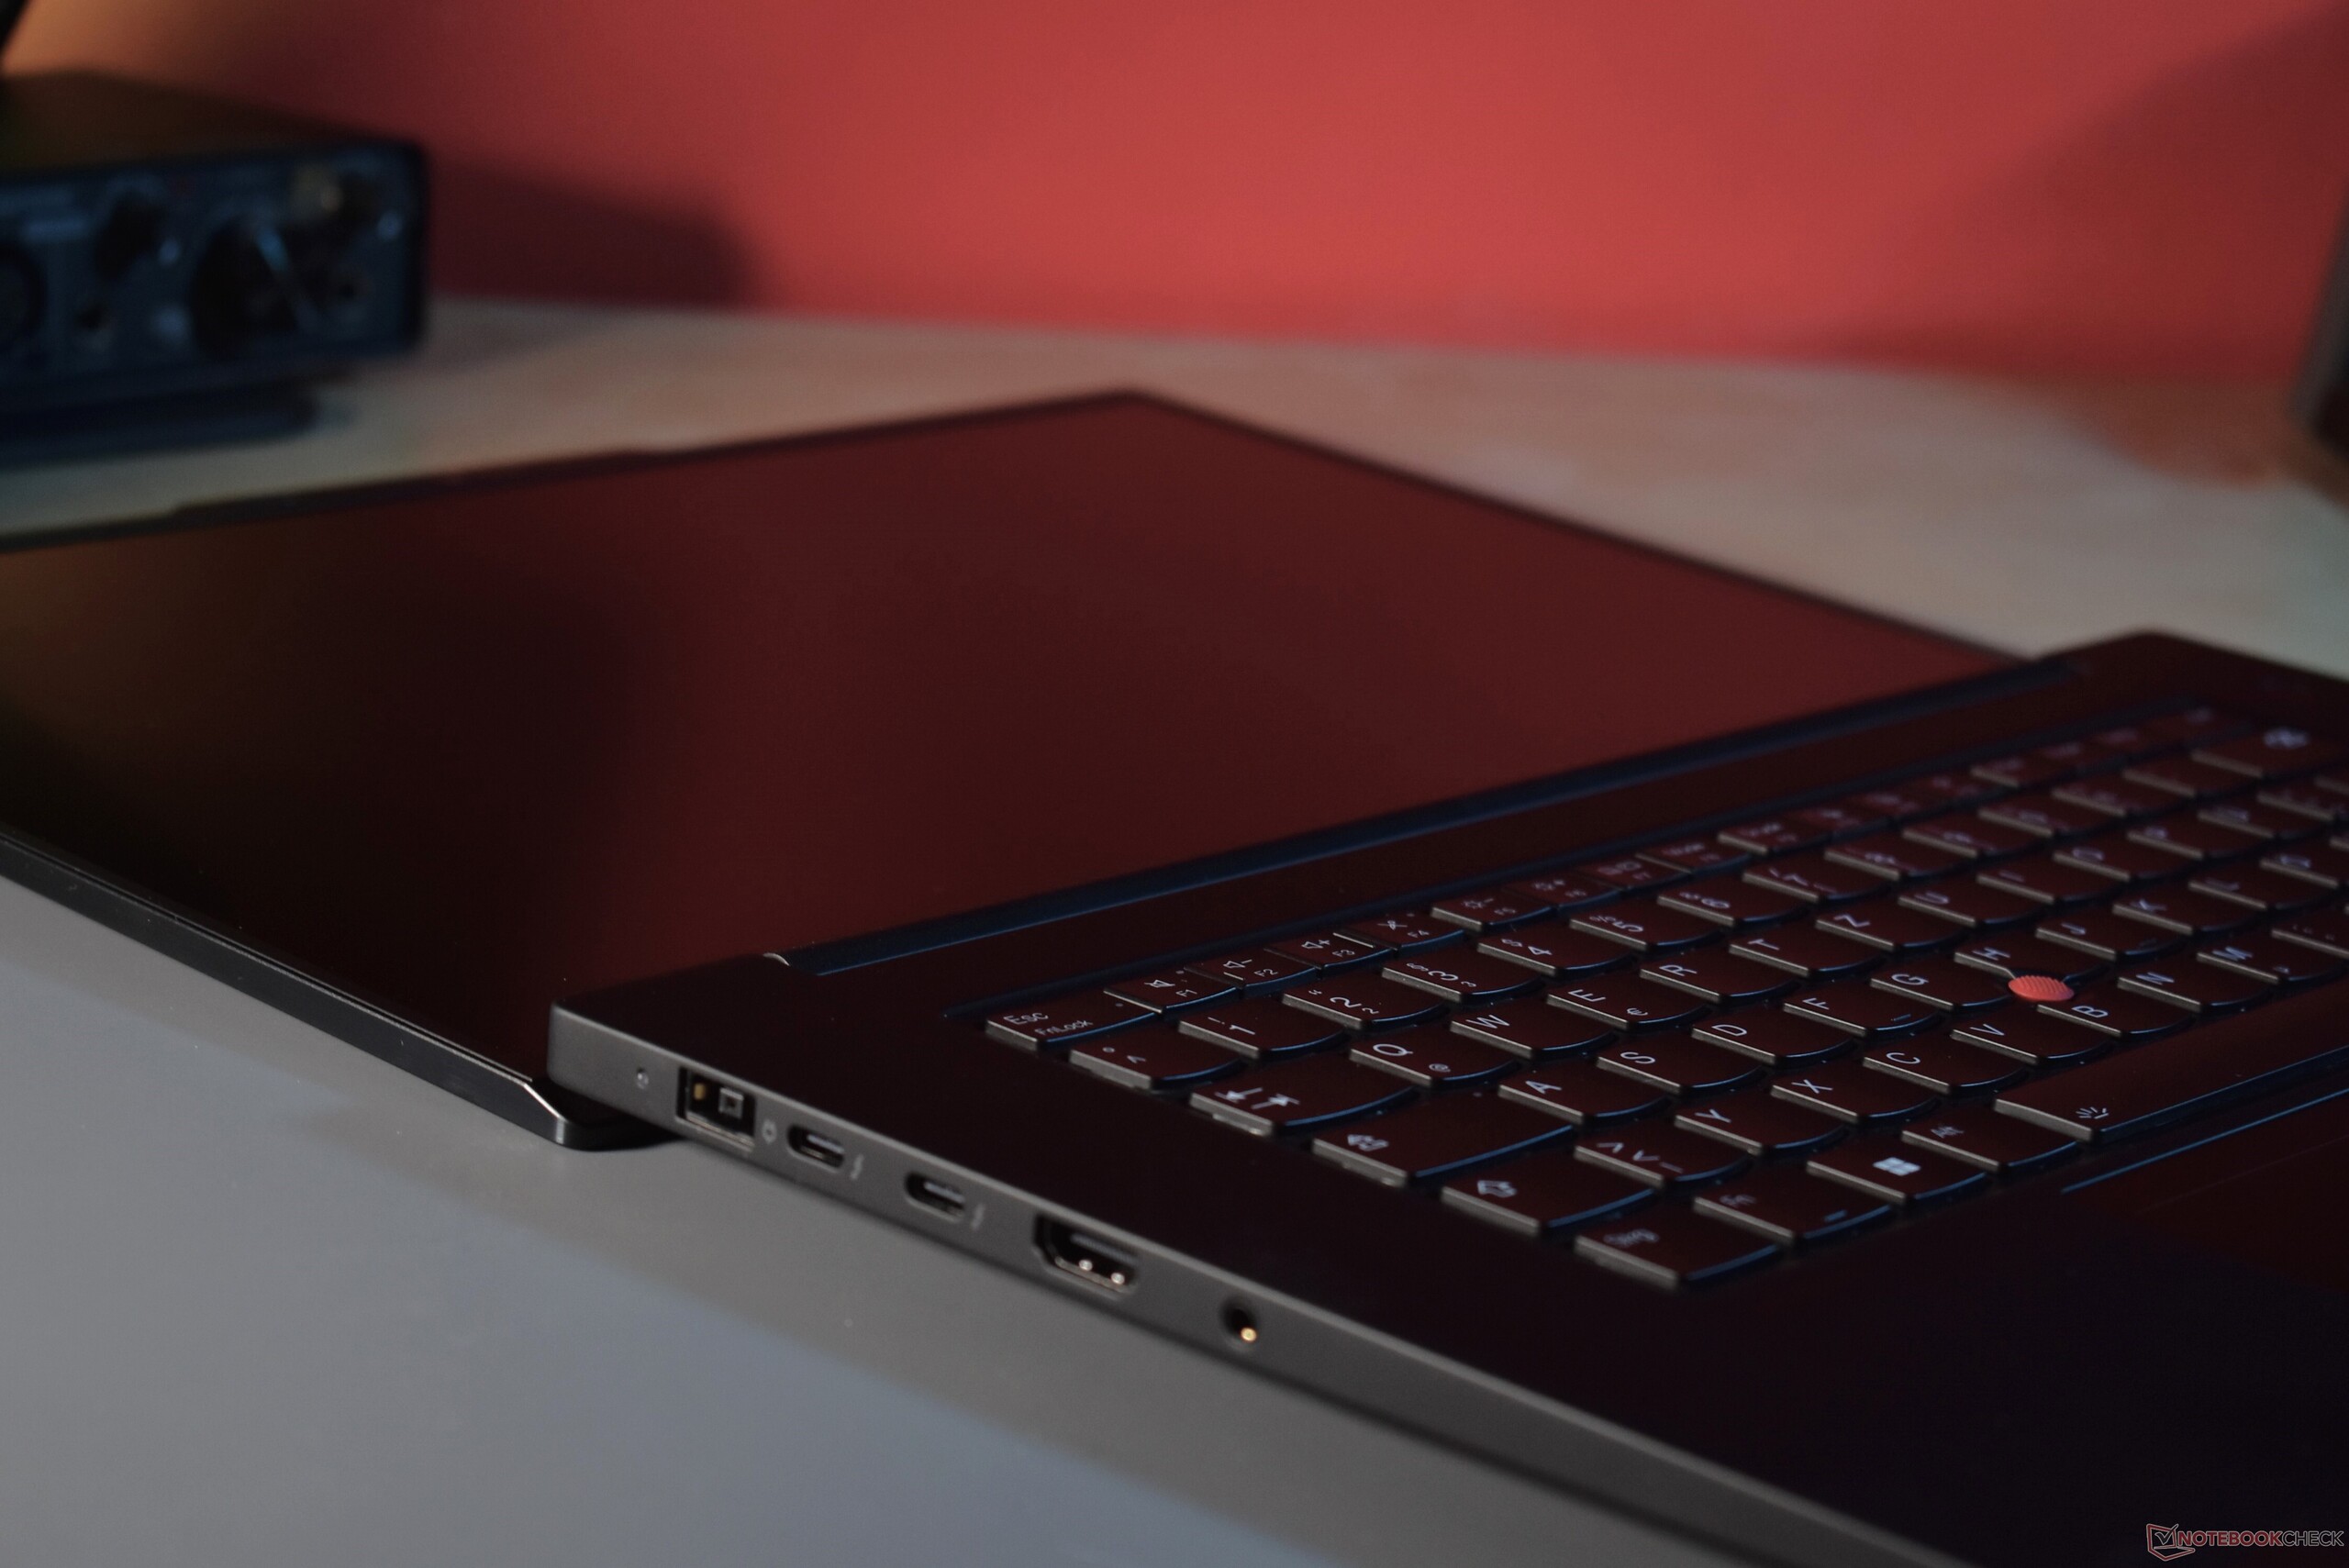
输入设备:首次完美实现集成 TrackPoint 按钮
键盘
联想对 ThinkPad P1 Gen 7 的双层背光键盘进行了多方面的重新设计。
键程仍然是 1.5 毫米。键帽设计也保持不变,但联想将外侧按键从微笑形设计改为矩形设计--这是不久前他们在大多数 ThinkPad 上所做的。第二个变化也是如此:联想首次在 ThinkPad P1 上使用了尺寸略小的键盘。新键盘的宽度大约减少了一厘米。这看起来很奇怪,因为 ThinkPad P1 有足够的空间。不过,ThinkPad P1 第六代是该系列中最后一款采用旧标准宽度的 ThinkPad 笔记本电脑。最终,成本可能是决定性因素,因为制造专用硬件组件往往成本高昂。通过使用像 14 英寸 ThinkPad 机型那样的较小布局,联想可以在产品线之间共享部件。
对于使用 ISO 键盘布局的欧洲用户来说,新键盘很恼人,因为像德文单引号 Ü 和 Ä 这样的重要按键变小了,而在使用较小回车键的美式 ANSI 键盘布局上,问题就不大了。其他新功能会影响到所有 2024 ThinkPad,如 FN/Ctrl 键的互换、Copilot 键代替 PrtScr 键,以及重要按键(如回车键或音量键)上的触觉标记。
总的来说,这款键盘非常出色。与其他 ThinkPad 笔记本电脑相比,它的驱动力稍大,但我们很喜欢。尽管键程较短,但在这款键盘上打字几乎和在旧款 ThinkPad 上打字一样舒适。使用这款键盘,几个小时的打字都轻松自如。
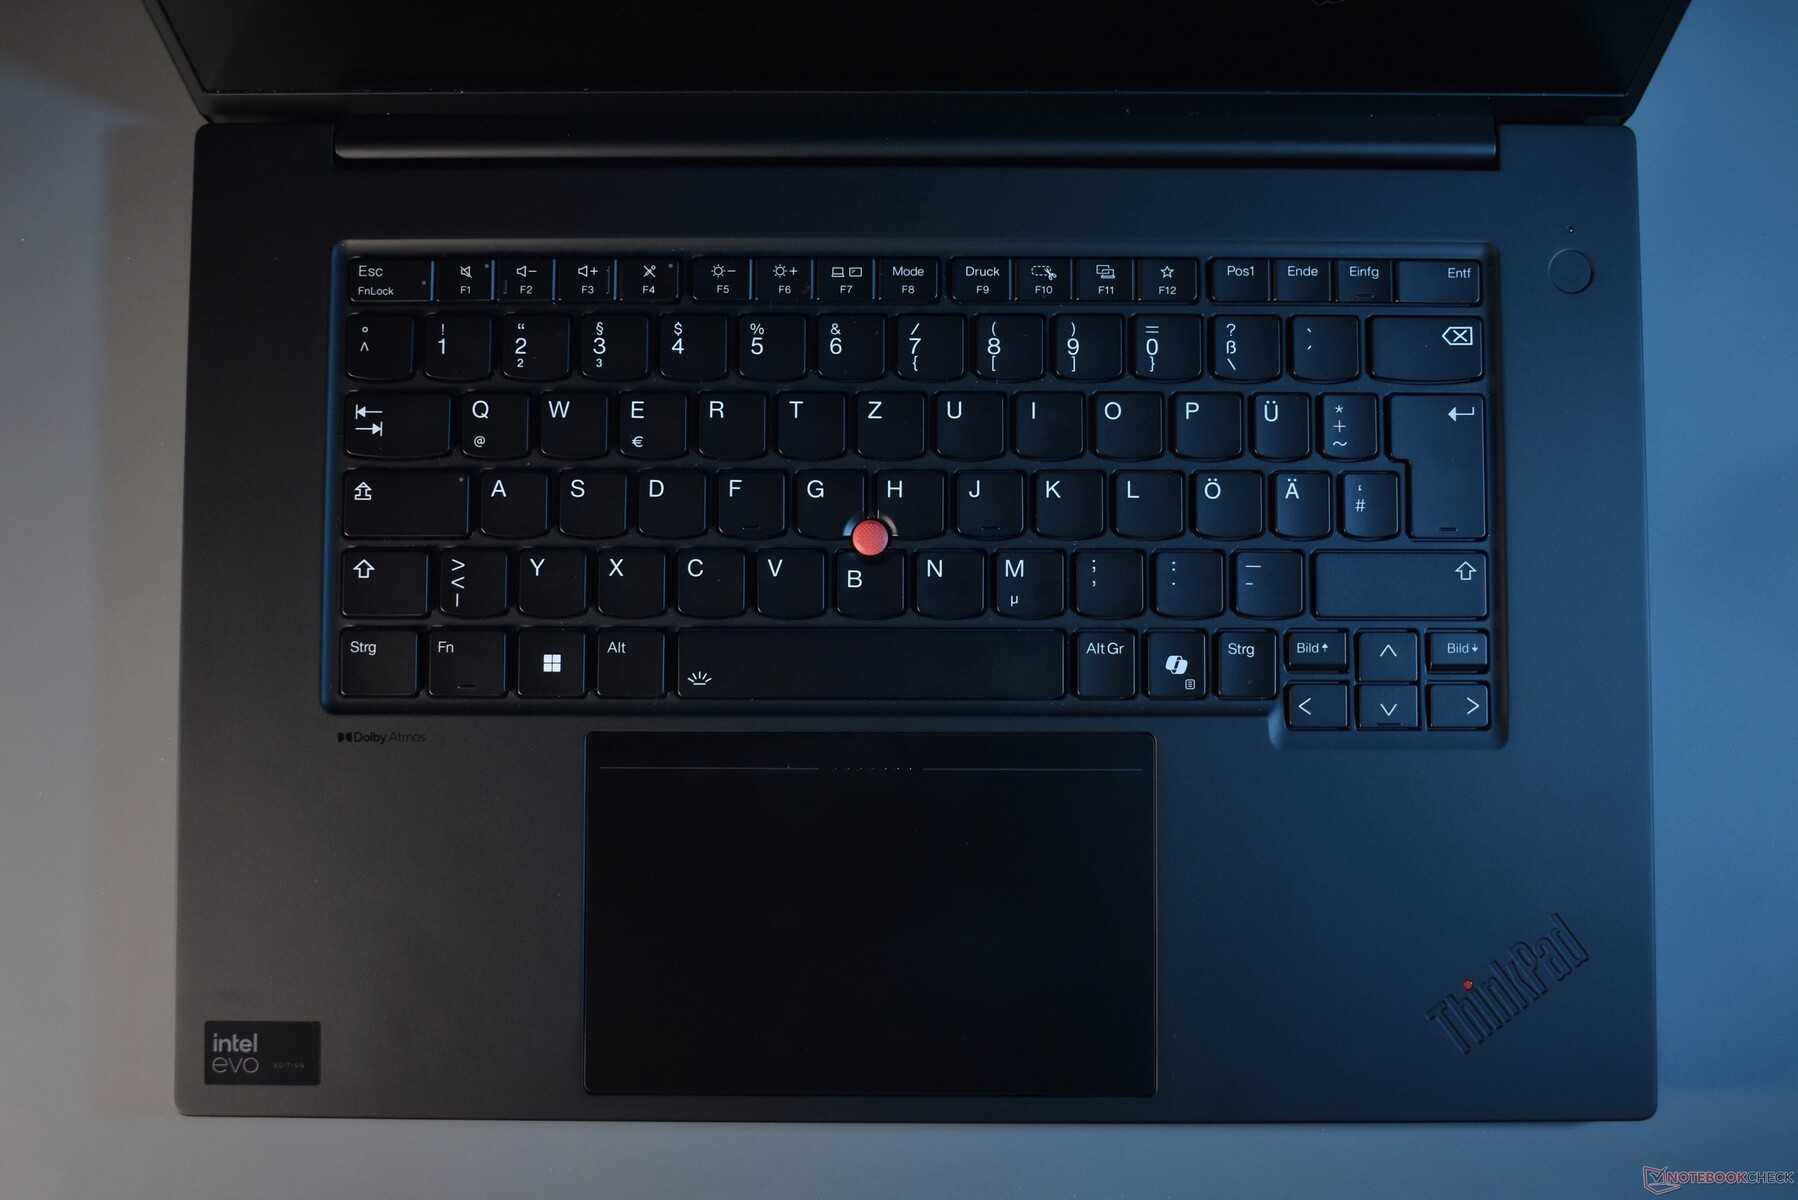
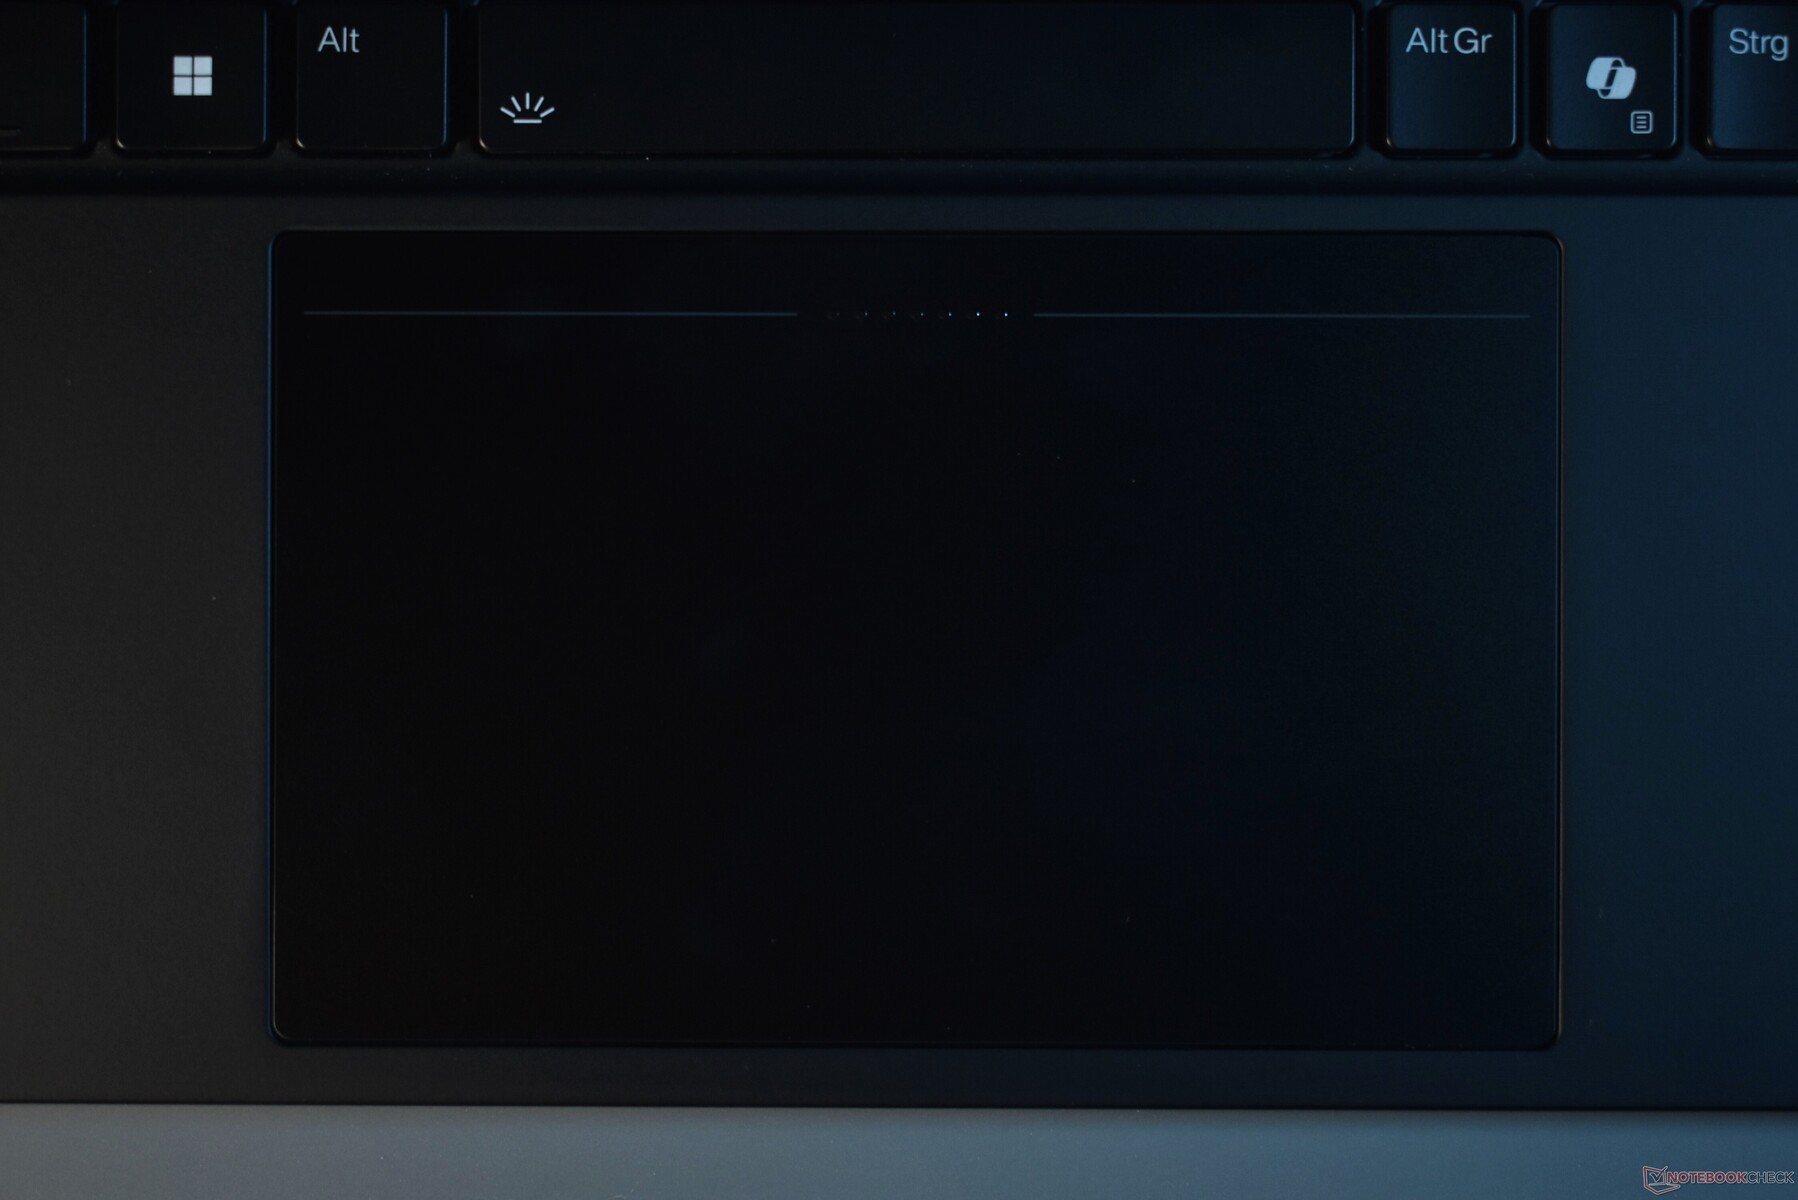
触摸板和轨迹点
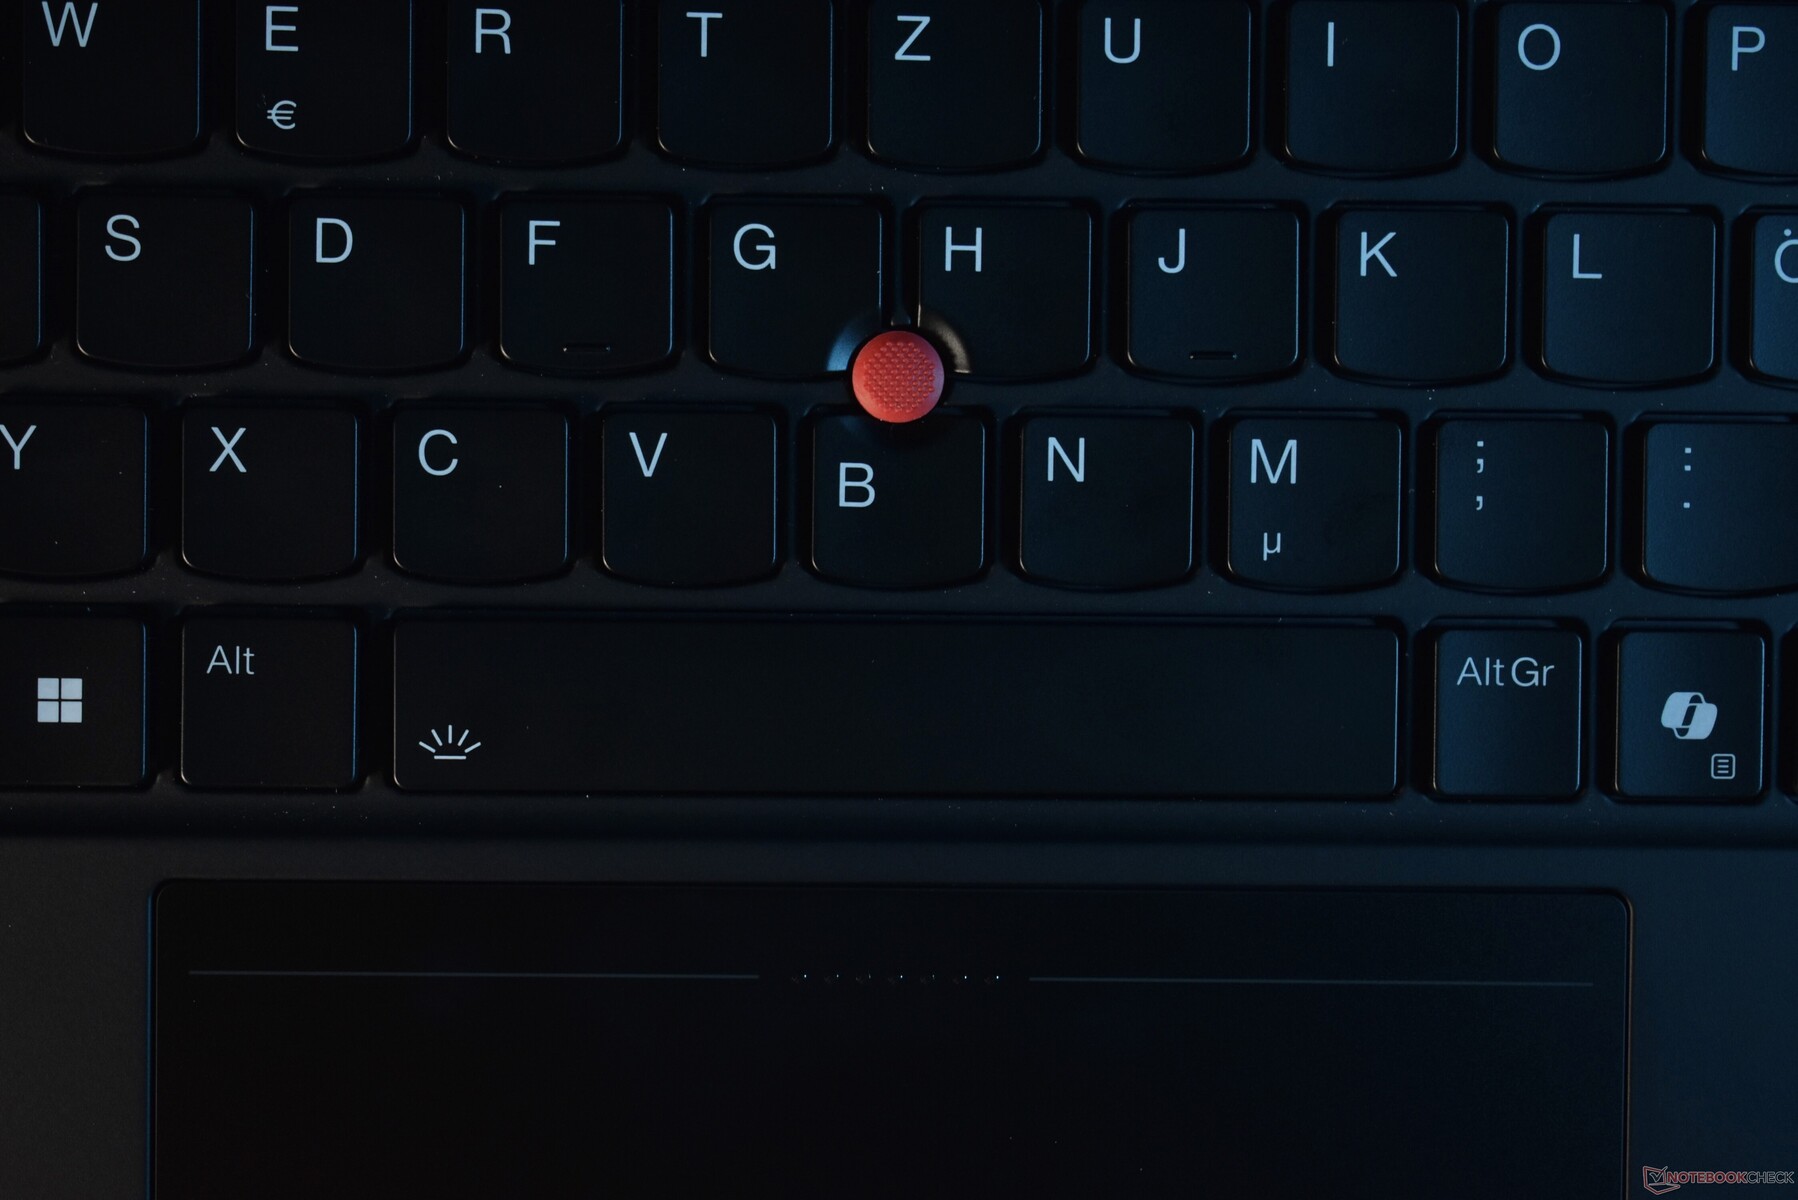
触控板是联想从 ThinkPad Z16 中汲取灵感最明显的地方。联想为 ThinkPad P1 Gen 7 配备了由 Sensel 公司生产的触觉触控板,而不是像 ThinkPad P1 那样将物理 TrackPoint 按钮和机械点击板结合在一起。表面集成了 ThinkPad TrackPoint 的点击区--P1 Gen 7 现在集成了 TrackPoint 按钮。
这种新设计使联想可以在不完全牺牲 TrackPoint 功能的情况下增大触摸板的尺寸。它的尺寸为 13.5 x 8.5 厘米,是最近一代 ThinkPad 中最大的触控板。表面由哑光玻璃组成,由于是触觉点击板,因此可以在任何地方点击。点击力度可在 Windows 设置中减小或增大。触觉效果也可以完全关闭。在 ThinkPad 中,触控板在各方面都表现出色,在笔记本电脑市场中处于领先地位。
如果使用红色 TrackPoint 控制鼠标指针,触摸板的上半部分就取代了专用的鼠标按键。由于没有独立的按键,中间按键的小圆点只能用来定位。这种解决方案仍无法与专用按键媲美,但也差不多了。与第一代 ThinkPad Z 系列的前一版本相比,触觉反馈要柔和得多,使用起来更加舒适。力度感应也非常好用,很少发生误点击的情况。我们只发现了一个问题:当与 TrackPoint 一起使用时,以及手放在触摸板表面上时,触摸板有时会冻结。Sensel 向我们承诺,固件更新将在未来解决这个问题。
显示屏快速 165 赫兹屏幕
联想在很多方面都做了调整,但屏幕没有。屏幕选项几乎没有变化,与 ThinkPad P1 G6 相比,唯一的变化是基本屏幕选项的亮度提高了 100 cd/m²。所有屏幕的宽高比均为 16:10,屏幕尺寸为 16 英寸。
- WUXGA(1,920 x 1,200),IPS,400 cd/m²,100 % sRGB,哑光
- WQXGA(2,560 x 1,600),IPS,500 cd/m²,100 % sRGB,哑光,165 Hz
- WQUXGA(3,840 x 2,400),OLED,400 cd/m²,100 % DCI-P3,半哑光/半光,HDR
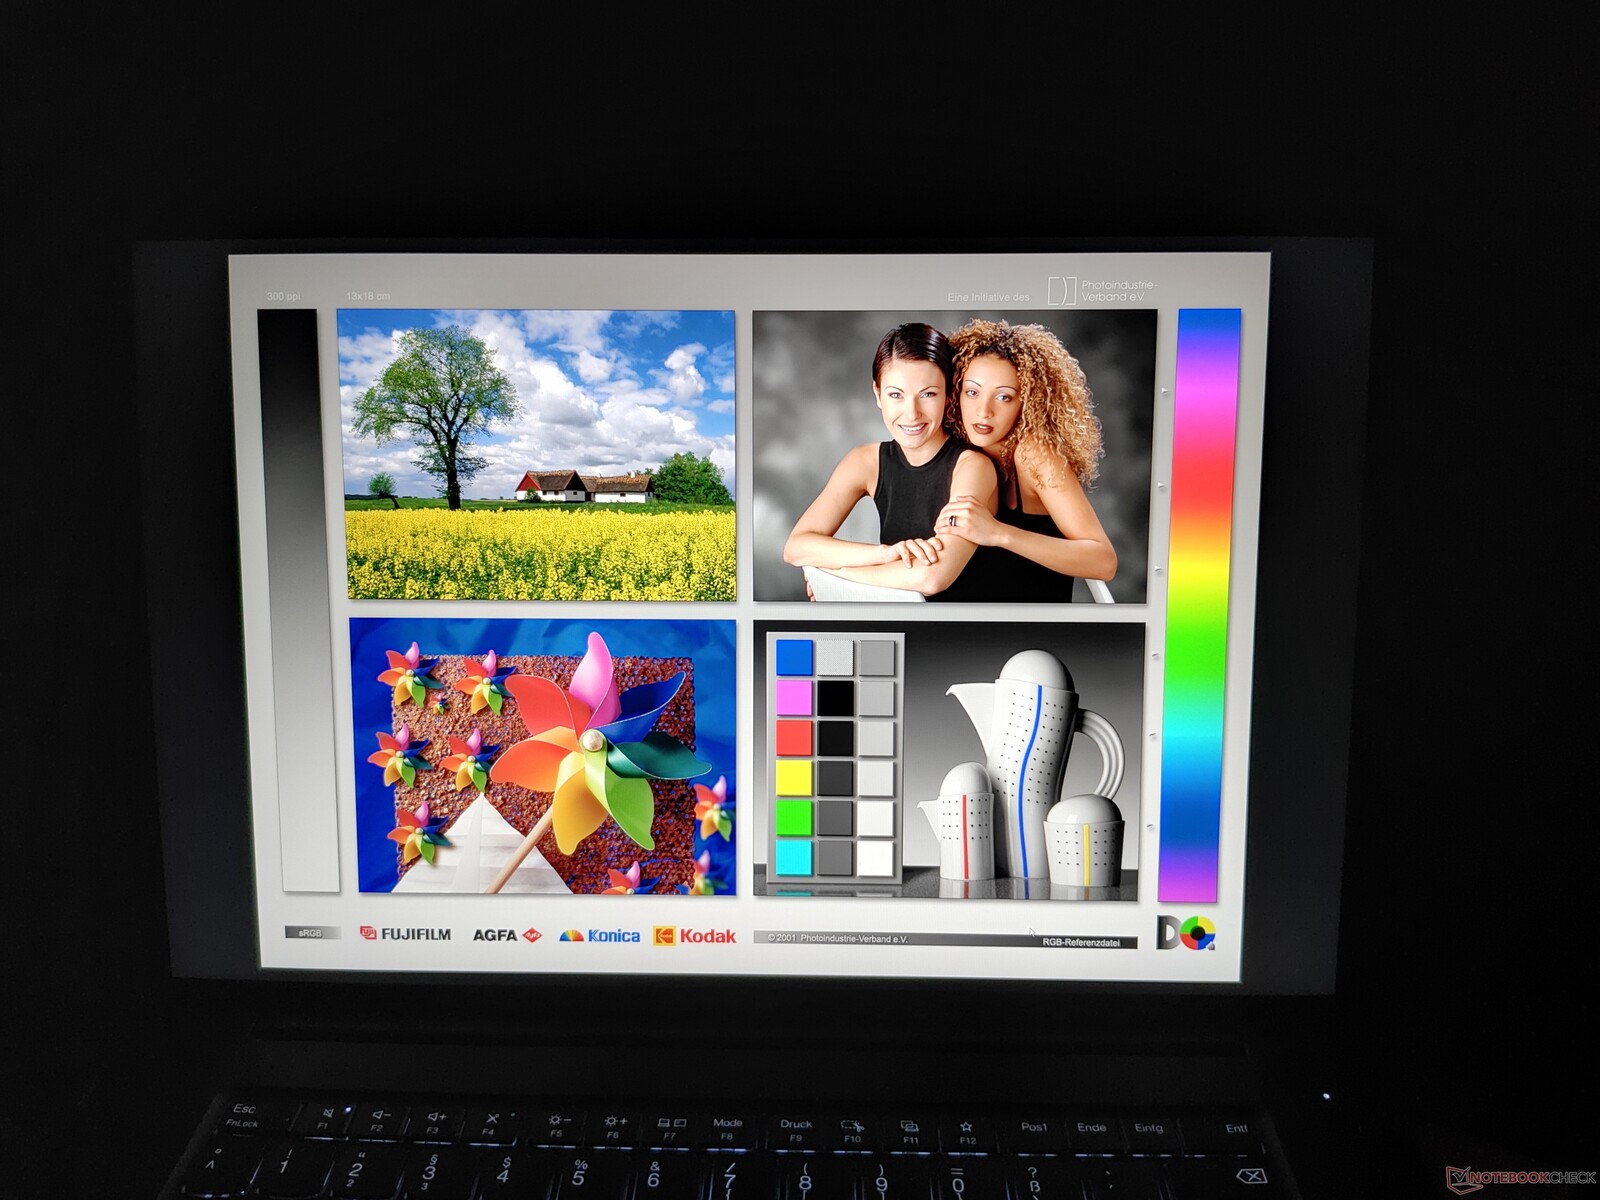
此处使用的液晶显示器承诺亮度为 500 cd/m²,实测平均亮度为 505 cd/m²。Windows 竞争产品的 OLED 显示屏被轻松击败,但Apple MacBook Pro 16 的 miniLED 屏幕却不在其列。总体而言,由于技术和分辨率不同,该面板与我们测试过的同类笔记本电脑并不具有可比性。ThinkPad P1 7 代的 OLED 屏幕更适合作为对比。尽管 OLED 显示屏的响应时间更长,但 165 Hz 的刷新率至少比其他同类产品高出一个档次。在这方面,MacBook 无法与之匹敌。值得肯定的是:液晶显示器没有 PWM,与 OLED 和 miniLED 竞争产品不同。
| |||||||||||||||||||||||||
Brightness Distribution: 89 %
Center on Battery: 516 cd/m²
Contrast: 1259:1 (Black: 0.41 cd/m²)
ΔE Color 3.5 | 0.5-29.43 Ø4.87, calibrated: 1.2
ΔE Greyscale 5.6 | 0.5-98 Ø5.1
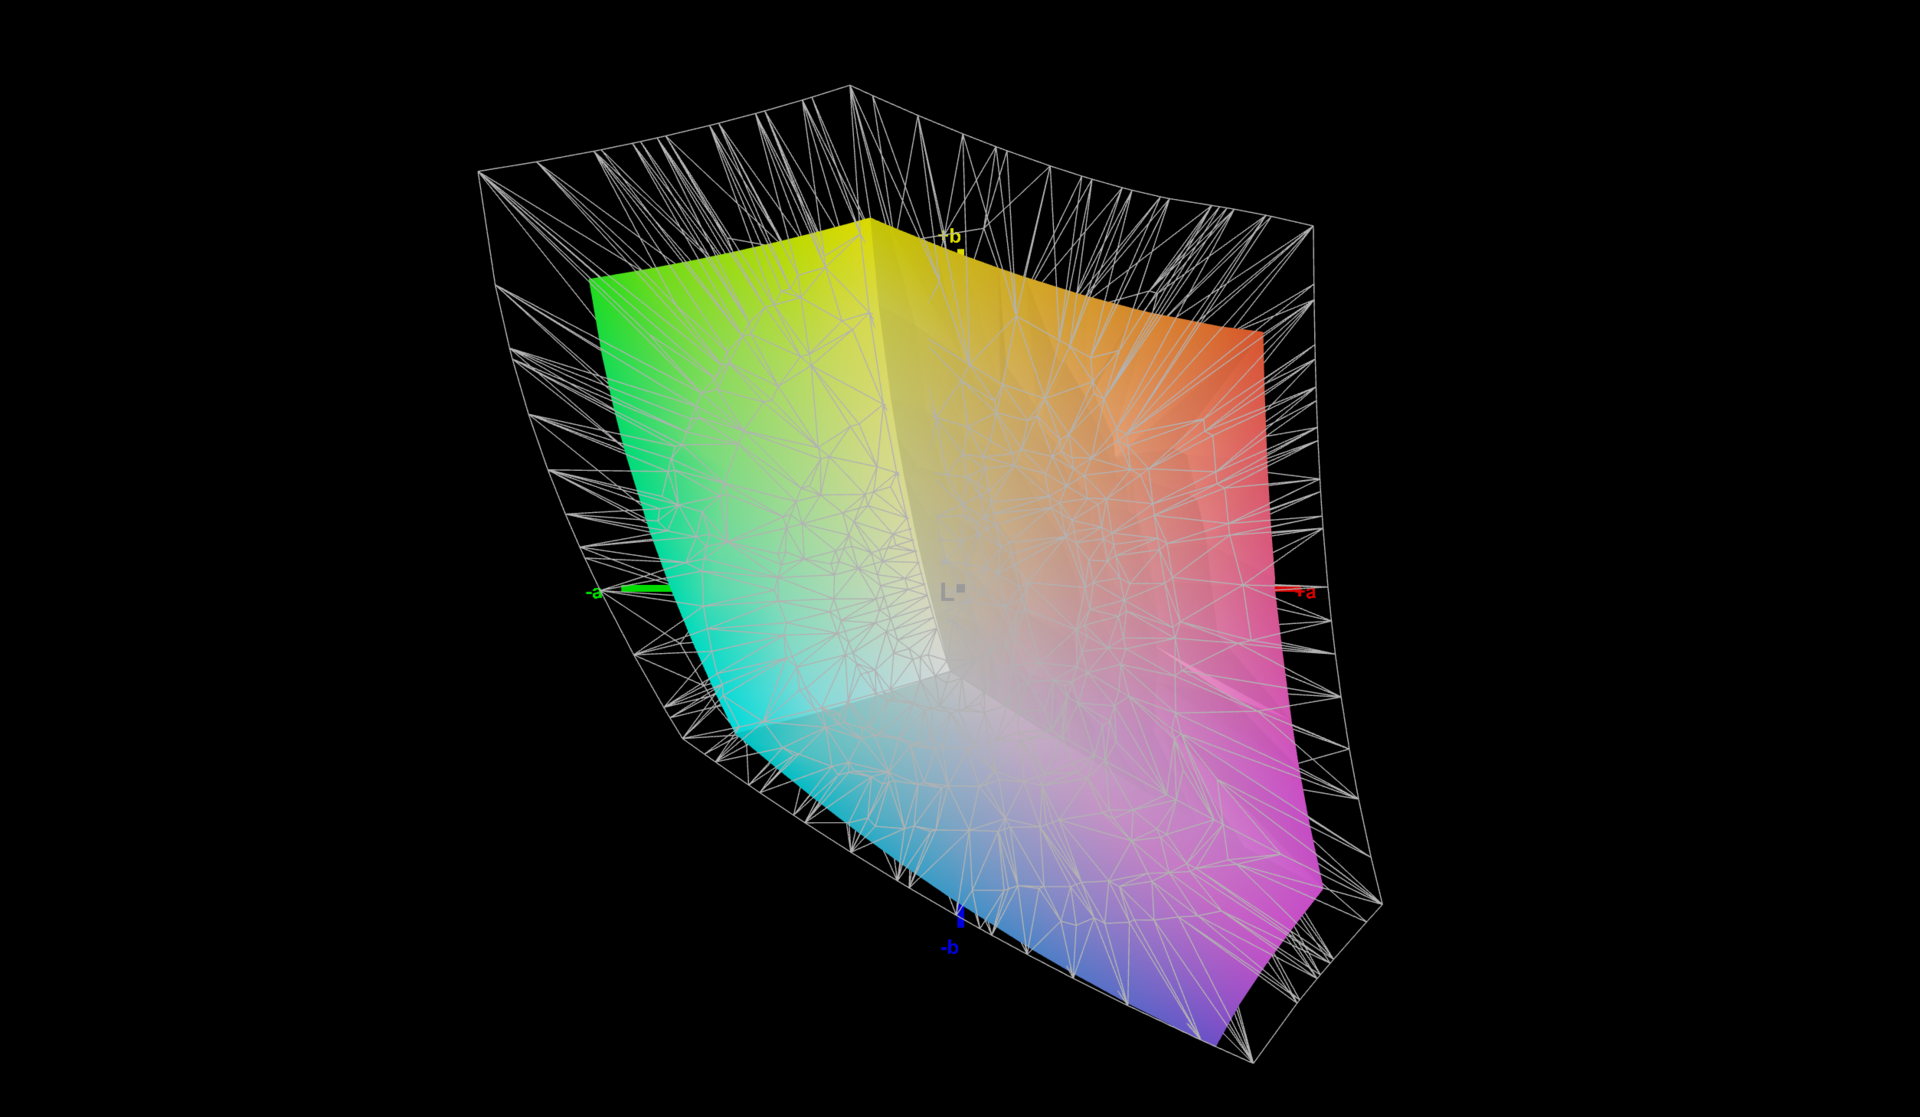
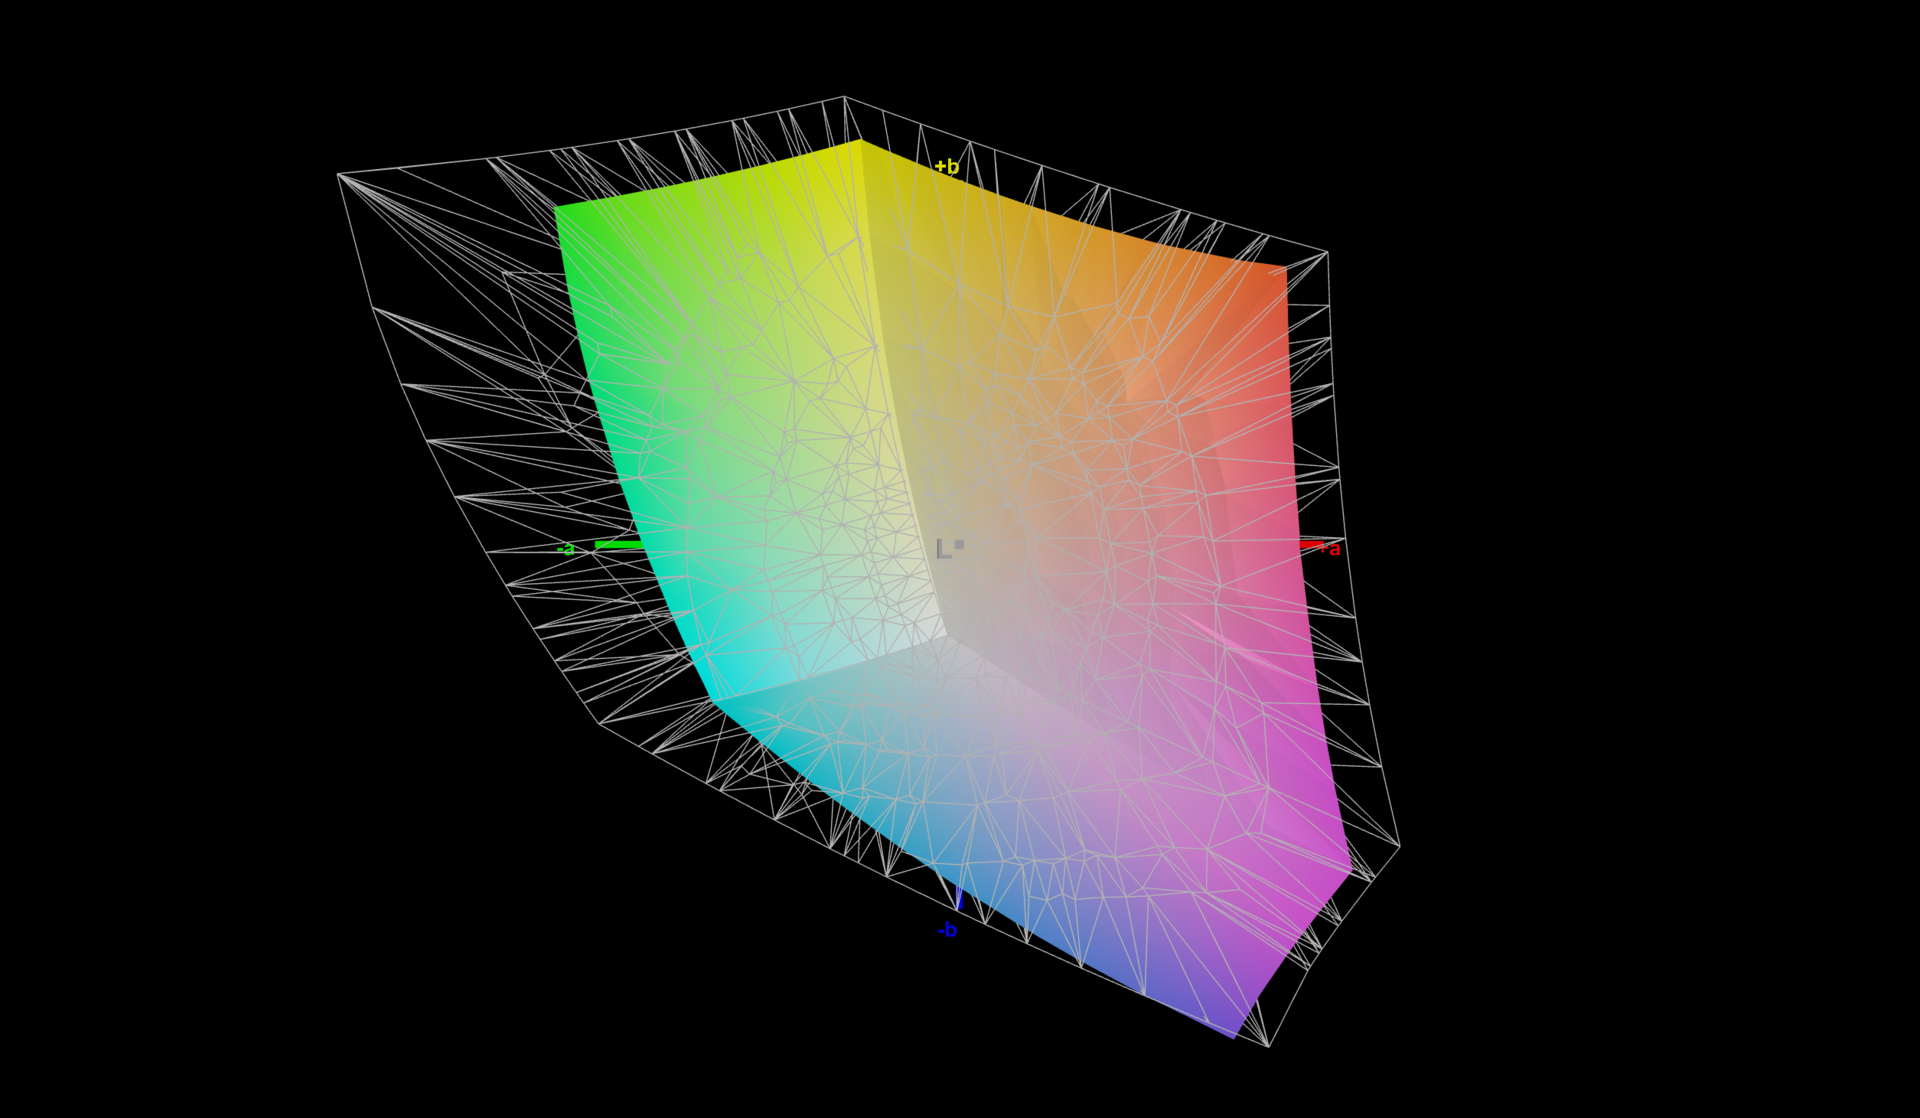
71.8% AdobeRGB 1998 (Argyll 2.2.0 3D)
97.6% sRGB (Argyll 2.2.0 3D)
69.4% Display P3 (Argyll 2.2.0 3D)
Gamma: 2.27
| Lenovo ThinkPad P1 Gen 7 21KV001SGE MNG007DA1-9 , IPS LED, 2560x1600, 16", 165 Hz | Lenovo ThinkPad P1 G6 21FV001KUS Samsung ATNA60YV04-0, OLED, 3480x2400, 16", 60 Hz | Dell XPS 16 9640 SDC4196, OLED, 3840x2400, 16.3", 90 Hz | Dell Precision 5690 Samsung 160YV03, OLED, 3840x2400, 16", 60 Hz | Apple MacBook Pro 16 2023 M3 Max Mini-LED, 3456x2234, 16", 120 Hz | |
|---|---|---|---|---|---|
| Display | 27% | 22% | 27% | 43% | |
| Display P3 Coverage | 69.4 | 99.8 44% | 98.3 42% | 99.8 44% | 99.2 43% |
| sRGB Coverage | 97.6 | 100 2% | 100 2% | 100 2% | |
| AdobeRGB 1998 Coverage | 71.8 | 97.9 36% | 87.8 22% | 96.6 35% | |
| Response Times | 85% | 93% | 85% | -404% | |
| Response Time Grey 50% / Grey 80% * | 11.2 ? | 1.69 ? 85% | 0.82 ? 93% | 1.7 ? 85% | 66.9 ? -497% |
| Response Time Black / White * | 10.6 ? | 1.73 ? 84% | 0.85 ? 92% | 1.7 ? 84% | 43.6 ? -311% |
| PWM Frequency | 60 ? | 360 ? | 60 ? | 14877 | |
| Screen | 28% | 22% | 6% | 41% | |
| Brightness middle | 516 | 375.1 -27% | 366 -29% | 348.1 -33% | 630 22% |
| Brightness | 505 | 379 -25% | 367 -27% | 351 -30% | 604 20% |
| Brightness Distribution | 89 | 98 10% | 96 8% | 97 9% | 94 6% |
| Black Level * | 0.41 | ||||
| Contrast | 1259 | ||||
| Colorchecker dE 2000 * | 3.5 | 1.16 67% | 1.3 63% | 4.18 -19% | 1.2 66% |
| Colorchecker dE 2000 max. * | 8.8 | 2.94 67% | 3.6 59% | 6.68 24% | 2.8 68% |
| Colorchecker dE 2000 calibrated * | 1.2 | 1 17% | 0.97 19% | ||
| Greyscale dE 2000 * | 5.6 | 1.4 75% | 2.2 61% | 1.7 70% | 1.9 66% |
| Gamma | 2.27 97% | 2.2 100% | 2.14 103% | 2.2 100% | 2.29 96% |
| CCT | 6071 107% | 6325 103% | 6680 97% | 6198 105% | 6812 95% |
| Total Average (Program / Settings) | 47% /
38% | 46% /
34% | 39% /
24% | -107% /
-57% |
* ... smaller is better
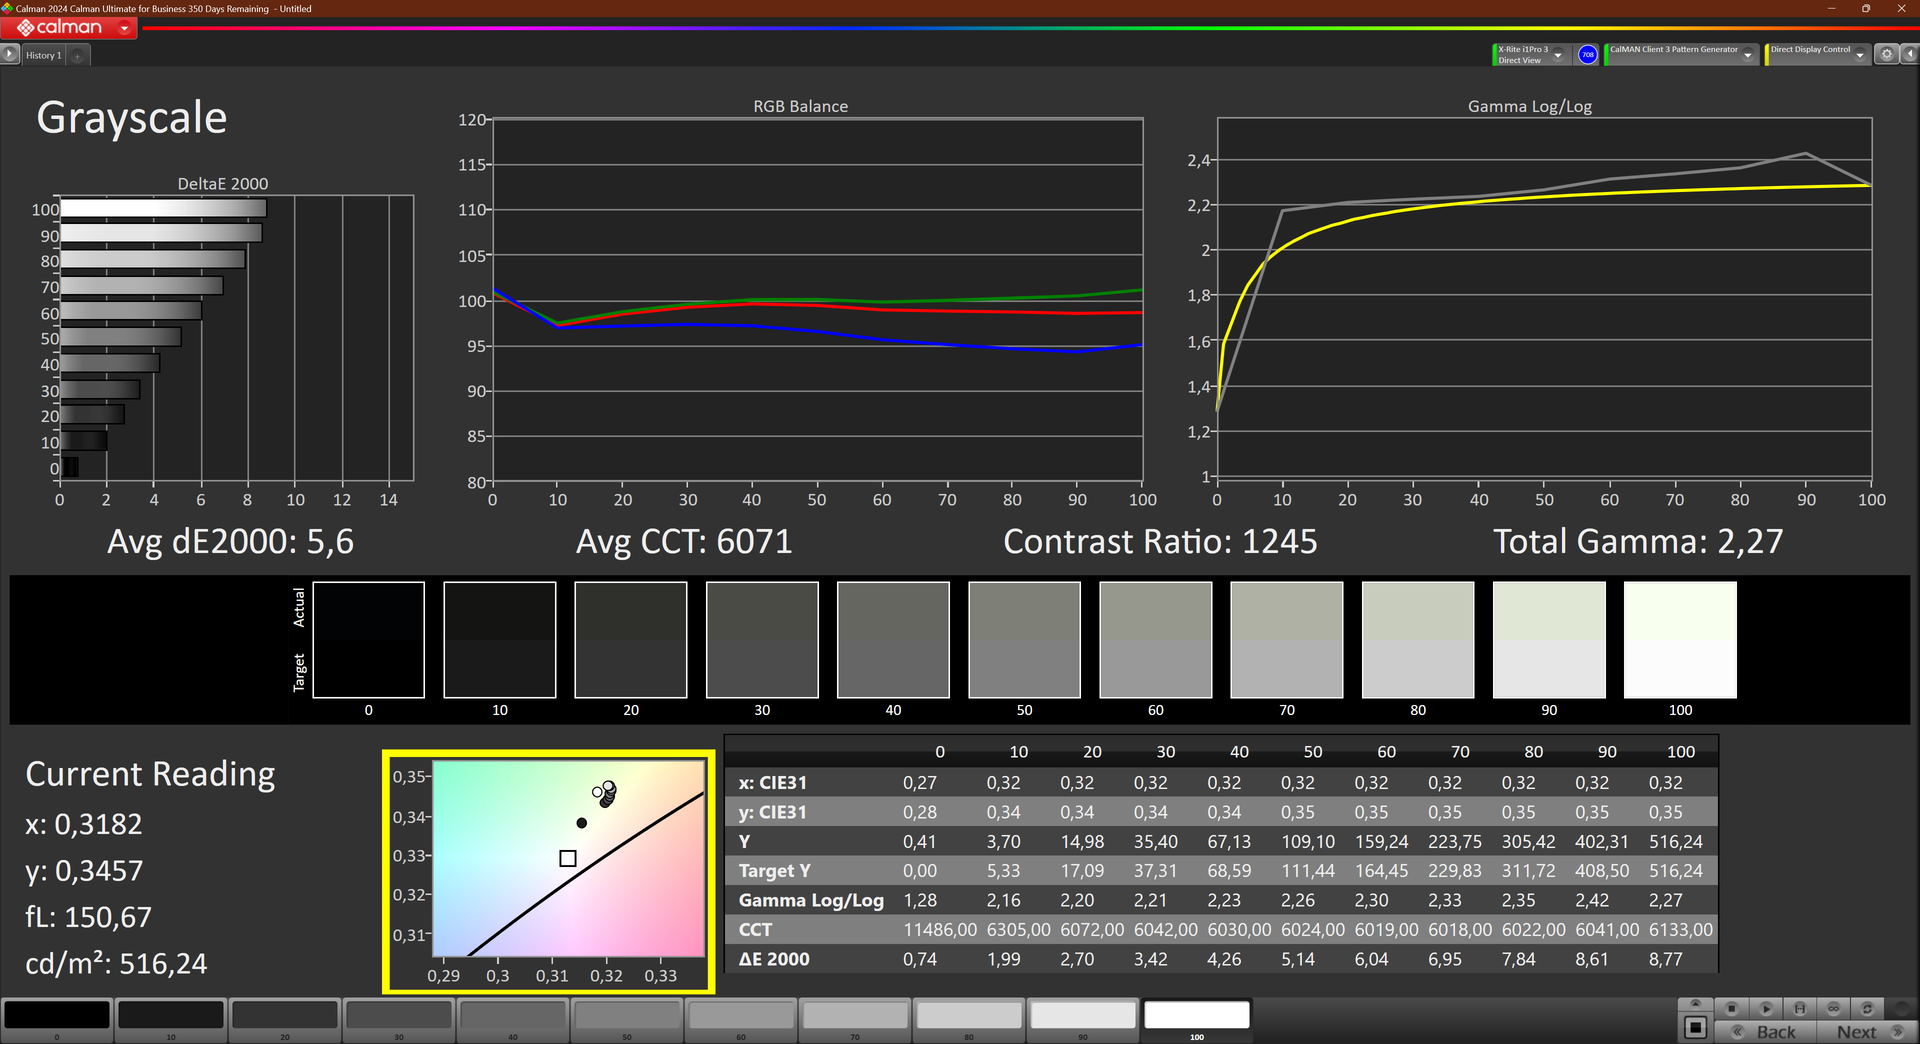
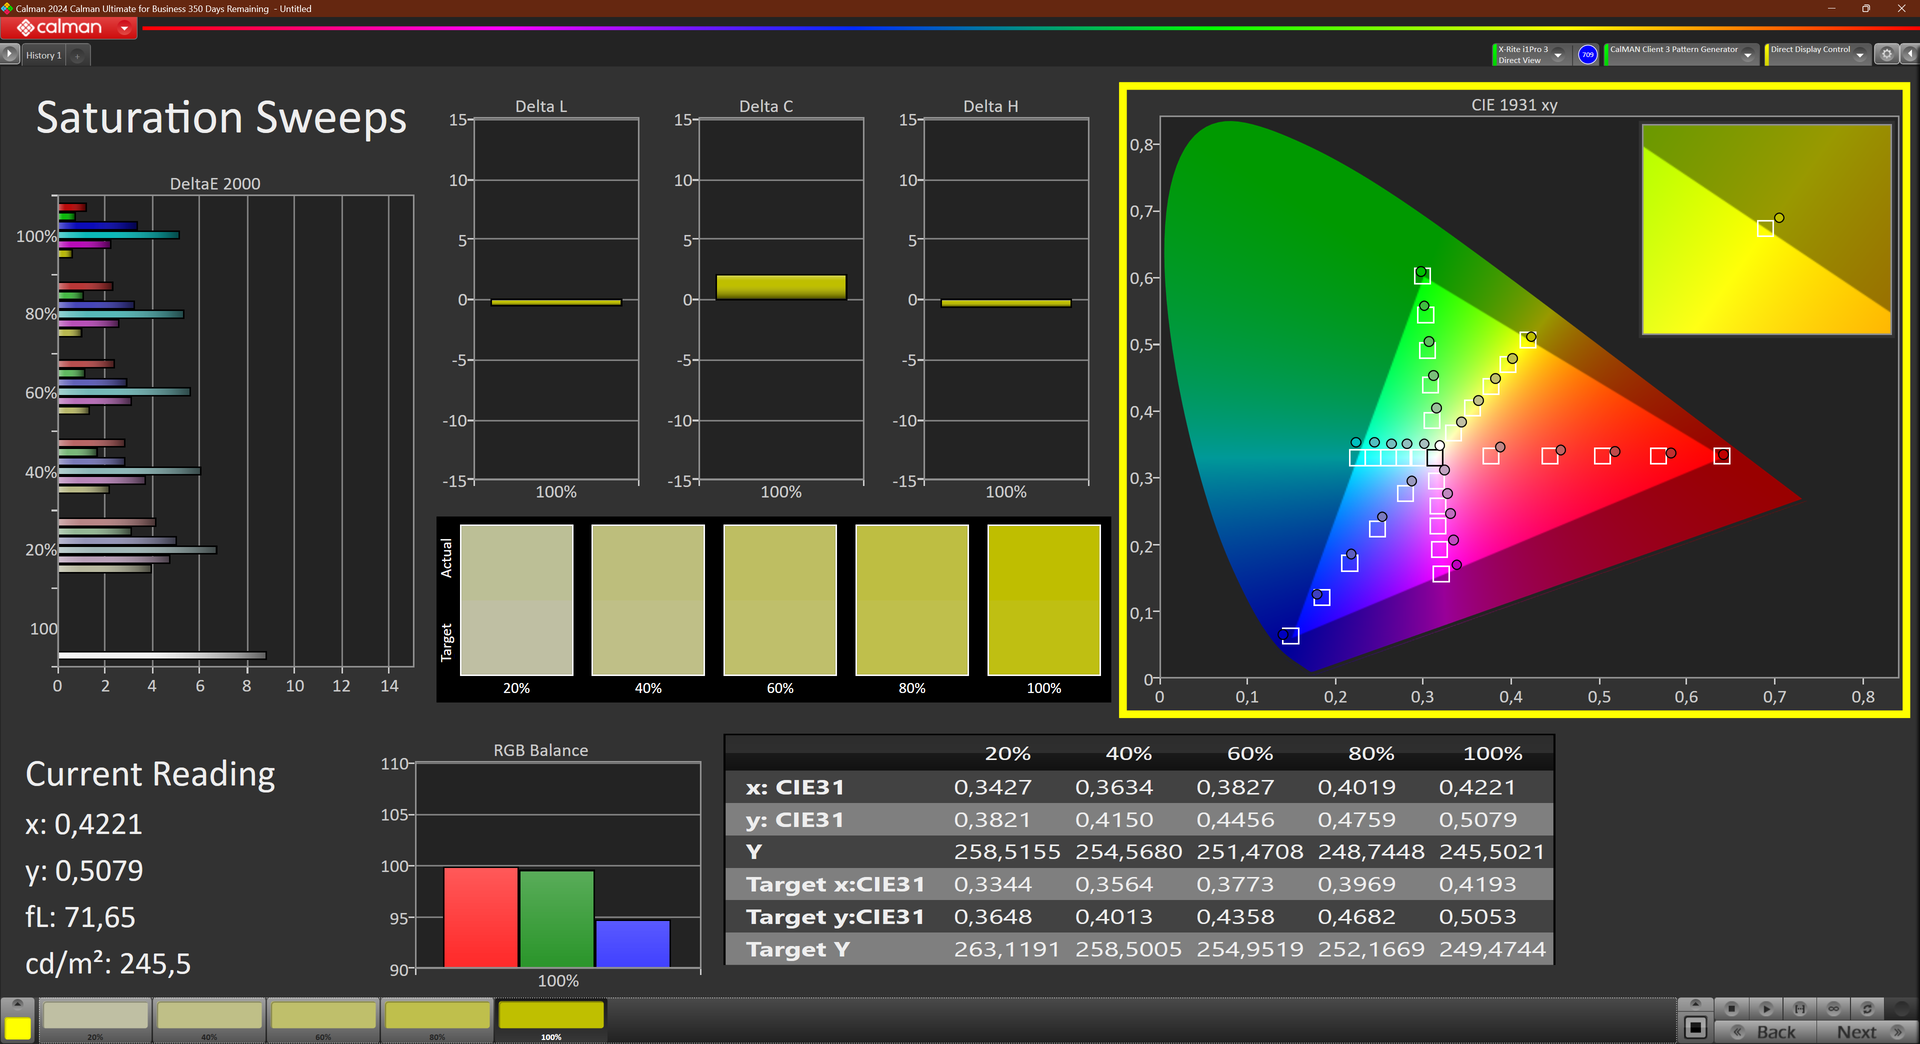
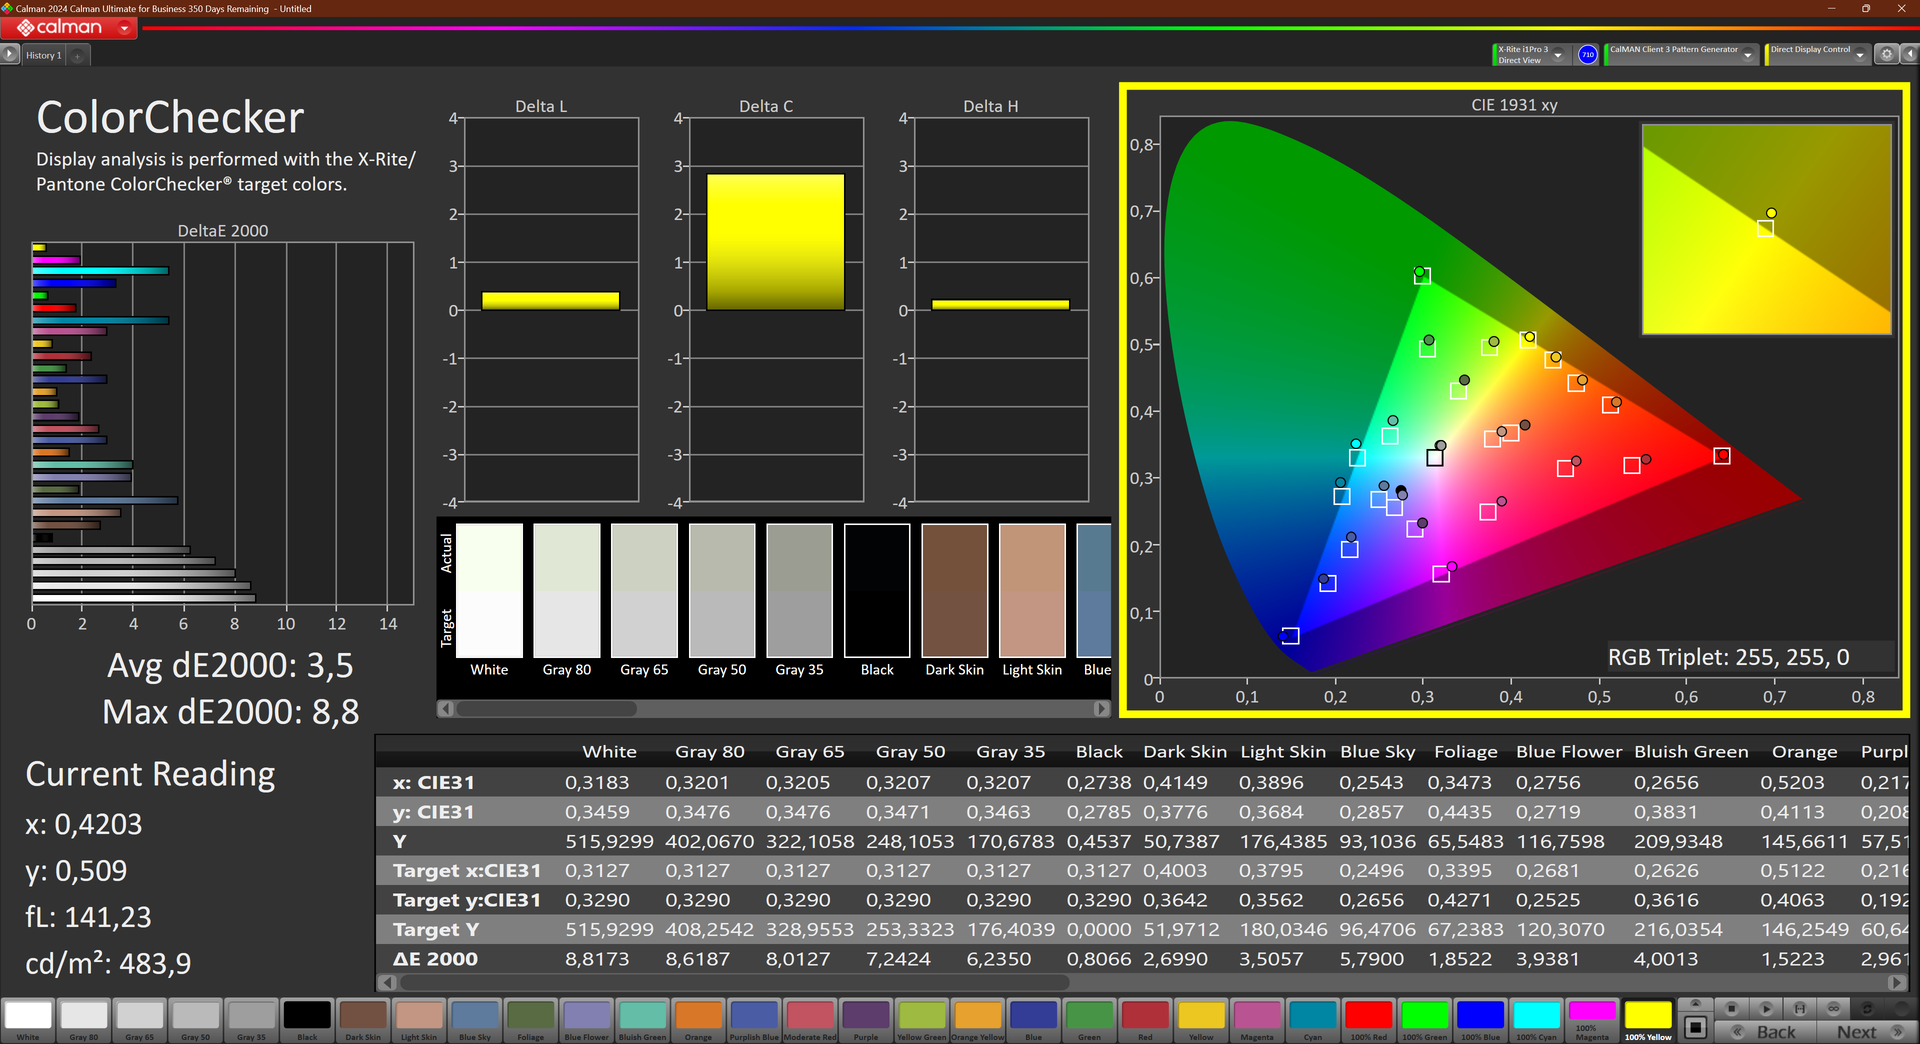
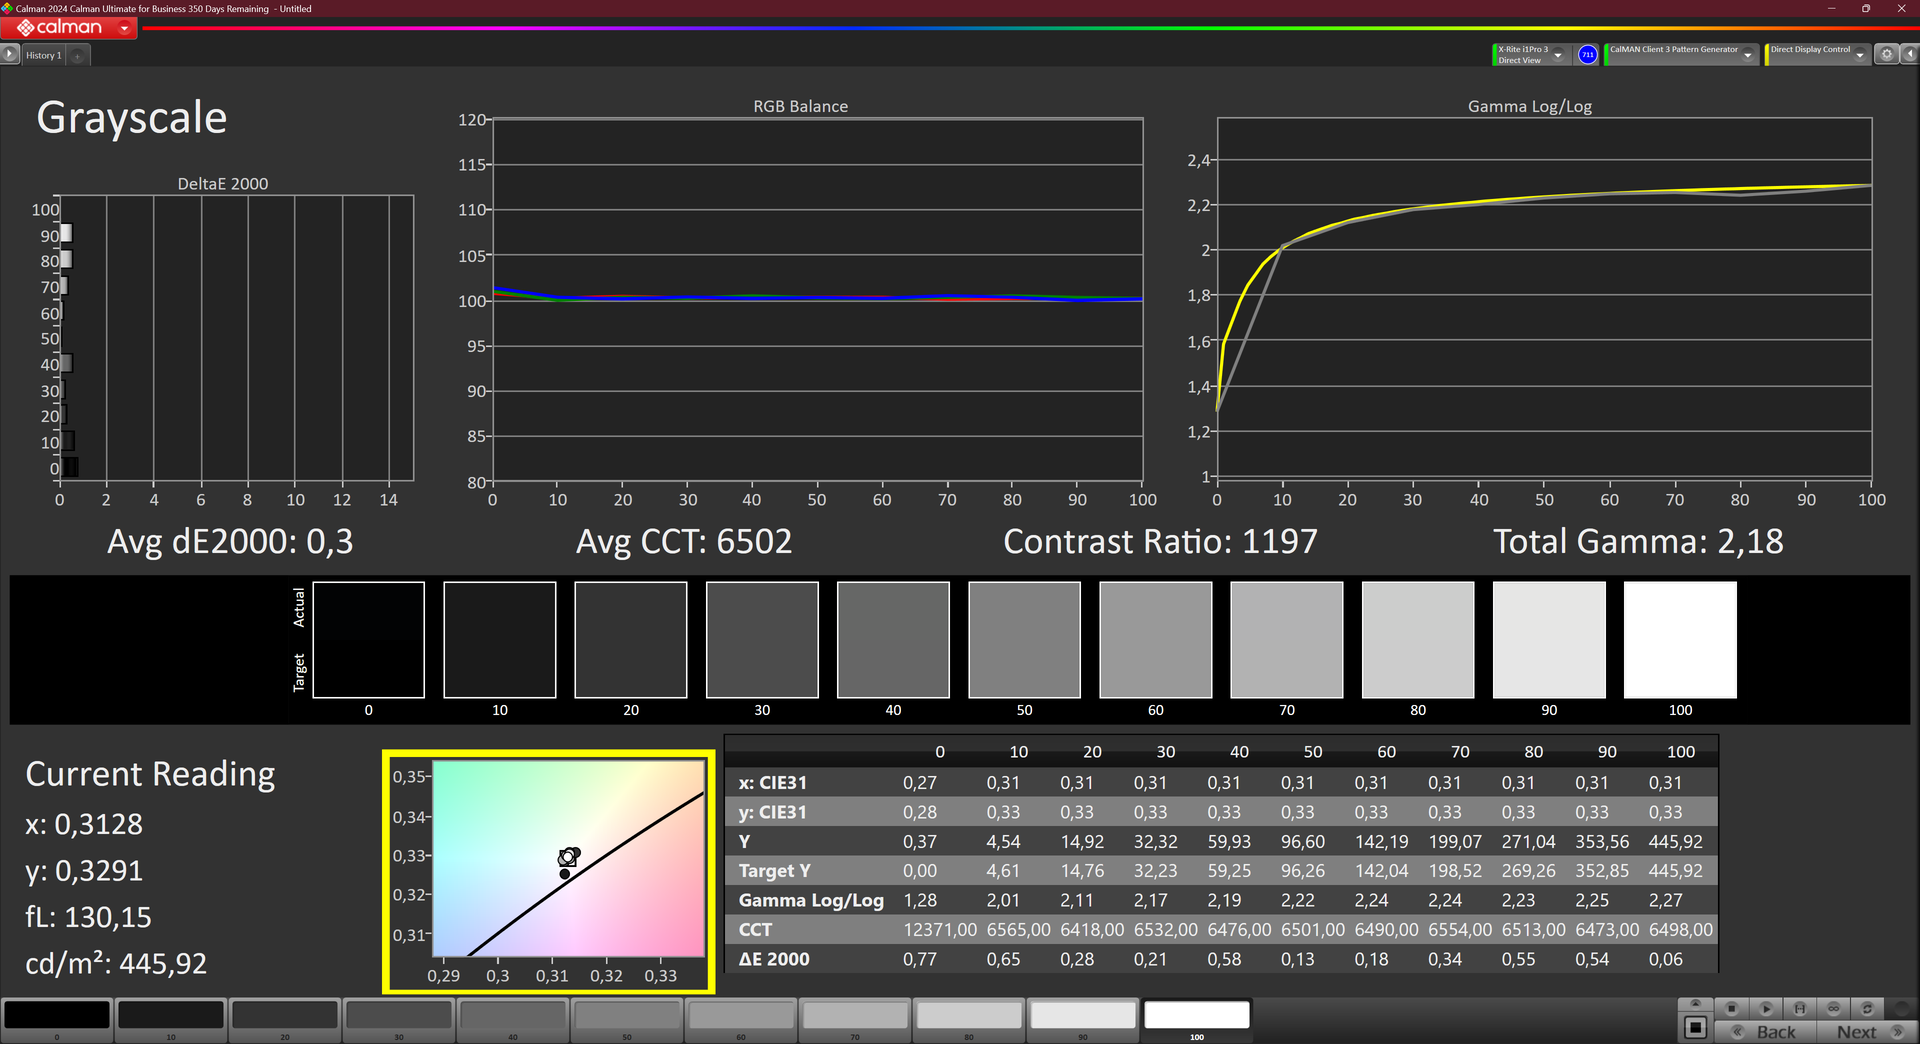
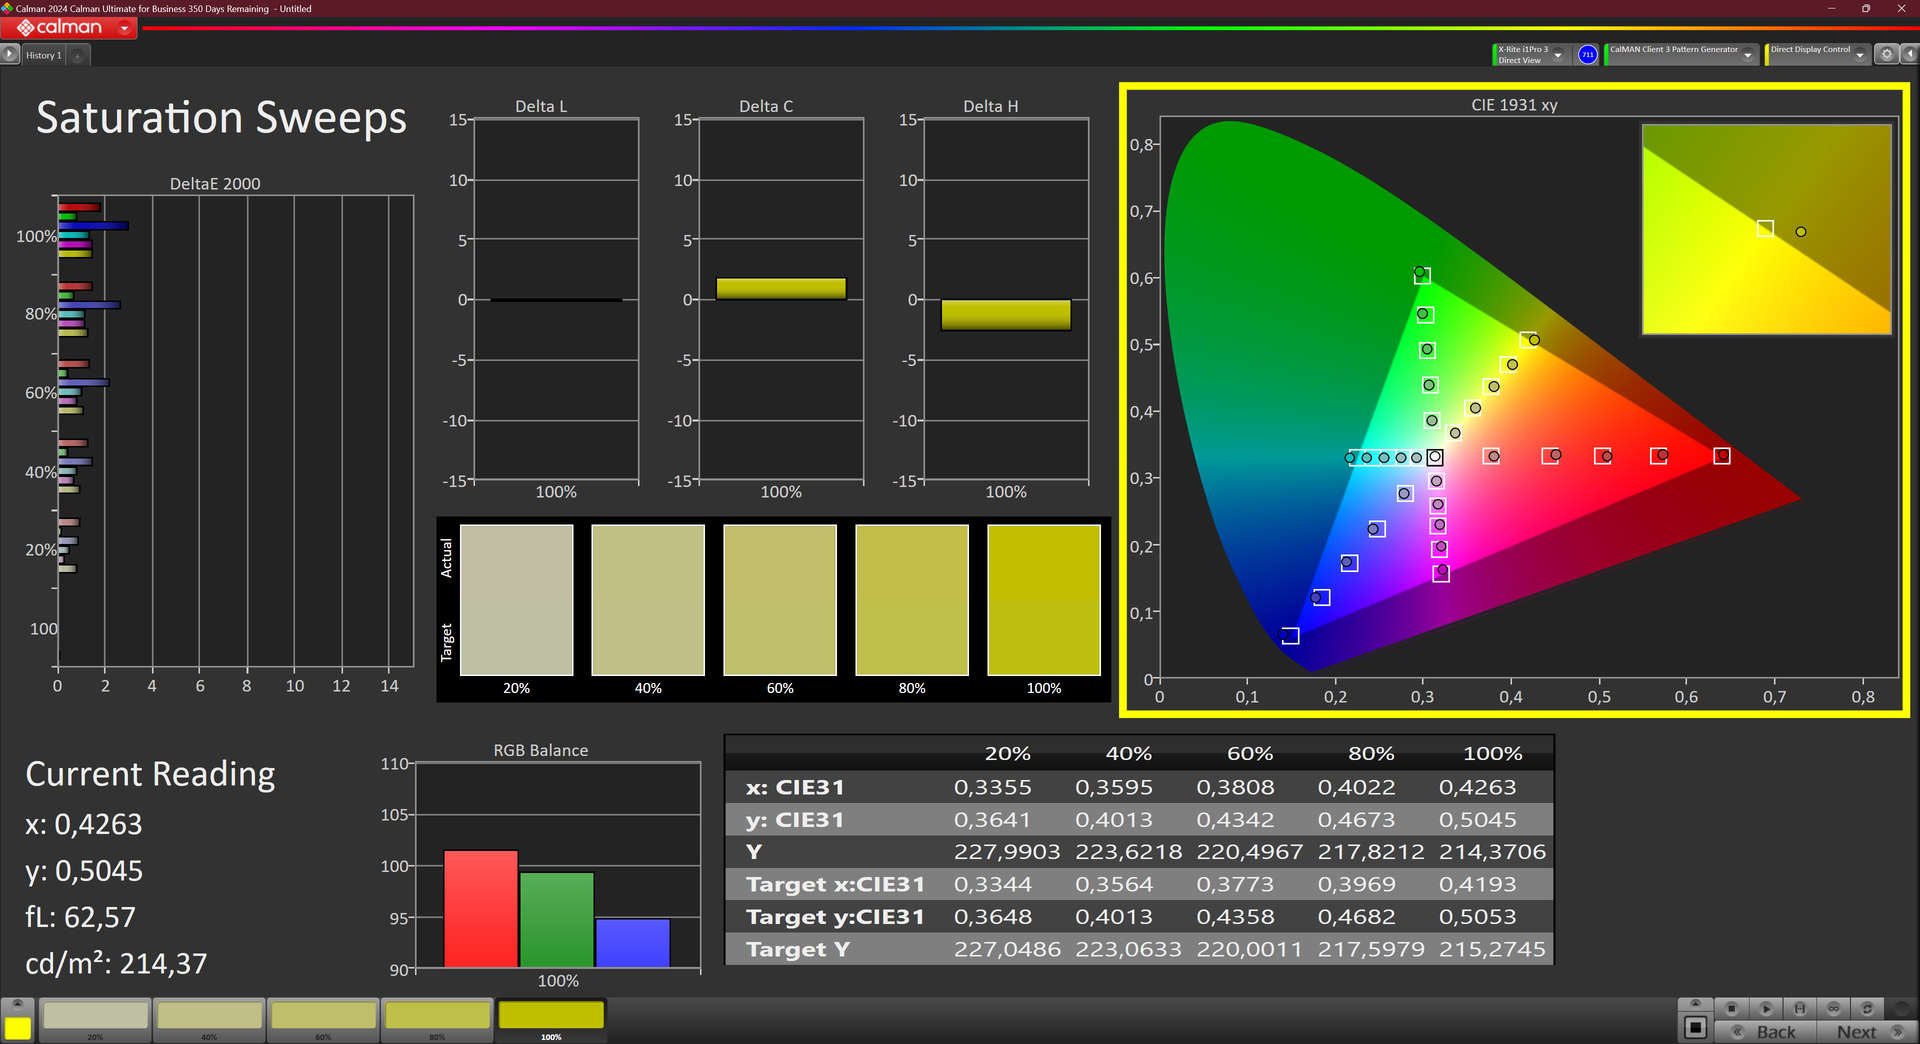

出厂时启用的色彩配置文件显示了错误的色彩,灰度也过暖。使用 X-Rite i1Pro 3 进行校准后,我们可以纠正这一问题。校准后,Colorchecker deltaE 从 3.5 降至 1.2,而 Colorchecker deltaE 则为我们提供了中性色的平均偏差。
联想 ThinkPad P1 7 代的 WQXGA 屏幕覆盖了 97% 的 sRGB 色域。这使得该面板适用于简单的色彩工作。如果要进行高级操作,则应选择 OLED 面板。

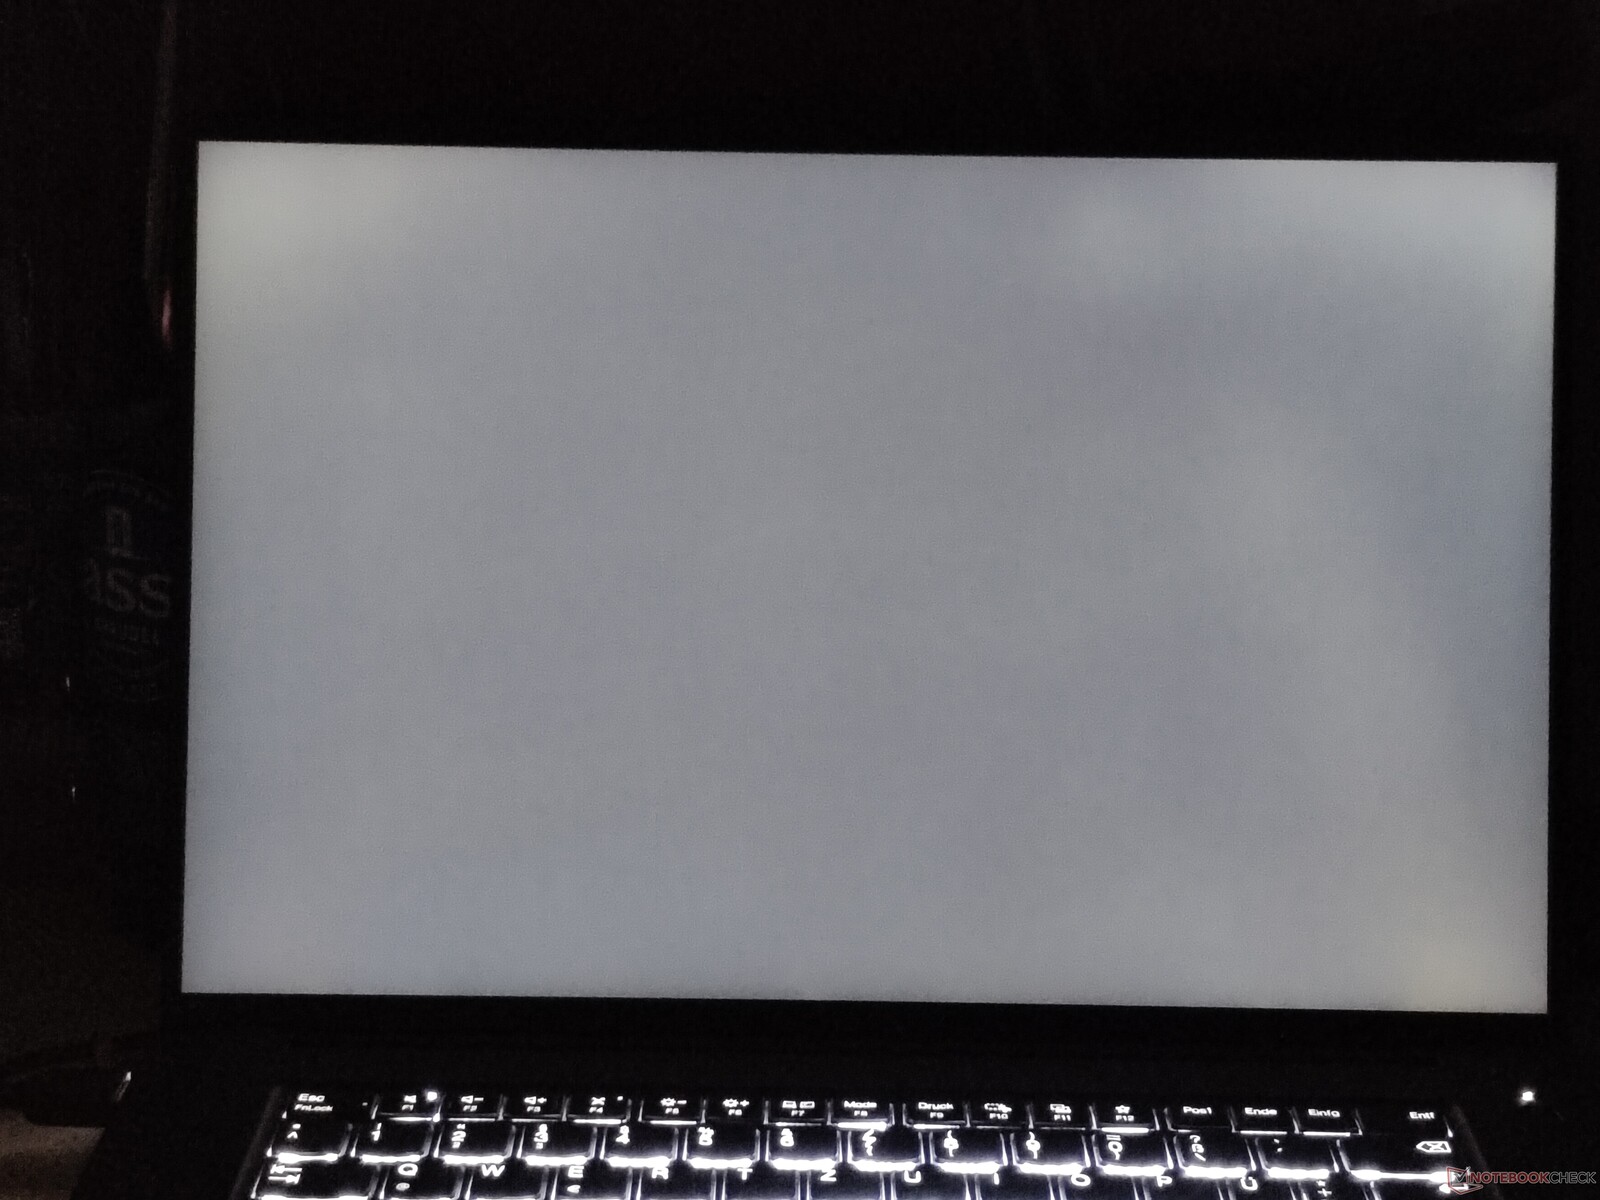
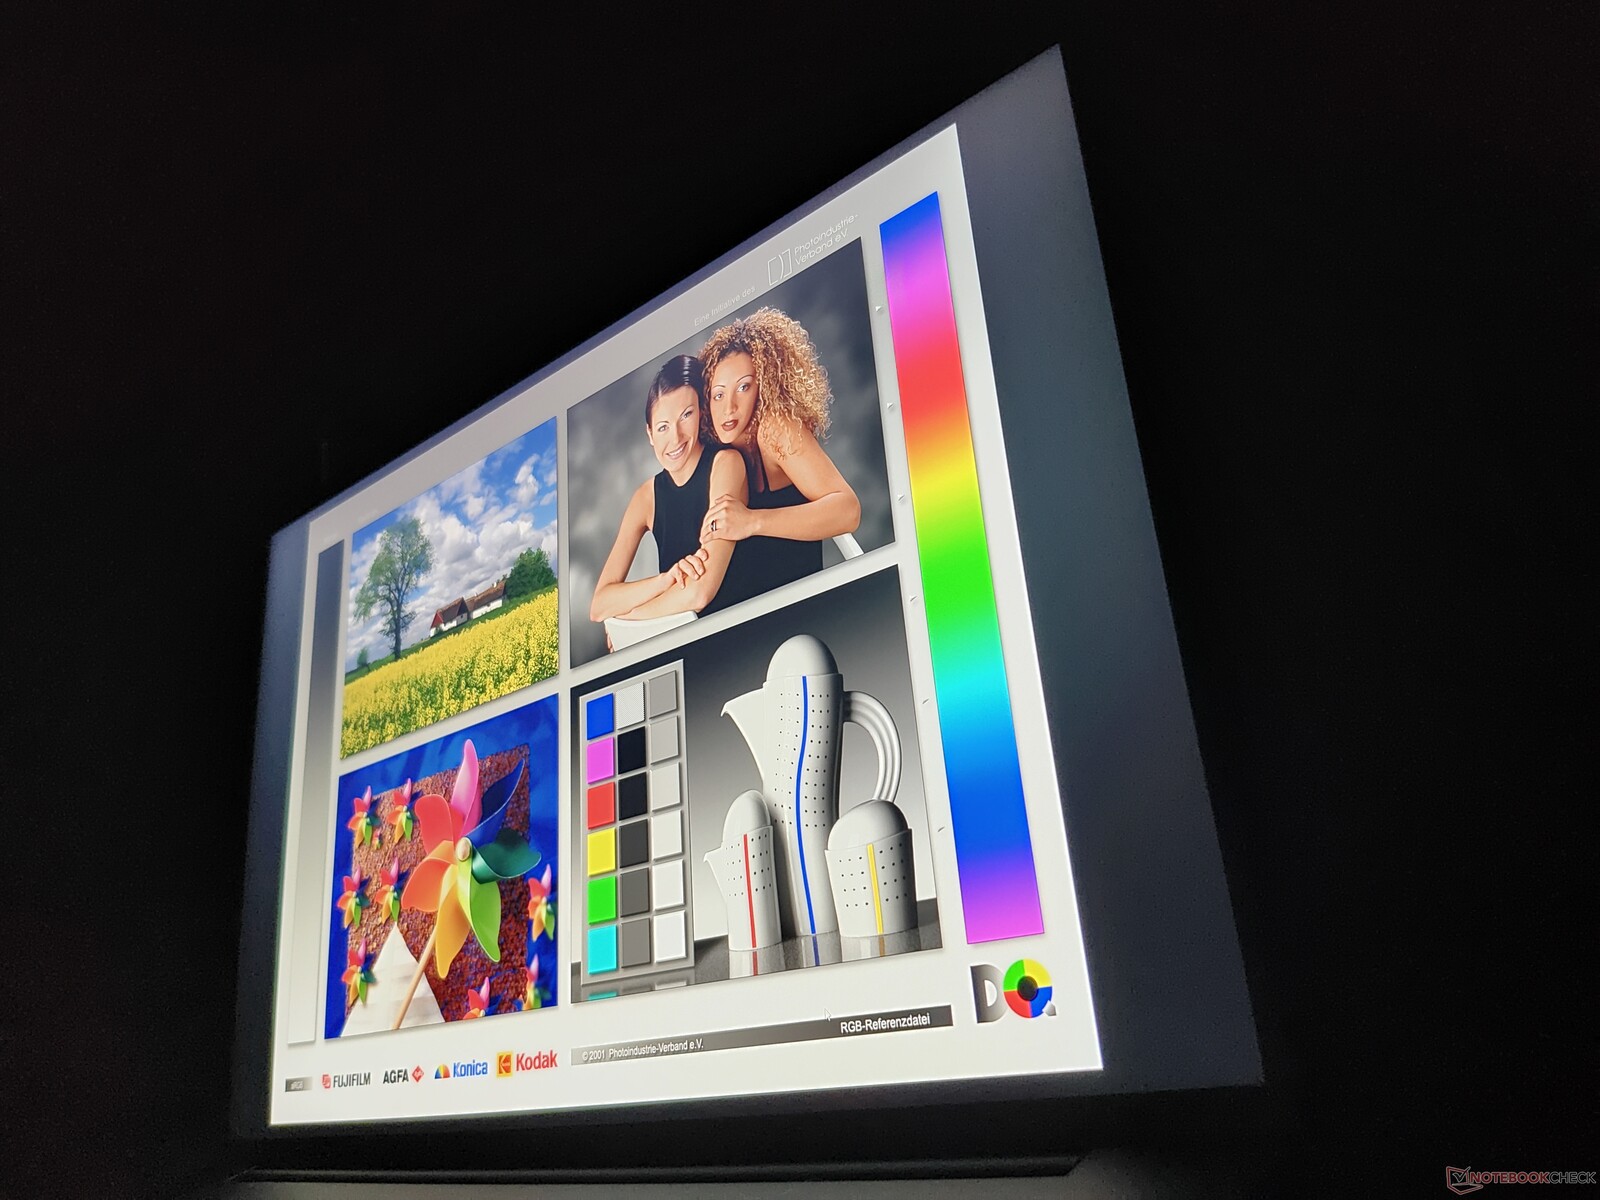
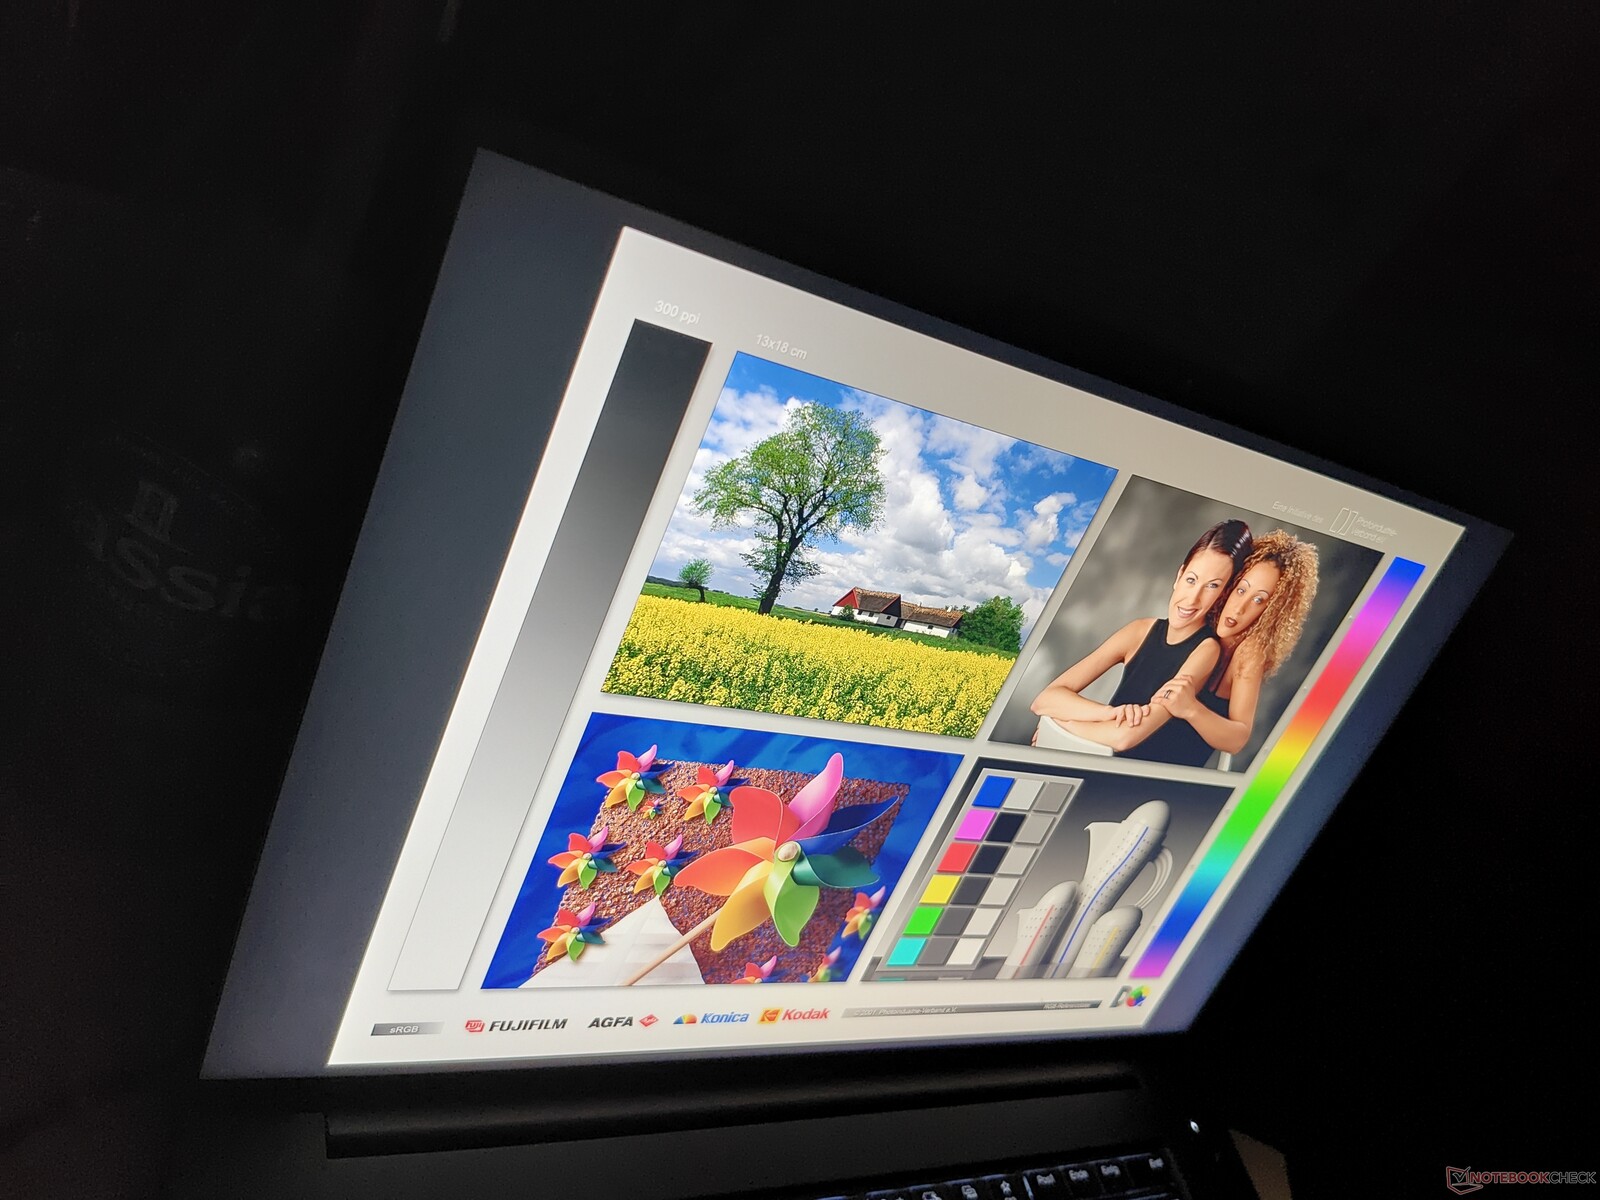
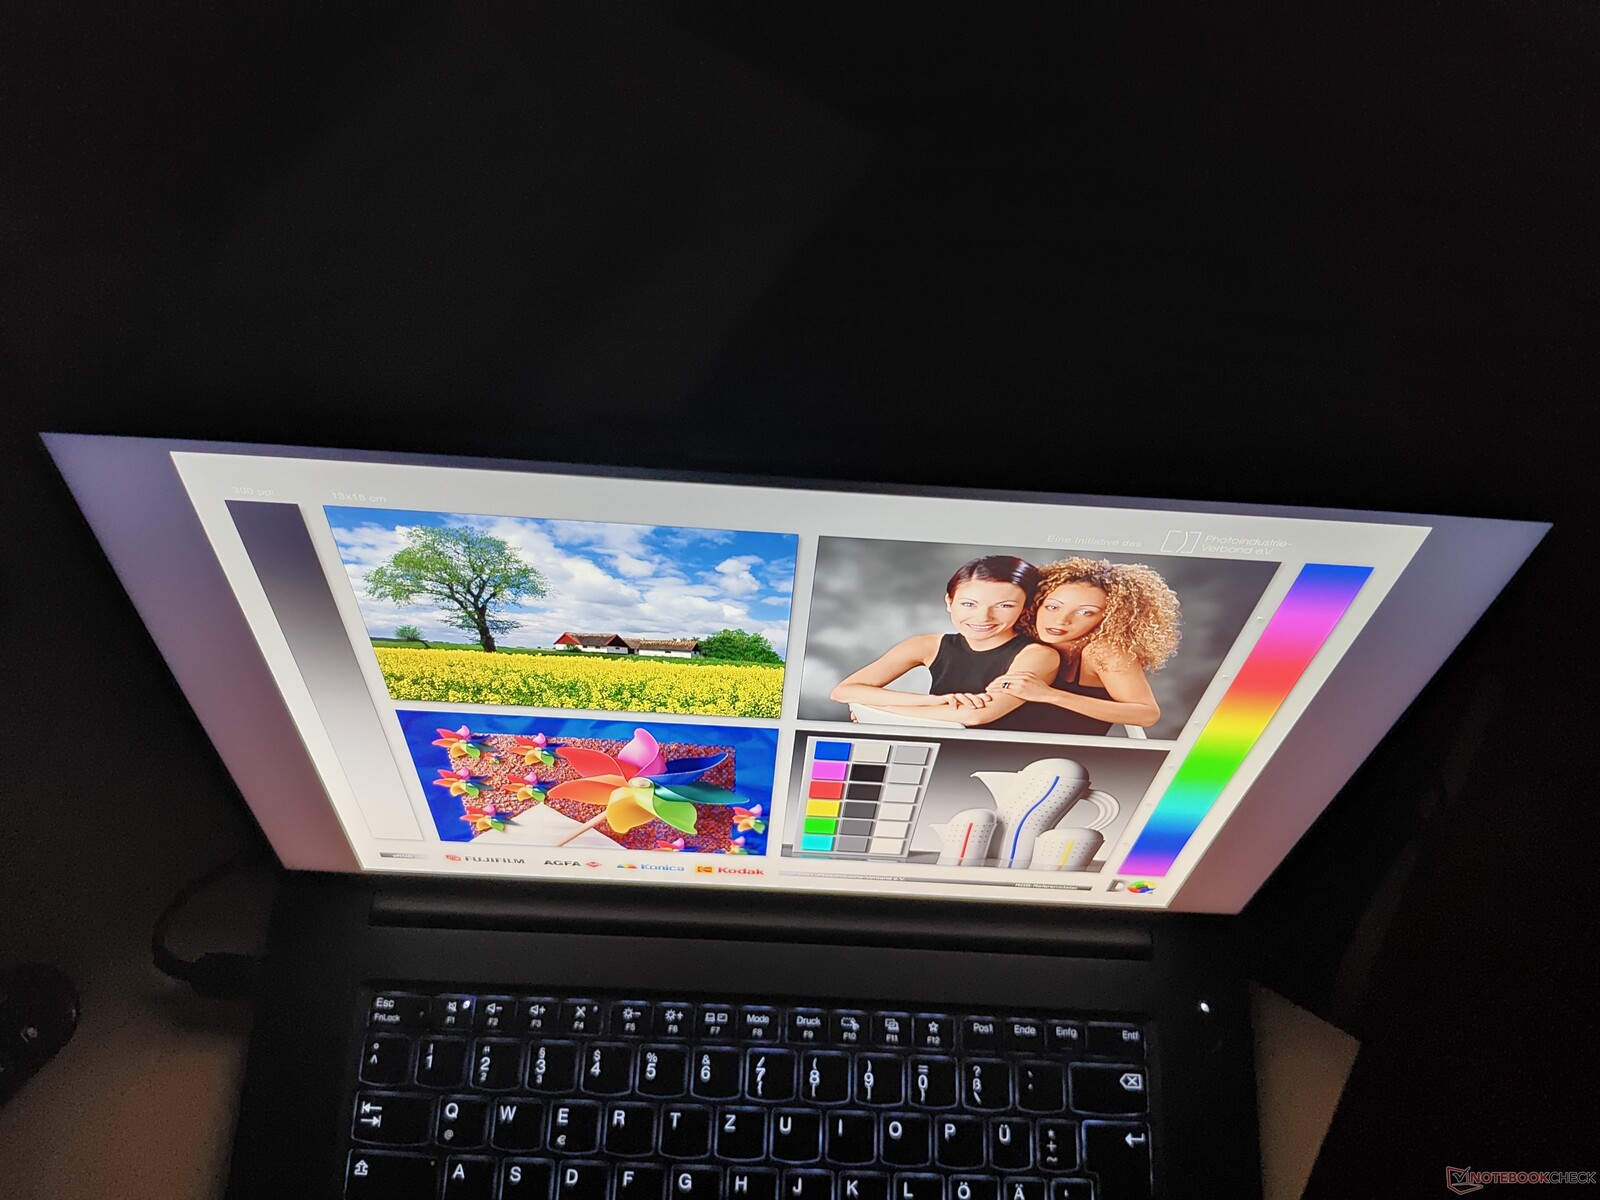
在户外使用联想 ThinkPad P1 7 代时,屏幕亮度高,屏幕内容清晰可见。亚光显示屏表面也支持户外功能。
Display Response Times
| ↔ Response Time Black to White | ||
|---|---|---|
| 10.6 ms ... rise ↗ and fall ↘ combined | ↗ 6.1 ms rise | 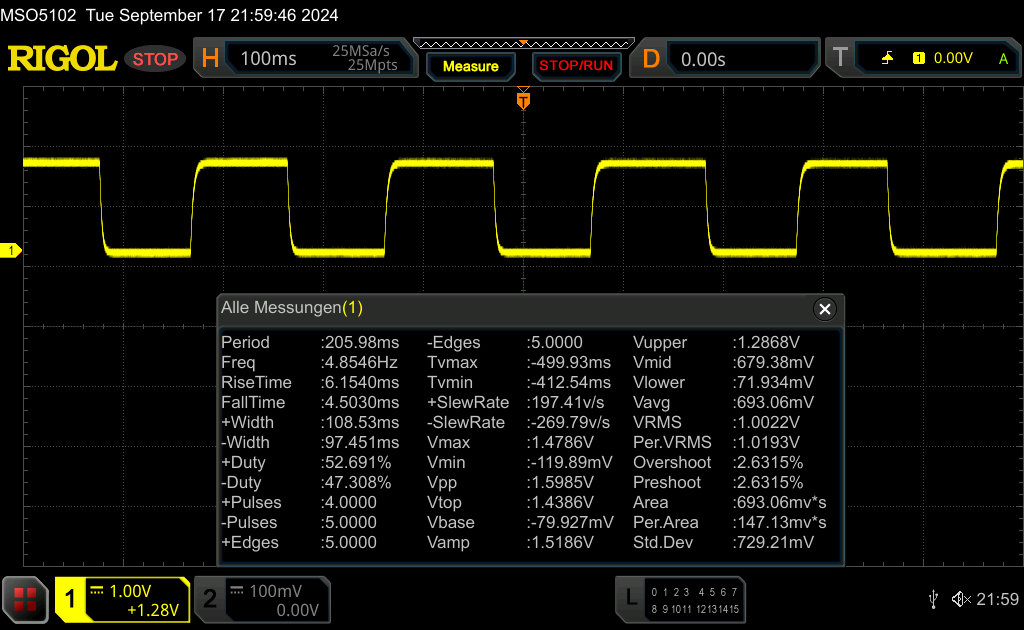 |
| ↘ 4.5 ms fall | ||
| The screen shows good response rates in our tests, but may be too slow for competitive gamers. In comparison, all tested devices range from 0.1 (minimum) to 240 (maximum) ms. » 26 % of all devices are better. This means that the measured response time is better than the average of all tested devices (20.8 ms). | ||
| ↔ Response Time 50% Grey to 80% Grey | ||
| 11.2 ms ... rise ↗ and fall ↘ combined | ↗ 5.6 ms rise | 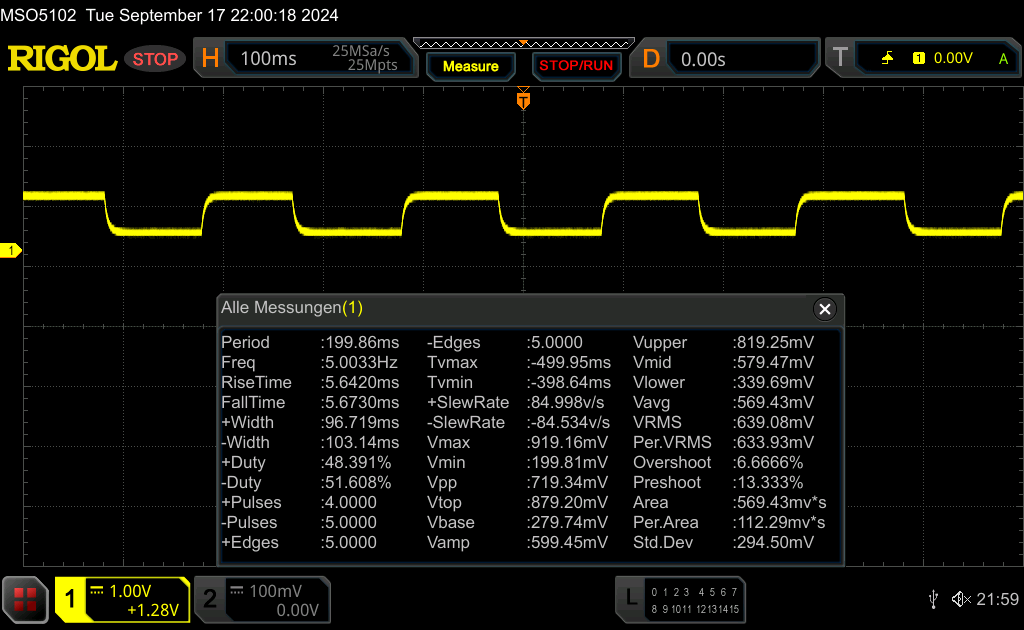 |
| ↘ 5.6 ms fall | ||
| The screen shows good response rates in our tests, but may be too slow for competitive gamers. In comparison, all tested devices range from 0.165 (minimum) to 636 (maximum) ms. » 22 % of all devices are better. This means that the measured response time is better than the average of all tested devices (32.5 ms). | ||
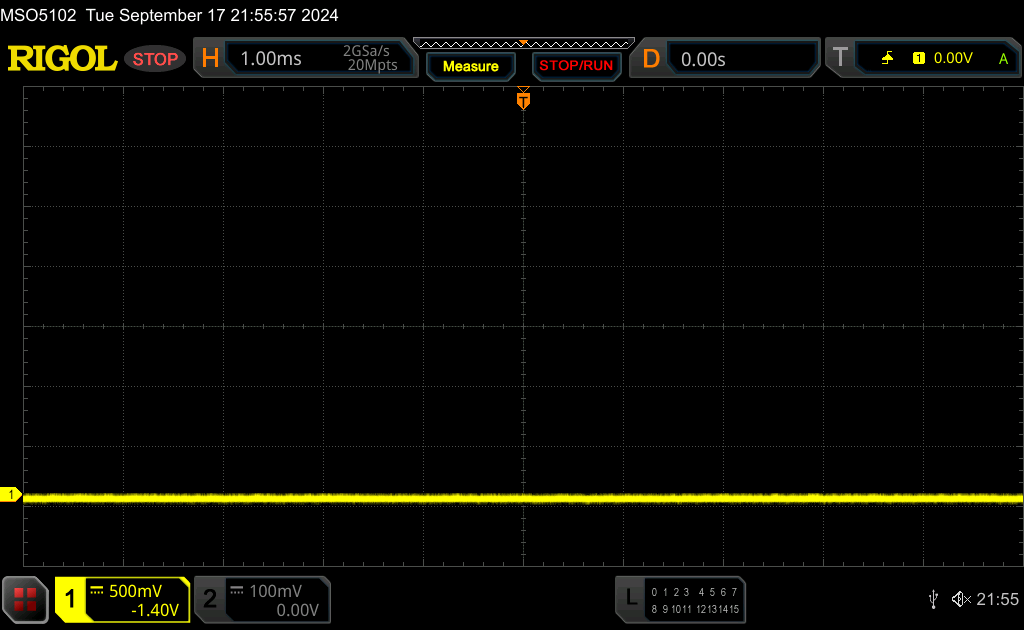
Screen Flickering / PWM (Pulse-Width Modulation)
| Screen flickering / PWM not detected | 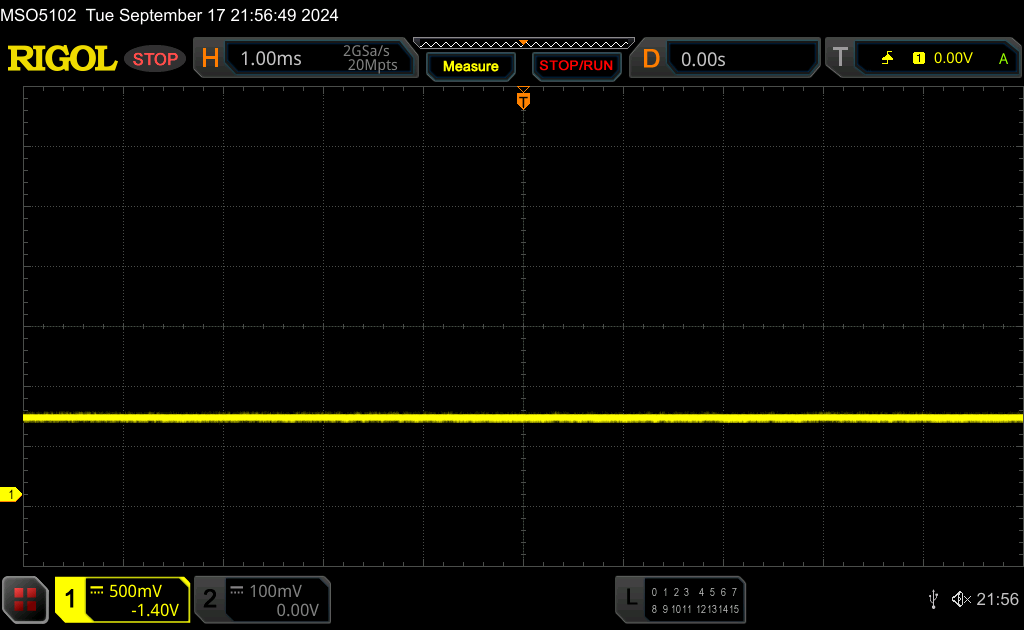 | ||
In comparison: 53 % of all tested devices do not use PWM to dim the display. If PWM was detected, an average of 8516 (minimum: 5 - maximum: 343500) Hz was measured. | |||
性能:流星湖取代猛禽湖
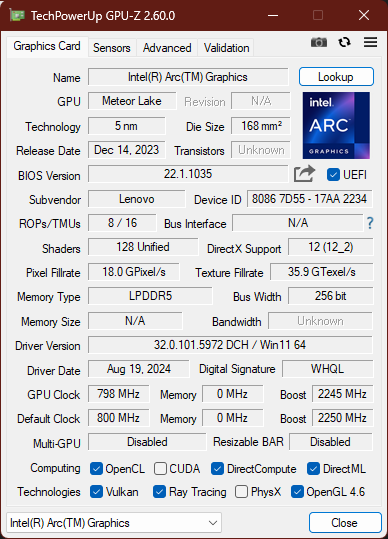
与基于 AMD 的 ThinkPad Z16 相比,联想 ThinkPad P1 Gen 7 只提供英特尔 CPU。规格表中列出了四款 Meteor Lake H 芯片(包括英特尔酷睿 5 135H, 酷睿至尊 7 155H, 酷睿至尊 7 165H, Core Ultra 9 185H除 155H 外,其余均支持 vPro Enterprise。更全面的是 GPU 的选择,有三种专业的 Nvidia RTX 芯片(RTX 1000 Ada、RTX 2000 Ada、RTX 4000 Ada、RTX 5000 Ada)。RTX 1000 Ada, RTX 2000 Ada, RTX 3000 Ada)和两块 NvidiaGeForce 芯片 (GeForce RTX 4060, GeForce RTX 4070).另外,P1 G7 也可以不配置任何 dGPU,在这种情况下,可以使用 英特尔 ARC取代。
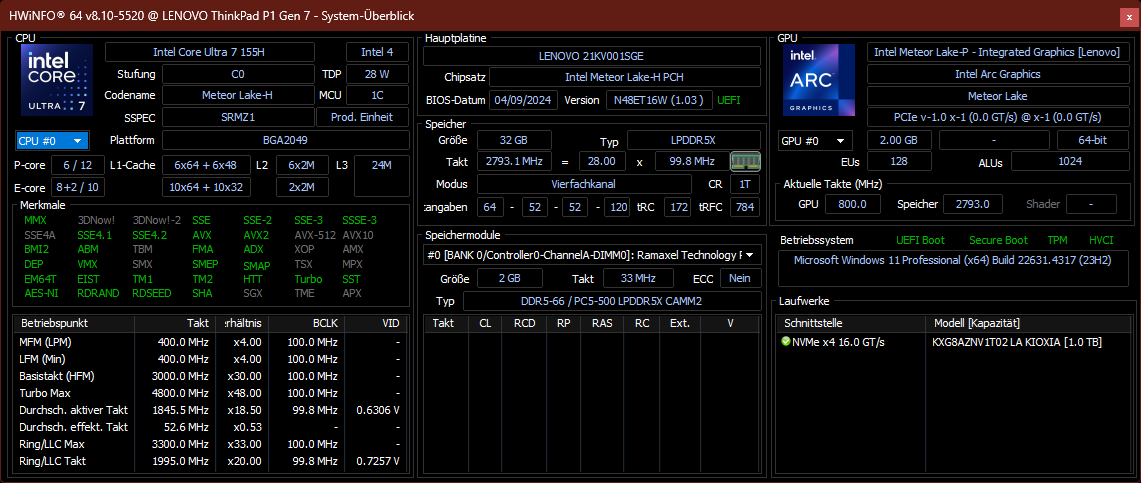
内存容量为 16、32 或 64 GB。单个 LPCAMM2 模块为 ThinkPad P1 G7 带来了快速的 LPDDR5X-7500 内存,取代了前代产品的 DDR5-5600,但由于不支持 ECC,这一功能也随之消失。两块 M.2 2280 SSD 通过 NVMe PCIe 4.0 连接,最大容量为 8 TB(2x 4 TB)。支持 RAID 0/1。
测试条件
可通过 Windows 设置选择三种可用的能源配置文件。它们通过功率限制影响 TDP 设置--功率限制 1 (PL1) 设置持续负载下的功耗,PL2 设置短期负载下的最大功耗。
- 最佳电池寿命:PL1 25 W / PL2 115 W
- 平衡:PL1 50 W / PL2 115 W
- 最佳性能:PL1 70 瓦 / PL2 115 瓦
下表列出了 ThinkPad P1 Gen 7 不同能源配置文件之间的性能差异。
| 能源概况 | PL1 | PL2 | CB R23 Multi | TGP | Time Spy 图形 | CP 2077 QHD/Ultra | 压力测试 | 最大风扇噪音 |
|---|---|---|---|---|---|---|---|---|
| 最佳电池寿命 | 25 W | 115 W | 16388 | 45 W | 7150 | 30.3 FPS | CPU:75 C GPU:65 C |
43.18 dB(A) |
| 平衡 | 50 W | 115 W | 17111 | 60 W | 8166 | 33.6 FPS | CPU:100 C GPU:80 C |
46.17 dB(A) |
| 最佳性能 | 70 W | 115 W | 18762 | 80 W | 9386 | 39.9 FPS | CPU:103 C GPU:88 C |
53.27 dB(a) |
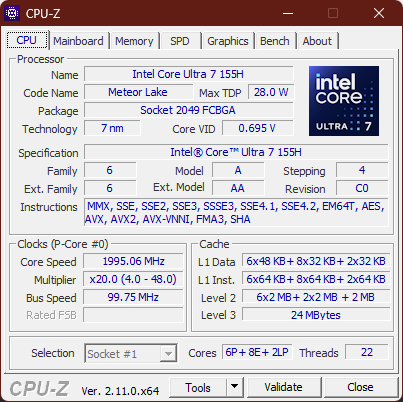
处理器
英特尔 酷睿至尊 7 155H属于注重性能的流星湖 H 系列。典型功耗在 28 到 45 W 之间,但正如我们在联想 ThinkPad P1 Gen 7 上看到的那样,OEM 厂商有可能设置更高的功耗。中央处理器有 16 个内核和 22 个超线程,采用 6+8+2 设计,包括 6 个大 P 核心、8 个 E 核心和 2 个低功耗 E 核心。这些内核的时钟频率各不相同(P 内核的时钟频率为 4 至 4.8 GHz,E 内核的时钟频率为 4 至 4.8 GHz,低功耗 E 内核的时钟频率为 4 至 5 GHz): 1.4 至 4.8 GHz,E 内核 0.9 至 3.9 GHz,LP E 内核:7 至 2.5 GHz): 0.7 至 2.5 吉赫)。通过我们的 CPU 列表.
高功耗限制使联想 ThinkPad P1 Gen 7 在多核测试中超越了其前代产品 P1 Gen 6。较新的 ThinkPad 工作站在持续负载情况下也能提供这样的性能,没有任何节流现象。在运行单核任务时,P1 Gen 7 输给了前代产品,因为 Raptor Lake 在这一领域总体上击败了 Meteor Lake - 功耗更高。总体而言,P1 Gen 7 的 CPU 性能对于现代工作站来说绰绰有余,与戴尔的竞争对手基本相当。
在电池模式下,CPU 性能略有下降。我们测得的性能损失为 13%。
Cinebench R15 Multi Dauertest
Cinebench R23: Multi Core | Single Core
Cinebench R20: CPU (Multi Core) | CPU (Single Core)
Cinebench R15: CPU Multi 64Bit | CPU Single 64Bit
Blender: v2.79 BMW27 CPU
7-Zip 18.03: 7z b 4 | 7z b 4 -mmt1
Geekbench 6.4: Multi-Core | Single-Core
Geekbench 5.5: Multi-Core | Single-Core
HWBOT x265 Benchmark v2.2: 4k Preset
LibreOffice : 20 Documents To PDF
R Benchmark 2.5: Overall mean
| CPU Performance Rating | |
| Apple MacBook Pro 16 2023 M3 Pro -8! | |
| Lenovo ThinkPad P1 G6 21FV001KUS | |
| Dell Precision 5690 | |
| Average of class Workstation | |
| Lenovo ThinkPad P1 Gen 7 21KV001SGE | |
| Dell XPS 16 9640 | |
| HP ZBook Power 16 G11 A | |
| Average Intel Core Ultra 7 155H | |
* ... smaller is better
AIDA64: FP32 Ray-Trace | FPU Julia | CPU SHA3 | CPU Queen | FPU SinJulia | FPU Mandel | CPU AES | CPU ZLib | FP64 Ray-Trace | CPU PhotoWorxx
| Performance Rating | |
| Average of class Workstation | |
| Dell Precision 5690 | |
| Dell XPS 16 9640 | |
| Lenovo ThinkPad P1 Gen 7 21KV001SGE | |
| Lenovo ThinkPad P1 G6 21FV001KUS | |
| Average Intel Core Ultra 7 155H | |
系统性能
在系统性能方面,没有什么可抱怨的。联想 ThinkPad P1 第 7 代运行速度非常快,这在如此昂贵的设备上是意料之中的。
内存基准测试非常有趣:LPCAMM2 内存比前代产品的 DDR5 内存快得多,但仍落后于戴尔的焊接式竞争对手。
CrossMark: Overall | Productivity | Creativity | Responsiveness
WebXPRT 3: Overall
WebXPRT 4: Overall
Mozilla Kraken 1.1: Total
| PCMark 10 / Score | |
| Dell Precision 5690 | |
| Lenovo ThinkPad P1 G6 21FV001KUS | |
| Average of class Workstation (6336 - 8587, n=25, last 2 years) | |
| Lenovo ThinkPad P1 Gen 7 21KV001SGE | |
| Dell XPS 16 9640 | |
| Average Intel Core Ultra 7 155H, NVIDIA GeForce RTX 4060 Laptop GPU (6751 - 7370, n=5) | |
* ... smaller is better
| PCMark 10 Score | 7370 points | |
Help | ||
| AIDA64 / Memory Copy | |
| Dell XPS 16 9640 | |
| Dell Precision 5690 | |
| Average Intel Core Ultra 7 155H (62397 - 96791, n=50) | |
| Average of class Workstation (34323 - 158632, n=25, last 2 years) | |
| Lenovo ThinkPad P1 Gen 7 21KV001SGE | |
| Lenovo ThinkPad P1 G6 21FV001KUS | |
* ... smaller is better
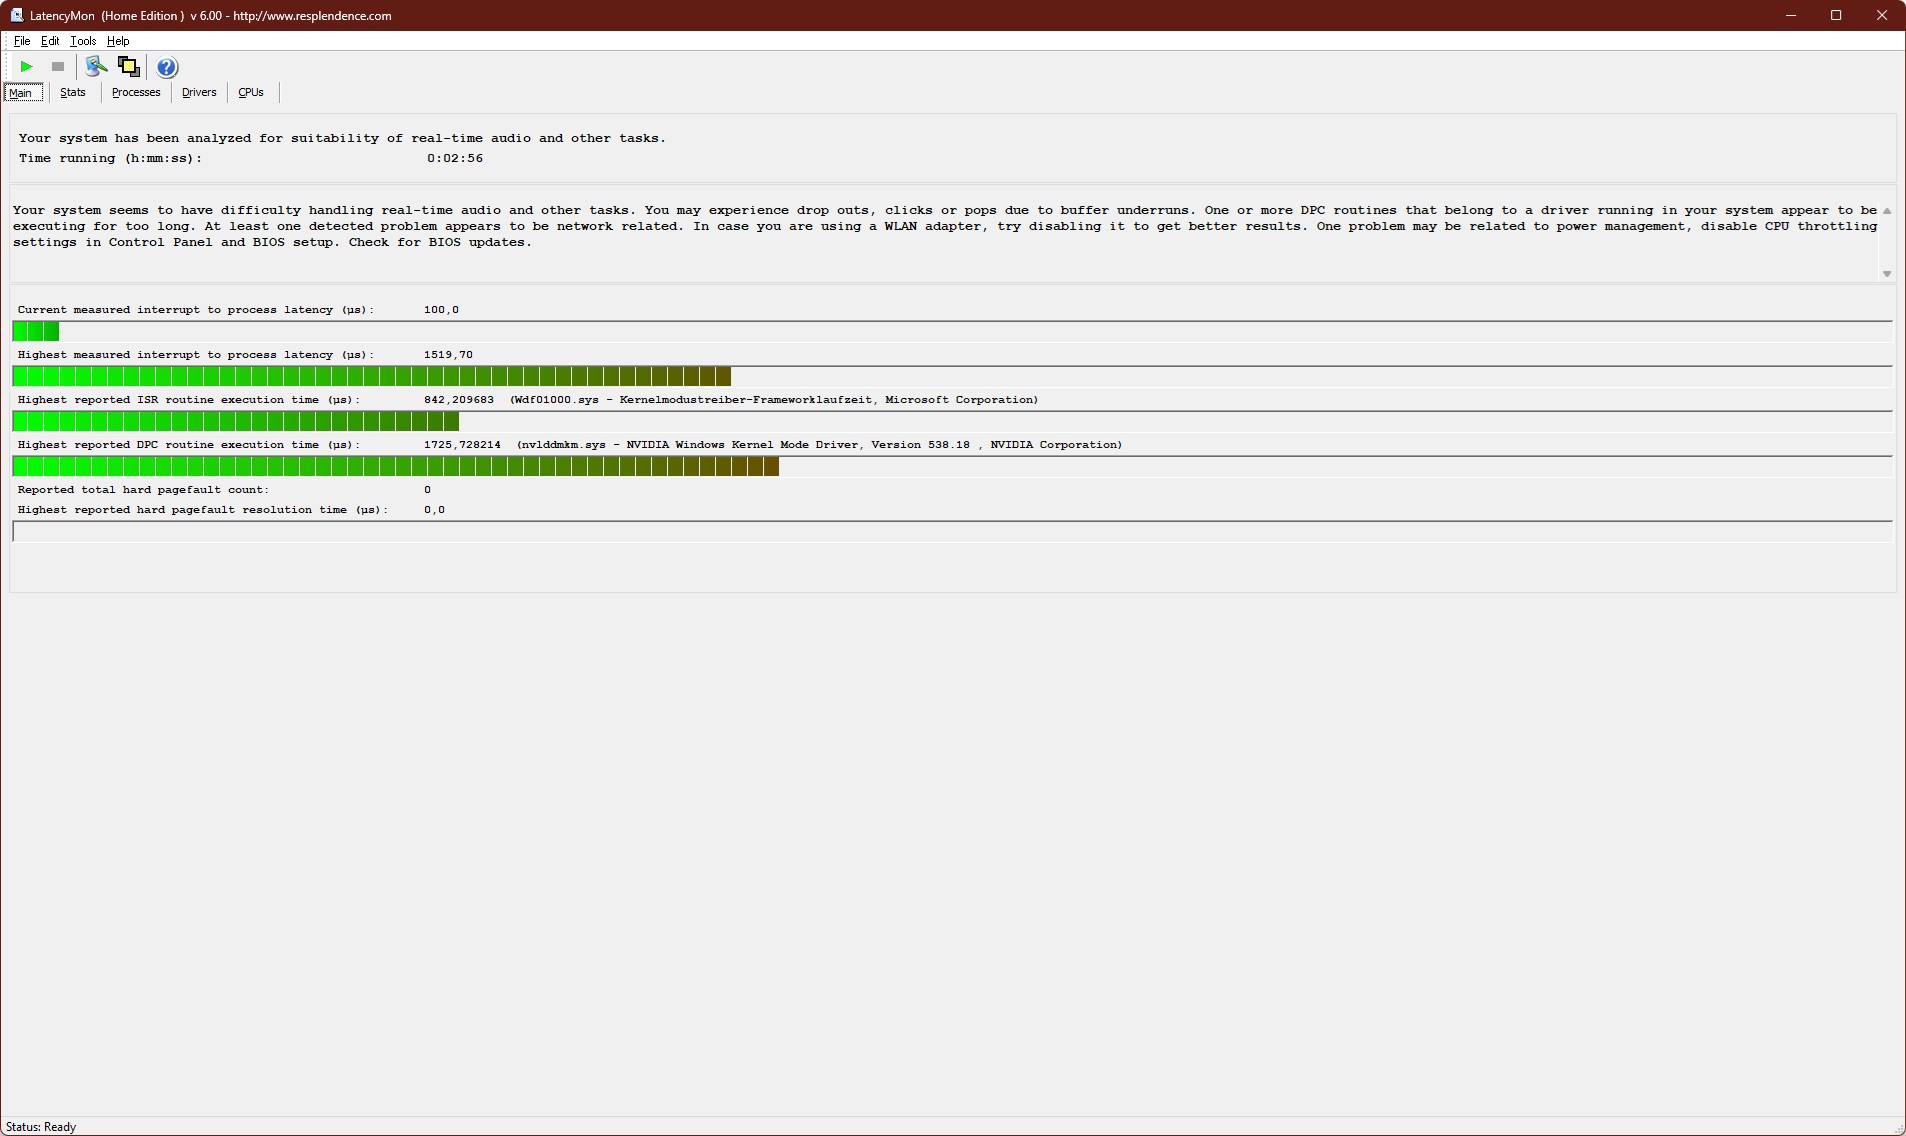
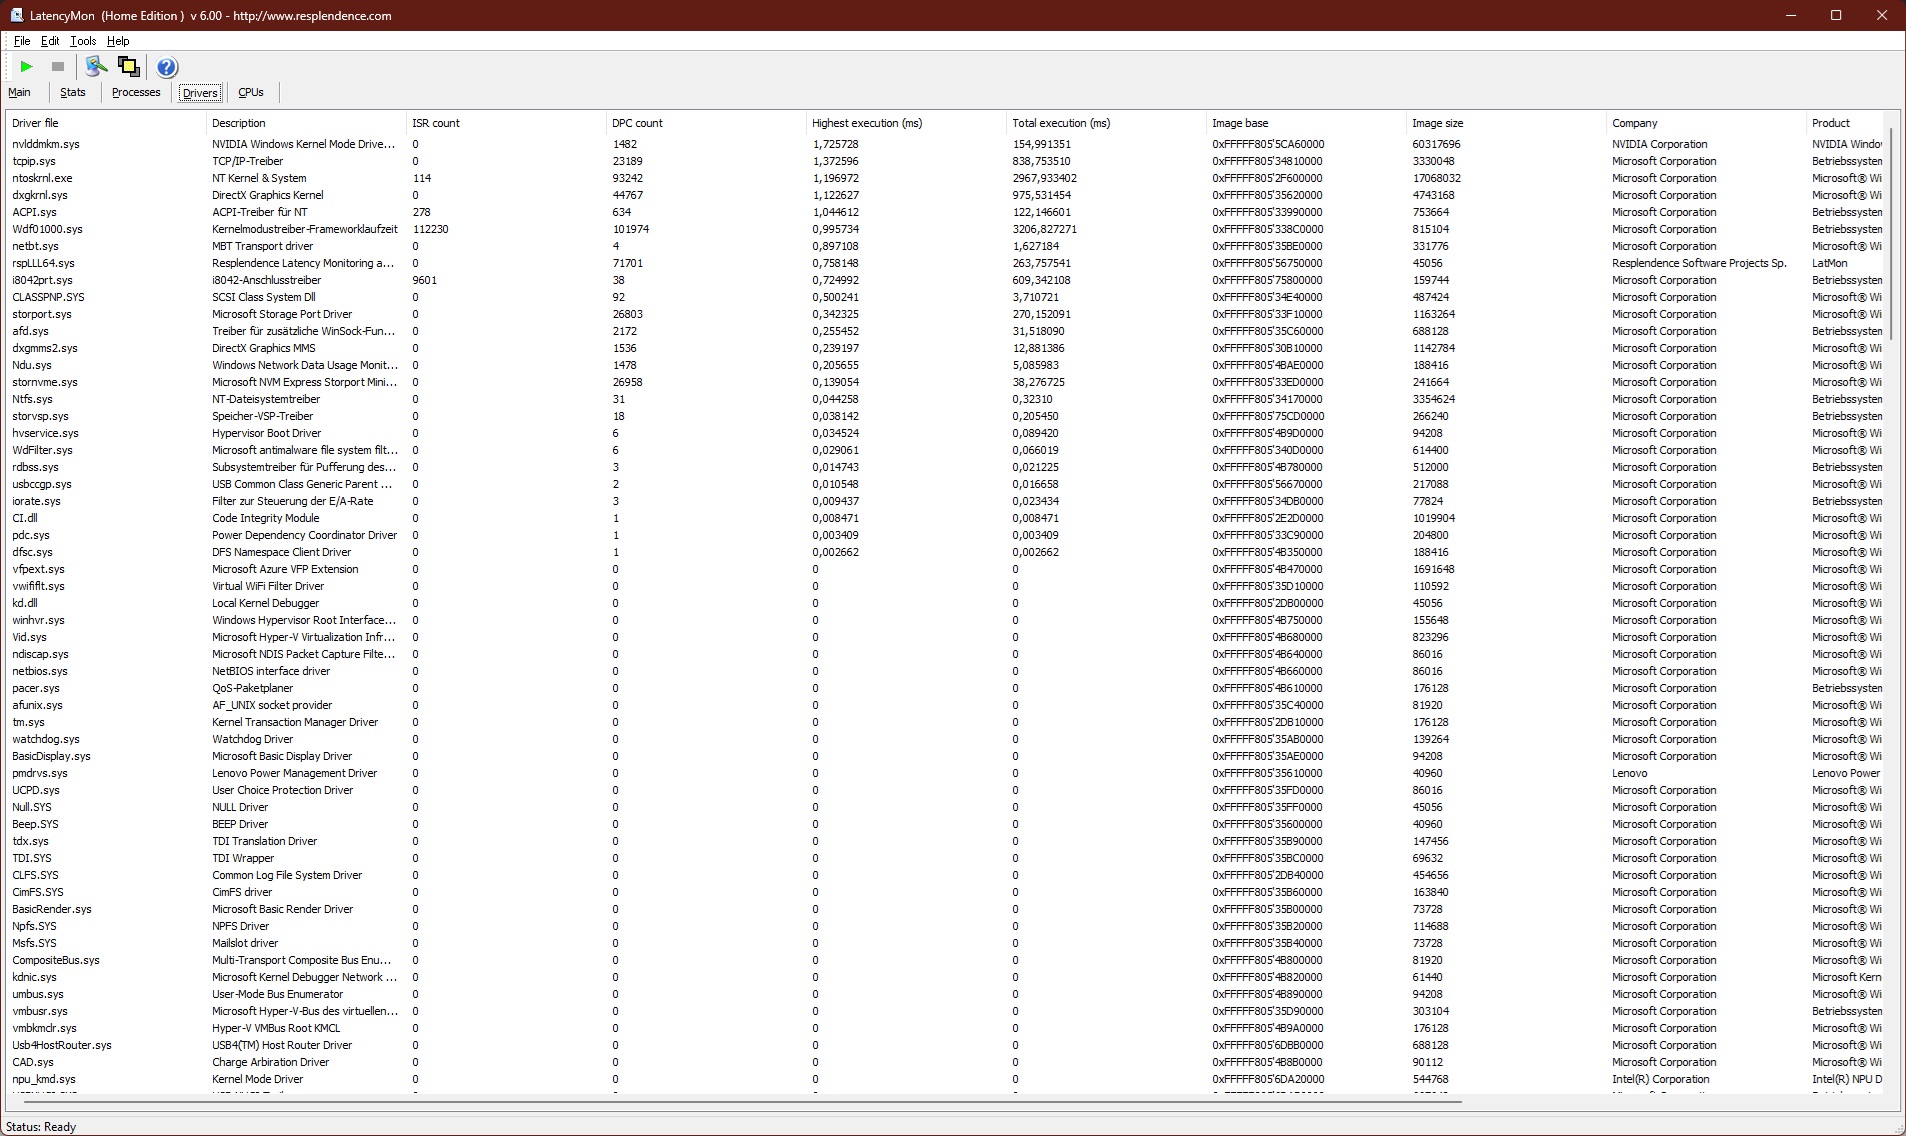
DPC 延迟
联想的 ThinkPad P1 G7 似乎在 DPC 延迟引起的掉线方面存在一些问题。根本原因似乎是 Nvidia 驱动程序。在禁用 Nvidia GPU 的情况下使用 ThinkPad,问题可能会消失。
| DPC Latencies / LatencyMon - interrupt to process latency (max), Web, Youtube, Prime95 | |
| Lenovo ThinkPad P1 Gen 7 21KV001SGE | |
| Lenovo ThinkPad P1 G6 21FV001KUS | |
| Dell XPS 16 9640 | |
| Dell Precision 5690 | |
* ... smaller is better
存储
联想使用的是容量为 1 TB 的 Kioxia SSD。NVMe PCIe 4.0 固态硬盘在持续负载下性能没有下降,但速度并不是很快。不过,在日常使用中,与竞争对手固态硬盘的差异并不明显。
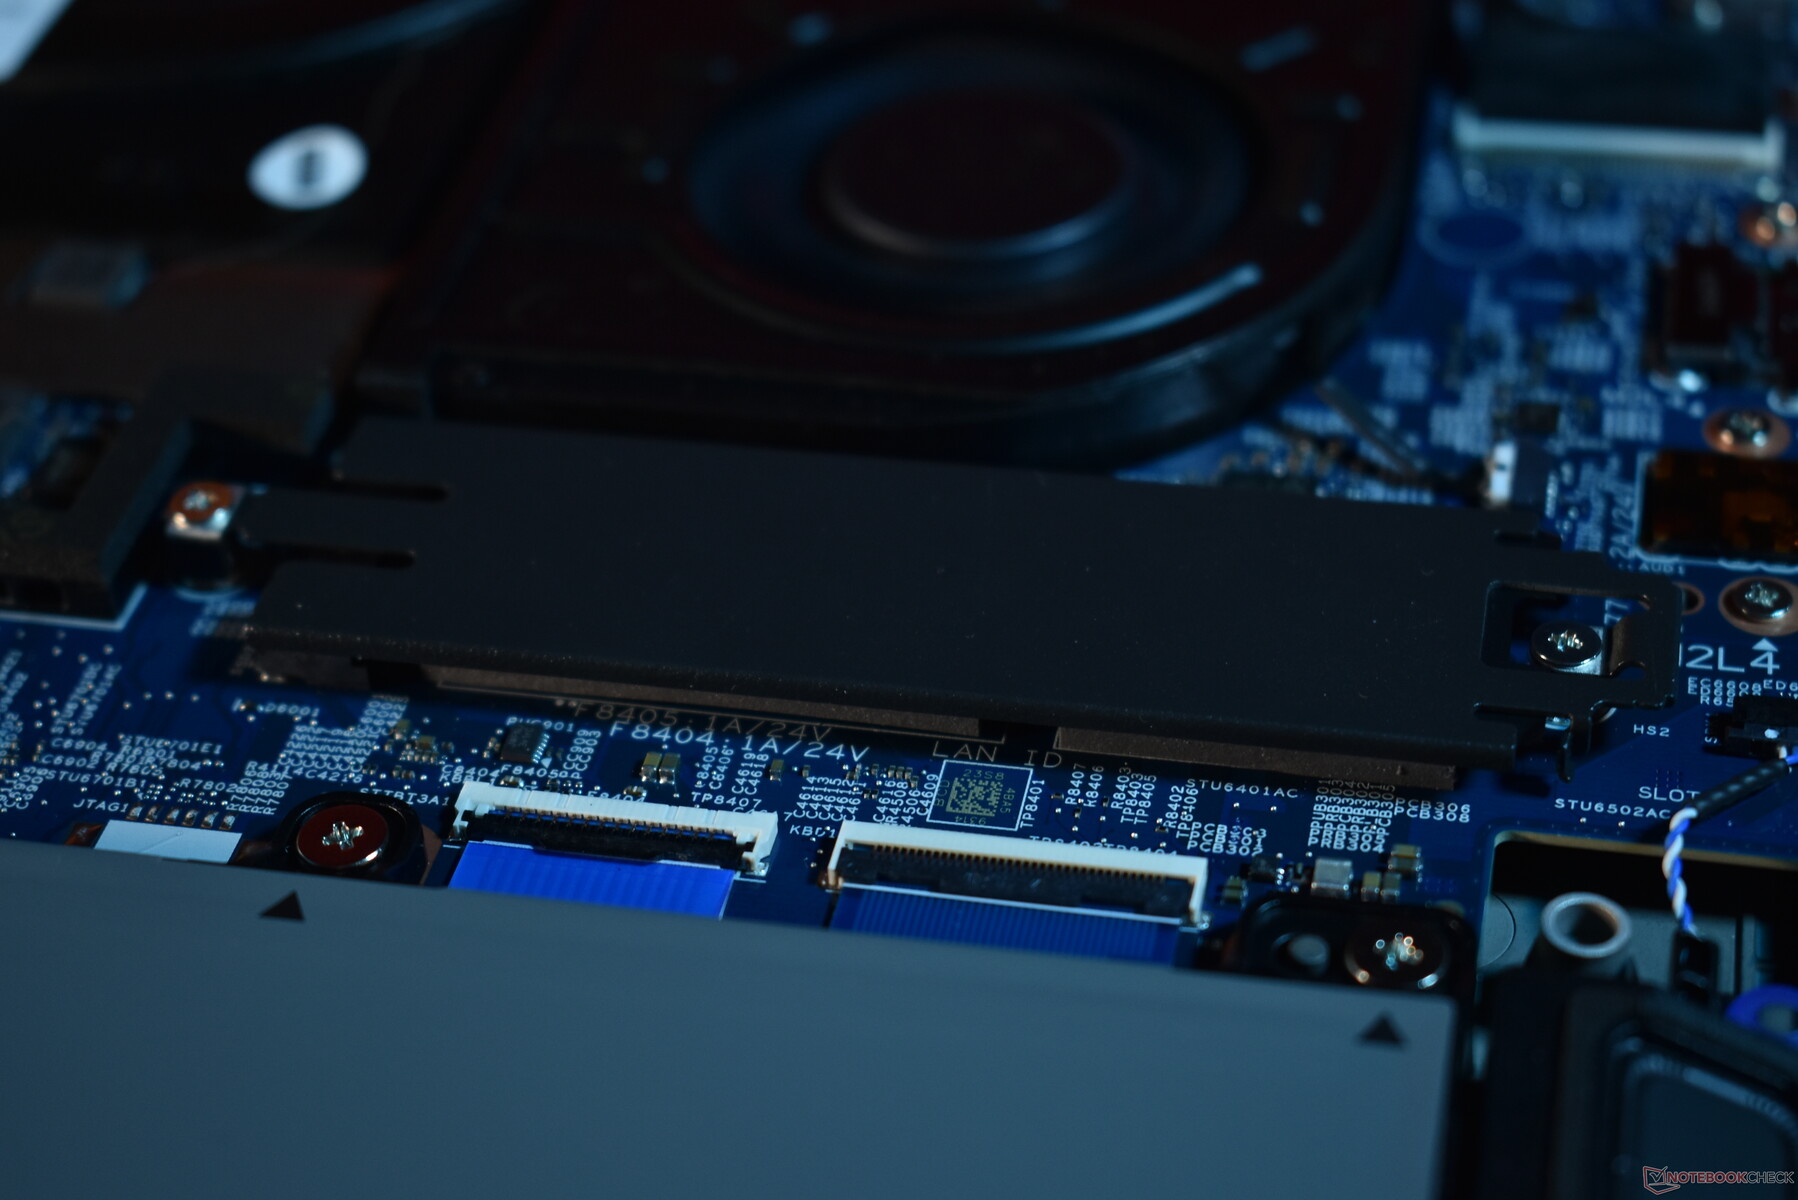
正如维护部分所述:联想 ThinkPad P1 7 代有两个 M.2 2280 插槽,其中一个在我们的设备上保持打开状态。可以添加另一块固态硬盘。ThinkPad P1 Gen 7 还支持 RAID 0/1。

| Drive Performance Rating - Percent | |
| Dell XPS 16 9640 | |
| Dell Precision 5690 | |
| Average of class Workstation | |
| Average Kioxia XG8 KXG8AZNV1T02 | |
| Lenovo ThinkPad P1 G6 21FV001KUS | |
| Lenovo ThinkPad P1 Gen 7 21KV001SGE | |
* ... smaller is better
Sustained performance read: DiskSpd Read Loop, Queue Depth 8
GPU
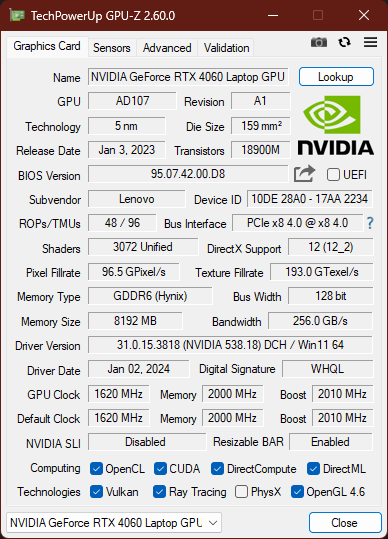
使用 NvidiaGeForce RTX 4060 笔记本电脑,联想 ThinkPad P1 Gen 7 提供了 Ada Lovelace 系列的中端解决方案。或者 GeForce RTX 4070或 RTX 3000 Ada可以提供更高的性能。真正的高端 GPU,在 ThinkPad P1 第六代(RTX 4000 Ada, RTX 5000 Ada, GeForce RTX 4080, GeForce RTX 4090)在这里都找不到。
这意味着,与老款 ThinkPad 工作站相比,联想 ThinkPad P1 第 7 代的 GPU 降级了。这种降级在 VRAM 方面尤为明显:P1 G6 提供高达 16 GB 的 VRAM,而 P1 Gen 7 则减半至 8 GB。至少,GeForce RTX 4060 的运行速度并不慢。在 3DMark 基准测试中,它的速度与戴尔 XPS 16 的 RTX 4070 大致相当。 戴尔 XPS 16.GPU 的 TGP 为 80 W。
令人遗憾的是,ThinkPad P1 Gen 7 不再提供高级优化功能。在前代产品中,BIOS 中的 MUX 开关可以实现纯 dGPU 操作,而现在已经不可能了。
在电池模式下,GPU 性能略受限制。在 3DMark 11 中,联想 ThinkPad P1 Gen 7 得到了 25,134 分,而不是 32,372 分,降低了 22%。
| 3DMark 11 Performance | 28509 points | |
| 3DMark Fire Strike Score | 21488 points | |
| 3DMark Time Spy Score | 9572 points | |
Help | ||
| SPECviewperf Performance Rating - Percent | |
| Dell Precision 5690 -1! | |
| Lenovo ThinkPad P1 G6 21FV001KUS -1! | |
| Average of class Workstation | |
| Average NVIDIA GeForce RTX 4060 Laptop GPU -1! | |
| Lenovo ThinkPad P1 Gen 7 21KV001SGE -1! | |
* ... smaller is better
游戏性能
P1 Gen 7 当然可以玩游戏,但其得分低于配备 NvidiaGeForce RTX 4080 的 ThinkPad P1 Gen 8。至少在这方面,ThinkPad P1 Gen 7 可以击败戴尔 XPS 16,尽管后者配备的是 RTX 4070。当然,用联想ThinkPad P1 Gen 7玩游戏有点像在公共街道上开法拉利,它是为不同的应用而生的。
在赛博朋克 负载测试中,帧速率没有大幅下降。
Cyberpunk 2077 ultra FPS diagram
| low | med. | high | ultra | QHD | 4K | |
|---|---|---|---|---|---|---|
| GTA V (2015) | 176.4 | 168 | 162.9 | 97.9 | 77.6 | 73.1 |
| Dota 2 Reborn (2015) | 161.5 | 146.7 | 138.2 | 131.2 | ||
| Final Fantasy XV Benchmark (2018) | 174.2 | 122.7 | 90.3 | 68.1 | ||
| X-Plane 11.11 (2018) | 124.4 | 105.9 | 83.3 | |||
| Far Cry 5 (2018) | 148 | 125 | 118 | 110 | 88 | |
| Baldur's Gate 3 (2023) | 102.8 | 77.5 | 68.7 | 67.4 | 45.2 | |
| Cyberpunk 2077 2.2 Phantom Liberty (2023) | 106.9 | 85.7 | 74.4 | 65.1 | 41 | 16.9 |
| F1 24 (2024) | 190.1 | 175.5 | 142.5 | 47.5 | 31.8 |
排放:联想笔记本电脑的掌托保持凉爽
噪音
我们不能指望像联想 ThinkPad P1 7 代这样的性能优化机型始终保持安静。空转时,两个风扇并不运转,但在中等负载下(能源配置文件:平衡),它们的声音已经相当大了。在压力测试的最大负载下(能耗配置文件:最佳性能),我们测得的噪音为 53 分贝(a)--非常大,但对于工作站笔记本电脑来说是正常的。总的来说,我们不会把 ThinkPad P1 Gen 7 称作噪音很大的笔记本电脑。风扇的声音确实很大,但只要系统恢复空转,风扇就会停止运转。
联想 ThinkPad P1 Gen 7 不会产生线圈啸叫。
Noise Level
| Idle |
| 24.7 / 24.7 / 24.7 dB(A) |
| Load |
| 43.7 / 53.3 dB(A) |
 | ||
30 dB silent 40 dB(A) audible 50 dB(A) loud |
||
min: | ||
| Lenovo ThinkPad P1 Gen 7 21KV001SGE NVIDIA GeForce RTX 4060 Laptop GPU, Ultra 7 155H, Kioxia XG8 KXG8AZNV1T02 | Lenovo ThinkPad P1 G6 21FV001KUS NVIDIA GeForce RTX 4080 Laptop GPU, i7-13800H, Kioxia XG8 KXG8AZNV1T02 | Apple MacBook Pro 16 2023 M3 Pro M3 Pro 18-Core GPU, Apple M3 Pro 12-Core, Apple SSD AP0512Z | Dell XPS 16 9640 NVIDIA GeForce RTX 4070 Laptop GPU, Ultra 7 155H, Kioxia XG8 KXG80ZNV1T02 | Dell Precision 5690 NVIDIA RTX 5000 Ada Generation Laptop GPU, Ultra 9 185H, 2x Samsung PM9A1 1TB (RAID 0) | |
|---|---|---|---|---|---|
| Noise | 11% | 8% | 1% | -1% | |
| off / environment * | 24.7 | 22.5 9% | 24.4 1% | 24.5 1% | 23.4 5% |
| Idle Minimum * | 24.7 | 22.5 9% | 24.4 1% | 24.5 1% | 23.6 4% |
| Idle Average * | 24.7 | 22.5 9% | 24.4 1% | 24.5 1% | 24.9 -1% |
| Idle Maximum * | 24.7 | 22.5 9% | 24.4 1% | 27.5 -11% | 30.9 -25% |
| Load Average * | 43.7 | 28.7 34% | 26.9 38% | 39.6 9% | 40.4 8% |
| Cyberpunk 2077 ultra * | 53.2 | ||||
| Load Maximum * | 53.3 | 54.4 -2% | 50.4 5% | 49.7 7% | 51.9 3% |
| Witcher 3 ultra * | 47.5 | 25.1 | 49.7 | 48.3 |
* ... smaller is better
热量
机箱的最高温度可达 50 摄氏度/123 华氏度。热点位于键盘上方,这是用户通常不会触及的区域。无论在压力测试还是赛博朋克游戏测试中,设备的下半部分大多保持低温。
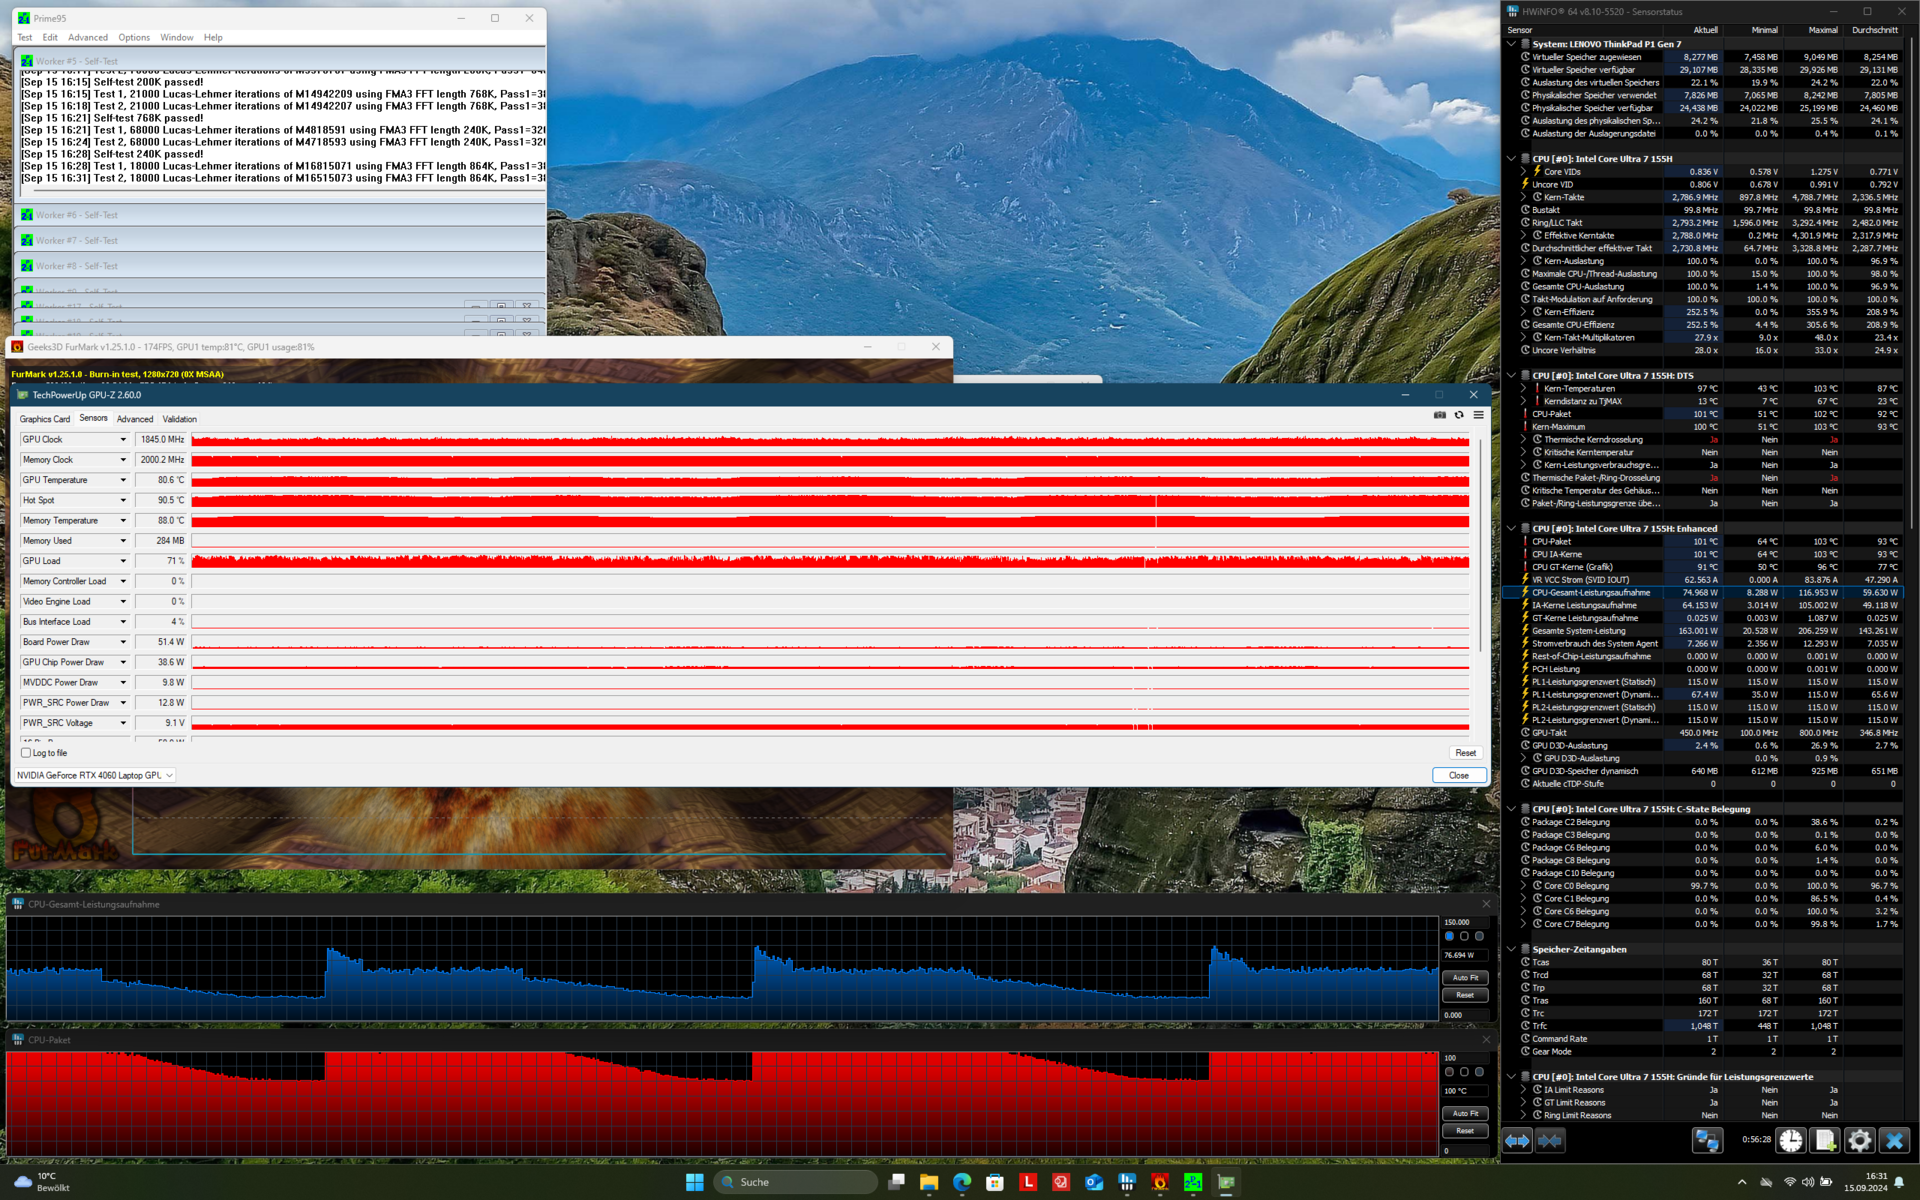
尽管有两个风扇、液态金属和一个蒸发室,联想 ThinkPad P1 Gen 7 还是无法在持续负载的情况下同时冷却 CPU 和 GPU。在压力测试中,两个组件都必须受到限制,GPU 运行功率为 50 W,CPU 为 70 W。
(-) The maximum temperature on the upper side is 50.3 °C / 123 F, compared to the average of 38.2 °C / 101 F, ranging from 22.2 to 69.8 °C for the class Workstation.
(+) The bottom heats up to a maximum of 38 °C / 100 F, compared to the average of 41.2 °C / 106 F
(+) In idle usage, the average temperature for the upper side is 24.9 °C / 77 F, compared to the device average of 32 °C / 90 F.
(±) 3: The average temperature for the upper side is 32.2 °C / 90 F, compared to the average of 32 °C / 90 F for the class Workstation.
(+) The palmrests and touchpad are cooler than skin temperature with a maximum of 30.2 °C / 86.4 F and are therefore cool to the touch.
(-) The average temperature of the palmrest area of similar devices was 27.8 °C / 82 F (-2.4 °C / -4.4 F).
| Lenovo ThinkPad P1 Gen 7 21KV001SGE Intel Core Ultra 7 155H, NVIDIA GeForce RTX 4060 Laptop GPU | Lenovo ThinkPad P1 G6 21FV001KUS Intel Core i7-13800H, NVIDIA GeForce RTX 4080 Laptop GPU | Apple MacBook Pro 16 2023 M3 Pro Apple M3 Pro 12-Core, Apple M3 Pro 18-Core GPU | Dell XPS 16 9640 Intel Core Ultra 7 155H, NVIDIA GeForce RTX 4070 Laptop GPU | Dell Precision 5690 Intel Core Ultra 9 185H, Nvidia RTX 5000 Ada Generation Laptop GPU | |
|---|---|---|---|---|---|
| Heat | -14% | 13% | 6% | -1% | |
| Maximum Upper Side * | 50.3 | 42 17% | 38.1 24% | 39.4 22% | 46.6 7% |
| Maximum Bottom * | 38 | 45.2 -19% | 37 3% | 36.9 3% | 33 13% |
| Idle Upper Side * | 28.3 | 33 -17% | 24.2 14% | 28.2 -0% | 32.4 -14% |
| Idle Bottom * | 27.3 | 37 -36% | 24.6 10% | 27.4 -0% | 29.4 -8% |
* ... smaller is better
发言人
没有像前代产品那样使用向上发射的扬声器 ThinkPad P1 6 代ThinkPad P1 7 代采用了向下发射的扬声器。立体声扬声器的音质依然出色,尽管最大音量与去年的机型相比略有降低。
Lenovo ThinkPad P1 Gen 7 21KV001SGE audio analysis
(±) | speaker loudness is average but good (81.4 dB)
Bass 100 - 315 Hz
(±) | reduced bass - on average 6.8% lower than median
(±) | linearity of bass is average (10.3% delta to prev. frequency)
Mids 400 - 2000 Hz
(+) | balanced mids - only 3.4% away from median
(+) | mids are linear (4.7% delta to prev. frequency)
Highs 2 - 16 kHz
(+) | balanced highs - only 3.1% away from median
(+) | highs are linear (6% delta to prev. frequency)
Overall 100 - 16.000 Hz
(+) | overall sound is linear (9.2% difference to median)
Compared to same class
» 3% of all tested devices in this class were better, 2% similar, 94% worse
» The best had a delta of 7%, average was 18%, worst was 35%
Compared to all devices tested
» 3% of all tested devices were better, 1% similar, 97% worse
» The best had a delta of 4%, average was 24%, worst was 134%
Lenovo ThinkPad P1 G6 21FV001KUS audio analysis
(+) | speakers can play relatively loud (85.2 dB)
Bass 100 - 315 Hz
(±) | reduced bass - on average 8% lower than median
(±) | linearity of bass is average (10.2% delta to prev. frequency)
Mids 400 - 2000 Hz
(±) | higher mids - on average 7.7% higher than median
(+) | mids are linear (4.7% delta to prev. frequency)
Highs 2 - 16 kHz
(+) | balanced highs - only 4.2% away from median
(+) | highs are linear (6.2% delta to prev. frequency)
Overall 100 - 16.000 Hz
(+) | overall sound is linear (13.2% difference to median)
Compared to same class
» 19% of all tested devices in this class were better, 6% similar, 75% worse
» The best had a delta of 7%, average was 18%, worst was 35%
Compared to all devices tested
» 12% of all tested devices were better, 3% similar, 86% worse
» The best had a delta of 4%, average was 24%, worst was 134%
Dell XPS 16 9640 audio analysis
(+) | speakers can play relatively loud (83.4 dB)
Bass 100 - 315 Hz
(±) | reduced bass - on average 11.2% lower than median
(±) | linearity of bass is average (8.9% delta to prev. frequency)
Mids 400 - 2000 Hz
(+) | balanced mids - only 4.5% away from median
(+) | mids are linear (3% delta to prev. frequency)
Highs 2 - 16 kHz
(+) | balanced highs - only 1.4% away from median
(+) | highs are linear (2% delta to prev. frequency)
Overall 100 - 16.000 Hz
(+) | overall sound is linear (10% difference to median)
Compared to same class
» 10% of all tested devices in this class were better, 1% similar, 89% worse
» The best had a delta of 5%, average was 18%, worst was 45%
Compared to all devices tested
» 4% of all tested devices were better, 1% similar, 95% worse
» The best had a delta of 4%, average was 24%, worst was 134%
能源管理:比 ThinkPad P1 第六代电池续航时间更长
耗电量
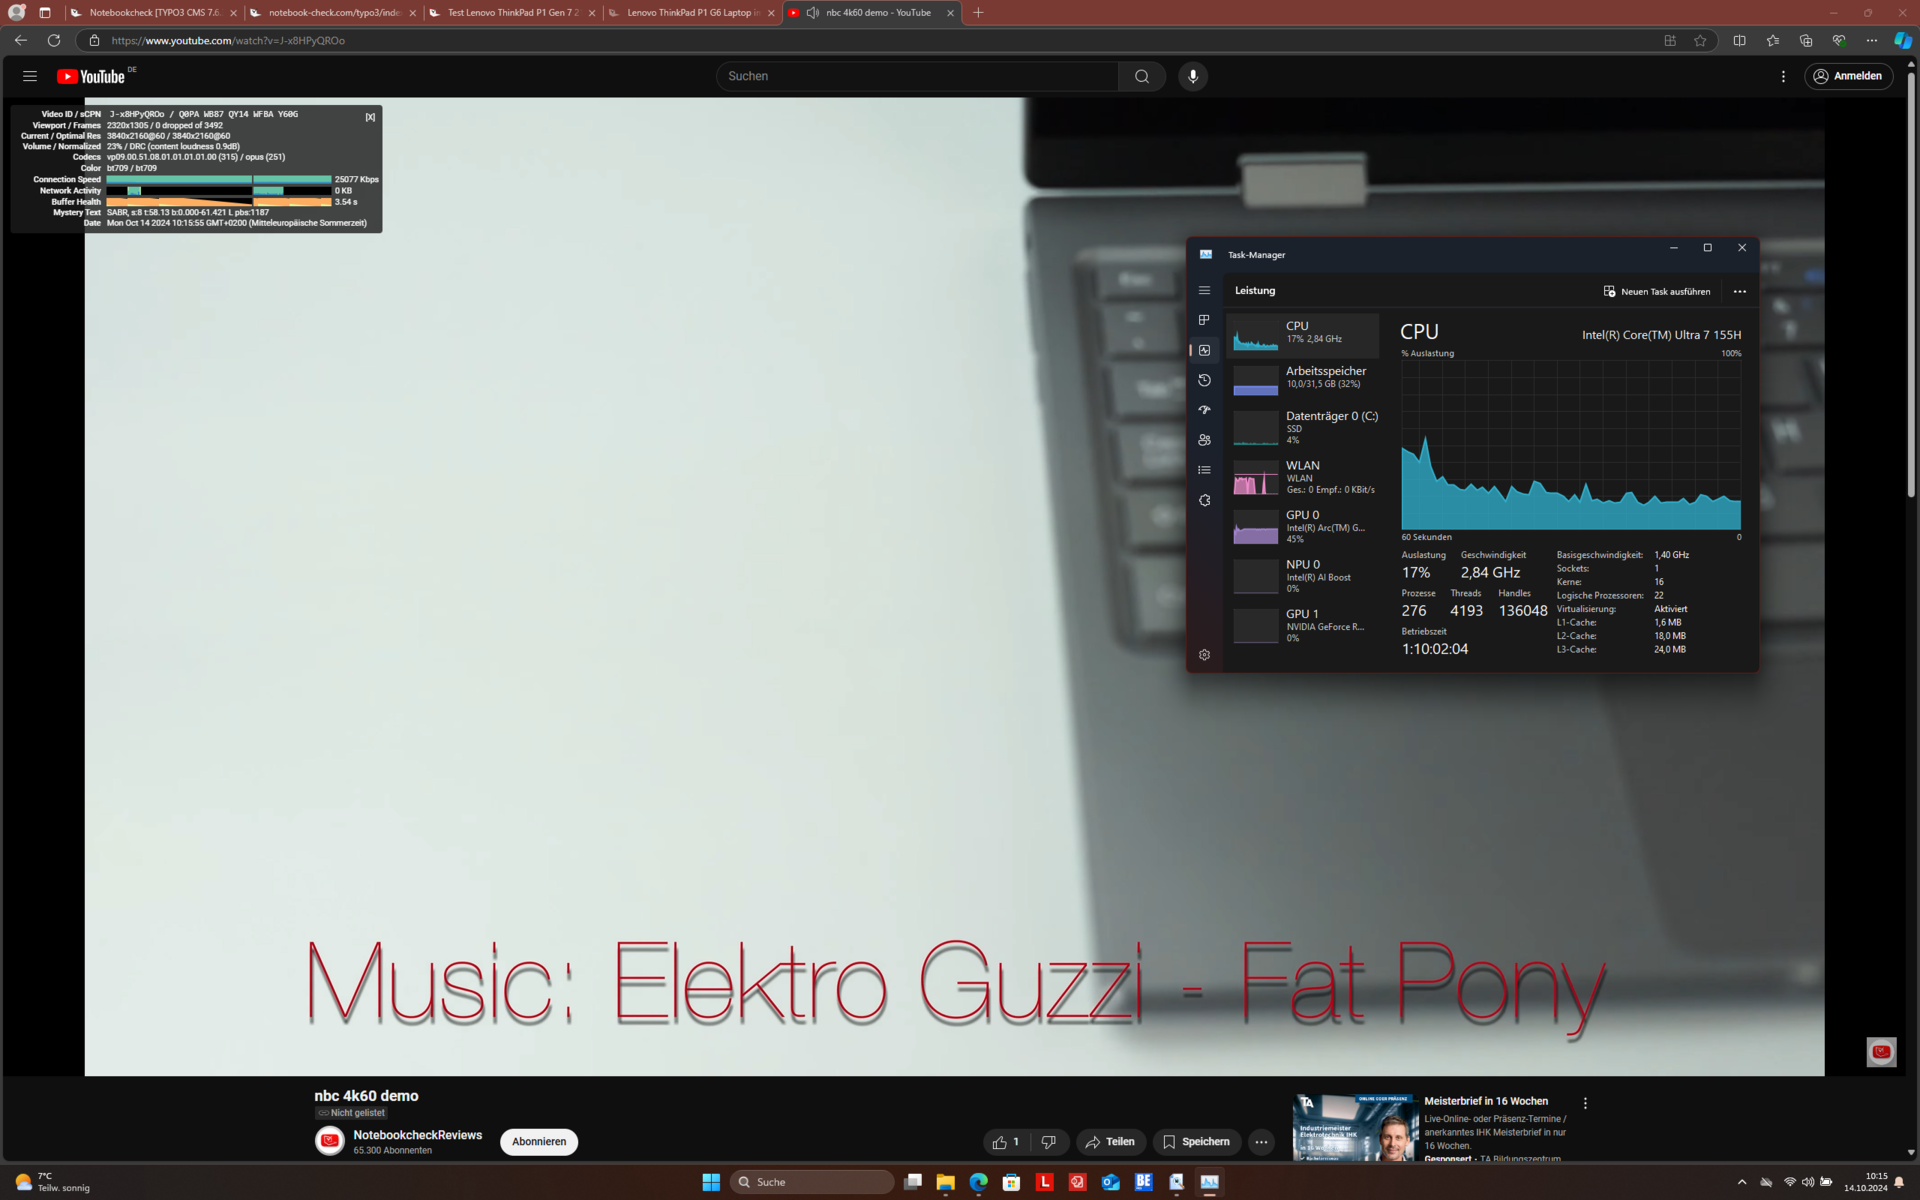
联想 ThinkPad P1 第 7 代的空闲功耗低于竞争对手,除了 Apple MacBook Pro 16.在这方面,较低的屏幕分辨率可能会带来好处,尽管 165 Hz 的较高刷新率抵消了这一优势。出厂时,屏幕设置为 165 Hz,不支持动态刷新率。
在最大负载情况下,ThinkPad 笔记本电脑的功耗高达 167.5 瓦,在 170 瓦充电器的承受范围内。
| Off / Standby | |
| Idle | |
| Load |
|
Key:
min: | |
| Lenovo ThinkPad P1 Gen 7 21KV001SGE Ultra 7 155H, NVIDIA GeForce RTX 4060 Laptop GPU, Kioxia XG8 KXG8AZNV1T02, IPS LED, 2560x1600, 16" | Lenovo ThinkPad P1 G6 21FV001KUS i7-13800H, NVIDIA GeForce RTX 4080 Laptop GPU, Kioxia XG8 KXG8AZNV1T02, OLED, 3480x2400, 16" | Apple MacBook Pro 16 2023 M3 Pro Apple M3 Pro 12-Core, M3 Pro 18-Core GPU, Apple SSD AP0512Z, Mini-LED, 3456x2234, 16.2" | Dell XPS 16 9640 Ultra 7 155H, NVIDIA GeForce RTX 4070 Laptop GPU, Kioxia XG8 KXG80ZNV1T02, OLED, 3840x2400, 16.3" | Dell Precision 5690 Ultra 9 185H, NVIDIA RTX 5000 Ada Generation Laptop GPU, 2x Samsung PM9A1 1TB (RAID 0), OLED, 3840x2400, 16" | Average NVIDIA GeForce RTX 4060 Laptop GPU | Average of class Workstation | |
|---|---|---|---|---|---|---|---|
| Power Consumption | -12% | 15% | 14% | -19% | -29% | -4% | |
| Idle Minimum * | 7.3 | 8 -10% | 4.5 38% | 7.7 -5% | 7.9 -8% | 11.5 ? -58% | 8.43 ? -15% |
| Idle Average * | 12.3 | 9.5 23% | 16.5 -34% | 10.3 16% | 12 2% | 16 ? -30% | 12.4 ? -1% |
| Idle Maximum * | 17.9 | 23.7 -32% | 16.7 7% | 10.6 41% | 28.6 -60% | 20.3 ? -13% | 17.8 ? 1% |
| Load Average * | 78.2 | 97.2 -24% | 60.4 23% | 76.5 2% | 98.8 -26% | 92.9 ? -19% | 88.4 ? -13% |
| Cyberpunk 2077 ultra external monitor * | 117.7 | ||||||
| Cyberpunk 2077 ultra * | 123.5 | ||||||
| Load Maximum * | 167.5 | 197.2 -18% | 102.9 39% | 138.5 17% | 174.8 -4% | 210 ? -25% | 154.1 ? 8% |
| Witcher 3 ultra * | 144 | 52.1 | 126.4 | 144.5 |
* ... smaller is better
Power consumption Cyberpunk / stress test
Power consumption w/external monitor
电池寿命
90 Wh 电池容量保持不变。不过,在 Wi-Fi 测试(屏幕亮度为 150 cd/m²)中,电池续航时间比上一代产品有所改善。 联想 ThinkPad P1 6 代.2024 机型的续航时间大约为 10 小时,而不是旧机型的 4 小时。与 P1 Gen 6 相比,在旅途中使用这款设备似乎更加可行。
| Lenovo ThinkPad P1 Gen 7 21KV001SGE Ultra 7 155H, NVIDIA GeForce RTX 4060 Laptop GPU, 90 Wh | Lenovo ThinkPad P1 G6 21FV001KUS i7-13800H, NVIDIA GeForce RTX 4080 Laptop GPU, 90 Wh | Apple MacBook Pro 16 2023 M3 Pro Apple M3 Pro 12-Core, M3 Pro 18-Core GPU, 99.6 Wh | Dell XPS 16 9640 Ultra 7 155H, NVIDIA GeForce RTX 4070 Laptop GPU, 99.5 Wh | Dell Precision 5690 Ultra 9 185H, NVIDIA RTX 5000 Ada Generation Laptop GPU, 98 Wh | Average of class Workstation | |
|---|---|---|---|---|---|---|
| Battery Runtime | -58% | 38% | -9% | -8% | -24% | |
| WiFi v1.3 | 595 | 252 -58% | 1204 102% | 629 6% | 549 -8% | 502 ? -16% |
| Load | 114 | 83 -27% | 87 -24% | 77.4 ? -32% |
Notebookcheck 总体评分
联想 ThinkPad P1 Gen 7 没有采用高端 GPU,而是使用了两个 M.2 2280 插槽和新的 LPCAMM2 内存。外观设计接近于 ThinkPad Z16,采用铝制上盖和大尺寸触控板。在内部,Meteor Lake CPU 提高了效率和电池续航时间。总体而言,该机型的设计更高端,移动性更强,但 GPU 性能略有下降。
Transparency
The selection of devices to be reviewed is made by our editorial team. The test sample was provided to the author as a loan by the manufacturer or retailer for the purpose of this review. The lender had no influence on this review, nor did the manufacturer receive a copy of this review before publication. There was no obligation to publish this review. We never accept compensation or payment in return for our reviews. As an independent media company, Notebookcheck is not subjected to the authority of manufacturers, retailers or publishers.
This is how Notebookcheck is testing
Every year, Notebookcheck independently reviews hundreds of laptops and smartphones using standardized procedures to ensure that all results are comparable. We have continuously developed our test methods for around 20 years and set industry standards in the process. In our test labs, high-quality measuring equipment is utilized by experienced technicians and editors. These tests involve a multi-stage validation process. Our complex rating system is based on hundreds of well-founded measurements and benchmarks, which maintains objectivity. Further information on our test methods can be found here.

